UNITED STATES
SECURITIES AND EXCHANGE COMMISSION
Washington, D.C. 20549
FORM N-CSR
CERTIFIED SHAREHOLDER REPORT OF REGISTERED
MANAGEMENT INVESTMENT COMPANIES
Investment Company Act file number 811-03725
Fidelity California Municipal Trust
(Exact name of registrant as specified in charter)
245 Summer St., Boston, MA 02210
(Address of principal executive offices) (Zip code)
Cynthia Lo Bessette, Secretary
245 Summer St.
Boston, Massachusetts 02210
(Name and address of agent for service)
Registrant's telephone number, including area code:
617-563-7000
Date of fiscal year end: | February 28 |
Date of reporting period: | August 31, 2022 |
Item 1.
Reports to Stockholders


Contents
| Revenue Sources (% of Fund's net assets) | ||
| Transportation | 28.5% | |
| General Obligations | 24.9% | |
| Health Care | 13.7% | |
| Special Tax | 10.6% | |
| Education | 8.3% | |
| Others* (Individually Less Than 5%) | 14.0% | |
| 100.0% | ||
| *Includes net other assets | ||
Quality Diversification (% of Fund's net assets) |
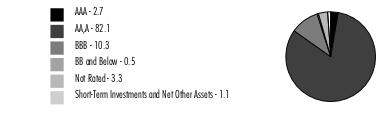 |
| We have used ratings from Moody's Investors Service, Inc. Where Moody's® ratings are not available, we have used S&P® ratings. All ratings are as of the date indicated and do not reflect subsequent changes. |
| Municipal Bonds - 98.9% | |||
Principal Amount (a) (000s) | Value ($) (000s) | ||
| California - 98.3% | |||
| ABC Unified School District Series 1997 C: | |||
| 0% 8/1/31 (Nat'l. Pub. Fin. Guarantee Corp. Insured) | 2,810 | 2,091 | |
| 0% 8/1/32 (Nat'l. Pub. Fin. Guarantee Corp. Insured) | 3,900 | 2,776 | |
| Anaheim Pub. Fing. Auth. Lease Rev. (Anaheim Pub. Impt. Proj.): | |||
| Series 1997 A, 6% 9/1/24 (Assured Guaranty Muni. Corp. Insured) | 705 | 728 | |
| Series 1997 C, 0% 9/1/22 (Assured Guaranty Muni. Corp. Insured) | 5,150 | 5,150 | |
| Bay Area Toll Auth. San Francisco Bay Toll Bridge Rev. Bonds: | |||
| Series 2018 A, 2.625%, tender 4/1/26 (b) | 3,000 | 2,984 | |
| Series 2021 A, 2%, tender 4/1/28 (b) | 17,000 | 16,078 | |
| Series B, 2.85%, tender 4/1/25 (b) | 6,890 | 6,897 | |
| Series H, 2.125%, tender 4/1/25 (b) | 4,000 | 3,929 | |
| Bay Area Wtr. Supply & Conservation Agcy. (Cap. Cost Recovery Prepayment Prog.) Series 2023 A: | |||
| 5% 10/1/23 (c) | 2,050 | 2,088 | |
| 5% 10/1/24 (c) | 2,000 | 2,080 | |
| 5% 10/1/25 (c) | 2,250 | 2,386 | |
| 5% 10/1/26 (c) | 2,250 | 2,432 | |
| 5% 10/1/27 (c) | 3,000 | 3,295 | |
| 5% 10/1/28 (c) | 3,000 | 3,344 | |
| 5% 10/1/29 (c) | 1,750 | 1,970 | |
| California County Tobacco Securitization Agcy. Tobacco Settlement Asset-Backed Series 2020 A: | |||
| 5% 6/1/27 | 400 | 432 | |
| 5% 6/1/28 | 420 | 457 | |
| 5% 6/1/29 | 500 | 548 | |
| 5% 6/1/30 | 300 | 330 | |
| 5% 6/1/31 | 300 | 329 | |
| 5% 6/1/32 | 250 | 273 | |
| 5% 6/1/33 | 250 | 272 | |
| California Edl. Facilities Auth. Rev.: | |||
| (Pomona College Proj.) Series 2005 A, 0% 7/1/38 | 3,155 | 1,725 | |
| (Santa Clara Univ. Proj.): | |||
Series 1999, 5.25% 9/1/26 (AMBAC Insured) | 7,910 | 8,543 | |
Series 2017 C: | |||
5% 4/1/30 | 650 | 728 | |
5% 4/1/31 | 890 | 992 | |
5% 4/1/33 | 1,245 | 1,372 | |
| Series 2018 A: | |||
5% 10/1/34 | 760 | 828 | |
5% 10/1/36 | 840 | 905 | |
5% 10/1/38 | 620 | 670 | |
5% 10/1/42 | 4,000 | 4,294 | |
5% 10/1/46 | 6,235 | 6,655 | |
| Series 2021 A: | |||
5% 4/1/29 | 400 | 449 | |
5% 4/1/30 | 425 | 482 | |
5% 4/1/31 | 460 | 523 | |
| California Gen. Oblig.: | |||
| Series 2002, 5% 10/1/32 (Nat'l. Pub. Fin. Guarantee Corp. Insured) | 10 | 10 | |
| Series 2004: | |||
5.25% 4/1/27 | 5 | 5 | |
5.25% 4/1/29 | 5 | 5 | |
5.25% 12/1/33 | 105 | 105 | |
5.5% 4/1/28 | 5 | 5 | |
5.5% 4/1/30 | 25 | 25 | |
| Series 2007: | |||
5.625% 5/1/26 | 120 | 120 | |
5.75% 5/1/30 | 90 | 90 | |
| Series 2019, 5% 4/1/49 | 2,900 | 3,146 | |
| Series 2020: | |||
4% 11/1/39 | 4,955 | 5,016 | |
5% 11/1/27 | 2,000 | 2,249 | |
| Series 2021, 5% 12/1/46 | 1,500 | 1,645 | |
| California Health Facilities Fing. Auth. Rev.: | |||
| (Children's Hosp. of Orange County Proj.) Series 2012 A: | |||
5% 11/15/22 | 2,500 | 2,509 | |
5% 11/15/23 | 2,000 | 2,010 | |
| (Lucile Salter Packrd Chil Hosp. Proj.) Series 2017 A, 5% 11/15/42 | 1,750 | 1,863 | |
| (Stanford Health Proj.) Series 2017 A: | |||
5% 11/15/35 | 3,405 | 3,749 | |
5% 11/15/36 | 5,000 | 5,497 | |
5% 11/15/37 | 3,000 | 3,293 | |
| Bonds: | |||
(Providence St. Jospeh Health) Series 2016 B3, 2%, tender 10/1/25 (b) | 8,190 | 7,951 | |
Series 2019 B, 5%, tender 10/1/27 (b) | 7,700 | 8,375 | |
| Series 2016 A, 3% 10/1/41 | 400 | 313 | |
| Series 2017 A: | |||
4% 11/1/38 | 5,475 | 5,384 | |
5% 11/15/32 | 1,400 | 1,520 | |
| Series 2018 A, 5% 11/15/27 | 500 | 552 | |
| Series 2020 A, 4% 4/1/49 | 9,010 | 8,273 | |
| Series 2021 A, 4% 8/15/48 | 5,000 | 4,856 | |
| California Hsg. Fin. Agcy.: | |||
| Series 2019 A, 4% 3/20/33 | 6,706 | 6,647 | |
| Series 2021 1, 3.5% 11/20/35 | 6,077 | 5,660 | |
| California Infrastructure & Econ. Dev. Series 2019: | |||
| 5% 8/1/44 | 7,610 | 8,148 | |
| 5% 8/1/49 | 11,000 | 11,711 | |
| California Infrastructure and Econ. Dev. Bank Rev.: | |||
| Bonds (Los Angeles County Museum of Art Proj.) Series 2021 A, 1.2%, tender 6/1/28 (b) | 7,000 | 6,154 | |
| Series 2020, 4% 7/1/50 | 7,125 | 6,718 | |
| California Muni. Fin. Auth.: | |||
| (Orange County Civic Ctr. Infrastructure Impt. Prog.) Series 2017 A: | |||
5% 6/1/32 | 2,750 | 3,017 | |
5% 6/1/33 | 2,320 | 2,538 | |
5% 6/1/34 | 5,290 | 5,771 | |
5% 6/1/35 | 5,110 | 5,564 | |
5% 6/1/36 | 5,830 | 6,337 | |
5% 6/1/37 | 3,000 | 3,251 | |
| Series 2019 A, 2.65% 8/1/36 | 9,662 | 8,495 | |
| California Muni. Fin. Auth. Ctfs. of Prtn. Series 2021, 5% 11/1/27 (d) | 11,850 | 12,568 | |
| California Muni. Fin. Auth. Rev.: | |||
| (Biola Univeristy, Inc. Proj.) Series 2017: | |||
5% 10/1/25 | 305 | 320 | |
5% 10/1/26 | 715 | 760 | |
5% 10/1/28 | 2,130 | 2,278 | |
5% 10/1/32 | 1,000 | 1,055 | |
| (Channing House Proj.) Series 2017 A: | |||
4% 5/15/29 | 2,000 | 2,105 | |
4% 5/15/30 | 1,575 | 1,651 | |
4% 5/15/31 | 2,150 | 2,237 | |
4% 5/15/32 | 1,000 | 1,036 | |
5% 5/15/33 | 895 | 979 | |
5% 5/15/34 | 1,000 | 1,090 | |
| (Institute On Aging Proj.) Series 2017: | |||
5% 8/15/27 | 230 | 256 | |
5% 8/15/29 | 245 | 272 | |
5% 8/15/30 | 225 | 249 | |
5% 8/15/33 | 750 | 823 | |
5% 8/15/36 | 1,435 | 1,564 | |
| (Pomona College Proj.) Series 2017: | |||
4% 1/1/37 (Pre-Refunded to 1/1/28 @ 100) | 1,250 | 1,351 | |
4% 1/1/38 (Pre-Refunded to 1/1/28 @ 100) | 1,500 | 1,621 | |
5% 1/1/32 (Pre-Refunded to 1/1/28 @ 100) | 1,000 | 1,132 | |
5% 1/1/33 (Pre-Refunded to 1/1/28 @ 100) | 500 | 566 | |
| (Univ. of Verne Proj.) Series 2017 A: | |||
5% 6/1/27 | 1,000 | 1,096 | |
5% 6/1/28 | 1,000 | 1,092 | |
5% 6/1/30 | 1,555 | 1,682 | |
5% 6/1/32 | 1,000 | 1,072 | |
5% 6/1/33 | 1,000 | 1,067 | |
5% 6/1/35 | 1,000 | 1,059 | |
5% 6/1/43 | 3,750 | 3,914 | |
| Series 2016 A, 5% 11/1/36 (d) | 1,000 | 1,036 | |
| Series 2017 A: | |||
5% 7/1/29 | 575 | 614 | |
5% 7/1/31 | 1,000 | 1,061 | |
5% 7/1/32 | 1,400 | 1,481 | |
5% 7/1/33 | 1,000 | 1,054 | |
5% 7/1/34 | 1,395 | 1,466 | |
5% 7/1/35 | 1,500 | 1,568 | |
5% 7/1/36 | 1,500 | 1,562 | |
5% 7/1/37 | 1,250 | 1,297 | |
| Series 2017 B: | |||
5% 7/1/28 | 1,250 | 1,339 | |
5% 7/1/29 | 1,300 | 1,389 | |
5% 7/1/30 | 750 | 799 | |
5% 7/1/31 | 800 | 849 | |
5% 7/1/32 | 1,385 | 1,465 | |
| Series 2017: | |||
5% 10/1/27 | 500 | 537 | |
5% 10/1/36 | 1,250 | 1,307 | |
5% 10/1/37 | 500 | 521 | |
5% 10/1/39 | 1,750 | 1,816 | |
| Series 2018: | |||
5% 10/1/31 | 200 | 214 | |
5% 10/1/32 | 225 | 240 | |
5% 10/1/33 | 225 | 239 | |
5% 10/1/34 | 225 | 238 | |
5% 10/1/35 | 225 | 237 | |
5% 10/1/36 | 250 | 263 | |
5% 10/1/37 | 550 | 577 | |
5% 10/1/38 | 345 | 362 | |
| Series 2019 A: | |||
5% 4/1/30 | 3,000 | 3,352 | |
5% 4/1/31 | 2,000 | 2,218 | |
5% 4/1/32 | 3,000 | 3,313 | |
5% 4/1/35 | 1,780 | 1,933 | |
5% 4/1/36 | 1,125 | 1,220 | |
5% 4/1/37 | 1,475 | 1,594 | |
5% 4/1/40 | 2,500 | 2,682 | |
5% 4/1/41 | 3,865 | 4,139 | |
| Series 2019: | |||
5% 7/1/34 | 825 | 919 | |
5% 7/1/39 | 1,000 | 1,096 | |
5% 7/1/49 | 2,100 | 2,255 | |
| Series 2021 A, 4% 2/1/51 | 7,500 | 6,967 | |
| Series 2021: | |||
4% 10/1/33 | 250 | 244 | |
4% 10/1/34 | 420 | 406 | |
4% 10/1/37 | 160 | 152 | |
4% 10/1/46 | 960 | 855 | |
4% 10/1/51 | 1,150 | 1,004 | |
| California Muni. Fin. Auth. Sr Living Series 2019: | |||
| 5% 11/15/39 | 1,155 | 1,192 | |
| 5% 11/15/49 | 2,500 | 2,550 | |
| California Muni. Fin. Auth. Student Hsg.: | |||
| (CHF Davis II, L.L.C. Orchard Park Student Hsg. Proj.) Series 2021, 4% 5/15/46 (Build America Mutual Assurance Insured) | 2,000 | 1,888 | |
| (CHF-Davis I, LLC - West Village Student Hsg. Proj.) Series 2018: | |||
5% 5/15/26 | 4,210 | 4,439 | |
5% 5/15/27 | 4,635 | 4,930 | |
5% 5/15/34 | 10,000 | 10,427 | |
| (CHF-Riverside I, LLC - UCR Dundee-Glasgow Student Hsg. Proj.) Series 2018: | |||
5% 5/15/33 | 1,345 | 1,406 | |
5% 5/15/35 | 1,955 | 2,035 | |
5% 5/15/36 | 1,500 | 1,559 | |
5% 5/15/43 | 1,500 | 1,541 | |
| California Poll. Cont. Fing. Auth. Solid Waste Disp. Rev. Bonds (Waste Mgmt., Inc. Proj.) Series 2002 C, 3.25%, tender 6/3/24 (b)(e) | 7,500 | 7,512 | |
| California Pub. Fin. Auth. Rev. Series 2021 A: | |||
| 4% 10/15/26 | 415 | 424 | |
| 4% 10/15/27 | 400 | 409 | |
| 4% 10/15/28 | 360 | 367 | |
| California Pub. Fin. Auth. Univ. Hsg. Rev.: | |||
| (Claremont Colleges Proj.) Series 2017 A, 5% 7/1/27 (d) | 1,160 | 992 | |
| (NCCD - Claremont Properties LLC - Claremont Colleges Proj.) Series 2017 A, 5% 7/1/47 (d) | 1,500 | 1,117 | |
| California Pub. Works Board Lease Rev.: | |||
| (Coalinga State Hosp. Proj.) Series 2013 E, 5% 6/1/29 | 7,000 | 7,135 | |
| (Various Cap. Projs.): | |||
Series 2012 G, 5% 11/1/25 | 2,500 | 2,512 | |
Series 2016 D, 4% 4/1/33 | 1,660 | 1,718 | |
Series 2022 C: | |||
4% 8/1/37 (c) | 16,845 | 17,211 | |
5% 8/1/35 (c) | 5,010 | 5,673 | |
5% 8/1/36 (c) | 5,260 | 5,925 | |
| Series A, 5% 9/1/29 | 1,425 | 1,494 | |
| California State Univ. Rev. Bonds Series 2016 B1, 1.6%, tender 11/1/26 (b) | 5,000 | 4,717 | |
| California Statewide Cmntys. Dev. Auth.: | |||
| Series 2016: | |||
5% 5/15/34 | 1,250 | 1,286 | |
5% 5/15/35 | 4,725 | 4,856 | |
5% 5/15/40 | 2,250 | 2,304 | |
| Series 2017, 5% 5/15/47 | 1,000 | 1,023 | |
| California Statewide Cmntys. Dev. Auth. Hosp. Rev. Series 2018: | |||
| 5% 1/1/33 | 1,595 | 1,675 | |
| 5% 1/1/38 | 6,240 | 6,472 | |
| 5% 1/1/43 | 9,300 | 9,545 | |
| California Statewide Cmntys. Dev. Auth. Rev.: | |||
| (Huntington Memorial Hosp. Proj.) Series 2018: | |||
5% 7/1/27 | 245 | 269 | |
5% 7/1/28 | 660 | 735 | |
5% 7/1/29 | 695 | 766 | |
5% 7/1/30 | 730 | 802 | |
5% 7/1/31 | 765 | 837 | |
5% 7/1/32 | 805 | 877 | |
5% 7/1/33 | 845 | 917 | |
5% 7/1/34 | 885 | 957 | |
5% 7/1/35 | 925 | 999 | |
5% 7/1/36 | 500 | 539 | |
5% 7/1/37 | 650 | 699 | |
5% 7/1/38 | 500 | 536 | |
5% 7/1/43 | 1,250 | 1,329 | |
5% 7/1/48 | 9,000 | 9,524 | |
| (Lancer Edl. Student Hsg. Proj.) Series 2019 A: | |||
5% 6/1/34 (d) | 375 | 380 | |
5% 6/1/39 (d) | 475 | 476 | |
5% 6/1/51 (d) | 8,225 | 7,909 | |
| (Viamonte Sr. Living 1 Proj.) Series 2018 B, 3% 7/1/27 | 3,000 | 3,003 | |
| Series 2015: | |||
5% 2/1/35 | 1,975 | 1,780 | |
5% 2/1/45 | 4,440 | 3,677 | |
| Series 2016: | |||
5% 10/1/26 | 1,125 | 1,200 | |
5% 10/1/27 | 2,360 | 2,518 | |
5% 10/1/28 | 1,230 | 1,310 | |
5% 10/1/29 | 675 | 717 | |
5% 10/1/30 | 1,100 | 1,165 | |
5% 10/1/33 | 1,850 | 1,943 | |
| Series 2017 A, 5% 11/1/32 (d) | 1,135 | 1,192 | |
| Series 2017, 5% 11/1/48 | 795 | 648 | |
| Series 2018 A, 5% 3/1/42 | 7,500 | 7,795 | |
| Series 2021 A: | |||
4% 4/1/38 | 2,625 | 2,513 | |
4% 4/1/39 | 2,250 | 2,141 | |
4% 4/1/40 | 2,500 | 2,363 | |
4% 4/1/41 | 1,885 | 1,768 | |
4% 4/1/46 | 2,500 | 2,295 | |
| Carlsbad Unified School District: | |||
| Series 2009 B, 6% 5/1/34 (Pre-Refunded to 5/1/24 @ 100) | 5,300 | 5,606 | |
| Series 2017 A: | |||
4% 5/1/31 | 1,500 | 1,572 | |
4% 5/1/32 | 1,150 | 1,202 | |
4% 5/1/33 | 1,375 | 1,427 | |
4% 5/1/34 | 1,375 | 1,418 | |
| Chaffey Unified High School District Series 2017 C, 5.25% 8/1/47 | 8,305 | 8,908 | |
| Contra Costa Wtr. District Wtr. Rev. Series 2021 W, 5% 10/1/51 | 7,000 | 7,792 | |
| Corona-Norco Unified School District Series 2013 A: | |||
| 5% 9/1/25 (Pre-Refunded to 9/1/23 @ 100) | 645 | 662 | |
| 5% 9/1/35 (Pre-Refunded to 9/1/23 @ 100) | 585 | 601 | |
| Desert Cmnty. College District Series 2020, 2% 8/1/37 | 625 | 477 | |
| Eastern Muni. Wtr. District Fing. Auth. Series 2020 A: | |||
| 5% 7/1/29 | 250 | 290 | |
| 5% 7/1/30 | 250 | 294 | |
| El Camino Hosp. District Series 2006, 0% 8/1/27 (Nat'l. Pub. Fin. Guarantee Corp. Insured) | 1,425 | 1,234 | |
| El Dorado County Gen. Oblig. Series 2012, 5% 9/1/23 | 1,345 | 1,348 | |
| El Dorado Irr. Distr. Rev. Series 2016 C, 5% 3/1/36 (Pre-Refunded to 3/1/26 @ 100) | 330 | 360 | |
| Elk Grove Fin. Auth. Spl. Tax Rev.: | |||
| (Elk Grove Cfd Laguna Ridge Proj.) Series 2016, 5% 9/1/41 | 4,500 | 4,662 | |
| Series 2015: | |||
5% 9/1/27 | 1,940 | 2,083 | |
5% 9/1/28 | 4,125 | 4,427 | |
5% 9/1/29 | 4,325 | 4,633 | |
5% 9/1/30 (Build America Mutual Assurance Insured) | 1,135 | 1,219 | |
5% 9/1/31 (Build America Mutual Assurance Insured) | 1,750 | 1,866 | |
5% 9/1/32 (Build America Mutual Assurance Insured) | 1,615 | 1,719 | |
| Series 2016: | |||
5% 9/1/27 | 1,875 | 2,004 | |
5% 9/1/28 | 1,500 | 1,599 | |
5% 9/1/29 | 2,000 | 2,124 | |
5% 9/1/30 | 1,720 | 1,825 | |
5% 9/1/31 | 2,500 | 2,639 | |
| Elk Grove Unified School District Spl. Tax (Cmnty. Facilities District #1 Proj.) Series 1995, 6.5% 12/1/24 (AMBAC Insured) | 1,765 | 1,843 | |
| Empire Union School District Spl. Tax (Cmnty. Facilities District No. 1987 Proj.) Series 2002 A: | |||
| 0% 10/1/24 (AMBAC Insured) | 1,665 | 1,567 | |
| 0% 10/1/25 (AMBAC Insured) | 1,665 | 1,508 | |
| Escondido Union High School District Series 2008 A: | |||
| 0% 8/1/33 (Assured Guaranty Corp. Insured) | 5,655 | 3,796 | |
| 0% 8/1/34 (Assured Guaranty Corp. Insured) | 3,500 | 2,237 | |
| Foothill-De Anza Cmnty. College District Series 1999 B, 0% 8/1/24 (Nat'l. Pub. Fin. Guarantee Corp. Insured) | 5,000 | 4,755 | |
| Foothill/Eastern Trans. Corridor Agcy. Toll Road Rev. Series 2015 A, 0% 1/15/33 (Assured Guaranty Muni. Corp. Insured) | 9,000 | 6,045 | |
| Fresno Unified School District Series 2020 B: | |||
| 5% 8/1/34 | 100 | 114 | |
| 5% 8/1/35 | 175 | 198 | |
| 5% 8/1/36 | 235 | 264 | |
| 5% 8/1/37 | 150 | 168 | |
| 5% 8/1/38 | 300 | 333 | |
| 5% 8/1/39 | 350 | 386 | |
| 5% 8/1/40 | 400 | 439 | |
| 5% 8/1/41 | 435 | 475 | |
| 5% 8/1/42 | 500 | 544 | |
| 5% 8/1/46 | 2,500 | 2,700 | |
| Fullerton Pub. Fing. Auth. Series 2021 A: | |||
| 4% 2/1/32 | 520 | 527 | |
| 4% 2/1/33 | 250 | 257 | |
| 4% 2/1/34 | 430 | 438 | |
| 4% 2/1/36 | 600 | 605 | |
| 4% 2/1/41 | 2,530 | 2,470 | |
| 4% 2/1/46 | 2,055 | 1,905 | |
| 4% 2/1/51 | 2,500 | 2,311 | |
| Golden State Tobacco Securitization Corp. Tobacco Settlement Rev. Series 2005 A, 0% 6/1/27 (Escrowed to Maturity) | 6,790 | 6,005 | |
| Grossmont-Cuyamaca Cmnty. College District Series 2021 C, 4% 8/1/46 | 4,250 | 4,066 | |
| Hillsborough School District Series 2022 A, 4% 9/1/52 (c) | 3,500 | 3,403 | |
| Irvine Reassessment District 12-1 Ltd. Oblig.: | |||
| Series 2012: | |||
5% 9/2/23 | 1,000 | 1,012 | |
5% 9/2/25 | 500 | 506 | |
| Series 2013: | |||
5% 9/2/24 | 825 | 846 | |
5% 9/2/26 | 800 | 820 | |
| Series 2019: | |||
4% 9/2/38 | 1,000 | 989 | |
4% 9/2/39 | 1,000 | 987 | |
5% 9/2/44 | 2,545 | 2,706 | |
| Series 2021: | |||
4% 9/2/35 (Build America Mutual Assurance Insured) | 400 | 404 | |
4% 9/2/36 (Build America Mutual Assurance Insured) | 250 | 252 | |
4% 9/2/37 (Build America Mutual Assurance Insured) | 250 | 251 | |
4% 9/2/38 (Build America Mutual Assurance Insured) | 350 | 350 | |
4% 9/2/39 (Build America Mutual Assurance Insured) | 500 | 498 | |
4% 9/2/40 (Build America Mutual Assurance Insured) | 1,025 | 1,013 | |
4% 9/2/46 (Build America Mutual Assurance Insured) | 1,350 | 1,293 | |
| Ladera Ranch Cmnty. Facilities District 2004-1 Series 2014 A: | |||
| 5% 8/15/27 | 1,765 | 1,786 | |
| 5% 8/15/28 | 1,960 | 1,984 | |
| 5% 8/15/29 | 4,225 | 4,276 | |
| 5% 8/15/30 | 4,555 | 4,609 | |
| Long Beach Cmnty. College Series 2008 A: | |||
| 0% 6/1/28 (Assured Guaranty Muni. Corp. Insured) | 2,995 | 2,534 | |
| 0% 6/1/31 (Assured Guaranty Muni. Corp. Insured) | 8,285 | 6,246 | |
| Long Beach Hbr. Rev.: | |||
| Series 2017 A: | |||
5% 5/15/26 (e) | 1,110 | 1,193 | |
5% 5/15/27 (e) | 2,000 | 2,178 | |
5% 5/15/29 (e) | 1,350 | 1,470 | |
5% 5/15/30 (e) | 1,300 | 1,414 | |
5% 5/15/31 (e) | 2,400 | 2,604 | |
5% 5/15/32 (e) | 1,760 | 1,905 | |
5% 5/15/33 (e) | 1,350 | 1,457 | |
5% 5/15/34 (e) | 1,650 | 1,776 | |
5% 5/15/35 (e) | 2,500 | 2,686 | |
5% 5/15/36 (e) | 3,000 | 3,220 | |
5% 5/15/37 (e) | 2,755 | 2,951 | |
| Series 2019 A, 5% 5/15/44 | 10,000 | 10,947 | |
| Long Beach Unified School District Series 2009: | |||
| 5.25% 8/1/33 | 410 | 411 | |
| 5.75% 8/1/33 | 170 | 170 | |
| Los Angeles Cmnty. College District Series 2017 J, 4% 8/1/33 | 2,500 | 2,598 | |
| Los Angeles County Pub. Works Fing. Auth. Lease Rev. Series 2022 G: | |||
| 5% 12/1/41 | 6,875 | 7,791 | |
| 5% 12/1/42 | 2,500 | 2,825 | |
| Los Angeles County Reg'l. Fin. Auth. (MonteCedro, Inc. Proj.) Series 2014 A, 5% 11/15/44 | 2,250 | 2,259 | |
| Los Angeles Dept. Arpt. Rev.: | |||
| Series 2015 A: | |||
5% 5/15/24 (e) | 795 | 824 | |
5% 5/15/25 (e) | 2,250 | 2,367 | |
5% 5/15/26 (e) | 1,715 | 1,805 | |
5% 5/15/27 (e) | 1,250 | 1,313 | |
5% 5/15/28 (e) | 1,260 | 1,326 | |
5% 5/15/29 (e) | 1,575 | 1,656 | |
5% 5/15/30 (e) | 1,400 | 1,469 | |
| Series 2015 D: | |||
5% 5/15/26 (e) | 1,100 | 1,158 | |
5% 5/15/28 (e) | 1,950 | 2,053 | |
5% 5/15/29 (e) | 2,550 | 2,681 | |
5% 5/15/30 (e) | 2,000 | 2,098 | |
5% 5/15/31 (e) | 2,540 | 2,658 | |
5% 5/15/41 (e) | 3,240 | 3,338 | |
| Series 2016 B: | |||
5% 5/15/26 (e) | 1,600 | 1,709 | |
5% 5/15/27 (e) | 1,000 | 1,071 | |
5% 5/15/36 (e) | 3,600 | 3,766 | |
5% 5/15/41 (e) | 3,750 | 3,895 | |
| Series 2017 B: | |||
5% 5/15/24 (e) | 1,905 | 1,973 | |
5% 5/15/25 (e) | 1,750 | 1,841 | |
| Series 2018 B, 5% 5/15/31 (e) | 7,350 | 7,910 | |
| Series 2018 D, 5% 5/15/48 (e) | 2,000 | 2,076 | |
| Series 2018, 5% 5/15/43 (e) | 10,000 | 10,458 | |
| Series 2019 A, 5% 5/15/49 (e) | 4,950 | 5,134 | |
| Series 2019 D, 5% 5/15/49 (e) | 5,625 | 5,821 | |
| Series A: | |||
5% 5/15/30 (e) | 700 | 754 | |
5% 5/15/51 (e) | 12,270 | 12,812 | |
| Series B, 5% 5/15/48 | 6,200 | 6,712 | |
| Series F: | |||
4% 5/15/49 (e) | 5,000 | 4,604 | |
5% 5/15/30 (e) | 2,480 | 2,709 | |
5% 5/15/34 (e) | 950 | 1,016 | |
5% 5/15/44 (e) | 13,685 | 14,256 | |
| Los Angeles Dept. of Wtr. & Pwr. Rev.: | |||
| Series 2015 A, 5% 7/1/30 | 6,000 | 6,350 | |
| Series 2016 B, 5% 7/1/42 | 4,595 | 4,864 | |
| Los Angeles Dept. of Wtr. & Pwr. Wtrwks. Rev. Series 2020 A: | |||
| 5% 7/1/47 | 3,030 | 3,301 | |
| 5% 7/1/50 | 1,255 | 1,359 | |
| Los Angeles Hbr. Dept. Rev. Series 2016 A, 5% 8/1/24 (e) | 1,500 | 1,566 | |
| Los Angeles Muni. Impt. Corp. Lease Rev.: | |||
| Series 2014 A: | |||
5% 5/1/24 (Escrowed to Maturity) | 325 | 339 | |
5% 5/1/25 (Pre-Refunded to 5/1/24 @ 100) | 540 | 563 | |
5% 5/1/29 (Pre-Refunded to 5/1/24 @ 100) | 500 | 522 | |
| Series 2014 B: | |||
5% 5/1/24 (Escrowed to Maturity) | 200 | 208 | |
5% 5/1/25 (Pre-Refunded to 5/1/24 @ 100) | 225 | 235 | |
5% 5/1/29 (Pre-Refunded to 5/1/24 @ 100) | 500 | 521 | |
5% 5/1/30 (Pre-Refunded to 5/1/24 @ 100) | 400 | 417 | |
5% 5/1/31 (Pre-Refunded to 5/1/24 @ 100) | 400 | 417 | |
| Series 2016 B, 5% 11/1/36 | 1,500 | 1,630 | |
| Los Angeles Unified School District Series 2020 C, 3% 7/1/35 | 4,000 | 3,665 | |
| Manhattan Beach Unified School District Series 2020 B, 4% 9/1/45 | 3,500 | 3,475 | |
| Middle Fork Proj. Fin. Auth. Series 2020: | |||
| 5% 4/1/27 | 190 | 203 | |
| 5% 4/1/28 | 3,350 | 3,623 | |
| Miracosta Cmnty. Clg District Series 2016 B, 2% 8/1/40 | 1,050 | 734 | |
| Modesto Elementary School District, Stanislaus County Series A, 0% 8/1/25 (Nat'l. Pub. Fin. Guarantee Corp. Insured) | 2,800 | 2,566 | |
| Modesto Gen. Oblig. Ctfs. of Prtn.: | |||
| (Cmnty. Ctr. Refing. Proj.) Series A, 5% 11/1/23 (AMBAC Insured) | 640 | 632 | |
| (Golf Course Refing. Proj.) Series B, 5% 11/1/23 (Nat'l. Pub. Fin. Guarantee Corp. Insured) | 415 | 414 | |
| Modesto Irrigation District Fing. Auth. Series 2019 A, 5% 10/1/39 | 1,500 | 1,645 | |
| Monrovia Unified School District Series B, 0% 8/1/33 (Nat'l. Pub. Fin. Guarantee Corp. Insured) | 2,625 | 1,738 | |
| Montebello Pub. Fing. Auth. (Montebello Home2 Suites by Hilton Hotel Proj.) Series 2016 A: | |||
| 5% 6/1/30 | 1,640 | 1,745 | |
| 5% 6/1/31 | 500 | 530 | |
| 5% 6/1/32 | 500 | 529 | |
| 5% 6/1/33 | 1,800 | 1,900 | |
| 5% 6/1/34 | 1,345 | 1,416 | |
| 5% 6/1/35 | 1,895 | 1,992 | |
| 5% 6/1/36 | 2,000 | 2,100 | |
| 5% 6/1/41 | 6,155 | 6,420 | |
| Moreland School District Series 2003 B, 0% 8/1/27 (Nat'l. Pub. Fin. Guarantee Corp. Insured) | 1,485 | 1,294 | |
| Mount Diablo Unified School District Series 2022 B: | |||
| 4% 8/1/35 | 4,000 | 4,188 | |
| 4% 8/1/36 | 3,650 | 3,757 | |
| 4% 6/1/37 | 1,625 | 1,655 | |
| Mount San Antonio Cmnty. College Series 2021 C, 2% 8/1/39 | 3,670 | 2,634 | |
| Muroc Jt Unified School District Series 2016 B, 5.25% 8/1/47 | 4,375 | 4,734 | |
| Murrieta Pub. Fing. Auth. Spl. Tax Series 2012: | |||
| 5% 9/1/23 | 1,650 | 1,650 | |
| 5% 9/1/25 | 1,000 | 1,000 | |
| 5% 9/1/26 | 1,155 | 1,155 | |
| Murrieta Valley Unified School District: | |||
| Series 2008, 0% 9/1/32 (Assured Guaranty Muni. Corp. Insured) | 5,000 | 3,525 | |
| Series 2015: | |||
4% 9/1/24 (Assured Guaranty Muni. Corp. Insured) | 330 | 340 | |
5% 9/1/25 (Assured Guaranty Muni. Corp. Insured) | 680 | 723 | |
5% 9/1/26 (Assured Guaranty Muni. Corp. Insured) | 1,500 | 1,598 | |
5% 9/1/26 (Pre-Refunded to 3/1/25 @ 100) | 500 | 533 | |
5% 9/1/27 (Pre-Refunded to 3/1/25 @ 100) | 455 | 485 | |
| North City West School Facilities Fing. Auth. Spl. Tax Series 2005 B, 5.25% 9/1/23 (AMBAC Insured) | 1,530 | 1,571 | |
| Northern California Energy Auth. Bonds Series 2018, 4%, tender 7/1/24 (b) | 10,250 | 10,410 | |
| Northern California Transmission Agcy. Rev. Series 2016 A: | |||
| 5% 5/1/36 | 2,390 | 2,558 | |
| 5% 5/1/38 | 2,265 | 2,416 | |
| 5% 5/1/39 | 1,500 | 1,597 | |
| Norwalk-Mirada Unified School District Series 2009 D, 0% 8/1/33 (Assured Guaranty Muni. Corp. Insured) | 5,755 | 3,850 | |
| Novato Unified School District Series 2020 C, 2% 8/1/39 | 4,645 | 3,285 | |
| Oakland Gen. Oblig. Series 2015 A: | |||
| 5% 1/15/28 | 1,225 | 1,316 | |
| 5% 1/15/29 | 1,650 | 1,771 | |
| 5% 1/15/30 | 1,665 | 1,785 | |
| 5% 1/15/31 | 1,520 | 1,621 | |
| Oakland Unified School District Alameda County Series 2015 A: | |||
| 5% 8/1/30 | 1,250 | 1,334 | |
| 5% 8/1/30 (Assured Guaranty Muni. Corp. Insured) | 1,570 | 1,680 | |
| Oceanside Unified School District Series A, 0% 8/1/31 (Assured Guaranty Corp. Insured) | 5,000 | 3,751 | |
| Ontario Int'l. Arpt. Auth.: | |||
| Series 2021 A, 5% 5/15/46 (Assured Guaranty Muni. Corp. Insured) | 4,315 | 4,662 | |
| Series 2021 B: | |||
4% 5/15/35 (Assured Guaranty Muni. Corp. Insured) (e) | 1,120 | 1,097 | |
4% 5/15/36 (Assured Guaranty Muni. Corp. Insured) (e) | 775 | 756 | |
4% 5/15/37 (Assured Guaranty Muni. Corp. Insured) (e) | 1,700 | 1,650 | |
4% 5/15/38 (Assured Guaranty Muni. Corp. Insured) (e) | 800 | 772 | |
4% 5/15/39 (Assured Guaranty Muni. Corp. Insured) (e) | 555 | 532 | |
4% 5/15/40 (Assured Guaranty Muni. Corp. Insured) (e) | 685 | 655 | |
| Orange County San District Waste Series 2016 A: | |||
| 5% 2/1/35 | 5,490 | 5,894 | |
| 5% 2/1/36 | 6,630 | 7,111 | |
| Oxnard Union High School District Gen. Oblig. Series B, 5% 8/1/45 | 5,000 | 5,403 | |
| Palmdale Elementary School District Spl. Tax Series 2017 A, 5% 8/1/41 (Assured Guaranty Muni. Corp. Insured) | 1,275 | 1,360 | |
| Palomar Cmnty. College District Series 2017, 5% 8/1/35 | 1,410 | 1,546 | |
| Palomar Health Rev.: | |||
| Series 2016, 5% 11/1/36 | 12,970 | 13,404 | |
| Series 2017, 5% 11/1/42 | 3,000 | 3,073 | |
| Palomar Pomerado Health Series 2004 A, 0% 8/1/26 (Nat'l. Pub. Fin. Guarantee Corp. Insured) | 4,870 | 4,264 | |
| Pomona Calif Wtsw Rev. (Wtr. Facilities Proj.) Series 2017, 4% 5/1/37 | 4,335 | 4,403 | |
| Port of Oakland Rev.: | |||
| Series 2017 D: | |||
5% 11/1/25 (e) | 5,135 | 5,451 | |
5% 11/1/26 (e) | 2,285 | 2,465 | |
5% 11/1/27 (e) | 4,000 | 4,375 | |
5% 11/1/28 (e) | 4,925 | 5,382 | |
5% 11/1/29 (e) | 4,200 | 4,585 | |
| Series 2021 H, 5% 5/1/28 (e) | 2,125 | 2,325 | |
| Poway California Redev. Agcy. Successor Series A: | |||
| 5% 6/15/27 | 2,385 | 2,645 | |
| 5% 6/15/28 | 2,190 | 2,361 | |
| 5% 12/15/28 | 2,200 | 2,369 | |
| 5% 12/15/29 | 4,825 | 5,196 | |
| 5% 12/15/30 | 3,500 | 4,055 | |
| Poway Unified School District: | |||
| (District #2007-1 School Facilities Proj.) Series 2008 A, 0% 8/1/32 | 13,070 | 9,356 | |
| Series 2011, 0% 8/1/46 | 10,150 | 3,433 | |
| Series B: | |||
0% 8/1/33 | 4,955 | 3,383 | |
0% 8/1/35 | 9,000 | 5,582 | |
0% 8/1/37 | 6,325 | 3,551 | |
0% 8/1/41 | 5,130 | 2,348 | |
| Poway Unified School District Pub. Fing.: | |||
| Series 2013, 5% 9/15/26 (Pre-Refunded to 9/15/23 @ 100) | 930 | 955 | |
| Series 2015 A: | |||
5% 9/1/30 | 1,495 | 1,567 | |
5% 9/1/31 | 1,260 | 1,317 | |
5% 9/1/32 | 1,795 | 1,873 | |
5% 9/1/33 | 2,740 | 2,853 | |
5% 9/1/34 | 1,225 | 1,273 | |
5% 9/1/35 | 1,580 | 1,641 | |
5% 9/1/36 | 3,395 | 3,522 | |
| Rancho Cucamonga Redev. Agcy. (Rancho Redev. Proj.) Series 2014: | |||
| 5% 9/1/25 (Assured Guaranty Muni. Corp. Insured) | 1,775 | 1,856 | |
| 5% 9/1/26 (Assured Guaranty Muni. Corp. Insured) | 1,350 | 1,414 | |
| 5% 9/1/27 (Assured Guaranty Muni. Corp. Insured) | 1,700 | 1,783 | |
| 5% 9/1/28 (Assured Guaranty Muni. Corp. Insured) | 1,700 | 1,786 | |
| 5% 9/1/29 (Assured Guaranty Muni. Corp. Insured) | 1,850 | 1,942 | |
| Richmond Wastewtr. Rev. Series 2019 A: | |||
| 5% 8/1/39 | 390 | 432 | |
| 5% 8/1/44 | 2,135 | 2,336 | |
| Riverside County Trans. Commission Toll Rev. Series 2021 B1, 4% 6/1/46 | 5,500 | 5,025 | |
| Riverside Elec. Rev. Series 2019 A, 5% 10/1/43 | 3,840 | 4,200 | |
| Riverside Swr. Rev. Series 2015 A: | |||
| 5% 8/1/26 | 1,710 | 1,834 | |
| 5% 8/1/27 | 1,725 | 1,851 | |
| 5% 8/1/28 | 1,935 | 2,078 | |
| 5% 8/1/29 | 2,330 | 2,502 | |
| Rocklin Unified School District Series 2002: | |||
| 0% 8/1/24 (Nat'l. Pub. Fin. Guarantee Corp. Insured) | 6,370 | 6,048 | |
| 0% 8/1/25 (Nat'l. Pub. Fin. Guarantee Corp. Insured) | 6,725 | 6,186 | |
| 0% 8/1/26 (Nat'l. Pub. Fin. Guarantee Corp. Insured) | 5,365 | 4,781 | |
| 0% 8/1/27 (Nat'l. Pub. Fin. Guarantee Corp. Insured) | 6,500 | 5,611 | |
| Roseville City School District Series 2002 A: | |||
| 0% 8/1/25 (Nat'l. Pub. Fin. Guarantee Corp. Insured) | 1,745 | 1,597 | |
| 0% 8/1/27 (Nat'l. Pub. Fin. Guarantee Corp. Insured) | 1,940 | 1,661 | |
| Sacramento City Fing. Auth. Rev. Series A, 0% 12/1/26 (Nat'l. Pub. Fin. Guarantee Corp. Insured) | 6,000 | 5,272 | |
| Sacramento City Unified School District: | |||
| Series 2007, 0% 7/1/28 (Assured Guaranty Muni. Corp. Insured) | 1,450 | 1,205 | |
| Series 2021 G: | |||
4% 8/1/44 (Assured Guaranty Muni. Corp. Insured) | 2,250 | 2,168 | |
4% 8/1/49 (Assured Guaranty Muni. Corp. Insured) | 4,000 | 3,765 | |
| Series 2022 A: | |||
5% 8/1/41 | 1,870 | 2,070 | |
5.5% 8/1/47 | 2,500 | 2,824 | |
| Sacramento County Arpt. Sys. Rev.: | |||
| Series 2016 B: | |||
5% 7/1/35 | 790 | 837 | |
5% 7/1/36 | 2,000 | 2,116 | |
5% 7/1/41 | 6,430 | 6,757 | |
| Series 2018 C: | |||
5% 7/1/31 (e) | 2,110 | 2,262 | |
5% 7/1/32 (e) | 1,590 | 1,699 | |
5% 7/1/34 (e) | 4,000 | 4,243 | |
5% 7/1/35 (e) | 5,000 | 5,289 | |
5% 7/1/36 (e) | 7,500 | 7,901 | |
| Series 2018 E: | |||
5% 7/1/33 | 1,315 | 1,442 | |
5% 7/1/34 | 1,000 | 1,087 | |
5% 7/1/35 | 1,270 | 1,374 | |
| Sacramento Muni. Util. District Elec. Rev.: | |||
| Series 2013 A, 5% 8/15/41 | 2,810 | 2,870 | |
| Series 2016 D, 5% 8/15/28 | 2,500 | 2,849 | |
| Sacramento TOT Rev. Series A: | |||
| 5% 6/1/34 | 700 | 761 | |
| 5% 6/1/35 | 2,065 | 2,236 | |
| 5% 6/1/36 | 2,215 | 2,390 | |
| 5% 6/1/37 | 2,405 | 2,584 | |
| 5% 6/1/38 | 1,240 | 1,327 | |
| 5% 6/1/43 | 7,165 | 7,568 | |
| San Bernardino County Ctfs. of Prtn. (Cap. Facilities Proj.) Series B, 6.875% 8/1/24 (Escrowed to Maturity) | 3,665 | 3,897 | |
| San Bernardino Unified School District Gen. Oblig. Series 2013 A, 5% 8/1/24 (Escrowed to Maturity) | 1,250 | 1,281 | |
| San Diego Assoc. of Governments (Mid-Coast Corridor Transit Proj.) Series 2019 A, 1.8% 11/15/27 | 7,505 | 7,105 | |
| San Diego California Assn. Govts. South Bay (South Bay Expressway Proj.) Series 2017 A: | |||
| 5% 7/1/29 | 1,660 | 1,825 | |
| 5% 7/1/31 | 2,000 | 2,184 | |
| 5% 7/1/33 | 1,735 | 1,883 | |
| 5% 7/1/34 | 1,380 | 1,493 | |
| 5% 7/1/35 | 1,500 | 1,620 | |
| 5% 7/1/36 | 1,980 | 2,135 | |
| 5% 7/1/38 | 2,000 | 2,145 | |
| 5% 7/1/42 | 5,000 | 5,316 | |
| San Diego County Reg'l. Arpt. Auth. Arpt. Rev.: | |||
| (Sub Lien Proj.): | |||
Series 2017 B: | |||
5% 7/1/24 (e) | 1,000 | 1,037 | |
5% 7/1/25 (e) | 515 | 543 | |
5% 7/1/27 (e) | 500 | 541 | |
5% 7/1/28 (e) | 1,000 | 1,080 | |
5% 7/1/29 (e) | 1,725 | 1,854 | |
5% 7/1/30 (e) | 2,915 | 3,116 | |
5% 7/1/31 (e) | 1,250 | 1,328 | |
5% 7/1/32 (e) | 1,300 | 1,374 | |
5% 7/1/33 (e) | 1,330 | 1,402 | |
5% 7/1/34 (e) | 1,000 | 1,048 | |
5% 7/1/36 (e) | 1,500 | 1,564 | |
5% 7/1/37 (e) | 750 | 781 | |
5% 7/1/47 (e) | 5,250 | 5,376 | |
Series A, 5% 7/1/26 (e) | 690 | 737 | |
| Series 2017A, 5% 7/1/42 | 5,810 | 6,130 | |
| Series 2019 B: | |||
5% 7/1/28 (e) | 820 | 894 | |
5% 7/1/49 (e) | 5,050 | 5,196 | |
| Series 2020 B: | |||
5% 7/1/29 | 2,720 | 3,105 | |
5% 7/1/30 | 2,550 | 2,944 | |
| Series 2020 C, 5% 7/1/23 (e) | 585 | 595 | |
| San Diego Pub. Facilities Fing. Auth. Lease Rev.: | |||
| (Cap. Impt. Proj.) Series 2012 A, 5% 4/15/23 | 1,710 | 1,714 | |
| Series 2015 A, 5% 10/15/44 | 4,005 | 4,256 | |
| Series 2016: | |||
5% 10/15/29 | 2,000 | 2,159 | |
5% 10/15/30 | 1,000 | 1,079 | |
5% 10/15/31 | 650 | 700 | |
| San Diego Unified School District: | |||
| (Convention Ctr. Proj.) Series 2012, 0% 7/1/45 | 4,770 | 1,782 | |
| Series 2008 C, 0% 7/1/37 | 1,300 | 741 | |
| Series 2008 E, 0% 7/1/47 (f) | 8,700 | 6,263 | |
| San Francisco Bay Area Rapid Transit District Sales Tax Rev. Series 2019 A: | |||
| 4% 7/1/38 | 3,040 | 3,080 | |
| 4% 7/1/39 | 2,075 | 2,094 | |
| San Francisco City & County Arpts. Commission Int'l. Arpt. Rev.: | |||
| Series 2014 A, 5% 5/1/40 (e) | 1,865 | 1,900 | |
| Series 2016 A: | |||
5% 5/1/28 | 2,280 | 2,478 | |
5% 5/1/29 | 1,225 | 1,327 | |
5% 5/1/30 | 330 | 356 | |
5% 5/1/32 | 1,000 | 1,073 | |
| Series 2016 B: | |||
5% 5/1/41 (e) | 9,695 | 10,027 | |
5% 5/1/46 (e) | 23,000 | 23,656 | |
| Series 2017 A, 5% 5/1/42 (e) | 3,205 | 3,308 | |
| Series 2017 D, 5% 5/1/25 (e) | 2,250 | 2,365 | |
| Series 2018 D, 5% 5/1/43 (e) | 1,000 | 1,036 | |
| Series 2019 A: | |||
5% 5/1/36 (e) | 10,000 | 10,605 | |
5% 5/1/37 (e) | 5,595 | 5,916 | |
5% 1/1/47 (e) | 6,005 | 6,218 | |
5% 5/1/49 (e) | 12,645 | 13,099 | |
| Series 2019 B, 5% 5/1/49 | 5,000 | 5,310 | |
| Series 2019 E, 5% 5/1/50 (e) | 7,000 | 7,247 | |
| Series 2022 A: | |||
5% 5/1/26 (e) | 5,000 | 5,326 | |
5% 5/1/52 (e) | 14,500 | 15,105 | |
| Series A, 5% 5/1/44 (e) | 13,220 | 13,439 | |
| San Francisco City & County Redev. Spl. Tax (Mission Bay South Pub. Impt. Proj.) Series 2013 A: | |||
| 5% 8/1/23 | 1,000 | 1,002 | |
| 5% 8/1/24 | 750 | 751 | |
| San Jacinto Unified School District Series 2014: | |||
| 5% 8/1/25 (Assured Guaranty Muni. Corp. Insured) | 875 | 915 | |
| 5% 8/1/26 (Assured Guaranty Muni. Corp. Insured) | 1,055 | 1,102 | |
| 5% 8/1/27 (Assured Guaranty Muni. Corp. Insured) | 1,250 | 1,305 | |
| 5% 8/1/28 (Assured Guaranty Muni. Corp. Insured) | 1,250 | 1,305 | |
| 5% 8/1/29 (Assured Guaranty Muni. Corp. Insured) | 3,150 | 3,289 | |
| 5% 8/1/30 (Assured Guaranty Muni. Corp. Insured) | 4,070 | 4,249 | |
| 5% 8/1/31 (Assured Guaranty Muni. Corp. Insured) | 650 | 678 | |
| San Joaquin Hills Trans. Corridor Agcy. Toll Road Rev. Series 1993, 0% 1/1/27 (Escrowed to Maturity) | 4,000 | 3,577 | |
| San Jose Int. Arpt. Rev.: | |||
| Series 2017 A: | |||
5% 3/1/27 (e) | 2,480 | 2,670 | |
5% 3/1/29 (e) | 735 | 787 | |
5% 3/1/31 (e) | 1,100 | 1,166 | |
5% 3/1/32 (e) | 850 | 896 | |
5% 3/1/33 (e) | 1,095 | 1,151 | |
5% 3/1/34 (e) | 1,250 | 1,308 | |
5% 3/1/35 (e) | 3,475 | 3,621 | |
5% 3/1/36 (e) | 2,250 | 2,342 | |
5% 3/1/37 (e) | 2,250 | 2,336 | |
5% 3/1/41 (e) | 10,235 | 10,536 | |
| Series 2017 B: | |||
5% 3/1/29 | 200 | 219 | |
5% 3/1/30 | 250 | 274 | |
5% 3/1/32 | 235 | 254 | |
5% 3/1/33 | 250 | 269 | |
5% 3/1/34 | 500 | 535 | |
5% 3/1/37 | 3,000 | 3,196 | |
| Series 2021 A: | |||
4% 3/1/34 (e) | 2,000 | 1,970 | |
5% 3/1/24 (e) | 1,000 | 1,030 | |
5% 3/1/25 (e) | 500 | 524 | |
5% 3/1/26 (e) | 1,550 | 1,647 | |
5% 3/1/27 (e) | 750 | 807 | |
5% 3/1/28 (e) | 1,270 | 1,380 | |
5% 3/1/29 (e) | 1,000 | 1,092 | |
5% 3/1/30 (e) | 1,275 | 1,402 | |
5% 3/1/31 (e) | 1,600 | 1,764 | |
5% 3/1/32 (e) | 2,000 | 2,188 | |
5% 3/1/33 (e) | 1,500 | 1,633 | |
| San Juan Unified School District Series 2020, 2.25% 8/1/39 | 2,000 | 1,458 | |
| San Marcos Redev. Agcy. Successor Series 2015 A: | |||
| 5% 10/1/27 | 1,650 | 1,773 | |
| 5% 10/1/29 | 675 | 724 | |
| 5% 10/1/30 | 2,000 | 2,144 | |
| 5% 10/1/31 | 2,310 | 2,472 | |
| San Marcos Unified School District Series 2010 B: | |||
| 0% 8/1/35 | 3,675 | 2,242 | |
| 0% 8/1/37 | 1,900 | 1,050 | |
| 0% 8/1/47 | 9,000 | 2,954 | |
| San Mateo County Cmnty. College District Series 2019: | |||
| 5% 9/1/36 | 1,000 | 1,124 | |
| 5% 9/1/37 | 1,000 | 1,121 | |
| 5% 9/1/38 | 760 | 850 | |
| 5% 9/1/39 | 1,000 | 1,116 | |
| 5% 9/1/40 | 1,100 | 1,222 | |
| San Mateo Foster City (Clean Wtr. Prog.) Series 2019, 5% 8/1/49 | 8,000 | 8,714 | |
| San Mateo Unified School District (Election of 2000 Proj.) Series B: | |||
| 0% 9/1/25 (Nat'l. Pub. Fin. Guarantee Corp. Insured) | 1,490 | 1,375 | |
| 0% 9/1/26 (Nat'l. Pub. Fin. Guarantee Corp. Insured) | 1,500 | 1,345 | |
| San Pablo Redev. Agcy. Series 2014 A: | |||
| 5% 6/15/25 (Assured Guaranty Muni. Corp. Insured) | 825 | 859 | |
| 5% 6/15/26 (Assured Guaranty Muni. Corp. Insured) | 860 | 897 | |
| 5% 6/15/27 (Assured Guaranty Muni. Corp. Insured) | 1,770 | 1,848 | |
| 5% 6/15/28 (Assured Guaranty Muni. Corp. Insured) | 1,865 | 1,950 | |
| 5% 6/15/29 (Assured Guaranty Muni. Corp. Insured) | 1,780 | 1,860 | |
| 5% 6/15/30 (Assured Guaranty Muni. Corp. Insured) | 1,150 | 1,201 | |
| 5% 6/15/31 (Assured Guaranty Muni. Corp. Insured) | 1,000 | 1,043 | |
| Sanger Unified School District Series 1999, 5.6% 8/1/23 (Nat'l. Pub. Fin. Guarantee Corp. Insured) | 75 | 76 | |
| Santa Barbara Fing. Auth. (Arpt. Proj.) Series 2019: | |||
| 5% 4/1/30 | 1,000 | 1,146 | |
| 5% 4/1/32 | 1,365 | 1,542 | |
| 5% 4/1/34 | 1,000 | 1,108 | |
| 5% 4/1/36 | 2,135 | 2,347 | |
| 5% 4/1/37 | 1,000 | 1,093 | |
| 5% 4/1/38 | 845 | 919 | |
| Santa Clara County Fing. Auth. Lease Rev.: | |||
| Series 2019 C, 3% 5/1/41 | 1,000 | 828 | |
| Series 2021 A, 3% 5/1/39 | 1,250 | 1,055 | |
| Santa Monica Pub. Fin. Rev.: | |||
| (City Svcs. Bldg. Proj.) Series 2017: | |||
4% 7/1/39 | 790 | 799 | |
5% 7/1/36 | 2,380 | 2,597 | |
5% 7/1/37 | 1,780 | 1,934 | |
| (Downtown Fire Station Proj.) Series 2018, 5% 7/1/42 | 1,250 | 1,342 | |
| Santa Monica-Malibu Unified School District Series 2017 C: | |||
| 4% 7/1/36 | 435 | 444 | |
| 4% 7/1/37 | 475 | 483 | |
| 4% 7/1/38 | 450 | 456 | |
| 4% 7/1/39 | 550 | 556 | |
| 5% 7/1/30 | 250 | 278 | |
| 5% 7/1/31 | 350 | 387 | |
| 5% 7/1/32 | 255 | 281 | |
| 5% 7/1/33 | 250 | 275 | |
| 5% 7/1/34 | 315 | 346 | |
| 5% 7/1/35 | 400 | 438 | |
| Santa Rosa Wastewtr. Rev. Series 2002 B, 0% 9/1/25 (AMBAC Insured) | 6,800 | 6,275 | |
| Shasta Union High School District: | |||
| Series 2002, 0% 8/1/26 (Nat'l. Pub. Fin. Guarantee Corp. Insured) | 1,000 | 887 | |
| Series 2003, 0% 5/1/28 (Nat'l. Pub. Fin. Guarantee Corp. Insured) | 3,340 | 2,789 | |
| South Bayside Waste Mgmt. Auth.: | |||
| Series 2019 A: | |||
5% 9/1/42 (Assured Guaranty Muni. Corp. Insured) | 1,255 | 1,366 | |
5% 9/1/42 (Pre-Refunded to 9/1/29 @ 100) | 45 | 52 | |
| Series 2019 B: | |||
5% 9/1/24 (e) | 425 | 444 | |
5% 9/1/24 (Escrowed to Maturity) (e) | 15 | 16 | |
| South Orange County Pub. Fin. Auth. Series 2016: | |||
| 5% 4/1/34 | 2,000 | 2,148 | |
| 5% 4/1/36 | 3,000 | 3,211 | |
| South Orange County Pub. Fing. Auth. Spl. Tax Rev. Series 2014 A: | |||
| 5% 8/15/23 | 1,000 | 1,029 | |
| 5% 8/15/26 | 1,975 | 2,009 | |
| 5% 8/15/27 | 700 | 712 | |
| 5% 8/15/28 | 1,000 | 1,017 | |
| South San Francisco Pub. Fing. Auth. (Cmnty. Civic Campus And Multiple Cap. Projs.) Series 2021 A, 4% 6/1/46 | 5,000 | 4,887 | |
| Southern California Pub. Pwr. Auth. Rev. Bonds Series 2020 C, 0.65%, tender 7/1/25 (b) | 10,000 | 9,254 | |
| Southwestern Cmnty. College District Gen. Oblig.: | |||
| Series 2000, 0% 8/1/27 (Nat'l. Pub. Fin. Guarantee Corp. Insured) | 2,495 | 2,160 | |
| Series 2004, 0% 8/1/28 (Nat'l. Pub. Fin. Guarantee Corp. Insured) | 2,500 | 2,093 | |
| Stockton Pub. Fing. Auth. Wtr. Rev. Series 2018 A: | |||
| 4% 10/1/37 | 2,000 | 2,023 | |
| 5% 10/1/35 | 1,000 | 1,093 | |
| 5% 10/1/36 | 1,585 | 1,729 | |
| Stockton Unified School District Gen. Oblig.: | |||
| Series 2012 A: | |||
5% 8/1/24 (Assured Guaranty Muni. Corp. Insured) | 300 | 314 | |
5% 8/1/25 (Assured Guaranty Muni. Corp. Insured) | 750 | 786 | |
5% 8/1/27 (Assured Guaranty Muni. Corp. Insured) | 265 | 277 | |
5% 8/1/28 (Assured Guaranty Muni. Corp. Insured) | 510 | 532 | |
5% 8/1/38 (Assured Guaranty Muni. Corp. Insured) | 2,500 | 2,579 | |
5% 8/1/42 (Assured Guaranty Muni. Corp. Insured) | 4,650 | 4,786 | |
| Series 2012: | |||
5% 7/1/23 (Assured Guaranty Muni. Corp. Insured) | 1,270 | 1,273 | |
5% 7/1/24 (Assured Guaranty Muni. Corp. Insured) | 1,350 | 1,353 | |
5% 7/1/25 (Assured Guaranty Muni. Corp. Insured) | 1,060 | 1,062 | |
5% 7/1/26 (Assured Guaranty Muni. Corp. Insured) | 1,110 | 1,112 | |
5% 7/1/27 (Assured Guaranty Muni. Corp. Insured) | 1,065 | 1,067 | |
5% 1/1/29 (Assured Guaranty Muni. Corp. Insured) | 600 | 601 | |
| Successor Agcy. to the Redev. Agcy. of Pittsburg (Los Medanos Cmnty. Dev. Proj.) Series 2016 A: | |||
| 5% 9/1/24 (Assured Guaranty Muni. Corp. Insured) | 2,440 | 2,543 | |
| 5% 9/1/25 (Assured Guaranty Muni. Corp. Insured) | 3,500 | 3,709 | |
| 5% 9/1/26 (Assured Guaranty Muni. Corp. Insured) | 3,000 | 3,234 | |
| 5% 9/1/27 (Assured Guaranty Muni. Corp. Insured) | 4,380 | 4,734 | |
| 5% 9/1/28 (Assured Guaranty Muni. Corp. Insured) | 3,500 | 3,790 | |
| 5% 9/1/29 (Assured Guaranty Muni. Corp. Insured) | 2,000 | 2,164 | |
| Tobacco Securitization Auth. Southern California Tobacco Settlement Series 2019 A1: | |||
| 5% 6/1/24 | 1,000 | 1,035 | |
| 5% 6/1/26 | 1,185 | 1,261 | |
| Tulare Swr. Rev. Series 2015: | |||
| 5% 11/15/24 (Assured Guaranty Muni. Corp. Insured) | 820 | 865 | |
| 5% 11/15/25 (Assured Guaranty Muni. Corp. Insured) | 800 | 864 | |
| 5% 11/15/26 (Assured Guaranty Muni. Corp. Insured) | 965 | 1,041 | |
| 5% 11/15/27 (Assured Guaranty Muni. Corp. Insured) | 1,500 | 1,618 | |
| 5% 11/15/28 (Assured Guaranty Muni. Corp. Insured) | 1,165 | 1,256 | |
| Turlock Irrigation District Rev. Series 2020, 5% 1/1/41 | 4,000 | 4,381 | |
| Univ. of California Regents Med. Ctr. Pool Rev. Series 2013 J, 5% 5/15/48 | 5,815 | 5,898 | |
| Univ. of California Revs.: | |||
| Series 2017 AV, 5% 5/15/34 | 2,000 | 2,198 | |
| Series 2017 M, 3% 5/15/37 | 800 | 703 | |
| Series 2018 O, 5% 5/15/48 | 1,000 | 1,078 | |
| Series 2019 BB, 5% 5/15/49 | 2,000 | 2,181 | |
| Series 2023 BM: | |||
5% 5/15/37 (c) | 2,000 | 2,229 | |
5% 5/15/38 (c) | 2,290 | 2,533 | |
5% 5/15/39 (c) | 2,000 | 2,199 | |
| Upland Gen. Oblig. Ctfs. of Prtn. (San Antonio Cmnty. Hosp.,CA. Proj.) Series 2017: | |||
| 4% 1/1/35 | 1,000 | 942 | |
| 4% 1/1/36 | 1,000 | 938 | |
| 5% 1/1/30 | 1,335 | 1,425 | |
| 5% 1/1/31 | 1,350 | 1,432 | |
| 5% 1/1/32 | 1,400 | 1,473 | |
| 5% 1/1/33 | 2,835 | 2,972 | |
| 5% 1/1/34 | 2,230 | 2,330 | |
| Vacaville Unified School District Series 2014 C: | |||
| 5% 8/1/23 (Build America Mutual Assurance Insured) | 930 | 953 | |
| 5% 8/1/26 (Build America Mutual Assurance Insured) | 1,295 | 1,356 | |
| Vernon Elec. Sys. Rev. Series 2022 A: | |||
| 5% 8/1/36 | 1,490 | 1,598 | |
| 5% 8/1/38 | 825 | 875 | |
| 5% 8/1/39 | 850 | 899 | |
| 5% 8/1/41 | 420 | 441 | |
| Walnut Valley Unified School District Series D: | |||
| 0% 8/1/30 (Nat'l. Pub. Fin. Guarantee Corp. Insured) | 2,875 | 2,196 | |
| 0% 8/1/31 (Nat'l. Pub. Fin. Guarantee Corp. Insured) | 2,900 | 2,115 | |
| 0% 8/1/32 (Nat'l. Pub. Fin. Guarantee Corp. Insured) | 1,315 | 915 | |
| Washington Township Health Care District Gen. Oblig. Series 2013 B: | |||
| 5% 8/1/43 | 5,000 | 5,127 | |
| 5.5% 8/1/40 | 5,000 | 5,194 | |
| Washington Township Health Care District Rev.: | |||
| Series 2017 B: | |||
5% 7/1/30 | 2,500 | 2,647 | |
5% 7/1/32 | 1,350 | 1,411 | |
5% 7/1/33 | 1,000 | 1,042 | |
| Series 2019 A: | |||
5% 7/1/30 | 1,000 | 1,086 | |
5% 7/1/31 | 875 | 945 | |
5% 7/1/32 | 890 | 957 | |
5% 7/1/36 | 750 | 797 | |
| Series A: | |||
4% 7/1/33 | 260 | 259 | |
4% 7/1/35 | 300 | 287 | |
5% 7/1/30 | 300 | 328 | |
5% 7/1/31 | 325 | 351 | |
| West Contra Costa Unified School District: | |||
| Series 2012 D, 0% 8/1/33 (Assured Guaranty Muni. Corp. Insured) | 1,675 | 1,138 | |
| Series 2014 A: | |||
5% 8/1/23 | 365 | 374 | |
5% 8/1/25 | 2,555 | 2,675 | |
5% 8/1/26 (Pre-Refunded to 8/1/24 @ 100) | 2,550 | 2,674 | |
5% 8/1/27 (Pre-Refunded to 8/1/24 @ 100) | 1,150 | 1,206 | |
5% 8/1/28 (Pre-Refunded to 8/1/24 @ 100) | 1,000 | 1,048 | |
5% 8/1/29 (Pre-Refunded to 8/1/24 @ 100) | 1,675 | 1,756 | |
TOTAL CALIFORNIA | 1,748,271 | ||
| Guam - 0.0% | |||
| Guam Int'l. Arpt. Auth. Rev. Series 2013 C, 6.375% 10/1/43 (e) | 230 | 236 | |
| Puerto Rico - 0.6% | |||
| Puerto Rico Commonwealth Pub. Impt. Gen. Oblig. Series 2021 A1: | |||
| 0% 7/1/33 | 4,980 | 2,827 | |
| 5.625% 7/1/27 | 595 | 631 | |
| 5.625% 7/1/29 | 1,815 | 1,951 | |
| 5.75% 7/1/31 | 4,240 | 4,642 | |
TOTAL PUERTO RICO | 10,051 | ||
| TOTAL MUNICIPAL BONDS (Cost $1,813,277) | 1,758,558 | ||
| Municipal Notes - 2.4% | |||
Principal Amount (a) (000s) | Value ($) (000s) | ||
| California - 2.4% | |||
| California Muni. Fin. Auth. Rev. (Chevron U.S.A., Inc. Proj.) Series 2010 A, 0.85% 9/1/22, VRDN (b) | 26,500 | 26,508 | |
| California Pub. Fin. Auth. Rev. Series 2022 B1, 0.87% 9/1/22 (Liquidity Facility JPMorgan Chase Bank), VRDN (b) | 9,000 | 9,000 | |
| California Statewide Cmntys. Dev. Auth. Multi-family Hsg. Rev. (Irvine Apt. Cmntys. LP Proj.) Series 2001 W1, 0.95% 9/1/22, LOC Wells Fargo Bank NA, VRDN (b)(e) | 5,000 | 5,000 | |
| Los Angeles Multi-family Hsg. Rev. Series 1994 A, 1.3% 9/1/22, LOC JPMorgan Chase Bank, VRDN (b)(e) | 1,608 | 1,608 | |
| TOTAL MUNICIPAL NOTES (Cost $42,118) | 42,116 | ||
| TOTAL INVESTMENT IN SECURITIES - 101.3% (Cost $1,855,395) | 1,800,674 |
NET OTHER ASSETS (LIABILITIES) - (1.3)% | (23,128) |
| NET ASSETS - 100.0% | 1,777,546 |
| VRDN | - | VARIABLE RATE DEMAND NOTE (A debt instrument that is payable upon demand, either daily, weekly or monthly) |
| (a) | Amount is stated in United States dollars unless otherwise noted. |
| (b) | Coupon rates for floating and adjustable rate securities reflect the rates in effect at period end. |
| (c) | Security or a portion of the security purchased on a delayed delivery or when-issued basis. |
| (d) | Security exempt from registration under Rule 144A of the Securities Act of 1933. These securities may be resold in transactions exempt from registration, normally to qualified institutional buyers. At the end of the period, the value of these securities amounted to $25,670,000 or 1.4% of net assets. |
| (e) | Private activity obligations whose interest is subject to the federal alternative minimum tax for individuals. |
| (f) | Security initially issued in zero coupon form which converts to coupon form at a specified rate and date. The rate shown is the rate at period end. |
| Valuation Inputs at Reporting Date: | ||||
Description (Amounts in thousands) | Total ($) | Level 1 ($) | Level 2 ($) | Level 3 ($) |
Investments in Securities: | ||||
| Municipal Securities | 1,800,674 | - | 1,800,674 | - |
| Total Investments in Securities: | 1,800,674 | - | 1,800,674 | - |
| Statement of Assets and Liabilities | ||||
| Amounts in thousands (except per-share amounts) | August 31, 2022 (Unaudited) | |||
| Assets | ||||
Investment in securities, at value - See accompanying schedule Unaffiliated issuers (cost $1,855,395): | $ | 1,800,674 | ||
| Cash | 22,492 | |||
| Receivable for fund shares sold | 1,998 | |||
| Interest receivable | 19,023 | |||
| Prepaid expenses | 3 | |||
| Other receivables | 4 | |||
Total assets | 1,844,194 | |||
| Liabilities | ||||
| Payable for investments purchased | ||||
Regular delivery | $834 | |||
Delayed delivery | 60,052 | |||
| Payable for fund shares redeemed | 3,503 | |||
| Distributions payable | 1,530 | |||
| Accrued management fee | 526 | |||
| Distribution and service plan fees payable | 21 | |||
| Other affiliated payables | 151 | |||
| Other payables and accrued expenses | 31 | |||
| Total Liabilities | 66,648 | |||
| Net Assets | $ | 1,777,546 | ||
| Net Assets consist of: | ||||
| Paid in capital | $ | 1,842,263 | ||
| Total accumulated earnings (loss) | (64,717) | |||
| Net Assets | $ | 1,777,546 | ||
| Net Asset Value and Maximum Offering Price | ||||
| Class A : | ||||
Net Asset Value and redemption price per share ($51,601 ÷ 4,316 shares) (a) | $ | 11.96 | ||
| Maximum offering price per share (100/96.00 of $11.96) | $ | 12.46 | ||
| Class M : | ||||
Net Asset Value and redemption price per share ($4,274 ÷ 357 shares) (a)(b) | $ | 11.99 | ||
| Maximum offering price per share (100/96.00 of $11.99) | $ | 12.49 | ||
| Class C : | ||||
Net Asset Value and offering price per share ($11,011 ÷ 923 shares) (a)(b) | $ | 11.94 | ||
| California Municipal Income : | ||||
Net Asset Value , offering price and redemption price per share ($1,625,343 ÷ 136,137 shares) | $ | 11.94 | ||
| Class I : | ||||
Net Asset Value , offering price and redemption price per share ($36,930 ÷ 3,087 shares) (b) | $ | 11.97 | ||
| Class Z : | ||||
Net Asset Value , offering price and redemption price per share ($48,387 ÷ 4,045 shares) | $ | 11.96 | ||
(a)Redemption price per share is equal to net asset value less any applicable contingent deferred sales charge. | ||||
(b)Corresponding Net Asset Value does not calculate due to rounding of fractional net assets and/or units | ||||
| Statement of Operations | ||||
| Amounts in thousands | Six months ended August 31, 2022 (Unaudited) | |||
| Investment Income | ||||
| Interest | $ | 27,351 | ||
| Expenses | ||||
| Management fee | $ | 3,222 | ||
| Transfer agent fees | 759 | |||
| Distribution and service plan fees | 133 | |||
| Accounting fees and expenses | 170 | |||
| Custodian fees and expenses | 10 | |||
| Independent trustees' fees and expenses | 3 | |||
| Registration fees | 77 | |||
| Audit | 27 | |||
| Legal | 4 | |||
| Miscellaneous | 5 | |||
| Total expenses before reductions | 4,410 | |||
| Expense reductions | (26) | |||
| Total expenses after reductions | 4,384 | |||
| Net Investment income (loss) | 22,967 | |||
| Realized and Unrealized Gain (Loss) | ||||
| Net realized gain (loss) on: | ||||
| Investment Securities: | ||||
| Unaffiliated issuers | (8,155) | |||
| Total net realized gain (loss) | (8,155) | |||
| Change in net unrealized appreciation (depreciation) on investment securities | (134,703) | |||
| Net gain (loss) | (142,858) | |||
| Net increase (decrease) in net assets resulting from operations | $ | (119,891) | ||
| Statement of Changes in Net Assets | ||||
| Amount in thousands | Six months ended August 31, 2022 (Unaudited) | Year ended February 28, 2022 | ||
| Increase (Decrease) in Net Assets | ||||
| Operations | ||||
| Net investment income (loss) | $ | 22,967 | $ | 49,753 |
| Net realized gain (loss) | (8,155) | 6,358 | ||
| Change in net unrealized appreciation (depreciation) | (134,703) | (71,653) | ||
| Net increase (decrease) in net assets resulting from operations | (119,891) | (15,542) | ||
| Distributions to shareholders | (22,932) | (60,162) | ||
| Share transactions - net increase (decrease) | (216,385) | (40,615) | ||
| Total increase (decrease) in net assets | (359,208) | (116,319) | ||
| Net Assets | ||||
| Beginning of period | 2,136,754 | 2,253,073 | ||
| End of period | $ | 1,777,546 | $ | 2,136,754 |
| Fidelity Advisor® California Municipal Income Fund Class A |
Six months ended (Unaudited) August 31, 2022 | Years ended February 28, 2022 | 2021 | 2020 A | 2019 | 2018 | |||||||
Selected Per-Share Data | ||||||||||||
| Net asset value, beginning of period | $ | 12.85 | $ | 13.28 | $ | 13.63 | $ | 12.78 | $ | 12.68 | $ | 12.79 |
| Income from Investment Operations | ||||||||||||
Net investment income (loss) B,C | .132 | .245 | .281 | .309 | .339 | .340 | ||||||
| Net realized and unrealized gain (loss) | (.890) | (.370) | (.305) | .866 | .101 | (.043) | ||||||
| Total from investment operations | (.758) | (.125) | (.024) | 1.175 | .440 | .297 | ||||||
| Distributions from net investment income | (.132) | (.245) | (.281) | (.309) | (.339) | (.339) | ||||||
| Distributions from net realized gain | - | (.060) | (.045) | (.016) | (.001) | (.068) | ||||||
| Total distributions | (.132) | (.305) | (.326) | (.325) | (.340) | (.407) | ||||||
| Net asset value, end of period | $ | 11.96 | $ | 12.85 | $ | 13.28 | $ | 13.63 | $ | 12.78 | $ | 12.68 |
Total Return D,E,F | (5.91)% | (1.00)% | (.15)% | 9.30% | 3.53% | 2.31% | ||||||
Ratios to Average Net Assets C,G,H | ||||||||||||
| Expenses before reductions | .78% I | .79% | .79% | .79% | .79% | .80% | ||||||
| Expenses net of fee waivers, if any | .78% I | .78% | .79% | .79% | .79% | .80% | ||||||
| Expenses net of all reductions | .78% I | .78% | .78% | .79% | .79% | .80% | ||||||
| Net investment income (loss) | 2.15% I | 1.84% | 2.11% | 2.34% | 2.69% | 2.62% | ||||||
| Supplemental Data | ||||||||||||
| Net assets, end of period (in millions) | $ | 52 | $ | 59 | $ | 60 | $ | 56 | $ | 44 | $ | 39 |
Portfolio turnover rate J | 9% I | 14% | 13% | 11% | 20% | 20% |
| Fidelity Advisor® California Municipal Income Fund Class M |
Six months ended (Unaudited) August 31, 2022 | Years ended February 28, 2022 | 2021 | 2020 A | 2019 | 2018 | |||||||
Selected Per-Share Data | ||||||||||||
| Net asset value, beginning of period | $ | 12.88 | $ | 13.31 | $ | 13.66 | $ | 12.81 | $ | 12.71 | $ | 12.82 |
| Income from Investment Operations | ||||||||||||
Net investment income (loss) B,C | .138 | .258 | .290 | .315 | .345 | .346 | ||||||
| Net realized and unrealized gain (loss) | (.890) | (.370) | (.304) | .866 | .101 | (.043) | ||||||
| Total from investment operations | (.752) | (.112) | (.014) | 1.181 | .446 | .303 | ||||||
| Distributions from net investment income | (.138) | (.258) | (.291) | (.315) | (.345) | (.345) | ||||||
| Distributions from net realized gain | - | (.060) | (.045) | (.016) | (.001) | (.068) | ||||||
| Total distributions | (.138) | (.318) | (.336) | (.331) | (.346) | (.413) | ||||||
| Net asset value, end of period | $ | 11.99 | $ | 12.88 | $ | 13.31 | $ | 13.66 | $ | 12.81 | $ | 12.71 |
Total Return D,E,F | (5.85)% | (.91)% | (.08)% | 9.32% | 3.57% | 2.35% | ||||||
Ratios to Average Net Assets C,G,H | ||||||||||||
| Expenses before reductions | .69% I | .70% | .72% | .75% | .75% | .76% | ||||||
| Expenses net of fee waivers, if any | .69% I | .70% | .72% | .75% | .75% | .76% | ||||||
| Expenses net of all reductions | .69% I | .70% | .72% | .75% | .75% | .76% | ||||||
| Net investment income (loss) | 2.24% I | 1.92% | 2.18% | 2.37% | 2.72% | 2.66% | ||||||
| Supplemental Data | ||||||||||||
| Net assets, end of period (in millions) | $ | 4 | $ | 5 | $ | 5 | $ | 11 | $ | 9 | $ | 8 |
Portfolio turnover rate J | 9% I | 14% | 13% | 11% | 20% | 20% |
| Fidelity Advisor® California Municipal Income Fund Class C |
Six months ended (Unaudited) August 31, 2022 | Years ended February 28, 2022 | 2021 | 2020 A | 2019 | 2018 | |||||||
Selected Per-Share Data | ||||||||||||
| Net asset value, beginning of period | $ | 12.83 | $ | 13.26 | $ | 13.61 | $ | 12.76 | $ | 12.66 | $ | 12.77 |
| Income from Investment Operations | ||||||||||||
Net investment income (loss) B,C | .087 | .146 | .181 | .210 | .244 | .241 | ||||||
| Net realized and unrealized gain (loss) | (.890) | (.370) | (.305) | .866 | .100 | (.042) | ||||||
| Total from investment operations | (.803) | (.224) | (.124) | 1.076 | .344 | .199 | ||||||
| Distributions from net investment income | (.087) | (.146) | (.181) | (.210) | (.243) | (.241) | ||||||
| Distributions from net realized gain | - | (.060) | (.045) | (.016) | (.001) | (.068) | ||||||
| Total distributions | (.087) | (.206) | (.226) | (.226) | (.244) | (.309) | ||||||
| Net asset value, end of period | $ | 11.94 | $ | 12.83 | $ | 13.26 | $ | 13.61 | $ | 12.76 | $ | 12.66 |
Total Return D,E,F | (6.27)% | (1.74)% | (.90)% | 8.50% | 2.76% | 1.54% | ||||||
Ratios to Average Net Assets C,G,H | ||||||||||||
| Expenses before reductions | 1.52% I | 1.53% | 1.54% | 1.54% | 1.55% | 1.56% | ||||||
| Expenses net of fee waivers, if any | 1.52% I | 1.53% | 1.54% | 1.54% | 1.54% | 1.56% | ||||||
| Expenses net of all reductions | 1.51% I | 1.53% | 1.54% | 1.54% | 1.54% | 1.56% | ||||||
| Net investment income (loss) | 1.41% I | 1.09% | 1.36% | 1.59% | 1.93% | 1.87% | ||||||
| Supplemental Data | ||||||||||||
| Net assets, end of period (in millions) | $ | 11 | $ | 14 | $ | 21 | $ | 24 | $ | 24 | $ | 29 |
Portfolio turnover rate J | 9% I | 14% | 13% | 11% | 20% | 20% |
| Fidelity® California Municipal Income Fund |
Six months ended (Unaudited) August 31, 2022 | Years ended February 28, 2022 | 2021 | 2020 A | 2019 | 2018 | |||||||
Selected Per-Share Data | ||||||||||||
| Net asset value, beginning of period | $ | 12.83 | $ | 13.26 | $ | 13.61 | $ | 12.76 | $ | 12.66 | $ | 12.77 |
| Income from Investment Operations | ||||||||||||
Net investment income (loss) B,C | .152 | .290 | .325 | .353 | .381 | .383 | ||||||
| Net realized and unrealized gain (loss) | (.890) | (.370) | (.305) | .866 | .101 | (.042) | ||||||
| Total from investment operations | (.738) | (.080) | .020 | 1.219 | .482 | .341 | ||||||
| Distributions from net investment income | (.152) | (.290) | (.325) | (.353) | (.381) | (.383) | ||||||
| Distributions from net realized gain | - | (.060) | (.045) | (.016) | (.001) | (.068) | ||||||
| Total distributions | (.152) | (.350) | (.370) | (.369) | (.382) | (.451) | ||||||
| Net asset value, end of period | $ | 11.94 | $ | 12.83 | $ | 13.26 | $ | 13.61 | $ | 12.76 | $ | 12.66 |
Total Return D,E | (5.77)% | (.67)% | .18% | 9.68% | 3.88% | 2.66% | ||||||
Ratios to Average Net Assets C,F,G | ||||||||||||
| Expenses before reductions | .45% H | .45% | .45% | .45% | .46% | .46% | ||||||
| Expenses net of fee waivers, if any | .45% H | .45% | .45% | .45% | .46% | .46% | ||||||
| Expenses net of all reductions | .45% H | .45% | .45% | .45% | .46% | .46% | ||||||
| Net investment income (loss) | 2.48% H | 2.17% | 2.45% | 2.68% | 3.02% | 2.97% | ||||||
| Supplemental Data | ||||||||||||
| Net assets, end of period (in millions) | $ | 1,625 | $ | 1,947 | $ | 2,047 | $ | 2,159 | $ | 1,792 | $ | 1,841 |
Portfolio turnover rate I | 9% H | 14% | 13% | 11% | 20% | 20% |
| Fidelity Advisor® California Municipal Income Fund Class I |
Six months ended (Unaudited) August 31, 2022 | Years ended February 28, 2022 | 2021 | 2020 A | 2019 | 2018 | |||||||
Selected Per-Share Data | ||||||||||||
| Net asset value, beginning of period | $ | 12.86 | $ | 13.29 | $ | 13.64 | $ | 12.79 | $ | 12.69 | $ | 12.80 |
| Income from Investment Operations | ||||||||||||
Net investment income (loss) B,C | .147 | .278 | .313 | .342 | .371 | .372 | ||||||
| Net realized and unrealized gain (loss) | (.891) | (.370) | (.304) | .866 | .100 | (.042) | ||||||
| Total from investment operations | (.744) | (.092) | .009 | 1.208 | .471 | .330 | ||||||
| Distributions from net investment income | (.146) | (.278) | (.314) | (.342) | (.370) | (.372) | ||||||
| Distributions from net realized gain | - | (.060) | (.045) | (.016) | (.001) | (.068) | ||||||
| Total distributions | (.146) | (.338) | (.359) | (.358) | (.371) | (.440) | ||||||
| Net asset value, end of period | $ | 11.97 | $ | 12.86 | $ | 13.29 | $ | 13.64 | $ | 12.79 | $ | 12.69 |
Total Return D,E | (5.79)% | (.75)% | .09% | 9.56% | 3.78% | 2.57% | ||||||
Ratios to Average Net Assets C,F,G | ||||||||||||
| Expenses before reductions | .55% H | .54% | .54% | .55% | .55% | .55% | ||||||
| Expenses net of fee waivers, if any | .54% H | .54% | .54% | .55% | .55% | .55% | ||||||
| Expenses net of all reductions | .54% H | .54% | .54% | .55% | .54% | .55% | ||||||
| Net investment income (loss) | 2.38% H | 2.08% | 2.36% | 2.58% | 2.93% | 2.87% | ||||||
| Supplemental Data | ||||||||||||
| Net assets, end of period (in millions) | $ | 37 | $ | 52 | $ | 67 | $ | 59 | $ | 48 | $ | 60 |
Portfolio turnover rate I | 9% H | 14% | 13% | 11% | 20% | 20% |
| Fidelity Advisor® California Municipal Income Fund Class Z |
Six months ended (Unaudited) August 31, 2022 | Years ended February 28, 2022 | 2021 | 2020 A | 2019 B | ||||||
Selected Per-Share Data | ||||||||||
| Net asset value, beginning of period | $ | 12.86 | $ | 13.29 | $ | 13.64 | $ | 12.79 | $ | 12.58 |
| Income from Investment Operations | ||||||||||
Net investment income (loss) C,D | .154 | .294 | .329 | .357 | .156 | |||||
| Net realized and unrealized gain (loss) | (.900) | (.370) | (.305) | .866 | .211 | |||||
| Total from investment operations | (.746) | (.076) | .024 | 1.223 | .367 | |||||
| Distributions from net investment income | (.154) | (.294) | (.329) | (.357) | (.156) | |||||
| Distributions from net realized gain | - | (.060) | (.045) | (.016) | (.001) | |||||
| Total distributions | (.154) | (.354) | (.374) | (.373) | (.157) | |||||
| Net asset value, end of period | $ | 11.96 | $ | 12.86 | $ | 13.29 | $ | 13.64 | $ | 12.79 |
Total Return E,F | (5.81)% | (.64)% | .21% | 9.68% | 2.93% | |||||
Ratios to Average Net Assets D,G,H | ||||||||||
| Expenses before reductions | .43% I | .42% | .43% | .43% | .44% I | |||||
| Expenses net of fee waivers, if any | .42% I | .42% | .43% | .43% | .43% I | |||||
| Expenses net of all reductions | .42% I | .42% | .43% | .43% | .43% I | |||||
| Net investment income (loss) | 2.50% I | 2.20% | 2.47% | 2.70% | 3.01% I | |||||
| Supplemental Data | ||||||||||
| Net assets, end of period (in millions) | $ | 48 | $ | 60 | $ | 53 | $ | 43 | $ | 27 |
Portfolio turnover rate J | 9% I | 14% | 13% | 11% | 20% |
| Gross unrealized appreciation | $ 27,264 |
| Gross unrealized depreciation | (81,834) |
| Net unrealized appreciation (depreciation) | $ (54,570) |
| Tax cost | $ 1,855,244 |
| Purchases ($) | Sales ($) | |
| Fidelity California Municipal Income Fund | 87,632 | 282,536 |
| Distribution Fee | Service Fee | Total Fees | Retained by FDC | |
| Class A | - % | .25% | $ 68 | $ - A |
| Class M | - % | .25% | 6 | - |
| Class C | .75% | .25% | 59 | 1 |
$ 133 | $ 1 |
| Retained by FDC | |
| Class A | $ - A |
| Class M | - A |
Class C B | - A |
$ - A |
| Amount | % of Class-Level Average Net Assets A | |
| Class A | $ 44 | .16 |
| Class M | 1 | .06 |
| Class C | 9 | .15 |
| California Municipal Income | 653 | .08 |
| Class I | 39 | .17 |
| Class Z | 13 | .05 |
$ 759 |
| % of Average Net Assets | |
| Fidelity California Municipal Income Fund | .02 |
| Purchases ($) | Sales ($) | Realized Gain (Loss) ($) | |
| Fidelity California Municipal Income Fund | - | 29,400 | (16) |
| Amount | |
| Fidelity California Municipal Income Fund | $ 2 |
Six months ended August 31, 2022 | Year ended February 28, 2022 | |
| Fidelity California Municipal Income Fund | ||
| Distributions to shareholders | ||
| Class A | $ 590 | $1,413 |
| Class M | 51 | 126 |
| Class C | 84 | 268 |
| California Municipal Income | 21,020 | 55,279 |
| Class I | 552 | 1,496 |
| Class Z | 635 | 1,580 |
Total | $ 22,932 | $ 60,162 |
| Shares | Shares | Dollars | Dollars | |
| Six months ended August 31, 2022 | Year ended February 28, 2022 | Six months ended August 31, 2022 | Year ended February 28, 2022 | |
| Fidelity California Municipal Income Fund | ||||
| Class A | ||||
| Shares sold | 219 | 614 | $ 2,637 | $ 8,217 |
| Reinvestment of distributions | 43 | 94 | 522 | 1,250 |
| Shares redeemed | (539) | (651) | (6,550) | (8,683) |
| Net increase (decrease) | (277) | 57 | $ (3,391) | $ 784 |
| Class M | ||||
| Shares sold | 10 | 19 | $ 120 | $ 255 |
| Reinvestment of distributions | 4 | 9 | 47 | 115 |
| Shares redeemed | (52) | (33) | (634) | (436) |
| Net increase (decrease) | (38) | (5) | $ (467) | $ (66) |
| Class C | ||||
| Shares sold | 55 | 43 | $ 655 | $ 579 |
| Reinvestment of distributions | 6 | 19 | 77 | 249 |
| Shares redeemed | (205) | (548) | (2,506) | (7,311) |
| Net increase (decrease) | (144) | (486) | $ (1,774) | $ (6,483) |
| California Municipal Income | ||||
| Shares sold | 52,250 | 29,380 | $ 635,705 | $ 390,522 |
| Reinvestment of distributions | 1,001 | 2,279 | 12,130 | 30,348 |
| Shares redeemed | (68,827) | (34,305) | (839,623) | (451,641) |
| Net increase (decrease) | (15,576) | (2,646) | $ (191,788) | $ (30,771) |
| Class I | ||||
| Shares sold | 729 | 489 | $ 8,827 | $ 6,565 |
| Reinvestment of distributions | 39 | 95 | 470 | 1,273 |
| Shares redeemed | (1,757) | (1,565) | (21,311) | (20,938) |
| Net increase (decrease) | (989) | (981) | $ (12,014) | $ (13,100) |
| Class Z | ||||
| Shares sold | 1,317 | 1,636 | $ 16,063 | $ 21,884 |
| Reinvestment of distributions | 47 | 107 | 575 | 1,425 |
| Shares redeemed | (1,952) | (1,073) | (23,589) | (14,288) |
| Net increase (decrease) | (588) | 670 | $ (6,951) | $ 9,021 |
| The Example is based on an investment of $1,000 invested at the beginning of the period and held for the entire period (March 1, 2022 to August 31, 2022). |
Annualized Expense Ratio- A | Beginning Account Value March 1, 2022 | Ending Account Value August 31, 2022 | Expenses Paid During Period- C March 1, 2022 to August 31, 2022 | |||||||
| Fidelity® California Municipal Income Fund | ||||||||||
| Class A | .78% | |||||||||
| Actual | $ 1,000 | $ 940.90 | $ 3.82 | |||||||
Hypothetical- B | $ 1,000 | $ 1,021.27 | $ 3.97 | |||||||
| Class M | .69% | |||||||||
| Actual | $ 1,000 | $ 941.50 | $ 3.38 | |||||||
Hypothetical- B | $ 1,000 | $ 1,021.73 | $ 3.52 | |||||||
| Class C | 1.52% | |||||||||
| Actual | $ 1,000 | $ 937.30 | $ 7.42 | |||||||
Hypothetical- B | $ 1,000 | $ 1,017.54 | $ 7.73 | |||||||
| Fidelity® California Municipal Income Fund | .45% | |||||||||
| Actual | $ 1,000 | $ 942.30 | $ 2.20 | |||||||
Hypothetical- B | $ 1,000 | $ 1,022.94 | $ 2.29 | |||||||
| Class I | .54% | |||||||||
| Actual | $ 1,000 | $ 942.10 | $ 2.64 | |||||||
Hypothetical- B | $ 1,000 | $ 1,022.48 | $ 2.75 | |||||||
| Class Z | .42% | |||||||||
| Actual | $ 1,000 | $ 941.90 | $ 2.06 | |||||||
Hypothetical- B | $ 1,000 | $ 1,023.09 | $ 2.14 | |||||||
|


Contents
| Revenue Sources (% of Fund's net assets) | ||
| General Obligations | 36.0% | |
| Health Care | 18.7% | |
| Transportation | 14.3% | |
| Education | 10.9% | |
| Water & Sewer | 7.6% | |
| Electric Utilities | 5.0% | |
| Others* (Individually Less Than 5%) | 7.5% | |
| 100.0% | ||
| *Includes net other assets | ||
Quality Diversification (% of Fund's net assets) |
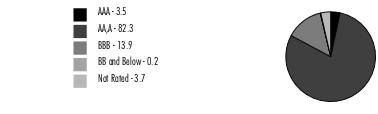 |
Short-Term Investments and Net Other Assets (Liabilities) - (3.6)%* |
*Short-term investments and Net Other Assets (Liabilities) are not available in the pie chart. |
| We have used ratings from Moody's Investors Service, Inc. Where Moody's® ratings are not available, we have used S&P® ratings. All ratings are as of the date indicated and do not reflect subsequent changes. |
| Municipal Bonds - 103.6% | |||
Principal Amount (a) | Value ($) | ||
| California - 103.0% | |||
| Alameda Corridor Trans. Auth. Rev. Series 2016 A: | |||
| 4% 10/1/23 | 850,000 | 858,105 | |
| 5% 10/1/22 | 1,250,000 | 1,251,987 | |
| Azusa Unified School District Series 2002, 0% 7/1/26 (Assured Guaranty Muni. Corp. Insured) | 1,125,000 | 995,274 | |
| Bay Area Toll Auth. San Francisco Bay Toll Bridge Rev. Bonds: | |||
| Series 2018 A, 2.625%, tender 4/1/26 (b) | 7,300,000 | 7,261,100 | |
| Series 2021 A, 2%, tender 4/1/28 (b) | 11,900,000 | 11,254,924 | |
| Series A, 2.95%, tender 4/1/26 (b) | 985,000 | 989,095 | |
| Series B, 2.85%, tender 4/1/25 (b) | 7,215,000 | 7,222,512 | |
| Bay Area Wtr. Supply & Conservation Agcy. (Cap. Cost Recovery Prepayment Prog.) Series 2023 A: | |||
| 5% 10/1/23 (c) | 1,000,000 | 1,018,566 | |
| 5% 10/1/24 (c) | 1,000,000 | 1,039,857 | |
| 5% 10/1/25 (c) | 1,000,000 | 1,060,351 | |
| 5% 10/1/26 (c) | 1,000,000 | 1,080,993 | |
| 5% 10/1/27 (c) | 1,000,000 | 1,098,352 | |
| 5% 10/1/28 (c) | 1,000,000 | 1,114,777 | |
| California County Tobacco Securitization Agcy. Tobacco Settlement Asset-Backed Series 2020 A: | |||
| 4% 6/1/23 | 490,000 | 496,667 | |
| 5% 6/1/24 | 350,000 | 363,817 | |
| 5% 6/1/25 | 400,000 | 422,195 | |
| 5% 6/1/26 | 500,000 | 534,577 | |
| California Edl. Facilities Auth. Rev. Series 2021 A: | |||
| 5% 4/1/23 | 525,000 | 532,549 | |
| 5% 4/1/24 | 525,000 | 544,233 | |
| 5% 4/1/25 | 415,000 | 438,176 | |
| 5% 4/1/26 | 475,000 | 510,322 | |
| 5% 4/1/27 | 475,000 | 519,371 | |
| 5% 4/1/28 | 375,000 | 416,440 | |
| California Gen. Oblig.: | |||
| Series 2014, 4% 5/1/23 | 2,440,000 | 2,467,634 | |
| Series 2015, 5% 8/1/24 | 2,060,000 | 2,164,198 | |
| Series 2016: | |||
5% 8/1/27 | 2,000,000 | 2,191,923 | |
5% 9/1/30 | 1,550,000 | 1,697,197 | |
| Series 2017, 5% 8/1/23 | 8,175,000 | 8,378,571 | |
| Series 2018, 5% 8/1/25 | 250,000 | 268,577 | |
| Series 2020: | |||
4% 3/1/23 | 5,000,000 | 5,042,875 | |
4% 3/1/24 | 2,500,000 | 2,560,954 | |
5% 11/1/26 | 2,000,000 | 2,205,877 | |
5% 11/1/27 | 1,000,000 | 1,124,291 | |
5% 11/1/30 | 1,060,000 | 1,247,363 | |
| Series 2021: | |||
4% 12/1/24 | 5,000,000 | 5,180,962 | |
5% 12/1/25 | 2,500,000 | 2,705,942 | |
| California Health Facilities Fing. Auth. Rev.: | |||
| Bonds: | |||
(Providence St. Jospeh Health) Series 2016 B3, 2%, tender 10/1/25 (b) | 12,800,000 | 12,426,752 | |
Series 2009 C, 5%, tender 10/18/22 (b) | 640,000 | 641,827 | |
Series 2009 D, 1.7%, tender 10/18/22 (b) | 5,300,000 | 5,293,079 | |
Series 2016 B2, 4%, tender 10/1/24 (b) | 7,130,000 | 7,307,812 | |
Series 2019 B, 5%, tender 10/1/27 (b) | 5,625,000 | 6,118,138 | |
Series 2019 C: | |||
5%, tender 10/1/25 (b) | 3,910,000 | 4,206,721 | |
5%, tender 10/1/25 (b) | 5,730,000 | 6,065,075 | |
Series 2021 A, 3%, tender 8/15/25 (b) | 9,000,000 | 9,079,734 | |
| Series 2014 A, 5% 10/1/22 | 1,850,000 | 1,853,701 | |
| Series 2015, 5% 11/15/25 | 675,000 | 727,712 | |
| Series 2016 A, 4% 3/1/27 | 475,000 | 489,370 | |
| Series 2021 A: | |||
4% 11/1/23 | 500,000 | 509,591 | |
4% 11/1/24 | 365,000 | 376,778 | |
5% 11/1/25 | 500,000 | 538,281 | |
5% 11/1/26 | 300,000 | 329,382 | |
5% 11/1/27 | 200,000 | 223,519 | |
| Series 2021 B: | |||
5% 11/1/26 | 250,000 | 274,485 | |
5% 11/1/27 | 600,000 | 670,557 | |
| Series 2022 A: | |||
5% 5/15/23 | 550,000 | 559,099 | |
5% 5/15/24 | 1,200,000 | 1,246,132 | |
5% 5/15/25 | 1,650,000 | 1,747,595 | |
5% 5/15/26 | 1,000,000 | 1,078,544 | |
5% 5/15/27 | 275,000 | 301,563 | |
| California Infrastructure & Econ. Dev. Series 2019, 5% 8/1/27 | 300,000 | 332,055 | |
| California Infrastructure and Econ. Dev. Bank Rev.: | |||
| Bonds: | |||
(Los Angeles County Museum of Art Proj.) Series 2021 A, 1.2%, tender 6/1/28 (b) | 7,000,000 | 6,154,293 | |
Series 2021 B1, 0.39%, tender 1/1/24 (b) | 2,500,000 | 2,432,797 | |
| Series 2015 A, 5% 11/1/24 | 1,230,000 | 1,267,486 | |
| California Muni. Fin. Auth. (Orange County Civic Ctr. Infrastructure Impt. Prog.) Series 2017 A, 5% 6/1/30 | 2,650,000 | 2,923,401 | |
| California Muni. Fin. Auth. Ctfs. of Prtn. Series 2021, 5% 11/1/27 (d) | 6,930,000 | 7,350,152 | |
| California Muni. Fin. Auth. Rev.: | |||
| (Biola Univeristy, Inc. Proj.) Series 2017: | |||
5% 10/1/22 | 1,020,000 | 1,021,663 | |
5% 10/1/23 | 1,230,000 | 1,255,353 | |
5% 10/1/24 | 370,000 | 383,085 | |
5% 10/1/25 | 1,210,000 | 1,271,285 | |
5% 10/1/26 | 355,000 | 377,345 | |
| (Channing House Proj.) Series 2017 A: | |||
4% 5/15/28 | 2,000,000 | 2,111,661 | |
5% 5/15/24 | 910,000 | 947,304 | |
5% 5/15/26 | 360,000 | 390,921 | |
5% 5/15/27 | 350,000 | 387,550 | |
| (Institute On Aging Proj.) Series 2017: | |||
5% 8/15/23 | 225,000 | 230,379 | |
5% 8/15/24 | 285,000 | 298,301 | |
5% 8/15/25 | 995,000 | 1,064,004 | |
5% 8/15/26 | 275,000 | 300,121 | |
| (Univ. of Verne Proj.) Series 2017 A: | |||
5% 6/1/23 | 700,000 | 713,427 | |
5% 6/1/25 | 1,250,000 | 1,324,069 | |
5% 6/1/28 | 390,000 | 426,026 | |
| Series 2016 A, 4% 11/1/26 (d) | 1,000,000 | 1,008,086 | |
| Series 2017 A: | |||
5% 11/1/23 | 450,000 | 459,796 | |
5% 7/1/24 | 1,400,000 | 1,440,145 | |
5% 7/1/25 | 1,035,000 | 1,079,133 | |
5% 11/1/25 | 745,000 | 782,300 | |
5% 7/1/26 | 1,065,000 | 1,123,936 | |
5% 7/1/27 | 1,235,000 | 1,321,475 | |
5% 7/1/29 | 115,000 | 122,839 | |
| Series 2017 B: | |||
5% 7/1/24 | 1,440,000 | 1,481,292 | |
5% 1/1/25 | 1,230,000 | 1,280,692 | |
5% 7/1/26 | 500,000 | 527,670 | |
5% 7/1/27 | 640,000 | 684,813 | |
| Series 2018: | |||
5% 10/1/22 | 475,000 | 475,794 | |
5% 10/1/23 | 225,000 | 229,638 | |
5% 10/1/24 | 275,000 | 284,894 | |
5% 10/1/25 | 275,000 | 289,341 | |
5% 10/1/26 | 300,000 | 319,827 | |
| Series 2019 A: | |||
5% 4/1/26 | 650,000 | 698,336 | |
5% 4/1/27 | 1,285,000 | 1,405,036 | |
5% 4/1/28 | 2,000,000 | 2,221,016 | |
5% 4/1/29 | 3,000,000 | 3,365,435 | |
| California Muni. Fin. Auth. Solid Waste Disp. Rev. Bonds (Waste Mgmt., Inc. Proj.) Series 2009 A, 1.3%, tender 2/3/25 (b)(d) | 1,500,000 | 1,430,775 | |
| California Muni. Fin. Auth. Sr Living Series 2019: | |||
| 4% 11/15/23 | 295,000 | 296,780 | |
| 4% 11/15/25 | 630,000 | 634,116 | |
| 4% 11/15/28 | 710,000 | 704,960 | |
| California Muni. Fin. Auth. Student Hsg.: | |||
| (CHF Davis II, L.L.C. Orchard Park Student Hsg. Proj.) Series 2021: | |||
5% 5/15/24 (Build America Mutual Assurance Insured) | 500,000 | 517,106 | |
5% 5/15/25 (Build America Mutual Assurance Insured) | 400,000 | 419,393 | |
5% 5/15/26 (Build America Mutual Assurance Insured) | 350,000 | 372,534 | |
5% 5/15/27 (Build America Mutual Assurance Insured) | 470,000 | 507,006 | |
5% 5/15/28 (Build America Mutual Assurance Insured) | 375,000 | 408,895 | |
5% 5/15/29 (Build America Mutual Assurance Insured) | 400,000 | 439,638 | |
5% 5/15/30 (Build America Mutual Assurance Insured) | 500,000 | 552,453 | |
| (CHF-Davis I, LLC - West Village Student Housing Proj.) Series 2018, 5% 5/15/23 | 1,000,000 | 1,014,532 | |
| (CHF-Davis I, LLC - West Village Student Hsg. Proj.) Series 2018: | |||
5% 5/15/24 | 1,300,000 | 1,339,073 | |
5% 5/15/25 | 3,400,000 | 3,545,436 | |
5% 5/15/26 | 3,000,000 | 3,163,392 | |
5% 5/15/27 | 3,000,000 | 3,190,738 | |
| (CHF-Riverside I, LLC - UCR Dundee-Glasgow Student Hsg. Proj.) Series 2018: | |||
5% 5/15/23 | 950,000 | 963,805 | |
5% 5/15/24 | 2,265,000 | 2,333,076 | |
5% 5/15/27 | 750,000 | 797,685 | |
| (CHF-Riverside II, LLC-UCR North District Phase I Student Hsg. Proj.) Series 2019: | |||
5% 5/15/23 (Build America Mutual Assurance Insured) | 400,000 | 407,180 | |
5% 5/15/24 (Build America Mutual Assurance Insured) | 345,000 | 356,920 | |
| California Pub. Fin. Auth. Rev. Series 2021 A: | |||
| 4% 10/15/22 | 245,000 | 245,347 | |
| 4% 10/15/23 | 285,000 | 288,403 | |
| 4% 10/15/24 | 380,000 | 385,641 | |
| 4% 10/15/25 | 390,000 | 397,461 | |
| California Pub. Works Board Lease Rev.: | |||
| (Various Cap. Projs.): | |||
Series 2012 G: | |||
5% 11/1/24 | 720,000 | 723,327 | |
5% 11/1/25 | 5,600,000 | 5,625,878 | |
Series 2016 D, 5% 4/1/28 | 4,600,000 | 5,055,781 | |
Series 2021 D: | |||
5% 11/1/27 | 3,555,000 | 3,991,345 | |
5% 11/1/28 | 3,745,000 | 4,273,394 | |
Series 2022 C: | |||
5% 8/1/23 (c) | 5,290,000 | 5,406,499 | |
5% 8/1/24 (c) | 2,570,000 | 2,690,233 | |
5% 8/1/25 (c) | 4,850,000 | 5,182,044 | |
5% 8/1/26 (c) | 6,255,000 | 6,822,627 | |
5% 8/1/27 (c) | 5,165,000 | 5,741,150 | |
5% 8/1/28 (c) | 3,175,000 | 3,583,400 | |
Series B, 5% 10/1/26 | 325,000 | 357,168 | |
| Series 2014 B, 5% 10/1/22 | 1,225,000 | 1,227,703 | |
| Series 2014 C, 5% 10/1/22 | 1,000,000 | 1,002,206 | |
| Series 2021 D, 4% 11/1/26 | 2,905,000 | 3,082,851 | |
| Series A, 5% 9/1/29 | 860,000 | 901,862 | |
| California State Univ. Rev.: | |||
| Bonds: | |||
Series 2016 B1, 1.6%, tender 11/1/26 (b) | 525,000 | 495,291 | |
Series 2016 B3, 4%, tender 11/1/23 (b) | 6,205,000 | 6,260,088 | |
| Series 2020 A: | |||
5% 11/1/23 | 1,500,000 | 1,546,240 | |
5% 11/1/24 | 1,500,000 | 1,586,982 | |
5% 11/1/25 | 1,000,000 | 1,083,550 | |
| California Statewide Cmntys. Dev. Auth. Series 2016: | |||
| 5% 5/15/23 | 2,375,000 | 2,406,813 | |
| 5% 5/15/24 | 1,000,000 | 1,027,054 | |
| California Statewide Cmntys. Dev. Auth. Hosp. Rev. Series 2018: | |||
| 5% 1/1/23 | 500,000 | 503,726 | |
| 5% 1/1/24 | 750,000 | 771,020 | |
| 5% 1/1/25 | 2,100,000 | 2,177,440 | |
| 5% 1/1/26 | 1,090,000 | 1,144,434 | |
| 5% 1/1/27 | 1,900,000 | 2,016,722 | |
| California Statewide Cmntys. Dev. Auth. Rev.: | |||
| (Huntington Memorial Hosp. Proj.) Series 2018: | |||
5% 7/1/24 | 1,020,000 | 1,062,539 | |
5% 7/1/25 | 625,000 | 663,630 | |
| Series 2014 B, 5% 7/1/24 (Escrowed to Maturity) | 900,000 | 943,470 | |
| Series 2015: | |||
4% 2/1/25 | 940,000 | 902,336 | |
5% 2/1/30 | 200,000 | 187,424 | |
| Series 2016: | |||
5% 10/1/22 | 725,000 | 726,457 | |
5% 10/1/24 | 2,030,000 | 2,108,853 | |
5% 10/1/25 | 1,010,000 | 1,062,670 | |
| Series 2017 A, 3% 11/1/22 (d) | 365,000 | 364,988 | |
| Series 2018 A, 5% 3/1/27 | 555,000 | 596,997 | |
| Series 2018, 5% 7/1/23 | 300,000 | 306,291 | |
| Series 2021 A: | |||
5% 4/1/23 | 350,000 | 355,074 | |
5% 4/1/24 | 375,000 | 385,329 | |
5% 4/1/25 | 575,000 | 600,823 | |
5% 4/1/26 | 380,000 | 402,666 | |
5% 4/1/27 | 600,000 | 643,764 | |
5% 4/1/28 | 425,000 | 461,675 | |
5% 4/1/29 | 625,000 | 683,909 | |
5% 4/1/30 | 440,000 | 484,884 | |
5% 4/1/31 | 450,000 | 498,551 | |
| Chula Vista Elementary School District Series 2019, 0% 8/1/23 | 6,500,000 | 6,343,767 | |
| Corona-Norco Unified School District Series 2013 A, 5% 9/1/22 (Escrowed to Maturity) | 500,000 | 500,000 | |
| Eastern Muni. Wtr. District Fing. Auth. Series 2020 A: | |||
| 5% 7/1/26 | 250,000 | 274,181 | |
| 5% 7/1/27 | 255,000 | 285,627 | |
| El Camino Hosp. District Series 2006, 0% 8/1/29 (Nat'l. Pub. Fin. Guarantee Corp. Insured) | 5,000,000 | 4,028,373 | |
| El Dorado Irr. Distr. Rev. Series 2016 A, 5% 3/1/23 | 500,000 | 506,821 | |
| Elk Grove Fin. Auth. Spl. Tax Rev.: | |||
| Series 2015: | |||
5% 9/1/22 | 425,000 | 425,000 | |
5% 9/1/23 | 1,000,000 | 1,022,081 | |
5% 9/1/24 | 1,000,000 | 1,041,719 | |
5% 9/1/27 | 150,000 | 161,051 | |
| Series 2016: | |||
4% 9/1/23 | 1,500,000 | 1,510,802 | |
4% 9/1/25 | 1,915,000 | 1,948,738 | |
| Elk Grove Unified School Distr. Ctfs. of Prtn. (Cap. Facilities Proj.) Series 2016, 5% 2/1/24 (Build America Mutual Assurance Insured) | 1,460,000 | 1,510,374 | |
| Elsinore Valley Muni. Wtr. District Series 2016 A: | |||
| 5% 7/1/23 | 770,000 | 786,981 | |
| 5% 7/1/24 | 1,000,000 | 1,045,729 | |
| Emery Unified School District Series D, 0% 8/1/40 (Pre-Refunded to 8/1/23 @ 40.487) | 250,000 | 99,099 | |
| Evergreen Elementary School District Series 2006 B, 0% 8/1/27 | 1,240,000 | 1,081,893 | |
| Fairfield Ctfs. Prtn. Series 2007, 0% 4/1/27 | 1,850,000 | 1,610,359 | |
| Fullerton Pub. Fing. Auth. Series 2021 A: | |||
| 4% 2/1/23 | 100,000 | 100,671 | |
| 4% 2/1/24 | 240,000 | 245,103 | |
| 4% 2/1/25 | 235,000 | 241,108 | |
| 4% 2/1/26 | 210,000 | 217,227 | |
| 4% 2/1/27 | 230,000 | 239,438 | |
| 4% 2/1/28 | 230,000 | 239,147 | |
| 4% 2/1/30 | 385,000 | 399,260 | |
| Garvey School District Series 2000 B, 0% 8/1/30 | 1,625,000 | 1,228,771 | |
| Golden State Tobacco Securitization Corp. Tobacco Settlement Rev.: | |||
| Series 2005 A, 0% 6/1/27 (Escrowed to Maturity) | 5,000,000 | 4,422,237 | |
| Series 2015 A, 5% 6/1/40 (Pre-Refunded to 6/1/25 @ 100) | 6,435,000 | 6,885,102 | |
| Series 2017 A1, 5% 6/1/28 (Pre-Refunded to 6/1/27 @ 100) | 1,510,000 | 1,689,897 | |
| Series A, 0% 6/1/24 (Escrowed to Maturity) | 7,605,000 | 7,287,581 | |
| Indio Pub. Fing. Auth. Lease Rev. Series 2012, 5% 11/1/22 | 745,000 | 748,381 | |
| Irvine Reassessment District 12-1 Ltd. Oblig. Series 2013, 5% 9/2/22 | 750,000 | 750,000 | |
| La Quinta Redev. Agcy. (La Quinta Redev. Proj. Areas No. 1 and 2) Series 2014 A, 5% 9/1/22 (Escrowed to Maturity) | 615,000 | 615,000 | |
| Long Beach Unified School District Series D1, 0% 8/1/29 | 1,915,000 | 1,496,744 | |
| Los Angeles Cmnty. College District Series 2016 I, 4% 8/1/24 | 800,000 | 823,293 | |
| Los Angeles County Pub. Works Fing. Auth. Lease Rev.: | |||
| (LACMA Bldg. for the Permanent Collection Proj.) Series 2020 A, 5% 12/1/27 | 3,375,000 | 3,812,542 | |
| Series 2022 G: | |||
5% 12/1/25 | 1,500,000 | 1,625,524 | |
5% 12/1/26 | 1,750,000 | 1,937,230 | |
5% 12/1/27 | 1,875,000 | 2,118,079 | |
5% 12/1/28 | 1,625,000 | 1,863,703 | |
| Los Angeles Dept. Arpt. Rev.: | |||
| Series 2020 A: | |||
5% 5/15/23 | 5,000,000 | 5,091,519 | |
5% 5/15/24 | 5,000,000 | 5,213,487 | |
5% 5/15/25 | 5,015,000 | 5,361,707 | |
| Series 2020 B, 5% 5/15/26 | 7,000,000 | 7,653,104 | |
| Series C, 5% 5/15/25 | 265,000 | 283,320 | |
| Los Angeles Muni. Impt. Corp. Lease Rev.: | |||
| Series 2014 A, 5% 5/1/23 (Escrowed to Maturity) | 475,000 | 483,647 | |
| Series 2014 B, 5% 5/1/23 (Escrowed to Maturity) | 200,000 | 203,508 | |
| Los Angeles Unified School District: | |||
| Series 2016 B, 2% 7/1/29 | 465,000 | 429,006 | |
| Series 2020 C, 5% 7/1/26 | 5,670,000 | 6,222,795 | |
| Series A: | |||
5% 7/1/24 | 435,000 | 456,251 | |
5% 7/1/25 | 3,355,000 | 3,601,258 | |
| Series C, 5% 7/1/25 | 655,000 | 686,998 | |
| Series M1, 5% 7/1/25 | 300,000 | 322,020 | |
| Middle Fork Proj. Fin. Auth. Series 2020: | |||
| 5% 4/1/23 | 2,610,000 | 2,638,304 | |
| 5% 4/1/30 | 1,200,000 | 1,316,540 | |
| Montebello Pub. Fing. Auth.: | |||
| (Montebello Home2 Suites By Hilton Hotel Proj.) Series 2016 A, 5% 6/1/27 | 1,415,000 | 1,509,180 | |
| (Montebello Home2 Suites by Hilton Hotel Proj.) Series 2016 A, 5% 6/1/28 | 1,490,000 | 1,591,974 | |
| (Montebello Home2 Suites By Hilton Hotel Proj.) Series 2016 A, 5% 6/1/29 | 1,560,000 | 1,663,477 | |
| Monterey Peninsula Cmnty. College District Series 2016, 0% 8/1/24 | 2,850,000 | 2,711,351 | |
| Mount Diablo Unified School District Series 2022 B: | |||
| 4% 8/1/24 | 4,335,000 | 4,462,749 | |
| 4% 8/1/27 | 3,000,000 | 3,211,235 | |
| Napa Valley Cmnty. Cllge District Series 2002 B, 0% 8/1/27 (Nat'l. Pub. Fin. Guarantee Corp. Insured) | 1,025,000 | 881,835 | |
| Napa Valley Unified School District Series 2010 A, 0% 8/1/27 | 2,065,000 | 1,781,742 | |
| Newport Mesa Unified School District Series 2007, 0% 8/1/29 (Nat'l. Pub. Fin. Guarantee Corp. Insured) | 3,915,000 | 3,221,531 | |
| Northern California Energy Auth. Bonds Series 2018, 4%, tender 7/1/24 (b) | 10,000,000 | 10,156,370 | |
| Oakland Unified School District Alameda County: | |||
| Series 2015 A: | |||
5% 8/1/23 (Assured Guaranty Muni. Corp. Insured) | 2,125,000 | 2,176,941 | |
5% 8/1/24 | 1,900,000 | 1,988,451 | |
5% 8/1/24 (Assured Guaranty Muni. Corp. Insured) | 2,400,000 | 2,514,945 | |
| Series 2016: | |||
5% 8/1/26 | 1,470,000 | 1,603,031 | |
5% 8/1/29 | 940,000 | 1,025,256 | |
| Orange County Trans. Auth. (I-405 Impt. Proj.) Series 2021, 5% 10/15/24 (Liquidity Facility Orange County Local Trans. Auth. Sales Tax Rev.) | 5,000,000 | 5,276,738 | |
| Palmdale School District Series 2002, 0% 2/1/27 (Nat'l. Pub. Fin. Guarantee Corp. Insured) | 1,400,000 | 1,239,922 | |
| Palo Alto Unified School District Gen. Oblig. Series 2008, 0% 8/1/25 | 2,255,000 | 2,082,124 | |
| Palomar Cmnty. College District Series 2010 B, 0% 8/1/29 | 1,010,000 | 813,731 | |
| Palomar Health Calif Ctfs. Prtn. Series 2017: | |||
| 5% 11/1/23 | 300,000 | 306,323 | |
| 5% 11/1/24 | 300,000 | 311,328 | |
| 5% 11/1/25 | 350,000 | 368,708 | |
| 5% 11/1/26 | 475,000 | 506,777 | |
| Palomar Health Rev. Series 2016: | |||
| 5% 11/1/25 | 2,000,000 | 2,106,903 | |
| 5% 11/1/26 | 1,875,000 | 2,000,435 | |
| Palomar Pomerado Health Series 2009 A, 0% 8/1/31 (Assured Guaranty Corp. Insured) | 800,000 | 569,422 | |
| Perris Union High School District Series A, 5% 9/1/22 (Assured Guaranty Muni. Corp. Insured) | 625,000 | 625,000 | |
| Placentia-Yorba Linda Unified School District Series 2004 B, 0% 8/1/27 | 1,905,000 | 1,650,068 | |
| Poway California Redev. Agcy. Successor Series A: | |||
| 5% 12/15/23 | 4,330,000 | 4,473,057 | |
| 5% 6/15/24 | 2,440,000 | 2,544,641 | |
| Poway Unified School District Series 2009, 0% 8/1/26 | 2,145,000 | 1,922,708 | |
| Poway Unified School District Pub. Fing. Series 2015 A: | |||
| 5% 9/1/22 | 990,000 | 990,000 | |
| 5% 9/1/23 | 1,345,000 | 1,371,099 | |
| Pub. Utils. Commission San Francisco City & County Wastewtr. Rev. Bonds Series 2018 C, 2.125%, tender 10/1/23 (b) | 25,000,000 | 24,833,447 | |
| Rancho Cucamonga Redev. Agcy. (Rancho Redev. Proj.) Series 2014, 5% 9/1/22 (Assured Guaranty Muni. Corp. Insured) | 1,400,000 | 1,400,000 | |
| Richmond Wastewtr. Rev. Series 2019 B: | |||
| 5% 8/1/24 | 730,000 | 764,683 | |
| 5% 8/1/25 | 1,950,000 | 2,089,770 | |
| Rio Hondo Cmnty. College District Series 2010 C, 0% 8/1/29 | 1,800,000 | 1,444,305 | |
| Riverside Swr. Rev. Series 2015 A, 5% 8/1/24 | 1,500,000 | 1,571,266 | |
| Sacramento City Unified School District: | |||
| Series 2007: | |||
0% 7/1/27 (Assured Guaranty Muni. Corp. Insured) | 1,455,000 | 1,256,220 | |
0% 7/1/28 (Assured Guaranty Muni. Corp. Insured) | 500,000 | 415,369 | |
| Series 2014: | |||
5% 7/1/23 | 605,000 | 616,983 | |
5% 7/1/25 | 50,000 | 51,967 | |
| Series 2021: | |||
4% 7/1/23 (Assured Guaranty Muni. Corp. Insured) | 900,000 | 910,631 | |
4% 7/1/24 (Assured Guaranty Muni. Corp. Insured) | 1,000,000 | 1,024,680 | |
4% 7/1/25 (Assured Guaranty Muni. Corp. Insured) | 1,200,000 | 1,244,412 | |
4% 7/1/26 (Assured Guaranty Muni. Corp. Insured) | 1,100,000 | 1,149,828 | |
4% 7/1/27 (Assured Guaranty Muni. Corp. Insured) | 350,000 | 370,019 | |
4% 7/1/28 (Assured Guaranty Muni. Corp. Insured) | 625,000 | 662,437 | |
4% 7/1/29 (Assured Guaranty Muni. Corp. Insured) | 250,000 | 265,635 | |
| Series 2022: | |||
5% 7/1/26 (Build America Mutual Assurance Insured) | 1,415,000 | 1,541,558 | |
5% 7/1/27 (Build America Mutual Assurance Insured) | 1,825,000 | 2,027,444 | |
5% 7/1/28 (Build America Mutual Assurance Insured) | 2,250,000 | 2,538,251 | |
5% 7/1/29 (Build America Mutual Assurance Insured) | 2,750,000 | 3,144,846 | |
5% 7/1/30 (Build America Mutual Assurance Insured) | 1,575,000 | 1,819,843 | |
| Sacramento County Arpt. Sys. Rev.: | |||
| Series 2018 A: | |||
5% 7/1/23 | 430,000 | 438,624 | |
5% 7/1/24 | 675,000 | 703,890 | |
5% 7/1/25 | 605,000 | 647,002 | |
| Series 2018 B: | |||
5% 7/1/24 | 1,560,000 | 1,629,621 | |
5% 7/1/25 | 2,040,000 | 2,181,626 | |
| Series 2018 D: | |||
5% 7/1/23 | 500,000 | 509,903 | |
5% 7/1/24 | 400,000 | 416,463 | |
| Series 2018 E, 5% 7/1/28 | 745,000 | 840,873 | |
| Series 2020: | |||
5% 7/1/23 | 350,000 | 357,019 | |
5% 7/1/24 | 730,000 | 758,583 | |
5% 7/1/25 | 1,045,000 | 1,117,549 | |
5% 7/1/26 | 370,000 | 403,517 | |
5% 7/1/27 | 830,000 | 923,268 | |
5% 7/1/28 | 700,000 | 790,082 | |
| Sacramento Muni. Util. District Elec. Rev. Bonds Series 2019 B, 5%, tender 10/15/25 (b) | 1,920,000 | 2,015,121 | |
| Sacramento TOT Rev.: | |||
| Series 2018 A, 5% 6/1/31 | 500,000 | 550,579 | |
| Series A, 5% 6/1/26 | 900,000 | 967,824 | |
| San Diego Assoc. of Governments (Mid-Coast Corridor Transit Proj.) Series 2019 A, 1.8% 11/15/27 | 2,495,000 | 2,362,136 | |
| San Diego California Assn. Govts. South Bay (South Bay Expressway Proj.) Series 2017 A: | |||
| 5% 7/1/24 | 1,415,000 | 1,475,821 | |
| 5% 7/1/26 | 1,450,000 | 1,574,163 | |
| San Diego County Reg'l. Arpt. Auth. Arpt. Rev.: | |||
| Series 2019 A, 5% 7/1/24 | 45,000 | 46,901 | |
| Series 2020 B, 5% 7/1/29 | 1,025,000 | 1,170,109 | |
| San Diego County Wtr. Auth. Rev. Series 2021 A, 5% 5/1/25 | 1,050,000 | 1,122,998 | |
| San Diego Pub. Facilities Fing. Auth. Lease Rev. Series 2015 B: | |||
| 5% 10/15/23 | 1,400,000 | 1,440,782 | |
| 5% 10/15/25 | 1,605,000 | 1,729,255 | |
| San Jacinto Unified School District Series 2014: | |||
| 5% 8/1/23 (Assured Guaranty Muni. Corp. Insured) | 400,000 | 408,861 | |
| 5% 8/1/24 (Assured Guaranty Muni. Corp. Insured) | 750,000 | 783,624 | |
| San Marcos Redev. Agcy. Successor Series 2015 A, 5% 10/1/23 | 900,000 | 923,102 | |
| San Mateo County Cmnty. College District Series 2006 B, 0% 9/1/26 (Nat'l. Pub. Fin. Guarantee Corp. Insured) | 3,505,000 | 3,162,930 | |
| San Mateo Unified School District: | |||
| (Election of 2000 Proj.) Series B, 0% 9/1/25 (Nat'l. Pub. Fin. Guarantee Corp. Insured) | 3,055,000 | 2,818,458 | |
| Series 2013 A, 5% 9/1/33 (Pre-Refunded to 9/1/23 @ 100) | 815,000 | 836,163 | |
| San Pablo Redev. Agcy. Series 2014 A: | |||
| 5% 6/15/23 (Assured Guaranty Muni. Corp. Insured) | 630,000 | 641,988 | |
| 5% 6/15/24 (Assured Guaranty Muni. Corp. Insured) | 100,000 | 104,289 | |
| Santa Barbara Fing. Auth. (Arpt. Proj.) Series 2019: | |||
| 5% 4/1/23 | 1,125,000 | 1,141,962 | |
| 5% 4/1/25 | 1,250,000 | 1,333,333 | |
| Southern California Pub. Pwr. Auth. Rev. Bonds Series 2020 C, 0.65%, tender 7/1/25 (b) | 7,325,000 | 6,778,715 | |
| Stockton Pub. Fing. Auth. Wtr. Rev. Series 2018 A: | |||
| 5% 10/1/23 | 650,000 | 668,654 | |
| 5% 10/1/24 | 700,000 | 734,269 | |
| 5% 10/1/25 | 750,000 | 803,455 | |
| 5% 10/1/26 | 1,000,000 | 1,092,064 | |
| 5% 10/1/27 | 1,000,000 | 1,112,501 | |
| Successor Agcy. to the Redev. Agcy. of Pittsburg (Los Medanos Cmnty. Dev. Proj.) Series 2016 A: | |||
| 5% 9/1/23 (Assured Guaranty Muni. Corp. Insured) | 3,115,000 | 3,182,855 | |
| 5% 9/1/24 (Assured Guaranty Muni. Corp. Insured) | 125,000 | 130,289 | |
| 5% 9/1/26 (Assured Guaranty Muni. Corp. Insured) | 3,610,000 | 3,891,969 | |
| Tobacco Securitization Auth. Southern California Tobacco Settlement Series 2019 A1: | |||
| 5% 6/1/23 | 1,000,000 | 1,017,836 | |
| 5% 6/1/27 | 500,000 | 539,269 | |
| Turlock Irrigation District Rev. Series 2020: | |||
| 5% 1/1/25 | 4,760,000 | 5,028,726 | |
| 5% 1/1/26 | 4,995,000 | 5,391,537 | |
| Union Elementary School District Series B, 0% 9/1/22 (Nat'l. Pub. Fin. Guarantee Corp. Insured) | 400,000 | 400,000 | |
| Univ. of California Revs. Series 2023 BM: | |||
| 5% 5/15/28 (c) | 3,000,000 | 3,322,024 | |
| 5% 5/15/29 (c) | 2,350,000 | 2,628,354 | |
| Upland Gen. Oblig. Ctfs. of Prtn. (San Antonio Cmnty. Hosp.,CA. Proj.) Series 2017: | |||
| 5% 1/1/23 | 450,000 | 453,204 | |
| 5% 1/1/24 | 1,150,000 | 1,180,863 | |
| 5% 1/1/26 | 500,000 | 529,011 | |
| 5% 1/1/28 | 1,000,000 | 1,078,270 | |
| Vernon Elec. Sys. Rev.: | |||
| Series 2021 A: | |||
5% 4/1/24 | 1,100,000 | 1,128,586 | |
5% 4/1/26 | 1,000,000 | 1,055,833 | |
5% 4/1/28 | 1,500,000 | 1,623,081 | |
| Series 2022 A: | |||
5% 8/1/23 | 575,000 | 584,129 | |
5% 8/1/24 | 700,000 | 721,707 | |
5% 8/1/25 | 500,000 | 523,046 | |
5% 8/1/26 | 600,000 | 636,356 | |
5% 8/1/29 | 1,055,000 | 1,152,096 | |
| Washington Township Health Care District Rev.: | |||
| Series 2019 A: | |||
5% 7/1/23 | 715,000 | 726,496 | |
5% 7/1/24 | 500,000 | 516,587 | |
5% 7/1/25 | 500,000 | 524,907 | |
5% 7/1/26 | 550,000 | 585,723 | |
5% 7/1/27 | 600,000 | 644,224 | |
| Series A: | |||
5% 7/1/23 | 175,000 | 178,176 | |
5% 7/1/24 | 200,000 | 206,635 | |
5% 7/1/25 | 200,000 | 209,963 | |
5% 7/1/26 | 250,000 | 266,238 | |
5% 7/1/27 | 375,000 | 402,640 | |
5% 7/1/28 | 400,000 | 433,003 | |
5% 7/1/29 | 350,000 | 380,865 | |
| West Contra Costa Unified School District: | |||
| Series 2004 C, 0% 8/1/27 (Nat'l. Pub. Fin. Guarantee Corp. Insured) | 530,000 | 461,303 | |
| Series E: | |||
4% 8/1/25 (Assured Guaranty Muni. Corp. Insured) | 500,000 | 519,999 | |
4% 8/1/27 (Assured Guaranty Muni. Corp. Insured) | 650,000 | 690,810 | |
4% 8/1/27 (Assured Guaranty Muni. Corp. Insured) | 600,000 | 637,671 | |
| Series F, 4% 8/1/25 (Assured Guaranty Muni. Corp. Insured) | 400,000 | 415,999 | |
TOTAL CALIFORNIA | 626,184,826 | ||
| Puerto Rico - 0.6% | |||
| Puerto Rico Commonwealth Pub. Impt. Gen. Oblig. Series 2021 A1: | |||
| 0% 7/1/24 | 2,000,681 | 1,848,131 | |
| 5.25% 7/1/23 | 1,000,000 | 1,014,893 | |
| 5.625% 7/1/27 | 200,000 | 211,972 | |
| Puerto Rico Indl., Tourist, Edl., Med. And Envir. Cont. Facilities Fing. Auth. Series 2021: | |||
| 5% 7/1/23 | 50,000 | 50,837 | |
| 5% 7/1/24 | 70,000 | 72,348 | |
| 5% 7/1/25 | 95,000 | 99,706 | |
| 5% 7/1/26 | 100,000 | 106,272 | |
TOTAL PUERTO RICO | 3,404,159 | ||
| TOTAL MUNICIPAL BONDS (Cost $648,727,391) | 629,588,985 | ||
| Municipal Notes - 2.8% | |||
Principal Amount (a) | Value ($) | ||
| California - 2.8% | |||
| Bay Area Toll Auth. San Francisco Bay Toll Bridge Rev. Series G1, 1.35% 9/7/22, LOC Bank of America NA, VRDN (b) | 10,000,000 | 10,000,000 | |
| California Gen. Oblig. Series 2005 B5, 0.85% 9/1/22, LOC U.S. Bank NA, Cincinnati, VRDN (b) | 3,800,000 | 3,800,000 | |
| California Muni. Fin. Auth. Rev. (Chevron U.S.A., Inc. Proj.) Series 2010 A, 0.85% 9/1/22, VRDN (b) | 2,000,000 | 2,000,000 | |
| Irvine Reassessment District 12-1 Ltd. Oblig. Series A, 0.85% 9/1/22, LOC Sumitomo Mitsui Banking Corp., VRDN (b)(d) | 1,614,000 | 1,614,000 | |
| TOTAL MUNICIPAL NOTES (Cost $17,414,000) | 17,414,000 | ||
| TOTAL INVESTMENT IN SECURITIES - 106.4% (Cost $666,141,391) | 647,002,985 |
NET OTHER ASSETS (LIABILITIES) - (6.4)% | (39,087,552) |
| NET ASSETS - 100.0% | 607,915,433 |
| VRDN | - | VARIABLE RATE DEMAND NOTE (A debt instrument that is payable upon demand, either daily, weekly or monthly) |
| (a) | Amount is stated in United States dollars unless otherwise noted. |
| (b) | Coupon rates for floating and adjustable rate securities reflect the rates in effect at period end. |
| (c) | Security or a portion of the security purchased on a delayed delivery or when-issued basis. |
| (d) | Security exempt from registration under Rule 144A of the Securities Act of 1933. These securities may be resold in transactions exempt from registration, normally to qualified institutional buyers. At the end of the period, the value of these securities amounted to $11,768,001 or 1.9% of net assets. |
| Valuation Inputs at Reporting Date: | ||||
| Description | Total ($) | Level 1 ($) | Level 2 ($) | Level 3 ($) |
Investments in Securities: | ||||
| Municipal Securities | 647,002,985 | - | 647,002,985 | - |
| Total Investments in Securities: | 647,002,985 | - | 647,002,985 | - |
| Statement of Assets and Liabilities | ||||
August 31, 2022 (Unaudited) | ||||
| Assets | ||||
Investment in securities, at value - See accompanying schedule Unaffiliated issuers (cost $666,141,391): | $ | 647,002,985 | ||
| Receivable for fund shares sold | 228,497 | |||
| Interest receivable | 6,212,206 | |||
| Prepaid expenses | 991 | |||
| Receivable from investment adviser for expense reductions | 64,990 | |||
| Other receivables | 1,449 | |||
Total assets | 653,511,118 | |||
| Liabilities | ||||
| Payable to custodian bank | $1,261,312 | |||
| Payable for investments purchased on a delayed delivery basis | 43,026,181 | |||
| Payable for fund shares redeemed | 847,689 | |||
| Distributions payable | 190,785 | |||
| Accrued management fee | 179,193 | |||
| Other affiliated payables | 60,934 | |||
| Other payables and accrued expenses | 29,591 | |||
| Total Liabilities | 45,595,685 | |||
| Net Assets | $ | 607,915,433 | ||
| Net Assets consist of: | ||||
| Paid in capital | $ | 630,587,948 | ||
| Total accumulated earnings (loss) | (22,672,515) | |||
| Net Assets | $ | 607,915,433 | ||
Net Asset Value , offering price and redemption price per share ($607,915,433 ÷ 59,701,783 shares) | $ | 10.18 | ||
| Statement of Operations | ||||
Six months ended August 31, 2022 (Unaudited) | ||||
| Investment Income | ||||
| Interest | $ | 5,311,919 | ||
| Expenses | ||||
| Management fee | $ | 1,087,978 | ||
| Transfer agent fees | 287,663 | |||
| Accounting fees and expenses | 74,526 | |||
| Custodian fees and expenses | 4,807 | |||
| Independent trustees' fees and expenses | 1,034 | |||
| Registration fees | 11,598 | |||
| Audit | 29,023 | |||
| Legal | 1,419 | |||
| Miscellaneous | 1,861 | |||
| Total expenses before reductions | 1,499,909 | |||
| Expense reductions | (403,114) | |||
| Total expenses after reductions | 1,096,795 | |||
| Net Investment income (loss) | 4,215,124 | |||
| Realized and Unrealized Gain (Loss) | ||||
| Net realized gain (loss) on: | ||||
| Investment Securities: | ||||
| Unaffiliated issuers | (3,060,596) | |||
| Total net realized gain (loss) | (3,060,596) | |||
| Change in net unrealized appreciation (depreciation) on investment securities | (17,746,019) | |||
| Net gain (loss) | (20,806,615) | |||
| Net increase (decrease) in net assets resulting from operations | $ | (16,591,491) | ||
| Statement of Changes in Net Assets | ||||
Six months ended August 31, 2022 (Unaudited) | Year ended February 28, 2022 | |||
| Increase (Decrease) in Net Assets | ||||
| Operations | ||||
| Net investment income (loss) | $ | 4,215,124 | $ | 9,311,027 |
| Net realized gain (loss) | (3,060,596) | (505,380) | ||
| Change in net unrealized appreciation (depreciation) | (17,746,019) | (20,511,389) | ||
| Net increase (decrease) in net assets resulting from operations | (16,591,491) | (11,705,742) | ||
| Distributions to shareholders | (4,205,262) | (9,381,413) | ||
| Share transactions | ||||
| Proceeds from sales of shares | 135,876,573 | 200,532,241 | ||
| Reinvestment of distributions | 3,156,037 | 6,880,366 | ||
| Cost of shares redeemed | (215,105,265) | (256,993,169) | ||
Net increase (decrease) in net assets resulting from share transactions | (76,072,655) | (49,580,562) | ||
| Total increase (decrease) in net assets | (96,869,408) | (70,667,717) | ||
| Net Assets | ||||
| Beginning of period | 704,784,841 | 775,452,558 | ||
| End of period | $ | 607,915,433 | $ | 704,784,841 |
| Other Information | ||||
| Shares | ||||
| Sold | 13,297,474 | 18,586,287 | ||
| Issued in reinvestment of distributions | 308,356 | 638,642 | ||
| Redeemed | (21,003,757) | (23,871,027) | ||
| Net increase (decrease) | (7,397,927) | (4,646,098) | ||
| Fidelity® California Limited Term Tax-Free Bond Fund |
Six months ended (Unaudited) August 31, 2022 | Years ended February 28, 2022 | 2021 | 2020 A | 2019 | 2018 | |||||||
Selected Per-Share Data | ||||||||||||
| Net asset value, beginning of period | $ | 10.50 | $ | 10.81 | $ | 10.87 | $ | 10.58 | $ | 10.49 | $ | 10.59 |
| Income from Investment Operations | ||||||||||||
Net investment income (loss) B,C | .069 | .132 | .157 | .182 | .184 | .168 | ||||||
| Net realized and unrealized gain (loss) | (.320) | (.309) | (.040) | .290 | .090 | (.100) | ||||||
| Total from investment operations | (.251) | (.177) | .117 | .472 | .274 | .068 | ||||||
| Distributions from net investment income | (.069) | (.132) | (.157) | (.181) | (.184) | (.168) | ||||||
| Distributions from net realized gain | - | (.001) | (.020) | (.001) | - | - | ||||||
| Total distributions | (.069) | (.133) | (.177) | (.182) | (.184) | (.168) | ||||||
| Net asset value, end of period | $ | 10.18 | $ | 10.50 | $ | 10.81 | $ | 10.87 | $ | 10.58 | $ | 10.49 |
Total Return D,E | (2.39)% | (1.66)% | 1.09% | 4.50% | 2.64% | .64% | ||||||
Ratios to Average Net Assets C,F,G | ||||||||||||
| Expenses before reductions | .48% H | .47% | .47% | .47% | .48% | .47% | ||||||
| Expenses net of fee waivers, if any | .35% H | .35% | .35% | .35% | .35% | .35% | ||||||
| Expenses net of all reductions | .35% H | .35% | .35% | .35% | .35% | .35% | ||||||
| Net investment income (loss) | 1.34% H | 1.23% | 1.45% | 1.70% | 1.75% | 1.59% | ||||||
| Supplemental Data | ||||||||||||
| Net assets, end of period (000 omitted) | $ | 607,915 | $ | 704,785 | $ | 775,453 | $ | 751,973 | $ | 730,594 | $ | 774,419 |
Portfolio turnover rate I | 24% H | 18% | 19% | 31% | 33% | 20% |
| Gross unrealized appreciation | $ 387,059 |
| Gross unrealized depreciation | (19,518,695) |
| Net unrealized appreciation (depreciation) | $ (19,131,636) |
| Tax cost | $ 666,134,621 |
| Short-term | $(443,986) |
| Long-term | (61,394) |
| Total capital loss carryforward | $(505,380) |
| Purchases ($) | Sales ($) | |
| Fidelity California Limited Term Tax-Free Bond Fund | 77,932,669 | 131,813,846 |
| % of Average Net Assets | |
| Fidelity California Limited Term Tax-Free Bond Fund | .02 |
| Purchases ($) | Sales ($) | Realized Gain (Loss) ($) | |
| Fidelity California Limited Term Tax-Free Bond Fund | 9,750,000 | 1,000,000 | - |
| Amount | |
| Fidelity California Limited Term Tax-Free Bond Fund | $ 583 |
| The Example is based on an investment of $1,000 invested at the beginning of the period and held for the entire period (March 1, 2022 to August 31, 2022). |
Annualized Expense Ratio- A | Beginning Account Value March 1, 2022 | Ending Account Value August 31, 2022 | Expenses Paid During Period- C March 1, 2022 to August 31, 2022 | |||||||
| Fidelity® California Limited Term Tax-Free Bond Fund | .35% | |||||||||
| Actual | $ 1,000 | $ 976.10 | $ 1.74 | |||||||
Hypothetical- B | $ 1,000 | $ 1,023.44 | $ 1.79 | |||||||
|
Item 2.
Code of Ethics
Not applicable.
Item 3.
Audit Committee Financial Expert
Not applicable.
Item 4.
Principal Accountant Fees and Services
Not applicable.
Item 5.
Audit Committee of Listed Registrants
Not applicable.
Item 6.
Investments
(a)
Not applicable.
(b)
Not applicable
Item 7.
Disclosure of Proxy Voting Policies and Procedures for Closed-End Management Investment Companies
Not applicable.
Item 8.
Portfolio Managers of Closed-End Management Investment Companies
Not applicable.
Item 9.
Purchase of Equity Securities by Closed-End Management Investment Company and Affiliated Purchasers
Not applicable.
Item 10.
Submission of Matters to a Vote of Security Holders
There were no material changes to the procedures by which shareholders may recommend nominees to the Fidelity California Municipal Trust’s Board of Trustees.
Item 11.
Controls and Procedures
(a)(i) The President and Treasurer and the Chief Financial Officer have concluded that the Fidelity California Municipal Trust’s (the “Trust”) disclosure controls and procedures (as defined in Rule 30a-3(c) under the Investment Company Act) provide reasonable assurances that material information relating to the Trust is made known to them by the appropriate persons, based on their evaluation of these controls and procedures as of a date within 90 days of the filing date of this report.
(a)(ii) There was no change in the Trust’s internal control over financial reporting (as defined in Rule 30a-3(d) under the Investment Company Act) that occurred during the period covered by this report that has materially affected, or is reasonably likely to materially affect, the Trust’s internal control over financial reporting.
Item 12.
Disclosure of Securities Lending Activities for Closed-End Management
Investment Companies
Not applicable.
Item 13.
Exhibits
(a) | (1) | Not applicable. |
(a) | (2) | |
(a) | (3) | Not applicable. |
(b) |
SIGNATURES
Pursuant to the requirements of the Securities Exchange Act of 1934 and the Investment Company Act of 1940, the registrant has duly caused this report to be signed on its behalf by the undersigned, thereunto duly authorized.
Fidelity California Municipal Trust
By: | /s/Laura M. Del Prato |
Laura M. Del Prato | |
President and Treasurer | |
Date: | October 20, 2022 |
Pursuant to the requirements of the Securities Exchange Act of 1934 and the Investment Company Act of 1940, this report has been signed below by the following persons on behalf of the registrant and in the capacities and on the dates indicated.
By: | /s/Laura M. Del Prato |
Laura M. Del Prato | |
President and Treasurer | |
Date: | October 20, 2022 |
By: | /s/John J. Burke III |
John J. Burke III | |
Chief Financial Officer | |
Date: | October 20, 2022 |