UNITED STATES
SECURITIES AND EXCHANGE COMMISSION
Washington, D.C. 20549
FORM N-CSR
CERTIFIED SHAREHOLDER REPORT OF REGISTERED
MANAGEMENT INVESTMENT COMPANIES
Investment Company Act file number 811-3725
Fidelity California Municipal Trust
(Exact name of registrant as specified in charter)
82 Devonshire St., Boston, Massachusetts 02109
(Address of principal executive offices) (Zip code)
Scott C. Goebel, Secretary
82 Devonshire St.
Boston, Massachusetts 02109
(Name and address of agent for service)
Registrant's telephone number, including area code: 617-563-7000
Date of fiscal year end: | February 29 |
|
|
Date of reporting period: | August 31, 2011 |
Item 1. Reports to Stockholders
Fidelity®
California
Municipal Income
Fund
Semiannual Report
August 31, 2011
(2_fidelity_logos) (Registered_Trademark)
Contents
Chairman's Message | The Chairman's message to shareholders. | |
Shareholder Expense Example | An example of shareholder expenses. | |
Investment Changes | A summary of major shifts in the fund's investments over the past six months. | |
Investments | A complete list of the fund's investments with their market values. | |
Financial Statements | Statements of assets and liabilities, operations, and changes in net assets, | |
Notes | Notes to the financial statements. |
To view a fund's proxy voting guidelines and proxy voting record for the 12-month period ended June 30, visit http://www.fidelity.com/proxyvotingresults or visit the Securities and Exchange Commission's (SEC) web site at http://www.sec.gov. You may also call 1-800-544-8544 to request a free copy of the proxy voting guidelines.
Standard & Poor's, S&P and S&P 500 are registered service marks of The McGraw-Hill Companies, Inc. and have been licensed for use by Fidelity Distributors Corporation.
Other third party marks appearing herein are the property of their respective owners.
All other marks appearing herein are registered or unregistered trademarks or service marks of FMR LLC or an affiliated company.
This report and the financial statements contained herein are submitted for the general information of the shareholders of the fund. This report is not authorized for distribution to prospective investors in the fund unless preceded or accompanied by an effective prospectus.
A fund files its complete schedule of portfolio holdings with the SEC for the first and third quarters of each fiscal year on Form N-Q. Forms N-Q are available on the SEC's web site at http://www.sec.gov. A fund's Forms N-Q may be reviewed and copied at the SEC's Public Reference Room in Washington, DC. Information regarding the operation of the SEC's Public Reference Room may be obtained by calling 1-800-SEC-0330. For a complete list of a fund's portfolio holdings, view the most recent holdings listing, semiannual report, or annual report on Fidelity's web site at http://www.fidelity.com, http://www.advisor.fidelity.com, or http://www.401k.com, as applicable.
NOT FDIC INSURED • MAY LOSE VALUE • NO BANK GUARANTEE
Neither the fund nor Fidelity Distributors Corporation is a bank.
Semiannual Report
Chairman's Message
(Chairman's photo appears here)
Dear Shareholder:
U.S. equities remained in a significant midyear downturn that began in May and intensified in the final week of July and the early part of August, when Standard & Poor's announced it was lowering its long-term sovereign credit rating of the United States. The historic downgrade followed a political stalemate in which Congress struggled to address the debt ceiling issue before an early-August deadline, resulting in heightened investor anxiety and volatility across major financial markets. Financial markets are always unpredictable, of course, but there are several time-tested investment principles that can help put the odds in your favor.
One of the basic tenets is to invest for the long term. Over time, riding out the markets' inevitable ups and downs has proven much more effective than selling into panic or chasing the hottest trend. Even missing only a few of the markets' best days can significantly diminish investor returns. Patience also affords the benefits of compounding - of earning interest on additional income or reinvested dividends and capital gains. There can be tax advantages and cost benefits to consider as well. While staying the course doesn't eliminate risk, it can considerably lessen the effect of short-term declines.
You can further manage your investing risk through diversification. And today, more than ever, geographic diversification should be taken into account. Studies indicate that asset allocation is the single most important determinant of a portfolio's long-term success. The right mix of stocks, bonds and cash - aligned to your particular risk tolerance and investment objective - is very important. Age-appropriate rebalancing is also an essential aspect of asset allocation. For younger investors, an emphasis on equities - which historically have been the best-performing asset class over time - is encouraged. As investors near their specific goal, such as retirement or sending a child to college, consideration may be given to replacing volatile assets (e.g. common stocks) with more-stable fixed investments (bonds or savings plans).
A third principle - investing regularly - can help lower the average cost of your purchases. Investing a certain amount of money each month or quarter helps ensure you won't pay for all your shares at market highs. This strategy - known as dollar cost averaging - also reduces "emotion" from investing, helping shareholders avoid selling weak performers just prior to an upswing, or chasing a hot performer just before a correction.
We invite you to contact us via the Internet, through our Investor Centers or by phone. It is our privilege to provide you the information you need to make the investments that are right for you.
Sincerely,
(Chairmans signature appears here)
Abigail P. Johnson
Semiannual Report
Shareholder Expense Example
As a shareholder of the Fund, you incur two types of costs: (1) transaction costs, including sales charges (loads) on purchase payments or redemption proceeds, and (2) ongoing costs, including management fees, distribution and/or service (12b-1) fees and other Fund expenses. This Example is intended to help you understand your ongoing costs (in dollars) of investing in the Fund and to compare these costs with the ongoing costs of investing in other mutual funds.
The Example is based on an investment of $1,000 invested at the beginning of the period and held for the entire period (March 1, 2011 to August 31, 2011).
Actual Expenses
The first line of the accompanying table for each class of the Fund provides information about actual account values and actual expenses. You may use the information in this line, together with the amount you invested, to estimate the expenses that you paid over the period. Simply divide your account value by $1,000.00 (for example, an $8,600 account value divided by $1,000.00 = 8.6), then multiply the result by the number in the first line for a class of the Fund under the heading entitled "Expenses Paid During Period" to estimate the expenses you paid on your account during this period. A small balance maintenance fee of $12.00 that is charged once a year may apply for certain accounts with a value of less than $2,000. This fee is not included in the table below. If it was, the estimate of expenses you paid during the period would be higher, and your ending account value lower, by this amount.
Hypothetical Example for Comparison Purposes
The second line of the accompanying table for each class of the Fund provides information about hypothetical account values and hypothetical expenses based on a Class' actual expense ratio and an assumed rate of return of 5% per year before expenses, which is not the Class' actual return. The hypothetical account values and expenses may not be used to estimate the actual ending account balance or expenses you paid for the period. You may use this information to compare the ongoing costs of investing in the Fund and other funds. To do so, compare this 5% hypothetical example with the 5% hypothetical examples that appear in the shareholder reports of the other funds. A small balance maintenance fee of $12.00 that is charged once a year may apply for certain accounts with a value of less than $2,000. This fee is not included in the table below. If it was, the estimate of expenses you paid during the period would be higher, and your ending account value lower, by this amount.
Please note that the expenses shown in the table are meant to highlight your ongoing costs only and do not reflect any transaction costs. Therefore, the second line of the table is useful in comparing ongoing costs only, and will not help you determine the relative total costs of owning different funds. In addition, if these transactional costs were included, your costs would have been higher.
Semiannual Report
Shareholder Expense Example - continued
| Annualized Expense Ratio | Beginning | Ending | Expenses Paid |
Class A | .75% |
|
|
|
Actual |
| $ 1,000.00 | $ 1,065.00 | $ 3.89 |
Hypothetical A |
| $ 1,000.00 | $ 1,021.37 | $ 3.81 |
Class T | .76% |
|
|
|
Actual |
| $ 1,000.00 | $ 1,064.80 | $ 3.94 |
Hypothetical A |
| $ 1,000.00 | $ 1,021.32 | $ 3.86 |
Class B | 1.37% |
|
|
|
Actual |
| $ 1,000.00 | $ 1,061.70 | $ 7.10 |
Hypothetical A |
| $ 1,000.00 | $ 1,018.25 | $ 6.95 |
Class C | 1.52% |
|
|
|
Actual |
| $ 1,000.00 | $ 1,061.90 | $ 7.88 |
Hypothetical A |
| $ 1,000.00 | $ 1,017.50 | $ 7.71 |
California Municipal Income | .47% |
|
|
|
Actual |
| $ 1,000.00 | $ 1,066.60 | $ 2.44 |
Hypothetical A |
| $ 1,000.00 | $ 1,022.77 | $ 2.39 |
Institutional Class | .53% |
|
|
|
Actual |
| $ 1,000.00 | $ 1,066.10 | $ 2.75 |
Hypothetical A |
| $ 1,000.00 | $ 1,022.47 | $ 2.69 |
A 5% return per year before expenses
* Expenses are equal to each Class' annualized expense ratio, multiplied by the average account value over the period, multiplied by 184/366 (to reflect the one-half year period).
Semiannual Report
Investment Changes (Unaudited)
Top Five Sectors as of August 31, 2011 | ||
| % of fund's | % of fund's net assets |
General Obligations | 46.6 | 48.2 |
Health Care | 12.1 | 11.6 |
Transportation | 10.9 | 11.6 |
Education | 6.5 | 6.9 |
Electric Utilities | 4.7 | 3.6 |
Weighted Average Maturity as of August 31, 2011 | ||
|
| 6 months ago |
Years | 7.3 | 10.0 |
This is a weighted average of all the maturities of the securities held in a fund. Weighted Average Maturity (WAM) can be used as a measure of sensitivity to interest rate changes and markets changes. Generally, the longer the maturity, the greater the sensitivity to such changes. WAM is based on the dollar-weighted average length of time until principal payments must be paid. Depending on the types of securities held in a fund, certain maturity shortening devices (e.g., demand features, interest rate resets, and call options) may be taken into account when calculating the WAM. |
Duration as of August 31, 2011 | ||
|
| 6 months ago |
Years | 7.7 | 8.1 |
Duration estimates how much a bond fund's price will change with a change in comparable interest rates. If rates rise 1%, for example, a fund with a 5-year duration is likely to lose about 5% of its value. Other factors also can influence a bond fund's performance and share price. Accordingly, a bond fund's actual performance may differ from this example. Duration takes into account any call or put option embedded in the bonds. |
Quality Diversification (% of fund's net assets) | |||||||
As of August 31, 2011 | As of February 28, 2011 | ||||||
 | AAA 2.0% |
| | AAA 2.8% |
| ||
 | AA,A 79.1% |
| | AA,A 81.4% |
| ||
 | BBB 13.7% |
| | BBB 12.7% |
| ||
 | BB and Below 0.4% |
| | BB and Below 0.4% |
| ||
 | Not Rated 1.6% |
| | Not Rated 2.0% |
| ||
 | Short-Term |
| | Short-Term |
| ||

We have used ratings from Moody's Investors Service, Inc. Where Moody's® ratings are not available, we have used S&P® ratings. All ratings are as of the date indicated and do not reflect subsequent changes. |
Semiannual Report
Investments August 31, 2011 (Unaudited)
Showing Percentage of Net Assets
Municipal Bonds - 96.8% | ||||
| Principal Amount (000s) | Value (000s) | ||
California - 95.6% | ||||
ABAG Fin. Auth. for Nonprofit Corps. Rev.: | ||||
(Hamlin School Proj.) Series 2007: | ||||
4.625% 8/1/16 | $ 380 | $ 400 | ||
5% 8/1/18 | 330 | 349 | ||
5% 8/1/19 | 555 | 583 | ||
(Sharp HealthCare Proj.) Series 2009 B, 6.25% 8/1/39 | 3,000 | 3,158 | ||
ABC Unified School District Series 1997 C: | ||||
0% 8/1/31 (Nat'l. Pub. Fin. Guarantee Corp. Insured) | 2,720 | 781 | ||
0% 8/1/32 (Nat'l. Pub. Fin. Guarantee Corp. Insured) | 3,760 | 976 | ||
Alameda Corridor Trans. Auth. Rev. Series 1999 A, 5.25% 10/1/21 (Nat'l. Pub. Fin. Guarantee Corp. Insured) | 7,575 | 7,578 | ||
Alameda County Ctfs. of Prtn.: | ||||
(Santa Rita Jail Proj.) Series 2007 A: | ||||
5% 12/1/18 (AMBAC Insured) | 2,645 | 2,966 | ||
5% 12/1/20 (AMBAC Insured) | 2,810 | 3,082 | ||
Series 1989, 0% 6/15/17 (Nat'l. Pub. Fin. Guarantee Corp. Insured) | 2,310 | 1,718 | ||
Alhambra Unified School District Series 2004 A, 5% 8/1/25 (FGIC Insured) | 1,880 | 1,940 | ||
Anaheim Pub. Fing. Auth. Lease Rev. (Anaheim Pub. Impt. Proj.): | ||||
Series 1997 A, 6% 9/1/24 | 1,000 | 1,201 | ||
Series 1997 C: | ||||
0% 9/1/19 (FSA Insured) | 1,285 | 864 | ||
0% 9/1/22 (FSA Insured) | 5,150 | 2,789 | ||
Anaheim Pub. Fing. Auth. Rev. Series 2007 A, 4.5% 10/1/32 | 10,000 | 10,034 | ||
Antioch Unified School District (School Facilities Impt. District #1 Proj.) Series 2008 B, 5.75% 8/1/24 (Assured Guaranty Corp. Insured) | 1,000 | 1,139 | ||
Auburn Union School District Ctfs. of Prtn. (2008 Refing. Proj.) 5% 6/1/38 (Assured Guaranty Corp. Insured) | 5,615 | 5,707 | ||
Azusa Unified School District Series 2002, 5.375% 7/1/16 (FSA Insured) | 1,225 | 1,277 | ||
Banning Unified School District Gen. Oblig. Series 2006 A, 5% 8/1/31 (Berkshire Hathaway Assurance Corp. Insured) | 5,190 | 5,312 | ||
Bay Area Infrastructure Fing. Auth.: | ||||
5% 8/1/17 | 2,015 | 2,019 | ||
5% 8/1/17 (FGIC Insured) | 5,030 | 5,217 | ||
Municipal Bonds - continued | ||||
| Principal Amount (000s) | Value (000s) | ||
California - continued | ||||
Bay Area Toll Auth. San Francisco Bay Toll Bridge Rev. Series 2009 F1, 5.625% 4/1/44 | $ 5,500 | $ 5,926 | ||
Burbank Glendale Pasadena Arpt. Auth. Rev. Series 2005 B: | ||||
5% 7/1/12 (AMBAC Insured) (d) | 1,840 | 1,890 | ||
5.25% 7/1/14 (AMBAC Insured) (d) | 2,035 | 2,224 | ||
5.25% 7/1/16 (AMBAC Insured) (d) | 1,255 | 1,394 | ||
5.25% 7/1/17 (AMBAC Insured) (d) | 1,370 | 1,488 | ||
Burbank Unified School District: | ||||
Series 1997 B, 0% 8/1/20 | 3,835 | 2,574 | ||
Series 1997 C, 0% 8/1/20 (Nat'l. Pub. Fin. Guarantee Corp. Insured) | 5,865 | 3,909 | ||
Butte-Glenn Cmnty. College District Series A, 5.5% 8/1/18 (Nat'l. Pub. Fin. Guarantee Corp. Insured) | 1,085 | 1,137 | ||
Cabrillo Unified School District Series A: | ||||
0% 8/1/12 (AMBAC Insured) | 2,800 | 2,730 | ||
0% 8/1/17 (AMBAC Insured) | 1,000 | 782 | ||
0% 8/1/18 (AMBAC Insured) | 2,000 | 1,467 | ||
California Dept. of Wtr. Resources Central Valley Proj. Rev.: | ||||
Series AI: | ||||
5% 12/1/18 (b) | 3,000 | 3,637 | ||
5% 12/1/25 (b) | 2,700 | 3,126 | ||
Series J1, 7% 12/1/12 | 730 | 790 | ||
California Econ. Recovery Series 2009 A: | ||||
5% 7/1/22 | 3,800 | 4,169 | ||
5.25% 7/1/14 | 2,095 | 2,361 | ||
California Edl. Facilities Auth. Rev.: | ||||
(Claremont Graduate Univ. Proj.) Series 2008 A: | ||||
6% 3/1/33 | 1,000 | 1,054 | ||
6% 3/1/38 | 1,000 | 1,044 | ||
(College & Univ. Fing. Prog.) Series 2007: | ||||
5% 2/1/16 | 1,600 | 1,645 | ||
5% 2/1/17 | 1,000 | 1,014 | ||
(Loyola Marymount Univ. Proj.): | ||||
Series 2001 A, 0% 10/1/16 (Nat'l. Pub. Fin. Guarantee Corp. Insured) | 2,280 | 1,946 | ||
Series 2010 A, 5% 10/1/25 | 5,860 | 6,145 | ||
(Pomona College Proj.) Series 2005 A, 0% 7/1/38 | 3,155 | 712 | ||
(Santa Clara Univ. Proj.) Series 1999, 5.25% 9/1/26 (AMBAC Insured) | 7,910 | 9,000 | ||
Municipal Bonds - continued | ||||
| Principal Amount (000s) | Value (000s) | ||
California - continued | ||||
California Edl. Facilities Auth. Rev.: - continued | ||||
(Univ. of Southern California Proj.) Series 2007 A, 4.75% 10/1/37 | $ 6,000 | $ 6,162 | ||
California Enterprise Dev. Auth. (The Thacher School Proj.) Series 2010: | ||||
4% 9/1/20 | 860 | 912 | ||
4% 9/1/21 | 1,000 | 1,037 | ||
4% 9/1/22 | 740 | 756 | ||
4% 9/1/23 | 1,080 | 1,086 | ||
4% 9/1/24 | 1,125 | 1,115 | ||
5% 9/1/19 | 400 | 460 | ||
5% 9/1/39 | 5,000 | 5,039 | ||
California Gen. Oblig.: | ||||
Series 1992, 6.25% 9/1/12 (FGIC Insured) | 1,350 | 1,379 | ||
Series 2005, 5.5% 6/1/28 | 275 | 275 | ||
Series 2007: | ||||
5.625% 5/1/20 | 150 | 150 | ||
5.625% 5/1/26 | 215 | 215 | ||
5.75% 5/1/30 | 160 | 160 | ||
4.5% 8/1/30 | 3,250 | 3,099 | ||
4.5% 10/1/36 | 3,075 | 2,765 | ||
5% 3/1/15 | 2,130 | 2,421 | ||
5% 3/1/16 (Nat'l. Pub. Fin. Guarantee Corp. Insured) | 2,500 | 2,760 | ||
5% 9/1/17 | 750 | 851 | ||
5% 3/1/19 | 3,000 | 3,439 | ||
5% 8/1/22 | 1,500 | 1,614 | ||
5% 10/1/22 | 1,355 | 1,524 | ||
5% 11/1/22 | 1,600 | 1,747 | ||
5% 11/1/22 (XL Cap. Assurance, Inc. Insured) | 2,800 | 3,058 | ||
5% 12/1/22 | 3,500 | 3,827 | ||
5% 2/1/23 | 1,095 | 1,141 | ||
5% 2/1/26 | 1,500 | 1,511 | ||
5% 3/1/26 | 2,800 | 2,917 | ||
5% 6/1/26 | 2,600 | 2,706 | ||
5% 2/1/31 (Nat'l. Pub. Fin. Guarantee Corp. Insured) | 2,800 | 2,825 | ||
5% 6/1/31 | 2,000 | 2,031 | ||
5% 12/1/31 (Nat'l. Pub. Fin. Guarantee Corp. Insured) | 2,000 | 2,029 | ||
5% 10/1/32 (Nat'l. Pub. Fin. Guarantee Corp. Insured) | 1,000 | 1,006 | ||
5.125% 11/1/24 | 2,800 | 2,930 | ||
5.125% 2/1/26 | 2,800 | 2,899 | ||
Municipal Bonds - continued | ||||
| Principal Amount (000s) | Value (000s) | ||
California - continued | ||||
California Gen. Oblig.: - continued | ||||
5.25% 2/1/14 | $ 4,045 | $ 4,390 | ||
5.25% 10/1/14 | 140 | 144 | ||
5.25% 10/1/17 | 105 | 108 | ||
5.25% 11/1/18 | 3,000 | 3,223 | ||
5.25% 2/1/20 | 6,805 | 7,190 | ||
5.25% 2/1/22 | 2,020 | 2,120 | ||
5.25% 2/1/27 (Nat'l. Pub. Fin. Guarantee Corp. Insured) | 5,490 | 5,603 | ||
5.25% 4/1/27 | 5 | 5 | ||
5.25% 2/1/28 | 2,785 | 2,862 | ||
5.25% 2/1/29 | 5,000 | 5,075 | ||
5.25% 4/1/29 | 5 | 5 | ||
5.25% 11/1/29 | 2,000 | 2,048 | ||
5.25% 4/1/30 | 35 | 35 | ||
5.25% 2/1/33 | 8,150 | 8,211 | ||
5.25% 12/1/33 | 105 | 106 | ||
5.25% 3/1/38 | 5,400 | 5,459 | ||
5.375% 4/1/15 (Nat'l. Pub. Fin. Guarantee Corp. Insured) | 35 | 36 | ||
5.5% 5/1/13 (Nat'l. Pub. Fin. Guarantee Corp. Insured) | 100 | 100 | ||
5.5% 4/1/28 | 5 | 5 | ||
5.5% 8/1/29 | 7,790 | 8,420 | ||
5.5% 4/1/30 | 25 | 26 | ||
5.5% 11/1/33 | 29,440 | 29,952 | ||
5.5% 11/1/34 | 2,535 | 2,662 | ||
5.5% 11/1/39 | 1,810 | 1,892 | ||
6% 4/1/18 | 1,570 | 1,952 | ||
6% 3/1/33 | 20,050 | 22,361 | ||
6% 4/1/38 | 1,190 | 1,295 | ||
6.5% 4/1/33 | 11,650 | 13,404 | ||
6.75% 8/1/12 | 1,100 | 1,162 | ||
California Health Facilities Fing. Auth. Rev.: | ||||
(Catholic Healthcare West Proj.): | ||||
Series 2008 H, 5.125% 7/1/22 | 2,630 | 2,811 | ||
Series 2008 L, 5.125% 7/1/22 | 2,475 | 2,645 | ||
Series 2009 E, 5.625% 7/1/25 | 5,000 | 5,323 | ||
(Cedars-Sinai Med. Ctr. Proj.): | ||||
Series 2005, 5% 11/15/14 | 1,485 | 1,647 | ||
Series 2009, 5% 8/15/39 | 5,000 | 4,846 | ||
Municipal Bonds - continued | ||||
| Principal Amount (000s) | Value (000s) | ||
California - continued | ||||
California Health Facilities Fing. Auth. Rev.: - continued | ||||
(Children's Hosp. of Orange County Proj.) Series 2009 A, 5% 11/1/12 | $ 2,345 | $ 2,429 | ||
(Cottage Health Sys. Proj.) Series 2003 B, 5.25% 11/1/18 (Nat'l. Pub. Fin. Guarantee Corp. Insured) | 1,260 | 1,320 | ||
(Providence Health and Svcs. Proj.): | ||||
Series 2009 B, 5.5% 10/1/39 | 2,000 | 2,070 | ||
Series C, 6.5% 10/1/38 (Pre-Refunded to 10/1/18 @ 100) (e) | 90 | 120 | ||
6.5% 10/1/38 | 4,910 | 5,436 | ||
(Scripps Health Proj.) Series 2010 A, 5% 11/15/36 | 3,000 | 3,004 | ||
(Stanford Hosp. & Clinics Proj.) Series 2010 B, 5.75% 11/15/31 | 4,600 | 4,914 | ||
(Sutter Health Proj.) Series 2008 A, 5% 8/15/15 | 4,500 | 5,075 | ||
Bonds (Catholic Healthcare West Proj.) Series 2004 I, 4.95%, tender 7/1/14 (c) | 5,000 | 5,434 | ||
Series 2008 A3, 5.5% 11/15/40 | 3,090 | 3,207 | ||
California Infrastructure & Econ. Dev. Bank Rev.: | ||||
(California Science Ctr. Phase II Proj.) Series 2006 B, 5% 5/1/19 (FGIC Insured) | 1,000 | 1,042 | ||
(Performing Arts Ctr. of Los Angeles County Proj.) Series 2007: | ||||
5% 12/1/27 | 1,080 | 1,105 | ||
5% 12/1/32 | 1,000 | 1,006 | ||
5% 12/1/42 | 3,000 | 2,912 | ||
(YMCA Metropolitan L.A. Proj.) Series 2001: | ||||
5.25% 2/1/26 (AMBAC Insured) | 2,000 | 2,020 | ||
5.25% 2/1/32 (AMBAC Insured) | 6,295 | 6,297 | ||
Series 2005, 5% 10/1/33 | 7,235 | 7,394 | ||
California Muni. Fin. Auth. Ctfs. of Prtn. (Cmnty. Hospitals of Central California Obligated Group Proj.) Series 2009, 5.5% 2/1/39 | 5,000 | 4,463 | ||
California Muni. Fin. Auth. Rev.: | ||||
(Eisenhower Med. Ctr. Proj.) Series 2010 A: | ||||
5% 7/1/19 | 300 | 315 | ||
5% 7/1/20 | 500 | 524 | ||
5.75% 7/1/40 | 5,000 | 4,965 | ||
(Loma Linda Univ. Proj.) Series 2007, 5% 4/1/22 | 1,090 | 1,158 | ||
California Poll. Cont. Fing. Auth. Ctfs. of Prtn.: | ||||
(Pacific Gas & Elec. Co. Proj.) Series 1996 A, 5.35% 12/1/16 (Nat'l. Pub. Fin. Guarantee Corp. Insured) (d) | 4,335 | 4,428 | ||
Municipal Bonds - continued | ||||
| Principal Amount (000s) | Value (000s) | ||
California - continued | ||||
California Poll. Cont. Fing. Auth. Ctfs. of Prtn.: - continued | ||||
(San Diego Gas & Elec. Co. Proj.) 5.9% 6/1/14 (Nat'l. Pub. Fin. Guarantee Corp. Insured) | $ 4,250 | $ 4,765 | ||
California Poll. Cont. Fing. Auth. Solid Waste Disp. Rev. Bonds (Waste Mgmt., Inc. Proj.): | ||||
Series 2001 A, 5.125%, tender 5/1/14 (c)(d) | 9,000 | 9,694 | ||
Series 2003 A, 5%, tender 5/1/13 (c)(d) | 3,000 | 3,160 | ||
Series 2005 A1, 4.7%, tender 4/1/12 (c)(d) | 3,250 | 3,314 | ||
California Pub. Works Board Lease Rev.: | ||||
(Butterfield State Office Complex Proj.) Series 2005 A: | ||||
5% 6/1/13 | 2,600 | 2,753 | ||
5% 6/1/14 | 2,000 | 2,189 | ||
5.25% 6/1/24 | 5,400 | 5,624 | ||
5.25% 6/1/25 | 5,000 | 5,150 | ||
5.25% 6/1/30 | 4,000 | 4,048 | ||
(California Cmnty. College Projs.) Series 1998 A, 5.25% 12/1/16 | 4,400 | 4,415 | ||
(California State Univ. Proj.): | ||||
Series 2006 A, 5% 10/1/14 (FGIC Insured) | 2,700 | 2,942 | ||
Series 2006 G: | ||||
5% 11/1/20 | 1,825 | 1,928 | ||
5% 11/1/21 | 2,020 | 2,120 | ||
(California Substance Abuse Treatment Facility and State Prison at Corcoran II Proj.) Series 2005 J, 5.25% 1/1/16 (AMBAC Insured) | 4,520 | 5,171 | ||
(Capitol East End Complex-Blocks 171-174 & 225 Proj.) Series 2002 A, 5.25% 12/1/18 | 5,000 | 5,219 | ||
(Coalinga State Hosp. Proj.) Series 2004 A: | ||||
5.25% 6/1/12 | 2,485 | 2,559 | ||
5.5% 6/1/15 | 1,000 | 1,109 | ||
5.5% 6/1/17 | 9,980 | 10,877 | ||
(Dept. of Corrections & Rehab. Proj.) Series 2006 F: | ||||
5% 11/1/15 (FGIC Insured) | 2,455 | 2,726 | ||
5% 11/1/16 (FGIC Insured) | 2,000 | 2,236 | ||
(Dept. of Corrections State Prison Proj.) Series 1993 E: | ||||
5.5% 6/1/15 (FSA Insured) | 1,640 | 1,768 | ||
5.5% 6/1/15 (Nat'l. Pub. Fin. Guarantee Corp. Insured) | 815 | 877 | ||
(Dept. of Corrections, Madera State Prison Proj.) Series E, 5.5% 6/1/15 | 7,205 | 7,750 | ||
(Dept. of Corrections, Monterey County State Prison Proj.) Series 2003 C, 5.5% 6/1/15 | 6,100 | 6,622 | ||
Municipal Bonds - continued | ||||
| Principal Amount (000s) | Value (000s) | ||
California - continued | ||||
California Pub. Works Board Lease Rev.: - continued | ||||
(Dept. of Corrections, Susanville State Prison Proj.) Series 1993 D, 5.25% 6/1/15 (FSA Insured) | $ 4,210 | $ 4,679 | ||
(Dept. of Gen. Svcs. Butterfield Proj.) Series 2005 A, 5% 6/1/23 | 2,900 | 2,991 | ||
(Dept. of Health Svcs. Proj.) Series 2005 K, 5% 11/1/23 | 2,800 | 2,876 | ||
(Dept. of Mental Health Proj.) Series 2004 A: | ||||
5% 6/1/25 | 3,000 | 3,059 | ||
5.125% 6/1/29 | 5,000 | 5,022 | ||
5.5% 6/1/19 | 2,000 | 2,146 | ||
(Kern County at Delano II Proj.) Series 2003 C, 5.5% 6/1/17 (Nat'l. Pub. Fin. Guarantee Corp. Insured) | 4,775 | 5,074 | ||
(Madera County, Valley State Prison for Women Proj.) Series 2005 H, 5% 6/1/16 | 5,000 | 5,558 | ||
(Office of Emergency Svcs. Proj.) Series 2007 A, 5% 3/1/20 | 3,335 | 3,554 | ||
(Porterville Developmental Ctr. Hsg. Expansion and Recreation Complex Proj.) Series 2009 C, 6.25% 4/1/34 | 5,900 | 6,261 | ||
(Richmond Lab. Proj.) Series 2005 K, 5% 11/1/17 | 5,625 | 6,137 | ||
(Ten Administrative Segregation Hsg. Units Proj.) Series 2002 A, 5.25% 3/1/18 (AMBAC Insured) | 2,500 | 2,540 | ||
(Univ. of California Research Proj.): | ||||
Series 2005 L: | ||||
5% 11/1/25 (Nat'l. Pub. Fin. Guarantee Corp. Insured) | 5,165 | 5,381 | ||
5.25% 11/1/23 (Nat'l. Pub. Fin. Guarantee Corp. Insured) | 3,500 | 3,766 | ||
Series 2006 E: | ||||
5% 10/1/23 | 2,410 | 2,622 | ||
5.25% 10/1/21 | 2,900 | 3,270 | ||
Series 2009 G1, 5.75% 10/1/30 | 1,800 | 1,881 | ||
Series 2009 I: | ||||
5.5% 11/1/23 | 1,535 | 1,643 | ||
6.125% 11/1/29 | 1,200 | 1,306 | ||
6.25% 11/1/21 | 2,000 | 2,336 | ||
6.375% 11/1/34 | 3,000 | 3,230 | ||
California State Univ. Rev.: | ||||
(Systemwide Proj.) Series 2002 A: | ||||
5.375% 11/1/18 (AMBAC Insured) | 1,290 | 1,350 | ||
5.5% 11/1/16 (AMBAC Insured) | 1,500 | 1,580 | ||
Municipal Bonds - continued | ||||
| Principal Amount (000s) | Value (000s) | ||
California - continued | ||||
California State Univ. Rev.: - continued | ||||
Series 2009 A: | ||||
5.75% 11/1/25 | $ 3,675 | $ 4,103 | ||
5.75% 11/1/28 | 6,525 | 7,123 | ||
6% 11/1/40 | 7,240 | 7,902 | ||
California Statewide Cmntys. Dev. Auth. Poll. Cont. Rev. Bonds (Southern California Edison Co. Proj.) Series 2006 B, 4.1%, tender 4/1/13 (XL Cap. Assurance, Inc. Insured) (c) | 2,425 | 2,540 | ||
California Statewide Cmntys. Dev. Auth. Rev.: | ||||
(Adventist Health Sys. Proj.) Series 2007 B, 5% 3/1/37 (Assured Guaranty Corp. Insured) | 5,000 | 5,059 | ||
(Cmnty. Hosp. Monterey Peninsula Proj.) Series 2003 B, 5.25% 6/1/23 (FSA Insured) | 1,800 | 1,836 | ||
(Cottage Health Sys. Obligated Group Proj.) Series 2010, 5.25% 11/1/30 | 3,000 | 3,035 | ||
(Daughters of Charity Health Sys. Proj.): | ||||
Series 2003 G, 5.25% 7/1/12 | 900 | 924 | ||
Series 2005 G, 5.25% 7/1/13 | 1,475 | 1,517 | ||
(Enloe Health Sys. Proj.) Series 2008 B: | ||||
5% 8/15/16 | 125 | 139 | ||
5% 8/15/19 | 50 | 56 | ||
5.75% 8/15/38 | 3,000 | 3,109 | ||
6.25% 8/15/33 | 2,500 | 2,669 | ||
(Kaiser Permanente Health Sys. Proj.): | ||||
Series 2001 C, 5.25% 8/1/31 | 3,215 | 3,240 | ||
Series 2007 A: | ||||
4.75% 4/1/33 | 2,000 | 1,843 | ||
5% 4/1/31 | 4,900 | 4,858 | ||
(Los Angeles Orthopaedic Hosp. Foundation Prog.) Series 2000, 5.75% 6/1/30 (AMBAC Insured) | 8,355 | 8,148 | ||
(St. Joseph Health Sys. Proj.) Series 2007 C, 5.75% 7/1/47 (FGIC Insured) | 9,000 | 9,126 | ||
(Sutter Health Proj.) Series 2011 A, 6% 8/15/42 | 3,300 | 3,565 | ||
(Sutter Health Systems Proj.): | ||||
Series 2002 B, 5.625% 8/15/42 | 7,000 | 7,041 | ||
Series 2005 A, 5% 11/15/43 (Nat'l. Pub. Fin. Guarantee Corp. Insured) | 4,125 | 3,886 | ||
5.375% 6/1/26 | 2,500 | 2,552 | ||
6% 6/1/33 | 3,000 | 3,105 | ||
Campbell Union School District Gen. Oblig. Series 2002 C, 5% 8/1/34 (Pre-Refunded to 8/1/14 @ 102) (e) | 1,910 | 2,205 | ||
Municipal Bonds - continued | ||||
| Principal Amount (000s) | Value (000s) | ||
California - continued | ||||
Carlsbad Unified School District: | ||||
Series 2009 B: | ||||
0% 5/1/15 | $ 1,000 | $ 930 | ||
0% 5/1/16 | 1,365 | 1,217 | ||
0% 5/1/17 | 1,155 | 979 | ||
0% 5/1/18 | 1,335 | 1,065 | ||
0% 5/1/19 | 1,000 | 747 | ||
0% 5/1/34 (a) | 5,300 | 3,395 | ||
0% 11/1/15 (Nat'l. Pub. Fin. Guarantee Corp. Insured) | 1,700 | 1,560 | ||
Chino Basin Reg'l. Fing. Auth. Rev. (Inland Empire Util. Agcy. Proj.) Series 2008 A: | ||||
5% 11/1/24 (AMBAC Insured) | 1,000 | 1,079 | ||
5% 11/1/25 (AMBAC Insured) | 3,820 | 4,093 | ||
5% 11/1/33 (AMBAC Insured) | 5,000 | 5,098 | ||
Chula Vista Ind. Dev. Rev. (San Diego Gas & Elec. Co. Proj.) Series B, 5.875% 2/15/34 | 5,000 | 5,455 | ||
Clovis Pub. Fing. Auth. Wastewtr. Rev. Series 2005, 5% 8/1/35 (Nat'l. Pub. Fin. Guarantee Corp. Insured) | 3,295 | 3,192 | ||
Colton Joint Unified School District Series 2001 C, 5.25% 2/1/22 (FGIC Insured) | 1,200 | 1,269 | ||
Commerce Refuse to Energy Auth. Rev. Series 2005: | ||||
5.5% 7/1/14 (Nat'l. Pub. Fin. Guarantee Corp. Insured) | 1,545 | 1,677 | ||
5.5% 7/1/15 (Nat'l. Pub. Fin. Guarantee Corp. Insured) | 2,685 | 2,967 | ||
Corona-Norco Unified School District Series A: | ||||
5% 8/1/22 (FSA Insured) | 1,470 | 1,604 | ||
5% 8/1/25 (FSA Insured) | 1,435 | 1,521 | ||
5% 8/1/26 (FSA Insured) | 2,000 | 2,107 | ||
5% 8/1/27 (FSA Insured) | 1,785 | 1,862 | ||
5% 8/1/31 (FSA Insured) | 5,000 | 5,144 | ||
Covina Valley Unified School District Series 2006 A, 5% 8/1/31 (Nat'l. Pub. Fin. Guarantee Corp. Insured) | 5,600 | 5,671 | ||
Ctr. Unified School District Series 1997 C: | ||||
0% 9/1/18 (Nat'l. Pub. Fin. Guarantee Corp. Insured) | 2,000 | 1,485 | ||
0% 9/1/20 (Nat'l. Pub. Fin. Guarantee Corp. Insured) | 2,010 | 1,343 | ||
Cucamonga County Wtr. District 5% 9/1/36 (Nat'l. Pub. Fin. Guarantee Corp. Insured) | 2,890 | 2,956 | ||
Cupertino California Union School District: | ||||
5% 8/1/18 | 1,735 | 2,115 | ||
5% 8/1/19 | 1,120 | 1,375 | ||
Municipal Bonds - continued | ||||
| Principal Amount (000s) | Value (000s) | ||
California - continued | ||||
Davis Spl. Tax Rev. Series 2007: | ||||
5% 9/1/11 (AMBAC Insured) | $ 595 | $ 595 | ||
5% 9/1/12 (AMBAC Insured) | 625 | 636 | ||
5% 9/1/13 (AMBAC Insured) | 655 | 675 | ||
5% 9/1/14 (AMBAC Insured) | 690 | 718 | ||
5% 9/1/15 (AMBAC Insured) | 725 | 755 | ||
5% 9/1/18 (AMBAC Insured) | 835 | 855 | ||
5% 9/1/20 (AMBAC Insured) | 925 | 925 | ||
5% 9/1/22 (AMBAC Insured) | 1,020 | 1,012 | ||
Desert Sands Union School District Ctfs. of Prtn.: | ||||
5.75% 3/1/24 (FSA Insured) | 2,000 | 2,204 | ||
6% 3/1/20 (FSA Insured) | 1,000 | 1,165 | ||
Duarte Ctfs. of Prtn. Series 1999 A: | ||||
5% 4/1/12 | 4,210 | 4,222 | ||
5% 4/1/13 | 1,830 | 1,835 | ||
El Centro Fing. Auth. Wastewtr. Series 2006 A, 5.25% 10/1/35 (FSA Insured) | 6,890 | 7,075 | ||
Elk Grove Fin. Auth. Spl. Tax Rev. 5% 9/1/17 (AMBAC Insured) | 2,415 | 2,494 | ||
Elk Grove Unified School District Spl. Tax (Cmnty. Facilities District #1 Proj.) 6.5% 12/1/24 (AMBAC Insured) | 4,025 | 4,326 | ||
Empire Union School District Spl. Tax (Cmnty. Facilities District No. 1987 Proj.) Series 2002 A: | ||||
0% 10/1/24 (AMBAC Insured) | 1,665 | 777 | ||
0% 10/1/25 (AMBAC Insured) | 1,665 | 723 | ||
Encinitas Union School District Series 1996, 0% 8/1/21 (Nat'l. Pub. Fin. Guarantee Corp. Insured) | 1,000 | 601 | ||
Escondido Union High School District: | ||||
Series 2008 A: | ||||
0% 8/1/33 (Assured Guaranty Corp. Insured) | 5,655 | 1,384 | ||
0% 8/1/34 (Assured Guaranty Corp. Insured) | 3,500 | 800 | ||
0% 11/1/16 (Escrowed to Maturity) (e) | 3,500 | 3,272 | ||
Fairfield-Suisun Unified School District Series 2004, 5.5% 8/1/28 (Nat'l. Pub. Fin. Guarantee Corp. Insured) | 3,000 | 3,152 | ||
Fillmore Pub. Fing. Auth. Rev. (Wtr. Recycling Fing. Proj.) Series 2007, 5% 5/1/37 (CIFG North America Insured) | 2,500 | 2,365 | ||
Folsom Cordova Unified School District School Facilities Impt. District #1 Series A, 0% 10/1/20 (Nat'l. Pub. Fin. Guarantee Corp. Insured) | 1,315 | 818 | ||
Municipal Bonds - continued | ||||
| Principal Amount (000s) | Value (000s) | ||
California - continued | ||||
Foothill-De Anza Cmnty. College District: | ||||
Series 1999 A: | ||||
0% 8/1/15 (Nat'l. Pub. Fin. Guarantee Corp. Insured) | $ 2,430 | $ 2,272 | ||
0% 8/1/19 (Nat'l. Pub. Fin. Guarantee Corp. Insured) | 5,365 | 4,082 | ||
0% 8/1/20 (Nat'l. Pub. Fin. Guarantee Corp. Insured) | 6,425 | 4,551 | ||
Series 1999 B, 0% 8/1/24 (Nat'l. Pub. Fin. Guarantee Corp. Insured) | 5,000 | 2,704 | ||
Series C, 5% 8/1/36 | 10,000 | 10,609 | ||
Foothill/Eastern Trans. Corridor Agcy. Toll Road Rev.: | ||||
Series 1995 A, 5% 1/1/35 (Nat'l. Pub. Fin. Guarantee Corp. Insured) | 24,070 | 19,689 | ||
Series 1999: | ||||
5% 1/15/16 (Nat'l. Pub. Fin. Guarantee Corp. Insured) | 5,860 | 5,871 | ||
5.75% 1/15/40 | 8,155 | 7,261 | ||
5.875% 1/15/27 | 4,000 | 3,887 | ||
5.875% 1/15/27 (Nat'l. Pub. Fin. Guarantee Corp. Insured) | 4,500 | 4,373 | ||
5.875% 1/15/29 | 4,000 | 3,871 | ||
Garden Grove Agcy. Cmnty. Dev. Tax Allocation Rev. (Garden Grove Cmnty. Proj.) 5.375% 10/1/20 | 2,645 | 2,662 | ||
Glendora Unified School District Series 2005 A, 5.25% 8/1/26 (Nat'l. Pub. Fin. Guarantee Corp. Insured) | 1,000 | 1,066 | ||
Golden State Tobacco Securitization Corp. Tobacco Settlement Rev.: | ||||
Series 2005 A: | ||||
5% 6/1/35 (Berkshire Hathaway Assurance Corp. Insured) | 1,535 | 1,487 | ||
5% 6/1/45 | 12,125 | 10,671 | ||
5% 6/1/45 | 2,775 | 2,450 | ||
Series 2007 A1: | ||||
5% 6/1/12 | 1,400 | 1,420 | ||
5% 6/1/13 | 1,000 | 1,024 | ||
5% 6/1/14 | 2,000 | 2,053 | ||
5% 6/1/15 | 1,000 | 1,027 | ||
5% 6/1/33 | 3,000 | 2,077 | ||
5.125% 6/1/47 | 2,600 | 1,668 | ||
5.75% 6/1/47 | 5,000 | 3,526 | ||
5% 6/1/45 (FSA Insured) | 235 | 220 | ||
Municipal Bonds - continued | ||||
| Principal Amount (000s) | Value (000s) | ||
California - continued | ||||
Golden West Schools Fing. Auth. Rev. Series A, 0% 8/1/18 (Nat'l. Pub. Fin. Guarantee Corp. Insured) | $ 2,750 | $ 2,013 | ||
Indio Pub. Fing. Auth. Lease Rev. Bonds Series 2007 B, 3.8%, tender 11/1/12 (c) | 2,500 | 2,538 | ||
La Quinta Redev. Agcy. Tax. Allocation (Area #1 Redev. Proj.) Series 1994, 7.3% 9/1/11 (National Public Finance Guarantee Corp. Insured) | 480 | 480 | ||
Laguna Beach Unified School District Gen. Oblig. (Election of 2001 Proj.): | ||||
5% 8/1/21 | 405 | 486 | ||
5% 8/1/22 | 450 | 526 | ||
5% 8/1/23 | 485 | 559 | ||
5% 8/1/24 | 1,000 | 1,138 | ||
5% 8/1/26 | 1,370 | 1,530 | ||
5% 8/1/28 | 760 | 831 | ||
Lancaster Fing. Auth. Tax Allocation Rev. 5% 2/1/31 (AMBAC Insured) | 3,420 | 2,449 | ||
Loma Linda Hosp. Rev.: | ||||
(Loma Linda Univ. Med. Ctr. Proj.) Series 2008 A, 8.25% 12/1/38 | 4,400 | 4,809 | ||
Series 2005 A, 5% 12/1/14 | 4,500 | 4,765 | ||
Long Beach Bond Fin. Auth. Natural Gas Purchase Rev. Series 2007 A, 5.25% 11/15/21 | 3,790 | 3,843 | ||
Long Beach Cmnty. College Series 2008 A, 0% 6/1/31 (FSA Insured) | 9,750 | 2,873 | ||
Long Beach Hbr. Rev. Series 2010 B, 5% 5/15/22 | 2,735 | 3,142 | ||
Long Beach Unified School District: | ||||
Series 2008 A, 5.25% 8/1/33 | 6,725 | 7,228 | ||
Series A, 5.75% 8/1/33 | 2,800 | 3,143 | ||
Los Angeles Cmnty. College District: | ||||
Series 2008 A, 6% 8/1/33 | 10,000 | 11,336 | ||
Series 2009 A, 5.5% 8/1/29 | 1,000 | 1,102 | ||
Series 2010 C, 5.25% 8/1/39 | 1,300 | 1,385 | ||
Los Angeles Cmnty. Redev. Agcy. Lease Rev. (Vermont Manchester Social Svcs. Proj.) Series 2005, 5% 9/1/21 (AMBAC Insured) | 2,805 | 2,875 | ||
Los Angeles County Ctfs. of Prtn.: | ||||
(Correctional Facilities Proj.) 0% 9/1/13 (Escrowed to Maturity) (e) | 3,380 | 3,333 | ||
(Disney Parking Proj.): | ||||
0% 3/1/12 | 2,180 | 2,163 | ||
0% 3/1/13 | 6,490 | 6,337 | ||
0% 9/1/14 (AMBAC Insured) | 3,860 | 3,622 | ||
Municipal Bonds - continued | ||||
| Principal Amount (000s) | Value (000s) | ||
California - continued | ||||
Los Angeles County Ctfs. of Prtn.: - continued | ||||
(Disney Parking Proj.): | ||||
0% 3/1/18 | $ 3,000 | $ 2,383 | ||
0% 3/1/19 | 3,200 | 2,395 | ||
0% 3/1/20 | 1,000 | 697 | ||
Los Angeles County Schools Regionalized Bus. Svcs. Corp. Ctfs. of Prtn. (Pooled Fing. Prog.) Series 2003 B: | ||||
5.375% 9/1/16 (FSA Insured) | 1,045 | 1,129 | ||
5.375% 9/1/17 (FSA Insured) | 1,095 | 1,176 | ||
5.375% 9/1/18 (FSA Insured) | 1,155 | 1,236 | ||
5.375% 9/1/19 (FSA Insured) | 1,210 | 1,290 | ||
Los Angeles Ctfs. of Prtn. (Dept. Pub. Social Svcs. Proj.) Series 1999 A, 5.5% 8/1/24 (AMBAC Insured) | 3,700 | 3,703 | ||
Los Angeles Dept. Arpt. Rev.: | ||||
Series 2002 A, 5.25% 5/15/19 (Nat'l. Pub. Fin. Guarantee Corp. Insured) | 3,000 | 3,069 | ||
Series 2006 A: | ||||
5% 5/15/16 (Nat'l. Pub. Fin. Guarantee Corp. Insured) (d) | 1,000 | 1,104 | ||
5% 5/15/17 (Nat'l. Pub. Fin. Guarantee Corp. Insured) (d) | 3,990 | 4,349 | ||
5% 5/15/18 (Nat'l. Pub. Fin. Guarantee Corp. Insured) (d) | 1,410 | 1,518 | ||
Los Angeles Dept. of Wtr. & Pwr. Elec. Plant Rev.: | ||||
4.75% 8/15/12 (Escrowed to Maturity) (e) | 3,120 | 3,129 | ||
4.75% 8/15/16 (Escrowed to Maturity) (e) | 1,395 | 1,399 | ||
4.75% 10/15/20 (Escrowed to Maturity) (e) | 150 | 150 | ||
Los Angeles Dept. of Wtr. & Pwr. Rev. Series A2, 5% 7/1/25 (FSA Insured) | 2,800 | 2,969 | ||
Los Angeles Dept. of Wtr. & Pwr. Wtrwks. Rev. Series 2004 C, 5% 7/1/34 (Nat'l. Pub. Fin. Guarantee Corp. Insured) | 1,500 | 1,530 | ||
Los Angeles Hbr. Dept. Rev. 7.6% 10/1/18 (Escrowed to Maturity) (e) | 9,820 | 12,262 | ||
Los Angeles Muni. Impt. Corp. Lease Rev. Series 2008 A, 5% 9/1/22 | 5,500 | 5,819 | ||
Los Angeles Unified School District: | ||||
Series 1997 F, 5% 7/1/21 (FSA Insured) | 3,880 | 4,108 | ||
Series 2003 A, 5% 7/1/21 (FSA Insured) | 11,050 | 11,698 | ||
Series 2004 A1, 5% 7/1/17 (Nat'l. Pub. Fin. Guarantee Corp. Insured) | 3,000 | 3,290 | ||
Series 2007 A1, 4.5% 1/1/28 | 6,900 | 6,744 | ||
Los Angeles Wastewtr. Sys. Rev. Series 2009 A, 5.75% 6/1/34 | 10,000 | 10,973 | ||
Municipal Bonds - continued | ||||
| Principal Amount (000s) | Value (000s) | ||
California - continued | ||||
M-S-R Pub. Pwr. Agcy. San Juan Proj. Rev. Series D, 6.75% 7/1/20 (Escrowed to Maturity) (e) | $ 1,635 | $ 2,037 | ||
Madera County Ctfs. of Prtn. (Children's Hosp. Central California Proj.) Series 2010, 5.375% 3/15/36 | 3,425 | 3,310 | ||
Malibu Gen. Oblig. Ctfs. of Prtn. (City Hall Proj.) Series A: | ||||
5% 7/1/32 | 500 | 521 | ||
5% 7/1/39 | 4,095 | 4,193 | ||
Marina Coast Wtr. District Ctfs. Prtn. Series 2006, 5% 6/1/37 (Nat'l. Pub. Fin. Guarantee Corp. Insured) | 3,500 | 3,455 | ||
Merced Union High School District Series A, 0% 8/1/22 (Nat'l. Pub. Fin. Guarantee Corp. Insured) | 1,100 | 627 | ||
Modesto Elementary School District, Stanislaus County Series A: | ||||
0% 8/1/21 (Nat'l. Pub. Fin. Guarantee Corp. Insured) | 2,000 | 1,225 | ||
0% 8/1/25 (Nat'l. Pub. Fin. Guarantee Corp. Insured) | 2,800 | 1,271 | ||
Modesto Gen. Oblig. Ctfs. of Prtn.: | ||||
(Cmnty. Ctr. Refing. Proj.) Series A, 5% 11/1/23 (AMBAC Insured) | 2,500 | 2,245 | ||
(Golf Course Refing. Proj.) Series B, 5% 11/1/23 (Nat'l. Pub. Fin. Guarantee Corp. Insured) | 1,585 | 1,537 | ||
Modesto Irrigation District Ctfs. of Prtn.: | ||||
(Cap. Impts. Proj.) Series 2004 B, 5.5% 7/1/35 | 3,800 | 3,891 | ||
(Geysers Geothermal Pwr. Proj.) Series 1986 A, 5% 10/1/17 (Escrowed to Maturity) (e) | 5,000 | 5,799 | ||
Monrovia Unified School District Series B, 0% 8/1/33 (Nat'l. Pub. Fin. Guarantee Corp. Insured) | 2,500 | 673 | ||
Montebello Unified School District Series 2001, 0% 6/1/26 (FSA Insured) | 1,580 | 598 | ||
Monterey County Pub. Impt. Corp. Ctfs. of Prtn. 5% 8/1/18 (AMBAC Insured) | 3,580 | 3,944 | ||
Moreland School District Series 2003 B, 0% 8/1/27 (Nat'l. Pub. Fin. Guarantee Corp. Insured) | 1,485 | 565 | ||
Murrieta Valley Unified School District: | ||||
Series 1998 A, 0% 9/1/13 (Nat'l. Pub. Fin. Guarantee Corp. Insured) | 1,500 | 1,449 | ||
Series 2008, 0% 9/1/32 (FSA Insured) | 5,000 | 1,252 | ||
Natomas Unified School District Series 2007, 5.25% 8/1/30 (FGIC Insured) | 5,150 | 5,125 | ||
New Haven Unified School District: | ||||
12% 8/1/16 (FSA Insured) | 1,500 | 2,237 | ||
12% 8/1/17 (FSA Insured) | 1,000 | 1,552 | ||
Municipal Bonds - continued | ||||
| Principal Amount (000s) | Value (000s) | ||
California - continued | ||||
Newport Beach Rev.: | ||||
(Hoag Memorial Hosp. Presbyterian Proj.) Series 2009 A, 5% 12/1/24 | $ 2,000 | $ 2,042 | ||
Bonds (Hoag Memorial Hosp. Presbyterian Proj.) Series 2009 E, 5%, tender 2/7/13 (c) | 2,800 | 2,965 | ||
Hoag Memorial Hosp. Presbyterian Proj.) Series 2011 A, 6% 12/1/40 | 3,000 | 3,288 | ||
North City West School Facilities Fing. Auth. Spl. Tax: | ||||
Series 2005 B, 5.25% 9/1/23 (AMBAC Insured) | 1,530 | 1,630 | ||
Series 2006 C: | ||||
5% 9/1/16 (AMBAC Insured) | 1,000 | 1,101 | ||
5% 9/1/17 (AMBAC Insured) | 2,735 | 2,983 | ||
Northern California Power Agency Rev. (Hydroelectric #1 Proj.) Series 2008 C, 5% 7/1/12 | 2,500 | 2,594 | ||
Northern California Pwr. Agcy. Rev. (Hydroelectric #1 Proj.) Series 1986 A, 7.5% 7/1/23 (Pre-Refunded to 7/1/21 @ 100) (e) | 3,850 | 5,346 | ||
Northern California Transmission Auth. Rev. (Ore Trans. Proj.) Series A, 7% 5/1/13 (Nat'l. Pub. Fin. Guarantee Corp. Insured) | 4,205 | 4,400 | ||
Norwalk-Mirada Unified School District Series 2009 D, 0% 8/1/33 (FSA Insured) | 5,700 | 1,329 | ||
Novato Unified School District Series 2002, 5.25% 8/1/17 (Nat'l. Pub. Fin. Guarantee Corp. Insured) | 1,000 | 1,013 | ||
Oakland Gen. Oblig. Series 2009 B, 6.25% 1/15/39 | 3,000 | 3,275 | ||
Oakland Joint Powers Fing. Auth. Series 2008 A1, 4.25% 1/1/13 (Assured Guaranty Corp. Insured) | 3,000 | 3,136 | ||
Oakland Redev. Agcy. Sub Tax Allocation (Central District Redev. Proj.): | ||||
Series 1993 A, 5% 9/1/21 (Escrowed to Maturity) (e) | 1,000 | 1,183 | ||
Series 2003, 5.5% 9/1/17 (Nat'l. Pub. Fin. Guarantee Corp. Insured) | 3,000 | 3,029 | ||
Oakland Unified School District Alameda County Series 2009 A: | ||||
6.5% 8/1/23 | 2,810 | 3,208 | ||
6.5% 8/1/24 | 1,220 | 1,382 | ||
Oceanside Unified School District Series A, 0% 8/1/31 (Assured Guaranty Corp. Insured) | 5,000 | 1,441 | ||
Orange County Pub. Fin. Lease Rev. (Juvenile Justice Ctr. Facility Proj.) Series 2002, 5.375% 6/1/16 (AMBAC Insured) | 3,770 | 3,916 | ||
Oxnard Fin. Auth. Solid Waste Rev. Series 2005, 5% 5/1/12 (AMBAC Insured) (d) | 2,065 | 2,101 | ||
Municipal Bonds - continued | ||||
| Principal Amount (000s) | Value (000s) | ||
California - continued | ||||
Oxnard Fing. Auth. Wastewtr. Rev. (Redwood Trunk Swr. and Headworks Proj.) Series 2004 A, 5% 6/1/29 (FGIC Insured) | $ 3,000 | $ 3,077 | ||
Palmdale Elementary School District Spl. Tax (Cmnty. Facilities District #90-1 Proj.) Series 1999, 5.8% 8/1/29 (FSA Insured) | 6,410 | 6,415 | ||
Placentia Pub. Fing. Auth. Rev.: | ||||
3.125% 9/1/12 | 1,585 | 1,604 | ||
4% 9/1/13 | 1,855 | 1,917 | ||
Placer County Union High School District Series A: | ||||
0% 8/1/20 (Nat'l. Pub. Fin. Guarantee Corp. Insured) | 2,000 | 1,338 | ||
0% 8/1/21 (Nat'l. Pub. Fin. Guarantee Corp. Insured) | 1,000 | 634 | ||
Placer County Wtr. Agcy. Rev. (Middle Fork Proj.) Series A, 3.75% 7/1/12 | 305 | 306 | ||
Port of Oakland Rev.: | ||||
Series 2002 L: | ||||
5.5% 11/1/20 (Nat'l. Pub. Fin. Guarantee Corp. Insured) (d) | 3,030 | 3,116 | ||
5.5% 11/1/20 (Pre-Refunded to 11/1/12 @ 100) (d)(e) | 375 | 396 | ||
Series 2002 N: | ||||
5% 11/1/12 (Nat'l. Pub. Fin. Guarantee Corp. Insured) (d) | 2,800 | 2,930 | ||
5% 11/1/15 (Nat'l. Pub. Fin. Guarantee Corp. Insured) (d) | 5,850 | 6,079 | ||
5% 11/1/17 (Nat'l. Pub. Fin. Guarantee Corp. Insured) (d) | 3,355 | 3,459 | ||
5% 11/1/18 (Nat'l. Pub. Fin. Guarantee Corp. Insured) (d) | 2,740 | 2,820 | ||
Series 2007 A: | ||||
5% 11/1/14 (Nat'l. Pub. Fin. Guarantee Corp. Insured) (d) | 10,910 | 12,046 | ||
5% 11/1/16 (Nat'l. Pub. Fin. Guarantee Corp. Insured) (d) | 2,885 | 3,232 | ||
5% 11/1/17 (Nat'l. Pub. Fin. Guarantee Corp. Insured) (d) | 2,185 | 2,448 | ||
Series 2011 O, 5% 5/1/22 (d) | 4,500 | 4,750 | ||
Poway Unified School District: | ||||
(District #2007-1 School Facilities Proj.) Series 2008 A, 0% 8/1/32 | 12,800 | 3,493 | ||
Series B, 0% 8/1/35 | 9,000 | 1,987 | ||
0% 8/1/37 | 6,325 | 1,225 | ||
0% 8/1/38 | 5,410 | 981 | ||
Municipal Bonds - continued | ||||
| Principal Amount (000s) | Value (000s) | ||
California - continued | ||||
Poway Unified School District Pub. Fing. Auth. Lease Rev. Bonds: | ||||
Series 2008 B, 0%, tender 12/1/14 (FSA Insured) (c) | $ 6,685 | $ 6,232 | ||
Series 2008 C: | ||||
3.125%, tender 12/1/11 (FSA Insured) (c) | 1,730 | 1,738 | ||
4%, tender 12/1/11 (FSA Insured) (c) | 6,500 | 6,543 | ||
Rancho Mirage Joint Powers Fing. Auth. Rev. (Eisenhower Med. Ctr. Proj.) Series A, 4.875% 7/1/22 (Nat'l. Pub. Fin. Guarantee Corp. Insured) | 3,500 | 3,522 | ||
Redwood City Elementary School District Series 1997, 0% 8/1/20 (Nat'l. Pub. Fin. Guarantee Corp. Insured) | 4,825 | 3,119 | ||
Riverside County Asset Leasing Corp. Leasehold Rev. (Riverside County Hosp. Proj.): | ||||
Series A, 6.5% 6/1/12 (Nat'l. Pub. Fin. Guarantee Corp. Insured) | 5,815 | 6,044 | ||
Series B, 5.7% 6/1/16 (Nat'l. Pub. Fin. Guarantee Corp. Insured) | 1,950 | 2,003 | ||
Riverside County Pub. Fing. Auth. Tax Allocation Rev. (Redev. Projs.): | ||||
Series 2004: | ||||
5.25% 10/1/20 (XL Cap. Assurance, Inc. Insured) | 2,020 | 1,969 | ||
5.25% 10/1/21 (XL Cap. Assurance, Inc. Insured) | 2,125 | 2,043 | ||
Series 2005 A, 5% 10/1/18 (XL Cap. Assurance, Inc. Insured) | 3,740 | 3,716 | ||
Rocklin Unified School District Series 2002: | ||||
0% 8/1/24 (Nat'l. Pub. Fin. Guarantee Corp. Insured) | 1,370 | 683 | ||
0% 8/1/25 (Nat'l. Pub. Fin. Guarantee Corp. Insured) | 2,725 | 1,263 | ||
0% 8/1/26 (Nat'l. Pub. Fin. Guarantee Corp. Insured) | 1,365 | 588 | ||
Roseville City School District Series 2002 A: | ||||
0% 8/1/25 (Nat'l. Pub. Fin. Guarantee Corp. Insured) | 1,745 | 766 | ||
0% 8/1/27 (Nat'l. Pub. Fin. Guarantee Corp. Insured) | 1,940 | 718 | ||
Sacramento City Fing. Auth. Lease Rev. Series A, 5.4% 11/1/20 (AMBAC Insured) | 2,000 | 2,195 | ||
Sacramento City Fing. Auth. Rev. (Combined Area Projs.) Series B, 0% 11/1/15 (Nat'l. Pub. Fin. Guarantee Corp. Insured) | 7,735 | 6,477 | ||
Sacramento Muni. Util. District Elec. Rev.: | ||||
Series 2001 P, 5.25% 8/15/16 (FSA Insured) | 1,500 | 1,505 | ||
Series 2003 R, 5% 8/15/33 (Nat'l. Pub. Fin. Guarantee Corp. Insured) | 6,825 | 6,870 | ||
Sacramento Pwr. Auth. Cogeneration Proj. Rev.: | ||||
Series 2005 A, 5% 7/1/18 (AMBAC Insured) | 2,800 | 2,907 | ||
Series 2005, 5% 7/1/19 (AMBAC Insured) | 2,900 | 3,001 | ||
Municipal Bonds - continued | ||||
| Principal Amount (000s) | Value (000s) | ||
California - continued | ||||
San Bernardino Cmnty. College District Series A: | ||||
6.25% 8/1/33 | $ 5,900 | $ 6,488 | ||
6.5% 8/1/28 | 2,445 | 2,799 | ||
San Bernardino County Ctfs. of Prtn.: | ||||
(Arrowhead Proj.) Series 2009 A, 5.25% 8/1/26 | 3,000 | 3,050 | ||
(Cap. Facilities Proj.) Series B, 6.875% 8/1/24 (Escrowed to Maturity) (e) | 8,300 | 11,434 | ||
(Med. Ctr. Fing. Prog.) 5.5% 8/1/22 | 10,000 | 10,772 | ||
San Diego Cmnty. College District: | ||||
Series 2002 A, 5% 5/1/22 (Pre-Refunded to 5/1/13 @ 100) (e) | 1,000 | 1,079 | ||
Series 2007, 0% 8/1/17 (FSA Insured) | 3,395 | 2,818 | ||
San Diego County Ctfs. of Prtn.: | ||||
(North and East County Justice Facilities Proj.): | ||||
5% 11/15/16 (AMBAC Insured) | 2,000 | 2,275 | ||
5% 11/15/17 (AMBAC Insured) | 2,000 | 2,251 | ||
5% 11/15/18 (AMBAC Insured) | 2,000 | 2,228 | ||
(The Bishop's School Proj.) Series A, 6% 9/1/34, LOC Bank of New York, New York | 4,090 | 4,159 | ||
(Univ. of San Diego Proj.) 5.25% 10/1/11 | 1,705 | 1,710 | ||
San Diego County Reg'l. Arpt. Auth. Arpt. Rev.: | ||||
Series 2005: | ||||
5% 7/1/14 (AMBAC Insured) (d) | 1,000 | 1,091 | ||
5.25% 7/1/16 (AMBAC Insured) (d) | 1,400 | 1,566 | ||
5% 7/1/12 (AMBAC Insured) (d) | 2,200 | 2,268 | ||
San Diego Pub. Facilities Fing. Auth. Swr. Rev. Series 2009 A, 5.25% 5/15/39 | 1,500 | 1,563 | ||
San Diego Pub. Facilities Fing. Auth. Wtr. Rev. 2009 B, 5.75% 8/1/35 | 3,455 | 3,783 | ||
San Francisco City & County Arpts. Commission Int'l. Arpt. Rev.: | ||||
(SFO Fuel Co. Proj.) Series 1997 A: | ||||
5.125% 1/1/17 (AMBAC Insured) (d) | 6,000 | 6,003 | ||
5.25% 1/1/18 (AMBAC Insured) (d) | 4,515 | 4,518 | ||
Second Series 32F, 5.25% 5/1/19 | 2,500 | 2,946 | ||
Second Series 32H, 5% 5/1/12 (CIFG North America Insured) (d) | 1,000 | 1,029 | ||
San Francisco City & County Redev. Fing. Auth. Tax Allocation Rev. (San Francisco Redev. Projs.) Series 2009 B: | ||||
6.125% 8/1/28 | 1,000 | 1,040 | ||
6.625% 8/1/39 | 1,000 | 1,043 | ||
Municipal Bonds - continued | ||||
| Principal Amount (000s) | Value (000s) | ||
California - continued | ||||
San Jacinto Unified School District Series 2007, 5.25% 8/1/32 (FSA Insured) | $ 3,080 | $ 3,194 | ||
San Joaquin County Ctfs. of Prtn. (County Administration Bldg. Proj.): | ||||
5% 11/15/20 (Nat'l. Pub. Fin. Guarantee Corp. Insured) | 3,720 | 3,964 | ||
5% 11/15/21 (Nat'l. Pub. Fin. Guarantee Corp. Insured) | 3,645 | 3,857 | ||
San Joaquin Hills Trans. Corridor Agcy. Toll Road Rev.: | ||||
Series 1993, 0% 1/1/27 (Escrowed to Maturity) (e) | 4,000 | 2,297 | ||
Series 1997 A: | ||||
0% 1/15/26 (Nat'l. Pub. Fin. Guarantee Corp. Insured) | 11,000 | 3,306 | ||
5.5% 1/15/28 | 1,060 | 846 | ||
Series A: | ||||
0% 1/15/12 (Nat'l. Pub. Fin. Guarantee Corp. Insured) | 7,000 | 6,881 | ||
0% 1/15/15 (Nat'l. Pub. Fin. Guarantee Corp. Insured) | 5,000 | 4,081 | ||
0% 1/15/20 (Nat'l. Pub. Fin. Guarantee Corp. Insured) | 3,765 | 2,036 | ||
0% 1/15/31 (Nat'l. Pub. Fin. Guarantee Corp. Insured) | 5,000 | 951 | ||
San Jose Int'l. Arpt. Rev. Series 2007 A: | ||||
5% 3/1/17 (AMBAC Insured) (d) | 1,180 | 1,297 | ||
5% 3/1/24 (AMBAC Insured) (d) | 9,690 | 9,876 | ||
5% 3/1/37 (AMBAC Insured) (d) | 10,000 | 9,332 | ||
San Jose Unified School District Santa Clara County Series 2002 B, 5% 8/1/25 (FGIC Insured) | 1,750 | 1,863 | ||
San Leandro Unified School District Series 2006 B, 6.25% 8/1/33 (FSA Insured) | 2,800 | 3,095 | ||
San Marcos Pub. Facilities Auth. Pub. Facilities Rev. 0% 9/1/15 (Escrowed to Maturity) (e) | 1,990 | 1,918 | ||
San Marcos Unified School District Series A, 5% 8/1/38 | 5,000 | 5,121 | ||
San Mateo County Cmnty. College District Series A, 0% 9/1/18 (Nat'l. Pub. Fin. Guarantee Corp. Insured) | 3,000 | 2,425 | ||
San Mateo County Joint Powers Fing. Auth. (Cap. Projects) Series 2009 A, 5.25% 7/15/24 | 5,280 | 5,733 | ||
San Mateo Unified School District (Election of 2000 Proj.) Series B: | ||||
0% 9/1/23 (Nat'l. Pub. Fin. Guarantee Corp. Insured) | 2,000 | 1,085 | ||
0% 9/1/25 (Nat'l. Pub. Fin. Guarantee Corp. Insured) | 1,490 | 701 | ||
0% 9/1/26 (Nat'l. Pub. Fin. Guarantee Corp. Insured) | 1,500 | 657 | ||
Municipal Bonds - continued | ||||
| Principal Amount (000s) | Value (000s) | ||
California - continued | ||||
Sanger Unified School District 5.6% 8/1/23 (Nat'l. Pub. Fin. Guarantee Corp. Insured) | $ 3,000 | $ 3,132 | ||
Santa Clara County Fing. Auth. Rev. (El Camino Hosp. Proj.): | ||||
Series 2007 B, 5.125% 2/1/41 (AMBAC Insured) | 2,000 | 1,880 | ||
Series 2007 C, 5.75% 2/1/41 (AMBAC Insured) | 8,000 | 8,083 | ||
Santa Clara Elec. Rev. Series 2011 A, 6% 7/1/31 | 3,000 | 3,324 | ||
Santa Margarita/Dana Point Auth. Rev. Impt. (Dists. 1, 2, 2A & 8 Proj.) Series A, 7.25% 8/1/12 (Nat'l. Pub. Fin. Guarantee Corp. Insured) | 1,865 | 1,949 | ||
Santa Rosa Wastewtr. Rev. Series 2002 B: | ||||
0% 9/1/20 (AMBAC Insured) | 4,030 | 2,554 | ||
0% 9/1/22 (AMBAC Insured) | 2,900 | 1,601 | ||
0% 9/1/25 (AMBAC Insured) | 6,800 | 2,995 | ||
Shasta Joint Powers Fing. Auth. Lease Rev. (County Administration Bldg. Proj.) Series A, 5% 4/1/29 (Nat'l. Pub. Fin. Guarantee Corp. Insured) | 5,015 | 5,019 | ||
Shasta Union High School District: | ||||
Series 2002, 0% 8/1/26 (Nat'l. Pub. Fin. Guarantee Corp. Insured) | 1,000 | 422 | ||
Series 2003, 0% 5/1/28 (Nat'l. Pub. Fin. Guarantee Corp. Insured) | 3,340 | 1,252 | ||
Sonoma County Jr. College District Rev. Series 2002 B, 5% 8/1/26 (FSA Insured) | 11,845 | 12,439 | ||
Southern California Pub. Pwr. Auth. Transmission Proj. Rev. (Southern Transmission Proj.) Series 2008 B, 6% 7/1/25 | 5,450 | 6,356 | ||
Southwestern Cmnty. College District Gen. Oblig. Series 2000, 0% 8/1/27 (Nat'l. Pub. Fin. Guarantee Corp. Insured) | 2,495 | 1,000 | ||
Sulphur Springs Union School District Series A, 0% 9/1/12 (Nat'l. Pub. Fin. Guarantee Corp. Insured) | 2,750 | 2,698 | ||
Sweetwater Union High School District Series 2008 A, 5.625% 8/1/47 (FSA Insured) | 16,900 | 17,863 | ||
Torrance Ctfs. of Prtn. (Refing. & Pub. Impt. Proj.) Series B, 5.25% 6/1/34 (AMBAC Insured) | 3,000 | 3,004 | ||
Torrance Gen. Oblig. Rev. (Torrance Memorial Med. Ctr. Proj.) Series A, 5% 9/1/40 | 5,000 | 4,667 | ||
Torrance Hosp. Rev. (Torrance Memorial Med. Ctr. Proj.) Series 2001 A: | ||||
5.5% 6/1/31 | 2,350 | 2,355 | ||
6% 6/1/22 | 1,100 | 1,115 | ||
Torrance Unified School District Series 2008 Z, 6% 8/1/33 | 5,000 | 5,561 | ||
Municipal Bonds - continued | ||||
| Principal Amount (000s) | Value (000s) | ||
California - continued | ||||
Tracy Operating Partnership Joint Powers Auth. Rev. 6.375% 10/1/38 (Assured Guaranty Corp. Insured) | $ 5,000 | $ 5,527 | ||
Turlock Irrigation District Rev. Series 2011, 5.5% 1/1/41 | 10,000 | 10,707 | ||
Ukiah Unified School District 0% 8/1/14 (Nat'l. Pub. Fin. Guarantee Corp. Insured) | 3,040 | 2,765 | ||
Union Elementary School District Series A: | ||||
0% 9/1/18 (Nat'l. Pub. Fin. Guarantee Corp. Insured) | 1,000 | 786 | ||
0% 9/1/21 (Nat'l. Pub. Fin. Guarantee Corp. Insured) | 2,995 | 1,889 | ||
Univ. of California Regents Med. Ctr. Pool Rev. Series 2010 G: | ||||
4% 5/15/19 | 1,305 | 1,415 | ||
4% 5/15/20 | 615 | 665 | ||
5% 5/15/19 | 2,830 | 3,262 | ||
Univ. of California Revs.: | ||||
(Ltd. Proj.): | ||||
Series 2005 B, 5% 5/15/33 | 1,000 | 1,011 | ||
Series 2007 D, 5% 5/15/25 | 4,250 | 4,592 | ||
(UCLA Med. Ctr. Proj.) Series A: | ||||
5.5% 5/15/21 (AMBAC Insured) | 785 | 798 | ||
5.5% 5/15/24 (AMBAC Insured) | 370 | 374 | ||
Series 2009 O, 5.75% 5/15/34 | 9,900 | 10,913 | ||
Series C, 4.75% 5/15/37 (Nat'l. Pub. Fin. Guarantee Corp. Insured) | 3,150 | 3,174 | ||
Val Verde Unified School District Ctfs. of Prtn.: | ||||
5% 1/1/35 (FGIC Insured) | 2,090 | 1,797 | ||
5.25% 1/1/17 (Pre-Refunded to 1/1/15 @ 100) (e) | 1,000 | 1,155 | ||
5.25% 1/1/18 (Pre-Refunded to 1/1/15 @ 100) (e) | 1,380 | 1,595 | ||
Ventura County Cmnty. College District Series C, 5.5% 8/1/33 | 7,700 | 8,265 | ||
Victor Elementary School District Series A, 0% 6/1/14 (Nat'l. Pub. Fin. Guarantee Corp. Insured) | 2,375 | 2,174 | ||
Vista Gen. Oblig. Ctfs. of Prtn. 5% 5/1/20 (Nat'l. Pub. Fin. Guarantee Corp. Insured) | 2,120 | 2,293 | ||
Vista Unified School District Series A: | ||||
5.375% 8/1/15 (FSA Insured) | 130 | 136 | ||
5.375% 8/1/16 (FSA Insured) | 100 | 104 | ||
Walnut Valley Unified School District Series D: | ||||
0% 8/1/30 (Nat'l. Pub. Fin. Guarantee Corp. Insured) | 2,875 | 890 | ||
0% 8/1/31 (Nat'l. Pub. Fin. Guarantee Corp. Insured) | 2,715 | 767 | ||
0% 8/1/32 (Nat'l. Pub. Fin. Guarantee Corp. Insured) | 1,315 | 343 | ||
5.25% 8/1/16 (Pre-Refunded to 8/1/13 @ 100) (e) | 1,000 | 1,095 | ||
Municipal Bonds - continued | ||||
| Principal Amount (000s) | Value (000s) | ||
California - continued | ||||
Washington Township Health Care District Rev.: | ||||
Series 2009 A: | ||||
6% 7/1/29 | $ 3,000 | $ 3,162 | ||
6.25% 7/1/39 | 7,000 | 7,222 | ||
Series 2010 A, 5.5% 7/1/38 | 3,100 | 2,999 | ||
Series A: | ||||
5% 7/1/23 | 1,460 | 1,483 | ||
5% 7/1/25 | 1,665 | 1,672 | ||
West Contra Costa Unified School District (Election of 2005 Proj.) Series B, 5.625% 8/1/35 (Berkshire Hathaway Assurance Corp. Insured) | 1,500 | 1,542 | ||
Western Riverside County Trust & Wastewtr. Fin. Auth.: | ||||
5.5% 9/1/34 (Assured Guaranty Corp. Insured) | 1,750 | 1,830 | ||
5.625% 9/1/39 (Assured Guaranty Corp. Insured) | 2,250 | 2,357 | ||
Yuba City Unified School District Series A, 0% 9/1/21 (Nat'l. Pub. Fin. Guarantee Corp. Insured) | 2,090 | 1,252 | ||
| 1,602,889 | |||
Guam - 0.2% | ||||
Guam Ed. Fing. Foundation Ctfs. of Prtn. Series 2008: | ||||
4.625% 10/1/11 | 275 | 275 | ||
5.375% 10/1/14 | 1,000 | 1,070 | ||
5.875% 10/1/18 | 1,565 | 1,764 | ||
| 3,109 | |||
Puerto Rico - 0.8% | ||||
Puerto Rico Commonwealth Pub. Impt. Gen. Oblig. Series 2006 A, 4.064% 7/1/21 (FGIC Insured) (c) | 4,600 | 3,830 | ||
Puerto Rico Pub. Bldg. Auth. Rev. Bonds Series M2, 5.75%, tender 7/1/17 (c) | 7,000 | 7,577 | ||
Puerto Rico Sales Tax Fing. Corp. Sales Tax Rev. Series 2007 A, 0% 8/1/41 (FGIC Insured) | 9,500 | 1,423 | ||
| 12,830 | |||
Virgin Islands - 0.2% | ||||
Virgin Islands Pub. Fin. Auth.: | ||||
Series 2009 A1, 5% 10/1/29 | 1,500 | 1,450 | ||
Municipal Bonds - continued | ||||
| Principal Amount (000s) | Value (000s) | ||
Virgin Islands - continued | ||||
Virgin Islands Pub. Fin. Auth.: - continued | ||||
Series 2009 B, 5% 10/1/25 | $ 1,500 | $ 1,507 | ||
Series A, 5.25% 10/1/15 | 1,255 | 1,368 | ||
| 4,325 | |||
TOTAL INVESTMENT PORTFOLIO - 96.8% (Cost $1,581,311) | 1,623,153 | ||
NET OTHER ASSETS (LIABILITIES) - 3.2% | 52,816 | ||
NET ASSETS - 100% | $ 1,675,969 | ||
Legend |
(a) Security initially issued in zero coupon form which converts to coupon form at a specified rate and date. The rate shown is the rate at period end. |
(b) Security or a portion of the security purchased on a delayed delivery or when-issued basis. |
(c) Coupon rates for floating and adjustable rate securities reflect the rates in effect at period end. |
(d) Private activity obligations whose interest is subject to the federal alternative minimum tax for individuals. |
(e) Security collateralized by an amount sufficient to pay interest and principal. |
Other Information |
All investments are categorized as Level 2 under the Fair Value Hierarchy. The inputs or methodology used for valuing securities may not be an indication of the risk associated with investing in those securities. For more information on valuation inputs, please refer to the Security Valuation section in the accompanying Notes to Financial Statements. |
The distribution of municipal securities by revenue source, as a percentage of total net assets, is as follows (Unaudited): |
General Obligations | 46.6% |
Health Care | 12.1% |
Transportation | 10.9% |
Education | 6.5% |
Others* (Individually Less Than 5%) | 23.9% |
| 100.0% |
*Includes net other assets |
Income Tax Information |
At February 28, 2011, the Fund had a capital loss carryforward of approximately $23,286,000 of which $21,327,000 and $1,959,000 will expire in fiscal 2017 and 2018, respectively. Capital loss carryforwards are only available to offset future capital gains of the Fund to the extent provided by regulations and may be limited. |
See accompanying notes which are an integral part of the financial statements.
Semiannual Report
Financial Statements
Statement of Assets and Liabilities
Amounts in thousands (except per-share amounts) | August 31, 2011 (Unaudited) | |
|
|
|
Assets | ||
Investment in securities, at value - See accompanying schedule: Unaffiliated issuers (cost $1,581,311) |
| $ 1,623,153 |
Cash | 43,490 | |
Receivable for fund shares sold | 839 | |
Interest receivable | 18,330 | |
Other receivables | 3 | |
Total assets | 1,685,815 | |
|
|
|
Liabilities | ||
Payable for investments purchased on a delayed delivery basis | $ 6,384 | |
Payable for fund shares redeemed | 521 | |
Distributions payable | 2,004 | |
Accrued management fee | 508 | |
Distribution and service plan fees payable | 27 | |
Other affiliated payables | 372 | |
Other payables and accrued expenses | 30 | |
Total liabilities | 9,846 | |
|
|
|
Net Assets | $ 1,675,969 | |
Net Assets consist of: |
| |
Paid in capital | $ 1,659,185 | |
Undistributed net investment income | 1,619 | |
Accumulated undistributed net realized gain (loss) on investments | (26,677) | |
Net unrealized appreciation (depreciation) on investments | 41,842 | |
Net Assets | $ 1,675,969 | |
See accompanying notes which are an integral part of the financial statements.
Semiannual Report
Financial Statements - continued
Statement of Assets and Liabilities - continued
Amounts in thousands (except per-share amounts) | August 31, 2011 (Unaudited) | |
|
|
|
Calculation of Maximum Offering Price | $ 12.15 | |
|
|
|
Maximum offering price per share (100/96.00 of $12.15) | $ 12.66 | |
Class T: | $ 12.18 | |
|
|
|
Maximum offering price per share (100/96.00 of $12.18) | $ 12.69 | |
Class B: | $ 12.14 | |
|
|
|
Class C: | $ 12.14 | |
|
|
|
|
|
|
California Municipal Income: | $ 12.14 | |
|
|
|
Institutional Class: | $ 12.16 | |
A Redemption price per share is equal to net asset value less any applicable contingent deferred sales charge.
See accompanying notes which are an integral part of the financial statements.
Semiannual Report
Statement of Operations
Amounts in thousands Six months ended August 31, 2011 (Unaudited) | ||
|
|
|
Investment Income |
|
|
Interest |
| $ 38,433 |
|
|
|
Expenses | ||
Management fee | $ 2,914 | |
Transfer agent fees | 574 | |
Distribution and service plan fees | 154 | |
Accounting fees and expenses | 150 | |
Custodian fees and expenses | 9 | |
Independent trustees' compensation | 3 | |
Registration fees | 68 | |
Audit | 24 | |
Legal | 6 | |
Miscellaneous | 12 | |
Total expenses before reductions | 3,914 | |
Expense reductions | (4) | 3,910 |
Net investment income (loss) | 34,523 | |
Realized and Unrealized Gain (Loss) Net realized gain (loss) on: | ||
Investment securities: |
|
|
Unaffiliated issuers |
| 519 |
Change in net unrealized appreciation (depreciation) on investment securities | 68,507 | |
Net gain (loss) | 69,026 | |
Net increase (decrease) in net assets resulting from operations | $ 103,549 | |
See accompanying notes which are an integral part of the financial statements.
Semiannual Report
Financial Statements - continued
Statement of Changes in Net Assets
Amounts in thousands | Six months ended August 31, 2011 (Unaudited) | Year ended |
Increase (Decrease) in Net Assets |
|
|
Operations |
|
|
Net investment income (loss) | $ 34,523 | $ 71,286 |
Net realized gain (loss) | 519 | (1,281) |
Change in net unrealized appreciation (depreciation) | 68,507 | (36,685) |
Net increase (decrease) in net assets resulting | 103,549 | 33,320 |
Distributions to shareholders from net investment income | (34,341) | (70,898) |
Distributions to shareholders from net realized gain | - | (100) |
Total distributions | (34,341) | (70,998) |
Share transactions - net increase (decrease) | 67,077 | (116,381) |
Redemption fees | 5 | 39 |
Total increase (decrease) in net assets | 136,290 | (154,020) |
|
|
|
Net Assets | ||
Beginning of period | 1,539,679 | 1,693,699 |
End of period (including undistributed net investment income of $1,619 and undistributed net investment income of $1,437, respectively) | $ 1,675,969 | $ 1,539,679 |
See accompanying notes which are an integral part of the financial statements.
Semiannual Report
Financial Highlights - Class A
| Six months ended August 31, 2011 | Years ended February 28, | ||||
| (Unaudited) | 2011 | 2010 | 2009 | 2008 G | 2007 |
Selected Per-Share Data |
|
|
|
|
| |
Net asset value, beginning of period | $ 11.64 | $ 11.89 | $ 11.40 | $ 11.63 | $ 12.41 | $ 12.46 |
Income from Investment Operations |
|
|
|
|
|
|
Net investment income (loss) E | .240 | .470 | .472 | .459 | .457 | .478 |
Net realized and unrealized gain (loss) | .509 | (.252) | .486 | (.224) | (.711) | .050 |
Total from investment operations | .749 | .218 | .958 | .235 | (.254) | .528 |
Distributions from net investment income | (.239) | (.467) | (.468) | (.461) | (.457) | (.483) |
Distributions from net realized gain | - | (.001) | - H | (.004) | (.069) | (.095) |
Total distributions | (.239) | (.468) | (.468) | (.465) | (.526) | (.578) |
Redemption fees added to paid in capital E, H | - | - | - | - | - | - |
Net asset value, end of period | $ 12.15 | $ 11.64 | $ 11.89 | $ 11.40 | $ 11.63 | $ 12.41 |
Total Return B, C, D | 6.50% | 1.79% | 8.57% | 2.04% | (2.15)% | 4.36% |
Ratios to Average Net Assets F |
|
|
|
|
| |
Expenses before reductions | .75% A | .75% | .77% | .75% | .73% | .64% |
Expenses net of fee waivers, if any | .75% A | .75% | .77% | .75% | .73% | .64% |
Expenses net of all reductions | .75% A | .74% | .77% | .74% | .70% | .62% |
Net investment income (loss) | 4.03% A | 3.93% | 4.05% | 3.98% | 3.76% | 3.88% |
Supplemental Data |
|
|
|
|
|
|
Net assets, end of period (in millions) | $ 43 | $ 40 | $ 44 | $ 34 | $ 20 | $ 13 |
Portfolio turnover rate | 8% A | 8% | 15% | 26% | 27% | 23% |
A Annualized
B Total returns for periods of less than one year are not annualized.
C Total returns would have been lower had certain expenses not been reduced during the periods shown.
D Total returns do not include the effect of the sales charges.
E Calculated based on average shares outstanding during the period.
F Expense ratios reflect operating expenses of the class. Expenses before reductions do not reflect amounts reimbursed by the investment adviser or reductions from expense offset arrangements and do not represent the amount paid by the class during periods when reimbursements or reductions occur. Expenses net of fee waivers reflect expenses after reimbursement by the investment adviser but prior to reductions from expense offset arrangements. Expenses net of all reductions represent the net expenses paid by the class.
G For the year ended February 29.
H Amount represents less than $.001 per share.
See accompanying notes which are an integral part of the financial statements.
Semiannual Report
Financial Highlights - Class T
| Six months ended August 31, 2011 | Years ended February 28, | ||||
| (Unaudited) | 2011 | 2010 | 2009 | 2008 G | 2007 |
Selected Per-Share Data |
|
|
|
|
| |
Net asset value, beginning of period | $ 11.67 | $ 11.91 | $ 11.42 | $ 11.65 | $ 12.43 | $ 12.48 |
Income from Investment Operations |
|
|
|
|
|
|
Net investment income (loss) E | .240 | .473 | .477 | .464 | .458 | .466 |
Net realized and unrealized gain (loss) | .508 | (.245) | .486 | (.227) | (.712) | .048 |
Total from investment operations | .748 | .228 | .963 | .237 | (.254) | .514 |
Distributions from net investment income | (.238) | (.467) | (.473) | (.463) | (.457) | (.469) |
Distributions from net realized gain | - | (.001) | - H | (.004) | (.069) | (.095) |
Total distributions | (.238) | (.468) | (.473) | (.467) | (.526) | (.564) |
Redemption fees added to paid in capitalE, H | - | - | - | - | - | - |
Net asset value, end of period | $ 12.18 | $ 11.67 | $ 11.91 | $ 11.42 | $ 11.65 | $ 12.43 |
Total Return B, C, D | 6.48% | 1.87% | 8.59% | 2.05% | (2.15)% | 4.24% |
Ratios to Average Net Assets F |
|
|
|
|
| |
Expenses before reductions | .76% A | .75% | .73% | .73% | .74% | .75% |
Expenses net of fee waivers, if any | .76% A | .75% | .73% | .73% | .74% | .75% |
Expenses net of all reductions | .76% A | .75% | .73% | .72% | .70% | .72% |
Net investment income (loss) | 4.02% A | 3.93% | 4.09% | 4.00% | 3.75% | 3.77% |
Supplemental Data |
|
|
|
|
|
|
Net assets, end of period (in millions) | $ 4 | $ 4 | $ 6 | $ 7 | $ 5 | $ 5 |
Portfolio turnover rate | 8% A | 8% | 15% | 26% | 27% | 23% |
A Annualized
B Total returns for periods of less than one year are not annualized.
C Total returns would have been lower had certain expenses not been reduced during the periods shown.
D Total returns do not include the effect of the sales charges.
E Calculated based on average shares outstanding during the period.
F Expense ratios reflect operating expenses of the class. Expenses before reductions do not reflect amounts reimbursed by the investment adviser or reductions from expense offset arrangements and do not represent the amount paid by the class during periods when reimbursements or reductions occur. Expenses net of fee waivers reflect expenses after reimbursement by the investment adviser but prior to reductions from expense offset arrangements. Expenses net of all reductions represent the net expenses paid by the class.
G For the year ended February 29.
H Amount represents less than $.001 per share.
See accompanying notes which are an integral part of the financial statements.
Semiannual Report
Financial Highlights - Class B
| Six months ended August 31, 2011 | Years ended February 28, | ||||
| (Unaudited) | 2011 | 2010 | 2009 | 2008 G | 2007 |
Selected Per-Share Data |
|
|
|
|
| |
Net asset value, beginning of period | $ 11.63 | $ 11.88 | $ 11.39 | $ 11.62 | $ 12.40 | $ 12.45 |
Income from Investment Operations |
|
|
|
|
|
|
Net investment income (loss) E | .203 | .395 | .397 | .387 | .376 | .383 |
Net realized and unrealized gain (loss) | .509 | (.253) | .488 | (.228) | (.712) | .049 |
Total from investment operations | .712 | .142 | .885 | .159 | (.336) | .432 |
Distributions from net investment income | (.202) | (.391) | (.395) | (.385) | (.375) | (.387) |
Distributions from net realized gain | - | (.001) | - H | (.004) | (.069) | (.095) |
Total distributions | (.202) | (.392) | (.395) | (.389) | (.444) | (.482) |
Redemption fees added to paid in capitalE, H | - | - | - | - | - | - |
Net asset value, end of period | $ 12.14 | $ 11.63 | $ 11.88 | $ 11.39 | $ 11.62 | $ 12.40 |
Total Return B, C, D | 6.17% | 1.15% | 7.90% | 1.38% | (2.81)% | 3.57% |
Ratios to Average Net Assets F |
|
|
|
|
| |
Expenses before reductions | 1.37% A | 1.38% | 1.40% | 1.41% | 1.41% | 1.41% |
Expenses net of fee waivers, if any | 1.37% A | 1.38% | 1.40% | 1.41% | 1.41% | 1.41% |
Expenses net of all reductions | 1.37% A | 1.38% | 1.40% | 1.40% | 1.37% | 1.39% |
Net investment income (loss) | 3.41% A | 3.29% | 3.42% | 3.33% | 3.08% | 3.11% |
Supplemental Data |
|
|
|
|
|
|
Net assets, end of period (in millions) | $ 2 | $ 2 | $ 3 | $ 4 | $ 5 | $ 5 |
Portfolio turnover rate | 8% A | 8% | 15% | 26% | 27% | 23% |
A Annualized
B Total returns for periods of less than one year are not annualized.
C Total returns would have been lower had certain expenses not been reduced during the periods shown.
D Total returns do not include the effect of the contingent deferred sales charge.
E Calculated based on average shares outstanding during the period.
F Expense ratios reflect operating expenses of the class. Expenses before reductions do not reflect amounts reimbursed by the investment adviser or reductions from expense offset arrangements and do not represent the amount paid by the class during periods when reimbursements or reductions occur. Expenses net of fee waivers reflect expenses after reimbursement by the investment adviser but prior to reductions from expense offset arrangements. Expenses net of all reductions represent the net expenses paid by the class.
G For the year ended February 29.
H Amount represents less than $.001 per share.
See accompanying notes which are an integral part of the financial statements.
Semiannual Report
Financial Highlights - Class C
| Six months ended August 31, 2011 | Years ended February 28, | ||||
| (Unaudited) | 2011 | 2010 | 2009 | 2008 G | 2007 |
Selected Per-Share Data |
|
|
|
|
| |
Net asset value, beginning of period | $ 11.62 | $ 11.87 | $ 11.38 | $ 11.61 | $ 12.40 | $ 12.44 |
Income from Investment Operations |
|
|
|
|
|
|
Net investment income (loss) E | .194 | .378 | .384 | .374 | .364 | .371 |
Net realized and unrealized gain (loss) | .519 | (.252) | .488 | (.225) | (.721) | .061 |
Total from investment operations | .713 | .126 | .872 | .149 | (.357) | .432 |
Distributions from net investment income | (.193) | (.376) | (.382) | (.375) | (.364) | (.377) |
Distributions from net realized gain | - | (.001) | - H | (.004) | (.069) | (.095) |
Total distributions | (.193) | (.376) I | (.382) | (.379) | (.433) | (.472) |
Redemption fees added to paid in capitalE, H | - | - | - | - | - | - |
Net asset value, end of period | $ 12.14 | $ 11.62 | $ 11.87 | $ 11.38 | $ 11.61 | $ 12.40 |
Total Return B, C, D | 6.19% | 1.02% | 7.78% | 1.29% | (2.98)% | 3.56% |
Ratios to Average Net Assets F |
|
|
|
|
| |
Expenses before reductions | 1.52% A | 1.51% | 1.51% | 1.49% | 1.50% | 1.50% |
Expenses net of fee waivers, if any | 1.52% A | 1.51% | 1.51% | 1.49% | 1.50% | 1.50% |
Expenses net of all reductions | 1.52% A | 1.51% | 1.51% | 1.48% | 1.47% | 1.48% |
Net investment income (loss) | 3.26% A | 3.16% | 3.30% | 3.24% | 2.99% | 3.02% |
Supplemental Data |
|
|
|
|
|
|
Net assets, end of period (in millions) | $ 19 | $ 17 | $ 19 | $ 12 | $ 8 | $ 10 |
Portfolio turnover rate | 8% A | 8% | 15% | 26% | 27% | 23% |
A Annualized
B Total returns for periods of less than one year are not annualized.
C Total returns would have been lower had certain expenses not been reduced during the periods shown.
D Total returns do not include the effect of the contingent deferred sales charge.
E Calculated based on average shares outstanding during the period.
F Expense ratios reflect operating expenses of the class. Expenses before reductions do not reflect amounts reimbursed by the investment adviser or reductions from expense offset arrangements and do not represent the amount paid by the class during periods when reimbursements or reductions occur. Expenses net of fee waivers reflect expenses after reimbursement by the investment adviser but prior to reductions from expense offset arrangements. Expenses net of all reductions represent the net expenses paid by the class.
G For the year ended February 29.
H Amount represents less than $.001 per share.
I Total distributions of $.376 per share is comprised of distributions from net investment income of $.3757 and distributions from net realized gain of $.0007 per share.
See accompanying notes which are an integral part of the financial statements.
Semiannual Report
Financial Highlights - California Municipal Income
| Six months ended August 31, 2011 | Years ended February 28, | ||||
| (Unaudited) | 2011 | 2010 | 2009 | 2008 F | 2007 |
Selected Per-Share Data |
|
|
|
|
| |
Net asset value, beginning of period | $ 11.63 | $ 11.88 | $ 11.38 | $ 11.61 | $ 12.40 | $ 12.45 |
Income from Investment Operations |
|
|
|
|
|
|
Net investment income (loss) D | .257 | .504 | .506 | .495 | .491 | .499 |
Net realized and unrealized gain (loss) | .509 | (.252) | .497 | (.227) | (.722) | .050 |
Total from investment operations | .766 | .252 | 1.003 | .268 | (.231) | .549 |
Distributions from net investment income | (.256) | (.501) | (.503) | (.494) | (.490) | (.504) |
Distributions from net realized gain | - | (.001) | - G | (.004) | (.069) | (.095) |
Total distributions | (.256) | (.502) | (.503) | (.498) | (.559) | (.599) |
Redemption fees added to paid in capital D, G | - | - | - | - | - | - |
Net asset value, end of period | $ 12.14 | $ 11.63 | $ 11.88 | $ 11.38 | $ 11.61 | $ 12.40 |
Total Return B, C | 6.66% | 2.08% | 9.00% | 2.33% | (1.97)% | 4.55% |
Ratios to Average Net Assets E |
|
|
|
|
| |
Expenses before reductions | .47% A | .46% | .47% | .47% | .46% | .47% |
Expenses net of fee waivers, if any | .47% A | .46% | .47% | .47% | .46% | .47% |
Expenses net of all reductions | .46% A | .46% | .47% | .46% | .43% | .44% |
Net investment income (loss) | 4.32% A | 4.21% | 4.34% | 4.27% | 4.03% | 4.05% |
Supplemental Data |
|
|
|
|
|
|
Net assets, end of period (in millions) | $ 1,580 | $ 1,456 | $ 1,560 | $ 1,427 | $ 1,543 | $ 1,611 |
Portfolio turnover rate | 8% A | 8% | 15% | 26% | 27% | 23% |
A Annualized
B Total returns for periods of less than one year are not annualized.
C Total returns would have been lower had certain expenses not been reduced during the periods shown.
D Calculated based on average shares outstanding during the period.
E Expense ratios reflect operating expenses of the class. Expenses before reductions do not reflect amounts reimbursed by the investment adviser or reductions from expense offset arrangements and do not represent the amount paid by the class during periods when reimbursements or reductions occur. Expenses net of fee waivers reflect expenses after reimbursement by the investment adviser but prior to reductions from expense offset arrangements. Expenses net of all reductions represent the net expenses paid by the class.
F For the year ended February 29.
G Amount represents less than $.001 per share.
See accompanying notes which are an integral part of the financial statements.
Semiannual Report
Financial Highlights - Institutional Class
| Six months ended August 31, 2011 | Years ended February 28, | ||||
| (Unaudited) | 2011 | 2010 | 2009 | 2008 F | 2007 |
Selected Per-Share Data |
|
|
|
|
| |
Net asset value, beginning of period | $ 11.65 | $ 11.90 | $ 11.40 | $ 11.63 | $ 12.42 | $ 12.47 |
Income from Investment Operations |
|
|
|
|
|
|
Net investment income (loss) D | .254 | .500 | .503 | .491 | .486 | .493 |
Net realized and unrealized gain (loss) | .508 | (.255) | .496 | (.226) | (.722) | .049 |
Total from investment operations | .762 | .245 | .999 | .265 | (.236) | .542 |
Distributions from net investment income | (.252) | (.495) | (.499) | (.491) | (.485) | (.497) |
Distributions from net realized gain | - | (.001) | - G | (.004) | (.069) | (.095) |
Total distributions | (.252) | (.495)H | (.499) | (.495) | (.554) | (.592) |
Redemption fees added to paid in capital D, G | - | - | - | - | - | - |
Net asset value, end of period | $ 12.16 | $ 11.65 | $ 11.90 | $ 11.40 | $ 11.63 | $ 12.42 |
Total Return B, C | 6.61% | 2.02% | 8.94% | 2.30% | (2.00)% | 4.48% |
Ratios to Average Net Assets E |
|
|
|
|
| |
Expenses before reductions | .53% A | .51% | .51% | .49% | .50% | .53% |
Expenses net of fee waivers, if any | .53% A | .51% | .51% | .49% | .50% | .53% |
Expenses net of all reductions | .53% A | .51% | .51% | .48% | .47% | .50% |
Net investment income (loss) | 4.26% A | 4.16% | 4.31% | 4.24% | 3.99% | 3.99% |
Supplemental Data |
|
|
|
|
|
|
Net assets, end of period (in millions) | $ 27 | $ 21 | $ 62 | $ 19 | $ 11 | $ 8 |
Portfolio turnover rate | 8% A | 8% | 15% | 26% | 27% | 23% |
A Annualized
B Total returns for periods of less than one year are not annualized.
C Total returns would have been lower had certain expenses not been reduced during the periods shown.
D Calculated based on average shares outstanding during the period.
E Expense ratios reflect operating expenses of the class. Expenses before reductions do not reflect amounts reimbursed by the investment adviser or reductions from expense offset arrangements and do not represent the amount paid by the class during periods when reimbursements or reductions occur. Expenses net of fee waivers reflect expenses after reimbursement by the investment adviser but prior to reductions from expense offset arrangements. Expenses net of all reductions represent the net expenses paid by the class.
F For the year ended February 29.
G Amount represents less than $.001 per share.
H Total distributions of $.495 per share is comprised of distributions from net investment income of $.4945 and distributions from net realized gain of $.0007 per share.
See accompanying notes which are an integral part of the financial statements.
Semiannual Report
Notes to Financial Statements
For the period ended August 31, 2011 (Unaudited)
(Amounts in thousands except ratios)
1. Organization.
Fidelity California Municipal Income Fund (the Fund) is a non-diversified fund of Fidelity California Municipal Trust (the Trust) and is authorized to issue an unlimited number of shares. The Trust is registered under the Investment Company Act of 1940, as amended (the 1940 Act), as an open-end management investment company organized as a Massachusetts business trust. The Fund offers Class A, Class T, Class C, California Municipal Income and Institutional Class shares, each of which, along with Class B shares, has equal rights as to assets and voting privileges. Effective after the close of business on September 1, 2010, Class B shares were closed to new accounts and additional purchases, except for exchanges and reinvestments by existing shareholders. Each class has exclusive voting rights with respect to matters that affect that class. Class B shares will automatically convert to Class A shares after a holding period of seven years from the initial date of purchase. Investment income, realized and unrealized capital gains and losses, the common expenses of the Fund, and certain fund-level expense reductions, if any, are allocated on a pro-rata basis to each class based on the relative net assets of each class to the total net assets of the Fund. Each class differs with respect to transfer agent and distribution and service plan fees incurred. Certain expense reductions may also differ by class. The Fund may be affected by economic and political developments in the state of California.
2. Significant Accounting Policies.
The financial statements have been prepared in conformity with accounting principles generally accepted in the United States of America (GAAP), which require management to make certain estimates and assumptions at the date of the financial statements. Actual results could differ from those estimates. Subsequent events, if any, through the date that the financial statements were issued have been evaluated in the preparation of the financial statements. The following summarizes the significant accounting policies of the Fund:
Security Valuation. Investments are valued as of 4:00 p.m. Eastern time on the last calendar day of the period. The Fund uses independent pricing services approved by the Board of Trustees to value its investments. When current market prices or quotations are not readily available or reliable, valuations may be determined in good faith in accordance with procedures adopted by the Board of Trustees. Factors used in determining value may include market or security specific events, changes in interest rates and credit quality. The frequency with which these procedures are used cannot be predicted and they may be utilized to a significant extent. The value used for net asset value (NAV) calculation under these procedures may differ from published prices for the same securities.
Semiannual Report
2. Significant Accounting Policies - continued
Security Valuation - continued
The Fund categorizes the inputs to valuation techniques used to value its investments into a disclosure hierarchy consisting of three levels as shown below:
Level 1 - quoted prices in active markets for identical investments
Level 2 - other significant observable inputs (including quoted prices for similar investments, interest rates, prepayment speeds, etc.)
Level 3 - unobservable inputs (including the Fund's own assumptions based on the best information available)
Changes in valuation techniques may result in transfers in or out of an assigned level within the disclosure hierarchy. Valuation techniques used to value the Fund's investments by major category are as follows:
Debt securities, including restricted securities, are valued based on evaluated prices received from independent pricing services or from dealers who make markets in such securities. For municipal securities, pricing services utilize matrix pricing which considers yield or price of bonds of comparable quality, coupon, maturity and type as well as dealer supplied prices and are generally categorized as Level 2 in the hierarchy. When independent prices are unavailable or unreliable, debt securities may be valued utilizing pricing matrices which consider similar factors that would be used by independent pricing services. These are generally categorized as Level 2 in the hierarchy but may be Level 3 depending on the circumstances.
Investment Transactions and Income. For financial reporting purposes, the Fund's investment holdings and NAV include trades executed through the end of the last business day of the period. The NAV per share for processing shareholder transactions is calculated as of the close of business of the New York Stock Exchange (NYSE), normally 4:00 p.m. Eastern time and includes trades executed through the end of the prior business day. Gains and losses on securities sold are determined on the basis of identified cost. Interest income is accrued as earned. Interest income includes coupon interest and amortization of premium and accretion of discount on debt securities.
Expenses. Expenses directly attributable to a fund are charged to that fund. Expenses attributable to more than one fund are allocated among the respective funds on the basis of relative net assets or other appropriate methods. Expense estimates are accrued in the period to which they relate and adjustments are made when actual amounts are known.
Semiannual Report
Notes to Financial Statements (Unaudited) - continued
(Amounts in thousands except ratios)
2. Significant Accounting Policies - continued
Income Tax Information and Distributions to Shareholders. Each year, the Fund intends to qualify as a regulated investment company, including distributing substantially all of its taxable income and realized gains under Subchapter M of the Internal Revenue Code and filing its U.S. federal tax return. As a result, no provision for income taxes is required. A fund's federal tax return is subject to examination by the Internal Revenue Service (IRS) for a period of three years.
Dividends are declared and recorded daily and paid monthly from net investment income. Distributions from realized gains, if any, are declared and recorded on the ex-dividend date. Income dividends and capital gain distributions are declared separately for each class. Income and capital gain distributions are determined in accordance with income tax regulations, which may differ from GAAP.
Capital accounts within the financial statements are adjusted for permanent book-tax differences. These adjustments have no impact on net assets or the results of operations. Temporary book-tax differences will reverse in a subsequent period.
Book-tax differences are primarily due to market discount, deferred trustees compensation, capital loss carryforwards, losses deferred due to futures transactions and excise tax regulations.
The Fund purchases municipal securities whose interest, in the opinion of the issuer, is free from federal income tax. There is no assurance that the IRS will agree with this opinion. In the event the IRS determines that the issuer does not comply with relevant tax requirements, interest payments from a security could become federally taxable, possibly retroactively to the date the security was issued.
The federal tax cost of investment securities and unrealized appreciation (depreciation) as of period end were as follows:
Gross unrealized appreciation | $ 66,577 |
Gross unrealized depreciation | (23,185) |
Net unrealized appreciation (depreciation) on securities and other investments | $ 43,392 |
|
|
Tax cost | $ 1,579,761 |
Under the recently enacted Regulated Investment Company Modernization Act of 2010 (the Act), the Fund will be permitted to carry forward capital losses incurred in taxable years beginning after December 22, 2010 for an unlimited period. However, any losses incurred during those future taxable years will be required to be utilized prior to any losses incurred in pre-enactment taxable years, which generally expire after eight years from when they are incurred. Additionally, post-enactment capital losses that are carried
Semiannual Report
2. Significant Accounting Policies - continued
Income Tax Information and Distributions to Shareholders - continued
forward will retain their character as either short-term or long-term capital losses rather than being considered all short-term as under previous law. The Fund's first fiscal year end subject to the Act will be February 28, 2012.
Short-Term Trading (Redemption) Fees. Shares held by investors in the Fund less than 30 days are subject to a redemption fee equal to .50% of the net asset value of shares redeemed. All redemption fees, which reduce the proceeds of the shareholder redemption, are retained by the Fund and accounted for as an addition to paid in capital.
3. Operating Policies.
Delayed Delivery Transactions and When-Issued Securities. During the period, the Fund transacted in securities on a delayed delivery or when-issued basis. Payment and delivery may take place after the customary settlement period for that security. The price of the underlying securities and the date when the securities will be delivered and paid for are fixed at the time the transaction is negotiated. During the time a delayed delivery sell is outstanding, the contract is marked-to-market daily and equivalent deliverable securities are held for the transaction. The securities purchased on a delayed delivery or when-issued basis are identified as such in the Fund's Schedule of Investments. The Fund may receive compensation for interest forgone in the purchase of a delayed delivery or when-issued security. With respect to purchase commitments, the Fund identifies securities as segregated in its records with a value at least equal to the amount of the commitment. Losses may arise due to changes in the value of the underlying securities or if the counterparty does not perform under the contract's terms, or if the issuer does not issue the securities due to political, economic, or other factors.
4. Purchases and Sales of Investments.
Purchases and sales of securities, other than short-term securities, aggregated $86,817 and $63,354, respectively.
5. Fees and Other Transactions with Affiliates.
Management Fee. Fidelity Management & Research Company (FMR) and its affiliates provide the Fund with investment management related services for which the Fund pays a monthly management fee. The management fee is the sum of an individual fund fee rate that is based on an annual rate of .25% of the Fund's average net assets and a group fee rate that averaged .11% during the period. The group fee rate is based upon the average net assets of all the mutual funds advised by FMR. The group fee rate decreases as assets under management increase and increases as assets under management decrease. For the period, the total annualized management fee rate was .36% of the Fund's average net assets.
Semiannual Report
Notes to Financial Statements (Unaudited) - continued
(Amounts in thousands except ratios)
5. Fees and Other Transactions with Affiliates - continued
Distribution and Service Plan Fees. In accordance with Rule 12b-1 of the 1940 Act, the Fund has adopted separate Distribution and Service Plans for each class of shares. Certain classes pay Fidelity Distributors Corporation (FDC), an affiliate of FMR, separate Distribution and Service Fees, each of which is based on an annual percentage of each class' average net assets. In addition, FDC may pay financial intermediaries for selling shares of the Fund and providing shareholder support services. For the period, the Distribution and Service Fee rates, total fees and amounts retained by FDC were as follows:
| Distribution | Service | Total Fees | Retained |
Class A | -% | .25% | $ 52 | $ 5 |
Class T | -% | .25% | 5 | - |
Class B | .65% | .25% | 8 | 6 |
Class C | .75% | .25% | 89 | 19 |
|
|
| $ 154 | $ 30 |
Sales Load. FDC may receive a front-end sales charge of up to 4.00% for selling Class A shares and Class T shares, some of which is paid to financial intermediaries for selling shares of the Fund. Depending on the holding period, FDC may receive contingent deferred sales charges levied on Class A, Class T, Class B, and Class C redemptions. The deferred sales charges range from 5% to 1% for Class B, 1% for Class C, .75% for certain purchases of Class A shares and .25% for certain purchases of Class T shares.
For the period, sales charge amounts retained by FDC were as follows:
| Retained |
Class A | $ 5 |
Class T | -** |
Class B* | 2 |
Class C* | 1 |
| $ 8 |
* When Class B and Class C shares are initially sold, FDC pays commissions from its own resources to financial intermediaries through which the sales are made.
** Amount represents one hundred sixty dollars.
Transfer Agent and Accounting Fees. Citibank, N.A. (Citibank) is the custodian, transfer agent, and servicing agent for the Fund's Class A, Class T, Class B, Class C, California Municipal Income and Institutional Class shares. Citibank has entered into a sub-arrangement with Fidelity Investments Institutional Operations Company, Inc. (FIIOC), an affiliate of FMR, with respect to all classes of the Fund, to perform the transfer agency, dividend disbursing, and shareholder servicing functions. FIIOC
Semiannual Report
5. Fees and Other Transactions with Affiliates - continued
Transfer Agent and Accounting Fees - continued
receives account fees and asset-based fees that vary according to the account size and type of account of the shareholders of the respective classes of the Fund. All fees are paid to FIIOC by Citibank, which is reimbursed by each class for such payments. FIIOC pays for typesetting, printing and mailing of shareholder reports, except proxy statements. For the period, transfer agent fees for each class were as follows:
| Amount | % of |
Class A | $ 23 | .11 |
Class T | 2 | .12 |
Class B | 1 | .08 |
Class C | 12 | .13 |
California Municipal Income | 520 | .07 |
Institutional Class | 16 | .13 |
| $ 574 |
|
* Annualized
Citibank also has a sub-arrangement with Fidelity Service Company, Inc. (FSC), an affiliate of FMR, under which FSC maintains the Fund's accounting records. The fee is based on the level of average net assets for the month.
6. Committed Line of Credit.
The Fund participates with other funds managed by FMR or an affiliate in a $4.0 billion credit facility (the "line of credit") to be utilized for temporary or emergency purposes to fund shareholder redemptions or for other short-term liquidity purposes. The Fund has agreed to pay commitment fees on its pro-rata portion of the line of credit, which amounted to $2 and is reflected in Miscellaneous expenses on the Statement of Operations. During the period, there were no borrowings on this line of credit.
7. Expense Reductions.
Through arrangements with the Fund's custodian, credits realized as a result of uninvested cash balances were used to reduce the Fund's expenses. During the period, these credits reduced the Fund's custody expenses by $4.
Semiannual Report
Notes to Financial Statements (Unaudited) - continued
(Amounts in thousands except ratios)
8. Distributions to Shareholders.
Distributions to shareholders of each class were as follows:
Six months ended | Year ended | |
From net investment income |
|
|
Class A | $ 829 | $ 1,696 |
Class T | 82 | 218 |
Class B | 31 | 81 |
Class C | 292 | 603 |
California Municipal Income | 32,600 | 66,826 |
Institutional Class | 507 | 1,474 |
Total | $ 34,341 | $ 70,898 |
From net realized gain |
|
|
Class A | $ - | $ 3 |
Class T | - | -* |
Class B | - | -* |
Class C | - | 1 |
California Municipal Income | - | 95 |
Institutional Class | - | 1 |
Total | $ - | $ 100 |
* Amount represents less than $1,000
9. Share Transactions.
Transactions for each class of shares were as follows:
| Shares | Dollars | ||
Six months ended | Year ended | Six months ended | Year ended | |
Class A |
|
|
|
|
Shares sold | 665 | 1,131 | $ 7,879 | $ 13,594 |
Reinvestment of distributions | 48 | 97 | 576 | 1,160 |
Shares redeemed | (548) | (1,496) | (6,515) | (17,712) |
Net increase (decrease) | 165 | (268) | $ 1,940 | $ (2,958) |
Class T |
|
|
|
|
Shares sold | 30 | 64 | $ 362 | $ 770 |
Reinvestment of distributions | 6 | 14 | 69 | 172 |
Shares redeemed | (28) | (259) | (333) | (3,101) |
Net increase (decrease) | 8 | (181) | $ 98 | $ (2,159) |
Class B |
|
|
|
|
Shares sold | 3 | 31 | $ 24 | $ 375 |
Reinvestment of distributions | 1 | 3 | 14 | 36 |
Shares redeemed | (21) | (87) | (244) | (1,030) |
Net increase (decrease) | (17) | (53) | $ (206) | $ (619) |
Semiannual Report
9. Share Transactions - continued
| Shares | Dollars | ||
Six months ended | Year ended | Six months ended | Year ended | |
Class C |
|
|
|
|
Shares sold | 203 | 503 | $ 2,425 | $ 6,012 |
Reinvestment of distributions | 15 | 29 | 175 | 350 |
Shares redeemed | (105) | (659) | (1,236) | (7,787) |
Net increase (decrease) | 113 | (127) | $ 1,364 | $ (1,425) |
California Municipal Income |
|
|
|
|
Shares sold | 13,001 | 30,469 | $ 153,825 | $ 363,379 |
Reinvestment of distributions | 1,805 | 3,784 | 21,393 | 45,282 |
Shares redeemed | (9,827) | (40,406) | (116,062) | (476,687) |
Net increase (decrease) | 4,979 | (6,153) | $ 59,156 | $ (68,026) |
Institutional Class |
|
|
|
|
Shares sold | 591 | 1,709 | $ 6,983 | $ 20,475 |
Reinvestment of distributions | 25 | 46 | 301 | 554 |
Shares redeemed | (216) | (5,174) | (2,559) | (62,223) |
Net increase (decrease) | 400 | (3,419) | $ 4,725 | $ (41,194) |
10. Other.
The Fund's organizational documents provide former and current trustees and officers with a limited indemnification against liabilities arising in connection with the performance of their duties to the Fund. In the normal course of business, the Fund may also enter into contracts that provide general indemnifications. The Fund's maximum exposure under these arrangements is unknown as this would be dependent on future claims that may be made against the Fund. The risk of material loss from such claims is considered remote.
Semiannual Report
Managing Your Investments
Fidelity offers several ways to conveniently manage your personal investments via your telephone or PC. You can access your account information, conduct trades and research your investments 24 hours a day.
By Phone
Fidelity Automated Service Telephone provides a single toll-free number to access account balances, positions, quotes and trading. It's easy to navigate the service, and on your first call, the system will help you create a personal identification number (PIN) for security.
(phone_graphic)Fidelity Automated
Service Telephone (FAST®)
1-800-544-5555
Press
 For mutual fund and brokerage trading.
 For quotes.*
 For account balances and holdings.
 To review orders and mutual
fund activity.
 To change your PIN.

 To speak to a Fidelity representative.
By PC
Fidelity's web site on the Internet provides a wide range of information, including daily financial news, fund performance, interactive planning tools and news about Fidelity products and services.
(computer_graphic)Fidelity's Web Site
www.fidelity.com
* When you call the quotes line, please remember that a fund's yield and return will vary and, except for money market funds, share price will also vary. This means that you may have a gain or loss when you sell your shares. There is no assurance that money market funds will be able to maintain a stable $1 share price; an investment in a money market fund is not insured or guaranteed by the U.S. government. Total returns are historical and include changes in share price, reinvestment of dividends and capital gains distributions, and the effects of any sales charges.
Semiannual Report
To Visit Fidelity
For directions and hours,
please call 1-800-544-9797.
Arizona
7001 West Ray Road
Chandler, AZ
15445 N. Scottsdale Road
Scottsdale, AZ
17550 North 75th Avenue
Glendale, AZ
5330 E. Broadway Blvd
Tucson, AZ
California
815 East Birch Street
Brea, CA
1411 Chapin Avenue
Burlingame, CA
851 East Hamilton Avenue
Campbell, CA
601 Larkspur Landing Circle
Larkspur, CA
2000 Avenue of the Stars
Los Angeles, CA
27101 Puerta Real
Mission Viejo, CA
73575 El Paseo
Palm Desert, CA
251 University Avenue
Palo Alto, CA
123 South Lake Avenue
Pasadena, CA
16656 Bernardo Ctr. Drive
Rancho Bernardo, CA
1220 Roseville Parkway
Roseville, CA
1740 Arden Way
Sacramento, CA
7676 Hazard Center Drive
San Diego, CA
11943 El Camino Real
San Diego, CA
8 Montgomery Street
San Francisco, CA
3793 State Street
Santa Barbara, CA
1200 Wilshire Boulevard
Santa Monica, CA
398 West El Camino Real
Sunnyvale, CA
111 South Westlake Blvd
Thousand Oaks, CA
21701 Hawthorne Boulevard
Torrance, CA
2001 North Main Street
Walnut Creek, CA
6326 Canoga Avenue
Woodland Hills, CA
2211 Michelson Drive
Irvine, CA
Colorado
281 East Flatiron Circle
Broomfield, CO
1625 Broadway
Denver, CO
9185 Westview Road
Lone Tree, CO
Connecticut
48 West Putnam Avenue
Greenwich, CT
265 Church Street
New Haven, CT
300 Atlantic Street
Stamford, CT
29 South Main Street
West Hartford, CT
1261 Post Road
Fairfield, CT
Delaware
400 Delaware Avenue
Wilmington, DE
Florida
175 East Altamonte Drive
Altamonte Springs, FL
1400 Glades Road
Boca Raton, FL
121 Alhambra Plaza
Coral Gables, FL
2948 N. Federal Highway
Ft. Lauderdale, FL
4671 Town Center Parkway
Jacksonville, FL
8880 Tamiami Trail, North
Naples, FL
230 Royal Palm Way
Palm Beach, FL
3501 PGA Boulevard
Palm Beach Gardens, FL
3550 Tamiami Trail, South
Sarasota, FL
1502 N. Westshore Blvd.
Tampa, FL
2465 State Road 7
Wellington, FL
Georgia
3242 Peachtree Road
Atlanta, GA
1000 Abernathy Road
Atlanta, GA
Illinois
One North LaSalle Street
Chicago, IL
401 North Michigan Avenue
Chicago, IL
One Skokie Valley Road
Highland Park, IL
1415 West 22nd Street
Oak Brook, IL
15105 S LaGrange Road
Orland Park, IL
1572 East Golf Road
Schaumburg, IL
1823 Freedom Drive
Naperville, IL
Indiana
8480 Keystone Crossing
Indianapolis, IN
Kansas
5400 College Boulevard
Overland Park, KS
Maine
Three Canal Plaza
Portland, ME
Maryland
7315 Wisconsin Avenue
Bethesda, MD
610 York Road
Towson, MD
Massachusetts
801 Boylston Street
Boston, MA
155 Congress Street
Boston, MA
300 Granite Street
Braintree, MA
44 Mall Road
Burlington, MA
238 Main Street
Cambridge, MA
200 Endicott Street
Danvers, MA
Fidelity Brokerage Services, Inc., 100 Summer St., Boston, MA 02110 Member NYSE/SIPC
Semiannual Report
405 Cochituate Road
Framingham, MA
551 Boston Turnpike
Shrewsbury, MA
Michigan
500 E. Eisenhower Pkwy.
Ann Arbor, MI
280 N. Old Woodward Ave.
Birmingham, MI
30200 Northwestern Hwy.
Farmington Hills, MI
43420 Grand River Avenue
Novi, MI
3480 28th Street
Grand Rapids, MI
2425 S. Linden Road STE E
Flint, MI
Minnesota
7740 France Avenue South
Edina, MN
8342 3rd Street North
Oakdale, MN
Missouri
1524 South Lindbergh Blvd.
St. Louis, MO
Nevada
2225 Village Walk Drive
Henderson, NV
New Jersey
501 Route 73 South
Marlton, NJ
150 Essex Street
Millburn, NJ
35 Morris Street
Morristown, NJ
396 Route 17, North
Paramus, NJ
3518 Route 1 North
Princeton, NJ
530 Broad Street
Shrewsbury, NJ
New Mexico
2261 Q Street NE
Albuquerque, NM
New York
1130 Franklin Avenue
Garden City, NY
37 West Jericho Turnpike
Huntington Station, NY
1271 Avenue of the Americas
New York, NY
980 Madison Avenue
New York, NY
61 Broadway
New York, NY
350 Park Avenue
New York, NY
200 Fifth Avenue
New York, NY
733 Third Avenue
New York, NY
2070 Broadway
New York, NY
1075 Northern Blvd.
Roslyn, NY
799 Central Park Avenue
Scarsdale, NY
3349 Monroe Avenue
Rochester, NY
North Carolina
4611 Sharon Road
Charlotte, NC
7011 Fayetteville Road
Durham, NC
Ohio
3805 Edwards Road
Cincinnati, OH
1324 Polaris Parkway
Columbus, OH
1800 Crocker Road
Westlake, OH
28699 Chagrin Boulevard
Woodmere Village, OH
Oregon
7493 SW Bridgeport Road
Tigard, OR
Pennsylvania
600 West DeKalb Pike
King of Prussia, PA
1735 Market Street
Philadelphia, PA
12001 Perry Highway
Wexford, PA
Rhode Island
10 Memorial Boulevard
Providence, RI
Tennessee
3018 Peoples Street
Johnson City, TN
7628 West Farmington Blvd.
Germantown, TN
2035 Mallory Lane
Franklin, TN
Texas
10000 Research Boulevard
Austin, TX
4001 Northwest Parkway
Dallas, TX
12532 Memorial Drive
Houston, TX
2701 Drexel Drive
Houston, TX
6560 Fannin Street
Houston, TX
1701 Lake Robbins Drive
The Woodlands, TX
6500 N. MacArthur Blvd.
Irving, TX
6005 West Park Boulevard
Plano, TX
1576 East Southlake Blvd.
Southlake, TX
15600 Southwest Freeway
Sugar Land, TX
139 N. Loop 1604 East
San Antonio, TX
Utah
279 West South Temple
Salt Lake City, UT
Virginia
1861 International Drive
McLean, VA
11957 Democracy Drive
Reston, VA
Washington
10500 NE 8th Street
Bellevue, WA
1518 6th Avenue
Seattle, WA
304 Strander Blvd
Tukwila, WA
Washington, DC
1900 K Street, N.W.
Washington, DC
Wisconsin
16020 West Bluemound Road
Brookfield, WI
Semiannual Report
To Write Fidelity
We'll give your correspondence immediate attention and send you written confirmation upon completion of your request.
(letter_graphic)Making Changes
To Your Account
(such as changing name, address, bank, etc.)
Fidelity Investments
P.O. Box 770001
Cincinnati, OH 45277-0002
(letter_graphic)For Non-Retirement
Accounts
Buying shares
Fidelity Investments
P.O. Box 770001
Cincinnati, OH 45277-0003
Overnight Express
Fidelity Investments
Attn: Distribution Services
100 Crosby Parkway - KC1H
Covington, KY 41015
Selling shares
Fidelity Investments
P.O. Box 770001
Cincinnati, OH 45277-0035
Overnight Express
Fidelity Investments
Attn: Distribution Services
100 Crosby Parkway - KC1H
Covington, KY 41015
General Correspondence
Fidelity Investments
P.O. Box 500
Merrimack, NH 03054-0500
(letter_graphic)For Retirement
Accounts
Buying shares
Fidelity Investments
P.O. Box 770001
Cincinnati, OH 45277-0003
Selling shares
Fidelity Investments
P.O. Box 770001
Cincinnati, OH 45277-0035
Overnight Express
Fidelity Investments
Attn: Distribution Services
100 Crosby Parkway - KC1H
Covington, KY 41015
General Correspondence
Fidelity Investments
P.O. Box 500
Merrimack, NH 03054-0500
Semiannual Report
Investment Adviser
Fidelity Management & Research
Company
Boston, MA
Investment Sub-Advisers
Fidelity Investments
Money Management, Inc.
Fidelity Management & Research
(U.K.) Inc.
Fidelity Management & Research
(Hong Kong) Limited
Fidelity Management & Research
(Japan) Inc.
General Distributor
Fidelity Distributors Corporation
Boston, MA
Transfer and Service Agents
Citibank, N.A.
New York, NY
Fidelity Investments Institutional
Operations Company, Inc.
Boston, MA
Fidelity Service Company, Inc.
Boston, MA
Custodian
Citibank, N.A.
New York, NY
The Fidelity Telephone Connection
Mutual Fund 24-Hour Service
Exchanges/Redemptions
and Account Assistance 1-800-544-6666
Product Information 1-800-544-6666
Retirement Accounts 1-800-544-4774 (8 a.m. - 9 p.m.)
TDD Service 1-800-544-0118
for the deaf and hearing impaired
(9 a.m. - 9 p.m. Eastern time)
Fidelity Automated Service
Telephone (FAST®)
1-800-544-5555
Automated line for quickest service

CFL-USAN-1011
1.790942.108
Fidelity®
California Short-Intermediate Tax-Free Bond Fund
Semiannual Report
August 31, 2011
(2_fidelity_logos) (Registered_Trademark)
Contents
Chairman's Message | The Chairman's message to shareholders. | |
Shareholder Expense Example | An example of shareholder expenses. | |
Investment Changes | A summary of major shifts in the fund's investments over the past six months. | |
Investments | A complete list of the fund's investments with their market values. | |
Financial Statements | Statements of assets and liabilities, operations, and changes in net assets, | |
Notes | Notes to the financial statements. |
To view a fund's proxy voting guidelines and proxy voting record for the 12-month period ended June 30, visit http://www.fidelity.com/proxyvotingresults or visit the Securities and Exchange Commission's (SEC) web site at http://www.sec.gov. You may also call 1-800-544-8544 to request a free copy of the proxy voting guidelines.
Standard & Poor's, S&P and S&P 500 are registered service marks of The McGraw-Hill Companies, Inc. and have been licensed for use by Fidelity Distributors Corporation.
Other third party marks appearing herein are the property of their respective owners.
All other marks appearing herein are registered or unregistered trademarks or service marks of FMR LLC or an affiliated company.
This report and the financial statements contained herein are submitted for the general information of the shareholders of the fund. This report is not authorized for distribution to prospective investors in the fund unless preceded or accompanied by an effective prospectus.
A fund files its complete schedule of portfolio holdings with the SEC for the first and third quarters of each fiscal year on Form N-Q. Forms N-Q are available on the SEC's web site at http://www.sec.gov. A fund's Forms N-Q may be reviewed and copied at the SEC's Public Reference Room in Washington, DC. Information regarding the operation of the SEC's Public Reference Room may be obtained by calling 1-800-SEC-0330. For a complete list of a fund's portfolio holdings, view the most recent holdings listing, semiannual report, or annual report on Fidelity's web site at http://www.fidelity.com, http://www.advisor.fidelity.com, or http://www.401k.com, as applicable.
NOT FDIC INSURED • MAY LOSE VALUE • NO BANK GUARANTEE
Neither the fund nor Fidelity Distributors Corporation is a bank.
Semiannual Report
Chairman's Message
(Chairmans photo appears here)
Dear Shareholder:
U.S. equities remained in a significant midyear downturn that began in May and intensified in the final week of July and the early part of August, when Standard & Poor's announced it was lowering its long-term sovereign credit rating of the United States. The historic downgrade followed a political stalemate in which Congress struggled to address the debt ceiling issue before an early-August deadline, resulting in heightened investor anxiety and volatility across major financial markets. Financial markets are always unpredictable, of course, but there are several time-tested investment principles that can help put the odds in your favor.
One of the basic tenets is to invest for the long term. Over time, riding out the markets' inevitable ups and downs has proven much more effective than selling into panic or chasing the hottest trend. Even missing only a few of the markets' best days can significantly diminish investor returns. Patience also affords the benefits of compounding - of earning interest on additional income or reinvested dividends and capital gains. There can be tax advantages and cost benefits to consider as well. While staying the course doesn't eliminate risk, it can considerably lessen the effect of short-term declines.
You can further manage your investing risk through diversification. And today, more than ever, geographic diversification should be taken into account. Studies indicate that asset allocation is the single most important determinant of a portfolio's long-term success. The right mix of stocks, bonds and cash - aligned to your particular risk tolerance and investment objective - is very important. Age-appropriate rebalancing is also an essential aspect of asset allocation. For younger investors, an emphasis on equities - which historically have been the best-performing asset class over time - is encouraged. As investors near their specific goal, such as retirement or sending a child to college, consideration may be given to replacing volatile assets (e.g. common stocks) with more-stable fixed investments (bonds or savings plans).
A third principle - investing regularly - can help lower the average cost of your purchases. Investing a certain amount of money each month or quarter helps ensure you won't pay for all your shares at market highs. This strategy - known as dollar cost averaging - also reduces "emotion" from investing, helping shareholders avoid selling weak performers just prior to an upswing, or chasing a hot performer just before a correction.
We invite you to contact us via the Internet, through our Investor Centers or by phone. It is our privilege to provide you the information you need to make the investments that are right for you.
Sincerely,
(Chairmans signature appears here)
Abigail P. Johnson
Semiannual Report
Shareholder Expense Example
As a shareholder of the Fund, you incur two types of costs: (1) transaction costs, including redemption fees, and (2) ongoing costs, including management fees and other Fund expenses. This Example is intended to help you understand your ongoing costs (in dollars) of investing in the Fund and to compare these costs with the ongoing costs of investing in other mutual funds.
The Example is based on an investment of $1,000 invested at the beginning of the period and held for the entire period (March 1, 2011 to August 31, 2011).
Actual Expenses
The first line of the accompanying table provides information about actual account values and actual expenses. You may use the information in this line, together with the amount you invested, to estimate the expenses that you paid over the period. Simply divide your account value by $1,000.00 (for example, an $8,600 account value divided by $1,000.00 = 8.6), then multiply the result by the number in the first line under the heading entitled "Expenses Paid During Period" to estimate the expenses you paid on your account during this period. A small balance maintenance fee of $12.00 that is charged once a year may apply for certain accounts with a value of less than $2,000. This fee is not included in the table below. If it was, the estimate of expenses you paid during the period would be higher, and your ending account value lower, by this amount.
Hypothetical Example for Comparison Purposes
The second line of the accompanying table provides information about hypothetical account values and hypothetical expenses based on the Fund's actual expense ratio and an assumed rate of return of 5% per year before expenses, which is not the Fund's actual return. The hypothetical account values and expenses may not be used to estimate the actual ending account balance or expenses you paid for the period. You may use this information to compare the ongoing costs of investing in the Fund and other funds. To do so, compare this 5% hypothetical example with the 5% hypothetical examples that appear in the shareholder reports of the other funds. A small balance maintenance fee of $12.00 that is charged once a year may apply for certain accounts with a value of less than $2,000. This fee is not included in the table below. If it was, the estimate of expenses you paid during the period would be higher, and your ending account value lower, by this amount.
Please note that the expenses shown in the table are meant to highlight your ongoing costs only and do not reflect any transaction costs. Therefore, the second line of the table is useful in comparing ongoing costs only, and will not help you determine the relative total costs of owning different funds. In addition, if these transactional costs were included, your costs would have been higher.
| Annualized | Beginning | Ending | Expenses Paid |
Actual | .35% | $ 1,000.00 | $ 1,033.70 | $ 1.79 |
Hypothetical (5% return per year before expenses) |
| $ 1,000.00 | $ 1,023.38 | $ 1.78 |
* Expenses are equal to the Fund's annualized expense ratio, multiplied by the average account value over the period, multiplied by 184/366 (to reflect the one-half year period).
Semiannual Report
Investment Changes (Unaudited)
Top Five Sectors as of August 31, 2011 | ||
| % of fund's | % of fund's net assets |
General Obligations | 37.2 | 35.7 |
Escrowed/Pre-Refunded | 12.7 | 15.8 |
Electric Utilities | 9.7 | 8.7 |
Special Tax | 9.2 | 9.4 |
Health Care | 9.1 | 10.9 |
Weighted Average Maturity as of August 31, 2011 | ||
|
| 6 months ago |
Years | 3.2 | 3.2 |
This is a weighted average of all the maturities of the securities held in a fund. Weighted Average Maturity (WAM) can be used as a measure of sensitivity to interest rate changes and markets changes. Generally, the longer the maturity, the greater the sensitivity to such changes. WAM is based on the dollar-weighted average length of time until principal payments must be paid. Depending on the types of securities held in a fund, certain maturity shortening devices (e.g., demand features, interest rate resets, and call options) may be taken into account when calculating the WAM. |
Duration as of August 31, 2011 | ||
|
| 6 months ago |
Years | 2.9 | 3.0 |
Duration estimates how much a bond fund's price will change with a change in comparable interest rates. If rates rise 1%, for example, a fund with a 5-year duration is likely to lose about 5% of its value. Other factors also can influence a bond fund's performance and share price. Accordingly, a bond fund's actual performance may differ from this example. Duration takes into account any call or put option embedded in the bonds. |
Quality Diversification (% of fund's net assets) | |||||||
As of August 31, 2011 | As of February 28, 2011 | ||||||
| AAA 11.7% |
| | AAA 15.5% |
| ||
 | AA,A 78.2% |
| | AA,A 77.7% |
| ||
 | BBB 5.0% |
| | BBB 4.4% |
| ||
| BB and Below 0.2% |
| | BB and Below 0.2% |
| ||
 | Not Rated 0.6% |
| | Not Rated 1.1% |
| ||
| Short-Term |
| | Short-Term |
| ||
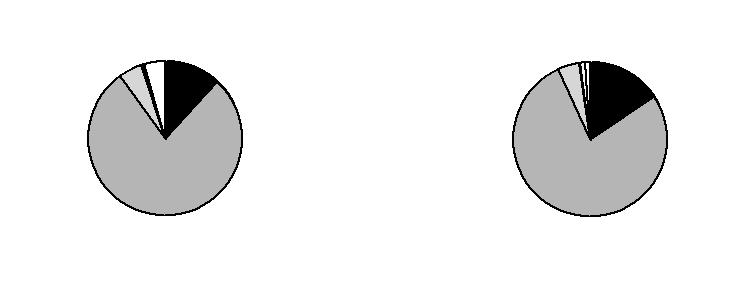
We have used ratings from Moody's® Investors Service, Inc. Where Moody's ratings are not available, we have used S&P® ratings. All ratings are as of the date indicated and do not reflect subsequent changes. |
Semiannual Report
Investments August 31, 2011 (Unaudited)
Showing Percentage of Net Assets
Municipal Bonds - 95.5% | ||||
| Principal Amount | Value | ||
California - 94.3% | ||||
ABAG Fin. Auth. for Nonprofit Corps. Rev.: | ||||
(Hamlin School Proj.) Series 2007, 4.375% 8/1/13 | $ 220,000 | $ 228,364 | ||
(Sharp HealthCare Proj.) Series 2011 A: | ||||
5% 8/1/17 | 5,065,000 | 5,586,087 | ||
5% 8/1/18 | 2,645,000 | 2,889,742 | ||
Alameda County Wtr. District Rev.: | ||||
2.5% 6/1/14 | 1,885,000 | 1,971,540 | ||
2.5% 6/1/15 | 895,000 | 947,152 | ||
2.5% 6/1/16 | 1,070,000 | 1,128,786 | ||
3% 6/1/15 | 525,000 | 565,210 | ||
3% 6/1/16 | 525,000 | 565,861 | ||
Alameda Unified School District Gen. Oblig. Series 2002, 5.5% 7/1/13 (FSA Insured) | 125,000 | 136,043 | ||
Anaheim Union High School District Series 2002 A, 5% 8/1/22 (Pre-Refunded to 8/1/12 @ 100) (c) | 155,000 | 161,677 | ||
Antioch Unified School District (School Facilities Impt. District #1 Proj.) Series 2008 B: | ||||
6.25% 8/1/16 (Assured Guaranty Corp. Insured) | 370,000 | 445,769 | ||
6.25% 8/1/17 (Assured Guaranty Corp. Insured) | 395,000 | 477,982 | ||
6.25% 8/1/19 (Assured Guaranty Corp. Insured) | 440,000 | 543,770 | ||
California County Tobacco Securitization Agcy. Tobacco Settlement Asset-Backed Series 2002 A: | ||||
5.875% 6/1/43 (Pre-Refunded to 6/1/12 @ 100) (c) | 165,000 | 171,796 | ||
5.875% 6/1/43 (Pre-Refunded to 6/1/12 @ 100) (c) | 125,000 | 130,196 | ||
California Dept. of Trans. Rev. Series 2004 A: | ||||
5% 2/1/12 (Nat'l. Pub. Fin. Guarantee Corp. Insured) | 130,000 | 132,484 | ||
5% 2/1/13 (Nat'l. Pub. Fin. Guarantee Corp. Insured) | 5,555,000 | 5,912,075 | ||
California Dept. of Wtr. Resources Central Valley Proj. Rev.: | ||||
Series AI, 5% 12/1/17 (a) | 12,720,000 | 15,419,693 | ||
Series J2, 7% 12/1/12 | 2,600,000 | 2,815,436 | ||
Series J3, 7% 12/1/12 (Escrowed to Maturity) (c) | 70,000 | 75,718 | ||
California Dept. of Wtr. Resources Pwr. Supply Rev.: | ||||
Series 2002 A: | ||||
5.125% 5/1/18 (Pre-Refunded to 5/1/12 @ 101) (c) | 1,110,000 | 1,156,953 | ||
5.125% 5/1/19 (Pre-Refunded to 5/1/12 @ 101) (c) | 595,000 | 620,169 | ||
5.125% 5/1/19 (Pre-Refunded to 5/1/12 @ 101) (c) | 1,920,000 | 2,001,216 | ||
5.25% 5/1/12 | 135,000 | 139,417 | ||
5.25% 5/1/12 (FSA Insured) | 605,000 | 624,796 | ||
Municipal Bonds - continued | ||||
| Principal Amount | Value | ||
California - continued | ||||
California Dept. of Wtr. Resources Pwr. Supply Rev.: - continued | ||||
Series 2002 A: | ||||
5.25% 5/1/20 (Pre-Refunded to 5/1/12 @ 101) (c) | $ 3,000,000 | $ 3,129,360 | ||
5.375% 5/1/18 (Pre-Refunded to 5/1/12 @ 101) (c) | 1,655,000 | 1,727,704 | ||
5.375% 5/1/21 (Pre-Refunded to 5/1/12 @ 101) (c) | 1,645,000 | 1,717,265 | ||
5.375% 5/1/22 (Pre-Refunded to 5/1/12 @ 101) (c) | 11,730,000 | 12,245,299 | ||
5.375% 5/1/22 (Pre-Refunded to 5/1/12 @ 101) (c) | 1,440,000 | 1,503,259 | ||
5.5% 5/1/12 | 2,260,000 | 2,337,631 | ||
5.5% 5/1/15 (Pre-Refunded to 5/1/12 @ 101) (c) | 2,100,000 | 2,193,975 | ||
5.5% 5/1/16 (Pre-Refunded to 5/1/12 @ 101) (c) | 6,335,000 | 6,618,491 | ||
5.75% 5/1/17 (Pre-Refunded to 5/1/12 @ 101) (c) | 4,150,000 | 4,342,477 | ||
6% 5/1/13 (Pre-Refunded to 5/1/12 @ 101) (c) | 1,670,000 | 1,750,177 | ||
Series 2011 N, 5% 5/1/19 | 5,000,000 | 5,980,950 | ||
Series A: | ||||
5.5% 5/1/13 (AMBAC Insured) | 240,000 | 250,414 | ||
5.5% 5/1/13 (Pre-Refunded to 5/1/12 @ 101) (c) | 495,000 | 517,151 | ||
California Dept. of Wtr. Resources Wtr. Rev. Series W, 5.5% 12/1/13 (FSA Insured) | 110,000 | 121,849 | ||
California Econ. Recovery: | ||||
Bonds Series B, 5%, tender 7/1/14 (b) | 4,760,000 | 5,354,619 | ||
Series 2004 A: | ||||
5% 7/1/15 | 1,815,000 | 2,026,538 | ||
5.25% 7/1/12 | 7,035,000 | 7,319,777 | ||
5.25% 7/1/12 (FGIC Insured) | 445,000 | 463,014 | ||
5.25% 7/1/14 | 2,050,000 | 2,310,555 | ||
Series 2009 A: | ||||
5% 7/1/12 (Escrowed to Maturity) (c) | 995,000 | 1,033,914 | ||
5% 7/1/12 (Nat'l. Pub. Fin. Guarantee Corp. Insured) | 1,200,000 | 1,246,116 | ||
5% 7/1/15 | 2,615,000 | 2,919,778 | ||
5% 7/1/22 | 5,000,000 | 5,485,400 | ||
5.25% 7/1/13 (Escrowed to Maturity) (c) | 4,395,000 | 4,792,791 | ||
5.25% 7/1/13 (Nat'l. Pub. Fin. Guarantee Corp. Insured) | 4,605,000 | 5,005,036 | ||
5.25% 7/1/14 | 10,570,000 | 11,913,447 | ||
5.25% 7/1/14 (Escrowed to Maturity) (c) | 3,525,000 | 4,011,309 | ||
Series 2009 B, 5% 7/1/20 | 3,115,000 | 3,664,891 | ||
Municipal Bonds - continued | ||||
| Principal Amount | Value | ||
California - continued | ||||
California Econ. Recovery: - continued | ||||
Series A, 5% 7/1/18 | $ 1,905,000 | $ 2,259,578 | ||
California Edl. Facilities Auth. Rev.: | ||||
(College & Univ. Fing. Prog.) Series 2007, 5% 2/1/13 | 1,265,000 | 1,290,882 | ||
(Loyola Marymount Univ. Proj.) Series 2010 A, 4% 10/1/13 | 500,000 | 529,690 | ||
(Santa Clara Univ. Proj.) Series 2008: | ||||
5% 4/1/15 | 500,000 | 569,765 | ||
5% 4/1/16 | 400,000 | 464,096 | ||
(Stanford Univ. Proj.) Series T4, 5% 3/15/14 | 3,215,000 | 3,589,612 | ||
California Enterprise Dev. Auth. (The Thacher School Proj.) Series 2010: | ||||
3% 9/1/15 | 450,000 | 477,459 | ||
4% 9/1/18 | 255,000 | 277,330 | ||
5% 9/1/16 | 300,000 | 344,658 | ||
5% 9/1/17 | 400,000 | 460,072 | ||
California Gen. Oblig.: | ||||
4% 8/1/13 | 500,000 | 531,130 | ||
4% 11/1/13 | 1,750,000 | 1,870,050 | ||
4% 11/1/14 | 1,265,000 | 1,386,617 | ||
5% 2/1/12 | 260,000 | 264,742 | ||
5% 2/1/12 | 120,000 | 122,189 | ||
5% 2/1/12 | 110,000 | 112,006 | ||
5% 3/1/12 | 1,425,000 | 1,456,379 | ||
5% 4/1/12 | 125,000 | 128,325 | ||
5% 10/1/12 | 2,000,000 | 2,095,420 | ||
5% 2/1/13 | 2,205,000 | 2,338,380 | ||
5% 2/1/13 | 175,000 | 185,586 | ||
5% 6/1/13 | 1,000,000 | 1,074,240 | ||
5% 10/1/13 | 50,000 | 52,518 | ||
5% 11/1/13 | 870,000 | 948,213 | ||
5% 3/1/14 | 3,675,000 | 4,056,098 | ||
5% 3/1/16 | 2,500,000 | 2,895,900 | ||
5% 2/1/19 (Pre-Refunded to 2/1/12 @ 100) (c) | 3,785,000 | 3,858,580 | ||
5.25% 10/1/12 | 110,000 | 115,541 | ||
5.25% 10/1/13 | 185,000 | 201,983 | ||
5.25% 2/1/14 (FSA Insured) | 270,000 | 292,480 | ||
5.25% 2/1/15 | 40,000 | 43,291 | ||
5.25% 2/1/16 | 1,000,000 | 1,062,230 | ||
5.25% 4/1/29 (Pre-Refunded to 4/1/14 @ 100) (c) | 2,000,000 | 2,253,200 | ||
5.3% 4/1/29 (Pre-Refunded to 4/1/14 @ 100) (c) | 2,750,000 | 3,101,670 | ||
5.75% 10/1/11 | 170,000 | 170,626 | ||
Municipal Bonds - continued | ||||
| Principal Amount | Value | ||
California - continued | ||||
California Gen. Oblig.: - continued | ||||
5.75% 11/1/11 | $ 100,000 | $ 100,809 | ||
6.25% 9/1/12 | 315,000 | 321,791 | ||
California Health Facilities Fing. Auth. Rev.: | ||||
(Adventist Health Sys. West Proj.) Series 2009 C: | ||||
5% 3/1/13 | 1,700,000 | 1,786,343 | ||
5% 3/1/14 | 2,000,000 | 2,157,460 | ||
(Catholic Healthcare West Proj.) Series 2008 H, 5.125% 7/1/22 | 880,000 | 940,412 | ||
(Cedars-Sinai Med. Ctr. Proj.) Series 2005, 5% 11/15/14 | 50,000 | 55,466 | ||
(Providence Health & Svcs. Proj.) Series 2008 C, 5.25% 10/1/13 | 750,000 | 818,520 | ||
(Scripps Health Sys. Proj.) Series 2008 A, 5% 10/1/15 | 1,000,000 | 1,135,120 | ||
(Scripps Memorial Hosp. Proj.) Series A, 5% 10/1/16 | 500,000 | 573,525 | ||
(Sutter Health Proj.): | ||||
Series 2008 A: | ||||
5% 8/15/12 | 2,000,000 | 2,086,760 | ||
5% 8/15/15 | 1,440,000 | 1,623,931 | ||
5.5% 8/15/16 | 1,000,000 | 1,162,360 | ||
Series 2011 B, 4% 8/15/17 | 1,000,000 | 1,088,100 | ||
Bonds: | ||||
(Catholic Healthcare West Proj.): | ||||
Series 2004 I, 4.95%, tender 7/1/14 (b) | 275,000 | 298,862 | ||
Series 2009 C, 5%, tender 7/2/12 (b) | 1,700,000 | 1,751,952 | ||
Series 2009 F, 5%, tender 7/1/14 (b) | 2,800,000 | 3,043,572 | ||
(St. Joseph Health Sys. Proj.) Series 2009 C, 5%, tender 10/16/14 (b) | 2,800,000 | 3,072,524 | ||
Series 2011 A: | ||||
4% 2/1/13 | 500,000 | 512,845 | ||
4% 2/1/14 | 1,000,000 | 1,051,010 | ||
5.25% 2/1/15 | 1,000,000 | 1,104,990 | ||
California Infrastructure & Econ. Dev. Bank Rev.: | ||||
(Bay Area Toll Bridges Seismic Retrofit Prog.) Series 2003 A, 5.25% 7/1/20 (Pre-Refunded to 7/1/13 @ 100) (c) | 5,300,000 | 5,779,703 | ||
(California Independent Sys. Operator Corp. Proj.) Series 2008 A, 5% 2/1/12 | 2,500,000 | 2,545,000 | ||
(Clean Wtr. State Revolving Fund Proj.) Series 2002, 5% 10/1/15 | 1,660,000 | 1,743,979 | ||
(Worker's Compensation Relief Proj.) Series 2004 A, 5.25% 10/1/13 (AMBAC Insured) | 45,000 | 48,927 | ||
Municipal Bonds - continued | ||||
| Principal Amount | Value | ||
California - continued | ||||
California Infrastructure & Econ. Dev. Bank Rev.: - continued | ||||
Bonds (The J. Paul Getty Trust Proj.): | ||||
Series 2003 A, 3.9%, tender 12/1/11 (b) | $ 3,825,000 | $ 3,857,819 | ||
Series 2003 C, 3.9%, tender 12/1/11 (b) | 1,745,000 | 1,759,972 | ||
Series 2004 A, 4%, tender 12/1/11 (b) | 1,600,000 | 1,614,112 | ||
Series 2007 A3, 2.25%, tender 4/1/12 (b) | 2,000,000 | 2,022,060 | ||
California Muni. Fin. Auth. Ctfs. of Prtn. (Cmnty. Hospitals of Central California Obligated Group Proj.) Series 2009: | ||||
5% 2/1/13 | 1,160,000 | 1,205,414 | ||
5% 2/1/14 | 1,220,000 | 1,287,747 | ||
5% 2/1/15 | 1,615,000 | 1,710,640 | ||
California Muni. Fin. Auth. Rev.: | ||||
(Eisenhower Med. Ctr. Proj.) Series 2010 A, 5% 7/1/16 | 1,530,000 | 1,643,541 | ||
(Loma Linda Univ. Proj.) Series 2007: | ||||
4.5% 4/1/13 | 365,000 | 382,969 | ||
5% 4/1/14 | 200,000 | 216,522 | ||
California Muni. Fin. Auth. Solid Waste Disp. Rev.: | ||||
(Waste Mgmt., Inc. Proj.) Series 2004, 3% 9/1/14 | 3,000,000 | 3,101,550 | ||
Bonds (Waste Mgmt., Inc. Proj.) Series 2009 A, 2.375%, tender 2/1/13 (b) | 3,000,000 | 3,039,630 | ||
California Muni. Fin. Auth. Solid Waste Rev. Bonds (Republic Svcs., Inc. Proj.) 1.1%, tender 10/3/11 (b) | 1,550,000 | 1,550,186 | ||
California Poll. Cont. Fing. Auth. Ctfs. of Prtn. (San Diego Gas & Elec. Co. Proj.) 5.9% 6/1/14 (Nat'l. Pub. Fin. Guarantee Corp. Insured) | 6,000,000 | 6,727,320 | ||
California Poll. Cont. Fing. Auth. Solid Waste Disp. Rev. Bonds (Republic Svcs., Inc. Proj.) Series 2010 B, 1.125%, tender 11/1/11 (b) | 1,000,000 | 999,980 | ||
California Pub. Works Board Lease Rev.: | ||||
(California Substance Abuse Treatment Facility and State Prison at Corcoran II Proj.) Series 2005 J, 5.25% 1/1/16 (AMBAC Insured) | 2,985,000 | 3,415,049 | ||
(Coalinga State Hosp. Proj.) Series 2004 A: | ||||
5.25% 6/1/12 | 1,440,000 | 1,482,797 | ||
5.25% 6/1/14 | 70,000 | 77,049 | ||
(Dept. of Corrections & Rehab. Proj.): | ||||
Series 2005 J, 5% 1/1/14 (AMBAC Insured) | 3,080,000 | 3,333,607 | ||
Series 2006 F, 5% 11/1/16 (FGIC Insured) | 1,550,000 | 1,733,024 | ||
Series 2007 F: | ||||
4% 11/1/12 | 110,000 | 113,682 | ||
Municipal Bonds - continued | ||||
| Principal Amount | Value | ||
California - continued | ||||
California Pub. Works Board Lease Rev.: - continued | ||||
Series 2007 F: | ||||
4% 11/1/13 | $ 165,000 | $ 173,811 | ||
(Dept. of Corrections Proj.) Series B, 5.25% 1/1/13 | 40,000 | 42,141 | ||
(Dept. of Corrections, Madera State Prison Proj.) Series E, 5.5% 6/1/15 | 940,000 | 1,011,139 | ||
(Dept. of Corrections, Monterey County State Prison Proj.): | ||||
Series 2003 C: | ||||
5.5% 6/1/14 | 100,000 | 109,155 | ||
5.5% 6/1/14 (Nat'l. Pub. Fin. Guarantee Corp. Insured) | 50,000 | 54,578 | ||
Series 2004 D, 5% 12/1/15 (Nat'l. Pub. Fin. Guarantee Corp. Insured) | 150,000 | 162,165 | ||
(Dept. of Corrections, Various State Prisons Proj.) Series 1993 A, 5.25% 12/1/13 (AMBAC Insured) | 2,220,000 | 2,305,514 | ||
(Dept. of Food & Agric. Proj.) Series 2007 H, 4% 11/1/13 | 335,000 | 352,889 | ||
(Dept. of Forestry & Fire Protection Proj.) Series 2007 E, 5% 11/1/13 | 935,000 | 1,007,154 | ||
(Judicial Council Proj.) Series 2007 G, 3.7% 11/1/12 | 110,000 | 113,304 | ||
(Monterey Bay Campus Library Proj.) Series 2009 D: | ||||
4% 4/1/15 | 660,000 | 717,130 | ||
5% 4/1/14 | 1,270,000 | 1,384,973 | ||
(Regents Univ. of California Proj.) Series A, 5.25% 6/1/12 (AMBAC Insured) | 50,000 | 51,796 | ||
(Univ. of California Research Proj.) Series 2005 L, 5% 11/1/13 (Nat'l. Pub. Fin. Guarantee Corp. Insured) | 1,490,000 | 1,643,559 | ||
(Various California State Univ. Projs.): | ||||
Series 2006 A, 5% 10/1/13 (Nat'l. Pub. Fin. Guarantee Corp. Insured) | 2,000,000 | 2,130,260 | ||
Series A, 5.5% 6/1/14 | 120,000 | 128,216 | ||
(Various Cap. Projs.): | ||||
Series 2009 G1, 5.25% 10/1/17 | 2,900,000 | 3,353,531 | ||
Series 2010 A, 5% 3/1/15 | 2,960,000 | 3,295,634 | ||
Series 2008 F, 5.25% 11/1/19 (Nat'l. Pub. Fin. Guarantee Corp. Insured) | 3,000,000 | 3,322,320 | ||
Series 2009 A, 5% 4/1/19 | 1,000,000 | 1,106,670 | ||
Series 2009 J, 5% 11/1/17 | 2,700,000 | 3,089,286 | ||
California State Univ. Rev.: | ||||
Series 2005 B, 5% 11/1/11 (AMBAC Insured) | 40,000 | 40,288 | ||
Series 2009 A: | ||||
5% 11/1/15 | 1,000,000 | 1,148,220 | ||
5% 11/1/16 | 1,485,000 | 1,720,194 | ||
Municipal Bonds - continued | ||||
| Principal Amount | Value | ||
California - continued | ||||
California State Univ., Fresno Assoc., Inc. Auxiliary Organization Event Ctr. Rev. Series 2002, 6% 7/1/26 (Pre-Refunded to 7/1/12 @ 101) (c) | $ 35,000 | $ 36,899 | ||
California Statewide Cmntys. Dev. Auth. Poll. Cont. Rev. Bonds (Southern California Edison Co. Proj.): | ||||
Series 2006 A, 4.1%, tender 4/1/13 (XL Cap. Assurance, Inc. Insured) (b) | 1,000,000 | 1,047,350 | ||
Series 2006 B, 4.1%, tender 4/1/13 (XL Cap. Assurance, Inc. Insured) (b) | 2,000,000 | 2,094,700 | ||
California Statewide Cmntys. Dev. Auth. Rev.: | ||||
(Cottage Health Sys. Obligated Group Proj.) Series 2010: | ||||
5% 11/1/16 | 500,000 | 558,270 | ||
5% 11/1/18 | 500,000 | 554,080 | ||
(Enloe Health Sys. Proj.): | ||||
Series 2008 A, 5.5% 8/15/14 | 1,435,000 | 1,573,449 | ||
Series 2008 B, 5% 8/15/15 | 60,000 | 65,975 | ||
(John Muir Health Proj.) Series 2009 A, 5% 7/1/15 | 1,900,000 | 2,101,172 | ||
(St. Joseph Health Sys. Proj.) Series 2007 F, 5% 7/1/14 (FSA Insured) | 935,000 | 1,023,629 | ||
(State of California Proposition 1A Receivables Prog.) Series 2009: | ||||
4% 6/15/13 | 2,520,000 | 2,660,440 | ||
5% 6/15/13 | 46,560,000 | 49,973,299 | ||
(Thomas Jefferson School of Law Proj.) Series 2001, 7.75% 10/1/31 (Pre-Refunded to 10/1/11 @ 101) (c) | 920,000 | 933,754 | ||
Bonds (Kaiser Permanente Health Sys. Proj.) Series 2001 B, 3.9%, tender 7/1/14 (b) | 6,250,000 | 6,765,313 | ||
4% 6/1/14 | 600,000 | 630,960 | ||
4% 6/1/15 | 325,000 | 343,229 | ||
California Statewide Cmntys. Dev. Auth. Wtr. & Wastewtr. Rev. Series 2004 A: | ||||
5% 10/1/13 (Escrowed to Maturity) (c) | 15,000 | 16,466 | ||
5% 10/1/13 (FSA Insured) | 40,000 | 43,320 | ||
Calleguas-Las Virgenes Pub. Fing. Auth. Sanitation Sys. Rev. (Las Virgenes Muni. Wtr. District Proj.) Series 2009: | ||||
4% 11/1/13 | 400,000 | 425,580 | ||
4% 11/1/14 | 300,000 | 326,883 | ||
5% 11/1/15 | 1,000,000 | 1,157,440 | ||
Carlsbad Unified School District Series 2009 B, 0% 5/1/14 | 400,000 | 382,940 | ||
Municipal Bonds - continued | ||||
| Principal Amount | Value | ||
California - continued | ||||
Central Contra Costa San. District Wastewtr. Rev. Ctfs. of Prtn. Series B: | ||||
4% 9/1/14 | $ 2,390,000 | $ 2,593,054 | ||
4% 9/1/16 | 1,125,000 | 1,262,509 | ||
Central Valley Fing. Auth. Cogeneration Proj. Rev. (Carson Ice-Gen. Proj.) Series 2009, 5% 7/1/16 | 1,150,000 | 1,298,695 | ||
Chaffey Cmnty. College District Series A, 5.25% 7/1/14 (Pre-Refunded to 7/1/12 @ 101) (c) | 30,000 | 31,534 | ||
Chaffey Unified High School District Series 2005, 5% 8/1/12 (Nat'l. Pub. Fin. Guarantee Corp. Insured) | 20,000 | 20,836 | ||
Chino Basin Reg'l. Fing. Auth. Rev. (Inland Empire Util. Agcy. Proj.) Series 2010 A, 4% 8/1/16 | 3,730,000 | 4,159,808 | ||
Commerce Refuse to Energy Auth. Rev. Series 2005: | ||||
5.5% 7/1/13 (Nat'l. Pub. Fin. Guarantee Corp. Insured) | 1,790,000 | 1,896,040 | ||
5.5% 7/1/14 (Nat'l. Pub. Fin. Guarantee Corp. Insured) | 1,000,000 | 1,085,410 | ||
Cupertino California Union School District: | ||||
4% 8/1/13 | 1,410,000 | 1,505,006 | ||
4% 8/1/14 | 735,000 | 809,037 | ||
4% 8/1/16 | 1,825,000 | 2,087,234 | ||
Desert Sands Union School District Ctfs. of Prtn. 5.25% 3/1/14 | 500,000 | 542,135 | ||
East Bay Reg'l. Park District: | ||||
Series 2008 A, 3% 9/1/16 | 1,000,000 | 1,099,090 | ||
Series 2008, 4% 9/1/13 | 5,000,000 | 5,353,650 | ||
East Side Union High School District Santa Clara County: | ||||
Series B, 5.1% 2/1/19 (MBIA Insured) | 500,000 | 550,045 | ||
Series C, 5% 8/1/12 (FSA Insured) | 55,000 | 57,313 | ||
Eastern Muni. Wtr. Ds Wtr. Rev. Series 2011 A, 5% 7/1/18 | 1,085,000 | 1,311,494 | ||
El Centro School District Gen. Oblig. Series A, 6% 8/1/12 (AMBAC Insured) | 15,000 | 15,629 | ||
Fillmore Pub. Fing. Auth. Rev. (Wtr. Recycling Fing. Proj.) 4% 5/1/12 (CIFG North America Insured) | 300,000 | 304,908 | ||
Fontana Unified School District Gen. Oblig. 5.25% 5/1/13 (Assured Guaranty Corp. Insured) | 380,000 | 406,988 | ||
Fremont Union High School District, Santa Clara Series 1998 C, 5% 9/1/18 (Pre-Refunded to 9/1/12 @ 100) (c) | 85,000 | 89,000 | ||
Fullerton School District: | ||||
4% 8/1/16 | 525,000 | 589,192 | ||
4% 8/1/17 | 600,000 | 669,324 | ||
Municipal Bonds - continued | ||||
| Principal Amount | Value | ||
California - continued | ||||
Fullerton School District: - continued | ||||
5% 8/1/18 | $ 500,000 | $ 590,950 | ||
Golden State Tobacco Securitization Corp. Tobacco Settlement Rev.: | ||||
Series 2003 A1, 6.75% 6/1/39 (Pre-Refunded to 6/1/13 @ 100) (c) | 2,685,000 | 2,976,672 | ||
Series 2003 B: | ||||
5% 6/1/38 (Pre-Refunded to 6/1/13 @ 100) (c) | 775,000 | 835,768 | ||
5% 6/1/43 (Pre-Refunded to 6/1/13 @ 100) (c) | 205,000 | 221,074 | ||
5.5% 6/1/33 (Pre-Refunded to 6/1/13 @ 100) (c) | 7,470,000 | 8,120,189 | ||
5.5% 6/1/43 (Pre-Refunded to 6/1/13 @ 100) (c) | 3,290,000 | 3,576,362 | ||
Series B: | ||||
5.5% 6/1/43 (Pre-Refunded to 6/1/13 @ 100) (c) | 1,000,000 | 1,087,040 | ||
5.625% 6/1/33 (Pre-Refunded to 6/1/13 @ 100) (c) | 175,000 | 190,610 | ||
Grossmont-Cuyamaca Cmnty. College District 5% 8/1/12 (Assured Guaranty Corp. Insured) | 2,915,000 | 3,037,605 | ||
Indio Pub. Fing. Auth. Lease Rev. Bonds Series 2007 B, 3.8%, tender 11/1/12 (b) | 500,000 | 507,555 | ||
Jefferson Union High School District Gen. Oblig. Series A, 6.25% 2/1/12 (Nat'l. Pub. Fin. Guarantee Corp. Insured) | 50,000 | 50,949 | ||
Kern Cmnty. College District Gen. Oblig. Series A, 4.75% 11/1/26 (Pre-Refunded to 11/1/13 @ 100) (c) | 170,000 | 186,374 | ||
Laguna Beach Unified School District Gen. Oblig. (Election of 2001 Proj.): | ||||
3% 8/1/14 | 100,000 | 107,105 | ||
4% 8/1/15 | 125,000 | 140,544 | ||
4% 8/1/16 | 100,000 | 113,752 | ||
4% 8/1/17 | 175,000 | 200,477 | ||
5% 8/1/19 | 250,000 | 304,568 | ||
Lodi Elec. Sys. Rev. Ctfs. of Prtn. Series A, 5% 7/1/16 (Assured Guaranty Corp. Insured) | 2,390,000 | 2,740,302 | ||
Loma Linda Hosp. Rev. Series 2005 A, 5% 12/1/14 | 1,860,000 | 1,969,703 | ||
Long Beach Hbr. Rev. Series 2010 B: | ||||
5% 5/15/14 | 1,060,000 | 1,182,218 | ||
5% 5/15/15 | 1,000,000 | 1,151,290 | ||
Long Beach Wtr. Rev. Series 2010 A, 3% 5/1/17 | 1,550,000 | 1,658,144 | ||
Los Alamitos Unified School District 0% 9/1/16 (a) | 2,000,000 | 1,756,560 | ||
Los Angeles County Ctfs. of Prtn.: | ||||
(Correctional Facilities Proj.) 0% 9/1/12 (Escrowed to Maturity) (c) | 100,000 | 99,343 | ||
Municipal Bonds - continued | ||||
| Principal Amount | Value | ||
California - continued | ||||
Los Angeles County Ctfs. of Prtn.: - continued | ||||
(Disney Parking Proj.) 0% 3/1/14 | $ 20,000 | $ 19,021 | ||
Los Angeles County Metropolitan Trans. Auth. Sales Tax Rev.: | ||||
(Proposition C Proj.) First Tier Sr. Series 2003 A, 5% 7/1/13 (FSA Insured) | 285,000 | 308,307 | ||
Series 2009 A, 5% 7/1/14 | 5,000,000 | 5,599,150 | ||
Los Angeles County Pub. Works Fing. Auth. Lease Rev. Series 2010 A, 5% 8/1/16 | 5,000,000 | 5,704,650 | ||
Los Angeles County Pub. Works Fing. Auth. Rev.: | ||||
(Los Angeles County Flood Cont. District Proj.) Series A, 5% 3/1/12 (Nat'l. Pub. Fin. Guarantee Corp. Insured) | 35,000 | 35,795 | ||
(Reg'l. Park & Open Space District Proj.) Series 2005 A: | ||||
5% 10/1/12 (FSA Insured) | 105,000 | 110,172 | ||
5% 10/1/14 (FSA Insured) | 25,000 | 28,112 | ||
Los Angeles Dept. Arpt. Rev. Series 2003 B, 5% 5/15/14 (Nat'l. Pub. Fin. Guarantee Corp. Insured) | 165,000 | 182,949 | ||
Los Angeles Dept. of Wtr. & Pwr. Rev.: | ||||
Series 2003 A1: | ||||
5% 7/1/12 (Nat'l. Pub. Fin. Guarantee Corp. Insured) | 25,000 | 25,980 | ||
5% 7/1/15 (Nat'l. Pub. Fin. Guarantee Corp. Insured) | 3,000,000 | 3,236,190 | ||
Series 2011 A, 5% 7/1/19 | 5,000,000 | 6,056,500 | ||
Los Angeles Gen. Oblig.: | ||||
Series 2001 A, 5% 9/1/15 (Pre-Refunded to 9/1/11 @ 100) (c) | 60,000 | 60,000 | ||
Series 2002 A, 5.25% 9/1/13 (Nat'l. Pub. Fin. Guarantee Corp. Insured) | 185,000 | 202,074 | ||
Series 2003 A, 5% 9/1/13 (Nat'l. Pub. Fin. Guarantee Corp. Insured) | 20,000 | 21,789 | ||
Series 2009 A, 4% 9/1/15 | 2,085,000 | 2,326,235 | ||
Los Angeles Muni. Impt. Corp. Lease Rev. Series 2010 D: | ||||
5% 11/1/14 | 3,295,000 | 3,600,776 | ||
5% 11/1/15 | 1,880,000 | 2,101,238 | ||
Los Angeles Solid Waste Resources Rev. Series 2009 A, 5% 2/1/14 | 1,160,000 | 1,271,337 | ||
Municipal Bonds - continued | ||||
| Principal Amount | Value | ||
California - continued | ||||
Los Angeles Unified School District: | ||||
(Election of 1997 Proj.): | ||||
Series 2002 E: | ||||
5.5% 7/1/13 (Pre-Refunded to 7/1/12 @ 100) (c) | $ 40,000 | $ 41,728 | ||
5.5% 7/1/14 (Pre-Refunded to 7/1/12 @ 100) (c) | 1,300,000 | 1,356,160 | ||
Series 2003 F: | ||||
4.5% 7/1/13 | 3,000,000 | 3,213,660 | ||
5% 7/1/14 | 25,000 | 26,883 | ||
(Election of 2002 Proj.) Series 2003 A, 5% 7/1/13 | 25,000 | 27,006 | ||
Series 1997 A, 6% 7/1/14 | 3,055,000 | 3,481,325 | ||
Series 1997 F, 5% 7/1/21 (FSA Insured) | 3,000,000 | 3,176,010 | ||
Series 2002: | ||||
5.75% 7/1/14 (Nat'l. Pub. Fin. Guarantee Corp. Insured) | 4,025,000 | 4,557,548 | ||
5.75% 7/1/16 (Nat'l. Pub. Fin. Guarantee Corp. Insured) | 1,475,000 | 1,763,849 | ||
Series 2003 A, 5% 7/1/21 (FSA Insured) | 4,500,000 | 4,764,015 | ||
Series 2004 I, 5% 7/1/16 | 3,180,000 | 3,708,421 | ||
Series 2009 KRY, 5% 7/1/15 | 5,000,000 | 5,776,100 | ||
Los Angeles Unified School District Ctfs. of Prtn. (Multiple Properties Proj.) Series 2010 A, 5% 12/1/17 | 1,045,000 | 1,164,903 | ||
Los Angeles Wastewtr. Sys. Rev. Series 2009 A, 5% 6/1/15 | 5,000,000 | 5,779,400 | ||
M-S-R Pub. Pwr. Agcy. San Juan Proj. Rev. Series 2008 L: | ||||
4% 7/1/12 (FSA Insured) | 145,000 | 148,890 | ||
4% 7/1/13 (FSA Insured) | 175,000 | 184,049 | ||
5% 7/1/14 (FSA Insured) | 2,000,000 | 2,200,660 | ||
Malibu Gen. Oblig. Ctfs. of Prtn. (City Hall Proj.) Series A: | ||||
4% 7/1/13 | 50,000 | 52,642 | ||
4% 7/1/15 | 100,000 | 109,362 | ||
4% 7/1/17 | 85,000 | 93,655 | ||
Marin County Gen. Oblig. Ctfs. of Prtn.: | ||||
3% 8/1/15 | 1,870,000 | 2,003,873 | ||
3% 8/1/16 | 1,925,000 | 2,063,812 | ||
3% 8/1/17 | 1,735,000 | 1,833,114 | ||
Marin Muni. Wtr. District Rev. Ctfs. of Prtn. (2004 Fing. Proj.) 5% 7/1/12 (AMBAC Insured) | 25,000 | 25,841 | ||
Metropolitan Wtr. District of Southern California Wtrwks. Rev. Series 2003 A, 5% 7/1/13 | 35,000 | 37,902 | ||
Municipal Bonds - continued | ||||
| Principal Amount | Value | ||
California - continued | ||||
Modesto Irrigation District Elec. Rev. Series 2011 A, 5% 7/1/18 | $ 2,000,000 | $ 2,329,360 | ||
Monterey County Pub. Impt. Corp. Ctfs. of Prtn. (Refing. Proj.) Series 2009, 5% 8/1/15 (FSA Insured) | 2,000,000 | 2,257,860 | ||
Monterey Peninsula Cmnty. College District Series A, 4.75% 8/1/27 (Pre-Refunded to 8/1/13 @ 100) (c) | 15,000 | 16,278 | ||
Mount Diablo Unified School District: | ||||
Series 2004, 5% 7/1/13 (Nat'l. Pub. Fin. Guarantee Corp. Insured) | 1,830,000 | 1,973,381 | ||
Series 2011, 4% 2/1/17 | 525,000 | 591,413 | ||
New Haven Unified School District Series B, 7.9% 8/1/12 (Nat'l. Pub. Fin. Guarantee Corp. Insured) | 100,000 | 106,837 | ||
Newhall School District Gen. Oblig. Series B, 5% 8/1/18 (Pre-Refunded to 8/1/12 @ 101) (c) | 45,000 | 47,388 | ||
Newport Beach Rev. Bonds (Hoag Memorial Hosp. Presbyterian Proj.) Series 2009 D, 5%, tender 2/7/13 (b) | 750,000 | 794,258 | ||
Newport Mesa Unified School District Series 2010: | ||||
4% 8/1/16 | 625,000 | 710,950 | ||
4% 8/1/17 | 500,000 | 560,735 | ||
North Orange County Cmnty. College District Rev.: | ||||
5% 8/1/14 (Nat'l. Pub. Fin. Guarantee Corp. Insured) | 60,000 | 67,198 | ||
5% 8/1/16 (Nat'l. Pub. Fin. Guarantee Corp. Insured) | 35,000 | 39,883 | ||
Northern California Pwr. Agcy. Cap. Facilities Rev. Series 2010 A: | ||||
3% 8/1/15 | 1,705,000 | 1,805,578 | ||
4% 8/1/16 | 1,335,000 | 1,468,260 | ||
Northern California Pwr. Agcy. Rev.: | ||||
(Geothermal #3 Proj.) Series 2009 A, 5% 7/1/16 | 1,940,000 | 2,258,451 | ||
(Hydroelectric #1 Proj.) Series 2010 A: | ||||
5% 7/1/16 | 1,000,000 | 1,162,630 | ||
5% 7/1/17 | 2,750,000 | 3,232,405 | ||
(Lodi Energy Ctr. Proj.) Series 2010 A, 5% 6/1/15 | 2,295,000 | 2,600,051 | ||
Oakland Joint Powers Fing. Auth. Series 2008 A1: | ||||
4.25% 1/1/13 (Assured Guaranty Corp. Insured) | 1,000,000 | 1,045,450 | ||
5% 1/1/13 (Assured Guaranty Corp. Insured) | 1,320,000 | 1,392,970 | ||
Oakland Unified School District Alameda County Series 2005, 5% 8/1/12 (Nat'l. Pub. Fin. Guarantee Corp. Insured) | 60,000 | 61,815 | ||
Ohlone Cmnty. College District Series 2010: | ||||
4% 8/1/15 | 300,000 | 337,305 | ||
4% 8/1/17 | 450,000 | 510,323 | ||
4% 8/1/18 | 200,000 | 227,186 | ||
Municipal Bonds - continued | ||||
| Principal Amount | Value | ||
California - continued | ||||
Orange County Wtr. District Rev. Ctfs. of Prtn. Series 2009 A: | ||||
3% 8/15/13 | $ 110,000 | $ 114,827 | ||
4% 8/15/15 | 50,000 | 55,969 | ||
Padre Dam Muni. Wtr. District Ctfs. of Prtn. Series 2009 A: | ||||
3% 10/1/13 | 215,000 | 223,155 | ||
3.5% 10/1/14 | 150,000 | 159,431 | ||
4% 10/1/15 | 100,000 | 110,166 | ||
4% 10/1/16 | 100,000 | 110,561 | ||
4% 10/1/17 | 420,000 | 460,727 | ||
Palm Springs Unified School District Series 2011, 4% 8/1/17 | 2,560,000 | 2,898,560 | ||
Pasadena Area Cmnty. College District Gen. Oblig. Series 2009 D: | ||||
4% 8/1/14 | 285,000 | 310,428 | ||
4% 8/1/15 | 250,000 | 279,553 | ||
5% 8/1/17 | 470,000 | 546,140 | ||
5% 8/1/18 | 505,000 | 591,557 | ||
Pasadena Unified School District Gen. Oblig.: | ||||
(Election of 1997 Proj.) Series C, 4.75% 11/1/24 (Pre-Refunded to 11/1/11 @ 101) (c) | 50,000 | 50,851 | ||
Series 2009 A1: | ||||
4% 8/1/14 | 300,000 | 327,036 | ||
5% 8/1/15 | 1,000,000 | 1,151,480 | ||
Placentia Pub. Fing. Auth. Rev. 2.625% 9/1/11 | 750,000 | 750,000 | ||
Pleasanton Unified School District Gen. Oblig. Series 2004 B, 5% 8/1/14 (FSA Insured) | 60,000 | 65,906 | ||
Pomona Pub. Fing. Auth. Rev. 5% 2/1/12 (Escrowed to Maturity) (c) | 10,000 | 10,192 | ||
Port of Oakland Rev. Series M, 5% 11/1/12 (Nat'l. Pub. Fin. Guarantee Corp. Insured) | 85,000 | 89,513 | ||
Poway Unified School District Pub. Fing. Auth. Lease Rev. Bonds: | ||||
Series 2008 B, 0%, tender 12/1/14 (FSA Insured) (b) | 5,385,000 | 5,020,112 | ||
Series 2008 C: | ||||
3.125%, tender 12/1/11 (FSA Insured) (b) | 665,000 | 668,012 | ||
4%, tender 12/1/11 (FSA Insured) (b) | 1,500,000 | 1,509,885 | ||
Rancho Mirage Joint Powers Fing. Auth. Rev. (Eisenhower Med. Ctr. Proj.) Series A, 5% 7/1/14 | 1,205,000 | 1,283,084 | ||
Rancho Santiago Cmnty. College District 5% 9/1/16 (FSA Insured) | 45,000 | 51,712 | ||
Municipal Bonds - continued | ||||
| Principal Amount | Value | ||
California - continued | ||||
Riverside County Asset Leasing Corp. Leasehold Rev. (Riverside County Hosp. Proj.) Series A, 6.5% 6/1/12 (Nat'l. Pub. Fin. Guarantee Corp. Insured) | $ 380,000 | $ 394,995 | ||
Sacramento Area Flood Cont. Agcy. Series 2008, 4% 10/1/14 (Berkshire Hathaway Assurance Corp. Insured) | 1,000,000 | 1,092,050 | ||
Sacramento City Fing. Auth. Lease Rev.: | ||||
Series 1993 B, 5.4% 11/1/20 | 2,855,000 | 3,133,619 | ||
Series A, 5.4% 11/1/20 (AMBAC Insured) | 1,250,000 | 1,372,025 | ||
Sacramento City Fing. Auth. Rev. (Solid Waste, Redev. and Master Lease Prog. Facilities Proj.) Series 2005, 5% 12/1/14 (FGIC Insured) | 40,000 | 44,125 | ||
Sacramento Cogeneration Auth. Cogeneration Proj. Rev. (Proctor & Gamble Proj.) Series 2009: | ||||
5% 7/1/12 | 500,000 | 517,490 | ||
5% 7/1/13 | 625,000 | 669,838 | ||
5% 7/1/14 | 550,000 | 605,341 | ||
5% 7/1/16 | 1,275,000 | 1,458,702 | ||
Sacramento County (Pub. Facilities Proj.): | ||||
5% 2/1/12 | 2,000,000 | 2,026,580 | ||
5% 2/1/16 | 3,000,000 | 3,231,540 | ||
Sacramento Muni. Util. District Elec. Rev. Series 2002 Q, 5.25% 8/15/17 (FSA Insured) | 1,000,000 | 1,037,030 | ||
Sacramento Pwr. Auth. Cogeneration Proj. Rev.: | ||||
Series 2005 A, 5% 7/1/18 (AMBAC Insured) | 2,800,000 | 2,907,156 | ||
Series 2005, 5% 7/1/19 (AMBAC Insured) | 2,900,000 | 3,000,572 | ||
San Bernardino Cmnty. College District Series A: | ||||
5% 8/1/16 | 215,000 | 249,336 | ||
5% 8/1/17 | 150,000 | 175,572 | ||
San Bernardino County Ctfs. of Prtn. (Arrowhead Proj.): | ||||
Series 2009 A, 5% 8/1/15 | 5,000,000 | 5,463,900 | ||
Series 2009 B, 5.25% 8/1/19 | 3,285,000 | 3,631,042 | ||
San Diego Cmnty. College District Series 2007, 0% 8/1/16 (FSA Insured) | 3,900,000 | 3,412,851 | ||
San Diego County Calif Wtr. Auth. Series 2011 S1, 5% 7/1/16 | 5,000,000 | 5,910,100 | ||
San Diego County Wtr. Auth. Wtr. Rev. Series A, 5.25% 5/1/13 (Nat'l. Pub. Fin. Guarantee Corp. Insured) | 50,000 | 53,818 | ||
San Diego Pub. Facilities Fing. Auth. Swr. Rev. Series 2009 B, 5% 5/15/12 | 50,000 | 51,623 | ||
San Diego Pub. Facilities Fing. Auth. Wtr. Rev. 5% 8/1/12 | 2,055,000 | 2,138,001 | ||
Municipal Bonds - continued | ||||
| Principal Amount | Value | ||
California - continued | ||||
San Diego Unified School District (Election of 1998 Proj.): | ||||
Series 2002 D, 5.25% 7/1/20 (FGIC Insured) (Pre-Refunded to 7/1/12 @ 101) (c) | $ 3,000,000 | $ 3,142,920 | ||
Series 2003 E: | ||||
5.25% 7/1/20 (FSA Insured) (Pre-Refunded to 7/1/13 @ 101) (c) | 2,000,000 | 2,183,580 | ||
5.25% 7/1/22 (FSA Insured) (Pre-Refunded to 7/1/13 @ 101) (c) | 1,695,000 | 1,850,584 | ||
Series 2004 F, 5% 7/1/16 (FSA Insured) | 75,000 | 83,652 | ||
San Francisco Bldg. Auth. Lease Rev. (Dept. Gen. Svcs. Lease Proj.) Series A, 5% 10/1/13 (Nat'l. Pub. Fin. Guarantee Corp. Insured) | 20,000 | 20,308 | ||
San Francisco City & County Arpts. Commission Int'l. Arpt. Rev. Series 2010 D, 5% 5/1/17 (FSA Insured) | 5,000,000 | 5,789,150 | ||
San Francisco City & County Gen. Oblig. (San Francisco Gen. Hosp. Impt. Proj.) Series 2010 A, 5% 6/15/16 | 11,110,000 | 12,967,703 | ||
San Francisco City & County Redev. Fing. Auth. Tax Allocation Rev.: | ||||
(San Francisco Redev. Projs.) Series 2009 B: | ||||
4% 8/1/13 | 905,000 | 926,150 | ||
5% 8/1/16 | 1,095,000 | 1,175,515 | ||
Series 2007 B, 5% 8/1/16 (Nat'l. Pub. Fin. Guarantee Corp. Insured) | 3,640,000 | 3,873,797 | ||
San Francisco Pub. Utils. Commission Wtr. Rev.: | ||||
Series 2002 B, 5% 11/1/13 (Nat'l. Pub. Fin. Guarantee Corp. Insured) | 650,000 | 684,119 | ||
Series 2010 D, 5% 11/1/16 | 4,445,000 | 5,303,641 | ||
San Jose Gen. Oblig. (Libraries, Parks and Pub. Safety Projs.) 5% 9/1/11 (Nat'l. Pub. Fin. Guarantee Corp. Insured) | 45,000 | 45,000 | ||
San Mateo Unified School District 5% 9/1/15 (FSA Insured) | 25,000 | 28,299 | ||
Santa Clara County Fing. Auth. Lease Rev.: | ||||
(VMC Rfdg. Proj.) Series 1997 A, 6% 11/15/12 (AMBAC Insured) | 240,000 | 255,691 | ||
Series 2010 N: | ||||
5% 5/15/15 | 1,000,000 | 1,130,610 | ||
5% 5/15/16 | 1,000,000 | 1,143,320 | ||
Santa Clara Valley Wtr. District Ctfs. of Prtn. 5.25% 2/1/12 (Nat'l. Pub. Fin. Guarantee Corp. Insured) | 35,000 | 35,690 | ||
Santa Maria Joint Union High School District Gen. Oblig. Series A, 5.375% 8/1/14 (Escrowed to Maturity) (c) | 20,000 | 22,912 | ||
Municipal Bonds - continued | ||||
| Principal Amount | Value | ||
California - continued | ||||
Santa Monica Cmnty. College District Gen. Oblig. Series 2010 A: | ||||
5% 8/1/14 | $ 430,000 | $ 485,294 | ||
5% 8/1/15 | 250,000 | 290,685 | ||
Saugus Union School District Series B, 5% 8/1/14 (FSA Insured) | 55,000 | 61,312 | ||
Semitropic Impt. District Wtr. Storage Rev. Series 2009 A: | ||||
2.5% 12/1/13 | 300,000 | 308,979 | ||
3% 12/1/14 | 250,000 | 263,423 | ||
5% 12/1/15 | 300,000 | 343,998 | ||
South Placer Wastewtr. Auth. Rev. Series C, 4% 11/1/15 | 1,135,000 | 1,258,000 | ||
Southern California Pub. Pwr. Auth. Rev.: | ||||
(Multiple Projs.): | ||||
6.75% 7/1/12 | 30,000 | 31,490 | ||
6.75% 7/1/13 | 65,000 | 71,958 | ||
6.75% 7/1/13 (FSA Insured) | 1,800,000 | 1,999,656 | ||
(San Juan Unit 3 Proj.) Series A, 5.5% 1/1/14 (FSA Insured) | 200,000 | 220,094 | ||
Southern California Pub. Pwr. Auth. Transmission Proj. Rev. Series 2002 B, 5% 7/1/12 (FSA Insured) | 55,000 | 57,155 | ||
Southwestern Cmnty. College District Gen. Oblig.: | ||||
Series 2004, 5% 8/1/15 (Pre-Refunded to 8/1/14 @ 100) (c) | 45,000 | 51,066 | ||
Series B, 5.25% 8/1/14 (Nat'l. Pub. Fin. Guarantee Corp. Insured) | 25,000 | 27,691 | ||
Sweetwater Union High School District Pub. Fing. Auth. Spl. Tax Rev. Series A, 5% 9/1/14 (FSA Insured) | 20,000 | 21,731 | ||
Torrance Unified School District: | ||||
Series 2008 Y, 5.375% 8/1/22 | 1,250,000 | 1,420,713 | ||
Series 2008 Z: | ||||
5.25% 8/1/18 | 1,000,000 | 1,197,860 | ||
5.375% 8/1/22 | 1,750,000 | 2,035,093 | ||
Turlock Irrigation District Rev. Series 2010 A, 5% 1/1/14 | 1,230,000 | 1,341,315 | ||
Univ. of California Regents Med. Ctr. Pool Rev. Series 2010 G, 5% 5/15/17 | 900,000 | 1,036,692 | ||
Univ. of California Revs.: | ||||
(Ltd. Proj.) Series 2010 E, 4% 5/15/17 | 1,150,000 | 1,297,557 | ||
(Multiple Purp. Projs.) Series Q, 5% 9/1/11 (FSA Insured) | 50,000 | 50,000 | ||
Series 2009 O, 5% 5/15/17 | 1,000,000 | 1,188,430 | ||
Municipal Bonds - continued | ||||
| Principal Amount | Value | ||
California - continued | ||||
Univ. of California Revs.: - continued | ||||
Series 2010 S, 5% 5/15/16 | $ 1,785,000 | $ 2,099,767 | ||
Series A, 5% 5/15/12 (AMBAC Insured) | 100,000 | 103,309 | ||
Upland Gen. Oblig. Ctfs. of Prtn.: | ||||
5% 1/1/16 | 1,000,000 | 1,091,010 | ||
5% 1/1/17 | 2,115,000 | 2,307,338 | ||
5% 1/1/18 | 2,220,000 | 2,404,593 | ||
Washington Township Health Care District Gen. Oblig. Series 2009 A, 6.5% 8/1/14 | 1,600,000 | 1,852,640 | ||
Washington Township Health Care District Rev.: | ||||
Series 2009 A: | ||||
4.5% 7/1/12 | 275,000 | 281,575 | ||
4.5% 7/1/13 | 250,000 | 261,703 | ||
5% 7/1/14 | 300,000 | 323,772 | ||
5% 7/1/15 | 520,000 | 570,040 | ||
5% 7/1/16 | 200,000 | 219,984 | ||
Series 2010 A, 5% 7/1/17 | 1,000,000 | 1,098,180 | ||
Series A, 5% 7/1/12 | 385,000 | 395,765 | ||
West Contra Costa Unified School District: | ||||
5% 8/1/18 (FSA Insured) | 1,500,000 | 1,722,015 | ||
5% 8/1/19 (FSA Insured) | 1,500,000 | 1,729,020 | ||
Western Riverside County Trust & Wastewtr. Fin. Auth.: | ||||
4% 9/1/14 (Assured Guaranty Corp. Insured) | 500,000 | 537,890 | ||
5% 9/1/13 (Assured Guaranty Corp. Insured) | 500,000 | 537,385 | ||
Whisman School District Gen. Oblig. Series A, 0% 8/1/14 (Escrowed to Maturity) (c) | 40,000 | 38,937 | ||
| 662,305,413 | |||
Puerto Rico - 0.3% | ||||
Puerto Rico Commonwealth Pub. Impt. Gen. Oblig.: | ||||
Series 1996, 6.5% 7/1/12 (FSA Insured) | 1,140,000 | 1,194,891 | ||
6.5% 7/1/12 (Nat'l. Pub. Fin. Guarantee Corp. Insured) | 75,000 | 78,155 | ||
Puerto Rico Govt. Dev. Bank Series 2006 B, 5% 12/1/12 | 1,000,000 | 1,041,050 | ||
| 2,314,096 | |||
Virgin Islands - 0.9% | ||||
Virgin Islands Pub. Fin. Auth.: | ||||
(Cruzan Proj.) Series 2009 A: | ||||
5% 10/1/14 | 640,000 | 687,962 | ||
5% 10/1/15 | 600,000 | 657,930 | ||
Municipal Bonds - continued | ||||
| Principal Amount | Value | ||
Virgin Islands - continued | ||||
Virgin Islands Pub. Fin. Auth.: - continued | ||||
(Sr. Lien/Working Cap. Proj.) Series 2010 A, 5% 10/1/16 | $ 1,000,000 | $ 1,110,270 | ||
Series 2009 A, 6% 10/1/14 | 1,250,000 | 1,364,913 | ||
Series 2009 B, 5% 10/1/16 | 2,000,000 | 2,220,540 | ||
| 6,041,615 | |||
TOTAL MUNICIPAL BONDS (Cost $646,195,435) | 670,661,124 | |||
Municipal Notes - 0.2% | |||
|
|
|
|
California - 0.2% | |||
Baldwin Park Unified School District Gen. Oblig. BAN Series 2009, 0% 8/1/14 | 1,500,000 | 1,410,930 | |
TOTAL INVESTMENT PORTFOLIO - 95.7% (Cost $647,494,203) | 672,072,054 | ||
NET OTHER ASSETS (LIABILITIES) - 4.3% | 30,316,504 | ||
NET ASSETS - 100% | $ 702,388,558 | ||
Security Type Abbreviations | ||
BAN | - | BOND ANTICIPATION NOTE |
Legend |
(a) Security or a portion of the security purchased on a delayed delivery or when-issued basis. |
(b) Coupon rates for floating and adjustable rate securities reflect the rates in effect at period end. |
(c) Security collateralized by an amount sufficient to pay interest and principal. |
Other Information |
All investments are categorized as Level 2 under the Fair Value Hierarchy. The inputs or methodology used for valuing securities may not be an indication of the risk associated with investing in those securities. For more information on valuation inputs, please refer to the Security Valuation section in the accompanying Notes to Financial Statements. |
Other Information |
The distribution of municipal securities by revenue source, as a percentage of total net assets, is as follows (Unaudited): |
General Obligations | 37.2% |
Escrowed/Pre-Refunded | 12.7% |
Electric Utilities | 9.7% |
Special Tax | 9.2% |
Health Care | 9.1% |
Water & Sewer | 8.9% |
Others* (Individually Less Than 5%) | 13.2% |
| 100.0% |
*Includes net other assets |
See accompanying notes which are an integral part of the financial statements.
Semiannual Report
Financial Statements
Statement of Assets and Liabilities
| August 31, 2011 (Unaudited) | |
|
|
|
Assets | ||
Investment in securities, at value - See accompanying schedule: Unaffiliated issuers (cost $647,494,203) |
| $ 672,072,054 |
Cash | 41,519,271 | |
Receivable for investments sold | 3,385,513 | |
Receivable for fund shares sold | 384,186 | |
Interest receivable | 6,397,202 | |
Receivable from investment adviser for expense | 70,513 | |
Other receivables | 3,935 | |
Total assets | 723,832,674 | |
|
|
|
Liabilities | ||
Payable for investments purchased | $ 3,677,465 | |
Delayed delivery | 16,380,648 | |
Payable for fund shares redeemed | 719,319 | |
Distributions payable | 254,773 | |
Accrued management fee | 211,700 | |
Other affiliated payables | 171,112 | |
Other payables and accrued expenses | 29,099 | |
Total liabilities | 21,444,116 | |
|
|
|
Net Assets | $ 702,388,558 | |
Net Assets consist of: |
| |
Paid in capital | $ 677,515,931 | |
Undistributed net investment income | 3,639 | |
Accumulated undistributed net realized gain (loss) on investments | 291,137 | |
Net unrealized appreciation (depreciation) on investments | 24,577,851 | |
Net Assets, for 65,266,872 shares outstanding | $ 702,388,558 | |
Net Asset Value, offering price and redemption price per share ($702,388,558 ÷ 65,266,872 shares) | $ 10.76 | |
See accompanying notes which are an integral part of the financial statements.
Semiannual Report
Financial Statements - continued
Statement of Operations
Six months ended August 31, 2011 (Unaudited) | ||
|
|
|
Investment Income |
|
|
Interest |
| $ 9,136,670 |
|
|
|
Expenses | ||
Management fee | $ 1,205,683 | |
Transfer agent fees | 255,378 | |
Accounting fees and expenses | 77,287 | |
Custodian fees and expenses | 3,790 | |
Independent trustees' compensation | 1,133 | |
Registration fees | 10,760 | |
Audit | 26,103 | |
Legal | 2,606 | |
Miscellaneous | 3,774 | |
Total expenses before reductions | 1,586,514 | |
Expense reductions | (430,779) | 1,155,735 |
Net investment income (loss) | 7,980,935 | |
Realized and Unrealized Gain (Loss) Net realized gain (loss) on: | ||
Investment securities: |
|
|
Unaffiliated issuers |
| 295,778 |
Change in net unrealized appreciation (depreciation) on investment securities | 13,938,637 | |
Net gain (loss) | 14,234,415 | |
Net increase (decrease) in net assets resulting from operations | $ 22,215,350 | |
See accompanying notes which are an integral part of the financial statements.
Semiannual Report
Statement of Changes in Net Assets
| Six months ended August 31, 2011 (Unaudited) | Year ended |
Increase (Decrease) in Net Assets |
|
|
Operations |
|
|
Net investment income (loss) | $ 7,980,935 | $ 15,895,515 |
Net realized gain (loss) | 295,778 | 432,276 |
Change in net unrealized appreciation (depreciation) | 13,938,637 | (7,711,402) |
Net increase (decrease) in net assets resulting | 22,215,350 | 8,616,389 |
Distributions to shareholders from net investment income | (7,980,618) | (15,894,070) |
Distributions to shareholders from net realized gain | (297,742) | (478,730) |
Total distributions | (8,278,360) | (16,372,800) |
Share transactions | 144,645,629 | 377,846,139 |
Reinvestment of distributions | 6,746,315 | 13,223,341 |
Cost of shares redeemed | (90,630,410) | (381,090,557) |
Net increase (decrease) in net assets resulting from share transactions | 60,761,534 | 9,978,923 |
Redemption fees | 1,242 | 13,232 |
Total increase (decrease) in net assets | 74,699,766 | 2,235,744 |
|
|
|
Net Assets | ||
Beginning of period | 627,688,792 | 625,453,048 |
End of period (including undistributed net investment income of $3,639 and undistributed net investment income of $3,322, respectively) | $ 702,388,558 | $ 627,688,792 |
Other Information Shares | ||
Sold | 13,586,189 | 35,471,925 |
Issued in reinvestment of distributions | 633,191 | 1,242,819 |
Redeemed | (8,520,372) | (35,920,917) |
Net increase (decrease) | 5,699,008 | 793,827 |
See accompanying notes which are an integral part of the financial statements.
Semiannual Report
Financial Highlights
| Six months ended August 31, 2011 | Years ended February 28, | ||||
| (Unaudited) | 2011 | 2010 | 2009 | 2008F | 2007 |
Selected Per-Share Data |
|
|
|
|
| |
Net asset value, beginning of period | $ 10.54 | $ 10.64 | $ 10.35 | $ 10.09 | $ 10.08 | $ 10.06 |
Income from Investment Operations |
|
|
|
|
|
|
Net investment income (loss)D | .128 | .249 | .263 | .295 | .335 | .328 |
Net realized and unrealized gain (loss) | .226 | (.092) | .308 | .263 | .017 | .021 |
Total from investment operations | .354 | .157 | .571 | .558 | .352 | .349 |
Distributions from net investment income | (.129) | (.249) | (.266) | (.299) | (.336) | (.328) |
Distributions from net realized gain | (.005) | (.008) | (.015) | - | (.007) | (.001) |
Total distributions | (.134) | (.257) | (.281) | (.299) | (.343) | (.329) |
Redemption fees added to paid in capitalD | -G | -G | -G | .001 | .001 | -G |
Net asset value, end of period | $ 10.76 | $ 10.54 | $ 10.64 | $ 10.35 | $ 10.09 | $ 10.08 |
Total ReturnB,C | 3.37% | 1.48% | 5.58% | 5.62% | 3.55% | 3.54% |
Ratios to Average Net AssetsE |
|
|
|
|
| |
Expenses before | .48%A | .48% | .50% | .49% | .52% | .57% |
Expenses net of fee waivers, if any | .35%A | .35% | .35% | .35% | .35% | .35% |
Expenses net of all | .35%A | .34% | .35% | .31% | .27% | .26% |
Net investment income (loss) | 2.40%A | 2.34% | 2.51% | 2.90% | 3.32% | 3.27% |
Supplemental Data |
|
|
|
|
|
|
Net assets, end of period (000 omitted) | $ 702,389 | $ 627,689 | $ 625,453 | $ 355,044 | $ 147,546 | $ 102,049 |
Portfolio turnover rate | 13%A | 22% | 19% | 18% | 13% | 16% |
A Annualized
B Total returns for periods of less than one year are not annualized.
C Total returns would have been lower if certain expenses had not been reduced during the applicable periods shown.
D Calculated based on average shares outstanding during the period.
E Expense ratios reflect operating expenses of the Fund. Expenses before reductions do not reflect amounts reimbursed by the investment adviser or reductions from expense offset arrangements and do not represent the amount paid by the Fund during periods when reimbursements or reductions occur. Expenses net of fee waivers reflect expenses after reimbursement by the investment adviser but prior to reductions from expense offset arrangements. Expenses net of all reductions represent the net expenses paid by the Fund.
F For the year ended February 29.
G Amount represents less than $.001 per share.
See accompanying notes which are an integral part of the financial statements.
Semiannual Report
Notes to Financial Statements
For the period ended August 31, 2011 (Unaudited)
1. Organization.
Fidelity California Short-Intermediate Tax-Free Bond Fund (the Fund) is a non-diversified fund of Fidelity California Municipal Trust (the Trust) and is authorized to issue an unlimited number of shares. The Trust is registered under the Investment Company Act of 1940, as amended (the 1940 Act), as an open-end management investment company organized as a Massachusetts business trust. The Fund may be affected by economic and political developments in the state of California.
2. Significant Accounting Policies.
The financial statements have been prepared in conformity with accounting principles generally accepted in the United States of America (GAAP), which require management to make certain estimates and assumptions at the date of the financial statements. Actual results could differ from those estimates. Subsequent events, if any, through the date that the financial statements were issued have been evaluated in the preparation of the financial statements. The following summarizes the significant accounting policies of the Fund:
Security Valuation. Investments are valued as of 4:00 p.m. Eastern time on the last calendar day of the period. The Fund uses independent pricing services approved by the Board of Trustees to value its investments. When current market prices or quotations are not readily available or reliable, valuations may be determined in good faith in accordance with procedures adopted by the Board of Trustees. Factors used in determining value may include market or security specific events, changes in interest rates and credit quality. The frequency with which these procedures are used cannot be predicted and they may be utilized to a significant extent. The value used for net asset value (NAV) calculation under these procedures may differ from published prices for the same securities.
The Fund categorizes the inputs to valuation techniques used to value its investments into a disclosure hierarchy consisting of three levels as shown below:
Level 1 - quoted prices in active markets for identical investments
Level 2 - other significant observable inputs (including quoted prices for similar investments, interest rates, prepayment speeds, etc.)
Level 3 - unobservable inputs (including the Fund's own assumptions based on the best information available)
Changes in valuation techniques may result in transfers in or out of an assigned level within the disclosure hierarchy. Valuation techniques used to value the Fund's investments by major category are as follows:
Semiannual Report
Notes to Financial Statements (Unaudited) - continued
2. Significant Accounting Policies - continued
Security Valuation - continued
Debt securities, including restricted securities, are valued based on evaluated prices received from independent pricing services or from dealers who make markets in such securities. For municipal securities, pricing services utilize matrix pricing which considers yield or price of bonds of comparable quality, coupon, maturity and type as well as dealer supplied prices and are generally categorized as Level 2 in the hierarchy. When independent prices are unavailable or unreliable, debt securities may be valued utilizing pricing matrices which consider similar factors that would be used by independent pricing services. These are generally categorized as Level 2 in the hierarchy but may be Level 3 depending on the circumstances.
Investment Transactions and Income. For financial reporting purposes, the Fund's investment holdings and NAV include trades executed through the end of the last business day of the period. The NAV per share for processing shareholder transactions is calculated as of the close of business of the New York Stock Exchange (NYSE), normally 4:00 p.m. Eastern time and includes trades executed through the end of the prior business day. Gains and losses on securities sold are determined on the basis of identified cost. Interest income is accrued as earned. Interest income includes coupon interest and amortization of premium and accretion of discount on debt securities.
Expenses. Expenses directly attributable to a fund are charged to that fund. Expenses attributable to more than one fund are allocated among the respective funds on the basis of relative net assets or other appropriate methods. Expense estimates are accrued in the period to which they relate and adjustments are made when actual amounts are known.
Income Tax Information and Distributions to Shareholders. Each year, the Fund intends to qualify as a regulated investment company, including distributing substantially all of its taxable income and realized gains under Subchapter M of the Internal Revenue Code and filing its U.S. federal tax return. As a result, no provision for income taxes is required. A fund's federal tax return is subject to examination by the Internal Revenue Service (IRS) for a period of three years.
Dividends are declared and recorded daily and paid monthly from net investment income. Distributions from realized gains, if any, are declared and recorded on the ex-dividend date. Income and capital gain distributions are determined in accordance with income tax regulations, which may differ from GAAP.
Capital accounts within the financial statements are adjusted for permanent book-tax differences. These adjustments have no impact on net assets or the results of operations. Temporary book-tax differences will reverse in a subsequent period.
Book-tax differences are primarily due to market discount.
Semiannual Report
2. Significant Accounting Policies - continued
Income Tax Information and Distributions to Shareholders - continued
The Fund purchases municipal securities whose interest, in the opinion of the issuer, is free from federal income tax. There is no assurance that the IRS will agree with this opinion. In the event the IRS determines that the issuer does not comply with relevant tax requirements, interest payments from a security could become federally taxable, possibly retroactively to the date the security was issued.
The federal tax cost of investment securities and unrealized appreciation (depreciation) as of period end were as follows:
Gross unrealized appreciation | $ 24,753,501 |
Gross unrealized depreciation | (173,944) |
Net unrealized appreciation (depreciation) on securities and other investments | $ 24,579,557 |
|
|
Tax cost | $ 647,492,497 |
Under the recently enacted Regulated Investment Company Modernization Act of 2010 (the Act), the Fund will be permitted to carry forward capital losses incurred in taxable years beginning after December 22, 2010 for an unlimited period. However, any losses incurred during those future taxable years will be required to be utilized prior to any losses incurred in pre-enactment taxable years, which generally expire after eight years from when they are incurred. Additionally, post-enactment capital losses that are carried forward will retain their character as either short-term or long-term capital losses rather than being considered all short-term as under previous law. The Fund's first fiscal year end subject to the Act will be February 28, 2012.
Short-Term Trading (Redemption) Fees. Shares held by investors in the Fund less than 30 days are subject to a redemption fee equal to .50% of the net asset value of shares redeemed. All redemption fees, which reduce the proceeds of the shareholder redemption, are retained by the Fund and accounted for as an addition to paid in capital.
3. Operating Policies.
Delayed Delivery Transactions and When-Issued Securities. During the period, the Fund transacted in securities on a delayed delivery or when-issued basis. Payment and delivery may take place after the customary settlement period for that security. The price of the underlying securities and the date when the securities will be delivered and paid for are fixed at the time the transaction is negotiated. During the time a delayed delivery sell is outstanding, the contract is marked-to-market daily and equivalent deliverable securities are held for the transaction. The securities purchased on a delayed
Semiannual Report
Notes to Financial Statements (Unaudited) - continued
3. Operating Policies - continued
Delayed Delivery Transactions and When-Issued Securities - continued
delivery or when-issued basis are identified as such in the Fund's Schedule of Investments. The Fund may receive compensation for interest forgone in the purchase of a delayed delivery or when-issued security. With respect to purchase commitments, the Fund identifies securities as segregated in its records with a value at least equal to the amount of the commitment. Losses may arise due to changes in the value of the underlying securities or if the counterparty does not perform under the contract's terms, or if the issuer does not issue the securities due to political, economic, or other factors.
4. Purchases and Sales of Investments.
Purchases and sales of securities, other than short-term securities, aggregated $85,035,784 and $43,141,906, respectively.
5. Fees and Other Transactions with Affiliates.
Management Fee. Fidelity Management & Research Company (FMR) and its affiliates provide the Fund with investment management related services for which the Fund pays a monthly management fee. The management fee is the sum of an individual fund fee rate that is based on an annual rate of .25% of the Fund's average net assets and a group fee rate that averaged .11% during the period. The group fee rate is based upon the average net assets of all the mutual funds advised by FMR. The group fee rate decreases as assets under management increase and increases as assets under management decrease. For the period, the total annualized management fee rate was .36% of the Fund's average net assets.
Transfer Agent and Accounting Fees. Citibank, N.A. (Citibank) is the custodian, transfer agent and servicing agent for the Fund. Citibank has entered into a sub-arrangement with Fidelity Investments Institutional Operations Company, Inc. (FIIOC), an affiliate of FMR, under which FIIOC performs the activities associated with the Fund's transfer agency, dividend disbursing and shareholder servicing functions. The Fund pays account fees and asset-based fees that vary according to account size and type of account. FIIOC pays for typesetting, printing and mailing of shareholder reports, except proxy statements. For the period, transfer agent fees were equivalent to an annualized rate of .08% of average net assets.
Citibank also has a sub-arrangement with Fidelity Service Company, Inc. (FSC), an affiliate of FMR, under which FSC maintains the Fund's accounting records. The fee is based on the level of average net assets for the month.
Semiannual Report
6. Committed Line of Credit.
The Fund participates with other funds managed by FMR or an affiliate in a $4.0 billion credit facility (the "line of credit") to be utilized for temporary or emergency purposes to fund shareholder redemptions or for other short-term liquidity purposes. The Fund has agreed to pay commitment fees on its pro-rata portion of the line of credit, which amounted to $1,011 and is reflected in Miscellaneous expenses on the Statement of Operations. During the period, there were no borrowings on this line of credit.
7. Expense Reductions.
FMR voluntarily agreed to reimburse the Fund to the extent annual operating expenses exceeded .35% of average net assets. During the period this reimbursement reduced the Fund's expenses by $422,595.
Through arrangements with the Fund's custodian and transfer agent, credits realized as a result of uninvested cash balances were used to reduce the Fund's expenses. During the period, these credits reduced the Fund's custody and transfer agent expenses by $3,790 and $4,394, respectively.
8. Other.
The Fund's organizational documents provide former and current trustees and officers with a limited indemnification against liabilities arising in connection with the performance of their duties to the Fund. In the normal course of business, the Fund may also enter into contracts that provide general indemnifications. The Fund's maximum exposure under these arrangements is unknown as this would be dependent on future claims that may be made against the Fund. The risk of material loss from such claims is considered remote.
Semiannual Report
Managing Your Investments
Fidelity offers several ways to conveniently manage your personal investments via your telephone or PC. You can access your account information, conduct trades and research your investments 24 hours a day.
By Phone
Fidelity Automated Service Telephone provides a single toll-free number to access account balances, positions, quotes and trading. It's easy to navigate the service, and on your first call, the system will help you create a personal identification number (PIN) for security.
(phone_graphic)Fidelity Automated
Service Telephone (FAST®)
1-800-544-5555
Press
For mutual fund and brokerage trading.
For quotes.*
For account balances and holdings.
To review orders and mutual
fund activity.
To change your PIN.
To speak to a Fidelity representative.
By PC
Fidelity's web site on the Internet provides a wide range of information, including daily financial news, fund performance, interactive planning tools and news about Fidelity products and services.
(computer_graphic)Fidelity's Web Site
www.fidelity.com
* When you call the quotes line, please remember that a fund's yield and return will vary and, except for money market funds, share price will also vary. This means that you may have a gain or loss when you sell your shares. There is no assurance that money market funds will be able to maintain a stable $1 share price; an investment in a money market fund is not insured or guaranteed by the U.S. government. Total returns are historical and include changes in share price, reinvestment of dividends and capital gains distributions, and the effects of any sales charges.
Semiannual Report
To Write Fidelity
We'll give your correspondence immediate attention and send you written confirmation upon completion of your request.
(letter_graphic)Making Changes
To Your Account
(such as changing name, address, bank, etc.)
Fidelity Investments
P.O. Box 770001
Cincinnati, OH 45277-0002
(letter_graphic)For Non-Retirement
Accounts
Buying shares
Fidelity Investments
P.O. Box 770001
Cincinnati, OH 45277-0003
Overnight Express
Fidelity Investments
Attn: Distribution Services
100 Crosby Parkway - KC1H
Covington, KY 41015
Selling shares
Fidelity Investments
P.O. Box 770001
Cincinnati, OH 45277-0035
Overnight Express
Fidelity Investments
Attn: Distribution Services
100 Crosby Parkway - KC1H
Covington, KY 41015
General Correspondence
Fidelity Investments
P.O. Box 500
Merrimack, NH 03054-0500
(letter_graphic)For Retirement
Accounts
Buying shares
Fidelity Investments
P.O. Box 770001
Cincinnati, OH 45277-0003
Selling shares
Fidelity Investments
P.O. Box 770001
Cincinnati, OH 45277-0035
Overnight Express
Fidelity Investments
Attn: Distribution Services
100 Crosby Parkway - KC1H
Covington, KY 41015
General Correspondence
Fidelity Investments
P.O. Box 500
Merrimack, NH 03054-0500
Semiannual Report
To Visit Fidelity
For directions and hours,
please call 1-800-544-9797.
Arizona
7001 West Ray Road
Chandler, AZ
15445 N. Scottsdale Road
Scottsdale, AZ
17550 North 75th Avenue
Glendale, AZ
5330 E. Broadway Blvd
Tucson, AZ
California
815 East Birch Street
Brea, CA
1411 Chapin Avenue
Burlingame, CA
851 East Hamilton Avenue
Campbell, CA
601 Larkspur Landing Circle
Larkspur, CA
2000 Avenue of the Stars
Los Angeles, CA
27101 Puerta Real
Mission Viejo, CA
73575 El Paseo
Palm Desert, CA
251 University Avenue
Palo Alto, CA
123 South Lake Avenue
Pasadena, CA
16656 Bernardo Ctr. Drive
Rancho Bernardo, CA
1220 Roseville Parkway
Roseville, CA
1740 Arden Way
Sacramento, CA
7676 Hazard Center Drive
San Diego, CA
11943 El Camino Real
San Diego, CA
8 Montgomery Street
San Francisco, CA
3793 State Street
Santa Barbara, CA
1200 Wilshire Boulevard
Santa Monica, CA
398 West El Camino Real
Sunnyvale, CA
111 South Westlake Blvd
Thousand Oaks, CA
21701 Hawthorne Boulevard
Torrance, CA
2001 North Main Street
Walnut Creek, CA
6326 Canoga Avenue
Woodland Hills, CA
2211 Michelson Drive
Irvine, CA
Colorado
281 East Flatiron Circle
Broomfield, CO
1625 Broadway
Denver, CO
9185 Westview Road
Lone Tree, CO
Connecticut
48 West Putnam Avenue
Greenwich, CT
265 Church Street
New Haven, CT
300 Atlantic Street
Stamford, CT
29 South Main Street
West Hartford, CT
1261 Post Road
Fairfield, CT
Delaware
400 Delaware Avenue
Wilmington, DE
Florida
175 East Altamonte Drive
Altamonte Springs, FL
1400 Glades Road
Boca Raton, FL
121 Alhambra Plaza
Coral Gables, FL
2948 N. Federal Highway
Ft. Lauderdale, FL
4671 Town Center Parkway
Jacksonville, FL
8880 Tamiami Trail, North
Naples, FL
230 Royal Palm Way
Palm Beach, FL
3501 PGA Boulevard
Palm Beach Gardens, FL
3550 Tamiami Trail, South
Sarasota, FL
1502 N. Westshore Blvd.
Tampa, FL
2465 State Road 7
Wellington, FL
Georgia
3242 Peachtree Road
Atlanta, GA
1000 Abernathy Road
Atlanta, GA
Illinois
One North LaSalle Street
Chicago, IL
401 North Michigan Avenue
Chicago, IL
One Skokie Valley Road
Highland Park, IL
1415 West 22nd Street
Oak Brook, IL
15105 S LaGrange Road
Orland Park, IL
1572 East Golf Road
Schaumburg, IL
1823 Freedom Drive
Naperville, IL
Indiana
8480 Keystone Crossing
Indianapolis, IN
Kansas
5400 College Boulevard
Overland Park, KS
Maine
Three Canal Plaza
Portland, ME
Maryland
7315 Wisconsin Avenue
Bethesda, MD
610 York Road
Towson, MD
Massachusetts
801 Boylston Street
Boston, MA
155 Congress Street
Boston, MA
300 Granite Street
Braintree, MA
44 Mall Road
Burlington, MA
238 Main Street
Cambridge, MA
200 Endicott Street
Danvers, MA
Fidelity Brokerage Services, Inc., 100 Summer St., Boston, MA 02110 Member NYSE/SIPC
Semiannual Report
405 Cochituate Road
Framingham, MA
551 Boston Turnpike
Shrewsbury, MA
Michigan
500 E. Eisenhower Pkwy.
Ann Arbor, MI
280 N. Old Woodward Ave.
Birmingham, MI
30200 Northwestern Hwy.
Farmington Hills, MI
43420 Grand River Avenue
Novi, MI
3480 28th Street
Grand Rapids, MI
2425 S. Linden Road STE E
Flint, MI
Minnesota
7740 France Avenue South
Edina, MN
8342 3rd Street North
Oakdale, MN
Missouri
1524 South Lindbergh Blvd.
St. Louis, MO
Nevada
2225 Village Walk Drive
Henderson, NV
New Jersey
501 Route 73 South
Marlton, NJ
150 Essex Street
Millburn, NJ
35 Morris Street
Morristown, NJ
396 Route 17, North
Paramus, NJ
3518 Route 1 North
Princeton, NJ
530 Broad Street
Shrewsbury, NJ
New Mexico
2261 Q Street NE
Albuquerque, NM
New York
1130 Franklin Avenue
Garden City, NY
37 West Jericho Turnpike
Huntington Station, NY
1271 Avenue of the Americas
New York, NY
980 Madison Avenue
New York, NY
61 Broadway
New York, NY
350 Park Avenue
New York, NY
200 Fifth Avenue
New York, NY
733 Third Avenue
New York, NY
2070 Broadway
New York, NY
1075 Northern Blvd.
Roslyn, NY
799 Central Park Avenue
Scarsdale, NY
3349 Monroe Avenue
Rochester, NY
North Carolina
4611 Sharon Road
Charlotte, NC
7011 Fayetteville Road
Durham, NC
Ohio
3805 Edwards Road
Cincinnati, OH
1324 Polaris Parkway
Columbus, OH
1800 Crocker Road
Westlake, OH
28699 Chagrin Boulevard
Woodmere Village, OH
Oregon
7493 SW Bridgeport Road
Tigard, OR
Pennsylvania
600 West DeKalb Pike
King of Prussia, PA
1735 Market Street
Philadelphia, PA
12001 Perry Highway
Wexford, PA
Rhode Island
10 Memorial Boulevard
Providence, RI
Tennessee
3018 Peoples Street
Johnson City, TN
7628 West Farmington Blvd.
Germantown, TN
2035 Mallory Lane
Franklin, TN
Texas
10000 Research Boulevard
Austin, TX
4001 Northwest Parkway
Dallas, TX
12532 Memorial Drive
Houston, TX
2701 Drexel Drive
Houston, TX
6560 Fannin Street
Houston, TX
1701 Lake Robbins Drive
The Woodlands, TX
6500 N. MacArthur Blvd.
Irving, TX
6005 West Park Boulevard
Plano, TX
1576 East Southlake Blvd.
Southlake, TX
15600 Southwest Freeway
Sugar Land, TX
139 N. Loop 1604 East
San Antonio, TX
Utah
279 West South Temple
Salt Lake City, UT
Virginia
1861 International Drive
McLean, VA
11957 Democracy Drive
Reston, VA
Washington
10500 NE 8th Street
Bellevue, WA
1518 6th Avenue
Seattle, WA
304 Strander Blvd
Tukwila, WA
Washington, DC
1900 K Street, N.W.
Washington, DC
Wisconsin
16020 West Bluemound Road
Brookfield, WI
Semiannual Report
Investment Adviser
Fidelity Management & Research Company
Boston, MA
Investment Sub-Adviser
Fidelity Management & Research
(Hong Kong) Limited
Fidelity Management & Research
(Japan) Inc.
Fidelity Management & Research
(U.K.) Inc.
Fidelity Investments
Money Management, Inc.
General Distributor
Fidelity Distributors Corporation
Boston, MA
Transfer and Service Agents
Citibank, N.A.
New York, NY
Fidelity Investments Institutional Operations Company, Inc.
Boston, MA
Custodian
Citibank, N.A.
New York, NY
The Fidelity Telephone Connection
Mutual Fund 24-Hour Service
Exchanges/Redemptions
and Account Assistance 1-800-544-6666
Product Information 1-800-544-6666
Retirement Accounts 1-800-544-4774 (8 a.m. - 9 p.m.)
TDD Service 1-800-544-0118
for the deaf and hearing impaired
(9 a.m. - 9 p.m. Eastern time)
Fidelity Automated Service
Telephone (FAST®)
1-800-544-5555
Automated line for quickest service
CSI-USAN-1011
1.817079.105
(Fidelity Investment logo)(registered trademark)
Fidelity Advisor®
California Municipal Income
Fund - Class A, Class T, Class B
and Class C
Semiannual Report
August 31, 2011
(2_fidelity_logos) (Registered_Trademark)
Class A, Class T, Class B, and Class C are classes of Fidelity® California Municipal Income Fund
Contents
Chairman's Message | The Chairman's message to shareholders. | |
Shareholder Expense Example | An example of shareholder expenses. | |
Investment Changes | A summary of major shifts in the fund's investments over the past six months. | |
Investments | A complete list of the fund's investments with their market values. | |
Financial Statements | Statements of assets and liabilities, operations, and changes in net assets, | |
Notes | Notes to the financial statements. |
To view a fund's proxy voting guidelines and proxy voting record for the 12-month period ended June 30, visit http://www.fidelity.com/proxyvotingresults or visit the Securities and Exchange Commission's (SEC) web site at http://www.sec.gov. You may also call 1-877-208-0098 to request a free copy of the proxy voting guidelines.
Standard & Poor's, S&P and S&P 500 are registered service marks of The McGraw-Hill Companies, Inc. and have been licensed for use by Fidelity Distributors Corporation.
Other third party marks appearing herein are the property of their respective owners.
All other marks appearing herein are registered or unregistered trademarks or service marks of FMR LLC or an affiliated company.
This report and the financial statements contained herein are submitted for the general information of the shareholders of the fund. This report is not authorized for distribution to prospective investors in the fund unless preceded or accompanied by an effective prospectus.
A fund files its complete schedule of portfolio holdings with the SEC for the first and third quarters of each fiscal year on Form N-Q. Forms N-Q are available on the SEC's web site at http://www.sec.gov. A fund's Forms N-Q may be reviewed and copied at the SEC's Public Reference Room in Washington, DC. Information regarding the operation of the SEC's Public Reference Room may be obtained by calling 1-800-SEC-0330. For a complete list of a fund's portfolio holdings, view the most recent holdings listing, semiannual report, or annual report on Fidelity's web site at http://www.fidelity.com, http://www.advisor.fidelity.com, or http://www.401k.com, as applicable.
NOT FDIC INSURED • MAY LOSE VALUE • NO BANK GUARANTEE
Neither the fund nor Fidelity Distributors Corporation is a bank.
Semiannual Report
Chairman's Message
(Chairmans photo appears here)
Dear Shareholder:
U.S. equities remained in a significant midyear downturn that began in May and intensified in the final week of July and the early part of August, when Standard & Poor's announced it was lowering its long-term sovereign credit rating of the United States. The historic downgrade followed a political stalemate in which Congress struggled to address the debt ceiling issue before an early-August deadline, resulting in heightened investor anxiety and volatility across major financial markets. Financial markets are always unpredictable, of course, but there are several time-tested investment principles that can help put the odds in your favor.
One of the basic tenets is to invest for the long term. Over time, riding out the markets' inevitable ups and downs has proven much more effective than selling into panic or chasing the hottest trend. Even missing only a few of the markets' best days can significantly diminish investor returns. Patience also affords the benefits of compounding - of earning interest on additional income or reinvested dividends and capital gains. There can be tax advantages and cost benefits to consider as well. While staying the course doesn't eliminate risk, it can considerably lessen the effect of short-term declines.
You can further manage your investing risk through diversification. And today, more than ever, geographic diversification should be taken into account. Studies indicate that asset allocation is the single most important determinant of a portfolio's long-term success. The right mix of stocks, bonds and cash - aligned to your particular risk tolerance and investment objective - is very important. Age-appropriate rebalancing is also an essential aspect of asset allocation. For younger investors, an emphasis on equities - which historically have been the best-performing asset class over time - is encouraged. As investors near their specific goal, such as retirement or sending a child to college, consideration may be given to replacing volatile assets (e.g. common stocks) with more-stable fixed investments (bonds or savings plans).
A third principle - investing regularly - can help lower the average cost of your purchases. Investing a certain amount of money each month or quarter helps ensure you won't pay for all your shares at market highs. This strategy - known as dollar cost averaging - also reduces "emotion" from investing, helping shareholders avoid selling weak performers just prior to an upswing, or chasing a hot performer just before a correction.
We invite you to contact us via the Internet, through our Investor Centers or by phone. It is our privilege to provide you the information you need to make the investments that are right for you.
Sincerely,
(Chairmans signature appears here)
Abigail P. Johnson
Semiannual Report
Shareholder Expense Example
As a shareholder of the Fund, you incur two types of costs: (1) transaction costs, including sales charges (loads) on purchase payments or redemption proceeds, and (2) ongoing costs, including management fees, distribution and/or service (12b-1) fees and other Fund expenses. This Example is intended to help you understand your ongoing costs (in dollars) of investing in the Fund and to compare these costs with the ongoing costs of investing in other mutual funds.
The Example is based on an investment of $1,000 invested at the beginning of the period and held for the entire period (March 1, 2011 to August 31, 2011).
Actual Expenses
The first line of the accompanying table for each class of the Fund provides information about actual account values and actual expenses. You may use the information in this line, together with the amount you invested, to estimate the expenses that you paid over the period. Simply divide your account value by $1,000.00 (for example, an $8,600 account value divided by $1,000.00 = 8.6), then multiply the result by the number in the first line for a class of the Fund under the heading entitled "Expenses Paid During Period" to estimate the expenses you paid on your account during this period. A small balance maintenance fee of $12.00 that is charged once a year may apply for certain accounts with a value of less than $2,000. This fee is not included in the table below. If it was, the estimate of expenses you paid during the period would be higher, and your ending account value lower, by this amount.
Hypothetical Example for Comparison Purposes
The second line of the accompanying table for each class of the Fund provides information about hypothetical account values and hypothetical expenses based on a Class' actual expense ratio and an assumed rate of return of 5% per year before expenses, which is not the Class' actual return. The hypothetical account values and expenses may not be used to estimate the actual ending account balance or expenses you paid for the period. You may use this information to compare the ongoing costs of investing in the Fund and other funds. To do so, compare this 5% hypothetical example with the 5% hypothetical examples that appear in the shareholder reports of the other funds. A small balance maintenance fee of $12.00 that is charged once a year may apply for certain accounts with a value of less than $2,000. This fee is not included in the table below. If it was, the estimate of expenses you paid during the period would be higher, and your ending account value lower, by this amount.
Please note that the expenses shown in the table are meant to highlight your ongoing costs only and do not reflect any transaction costs. Therefore, the second line of the table is useful in comparing ongoing costs only, and will not help you determine the relative total costs of owning different funds. In addition, if these transactional costs were included, your costs would have been higher.
Semiannual Report
Shareholder Expense Example - continued
| Annualized Expense Ratio | Beginning | Ending | Expenses Paid |
Class A | .75% |
|
|
|
Actual |
| $ 1,000.00 | $ 1,065.00 | $ 3.89 |
Hypothetical A |
| $ 1,000.00 | $ 1,021.37 | $ 3.81 |
Class T | .76% |
|
|
|
Actual |
| $ 1,000.00 | $ 1,064.80 | $ 3.94 |
Hypothetical A |
| $ 1,000.00 | $ 1,021.32 | $ 3.86 |
Class B | 1.37% |
|
|
|
Actual |
| $ 1,000.00 | $ 1,061.70 | $ 7.10 |
Hypothetical A |
| $ 1,000.00 | $ 1,018.25 | $ 6.95 |
Class C | 1.52% |
|
|
|
Actual |
| $ 1,000.00 | $ 1,061.90 | $ 7.88 |
Hypothetical A |
| $ 1,000.00 | $ 1,017.50 | $ 7.71 |
California Municipal Income | .47% |
|
|
|
Actual |
| $ 1,000.00 | $ 1,066.60 | $ 2.44 |
Hypothetical A |
| $ 1,000.00 | $ 1,022.77 | $ 2.39 |
Institutional Class | .53% |
|
|
|
Actual |
| $ 1,000.00 | $ 1,066.10 | $ 2.75 |
Hypothetical A |
| $ 1,000.00 | $ 1,022.47 | $ 2.69 |
A 5% return per year before expenses
* Expenses are equal to each Class' annualized expense ratio, multiplied by the average account value over the period, multiplied by 184/366 (to reflect the one-half year period).
Semiannual Report
Investment Changes (Unaudited)
Top Five Sectors as of August 31, 2011 | ||
| % of fund's | % of fund's net assets |
General Obligations | 46.6 | 48.2 |
Health Care | 12.1 | 11.6 |
Transportation | 10.9 | 11.6 |
Education | 6.5 | 6.9 |
Electric Utilities | 4.7 | 3.6 |
Weighted Average Maturity as of August 31, 2011 | ||
|
| 6 months ago |
Years | 7.3 | 10.0 |
This is a weighted average of all the maturities of the securities held in a fund. Weighted Average Maturity (WAM) can be used as a measure of sensitivity to interest rate changes and markets changes. Generally, the longer the maturity, the greater the sensitivity to such changes. WAM is based on the dollar-weighted average length of time until principal payments must be paid. Depending on the types of securities held in a fund, certain maturity shortening devices (e.g., demand features, interest rate resets, and call options) may be taken into account when calculating the WAM. |
Duration as of August 31, 2011 | ||
|
| 6 months ago |
Years | 7.7 | 8.1 |
Duration estimates how much a bond fund's price will change with a change in comparable interest rates. If rates rise 1%, for example, a fund with a 5-year duration is likely to lose about 5% of its value. Other factors also can influence a bond fund's performance and share price. Accordingly, a bond fund's actual performance may differ from this example. Duration takes into account any call or put option embedded in the bonds. |
Quality Diversification (% of fund's net assets) | |||||||
As of August 31, 2011 | As of February 28, 2011 | ||||||
| AAA 2.0% |
| | AAA 2.8% |
| ||
| AA,A 79.1% |
| | AA,A 81.4% |
| ||
| BBB 13.7% |
| | BBB 12.7% |
| ||
| BB and Below 0.4% |
| | BB and Below 0.4% |
| ||
 | Not Rated 1.6% |
| | Not Rated 2.0% |
| ||
| Short-Term |
| | Short-Term |
| ||
We have used ratings from Moody's Investors Service, Inc. Where Moody's® ratings are not available, we have used S&P® ratings. All ratings are as of the date indicated and do not reflect subsequent changes. |
Semiannual Report
Investments August 31, 2011 (Unaudited)
Showing Percentage of Net Assets
Municipal Bonds - 96.8% | ||||
| Principal Amount (000s) | Value (000s) | ||
California - 95.6% | ||||
ABAG Fin. Auth. for Nonprofit Corps. Rev.: | ||||
(Hamlin School Proj.) Series 2007: | ||||
4.625% 8/1/16 | $ 380 | $ 400 | ||
5% 8/1/18 | 330 | 349 | ||
5% 8/1/19 | 555 | 583 | ||
(Sharp HealthCare Proj.) Series 2009 B, 6.25% 8/1/39 | 3,000 | 3,158 | ||
ABC Unified School District Series 1997 C: | ||||
0% 8/1/31 (Nat'l. Pub. Fin. Guarantee Corp. Insured) | 2,720 | 781 | ||
0% 8/1/32 (Nat'l. Pub. Fin. Guarantee Corp. Insured) | 3,760 | 976 | ||
Alameda Corridor Trans. Auth. Rev. Series 1999 A, 5.25% 10/1/21 (Nat'l. Pub. Fin. Guarantee Corp. Insured) | 7,575 | 7,578 | ||
Alameda County Ctfs. of Prtn.: | ||||
(Santa Rita Jail Proj.) Series 2007 A: | ||||
5% 12/1/18 (AMBAC Insured) | 2,645 | 2,966 | ||
5% 12/1/20 (AMBAC Insured) | 2,810 | 3,082 | ||
Series 1989, 0% 6/15/17 (Nat'l. Pub. Fin. Guarantee Corp. Insured) | 2,310 | 1,718 | ||
Alhambra Unified School District Series 2004 A, 5% 8/1/25 (FGIC Insured) | 1,880 | 1,940 | ||
Anaheim Pub. Fing. Auth. Lease Rev. (Anaheim Pub. Impt. Proj.): | ||||
Series 1997 A, 6% 9/1/24 | 1,000 | 1,201 | ||
Series 1997 C: | ||||
0% 9/1/19 (FSA Insured) | 1,285 | 864 | ||
0% 9/1/22 (FSA Insured) | 5,150 | 2,789 | ||
Anaheim Pub. Fing. Auth. Rev. Series 2007 A, 4.5% 10/1/32 | 10,000 | 10,034 | ||
Antioch Unified School District (School Facilities Impt. District #1 Proj.) Series 2008 B, 5.75% 8/1/24 (Assured Guaranty Corp. Insured) | 1,000 | 1,139 | ||
Auburn Union School District Ctfs. of Prtn. (2008 Refing. Proj.) 5% 6/1/38 (Assured Guaranty Corp. Insured) | 5,615 | 5,707 | ||
Azusa Unified School District Series 2002, 5.375% 7/1/16 (FSA Insured) | 1,225 | 1,277 | ||
Banning Unified School District Gen. Oblig. Series 2006 A, 5% 8/1/31 (Berkshire Hathaway Assurance Corp. Insured) | 5,190 | 5,312 | ||
Bay Area Infrastructure Fing. Auth.: | ||||
5% 8/1/17 | 2,015 | 2,019 | ||
5% 8/1/17 (FGIC Insured) | 5,030 | 5,217 | ||
Municipal Bonds - continued | ||||
| Principal Amount (000s) | Value (000s) | ||
California - continued | ||||
Bay Area Toll Auth. San Francisco Bay Toll Bridge Rev. Series 2009 F1, 5.625% 4/1/44 | $ 5,500 | $ 5,926 | ||
Burbank Glendale Pasadena Arpt. Auth. Rev. Series 2005 B: | ||||
5% 7/1/12 (AMBAC Insured) (d) | 1,840 | 1,890 | ||
5.25% 7/1/14 (AMBAC Insured) (d) | 2,035 | 2,224 | ||
5.25% 7/1/16 (AMBAC Insured) (d) | 1,255 | 1,394 | ||
5.25% 7/1/17 (AMBAC Insured) (d) | 1,370 | 1,488 | ||
Burbank Unified School District: | ||||
Series 1997 B, 0% 8/1/20 | 3,835 | 2,574 | ||
Series 1997 C, 0% 8/1/20 (Nat'l. Pub. Fin. Guarantee Corp. Insured) | 5,865 | 3,909 | ||
Butte-Glenn Cmnty. College District Series A, 5.5% 8/1/18 (Nat'l. Pub. Fin. Guarantee Corp. Insured) | 1,085 | 1,137 | ||
Cabrillo Unified School District Series A: | ||||
0% 8/1/12 (AMBAC Insured) | 2,800 | 2,730 | ||
0% 8/1/17 (AMBAC Insured) | 1,000 | 782 | ||
0% 8/1/18 (AMBAC Insured) | 2,000 | 1,467 | ||
California Dept. of Wtr. Resources Central Valley Proj. Rev.: | ||||
Series AI: | ||||
5% 12/1/18 (b) | 3,000 | 3,637 | ||
5% 12/1/25 (b) | 2,700 | 3,126 | ||
Series J1, 7% 12/1/12 | 730 | 790 | ||
California Econ. Recovery Series 2009 A: | ||||
5% 7/1/22 | 3,800 | 4,169 | ||
5.25% 7/1/14 | 2,095 | 2,361 | ||
California Edl. Facilities Auth. Rev.: | ||||
(Claremont Graduate Univ. Proj.) Series 2008 A: | ||||
6% 3/1/33 | 1,000 | 1,054 | ||
6% 3/1/38 | 1,000 | 1,044 | ||
(College & Univ. Fing. Prog.) Series 2007: | ||||
5% 2/1/16 | 1,600 | 1,645 | ||
5% 2/1/17 | 1,000 | 1,014 | ||
(Loyola Marymount Univ. Proj.): | ||||
Series 2001 A, 0% 10/1/16 (Nat'l. Pub. Fin. Guarantee Corp. Insured) | 2,280 | 1,946 | ||
Series 2010 A, 5% 10/1/25 | 5,860 | 6,145 | ||
(Pomona College Proj.) Series 2005 A, 0% 7/1/38 | 3,155 | 712 | ||
(Santa Clara Univ. Proj.) Series 1999, 5.25% 9/1/26 (AMBAC Insured) | 7,910 | 9,000 | ||
Municipal Bonds - continued | ||||
| Principal Amount (000s) | Value (000s) | ||
California - continued | ||||
California Edl. Facilities Auth. Rev.: - continued | ||||
(Univ. of Southern California Proj.) Series 2007 A, 4.75% 10/1/37 | $ 6,000 | $ 6,162 | ||
California Enterprise Dev. Auth. (The Thacher School Proj.) Series 2010: | ||||
4% 9/1/20 | 860 | 912 | ||
4% 9/1/21 | 1,000 | 1,037 | ||
4% 9/1/22 | 740 | 756 | ||
4% 9/1/23 | 1,080 | 1,086 | ||
4% 9/1/24 | 1,125 | 1,115 | ||
5% 9/1/19 | 400 | 460 | ||
5% 9/1/39 | 5,000 | 5,039 | ||
California Gen. Oblig.: | ||||
Series 1992, 6.25% 9/1/12 (FGIC Insured) | 1,350 | 1,379 | ||
Series 2005, 5.5% 6/1/28 | 275 | 275 | ||
Series 2007: | ||||
5.625% 5/1/20 | 150 | 150 | ||
5.625% 5/1/26 | 215 | 215 | ||
5.75% 5/1/30 | 160 | 160 | ||
4.5% 8/1/30 | 3,250 | 3,099 | ||
4.5% 10/1/36 | 3,075 | 2,765 | ||
5% 3/1/15 | 2,130 | 2,421 | ||
5% 3/1/16 (Nat'l. Pub. Fin. Guarantee Corp. Insured) | 2,500 | 2,760 | ||
5% 9/1/17 | 750 | 851 | ||
5% 3/1/19 | 3,000 | 3,439 | ||
5% 8/1/22 | 1,500 | 1,614 | ||
5% 10/1/22 | 1,355 | 1,524 | ||
5% 11/1/22 | 1,600 | 1,747 | ||
5% 11/1/22 (XL Cap. Assurance, Inc. Insured) | 2,800 | 3,058 | ||
5% 12/1/22 | 3,500 | 3,827 | ||
5% 2/1/23 | 1,095 | 1,141 | ||
5% 2/1/26 | 1,500 | 1,511 | ||
5% 3/1/26 | 2,800 | 2,917 | ||
5% 6/1/26 | 2,600 | 2,706 | ||
5% 2/1/31 (Nat'l. Pub. Fin. Guarantee Corp. Insured) | 2,800 | 2,825 | ||
5% 6/1/31 | 2,000 | 2,031 | ||
5% 12/1/31 (Nat'l. Pub. Fin. Guarantee Corp. Insured) | 2,000 | 2,029 | ||
5% 10/1/32 (Nat'l. Pub. Fin. Guarantee Corp. Insured) | 1,000 | 1,006 | ||
5.125% 11/1/24 | 2,800 | 2,930 | ||
5.125% 2/1/26 | 2,800 | 2,899 | ||
Municipal Bonds - continued | ||||
| Principal Amount (000s) | Value (000s) | ||
California - continued | ||||
California Gen. Oblig.: - continued | ||||
5.25% 2/1/14 | $ 4,045 | $ 4,390 | ||
5.25% 10/1/14 | 140 | 144 | ||
5.25% 10/1/17 | 105 | 108 | ||
5.25% 11/1/18 | 3,000 | 3,223 | ||
5.25% 2/1/20 | 6,805 | 7,190 | ||
5.25% 2/1/22 | 2,020 | 2,120 | ||
5.25% 2/1/27 (Nat'l. Pub. Fin. Guarantee Corp. Insured) | 5,490 | 5,603 | ||
5.25% 4/1/27 | 5 | 5 | ||
5.25% 2/1/28 | 2,785 | 2,862 | ||
5.25% 2/1/29 | 5,000 | 5,075 | ||
5.25% 4/1/29 | 5 | 5 | ||
5.25% 11/1/29 | 2,000 | 2,048 | ||
5.25% 4/1/30 | 35 | 35 | ||
5.25% 2/1/33 | 8,150 | 8,211 | ||
5.25% 12/1/33 | 105 | 106 | ||
5.25% 3/1/38 | 5,400 | 5,459 | ||
5.375% 4/1/15 (Nat'l. Pub. Fin. Guarantee Corp. Insured) | 35 | 36 | ||
5.5% 5/1/13 (Nat'l. Pub. Fin. Guarantee Corp. Insured) | 100 | 100 | ||
5.5% 4/1/28 | 5 | 5 | ||
5.5% 8/1/29 | 7,790 | 8,420 | ||
5.5% 4/1/30 | 25 | 26 | ||
5.5% 11/1/33 | 29,440 | 29,952 | ||
5.5% 11/1/34 | 2,535 | 2,662 | ||
5.5% 11/1/39 | 1,810 | 1,892 | ||
6% 4/1/18 | 1,570 | 1,952 | ||
6% 3/1/33 | 20,050 | 22,361 | ||
6% 4/1/38 | 1,190 | 1,295 | ||
6.5% 4/1/33 | 11,650 | 13,404 | ||
6.75% 8/1/12 | 1,100 | 1,162 | ||
California Health Facilities Fing. Auth. Rev.: | ||||
(Catholic Healthcare West Proj.): | ||||
Series 2008 H, 5.125% 7/1/22 | 2,630 | 2,811 | ||
Series 2008 L, 5.125% 7/1/22 | 2,475 | 2,645 | ||
Series 2009 E, 5.625% 7/1/25 | 5,000 | 5,323 | ||
(Cedars-Sinai Med. Ctr. Proj.): | ||||
Series 2005, 5% 11/15/14 | 1,485 | 1,647 | ||
Series 2009, 5% 8/15/39 | 5,000 | 4,846 | ||
Municipal Bonds - continued | ||||
| Principal Amount (000s) | Value (000s) | ||
California - continued | ||||
California Health Facilities Fing. Auth. Rev.: - continued | ||||
(Children's Hosp. of Orange County Proj.) Series 2009 A, 5% 11/1/12 | $ 2,345 | $ 2,429 | ||
(Cottage Health Sys. Proj.) Series 2003 B, 5.25% 11/1/18 (Nat'l. Pub. Fin. Guarantee Corp. Insured) | 1,260 | 1,320 | ||
(Providence Health and Svcs. Proj.): | ||||
Series 2009 B, 5.5% 10/1/39 | 2,000 | 2,070 | ||
Series C, 6.5% 10/1/38 (Pre-Refunded to 10/1/18 @ 100) (e) | 90 | 120 | ||
6.5% 10/1/38 | 4,910 | 5,436 | ||
(Scripps Health Proj.) Series 2010 A, 5% 11/15/36 | 3,000 | 3,004 | ||
(Stanford Hosp. & Clinics Proj.) Series 2010 B, 5.75% 11/15/31 | 4,600 | 4,914 | ||
(Sutter Health Proj.) Series 2008 A, 5% 8/15/15 | 4,500 | 5,075 | ||
Bonds (Catholic Healthcare West Proj.) Series 2004 I, 4.95%, tender 7/1/14 (c) | 5,000 | 5,434 | ||
Series 2008 A3, 5.5% 11/15/40 | 3,090 | 3,207 | ||
California Infrastructure & Econ. Dev. Bank Rev.: | ||||
(California Science Ctr. Phase II Proj.) Series 2006 B, 5% 5/1/19 (FGIC Insured) | 1,000 | 1,042 | ||
(Performing Arts Ctr. of Los Angeles County Proj.) Series 2007: | ||||
5% 12/1/27 | 1,080 | 1,105 | ||
5% 12/1/32 | 1,000 | 1,006 | ||
5% 12/1/42 | 3,000 | 2,912 | ||
(YMCA Metropolitan L.A. Proj.) Series 2001: | ||||
5.25% 2/1/26 (AMBAC Insured) | 2,000 | 2,020 | ||
5.25% 2/1/32 (AMBAC Insured) | 6,295 | 6,297 | ||
Series 2005, 5% 10/1/33 | 7,235 | 7,394 | ||
California Muni. Fin. Auth. Ctfs. of Prtn. (Cmnty. Hospitals of Central California Obligated Group Proj.) Series 2009, 5.5% 2/1/39 | 5,000 | 4,463 | ||
California Muni. Fin. Auth. Rev.: | ||||
(Eisenhower Med. Ctr. Proj.) Series 2010 A: | ||||
5% 7/1/19 | 300 | 315 | ||
5% 7/1/20 | 500 | 524 | ||
5.75% 7/1/40 | 5,000 | 4,965 | ||
(Loma Linda Univ. Proj.) Series 2007, 5% 4/1/22 | 1,090 | 1,158 | ||
California Poll. Cont. Fing. Auth. Ctfs. of Prtn.: | ||||
(Pacific Gas & Elec. Co. Proj.) Series 1996 A, 5.35% 12/1/16 (Nat'l. Pub. Fin. Guarantee Corp. Insured) (d) | 4,335 | 4,428 | ||
Municipal Bonds - continued | ||||
| Principal Amount (000s) | Value (000s) | ||
California - continued | ||||
California Poll. Cont. Fing. Auth. Ctfs. of Prtn.: - continued | ||||
(San Diego Gas & Elec. Co. Proj.) 5.9% 6/1/14 (Nat'l. Pub. Fin. Guarantee Corp. Insured) | $ 4,250 | $ 4,765 | ||
California Poll. Cont. Fing. Auth. Solid Waste Disp. Rev. Bonds (Waste Mgmt., Inc. Proj.): | ||||
Series 2001 A, 5.125%, tender 5/1/14 (c)(d) | 9,000 | 9,694 | ||
Series 2003 A, 5%, tender 5/1/13 (c)(d) | 3,000 | 3,160 | ||
Series 2005 A1, 4.7%, tender 4/1/12 (c)(d) | 3,250 | 3,314 | ||
California Pub. Works Board Lease Rev.: | ||||
(Butterfield State Office Complex Proj.) Series 2005 A: | ||||
5% 6/1/13 | 2,600 | 2,753 | ||
5% 6/1/14 | 2,000 | 2,189 | ||
5.25% 6/1/24 | 5,400 | 5,624 | ||
5.25% 6/1/25 | 5,000 | 5,150 | ||
5.25% 6/1/30 | 4,000 | 4,048 | ||
(California Cmnty. College Projs.) Series 1998 A, 5.25% 12/1/16 | 4,400 | 4,415 | ||
(California State Univ. Proj.): | ||||
Series 2006 A, 5% 10/1/14 (FGIC Insured) | 2,700 | 2,942 | ||
Series 2006 G: | ||||
5% 11/1/20 | 1,825 | 1,928 | ||
5% 11/1/21 | 2,020 | 2,120 | ||
(California Substance Abuse Treatment Facility and State Prison at Corcoran II Proj.) Series 2005 J, 5.25% 1/1/16 (AMBAC Insured) | 4,520 | 5,171 | ||
(Capitol East End Complex-Blocks 171-174 & 225 Proj.) Series 2002 A, 5.25% 12/1/18 | 5,000 | 5,219 | ||
(Coalinga State Hosp. Proj.) Series 2004 A: | ||||
5.25% 6/1/12 | 2,485 | 2,559 | ||
5.5% 6/1/15 | 1,000 | 1,109 | ||
5.5% 6/1/17 | 9,980 | 10,877 | ||
(Dept. of Corrections & Rehab. Proj.) Series 2006 F: | ||||
5% 11/1/15 (FGIC Insured) | 2,455 | 2,726 | ||
5% 11/1/16 (FGIC Insured) | 2,000 | 2,236 | ||
(Dept. of Corrections State Prison Proj.) Series 1993 E: | ||||
5.5% 6/1/15 (FSA Insured) | 1,640 | 1,768 | ||
5.5% 6/1/15 (Nat'l. Pub. Fin. Guarantee Corp. Insured) | 815 | 877 | ||
(Dept. of Corrections, Madera State Prison Proj.) Series E, 5.5% 6/1/15 | 7,205 | 7,750 | ||
(Dept. of Corrections, Monterey County State Prison Proj.) Series 2003 C, 5.5% 6/1/15 | 6,100 | 6,622 | ||
Municipal Bonds - continued | ||||
| Principal Amount (000s) | Value (000s) | ||
California - continued | ||||
California Pub. Works Board Lease Rev.: - continued | ||||
(Dept. of Corrections, Susanville State Prison Proj.) Series 1993 D, 5.25% 6/1/15 (FSA Insured) | $ 4,210 | $ 4,679 | ||
(Dept. of Gen. Svcs. Butterfield Proj.) Series 2005 A, 5% 6/1/23 | 2,900 | 2,991 | ||
(Dept. of Health Svcs. Proj.) Series 2005 K, 5% 11/1/23 | 2,800 | 2,876 | ||
(Dept. of Mental Health Proj.) Series 2004 A: | ||||
5% 6/1/25 | 3,000 | 3,059 | ||
5.125% 6/1/29 | 5,000 | 5,022 | ||
5.5% 6/1/19 | 2,000 | 2,146 | ||
(Kern County at Delano II Proj.) Series 2003 C, 5.5% 6/1/17 (Nat'l. Pub. Fin. Guarantee Corp. Insured) | 4,775 | 5,074 | ||
(Madera County, Valley State Prison for Women Proj.) Series 2005 H, 5% 6/1/16 | 5,000 | 5,558 | ||
(Office of Emergency Svcs. Proj.) Series 2007 A, 5% 3/1/20 | 3,335 | 3,554 | ||
(Porterville Developmental Ctr. Hsg. Expansion and Recreation Complex Proj.) Series 2009 C, 6.25% 4/1/34 | 5,900 | 6,261 | ||
(Richmond Lab. Proj.) Series 2005 K, 5% 11/1/17 | 5,625 | 6,137 | ||
(Ten Administrative Segregation Hsg. Units Proj.) Series 2002 A, 5.25% 3/1/18 (AMBAC Insured) | 2,500 | 2,540 | ||
(Univ. of California Research Proj.): | ||||
Series 2005 L: | ||||
5% 11/1/25 (Nat'l. Pub. Fin. Guarantee Corp. Insured) | 5,165 | 5,381 | ||
5.25% 11/1/23 (Nat'l. Pub. Fin. Guarantee Corp. Insured) | 3,500 | 3,766 | ||
Series 2006 E: | ||||
5% 10/1/23 | 2,410 | 2,622 | ||
5.25% 10/1/21 | 2,900 | 3,270 | ||
Series 2009 G1, 5.75% 10/1/30 | 1,800 | 1,881 | ||
Series 2009 I: | ||||
5.5% 11/1/23 | 1,535 | 1,643 | ||
6.125% 11/1/29 | 1,200 | 1,306 | ||
6.25% 11/1/21 | 2,000 | 2,336 | ||
6.375% 11/1/34 | 3,000 | 3,230 | ||
California State Univ. Rev.: | ||||
(Systemwide Proj.) Series 2002 A: | ||||
5.375% 11/1/18 (AMBAC Insured) | 1,290 | 1,350 | ||
5.5% 11/1/16 (AMBAC Insured) | 1,500 | 1,580 | ||
Municipal Bonds - continued | ||||
| Principal Amount (000s) | Value (000s) | ||
California - continued | ||||
California State Univ. Rev.: - continued | ||||
Series 2009 A: | ||||
5.75% 11/1/25 | $ 3,675 | $ 4,103 | ||
5.75% 11/1/28 | 6,525 | 7,123 | ||
6% 11/1/40 | 7,240 | 7,902 | ||
California Statewide Cmntys. Dev. Auth. Poll. Cont. Rev. Bonds (Southern California Edison Co. Proj.) Series 2006 B, 4.1%, tender 4/1/13 (XL Cap. Assurance, Inc. Insured) (c) | 2,425 | 2,540 | ||
California Statewide Cmntys. Dev. Auth. Rev.: | ||||
(Adventist Health Sys. Proj.) Series 2007 B, 5% 3/1/37 (Assured Guaranty Corp. Insured) | 5,000 | 5,059 | ||
(Cmnty. Hosp. Monterey Peninsula Proj.) Series 2003 B, 5.25% 6/1/23 (FSA Insured) | 1,800 | 1,836 | ||
(Cottage Health Sys. Obligated Group Proj.) Series 2010, 5.25% 11/1/30 | 3,000 | 3,035 | ||
(Daughters of Charity Health Sys. Proj.): | ||||
Series 2003 G, 5.25% 7/1/12 | 900 | 924 | ||
Series 2005 G, 5.25% 7/1/13 | 1,475 | 1,517 | ||
(Enloe Health Sys. Proj.) Series 2008 B: | ||||
5% 8/15/16 | 125 | 139 | ||
5% 8/15/19 | 50 | 56 | ||
5.75% 8/15/38 | 3,000 | 3,109 | ||
6.25% 8/15/33 | 2,500 | 2,669 | ||
(Kaiser Permanente Health Sys. Proj.): | ||||
Series 2001 C, 5.25% 8/1/31 | 3,215 | 3,240 | ||
Series 2007 A: | ||||
4.75% 4/1/33 | 2,000 | 1,843 | ||
5% 4/1/31 | 4,900 | 4,858 | ||
(Los Angeles Orthopaedic Hosp. Foundation Prog.) Series 2000, 5.75% 6/1/30 (AMBAC Insured) | 8,355 | 8,148 | ||
(St. Joseph Health Sys. Proj.) Series 2007 C, 5.75% 7/1/47 (FGIC Insured) | 9,000 | 9,126 | ||
(Sutter Health Proj.) Series 2011 A, 6% 8/15/42 | 3,300 | 3,565 | ||
(Sutter Health Systems Proj.): | ||||
Series 2002 B, 5.625% 8/15/42 | 7,000 | 7,041 | ||
Series 2005 A, 5% 11/15/43 (Nat'l. Pub. Fin. Guarantee Corp. Insured) | 4,125 | 3,886 | ||
5.375% 6/1/26 | 2,500 | 2,552 | ||
6% 6/1/33 | 3,000 | 3,105 | ||
Campbell Union School District Gen. Oblig. Series 2002 C, 5% 8/1/34 (Pre-Refunded to 8/1/14 @ 102) (e) | 1,910 | 2,205 | ||
Municipal Bonds - continued | ||||
| Principal Amount (000s) | Value (000s) | ||
California - continued | ||||
Carlsbad Unified School District: | ||||
Series 2009 B: | ||||
0% 5/1/15 | $ 1,000 | $ 930 | ||
0% 5/1/16 | 1,365 | 1,217 | ||
0% 5/1/17 | 1,155 | 979 | ||
0% 5/1/18 | 1,335 | 1,065 | ||
0% 5/1/19 | 1,000 | 747 | ||
0% 5/1/34 (a) | 5,300 | 3,395 | ||
0% 11/1/15 (Nat'l. Pub. Fin. Guarantee Corp. Insured) | 1,700 | 1,560 | ||
Chino Basin Reg'l. Fing. Auth. Rev. (Inland Empire Util. Agcy. Proj.) Series 2008 A: | ||||
5% 11/1/24 (AMBAC Insured) | 1,000 | 1,079 | ||
5% 11/1/25 (AMBAC Insured) | 3,820 | 4,093 | ||
5% 11/1/33 (AMBAC Insured) | 5,000 | 5,098 | ||
Chula Vista Ind. Dev. Rev. (San Diego Gas & Elec. Co. Proj.) Series B, 5.875% 2/15/34 | 5,000 | 5,455 | ||
Clovis Pub. Fing. Auth. Wastewtr. Rev. Series 2005, 5% 8/1/35 (Nat'l. Pub. Fin. Guarantee Corp. Insured) | 3,295 | 3,192 | ||
Colton Joint Unified School District Series 2001 C, 5.25% 2/1/22 (FGIC Insured) | 1,200 | 1,269 | ||
Commerce Refuse to Energy Auth. Rev. Series 2005: | ||||
5.5% 7/1/14 (Nat'l. Pub. Fin. Guarantee Corp. Insured) | 1,545 | 1,677 | ||
5.5% 7/1/15 (Nat'l. Pub. Fin. Guarantee Corp. Insured) | 2,685 | 2,967 | ||
Corona-Norco Unified School District Series A: | ||||
5% 8/1/22 (FSA Insured) | 1,470 | 1,604 | ||
5% 8/1/25 (FSA Insured) | 1,435 | 1,521 | ||
5% 8/1/26 (FSA Insured) | 2,000 | 2,107 | ||
5% 8/1/27 (FSA Insured) | 1,785 | 1,862 | ||
5% 8/1/31 (FSA Insured) | 5,000 | 5,144 | ||
Covina Valley Unified School District Series 2006 A, 5% 8/1/31 (Nat'l. Pub. Fin. Guarantee Corp. Insured) | 5,600 | 5,671 | ||
Ctr. Unified School District Series 1997 C: | ||||
0% 9/1/18 (Nat'l. Pub. Fin. Guarantee Corp. Insured) | 2,000 | 1,485 | ||
0% 9/1/20 (Nat'l. Pub. Fin. Guarantee Corp. Insured) | 2,010 | 1,343 | ||
Cucamonga County Wtr. District 5% 9/1/36 (Nat'l. Pub. Fin. Guarantee Corp. Insured) | 2,890 | 2,956 | ||
Cupertino California Union School District: | ||||
5% 8/1/18 | 1,735 | 2,115 | ||
5% 8/1/19 | 1,120 | 1,375 | ||
Municipal Bonds - continued | ||||
| Principal Amount (000s) | Value (000s) | ||
California - continued | ||||
Davis Spl. Tax Rev. Series 2007: | ||||
5% 9/1/11 (AMBAC Insured) | $ 595 | $ 595 | ||
5% 9/1/12 (AMBAC Insured) | 625 | 636 | ||
5% 9/1/13 (AMBAC Insured) | 655 | 675 | ||
5% 9/1/14 (AMBAC Insured) | 690 | 718 | ||
5% 9/1/15 (AMBAC Insured) | 725 | 755 | ||
5% 9/1/18 (AMBAC Insured) | 835 | 855 | ||
5% 9/1/20 (AMBAC Insured) | 925 | 925 | ||
5% 9/1/22 (AMBAC Insured) | 1,020 | 1,012 | ||
Desert Sands Union School District Ctfs. of Prtn.: | ||||
5.75% 3/1/24 (FSA Insured) | 2,000 | 2,204 | ||
6% 3/1/20 (FSA Insured) | 1,000 | 1,165 | ||
Duarte Ctfs. of Prtn. Series 1999 A: | ||||
5% 4/1/12 | 4,210 | 4,222 | ||
5% 4/1/13 | 1,830 | 1,835 | ||
El Centro Fing. Auth. Wastewtr. Series 2006 A, 5.25% 10/1/35 (FSA Insured) | 6,890 | 7,075 | ||
Elk Grove Fin. Auth. Spl. Tax Rev. 5% 9/1/17 (AMBAC Insured) | 2,415 | 2,494 | ||
Elk Grove Unified School District Spl. Tax (Cmnty. Facilities District #1 Proj.) 6.5% 12/1/24 (AMBAC Insured) | 4,025 | 4,326 | ||
Empire Union School District Spl. Tax (Cmnty. Facilities District No. 1987 Proj.) Series 2002 A: | ||||
0% 10/1/24 (AMBAC Insured) | 1,665 | 777 | ||
0% 10/1/25 (AMBAC Insured) | 1,665 | 723 | ||
Encinitas Union School District Series 1996, 0% 8/1/21 (Nat'l. Pub. Fin. Guarantee Corp. Insured) | 1,000 | 601 | ||
Escondido Union High School District: | ||||
Series 2008 A: | ||||
0% 8/1/33 (Assured Guaranty Corp. Insured) | 5,655 | 1,384 | ||
0% 8/1/34 (Assured Guaranty Corp. Insured) | 3,500 | 800 | ||
0% 11/1/16 (Escrowed to Maturity) (e) | 3,500 | 3,272 | ||
Fairfield-Suisun Unified School District Series 2004, 5.5% 8/1/28 (Nat'l. Pub. Fin. Guarantee Corp. Insured) | 3,000 | 3,152 | ||
Fillmore Pub. Fing. Auth. Rev. (Wtr. Recycling Fing. Proj.) Series 2007, 5% 5/1/37 (CIFG North America Insured) | 2,500 | 2,365 | ||
Folsom Cordova Unified School District School Facilities Impt. District #1 Series A, 0% 10/1/20 (Nat'l. Pub. Fin. Guarantee Corp. Insured) | 1,315 | 818 | ||
Municipal Bonds - continued | ||||
| Principal Amount (000s) | Value (000s) | ||
California - continued | ||||
Foothill-De Anza Cmnty. College District: | ||||
Series 1999 A: | ||||
0% 8/1/15 (Nat'l. Pub. Fin. Guarantee Corp. Insured) | $ 2,430 | $ 2,272 | ||
0% 8/1/19 (Nat'l. Pub. Fin. Guarantee Corp. Insured) | 5,365 | 4,082 | ||
0% 8/1/20 (Nat'l. Pub. Fin. Guarantee Corp. Insured) | 6,425 | 4,551 | ||
Series 1999 B, 0% 8/1/24 (Nat'l. Pub. Fin. Guarantee Corp. Insured) | 5,000 | 2,704 | ||
Series C, 5% 8/1/36 | 10,000 | 10,609 | ||
Foothill/Eastern Trans. Corridor Agcy. Toll Road Rev.: | ||||
Series 1995 A, 5% 1/1/35 (Nat'l. Pub. Fin. Guarantee Corp. Insured) | 24,070 | 19,689 | ||
Series 1999: | ||||
5% 1/15/16 (Nat'l. Pub. Fin. Guarantee Corp. Insured) | 5,860 | 5,871 | ||
5.75% 1/15/40 | 8,155 | 7,261 | ||
5.875% 1/15/27 | 4,000 | 3,887 | ||
5.875% 1/15/27 (Nat'l. Pub. Fin. Guarantee Corp. Insured) | 4,500 | 4,373 | ||
5.875% 1/15/29 | 4,000 | 3,871 | ||
Garden Grove Agcy. Cmnty. Dev. Tax Allocation Rev. (Garden Grove Cmnty. Proj.) 5.375% 10/1/20 | 2,645 | 2,662 | ||
Glendora Unified School District Series 2005 A, 5.25% 8/1/26 (Nat'l. Pub. Fin. Guarantee Corp. Insured) | 1,000 | 1,066 | ||
Golden State Tobacco Securitization Corp. Tobacco Settlement Rev.: | ||||
Series 2005 A: | ||||
5% 6/1/35 (Berkshire Hathaway Assurance Corp. Insured) | 1,535 | 1,487 | ||
5% 6/1/45 | 12,125 | 10,671 | ||
5% 6/1/45 | 2,775 | 2,450 | ||
Series 2007 A1: | ||||
5% 6/1/12 | 1,400 | 1,420 | ||
5% 6/1/13 | 1,000 | 1,024 | ||
5% 6/1/14 | 2,000 | 2,053 | ||
5% 6/1/15 | 1,000 | 1,027 | ||
5% 6/1/33 | 3,000 | 2,077 | ||
5.125% 6/1/47 | 2,600 | 1,668 | ||
5.75% 6/1/47 | 5,000 | 3,526 | ||
5% 6/1/45 (FSA Insured) | 235 | 220 | ||
Municipal Bonds - continued | ||||
| Principal Amount (000s) | Value (000s) | ||
California - continued | ||||
Golden West Schools Fing. Auth. Rev. Series A, 0% 8/1/18 (Nat'l. Pub. Fin. Guarantee Corp. Insured) | $ 2,750 | $ 2,013 | ||
Indio Pub. Fing. Auth. Lease Rev. Bonds Series 2007 B, 3.8%, tender 11/1/12 (c) | 2,500 | 2,538 | ||
La Quinta Redev. Agcy. Tax. Allocation (Area #1 Redev. Proj.) Series 1994, 7.3% 9/1/11 (National Public Finance Guarantee Corp. Insured) | 480 | 480 | ||
Laguna Beach Unified School District Gen. Oblig. (Election of 2001 Proj.): | ||||
5% 8/1/21 | 405 | 486 | ||
5% 8/1/22 | 450 | 526 | ||
5% 8/1/23 | 485 | 559 | ||
5% 8/1/24 | 1,000 | 1,138 | ||
5% 8/1/26 | 1,370 | 1,530 | ||
5% 8/1/28 | 760 | 831 | ||
Lancaster Fing. Auth. Tax Allocation Rev. 5% 2/1/31 (AMBAC Insured) | 3,420 | 2,449 | ||
Loma Linda Hosp. Rev.: | ||||
(Loma Linda Univ. Med. Ctr. Proj.) Series 2008 A, 8.25% 12/1/38 | 4,400 | 4,809 | ||
Series 2005 A, 5% 12/1/14 | 4,500 | 4,765 | ||
Long Beach Bond Fin. Auth. Natural Gas Purchase Rev. Series 2007 A, 5.25% 11/15/21 | 3,790 | 3,843 | ||
Long Beach Cmnty. College Series 2008 A, 0% 6/1/31 (FSA Insured) | 9,750 | 2,873 | ||
Long Beach Hbr. Rev. Series 2010 B, 5% 5/15/22 | 2,735 | 3,142 | ||
Long Beach Unified School District: | ||||
Series 2008 A, 5.25% 8/1/33 | 6,725 | 7,228 | ||
Series A, 5.75% 8/1/33 | 2,800 | 3,143 | ||
Los Angeles Cmnty. College District: | ||||
Series 2008 A, 6% 8/1/33 | 10,000 | 11,336 | ||
Series 2009 A, 5.5% 8/1/29 | 1,000 | 1,102 | ||
Series 2010 C, 5.25% 8/1/39 | 1,300 | 1,385 | ||
Los Angeles Cmnty. Redev. Agcy. Lease Rev. (Vermont Manchester Social Svcs. Proj.) Series 2005, 5% 9/1/21 (AMBAC Insured) | 2,805 | 2,875 | ||
Los Angeles County Ctfs. of Prtn.: | ||||
(Correctional Facilities Proj.) 0% 9/1/13 (Escrowed to Maturity) (e) | 3,380 | 3,333 | ||
(Disney Parking Proj.): | ||||
0% 3/1/12 | 2,180 | 2,163 | ||
0% 3/1/13 | 6,490 | 6,337 | ||
0% 9/1/14 (AMBAC Insured) | 3,860 | 3,622 | ||
Municipal Bonds - continued | ||||
| Principal Amount (000s) | Value (000s) | ||
California - continued | ||||
Los Angeles County Ctfs. of Prtn.: - continued | ||||
(Disney Parking Proj.): | ||||
0% 3/1/18 | $ 3,000 | $ 2,383 | ||
0% 3/1/19 | 3,200 | 2,395 | ||
0% 3/1/20 | 1,000 | 697 | ||
Los Angeles County Schools Regionalized Bus. Svcs. Corp. Ctfs. of Prtn. (Pooled Fing. Prog.) Series 2003 B: | ||||
5.375% 9/1/16 (FSA Insured) | 1,045 | 1,129 | ||
5.375% 9/1/17 (FSA Insured) | 1,095 | 1,176 | ||
5.375% 9/1/18 (FSA Insured) | 1,155 | 1,236 | ||
5.375% 9/1/19 (FSA Insured) | 1,210 | 1,290 | ||
Los Angeles Ctfs. of Prtn. (Dept. Pub. Social Svcs. Proj.) Series 1999 A, 5.5% 8/1/24 (AMBAC Insured) | 3,700 | 3,703 | ||
Los Angeles Dept. Arpt. Rev.: | ||||
Series 2002 A, 5.25% 5/15/19 (Nat'l. Pub. Fin. Guarantee Corp. Insured) | 3,000 | 3,069 | ||
Series 2006 A: | ||||
5% 5/15/16 (Nat'l. Pub. Fin. Guarantee Corp. Insured) (d) | 1,000 | 1,104 | ||
5% 5/15/17 (Nat'l. Pub. Fin. Guarantee Corp. Insured) (d) | 3,990 | 4,349 | ||
5% 5/15/18 (Nat'l. Pub. Fin. Guarantee Corp. Insured) (d) | 1,410 | 1,518 | ||
Los Angeles Dept. of Wtr. & Pwr. Elec. Plant Rev.: | ||||
4.75% 8/15/12 (Escrowed to Maturity) (e) | 3,120 | 3,129 | ||
4.75% 8/15/16 (Escrowed to Maturity) (e) | 1,395 | 1,399 | ||
4.75% 10/15/20 (Escrowed to Maturity) (e) | 150 | 150 | ||
Los Angeles Dept. of Wtr. & Pwr. Rev. Series A2, 5% 7/1/25 (FSA Insured) | 2,800 | 2,969 | ||
Los Angeles Dept. of Wtr. & Pwr. Wtrwks. Rev. Series 2004 C, 5% 7/1/34 (Nat'l. Pub. Fin. Guarantee Corp. Insured) | 1,500 | 1,530 | ||
Los Angeles Hbr. Dept. Rev. 7.6% 10/1/18 (Escrowed to Maturity) (e) | 9,820 | 12,262 | ||
Los Angeles Muni. Impt. Corp. Lease Rev. Series 2008 A, 5% 9/1/22 | 5,500 | 5,819 | ||
Los Angeles Unified School District: | ||||
Series 1997 F, 5% 7/1/21 (FSA Insured) | 3,880 | 4,108 | ||
Series 2003 A, 5% 7/1/21 (FSA Insured) | 11,050 | 11,698 | ||
Series 2004 A1, 5% 7/1/17 (Nat'l. Pub. Fin. Guarantee Corp. Insured) | 3,000 | 3,290 | ||
Series 2007 A1, 4.5% 1/1/28 | 6,900 | 6,744 | ||
Los Angeles Wastewtr. Sys. Rev. Series 2009 A, 5.75% 6/1/34 | 10,000 | 10,973 | ||
Municipal Bonds - continued | ||||
| Principal Amount (000s) | Value (000s) | ||
California - continued | ||||
M-S-R Pub. Pwr. Agcy. San Juan Proj. Rev. Series D, 6.75% 7/1/20 (Escrowed to Maturity) (e) | $ 1,635 | $ 2,037 | ||
Madera County Ctfs. of Prtn. (Children's Hosp. Central California Proj.) Series 2010, 5.375% 3/15/36 | 3,425 | 3,310 | ||
Malibu Gen. Oblig. Ctfs. of Prtn. (City Hall Proj.) Series A: | ||||
5% 7/1/32 | 500 | 521 | ||
5% 7/1/39 | 4,095 | 4,193 | ||
Marina Coast Wtr. District Ctfs. Prtn. Series 2006, 5% 6/1/37 (Nat'l. Pub. Fin. Guarantee Corp. Insured) | 3,500 | 3,455 | ||
Merced Union High School District Series A, 0% 8/1/22 (Nat'l. Pub. Fin. Guarantee Corp. Insured) | 1,100 | 627 | ||
Modesto Elementary School District, Stanislaus County Series A: | ||||
0% 8/1/21 (Nat'l. Pub. Fin. Guarantee Corp. Insured) | 2,000 | 1,225 | ||
0% 8/1/25 (Nat'l. Pub. Fin. Guarantee Corp. Insured) | 2,800 | 1,271 | ||
Modesto Gen. Oblig. Ctfs. of Prtn.: | ||||
(Cmnty. Ctr. Refing. Proj.) Series A, 5% 11/1/23 (AMBAC Insured) | 2,500 | 2,245 | ||
(Golf Course Refing. Proj.) Series B, 5% 11/1/23 (Nat'l. Pub. Fin. Guarantee Corp. Insured) | 1,585 | 1,537 | ||
Modesto Irrigation District Ctfs. of Prtn.: | ||||
(Cap. Impts. Proj.) Series 2004 B, 5.5% 7/1/35 | 3,800 | 3,891 | ||
(Geysers Geothermal Pwr. Proj.) Series 1986 A, 5% 10/1/17 (Escrowed to Maturity) (e) | 5,000 | 5,799 | ||
Monrovia Unified School District Series B, 0% 8/1/33 (Nat'l. Pub. Fin. Guarantee Corp. Insured) | 2,500 | 673 | ||
Montebello Unified School District Series 2001, 0% 6/1/26 (FSA Insured) | 1,580 | 598 | ||
Monterey County Pub. Impt. Corp. Ctfs. of Prtn. 5% 8/1/18 (AMBAC Insured) | 3,580 | 3,944 | ||
Moreland School District Series 2003 B, 0% 8/1/27 (Nat'l. Pub. Fin. Guarantee Corp. Insured) | 1,485 | 565 | ||
Murrieta Valley Unified School District: | ||||
Series 1998 A, 0% 9/1/13 (Nat'l. Pub. Fin. Guarantee Corp. Insured) | 1,500 | 1,449 | ||
Series 2008, 0% 9/1/32 (FSA Insured) | 5,000 | 1,252 | ||
Natomas Unified School District Series 2007, 5.25% 8/1/30 (FGIC Insured) | 5,150 | 5,125 | ||
New Haven Unified School District: | ||||
12% 8/1/16 (FSA Insured) | 1,500 | 2,237 | ||
12% 8/1/17 (FSA Insured) | 1,000 | 1,552 | ||
Municipal Bonds - continued | ||||
| Principal Amount (000s) | Value (000s) | ||
California - continued | ||||
Newport Beach Rev.: | ||||
(Hoag Memorial Hosp. Presbyterian Proj.) Series 2009 A, 5% 12/1/24 | $ 2,000 | $ 2,042 | ||
Bonds (Hoag Memorial Hosp. Presbyterian Proj.) Series 2009 E, 5%, tender 2/7/13 (c) | 2,800 | 2,965 | ||
Hoag Memorial Hosp. Presbyterian Proj.) Series 2011 A, 6% 12/1/40 | 3,000 | 3,288 | ||
North City West School Facilities Fing. Auth. Spl. Tax: | ||||
Series 2005 B, 5.25% 9/1/23 (AMBAC Insured) | 1,530 | 1,630 | ||
Series 2006 C: | ||||
5% 9/1/16 (AMBAC Insured) | 1,000 | 1,101 | ||
5% 9/1/17 (AMBAC Insured) | 2,735 | 2,983 | ||
Northern California Power Agency Rev. (Hydroelectric #1 Proj.) Series 2008 C, 5% 7/1/12 | 2,500 | 2,594 | ||
Northern California Pwr. Agcy. Rev. (Hydroelectric #1 Proj.) Series 1986 A, 7.5% 7/1/23 (Pre-Refunded to 7/1/21 @ 100) (e) | 3,850 | 5,346 | ||
Northern California Transmission Auth. Rev. (Ore Trans. Proj.) Series A, 7% 5/1/13 (Nat'l. Pub. Fin. Guarantee Corp. Insured) | 4,205 | 4,400 | ||
Norwalk-Mirada Unified School District Series 2009 D, 0% 8/1/33 (FSA Insured) | 5,700 | 1,329 | ||
Novato Unified School District Series 2002, 5.25% 8/1/17 (Nat'l. Pub. Fin. Guarantee Corp. Insured) | 1,000 | 1,013 | ||
Oakland Gen. Oblig. Series 2009 B, 6.25% 1/15/39 | 3,000 | 3,275 | ||
Oakland Joint Powers Fing. Auth. Series 2008 A1, 4.25% 1/1/13 (Assured Guaranty Corp. Insured) | 3,000 | 3,136 | ||
Oakland Redev. Agcy. Sub Tax Allocation (Central District Redev. Proj.): | ||||
Series 1993 A, 5% 9/1/21 (Escrowed to Maturity) (e) | 1,000 | 1,183 | ||
Series 2003, 5.5% 9/1/17 (Nat'l. Pub. Fin. Guarantee Corp. Insured) | 3,000 | 3,029 | ||
Oakland Unified School District Alameda County Series 2009 A: | ||||
6.5% 8/1/23 | 2,810 | 3,208 | ||
6.5% 8/1/24 | 1,220 | 1,382 | ||
Oceanside Unified School District Series A, 0% 8/1/31 (Assured Guaranty Corp. Insured) | 5,000 | 1,441 | ||
Orange County Pub. Fin. Lease Rev. (Juvenile Justice Ctr. Facility Proj.) Series 2002, 5.375% 6/1/16 (AMBAC Insured) | 3,770 | 3,916 | ||
Oxnard Fin. Auth. Solid Waste Rev. Series 2005, 5% 5/1/12 (AMBAC Insured) (d) | 2,065 | 2,101 | ||
Municipal Bonds - continued | ||||
| Principal Amount (000s) | Value (000s) | ||
California - continued | ||||
Oxnard Fing. Auth. Wastewtr. Rev. (Redwood Trunk Swr. and Headworks Proj.) Series 2004 A, 5% 6/1/29 (FGIC Insured) | $ 3,000 | $ 3,077 | ||
Palmdale Elementary School District Spl. Tax (Cmnty. Facilities District #90-1 Proj.) Series 1999, 5.8% 8/1/29 (FSA Insured) | 6,410 | 6,415 | ||
Placentia Pub. Fing. Auth. Rev.: | ||||
3.125% 9/1/12 | 1,585 | 1,604 | ||
4% 9/1/13 | 1,855 | 1,917 | ||
Placer County Union High School District Series A: | ||||
0% 8/1/20 (Nat'l. Pub. Fin. Guarantee Corp. Insured) | 2,000 | 1,338 | ||
0% 8/1/21 (Nat'l. Pub. Fin. Guarantee Corp. Insured) | 1,000 | 634 | ||
Placer County Wtr. Agcy. Rev. (Middle Fork Proj.) Series A, 3.75% 7/1/12 | 305 | 306 | ||
Port of Oakland Rev.: | ||||
Series 2002 L: | ||||
5.5% 11/1/20 (Nat'l. Pub. Fin. Guarantee Corp. Insured) (d) | 3,030 | 3,116 | ||
5.5% 11/1/20 (Pre-Refunded to 11/1/12 @ 100) (d)(e) | 375 | 396 | ||
Series 2002 N: | ||||
5% 11/1/12 (Nat'l. Pub. Fin. Guarantee Corp. Insured) (d) | 2,800 | 2,930 | ||
5% 11/1/15 (Nat'l. Pub. Fin. Guarantee Corp. Insured) (d) | 5,850 | 6,079 | ||
5% 11/1/17 (Nat'l. Pub. Fin. Guarantee Corp. Insured) (d) | 3,355 | 3,459 | ||
5% 11/1/18 (Nat'l. Pub. Fin. Guarantee Corp. Insured) (d) | 2,740 | 2,820 | ||
Series 2007 A: | ||||
5% 11/1/14 (Nat'l. Pub. Fin. Guarantee Corp. Insured) (d) | 10,910 | 12,046 | ||
5% 11/1/16 (Nat'l. Pub. Fin. Guarantee Corp. Insured) (d) | 2,885 | 3,232 | ||
5% 11/1/17 (Nat'l. Pub. Fin. Guarantee Corp. Insured) (d) | 2,185 | 2,448 | ||
Series 2011 O, 5% 5/1/22 (d) | 4,500 | 4,750 | ||
Poway Unified School District: | ||||
(District #2007-1 School Facilities Proj.) Series 2008 A, 0% 8/1/32 | 12,800 | 3,493 | ||
Series B, 0% 8/1/35 | 9,000 | 1,987 | ||
0% 8/1/37 | 6,325 | 1,225 | ||
0% 8/1/38 | 5,410 | 981 | ||
Municipal Bonds - continued | ||||
| Principal Amount (000s) | Value (000s) | ||
California - continued | ||||
Poway Unified School District Pub. Fing. Auth. Lease Rev. Bonds: | ||||
Series 2008 B, 0%, tender 12/1/14 (FSA Insured) (c) | $ 6,685 | $ 6,232 | ||
Series 2008 C: | ||||
3.125%, tender 12/1/11 (FSA Insured) (c) | 1,730 | 1,738 | ||
4%, tender 12/1/11 (FSA Insured) (c) | 6,500 | 6,543 | ||
Rancho Mirage Joint Powers Fing. Auth. Rev. (Eisenhower Med. Ctr. Proj.) Series A, 4.875% 7/1/22 (Nat'l. Pub. Fin. Guarantee Corp. Insured) | 3,500 | 3,522 | ||
Redwood City Elementary School District Series 1997, 0% 8/1/20 (Nat'l. Pub. Fin. Guarantee Corp. Insured) | 4,825 | 3,119 | ||
Riverside County Asset Leasing Corp. Leasehold Rev. (Riverside County Hosp. Proj.): | ||||
Series A, 6.5% 6/1/12 (Nat'l. Pub. Fin. Guarantee Corp. Insured) | 5,815 | 6,044 | ||
Series B, 5.7% 6/1/16 (Nat'l. Pub. Fin. Guarantee Corp. Insured) | 1,950 | 2,003 | ||
Riverside County Pub. Fing. Auth. Tax Allocation Rev. (Redev. Projs.): | ||||
Series 2004: | ||||
5.25% 10/1/20 (XL Cap. Assurance, Inc. Insured) | 2,020 | 1,969 | ||
5.25% 10/1/21 (XL Cap. Assurance, Inc. Insured) | 2,125 | 2,043 | ||
Series 2005 A, 5% 10/1/18 (XL Cap. Assurance, Inc. Insured) | 3,740 | 3,716 | ||
Rocklin Unified School District Series 2002: | ||||
0% 8/1/24 (Nat'l. Pub. Fin. Guarantee Corp. Insured) | 1,370 | 683 | ||
0% 8/1/25 (Nat'l. Pub. Fin. Guarantee Corp. Insured) | 2,725 | 1,263 | ||
0% 8/1/26 (Nat'l. Pub. Fin. Guarantee Corp. Insured) | 1,365 | 588 | ||
Roseville City School District Series 2002 A: | ||||
0% 8/1/25 (Nat'l. Pub. Fin. Guarantee Corp. Insured) | 1,745 | 766 | ||
0% 8/1/27 (Nat'l. Pub. Fin. Guarantee Corp. Insured) | 1,940 | 718 | ||
Sacramento City Fing. Auth. Lease Rev. Series A, 5.4% 11/1/20 (AMBAC Insured) | 2,000 | 2,195 | ||
Sacramento City Fing. Auth. Rev. (Combined Area Projs.) Series B, 0% 11/1/15 (Nat'l. Pub. Fin. Guarantee Corp. Insured) | 7,735 | 6,477 | ||
Sacramento Muni. Util. District Elec. Rev.: | ||||
Series 2001 P, 5.25% 8/15/16 (FSA Insured) | 1,500 | 1,505 | ||
Series 2003 R, 5% 8/15/33 (Nat'l. Pub. Fin. Guarantee Corp. Insured) | 6,825 | 6,870 | ||
Sacramento Pwr. Auth. Cogeneration Proj. Rev.: | ||||
Series 2005 A, 5% 7/1/18 (AMBAC Insured) | 2,800 | 2,907 | ||
Series 2005, 5% 7/1/19 (AMBAC Insured) | 2,900 | 3,001 | ||
Municipal Bonds - continued | ||||
| Principal Amount (000s) | Value (000s) | ||
California - continued | ||||
San Bernardino Cmnty. College District Series A: | ||||
6.25% 8/1/33 | $ 5,900 | $ 6,488 | ||
6.5% 8/1/28 | 2,445 | 2,799 | ||
San Bernardino County Ctfs. of Prtn.: | ||||
(Arrowhead Proj.) Series 2009 A, 5.25% 8/1/26 | 3,000 | 3,050 | ||
(Cap. Facilities Proj.) Series B, 6.875% 8/1/24 (Escrowed to Maturity) (e) | 8,300 | 11,434 | ||
(Med. Ctr. Fing. Prog.) 5.5% 8/1/22 | 10,000 | 10,772 | ||
San Diego Cmnty. College District: | ||||
Series 2002 A, 5% 5/1/22 (Pre-Refunded to 5/1/13 @ 100) (e) | 1,000 | 1,079 | ||
Series 2007, 0% 8/1/17 (FSA Insured) | 3,395 | 2,818 | ||
San Diego County Ctfs. of Prtn.: | ||||
(North and East County Justice Facilities Proj.): | ||||
5% 11/15/16 (AMBAC Insured) | 2,000 | 2,275 | ||
5% 11/15/17 (AMBAC Insured) | 2,000 | 2,251 | ||
5% 11/15/18 (AMBAC Insured) | 2,000 | 2,228 | ||
(The Bishop's School Proj.) Series A, 6% 9/1/34, LOC Bank of New York, New York | 4,090 | 4,159 | ||
(Univ. of San Diego Proj.) 5.25% 10/1/11 | 1,705 | 1,710 | ||
San Diego County Reg'l. Arpt. Auth. Arpt. Rev.: | ||||
Series 2005: | ||||
5% 7/1/14 (AMBAC Insured) (d) | 1,000 | 1,091 | ||
5.25% 7/1/16 (AMBAC Insured) (d) | 1,400 | 1,566 | ||
5% 7/1/12 (AMBAC Insured) (d) | 2,200 | 2,268 | ||
San Diego Pub. Facilities Fing. Auth. Swr. Rev. Series 2009 A, 5.25% 5/15/39 | 1,500 | 1,563 | ||
San Diego Pub. Facilities Fing. Auth. Wtr. Rev. 2009 B, 5.75% 8/1/35 | 3,455 | 3,783 | ||
San Francisco City & County Arpts. Commission Int'l. Arpt. Rev.: | ||||
(SFO Fuel Co. Proj.) Series 1997 A: | ||||
5.125% 1/1/17 (AMBAC Insured) (d) | 6,000 | 6,003 | ||
5.25% 1/1/18 (AMBAC Insured) (d) | 4,515 | 4,518 | ||
Second Series 32F, 5.25% 5/1/19 | 2,500 | 2,946 | ||
Second Series 32H, 5% 5/1/12 (CIFG North America Insured) (d) | 1,000 | 1,029 | ||
San Francisco City & County Redev. Fing. Auth. Tax Allocation Rev. (San Francisco Redev. Projs.) Series 2009 B: | ||||
6.125% 8/1/28 | 1,000 | 1,040 | ||
6.625% 8/1/39 | 1,000 | 1,043 | ||
Municipal Bonds - continued | ||||
| Principal Amount (000s) | Value (000s) | ||
California - continued | ||||
San Jacinto Unified School District Series 2007, 5.25% 8/1/32 (FSA Insured) | $ 3,080 | $ 3,194 | ||
San Joaquin County Ctfs. of Prtn. (County Administration Bldg. Proj.): | ||||
5% 11/15/20 (Nat'l. Pub. Fin. Guarantee Corp. Insured) | 3,720 | 3,964 | ||
5% 11/15/21 (Nat'l. Pub. Fin. Guarantee Corp. Insured) | 3,645 | 3,857 | ||
San Joaquin Hills Trans. Corridor Agcy. Toll Road Rev.: | ||||
Series 1993, 0% 1/1/27 (Escrowed to Maturity) (e) | 4,000 | 2,297 | ||
Series 1997 A: | ||||
0% 1/15/26 (Nat'l. Pub. Fin. Guarantee Corp. Insured) | 11,000 | 3,306 | ||
5.5% 1/15/28 | 1,060 | 846 | ||
Series A: | ||||
0% 1/15/12 (Nat'l. Pub. Fin. Guarantee Corp. Insured) | 7,000 | 6,881 | ||
0% 1/15/15 (Nat'l. Pub. Fin. Guarantee Corp. Insured) | 5,000 | 4,081 | ||
0% 1/15/20 (Nat'l. Pub. Fin. Guarantee Corp. Insured) | 3,765 | 2,036 | ||
0% 1/15/31 (Nat'l. Pub. Fin. Guarantee Corp. Insured) | 5,000 | 951 | ||
San Jose Int'l. Arpt. Rev. Series 2007 A: | ||||
5% 3/1/17 (AMBAC Insured) (d) | 1,180 | 1,297 | ||
5% 3/1/24 (AMBAC Insured) (d) | 9,690 | 9,876 | ||
5% 3/1/37 (AMBAC Insured) (d) | 10,000 | 9,332 | ||
San Jose Unified School District Santa Clara County Series 2002 B, 5% 8/1/25 (FGIC Insured) | 1,750 | 1,863 | ||
San Leandro Unified School District Series 2006 B, 6.25% 8/1/33 (FSA Insured) | 2,800 | 3,095 | ||
San Marcos Pub. Facilities Auth. Pub. Facilities Rev. 0% 9/1/15 (Escrowed to Maturity) (e) | 1,990 | 1,918 | ||
San Marcos Unified School District Series A, 5% 8/1/38 | 5,000 | 5,121 | ||
San Mateo County Cmnty. College District Series A, 0% 9/1/18 (Nat'l. Pub. Fin. Guarantee Corp. Insured) | 3,000 | 2,425 | ||
San Mateo County Joint Powers Fing. Auth. (Cap. Projects) Series 2009 A, 5.25% 7/15/24 | 5,280 | 5,733 | ||
San Mateo Unified School District (Election of 2000 Proj.) Series B: | ||||
0% 9/1/23 (Nat'l. Pub. Fin. Guarantee Corp. Insured) | 2,000 | 1,085 | ||
0% 9/1/25 (Nat'l. Pub. Fin. Guarantee Corp. Insured) | 1,490 | 701 | ||
0% 9/1/26 (Nat'l. Pub. Fin. Guarantee Corp. Insured) | 1,500 | 657 | ||
Municipal Bonds - continued | ||||
| Principal Amount (000s) | Value (000s) | ||
California - continued | ||||
Sanger Unified School District 5.6% 8/1/23 (Nat'l. Pub. Fin. Guarantee Corp. Insured) | $ 3,000 | $ 3,132 | ||
Santa Clara County Fing. Auth. Rev. (El Camino Hosp. Proj.): | ||||
Series 2007 B, 5.125% 2/1/41 (AMBAC Insured) | 2,000 | 1,880 | ||
Series 2007 C, 5.75% 2/1/41 (AMBAC Insured) | 8,000 | 8,083 | ||
Santa Clara Elec. Rev. Series 2011 A, 6% 7/1/31 | 3,000 | 3,324 | ||
Santa Margarita/Dana Point Auth. Rev. Impt. (Dists. 1, 2, 2A & 8 Proj.) Series A, 7.25% 8/1/12 (Nat'l. Pub. Fin. Guarantee Corp. Insured) | 1,865 | 1,949 | ||
Santa Rosa Wastewtr. Rev. Series 2002 B: | ||||
0% 9/1/20 (AMBAC Insured) | 4,030 | 2,554 | ||
0% 9/1/22 (AMBAC Insured) | 2,900 | 1,601 | ||
0% 9/1/25 (AMBAC Insured) | 6,800 | 2,995 | ||
Shasta Joint Powers Fing. Auth. Lease Rev. (County Administration Bldg. Proj.) Series A, 5% 4/1/29 (Nat'l. Pub. Fin. Guarantee Corp. Insured) | 5,015 | 5,019 | ||
Shasta Union High School District: | ||||
Series 2002, 0% 8/1/26 (Nat'l. Pub. Fin. Guarantee Corp. Insured) | 1,000 | 422 | ||
Series 2003, 0% 5/1/28 (Nat'l. Pub. Fin. Guarantee Corp. Insured) | 3,340 | 1,252 | ||
Sonoma County Jr. College District Rev. Series 2002 B, 5% 8/1/26 (FSA Insured) | 11,845 | 12,439 | ||
Southern California Pub. Pwr. Auth. Transmission Proj. Rev. (Southern Transmission Proj.) Series 2008 B, 6% 7/1/25 | 5,450 | 6,356 | ||
Southwestern Cmnty. College District Gen. Oblig. Series 2000, 0% 8/1/27 (Nat'l. Pub. Fin. Guarantee Corp. Insured) | 2,495 | 1,000 | ||
Sulphur Springs Union School District Series A, 0% 9/1/12 (Nat'l. Pub. Fin. Guarantee Corp. Insured) | 2,750 | 2,698 | ||
Sweetwater Union High School District Series 2008 A, 5.625% 8/1/47 (FSA Insured) | 16,900 | 17,863 | ||
Torrance Ctfs. of Prtn. (Refing. & Pub. Impt. Proj.) Series B, 5.25% 6/1/34 (AMBAC Insured) | 3,000 | 3,004 | ||
Torrance Gen. Oblig. Rev. (Torrance Memorial Med. Ctr. Proj.) Series A, 5% 9/1/40 | 5,000 | 4,667 | ||
Torrance Hosp. Rev. (Torrance Memorial Med. Ctr. Proj.) Series 2001 A: | ||||
5.5% 6/1/31 | 2,350 | 2,355 | ||
6% 6/1/22 | 1,100 | 1,115 | ||
Torrance Unified School District Series 2008 Z, 6% 8/1/33 | 5,000 | 5,561 | ||
Municipal Bonds - continued | ||||
| Principal Amount (000s) | Value (000s) | ||
California - continued | ||||
Tracy Operating Partnership Joint Powers Auth. Rev. 6.375% 10/1/38 (Assured Guaranty Corp. Insured) | $ 5,000 | $ 5,527 | ||
Turlock Irrigation District Rev. Series 2011, 5.5% 1/1/41 | 10,000 | 10,707 | ||
Ukiah Unified School District 0% 8/1/14 (Nat'l. Pub. Fin. Guarantee Corp. Insured) | 3,040 | 2,765 | ||
Union Elementary School District Series A: | ||||
0% 9/1/18 (Nat'l. Pub. Fin. Guarantee Corp. Insured) | 1,000 | 786 | ||
0% 9/1/21 (Nat'l. Pub. Fin. Guarantee Corp. Insured) | 2,995 | 1,889 | ||
Univ. of California Regents Med. Ctr. Pool Rev. Series 2010 G: | ||||
4% 5/15/19 | 1,305 | 1,415 | ||
4% 5/15/20 | 615 | 665 | ||
5% 5/15/19 | 2,830 | 3,262 | ||
Univ. of California Revs.: | ||||
(Ltd. Proj.): | ||||
Series 2005 B, 5% 5/15/33 | 1,000 | 1,011 | ||
Series 2007 D, 5% 5/15/25 | 4,250 | 4,592 | ||
(UCLA Med. Ctr. Proj.) Series A: | ||||
5.5% 5/15/21 (AMBAC Insured) | 785 | 798 | ||
5.5% 5/15/24 (AMBAC Insured) | 370 | 374 | ||
Series 2009 O, 5.75% 5/15/34 | 9,900 | 10,913 | ||
Series C, 4.75% 5/15/37 (Nat'l. Pub. Fin. Guarantee Corp. Insured) | 3,150 | 3,174 | ||
Val Verde Unified School District Ctfs. of Prtn.: | ||||
5% 1/1/35 (FGIC Insured) | 2,090 | 1,797 | ||
5.25% 1/1/17 (Pre-Refunded to 1/1/15 @ 100) (e) | 1,000 | 1,155 | ||
5.25% 1/1/18 (Pre-Refunded to 1/1/15 @ 100) (e) | 1,380 | 1,595 | ||
Ventura County Cmnty. College District Series C, 5.5% 8/1/33 | 7,700 | 8,265 | ||
Victor Elementary School District Series A, 0% 6/1/14 (Nat'l. Pub. Fin. Guarantee Corp. Insured) | 2,375 | 2,174 | ||
Vista Gen. Oblig. Ctfs. of Prtn. 5% 5/1/20 (Nat'l. Pub. Fin. Guarantee Corp. Insured) | 2,120 | 2,293 | ||
Vista Unified School District Series A: | ||||
5.375% 8/1/15 (FSA Insured) | 130 | 136 | ||
5.375% 8/1/16 (FSA Insured) | 100 | 104 | ||
Walnut Valley Unified School District Series D: | ||||
0% 8/1/30 (Nat'l. Pub. Fin. Guarantee Corp. Insured) | 2,875 | 890 | ||
0% 8/1/31 (Nat'l. Pub. Fin. Guarantee Corp. Insured) | 2,715 | 767 | ||
0% 8/1/32 (Nat'l. Pub. Fin. Guarantee Corp. Insured) | 1,315 | 343 | ||
5.25% 8/1/16 (Pre-Refunded to 8/1/13 @ 100) (e) | 1,000 | 1,095 | ||
Municipal Bonds - continued | ||||
| Principal Amount (000s) | Value (000s) | ||
California - continued | ||||
Washington Township Health Care District Rev.: | ||||
Series 2009 A: | ||||
6% 7/1/29 | $ 3,000 | $ 3,162 | ||
6.25% 7/1/39 | 7,000 | 7,222 | ||
Series 2010 A, 5.5% 7/1/38 | 3,100 | 2,999 | ||
Series A: | ||||
5% 7/1/23 | 1,460 | 1,483 | ||
5% 7/1/25 | 1,665 | 1,672 | ||
West Contra Costa Unified School District (Election of 2005 Proj.) Series B, 5.625% 8/1/35 (Berkshire Hathaway Assurance Corp. Insured) | 1,500 | 1,542 | ||
Western Riverside County Trust & Wastewtr. Fin. Auth.: | ||||
5.5% 9/1/34 (Assured Guaranty Corp. Insured) | 1,750 | 1,830 | ||
5.625% 9/1/39 (Assured Guaranty Corp. Insured) | 2,250 | 2,357 | ||
Yuba City Unified School District Series A, 0% 9/1/21 (Nat'l. Pub. Fin. Guarantee Corp. Insured) | 2,090 | 1,252 | ||
| 1,602,889 | |||
Guam - 0.2% | ||||
Guam Ed. Fing. Foundation Ctfs. of Prtn. Series 2008: | ||||
4.625% 10/1/11 | 275 | 275 | ||
5.375% 10/1/14 | 1,000 | 1,070 | ||
5.875% 10/1/18 | 1,565 | 1,764 | ||
| 3,109 | |||
Puerto Rico - 0.8% | ||||
Puerto Rico Commonwealth Pub. Impt. Gen. Oblig. Series 2006 A, 4.064% 7/1/21 (FGIC Insured) (c) | 4,600 | 3,830 | ||
Puerto Rico Pub. Bldg. Auth. Rev. Bonds Series M2, 5.75%, tender 7/1/17 (c) | 7,000 | 7,577 | ||
Puerto Rico Sales Tax Fing. Corp. Sales Tax Rev. Series 2007 A, 0% 8/1/41 (FGIC Insured) | 9,500 | 1,423 | ||
| 12,830 | |||
Virgin Islands - 0.2% | ||||
Virgin Islands Pub. Fin. Auth.: | ||||
Series 2009 A1, 5% 10/1/29 | 1,500 | 1,450 | ||
Municipal Bonds - continued | ||||
| Principal Amount (000s) | Value (000s) | ||
Virgin Islands - continued | ||||
Virgin Islands Pub. Fin. Auth.: - continued | ||||
Series 2009 B, 5% 10/1/25 | $ 1,500 | $ 1,507 | ||
Series A, 5.25% 10/1/15 | 1,255 | 1,368 | ||
| 4,325 | |||
TOTAL INVESTMENT PORTFOLIO - 96.8% (Cost $1,581,311) | 1,623,153 | ||
NET OTHER ASSETS (LIABILITIES) - 3.2% | 52,816 | ||
NET ASSETS - 100% | $ 1,675,969 | ||
Legend |
(a) Security initially issued in zero coupon form which converts to coupon form at a specified rate and date. The rate shown is the rate at period end. |
(b) Security or a portion of the security purchased on a delayed delivery or when-issued basis. |
(c) Coupon rates for floating and adjustable rate securities reflect the rates in effect at period end. |
(d) Private activity obligations whose interest is subject to the federal alternative minimum tax for individuals. |
(e) Security collateralized by an amount sufficient to pay interest and principal. |
Other Information |
All investments are categorized as Level 2 under the Fair Value Hierarchy. The inputs or methodology used for valuing securities may not be an indication of the risk associated with investing in those securities. For more information on valuation inputs, please refer to the Security Valuation section in the accompanying Notes to Financial Statements. |
The distribution of municipal securities by revenue source, as a percentage of total net assets, is as follows (Unaudited): |
General Obligations | 46.6% |
Health Care | 12.1% |
Transportation | 10.9% |
Education | 6.5% |
Others* (Individually Less Than 5%) | 23.9% |
| 100.0% |
*Includes net other assets |
Income Tax Information |
At February 28, 2011, the Fund had a capital loss carryforward of approximately $23,286,000 of which $21,327,000 and $1,959,000 will expire in fiscal 2017 and 2018, respectively. Capital loss carryforwards are only available to offset future capital gains of the Fund to the extent provided by regulations and may be limited. |
See accompanying notes which are an integral part of the financial statements.
Semiannual Report
Financial Statements
Statement of Assets and Liabilities
Amounts in thousands (except per-share amounts) | August 31, 2011 (Unaudited) | |
|
|
|
Assets | ||
Investment in securities, at value - See accompanying schedule: Unaffiliated issuers (cost $1,581,311) |
| $ 1,623,153 |
Cash | 43,490 | |
Receivable for fund shares sold | 839 | |
Interest receivable | 18,330 | |
Other receivables | 3 | |
Total assets | 1,685,815 | |
|
|
|
Liabilities | ||
Payable for investments purchased on a delayed delivery basis | $ 6,384 | |
Payable for fund shares redeemed | 521 | |
Distributions payable | 2,004 | |
Accrued management fee | 508 | |
Distribution and service plan fees payable | 27 | |
Other affiliated payables | 372 | |
Other payables and accrued expenses | 30 | |
Total liabilities | 9,846 | |
|
|
|
Net Assets | $ 1,675,969 | |
Net Assets consist of: |
| |
Paid in capital | $ 1,659,185 | |
Undistributed net investment income | 1,619 | |
Accumulated undistributed net realized gain (loss) on investments | (26,677) | |
Net unrealized appreciation (depreciation) on investments | 41,842 | |
Net Assets | $ 1,675,969 | |
See accompanying notes which are an integral part of the financial statements.
Semiannual Report
Financial Statements - continued
Statement of Assets and Liabilities - continued
Amounts in thousands (except per-share amounts) | August 31, 2011 (Unaudited) | |
|
|
|
Calculation of Maximum Offering Price | $ 12.15 | |
|
|
|
Maximum offering price per share (100/96.00 of $12.15) | $ 12.66 | |
Class T: | $ 12.18 | |
|
|
|
Maximum offering price per share (100/96.00 of $12.18) | $ 12.69 | |
Class B: | $ 12.14 | |
|
|
|
Class C: | $ 12.14 | |
|
|
|
|
|
|
California Municipal Income: | $ 12.14 | |
|
|
|
Institutional Class: | $ 12.16 | |
A Redemption price per share is equal to net asset value less any applicable contingent deferred sales charge.
See accompanying notes which are an integral part of the financial statements.
Semiannual Report
Statement of Operations
Amounts in thousands Six months ended August 31, 2011 (Unaudited) | ||
|
|
|
Investment Income |
|
|
Interest |
| $ 38,433 |
|
|
|
Expenses | ||
Management fee | $ 2,914 | |
Transfer agent fees | 574 | |
Distribution and service plan fees | 154 | |
Accounting fees and expenses | 150 | |
Custodian fees and expenses | 9 | |
Independent trustees' compensation | 3 | |
Registration fees | 68 | |
Audit | 24 | |
Legal | 6 | |
Miscellaneous | 12 | |
Total expenses before reductions | 3,914 | |
Expense reductions | (4) | 3,910 |
Net investment income (loss) | 34,523 | |
Realized and Unrealized Gain (Loss) Net realized gain (loss) on: | ||
Investment securities: |
|
|
Unaffiliated issuers |
| 519 |
Change in net unrealized appreciation (depreciation) on investment securities | 68,507 | |
Net gain (loss) | 69,026 | |
Net increase (decrease) in net assets resulting from operations | $ 103,549 | |
See accompanying notes which are an integral part of the financial statements.
Semiannual Report
Financial Statements - continued
Statement of Changes in Net Assets
Amounts in thousands | Six months ended August 31, 2011 (Unaudited) | Year ended |
Increase (Decrease) in Net Assets |
|
|
Operations |
|
|
Net investment income (loss) | $ 34,523 | $ 71,286 |
Net realized gain (loss) | 519 | (1,281) |
Change in net unrealized appreciation (depreciation) | 68,507 | (36,685) |
Net increase (decrease) in net assets resulting | 103,549 | 33,320 |
Distributions to shareholders from net investment income | (34,341) | (70,898) |
Distributions to shareholders from net realized gain | - | (100) |
Total distributions | (34,341) | (70,998) |
Share transactions - net increase (decrease) | 67,077 | (116,381) |
Redemption fees | 5 | 39 |
Total increase (decrease) in net assets | 136,290 | (154,020) |
|
|
|
Net Assets | ||
Beginning of period | 1,539,679 | 1,693,699 |
End of period (including undistributed net investment income of $1,619 and undistributed net investment income of $1,437, respectively) | $ 1,675,969 | $ 1,539,679 |
See accompanying notes which are an integral part of the financial statements.
Semiannual Report
Financial Highlights - Class A
| Six months ended August 31, 2011 | Years ended February 28, | ||||
| (Unaudited) | 2011 | 2010 | 2009 | 2008 G | 2007 |
Selected Per-Share Data |
|
|
|
|
| |
Net asset value, beginning of period | $ 11.64 | $ 11.89 | $ 11.40 | $ 11.63 | $ 12.41 | $ 12.46 |
Income from Investment Operations |
|
|
|
|
|
|
Net investment income (loss) E | .240 | .470 | .472 | .459 | .457 | .478 |
Net realized and unrealized gain (loss) | .509 | (.252) | .486 | (.224) | (.711) | .050 |
Total from investment operations | .749 | .218 | .958 | .235 | (.254) | .528 |
Distributions from net investment income | (.239) | (.467) | (.468) | (.461) | (.457) | (.483) |
Distributions from net realized gain | - | (.001) | - H | (.004) | (.069) | (.095) |
Total distributions | (.239) | (.468) | (.468) | (.465) | (.526) | (.578) |
Redemption fees added to paid in capital E, H | - | - | - | - | - | - |
Net asset value, end of period | $ 12.15 | $ 11.64 | $ 11.89 | $ 11.40 | $ 11.63 | $ 12.41 |
Total Return B, C, D | 6.50% | 1.79% | 8.57% | 2.04% | (2.15)% | 4.36% |
Ratios to Average Net Assets F |
|
|
|
|
| |
Expenses before reductions | .75% A | .75% | .77% | .75% | .73% | .64% |
Expenses net of fee waivers, if any | .75% A | .75% | .77% | .75% | .73% | .64% |
Expenses net of all reductions | .75% A | .74% | .77% | .74% | .70% | .62% |
Net investment income (loss) | 4.03% A | 3.93% | 4.05% | 3.98% | 3.76% | 3.88% |
Supplemental Data |
|
|
|
|
|
|
Net assets, end of period (in millions) | $ 43 | $ 40 | $ 44 | $ 34 | $ 20 | $ 13 |
Portfolio turnover rate | 8% A | 8% | 15% | 26% | 27% | 23% |
A Annualized
B Total returns for periods of less than one year are not annualized.
C Total returns would have been lower had certain expenses not been reduced during the periods shown.
D Total returns do not include the effect of the sales charges.
E Calculated based on average shares outstanding during the period.
F Expense ratios reflect operating expenses of the class. Expenses before reductions do not reflect amounts reimbursed by the investment adviser or reductions from expense offset arrangements and do not represent the amount paid by the class during periods when reimbursements or reductions occur. Expenses net of fee waivers reflect expenses after reimbursement by the investment adviser but prior to reductions from expense offset arrangements. Expenses net of all reductions represent the net expenses paid by the class.
G For the year ended February 29.
H Amount represents less than $.001 per share.
See accompanying notes which are an integral part of the financial statements.
Semiannual Report
Financial Highlights - Class T
| Six months ended August 31, 2011 | Years ended February 28, | ||||
| (Unaudited) | 2011 | 2010 | 2009 | 2008 G | 2007 |
Selected Per-Share Data |
|
|
|
|
| |
Net asset value, beginning of period | $ 11.67 | $ 11.91 | $ 11.42 | $ 11.65 | $ 12.43 | $ 12.48 |
Income from Investment Operations |
|
|
|
|
|
|
Net investment income (loss) E | .240 | .473 | .477 | .464 | .458 | .466 |
Net realized and unrealized gain (loss) | .508 | (.245) | .486 | (.227) | (.712) | .048 |
Total from investment operations | .748 | .228 | .963 | .237 | (.254) | .514 |
Distributions from net investment income | (.238) | (.467) | (.473) | (.463) | (.457) | (.469) |
Distributions from net realized gain | - | (.001) | - H | (.004) | (.069) | (.095) |
Total distributions | (.238) | (.468) | (.473) | (.467) | (.526) | (.564) |
Redemption fees added to paid in capitalE, H | - | - | - | - | - | - |
Net asset value, end of period | $ 12.18 | $ 11.67 | $ 11.91 | $ 11.42 | $ 11.65 | $ 12.43 |
Total Return B, C, D | 6.48% | 1.87% | 8.59% | 2.05% | (2.15)% | 4.24% |
Ratios to Average Net Assets F |
|
|
|
|
| |
Expenses before reductions | .76% A | .75% | .73% | .73% | .74% | .75% |
Expenses net of fee waivers, if any | .76% A | .75% | .73% | .73% | .74% | .75% |
Expenses net of all reductions | .76% A | .75% | .73% | .72% | .70% | .72% |
Net investment income (loss) | 4.02% A | 3.93% | 4.09% | 4.00% | 3.75% | 3.77% |
Supplemental Data |
|
|
|
|
|
|
Net assets, end of period (in millions) | $ 4 | $ 4 | $ 6 | $ 7 | $ 5 | $ 5 |
Portfolio turnover rate | 8% A | 8% | 15% | 26% | 27% | 23% |
A Annualized
B Total returns for periods of less than one year are not annualized.
C Total returns would have been lower had certain expenses not been reduced during the periods shown.
D Total returns do not include the effect of the sales charges.
E Calculated based on average shares outstanding during the period.
F Expense ratios reflect operating expenses of the class. Expenses before reductions do not reflect amounts reimbursed by the investment adviser or reductions from expense offset arrangements and do not represent the amount paid by the class during periods when reimbursements or reductions occur. Expenses net of fee waivers reflect expenses after reimbursement by the investment adviser but prior to reductions from expense offset arrangements. Expenses net of all reductions represent the net expenses paid by the class.
G For the year ended February 29.
H Amount represents less than $.001 per share.
See accompanying notes which are an integral part of the financial statements.
Semiannual Report
Financial Highlights - Class B
| Six months ended August 31, 2011 | Years ended February 28, | ||||
| (Unaudited) | 2011 | 2010 | 2009 | 2008 G | 2007 |
Selected Per-Share Data |
|
|
|
|
| |
Net asset value, beginning of period | $ 11.63 | $ 11.88 | $ 11.39 | $ 11.62 | $ 12.40 | $ 12.45 |
Income from Investment Operations |
|
|
|
|
|
|
Net investment income (loss) E | .203 | .395 | .397 | .387 | .376 | .383 |
Net realized and unrealized gain (loss) | .509 | (.253) | .488 | (.228) | (.712) | .049 |
Total from investment operations | .712 | .142 | .885 | .159 | (.336) | .432 |
Distributions from net investment income | (.202) | (.391) | (.395) | (.385) | (.375) | (.387) |
Distributions from net realized gain | - | (.001) | - H | (.004) | (.069) | (.095) |
Total distributions | (.202) | (.392) | (.395) | (.389) | (.444) | (.482) |
Redemption fees added to paid in capitalE, H | - | - | - | - | - | - |
Net asset value, end of period | $ 12.14 | $ 11.63 | $ 11.88 | $ 11.39 | $ 11.62 | $ 12.40 |
Total Return B, C, D | 6.17% | 1.15% | 7.90% | 1.38% | (2.81)% | 3.57% |
Ratios to Average Net Assets F |
|
|
|
|
| |
Expenses before reductions | 1.37% A | 1.38% | 1.40% | 1.41% | 1.41% | 1.41% |
Expenses net of fee waivers, if any | 1.37% A | 1.38% | 1.40% | 1.41% | 1.41% | 1.41% |
Expenses net of all reductions | 1.37% A | 1.38% | 1.40% | 1.40% | 1.37% | 1.39% |
Net investment income (loss) | 3.41% A | 3.29% | 3.42% | 3.33% | 3.08% | 3.11% |
Supplemental Data |
|
|
|
|
|
|
Net assets, end of period (in millions) | $ 2 | $ 2 | $ 3 | $ 4 | $ 5 | $ 5 |
Portfolio turnover rate | 8% A | 8% | 15% | 26% | 27% | 23% |
A Annualized
B Total returns for periods of less than one year are not annualized.
C Total returns would have been lower had certain expenses not been reduced during the periods shown.
D Total returns do not include the effect of the contingent deferred sales charge.
E Calculated based on average shares outstanding during the period.
F Expense ratios reflect operating expenses of the class. Expenses before reductions do not reflect amounts reimbursed by the investment adviser or reductions from expense offset arrangements and do not represent the amount paid by the class during periods when reimbursements or reductions occur. Expenses net of fee waivers reflect expenses after reimbursement by the investment adviser but prior to reductions from expense offset arrangements. Expenses net of all reductions represent the net expenses paid by the class.
G For the year ended February 29.
H Amount represents less than $.001 per share.
See accompanying notes which are an integral part of the financial statements.
Semiannual Report
Financial Highlights - Class C
| Six months ended August 31, 2011 | Years ended February 28, | ||||
| (Unaudited) | 2011 | 2010 | 2009 | 2008 G | 2007 |
Selected Per-Share Data |
|
|
|
|
| |
Net asset value, beginning of period | $ 11.62 | $ 11.87 | $ 11.38 | $ 11.61 | $ 12.40 | $ 12.44 |
Income from Investment Operations |
|
|
|
|
|
|
Net investment income (loss) E | .194 | .378 | .384 | .374 | .364 | .371 |
Net realized and unrealized gain (loss) | .519 | (.252) | .488 | (.225) | (.721) | .061 |
Total from investment operations | .713 | .126 | .872 | .149 | (.357) | .432 |
Distributions from net investment income | (.193) | (.376) | (.382) | (.375) | (.364) | (.377) |
Distributions from net realized gain | - | (.001) | - H | (.004) | (.069) | (.095) |
Total distributions | (.193) | (.376) I | (.382) | (.379) | (.433) | (.472) |
Redemption fees added to paid in capitalE, H | - | - | - | - | - | - |
Net asset value, end of period | $ 12.14 | $ 11.62 | $ 11.87 | $ 11.38 | $ 11.61 | $ 12.40 |
Total Return B, C, D | 6.19% | 1.02% | 7.78% | 1.29% | (2.98)% | 3.56% |
Ratios to Average Net Assets F |
|
|
|
|
| |
Expenses before reductions | 1.52% A | 1.51% | 1.51% | 1.49% | 1.50% | 1.50% |
Expenses net of fee waivers, if any | 1.52% A | 1.51% | 1.51% | 1.49% | 1.50% | 1.50% |
Expenses net of all reductions | 1.52% A | 1.51% | 1.51% | 1.48% | 1.47% | 1.48% |
Net investment income (loss) | 3.26% A | 3.16% | 3.30% | 3.24% | 2.99% | 3.02% |
Supplemental Data |
|
|
|
|
|
|
Net assets, end of period (in millions) | $ 19 | $ 17 | $ 19 | $ 12 | $ 8 | $ 10 |
Portfolio turnover rate | 8% A | 8% | 15% | 26% | 27% | 23% |
A Annualized
B Total returns for periods of less than one year are not annualized.
C Total returns would have been lower had certain expenses not been reduced during the periods shown.
D Total returns do not include the effect of the contingent deferred sales charge.
E Calculated based on average shares outstanding during the period.
F Expense ratios reflect operating expenses of the class. Expenses before reductions do not reflect amounts reimbursed by the investment adviser or reductions from expense offset arrangements and do not represent the amount paid by the class during periods when reimbursements or reductions occur. Expenses net of fee waivers reflect expenses after reimbursement by the investment adviser but prior to reductions from expense offset arrangements. Expenses net of all reductions represent the net expenses paid by the class.
G For the year ended February 29.
H Amount represents less than $.001 per share.
I Total distributions of $.376 per share is comprised of distributions from net investment income of $.3757 and distributions from net realized gain of $.0007 per share.
See accompanying notes which are an integral part of the financial statements.
Semiannual Report
Financial Highlights - California Municipal Income
| Six months ended August 31, 2011 | Years ended February 28, | ||||
| (Unaudited) | 2011 | 2010 | 2009 | 2008 F | 2007 |
Selected Per-Share Data |
|
|
|
|
| |
Net asset value, beginning of period | $ 11.63 | $ 11.88 | $ 11.38 | $ 11.61 | $ 12.40 | $ 12.45 |
Income from Investment Operations |
|
|
|
|
|
|
Net investment income (loss) D | .257 | .504 | .506 | .495 | .491 | .499 |
Net realized and unrealized gain (loss) | .509 | (.252) | .497 | (.227) | (.722) | .050 |
Total from investment operations | .766 | .252 | 1.003 | .268 | (.231) | .549 |
Distributions from net investment income | (.256) | (.501) | (.503) | (.494) | (.490) | (.504) |
Distributions from net realized gain | - | (.001) | - G | (.004) | (.069) | (.095) |
Total distributions | (.256) | (.502) | (.503) | (.498) | (.559) | (.599) |
Redemption fees added to paid in capital D, G | - | - | - | - | - | - |
Net asset value, end of period | $ 12.14 | $ 11.63 | $ 11.88 | $ 11.38 | $ 11.61 | $ 12.40 |
Total Return B, C | 6.66% | 2.08% | 9.00% | 2.33% | (1.97)% | 4.55% |
Ratios to Average Net Assets E |
|
|
|
|
| |
Expenses before reductions | .47% A | .46% | .47% | .47% | .46% | .47% |
Expenses net of fee waivers, if any | .47% A | .46% | .47% | .47% | .46% | .47% |
Expenses net of all reductions | .46% A | .46% | .47% | .46% | .43% | .44% |
Net investment income (loss) | 4.32% A | 4.21% | 4.34% | 4.27% | 4.03% | 4.05% |
Supplemental Data |
|
|
|
|
|
|
Net assets, end of period (in millions) | $ 1,580 | $ 1,456 | $ 1,560 | $ 1,427 | $ 1,543 | $ 1,611 |
Portfolio turnover rate | 8% A | 8% | 15% | 26% | 27% | 23% |
A Annualized
B Total returns for periods of less than one year are not annualized.
C Total returns would have been lower had certain expenses not been reduced during the periods shown.
D Calculated based on average shares outstanding during the period.
E Expense ratios reflect operating expenses of the class. Expenses before reductions do not reflect amounts reimbursed by the investment adviser or reductions from expense offset arrangements and do not represent the amount paid by the class during periods when reimbursements or reductions occur. Expenses net of fee waivers reflect expenses after reimbursement by the investment adviser but prior to reductions from expense offset arrangements. Expenses net of all reductions represent the net expenses paid by the class.
F For the year ended February 29.
G Amount represents less than $.001 per share.
See accompanying notes which are an integral part of the financial statements.
Semiannual Report
Financial Highlights - Institutional Class
| Six months ended August 31, 2011 | Years ended February 28, | ||||
| (Unaudited) | 2011 | 2010 | 2009 | 2008 F | 2007 |
Selected Per-Share Data |
|
|
|
|
| |
Net asset value, beginning of period | $ 11.65 | $ 11.90 | $ 11.40 | $ 11.63 | $ 12.42 | $ 12.47 |
Income from Investment Operations |
|
|
|
|
|
|
Net investment income (loss) D | .254 | .500 | .503 | .491 | .486 | .493 |
Net realized and unrealized gain (loss) | .508 | (.255) | .496 | (.226) | (.722) | .049 |
Total from investment operations | .762 | .245 | .999 | .265 | (.236) | .542 |
Distributions from net investment income | (.252) | (.495) | (.499) | (.491) | (.485) | (.497) |
Distributions from net realized gain | - | (.001) | - G | (.004) | (.069) | (.095) |
Total distributions | (.252) | (.495)H | (.499) | (.495) | (.554) | (.592) |
Redemption fees added to paid in capital D, G | - | - | - | - | - | - |
Net asset value, end of period | $ 12.16 | $ 11.65 | $ 11.90 | $ 11.40 | $ 11.63 | $ 12.42 |
Total Return B, C | 6.61% | 2.02% | 8.94% | 2.30% | (2.00)% | 4.48% |
Ratios to Average Net Assets E |
|
|
|
|
| |
Expenses before reductions | .53% A | .51% | .51% | .49% | .50% | .53% |
Expenses net of fee waivers, if any | .53% A | .51% | .51% | .49% | .50% | .53% |
Expenses net of all reductions | .53% A | .51% | .51% | .48% | .47% | .50% |
Net investment income (loss) | 4.26% A | 4.16% | 4.31% | 4.24% | 3.99% | 3.99% |
Supplemental Data |
|
|
|
|
|
|
Net assets, end of period (in millions) | $ 27 | $ 21 | $ 62 | $ 19 | $ 11 | $ 8 |
Portfolio turnover rate | 8% A | 8% | 15% | 26% | 27% | 23% |
A Annualized
B Total returns for periods of less than one year are not annualized.
C Total returns would have been lower had certain expenses not been reduced during the periods shown.
D Calculated based on average shares outstanding during the period.
E Expense ratios reflect operating expenses of the class. Expenses before reductions do not reflect amounts reimbursed by the investment adviser or reductions from expense offset arrangements and do not represent the amount paid by the class during periods when reimbursements or reductions occur. Expenses net of fee waivers reflect expenses after reimbursement by the investment adviser but prior to reductions from expense offset arrangements. Expenses net of all reductions represent the net expenses paid by the class.
F For the year ended February 29.
G Amount represents less than $.001 per share.
H Total distributions of $.495 per share is comprised of distributions from net investment income of $.4945 and distributions from net realized gain of $.0007 per share.
See accompanying notes which are an integral part of the financial statements.
Semiannual Report
Notes to Financial Statements
For the period ended August 31, 2011 (Unaudited)
(Amounts in thousands except ratios)
1. Organization.
Fidelity California Municipal Income Fund (the Fund) is a non-diversified fund of Fidelity California Municipal Trust (the Trust) and is authorized to issue an unlimited number of shares. The Trust is registered under the Investment Company Act of 1940, as amended (the 1940 Act), as an open-end management investment company organized as a Massachusetts business trust. The Fund offers Class A, Class T, Class C, California Municipal Income and Institutional Class shares, each of which, along with Class B shares, has equal rights as to assets and voting privileges. Effective after the close of business on September 1, 2010, Class B shares were closed to new accounts and additional purchases, except for exchanges and reinvestments by existing shareholders. Each class has exclusive voting rights with respect to matters that affect that class. Class B shares will automatically convert to Class A shares after a holding period of seven years from the initial date of purchase. Investment income, realized and unrealized capital gains and losses, the common expenses of the Fund, and certain fund-level expense reductions, if any, are allocated on a pro-rata basis to each class based on the relative net assets of each class to the total net assets of the Fund. Each class differs with respect to transfer agent and distribution and service plan fees incurred. Certain expense reductions may also differ by class. The Fund may be affected by economic and political developments in the state of California.
2. Significant Accounting Policies.
The financial statements have been prepared in conformity with accounting principles generally accepted in the United States of America (GAAP), which require management to make certain estimates and assumptions at the date of the financial statements. Actual results could differ from those estimates. Subsequent events, if any, through the date that the financial statements were issued have been evaluated in the preparation of the financial statements. The following summarizes the significant accounting policies of the Fund:
Security Valuation. Investments are valued as of 4:00 p.m. Eastern time on the last calendar day of the period. The Fund uses independent pricing services approved by the Board of Trustees to value its investments. When current market prices or quotations are not readily available or reliable, valuations may be determined in good faith in accordance with procedures adopted by the Board of Trustees. Factors used in determining value may include market or security specific events, changes in interest rates and credit quality. The frequency with which these procedures are used cannot be predicted and they may be utilized to a significant extent. The value used for net asset value (NAV) calculation under these procedures may differ from published prices for the same securities.
Semiannual Report
2. Significant Accounting Policies - continued
Security Valuation - continued
The Fund categorizes the inputs to valuation techniques used to value its investments into a disclosure hierarchy consisting of three levels as shown below:
Level 1 - quoted prices in active markets for identical investments
Level 2 - other significant observable inputs (including quoted prices for similar investments, interest rates, prepayment speeds, etc.)
Level 3 - unobservable inputs (including the Fund's own assumptions based on the best information available)
Changes in valuation techniques may result in transfers in or out of an assigned level within the disclosure hierarchy. Valuation techniques used to value the Fund's investments by major category are as follows:
Debt securities, including restricted securities, are valued based on evaluated prices received from independent pricing services or from dealers who make markets in such securities. For municipal securities, pricing services utilize matrix pricing which considers yield or price of bonds of comparable quality, coupon, maturity and type as well as dealer supplied prices and are generally categorized as Level 2 in the hierarchy. When independent prices are unavailable or unreliable, debt securities may be valued utilizing pricing matrices which consider similar factors that would be used by independent pricing services. These are generally categorized as Level 2 in the hierarchy but may be Level 3 depending on the circumstances.
Investment Transactions and Income. For financial reporting purposes, the Fund's investment holdings and NAV include trades executed through the end of the last business day of the period. The NAV per share for processing shareholder transactions is calculated as of the close of business of the New York Stock Exchange (NYSE), normally 4:00 p.m. Eastern time and includes trades executed through the end of the prior business day. Gains and losses on securities sold are determined on the basis of identified cost. Interest income is accrued as earned. Interest income includes coupon interest and amortization of premium and accretion of discount on debt securities.
Expenses. Expenses directly attributable to a fund are charged to that fund. Expenses attributable to more than one fund are allocated among the respective funds on the basis of relative net assets or other appropriate methods. Expense estimates are accrued in the period to which they relate and adjustments are made when actual amounts are known.
Semiannual Report
Notes to Financial Statements (Unaudited) - continued
(Amounts in thousands except ratios)
2. Significant Accounting Policies - continued
Income Tax Information and Distributions to Shareholders. Each year, the Fund intends to qualify as a regulated investment company, including distributing substantially all of its taxable income and realized gains under Subchapter M of the Internal Revenue Code and filing its U.S. federal tax return. As a result, no provision for income taxes is required. A fund's federal tax return is subject to examination by the Internal Revenue Service (IRS) for a period of three years.
Dividends are declared and recorded daily and paid monthly from net investment income. Distributions from realized gains, if any, are declared and recorded on the ex-dividend date. Income dividends and capital gain distributions are declared separately for each class. Income and capital gain distributions are determined in accordance with income tax regulations, which may differ from GAAP.
Capital accounts within the financial statements are adjusted for permanent book-tax differences. These adjustments have no impact on net assets or the results of operations. Temporary book-tax differences will reverse in a subsequent period.
Book-tax differences are primarily due to market discount, deferred trustees compensation, capital loss carryforwards, losses deferred due to futures transactions and excise tax regulations.
The Fund purchases municipal securities whose interest, in the opinion of the issuer, is free from federal income tax. There is no assurance that the IRS will agree with this opinion. In the event the IRS determines that the issuer does not comply with relevant tax requirements, interest payments from a security could become federally taxable, possibly retroactively to the date the security was issued.
The federal tax cost of investment securities and unrealized appreciation (depreciation) as of period end were as follows:
Gross unrealized appreciation | $ 66,577 |
Gross unrealized depreciation | (23,185) |
Net unrealized appreciation (depreciation) on securities and other investments | $ 43,392 |
|
|
Tax cost | $ 1,579,761 |
Under the recently enacted Regulated Investment Company Modernization Act of 2010 (the Act), the Fund will be permitted to carry forward capital losses incurred in taxable years beginning after December 22, 2010 for an unlimited period. However, any losses incurred during those future taxable years will be required to be utilized prior to any losses incurred in pre-enactment taxable years, which generally expire after eight years from when they are incurred. Additionally, post-enactment capital losses that are carried
Semiannual Report
2. Significant Accounting Policies - continued
Income Tax Information and Distributions to Shareholders - continued
forward will retain their character as either short-term or long-term capital losses rather than being considered all short-term as under previous law. The Fund's first fiscal year end subject to the Act will be February 28, 2012.
Short-Term Trading (Redemption) Fees. Shares held by investors in the Fund less than 30 days are subject to a redemption fee equal to .50% of the net asset value of shares redeemed. All redemption fees, which reduce the proceeds of the shareholder redemption, are retained by the Fund and accounted for as an addition to paid in capital.
3. Operating Policies.
Delayed Delivery Transactions and When-Issued Securities. During the period, the Fund transacted in securities on a delayed delivery or when-issued basis. Payment and delivery may take place after the customary settlement period for that security. The price of the underlying securities and the date when the securities will be delivered and paid for are fixed at the time the transaction is negotiated. During the time a delayed delivery sell is outstanding, the contract is marked-to-market daily and equivalent deliverable securities are held for the transaction. The securities purchased on a delayed delivery or when-issued basis are identified as such in the Fund's Schedule of Investments. The Fund may receive compensation for interest forgone in the purchase of a delayed delivery or when-issued security. With respect to purchase commitments, the Fund identifies securities as segregated in its records with a value at least equal to the amount of the commitment. Losses may arise due to changes in the value of the underlying securities or if the counterparty does not perform under the contract's terms, or if the issuer does not issue the securities due to political, economic, or other factors.
4. Purchases and Sales of Investments.
Purchases and sales of securities, other than short-term securities, aggregated $86,817 and $63,354, respectively.
5. Fees and Other Transactions with Affiliates.
Management Fee. Fidelity Management & Research Company (FMR) and its affiliates provide the Fund with investment management related services for which the Fund pays a monthly management fee. The management fee is the sum of an individual fund fee rate that is based on an annual rate of .25% of the Fund's average net assets and a group fee rate that averaged .11% during the period. The group fee rate is based upon the average net assets of all the mutual funds advised by FMR. The group fee rate decreases as assets under management increase and increases as assets under management decrease. For the period, the total annualized management fee rate was .36% of the Fund's average net assets.
Semiannual Report
Notes to Financial Statements (Unaudited) - continued
(Amounts in thousands except ratios)
5. Fees and Other Transactions with Affiliates - continued
Distribution and Service Plan Fees. In accordance with Rule 12b-1 of the 1940 Act, the Fund has adopted separate Distribution and Service Plans for each class of shares. Certain classes pay Fidelity Distributors Corporation (FDC), an affiliate of FMR, separate Distribution and Service Fees, each of which is based on an annual percentage of each class' average net assets. In addition, FDC may pay financial intermediaries for selling shares of the Fund and providing shareholder support services. For the period, the Distribution and Service Fee rates, total fees and amounts retained by FDC were as follows:
| Distribution | Service | Total Fees | Retained |
Class A | -% | .25% | $ 52 | $ 5 |
Class T | -% | .25% | 5 | - |
Class B | .65% | .25% | 8 | 6 |
Class C | .75% | .25% | 89 | 19 |
|
|
| $ 154 | $ 30 |
Sales Load. FDC may receive a front-end sales charge of up to 4.00% for selling Class A shares and Class T shares, some of which is paid to financial intermediaries for selling shares of the Fund. Depending on the holding period, FDC may receive contingent deferred sales charges levied on Class A, Class T, Class B, and Class C redemptions. The deferred sales charges range from 5% to 1% for Class B, 1% for Class C, .75% for certain purchases of Class A shares and .25% for certain purchases of Class T shares.
For the period, sales charge amounts retained by FDC were as follows:
| Retained |
Class A | $ 5 |
Class T | -** |
Class B* | 2 |
Class C* | 1 |
| $ 8 |
* When Class B and Class C shares are initially sold, FDC pays commissions from its own resources to financial intermediaries through which the sales are made.
** Amount represents one hundred sixty dollars.
Transfer Agent and Accounting Fees. Citibank, N.A. (Citibank) is the custodian, transfer agent, and servicing agent for the Fund's Class A, Class T, Class B, Class C, California Municipal Income and Institutional Class shares. Citibank has entered into a sub-arrangement with Fidelity Investments Institutional Operations Company, Inc. (FIIOC), an affiliate of FMR, with respect to all classes of the Fund, to perform the transfer agency, dividend disbursing, and shareholder servicing functions. FIIOC
Semiannual Report
5. Fees and Other Transactions with Affiliates - continued
Transfer Agent and Accounting Fees - continued
receives account fees and asset-based fees that vary according to the account size and type of account of the shareholders of the respective classes of the Fund. All fees are paid to FIIOC by Citibank, which is reimbursed by each class for such payments. FIIOC pays for typesetting, printing and mailing of shareholder reports, except proxy statements. For the period, transfer agent fees for each class were as follows:
| Amount | % of |
Class A | $ 23 | .11 |
Class T | 2 | .12 |
Class B | 1 | .08 |
Class C | 12 | .13 |
California Municipal Income | 520 | .07 |
Institutional Class | 16 | .13 |
| $ 574 |
|
* Annualized
Citibank also has a sub-arrangement with Fidelity Service Company, Inc. (FSC), an affiliate of FMR, under which FSC maintains the Fund's accounting records. The fee is based on the level of average net assets for the month.
6. Committed Line of Credit.
The Fund participates with other funds managed by FMR or an affiliate in a $4.0 billion credit facility (the "line of credit") to be utilized for temporary or emergency purposes to fund shareholder redemptions or for other short-term liquidity purposes. The Fund has agreed to pay commitment fees on its pro-rata portion of the line of credit, which amounted to $2 and is reflected in Miscellaneous expenses on the Statement of Operations. During the period, there were no borrowings on this line of credit.
7. Expense Reductions.
Through arrangements with the Fund's custodian, credits realized as a result of uninvested cash balances were used to reduce the Fund's expenses. During the period, these credits reduced the Fund's custody expenses by $4.
Semiannual Report
Notes to Financial Statements (Unaudited) - continued
(Amounts in thousands except ratios)
8. Distributions to Shareholders.
Distributions to shareholders of each class were as follows:
Six months ended | Year ended | |
From net investment income |
|
|
Class A | $ 829 | $ 1,696 |
Class T | 82 | 218 |
Class B | 31 | 81 |
Class C | 292 | 603 |
California Municipal Income | 32,600 | 66,826 |
Institutional Class | 507 | 1,474 |
Total | $ 34,341 | $ 70,898 |
From net realized gain |
|
|
Class A | $ - | $ 3 |
Class T | - | -* |
Class B | - | -* |
Class C | - | 1 |
California Municipal Income | - | 95 |
Institutional Class | - | 1 |
Total | $ - | $ 100 |
* Amount represents less than $1,000
9. Share Transactions.
Transactions for each class of shares were as follows:
| Shares | Dollars | ||
Six months ended | Year ended | Six months ended | Year ended | |
Class A |
|
|
|
|
Shares sold | 665 | 1,131 | $ 7,879 | $ 13,594 |
Reinvestment of distributions | 48 | 97 | 576 | 1,160 |
Shares redeemed | (548) | (1,496) | (6,515) | (17,712) |
Net increase (decrease) | 165 | (268) | $ 1,940 | $ (2,958) |
Class T |
|
|
|
|
Shares sold | 30 | 64 | $ 362 | $ 770 |
Reinvestment of distributions | 6 | 14 | 69 | 172 |
Shares redeemed | (28) | (259) | (333) | (3,101) |
Net increase (decrease) | 8 | (181) | $ 98 | $ (2,159) |
Class B |
|
|
|
|
Shares sold | 3 | 31 | $ 24 | $ 375 |
Reinvestment of distributions | 1 | 3 | 14 | 36 |
Shares redeemed | (21) | (87) | (244) | (1,030) |
Net increase (decrease) | (17) | (53) | $ (206) | $ (619) |
Semiannual Report
9. Share Transactions - continued
| Shares | Dollars | ||
Six months ended | Year ended | Six months ended | Year ended | |
Class C |
|
|
|
|
Shares sold | 203 | 503 | $ 2,425 | $ 6,012 |
Reinvestment of distributions | 15 | 29 | 175 | 350 |
Shares redeemed | (105) | (659) | (1,236) | (7,787) |
Net increase (decrease) | 113 | (127) | $ 1,364 | $ (1,425) |
California Municipal Income |
|
|
|
|
Shares sold | 13,001 | 30,469 | $ 153,825 | $ 363,379 |
Reinvestment of distributions | 1,805 | 3,784 | 21,393 | 45,282 |
Shares redeemed | (9,827) | (40,406) | (116,062) | (476,687) |
Net increase (decrease) | 4,979 | (6,153) | $ 59,156 | $ (68,026) |
Institutional Class |
|
|
|
|
Shares sold | 591 | 1,709 | $ 6,983 | $ 20,475 |
Reinvestment of distributions | 25 | 46 | 301 | 554 |
Shares redeemed | (216) | (5,174) | (2,559) | (62,223) |
Net increase (decrease) | 400 | (3,419) | $ 4,725 | $ (41,194) |
10. Other.
The Fund's organizational documents provide former and current trustees and officers with a limited indemnification against liabilities arising in connection with the performance of their duties to the Fund. In the normal course of business, the Fund may also enter into contracts that provide general indemnifications. The Fund's maximum exposure under these arrangements is unknown as this would be dependent on future claims that may be made against the Fund. The risk of material loss from such claims is considered remote.
Semiannual Report
Investment Adviser
Fidelity Management & Research Company
Boston, MA
Investment Sub-Advisers
Fidelity Investments
Money Management, Inc.
Fidelity Management & Research
(U.K.) Inc.
Fidelity Management & Research
(Hong Kong) Limited
Fidelity Management & Research
(Japan) Inc.
General Distributor
Fidelity Distributors Corporation
Boston, MA
Transfer and Service Agents
Citibank, N.A.
New York, NY
Fidelity Investments Institutional Operations Company, Inc.
Boston, MA
Fidelity Service Company, Inc.
Boston, MA
Custodian
Citibank, N.A.
New York, NY

ASCM-USAN-1011
1.790936.108
(Fidelity Investment logo)(registered trademark)
Fidelity Advisor®
California Municipal Income
Fund - Institutional Class
Semiannual Report
August 31, 2011(2_fidelity_logos) (Registered_Trademark)
Institutional Class is a class of Fidelity® California Municipal Income Fund
Contents
Chairman's Message | The Chairman's message to shareholders. | |
Shareholder Expense Example | An example of shareholder expenses. | |
Investment Changes | A summary of major shifts in the fund's investments over the past six months. | |
Investments | A complete list of the fund's investments with their market values. | |
Financial Statements | Statements of assets and liabilities, operations, and changes in net assets, | |
Notes | Notes to the financial statements. |
To view a fund's proxy voting guidelines and proxy voting record for the 12-month period ended June 30, visit http://www.fidelity.com/proxyvotingresults or visit the Securities and Exchange Commission's (SEC) web site at http://www.sec.gov. You may also call 1-877-208-0098 to request a free copy of the proxy voting guidelines.
Standard & Poor's, S&P and S&P 500 are registered service marks of The McGraw-Hill Companies, Inc. and have been licensed for use by Fidelity Distributors Corporation.
Other third party marks appearing herein are the property of their respective owners.
All other marks appearing herein are registered or unregistered trademarks or service marks of FMR LLC or an affiliated company.
This report and the financial statements contained herein are submitted for the general information of the shareholders of the fund. This report is not authorized for distribution to prospective investors in the fund unless preceded or accompanied by an effective prospectus.
A fund files its complete schedule of portfolio holdings with the SEC for the first and third quarters of each fiscal year on Form N-Q. Forms N-Q are available on the SEC's web site at http://www.sec.gov. A fund's Forms N-Q may be reviewed and copied at the SEC's Public Reference Room in Washington, DC. Information regarding the operation of the SEC's Public Reference Room may be obtained by calling 1-800-SEC-0330. For a complete list of a fund's portfolio holdings, view the most recent holdings listing, semiannual report, or annual report on Fidelity's web site at http://www.fidelity.com, http://www.advisor.fidelity.com, or http://www.401k.com, as applicable.
NOT FDIC INSURED • MAY LOSE VALUE • NO BANK GUARANTEE
Neither the fund nor Fidelity Distributors Corporation is a bank.
Semiannual Report
Chairman's Message
(Chairmans photo appears here)
Dear Shareholder:
U.S. equities remained in a significant midyear downturn that began in May and intensified in the final week of July and the early part of August, when Standard & Poor's announced it was lowering its long-term sovereign credit rating of the United States. The historic downgrade followed a political stalemate in which Congress struggled to address the debt ceiling issue before an early-August deadline, resulting in heightened investor anxiety and volatility across major financial markets. Financial markets are always unpredictable, of course, but there are several time-tested investment principles that can help put the odds in your favor.
One of the basic tenets is to invest for the long term. Over time, riding out the markets' inevitable ups and downs has proven much more effective than selling into panic or chasing the hottest trend. Even missing only a few of the markets' best days can significantly diminish investor returns. Patience also affords the benefits of compounding - of earning interest on additional income or reinvested dividends and capital gains. There can be tax advantages and cost benefits to consider as well. While staying the course doesn't eliminate risk, it can considerably lessen the effect of short-term declines.
You can further manage your investing risk through diversification. And today, more than ever, geographic diversification should be taken into account. Studies indicate that asset allocation is the single most important determinant of a portfolio's long-term success. The right mix of stocks, bonds and cash - aligned to your particular risk tolerance and investment objective - is very important. Age-appropriate rebalancing is also an essential aspect of asset allocation. For younger investors, an emphasis on equities - which historically have been the best-performing asset class over time - is encouraged. As investors near their specific goal, such as retirement or sending a child to college, consideration may be given to replacing volatile assets (e.g. common stocks) with more-stable fixed investments (bonds or savings plans).
A third principle - investing regularly - can help lower the average cost of your purchases. Investing a certain amount of money each month or quarter helps ensure you won't pay for all your shares at market highs. This strategy - known as dollar cost averaging - also reduces "emotion" from investing, helping shareholders avoid selling weak performers just prior to an upswing, or chasing a hot performer just before a correction.
We invite you to contact us via the Internet, through our Investor Centers or by phone. It is our privilege to provide you the information you need to make the investments that are right for you.
Sincerely,
(Chairmans signature appears here)
Abigail P. Johnson
Semiannual Report
Shareholder Expense Example
As a shareholder of the Fund, you incur two types of costs: (1) transaction costs, including sales charges (loads) on purchase payments or redemption proceeds, and (2) ongoing costs, including management fees, distribution and/or service (12b-1) fees and other Fund expenses. This Example is intended to help you understand your ongoing costs (in dollars) of investing in the Fund and to compare these costs with the ongoing costs of investing in other mutual funds.
The Example is based on an investment of $1,000 invested at the beginning of the period and held for the entire period (March 1, 2011 to August 31, 2011).
Actual Expenses
The first line of the accompanying table for each class of the Fund provides information about actual account values and actual expenses. You may use the information in this line, together with the amount you invested, to estimate the expenses that you paid over the period. Simply divide your account value by $1,000.00 (for example, an $8,600 account value divided by $1,000.00 = 8.6), then multiply the result by the number in the first line for a class of the Fund under the heading entitled "Expenses Paid During Period" to estimate the expenses you paid on your account during this period. A small balance maintenance fee of $12.00 that is charged once a year may apply for certain accounts with a value of less than $2,000. This fee is not included in the table below. If it was, the estimate of expenses you paid during the period would be higher, and your ending account value lower, by this amount.
Hypothetical Example for Comparison Purposes
The second line of the accompanying table for each class of the Fund provides information about hypothetical account values and hypothetical expenses based on a Class' actual expense ratio and an assumed rate of return of 5% per year before expenses, which is not the Class' actual return. The hypothetical account values and expenses may not be used to estimate the actual ending account balance or expenses you paid for the period. You may use this information to compare the ongoing costs of investing in the Fund and other funds. To do so, compare this 5% hypothetical example with the 5% hypothetical examples that appear in the shareholder reports of the other funds. A small balance maintenance fee of $12.00 that is charged once a year may apply for certain accounts with a value of less than $2,000. This fee is not included in the table below. If it was, the estimate of expenses you paid during the period would be higher, and your ending account value lower, by this amount.
Please note that the expenses shown in the table are meant to highlight your ongoing costs only and do not reflect any transaction costs. Therefore, the second line of the table is useful in comparing ongoing costs only, and will not help you determine the relative total costs of owning different funds. In addition, if these transactional costs were included, your costs would have been higher.
Semiannual Report
Shareholder Expense Example - continued
| Annualized Expense Ratio | Beginning | Ending | Expenses Paid |
Class A | .75% |
|
|
|
Actual |
| $ 1,000.00 | $ 1,065.00 | $ 3.89 |
Hypothetical A |
| $ 1,000.00 | $ 1,021.37 | $ 3.81 |
Class T | .76% |
|
|
|
Actual |
| $ 1,000.00 | $ 1,064.80 | $ 3.94 |
Hypothetical A |
| $ 1,000.00 | $ 1,021.32 | $ 3.86 |
Class B | 1.37% |
|
|
|
Actual |
| $ 1,000.00 | $ 1,061.70 | $ 7.10 |
Hypothetical A |
| $ 1,000.00 | $ 1,018.25 | $ 6.95 |
Class C | 1.52% |
|
|
|
Actual |
| $ 1,000.00 | $ 1,061.90 | $ 7.88 |
Hypothetical A |
| $ 1,000.00 | $ 1,017.50 | $ 7.71 |
California Municipal Income | .47% |
|
|
|
Actual |
| $ 1,000.00 | $ 1,066.60 | $ 2.44 |
Hypothetical A |
| $ 1,000.00 | $ 1,022.77 | $ 2.39 |
Institutional Class | .53% |
|
|
|
Actual |
| $ 1,000.00 | $ 1,066.10 | $ 2.75 |
Hypothetical A |
| $ 1,000.00 | $ 1,022.47 | $ 2.69 |
A 5% return per year before expenses
* Expenses are equal to each Class' annualized expense ratio, multiplied by the average account value over the period, multiplied by 184/366 (to reflect the one-half year period).
Semiannual Report
Investment Changes (Unaudited)
Top Five Sectors as of August 31, 2011 | ||
| % of fund's | % of fund's net assets |
General Obligations | 46.6 | 48.2 |
Health Care | 12.1 | 11.6 |
Transportation | 10.9 | 11.6 |
Education | 6.5 | 6.9 |
Electric Utilities | 4.7 | 3.6 |
Weighted Average Maturity as of August 31, 2011 | ||
|
| 6 months ago |
Years | 7.3 | 10.0 |
This is a weighted average of all the maturities of the securities held in a fund. Weighted Average Maturity (WAM) can be used as a measure of sensitivity to interest rate changes and markets changes. Generally, the longer the maturity, the greater the sensitivity to such changes. WAM is based on the dollar-weighted average length of time until principal payments must be paid. Depending on the types of securities held in a fund, certain maturity shortening devices (e.g., demand features, interest rate resets, and call options) may be taken into account when calculating the WAM. |
Duration as of August 31, 2011 | ||
|
| 6 months ago |
Years | 7.7 | 8.1 |
Duration estimates how much a bond fund's price will change with a change in comparable interest rates. If rates rise 1%, for example, a fund with a 5-year duration is likely to lose about 5% of its value. Other factors also can influence a bond fund's performance and share price. Accordingly, a bond fund's actual performance may differ from this example. Duration takes into account any call or put option embedded in the bonds. |
Quality Diversification (% of fund's net assets) | |||||||
As of August 31, 2011 | As of February 28, 2011 | ||||||
| AAA 2.0% |
| | AAA 2.8% |
| ||
| AA,A 79.1% |
| | AA,A 81.4% |
| ||
| BBB 13.7% |
| | BBB 12.7% |
| ||
| BB and Below 0.4% |
| | BB and Below 0.4% |
| ||
| Not Rated 1.6% |
| | Not Rated 2.0% |
| ||
| Short-Term |
| | Short-Term |
| ||
We have used ratings from Moody's Investors Service, Inc. Where Moody's® ratings are not available, we have used S&P® ratings. All ratings are as of the date indicated and do not reflect subsequent changes. |
Semiannual Report
Investments August 31, 2011 (Unaudited)
Showing Percentage of Net Assets
Municipal Bonds - 96.8% | ||||
| Principal Amount (000s) | Value (000s) | ||
California - 95.6% | ||||
ABAG Fin. Auth. for Nonprofit Corps. Rev.: | ||||
(Hamlin School Proj.) Series 2007: | ||||
4.625% 8/1/16 | $ 380 | $ 400 | ||
5% 8/1/18 | 330 | 349 | ||
5% 8/1/19 | 555 | 583 | ||
(Sharp HealthCare Proj.) Series 2009 B, 6.25% 8/1/39 | 3,000 | 3,158 | ||
ABC Unified School District Series 1997 C: | ||||
0% 8/1/31 (Nat'l. Pub. Fin. Guarantee Corp. Insured) | 2,720 | 781 | ||
0% 8/1/32 (Nat'l. Pub. Fin. Guarantee Corp. Insured) | 3,760 | 976 | ||
Alameda Corridor Trans. Auth. Rev. Series 1999 A, 5.25% 10/1/21 (Nat'l. Pub. Fin. Guarantee Corp. Insured) | 7,575 | 7,578 | ||
Alameda County Ctfs. of Prtn.: | ||||
(Santa Rita Jail Proj.) Series 2007 A: | ||||
5% 12/1/18 (AMBAC Insured) | 2,645 | 2,966 | ||
5% 12/1/20 (AMBAC Insured) | 2,810 | 3,082 | ||
Series 1989, 0% 6/15/17 (Nat'l. Pub. Fin. Guarantee Corp. Insured) | 2,310 | 1,718 | ||
Alhambra Unified School District Series 2004 A, 5% 8/1/25 (FGIC Insured) | 1,880 | 1,940 | ||
Anaheim Pub. Fing. Auth. Lease Rev. (Anaheim Pub. Impt. Proj.): | ||||
Series 1997 A, 6% 9/1/24 | 1,000 | 1,201 | ||
Series 1997 C: | ||||
0% 9/1/19 (FSA Insured) | 1,285 | 864 | ||
0% 9/1/22 (FSA Insured) | 5,150 | 2,789 | ||
Anaheim Pub. Fing. Auth. Rev. Series 2007 A, 4.5% 10/1/32 | 10,000 | 10,034 | ||
Antioch Unified School District (School Facilities Impt. District #1 Proj.) Series 2008 B, 5.75% 8/1/24 (Assured Guaranty Corp. Insured) | 1,000 | 1,139 | ||
Auburn Union School District Ctfs. of Prtn. (2008 Refing. Proj.) 5% 6/1/38 (Assured Guaranty Corp. Insured) | 5,615 | 5,707 | ||
Azusa Unified School District Series 2002, 5.375% 7/1/16 (FSA Insured) | 1,225 | 1,277 | ||
Banning Unified School District Gen. Oblig. Series 2006 A, 5% 8/1/31 (Berkshire Hathaway Assurance Corp. Insured) | 5,190 | 5,312 | ||
Bay Area Infrastructure Fing. Auth.: | ||||
5% 8/1/17 | 2,015 | 2,019 | ||
5% 8/1/17 (FGIC Insured) | 5,030 | 5,217 | ||
Municipal Bonds - continued | ||||
| Principal Amount (000s) | Value (000s) | ||
California - continued | ||||
Bay Area Toll Auth. San Francisco Bay Toll Bridge Rev. Series 2009 F1, 5.625% 4/1/44 | $ 5,500 | $ 5,926 | ||
Burbank Glendale Pasadena Arpt. Auth. Rev. Series 2005 B: | ||||
5% 7/1/12 (AMBAC Insured) (d) | 1,840 | 1,890 | ||
5.25% 7/1/14 (AMBAC Insured) (d) | 2,035 | 2,224 | ||
5.25% 7/1/16 (AMBAC Insured) (d) | 1,255 | 1,394 | ||
5.25% 7/1/17 (AMBAC Insured) (d) | 1,370 | 1,488 | ||
Burbank Unified School District: | ||||
Series 1997 B, 0% 8/1/20 | 3,835 | 2,574 | ||
Series 1997 C, 0% 8/1/20 (Nat'l. Pub. Fin. Guarantee Corp. Insured) | 5,865 | 3,909 | ||
Butte-Glenn Cmnty. College District Series A, 5.5% 8/1/18 (Nat'l. Pub. Fin. Guarantee Corp. Insured) | 1,085 | 1,137 | ||
Cabrillo Unified School District Series A: | ||||
0% 8/1/12 (AMBAC Insured) | 2,800 | 2,730 | ||
0% 8/1/17 (AMBAC Insured) | 1,000 | 782 | ||
0% 8/1/18 (AMBAC Insured) | 2,000 | 1,467 | ||
California Dept. of Wtr. Resources Central Valley Proj. Rev.: | ||||
Series AI: | ||||
5% 12/1/18 (b) | 3,000 | 3,637 | ||
5% 12/1/25 (b) | 2,700 | 3,126 | ||
Series J1, 7% 12/1/12 | 730 | 790 | ||
California Econ. Recovery Series 2009 A: | ||||
5% 7/1/22 | 3,800 | 4,169 | ||
5.25% 7/1/14 | 2,095 | 2,361 | ||
California Edl. Facilities Auth. Rev.: | ||||
(Claremont Graduate Univ. Proj.) Series 2008 A: | ||||
6% 3/1/33 | 1,000 | 1,054 | ||
6% 3/1/38 | 1,000 | 1,044 | ||
(College & Univ. Fing. Prog.) Series 2007: | ||||
5% 2/1/16 | 1,600 | 1,645 | ||
5% 2/1/17 | 1,000 | 1,014 | ||
(Loyola Marymount Univ. Proj.): | ||||
Series 2001 A, 0% 10/1/16 (Nat'l. Pub. Fin. Guarantee Corp. Insured) | 2,280 | 1,946 | ||
Series 2010 A, 5% 10/1/25 | 5,860 | 6,145 | ||
(Pomona College Proj.) Series 2005 A, 0% 7/1/38 | 3,155 | 712 | ||
(Santa Clara Univ. Proj.) Series 1999, 5.25% 9/1/26 (AMBAC Insured) | 7,910 | 9,000 | ||
Municipal Bonds - continued | ||||
| Principal Amount (000s) | Value (000s) | ||
California - continued | ||||
California Edl. Facilities Auth. Rev.: - continued | ||||
(Univ. of Southern California Proj.) Series 2007 A, 4.75% 10/1/37 | $ 6,000 | $ 6,162 | ||
California Enterprise Dev. Auth. (The Thacher School Proj.) Series 2010: | ||||
4% 9/1/20 | 860 | 912 | ||
4% 9/1/21 | 1,000 | 1,037 | ||
4% 9/1/22 | 740 | 756 | ||
4% 9/1/23 | 1,080 | 1,086 | ||
4% 9/1/24 | 1,125 | 1,115 | ||
5% 9/1/19 | 400 | 460 | ||
5% 9/1/39 | 5,000 | 5,039 | ||
California Gen. Oblig.: | ||||
Series 1992, 6.25% 9/1/12 (FGIC Insured) | 1,350 | 1,379 | ||
Series 2005, 5.5% 6/1/28 | 275 | 275 | ||
Series 2007: | ||||
5.625% 5/1/20 | 150 | 150 | ||
5.625% 5/1/26 | 215 | 215 | ||
5.75% 5/1/30 | 160 | 160 | ||
4.5% 8/1/30 | 3,250 | 3,099 | ||
4.5% 10/1/36 | 3,075 | 2,765 | ||
5% 3/1/15 | 2,130 | 2,421 | ||
5% 3/1/16 (Nat'l. Pub. Fin. Guarantee Corp. Insured) | 2,500 | 2,760 | ||
5% 9/1/17 | 750 | 851 | ||
5% 3/1/19 | 3,000 | 3,439 | ||
5% 8/1/22 | 1,500 | 1,614 | ||
5% 10/1/22 | 1,355 | 1,524 | ||
5% 11/1/22 | 1,600 | 1,747 | ||
5% 11/1/22 (XL Cap. Assurance, Inc. Insured) | 2,800 | 3,058 | ||
5% 12/1/22 | 3,500 | 3,827 | ||
5% 2/1/23 | 1,095 | 1,141 | ||
5% 2/1/26 | 1,500 | 1,511 | ||
5% 3/1/26 | 2,800 | 2,917 | ||
5% 6/1/26 | 2,600 | 2,706 | ||
5% 2/1/31 (Nat'l. Pub. Fin. Guarantee Corp. Insured) | 2,800 | 2,825 | ||
5% 6/1/31 | 2,000 | 2,031 | ||
5% 12/1/31 (Nat'l. Pub. Fin. Guarantee Corp. Insured) | 2,000 | 2,029 | ||
5% 10/1/32 (Nat'l. Pub. Fin. Guarantee Corp. Insured) | 1,000 | 1,006 | ||
5.125% 11/1/24 | 2,800 | 2,930 | ||
5.125% 2/1/26 | 2,800 | 2,899 | ||
Municipal Bonds - continued | ||||
| Principal Amount (000s) | Value (000s) | ||
California - continued | ||||
California Gen. Oblig.: - continued | ||||
5.25% 2/1/14 | $ 4,045 | $ 4,390 | ||
5.25% 10/1/14 | 140 | 144 | ||
5.25% 10/1/17 | 105 | 108 | ||
5.25% 11/1/18 | 3,000 | 3,223 | ||
5.25% 2/1/20 | 6,805 | 7,190 | ||
5.25% 2/1/22 | 2,020 | 2,120 | ||
5.25% 2/1/27 (Nat'l. Pub. Fin. Guarantee Corp. Insured) | 5,490 | 5,603 | ||
5.25% 4/1/27 | 5 | 5 | ||
5.25% 2/1/28 | 2,785 | 2,862 | ||
5.25% 2/1/29 | 5,000 | 5,075 | ||
5.25% 4/1/29 | 5 | 5 | ||
5.25% 11/1/29 | 2,000 | 2,048 | ||
5.25% 4/1/30 | 35 | 35 | ||
5.25% 2/1/33 | 8,150 | 8,211 | ||
5.25% 12/1/33 | 105 | 106 | ||
5.25% 3/1/38 | 5,400 | 5,459 | ||
5.375% 4/1/15 (Nat'l. Pub. Fin. Guarantee Corp. Insured) | 35 | 36 | ||
5.5% 5/1/13 (Nat'l. Pub. Fin. Guarantee Corp. Insured) | 100 | 100 | ||
5.5% 4/1/28 | 5 | 5 | ||
5.5% 8/1/29 | 7,790 | 8,420 | ||
5.5% 4/1/30 | 25 | 26 | ||
5.5% 11/1/33 | 29,440 | 29,952 | ||
5.5% 11/1/34 | 2,535 | 2,662 | ||
5.5% 11/1/39 | 1,810 | 1,892 | ||
6% 4/1/18 | 1,570 | 1,952 | ||
6% 3/1/33 | 20,050 | 22,361 | ||
6% 4/1/38 | 1,190 | 1,295 | ||
6.5% 4/1/33 | 11,650 | 13,404 | ||
6.75% 8/1/12 | 1,100 | 1,162 | ||
California Health Facilities Fing. Auth. Rev.: | ||||
(Catholic Healthcare West Proj.): | ||||
Series 2008 H, 5.125% 7/1/22 | 2,630 | 2,811 | ||
Series 2008 L, 5.125% 7/1/22 | 2,475 | 2,645 | ||
Series 2009 E, 5.625% 7/1/25 | 5,000 | 5,323 | ||
(Cedars-Sinai Med. Ctr. Proj.): | ||||
Series 2005, 5% 11/15/14 | 1,485 | 1,647 | ||
Series 2009, 5% 8/15/39 | 5,000 | 4,846 | ||
Municipal Bonds - continued | ||||
| Principal Amount (000s) | Value (000s) | ||
California - continued | ||||
California Health Facilities Fing. Auth. Rev.: - continued | ||||
(Children's Hosp. of Orange County Proj.) Series 2009 A, 5% 11/1/12 | $ 2,345 | $ 2,429 | ||
(Cottage Health Sys. Proj.) Series 2003 B, 5.25% 11/1/18 (Nat'l. Pub. Fin. Guarantee Corp. Insured) | 1,260 | 1,320 | ||
(Providence Health and Svcs. Proj.): | ||||
Series 2009 B, 5.5% 10/1/39 | 2,000 | 2,070 | ||
Series C, 6.5% 10/1/38 (Pre-Refunded to 10/1/18 @ 100) (e) | 90 | 120 | ||
6.5% 10/1/38 | 4,910 | 5,436 | ||
(Scripps Health Proj.) Series 2010 A, 5% 11/15/36 | 3,000 | 3,004 | ||
(Stanford Hosp. & Clinics Proj.) Series 2010 B, 5.75% 11/15/31 | 4,600 | 4,914 | ||
(Sutter Health Proj.) Series 2008 A, 5% 8/15/15 | 4,500 | 5,075 | ||
Bonds (Catholic Healthcare West Proj.) Series 2004 I, 4.95%, tender 7/1/14 (c) | 5,000 | 5,434 | ||
Series 2008 A3, 5.5% 11/15/40 | 3,090 | 3,207 | ||
California Infrastructure & Econ. Dev. Bank Rev.: | ||||
(California Science Ctr. Phase II Proj.) Series 2006 B, 5% 5/1/19 (FGIC Insured) | 1,000 | 1,042 | ||
(Performing Arts Ctr. of Los Angeles County Proj.) Series 2007: | ||||
5% 12/1/27 | 1,080 | 1,105 | ||
5% 12/1/32 | 1,000 | 1,006 | ||
5% 12/1/42 | 3,000 | 2,912 | ||
(YMCA Metropolitan L.A. Proj.) Series 2001: | ||||
5.25% 2/1/26 (AMBAC Insured) | 2,000 | 2,020 | ||
5.25% 2/1/32 (AMBAC Insured) | 6,295 | 6,297 | ||
Series 2005, 5% 10/1/33 | 7,235 | 7,394 | ||
California Muni. Fin. Auth. Ctfs. of Prtn. (Cmnty. Hospitals of Central California Obligated Group Proj.) Series 2009, 5.5% 2/1/39 | 5,000 | 4,463 | ||
California Muni. Fin. Auth. Rev.: | ||||
(Eisenhower Med. Ctr. Proj.) Series 2010 A: | ||||
5% 7/1/19 | 300 | 315 | ||
5% 7/1/20 | 500 | 524 | ||
5.75% 7/1/40 | 5,000 | 4,965 | ||
(Loma Linda Univ. Proj.) Series 2007, 5% 4/1/22 | 1,090 | 1,158 | ||
California Poll. Cont. Fing. Auth. Ctfs. of Prtn.: | ||||
(Pacific Gas & Elec. Co. Proj.) Series 1996 A, 5.35% 12/1/16 (Nat'l. Pub. Fin. Guarantee Corp. Insured) (d) | 4,335 | 4,428 | ||
Municipal Bonds - continued | ||||
| Principal Amount (000s) | Value (000s) | ||
California - continued | ||||
California Poll. Cont. Fing. Auth. Ctfs. of Prtn.: - continued | ||||
(San Diego Gas & Elec. Co. Proj.) 5.9% 6/1/14 (Nat'l. Pub. Fin. Guarantee Corp. Insured) | $ 4,250 | $ 4,765 | ||
California Poll. Cont. Fing. Auth. Solid Waste Disp. Rev. Bonds (Waste Mgmt., Inc. Proj.): | ||||
Series 2001 A, 5.125%, tender 5/1/14 (c)(d) | 9,000 | 9,694 | ||
Series 2003 A, 5%, tender 5/1/13 (c)(d) | 3,000 | 3,160 | ||
Series 2005 A1, 4.7%, tender 4/1/12 (c)(d) | 3,250 | 3,314 | ||
California Pub. Works Board Lease Rev.: | ||||
(Butterfield State Office Complex Proj.) Series 2005 A: | ||||
5% 6/1/13 | 2,600 | 2,753 | ||
5% 6/1/14 | 2,000 | 2,189 | ||
5.25% 6/1/24 | 5,400 | 5,624 | ||
5.25% 6/1/25 | 5,000 | 5,150 | ||
5.25% 6/1/30 | 4,000 | 4,048 | ||
(California Cmnty. College Projs.) Series 1998 A, 5.25% 12/1/16 | 4,400 | 4,415 | ||
(California State Univ. Proj.): | ||||
Series 2006 A, 5% 10/1/14 (FGIC Insured) | 2,700 | 2,942 | ||
Series 2006 G: | ||||
5% 11/1/20 | 1,825 | 1,928 | ||
5% 11/1/21 | 2,020 | 2,120 | ||
(California Substance Abuse Treatment Facility and State Prison at Corcoran II Proj.) Series 2005 J, 5.25% 1/1/16 (AMBAC Insured) | 4,520 | 5,171 | ||
(Capitol East End Complex-Blocks 171-174 & 225 Proj.) Series 2002 A, 5.25% 12/1/18 | 5,000 | 5,219 | ||
(Coalinga State Hosp. Proj.) Series 2004 A: | ||||
5.25% 6/1/12 | 2,485 | 2,559 | ||
5.5% 6/1/15 | 1,000 | 1,109 | ||
5.5% 6/1/17 | 9,980 | 10,877 | ||
(Dept. of Corrections & Rehab. Proj.) Series 2006 F: | ||||
5% 11/1/15 (FGIC Insured) | 2,455 | 2,726 | ||
5% 11/1/16 (FGIC Insured) | 2,000 | 2,236 | ||
(Dept. of Corrections State Prison Proj.) Series 1993 E: | ||||
5.5% 6/1/15 (FSA Insured) | 1,640 | 1,768 | ||
5.5% 6/1/15 (Nat'l. Pub. Fin. Guarantee Corp. Insured) | 815 | 877 | ||
(Dept. of Corrections, Madera State Prison Proj.) Series E, 5.5% 6/1/15 | 7,205 | 7,750 | ||
(Dept. of Corrections, Monterey County State Prison Proj.) Series 2003 C, 5.5% 6/1/15 | 6,100 | 6,622 | ||
Municipal Bonds - continued | ||||
| Principal Amount (000s) | Value (000s) | ||
California - continued | ||||
California Pub. Works Board Lease Rev.: - continued | ||||
(Dept. of Corrections, Susanville State Prison Proj.) Series 1993 D, 5.25% 6/1/15 (FSA Insured) | $ 4,210 | $ 4,679 | ||
(Dept. of Gen. Svcs. Butterfield Proj.) Series 2005 A, 5% 6/1/23 | 2,900 | 2,991 | ||
(Dept. of Health Svcs. Proj.) Series 2005 K, 5% 11/1/23 | 2,800 | 2,876 | ||
(Dept. of Mental Health Proj.) Series 2004 A: | ||||
5% 6/1/25 | 3,000 | 3,059 | ||
5.125% 6/1/29 | 5,000 | 5,022 | ||
5.5% 6/1/19 | 2,000 | 2,146 | ||
(Kern County at Delano II Proj.) Series 2003 C, 5.5% 6/1/17 (Nat'l. Pub. Fin. Guarantee Corp. Insured) | 4,775 | 5,074 | ||
(Madera County, Valley State Prison for Women Proj.) Series 2005 H, 5% 6/1/16 | 5,000 | 5,558 | ||
(Office of Emergency Svcs. Proj.) Series 2007 A, 5% 3/1/20 | 3,335 | 3,554 | ||
(Porterville Developmental Ctr. Hsg. Expansion and Recreation Complex Proj.) Series 2009 C, 6.25% 4/1/34 | 5,900 | 6,261 | ||
(Richmond Lab. Proj.) Series 2005 K, 5% 11/1/17 | 5,625 | 6,137 | ||
(Ten Administrative Segregation Hsg. Units Proj.) Series 2002 A, 5.25% 3/1/18 (AMBAC Insured) | 2,500 | 2,540 | ||
(Univ. of California Research Proj.): | ||||
Series 2005 L: | ||||
5% 11/1/25 (Nat'l. Pub. Fin. Guarantee Corp. Insured) | 5,165 | 5,381 | ||
5.25% 11/1/23 (Nat'l. Pub. Fin. Guarantee Corp. Insured) | 3,500 | 3,766 | ||
Series 2006 E: | ||||
5% 10/1/23 | 2,410 | 2,622 | ||
5.25% 10/1/21 | 2,900 | 3,270 | ||
Series 2009 G1, 5.75% 10/1/30 | 1,800 | 1,881 | ||
Series 2009 I: | ||||
5.5% 11/1/23 | 1,535 | 1,643 | ||
6.125% 11/1/29 | 1,200 | 1,306 | ||
6.25% 11/1/21 | 2,000 | 2,336 | ||
6.375% 11/1/34 | 3,000 | 3,230 | ||
California State Univ. Rev.: | ||||
(Systemwide Proj.) Series 2002 A: | ||||
5.375% 11/1/18 (AMBAC Insured) | 1,290 | 1,350 | ||
5.5% 11/1/16 (AMBAC Insured) | 1,500 | 1,580 | ||
Municipal Bonds - continued | ||||
| Principal Amount (000s) | Value (000s) | ||
California - continued | ||||
California State Univ. Rev.: - continued | ||||
Series 2009 A: | ||||
5.75% 11/1/25 | $ 3,675 | $ 4,103 | ||
5.75% 11/1/28 | 6,525 | 7,123 | ||
6% 11/1/40 | 7,240 | 7,902 | ||
California Statewide Cmntys. Dev. Auth. Poll. Cont. Rev. Bonds (Southern California Edison Co. Proj.) Series 2006 B, 4.1%, tender 4/1/13 (XL Cap. Assurance, Inc. Insured) (c) | 2,425 | 2,540 | ||
California Statewide Cmntys. Dev. Auth. Rev.: | ||||
(Adventist Health Sys. Proj.) Series 2007 B, 5% 3/1/37 (Assured Guaranty Corp. Insured) | 5,000 | 5,059 | ||
(Cmnty. Hosp. Monterey Peninsula Proj.) Series 2003 B, 5.25% 6/1/23 (FSA Insured) | 1,800 | 1,836 | ||
(Cottage Health Sys. Obligated Group Proj.) Series 2010, 5.25% 11/1/30 | 3,000 | 3,035 | ||
(Daughters of Charity Health Sys. Proj.): | ||||
Series 2003 G, 5.25% 7/1/12 | 900 | 924 | ||
Series 2005 G, 5.25% 7/1/13 | 1,475 | 1,517 | ||
(Enloe Health Sys. Proj.) Series 2008 B: | ||||
5% 8/15/16 | 125 | 139 | ||
5% 8/15/19 | 50 | 56 | ||
5.75% 8/15/38 | 3,000 | 3,109 | ||
6.25% 8/15/33 | 2,500 | 2,669 | ||
(Kaiser Permanente Health Sys. Proj.): | ||||
Series 2001 C, 5.25% 8/1/31 | 3,215 | 3,240 | ||
Series 2007 A: | ||||
4.75% 4/1/33 | 2,000 | 1,843 | ||
5% 4/1/31 | 4,900 | 4,858 | ||
(Los Angeles Orthopaedic Hosp. Foundation Prog.) Series 2000, 5.75% 6/1/30 (AMBAC Insured) | 8,355 | 8,148 | ||
(St. Joseph Health Sys. Proj.) Series 2007 C, 5.75% 7/1/47 (FGIC Insured) | 9,000 | 9,126 | ||
(Sutter Health Proj.) Series 2011 A, 6% 8/15/42 | 3,300 | 3,565 | ||
(Sutter Health Systems Proj.): | ||||
Series 2002 B, 5.625% 8/15/42 | 7,000 | 7,041 | ||
Series 2005 A, 5% 11/15/43 (Nat'l. Pub. Fin. Guarantee Corp. Insured) | 4,125 | 3,886 | ||
5.375% 6/1/26 | 2,500 | 2,552 | ||
6% 6/1/33 | 3,000 | 3,105 | ||
Campbell Union School District Gen. Oblig. Series 2002 C, 5% 8/1/34 (Pre-Refunded to 8/1/14 @ 102) (e) | 1,910 | 2,205 | ||
Municipal Bonds - continued | ||||
| Principal Amount (000s) | Value (000s) | ||
California - continued | ||||
Carlsbad Unified School District: | ||||
Series 2009 B: | ||||
0% 5/1/15 | $ 1,000 | $ 930 | ||
0% 5/1/16 | 1,365 | 1,217 | ||
0% 5/1/17 | 1,155 | 979 | ||
0% 5/1/18 | 1,335 | 1,065 | ||
0% 5/1/19 | 1,000 | 747 | ||
0% 5/1/34 (a) | 5,300 | 3,395 | ||
0% 11/1/15 (Nat'l. Pub. Fin. Guarantee Corp. Insured) | 1,700 | 1,560 | ||
Chino Basin Reg'l. Fing. Auth. Rev. (Inland Empire Util. Agcy. Proj.) Series 2008 A: | ||||
5% 11/1/24 (AMBAC Insured) | 1,000 | 1,079 | ||
5% 11/1/25 (AMBAC Insured) | 3,820 | 4,093 | ||
5% 11/1/33 (AMBAC Insured) | 5,000 | 5,098 | ||
Chula Vista Ind. Dev. Rev. (San Diego Gas & Elec. Co. Proj.) Series B, 5.875% 2/15/34 | 5,000 | 5,455 | ||
Clovis Pub. Fing. Auth. Wastewtr. Rev. Series 2005, 5% 8/1/35 (Nat'l. Pub. Fin. Guarantee Corp. Insured) | 3,295 | 3,192 | ||
Colton Joint Unified School District Series 2001 C, 5.25% 2/1/22 (FGIC Insured) | 1,200 | 1,269 | ||
Commerce Refuse to Energy Auth. Rev. Series 2005: | ||||
5.5% 7/1/14 (Nat'l. Pub. Fin. Guarantee Corp. Insured) | 1,545 | 1,677 | ||
5.5% 7/1/15 (Nat'l. Pub. Fin. Guarantee Corp. Insured) | 2,685 | 2,967 | ||
Corona-Norco Unified School District Series A: | ||||
5% 8/1/22 (FSA Insured) | 1,470 | 1,604 | ||
5% 8/1/25 (FSA Insured) | 1,435 | 1,521 | ||
5% 8/1/26 (FSA Insured) | 2,000 | 2,107 | ||
5% 8/1/27 (FSA Insured) | 1,785 | 1,862 | ||
5% 8/1/31 (FSA Insured) | 5,000 | 5,144 | ||
Covina Valley Unified School District Series 2006 A, 5% 8/1/31 (Nat'l. Pub. Fin. Guarantee Corp. Insured) | 5,600 | 5,671 | ||
Ctr. Unified School District Series 1997 C: | ||||
0% 9/1/18 (Nat'l. Pub. Fin. Guarantee Corp. Insured) | 2,000 | 1,485 | ||
0% 9/1/20 (Nat'l. Pub. Fin. Guarantee Corp. Insured) | 2,010 | 1,343 | ||
Cucamonga County Wtr. District 5% 9/1/36 (Nat'l. Pub. Fin. Guarantee Corp. Insured) | 2,890 | 2,956 | ||
Cupertino California Union School District: | ||||
5% 8/1/18 | 1,735 | 2,115 | ||
5% 8/1/19 | 1,120 | 1,375 | ||
Municipal Bonds - continued | ||||
| Principal Amount (000s) | Value (000s) | ||
California - continued | ||||
Davis Spl. Tax Rev. Series 2007: | ||||
5% 9/1/11 (AMBAC Insured) | $ 595 | $ 595 | ||
5% 9/1/12 (AMBAC Insured) | 625 | 636 | ||
5% 9/1/13 (AMBAC Insured) | 655 | 675 | ||
5% 9/1/14 (AMBAC Insured) | 690 | 718 | ||
5% 9/1/15 (AMBAC Insured) | 725 | 755 | ||
5% 9/1/18 (AMBAC Insured) | 835 | 855 | ||
5% 9/1/20 (AMBAC Insured) | 925 | 925 | ||
5% 9/1/22 (AMBAC Insured) | 1,020 | 1,012 | ||
Desert Sands Union School District Ctfs. of Prtn.: | ||||
5.75% 3/1/24 (FSA Insured) | 2,000 | 2,204 | ||
6% 3/1/20 (FSA Insured) | 1,000 | 1,165 | ||
Duarte Ctfs. of Prtn. Series 1999 A: | ||||
5% 4/1/12 | 4,210 | 4,222 | ||
5% 4/1/13 | 1,830 | 1,835 | ||
El Centro Fing. Auth. Wastewtr. Series 2006 A, 5.25% 10/1/35 (FSA Insured) | 6,890 | 7,075 | ||
Elk Grove Fin. Auth. Spl. Tax Rev. 5% 9/1/17 (AMBAC Insured) | 2,415 | 2,494 | ||
Elk Grove Unified School District Spl. Tax (Cmnty. Facilities District #1 Proj.) 6.5% 12/1/24 (AMBAC Insured) | 4,025 | 4,326 | ||
Empire Union School District Spl. Tax (Cmnty. Facilities District No. 1987 Proj.) Series 2002 A: | ||||
0% 10/1/24 (AMBAC Insured) | 1,665 | 777 | ||
0% 10/1/25 (AMBAC Insured) | 1,665 | 723 | ||
Encinitas Union School District Series 1996, 0% 8/1/21 (Nat'l. Pub. Fin. Guarantee Corp. Insured) | 1,000 | 601 | ||
Escondido Union High School District: | ||||
Series 2008 A: | ||||
0% 8/1/33 (Assured Guaranty Corp. Insured) | 5,655 | 1,384 | ||
0% 8/1/34 (Assured Guaranty Corp. Insured) | 3,500 | 800 | ||
0% 11/1/16 (Escrowed to Maturity) (e) | 3,500 | 3,272 | ||
Fairfield-Suisun Unified School District Series 2004, 5.5% 8/1/28 (Nat'l. Pub. Fin. Guarantee Corp. Insured) | 3,000 | 3,152 | ||
Fillmore Pub. Fing. Auth. Rev. (Wtr. Recycling Fing. Proj.) Series 2007, 5% 5/1/37 (CIFG North America Insured) | 2,500 | 2,365 | ||
Folsom Cordova Unified School District School Facilities Impt. District #1 Series A, 0% 10/1/20 (Nat'l. Pub. Fin. Guarantee Corp. Insured) | 1,315 | 818 | ||
Municipal Bonds - continued | ||||
| Principal Amount (000s) | Value (000s) | ||
California - continued | ||||
Foothill-De Anza Cmnty. College District: | ||||
Series 1999 A: | ||||
0% 8/1/15 (Nat'l. Pub. Fin. Guarantee Corp. Insured) | $ 2,430 | $ 2,272 | ||
0% 8/1/19 (Nat'l. Pub. Fin. Guarantee Corp. Insured) | 5,365 | 4,082 | ||
0% 8/1/20 (Nat'l. Pub. Fin. Guarantee Corp. Insured) | 6,425 | 4,551 | ||
Series 1999 B, 0% 8/1/24 (Nat'l. Pub. Fin. Guarantee Corp. Insured) | 5,000 | 2,704 | ||
Series C, 5% 8/1/36 | 10,000 | 10,609 | ||
Foothill/Eastern Trans. Corridor Agcy. Toll Road Rev.: | ||||
Series 1995 A, 5% 1/1/35 (Nat'l. Pub. Fin. Guarantee Corp. Insured) | 24,070 | 19,689 | ||
Series 1999: | ||||
5% 1/15/16 (Nat'l. Pub. Fin. Guarantee Corp. Insured) | 5,860 | 5,871 | ||
5.75% 1/15/40 | 8,155 | 7,261 | ||
5.875% 1/15/27 | 4,000 | 3,887 | ||
5.875% 1/15/27 (Nat'l. Pub. Fin. Guarantee Corp. Insured) | 4,500 | 4,373 | ||
5.875% 1/15/29 | 4,000 | 3,871 | ||
Garden Grove Agcy. Cmnty. Dev. Tax Allocation Rev. (Garden Grove Cmnty. Proj.) 5.375% 10/1/20 | 2,645 | 2,662 | ||
Glendora Unified School District Series 2005 A, 5.25% 8/1/26 (Nat'l. Pub. Fin. Guarantee Corp. Insured) | 1,000 | 1,066 | ||
Golden State Tobacco Securitization Corp. Tobacco Settlement Rev.: | ||||
Series 2005 A: | ||||
5% 6/1/35 (Berkshire Hathaway Assurance Corp. Insured) | 1,535 | 1,487 | ||
5% 6/1/45 | 12,125 | 10,671 | ||
5% 6/1/45 | 2,775 | 2,450 | ||
Series 2007 A1: | ||||
5% 6/1/12 | 1,400 | 1,420 | ||
5% 6/1/13 | 1,000 | 1,024 | ||
5% 6/1/14 | 2,000 | 2,053 | ||
5% 6/1/15 | 1,000 | 1,027 | ||
5% 6/1/33 | 3,000 | 2,077 | ||
5.125% 6/1/47 | 2,600 | 1,668 | ||
5.75% 6/1/47 | 5,000 | 3,526 | ||
5% 6/1/45 (FSA Insured) | 235 | 220 | ||
Municipal Bonds - continued | ||||
| Principal Amount (000s) | Value (000s) | ||
California - continued | ||||
Golden West Schools Fing. Auth. Rev. Series A, 0% 8/1/18 (Nat'l. Pub. Fin. Guarantee Corp. Insured) | $ 2,750 | $ 2,013 | ||
Indio Pub. Fing. Auth. Lease Rev. Bonds Series 2007 B, 3.8%, tender 11/1/12 (c) | 2,500 | 2,538 | ||
La Quinta Redev. Agcy. Tax. Allocation (Area #1 Redev. Proj.) Series 1994, 7.3% 9/1/11 (National Public Finance Guarantee Corp. Insured) | 480 | 480 | ||
Laguna Beach Unified School District Gen. Oblig. (Election of 2001 Proj.): | ||||
5% 8/1/21 | 405 | 486 | ||
5% 8/1/22 | 450 | 526 | ||
5% 8/1/23 | 485 | 559 | ||
5% 8/1/24 | 1,000 | 1,138 | ||
5% 8/1/26 | 1,370 | 1,530 | ||
5% 8/1/28 | 760 | 831 | ||
Lancaster Fing. Auth. Tax Allocation Rev. 5% 2/1/31 (AMBAC Insured) | 3,420 | 2,449 | ||
Loma Linda Hosp. Rev.: | ||||
(Loma Linda Univ. Med. Ctr. Proj.) Series 2008 A, 8.25% 12/1/38 | 4,400 | 4,809 | ||
Series 2005 A, 5% 12/1/14 | 4,500 | 4,765 | ||
Long Beach Bond Fin. Auth. Natural Gas Purchase Rev. Series 2007 A, 5.25% 11/15/21 | 3,790 | 3,843 | ||
Long Beach Cmnty. College Series 2008 A, 0% 6/1/31 (FSA Insured) | 9,750 | 2,873 | ||
Long Beach Hbr. Rev. Series 2010 B, 5% 5/15/22 | 2,735 | 3,142 | ||
Long Beach Unified School District: | ||||
Series 2008 A, 5.25% 8/1/33 | 6,725 | 7,228 | ||
Series A, 5.75% 8/1/33 | 2,800 | 3,143 | ||
Los Angeles Cmnty. College District: | ||||
Series 2008 A, 6% 8/1/33 | 10,000 | 11,336 | ||
Series 2009 A, 5.5% 8/1/29 | 1,000 | 1,102 | ||
Series 2010 C, 5.25% 8/1/39 | 1,300 | 1,385 | ||
Los Angeles Cmnty. Redev. Agcy. Lease Rev. (Vermont Manchester Social Svcs. Proj.) Series 2005, 5% 9/1/21 (AMBAC Insured) | 2,805 | 2,875 | ||
Los Angeles County Ctfs. of Prtn.: | ||||
(Correctional Facilities Proj.) 0% 9/1/13 (Escrowed to Maturity) (e) | 3,380 | 3,333 | ||
(Disney Parking Proj.): | ||||
0% 3/1/12 | 2,180 | 2,163 | ||
0% 3/1/13 | 6,490 | 6,337 | ||
0% 9/1/14 (AMBAC Insured) | 3,860 | 3,622 | ||
Municipal Bonds - continued | ||||
| Principal Amount (000s) | Value (000s) | ||
California - continued | ||||
Los Angeles County Ctfs. of Prtn.: - continued | ||||
(Disney Parking Proj.): | ||||
0% 3/1/18 | $ 3,000 | $ 2,383 | ||
0% 3/1/19 | 3,200 | 2,395 | ||
0% 3/1/20 | 1,000 | 697 | ||
Los Angeles County Schools Regionalized Bus. Svcs. Corp. Ctfs. of Prtn. (Pooled Fing. Prog.) Series 2003 B: | ||||
5.375% 9/1/16 (FSA Insured) | 1,045 | 1,129 | ||
5.375% 9/1/17 (FSA Insured) | 1,095 | 1,176 | ||
5.375% 9/1/18 (FSA Insured) | 1,155 | 1,236 | ||
5.375% 9/1/19 (FSA Insured) | 1,210 | 1,290 | ||
Los Angeles Ctfs. of Prtn. (Dept. Pub. Social Svcs. Proj.) Series 1999 A, 5.5% 8/1/24 (AMBAC Insured) | 3,700 | 3,703 | ||
Los Angeles Dept. Arpt. Rev.: | ||||
Series 2002 A, 5.25% 5/15/19 (Nat'l. Pub. Fin. Guarantee Corp. Insured) | 3,000 | 3,069 | ||
Series 2006 A: | ||||
5% 5/15/16 (Nat'l. Pub. Fin. Guarantee Corp. Insured) (d) | 1,000 | 1,104 | ||
5% 5/15/17 (Nat'l. Pub. Fin. Guarantee Corp. Insured) (d) | 3,990 | 4,349 | ||
5% 5/15/18 (Nat'l. Pub. Fin. Guarantee Corp. Insured) (d) | 1,410 | 1,518 | ||
Los Angeles Dept. of Wtr. & Pwr. Elec. Plant Rev.: | ||||
4.75% 8/15/12 (Escrowed to Maturity) (e) | 3,120 | 3,129 | ||
4.75% 8/15/16 (Escrowed to Maturity) (e) | 1,395 | 1,399 | ||
4.75% 10/15/20 (Escrowed to Maturity) (e) | 150 | 150 | ||
Los Angeles Dept. of Wtr. & Pwr. Rev. Series A2, 5% 7/1/25 (FSA Insured) | 2,800 | 2,969 | ||
Los Angeles Dept. of Wtr. & Pwr. Wtrwks. Rev. Series 2004 C, 5% 7/1/34 (Nat'l. Pub. Fin. Guarantee Corp. Insured) | 1,500 | 1,530 | ||
Los Angeles Hbr. Dept. Rev. 7.6% 10/1/18 (Escrowed to Maturity) (e) | 9,820 | 12,262 | ||
Los Angeles Muni. Impt. Corp. Lease Rev. Series 2008 A, 5% 9/1/22 | 5,500 | 5,819 | ||
Los Angeles Unified School District: | ||||
Series 1997 F, 5% 7/1/21 (FSA Insured) | 3,880 | 4,108 | ||
Series 2003 A, 5% 7/1/21 (FSA Insured) | 11,050 | 11,698 | ||
Series 2004 A1, 5% 7/1/17 (Nat'l. Pub. Fin. Guarantee Corp. Insured) | 3,000 | 3,290 | ||
Series 2007 A1, 4.5% 1/1/28 | 6,900 | 6,744 | ||
Los Angeles Wastewtr. Sys. Rev. Series 2009 A, 5.75% 6/1/34 | 10,000 | 10,973 | ||
Municipal Bonds - continued | ||||
| Principal Amount (000s) | Value (000s) | ||
California - continued | ||||
M-S-R Pub. Pwr. Agcy. San Juan Proj. Rev. Series D, 6.75% 7/1/20 (Escrowed to Maturity) (e) | $ 1,635 | $ 2,037 | ||
Madera County Ctfs. of Prtn. (Children's Hosp. Central California Proj.) Series 2010, 5.375% 3/15/36 | 3,425 | 3,310 | ||
Malibu Gen. Oblig. Ctfs. of Prtn. (City Hall Proj.) Series A: | ||||
5% 7/1/32 | 500 | 521 | ||
5% 7/1/39 | 4,095 | 4,193 | ||
Marina Coast Wtr. District Ctfs. Prtn. Series 2006, 5% 6/1/37 (Nat'l. Pub. Fin. Guarantee Corp. Insured) | 3,500 | 3,455 | ||
Merced Union High School District Series A, 0% 8/1/22 (Nat'l. Pub. Fin. Guarantee Corp. Insured) | 1,100 | 627 | ||
Modesto Elementary School District, Stanislaus County Series A: | ||||
0% 8/1/21 (Nat'l. Pub. Fin. Guarantee Corp. Insured) | 2,000 | 1,225 | ||
0% 8/1/25 (Nat'l. Pub. Fin. Guarantee Corp. Insured) | 2,800 | 1,271 | ||
Modesto Gen. Oblig. Ctfs. of Prtn.: | ||||
(Cmnty. Ctr. Refing. Proj.) Series A, 5% 11/1/23 (AMBAC Insured) | 2,500 | 2,245 | ||
(Golf Course Refing. Proj.) Series B, 5% 11/1/23 (Nat'l. Pub. Fin. Guarantee Corp. Insured) | 1,585 | 1,537 | ||
Modesto Irrigation District Ctfs. of Prtn.: | ||||
(Cap. Impts. Proj.) Series 2004 B, 5.5% 7/1/35 | 3,800 | 3,891 | ||
(Geysers Geothermal Pwr. Proj.) Series 1986 A, 5% 10/1/17 (Escrowed to Maturity) (e) | 5,000 | 5,799 | ||
Monrovia Unified School District Series B, 0% 8/1/33 (Nat'l. Pub. Fin. Guarantee Corp. Insured) | 2,500 | 673 | ||
Montebello Unified School District Series 2001, 0% 6/1/26 (FSA Insured) | 1,580 | 598 | ||
Monterey County Pub. Impt. Corp. Ctfs. of Prtn. 5% 8/1/18 (AMBAC Insured) | 3,580 | 3,944 | ||
Moreland School District Series 2003 B, 0% 8/1/27 (Nat'l. Pub. Fin. Guarantee Corp. Insured) | 1,485 | 565 | ||
Murrieta Valley Unified School District: | ||||
Series 1998 A, 0% 9/1/13 (Nat'l. Pub. Fin. Guarantee Corp. Insured) | 1,500 | 1,449 | ||
Series 2008, 0% 9/1/32 (FSA Insured) | 5,000 | 1,252 | ||
Natomas Unified School District Series 2007, 5.25% 8/1/30 (FGIC Insured) | 5,150 | 5,125 | ||
New Haven Unified School District: | ||||
12% 8/1/16 (FSA Insured) | 1,500 | 2,237 | ||
12% 8/1/17 (FSA Insured) | 1,000 | 1,552 | ||
Municipal Bonds - continued | ||||
| Principal Amount (000s) | Value (000s) | ||
California - continued | ||||
Newport Beach Rev.: | ||||
(Hoag Memorial Hosp. Presbyterian Proj.) Series 2009 A, 5% 12/1/24 | $ 2,000 | $ 2,042 | ||
Bonds (Hoag Memorial Hosp. Presbyterian Proj.) Series 2009 E, 5%, tender 2/7/13 (c) | 2,800 | 2,965 | ||
Hoag Memorial Hosp. Presbyterian Proj.) Series 2011 A, 6% 12/1/40 | 3,000 | 3,288 | ||
North City West School Facilities Fing. Auth. Spl. Tax: | ||||
Series 2005 B, 5.25% 9/1/23 (AMBAC Insured) | 1,530 | 1,630 | ||
Series 2006 C: | ||||
5% 9/1/16 (AMBAC Insured) | 1,000 | 1,101 | ||
5% 9/1/17 (AMBAC Insured) | 2,735 | 2,983 | ||
Northern California Power Agency Rev. (Hydroelectric #1 Proj.) Series 2008 C, 5% 7/1/12 | 2,500 | 2,594 | ||
Northern California Pwr. Agcy. Rev. (Hydroelectric #1 Proj.) Series 1986 A, 7.5% 7/1/23 (Pre-Refunded to 7/1/21 @ 100) (e) | 3,850 | 5,346 | ||
Northern California Transmission Auth. Rev. (Ore Trans. Proj.) Series A, 7% 5/1/13 (Nat'l. Pub. Fin. Guarantee Corp. Insured) | 4,205 | 4,400 | ||
Norwalk-Mirada Unified School District Series 2009 D, 0% 8/1/33 (FSA Insured) | 5,700 | 1,329 | ||
Novato Unified School District Series 2002, 5.25% 8/1/17 (Nat'l. Pub. Fin. Guarantee Corp. Insured) | 1,000 | 1,013 | ||
Oakland Gen. Oblig. Series 2009 B, 6.25% 1/15/39 | 3,000 | 3,275 | ||
Oakland Joint Powers Fing. Auth. Series 2008 A1, 4.25% 1/1/13 (Assured Guaranty Corp. Insured) | 3,000 | 3,136 | ||
Oakland Redev. Agcy. Sub Tax Allocation (Central District Redev. Proj.): | ||||
Series 1993 A, 5% 9/1/21 (Escrowed to Maturity) (e) | 1,000 | 1,183 | ||
Series 2003, 5.5% 9/1/17 (Nat'l. Pub. Fin. Guarantee Corp. Insured) | 3,000 | 3,029 | ||
Oakland Unified School District Alameda County Series 2009 A: | ||||
6.5% 8/1/23 | 2,810 | 3,208 | ||
6.5% 8/1/24 | 1,220 | 1,382 | ||
Oceanside Unified School District Series A, 0% 8/1/31 (Assured Guaranty Corp. Insured) | 5,000 | 1,441 | ||
Orange County Pub. Fin. Lease Rev. (Juvenile Justice Ctr. Facility Proj.) Series 2002, 5.375% 6/1/16 (AMBAC Insured) | 3,770 | 3,916 | ||
Oxnard Fin. Auth. Solid Waste Rev. Series 2005, 5% 5/1/12 (AMBAC Insured) (d) | 2,065 | 2,101 | ||
Municipal Bonds - continued | ||||
| Principal Amount (000s) | Value (000s) | ||
California - continued | ||||
Oxnard Fing. Auth. Wastewtr. Rev. (Redwood Trunk Swr. and Headworks Proj.) Series 2004 A, 5% 6/1/29 (FGIC Insured) | $ 3,000 | $ 3,077 | ||
Palmdale Elementary School District Spl. Tax (Cmnty. Facilities District #90-1 Proj.) Series 1999, 5.8% 8/1/29 (FSA Insured) | 6,410 | 6,415 | ||
Placentia Pub. Fing. Auth. Rev.: | ||||
3.125% 9/1/12 | 1,585 | 1,604 | ||
4% 9/1/13 | 1,855 | 1,917 | ||
Placer County Union High School District Series A: | ||||
0% 8/1/20 (Nat'l. Pub. Fin. Guarantee Corp. Insured) | 2,000 | 1,338 | ||
0% 8/1/21 (Nat'l. Pub. Fin. Guarantee Corp. Insured) | 1,000 | 634 | ||
Placer County Wtr. Agcy. Rev. (Middle Fork Proj.) Series A, 3.75% 7/1/12 | 305 | 306 | ||
Port of Oakland Rev.: | ||||
Series 2002 L: | ||||
5.5% 11/1/20 (Nat'l. Pub. Fin. Guarantee Corp. Insured) (d) | 3,030 | 3,116 | ||
5.5% 11/1/20 (Pre-Refunded to 11/1/12 @ 100) (d)(e) | 375 | 396 | ||
Series 2002 N: | ||||
5% 11/1/12 (Nat'l. Pub. Fin. Guarantee Corp. Insured) (d) | 2,800 | 2,930 | ||
5% 11/1/15 (Nat'l. Pub. Fin. Guarantee Corp. Insured) (d) | 5,850 | 6,079 | ||
5% 11/1/17 (Nat'l. Pub. Fin. Guarantee Corp. Insured) (d) | 3,355 | 3,459 | ||
5% 11/1/18 (Nat'l. Pub. Fin. Guarantee Corp. Insured) (d) | 2,740 | 2,820 | ||
Series 2007 A: | ||||
5% 11/1/14 (Nat'l. Pub. Fin. Guarantee Corp. Insured) (d) | 10,910 | 12,046 | ||
5% 11/1/16 (Nat'l. Pub. Fin. Guarantee Corp. Insured) (d) | 2,885 | 3,232 | ||
5% 11/1/17 (Nat'l. Pub. Fin. Guarantee Corp. Insured) (d) | 2,185 | 2,448 | ||
Series 2011 O, 5% 5/1/22 (d) | 4,500 | 4,750 | ||
Poway Unified School District: | ||||
(District #2007-1 School Facilities Proj.) Series 2008 A, 0% 8/1/32 | 12,800 | 3,493 | ||
Series B, 0% 8/1/35 | 9,000 | 1,987 | ||
0% 8/1/37 | 6,325 | 1,225 | ||
0% 8/1/38 | 5,410 | 981 | ||
Municipal Bonds - continued | ||||
| Principal Amount (000s) | Value (000s) | ||
California - continued | ||||
Poway Unified School District Pub. Fing. Auth. Lease Rev. Bonds: | ||||
Series 2008 B, 0%, tender 12/1/14 (FSA Insured) (c) | $ 6,685 | $ 6,232 | ||
Series 2008 C: | ||||
3.125%, tender 12/1/11 (FSA Insured) (c) | 1,730 | 1,738 | ||
4%, tender 12/1/11 (FSA Insured) (c) | 6,500 | 6,543 | ||
Rancho Mirage Joint Powers Fing. Auth. Rev. (Eisenhower Med. Ctr. Proj.) Series A, 4.875% 7/1/22 (Nat'l. Pub. Fin. Guarantee Corp. Insured) | 3,500 | 3,522 | ||
Redwood City Elementary School District Series 1997, 0% 8/1/20 (Nat'l. Pub. Fin. Guarantee Corp. Insured) | 4,825 | 3,119 | ||
Riverside County Asset Leasing Corp. Leasehold Rev. (Riverside County Hosp. Proj.): | ||||
Series A, 6.5% 6/1/12 (Nat'l. Pub. Fin. Guarantee Corp. Insured) | 5,815 | 6,044 | ||
Series B, 5.7% 6/1/16 (Nat'l. Pub. Fin. Guarantee Corp. Insured) | 1,950 | 2,003 | ||
Riverside County Pub. Fing. Auth. Tax Allocation Rev. (Redev. Projs.): | ||||
Series 2004: | ||||
5.25% 10/1/20 (XL Cap. Assurance, Inc. Insured) | 2,020 | 1,969 | ||
5.25% 10/1/21 (XL Cap. Assurance, Inc. Insured) | 2,125 | 2,043 | ||
Series 2005 A, 5% 10/1/18 (XL Cap. Assurance, Inc. Insured) | 3,740 | 3,716 | ||
Rocklin Unified School District Series 2002: | ||||
0% 8/1/24 (Nat'l. Pub. Fin. Guarantee Corp. Insured) | 1,370 | 683 | ||
0% 8/1/25 (Nat'l. Pub. Fin. Guarantee Corp. Insured) | 2,725 | 1,263 | ||
0% 8/1/26 (Nat'l. Pub. Fin. Guarantee Corp. Insured) | 1,365 | 588 | ||
Roseville City School District Series 2002 A: | ||||
0% 8/1/25 (Nat'l. Pub. Fin. Guarantee Corp. Insured) | 1,745 | 766 | ||
0% 8/1/27 (Nat'l. Pub. Fin. Guarantee Corp. Insured) | 1,940 | 718 | ||
Sacramento City Fing. Auth. Lease Rev. Series A, 5.4% 11/1/20 (AMBAC Insured) | 2,000 | 2,195 | ||
Sacramento City Fing. Auth. Rev. (Combined Area Projs.) Series B, 0% 11/1/15 (Nat'l. Pub. Fin. Guarantee Corp. Insured) | 7,735 | 6,477 | ||
Sacramento Muni. Util. District Elec. Rev.: | ||||
Series 2001 P, 5.25% 8/15/16 (FSA Insured) | 1,500 | 1,505 | ||
Series 2003 R, 5% 8/15/33 (Nat'l. Pub. Fin. Guarantee Corp. Insured) | 6,825 | 6,870 | ||
Sacramento Pwr. Auth. Cogeneration Proj. Rev.: | ||||
Series 2005 A, 5% 7/1/18 (AMBAC Insured) | 2,800 | 2,907 | ||
Series 2005, 5% 7/1/19 (AMBAC Insured) | 2,900 | 3,001 | ||
Municipal Bonds - continued | ||||
| Principal Amount (000s) | Value (000s) | ||
California - continued | ||||
San Bernardino Cmnty. College District Series A: | ||||
6.25% 8/1/33 | $ 5,900 | $ 6,488 | ||
6.5% 8/1/28 | 2,445 | 2,799 | ||
San Bernardino County Ctfs. of Prtn.: | ||||
(Arrowhead Proj.) Series 2009 A, 5.25% 8/1/26 | 3,000 | 3,050 | ||
(Cap. Facilities Proj.) Series B, 6.875% 8/1/24 (Escrowed to Maturity) (e) | 8,300 | 11,434 | ||
(Med. Ctr. Fing. Prog.) 5.5% 8/1/22 | 10,000 | 10,772 | ||
San Diego Cmnty. College District: | ||||
Series 2002 A, 5% 5/1/22 (Pre-Refunded to 5/1/13 @ 100) (e) | 1,000 | 1,079 | ||
Series 2007, 0% 8/1/17 (FSA Insured) | 3,395 | 2,818 | ||
San Diego County Ctfs. of Prtn.: | ||||
(North and East County Justice Facilities Proj.): | ||||
5% 11/15/16 (AMBAC Insured) | 2,000 | 2,275 | ||
5% 11/15/17 (AMBAC Insured) | 2,000 | 2,251 | ||
5% 11/15/18 (AMBAC Insured) | 2,000 | 2,228 | ||
(The Bishop's School Proj.) Series A, 6% 9/1/34, LOC Bank of New York, New York | 4,090 | 4,159 | ||
(Univ. of San Diego Proj.) 5.25% 10/1/11 | 1,705 | 1,710 | ||
San Diego County Reg'l. Arpt. Auth. Arpt. Rev.: | ||||
Series 2005: | ||||
5% 7/1/14 (AMBAC Insured) (d) | 1,000 | 1,091 | ||
5.25% 7/1/16 (AMBAC Insured) (d) | 1,400 | 1,566 | ||
5% 7/1/12 (AMBAC Insured) (d) | 2,200 | 2,268 | ||
San Diego Pub. Facilities Fing. Auth. Swr. Rev. Series 2009 A, 5.25% 5/15/39 | 1,500 | 1,563 | ||
San Diego Pub. Facilities Fing. Auth. Wtr. Rev. 2009 B, 5.75% 8/1/35 | 3,455 | 3,783 | ||
San Francisco City & County Arpts. Commission Int'l. Arpt. Rev.: | ||||
(SFO Fuel Co. Proj.) Series 1997 A: | ||||
5.125% 1/1/17 (AMBAC Insured) (d) | 6,000 | 6,003 | ||
5.25% 1/1/18 (AMBAC Insured) (d) | 4,515 | 4,518 | ||
Second Series 32F, 5.25% 5/1/19 | 2,500 | 2,946 | ||
Second Series 32H, 5% 5/1/12 (CIFG North America Insured) (d) | 1,000 | 1,029 | ||
San Francisco City & County Redev. Fing. Auth. Tax Allocation Rev. (San Francisco Redev. Projs.) Series 2009 B: | ||||
6.125% 8/1/28 | 1,000 | 1,040 | ||
6.625% 8/1/39 | 1,000 | 1,043 | ||
Municipal Bonds - continued | ||||
| Principal Amount (000s) | Value (000s) | ||
California - continued | ||||
San Jacinto Unified School District Series 2007, 5.25% 8/1/32 (FSA Insured) | $ 3,080 | $ 3,194 | ||
San Joaquin County Ctfs. of Prtn. (County Administration Bldg. Proj.): | ||||
5% 11/15/20 (Nat'l. Pub. Fin. Guarantee Corp. Insured) | 3,720 | 3,964 | ||
5% 11/15/21 (Nat'l. Pub. Fin. Guarantee Corp. Insured) | 3,645 | 3,857 | ||
San Joaquin Hills Trans. Corridor Agcy. Toll Road Rev.: | ||||
Series 1993, 0% 1/1/27 (Escrowed to Maturity) (e) | 4,000 | 2,297 | ||
Series 1997 A: | ||||
0% 1/15/26 (Nat'l. Pub. Fin. Guarantee Corp. Insured) | 11,000 | 3,306 | ||
5.5% 1/15/28 | 1,060 | 846 | ||
Series A: | ||||
0% 1/15/12 (Nat'l. Pub. Fin. Guarantee Corp. Insured) | 7,000 | 6,881 | ||
0% 1/15/15 (Nat'l. Pub. Fin. Guarantee Corp. Insured) | 5,000 | 4,081 | ||
0% 1/15/20 (Nat'l. Pub. Fin. Guarantee Corp. Insured) | 3,765 | 2,036 | ||
0% 1/15/31 (Nat'l. Pub. Fin. Guarantee Corp. Insured) | 5,000 | 951 | ||
San Jose Int'l. Arpt. Rev. Series 2007 A: | ||||
5% 3/1/17 (AMBAC Insured) (d) | 1,180 | 1,297 | ||
5% 3/1/24 (AMBAC Insured) (d) | 9,690 | 9,876 | ||
5% 3/1/37 (AMBAC Insured) (d) | 10,000 | 9,332 | ||
San Jose Unified School District Santa Clara County Series 2002 B, 5% 8/1/25 (FGIC Insured) | 1,750 | 1,863 | ||
San Leandro Unified School District Series 2006 B, 6.25% 8/1/33 (FSA Insured) | 2,800 | 3,095 | ||
San Marcos Pub. Facilities Auth. Pub. Facilities Rev. 0% 9/1/15 (Escrowed to Maturity) (e) | 1,990 | 1,918 | ||
San Marcos Unified School District Series A, 5% 8/1/38 | 5,000 | 5,121 | ||
San Mateo County Cmnty. College District Series A, 0% 9/1/18 (Nat'l. Pub. Fin. Guarantee Corp. Insured) | 3,000 | 2,425 | ||
San Mateo County Joint Powers Fing. Auth. (Cap. Projects) Series 2009 A, 5.25% 7/15/24 | 5,280 | 5,733 | ||
San Mateo Unified School District (Election of 2000 Proj.) Series B: | ||||
0% 9/1/23 (Nat'l. Pub. Fin. Guarantee Corp. Insured) | 2,000 | 1,085 | ||
0% 9/1/25 (Nat'l. Pub. Fin. Guarantee Corp. Insured) | 1,490 | 701 | ||
0% 9/1/26 (Nat'l. Pub. Fin. Guarantee Corp. Insured) | 1,500 | 657 | ||
Municipal Bonds - continued | ||||
| Principal Amount (000s) | Value (000s) | ||
California - continued | ||||
Sanger Unified School District 5.6% 8/1/23 (Nat'l. Pub. Fin. Guarantee Corp. Insured) | $ 3,000 | $ 3,132 | ||
Santa Clara County Fing. Auth. Rev. (El Camino Hosp. Proj.): | ||||
Series 2007 B, 5.125% 2/1/41 (AMBAC Insured) | 2,000 | 1,880 | ||
Series 2007 C, 5.75% 2/1/41 (AMBAC Insured) | 8,000 | 8,083 | ||
Santa Clara Elec. Rev. Series 2011 A, 6% 7/1/31 | 3,000 | 3,324 | ||
Santa Margarita/Dana Point Auth. Rev. Impt. (Dists. 1, 2, 2A & 8 Proj.) Series A, 7.25% 8/1/12 (Nat'l. Pub. Fin. Guarantee Corp. Insured) | 1,865 | 1,949 | ||
Santa Rosa Wastewtr. Rev. Series 2002 B: | ||||
0% 9/1/20 (AMBAC Insured) | 4,030 | 2,554 | ||
0% 9/1/22 (AMBAC Insured) | 2,900 | 1,601 | ||
0% 9/1/25 (AMBAC Insured) | 6,800 | 2,995 | ||
Shasta Joint Powers Fing. Auth. Lease Rev. (County Administration Bldg. Proj.) Series A, 5% 4/1/29 (Nat'l. Pub. Fin. Guarantee Corp. Insured) | 5,015 | 5,019 | ||
Shasta Union High School District: | ||||
Series 2002, 0% 8/1/26 (Nat'l. Pub. Fin. Guarantee Corp. Insured) | 1,000 | 422 | ||
Series 2003, 0% 5/1/28 (Nat'l. Pub. Fin. Guarantee Corp. Insured) | 3,340 | 1,252 | ||
Sonoma County Jr. College District Rev. Series 2002 B, 5% 8/1/26 (FSA Insured) | 11,845 | 12,439 | ||
Southern California Pub. Pwr. Auth. Transmission Proj. Rev. (Southern Transmission Proj.) Series 2008 B, 6% 7/1/25 | 5,450 | 6,356 | ||
Southwestern Cmnty. College District Gen. Oblig. Series 2000, 0% 8/1/27 (Nat'l. Pub. Fin. Guarantee Corp. Insured) | 2,495 | 1,000 | ||
Sulphur Springs Union School District Series A, 0% 9/1/12 (Nat'l. Pub. Fin. Guarantee Corp. Insured) | 2,750 | 2,698 | ||
Sweetwater Union High School District Series 2008 A, 5.625% 8/1/47 (FSA Insured) | 16,900 | 17,863 | ||
Torrance Ctfs. of Prtn. (Refing. & Pub. Impt. Proj.) Series B, 5.25% 6/1/34 (AMBAC Insured) | 3,000 | 3,004 | ||
Torrance Gen. Oblig. Rev. (Torrance Memorial Med. Ctr. Proj.) Series A, 5% 9/1/40 | 5,000 | 4,667 | ||
Torrance Hosp. Rev. (Torrance Memorial Med. Ctr. Proj.) Series 2001 A: | ||||
5.5% 6/1/31 | 2,350 | 2,355 | ||
6% 6/1/22 | 1,100 | 1,115 | ||
Torrance Unified School District Series 2008 Z, 6% 8/1/33 | 5,000 | 5,561 | ||
Municipal Bonds - continued | ||||
| Principal Amount (000s) | Value (000s) | ||
California - continued | ||||
Tracy Operating Partnership Joint Powers Auth. Rev. 6.375% 10/1/38 (Assured Guaranty Corp. Insured) | $ 5,000 | $ 5,527 | ||
Turlock Irrigation District Rev. Series 2011, 5.5% 1/1/41 | 10,000 | 10,707 | ||
Ukiah Unified School District 0% 8/1/14 (Nat'l. Pub. Fin. Guarantee Corp. Insured) | 3,040 | 2,765 | ||
Union Elementary School District Series A: | ||||
0% 9/1/18 (Nat'l. Pub. Fin. Guarantee Corp. Insured) | 1,000 | 786 | ||
0% 9/1/21 (Nat'l. Pub. Fin. Guarantee Corp. Insured) | 2,995 | 1,889 | ||
Univ. of California Regents Med. Ctr. Pool Rev. Series 2010 G: | ||||
4% 5/15/19 | 1,305 | 1,415 | ||
4% 5/15/20 | 615 | 665 | ||
5% 5/15/19 | 2,830 | 3,262 | ||
Univ. of California Revs.: | ||||
(Ltd. Proj.): | ||||
Series 2005 B, 5% 5/15/33 | 1,000 | 1,011 | ||
Series 2007 D, 5% 5/15/25 | 4,250 | 4,592 | ||
(UCLA Med. Ctr. Proj.) Series A: | ||||
5.5% 5/15/21 (AMBAC Insured) | 785 | 798 | ||
5.5% 5/15/24 (AMBAC Insured) | 370 | 374 | ||
Series 2009 O, 5.75% 5/15/34 | 9,900 | 10,913 | ||
Series C, 4.75% 5/15/37 (Nat'l. Pub. Fin. Guarantee Corp. Insured) | 3,150 | 3,174 | ||
Val Verde Unified School District Ctfs. of Prtn.: | ||||
5% 1/1/35 (FGIC Insured) | 2,090 | 1,797 | ||
5.25% 1/1/17 (Pre-Refunded to 1/1/15 @ 100) (e) | 1,000 | 1,155 | ||
5.25% 1/1/18 (Pre-Refunded to 1/1/15 @ 100) (e) | 1,380 | 1,595 | ||
Ventura County Cmnty. College District Series C, 5.5% 8/1/33 | 7,700 | 8,265 | ||
Victor Elementary School District Series A, 0% 6/1/14 (Nat'l. Pub. Fin. Guarantee Corp. Insured) | 2,375 | 2,174 | ||
Vista Gen. Oblig. Ctfs. of Prtn. 5% 5/1/20 (Nat'l. Pub. Fin. Guarantee Corp. Insured) | 2,120 | 2,293 | ||
Vista Unified School District Series A: | ||||
5.375% 8/1/15 (FSA Insured) | 130 | 136 | ||
5.375% 8/1/16 (FSA Insured) | 100 | 104 | ||
Walnut Valley Unified School District Series D: | ||||
0% 8/1/30 (Nat'l. Pub. Fin. Guarantee Corp. Insured) | 2,875 | 890 | ||
0% 8/1/31 (Nat'l. Pub. Fin. Guarantee Corp. Insured) | 2,715 | 767 | ||
0% 8/1/32 (Nat'l. Pub. Fin. Guarantee Corp. Insured) | 1,315 | 343 | ||
5.25% 8/1/16 (Pre-Refunded to 8/1/13 @ 100) (e) | 1,000 | 1,095 | ||
Municipal Bonds - continued | ||||
| Principal Amount (000s) | Value (000s) | ||
California - continued | ||||
Washington Township Health Care District Rev.: | ||||
Series 2009 A: | ||||
6% 7/1/29 | $ 3,000 | $ 3,162 | ||
6.25% 7/1/39 | 7,000 | 7,222 | ||
Series 2010 A, 5.5% 7/1/38 | 3,100 | 2,999 | ||
Series A: | ||||
5% 7/1/23 | 1,460 | 1,483 | ||
5% 7/1/25 | 1,665 | 1,672 | ||
West Contra Costa Unified School District (Election of 2005 Proj.) Series B, 5.625% 8/1/35 (Berkshire Hathaway Assurance Corp. Insured) | 1,500 | 1,542 | ||
Western Riverside County Trust & Wastewtr. Fin. Auth.: | ||||
5.5% 9/1/34 (Assured Guaranty Corp. Insured) | 1,750 | 1,830 | ||
5.625% 9/1/39 (Assured Guaranty Corp. Insured) | 2,250 | 2,357 | ||
Yuba City Unified School District Series A, 0% 9/1/21 (Nat'l. Pub. Fin. Guarantee Corp. Insured) | 2,090 | 1,252 | ||
| 1,602,889 | |||
Guam - 0.2% | ||||
Guam Ed. Fing. Foundation Ctfs. of Prtn. Series 2008: | ||||
4.625% 10/1/11 | 275 | 275 | ||
5.375% 10/1/14 | 1,000 | 1,070 | ||
5.875% 10/1/18 | 1,565 | 1,764 | ||
| 3,109 | |||
Puerto Rico - 0.8% | ||||
Puerto Rico Commonwealth Pub. Impt. Gen. Oblig. Series 2006 A, 4.064% 7/1/21 (FGIC Insured) (c) | 4,600 | 3,830 | ||
Puerto Rico Pub. Bldg. Auth. Rev. Bonds Series M2, 5.75%, tender 7/1/17 (c) | 7,000 | 7,577 | ||
Puerto Rico Sales Tax Fing. Corp. Sales Tax Rev. Series 2007 A, 0% 8/1/41 (FGIC Insured) | 9,500 | 1,423 | ||
| 12,830 | |||
Virgin Islands - 0.2% | ||||
Virgin Islands Pub. Fin. Auth.: | ||||
Series 2009 A1, 5% 10/1/29 | 1,500 | 1,450 | ||
Municipal Bonds - continued | ||||
| Principal Amount (000s) | Value (000s) | ||
Virgin Islands - continued | ||||
Virgin Islands Pub. Fin. Auth.: - continued | ||||
Series 2009 B, 5% 10/1/25 | $ 1,500 | $ 1,507 | ||
Series A, 5.25% 10/1/15 | 1,255 | 1,368 | ||
| 4,325 | |||
TOTAL INVESTMENT PORTFOLIO - 96.8% (Cost $1,581,311) | 1,623,153 | ||
NET OTHER ASSETS (LIABILITIES) - 3.2% | 52,816 | ||
NET ASSETS - 100% | $ 1,675,969 | ||
Legend |
(a) Security initially issued in zero coupon form which converts to coupon form at a specified rate and date. The rate shown is the rate at period end. |
(b) Security or a portion of the security purchased on a delayed delivery or when-issued basis. |
(c) Coupon rates for floating and adjustable rate securities reflect the rates in effect at period end. |
(d) Private activity obligations whose interest is subject to the federal alternative minimum tax for individuals. |
(e) Security collateralized by an amount sufficient to pay interest and principal. |
Other Information |
All investments are categorized as Level 2 under the Fair Value Hierarchy. The inputs or methodology used for valuing securities may not be an indication of the risk associated with investing in those securities. For more information on valuation inputs, please refer to the Security Valuation section in the accompanying Notes to Financial Statements. |
The distribution of municipal securities by revenue source, as a percentage of total net assets, is as follows (Unaudited): |
General Obligations | 46.6% |
Health Care | 12.1% |
Transportation | 10.9% |
Education | 6.5% |
Others* (Individually Less Than 5%) | 23.9% |
| 100.0% |
*Includes net other assets |
Income Tax Information |
At February 28, 2011, the Fund had a capital loss carryforward of approximately $23,286,000 of which $21,327,000 and $1,959,000 will expire in fiscal 2017 and 2018, respectively. Capital loss carryforwards are only available to offset future capital gains of the Fund to the extent provided by regulations and may be limited. |
See accompanying notes which are an integral part of the financial statements.
Semiannual Report
Financial Statements
Statement of Assets and Liabilities
Amounts in thousands (except per-share amounts) | August 31, 2011 (Unaudited) | |
|
|
|
Assets | ||
Investment in securities, at value - See accompanying schedule: Unaffiliated issuers (cost $1,581,311) |
| $ 1,623,153 |
Cash | 43,490 | |
Receivable for fund shares sold | 839 | |
Interest receivable | 18,330 | |
Other receivables | 3 | |
Total assets | 1,685,815 | |
|
|
|
Liabilities | ||
Payable for investments purchased on a delayed delivery basis | $ 6,384 | |
Payable for fund shares redeemed | 521 | |
Distributions payable | 2,004 | |
Accrued management fee | 508 | |
Distribution and service plan fees payable | 27 | |
Other affiliated payables | 372 | |
Other payables and accrued expenses | 30 | |
Total liabilities | 9,846 | |
|
|
|
Net Assets | $ 1,675,969 | |
Net Assets consist of: |
| |
Paid in capital | $ 1,659,185 | |
Undistributed net investment income | 1,619 | |
Accumulated undistributed net realized gain (loss) on investments | (26,677) | |
Net unrealized appreciation (depreciation) on investments | 41,842 | |
Net Assets | $ 1,675,969 | |
See accompanying notes which are an integral part of the financial statements.
Semiannual Report
Financial Statements - continued
Statement of Assets and Liabilities - continued
Amounts in thousands (except per-share amounts) | August 31, 2011 (Unaudited) | |
|
|
|
Calculation of Maximum Offering Price | $ 12.15 | |
|
|
|
Maximum offering price per share (100/96.00 of $12.15) | $ 12.66 | |
Class T: | $ 12.18 | |
|
|
|
Maximum offering price per share (100/96.00 of $12.18) | $ 12.69 | |
Class B: | $ 12.14 | |
|
|
|
Class C: | $ 12.14 | |
|
|
|
|
|
|
California Municipal Income: | $ 12.14 | |
|
|
|
Institutional Class: | $ 12.16 | |
A Redemption price per share is equal to net asset value less any applicable contingent deferred sales charge.
See accompanying notes which are an integral part of the financial statements.
Semiannual Report
Statement of Operations
Amounts in thousands Six months ended August 31, 2011 (Unaudited) | ||
|
|
|
Investment Income |
|
|
Interest |
| $ 38,433 |
|
|
|
Expenses | ||
Management fee | $ 2,914 | |
Transfer agent fees | 574 | |
Distribution and service plan fees | 154 | |
Accounting fees and expenses | 150 | |
Custodian fees and expenses | 9 | |
Independent trustees' compensation | 3 | |
Registration fees | 68 | |
Audit | 24 | |
Legal | 6 | |
Miscellaneous | 12 | |
Total expenses before reductions | 3,914 | |
Expense reductions | (4) | 3,910 |
Net investment income (loss) | 34,523 | |
Realized and Unrealized Gain (Loss) Net realized gain (loss) on: | ||
Investment securities: |
|
|
Unaffiliated issuers |
| 519 |
Change in net unrealized appreciation (depreciation) on investment securities | 68,507 | |
Net gain (loss) | 69,026 | |
Net increase (decrease) in net assets resulting from operations | $ 103,549 | |
See accompanying notes which are an integral part of the financial statements.
Semiannual Report
Financial Statements - continued
Statement of Changes in Net Assets
Amounts in thousands | Six months ended August 31, 2011 (Unaudited) | Year ended |
Increase (Decrease) in Net Assets |
|
|
Operations |
|
|
Net investment income (loss) | $ 34,523 | $ 71,286 |
Net realized gain (loss) | 519 | (1,281) |
Change in net unrealized appreciation (depreciation) | 68,507 | (36,685) |
Net increase (decrease) in net assets resulting | 103,549 | 33,320 |
Distributions to shareholders from net investment income | (34,341) | (70,898) |
Distributions to shareholders from net realized gain | - | (100) |
Total distributions | (34,341) | (70,998) |
Share transactions - net increase (decrease) | 67,077 | (116,381) |
Redemption fees | 5 | 39 |
Total increase (decrease) in net assets | 136,290 | (154,020) |
|
|
|
Net Assets | ||
Beginning of period | 1,539,679 | 1,693,699 |
End of period (including undistributed net investment income of $1,619 and undistributed net investment income of $1,437, respectively) | $ 1,675,969 | $ 1,539,679 |
See accompanying notes which are an integral part of the financial statements.
Semiannual Report
Financial Highlights - Class A
| Six months ended August 31, 2011 | Years ended February 28, | ||||
| (Unaudited) | 2011 | 2010 | 2009 | 2008 G | 2007 |
Selected Per-Share Data |
|
|
|
|
| |
Net asset value, beginning of period | $ 11.64 | $ 11.89 | $ 11.40 | $ 11.63 | $ 12.41 | $ 12.46 |
Income from Investment Operations |
|
|
|
|
|
|
Net investment income (loss) E | .240 | .470 | .472 | .459 | .457 | .478 |
Net realized and unrealized gain (loss) | .509 | (.252) | .486 | (.224) | (.711) | .050 |
Total from investment operations | .749 | .218 | .958 | .235 | (.254) | .528 |
Distributions from net investment income | (.239) | (.467) | (.468) | (.461) | (.457) | (.483) |
Distributions from net realized gain | - | (.001) | - H | (.004) | (.069) | (.095) |
Total distributions | (.239) | (.468) | (.468) | (.465) | (.526) | (.578) |
Redemption fees added to paid in capital E, H | - | - | - | - | - | - |
Net asset value, end of period | $ 12.15 | $ 11.64 | $ 11.89 | $ 11.40 | $ 11.63 | $ 12.41 |
Total Return B, C, D | 6.50% | 1.79% | 8.57% | 2.04% | (2.15)% | 4.36% |
Ratios to Average Net Assets F |
|
|
|
|
| |
Expenses before reductions | .75% A | .75% | .77% | .75% | .73% | .64% |
Expenses net of fee waivers, if any | .75% A | .75% | .77% | .75% | .73% | .64% |
Expenses net of all reductions | .75% A | .74% | .77% | .74% | .70% | .62% |
Net investment income (loss) | 4.03% A | 3.93% | 4.05% | 3.98% | 3.76% | 3.88% |
Supplemental Data |
|
|
|
|
|
|
Net assets, end of period (in millions) | $ 43 | $ 40 | $ 44 | $ 34 | $ 20 | $ 13 |
Portfolio turnover rate | 8% A | 8% | 15% | 26% | 27% | 23% |
A Annualized
B Total returns for periods of less than one year are not annualized.
C Total returns would have been lower had certain expenses not been reduced during the periods shown.
D Total returns do not include the effect of the sales charges.
E Calculated based on average shares outstanding during the period.
F Expense ratios reflect operating expenses of the class. Expenses before reductions do not reflect amounts reimbursed by the investment adviser or reductions from expense offset arrangements and do not represent the amount paid by the class during periods when reimbursements or reductions occur. Expenses net of fee waivers reflect expenses after reimbursement by the investment adviser but prior to reductions from expense offset arrangements. Expenses net of all reductions represent the net expenses paid by the class.
G For the year ended February 29.
H Amount represents less than $.001 per share.
See accompanying notes which are an integral part of the financial statements.
Semiannual Report
Financial Highlights - Class T
| Six months ended August 31, 2011 | Years ended February 28, | ||||
| (Unaudited) | 2011 | 2010 | 2009 | 2008 G | 2007 |
Selected Per-Share Data |
|
|
|
|
| |
Net asset value, beginning of period | $ 11.67 | $ 11.91 | $ 11.42 | $ 11.65 | $ 12.43 | $ 12.48 |
Income from Investment Operations |
|
|
|
|
|
|
Net investment income (loss) E | .240 | .473 | .477 | .464 | .458 | .466 |
Net realized and unrealized gain (loss) | .508 | (.245) | .486 | (.227) | (.712) | .048 |
Total from investment operations | .748 | .228 | .963 | .237 | (.254) | .514 |
Distributions from net investment income | (.238) | (.467) | (.473) | (.463) | (.457) | (.469) |
Distributions from net realized gain | - | (.001) | - H | (.004) | (.069) | (.095) |
Total distributions | (.238) | (.468) | (.473) | (.467) | (.526) | (.564) |
Redemption fees added to paid in capitalE, H | - | - | - | - | - | - |
Net asset value, end of period | $ 12.18 | $ 11.67 | $ 11.91 | $ 11.42 | $ 11.65 | $ 12.43 |
Total Return B, C, D | 6.48% | 1.87% | 8.59% | 2.05% | (2.15)% | 4.24% |
Ratios to Average Net Assets F |
|
|
|
|
| |
Expenses before reductions | .76% A | .75% | .73% | .73% | .74% | .75% |
Expenses net of fee waivers, if any | .76% A | .75% | .73% | .73% | .74% | .75% |
Expenses net of all reductions | .76% A | .75% | .73% | .72% | .70% | .72% |
Net investment income (loss) | 4.02% A | 3.93% | 4.09% | 4.00% | 3.75% | 3.77% |
Supplemental Data |
|
|
|
|
|
|
Net assets, end of period (in millions) | $ 4 | $ 4 | $ 6 | $ 7 | $ 5 | $ 5 |
Portfolio turnover rate | 8% A | 8% | 15% | 26% | 27% | 23% |
A Annualized
B Total returns for periods of less than one year are not annualized.
C Total returns would have been lower had certain expenses not been reduced during the periods shown.
D Total returns do not include the effect of the sales charges.
E Calculated based on average shares outstanding during the period.
F Expense ratios reflect operating expenses of the class. Expenses before reductions do not reflect amounts reimbursed by the investment adviser or reductions from expense offset arrangements and do not represent the amount paid by the class during periods when reimbursements or reductions occur. Expenses net of fee waivers reflect expenses after reimbursement by the investment adviser but prior to reductions from expense offset arrangements. Expenses net of all reductions represent the net expenses paid by the class.
G For the year ended February 29.
H Amount represents less than $.001 per share.
See accompanying notes which are an integral part of the financial statements.
Semiannual Report
Financial Highlights - Class B
| Six months ended August 31, 2011 | Years ended February 28, | ||||
| (Unaudited) | 2011 | 2010 | 2009 | 2008 G | 2007 |
Selected Per-Share Data |
|
|
|
|
| |
Net asset value, beginning of period | $ 11.63 | $ 11.88 | $ 11.39 | $ 11.62 | $ 12.40 | $ 12.45 |
Income from Investment Operations |
|
|
|
|
|
|
Net investment income (loss) E | .203 | .395 | .397 | .387 | .376 | .383 |
Net realized and unrealized gain (loss) | .509 | (.253) | .488 | (.228) | (.712) | .049 |
Total from investment operations | .712 | .142 | .885 | .159 | (.336) | .432 |
Distributions from net investment income | (.202) | (.391) | (.395) | (.385) | (.375) | (.387) |
Distributions from net realized gain | - | (.001) | - H | (.004) | (.069) | (.095) |
Total distributions | (.202) | (.392) | (.395) | (.389) | (.444) | (.482) |
Redemption fees added to paid in capitalE, H | - | - | - | - | - | - |
Net asset value, end of period | $ 12.14 | $ 11.63 | $ 11.88 | $ 11.39 | $ 11.62 | $ 12.40 |
Total Return B, C, D | 6.17% | 1.15% | 7.90% | 1.38% | (2.81)% | 3.57% |
Ratios to Average Net Assets F |
|
|
|
|
| |
Expenses before reductions | 1.37% A | 1.38% | 1.40% | 1.41% | 1.41% | 1.41% |
Expenses net of fee waivers, if any | 1.37% A | 1.38% | 1.40% | 1.41% | 1.41% | 1.41% |
Expenses net of all reductions | 1.37% A | 1.38% | 1.40% | 1.40% | 1.37% | 1.39% |
Net investment income (loss) | 3.41% A | 3.29% | 3.42% | 3.33% | 3.08% | 3.11% |
Supplemental Data |
|
|
|
|
|
|
Net assets, end of period (in millions) | $ 2 | $ 2 | $ 3 | $ 4 | $ 5 | $ 5 |
Portfolio turnover rate | 8% A | 8% | 15% | 26% | 27% | 23% |
A Annualized
B Total returns for periods of less than one year are not annualized.
C Total returns would have been lower had certain expenses not been reduced during the periods shown.
D Total returns do not include the effect of the contingent deferred sales charge.
E Calculated based on average shares outstanding during the period.
F Expense ratios reflect operating expenses of the class. Expenses before reductions do not reflect amounts reimbursed by the investment adviser or reductions from expense offset arrangements and do not represent the amount paid by the class during periods when reimbursements or reductions occur. Expenses net of fee waivers reflect expenses after reimbursement by the investment adviser but prior to reductions from expense offset arrangements. Expenses net of all reductions represent the net expenses paid by the class.
G For the year ended February 29.
H Amount represents less than $.001 per share.
See accompanying notes which are an integral part of the financial statements.
Semiannual Report
Financial Highlights - Class C
| Six months ended August 31, 2011 | Years ended February 28, | ||||
| (Unaudited) | 2011 | 2010 | 2009 | 2008 G | 2007 |
Selected Per-Share Data |
|
|
|
|
| |
Net asset value, beginning of period | $ 11.62 | $ 11.87 | $ 11.38 | $ 11.61 | $ 12.40 | $ 12.44 |
Income from Investment Operations |
|
|
|
|
|
|
Net investment income (loss) E | .194 | .378 | .384 | .374 | .364 | .371 |
Net realized and unrealized gain (loss) | .519 | (.252) | .488 | (.225) | (.721) | .061 |
Total from investment operations | .713 | .126 | .872 | .149 | (.357) | .432 |
Distributions from net investment income | (.193) | (.376) | (.382) | (.375) | (.364) | (.377) |
Distributions from net realized gain | - | (.001) | - H | (.004) | (.069) | (.095) |
Total distributions | (.193) | (.376) I | (.382) | (.379) | (.433) | (.472) |
Redemption fees added to paid in capitalE, H | - | - | - | - | - | - |
Net asset value, end of period | $ 12.14 | $ 11.62 | $ 11.87 | $ 11.38 | $ 11.61 | $ 12.40 |
Total Return B, C, D | 6.19% | 1.02% | 7.78% | 1.29% | (2.98)% | 3.56% |
Ratios to Average Net Assets F |
|
|
|
|
| |
Expenses before reductions | 1.52% A | 1.51% | 1.51% | 1.49% | 1.50% | 1.50% |
Expenses net of fee waivers, if any | 1.52% A | 1.51% | 1.51% | 1.49% | 1.50% | 1.50% |
Expenses net of all reductions | 1.52% A | 1.51% | 1.51% | 1.48% | 1.47% | 1.48% |
Net investment income (loss) | 3.26% A | 3.16% | 3.30% | 3.24% | 2.99% | 3.02% |
Supplemental Data |
|
|
|
|
|
|
Net assets, end of period (in millions) | $ 19 | $ 17 | $ 19 | $ 12 | $ 8 | $ 10 |
Portfolio turnover rate | 8% A | 8% | 15% | 26% | 27% | 23% |
A Annualized
B Total returns for periods of less than one year are not annualized.
C Total returns would have been lower had certain expenses not been reduced during the periods shown.
D Total returns do not include the effect of the contingent deferred sales charge.
E Calculated based on average shares outstanding during the period.
F Expense ratios reflect operating expenses of the class. Expenses before reductions do not reflect amounts reimbursed by the investment adviser or reductions from expense offset arrangements and do not represent the amount paid by the class during periods when reimbursements or reductions occur. Expenses net of fee waivers reflect expenses after reimbursement by the investment adviser but prior to reductions from expense offset arrangements. Expenses net of all reductions represent the net expenses paid by the class.
G For the year ended February 29.
H Amount represents less than $.001 per share.
I Total distributions of $.376 per share is comprised of distributions from net investment income of $.3757 and distributions from net realized gain of $.0007 per share.
See accompanying notes which are an integral part of the financial statements.
Semiannual Report
Financial Highlights - California Municipal Income
| Six months ended August 31, 2011 | Years ended February 28, | ||||
| (Unaudited) | 2011 | 2010 | 2009 | 2008 F | 2007 |
Selected Per-Share Data |
|
|
|
|
| |
Net asset value, beginning of period | $ 11.63 | $ 11.88 | $ 11.38 | $ 11.61 | $ 12.40 | $ 12.45 |
Income from Investment Operations |
|
|
|
|
|
|
Net investment income (loss) D | .257 | .504 | .506 | .495 | .491 | .499 |
Net realized and unrealized gain (loss) | .509 | (.252) | .497 | (.227) | (.722) | .050 |
Total from investment operations | .766 | .252 | 1.003 | .268 | (.231) | .549 |
Distributions from net investment income | (.256) | (.501) | (.503) | (.494) | (.490) | (.504) |
Distributions from net realized gain | - | (.001) | - G | (.004) | (.069) | (.095) |
Total distributions | (.256) | (.502) | (.503) | (.498) | (.559) | (.599) |
Redemption fees added to paid in capital D, G | - | - | - | - | - | - |
Net asset value, end of period | $ 12.14 | $ 11.63 | $ 11.88 | $ 11.38 | $ 11.61 | $ 12.40 |
Total Return B, C | 6.66% | 2.08% | 9.00% | 2.33% | (1.97)% | 4.55% |
Ratios to Average Net Assets E |
|
|
|
|
| |
Expenses before reductions | .47% A | .46% | .47% | .47% | .46% | .47% |
Expenses net of fee waivers, if any | .47% A | .46% | .47% | .47% | .46% | .47% |
Expenses net of all reductions | .46% A | .46% | .47% | .46% | .43% | .44% |
Net investment income (loss) | 4.32% A | 4.21% | 4.34% | 4.27% | 4.03% | 4.05% |
Supplemental Data |
|
|
|
|
|
|
Net assets, end of period (in millions) | $ 1,580 | $ 1,456 | $ 1,560 | $ 1,427 | $ 1,543 | $ 1,611 |
Portfolio turnover rate | 8% A | 8% | 15% | 26% | 27% | 23% |
A Annualized
B Total returns for periods of less than one year are not annualized.
C Total returns would have been lower had certain expenses not been reduced during the periods shown.
D Calculated based on average shares outstanding during the period.
E Expense ratios reflect operating expenses of the class. Expenses before reductions do not reflect amounts reimbursed by the investment adviser or reductions from expense offset arrangements and do not represent the amount paid by the class during periods when reimbursements or reductions occur. Expenses net of fee waivers reflect expenses after reimbursement by the investment adviser but prior to reductions from expense offset arrangements. Expenses net of all reductions represent the net expenses paid by the class.
F For the year ended February 29.
G Amount represents less than $.001 per share.
See accompanying notes which are an integral part of the financial statements.
Semiannual Report
Financial Highlights - Institutional Class
| Six months ended August 31, 2011 | Years ended February 28, | ||||
| (Unaudited) | 2011 | 2010 | 2009 | 2008 F | 2007 |
Selected Per-Share Data |
|
|
|
|
| |
Net asset value, beginning of period | $ 11.65 | $ 11.90 | $ 11.40 | $ 11.63 | $ 12.42 | $ 12.47 |
Income from Investment Operations |
|
|
|
|
|
|
Net investment income (loss) D | .254 | .500 | .503 | .491 | .486 | .493 |
Net realized and unrealized gain (loss) | .508 | (.255) | .496 | (.226) | (.722) | .049 |
Total from investment operations | .762 | .245 | .999 | .265 | (.236) | .542 |
Distributions from net investment income | (.252) | (.495) | (.499) | (.491) | (.485) | (.497) |
Distributions from net realized gain | - | (.001) | - G | (.004) | (.069) | (.095) |
Total distributions | (.252) | (.495)H | (.499) | (.495) | (.554) | (.592) |
Redemption fees added to paid in capital D, G | - | - | - | - | - | - |
Net asset value, end of period | $ 12.16 | $ 11.65 | $ 11.90 | $ 11.40 | $ 11.63 | $ 12.42 |
Total Return B, C | 6.61% | 2.02% | 8.94% | 2.30% | (2.00)% | 4.48% |
Ratios to Average Net Assets E |
|
|
|
|
| |
Expenses before reductions | .53% A | .51% | .51% | .49% | .50% | .53% |
Expenses net of fee waivers, if any | .53% A | .51% | .51% | .49% | .50% | .53% |
Expenses net of all reductions | .53% A | .51% | .51% | .48% | .47% | .50% |
Net investment income (loss) | 4.26% A | 4.16% | 4.31% | 4.24% | 3.99% | 3.99% |
Supplemental Data |
|
|
|
|
|
|
Net assets, end of period (in millions) | $ 27 | $ 21 | $ 62 | $ 19 | $ 11 | $ 8 |
Portfolio turnover rate | 8% A | 8% | 15% | 26% | 27% | 23% |
A Annualized
B Total returns for periods of less than one year are not annualized.
C Total returns would have been lower had certain expenses not been reduced during the periods shown.
D Calculated based on average shares outstanding during the period.
E Expense ratios reflect operating expenses of the class. Expenses before reductions do not reflect amounts reimbursed by the investment adviser or reductions from expense offset arrangements and do not represent the amount paid by the class during periods when reimbursements or reductions occur. Expenses net of fee waivers reflect expenses after reimbursement by the investment adviser but prior to reductions from expense offset arrangements. Expenses net of all reductions represent the net expenses paid by the class.
F For the year ended February 29.
G Amount represents less than $.001 per share.
H Total distributions of $.495 per share is comprised of distributions from net investment income of $.4945 and distributions from net realized gain of $.0007 per share.
See accompanying notes which are an integral part of the financial statements.
Semiannual Report
Notes to Financial Statements
For the period ended August 31, 2011 (Unaudited)
(Amounts in thousands except ratios)
1. Organization.
Fidelity California Municipal Income Fund (the Fund) is a non-diversified fund of Fidelity California Municipal Trust (the Trust) and is authorized to issue an unlimited number of shares. The Trust is registered under the Investment Company Act of 1940, as amended (the 1940 Act), as an open-end management investment company organized as a Massachusetts business trust. The Fund offers Class A, Class T, Class C, California Municipal Income and Institutional Class shares, each of which, along with Class B shares, has equal rights as to assets and voting privileges. Effective after the close of business on September 1, 2010, Class B shares were closed to new accounts and additional purchases, except for exchanges and reinvestments by existing shareholders. Each class has exclusive voting rights with respect to matters that affect that class. Class B shares will automatically convert to Class A shares after a holding period of seven years from the initial date of purchase. Investment income, realized and unrealized capital gains and losses, the common expenses of the Fund, and certain fund-level expense reductions, if any, are allocated on a pro-rata basis to each class based on the relative net assets of each class to the total net assets of the Fund. Each class differs with respect to transfer agent and distribution and service plan fees incurred. Certain expense reductions may also differ by class. The Fund may be affected by economic and political developments in the state of California.
2. Significant Accounting Policies.
The financial statements have been prepared in conformity with accounting principles generally accepted in the United States of America (GAAP), which require management to make certain estimates and assumptions at the date of the financial statements. Actual results could differ from those estimates. Subsequent events, if any, through the date that the financial statements were issued have been evaluated in the preparation of the financial statements. The following summarizes the significant accounting policies of the Fund:
Security Valuation. Investments are valued as of 4:00 p.m. Eastern time on the last calendar day of the period. The Fund uses independent pricing services approved by the Board of Trustees to value its investments. When current market prices or quotations are not readily available or reliable, valuations may be determined in good faith in accordance with procedures adopted by the Board of Trustees. Factors used in determining value may include market or security specific events, changes in interest rates and credit quality. The frequency with which these procedures are used cannot be predicted and they may be utilized to a significant extent. The value used for net asset value (NAV) calculation under these procedures may differ from published prices for the same securities.
Semiannual Report
2. Significant Accounting Policies - continued
Security Valuation - continued
The Fund categorizes the inputs to valuation techniques used to value its investments into a disclosure hierarchy consisting of three levels as shown below:
Level 1 - quoted prices in active markets for identical investments
Level 2 - other significant observable inputs (including quoted prices for similar investments, interest rates, prepayment speeds, etc.)
Level 3 - unobservable inputs (including the Fund's own assumptions based on the best information available)
Changes in valuation techniques may result in transfers in or out of an assigned level within the disclosure hierarchy. Valuation techniques used to value the Fund's investments by major category are as follows:
Debt securities, including restricted securities, are valued based on evaluated prices received from independent pricing services or from dealers who make markets in such securities. For municipal securities, pricing services utilize matrix pricing which considers yield or price of bonds of comparable quality, coupon, maturity and type as well as dealer supplied prices and are generally categorized as Level 2 in the hierarchy. When independent prices are unavailable or unreliable, debt securities may be valued utilizing pricing matrices which consider similar factors that would be used by independent pricing services. These are generally categorized as Level 2 in the hierarchy but may be Level 3 depending on the circumstances.
Investment Transactions and Income. For financial reporting purposes, the Fund's investment holdings and NAV include trades executed through the end of the last business day of the period. The NAV per share for processing shareholder transactions is calculated as of the close of business of the New York Stock Exchange (NYSE), normally 4:00 p.m. Eastern time and includes trades executed through the end of the prior business day. Gains and losses on securities sold are determined on the basis of identified cost. Interest income is accrued as earned. Interest income includes coupon interest and amortization of premium and accretion of discount on debt securities.
Expenses. Expenses directly attributable to a fund are charged to that fund. Expenses attributable to more than one fund are allocated among the respective funds on the basis of relative net assets or other appropriate methods. Expense estimates are accrued in the period to which they relate and adjustments are made when actual amounts are known.
Semiannual Report
Notes to Financial Statements (Unaudited) - continued
(Amounts in thousands except ratios)
2. Significant Accounting Policies - continued
Income Tax Information and Distributions to Shareholders. Each year, the Fund intends to qualify as a regulated investment company, including distributing substantially all of its taxable income and realized gains under Subchapter M of the Internal Revenue Code and filing its U.S. federal tax return. As a result, no provision for income taxes is required. A fund's federal tax return is subject to examination by the Internal Revenue Service (IRS) for a period of three years.
Dividends are declared and recorded daily and paid monthly from net investment income. Distributions from realized gains, if any, are declared and recorded on the ex-dividend date. Income dividends and capital gain distributions are declared separately for each class. Income and capital gain distributions are determined in accordance with income tax regulations, which may differ from GAAP.
Capital accounts within the financial statements are adjusted for permanent book-tax differences. These adjustments have no impact on net assets or the results of operations. Temporary book-tax differences will reverse in a subsequent period.
Book-tax differences are primarily due to market discount, deferred trustees compensation, capital loss carryforwards, losses deferred due to futures transactions and excise tax regulations.
The Fund purchases municipal securities whose interest, in the opinion of the issuer, is free from federal income tax. There is no assurance that the IRS will agree with this opinion. In the event the IRS determines that the issuer does not comply with relevant tax requirements, interest payments from a security could become federally taxable, possibly retroactively to the date the security was issued.
The federal tax cost of investment securities and unrealized appreciation (depreciation) as of period end were as follows:
Gross unrealized appreciation | $ 66,577 |
Gross unrealized depreciation | (23,185) |
Net unrealized appreciation (depreciation) on securities and other investments | $ 43,392 |
|
|
Tax cost | $ 1,579,761 |
Under the recently enacted Regulated Investment Company Modernization Act of 2010 (the Act), the Fund will be permitted to carry forward capital losses incurred in taxable years beginning after December 22, 2010 for an unlimited period. However, any losses incurred during those future taxable years will be required to be utilized prior to any losses incurred in pre-enactment taxable years, which generally expire after eight years from when they are incurred. Additionally, post-enactment capital losses that are carried
Semiannual Report
2. Significant Accounting Policies - continued
Income Tax Information and Distributions to Shareholders - continued
forward will retain their character as either short-term or long-term capital losses rather than being considered all short-term as under previous law. The Fund's first fiscal year end subject to the Act will be February 28, 2012.
Short-Term Trading (Redemption) Fees. Shares held by investors in the Fund less than 30 days are subject to a redemption fee equal to .50% of the net asset value of shares redeemed. All redemption fees, which reduce the proceeds of the shareholder redemption, are retained by the Fund and accounted for as an addition to paid in capital.
3. Operating Policies.
Delayed Delivery Transactions and When-Issued Securities. During the period, the Fund transacted in securities on a delayed delivery or when-issued basis. Payment and delivery may take place after the customary settlement period for that security. The price of the underlying securities and the date when the securities will be delivered and paid for are fixed at the time the transaction is negotiated. During the time a delayed delivery sell is outstanding, the contract is marked-to-market daily and equivalent deliverable securities are held for the transaction. The securities purchased on a delayed delivery or when-issued basis are identified as such in the Fund's Schedule of Investments. The Fund may receive compensation for interest forgone in the purchase of a delayed delivery or when-issued security. With respect to purchase commitments, the Fund identifies securities as segregated in its records with a value at least equal to the amount of the commitment. Losses may arise due to changes in the value of the underlying securities or if the counterparty does not perform under the contract's terms, or if the issuer does not issue the securities due to political, economic, or other factors.
4. Purchases and Sales of Investments.
Purchases and sales of securities, other than short-term securities, aggregated $86,817 and $63,354, respectively.
5. Fees and Other Transactions with Affiliates.
Management Fee. Fidelity Management & Research Company (FMR) and its affiliates provide the Fund with investment management related services for which the Fund pays a monthly management fee. The management fee is the sum of an individual fund fee rate that is based on an annual rate of .25% of the Fund's average net assets and a group fee rate that averaged .11% during the period. The group fee rate is based upon the average net assets of all the mutual funds advised by FMR. The group fee rate decreases as assets under management increase and increases as assets under management decrease. For the period, the total annualized management fee rate was .36% of the Fund's average net assets.
Semiannual Report
Notes to Financial Statements (Unaudited) - continued
(Amounts in thousands except ratios)
5. Fees and Other Transactions with Affiliates - continued
Distribution and Service Plan Fees. In accordance with Rule 12b-1 of the 1940 Act, the Fund has adopted separate Distribution and Service Plans for each class of shares. Certain classes pay Fidelity Distributors Corporation (FDC), an affiliate of FMR, separate Distribution and Service Fees, each of which is based on an annual percentage of each class' average net assets. In addition, FDC may pay financial intermediaries for selling shares of the Fund and providing shareholder support services. For the period, the Distribution and Service Fee rates, total fees and amounts retained by FDC were as follows:
| Distribution | Service | Total Fees | Retained |
Class A | -% | .25% | $ 52 | $ 5 |
Class T | -% | .25% | 5 | - |
Class B | .65% | .25% | 8 | 6 |
Class C | .75% | .25% | 89 | 19 |
|
|
| $ 154 | $ 30 |
Sales Load. FDC may receive a front-end sales charge of up to 4.00% for selling Class A shares and Class T shares, some of which is paid to financial intermediaries for selling shares of the Fund. Depending on the holding period, FDC may receive contingent deferred sales charges levied on Class A, Class T, Class B, and Class C redemptions. The deferred sales charges range from 5% to 1% for Class B, 1% for Class C, .75% for certain purchases of Class A shares and .25% for certain purchases of Class T shares.
For the period, sales charge amounts retained by FDC were as follows:
| Retained |
Class A | $ 5 |
Class T | -** |
Class B* | 2 |
Class C* | 1 |
| $ 8 |
* When Class B and Class C shares are initially sold, FDC pays commissions from its own resources to financial intermediaries through which the sales are made.
** Amount represents one hundred sixty dollars.
Transfer Agent and Accounting Fees. Citibank, N.A. (Citibank) is the custodian, transfer agent, and servicing agent for the Fund's Class A, Class T, Class B, Class C, California Municipal Income and Institutional Class shares. Citibank has entered into a sub-arrangement with Fidelity Investments Institutional Operations Company, Inc. (FIIOC), an affiliate of FMR, with respect to all classes of the Fund, to perform the transfer agency, dividend disbursing, and shareholder servicing functions. FIIOC
Semiannual Report
5. Fees and Other Transactions with Affiliates - continued
Transfer Agent and Accounting Fees - continued
receives account fees and asset-based fees that vary according to the account size and type of account of the shareholders of the respective classes of the Fund. All fees are paid to FIIOC by Citibank, which is reimbursed by each class for such payments. FIIOC pays for typesetting, printing and mailing of shareholder reports, except proxy statements. For the period, transfer agent fees for each class were as follows:
| Amount | % of |
Class A | $ 23 | .11 |
Class T | 2 | .12 |
Class B | 1 | .08 |
Class C | 12 | .13 |
California Municipal Income | 520 | .07 |
Institutional Class | 16 | .13 |
| $ 574 |
|
* Annualized
Citibank also has a sub-arrangement with Fidelity Service Company, Inc. (FSC), an affiliate of FMR, under which FSC maintains the Fund's accounting records. The fee is based on the level of average net assets for the month.
6. Committed Line of Credit.
The Fund participates with other funds managed by FMR or an affiliate in a $4.0 billion credit facility (the "line of credit") to be utilized for temporary or emergency purposes to fund shareholder redemptions or for other short-term liquidity purposes. The Fund has agreed to pay commitment fees on its pro-rata portion of the line of credit, which amounted to $2 and is reflected in Miscellaneous expenses on the Statement of Operations. During the period, there were no borrowings on this line of credit.
7. Expense Reductions.
Through arrangements with the Fund's custodian, credits realized as a result of uninvested cash balances were used to reduce the Fund's expenses. During the period, these credits reduced the Fund's custody expenses by $4.
Semiannual Report
Notes to Financial Statements (Unaudited) - continued
(Amounts in thousands except ratios)
8. Distributions to Shareholders.
Distributions to shareholders of each class were as follows:
Six months ended | Year ended | |
From net investment income |
|
|
Class A | $ 829 | $ 1,696 |
Class T | 82 | 218 |
Class B | 31 | 81 |
Class C | 292 | 603 |
California Municipal Income | 32,600 | 66,826 |
Institutional Class | 507 | 1,474 |
Total | $ 34,341 | $ 70,898 |
From net realized gain |
|
|
Class A | $ - | $ 3 |
Class T | - | -* |
Class B | - | -* |
Class C | - | 1 |
California Municipal Income | - | 95 |
Institutional Class | - | 1 |
Total | $ - | $ 100 |
* Amount represents less than $1,000
9. Share Transactions.
Transactions for each class of shares were as follows:
| Shares | Dollars | ||
Six months ended | Year ended | Six months ended | Year ended | |
Class A |
|
|
|
|
Shares sold | 665 | 1,131 | $ 7,879 | $ 13,594 |
Reinvestment of distributions | 48 | 97 | 576 | 1,160 |
Shares redeemed | (548) | (1,496) | (6,515) | (17,712) |
Net increase (decrease) | 165 | (268) | $ 1,940 | $ (2,958) |
Class T |
|
|
|
|
Shares sold | 30 | 64 | $ 362 | $ 770 |
Reinvestment of distributions | 6 | 14 | 69 | 172 |
Shares redeemed | (28) | (259) | (333) | (3,101) |
Net increase (decrease) | 8 | (181) | $ 98 | $ (2,159) |
Class B |
|
|
|
|
Shares sold | 3 | 31 | $ 24 | $ 375 |
Reinvestment of distributions | 1 | 3 | 14 | 36 |
Shares redeemed | (21) | (87) | (244) | (1,030) |
Net increase (decrease) | (17) | (53) | $ (206) | $ (619) |
Semiannual Report
9. Share Transactions - continued
| Shares | Dollars | ||
Six months ended | Year ended | Six months ended | Year ended | |
Class C |
|
|
|
|
Shares sold | 203 | 503 | $ 2,425 | $ 6,012 |
Reinvestment of distributions | 15 | 29 | 175 | 350 |
Shares redeemed | (105) | (659) | (1,236) | (7,787) |
Net increase (decrease) | 113 | (127) | $ 1,364 | $ (1,425) |
California Municipal Income |
|
|
|
|
Shares sold | 13,001 | 30,469 | $ 153,825 | $ 363,379 |
Reinvestment of distributions | 1,805 | 3,784 | 21,393 | 45,282 |
Shares redeemed | (9,827) | (40,406) | (116,062) | (476,687) |
Net increase (decrease) | 4,979 | (6,153) | $ 59,156 | $ (68,026) |
Institutional Class |
|
|
|
|
Shares sold | 591 | 1,709 | $ 6,983 | $ 20,475 |
Reinvestment of distributions | 25 | 46 | 301 | 554 |
Shares redeemed | (216) | (5,174) | (2,559) | (62,223) |
Net increase (decrease) | 400 | (3,419) | $ 4,725 | $ (41,194) |
10. Other.
The Fund's organizational documents provide former and current trustees and officers with a limited indemnification against liabilities arising in connection with the performance of their duties to the Fund. In the normal course of business, the Fund may also enter into contracts that provide general indemnifications. The Fund's maximum exposure under these arrangements is unknown as this would be dependent on future claims that may be made against the Fund. The risk of material loss from such claims is considered remote.
Semiannual Report
Investment Adviser
Fidelity Management & Research Company
Boston, MA
Investment Sub-Advisers
Fidelity Investments
Money Management, Inc.
Fidelity Management & Research
(U.K.) Inc.
Fidelity Management & Research
(Hong Kong) Limited
Fidelity Management & Research
(Japan) Inc.
General Distributor
Fidelity Distributors Corporation
Boston, MA
Transfer and Service Agents
Citibank, N.A.
New York, NY
Fidelity Investments Institutional Operations Company, Inc.
Boston, MA
Fidelity Service Company, Inc.
Boston, MA
Custodian
Citibank, N.A.
New York, NY
ASCMI-USAN-1011
1.790937.108
Item 2. Code of Ethics
Not applicable.
Item 3. Audit Committee Financial Expert
Not applicable.
Item 4. Principal Accountant Fees and Services
Not applicable.
Item 5. Audit Committee of Listed Registrants
Not applicable.
Item 6. Investments
(a) Not applicable.
(b) Not applicable
Item 7. Disclosure of Proxy Voting Policies and Procedures for Closed-End Management Investment Companies
Not applicable.
Item 8. Portfolio Managers of Closed-End Management Investment Companies
Not applicable.
Item 9. Purchase of Equity Securities by Closed-End Management Investment Company and Affiliated Purchasers
Not applicable.
Item 10. Submission of Matters to a Vote of Security Holders
There were no material changes to the procedures by which shareholders may recommend nominees to the Fidelity California Municipal Trust's Board of Trustees.
Item 11. Controls and Procedures
(a)(i) The President and Treasurer and the Chief Financial Officer have concluded that the Fidelity California Municipal Trust's (the "Trust") disclosure controls and procedures (as defined in Rule 30a-3(c) under the Investment Company Act) provide reasonable assurances that material information relating to the Trust is made known to them by the appropriate persons, based on their evaluation of these controls and procedures as of a date within 90 days of the filing date of this report.
(a)(ii) There was no change in the Trust's internal control over financial reporting (as defined in Rule 30a-3(d) under the Investment Company Act) that occurred during the second fiscal quarter of the period covered by this report that has materially affected, or is reasonably likely to materially affect, the Trust's internal control over financial reporting.
Item 12. Exhibits
(a) | (1) | Not applicable. |
(a) | (2) | Certification pursuant to Rule 30a-2(a) under the Investment Company Act of 1940 (17 CFR 270.30a-2(a)) is filed and attached hereto as Exhibit 99.CERT. |
(a) | (3) | Not applicable. |
(b) |
| Certification pursuant to Rule 30a-2(b) under the Investment Company Act of 1940 (17 CFR 270.30a-2(b)) is furnished and attached hereto as Exhibit 99.906CERT. |
SIGNATURES
Pursuant to the requirements of the Securities Exchange Act of 1934 and the Investment Company Act of 1940, the registrant has duly caused this report to be signed on its behalf by the undersigned, thereunto duly authorized.
Fidelity California Municipal Trust
By: | /s/John R. Hebble |
| John R. Hebble |
| President and Treasurer |
|
|
Date: | October 18, 2011 |
Pursuant to the requirements of the Securities Exchange Act of 1934 and the Investment Company Act of 1940, this report has been signed below by the following persons on behalf of the registrant and in the capacities and on the dates indicated.
By: | /s/John R. Hebble |
| John R. Hebble |
| President and Treasurer |
|
|
Date: | October 18, 2011 |
By: | /s/Christine Reynolds |
| Christine Reynolds |
| Chief Financial Officer |
|
|
Date: | October 18, 2011 |