UNITED STATES
SECURITIES AND EXCHANGE COMMISSION
Washington, D.C. 20549
FORM N-CSR
CERTIFIED SHAREHOLDER REPORT OF REGISTERED
MANAGEMENT INVESTMENT COMPANIES
Investment Company Act file number 811-03725
Fidelity California Municipal Trust
(Exact name of registrant as specified in charter)
245 Summer St., Boston, Massachusetts 02210
(Address of principal executive offices) (Zip code)
Cynthia Lo Bessette, Secretary
245 Summer St.
Boston, Massachusetts 02210
(Name and address of agent for service)
Registrant's telephone number, including area code:
617-563-7000
Date of fiscal year end: | February 28 |
Date of reporting period: | February 28, 2022 |
Item 1.
Reports to Stockholders
Fidelity® California Municipal Income Fund
February 28, 2022
Includes Fidelity and Fidelity Advisor share classes

Contents
Board Approval of Investment Advisory Contracts and Management Fees | |
To view a fund's proxy voting guidelines and proxy voting record for the 12-month period ended June 30, visit http://www.fidelity.com/proxyvotingresults or visit the Securities and Exchange Commission's (SEC) web site at http://www.sec.gov.
You may also call 1-800-544-8544 if you’re an individual investing directly with Fidelity, call 1-800-835-5092 if you’re a plan sponsor or participant with Fidelity as your recordkeeper or call 1-877-208-0098 on institutional accounts or if you’re an advisor or invest through one to request a free copy of the proxy voting guidelines.
Standard & Poor's, S&P and S&P 500 are registered service marks of The McGraw-Hill Companies, Inc. and have been licensed for use by Fidelity Distributors Corporation.
Other third-party marks appearing herein are the property of their respective owners.
All other marks appearing herein are registered or unregistered trademarks or service marks of FMR LLC or an affiliated company. © 2022 FMR LLC. All rights reserved.
This report and the financial statements contained herein are submitted for the general information of the shareholders of the Fund. This report is not authorized for distribution to prospective investors in the Fund unless preceded or accompanied by an effective prospectus.
A fund files its complete schedule of portfolio holdings with the SEC for the first and third quarters of each fiscal year on Form N-PORT. Forms N-PORT are available on the SEC’s web site at http://www.sec.gov. A fund's Forms N-PORT may be reviewed and copied at the SEC’s Public Reference Room in Washington, DC. Information regarding the operation of the SEC's Public Reference Room may be obtained by calling 1-800-SEC-0330.
For a complete list of a fund's portfolio holdings, view the most recent holdings listing, semiannual report, or annual report on Fidelity's web site at http://www.fidelity.com, http://www.institutional.fidelity.com, or http://www.401k.com, as applicable.
NOT FDIC INSURED •MAY LOSE VALUE •NO BANK GUARANTEE
Neither the Fund nor Fidelity Distributors Corporation is a bank.
Note to Shareholders:
Early in 2020, the outbreak and spread of COVID-19 emerged as a public health emergency that had a major influence on financial markets, primarily based on its impact on the global economy and corporate earnings. On March 11, 2020, the World Health Organization declared the COVID-19 outbreak a pandemic, citing sustained risk of further global spread. The pandemic prompted a number of measures to limit the spread of COVID-19, including travel and border restrictions, quarantines, and restrictions on large gatherings. In turn, these resulted in lower consumer activity, diminished demand for a wide range of products and services, disruption in manufacturing and supply chains, and – given the wide variability in outcomes regarding the outbreak – significant market uncertainty and volatility. To help stem the turmoil, the U.S. government took unprecedented action – in concert with the U.S. Federal Reserve and central banks around the world – to help support consumers, businesses, and the broader economy, and to limit disruption to the financial system.
In general, the overall impact of the pandemic lessened in 2021, amid a resilient economy and widespread distribution of three COVID-19 vaccines granted emergency use authorization from the U.S. Food and Drug Administration (FDA) early in the year. Still, the situation remains dynamic, and the extent and duration of its influence on financial markets and the economy is highly uncertain, due in part to a recent spike in cases based on highly contagious variants of the coronavirus.
Extreme events such as the COVID-19 crisis are exogenous shocks that can have significant adverse effects on mutual funds and their investments. Although multiple asset classes may be affected by market disruption, the duration and impact may not be the same for all types of assets. Fidelity is committed to helping you stay informed amid news about COVID-19 and during increased market volatility, and we continue to take extra steps to be responsive to customer needs. We encourage you to visit us online, where we offer ongoing updates, commentary, and analysis on the markets and our funds.
Performance: The Bottom Line
Average annual total return reflects the change in the value of an investment, assuming reinvestment of distributions from dividend income and capital gains (the profits earned upon the sale of securities that have grown in value, if any) and assuming a constant rate of performance each year. The hypothetical investment and the average annual total returns do not reflect the deduction of taxes that a shareholder would pay on fund distributions or the redemption of fund shares. During periods of reimbursement by Fidelity, a fund’s total return will be greater than it would be had the reimbursement not occurred. How a fund did yesterday is no guarantee of how it will do tomorrow.
Average Annual Total Returns
| For the periods ended February 28, 2022 | Past 1 year | Past 5 years | Past 10 years |
| Class A (incl. 4.00% sales charge) | (4.96)% | 1.90% | 2.62% |
| Class M (incl. 4.00% sales charge) | (4.87)% | 1.95% | 2.67% |
| Class C (incl. contingent deferred sales charge) | (2.71)% | 1.97% | 2.42% |
| Fidelity® California Municipal Income Fund | (0.67)% | 3.08% | 3.38% |
| Class I | (0.75)% | 2.99% | 3.29% |
| Class Z | (0.64)% | 3.07% | 3.33% |
Class C shares' contingent deferred sales charges included in the past one year, past five years and past ten years total return figures are 1%, 0% and 0%, respectively.
The initial offering of Class Z shares took place on October 2, 2018. Returns prior to October 2, 2018, are those of Class I.
$10,000 Over 10 Years
Let's say hypothetically that $10,000 was invested in Fidelity® California Municipal Income Fund, a class of the fund, on February 29, 2012.
The chart shows how the value of your investment would have changed, and also shows how the Bloomberg Municipal Bond Index performed over the same period.
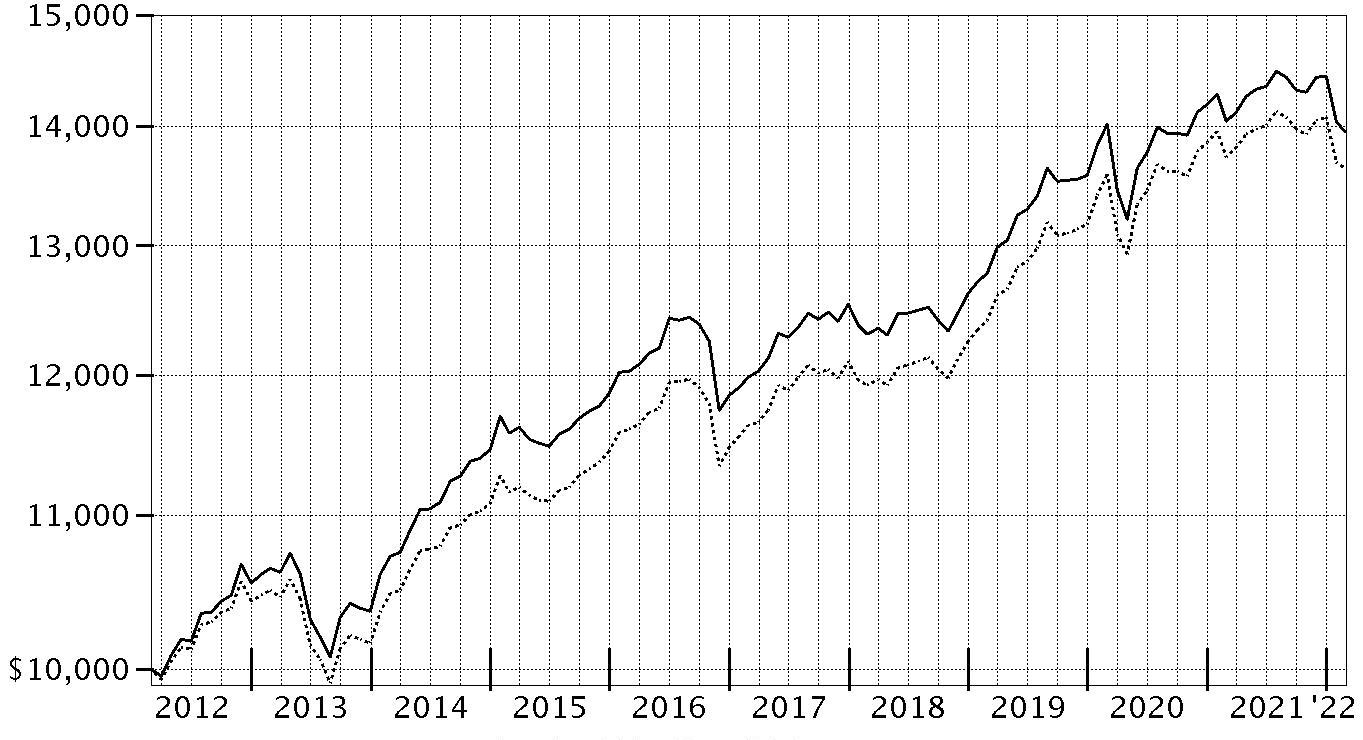
| Period Ending Values | ||
| $13,947 | Fidelity® California Municipal Income Fund | |
| $13,640 | Bloomberg Municipal Bond Index | |
Effective August 24, 2021, all Bloomberg Barclays Indices were re-branded as Bloomberg Indices.
Management's Discussion of Fund Performance
Market Recap: Tax-exempt municipal bonds declined modestly for the 12 months ending February 28, 2022, as expectations for higher policy interest rates, failure to pass the income-tax increases included in the Build Back Better legislation, and the perceived richness of municipals relative to Treasury bonds caused shareholder flows to turn negative in the final months of the period. The Bloomberg Municipal Bond Index returned -0.66% for the 12 months. In 2021, the muni market benefited from an improved fiscal outlook for many municipal issuers, economic optimism and strong demand for tax-exempt munis amid expectations for higher tax rates on upper-income tax brackets. Munis gained from March through July 2021, propelled by better-than-expected tax revenue from many state and local governments and reduced inflation expectations. Munis lost slight ground in August and September, then rose in the fourth quarter, partly driven by newfound clarity regarding infrastructure investment due to the passage of the Infrastructure Investment and Jobs Act, which earmarked $550 billion for new infrastructure spending and limited new tax-exempt bond issuance. Then, in January and February 2022, the muni market experienced rate volatility related to inflation that triggered shareholder outflows. Muni credit fundamentals remained solid overall for the 12 months and, for most issuers, the risk of credit-rating downgrades appeared low.Comments from Co-Portfolio Managers Cormac Cullen, Michael Maka and Elizah McLaughlin: For the fiscal year, the fund's share classes (excluding sales charges, if applicable) returned about -1%, roughly in line, net of fees, with the -0.75% result of the state-specific Bloomberg California Enhanced Municipal Bond Index and the -0.66% return of the Bloomberg Municipal Bond Index. The past 12 months, we continued to focus on longer-term objectives and sought to generate attractive tax-exempt income and competitive risk-adjusted returns. Versus the state index, larger exposure to lower-quality investment-grade munis contributed. These issues, rated BBB and A, outpaced higher-quality bonds amid strong investor demand for higher-yielding securities. It also helped to overweight airport and hospital bonds. They were two of the muni market's top segments the past year, benefiting from a reopening of the economy from COVID-related shutdowns. Conversely, yield-curve positioning slightly detracted versus the state index. The fund held less exposure than the index to longer-term bonds, whose yields rose less than those on shorter-term securities. Lastly, differences in the way fund holdings and index components were priced modestly detracted from the fund's relative result.The views expressed above reflect those of the portfolio manager(s) only through the end of the period as stated on the cover of this report and do not necessarily represent the views of Fidelity or any other person in the Fidelity organization. Any such views are subject to change at any time based upon market or other conditions and Fidelity disclaims any responsibility to update such views. These views may not be relied on as investment advice and, because investment decisions for a Fidelity fund are based on numerous factors, may not be relied on as an indication of trading intent on behalf of any Fidelity fund.
Investment Summary (Unaudited)
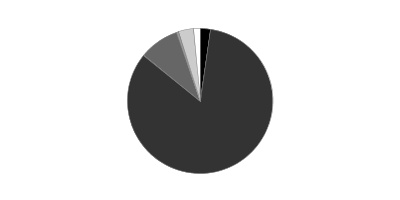
Top Five Sectors as of February 28, 2022
| % of fund's net assets | |
| Transportation | 27.5 |
| General Obligations | 25.0 |
| Health Care | 11.1 |
| Special Tax | 8.8 |
| Education | 7.4 |
Quality Diversification (% of fund's net assets)
| As of February 28, 2022 | ||
| AAA | 2.3% | |
| AA,A | 83.6% | |
| BBB | 8.9% | |
| BB and Below | 0.5% | |
| Not Rated | 3.3% | |
| Short-Term Investments and Net Other Assets | 1.4% | |
We have used ratings from Moody's Investors Service, Inc. Where Moody's® ratings are not available, we have used S&P® ratings. All ratings are as of the date indicated and do not reflect subsequent changes.
Schedule of Investments February 28, 2022
Showing Percentage of Net Assets
| Municipal Bonds - 98.6% | |||
| Principal Amount (000s) | Value (000s) | ||
| California - 98.6% | |||
| ABC Unified School District Series 1997 C: | |||
| 0% 8/1/31 (Nat'l. Pub. Fin. Guarantee Corp. Insured) | $2,810 | $2,290 | |
| 0% 8/1/32 (Nat'l. Pub. Fin. Guarantee Corp. Insured) | 3,900 | 3,086 | |
| Alameda Corridor Trans. Auth. Rev.: | |||
| Series 2013 A: | |||
| 5% 10/1/24 | 11,530 | 12,204 | |
| 5% 10/1/25 | 5,245 | 5,548 | |
| Series 2016 B: | |||
| 5% 10/1/34 | 2,530 | 2,844 | |
| 5% 10/1/35 | 4,000 | 4,494 | |
| Anaheim Pub. Fing. Auth. Lease Rev. (Anaheim Pub. Impt. Proj.): | |||
| Series 1997 A, 6% 9/1/24 (Assured Guaranty Muni. Corp. Insured) | 705 | 752 | |
| Series 1997 C, 0% 9/1/22 (Assured Guaranty Muni. Corp. Insured) | 5,150 | 5,129 | |
| Antelope Valley Cmnty. College District Series A: | |||
| 5% 8/1/31 (Pre-Refunded to 2/15/27 @ 100) | 1,325 | 1,550 | |
| 5% 8/1/32 (Pre-Refunded to 2/15/27 @ 100) | 1,345 | 1,573 | |
| 5% 8/1/33 (Pre-Refunded to 2/15/27 @ 100) | 1,805 | 2,111 | |
| Bay Area Toll Auth. San Francisco Bay Toll Bridge Rev. Bonds: | |||
| Series 2018 A, 2.625%, tender 4/1/26 (a) | 3,000 | 3,101 | |
| Series 2021 A, 2%, tender 4/1/28 (a) | 17,000 | 17,231 | |
| Series B, 2.85%, tender 4/1/25 (a) | 7,000 | 7,231 | |
| Series H, 2.125%, tender 4/1/25 (a) | 4,000 | 4,054 | |
| Bay Area Wtr. Supply & Conservation Agcy. (Cap. Cost Recovery Prepayment Prog.) Series 2023 A: | |||
| 5% 10/1/23 (b) | 2,050 | 2,103 | |
| 5% 10/1/24 (b) | 2,000 | 2,109 | |
| 5% 10/1/25 (b) | 2,250 | 2,438 | |
| 5% 10/1/26 (b) | 2,250 | 2,495 | |
| 5% 10/1/27 (b) | 3,000 | 3,397 | |
| 5% 10/1/28 (b) | 3,000 | 3,451 | |
| 5% 10/1/29 (b) | 1,750 | 2,045 | |
| California County Tobacco Securitization Agcy. Tobacco Settlement Asset-Backed Series 2020 A: | |||
| 5% 6/1/27 | 400 | 457 | |
| 5% 6/1/28 | 420 | 488 | |
| 5% 6/1/29 | 500 | 590 | |
| 5% 6/1/30 | 300 | 359 | |
| 5% 6/1/31 | 300 | 357 | |
| 5% 6/1/32 | 250 | 297 | |
| 5% 6/1/33 | 250 | 296 | |
| California Edl. Facilities Auth. Rev.: | |||
| (Pomona College Proj.) Series 2005 A, 0% 7/1/38 | 3,155 | 2,102 | |
| (Santa Clara Univ. Proj.): | |||
| Series 1999, 5.25% 9/1/26 (AMBAC Insured) | 7,910 | 8,936 | |
| Series 2017 C: | |||
| 5% 4/1/30 | 650 | 779 | |
| 5% 4/1/31 | 890 | 1,063 | |
| 5% 4/1/33 | 1,245 | 1,484 | |
| Series 2018 A: | |||
| 5% 10/1/34 | 760 | 905 | |
| 5% 10/1/36 | 840 | 999 | |
| 5% 10/1/38 | 620 | 736 | |
| 5% 10/1/42 | 4,000 | 4,723 | |
| 5% 10/1/46 | 6,235 | 7,315 | |
| Series 2021 A: | |||
| 5% 4/1/29 | 400 | 489 | |
| 5% 4/1/30 | 425 | 530 | |
| 5% 4/1/31 | 460 | 584 | |
| California Gen. Oblig.: | |||
| Series 2002, 5% 10/1/32 (Nat'l. Pub. Fin. Guarantee Corp. Insured) | 10 | 10 | |
| Series 2004: | |||
| 5.25% 4/1/27 | 5 | 5 | |
| 5.25% 4/1/29 | 5 | 5 | |
| 5.25% 12/1/33 | 105 | 105 | |
| 5.5% 4/1/28 | 5 | 5 | |
| 5.5% 4/1/30 | 25 | 25 | |
| Series 2007: | |||
| 5.625% 5/1/26 | 120 | 120 | |
| 5.75% 5/1/30 | 90 | 90 | |
| Series 2019, 5% 4/1/49 | 2,900 | 3,465 | |
| Series 2020: | |||
| 4% 11/1/39 | 5,500 | 6,319 | |
| 5% 11/1/27 | 2,000 | 2,374 | |
| 5% 3/1/32 | 4,800 | 5,945 | |
| 5% 3/1/33 | 5,000 | 6,199 | |
| Series 2021, 5% 12/1/46 | 1,500 | 1,851 | |
| California Health Facilities Fing. Auth. Rev.: | |||
| (Children's Hosp. of Orange County Proj.) Series 2012 A: | |||
| 5% 11/15/22 | 2,500 | 2,570 | |
| 5% 11/15/23 | 2,000 | 2,055 | |
| (Lucile Salter Packrd Chil Hosp. Proj.) Series 2017 A, 5% 11/15/42 | 1,750 | 2,050 | |
| (Stanford Health Proj.) Series 2017 A: | |||
| 5% 11/15/35 | 3,405 | 3,972 | |
| 5% 11/15/36 | 5,000 | 5,827 | |
| 5% 11/15/37 | 3,000 | 3,493 | |
| Bonds: | |||
| (Providence St. Jospeh Health) Series 2016 B3, 2%, tender 10/1/25 (a) | 8,190 | 8,335 | |
| Series 2019 B, 5%, tender 10/1/27 (a) | 7,700 | 9,005 | |
| Series 2016 A, 5% 11/15/46 (Pre-Refunded to 11/15/25 @ 100) | 3,335 | 3,767 | |
| Series 2017 A: | |||
| 4% 11/1/38 | 5,475 | 6,096 | |
| 5% 11/15/32 | 1,400 | 1,648 | |
| Series 2018 A, 5% 11/15/27 | 500 | 592 | |
| Series 2020 A, 4% 4/1/49 | 7,000 | 7,624 | |
| Series 2021 A, 4% 8/15/48 | 5,000 | 5,623 | |
| California Hsg. Fin. Agcy.: | |||
| Series 2019 A, 4% 3/20/33 | 6,764 | 7,453 | |
| Series 2021 1, 3.5% 11/20/35 | 6,123 | 6,541 | |
| California Infrastructure & Econ. Dev. Series 2019: | |||
| 5% 8/1/44 | 7,610 | 9,057 | |
| 5% 8/1/49 | 11,000 | 13,045 | |
| California Infrastructure and Econ. Dev. Bank Rev.: | |||
| Bonds (Los Angeles County Museum of Art Proj.) Series 2021 A, 1.2%, tender 6/1/28 (a) | 7,000 | 6,751 | |
| Series 2020, 4% 7/1/50 | 7,125 | 7,889 | |
| California Muni. Fin. Auth.: | |||
| (Orange County Civic Ctr. Infrastructure Impt. Prog.) Series 2017 A: | |||
| 5% 6/1/32 | 2,750 | 3,228 | |
| 5% 6/1/33 | 2,320 | 2,721 | |
| 5% 6/1/34 | 5,290 | 6,201 | |
| 5% 6/1/35 | 5,110 | 5,986 | |
| 5% 6/1/36 | 5,830 | 6,825 | |
| 5% 6/1/37 | 3,000 | 3,510 | |
| Series 2019 A, 2.65% 8/1/36 | 9,723 | 9,766 | |
| California Muni. Fin. Auth. Rev.: | |||
| (Biola Univeristy, Inc. Proj.) Series 2017: | |||
| 5% 10/1/25 | 305 | 340 | |
| 5% 10/1/26 | 715 | 813 | |
| 5% 10/1/28 | 2,130 | 2,454 | |
| 5% 10/1/32 | 1,000 | 1,144 | |
| (Channing House Proj.) Series 2017 A: | |||
| 4% 5/15/29 | 2,000 | 2,225 | |
| 4% 5/15/30 | 1,575 | 1,744 | |
| 4% 5/15/31 | 2,150 | 2,373 | |
| 4% 5/15/32 | 1,000 | 1,101 | |
| 5% 5/15/33 | 895 | 1,053 | |
| 5% 5/15/34 | 1,000 | 1,177 | |
| (Institute On Aging Proj.) Series 2017: | |||
| 5% 8/15/27 | 230 | 269 | |
| 5% 8/15/29 | 245 | 287 | |
| 5% 8/15/30 | 225 | 264 | |
| 5% 8/15/33 | 750 | 878 | |
| 5% 8/15/36 | 1,435 | 1,677 | |
| (Pomona College Proj.) Series 2017: | |||
| 4% 1/1/37 (Pre-Refunded to 1/1/28 @ 100) | 1,250 | 1,428 | |
| 4% 1/1/38 (Pre-Refunded to 1/1/28 @ 100) | 1,500 | 1,714 | |
| 5% 1/1/32 (Pre-Refunded to 1/1/28 @ 100) | 1,000 | 1,198 | |
| 5% 1/1/33 (Pre-Refunded to 1/1/28 @ 100) | 500 | 599 | |
| (Univ. of Verne Proj.) Series 2017 A: | |||
| 5% 6/1/27 | 1,000 | 1,171 | |
| 5% 6/1/28 | 1,000 | 1,171 | |
| 5% 6/1/30 | 1,555 | 1,815 | |
| 5% 6/1/32 | 1,000 | 1,166 | |
| 5% 6/1/33 | 1,000 | 1,165 | |
| 5% 6/1/35 | 1,000 | 1,164 | |
| 5% 6/1/43 | 3,750 | 4,332 | |
| Series 2016 A, 5% 11/1/36 (c) | 1,000 | 1,121 | |
| Series 2017 A: | |||
| 5% 7/1/29 | 575 | 670 | |
| 5% 7/1/31 | 1,000 | 1,162 | |
| 5% 7/1/32 | 1,400 | 1,623 | |
| 5% 7/1/33 | 1,000 | 1,158 | |
| 5% 7/1/34 | 1,395 | 1,615 | |
| 5% 7/1/35 | 1,500 | 1,735 | |
| 5% 7/1/36 | 1,500 | 1,732 | |
| 5% 7/1/37 | 1,250 | 1,442 | |
| Series 2017 B: | |||
| 5% 7/1/28 | 1,250 | 1,459 | |
| 5% 7/1/29 | 1,300 | 1,514 | |
| 5% 7/1/30 | 750 | 872 | |
| 5% 7/1/31 | 800 | 929 | |
| 5% 7/1/32 | 1,385 | 1,605 | |
| Series 2017: | |||
| 5% 10/1/27 | 500 | 580 | |
| 5% 10/1/36 | 1,250 | 1,426 | |
| 5% 10/1/37 | 500 | 569 | |
| 5% 10/1/39 | 1,750 | 1,986 | |
| Series 2018: | |||
| 5% 10/1/31 | 200 | 234 | |
| 5% 10/1/32 | 225 | 263 | |
| 5% 10/1/33 | 225 | 263 | |
| 5% 10/1/34 | 225 | 263 | |
| 5% 10/1/35 | 225 | 262 | |
| 5% 10/1/36 | 250 | 291 | |
| 5% 10/1/37 | 550 | 640 | |
| 5% 10/1/38 | 345 | 401 | |
| Series 2019 A: | |||
| 5% 4/1/30 | 3,000 | 3,619 | |
| 5% 4/1/31 | 2,000 | 2,405 | |
| 5% 4/1/32 | 3,000 | 3,601 | |
| 5% 4/1/35 | 1,780 | 2,118 | |
| 5% 4/1/36 | 1,125 | 1,338 | |
| 5% 4/1/37 | 1,475 | 1,752 | |
| 5% 4/1/40 | 2,500 | 2,956 | |
| 5% 4/1/41 | 3,865 | 4,565 | |
| Series 2019: | |||
| 5% 7/1/34 | 825 | 994 | |
| 5% 7/1/39 | 1,000 | 1,194 | |
| 5% 7/1/49 | 2,100 | 2,466 | |
| Series 2021 A, 4% 2/1/51 | 7,500 | 8,266 | |
| Series 2021: | |||
| 4% 10/1/33 | 250 | 277 | |
| 4% 10/1/34 | 420 | 464 | |
| 4% 10/1/37 | 160 | 176 | |
| 4% 10/1/46 | 960 | 1,039 | |
| 4% 10/1/51 | 1,150 | 1,240 | |
| California Muni. Fin. Auth. Solid Waste Disp. Rev. Bonds: | |||
| (Republic Svcs., Inc. Proj.) Series 2021 B, 0.375%, tender 7/15/22 (a)(d) | 7,000 | 6,984 | |
| (Waste Mgmt., Inc. Proj.) Series 2020, 0.18%, tender 3/1/22 (a)(d) | 5,000 | 5,000 | |
| California Muni. Fin. Auth. Sr Living Series 2019: | |||
| 5% 11/15/39 | 1,155 | 1,282 | |
| 5% 11/15/49 | 2,500 | 2,757 | |
| California Muni. Fin. Auth. Student Hsg.: | |||
| (CHF Davis II, L.L.C. Orchard Park Student Hsg. Proj.) Series 2021, 4% 5/15/46 (Build America Mutual Assurance Insured) | 2,000 | 2,178 | |
| (CHF-Davis I, LLC - West Village Student Hsg. Proj.) Series 2018: | |||
| 5% 5/15/26 | 4,210 | 4,727 | |
| 5% 5/15/27 | 4,635 | 5,311 | |
| 5% 5/15/34 | 10,000 | 11,520 | |
| (CHF-Riverside I, LLC - UCR Dundee-Glasgow Student Hsg. Proj.) Series 2018: | |||
| 5% 5/15/33 | 1,345 | 1,552 | |
| 5% 5/15/35 | 1,955 | 2,250 | |
| 5% 5/15/36 | 1,500 | 1,723 | |
| 5% 5/15/43 | 1,500 | 1,706 | |
| California Poll. Cont. Fing. Auth. Solid Waste Disp. Rev. Bonds (Waste Mgmt., Inc. Proj.) Series 2002 C, 3.25%, tender 6/3/24 (a)(d) | 7,500 | 7,739 | |
| California Pub. Fin. Auth. Rev. Series 2021 A: | |||
| 4% 10/15/26 | 415 | 456 | |
| 4% 10/15/27 | 400 | 446 | |
| 4% 10/15/28 | 360 | 406 | |
| California Pub. Fin. Auth. Univ. Hsg. Rev.: | |||
| (Claremont Colleges Proj.) Series 2017 A, 5% 7/1/27 (c) | 1,355 | 1,198 | |
| (NCCD - Claremont Properties LLC - Claremont Colleges Proj.) Series 2017 A, 5% 7/1/47 (c) | 1,500 | 1,258 | |
| California Pub. Works Board Lease Rev.: | |||
| (Coalinga State Hosp. Proj.) Series 2013 E, 5% 6/1/29 | 7,000 | 7,322 | |
| (Various Cap. Projs.): | |||
| Series 2012 A: | |||
| 5% 4/1/24 | 1,000 | 1,004 | |
| 5% 4/1/25 | 5,300 | 5,319 | |
| Series 2012 G, 5% 11/1/25 | 2,500 | 2,570 | |
| Series 2016 D, 4% 4/1/33 | 1,660 | 1,823 | |
| Series 2022 C: | |||
| 4% 8/1/37 (b) | 8,425 | 9,388 | |
| 5% 8/1/35 (b) | 5,010 | 6,062 | |
| 5% 8/1/36 (b) | 5,260 | 6,353 | |
| Series A, 5% 9/1/29 | 1,425 | 1,550 | |
| California State Univ. Rev. Bonds Series 2016 B1, 1.6%, tender 11/1/26 (a) | 5,000 | 5,032 | |
| California Statewide Cmntys. Dev. Auth.: | |||
| Series 2016: | |||
| 5% 5/15/34 | 1,250 | 1,398 | |
| 5% 5/15/35 | 4,725 | 5,279 | |
| 5% 5/15/40 | 2,250 | 2,502 | |
| Series 2017, 5% 5/15/47 | 1,000 | 1,122 | |
| California Statewide Cmntys. Dev. Auth. Hosp. Rev. Series 2018: | |||
| 5% 1/1/33 | 1,595 | 1,861 | |
| 5% 1/1/38 | 3,240 | 3,764 | |
| 5% 1/1/43 | 7,300 | 8,425 | |
| California Statewide Cmntys. Dev. Auth. Rev.: | |||
| (Huntington Memorial Hosp. Proj.) Series 2018: | |||
| 5% 7/1/27 | 245 | 287 | |
| 5% 7/1/28 | 660 | 790 | |
| 5% 7/1/29 | 695 | 827 | |
| 5% 7/1/30 | 730 | 865 | |
| 5% 7/1/31 | 765 | 905 | |
| 5% 7/1/32 | 805 | 951 | |
| 5% 7/1/33 | 845 | 997 | |
| 5% 7/1/34 | 885 | 1,043 | |
| 5% 7/1/35 | 925 | 1,090 | |
| 5% 7/1/36 | 500 | 589 | |
| 5% 7/1/37 | 650 | 765 | |
| 5% 7/1/38 | 500 | 587 | |
| 5% 7/1/43 | 1,250 | 1,458 | |
| 5% 7/1/48 | 9,000 | 10,434 | |
| (Lancer Edl. Student Hsg. Proj.) Series 2019 A: | |||
| 5% 6/1/34 (c) | 375 | 430 | |
| 5% 6/1/39 (c) | 475 | 541 | |
| 5% 6/1/51 (c) | 1,440 | 1,615 | |
| (Viamonte Sr. Living 1 Proj.) Series 2018 B, 3% 7/1/27 | 3,000 | 3,004 | |
| Series 2015: | |||
| 5% 2/1/35 | 1,975 | 2,050 | |
| 5% 2/1/45 | 4,440 | 4,560 | |
| Series 2016: | |||
| 5% 10/1/26 | 1,125 | 1,300 | |
| 5% 10/1/27 | 2,360 | 2,713 | |
| 5% 10/1/28 | 1,230 | 1,408 | |
| 5% 10/1/29 | 675 | 769 | |
| 5% 10/1/30 | 1,100 | 1,251 | |
| 5% 10/1/33 | 1,850 | 2,097 | |
| Series 2017 A, 5% 11/1/32 (c) | 1,135 | 1,295 | |
| Series 2017, 5% 11/1/48 | 795 | 818 | |
| Series 2018 A, 5% 3/1/42 | 7,500 | 8,798 | |
| Series 2021 A: | |||
| 4% 4/1/38 | 2,625 | 2,866 | |
| 4% 4/1/39 | 2,250 | 2,452 | |
| 4% 4/1/40 | 2,500 | 2,718 | |
| 4% 4/1/41 | 1,885 | 2,048 | |
| 4% 4/1/46 | 2,500 | 2,687 | |
| Carlsbad Unified School District: | |||
| Series 2009 B, 6% 5/1/34 (Pre-Refunded to 5/1/24 @ 100) | 5,300 | 5,835 | |
| Series 2017 A: | |||
| 4% 5/1/31 | 1,500 | 1,675 | |
| 4% 5/1/32 | 1,150 | 1,282 | |
| 4% 5/1/33 | 1,375 | 1,531 | |
| 4% 5/1/34 | 1,375 | 1,529 | |
| Chaffey Unified High School District Series 2017 C, 5.25% 8/1/47 | 8,305 | 9,650 | |
| Contra Costa Wtr. District Wtr. Rev. Series 2021 W, 5% 10/1/51 | 7,000 | 8,684 | |
| Corona-Norco Unified School District Series 2013 A: | |||
| 5% 9/1/25 (Pre-Refunded to 9/1/23 @ 100) | 645 | 683 | |
| 5% 9/1/28 (Pre-Refunded to 9/1/23 @ 100) | 1,250 | 1,323 | |
| 5% 9/1/32 (Pre-Refunded to 9/1/23 @ 100) | 1,125 | 1,191 | |
| 5% 9/1/35 (Pre-Refunded to 9/1/23 @ 100) | 585 | 619 | |
| Eastern Muni. Wtr. District Fing. Auth. Series 2020 A: | |||
| 5% 7/1/29 | 250 | 310 | |
| 5% 7/1/30 | 250 | 316 | |
| El Camino Hosp. District Series 2006, 0% 8/1/27 (Nat'l. Pub. Fin. Guarantee Corp. Insured) | 1,425 | 1,285 | |
| El Dorado County Gen. Oblig. Series 2012, 5% 9/1/23 | 1,345 | 1,373 | |
| El Dorado Irr. Distr. Rev. Series 2016 C, 5% 3/1/36 (Pre-Refunded to 3/1/26 @ 100) | 330 | 377 | |
| Elk Grove Fin. Auth. Spl. Tax Rev.: | |||
| (Elk Grove Cfd Laguna Ridge Proj.) Series 2016, 5% 9/1/41 | 4,500 | 4,987 | |
| Series 2015: | |||
| 5% 9/1/27 | 1,940 | 2,169 | |
| 5% 9/1/28 | 4,125 | 4,610 | |
| 5% 9/1/29 | 4,325 | 4,830 | |
| 5% 9/1/30 (Build America Mutual Assurance Insured) | 1,135 | 1,273 | |
| 5% 9/1/31 (Build America Mutual Assurance Insured) | 1,750 | 1,962 | |
| 5% 9/1/32 (Build America Mutual Assurance Insured) | 1,615 | 1,809 | |
| Series 2016: | |||
| 5% 9/1/27 | 1,875 | 2,107 | |
| 5% 9/1/28 | 1,500 | 1,682 | |
| 5% 9/1/29 | 2,000 | 2,240 | |
| 5% 9/1/30 | 1,720 | 1,925 | |
| 5% 9/1/31 | 2,500 | 2,793 | |
| Elk Grove Unified School District Spl. Tax (Cmnty. Facilities District #1 Proj.) Series 1995, 6.5% 12/1/24 (AMBAC Insured) | 1,765 | 1,908 | |
| Empire Union School District Spl. Tax (Cmnty. Facilities District No. 1987 Proj.) Series 2002 A: | |||
| 0% 10/1/24 (AMBAC Insured) | 1,665 | 1,589 | |
| 0% 10/1/25 (AMBAC Insured) | 1,665 | 1,553 | |
| Escondido Union High School District Series 2008 A: | |||
| 0% 8/1/33 (Assured Guaranty Corp. Insured) | 5,655 | 4,309 | |
| 0% 8/1/34 (Assured Guaranty Corp. Insured) | 3,500 | 2,587 | |
| Foothill-De Anza Cmnty. College District Series 1999 B, 0% 8/1/24 (Nat'l. Pub. Fin. Guarantee Corp. Insured) | 5,000 | 4,842 | |
| Foothill/Eastern Trans. Corridor Agcy. Toll Road Rev. Series 2015 A, 0% 1/15/33 (Assured Guaranty Muni. Corp. Insured) | 9,000 | 6,791 | |
| Fullerton Pub. Fing. Auth. Series 2021 A: | |||
| 4% 2/1/32 | 520 | 592 | |
| 4% 2/1/33 | 250 | 284 | |
| 4% 2/1/34 | 430 | 487 | |
| 4% 2/1/36 | 600 | 678 | |
| 4% 2/1/41 | 2,530 | 2,837 | |
| 4% 2/1/46 | 2,055 | 2,283 | |
| 4% 2/1/51 | 2,500 | 2,766 | |
| Golden State Tobacco Securitization Corp. Tobacco Settlement Rev.: | |||
| Series 2005 A, 0% 6/1/27 (Escrowed to Maturity) | 6,790 | 6,240 | |
| Series 2013 A, 5% 6/1/30 (Pre-Refunded to 6/1/23 @ 100) | 6,000 | 6,298 | |
| Series 2015 A, 5% 6/1/33 (Pre-Refunded to 6/1/25 @ 100) | 2,355 | 2,626 | |
| Series 2017 A1: | |||
| 5% 6/1/22 (Escrowed to Maturity) | 2,000 | 2,021 | |
| 5% 6/1/23 (Escrowed to Maturity) | 2,000 | 2,099 | |
| 5% 6/1/24 (Escrowed to Maturity) | 3,000 | 3,245 | |
| 5% 6/1/25 (Escrowed to Maturity) | 3,050 | 3,398 | |
| Series A, 0% 6/1/24 (Escrowed to Maturity) | 8,030 | 7,800 | |
| Grossmont-Cuyamaca Cmnty. College District Series 2021 C, 4% 8/1/46 | 4,250 | 4,870 | |
| Irvine Reassessment District 12-1 Ltd. Oblig.: | |||
| Series 2012: | |||
| 5% 9/2/23 | 1,000 | 1,020 | |
| 5% 9/2/25 | 500 | 509 | |
| Series 2013: | |||
| 5% 9/2/24 | 825 | 872 | |
| 5% 9/2/26 | 800 | 845 | |
| Series 2019: | |||
| 4% 9/2/38 | 1,000 | 1,127 | |
| 4% 9/2/39 | 1,000 | 1,125 | |
| 5% 9/2/44 | 2,545 | 3,028 | |
| Series 2021: | |||
| 4% 9/2/35 (Build America Mutual Assurance Insured) | 400 | 466 | |
| 4% 9/2/36 (Build America Mutual Assurance Insured) | 250 | 290 | |
| 4% 9/2/37 (Build America Mutual Assurance Insured) | 250 | 290 | |
| 4% 9/2/38 (Build America Mutual Assurance Insured) | 350 | 406 | |
| 4% 9/2/39 (Build America Mutual Assurance Insured) | 500 | 579 | |
| 4% 9/2/40 (Build America Mutual Assurance Insured) | 1,025 | 1,184 | |
| 4% 9/2/46 (Build America Mutual Assurance Insured) | 1,350 | 1,540 | |
| La Quinta Redev. Agcy. (La Quinta Redev. Proj. Areas No. 1 and 2) Series 2014 A: | |||
| 5% 9/1/25 (Pre-Refunded to 9/1/24 @ 100) | 2,000 | 2,184 | |
| 5% 9/1/26 (Pre-Refunded to 9/1/24 @ 100) | 1,860 | 2,031 | |
| 5% 9/1/27 (Pre-Refunded to 9/1/24 @ 100) | 1,725 | 1,883 | |
| 5% 9/1/28 (Pre-Refunded to 9/1/24 @ 100) | 1,000 | 1,092 | |
| 5% 9/1/29 (Pre-Refunded to 9/1/24 @ 100) | 1,250 | 1,365 | |
| Ladera Ranch Cmnty. Facilities District 2004-1 Series 2014 A: | |||
| 5% 8/15/27 | 1,765 | 1,806 | |
| 5% 8/15/28 | 1,960 | 2,005 | |
| 5% 8/15/29 | 4,225 | 4,322 | |
| 5% 8/15/30 | 4,555 | 4,659 | |
| Long Beach Bond Fin. Auth. Lease Series 2012 A: | |||
| 5% 8/1/24 | 1,000 | 1,018 | |
| 5% 8/1/25 | 1,000 | 1,018 | |
| 5% 8/1/26 | 1,000 | 1,017 | |
| 5% 8/1/27 | 1,000 | 1,017 | |
| 5% 8/1/28 | 1,000 | 1,017 | |
| 5% 8/1/29 | 1,000 | 1,017 | |
| 5% 8/1/30 | 1,000 | 1,017 | |
| 5% 8/1/31 | 1,000 | 1,017 | |
| Long Beach Cmnty. College Series 2008 A: | |||
| 0% 6/1/28 (Assured Guaranty Muni. Corp. Insured) | 2,995 | 2,637 | |
| 0% 6/1/31 (Assured Guaranty Muni. Corp. Insured) | 8,285 | 6,686 | |
| Long Beach Hbr. Rev.: | |||
| Series 2017 A: | |||
| 5% 5/15/26 (d) | 1,110 | 1,260 | |
| 5% 5/15/27 (d) | 2,000 | 2,324 | |
| 5% 5/15/29 (d) | 1,350 | 1,566 | |
| 5% 5/15/30 (d) | 1,300 | 1,508 | |
| 5% 5/15/31 (d) | 2,400 | 2,782 | |
| 5% 5/15/32 (d) | 1,760 | 2,040 | |
| 5% 5/15/33 (d) | 1,350 | 1,564 | |
| 5% 5/15/34 (d) | 1,650 | 1,912 | |
| 5% 5/15/35 (d) | 2,500 | 2,894 | |
| 5% 5/15/36 (d) | 3,000 | 3,471 | |
| 5% 5/15/37 (d) | 2,755 | 3,186 | |
| Series 2019 A, 5% 5/15/44 | 10,000 | 12,103 | |
| Long Beach Unified School District Series 2009: | |||
| 5.25% 8/1/33 | 410 | 412 | |
| 5.75% 8/1/33 | 170 | 171 | |
| Los Angeles Cmnty. College District Series 2017 J, 4% 8/1/33 | 2,500 | 2,795 | |
| Los Angeles County Ctfs. of Prtn. (Disney Concert Hall Parking Garage Proj.) Series 2012, 5% 3/1/23 | 1,600 | 1,662 | |
| Los Angeles County Pub. Works Fing. Auth. Lease Rev. Series 2022 G: | |||
| 5% 12/1/41 (b) | 6,875 | 8,456 | |
| 5% 12/1/42 (b) | 2,500 | 3,068 | |
| Los Angeles County Reg'l. Fin. Auth. (MonteCedro, Inc. Proj.) Series 2014 A, 5% 11/15/44 | 2,250 | 2,303 | |
| Los Angeles Dept. Arpt. Rev.: | |||
| Series 2015 A: | |||
| 5% 5/15/24 (d) | 795 | 858 | |
| 5% 5/15/25 (d) | 2,250 | 2,490 | |
| 5% 5/15/26 (d) | 1,715 | 1,897 | |
| 5% 5/15/27 (d) | 1,250 | 1,378 | |
| 5% 5/15/28 (d) | 1,260 | 1,383 | |
| 5% 5/15/29 (d) | 1,575 | 1,726 | |
| 5% 5/15/30 (d) | 1,400 | 1,532 | |
| Series 2015 D: | |||
| 5% 5/15/23 (d) | 1,390 | 1,454 | |
| 5% 5/15/26 (d) | 1,100 | 1,216 | |
| 5% 5/15/28 (d) | 1,950 | 2,140 | |
| 5% 5/15/29 (d) | 2,550 | 2,795 | |
| 5% 5/15/30 (d) | 2,000 | 2,190 | |
| 5% 5/15/31 (d) | 2,540 | 2,780 | |
| 5% 5/15/41 (d) | 3,240 | 3,546 | |
| Series 2016 B: | |||
| 5% 5/15/22 (d) | 1,000 | 1,009 | |
| 5% 5/15/26 (d) | 1,600 | 1,810 | |
| 5% 5/15/27 (d) | 1,000 | 1,124 | |
| 5% 5/15/36 (d) | 3,600 | 4,025 | |
| 5% 5/15/41 (d) | 3,750 | 4,186 | |
| Series 2017 B: | |||
| 5% 5/15/23 (d) | 1,000 | 1,045 | |
| 5% 5/15/24 (d) | 1,905 | 2,050 | |
| 5% 5/15/25 (d) | 1,750 | 1,934 | |
| Series 2018 B, 5% 5/15/31 (d) | 7,350 | 8,592 | |
| Series 2018 D, 5% 5/15/48 (d) | 2,000 | 2,319 | |
| Series 2018, 5% 5/15/43 (d) | 10,000 | 11,673 | |
| Series 2019 A, 5% 5/15/49 (d) | 4,950 | 5,735 | |
| Series 2019 D, 5% 5/15/49 (d) | 5,625 | 6,487 | |
| Series A: | |||
| 5% 5/15/30 (d) | 700 | 800 | |
| 5% 5/15/51 (d) | 12,270 | 14,631 | |
| Series B, 5% 5/15/48 | 6,200 | 7,546 | |
| Series F: | |||
| 4% 5/15/49 (d) | 5,000 | 5,385 | |
| 5% 5/15/30 (d) | 2,480 | 2,953 | |
| 5% 5/15/34 (d) | 950 | 1,122 | |
| 5% 5/15/44 (d) | 13,685 | 15,951 | |
| Los Angeles Dept. of Wtr. & Pwr. Rev.: | |||
| Series 2015 A: | |||
| 5% 7/1/28 | 3,400 | 3,750 | |
| 5% 7/1/30 | 6,000 | 6,614 | |
| Series 2016 B, 5% 7/1/42 | 4,595 | 5,152 | |
| Series 2021 B, 5% 7/1/51 | 15,000 | 18,204 | |
| Series B, 5% 7/1/50 | 17,155 | 20,717 | |
| Los Angeles Dept. of Wtr. & Pwr. Wtrwks. Rev.: | |||
| Series 2020 A: | |||
| 5% 7/1/47 | 3,030 | 3,686 | |
| 5% 7/1/50 | 1,255 | 1,523 | |
| Series 2021 B, 5% 7/1/51 | 3,370 | 4,105 | |
| Los Angeles Hbr. Dept. Rev. Series 2016 A, 5% 8/1/24 (d) | 1,500 | 1,624 | |
| Los Angeles Muni. Impt. Corp. Lease Rev.: | |||
| Series 2014 A: | |||
| 5% 5/1/24 (Escrowed to Maturity) | 325 | 351 | |
| 5% 5/1/25 (Pre-Refunded to 5/1/24 @ 100) | 540 | 583 | |
| 5% 5/1/29 (Pre-Refunded to 5/1/24 @ 100) | 500 | 540 | |
| 5% 5/1/30 (Pre-Refunded to 5/1/24 @ 100) | 1,000 | 1,079 | |
| 5% 5/1/31 (Pre-Refunded to 5/1/24 @ 100) | 1,555 | 1,678 | |
| Series 2014 B: | |||
| 5% 5/1/24 (Escrowed to Maturity) | 200 | 216 | |
| 5% 5/1/25 (Pre-Refunded to 5/1/24 @ 100) | 225 | 243 | |
| 5% 5/1/29 (Pre-Refunded to 5/1/24 @ 100) | 500 | 540 | |
| 5% 5/1/30 (Pre-Refunded to 5/1/24 @ 100) | 400 | 432 | |
| 5% 5/1/31 (Pre-Refunded to 5/1/24 @ 100) | 400 | 432 | |
| Series 2016 B, 5% 11/1/36 | 1,500 | 1,722 | |
| Los Angeles Unified School District: | |||
| Series C, 4% 7/1/44 | 5,000 | 5,635 | |
| Series2020, 4% 7/1/44 | 18,785 | 21,169 | |
| Los Angeles Wastewtr. Sys. Rev. Series 2012 B, 5% 6/1/28 | 4,800 | 4,851 | |
| Manhattan Beach Unified School District Series 2020 B, 4% 9/1/45 | 3,500 | 4,011 | |
| Merced Union High School District Series A, 0% 8/1/22 (Nat'l. Pub. Fin. Guarantee Corp. Insured) | 1,100 | 1,096 | |
| Middle Fork Proj. Fin. Auth. Series 2020: | |||
| 5% 4/1/27 | 190 | 219 | |
| 5% 4/1/28 | 3,350 | 3,932 | |
| Modesto Elementary School District, Stanislaus County Series A, 0% 8/1/25 (Nat'l. Pub. Fin. Guarantee Corp. Insured) | 2,800 | 2,640 | |
| Modesto Gen. Oblig. Ctfs. of Prtn.: | |||
| (Cmnty. Ctr. Refing. Proj.) Series A, 5% 11/1/23 (AMBAC Insured) | 640 | 640 | |
| (Golf Course Refing. Proj.) Series B, 5% 11/1/23 (Nat'l. Pub. Fin. Guarantee Corp. Insured) | 415 | 420 | |
| Modesto Irrigation District Fing. Auth. Series 2019 A, 5% 10/1/39 | 1,500 | 1,823 | |
| Monrovia Unified School District Series B, 0% 8/1/33 (Nat'l. Pub. Fin. Guarantee Corp. Insured) | 2,625 | 1,987 | |
| Montebello Pub. Fing. Auth. (Montebello Home2 Suites by Hilton Hotel Proj.) Series 2016 A: | |||
| 5% 6/1/30 | 1,640 | 1,794 | |
| 5% 6/1/31 | 500 | 546 | |
| 5% 6/1/32 | 500 | 546 | |
| 5% 6/1/33 | 1,800 | 1,963 | |
| 5% 6/1/34 | 1,345 | 1,465 | |
| 5% 6/1/35 | 1,895 | 2,061 | |
| 5% 6/1/36 | 2,000 | 2,173 | |
| 5% 6/1/41 | 6,155 | 6,688 | |
| Moreland School District Series 2003 B, 0% 8/1/27 (Nat'l. Pub. Fin. Guarantee Corp. Insured) | 1,485 | 1,351 | |
| Mount Diablo Unified School District Series 2022 B: | |||
| 4% 8/1/22 (b) | 1,345 | 1,355 | |
| 4% 8/1/23 (b) | 1,655 | 1,714 | |
| 4% 8/1/35 (b) | 4,000 | 4,605 | |
| 4% 8/1/36 (b) | 3,650 | 4,194 | |
| 4% 6/1/37 (b) | 1,625 | 1,866 | |
| Muroc Jt Unified School District Series 2016 B, 5.25% 8/1/47 | 4,375 | 5,298 | |
| Murrieta Pub. Fing. Auth. Spl. Tax Series 2012: | |||
| 5% 9/1/23 | 1,650 | 1,682 | |
| 5% 9/1/25 | 1,000 | 1,018 | |
| 5% 9/1/26 | 1,155 | 1,176 | |
| Murrieta Valley Unified School District: | |||
| Series 2008, 0% 9/1/32 (Assured Guaranty Muni. Corp. Insured) | 5,000 | 3,940 | |
| Series 2015: | |||
| 4% 9/1/24 (Assured Guaranty Muni. Corp. Insured) | 330 | 352 | |
| 5% 9/1/25 (Assured Guaranty Muni. Corp. Insured) | 680 | 750 | |
| 5% 9/1/26 (Assured Guaranty Muni. Corp. Insured) | 1,500 | 1,657 | |
| 5% 9/1/26 (Pre-Refunded to 3/1/25 @ 100) | 500 | 554 | |
| 5% 9/1/27 (Pre-Refunded to 3/1/25 @ 100) | 455 | 504 | |
| North City West School Facilities Fing. Auth. Spl. Tax Series 2005 B, 5.25% 9/1/23 (AMBAC Insured) | 1,530 | 1,621 | |
| Northern California Energy Auth. Bonds Series 2018, 4%, tender 7/1/24 (a) | 10,250 | 10,771 | |
| Northern California Transmission Agcy. Rev. Series 2016 A: | |||
| 5% 5/1/36 | 2,390 | 2,713 | |
| 5% 5/1/38 | 2,265 | 2,567 | |
| 5% 5/1/39 | 1,500 | 1,699 | |
| Norwalk-Mirada Unified School District Series 2009 D, 0% 8/1/33 (Assured Guaranty Muni. Corp. Insured) | 5,755 | 4,376 | |
| Oakland Gen. Oblig. Series 2015 A: | |||
| 5% 1/15/28 | 1,225 | 1,371 | |
| 5% 1/15/29 | 1,650 | 1,842 | |
| 5% 1/15/30 | 1,665 | 1,858 | |
| 5% 1/15/31 | 1,520 | 1,695 | |
| Oakland Unified School District Alameda County Series 2015 A: | |||
| 5% 8/1/30 | 1,250 | 1,395 | |
| 5% 8/1/30 (Assured Guaranty Muni. Corp. Insured) | 1,570 | 1,756 | |
| 5% 8/1/40 (Pre-Refunded to 8/1/25 @ 100) | 3,500 | 3,915 | |
| Oceanside Unified School District Series A, 0% 8/1/31 (Assured Guaranty Corp. Insured) | 5,000 | 4,025 | |
| Ontario Int'l. Arpt. Auth.: | |||
| Series 2021 A, 5% 5/15/46 (Assured Guaranty Muni. Corp. Insured) | 4,315 | 5,268 | |
| Series 2021 B: | |||
| 4% 5/15/35 (Assured Guaranty Muni. Corp. Insured) (d) | 1,120 | 1,247 | |
| 4% 5/15/36 (Assured Guaranty Muni. Corp. Insured) (d) | 775 | 862 | |
| 4% 5/15/37 (Assured Guaranty Muni. Corp. Insured) (d) | 1,700 | 1,890 | |
| 4% 5/15/38 (Assured Guaranty Muni. Corp. Insured) (d) | 800 | 887 | |
| 4% 5/15/39 (Assured Guaranty Muni. Corp. Insured) (d) | 555 | 614 | |
| 4% 5/15/40 (Assured Guaranty Muni. Corp. Insured) (d) | 685 | 757 | |
| Orange County San District Waste Series 2016 A: | |||
| 5% 2/1/35 | 5,490 | 6,212 | |
| 5% 2/1/36 | 6,630 | 7,492 | |
| Oxnard Union High School District Gen. Oblig. Series B, 5% 8/1/45 | 5,000 | 5,977 | |
| Palmdale Elementary School District Spl. Tax Series 2017 A, 5% 8/1/41 (Assured Guaranty Muni. Corp. Insured) | 1,275 | 1,467 | |
| Palomar Cmnty. College District Series 2017, 5% 8/1/35 | 1,410 | 1,653 | |
| Palomar Health Rev.: | |||
| Series 2016, 5% 11/1/36 | 12,970 | 14,718 | |
| Series 2017, 5% 11/1/42 | 3,000 | 3,455 | |
| Palomar Pomerado Health Series 2004 A, 0% 8/1/26 (Nat'l. Pub. Fin. Guarantee Corp. Insured) | 4,870 | 4,425 | |
| Perris Union High School District Series A, 4% 9/1/48 (Assured Guaranty Muni. Corp. Insured) | 11,000 | 12,376 | |
| Pomona Calif Wtsw Rev. (Wtr. Facilities Proj.) Series 2017, 4% 5/1/37 | 4,335 | 4,756 | |
| Port of Oakland Rev.: | |||
| Series 2012: | |||
| 5% 5/1/22 (d) | 3,520 | 3,545 | |
| 5% 5/1/22 (Escrowed to Maturity) (d) | 655 | 660 | |
| Series 2017 D: | |||
| 5% 11/1/25 (d) | 5,135 | 5,770 | |
| 5% 11/1/26 (d) | 2,285 | 2,631 | |
| 5% 11/1/27 (d) | 4,000 | 4,707 | |
| 5% 11/1/28 (d) | 4,925 | 5,765 | |
| 5% 11/1/29 (d) | 4,200 | 4,911 | |
| Series 2021 H, 5% 5/1/28 (d) | 2,125 | 2,520 | |
| Poway California Redev. Agcy. Successor Series A: | |||
| 5% 6/15/27 | 2,385 | 2,797 | |
| 5% 6/15/28 | 2,190 | 2,466 | |
| 5% 12/15/28 | 2,200 | 2,473 | |
| 5% 12/15/29 | 4,825 | 5,424 | |
| 5% 12/15/30 | 3,500 | 4,376 | |
| Poway Unified School District: | |||
| (District #2007-1 School Facilities Proj.) Series 2008 A, 0% 8/1/32 | 13,070 | 10,267 | |
| Series 2011, 0% 8/1/46 | 10,150 | 4,544 | |
| Series B: | |||
| 0% 8/1/33 | 4,955 | 3,780 | |
| 0% 8/1/35 | 9,000 | 6,454 | |
| 0% 8/1/37 | 6,325 | 4,256 | |
| 0% 8/1/41 | 5,130 | 2,989 | |
| Poway Unified School District Pub. Fing.: | |||
| Series 2013, 5% 9/15/26 | 930 | 986 | |
| Series 2015 A: | |||
| 5% 9/1/30 | 1,495 | 1,641 | |
| 5% 9/1/31 | 1,260 | 1,381 | |
| 5% 9/1/32 | 1,795 | 1,966 | |
| 5% 9/1/33 | 2,740 | 3,000 | |
| 5% 9/1/34 | 1,225 | 1,341 | |
| 5% 9/1/35 | 1,580 | 1,728 | |
| 5% 9/1/36 | 3,395 | 3,711 | |
| Rancho Cucamonga Redev. Agcy. (Rancho Redev. Proj.) Series 2014: | |||
| 5% 9/1/25 (Assured Guaranty Muni. Corp. Insured) | 1,775 | 1,932 | |
| 5% 9/1/26 (Assured Guaranty Muni. Corp. Insured) | 1,350 | 1,470 | |
| 5% 9/1/27 (Assured Guaranty Muni. Corp. Insured) | 1,700 | 1,850 | |
| 5% 9/1/28 (Assured Guaranty Muni. Corp. Insured) | 1,700 | 1,850 | |
| 5% 9/1/29 (Assured Guaranty Muni. Corp. Insured) | 1,850 | 2,015 | |
| Richmond Wastewtr. Rev. Series 2019 A: | |||
| 4% 8/1/49 | 4,000 | 4,489 | |
| 5% 8/1/39 | 390 | 476 | |
| 5% 8/1/44 | 2,135 | 2,588 | |
| Riverside County Trans. Commission Toll Rev. Series 2021 B1, 4% 6/1/46 | 5,500 | 6,076 | |
| Riverside Elec. Rev. Series 2019 A, 5% 10/1/43 | 3,840 | 4,627 | |
| Riverside Swr. Rev. Series 2015 A: | |||
| 5% 8/1/26 | 1,710 | 1,915 | |
| 5% 8/1/27 | 1,725 | 1,927 | |
| 5% 8/1/28 | 1,935 | 2,160 | |
| 5% 8/1/29 | 2,330 | 2,600 | |
| Rocklin Unified School District Series 2002: | |||
| 0% 8/1/23 (Nat'l. Pub. Fin. Guarantee Corp. Insured) | 2,610 | 2,567 | |
| 0% 8/1/24 (Nat'l. Pub. Fin. Guarantee Corp. Insured) | 6,370 | 6,150 | |
| 0% 8/1/25 (Nat'l. Pub. Fin. Guarantee Corp. Insured) | 6,725 | 6,362 | |
| 0% 8/1/26 (Nat'l. Pub. Fin. Guarantee Corp. Insured) | 5,365 | 4,969 | |
| 0% 8/1/27 (Nat'l. Pub. Fin. Guarantee Corp. Insured) | 6,500 | 5,886 | |
| Roseville City School District Series 2002 A: | |||
| 0% 8/1/25 (Nat'l. Pub. Fin. Guarantee Corp. Insured) | 1,745 | 1,643 | |
| 0% 8/1/27 (Nat'l. Pub. Fin. Guarantee Corp. Insured) | 1,940 | 1,741 | |
| Sacramento City Fing. Auth. Rev. Series A, 0% 12/1/26 (Nat'l. Pub. Fin. Guarantee Corp. Insured) | 6,000 | 5,448 | |
| Sacramento City Unified School District: | |||
| Series 2007, 0% 7/1/28 (Assured Guaranty Muni. Corp. Insured) | 1,450 | 1,265 | |
| Series 2021 G: | |||
| 4% 8/1/44 (Assured Guaranty Muni. Corp. Insured) | 2,250 | 2,525 | |
| 4% 8/1/49 (Assured Guaranty Muni. Corp. Insured) | 4,000 | 4,452 | |
| Sacramento County Arpt. Sys. Rev.: | |||
| Series 2016 B: | |||
| 5% 7/1/35 | 790 | 895 | |
| 5% 7/1/36 | 2,000 | 2,265 | |
| 5% 7/1/41 | 6,430 | 7,263 | |
| Series 2018 C: | |||
| 5% 7/1/34 (d) | 4,000 | 4,623 | |
| 5% 7/1/35 (d) | 5,000 | 5,774 | |
| 5% 7/1/36 (d) | 7,500 | 8,655 | |
| Series 2018 E: | |||
| 5% 7/1/33 | 1,315 | 1,551 | |
| 5% 7/1/34 | 1,000 | 1,178 | |
| 5% 7/1/35 | 1,270 | 1,495 | |
| Sacramento Muni. Util. District Elec. Rev.: | |||
| Series 2012 Y, 5% 8/15/27 | 2,800 | 2,854 | |
| Series 2013 A, 5% 8/15/41 | 2,810 | 2,957 | |
| Series 2016 D, 5% 8/15/28 | 2,500 | 3,029 | |
| Sacramento TOT Rev. Series A: | |||
| 5% 6/1/34 | 700 | 817 | |
| 5% 6/1/35 | 2,065 | 2,407 | |
| 5% 6/1/36 | 2,215 | 2,580 | |
| 5% 6/1/37 | 2,405 | 2,799 | |
| 5% 6/1/38 | 1,240 | 1,441 | |
| 5% 6/1/43 | 6,000 | 6,929 | |
| San Bernardino Cmnty. College District Series 2019 A, 4% 8/1/44 (Pre-Refunded to 8/16/27 @ 100) | 2,000 | 2,265 | |
| San Bernardino County Ctfs. of Prtn.: | |||
| (Cap. Facilities Proj.) Series B, 6.875% 8/1/24 (Escrowed to Maturity) | 5,320 | 5,749 | |
| (Med. Ctr. Fing. Proj.) Series 1994, 5.5% 8/1/22 (Escrowed to Maturity) | 5,140 | 5,243 | |
| San Bernardino Unified School District Gen. Oblig. Series 2013 A: | |||
| 5% 8/1/23 (Escrowed to Maturity) | 1,100 | 1,159 | |
| 5% 8/1/24 (Escrowed to Maturity) | 1,250 | 1,320 | |
| San Diego Assoc. of Governments (Mid-Coast Corridor Transit Proj.) Series 2019 A, 1.8% 11/15/27 | 7,505 | 7,575 | |
| San Diego California Assn. Govts. South Bay (South Bay Expressway Proj.) Series 2017 A: | |||
| 5% 7/1/29 | 1,660 | 1,942 | |
| 5% 7/1/31 | 2,000 | 2,341 | |
| 5% 7/1/33 | 1,735 | 2,031 | |
| 5% 7/1/34 | 1,380 | 1,615 | |
| 5% 7/1/35 | 1,500 | 1,755 | |
| 5% 7/1/36 | 1,980 | 2,317 | |
| 5% 7/1/38 | 2,000 | 2,339 | |
| 5% 7/1/42 | 5,000 | 5,835 | |
| San Diego County Reg'l. Arpt. Auth. Arpt. Rev.: | |||
| (Sub Lien Proj.): | |||
| Series 2017 B: | |||
| 5% 7/1/24 (d) | 1,000 | 1,076 | |
| 5% 7/1/25 (d) | 515 | 568 | |
| 5% 7/1/27 (d) | 500 | 574 | |
| 5% 7/1/28 (d) | 1,000 | 1,145 | |
| 5% 7/1/29 (d) | 1,725 | 1,974 | |
| 5% 7/1/30 (d) | 2,915 | 3,336 | |
| 5% 7/1/31 (d) | 1,250 | 1,431 | |
| 5% 7/1/32 (d) | 1,300�� | 1,488 | |
| 5% 7/1/33 (d) | 1,330 | 1,522 | |
| 5% 7/1/34 (d) | 1,000 | 1,141 | |
| 5% 7/1/36 (d) | 1,500 | 1,705 | |
| 5% 7/1/37 (d) | 750 | 852 | |
| 5% 7/1/47 (d) | 5,250 | 5,921 | |
| Series A, 5% 7/1/26 (d) | 690 | 777 | |
| Series 2000 B, 5% 7/1/22 | 4,000 | 4,057 | |
| Series 2013 B, 5% 7/1/38 (Pre-Refunded to 7/1/23 @ 100) (d) | 7,000 | 7,358 | |
| Series 2017A, 5% 7/1/42 | 5,810 | 6,690 | |
| Series 2019 B: | |||
| 5% 7/1/28 (d) | 820 | 955 | |
| 5% 7/1/49 (d) | 5,050 | 5,795 | |
| Series 2020 B: | |||
| 5% 7/1/29 | 2,720 | 3,288 | |
| 5% 7/1/30 | 2,550 | 3,137 | |
| Series 2020 C, 5% 7/1/23 (d) | 585 | 614 | |
| San Diego Pub. Facilities Fing. Auth. Lease Rev.: | |||
| (Cap. Impt. Proj.) Series 2012 A, 5% 4/15/23 | 1,710 | 1,718 | |
| Series 2015 A, 5% 10/15/44 | 4,005 | 4,423 | |
| Series 2016: | |||
| 5% 10/15/29 | 2,000 | 2,237 | |
| 5% 10/15/30 | 1,000 | 1,118 | |
| 5% 10/15/31 | 650 | 726 | |
| San Diego Unified School District: | |||
| (Convention Ctr. Proj.) Series 2012, 0% 7/1/45 | 4,770 | 2,401 | |
| Series 2008 C, 0% 7/1/37 | 1,300 | 873 | |
| Series 2008 E, 0% 7/1/47 (e) | 8,700 | 8,224 | |
| Series A, 4% 7/1/50 | 5,000 | 5,604 | |
| San Francisco Bay Area Rapid Transit District Sales Tax Rev. Series 2019 A: | |||
| 4% 7/1/38 | 3,040 | 3,378 | |
| 4% 7/1/39 | 2,075 | 2,302 | |
| San Francisco City & County Arpts. Commission Int'l. Arpt. Rev.: | |||
| Series 2014 A, 5% 5/1/40 (d) | 1,865 | 1,991 | |
| Series 2016 A: | |||
| 5% 5/1/28 | 2,280 | 2,587 | |
| 5% 5/1/29 | 1,225 | 1,390 | |
| 5% 5/1/30 | 330 | 375 | |
| 5% 5/1/32 | 1,000 | 1,134 | |
| Series 2016 B: | |||
| 5% 5/1/41 (d) | 9,695 | 10,813 | |
| 5% 5/1/46 (d) | 23,000 | 25,639 | |
| Series 2017 A, 5% 5/1/42 (d) | 3,205 | 3,624 | |
| Series 2017 D, 5% 5/1/25 (d) | 2,250 | 2,473 | |
| Series 2018 D, 5% 5/1/43 (d) | 1,000 | 1,148 | |
| Series 2019 A: | |||
| 5% 5/1/36 (d) | 10,000 | 11,720 | |
| 5% 5/1/37 (d) | 5,595 | 6,552 | |
| 5% 1/1/47 (d) | 6,005 | 6,874 | |
| 5% 5/1/49 (d) | 12,645 | 14,543 | |
| Series 2019 B, 5% 5/1/49 | 5,000 | 5,893 | |
| Series 2019 E, 5% 5/1/50 (d) | 7,000 | 8,017 | |
| Series 2022 A: | |||
| 5% 5/1/26 (d) | 5,000 | 5,607 | |
| 5% 5/1/52 (d) | 14,500 | 17,330 | |
| Series A, 5% 5/1/44 (d) | 14,620 | 15,560 | |
| San Francisco City & County Redev. Spl. Tax (Mission Bay South Pub. Impt. Proj.) Series 2013 A: | |||
| 5% 8/1/23 | 1,000 | 1,015 | |
| 5% 8/1/24 | 750 | 761 | |
| San Jacinto Unified School District Series 2014: | |||
| 5% 8/1/25 (Assured Guaranty Muni. Corp. Insured) | 875 | 950 | |
| 5% 8/1/26 (Assured Guaranty Muni. Corp. Insured) | 1,055 | 1,144 | |
| 5% 8/1/27 (Assured Guaranty Muni. Corp. Insured) | 1,250 | 1,353 | |
| 5% 8/1/28 (Assured Guaranty Muni. Corp. Insured) | 1,250 | 1,353 | |
| 5% 8/1/29 (Assured Guaranty Muni. Corp. Insured) | 3,150 | 3,409 | |
| 5% 8/1/30 (Assured Guaranty Muni. Corp. Insured) | 4,070 | 4,404 | |
| 5% 8/1/31 (Assured Guaranty Muni. Corp. Insured) | 650 | 703 | |
| San Joaquin Hills Trans. Corridor Agcy. Toll Road Rev. Series 1993, 0% 1/1/27 (Escrowed to Maturity) | 4,000 | 3,697 | |
| San Jose Int. Arpt. Rev.: | |||
| Series 2017 A: | |||
| 5% 3/1/27 (d) | 2,480 | 2,828 | |
| 5% 3/1/29 (d) | 735 | 836 | |
| 5% 3/1/31 (d) | 1,100 | 1,251 | |
| 5% 3/1/32 (d) | 850 | 966 | |
| 5% 3/1/33 (d) | 1,095 | 1,244 | |
| 5% 3/1/34 (d) | 1,250 | 1,419 | |
| 5% 3/1/35 (d) | 3,475 | 3,925 | |
| 5% 3/1/36 (d) | 2,250 | 2,540 | |
| 5% 3/1/37 (d) | 2,250 | 2,538 | |
| 5% 3/1/41 (d) | 10,235 | 11,547 | |
| Series 2017 B: | |||
| 5% 3/1/29 | 200 | 230 | |
| 5% 3/1/30 | 250 | 288 | |
| 5% 3/1/32 | 235 | 271 | |
| 5% 3/1/33 | 250 | 288 | |
| 5% 3/1/34 | 500 | 577 | |
| 5% 3/1/37 | 3,000 | 3,445 | |
| Series 2021 A: | |||
| 4% 3/1/34 (d) | 2,000 | 2,219 | |
| 5% 3/1/24 (d) | 1,000 | 1,066 | |
| 5% 3/1/25 (d) | 500 | 547 | |
| 5% 3/1/26 (d) | 1,550 | 1,732 | |
| 5% 3/1/27 (d) | 750 | 855 | |
| 5% 3/1/28 (d) | 1,270 | 1,474 | |
| 5% 3/1/29 (d) | 1,000 | 1,181 | |
| 5% 3/1/30 (d) | 1,275 | 1,529 | |
| 5% 3/1/31 (d) | 1,600 | 1,947 | |
| 5% 3/1/32 (d) | 2,000 | 2,427 | |
| 5% 3/1/33 (d) | 1,500 | 1,813 | |
| San Marcos Redev. Agcy. Successor Series 2015 A: | |||
| 5% 10/1/27 | 1,650 | 1,850 | |
| 5% 10/1/29 | 675 | 755 | |
| 5% 10/1/30 | 2,000 | 2,236 | |
| 5% 10/1/31 | 2,310 | 2,582 | |
| San Marcos Unified School District Series 2010 B: | |||
| 0% 8/1/35 | 3,675 | 2,591 | |
| 0% 8/1/37 | 1,900 | 1,250 | |
| 0% 8/1/47 | 9,000 | 4,029 | |
| San Mateo County Cmnty. College District Series 2019: | |||
| 5% 9/1/36 | 1,000 | 1,239 | |
| 5% 9/1/37 | 1,000 | 1,239 | |
| 5% 9/1/38 | 760 | 940 | |
| 5% 9/1/39 | 1,000 | 1,235 | |
| 5% 9/1/40 | 1,100 | 1,356 | |
| San Mateo County Joint Powers Fing. Auth. Series 2019 A: | |||
| 5% 7/15/24 | 4,000 | 4,356 | |
| 5% 7/15/26 | 4,000 | 4,621 | |
| San Mateo Foster City (Clean Wtr. Prog.) Series 2019, 5% 8/1/49 | 8,000 | 9,718 | |
| San Mateo Unified School District (Election of 2000 Proj.) Series B: | |||
| 0% 9/1/23 (Nat'l. Pub. Fin. Guarantee Corp. Insured) | 2,000 | 1,967 | |
| 0% 9/1/25 (Nat'l. Pub. Fin. Guarantee Corp. Insured) | 1,490 | 1,412 | |
| 0% 9/1/26 (Nat'l. Pub. Fin. Guarantee Corp. Insured) | 1,500 | 1,393 | |
| San Pablo Redev. Agcy. Series 2014 A: | |||
| 5% 6/15/25 (Assured Guaranty Muni. Corp. Insured) | 825 | 891 | |
| 5% 6/15/26 (Assured Guaranty Muni. Corp. Insured) | 860 | 930 | |
| 5% 6/15/27 (Assured Guaranty Muni. Corp. Insured) | 1,770 | 1,914 | |
| 5% 6/15/28 (Assured Guaranty Muni. Corp. Insured) | 1,865 | 2,017 | |
| 5% 6/15/29 (Assured Guaranty Muni. Corp. Insured) | 1,780 | 1,926 | |
| 5% 6/15/30 (Assured Guaranty Muni. Corp. Insured) | 1,150 | 1,245 | |
| 5% 6/15/31 (Assured Guaranty Muni. Corp. Insured) | 1,000 | 1,082 | |
| Sanger Unified School District Series 1999, 5.6% 8/1/23 (Nat'l. Pub. Fin. Guarantee Corp. Insured) | 85 | 89 | |
| Santa Barbara Fing. Auth. (Arpt. Proj.) Series 2019: | |||
| 5% 4/1/30 | 1,000 | 1,214 | |
| 5% 4/1/32 | 1,365 | 1,653 | |
| 5% 4/1/34 | 1,000 | 1,209 | |
| 5% 4/1/36 | 2,135 | 2,570 | |
| 5% 4/1/37 | 1,000 | 1,202 | |
| 5% 4/1/38 | 845 | 1,016 | |
| Santa Monica Pub. Fin. Rev.: | |||
| (City Svcs. Bldg. Proj.) Series 2017: | |||
| 4% 7/1/39 | 790 | 873 | |
| 5% 7/1/36 | 2,380 | 2,797 | |
| 5% 7/1/37 | 1,780 | 2,089 | |
| (Downtown Fire Station Proj.) Series 2018, 5% 7/1/42 | 1,250 | 1,461 | |
| Santa Monica-Malibu Unified School District Series 2017 C: | |||
| 4% 7/1/36 | 435 | 486 | |
| 4% 7/1/37 | 475 | 531 | |
| 4% 7/1/38 | 450 | 502 | |
| 4% 7/1/39 | 550 | 613 | |
| 5% 7/1/30 | 250 | 296 | |
| 5% 7/1/31 | 350 | 414 | |
| 5% 7/1/32 | 255 | 301 | |
| 5% 7/1/33 | 250 | 295 | |
| 5% 7/1/34 | 315 | 371 | |
| 5% 7/1/35 | 400 | 471 | |
| Santa Rosa Wastewtr. Rev. Series 2002 B: | |||
| 0% 9/1/22 (AMBAC Insured) | 2,900 | 2,888 | |
| 0% 9/1/25 (AMBAC Insured) | 6,800 | 6,401 | |
| Shasta Union High School District: | |||
| Series 2002, 0% 8/1/26 (Nat'l. Pub. Fin. Guarantee Corp. Insured) | 1,000 | 922 | |
| Series 2003, 0% 5/1/28 (Nat'l. Pub. Fin. Guarantee Corp. Insured) | 3,340 | 2,944 | |
| South Bayside Waste Mgmt. Auth.: | |||
| Series 2019 A: | |||
| 5% 9/1/42 (Assured Guaranty Muni. Corp. Insured) | 1,255 | 1,504 | |
| 5% 9/1/42 (Pre-Refunded to 9/1/29 @ 100) | 45 | 56 | |
| Series 2019 B: | |||
| 5% 9/1/24 (d) | 425 | 463 | |
| 5% 9/1/24 (Escrowed to Maturity) (d) | 15 | 16 | |
| South Orange County Pub. Fin. Auth. Series 2016: | |||
| 5% 4/1/34 | 2,000 | 2,246 | |
| 5% 4/1/36 | 3,000 | 3,357 | |
| South Orange County Pub. Fing. Auth. Spl. Tax Rev. Series 2014 A: | |||
| 5% 8/15/23 | 1,000 | 1,025 | |
| 5% 8/15/26 | 1,975 | 2,024 | |
| 5% 8/15/27 | 700 | 717 | |
| 5% 8/15/28 | 1,000 | 1,025 | |
| South San Francisco Pub. Fing. Auth. (Cmnty. Civic Campus And Multiple Cap. Projs.) Series 2021 A, 4% 6/1/46 | 5,000 | 5,620 | |
| Southern California Pub. Pwr. Auth. Rev. Bonds Series 2020 C, 0.65%, tender 7/1/25 (a) | 10,000 | 9,685 | |
| Southwestern Cmnty. College District Gen. Oblig.: | |||
| Series 2000, 0% 8/1/27 (Nat'l. Pub. Fin. Guarantee Corp. Insured) | 2,495 | 2,264 | |
| Series 2004, 0% 8/1/28 (Nat'l. Pub. Fin. Guarantee Corp. Insured) | 2,500 | 2,209 | |
| Stockton Pub. Fing. Auth. Wtr. Rev. Series 2018 A: | |||
| 4% 10/1/37 | 2,000 | 2,216 | |
| 5% 10/1/35 | 1,000 | 1,196 | |
| 5% 10/1/36 | 1,585 | 1,894 | |
| Stockton Unified School District Gen. Oblig.: | |||
| Series 2012 A: | |||
| 5% 8/1/24 (Assured Guaranty Muni. Corp. Insured) | 300 | 327 | |
| 5% 8/1/25 (Assured Guaranty Muni. Corp. Insured) | 750 | 817 | |
| 5% 8/1/27 (Assured Guaranty Muni. Corp. Insured) | 265 | 288 | |
| 5% 8/1/28 (Assured Guaranty Muni. Corp. Insured) | 510 | 555 | |
| 5% 8/1/38 (Assured Guaranty Muni. Corp. Insured) | 2,500 | 2,708 | |
| 5% 8/1/42 (Assured Guaranty Muni. Corp. Insured) | 4,650 | 5,028 | |
| Series 2012: | |||
| 5% 7/1/23 (Assured Guaranty Muni. Corp. Insured) | 1,270 | 1,287 | |
| 5% 7/1/24 (Assured Guaranty Muni. Corp. Insured) | 1,350 | 1,370 | |
| 5% 7/1/25 (Assured Guaranty Muni. Corp. Insured) | 1,060 | 1,076 | |
| 5% 7/1/26 (Assured Guaranty Muni. Corp. Insured) | 1,110 | 1,126 | |
| 5% 7/1/27 (Assured Guaranty Muni. Corp. Insured) | 1,065 | 1,080 | |
| 5% 1/1/29 (Assured Guaranty Muni. Corp. Insured) | 600 | 609 | |
| Successor Agcy. to the Redev. Agcy. of Pittsburg (Los Medanos Cmnty. Dev. Proj.) Series 2016 A: | |||
| 5% 9/1/24 (Assured Guaranty Muni. Corp. Insured) | 2,440 | 2,640 | |
| 5% 9/1/25 (Assured Guaranty Muni. Corp. Insured) | 3,500 | 3,892 | |
| 5% 9/1/26 (Assured Guaranty Muni. Corp. Insured) | 3,000 | 3,426 | |
| 5% 9/1/27 (Assured Guaranty Muni. Corp. Insured) | 4,380 | 5,006 | |
| 5% 9/1/28 (Assured Guaranty Muni. Corp. Insured) | 3,500 | 4,001 | |
| 5% 9/1/29 (Assured Guaranty Muni. Corp. Insured) | 2,000 | 2,286 | |
| Tobacco Securitization Auth. Southern California Tobacco Settlement Series 2019 A1: | |||
| 5% 6/1/24 | 1,000 | 1,069 | |
| 5% 6/1/26 | 1,185 | 1,328 | |
| Tulare Swr. Rev. Series 2015: | |||
| 5% 11/15/24 (Assured Guaranty Muni. Corp. Insured) | 820 | 896 | |
| 5% 11/15/25 (Assured Guaranty Muni. Corp. Insured) | 800 | 898 | |
| 5% 11/15/26 (Assured Guaranty Muni. Corp. Insured) | 965 | 1,089 | |
| 5% 11/15/27 (Assured Guaranty Muni. Corp. Insured) | 1,500 | 1,688 | |
| 5% 11/15/28 (Assured Guaranty Muni. Corp. Insured) | 1,165 | 1,308 | |
| Turlock Irrigation District Rev. Series 2020, 5% 1/1/41 | 4,000 | 4,859 | |
| Univ. of California Regents Med. Ctr. Pool Rev. Series 2013 J, 5% 5/15/48 | 7,300 | 7,628 | |
| Univ. of California Revs.: | |||
| Series 2017 AV, 5% 5/15/34 | 2,000 | 2,331 | |
| Series 2018 O, 5% 5/15/48 | 1,000 | 1,184 | |
| Series 2019 BB, 5% 5/15/49 | 2,000 | 2,417 | |
| Series 2020 BE, 4% 5/15/50 | 6,855 | 7,661 | |
| Series 2021, 5% 5/15/46 | 5,000 | 6,160 | |
| Upland Gen. Oblig. Ctfs. of Prtn. (San Antonio Cmnty. Hosp.,CA. Proj.) Series 2017: | |||
| 4% 1/1/35 | 1,000 | 1,090 | |
| 4% 1/1/36 | 1,000 | 1,089 | |
| 5% 1/1/30 | 1,335 | 1,558 | |
| 5% 1/1/31 | 1,350 | 1,571 | |
| 5% 1/1/32 | 1,400 | 1,627 | |
| 5% 1/1/33 | 2,835 | 3,291 | |
| 5% 1/1/34 | 2,230 | 2,587 | |
| Vacaville Unified School District Series 2014 C: | |||
| 5% 8/1/23 (Build America Mutual Assurance Insured) | 930 | 983 | |
| 5% 8/1/26 (Build America Mutual Assurance Insured) | 1,295 | 1,412 | |
| Vernon Elec. Sys. Rev. Series 2022 A: | |||
| 5% 8/1/36 (b) | 1,490 | 1,777 | |
| 5% 8/1/38 (b) | 825 | 980 | |
| 5% 8/1/39 (b) | 850 | 1,009 | |
| 5% 8/1/41 (b) | 420 | 497 | |
| Walnut Valley Unified School District Series D: | |||
| 0% 8/1/30 (Nat'l. Pub. Fin. Guarantee Corp. Insured) | 2,875 | 2,407 | |
| 0% 8/1/31 (Nat'l. Pub. Fin. Guarantee Corp. Insured) | 2,900 | 2,356 | |
| 0% 8/1/32 (Nat'l. Pub. Fin. Guarantee Corp. Insured) | 1,315 | 1,039 | |
| Washington Township Health Care District Gen. Oblig. Series 2013 B: | |||
| 5% 8/1/43 | 5,000 | 5,394 | |
| 5.5% 8/1/38 | 1,500 | 1,638 | |
| 5.5% 8/1/40 | 5,000 | 5,459 | |
| Washington Township Health Care District Rev.: | |||
| Series 2017 B: | |||
| 5% 7/1/30 | 2,500 | 2,880 | |
| 5% 7/1/32 | 1,350 | 1,550 | |
| 5% 7/1/33 | 1,000 | 1,147 | |
| Series 2019 A: | |||
| 5% 7/1/30 | 1,000 | 1,194 | |
| 5% 7/1/31 | 875 | 1,042 | |
| 5% 7/1/32 | 890 | 1,058 | |
| 5% 7/1/36 | 750 | 888 | |
| Series A: | |||
| 4% 7/1/33 | 260 | 289 | |
| 4% 7/1/35 | 300 | 333 | |
| 5% 7/1/30 | 300 | 371 | |
| 5% 7/1/31 | 325 | 385 | |
| West Contra Costa Unified School District: | |||
| Series 2012 D, 0% 8/1/33 (Assured Guaranty Muni. Corp. Insured) | 1,675 | 1,252 | |
| Series 2014 A: | |||
| 5% 8/1/23 | 365 | 386 | |
| 5% 8/1/25 | 2,555 | 2,777 | |
| 5% 8/1/26 | 2,550 | 2,771 | |
| 5% 8/1/27 | 1,150 | 1,247 | |
| 5% 8/1/28 | 1,000 | 1,085 | |
| 5% 8/1/29 | 1,675 | 1,817 | |
| TOTAL CALIFORNIA | 2,105,855 | ||
| Guam - 0.0% | |||
| Guam Int'l. Arpt. Auth. Rev. Series 2013 C, 6.375% 10/1/43 (d) | 230 | 245 | |
| TOTAL MUNICIPAL BONDS | |||
| (Cost $2,026,118) | 2,106,100 | ||
| Municipal Notes - 2.7% | |||
| California - 2.7% | |||
| California Gen. Oblig. Series 2005 B5, 0.06% 3/1/22, LOC U.S. Bank NA, Cincinnati, VRDN (a) | 5,000 | $5,000 | |
| California Muni. Fin. Auth. Student Hsg. Participating VRDN Series 2021 XL 01 73, 0.26% 3/7/22 (Liquidity Facility JPMorgan Chase Bank) (a)(f)(g) | 7,015 | 7,015 | |
| California Statewide Cmntys. Dev. Auth. Rev. Participating VRDN Series 2017, 0.26% 3/7/22 (Liquidity Facility Deutsche Bank AG New York Branch) (a)(f)(g) | 3,850 | 3,850 | |
| Eastern California Muni. Wtr. District Wtr. and Wasterwater Series 2018 A, 0.07% 3/1/22 (Liquidity Facility Bank of America NA), VRDN (a) | 2,345 | 2,345 | |
| Irvine Impt. Bond Act of 1915 (Assessment District #97-17 Proj.) Series 1998, 0.08% 3/1/22, LOC State Street Bank & Trust Co., Boston, VRDN (a) | 4,100 | 4,100 | |
| Los Angeles Dept. of Wtr. & Pwr. Rev.: | |||
| Series 2002 A7, 0.07% 3/1/22 (Liquidity Facility Bank of America NA), VRDN (a) | 7,400 | 7,400 | |
| Series 2021 A1, 0.03% 3/1/22 (Liquidity Facility Royal Bank of Canada), VRDN (a) | 9,350 | 9,350 | |
| Series A3, 0.04% 3/1/22 (Liquidity Facility Royal Bank of Canada), VRDN (a) | 6,000 | 6,000 | |
| Los Angeles Multi-family Hsg. Rev. Series 1994 A, 0.15% 3/1/22, LOC JPMorgan Chase Bank, VRDN (a)(d) | 1,608 | 1,608 | |
| River Islands Pub. Fing. Auth. Participating VRDN Series MIZ 90 26, 0.45% 4/4/22 (Liquidity Facility Mizuho Cap. Markets LLC) (a)(f)(g)(h) | 11,545 | 11,545 | |
| TOTAL CALIFORNIA | 58,213 | ||
| TOTAL MUNICIPAL NOTES | |||
| (Cost $58,213) | 58,213 | ||
| TOTAL INVESTMENT IN SECURITIES - 101.3% | |||
| (Cost $2,084,331) | 2,164,313 | ||
| NET OTHER ASSETS (LIABILITIES) - (1.3)% | (27,559) | ||
| NET ASSETS - 100% | $2,136,754 |
Security Type Abbreviations
VRDN – VARIABLE RATE DEMAND NOTE (A debt instrument that is payable upon demand, either daily, weekly or monthly)
Legend
(a) Coupon rates for floating and adjustable rate securities reflect the rates in effect at period end.
(b) Security or a portion of the security purchased on a delayed delivery or when-issued basis.
(c) Security exempt from registration under Rule 144A of the Securities Act of 1933. These securities may be resold in transactions exempt from registration, normally to qualified institutional buyers. At the end of the period, the value of these securities amounted to $7,458,000 or 0.3% of net assets.
(d) Private activity obligations whose interest is subject to the federal alternative minimum tax for individuals.
(e) Security initially issued in zero coupon form which converts to coupon form at a specified rate and date. The rate shown is the rate at period end.
(f) Provides evidence of ownership in one or more underlying municipal bonds.
(g) Coupon rates are determined by re-marketing agents based on current market conditions.
(h) Restricted securities (including private placements) - Investment in securities not registered under the Securities Act of 1933 (excluding 144A issues). At the end of the period, the value of restricted securities (excluding 144A issues) amounted to $11,545,000 or 0.5% of net assets.
Additional information on each restricted holding is as follows:
| Security | Acquisition Date | Acquisition Cost (000s) |
| River Islands Pub. Fing. Auth. Participating VRDN Series MIZ 90 26, 0.45% 4/4/22 (Liquidity Facility Mizuho Cap. Markets LLC) | 8/14/20 - 6/1/21 | $11,545 |
Investment Valuation
The following is a summary of the inputs used, as of February 28, 2022, involving the Fund's assets and liabilities carried at fair value. The inputs or methodology used for valuing securities may not be an indication of the risk associated with investing in those securities. For more information on valuation inputs, and their aggregation into the levels used below, please refer to the Investment Valuation section in the accompanying Notes to Financial Statements.
| Valuation Inputs at Reporting Date: | ||||
| Description | Total | Level 1 | Level 2 | Level 3 |
| (Amounts in thousands) | ||||
| Investments in Securities: | ||||
| Municipal Securities | $2,164,313 | $-- | $2,164,313 | $-- |
| Total Investments in Securities: | $2,164,313 | $-- | $2,164,313 | $-- |
Other Information
The distribution of municipal securities by revenue source, as a percentage of total Net Assets, is as follows (Unaudited):
| Transportation | 27.5% |
| General Obligations | 25.0% |
| Health Care | 11.1% |
| Special Tax | 8.8% |
| Education | 7.4% |
| Electric Utilities | 5.6% |
| Escrowed/Pre-Refunded | 5.2% |
| Water & Sewer | 5.2% |
| Others* (Individually Less Than 5%) | 4.2% |
| 100.0% |
* Includes net other assets
See accompanying notes which are an integral part of the financial statements.
Financial Statements
Statement of Assets and Liabilities
| Amounts in thousands (except per-share amounts) | February 28, 2022 | |
| Assets | ||
| Investment in securities, at value — See accompanying schedule: Unaffiliated issuers (cost $2,084,331) | $2,164,313 | |
| Cash | 33,788 | |
| Receivable for fund shares sold | 1,433 | |
| Interest receivable | 20,671 | |
| Prepaid expenses | 2 | |
| Other receivables | 4 | |
| Total assets | 2,220,211 | |
| Liabilities | ||
| Payable for investments purchased on a delayed delivery basis | $71,154 | |
| Payable for fund shares redeemed | 9,912 | |
| Distributions payable | 1,487 | |
| Accrued management fee | 638 | |
| Distribution and service plan fees payable | 25 | |
| Other affiliated payables | 188 | |
| Other payables and accrued expenses | 53 | |
| Total liabilities | 83,457 | |
| Net Assets | $2,136,754 | |
| Net Assets consist of: | ||
| Paid in capital | $2,058,648 | |
| Total accumulated earnings (loss) | 78,106 | |
| Net Assets | $2,136,754 | |
| Net Asset Value and Maximum Offering Price | ||
| Class A: | ||
| Net Asset Value and redemption price per share ($59,032 ÷ 4,593 shares)(a) | $12.85 | |
| Maximum offering price per share (100/96.00 of $12.85) | $13.39 | |
| Class M: | ||
| Net Asset Value and redemption price per share ($5,087 ÷ 395 shares)(a) | $12.88 | |
| Maximum offering price per share (100/96.00 of $12.88) | $13.42 | |
| Class C: | ||
| Net Asset Value and offering price per share ($13,692 ÷ 1,067 shares)(a) | $12.83 | |
| California Municipal Income: | ||
| Net Asset Value, offering price and redemption price per share ($1,946,948 ÷ 151,713 shares) | $12.83 | |
| Class I: | ||
| Net Asset Value, offering price and redemption price per share ($52,424 ÷ 4,076 shares) | $12.86 | |
| Class Z: | ||
| Net Asset Value, offering price and redemption price per share ($59,571 ÷ 4,633 shares) | $12.86 |
(a) Redemption price per share is equal to net asset value less any applicable contingent deferred sales charge.
See accompanying notes which are an integral part of the financial statements.
Statement of Operations
| Amounts in thousands | Year ended February 28, 2022 | |
| Investment Income | ||
| Interest | $60,543 | |
| Expenses | ||
| Management fee | $8,014 | |
| Transfer agent fees | 1,872 | |
| Distribution and service plan fees | 341 | |
| Accounting fees and expenses | 412 | |
| Custodian fees and expenses | 22 | |
| Independent trustees' fees and expenses | 7 | |
| Registration fees | 97 | |
| Audit | 56 | |
| Legal | 8 | |
| Miscellaneous | 9 | |
| Total expenses before reductions | 10,838 | |
| Expense reductions | (48) | |
| Total expenses after reductions | 10,790 | |
| Net investment income (loss) | 49,753 | |
| Realized and Unrealized Gain (Loss) | ||
| Net realized gain (loss) on: | ||
| Investment securities: | ||
| Unaffiliated issuers | 6,358 | |
| Total net realized gain (loss) | 6,358 | |
| Change in net unrealized appreciation (depreciation) on investment securities | (71,653) | |
| Net gain (loss) | (65,295) | |
| Net increase (decrease) in net assets resulting from operations | $(15,542) |
See accompanying notes which are an integral part of the financial statements.
Statement of Changes in Net Assets
| Amounts in thousands | Year ended February 28, 2022 | Year ended February 28, 2021 |
| Increase (Decrease) in Net Assets | ||
| Operations | ||
| Net investment income (loss) | $49,753 | $53,329 |
| Net realized gain (loss) | 6,358 | 9,570 |
| Change in net unrealized appreciation (depreciation) | (71,653) | (69,317) |
| Net increase (decrease) in net assets resulting from operations | (15,542) | (6,418) |
| Distributions to shareholders | (60,162) | (60,744) |
| Share transactions - net increase (decrease) | (40,615) | (30,656) |
| Total increase (decrease) in net assets | (116,319) | (97,818) |
| Net Assets | ||
| Beginning of period | 2,253,073 | 2,350,891 |
| End of period | $2,136,754 | $2,253,073 |
See accompanying notes which are an integral part of the financial statements.
Financial Highlights
Fidelity California Municipal Income Fund Class A
| Years ended February 28, | 2022 | 2021 | 2020 A | 2019 | 2018 |
| Selected Per–Share Data | |||||
| Net asset value, beginning of period | $13.28 | $13.63 | $12.78 | $12.68 | $12.79 |
| Income from Investment Operations | |||||
| Net investment income (loss)B,C | .245 | .281 | .309 | .339 | .340 |
| Net realized and unrealized gain (loss) | (.370) | (.305) | .866 | .101 | (.043) |
| Total from investment operations | (.125) | (.024) | 1.175 | .440 | .297 |
| Distributions from net investment income | (.245) | (.281) | (.309) | (.339) | (.339) |
| Distributions from net realized gain | (.060) | (.045) | (.016) | (.001) | (.068) |
| Total distributions | (.305) | (.326) | (.325) | (.340) | (.407) |
| Net asset value, end of period | $12.85 | $13.28 | $13.63 | $12.78 | $12.68 |
| Total ReturnD,E | (1.00)% | (.15)% | 9.30% | 3.53% | 2.31% |
| Ratios to Average Net AssetsC,F,G | |||||
| Expenses before reductions | .79% | .79% | .79% | .79% | .80% |
| Expenses net of fee waivers, if any | .78% | .79% | .79% | .79% | .80% |
| Expenses net of all reductions | .78% | .78% | .79% | .79% | .80% |
| Net investment income (loss) | 1.84% | 2.11% | 2.34% | 2.69% | 2.62% |
| Supplemental Data | |||||
| Net assets, end of period (in millions) | $59 | $60 | $56 | $44 | $39 |
| Portfolio turnover rateH | 14% | 13% | 11% | 20% | 20% |
A For the year ended February 29.
B Calculated based on average shares outstanding during the period.
C Net investment income (loss) is affected by the timing of the declaration of dividends by any underlying mutual funds or exchange-traded funds (ETFs). Net investment income (loss) of any such underlying funds is not included in the Fund's net investment income (loss) ratio.
D Total returns would have been lower if certain expenses had not been reduced during the applicable periods shown.
E Total returns do not include the effect of the sales charges.
F Fees and expenses of any underlying mutual funds or exchange-traded funds (ETFs) are not included in the Fund's expense ratio. The Fund indirectly bears its proportionate share of these expenses.
G Expense ratios reflect operating expenses of the class. Expenses before reductions do not reflect amounts reimbursed, waived, or reduced through arrangements with the investment adviser, brokerage services, or other offset arrangements, if applicable, and do not represent the amount paid by the class during periods when reimbursements, waivers or reductions occur.
H Amount does not include the portfolio activity of any underlying mutual funds or exchange-traded funds (ETFs).
See accompanying notes which are an integral part of the financial statements.
Fidelity California Municipal Income Fund Class M
| Years ended February 28, | 2022 | 2021 | 2020 A | 2019 | 2018 |
| Selected Per–Share Data | |||||
| Net asset value, beginning of period | $13.31 | $13.66 | $12.81 | $12.71 | $12.82 |
| Income from Investment Operations | |||||
| Net investment income (loss)B,C | .258 | .290 | .315 | .345 | .346 |
| Net realized and unrealized gain (loss) | (.370) | (.304) | .866 | .101 | (.043) |
| Total from investment operations | (.112) | (.014) | 1.181 | .446 | .303 |
| Distributions from net investment income | (.258) | (.291) | (.315) | (.345) | (.345) |
| Distributions from net realized gain | (.060) | (.045) | (.016) | (.001) | (.068) |
| Total distributions | (.318) | (.336) | (.331) | (.346) | (.413) |
| Net asset value, end of period | $12.88 | $13.31 | $13.66 | $12.81 | $12.71 |
| Total ReturnD,E | (.91)% | (.08)% | 9.32% | 3.57% | 2.35% |
| Ratios to Average Net AssetsC,F,G | |||||
| Expenses before reductions | .70% | .72% | .75% | .75% | .76% |
| Expenses net of fee waivers, if any | .70% | .72% | .75% | .75% | .76% |
| Expenses net of all reductions | .70% | .72% | .75% | .75% | .76% |
| Net investment income (loss) | 1.92% | 2.18% | 2.37% | 2.72% | 2.66% |
| Supplemental Data | |||||
| Net assets, end of period (in millions) | $5 | $5 | $11 | $9 | $8 |
| Portfolio turnover rateH | 14% | 13% | 11% | 20% | 20% |
A For the year ended February 29.
B Calculated based on average shares outstanding during the period.
C Net investment income (loss) is affected by the timing of the declaration of dividends by any underlying mutual funds or exchange-traded funds (ETFs). Net investment income (loss) of any such underlying funds is not included in the Fund's net investment income (loss) ratio.
D Total returns would have been lower if certain expenses had not been reduced during the applicable periods shown.
E Total returns do not include the effect of the sales charges.
F Fees and expenses of any underlying mutual funds or exchange-traded funds (ETFs) are not included in the Fund's expense ratio. The Fund indirectly bears its proportionate share of these expenses.
G Expense ratios reflect operating expenses of the class. Expenses before reductions do not reflect amounts reimbursed, waived, or reduced through arrangements with the investment adviser, brokerage services, or other offset arrangements, if applicable, and do not represent the amount paid by the class during periods when reimbursements, waivers or reductions occur.
H Amount does not include the portfolio activity of any underlying mutual funds or exchange-traded funds (ETFs).
See accompanying notes which are an integral part of the financial statements.
Fidelity California Municipal Income Fund Class C
| Years ended February 28, | 2022 | 2021 | 2020 A | 2019 | 2018 |
| Selected Per–Share Data | |||||
| Net asset value, beginning of period | $13.26 | $13.61 | $12.76 | $12.66 | $12.77 |
| Income from Investment Operations | |||||
| Net investment income (loss)B,C | .146 | .181 | .210 | .244 | .241 |
| Net realized and unrealized gain (loss) | (.370) | (.305) | .866 | .100 | (.042) |
| Total from investment operations | (.224) | (.124) | 1.076 | .344 | .199 |
| Distributions from net investment income | (.146) | (.181) | (.210) | (.243) | (.241) |
| Distributions from net realized gain | (.060) | (.045) | (.016) | (.001) | (.068) |
| Total distributions | (.206) | (.226) | (.226) | (.244) | (.309) |
| Net asset value, end of period | $12.83 | $13.26 | $13.61 | $12.76 | $12.66 |
| Total ReturnD,E | (1.74)% | (.90)% | 8.50% | 2.76% | 1.54% |
| Ratios to Average Net AssetsC,F,G | |||||
| Expenses before reductions | 1.53% | 1.54% | 1.54% | 1.55% | 1.56% |
| Expenses net of fee waivers, if any | 1.53% | 1.54% | 1.54% | 1.54% | 1.56% |
| Expenses net of all reductions | 1.53% | 1.54% | 1.54% | 1.54% | 1.56% |
| Net investment income (loss) | 1.09% | 1.36% | 1.59% | 1.93% | 1.87% |
| Supplemental Data | |||||
| Net assets, end of period (in millions) | $14 | $21 | $24 | $24 | $29 |
| Portfolio turnover rateH | 14% | 13% | 11% | 20% | 20% |
A For the year ended February 29.
B Calculated based on average shares outstanding during the period.
C Net investment income (loss) is affected by the timing of the declaration of dividends by any underlying mutual funds or exchange-traded funds (ETFs). Net investment income (loss) of any such underlying funds is not included in the Fund's net investment income (loss) ratio.
D Total returns would have been lower if certain expenses had not been reduced during the applicable periods shown.
E Total returns do not include the effect of the contingent deferred sales charge.
F Fees and expenses of any underlying mutual funds or exchange-traded funds (ETFs) are not included in the Fund's expense ratio. The Fund indirectly bears its proportionate share of these expenses.
G Expense ratios reflect operating expenses of the class. Expenses before reductions do not reflect amounts reimbursed, waived, or reduced through arrangements with the investment adviser, brokerage services, or other offset arrangements, if applicable, and do not represent the amount paid by the class during periods when reimbursements, waivers or reductions occur.
H Amount does not include the portfolio activity of any underlying mutual funds or exchange-traded funds (ETFs).
See accompanying notes which are an integral part of the financial statements.
Fidelity California Municipal Income Fund
| Years ended February 28, | 2022 | 2021 | 2020 A | 2019 | 2018 |
| Selected Per–Share Data | |||||
| Net asset value, beginning of period | $13.26 | $13.61 | $12.76 | $12.66 | $12.77 |
| Income from Investment Operations | |||||
| Net investment income (loss)B,C | .290 | .325 | .353 | .381 | .383 |
| Net realized and unrealized gain (loss) | (.370) | (.305) | .866 | .101 | (.042) |
| Total from investment operations | (.080) | .020 | 1.219 | .482 | .341 |
| Distributions from net investment income | (.290) | (.325) | (.353) | (.381) | (.383) |
| Distributions from net realized gain | (.060) | (.045) | (.016) | (.001) | (.068) |
| Total distributions | (.350) | (.370) | (.369) | (.382) | (.451) |
| Net asset value, end of period | $12.83 | $13.26 | $13.61 | $12.76 | $12.66 |
| Total ReturnD | (.67)% | .18% | 9.68% | 3.88% | 2.66% |
| Ratios to Average Net AssetsC,E,F | |||||
| Expenses before reductions | .45% | .45% | .45% | .46% | .46% |
| Expenses net of fee waivers, if any | .45% | .45% | .45% | .46% | .46% |
| Expenses net of all reductions | .45% | .45% | .45% | .46% | .46% |
| Net investment income (loss) | 2.17% | 2.45% | 2.68% | 3.02% | 2.97% |
| Supplemental Data | |||||
| Net assets, end of period (in millions) | $1,947 | $2,047 | $2,159 | $1,792 | $1,841 |
| Portfolio turnover rateG | 14% | 13% | 11% | 20% | 20% |
A For the year ended February 29.
B Calculated based on average shares outstanding during the period.
C Net investment income (loss) is affected by the timing of the declaration of dividends by any underlying mutual funds or exchange-traded funds (ETFs). Net investment income (loss) of any such underlying funds is not included in the Fund's net investment income (loss) ratio.
D Total returns would have been lower if certain expenses had not been reduced during the applicable periods shown.
E Fees and expenses of any underlying mutual funds or exchange-traded funds (ETFs) are not included in the Fund's expense ratio. The Fund indirectly bears its proportionate share of these expenses.
F Expense ratios reflect operating expenses of the class. Expenses before reductions do not reflect amounts reimbursed, waived, or reduced through arrangements with the investment adviser, brokerage services, or other offset arrangements, if applicable, and do not represent the amount paid by the class during periods when reimbursements, waivers or reductions occur.
G Amount does not include the portfolio activity of any underlying mutual funds or exchange-traded funds (ETFs).
See accompanying notes which are an integral part of the financial statements.
Fidelity California Municipal Income Fund Class I
| Years ended February 28, | 2022 | 2021 | 2020 A | 2019 | 2018 |
| Selected Per–Share Data | |||||
| Net asset value, beginning of period | $13.29 | $13.64 | $12.79 | $12.69 | $12.80 |
| Income from Investment Operations | |||||
| Net investment income (loss)B,C | .278 | .313 | .342 | .371 | .372 |
| Net realized and unrealized gain (loss) | (.370) | (.304) | .866 | .100 | (.042) |
| Total from investment operations | (.092) | .009 | 1.208 | .471 | .330 |
| Distributions from net investment income | (.278) | (.314) | (.342) | (.370) | (.372) |
| Distributions from net realized gain | (.060) | (.045) | (.016) | (.001) | (.068) |
| Total distributions | (.338) | (.359) | (.358) | (.371) | (.440) |
| Net asset value, end of period | $12.86 | $13.29 | $13.64 | $12.79 | $12.69 |
| Total ReturnD | (.75)% | .09% | 9.56% | 3.78% | 2.57% |
| Ratios to Average Net AssetsC,E,F | |||||
| Expenses before reductions | .54% | .54% | .55% | .55% | .55% |
| Expenses net of fee waivers, if any | .54% | .54% | .55% | .55% | .55% |
| Expenses net of all reductions | .54% | .54% | .55% | .54% | .55% |
| Net investment income (loss) | 2.08% | 2.36% | 2.58% | 2.93% | 2.87% |
| Supplemental Data | |||||
| Net assets, end of period (in millions) | $52 | $67 | $59 | $48 | $60 |
| Portfolio turnover rateG | 14% | 13% | 11% | 20% | 20% |
A For the year ended February 29.
B Calculated based on average shares outstanding during the period.
C Net investment income (loss) is affected by the timing of the declaration of dividends by any underlying mutual funds or exchange-traded funds (ETFs). Net investment income (loss) of any such underlying funds is not included in the Fund's net investment income (loss) ratio.
D Total returns would have been lower if certain expenses had not been reduced during the applicable periods shown.
E Fees and expenses of any underlying mutual funds or exchange-traded funds (ETFs) are not included in the Fund's expense ratio. The Fund indirectly bears its proportionate share of these expenses.
F Expense ratios reflect operating expenses of the class. Expenses before reductions do not reflect amounts reimbursed, waived, or reduced through arrangements with the investment adviser, brokerage services, or other offset arrangements, if applicable, and do not represent the amount paid by the class during periods when reimbursements, waivers or reductions occur.
G Amount does not include the portfolio activity of any underlying mutual funds or exchange-traded funds (ETFs).
See accompanying notes which are an integral part of the financial statements.
Fidelity California Municipal Income Fund Class Z
| Years ended February 28, | 2022 | 2021 | 2020 A | 2019 B |
| Selected Per–Share Data | ||||
| Net asset value, beginning of period | $13.29 | $13.64 | $12.79 | $12.58 |
| Income from Investment Operations | ||||
| Net investment income (loss)C,D | .294 | .329 | .357 | .156 |
| Net realized and unrealized gain (loss) | (.370) | (.305) | .866 | .211 |
| Total from investment operations | (.076) | .024 | 1.223 | .367 |
| Distributions from net investment income | (.294) | (.329) | (.357) | (.156) |
| Distributions from net realized gain | (.060) | (.045) | (.016) | (.001) |
| Total distributions | (.354) | (.374) | (.373) | (.157) |
| Net asset value, end of period | $12.86 | $13.29 | $13.64 | $12.79 |
| Total ReturnE,F | (.64)% | .21% | 9.68% | 2.93% |
| Ratios to Average Net AssetsD,G,H | ||||
| Expenses before reductions | .42% | .43% | .43% | .44%I |
| Expenses net of fee waivers, if any | .42% | .43% | .43% | .43%I |
| Expenses net of all reductions | .42% | .43% | .43% | .43%I |
| Net investment income (loss) | 2.20% | 2.47% | 2.70% | 3.01%I |
| Supplemental Data | ||||
| Net assets, end of period (in millions) | $60 | $53 | $43 | $27 |
| Portfolio turnover rateJ | 14% | 13% | 11% | 20% |
A For the year ended February 29.
B For the period October 2, 2018 (commencement of sale of shares) through February 28, 2019.
C Calculated based on average shares outstanding during the period.
D Net investment income (loss) is affected by the timing of the declaration of dividends by any underlying mutual funds or exchange-traded funds (ETFs). Net investment income (loss) of any such underlying funds is not included in the Fund's net investment income (loss) ratio.
E Total returns for periods of less than one year are not annualized.
F Total returns would have been lower if certain expenses had not been reduced during the applicable periods shown.
G Fees and expenses of any underlying mutual funds or exchange-traded funds (ETFs) are not included in the Fund's expense ratio. The Fund indirectly bears its proportionate share of these expenses.
H Expense ratios reflect operating expenses of the class. Expenses before reductions do not reflect amounts reimbursed, waived, or reduced through arrangements with the investment adviser, brokerage services, or other offset arrangements, if applicable, and do not represent the amount paid by the class during periods when reimbursements, waivers or reductions occur.
I Annualized
J Amount does not include the portfolio activity of any underlying mutual funds or exchange-traded funds (ETFs).
See accompanying notes which are an integral part of the financial statements.
Notes to Financial Statements
For the period ended February 28, 2022
(Amounts in thousands except percentages)
1. Organization.
Fidelity California Municipal Income Fund (the Fund) is a fund of Fidelity California Municipal Trust (the Trust) and is authorized to issue an unlimited number of shares. The Trust is registered under the Investment Company Act of 1940, as amended (the 1940 Act), as an open-end management investment company organized as a Massachusetts business trust. The Fund offers Class A, Class M, Class C, California Municipal Income, Class I and Class Z shares, each of which has equal rights as to assets and voting privileges. Each class has exclusive voting rights with respect to matters that affect that class. Effective June 21, 2021, Class C shares will automatically convert to Class A shares after a holding period of eight years from the initial date of purchase, with certain exceptions. Prior to June 21, 2021, Class C shares automatically converted to Class A shares after a holding period of ten years from the initial date of purchase, with certain exceptions. The Fund may be affected by economic and political developments in the state of California.
2. Significant Accounting Policies.
The Fund is an investment company and applies the accounting and reporting guidance of the Financial Accounting Standards Board (FASB) Accounting Standards Codification Topic 946 Financial Services - Investment Companies. The financial statements have been prepared in conformity with accounting principles generally accepted in the United States of America (GAAP), which require management to make certain estimates and assumptions at the date of the financial statements. Actual results could differ from those estimates. Subsequent events, if any, through the date that the financial statements were issued have been evaluated in the preparation of the financial statements. The Fund's Schedule of Investments lists any underlying mutual funds or exchange-traded funds (ETFs) but does not include the underlying holdings of these funds. The following summarizes the significant accounting policies of the Fund:
Investment Valuation. Investments are valued as of 4:00 p.m. Eastern time on the last calendar day of the period. The Board of Trustees (the Board) has delegated the day to day responsibility for the valuation of the Fund's investments to the Fair Value Committee (the Committee) established by the Fund's investment adviser. In accordance with valuation policies and procedures approved by the Board, the Fund attempts to obtain prices from one or more third party pricing vendors or brokers to value its investments. When current market prices, quotations or currency exchange rates are not readily available or reliable, investments will be fair valued in good faith by the Committee, in accordance with procedures adopted by the Board. Factors used in determining fair value vary by investment type and may include market or investment specific events, changes in interest rates and credit quality. The frequency with which these procedures are used cannot be predicted and they may be utilized to a significant extent. The Committee oversees the Fund's valuation policies and procedures and reports to the Board on the Committee's activities and fair value determinations. The Board monitors the appropriateness of the procedures used in valuing the Fund's investments and ratifies the fair value determinations of the Committee.
The Fund categorizes the inputs to valuation techniques used to value its investments into a disclosure hierarchy consisting of three levels as shown below:
- Level 1 – Unadjusted quoted prices in active markets for identical investments
- Level 2 – other significant observable inputs (including quoted prices for similar investments, interest rates, prepayment speeds, etc.)
- Level 3 – unobservable inputs (including the Fund's own assumptions based on the best information available)
Valuation techniques used to value the Fund's investments by major category are as follows:
Debt securities, including restricted securities, are valued based on evaluated prices received from third party pricing vendors or from brokers who make markets in such securities. Municipal securities are valued by pricing vendors who utilize matrix pricing which considers yield or price of bonds of comparable quality, coupon, maturity and type or by broker-supplied prices. When independent prices are unavailable or unreliable, debt securities may be valued utilizing pricing methodologies which consider similar factors that would be used by third party pricing vendors. Debt securities are generally categorized as Level 2 in the hierarchy but may be Level 3 depending on the circumstances.
Changes in valuation techniques may result in transfers in or out of an assigned level within the disclosure hierarchy. The aggregate value of investments by input level as of February 28, 2022 is included at the end of the Fund's Schedule of Investments.
Investment Transactions and Income. For financial reporting purposes, the Fund's investment holdings and NAV include trades executed through the end of the last business day of the period. The NAV per share for processing shareholder transactions is calculated as of the close of business of the New York Stock Exchange (NYSE), normally 4:00 p.m. Eastern time and includes trades executed through the end of the prior business day. Gains and losses on securities sold are determined on the basis of identified cost. Interest income is accrued as earned and includes coupon interest and amortization of premium and accretion of discount on debt securities as applicable. Debt obligations may be placed on non-accrual status and related interest income may be reduced by ceasing current accruals and writing off interest receivables when the collection of all or a portion of interest has become doubtful based on consistently applied procedures. A debt obligation is removed from non-accrual status when the issuer resumes interest payments or when collectability of interest is reasonably assured.
Class Allocations and Expenses. Investment income, realized and unrealized capital gains and losses, common expenses of a fund, and certain fund-level expense reductions, if any, are allocated daily on a pro-rata basis to each class based on the relative net assets of each class to the total net assets of a fund. Each class differs with respect to transfer agent and distribution and service plan fees incurred, as applicable. Certain expense reductions may also differ by class, if applicable. For the reporting period, the allocated portion of income and expenses to each class as a percent of its average net assets may vary due to the timing of recording these transactions in relation to fluctuating net assets of the classes. Expenses directly attributable to a fund are charged to that fund. Expenses attributable to more than one fund are allocated among the respective funds on the basis of relative net assets or other appropriate methods. Expenses included in the accompanying financial statements reflect the expenses of that fund and do not include any expenses associated with any underlying mutual funds or exchange-traded funds. Although not included in a fund's expenses, a fund indirectly bears its proportionate share of these expenses through the net asset value of each underlying mutual fund or exchange-traded fund. Expense estimates are accrued in the period to which they relate and adjustments are made when actual amounts are known.
Income Tax Information and Distributions to Shareholders. Each year, the Fund intends to qualify as a regulated investment company under Subchapter M of the Internal Revenue Code, including distributing substantially all of its taxable income and realized gains. As a result, no provision for U.S. Federal income taxes is required. As of February 28, 2022, the Fund did not have any unrecognized tax benefits in the financial statements; nor is the Fund aware of any tax positions for which it is reasonably possible that the total amounts of unrecognized tax benefits will significantly change in the next twelve months. The Fund files a U.S. federal tax return, in addition to state and local tax returns as required. The Fund's federal income tax returns are subject to examination by the Internal Revenue Service (IRS) for a period of three fiscal years after they are filed. State and local tax returns may be subject to examination for an additional fiscal year depending on the jurisdiction.
Distributions are declared and recorded daily and paid monthly from net investment income. Distributions from realized gains, if any, are declared and recorded on the ex-dividend date. Income and capital gain distributions are declared separately for each class. Income and capital gain distributions are determined in accordance with income tax regulations, which may differ from GAAP.
Capital accounts within the financial statements are adjusted for permanent book-tax differences. These adjustments have no impact on net assets or the results of operations. Capital accounts are not adjusted for temporary book-tax differences which will reverse in a subsequent period.
Book-tax differences are primarily due to market discount and losses deferred due to futures transactions and excise tax regulations.
The Fund purchases municipal securities whose interest, in the opinion of the issuer, is free from federal income tax. There is no assurance that the IRS will agree with this opinion. In the event the IRS determines that the issuer does not comply with relevant tax requirements, interest payments from a security could become federally taxable, possibly retroactively to the date the security was issued.
As of period end, the cost and unrealized appreciation (depreciation) in securities, and derivatives if applicable, for federal income tax purposes were as follows:
| Gross unrealized appreciation | $100,703 |
| Gross unrealized depreciation | (20,501) |
| Net unrealized appreciation (depreciation) | $80,202 |
| Tax Cost | $2,084,111 |
The tax-based components of distributable earnings as of period end were as follows:
| Net unrealized appreciation (depreciation) on securities and other investments | $80,202 |
The Fund intends to elect to defer to its next fiscal year $960 of capital losses recognized during the period November 1, 2021 to February 28, 2022.
The tax character of distributions paid was as follows:
| February 28, 2022 | February 28, 2021 | |
| Tax-exempt Income | $49,732 | $53,322 |
| Ordinary Income | – | 1,492 |
| Long-term Capital Gains | 10,430 | 5,930 |
| Total | $60,162 | $ 60,744 |
Delayed Delivery Transactions and When-Issued Securities. During the period, certain Funds transacted in securities on a delayed delivery or when-issued basis. Payment and delivery may take place after the customary settlement period for that security. The price of the underlying securities and the date when the securities will be delivered and paid for are fixed at the time the transaction is negotiated. Securities purchased on a delayed delivery or when-issued basis are identified as such in the Schedule of Investments. Compensation for interest forgone in the purchase of a delayed delivery or when-issued debt security may be received. With respect to purchase commitments, each applicable Fund identifies securities as segregated in its records with a value at least equal to the amount of the commitment. Payables and receivables associated with the purchases and sales of delayed delivery securities having the same coupon, settlement date and broker are offset. Delayed delivery or when-issued securities that have been purchased from and sold to different brokers are reflected as both payables and receivables in the Statement of Assets and Liabilities under the caption "Delayed delivery", as applicable. Losses may arise due to changes in the value of the underlying securities or if the counterparty does not perform under the contract's terms, or if the issuer does not issue the securities due to political, economic, or other factors.
Restricted Securities (including Private Placements). Funds may invest in securities that are subject to legal or contractual restrictions on resale. These securities generally may be resold in transactions exempt from registration or to the public if the securities are registered. Disposal of these securities may involve time-consuming negotiations and expense, and prompt sale at an acceptable price may be difficult. Information regarding restricted securities held at period end is included at the end of the Schedule of Investments, if applicable.
3. Purchases and Sales of Investments.
Purchases and sales of securities, other than short-term securities, and in-kind transactions, as applicable, are noted in the table below.
| Purchases ($) | Sales ($) | |
| Fidelity California Municipal Income Fund | 376,840 | 314,033 |
4. Fees and Other Transactions with Affiliates.
Management Fee. Fidelity Management & Research Company LLC (the investment adviser) and its affiliates provide the Fund with investment management related services for which the Fund pays a monthly management fee. The management fee is the sum of an individual fund fee rate that is based on an annual rate of .25% of the Fund's average net assets and an annualized group fee rate that averaged 0.10% during the period. The group fee rate is based upon the monthly average net assets of a group of registered investment companies with which the investment adviser has management contracts. The group fee rate decreases as assets under management increase and increases as assets under management decrease. For the reporting period, the total annual management fee rate was .35% of the Fund's average net assets.
Distribution and Service Plan Fees. In accordance with Rule 12b-1 of the 1940 Act, the Fund has adopted separate Distribution and Service Plans for each class of shares. Certain classes pay Fidelity Distributors Company LLC (FDC), an affiliate of the investment adviser, separate Distribution and Service Fees, each of which is based on an annual percentage of each class' average net assets. In addition, FDC may pay financial intermediaries for selling shares of the Fund and providing shareholder support services. For the period, the Distribution and Service Fee rates, total fees and amounts retained by FDC were as follows:
| Distribution Fee | Service Fee | Total Fees | Retained by FDC | |
| Class A | -% | .25% | $154 | $8 |
| Class M | -% | .25% | 13 | – |
| Class C | .75% | .25% | 174 | 23 |
| $341 | $31 |
Sales Load. FDC may receive a front-end sales charge of up to 4.00% for selling Class A shares and Class M shares, some of which is paid to financial intermediaries for selling shares of the Fund. Depending on the holding period, FDC may receive contingent deferred sales charges levied on Class A, Class M and Class C redemptions. The deferred sales charges are 1.00% for Class C shares, .75% for certain purchases of Class A shares and .25% for certain purchases of Class M shares.
For the period, sales charge amounts retained by FDC were as follows:
| Retained by FDC | |
| Class A | $4 |
| Class M | –(a) |
| Class C(b) | 1 |
| $5 |
(a) In the amount of less than five hundred dollars.
(b) When Class C shares are initially sold, FDC pays commissions from its own resources to financial intermediaries through which the sales are made.
Transfer Agent Fees. Fidelity Investments Institutional Operations Company LLC (FIIOC), an affiliate of the investment adviser, is the transfer, dividend disbursing and shareholder servicing agent for the Fund. FIIOC receives account fees and asset-based fees that vary according to the account size and type of account of the shareholders of the respective classes of the Fund, except for Class Z. FIIOC receives an asset-based fee of Class Z's average net assets. FIIOC pays for typesetting, printing and mailing of shareholder reports, except proxy statements. For the period, transfer agent fees for each class were as follows:
| Amount | % of Class-Level Average Net Assets | |
| Class A | $100 | .16 |
| Class M | 4 | .08 |
| Class C | 27 | .16 |
| California Municipal Income | 1,612 | .08 |
| Class I | 99 | .17 |
| Class Z | 30 | .05 |
| $1,872 |
Accounting Fees. Fidelity Service Company, Inc. (FSC), an affiliate of the investment adviser, maintains the Fund's accounting records. The accounting fee is based on the level of average net assets for each month. For the period, the fees were equivalent to the following annual rates:
| % of Average Net Assets | |
| Fidelity California Municipal Income Fund | .02 |
Interfund Trades. Funds may purchase from or sell securities to other Fidelity Funds under procedures adopted by the Board. The procedures have been designed to ensure these interfund trades are executed in accordance with Rule 17a-7 of the 1940 Act. Any interfund trades are included within the respective purchases and sales amounts shown in the Purchases and Sales of Investments note. Interfund trades during the period are noted in the table below.
| Purchases ($) | Sales ($) | Realized Gain (Loss) ($) | |
| Fidelity California Municipal Income Fund | 8,250 | 23,760 | – |
5. Committed Line of Credit.
Certain Funds participate with other funds managed by the investment adviser or an affiliate in a $4.25 billion credit facility (the "line of credit") to be utilized for temporary or emergency purposes to fund shareholder redemptions or for other short-term liquidity purposes. The participating funds have agreed to pay commitment fees on their pro-rata portion of the line of credit, which are reflected in Miscellaneous expenses on the Statement of Operations, and are listed below. During the period, there were no borrowings on this line of credit.
| Amount | |
| Fidelity California Municipal Income Fund | $4 |
6. Expense Reductions.
Through arrangements with the Fund's custodian, credits realized as a result of certain uninvested cash balances were used to reduce the Fund's expenses. During the period, custodian credits reduced the Fund's expenses by $19.
In addition, during the period the investment adviser or an affiliate reimbursed and/or waived a portion of fund-level operating expenses in the amount of $29.
7. Distributions to Shareholders.
Distributions to shareholders of each class were as follows:
| Year ended February 28, 2022 | Year ended February 28, 2021 | |
| Fidelity California Municipal Income Fund | ||
| Distributions to shareholders | ||
| Class A | $1,413 | $ 1,414 |
| Class M | 126 | 172 |
| Class C | 268 | 362 |
| California Municipal Income | 55,279 | 55,710 |
| Class I | 1,496 | 1,798 |
| Class Z | 1,580 | 1,288 |
| Total | $60,162 | $60,744 |
8. Share Transactions.
Share transactions for each class were as follows and may contain in-kind transactions, automatic conversions between classes or exchanges between affiliated funds:
| Shares | Shares | Dollars | Dollars | |
| Year ended February 28, 2022 | Year ended February 28, 2021 | Year ended February 28, 2022 | Year ended February 28, 2021 | |
| Fidelity California Municipal Income Fund | ||||
| Class A | ||||
| Shares sold | 614 | 1,332 | $8,217 | $17,591 |
| Reinvestment of distributions | 94 | 92 | 1,250 | 1,226 |
| Shares redeemed | (651) | (963) | (8,683) | (12,648) |
| Net increase (decrease) | 57 | 461 | $784 | $6,169 |
| Class M | ||||
| Shares sold | 19 | 19 | $255 | $265 |
| Reinvestment of distributions | 9 | 12 | 115 | 157 |
| Shares redeemed | (33) | (410) | (436) | (5,420) |
| Net increase (decrease) | (5) | (379) | $(66) | $(4,998) |
| Class C | ||||
| Shares sold | 43 | 314 | $579 | $4,189 |
| Reinvestment of distributions | 19 | 25 | 249 | 332 |
| Shares redeemed | (548) | (520) | (7,311) | (6,871) |
| Net increase (decrease) | (486) | (181) | $(6,483) | $(2,350) |
| California Municipal Income | ||||
| Shares sold | 29,380 | 30,747 | $390,522 | $407,779 |
| Reinvestment of distributions | 2,279 | 2,350 | 30,348 | 31,187 |
| Shares redeemed | (34,305) | (37,400) | (451,641) | (488,937) |
| Net increase (decrease) | (2,646) | (4,303) | $(30,771) | $(49,971) |
| Class I | ||||
| Shares sold | 489 | 2,730 | $6,565 | $35,710 |
| Reinvestment of distributions | 95 | 116 | 1,273 | 1,539 |
| Shares redeemed | (1,565) | (2,127) | (20,938) | (28,027) |
| Net increase (decrease) | (981) | 719 | $(13,100) | $9,222 |
| Class Z | ||||
| Shares sold | 1,636 | 2,031 | $21,884 | $27,019 |
| Reinvestment of distributions | 107 | 92 | 1,425 | 1,220 |
| Shares redeemed | (1,073) | (1,290) | (14,288) | (16,967) |
| Net increase (decrease) | 670 | 833 | $9,021 | $11,272 |
9. Other.
A fund's organizational documents provide former and current trustees and officers with a limited indemnification against liabilities arising in connection with the performance of their duties to the fund. In the normal course of business, a fund may also enter into contracts that provide general indemnifications. A fund's maximum exposure under these arrangements is unknown as this would be dependent on future claims that may be made against a fund. The risk of material loss from such claims is considered remote.
10. Coronavirus (COVID-19) Pandemic.
An outbreak of COVID-19 first detected in China during December 2019 has since spread globally and was declared a pandemic by the World Health Organization during March 2020. Developments that disrupt global economies and financial markets, such as the COVID-19 pandemic, may magnify factors that affect the Fund's performance.
Report of Independent Registered Public Accounting Firm
To the Board of Trustees of Fidelity California Municipal Trust and Shareholders of Fidelity California Municipal Income Fund
Opinion on the Financial Statements
We have audited the accompanying statement of assets and liabilities, including the schedule of investments, of Fidelity California Municipal Income Fund (one of the funds constituting Fidelity California Municipal Trust, referred to hereafter as the “Fund”) as of February 28, 2022, the related statement of operations for the year ended February 28, 2022, the statement of changes in net assets for each of the two years in the period ended February 28, 2022, including the related notes, and the financial highlights for each of the periods indicated therein (collectively referred to as the “financial statements”). In our opinion, the financial statements present fairly, in all material respects, the financial position of the Fund as of February 28, 2022, the results of its operations for the year then ended, the changes in its net assets for each of the two years in the period ended February 28, 2022 and the financial highlights for each of the periods indicated therein in conformity with accounting principles generally accepted in the United States of America.
Basis for Opinion
These financial statements are the responsibility of the Fund’s management. Our responsibility is to express an opinion on the Fund’s financial statements based on our audits. We are a public accounting firm registered with the Public Company Accounting Oversight Board (United States) (PCAOB) and are required to be independent with respect to the Fund in accordance with the U.S. federal securities laws and the applicable rules and regulations of the Securities and Exchange Commission and the PCAOB.
We conducted our audits of these financial statements in accordance with the standards of the PCAOB. Those standards require that we plan and perform the audit to obtain reasonable assurance about whether the financial statements are free of material misstatement, whether due to error or fraud.
Our audits included performing procedures to assess the risks of material misstatement of the financial statements, whether due to error or fraud, and performing procedures that respond to those risks. Such procedures included examining, on a test basis, evidence regarding the amounts and disclosures in the financial statements. Our audits also included evaluating the accounting principles used and significant estimates made by management, as well as evaluating the overall presentation of the financial statements. Our procedures included confirmation of securities owned as of February 28, 2022 by correspondence with the custodian and brokers; when replies were not received from brokers, we performed other auditing procedures. We believe that our audits provide a reasonable basis for our opinion.
/s/ PricewaterhouseCoopers LLP
Boston, Massachusetts
April 14, 2022
We have served as the auditor of one or more investment companies in the Fidelity group of funds since 1932.
Trustees and Officers
The Trustees, Members of the Advisory Board (if any), and officers of the trust and fund, as applicable, are listed below. The Board of Trustees governs the fund and is responsible for protecting the interests of shareholders. The Trustees are experienced executives who meet periodically throughout the year to oversee the fund's activities, review contractual arrangements with companies that provide services to the fund, oversee management of the risks associated with such activities and contractual arrangements, and review the fund's performance. Each of the Trustees oversees 292 funds.
The Trustees hold office without limit in time except that (a) any Trustee may resign; (b) any Trustee may be removed by written instrument, signed by at least two-thirds of the number of Trustees prior to such removal; (c) any Trustee who requests to be retired or who has become incapacitated by illness or injury may be retired by written instrument signed by a majority of the other Trustees; and (d) any Trustee may be removed at any special meeting of shareholders by a two-thirds vote of the outstanding voting securities of the trust. Each Trustee who is not an interested person (as defined in the 1940 Act) of the trust and the fund is referred to herein as an Independent Trustee. Each Independent Trustee shall retire not later than the last day of the calendar year in which his or her 75th birthday occurs. The Independent Trustees may waive this mandatory retirement age policy with respect to individual Trustees. Officers and Advisory Board Members hold office without limit in time, except that any officer or Advisory Board Member may resign or may be removed by a vote of a majority of the Trustees at any regular meeting or any special meeting of the Trustees. Except as indicated, each individual has held the office shown or other offices in the same company for the past five years.
The fund's Statement of Additional Information (SAI) includes more information about the Trustees. To request a free copy, call Fidelity at 1-800-544-8544 if you’re an individual investing directly with Fidelity, call 1-800-835-5092 if you’re a plan sponsor or participant with Fidelity as your recordkeeper or call 1-877-208-0098 on institutional accounts or if you’re an advisor or invest through one.
Experience, Skills, Attributes, and Qualifications of the Trustees. The Governance and Nominating Committee has adopted a statement of policy that describes the experience, qualifications, attributes, and skills that are necessary and desirable for potential Independent Trustee candidates (Statement of Policy). The Board believes that each Trustee satisfied at the time he or she was initially elected or appointed a Trustee, and continues to satisfy, the standards contemplated by the Statement of Policy. The Governance and Nominating Committee also engages professional search firms to help identify potential Independent Trustee candidates who have the experience, qualifications, attributes, and skills consistent with the Statement of Policy. From time to time, additional criteria based on the composition and skills of the current Independent Trustees, as well as experience or skills that may be appropriate in light of future changes to board composition, business conditions, and regulatory or other developments, have also been considered by the professional search firms and the Governance and Nominating Committee. In addition, the Board takes into account the Trustees' commitment and participation in Board and committee meetings, as well as their leadership of standing and ad hoc committees throughout their tenure.
In determining that a particular Trustee was and continues to be qualified to serve as a Trustee, the Board has considered a variety of criteria, none of which, in isolation, was controlling. The Board believes that, collectively, the Trustees have balanced and diverse experience, qualifications, attributes, and skills, which allow the Board to operate effectively in governing the fund and protecting the interests of shareholders. Information about the specific experience, skills, attributes, and qualifications of each Trustee, which in each case led to the Board's conclusion that the Trustee should serve (or continue to serve) as a trustee of the fund, is provided below.
Board Structure and Oversight Function. Abigail P. Johnson is an interested person and currently serves as Chairman. The Trustees have determined that an interested Chairman is appropriate and benefits shareholders because an interested Chairman has a personal and professional stake in the quality and continuity of services provided to the fund. Independent Trustees exercise their informed business judgment to appoint an individual of their choosing to serve as Chairman, regardless of whether the Trustee happens to be independent or a member of management. The Independent Trustees have determined that they can act independently and effectively without having an Independent Trustee serve as Chairman and that a key structural component for assuring that they are in a position to do so is for the Independent Trustees to constitute a substantial majority for the Board. The Independent Trustees also regularly meet in executive session. Michael E. Kenneally serves as Chairman of the Independent Trustees and as such (i) acts as a liaison between the Independent Trustees and management with respect to matters important to the Independent Trustees and (ii) with management prepares agendas for Board meetings.
Fidelity® funds are overseen by different Boards of Trustees. The fund's Board oversees Fidelity's investment-grade bond, money market, asset allocation and certain equity funds, and other Boards oversee Fidelity's high income and other equity funds. The asset allocation funds may invest in Fidelity® funds that are overseen by such other Boards. The use of separate Boards, each with its own committee structure, allows the Trustees of each group of Fidelity® funds to focus on the unique issues of the funds they oversee, including common research, investment, and operational issues. On occasion, the separate Boards establish joint committees to address issues of overlapping consequences for the Fidelity® funds overseen by each Board.
The Trustees operate using a system of committees to facilitate the timely and efficient consideration of all matters of importance to the Trustees, the fund, and fund shareholders and to facilitate compliance with legal and regulatory requirements and oversight of the fund's activities and associated risks. The Board, acting through its committees, has charged FMR and its affiliates with (i) identifying events or circumstances the occurrence of which could have demonstrably adverse effects on the fund's business and/or reputation; (ii) implementing processes and controls to lessen the possibility that such events or circumstances occur or to mitigate the effects of such events or circumstances if they do occur; and (iii) creating and maintaining a system designed to evaluate continuously business and market conditions in order to facilitate the identification and implementation processes described in (i) and (ii) above. Because the day-to-day operations and activities of the fund are carried out by or through FMR, its affiliates, and other service providers, the fund's exposure to risks is mitigated but not eliminated by the processes overseen by the Trustees. While each of the Board's committees has responsibility for overseeing different aspects of the fund's activities, oversight is exercised primarily through the Operations and Audit Committees. In addition, an ad hoc Board committee of Independent Trustees has worked with FMR to enhance the Board's oversight of investment and financial risks, legal and regulatory risks, technology risks, and operational risks, including the development of additional risk reporting to the Board. Appropriate personnel, including but not limited to the fund's Chief Compliance Officer (CCO), FMR's internal auditor, the independent accountants, the fund's Treasurer and portfolio management personnel, make periodic reports to the Board's committees, as appropriate, including an annual review of Fidelity's risk management program for the Fidelity® funds. The responsibilities of each standing committee, including their oversight responsibilities, are described further under "Standing Committees of the Trustees."
Interested Trustees*:
Correspondence intended for a Trustee who is an interested person may be sent to Fidelity Investments, 245 Summer Street, Boston, Massachusetts 02210.
Name, Year of Birth; Principal Occupations and Other Relevant Experience+
Abigail P. Johnson (1961)
Year of Election or Appointment: 2009
Trustee
Chairman of the Board of Trustees
Ms. Johnson also serves as Trustee of other Fidelity® funds. Ms. Johnson serves as Chairman (2016-present), Chief Executive Officer (2014-present), and Director (2007-present) of FMR LLC (diversified financial services company), President of Fidelity Financial Services (2012-present) and President of Personal, Workplace and Institutional Services (2005-present). Ms. Johnson is Chairman and Director of Fidelity Management & Research Company LLC (investment adviser firm, 2011-present). Previously, Ms. Johnson served as Chairman and Director of FMR Co., Inc. (investment adviser firm, 2011-2019), Vice Chairman (2007-2016) and President (2013-2016) of FMR LLC, President and a Director of Fidelity Management & Research Company (2001-2005), a Trustee of other investment companies advised by Fidelity Management & Research Company, Fidelity Investments Money Management, Inc. (investment adviser firm), and FMR Co., Inc. (2001-2005), Senior Vice President of the Fidelity® funds (2001-2005), and managed a number of Fidelity® funds. Ms. Abigail P. Johnson and Mr. Arthur E. Johnson are not related.
Jennifer Toolin McAuliffe (1959)
Year of Election or Appointment: 2016
Trustee
Ms. McAuliffe also serves as Trustee of other Fidelity® funds and as Trustee of Fidelity Charitable (2020-present). Previously, Ms. McAuliffe served as Co-Head of Fixed Income of Fidelity Investments Limited (now known as FIL Limited (FIL)) (diversified financial services company), Director of Research for FIL’s credit and quantitative teams in London, Hong Kong and Tokyo and Director of Research for taxable and municipal bonds at Fidelity Investments Money Management, Inc. Ms. McAuliffe previously served as a member of the Advisory Board of certain Fidelity® funds (2016). Ms. McAuliffe was previously a lawyer at Ropes & Gray LLP and currently serves as director or trustee of several not-for-profit entities.
* Determined to be an “Interested Trustee” by virtue of, among other things, his or her affiliation with the trust or various entities under common control with FMR.
+ The information includes the Trustee's principal occupation during the last five years and other information relating to the experience, attributes, and skills relevant to the Trustee's qualifications to serve as a Trustee, which led to the conclusion that the Trustee should serve as a Trustee for the fund.
Independent Trustees:
Correspondence intended for an Independent Trustee may be sent to Fidelity Investments, P.O. Box 55235, Boston, Massachusetts 02205-5235.
Name, Year of Birth; Principal Occupations and Other Relevant Experience+
Elizabeth S. Acton (1951)
Year of Election or Appointment: 2013
Trustee
Ms. Acton also serves as Trustee of other Fidelity® funds. Prior to her retirement, Ms. Acton served as Executive Vice President, Finance (2011-2012), Executive Vice President, Chief Financial Officer (2002-2011) and Treasurer (2004-2005) of Comerica Incorporated (financial services). Prior to joining Comerica, Ms. Acton held a variety of positions at Ford Motor Company (1983-2002), including Vice President and Treasurer (2000-2002) and Executive Vice President and Chief Financial Officer of Ford Motor Credit Company (1998-2000). Ms. Acton currently serves as a member of the Board and Audit and Finance Committees of Beazer Homes USA, Inc. (homebuilding, 2012-present). Ms. Acton previously served as a member of the Advisory Board of certain Fidelity® funds (2013-2016).
Ann E. Dunwoody (1953)
Year of Election or Appointment: 2018
Trustee
General Dunwoody also serves as Trustee of other Fidelity® funds. General Dunwoody (United States Army, Retired) was the first woman in U.S. military history to achieve the rank of four-star general and prior to her retirement in 2012 held a variety of positions within the U.S. Army, including Commanding General, U.S. Army Material Command (2008-2012). General Dunwoody currently serves as President of First to Four LLC (leadership and mentoring services, 2012-present), a member of the Board and Nomination and Corporate Governance Committees of Kforce Inc. (professional staffing services, 2016-present) and a member of the Board of Automattic Inc. (software engineering, 2018-present). Previously, General Dunwoody served as a member of the Advisory Board and Nominating and Corporate Governance Committee of L3 Technologies, Inc. (communication, electronic, sensor and aerospace systems, 2013-2019) and a member of the Board and Audit and Sustainability and Corporate Responsibility Committees of Republic Services, Inc. (waste collection, disposal and recycling, 2013-2016). Ms. Dunwoody also serves on several boards for non-profit organizations, including as a member of the Board, Chair of the Nomination and Governance Committee and a member of the Audit Committee of Logistics Management Institute (consulting non-profit, 2012-present), a member of the Council of Trustees for the Association of the United States Army (advocacy non-profit, 2013-present), a member of the Board of Florida Institute of Technology (2015-present) and a member of the Board of ThanksUSA (military family education non-profit, 2014-present). General Dunwoody previously served as a member of the Advisory Board of certain Fidelity® funds (2018).
John Engler (1948)
Year of Election or Appointment: 2014
Trustee
Mr. Engler also serves as Trustee of other Fidelity® funds. Previously, Mr. Engler served as Governor of Michigan (1991-2003), President of the Business Roundtable (2011-2017) and interim President of Michigan State University (2018-2019). Mr. Engler currently serves as a member of the Board of Stride, Inc. (formerly K12 Inc.) (technology-based education company, 2012-present). Previously, Mr. Engler served as a member of the Board of Universal Forest Products (manufacturer and distributor of wood and wood-alternative products, 2003-2019) and Trustee of The Munder Funds (2003-2014). Mr. Engler previously served as a member of the Advisory Board of certain Fidelity® funds (2014-2016).
Robert F. Gartland (1951)
Year of Election or Appointment: 2010
Trustee
Mr. Gartland also serves as Trustee of other Fidelity® funds. Prior to his retirement, Mr. Gartland held a variety of positions at Morgan Stanley (financial services, 1979-2007), including Managing Director (1987-2007) and Chase Manhattan Bank (1975-1978). Mr. Gartland previously served as Chairman and an investor in Gartland & Mellina Group Corp. (consulting, 2009-2019), as a member of the Board of National Securities Clearing Corporation (1993-1996) and as Chairman of TradeWeb (2003-2004).
Arthur E. Johnson (1947)
Year of Election or Appointment: 2008
Trustee
Mr. Johnson also serves as Trustee of other Fidelity® funds. Prior to his retirement, Mr. Johnson served as Senior Vice President of Corporate Strategic Development of Lockheed Martin Corporation (defense contractor, 1999-2009). Mr. Johnson currently serves as a member of the Board of Booz Allen Hamilton (management consulting, 2011-present). Mr. Johnson previously served as a member of the Board of Eaton Corporation plc (diversified power management, 2009-2019) and a member of the Board of AGL Resources, Inc. (holding company, 2002-2016). Mr. Johnson previously served as Chairman (2018-2021) and Vice Chairman (2015-2018) of the Independent Trustees of certain Fidelity® funds. Mr. Arthur E. Johnson is not related to Ms. Abigail P. Johnson.
Michael E. Kenneally (1954)
Year of Election or Appointment: 2009
Trustee
Chairman of the Independent Trustees
Mr. Kenneally also serves as Trustee of other Fidelity® funds and was Vice Chairman (2018-2021) of the Independent Trustees of certain Fidelity® funds. Prior to retirement in 2005, he was Chairman and Global Chief Executive Officer of Credit Suisse Asset Management, the worldwide fund management and institutional investment business of Credit Suisse Group. Previously, Mr. Kenneally was an Executive Vice President and the Chief Investment Officer for Bank of America. In this role, he was responsible for the investment management, strategy and products delivered to the bank’s institutional, high-net-worth and retail clients. Earlier, Mr. Kenneally directed the organization’s equity and quantitative research groups. He began his career as a research analyst and then spent more than a dozen years as a portfolio manager for endowments, pension plans and mutual funds. He earned the Chartered Financial Analyst (CFA) designation in 1991.
Marie L. Knowles (1946)
Year of Election or Appointment: 2001
Trustee
Ms. Knowles also serves as Trustee of other Fidelity® funds. Prior to her retirement, Ms. Knowles held several positions at Atlantic Richfield Company (diversified energy), including Executive Vice President and Chief Financial Officer (1996-2000), Senior Vice President (1993-1996) and President of ARCO Transportation Company (pipeline and tanker operations, 1993-1996). Ms. Knowles currently serves as a member of the Board of the Santa Catalina Island Company (real estate, 2009-present), a member of the Investment Company Institute Board of Governors and a member of the Governing Council of the Independent Directors Council (2014-present). Ms. Knowles also serves as a member of the Advisory Board for the School of Engineering of the University of Southern California. Ms. Knowles previously served as a member of the Board of McKesson Corporation (healthcare service, 2002-2021). In addition, Ms. Knowles previously served as Chairman (2015-2018) and Vice Chairman (2012-2015) of the Independent Trustees of certain Fidelity® funds.
Mark A. Murray (1954)
Year of Election or Appointment: 2016
Trustee
Mr. Murray also serves as Trustee of other Fidelity® funds. Previously, Mr. Murray served as Co-Chief Executive Officer (2013-2016), President (2006-2013) and Vice Chairman (2013-2020) of Meijer, Inc. Mr. Murray serves as a member of the Board (2009-present) and Public Policy and Responsibility Committee (2009-present) and Chair of the Nuclear Review Committee (2019-present) of DTE Energy Company (diversified energy company). Mr. Murray previously served as a member of the Board of Spectrum Health (not-for-profit health system, 2015-2019) and as a member of the Board and Audit Committee and Chairman of the Nominating and Corporate Governance Committee of Universal Forest Products, Inc. (manufacturer and distributor of wood and wood-alternative products, 2004-2016). Mr. Murray also serves as a member of the Board of many community and professional organizations. Mr. Murray previously served as a member of the Advisory Board of certain Fidelity® funds (2016).
+ The information includes the Trustee's principal occupation during the last five years and other information relating to the experience, attributes, and skills relevant to the Trustee's qualifications to serve as a Trustee, which led to the conclusion that the Trustee should serve as a Trustee for the fund.
Advisory Board Members and Officers:
Correspondence intended for an officer may be sent to Fidelity Investments, 245 Summer Street, Boston, Massachusetts 02210. Officers appear below in alphabetical order.
Name, Year of Birth; Principal Occupation
Robert W. Helm (1957)
Year of Election or Appointment: 2021
Member of the Advisory Board
Mr. Helm also serves as a Member of the Advisory Board of other Fidelity® funds. Mr. Helm was formerly Deputy Chairman (2003-2020), partner (1991-2020) and an associate (1984-1991) of Dechert LLP (formerly Dechert Price & Rhoads). Mr. Helm currently serves on boards and committees of several not-for-profit organizations.
Craig S. Brown (1977)
Year of Election or Appointment: 2019
Assistant Treasurer
Mr. Brown also serves as an officer of other funds. Mr. Brown serves as Assistant Treasurer of FIMM, LLC (2021-present) and is an employee of Fidelity Investments (2013-present).
John J. Burke III (1964)
Year of Election or Appointment: 2018
Chief Financial Officer
Mr. Burke also serves as Chief Financial Officer of other funds. Mr. Burke serves as Head of Investment Operations for Fidelity Fund and Investment Operations (2018-present) and is an employee of Fidelity Investments (1998-present). Previously Mr. Burke served as head of Asset Management Investment Operations (2012-2018).
David J. Carter (1973)
Year of Election or Appointment: 2020
Assistant Secretary
Mr. Carter also serves as Assistant Secretary of other funds. Mr. Carter serves as Vice President, Associate General Counsel (2010-present) and is an employee of Fidelity Investments (2005-present).
Jonathan Davis (1968)
Year of Election or Appointment: 2010
Assistant Treasurer
Mr. Davis also serves as an officer of other funds. Mr. Davis serves as Assistant Treasurer of FIMM, LLC (2021-present), FMR Capital, Inc. (2017-present), FD Funds GP LLC (2021-present), FD Funds Holding LLC (2021-present), and FD Funds Management LLC (2021-present); and is an employee of Fidelity Investments. Previously, Mr. Davis served as Vice President and Associate General Counsel of FMR LLC (diversified financial services company, 2003-2010).
Laura M. Del Prato (1964)
Year of Election or Appointment: 2018
President and Treasurer
Ms. Del Prato also serves as an officer of other funds. Ms. Del Prato serves as Assistant Treasurer of FIMM, LLC (2021-present) and is an employee of Fidelity Investments (2017-present). Previously, Ms. Del Prato served as President and Treasurer of The North Carolina Capital Management Trust: Cash Portfolio and Term Portfolio (2018-2020). Prior to joining Fidelity Investments, Ms. Del Prato served as a Managing Director and Treasurer of the JPMorgan Mutual Funds (2014-2017). Prior to JPMorgan, Ms. Del Prato served as a partner at Cohen Fund Audit Services (accounting firm, 2012-2013) and KPMG LLP (accounting firm, 2004-2012).
Colm A. Hogan (1973)
Year of Election or Appointment: 2016
Assistant Treasurer
Mr. Hogan also serves as an officer of other funds. Mr. Hogan serves as Assistant Treasurer of FIMM, LLC (2021-present) and FMR Capital, Inc. (2017-present) and is an employee of Fidelity Investments (2005-present). Previously, Mr. Hogan served as Deputy Treasurer of certain Fidelity® funds (2016-2020) and Assistant Treasurer of certain Fidelity® funds (2016-2018).
Cynthia Lo Bessette (1969)
Year of Election or Appointment: 2019
Secretary and Chief Legal Officer (CLO)
Ms. Lo Bessette also serves as an officer of other funds. Ms. Lo Bessette serves as CLO, Secretary, and Senior Vice President of Fidelity Management & Research Company LLC (investment adviser firm, 2019-present); CLO of Fidelity Management & Research (Hong Kong) Limited, FMR Investment Management (UK) Limited, and Fidelity Management & Research (Japan) Limited (investment adviser firms, 2019-present); Secretary of FD Funds GP LLC (2021-present), FD Funds Holding LLC (2021-present), and FD Funds Management LLC (2021-present); and Assistant Secretary of FIMM, LLC (2019-present). She is a Senior Vice President and Deputy General Counsel of FMR LLC (diversified financial services company, 2019-present), and is an employee of Fidelity Investments. Previously, Ms. Lo Bessette served as CLO, Secretary, and Senior Vice President of FMR Co., Inc. (investment adviser firm, 2019); Secretary of Fidelity SelectCo, LLC and Fidelity Investments Money Management, Inc. (investment adviser firms, 2019). Prior to joining Fidelity Investments, Ms. Lo Bessette was Executive Vice President, General Counsel (2016-2019) and Senior Vice President, Deputy General Counsel (2015-2016) of OppenheimerFunds (investment management company) and Deputy Chief Legal Officer (2013-2015) of Jennison Associates LLC (investment adviser firm).
Chris Maher (1972)
Year of Election or Appointment: 2013
Assistant Treasurer
Mr. Maher also serves as an officer of other funds. Mr. Maher serves as Assistant Treasurer of FIMM, LLC (2021-present) and FMR Capital, Inc. (2017-present), and is an employee of Fidelity Investments (2008-present). Previously, Mr. Maher served as Assistant Treasurer of certain funds (2013-2020); Vice President of Asset Management Compliance (2013), Vice President of the Program Management Group of FMR (investment adviser firm, 2010-2013), and Vice President of Valuation Oversight (2008-2010).
Jamie Pagliocco (1964)
Year of Election or Appointment: 2020
Vice President
Mr. Pagliocco also serves as Vice President of other funds. Mr. Pagliocco serves as President of Fixed Income (2020-present), and is an employee of Fidelity Investments (2001-present). Previously, Mr. Pagliocco served as Co-Chief Investment Officer – Bond (2017-2020), Global Head of Bond Trading (2016-2019), and as a portfolio manager.
Kenneth B. Robins (1969)
Year of Election or Appointment: 2020
Chief Compliance Officer
Mr. Robins also serves as an officer of other funds. Mr. Robins serves as Compliance Officer of Fidelity Management & Research Company LLC (investment adviser firm, 2016-present) and is an employee of Fidelity Investments (2004-present). Previously, Mr. Robins served as Compliance Officer of FMR Co., Inc. (investment adviser firm, 2016-2019), as Executive Vice President of Fidelity Investments Money Management, Inc. (investment adviser firm, 2013-2016) and served in other fund officer roles.
Brett Segaloff (1972)
Year of Election or Appointment: 2021
Anti-Money Laundering (AML) Officer
Mr. Segaloff also serves as an AML Officer of other funds and other related entities. He is Director, Anti-Money Laundering (2007-present) of FMR LLC (diversified financial services company) and is an employee of Fidelity Investments (1996-present).
Stacie M. Smith (1974)
Year of Election or Appointment: 2013
Assistant Treasurer
Ms. Smith also serves as an officer of other funds. Ms. Smith serves as Assistant Treasurer of FIMM, LLC (2021-present) and FMR Capital, Inc. (2017-present), is an employee of Fidelity Investments (2009-present), and has served in other fund officer roles. Prior to joining Fidelity Investments, Ms. Smith served as Senior Audit Manager of Ernst & Young LLP (accounting firm, 1996-2009). Previously, Ms. Smith served as Assistant Treasurer (2013-2019) and Deputy Treasurer (2013-2016) of certain Fidelity® funds.
Jim Wegmann (1979)
Year of Election or Appointment: 2021
Deputy Treasurer
Mr. Wegmann also serves as an officer of other funds. Mr. Wegmann serves as Assistant Treasurer of FIMM, LLC (2021-present) and is an employee of Fidelity Investments (2011-present). Previously, Mr. Wegmann served as Assistant Treasurer of certain Fidelity® funds (2019-2021).
Shareholder Expense Example
As a shareholder, you incur two types of costs: (1) transaction costs, which may include sales charges (loads) on purchase payments or redemption proceeds, as applicable and (2) ongoing costs, which generally include management fees, distribution and/or service (12b-1) fees and other Fund expenses. This Example is intended to help you understand your ongoing costs (in dollars) of investing in a fund and to compare these costs with the ongoing costs of investing in other mutual funds.
The Example is based on an investment of $1,000 invested at the beginning of the period and held for the entire period (September 1, 2021 to February 28, 2022).
Actual Expenses
The first line of the accompanying table provides information about actual account values and actual expenses. You may use the information in this line, together with the amount you invested, to estimate the expenses that you paid over the period. Simply divide your account value by $1,000.00 (for example, an $8,600 account value divided by $1,000.00 = 8.6), then multiply the result by the number in the first line for a class/Fund under the heading entitled "Expenses Paid During Period" to estimate the expenses you paid on your account during this period. If any fund is a shareholder of any underlying mutual funds or exchange-traded funds (ETFs) (the Underlying Funds), such fund indirectly bears its proportional share of the expenses of the Underlying Funds in addition to the direct expenses incurred presented in the table. These fees and expenses are not included in the annualized expense ratio used to calculate the expense estimate in the table below.
Hypothetical Example for Comparison Purposes
The second line of the accompanying table provides information about hypothetical account values and hypothetical expenses based on the actual expense ratio and an assumed rate of return of 5% per year before expenses, which is not the actual return. The hypothetical account values and expenses may not be used to estimate the actual ending account balance or expenses you paid for the period. You may use this information to compare the ongoing costs of investing in the Fund and other funds. To do so, compare this 5% hypothetical example with the 5% hypothetical examples that appear in the shareholder reports of the other funds. If any fund is a shareholder of any Underlying Funds, such fund indirectly bears its proportional share of the expenses of the Underlying Funds in addition to the direct expenses as presented in the table. These fees and expenses are not included in the annualized expense ratio used to calculate the expense estimate in the table below.
Please note that the expenses shown in the table are meant to highlight your ongoing costs only and do not reflect any transaction costs. Therefore, the second line of the table is useful in comparing ongoing costs only, and will not help you determine the relative total costs of owning different funds. In addition, if these transactional costs were included, your costs would have been higher.
| Annualized Expense Ratio-A | Beginning Account Value September 1, 2021 | Ending Account Value February 28, 2022 | Expenses Paid During Period-B September 1, 2021 to February 28, 2022 | |
| Fidelity California Municipal Income Fund | ||||
| Class A | .79% | |||
| Actual | $1,000.00 | $964.70 | $3.85 | |
| Hypothetical-C | $1,000.00 | $1,020.88 | $3.96 | |
| Class M | .68% | |||
| Actual | $1,000.00 | $965.30 | $3.31 | |
| Hypothetical-C | $1,000.00 | $1,021.42 | $3.41 | |
| Class C | 1.54% | |||
| Actual | $1,000.00 | $961.80 | $7.49 | |
| Hypothetical-C | $1,000.00 | $1,017.16 | $7.70 | |
| California Municipal Income | .45% | |||
| Actual | $1,000.00 | $966.30 | $2.19 | |
| Hypothetical-C | $1,000.00 | $1,022.56 | $2.26 | |
| Class I | .54% | |||
| Actual | $1,000.00 | $966.00 | $2.63 | |
| Hypothetical-C | $1,000.00 | $1,022.12 | $2.71 | |
| Class Z | .42% | |||
| Actual | $1,000.00 | $967.20 | $2.05 | |
| Hypothetical-C | $1,000.00 | $1,022.71 | $2.11 |
A Annualized expense ratio reflects expenses net of applicable fee waivers.
B Expenses are equal to the annualized expense ratio, multiplied by the average account value over the period, multiplied by 181/ 365 (to reflect the one-half year period). The fees and expenses of any Underlying Funds are not included in each annualized expense ratio.
C 5% return per year before expenses
Distributions (Unaudited)
The fund hereby designates as a capital gain dividend with respect to the taxable year ended February 28, 2022, $7,104,530, or, if subsequently determined to be different, the net capital gain of such year.
During fiscal year ended 2022, 100% of the fund's income dividends were free from federal income tax, and 18.66% of the fund's income dividends was subject to the federal alternative minimum tax.
The fund will notify shareholders in January 2023 of amounts for use in preparing 2022 income tax returns.
Board Approval of Investment Advisory Contracts and Management Fees
Fidelity California Municipal Income Fund
Each year, the Board of Trustees, including the Independent Trustees (together, the Board), votes on the renewal of the management contract with Fidelity Management & Research Company LLC (FMR) and the sub-advisory agreements (together, the Advisory Contracts) for the fund. FMR and the sub-advisers are referred to herein as the Investment Advisers. The Board, assisted by the advice of fund counsel and Independent Trustees' counsel, requests and considers a broad range of information relevant to the renewal of the Advisory Contracts throughout the year.The Board meets regularly and, at each of its meetings, covers an extensive agenda of topics and materials and considers factors that are relevant to its annual consideration of the renewal of the fund's Advisory Contracts, including the services and support provided to the fund and its shareholders. The Board has established four standing committees (Committees) — Operations, Audit, Fair Valuation, and Governance and Nominating — each composed of and chaired by Independent Trustees with varying backgrounds, to which the Board has assigned specific subject matter responsibilities in order to enhance effective decision-making by the Board. The Operations Committee, of which all of the Independent Trustees are members, meets regularly throughout the year and considers, among other matters, information specifically related to the annual consideration of the renewal of the fund's Advisory Contracts. The Board, acting directly and through its Committees, requests and receives information concerning the annual consideration of the renewal of the fund's Advisory Contracts. The Board also meets as needed to review matters specifically related to the Board's annual consideration of the renewal of the Advisory Contracts. Members of the Board may also meet with trustees of other Fidelity funds through joint ad hoc committees to discuss certain matters relevant to all of the Fidelity funds.At its September 2021 meeting, the Board unanimously determined to renew the fund's Advisory Contracts. In reaching its determination, the Board considered all factors it believed relevant, including (i) the nature, extent, and quality of the services provided to the fund and its shareholders (including the investment performance of the fund); (ii) the competitiveness relative to peer funds of the fund's management fee and total expense ratio of a representative class (the retail class); (iii) the total costs of the services provided by and the profits realized by Fidelity from its relationships with the fund; and (iv) the extent to which, if any, economies of scale exist and are realized as the fund grows, and whether any economies of scale are appropriately shared with fund shareholders.In considering whether to renew the Advisory Contracts for the fund, the Board reached a determination, with the assistance of fund counsel and Independent Trustees' counsel and through the exercise of its business judgment, that the renewal of the Advisory Contracts was in the best interests of the fund and its shareholders and that the compensation payable under the Advisory Contracts was fair and reasonable. The Board's decision to renew the Advisory Contracts was not based on any single factor, but rather was based on a comprehensive consideration of all the information provided to the Board at its meetings throughout the year. The Board, in reaching its determination to renew the Advisory Contracts, was aware that shareholders of the fund have a broad range of investment choices available to them, including a wide choice among funds offered by Fidelity's competitors, and that the fund's shareholders, who have the opportunity to review and weigh the disclosure provided by the fund in its prospectus and other public disclosures, have chosen to invest in this fund, which is part of the Fidelity family of funds.Nature, Extent, and Quality of Services Provided. The Board considered Fidelity's staffing as it relates to the fund, including the backgrounds of investment personnel of Fidelity, and also considered the fund's investment objective, strategies, and related investment philosophy. The Independent Trustees also had discussions with senior management of Fidelity's investment operations and investment groups. The Board considered the structure of the investment personnel compensation program and whether this structure provides appropriate incentives to act in the best interests of the fund. Additionally, the Board considered the portfolio managers' investments, if any, in the funds that they manage. The Board also considered the steps Fidelity had taken to ensure the continued provision of high quality services to the Fidelity funds during the COVID-19 pandemic, including the expansion of staff in client facing positions to maintain service levels in periods of high volumes and volatility.Resources Dedicated to Investment Management and Support Services. The Board reviewed the general qualifications and capabilities of Fidelity’s investment staff, including its size, education, experience, and resources, as well as Fidelity’s approach to recruiting, training, managing, and compensating investment personnel. The Board noted the resources devoted to Fidelity’s global investment organization, and that Fidelity’s analysts have extensive resources, tools and capabilities that allow them to conduct sophisticated quantitative and fundamental analysis, as well as credit analysis of issuers, counterparties and guarantors. Further, the Board considered that Fidelity’s investment professionals have sufficient access to global information and data so as to provide competitive investment results over time, and that those professionals also have access to sophisticated tools that permit them to assess portfolio construction and risk and performance attribution characteristics continuously, as well as to transmit new information and research conclusions rapidly around the world. Additionally, in its deliberations, the Board considered Fidelity’s trading, risk management, compliance, cybersecurity, and technology and operations capabilities and resources, which are integral parts of the investment management process.Shareholder and Administrative Services. The Board considered (i) the nature, extent, quality, and cost of advisory, administrative, and shareholder services performed by the Investment Advisers and their affiliates under the Advisory Contracts and under separate agreements covering transfer agency and pricing and bookkeeping services for the fund; (ii) the nature and extent of the supervision of third party service providers, principally custodians, subcustodians, and pricing vendors; and (iii) the resources devoted to, and the record of compliance with, the fund's compliance policies and procedures.The Board noted that the growth of fund assets over time across the complex allows Fidelity to reinvest in the development of services designed to enhance the value and convenience of the Fidelity funds as investment vehicles. These services include 24-hour access to account information and market information over the Internet and through telephone representatives, investor education materials and asset allocation tools. The Board also considered that it reviews customer service metrics such as telephone response times, continuity of services on the website and metrics addressing services at Fidelity Investor Centers.Investment in a Large Fund Family. The Board considered the benefits to shareholders of investing in a Fidelity fund, including the benefits of investing in a fund that is part of a large family of funds offering a variety of investment disciplines and providing a large variety of mutual fund investor services. The Board noted that Fidelity had taken, or had made recommendations to the Board that resulted in the Fidelity funds taking, a number of actions over the previous year that benefited particular funds, including: (i) continuing to dedicate additional resources to Fidelity's investment research process, which includes meetings with management of issuers of securities in which the funds invest; (ii) continuing efforts to enhance Fidelity's global research capabilities; (iii) launching new funds and ETFs with innovative structures, strategies and pricing and making other enhancements to meet client needs; (iv) launching new share classes of existing funds; (v) eliminating purchase minimums and broadening eligibility requirements for certain funds and share classes; (vi) reducing the holding period for the conversion of Class C shares to Class A shares; (vii) reducing management fees and total expenses for certain target date funds and classes and index funds; (viii) lowering expenses for certain existing funds and classes by implementing or lowering expense caps; (ix) rationalizing product lines and gaining increased efficiencies from fund mergers, liquidations, and share class consolidations; (x) continuing to develop, acquire and implement systems and technology to improve services to the funds and shareholders, strengthen information security, and increase efficiency; and (xi) continuing to implement enhancements to further strengthen Fidelity's product line to increase investors' probability of success in achieving their investment goals, including their retirement income goals.Investment Performance. The Board considered whether the fund has operated in accordance with its investment objective, as well as its record of compliance with its investment restrictions and its performance history.The Board took into account discussions that occur at Board meetings throughout the year with representatives of the Investment Advisers about fund investment performance. In this regard the Board noted that as part of regularly scheduled fund reviews and other reports to the Board on fund performance, the Board considers annualized return information for the fund for different time periods, measured against an appropriate securities market index (benchmark index) and an appropriate peer group of funds with similar objectives (peer group). The Board also reviews and considers information about performance attribution. In its evaluation of fund investment performance at meetings throughout the year, the Board gave particular attention to information indicating underperformance of certain Fidelity funds for specific time periods and discussed with the Investment Advisers the reasons for such underperformance.In addition to reviewing absolute and relative fund performance, the Independent Trustees periodically consider the appropriateness of fund performance metrics in evaluating the results achieved. In general, the Independent Trustees believe that fund performance should be evaluated based on gross performance (before fees and expenses but after transaction costs) compared to appropriate benchmark indices, over appropriate time periods that may include full market cycles, and on net performance (after fees and expenses) compared to appropriate peer groups, as applicable, over the same periods, taking into account relevant factors including the following: general market conditions; expectations for interest rate levels and credit conditions; issuer-specific information including credit quality; the potential for incremental return versus the fund's benchmark index weighed against the risks involved in obtaining that incremental return, including the risk of diminished or negative total returns; and fund cash flows and other factors. The Independent Trustees generally give greater weight to fund performance over longer time periods than over shorter time periods. Depending on the circumstances, the Independent Trustees may be satisfied with a fund's performance notwithstanding that it lags its benchmark index or peer group for certain periods.The Independent Trustees recognize that shareholders evaluate performance on a net basis over their own holding periods, for which one-, three-, and five-year periods are often used as a proxy. For this reason, the performance information reviewed by the Board also included net cumulative calendar year total return information for the fund and an appropriate benchmark index and peer group for the most recent one-, three-, and five-year periods. The Independent Trustees recognize that shareholders who are not investing through a tax-advantaged retirement account also consider tax consequences in evaluating performance.Based on its review, the Board concluded that the nature, extent, and quality of services provided to the fund under the Advisory Contracts should continue to benefit the shareholders of the fund.Competitiveness of Management Fee and Total Expense Ratio. The Board considered the fund's management fee and total expense ratio compared to "mapped groups" of competitive funds and classes created for the purpose of facilitating the Trustees' competitive analysis of management fees and total expenses. Fidelity creates "mapped groups" by combining similar Lipper investment objective categories that have comparable investment mandates. Combining Lipper investment objective categories aids the Board's management fee and total expense ratio comparisons by broadening the competitive group used for comparison.Management Fee. The Board considered two proprietary management fee comparisons for the 12-month periods shown in basis points (BP) in the chart below. The group of Lipper funds used by the Board for management fee comparisons is referred to below as the "Total Mapped Group" and is broader than the Lipper peer group used by the Board for performance comparisons. The Total Mapped Group comparison focuses on a fund's standing in terms of gross management fees before expense reimbursements or caps relative to the total universe of funds with comparable investment mandates, regardless of whether their management fee structures also are comparable. Funds with comparable investment mandates offer exposure to similar types of securities. Funds with comparable management fee structures have similar management fee contractual arrangements (e.g., flat rate charged for advisory services, all-inclusive fee rate, etc.). "TMG %" represents the percentage of funds in the Total Mapped Group that had management fees that were lower than the fund's. For example, a hypothetical TMG % of 20% would mean that 80% of the funds in the Total Mapped Group had higher, and 20% had lower, management fees than the fund. The fund's actual TMG %s and the number of funds in the Total Mapped Group are in the chart below. The "Asset-Sized Peer Group" (ASPG) comparison focuses on a fund's standing relative to a subset of non-Fidelity funds within the Total Mapped Group that are similar in size and management fee structure. For example, if a fund is in the first quartile of the ASPG, the fund's management fee ranks in the least expensive or lowest 25% of funds in the ASPG. The ASPG represents at least 15% of the funds in the Total Mapped Group with comparable asset size and management fee structures, subject to a minimum of 50 funds (or all funds in the Total Mapped Group if fewer than 50). Additional information, such as the ASPG quartile in which the fund's management fee rate ranked, is also included in the chart and was considered by the Board.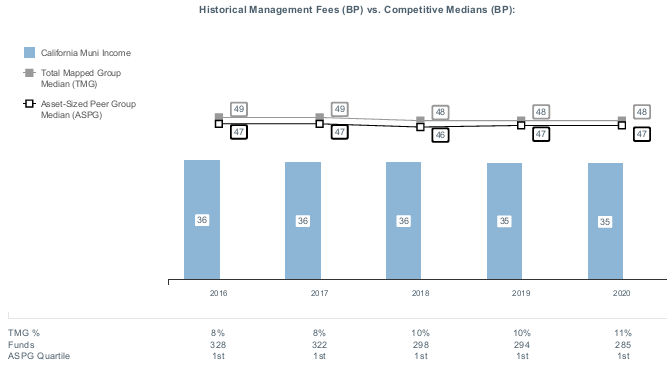
Liquidity Risk Management Program
The Securities and Exchange Commission adopted Rule 22e-4 under the Investment Company Act of 1940 (the Liquidity Rule) to promote effective liquidity risk management throughout the open-end investment company industry, thereby reducing the risk that funds will be unable to meet their redemption obligations and mitigating dilution of the interests of fund shareholders.
The California Municipal Income Fund (the Income Fund) has adopted and implemented a liquidity risk management program pursuant to the Liquidity Rule (the Program) effective December 1, 2018. The Program is reasonably designed to assess and manage the Income Fund’s liquidity risk and to comply with the requirements of the Liquidity Rule. The Income Fund’s Board of Trustees (the Board) has designated the Income Fund’s investment adviser as administrator of the Program. The Fidelity advisers have established a Liquidity Risk Management Committee (the LRM Committee) to manage the Program for each of the Fidelity Funds. The LRM Committee monitors the adequacy and effectiveness of implementation of the Program and on a periodic basis assesses each Fund’s liquidity risk based on a variety of factors including (1) the Fund’s investment strategy, (2) portfolio liquidity and cash flow projections during normal and reasonably foreseeable stressed conditions, (3) shareholder redemptions, (4) borrowings and other funding sources and (5) in the case of exchange-traded funds, certain additional factors including the effect of the Fund’s prices and spreads, market participants, and basket compositions on the overall liquidity of the Fund’s portfolio, as applicable.
In accordance with the Program, each of the Fund’s portfolio investments is classified into one of four liquidity categories described below based on a determination of a reasonable expectation for how long it would take to convert the investment to cash (or sell or dispose of the investment) without significantly changing its market value.
- Highly liquid investments – cash or convertible to cash within three business days or less
- Moderately liquid investments – convertible to cash in three to seven calendar days
- Less liquid investments – can be sold or disposed of, but not settled, within seven calendar days
- Illiquid investments – cannot be sold or disposed of within seven calendar days
Liquidity classification determinations take into account a variety of factors including various market, trading and investment-specific considerations, as well as market depth, and generally utilize analysis from a third-party liquidity metrics service.
The Liquidity Rule places a 15% limit on a fund’s illiquid investments and requires funds that do not primarily hold assets that are highly liquid investments to determine and maintain a minimum percentage of the fund’s net assets to be invested in highly liquid investments (highly liquid investment minimum or HLIM). The Program includes provisions reasonably designed to comply with the 15% limit on illiquid investments and for determining, periodically reviewing and complying with the HLIM requirement as applicable.
At a recent meeting of the Fund’s Board of Trustees, the LRM Committee provided a written report to the Board pertaining to the operation, adequacy, and effectiveness of implementation of the Program for the annual period from December 1, 2020 through November 30, 2021. The report concluded that the Program has been implemented and is operating effectively and is reasonably designed to assess and manage the Fund’s liquidity risk.
![]()
CFL-ANN-0422
1.783451.119
Fidelity® California Limited Term Tax-Free Bond Fund
February 28, 2022
Contents
Board Approval of Investment Advisory Contracts and Management Fees | |
To view a fund's proxy voting guidelines and proxy voting record for the 12-month period ended June 30, visit http://www.fidelity.com/proxyvotingresults or visit the Securities and Exchange Commission's (SEC) web site at http://www.sec.gov.
You may also call 1-800-544-8544 to request a free copy of the proxy voting guidelines.
Standard & Poor's, S&P and S&P 500 are registered service marks of The McGraw-Hill Companies, Inc. and have been licensed for use by Fidelity Distributors Corporation.
Other third-party marks appearing herein are the property of their respective owners.
All other marks appearing herein are registered or unregistered trademarks or service marks of FMR LLC or an affiliated company. © 2022 FMR LLC. All rights reserved.
This report and the financial statements contained herein are submitted for the general information of the shareholders of the Fund. This report is not authorized for distribution to prospective investors in the Fund unless preceded or accompanied by an effective prospectus.
A fund files its complete schedule of portfolio holdings with the SEC for the first and third quarters of each fiscal year on Form N-PORT. Forms N-PORT are available on the SEC’s web site at http://www.sec.gov. A fund's Forms N-PORT may be reviewed and copied at the SEC’s Public Reference Room in Washington, DC. Information regarding the operation of the SEC's Public Reference Room may be obtained by calling 1-800-SEC-0330.
For a complete list of a fund's portfolio holdings, view the most recent holdings listing, semiannual report, or annual report on Fidelity's web site at http://www.fidelity.com, http://www.institutional.fidelity.com, or http://www.401k.com, as applicable.
NOT FDIC INSURED •MAY LOSE VALUE •NO BANK GUARANTEE
Neither the Fund nor Fidelity Distributors Corporation is a bank.
Note to Shareholders:
Early in 2020, the outbreak and spread of COVID-19 emerged as a public health emergency that had a major influence on financial markets, primarily based on its impact on the global economy and corporate earnings. On March 11, 2020, the World Health Organization declared the COVID-19 outbreak a pandemic, citing sustained risk of further global spread. The pandemic prompted a number of measures to limit the spread of COVID-19, including travel and border restrictions, quarantines, and restrictions on large gatherings. In turn, these resulted in lower consumer activity, diminished demand for a wide range of products and services, disruption in manufacturing and supply chains, and – given the wide variability in outcomes regarding the outbreak – significant market uncertainty and volatility. To help stem the turmoil, the U.S. government took unprecedented action – in concert with the U.S. Federal Reserve and central banks around the world – to help support consumers, businesses, and the broader economy, and to limit disruption to the financial system.
In general, the overall impact of the pandemic lessened in 2021, amid a resilient economy and widespread distribution of three COVID-19 vaccines granted emergency use authorization from the U.S. Food and Drug Administration (FDA) early in the year. Still, the situation remains dynamic, and the extent and duration of its influence on financial markets and the economy is highly uncertain, due in part to a recent spike in cases based on highly contagious variants of the coronavirus.
Extreme events such as the COVID-19 crisis are exogenous shocks that can have significant adverse effects on mutual funds and their investments. Although multiple asset classes may be affected by market disruption, the duration and impact may not be the same for all types of assets. Fidelity is committed to helping you stay informed amid news about COVID-19 and during increased market volatility, and we continue to take extra steps to be responsive to customer needs. We encourage you to visit us online, where we offer ongoing updates, commentary, and analysis on the markets and our funds.
Performance: The Bottom Line
Average annual total return reflects the change in the value of an investment, assuming reinvestment of distributions from dividend income and capital gains (the profits earned upon the sale of securities that have grown in value, if any) and assuming a constant rate of performance each year. The hypothetical investment and the average annual total returns do not reflect the deduction of taxes that a shareholder would pay on fund distributions or the redemption of fund shares. During periods of reimbursement by Fidelity, a fund’s total return will be greater than it would be had the reimbursement not occurred. How a fund did yesterday is no guarantee of how it will do tomorrow.
Average Annual Total Returns
| For the periods ended February 28, 2022 | Past 1 year | Past 5 years | Past 10 years |
| Fidelity® California Limited Term Tax-Free Bond Fund | (1.66)% | 1.42% | 1.44% |
$10,000 Over 10 Years
Let's say hypothetically that $10,000 was invested in Fidelity® California Limited Term Tax-Free Bond Fund on February 29, 2012.
The chart shows how the value of your investment would have changed, and also shows how the Bloomberg Municipal Bond Index performed over the same period.
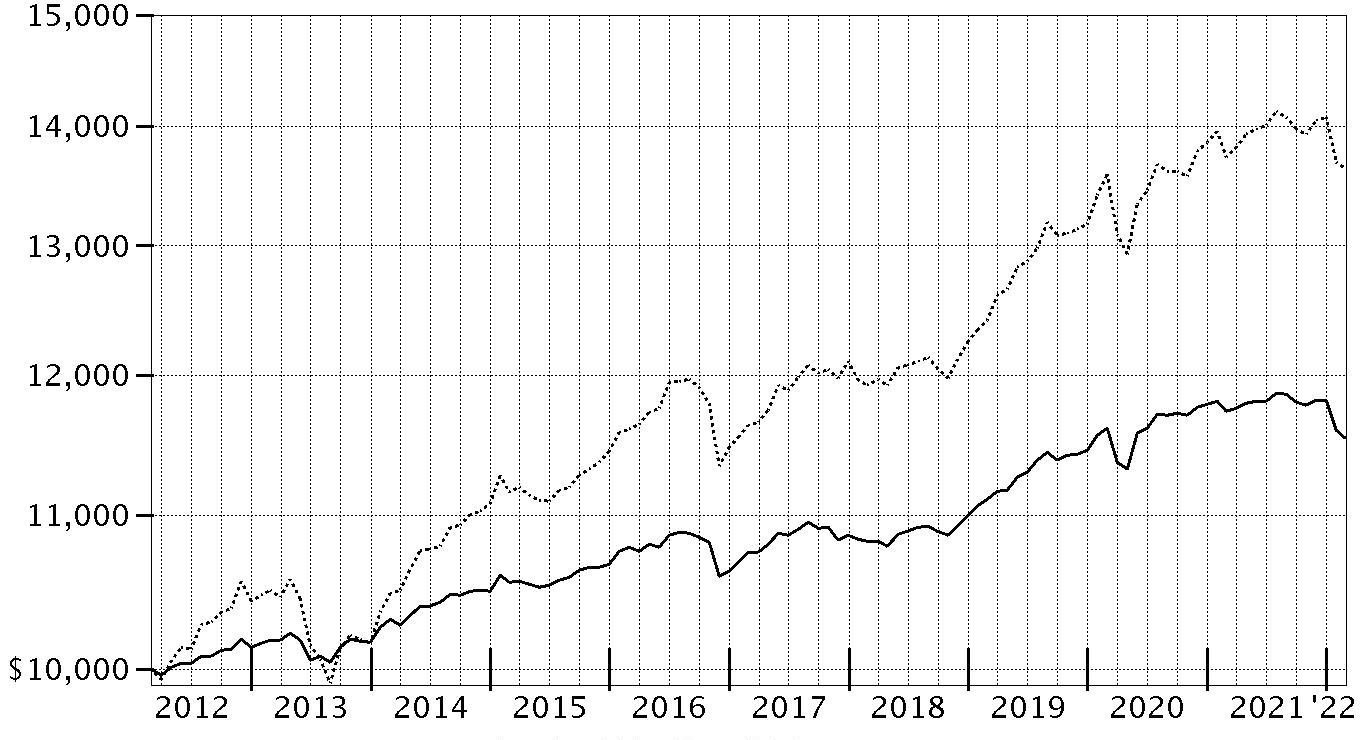
| Period Ending Values | ||
| $11,538 | Fidelity® California Limited Term Tax-Free Bond Fund | |
| $13,640 | Bloomberg Municipal Bond Index | |
Effective August 24, 2021, all Bloomberg Barclays Indices were re-branded as Bloomberg Indices.
Management's Discussion of Fund Performance
Market Recap: Tax-exempt municipal bonds declined modestly for the 12 months ending February 28, 2022, as expectations for higher policy interest rates, failure to pass the income-tax increases included in the Build Back Better legislation, and the perceived richness of municipals relative to Treasury bonds caused shareholder flows to turn negative in the final months of the period. The Bloomberg Municipal Bond Index returned -0.66% for the 12 months. In 2021, the muni market benefited from an improved fiscal outlook for many municipal issuers, economic optimism and strong demand for tax-exempt munis amid expectations for higher tax rates on upper-income tax brackets. Munis gained from March through July 2021, propelled by better-than-expected tax revenue from many state and local governments and reduced inflation expectations. Munis lost slight ground in August and September, then rose in the fourth quarter, partly driven by newfound clarity regarding infrastructure investment due to the passage of the Infrastructure Investment and Jobs Act, which earmarked $550 billion for new infrastructure spending and limited new tax-exempt bond issuance. Then, in January and February 2022, the muni market experienced rate volatility related to inflation that triggered shareholder outflows. Muni credit fundamentals remained solid overall for the 12 months and, for most issuers, the risk of credit-rating downgrades appeared low.Comments from Co-Portfolio Managers Cormac Cullen, Michael Maka and Elizah McLaughlin: For the fiscal year, the fund returned -1.66%, roughly in line, net of fees, with the -1.62% result of the state-specific Bloomberg California Enhanced Municipal 1-7 Year Non-AMT Index and trailing the -0.66% return of the Bloomberg Municipal Bond Index. The past 12 months, we continued to focus on longer-term objectives and sought to generate attractive tax-exempt income and competitive risk-adjusted returns. Versus the state index, the fund's larger exposure to lower-quality investment-grade munis contributed. These issues, rated BBB and A, outpaced higher-quality bonds amid strong investor demand for higher-yielding securities, given the low-rate environment. Elsewhere, overweighting bonds from certain student housing projects helped relative performance. They outpaced the index this period because colleges and universities across the state reopened after COVID-related shutdowns. Differences in the way fund holdings and index components were priced modestly contributed to the fund's relative result. Conversely, underweighting bonds from Foothill-Eastern Transportation Corridor detracted versus the state index. These securities performed well in response improved credit fundamentals and credit-rating upgrades.The views expressed above reflect those of the portfolio manager(s) only through the end of the period as stated on the cover of this report and do not necessarily represent the views of Fidelity or any other person in the Fidelity organization. Any such views are subject to change at any time based upon market or other conditions and Fidelity disclaims any responsibility to update such views. These views may not be relied on as investment advice and, because investment decisions for a Fidelity fund are based on numerous factors, may not be relied on as an indication of trading intent on behalf of any Fidelity fund.
Investment Summary (Unaudited)
Top Five Sectors as of February 28, 2022
| % of fund's net assets | |
| General Obligations | 34.8 |
| Health Care | 15.2 |
| Transportation | 13.0 |
| Education | 9.5 |
| Water & Sewer | 7.2 |
Quality Diversification (% of fund's net assets)
| As of February 28, 2022 | ||
| AAA | 2.2% | |
| AA,A | 81.6% | |
| BBB | 12.1% | |
| BB and Below | 0.2% | |
| Not Rated | 4.6% | |
| Short-Term Investments and Net Other Assets* | (0.7)% | |
* Short-Term Investments and Net Other Assets are not included in the pie chart
We have used ratings from Moody's Investors Service, Inc. Where Moody's® ratings are not available, we have used S&P® ratings. All ratings are as of the date indicated and do not reflect subsequent changes.
Schedule of Investments February 28, 2022
Showing Percentage of Net Assets
| Municipal Bonds - 100.7% | |||
| Principal Amount | Value | ||
| California - 100.6% | |||
| Alameda Corridor Trans. Auth. Rev.: | |||
| Series 2013 A: | $ | $ | |
| 5% 10/1/22 | 1,295,000 | 1,325,879 | |
| 5% 10/1/24 | 1,220,000 | 1,291,302 | |
| Series 2016 A: | |||
| 4% 10/1/23 | 850,000 | 887,374 | |
| 5% 10/1/22 | 1,250,000 | 1,278,550 | |
| Azusa Unified School District Series 2002, 0% 7/1/26 (Assured Guaranty Muni. Corp. Insured) | 1,125,000 | 1,032,617 | |
| Bay Area Toll Auth. San Francisco Bay Toll Bridge Rev. Bonds: | |||
| Series 2018 A, 2.625%, tender 4/1/26 (a) | 7,300,000 | 7,546,084 | |
| Series 2021 A, 2%, tender 4/1/28 (a) | 10,000,000 | 10,135,619 | |
| Series A, 2.95%, tender 4/1/26 (a) | 1,000,000 | 1,043,898 | |
| Series B, 2.85%, tender 4/1/25 (a) | 7,325,000 | 7,566,753 | |
| Bay Area Wtr. Supply & Conservation Agcy. (Cap. Cost Recovery Prepayment Prog.) Series 2023 A: | |||
| 5% 10/1/23 (b) | 1,000,000 | 1,025,875 | |
| 5% 10/1/24 (b) | 1,000,000 | 1,054,685 | |
| 5% 10/1/25 (b) | 1,000,000 | 1,083,404 | |
| 5% 10/1/26 (b) | 1,000,000 | 1,108,952 | |
| 5% 10/1/27 (b) | 1,000,000 | 1,132,360 | |
| 5% 10/1/28 (b) | 1,000,000 | 1,150,183 | |
| California County Tobacco Securitization Agcy. Tobacco Settlement Asset-Backed Series 2020 A: | |||
| 4% 6/1/22 | 350,000 | 352,422 | |
| 4% 6/1/23 | 490,000 | 504,384 | |
| 5% 6/1/24 | 350,000 | 374,102 | |
| 5% 6/1/25 | 400,000 | 438,040 | |
| 5% 6/1/26 | 500,000 | 559,801 | |
| California Edl. Facilities Auth. Rev. Series 2021 A: | |||
| 5% 4/1/22 | 650,000 | 652,393 | |
| 5% 4/1/23 | 525,000 | 548,038 | |
| 5% 4/1/24 | 525,000 | 565,863 | |
| 5% 4/1/25 | 415,000 | 461,252 | |
| 5% 4/1/26 | 475,000 | 543,312 | |
| 5% 4/1/27 | 475,000 | 557,981 | |
| 5% 4/1/28 | 375,000 | 450,914 | |
| California Gen. Oblig.: | |||
| Series 2014, 4% 5/1/23 | 2,440,000 | 2,524,667 | |
| Series 2015, 5% 8/1/24 | 2,060,000 | 2,243,431 | |
| Series 2017, 5% 8/1/23 | 8,175,000 | 8,625,131 | |
| Series 2018, 5% 8/1/25 | 250,000 | 280,253 | |
| Series 2019: | |||
| 5% 10/1/22 | 7,000,000 | 7,171,055 | |
| 5% 4/1/28 | 4,380,000 | 5,246,966 | |
| Series 2020: | |||
| 4% 3/1/23 | 5,000,000 | 5,151,257 | |
| 4% 3/1/24 | 2,500,000 | 2,636,107 | |
| 5% 11/1/26 | 2,000,000 | 2,317,331 | |
| 5% 11/1/27 | 1,000,000 | 1,186,924 | |
| 5% 11/1/28 | 10,000,000 | 12,129,917 | |
| Series 2021: | |||
| 4% 12/1/24 | 5,000,000 | 5,366,334 | |
| 5% 12/1/25 | 2,500,000 | 2,829,084 | |
| 5% 10/1/29 | 7,000,000 | 8,650,426 | |
| California Health Facilities Fing. Auth. Rev.: | |||
| Bonds: | |||
| (Providence St. Jospeh Health) Series 2016 B3, 2%, tender 10/1/25 (a) | 12,800,000 | 13,026,132 | |
| Series 2009 C, 5%, tender 10/18/22 (a) | 900,000 | 922,785 | |
| Series 2009 D, 1.7%, tender 10/18/22 (a) | 5,300,000 | 5,324,999 | |
| Series 2016 B2, 4%, tender 10/1/24 (a) | 6,120,000 | 6,528,243 | |
| Series 2019 B, 5%, tender 10/1/27 (a) | 5,625,000 | 6,578,567 | |
| Series 2019 C: | |||
| 5%, tender 10/1/25 (a) | 3,910,000 | 4,382,192 | |
| 5%, tender 10/1/25 (a) | 4,400,000 | 4,929,732 | |
| Series 2012 B, 5% 8/15/24 | 315,000 | 321,152 | |
| Series 2014 A, 5% 10/1/22 | 1,850,000 | 1,896,194 | |
| Series 2015, 5% 11/15/25 | 675,000 | 762,900 | |
| Series 2016 A, 4% 3/1/27 | 475,000 | 519,559 | |
| Series 2021 A: | |||
| 4% 11/1/23 | 500,000 | 524,198 | |
| 4% 11/1/24 | 365,000 | 391,526 | |
| 5% 11/1/25 | 500,000 | 565,457 | |
| 5% 11/1/26 | 300,000 | 348,777 | |
| 5% 11/1/27 | 200,000 | 237,983 | |
| Series 2021 B: | |||
| 5% 11/1/26 | 250,000 | 290,647 | |
| 5% 11/1/27 | 600,000 | 713,948 | |
| Series 2022 A: | |||
| 5% 5/15/23 (b) | 550,000 | 570,572 | |
| 5% 5/15/24 (b) | 1,200,000 | 1,279,464 | |
| 5% 5/15/25 (b) | 1,650,000 | 1,806,501 | |
| 5% 5/15/26 (b) | 1,000,000 | 1,121,106 | |
| 5% 5/15/27 (b) | 275,000 | 314,967 | |
| California Infrastructure & Econ. Dev. Series 2019, 5% 8/1/27 | 300,000 | 351,159 | |
| California Infrastructure and Econ. Dev. Bank Rev.: | |||
| Bonds: | |||
| (Los Angeles County Museum of Art Proj.) Series 2021 A, 1.2%, tender 6/1/28 (a) | 7,000,000 | 6,750,612 | |
| Series 2021 B1, 0.39%, tender 1/1/24 (a) | 2,500,000 | 2,461,856 | |
| Series 2015 A, 5% 11/1/24 | 1,230,000 | 1,309,968 | |
| California Muni. Fin. Auth. (Orange County Civic Ctr. Infrastructure Impt. Prog.) Series 2017 A, 5% 6/1/30 | 2,650,000 | 3,114,260 | |
| California Muni. Fin. Auth. Rev.: | |||
| (Biola Univeristy, Inc. Proj.) Series 2017: | |||
| 5% 10/1/22 | 1,020,000 | 1,044,020 | |
| 5% 10/1/23 | 1,230,000 | 1,301,687 | |
| 5% 10/1/24 | 370,000 | 401,573 | |
| 5% 10/1/25 | 1,210,000 | 1,347,170 | |
| 5% 10/1/26 | 355,000 | 403,678 | |
| (Channing House Proj.) Series 2017 A: | |||
| 4% 5/15/28 | 2,000,000 | 2,234,172 | |
| 5% 5/15/24 | 910,000 | 981,776 | |
| 5% 5/15/26 | 360,000 | 410,948 | |
| 5% 5/15/27 | 350,000 | 409,681 | |
| (Institute On Aging Proj.) Series 2017: | |||
| 5% 8/15/23 | 225,000 | 237,487 | |
| 5% 8/15/24 | 285,000 | 310,535 | |
| 5% 8/15/25 | 995,000 | 1,114,864 | |
| 5% 8/15/26 | 275,000 | 316,749 | |
| (Univ. of Verne Proj.) Series 2017 A: | |||
| 5% 6/1/22 | 625,000 | 631,780 | |
| 5% 6/1/23 | 700,000 | 734,186 | |
| 5% 6/1/25 | 1,250,000 | 1,392,819 | |
| 5% 6/1/28 | 390,000 | 456,570 | |
| Series 2017 A: | |||
| 5% 11/1/23 | 450,000 | 474,881 | |
| 5% 7/1/24 | 1,400,000 | 1,513,284 | |
| 5% 7/1/25 | 1,035,000 | 1,150,653 | |
| 5% 11/1/25 | 745,000 | 824,201 | |
| 5% 7/1/26 | 1,065,000 | 1,215,008 | |
| 5% 7/1/27 | 1,235,000 | 1,442,958 | |
| 5% 7/1/29 | 115,000 | 133,942 | |
| Series 2017 B: | |||
| 5% 7/1/24 | 1,440,000 | 1,556,520 | |
| 5% 1/1/25 | 1,230,000 | 1,337,573 | |
| 5% 7/1/26 | 500,000 | 570,426 | |
| 5% 7/1/27 | 640,000 | 747,768 | |
| Series 2018: | |||
| 5% 10/1/22 | 475,000 | 486,270 | |
| 5% 10/1/23 | 225,000 | 237,931 | |
| 5% 10/1/24 | 275,000 | 298,393 | |
| 5% 10/1/25 | 275,000 | 305,972 | |
| 5% 10/1/26 | 300,000 | 341,420 | |
| Series 2019 A: | |||
| 5% 4/1/26 | 650,000 | 739,595 | |
| 5% 4/1/27 | 1,285,000 | 1,498,502 | |
| 5% 4/1/28 | 2,000,000 | 2,383,085 | |
| 5% 4/1/29 | 3,000,000 | 3,636,724 | |
| California Muni. Fin. Auth. Solid Waste Disp. Rev. Bonds (Waste Mgmt., Inc. Proj.) Series 2009 A, 1.3%, tender 2/3/25 (a)(c) | 1,500,000 | 1,474,552 | |
| California Muni. Fin. Auth. Sr Living Series 2019: | |||
| 4% 11/15/23 | 295,000 | 305,325 | |
| 4% 11/15/25 | 630,000 | 667,790 | |
| 4% 11/15/28 | 710,000 | 768,488 | |
| California Muni. Fin. Auth. Student Hsg.: | |||
| (CHF Davis II, L.L.C. Orchard Park Student Hsg. Proj.) Series 2021: | |||
| 5% 5/15/24 (Build America Mutual Assurance Insured) | 500,000 | 535,033 | |
| 5% 5/15/25 (Build America Mutual Assurance Insured) | 400,000 | 438,922 | |
| 5% 5/15/26 (Build America Mutual Assurance Insured) | 350,000 | 392,996 | |
| 5% 5/15/27 (Build America Mutual Assurance Insured) | 470,000 | 538,247 | |
| 5% 5/15/28 (Build America Mutual Assurance Insured) | 375,000 | 436,920 | |
| 5% 5/15/29 (Build America Mutual Assurance Insured) | 400,000 | 472,989 | |
| 5% 5/15/30 (Build America Mutual Assurance Insured) | 500,000 | 599,490 | |
| (CHF-Davis I, LLC - West Village Student Housing Proj.) Series 2018, 5% 5/15/23 | 1,000,000 | 1,040,809 | |
| (CHF-Davis I, LLC - West Village Student Hsg. Proj.) Series 2018: | |||
| 5% 5/15/24 | 1,300,000 | 1,391,749 | |
| 5% 5/15/25 | 3,400,000 | 3,733,700 | |
| 5% 5/15/26 | 3,000,000 | 3,368,704 | |
| 5% 5/15/27 | 3,000,000 | 3,437,732 | |
| (CHF-Riverside I, LLC - UCR Dundee-Glasgow Student Hsg. Proj.) Series 2018: | |||
| 5% 5/15/22 | 710,000 | 715,080 | |
| 5% 5/15/23 | 950,000 | 988,768 | |
| 5% 5/15/24 | 2,265,000 | 2,424,855 | |
| 5% 5/15/27 | 750,000 | 859,433 | |
| (CHF-Riverside II, LLC-UCR North District Phase I Student Hsg. Proj.) Series 2019: | |||
| 5% 5/15/23 (Build America Mutual Assurance Insured) | 400,000 | 418,806 | |
| 5% 5/15/24 (Build America Mutual Assurance Insured) | 345,000 | 372,290 | |
| California Pub. Fin. Auth. Rev. Series 2021 A: | |||
| 4% 10/15/22 | 245,000 | 249,387 | |
| 4% 10/15/23 | 285,000 | 296,657 | |
| 4% 10/15/24 | 380,000 | 403,054 | |
| 4% 10/15/25 | 390,000 | 421,152 | |
| California Pub. Works Board Lease Rev.: | |||
| (Various Cap. Projs.): | |||
| Series 2012 A, 5% 4/1/24 | 9,800,000 | 9,835,754 | |
| Series 2012 G: | |||
| 5% 11/1/24 | 720,000 | 740,269 | |
| 5% 11/1/25 | 5,600,000 | 5,757,648 | |
| Series 2021 D: | |||
| 5% 11/1/27 | 3,555,000 | 4,211,038 | |
| 5% 11/1/28 | 3,745,000 | 4,532,123 | |
| Series 2022 C: | |||
| 5% 8/1/25 (b) | 2,530,000 | 2,762,589 | |
| 5% 8/1/26 (b) | 3,195,000 | 3,577,162 | |
| 5% 8/1/27 (b) | 2,955,000 | 3,376,476 | |
| 5% 8/1/28 (b) | 3,175,000 | 3,694,040 | |
| Series B, 5% 10/1/26 | 325,000 | 375,127 | |
| Series 2014 B, 5% 10/1/22 | 1,225,000 | 1,255,442 | |
| Series 2014 C, 5% 10/1/22 | 1,000,000 | 1,024,851 | |
| Series 2021 D, 4% 11/1/26 | 2,905,000 | 3,229,892 | |
| Series A, 5% 9/1/29 | 860,000 | 935,232 | |
| California State Univ. Rev.: | |||
| Bonds: | |||
| Series 2016 B1, 1.6%, tender 11/1/26 (a) | 525,000 | 528,400 | |
| Series 2016 B3, 4%, tender 11/1/23 (a) | 6,205,000 | 6,416,638 | |
| Series 2020 A: | |||
| 5% 11/1/22 | 2,585,000 | 2,658,298 | |
| 5% 11/1/23 | 1,500,000 | 1,597,780 | |
| 5% 11/1/24 | 1,500,000 | 1,644,885 | |
| 5% 11/1/25 | 1,000,000 | 1,128,998 | |
| California Statewide Cmntys. Dev. Auth. Series 2016: | |||
| 5% 5/15/22 | 1,000,000 | 1,007,609 | |
| 5% 5/15/23 | 2,375,000 | 2,477,740 | |
| 5% 5/15/24 | 1,000,000 | 1,075,311 | |
| California Statewide Cmntys. Dev. Auth. Hosp. Rev. Series 2018: | |||
| 5% 1/1/23 | 500,000 | 516,157 | |
| 5% 1/1/24 | 750,000 | 798,397 | |
| 5% 1/1/25 | 2,100,000 | 2,299,517 | |
| 5% 1/1/26 | 1,090,000 | 1,225,484 | |
| 5% 1/1/27 | 1,900,000 | 2,189,854 | |
| California Statewide Cmntys. Dev. Auth. Rev.: | |||
| (Huntington Memorial Hosp. Proj.) Series 2018: | |||
| 5% 7/1/24 | 1,020,000 | 1,104,984 | |
| 5% 7/1/25 | 625,000 | 696,565 | |
| (Viamonte Sr. Living 1 Proj.) Series 2018 B, 3% 7/1/25 | 1,875,000 | 1,877,427 | |
| Series 2014 B: | |||
| 5% 7/1/23 (Escrowed to Maturity) | 870,000 | 915,738 | |
| 5% 7/1/24 (Escrowed to Maturity) | 900,000 | 976,503 | |
| Series 2015: | |||
| 4% 2/1/25 | 940,000 | 961,702 | |
| 5% 2/1/30 | 200,000 | 208,748 | |
| Series 2016: | |||
| 5% 10/1/22 | 725,000 | 742,759 | |
| 5% 10/1/24 | 2,030,000 | 2,218,340 | |
| 5% 10/1/25 | 1,010,000 | 1,136,110 | |
| Series 2017 A, 3% 11/1/22 (c) | 365,000 | 368,793 | |
| Series 2018 A, 5% 3/1/27 | 555,000 | 648,581 | |
| Series 2018, 5% 7/1/23 | 300,000 | 315,403 | |
| Series 2021 A: | |||
| 5% 4/1/22 | 345,000 | 346,239 | |
| 5% 4/1/23 | 350,000 | 365,010 | |
| 5% 4/1/24 | 375,000 | 402,260 | |
| 5% 4/1/25 | 575,000 | 633,761 | |
| 5% 4/1/26 | 380,000 | 429,320 | |
| 5% 4/1/27 | 600,000 | 693,026 | |
| 5% 4/1/28 | 425,000 | 499,685 | |
| 5% 4/1/29 | 625,000 | 746,185 | |
| 5% 4/1/30 | 440,000 | 533,833 | |
| 5% 4/1/31 | 450,000 | 554,995 | |
| Chula Vista Elementary School District Series 2019, 0% 8/1/23 | 6,500,000 | 6,397,694 | |
| Corona-Norco Unified School District Series 2013 A, 5% 9/1/22 (Escrowed to Maturity) | 500,000 | 510,620 | |
| Eastern Muni. Wtr. District Fing. Auth. Series 2020 A: | |||
| 5% 7/1/26 | 250,000 | 288,499 | |
| 5% 7/1/27 | 255,000 | 302,084 | |
| El Camino Hosp. District Series 2006, 0% 8/1/29 (Nat'l. Pub. Fin. Guarantee Corp. Insured) | 5,000,000 | 4,274,823 | |
| El Dorado County Gen. Oblig. Series 2012, 5% 9/1/22 | 1,280,000 | 1,308,225 | |
| El Dorado Irr. Distr. Rev. Series 2016 A: | |||
| 5% 3/1/22 | 80,000 | 80,000 | |
| 5% 3/1/22 (Escrowed to Maturity) | 420,000 | 420,000 | |
| 5% 3/1/23 | 500,000 | 520,587 | |
| Elk Grove Fin. Auth. Spl. Tax Rev.: | |||
| Series 2015: | |||
| 5% 9/1/22 | 425,000 | 433,834 | |
| 5% 9/1/23 | 1,000,000 | 1,052,555 | |
| 5% 9/1/24 | 1,000,000 | 1,080,811 | |
| 5% 9/1/27 | 150,000 | 167,737 | |
| Series 2016: | |||
| 4% 9/1/23 | 1,500,000 | 1,552,388 | |
| 4% 9/1/25 | 1,915,000 | 2,040,694 | |
| Elk Grove Unified School Distr. Ctfs. of Prtn. (Cap. Facilities Proj.) Series 2016: | |||
| 5% 2/1/23 (Build America Mutual Assurance Insured) | 1,390,000 | 1,441,282 | |
| 5% 2/1/24 (Build America Mutual Assurance Insured) | 1,460,000 | 1,562,934 | |
| Elsinore Valley Muni. Wtr. District Series 2016 A: | |||
| 5% 7/1/22 | 900,000 | 913,104 | |
| 5% 7/1/23 | 770,000 | 810,902 | |
| 5% 7/1/24 | 1,000,000 | 1,087,174 | |
| Emery Unified School District Series D, 0% 8/1/40 (Pre-Refunded to 8/1/23 @ 40.487) | 250,000 | 99,724 | |
| Evergreen Elementary School District Series 2006 B, 0% 8/1/27 | 1,240,000 | 1,122,925 | |
| Fairfield Ctfs. Prtn. Series 2007, 0% 4/1/27 | 1,850,000 | 1,684,495 | |
| Fullerton Pub. Fing. Auth. Series 2021 A: | |||
| 4% 2/1/23 | 100,000 | 102,763 | |
| 4% 2/1/24 | 240,000 | 252,397 | |
| 4% 2/1/25 | 235,000 | 252,359 | |
| 4% 2/1/26 | 210,000 | 229,681 | |
| 4% 2/1/27 | 230,000 | 256,081 | |
| 4% 2/1/28 | 230,000 | 258,939 | |
| 4% 2/1/30 | 385,000 | 444,591 | |
| Garvey School District Series 2000 B, 0% 8/1/30 | 1,625,000 | 1,328,052 | |
| Gilroy School Facilities Fing. (Gilroy Calif Unified School District Proj.) Series 2013, 4% 8/1/22 (Escrowed to Maturity) | 40,000 | 40,558 | |
| Golden State Tobacco Securitization Corp. Tobacco Settlement Rev.: | |||
| Series 2005 A, 0% 6/1/27 (Escrowed to Maturity) | 5,000,000 | 4,594,891 | |
| Series 2017 A1: | |||
| 5% 6/1/22 (Escrowed to Maturity) | 1,000,000 | 1,010,746 | |
| 5% 6/1/23 (Escrowed to Maturity) | 3,875,000 | 4,067,223 | |
| 5% 6/1/28 (Pre-Refunded to 6/1/27 @ 100) | 1,510,000 | 1,771,796 | |
| Series A, 0% 6/1/24 (Escrowed to Maturity) | 7,605,000 | 7,387,240 | |
| Indio Pub. Fing. Auth. Lease Rev. Series 2012, 5% 11/1/22 | 745,000 | 765,821 | |
| Irvine Reassessment District 12-1 Ltd. Oblig. Series 2013, 5% 9/2/22 | 750,000 | 766,124 | |
| La Quinta Redev. Agcy.: | |||
| (La Quinta Redev. Proj. Areas No. 1 and 2) Series 2014 A: | |||
| 5% 9/1/22 (Escrowed to Maturity) | 615,000 | 628,063 | |
| 5% 9/1/23 (Escrowed to Maturity) | 1,205,000 | 1,275,351 | |
| Series 2013 A: | |||
| 5% 9/1/22 (Escrowed to Maturity) | 2,000,000 | 2,042,480 | |
| 5% 9/1/23 (Escrowed to Maturity) | 1,500,000 | 1,587,574 | |
| Long Beach Unified School District Series D1, 0% 8/1/29 | 1,915,000 | 1,515,141 | |
| Los Angeles Cmnty. College District Series 2016 I, 4% 8/1/24 | 800,000 | 853,060 | |
| Los Angeles County Ctfs. of Prtn. (Disney Concert Hall Parking Garage Proj.) Series 2012, 5% 3/1/22 | 1,000,000 | 1,000,000 | |
| Los Angeles County Metropolitan Trans. Auth. Sales Tax Rev. Series 2020 A, 5% 6/1/27 | 5,000,000 | 5,886,203 | |
| Los Angeles County Pub. Works Fing. Auth. Lease Rev.: | |||
| (LACMA Bldg. for the Permanent Collection Proj.) Series 2020 A, 5% 12/1/27 | 3,375,000 | 4,031,810 | |
| Series 2022 G: | |||
| 5% 12/1/25 (b) | 1,500,000 | 1,676,987 | |
| 5% 12/1/26 (b) | 1,750,000 | 2,007,022 | |
| 5% 12/1/27 (b) | 1,875,000 | 2,195,486 | |
| 5% 12/1/28 (b) | 1,625,000 | 1,937,950 | |
| Los Angeles Dept. Arpt. Rev.: | |||
| Series 2020 A: | |||
| 5% 5/15/23 | 5,000,000 | 5,243,717 | |
| 5% 5/15/24 | 5,000,000 | 5,408,015 | |
| 5% 5/15/25 | 5,015,000 | 5,579,142 | |
| Series 2020 B, 5% 5/15/26 | 7,000,000 | 7,996,798 | |
| Series C, 5% 5/15/25 | 265,000 | 294,810 | |
| Los Angeles Muni. Impt. Corp. Lease Rev.: | |||
| Series 2014 A, 5% 5/1/23 (Escrowed to Maturity) | 475,000 | 497,418 | |
| Series 2014 B, 5% 5/1/23 (Escrowed to Maturity) | 200,000 | 209,200 | |
| Los Angeles Unified School District: | |||
| Series 2020 C, 5% 7/1/26 | 5,670,000 | 6,514,770 | |
| Series A: | |||
| 5% 7/1/22 | 3,830,000 | 3,886,153 | |
| 5% 7/1/24 | 435,000 | 473,026 | |
| 5% 7/1/25 | 3,355,000 | 3,749,615 | |
| Series C, 5% 7/1/25 | 655,000 | 710,993 | |
| Series M1, 5% 7/1/25 | 300,000 | 335,286 | |
| Middle Fork Proj. Fin. Auth. Series 2020: | |||
| 5% 4/1/22 | 2,480,000 | 2,488,373 | |
| 5% 4/1/23 | 2,610,000 | 2,714,437 | |
| Montebello Pub. Fing. Auth.: | |||
| (Montebello Home2 Suites By Hilton Hotel Proj.) Series 2016 A, 5% 6/1/27 | 1,415,000 | 1,558,047 | |
| (Montebello Home2 Suites by Hilton Hotel Proj.) Series 2016 A, 5% 6/1/28 | 1,490,000 | 1,635,659 | |
| (Montebello Home2 Suites By Hilton Hotel Proj.) Series 2016 A, 5% 6/1/29 | 1,560,000 | 1,707,954 | |
| Monterey Peninsula Cmnty. College District Series 2016: | |||
| 0% 8/1/22 | 2,300,000 | 2,293,623 | |
| 0% 8/1/24 | 2,850,000 | 2,754,721 | |
| Mount Diablo Unified School District Series 2022 B: | |||
| 4% 8/1/24 (b) | 4,335,000 | 4,573,282 | |
| 4% 8/1/27 (b) | 3,000,000 | 3,337,978 | |
| Napa Valley Cmnty. Cllge District Series 2002 B, 0% 8/1/27 (Nat'l. Pub. Fin. Guarantee Corp. Insured) | 1,025,000 | 924,746 | |
| Napa Valley Unified School District Series 2010 A, 0% 8/1/27 | 2,065,000 | 1,856,045 | |
| Newport Mesa Unified School District Series 2007, 0% 8/1/29 (Nat'l. Pub. Fin. Guarantee Corp. Insured) | 3,915,000 | 3,389,209 | |
| Northern California Energy Auth. Bonds Series 2018, 4%, tender 7/1/24 (a) | 10,000,000 | 10,508,023 | |
| Oakland Unified School District Alameda County: | |||
| Series 2015 A: | |||
| 5% 8/1/23 (Assured Guaranty Muni. Corp. Insured) | 2,125,000 | 2,245,406 | |
| 5% 8/1/24 | 1,900,000 | 2,064,914 | |
| 5% 8/1/24 (Assured Guaranty Muni. Corp. Insured) | 2,400,000 | 2,611,307 | |
| Series 2016: | |||
| 5% 8/1/26 | 1,470,000 | 1,685,999 | |
| 5% 8/1/29 | 940,000 | 1,074,664 | |
| Orange County Trans. Auth. (I-405 Impt. Proj.) Series 2021, 5% 10/15/24 (Liquidity Facility Orange County Local Trans. Auth. Sales Tax Rev.) | 5,000,000 | 5,478,341 | |
| Palmdale School District Series 2002, 0% 2/1/27 (Nat'l. Pub. Fin. Guarantee Corp. Insured) | 1,400,000 | 1,272,574 | |
| Palo Alto Unified School District Gen. Oblig. Series 2008, 0% 8/1/25 | 2,255,000 | 2,145,750 | |
| Palomar Cmnty. College District Series 2010 B, 0% 8/1/29 | 1,005,000 | 865,568 | |
| Palomar Health Calif Ctfs. Prtn. Series 2017: | |||
| 5% 11/1/23 | 300,000 | 317,709 | |
| 5% 11/1/24 | 300,000 | 327,078 | |
| 5% 11/1/25 | 350,000 | 391,950 | |
| 5% 11/1/26 | 475,000 | 545,508 | |
| Palomar Health Rev. Series 2016: | |||
| 5% 11/1/25 | 2,000,000 | 2,239,715 | |
| 5% 11/1/26 | 1,875,000 | 2,153,320 | |
| Perris Union High School District Series A, 5% 9/1/22 (Assured Guaranty Muni. Corp. Insured) | 625,000 | 638,465 | |
| Pittsburg School District Series C, 0% 8/1/52 (Pre-Refunded to 8/1/22 @ 16.874) | 1,275,000 | 214,530 | |
| Placentia-Yorba Linda Unified School District Series 2004 B, 0% 8/1/27 | 1,905,000 | 1,714,072 | |
| Poway California Redev. Agcy. Successor Series A: | |||
| 5% 12/15/23 | 4,330,000 | 4,624,359 | |
| 5% 6/15/24 | 2,440,000 | 2,644,898 | |
| Poway Unified School District Series 2009, 0% 8/1/26 | 2,145,000 | 1,985,072 | |
| Poway Unified School District Pub. Fing. Series 2015 A: | |||
| 5% 9/1/22 | 990,000 | 1,008,928 | |
| 5% 9/1/23 | 1,345,000 | 1,414,043 | |
| Pub. Utils. Commission San Francisco City & County Wastewtr. Rev. Bonds Series 2018 C, 2.125%, tender 10/1/23 (a) | 25,000,000 | 25,312,510 | |
| Rancho Cucamonga Redev. Agcy. (Rancho Redev. Proj.) Series 2014, 5% 9/1/22 (Assured Guaranty Muni. Corp. Insured) | 1,400,000 | 1,428,533 | |
| Richmond Wastewtr. Rev. Series 2019 B: | |||
| 5% 8/1/22 | 300,000 | 305,457 | |
| 5% 8/1/23 | 1,000,000 | 1,056,807 | |
| 5% 8/1/24 | 730,000 | 794,455 | |
| 5% 8/1/25 | 1,950,000 | 2,182,506 | |
| Rio Hondo Cmnty. College District Series 2010 C, 0% 8/1/29 | 1,800,000 | 1,541,196 | |
| Riverside Swr. Rev. Series 2015 A: | |||
| 5% 8/1/22 | 2,160,000 | 2,199,656 | |
| 5% 8/1/24 | 1,500,000 | 1,632,067 | |
| Sacramento City Unified School District: | |||
| Series 2007: | |||
| 0% 7/1/27 (Assured Guaranty Muni. Corp. Insured) | 1,455,000 | 1,306,245 | |
| 0% 7/1/28 (Assured Guaranty Muni. Corp. Insured) | 500,000 | 436,378 | |
| Series 2014: | |||
| 5% 7/1/23 | 605,000 | 634,907 | |
| 5% 7/1/25 | 50,000 | 53,854 | |
| Series 2021: | |||
| 4% 7/1/22 (Assured Guaranty Muni. Corp. Insured) | 675,000 | 682,377 | |
| 4% 7/1/23 (Assured Guaranty Muni. Corp. Insured) | 900,000 | 933,869 | |
| 4% 7/1/24 (Assured Guaranty Muni. Corp. Insured) | 1,000,000 | 1,057,851 | |
| 4% 7/1/25 (Assured Guaranty Muni. Corp. Insured) | 1,200,000 | 1,294,880 | |
| 4% 7/1/26 (Assured Guaranty Muni. Corp. Insured) | 1,100,000 | 1,207,665 | |
| 4% 7/1/27 (Assured Guaranty Muni. Corp. Insured) | 350,000 | 390,596 | |
| 4% 7/1/28 (Assured Guaranty Muni. Corp. Insured) | 625,000 | 707,249 | |
| 4% 7/1/29 (Assured Guaranty Muni. Corp. Insured) | 250,000 | 286,505 | |
| Sacramento County Arpt. Sys. Rev.: | |||
| Series 2018 A: | |||
| 5% 7/1/22 (Escrowed to Maturity) | 275,000 | 278,865 | |
| 5% 7/1/23 | 430,000 | 452,019 | |
| 5% 7/1/24 | 675,000 | 731,564 | |
| 5% 7/1/25 | 605,000 | 675,112 | |
| Series 2018 B: | |||
| 5% 7/1/22 (Escrowed to Maturity) | 1,000,000 | 1,014,054 | |
| 5% 7/1/23 | 3,060,000 | 3,216,691 | |
| 5% 7/1/24 | 1,560,000 | 1,690,727 | |
| 5% 7/1/25 | 2,040,000 | 2,276,411 | |
| Series 2018 D: | |||
| 5% 7/1/22 | 300,000 | 304,368 | |
| 5% 7/1/23 | 500,000 | 525,740 | |
| 5% 7/1/24 | 400,000 | 433,520 | |
| Series 2018 E, 5% 7/1/28 | 745,000 | 886,454 | |
| Series 2020: | |||
| 5% 7/1/23 | 350,000 | 367,922 | |
| 5% 7/1/24 | 730,000 | 785,404 | |
| 5% 7/1/25 | 1,045,000 | 1,166,102 | |
| 5% 7/1/26 | 370,000 | 422,949 | |
| 5% 7/1/27 | 830,000 | 967,457 | |
| 5% 7/1/28 | 700,000 | 832,910 | |
| Sacramento Muni. Util. District Elec. Rev. Bonds Series 2019 B, 5%, tender 10/15/25 (a) | 1,920,000 | 2,132,602 | |
| Sacramento TOT Rev.: | |||
| Series 2018 A, 5% 6/1/31 | 500,000 | 585,040 | |
| Series A, 5% 6/1/26 | 900,000 | 1,016,294 | |
| San Diego Assoc. of Governments (Mid-Coast Corridor Transit Proj.) Series 2019 A, 1.8% 11/15/27 | 2,495,000 | 2,518,183 | |
| San Diego California Assn. Govts. South Bay (South Bay Expressway Proj.) Series 2017 A: | |||
| 5% 7/1/22 | 1,500,000 | 1,520,930 | |
| 5% 7/1/24 | 1,415,000 | 1,532,215 | |
| 5% 7/1/26 | 1,450,000 | 1,655,542 | |
| San Diego County Reg'l. Arpt. Auth. Arpt. Rev.: | |||
| Series 2019 A, 5% 7/1/24 | 45,000 | 48,771 | |
| Series 2020 A, 5% 7/1/22 | 2,055,000 | 2,084,089 | |
| Series 2020 B: | |||
| 5% 7/1/23 | 3,755,000 | 3,948,304 | |
| 5% 7/1/29 | 1,025,000 | 1,239,139 | |
| San Diego County Wtr. Auth. Rev. Series 2021 A, 5% 5/1/25 | 1,050,000 | 1,172,000 | |
| San Diego Pub. Facilities Fing. Auth. Lease Rev. Series 2015 B: | |||
| 5% 10/15/23 | 1,400,000 | 1,488,669 | |
| 5% 10/15/25 | 1,605,000 | 1,806,745 | |
| San Francisco City & County Redev. Agcy. Successor (San Francisco Redev. Projs.) Series 2014 C, 5% 8/1/22 | 175,000 | 178,036 | |
| San Jacinto Unified School District: | |||
| Series 2014 A, 5% 8/1/22 (Assured Guaranty Muni. Corp. Insured) | 325,000 | 330,597 | |
| Series 2014: | |||
| 5% 8/1/23 (Assured Guaranty Muni. Corp. Insured) | 400,000 | 421,154 | |
| 5% 8/1/24 (Assured Guaranty Muni. Corp. Insured) | 750,000 | 813,417 | |
| San Jose Fing. Auth. Lease Rev. (Civic Ctr. Proj.) Series 2013 A, 5% 6/1/22 (Escrowed to Maturity) | 1,100,000 | 1,112,099 | |
| San Marcos Redev. Agcy. Successor Series 2015 A: | |||
| 5% 10/1/22 | 1,850,000 | 1,893,675 | |
| 5% 10/1/23 | 900,000 | 955,085 | |
| San Mateo County Cmnty. College District Series 2006 B, 0% 9/1/26 (Nat'l. Pub. Fin. Guarantee Corp. Insured) | 3,505,000 | 3,267,264 | |
| San Mateo County Joint Powers Fing. Auth. Series 2019 A: | |||
| 5% 7/15/22 | 3,425,000 | 3,480,875 | |
| 5% 7/15/23 | 3,440,000 | 3,628,935 | |
| San Mateo Unified School District: | |||
| (Election of 2000 Proj.) Series B, 0% 9/1/25 (Nat'l. Pub. Fin. Guarantee Corp. Insured) | 3,055,000 | 2,895,853 | |
| Series 2013 A, 5% 9/1/33 (Pre-Refunded to 9/1/23 @ 100) | 815,000 | 861,955 | |
| San Pablo Redev. Agcy. Series 2014 A: | |||
| 5% 6/15/22 (Assured Guaranty Muni. Corp. Insured) | 1,000,000 | 1,012,023 | |
| 5% 6/15/23 (Assured Guaranty Muni. Corp. Insured) | 630,000 | 660,458 | |
| 5% 6/15/24 (Assured Guaranty Muni. Corp. Insured) | 100,000 | 108,209 | |
| Santa Barbara Fing. Auth. (Arpt. Proj.) Series 2019: | |||
| 5% 4/1/23 | 1,125,000 | 1,174,742 | |
| 5% 4/1/25 | 1,250,000 | 1,386,909 | |
| Santa Monica Pub. Fin. Rev. (Santa Monica Calif Proj.) Series 2017, 5% 7/1/22 | 400,000 | 405,892 | |
| South Bay Union School District Series 2019, 0% 8/1/22 | 2,230,000 | 2,221,342 | |
| South Orange County Pub. Fing. Auth. Spl. Tax Rev. Series 2014 A, 5% 8/15/22 | 750,000 | 764,856 | |
| Southern California Pub. Pwr. Auth. Rev. Bonds Series 2020 C, 0.65%, tender 7/1/25 (a) | 7,325,000 | 7,094,508 | |
| Stockton Pub. Fing. Auth. Wtr. Rev. Series 2018 A: | |||
| 5% 10/1/23 | 650,000 | 688,727 | |
| 5% 10/1/24 | 700,000 | 763,265 | |
| 5% 10/1/25 | 750,000 | 841,131 | |
| 5% 10/1/26 | 1,000,000 | 1,150,409 | |
| 5% 10/1/27 | 1,000,000 | 1,177,665 | |
| Stockton Unified School District Gen. Oblig. Series 2012, 5% 7/1/22 (Assured Guaranty Muni. Corp. Insured) | 1,220,000 | 1,237,763 | |
| Successor Agcy. to the Redev. Agcy. of Pittsburg (Los Medanos Cmnty. Dev. Proj.) Series 2016 A: | |||
| 5% 9/1/22 (Assured Guaranty Muni. Corp. Insured) | 3,370,000 | 3,434,091 | |
| 5% 9/1/23 (Assured Guaranty Muni. Corp. Insured) | 3,115,000 | 3,275,378 | |
| 5% 9/1/24 (Assured Guaranty Muni. Corp. Insured) | 125,000 | 135,229 | |
| 5% 9/1/26 (Assured Guaranty Muni. Corp. Insured) | 3,610,000 | 4,122,355 | |
| Tobacco Securitization Auth. Southern California Tobacco Settlement Series 2019 A1: | |||
| 5% 6/1/23 | 1,000,000 | 1,041,857 | |
| 5% 6/1/27 | 500,000 | 571,413 | |
| Turlock Irrigation District Rev. Series 2020: | |||
| 5% 1/1/23 | 4,315,000 | 4,462,858 | |
| 5% 1/1/24 | 4,530,000 | 4,843,631 | |
| 5% 1/1/25 | 4,760,000 | 5,244,285 | |
| 5% 1/1/26 | 4,995,000 | 5,659,628 | |
| Union Elementary School District Series B, 0% 9/1/22 (Nat'l. Pub. Fin. Guarantee Corp. Insured) | 400,000 | 398,429 | |
| Upland Gen. Oblig. Ctfs. of Prtn. (San Antonio Cmnty. Hosp.,CA. Proj.) Series 2017: | |||
| 5% 1/1/23 | 450,000 | 464,160 | |
| 5% 1/1/24 | 1,150,000 | 1,222,268 | |
| 5% 1/1/26 | 500,000 | 560,368 | |
| 5% 1/1/28 | 1,000,000 | 1,172,470 | |
| Vernon Elec. Sys. Rev.: | |||
| Series 2021 A: | |||
| 5% 4/1/24 | 1,100,000 | 1,177,381 | |
| 5% 4/1/26 | 1,000,000 | 1,125,159 | |
| 5% 4/1/28 | 1,500,000 | 1,756,082 | |
| Series 2022 A: | |||
| 5% 8/1/23 (b) | 575,000 | 598,401 | |
| 5% 8/1/24 (b) | 700,000 | 747,426 | |
| 5% 8/1/25 (b) | 500,000 | 546,637 | |
| 5% 8/1/26 (b) | 600,000 | 668,824 | |
| 5% 8/1/29 (b) | 1,055,000 | 1,225,982 | |
| Washington Township Health Care District Rev.: | |||
| Series 2019 A: | |||
| 5% 7/1/22 | 645,000 | 653,804 | |
| 5% 7/1/23 | 715,000 | 750,345 | |
| 5% 7/1/24 | 500,000 | 539,979 | |
| 5% 7/1/25 | 500,000 | 555,182 | |
| 5% 7/1/26 | 550,000 | 626,480 | |
| 5% 7/1/27 | 600,000 | 699,700 | |
| Series A: | |||
| 5% 7/1/22 | 200,000 | 202,730 | |
| 5% 7/1/23 | 175,000 | 183,651 | |
| 5% 7/1/24 | 200,000 | 215,992 | |
| 5% 7/1/25 | 200,000 | 222,073 | |
| 5% 7/1/26 | 250,000 | 284,763 | |
| 5% 7/1/27 | 375,000 | 437,312 | |
| 5% 7/1/28 | 400,000 | 476,212 | |
| 5% 7/1/29 | 350,000 | 424,720 | |
| West Contra Costa Unified School District: | |||
| Series 2004 C, 0% 8/1/27 (Nat'l. Pub. Fin. Guarantee Corp. Insured) | 530,000 | 473,570 | |
| Series 2014 A: | |||
| 5% 8/1/22 | 575,000 | 585,508 | |
| 5% 8/1/23 | 1,500,000 | 1,585,429 | |
| Series E: | |||
| 4% 8/1/25 (Assured Guaranty Muni. Corp. Insured) | 500,000 | 543,534 | |
| 4% 8/1/27 (Assured Guaranty Muni. Corp. Insured) | 650,000 | 733,096 | |
| 4% 8/1/27 (Assured Guaranty Muni. Corp. Insured) | 600,000 | 676,704 | |
| Series F, 4% 8/1/25 (Assured Guaranty Muni. Corp. Insured) | 400,000 | 434,827 | |
| TOTAL CALIFORNIA | 709,136,595 | ||
| Puerto Rico - 0.1% | |||
| Puerto Rico Indl., Tourist, Edl., Med. And Envir. Cont. Facilities Fing. Auth. Series 2021: | |||
| 5% 7/1/22 | 150,000 | 152,012 | |
| 5% 7/1/23 | 50,000 | 52,356 | |
| 5% 7/1/24 | 70,000 | 75,246 | |
| 5% 7/1/25 | 95,000 | 104,639 | |
| 5% 7/1/26 | 100,000 | 112,434 | |
| TOTAL PUERTO RICO | 496,687 | ||
| TOTAL MUNICIPAL BONDS | |||
| (Cost $711,025,669) | 709,633,282 | ||
| Municipal Notes - 1.3% | |||
| California - 1.3% | |||
| California Muni. Fin. Auth. Student Hsg. Participating VRDN Series 2021 XL 01 73, 0.26% 3/7/22 (Liquidity Facility JPMorgan Chase Bank) (a)(d)(e) | 3,550,000 | $3,550,000 | |
| Irvine Reassessment District 12-1 Ltd. Oblig. Series A, 0.05% 3/1/22, LOC Sumitomo Mitsui Banking Corp., VRDN (a)(c) | 1,950,000 | 1,950,000 | |
| Los Angeles Dept. of Wtr. & Pwr. Rev. Series 2021 A1, 0.03% 3/1/22 (Liquidity Facility Royal Bank of Canada), VRDN (a) | 2,950,000 | 2,950,000 | |
| River Islands Pub. Fing. Auth. Participating VRDN Series MIZ 90 26, 0.45% 4/4/22 (Liquidity Facility Mizuho Cap. Markets LLC) (a)(d)(e)(f) | 510,000 | 510,000 | |
| TOTAL MUNICIPAL NOTES | |||
| (Cost $8,960,000) | 8,960,000 | ||
| TOTAL INVESTMENT IN SECURITIES - 102.0% | |||
| (Cost $719,985,669) | 718,593,282 | ||
| NET OTHER ASSETS (LIABILITIES) - (2.0)% | (13,808,441) | ||
| NET ASSETS - 100% | $704,784,841 |
Security Type Abbreviations
VRDN – VARIABLE RATE DEMAND NOTE (A debt instrument that is payable upon demand, either daily, weekly or monthly)
Legend
(a) Coupon rates for floating and adjustable rate securities reflect the rates in effect at period end.
(b) Security or a portion of the security purchased on a delayed delivery or when-issued basis.
(c) Security exempt from registration under Rule 144A of the Securities Act of 1933. These securities may be resold in transactions exempt from registration, normally to qualified institutional buyers. At the end of the period, the value of these securities amounted to $3,793,345 or 0.5% of net assets.
(d) Provides evidence of ownership in one or more underlying municipal bonds.
(e) Coupon rates are determined by re-marketing agents based on current market conditions.
(f) Restricted securities (including private placements) - Investment in securities not registered under the Securities Act of 1933 (excluding 144A issues). At the end of the period, the value of restricted securities (excluding 144A issues) amounted to $510,000 or 0.1% of net assets.
Additional information on each restricted holding is as follows:
| Security | Acquisition Date | Acquisition Cost |
| River Islands Pub. Fing. Auth. Participating VRDN Series MIZ 90 26, 0.45% 4/4/22 (Liquidity Facility Mizuho Cap. Markets LLC) | 6/1/21 | $510,000 |
Investment Valuation
The following is a summary of the inputs used, as of February 28, 2022, involving the Fund's assets and liabilities carried at fair value. The inputs or methodology used for valuing securities may not be an indication of the risk associated with investing in those securities. For more information on valuation inputs, and their aggregation into the levels used below, please refer to the Investment Valuation section in the accompanying Notes to Financial Statements.
| Valuation Inputs at Reporting Date: | ||||
| Description | Total | Level 1 | Level 2 | Level 3 |
| Investments in Securities: | ||||
| Municipal Securities | $718,593,282 | $-- | $718,593,282 | $-- |
| Total Investments in Securities: | $718,593,282 | $-- | $718,593,282 | $-- |
Other Information
The distribution of municipal securities by revenue source, as a percentage of total Net Assets, is as follows (Unaudited):
| General Obligations | 34.8% |
| Health Care | 15.2% |
| Transportation | 13.0% |
| Education | 9.5% |
| Water & Sewer | 7.2% |
| Electric Utilities | 6.5% |
| Special Tax | 6.4% |
| Escrowed/Pre-Refunded | 5.0% |
| Others* (Individually Less Than 5%) | 2.4% |
| 100.0% |
* Includes net other assets
See accompanying notes which are an integral part of the financial statements.
Financial Statements
Statement of Assets and Liabilities
| February 28, 2022 | ||
| Assets | ||
| Investment in securities, at value — See accompanying schedule: Unaffiliated issuers (cost $719,985,669) | $718,593,282 | |
| Cash | 27,567,253 | |
| Receivable for fund shares sold | 256,337 | |
| Interest receivable | 7,103,493 | |
| Prepaid expenses | 503 | |
| Receivable from investment adviser for expense reductions | 85,877 | |
| Other receivables | 3,629 | |
| Total assets | 753,610,374 | |
| Liabilities | ||
| Payable for investments purchased on a delayed delivery basis | $45,737,854 | |
| Payable for fund shares redeemed | 2,596,010 | |
| Distributions payable | 166,632 | |
| Accrued management fee | 206,210 | |
| Other affiliated payables | 64,952 | |
| Other payables and accrued expenses | 53,875 | |
| Total liabilities | 48,825,533 | |
| Net Assets | $704,784,841 | |
| Net Assets consist of: | ||
| Paid in capital | $706,660,603 | |
| Total accumulated earnings (loss) | (1,875,762) | |
| Net Assets | $704,784,841 | |
| Net Asset Value, offering price and redemption price per share ($704,784,841 ÷ 67,099,710 shares) | $10.50 |
See accompanying notes which are an integral part of the financial statements.
Statement of Operations
| Year ended February 28, 2022 | ||
| Investment Income | ||
| Interest | $11,952,363 | |
| Expenses | ||
| Management fee | $2,633,979 | |
| Transfer agent fees | 624,475 | |
| Accounting fees and expenses | 169,947 | |
| Custodian fees and expenses | 7,776 | |
| Independent trustees' fees and expenses | 2,288 | |
| Registration fees | 28,819 | |
| Audit | 60,977 | |
| Legal | 3,144 | |
| Miscellaneous | 3,459 | |
| Total expenses before reductions | 3,534,864 | |
| Expense reductions | (893,528) | |
| Total expenses after reductions | 2,641,336 | |
| Net investment income (loss) | 9,311,027 | |
| Realized and Unrealized Gain (Loss) | ||
| Net realized gain (loss) on: | ||
| Investment securities: | ||
| Unaffiliated issuers | (505,380) | |
| Total net realized gain (loss) | (505,380) | |
| Change in net unrealized appreciation (depreciation) on investment securities | (20,511,389) | |
| Net gain (loss) | (21,016,769) | |
| Net increase (decrease) in net assets resulting from operations | $(11,705,742) |
See accompanying notes which are an integral part of the financial statements.
Statement of Changes in Net Assets
| Year ended February 28, 2022 | Year ended February 28, 2021 | |
| Increase (Decrease) in Net Assets | ||
| Operations | ||
| Net investment income (loss) | $9,311,027 | $10,465,091 |
| Net realized gain (loss) | (505,380) | 1,366,225 |
| Change in net unrealized appreciation (depreciation) | (20,511,389) | (6,574,522) |
| Net increase (decrease) in net assets resulting from operations | (11,705,742) | 5,256,794 |
| Distributions to shareholders | (9,381,413) | (11,807,294) |
| Share transactions | ||
| Proceeds from sales of shares | 200,532,241 | 251,121,569 |
| Reinvestment of distributions | 6,880,366 | 8,614,599 |
| Cost of shares redeemed | (256,993,169) | (229,706,166) |
| Net increase (decrease) in net assets resulting from share transactions | (49,580,562) | 30,030,002 |
| Total increase (decrease) in net assets | (70,667,717) | 23,479,502 |
| Net Assets | ||
| Beginning of period | 775,452,558 | 751,973,056 |
| End of period | $704,784,841 | $775,452,558 |
| Other Information | ||
| Shares | ||
| Sold | 18,586,287 | 23,196,586 |
| Issued in reinvestment of distributions | 638,642 | 796,711 |
| Redeemed | (23,871,027) | (21,435,984) |
| Net increase (decrease) | (4,646,098) | 2,557,313 |
See accompanying notes which are an integral part of the financial statements.
Financial Highlights
Fidelity California Limited Term Tax-Free Bond Fund
| Years ended February 28, | 2022 | 2021 | 2020 A | 2019 | 2018 |
| Selected Per–Share Data | |||||
| Net asset value, beginning of period | $10.81 | $10.87 | $10.58 | $10.49 | $10.59 |
| Income from Investment Operations | |||||
| Net investment income (loss)B,C | .132 | .157 | .182 | .184 | .168 |
| Net realized and unrealized gain (loss) | (.309) | (.040) | .290 | .090 | (.100) |
| Total from investment operations | (.177) | .117 | .472 | .274 | .068 |
| Distributions from net investment income | (.132) | (.157) | (.181) | (.184) | (.168) |
| Distributions from net realized gain | (.001) | (.020) | (.001) | – | – |
| Total distributions | (.133) | (.177) | (.182) | (.184) | (.168) |
| Net asset value, end of period | $10.50 | $10.81 | $10.87 | $10.58 | $10.49 |
| Total ReturnD | (1.66)% | 1.09% | 4.50% | 2.64% | .64% |
| Ratios to Average Net AssetsC,E,F | |||||
| Expenses before reductions | .47% | .47% | .47% | .48% | .47% |
| Expenses net of fee waivers, if any | .35% | .35% | .35% | .35% | .35% |
| Expenses net of all reductions | .35% | .35% | .35% | .35% | .35% |
| Net investment income (loss) | 1.23% | 1.45% | 1.70% | 1.75% | 1.59% |
| Supplemental Data | |||||
| Net assets, end of period (000 omitted) | $704,785 | $775,453 | $751,973 | $730,594 | $774,419 |
| Portfolio turnover rateG | 18% | 19% | 31% | 33% | 20% |
A For the year ended February 29.
B Calculated based on average shares outstanding during the period.
C Net investment income (loss) is affected by the timing of the declaration of dividends by any underlying mutual funds or exchange-traded funds (ETFs). Net investment income (loss) of any such underlying funds is not included in the Fund's net investment income (loss) ratio.
D Total returns would have been lower if certain expenses had not been reduced during the applicable periods shown.
E Fees and expenses of any underlying mutual funds or exchange-traded funds (ETFs) are not included in the Fund's expense ratio. The Fund indirectly bears its proportionate share of these expenses.
F Expense ratios reflect operating expenses of the class. Expenses before reductions do not reflect amounts reimbursed, waived, or reduced through arrangements with the investment adviser, brokerage services, or other offset arrangements, if applicable, and do not represent the amount paid by the class during periods when reimbursements, waivers or reductions occur.
G Amount does not include the portfolio activity of any underlying mutual funds or exchange-traded funds (ETFs).
See accompanying notes which are an integral part of the financial statements.
Notes to Financial Statements
For the period ended February 28, 2022
1. Organization.
Fidelity California Limited Term Tax-Free Bond Fund (the Fund) is a non-diversified fund of Fidelity California Municipal Trust (the Trust) and is authorized to issue an unlimited number of shares. Share transactions on the Statement of Changes in Net Assets may contain exchanges between affiliated funds. The Trust is registered under the Investment Company Act of 1940, as amended (the 1940 Act), as an open-end management investment company organized as a Massachusetts business trust. The Fund may be affected by economic and political developments in the state of California.
2. Significant Accounting Policies.
The Fund is an investment company and applies the accounting and reporting guidance of the Financial Accounting Standards Board (FASB) Accounting Standards Codification Topic 946 Financial Services - Investment Companies. The financial statements have been prepared in conformity with accounting principles generally accepted in the United States of America (GAAP), which require management to make certain estimates and assumptions at the date of the financial statements. Actual results could differ from those estimates. Subsequent events, if any, through the date that the financial statements were issued have been evaluated in the preparation of the financial statements. The Fund's Schedule of Investments lists any underlying mutual funds or exchange-traded funds (ETFs) but does not include the underlying holdings of these funds. The following summarizes the significant accounting policies of the Fund:
Investment Valuation. Investments are valued as of 4:00 p.m. Eastern time on the last calendar day of the period. The Board of Trustees (the Board) has delegated the day to day responsibility for the valuation of the Fund's investments to the Fair Value Committee (the Committee) established by the Fund's investment adviser. In accordance with valuation policies and procedures approved by the Board, the Fund attempts to obtain prices from one or more third party pricing vendors or brokers to value its investments. When current market prices, quotations or currency exchange rates are not readily available or reliable, investments will be fair valued in good faith by the Committee, in accordance with procedures adopted by the Board. Factors used in determining fair value vary by investment type and may include market or investment specific events, changes in interest rates and credit quality. The frequency with which these procedures are used cannot be predicted and they may be utilized to a significant extent. The Committee oversees the Fund's valuation policies and procedures and reports to the Board on the Committee's activities and fair value determinations. The Board monitors the appropriateness of the procedures used in valuing the Fund's investments and ratifies the fair value determinations of the Committee.
The Fund categorizes the inputs to valuation techniques used to value its investments into a disclosure hierarchy consisting of three levels as shown below:
- Level 1 – Unadjusted quoted prices in active markets for identical investments
- Level 2 – other significant observable inputs (including quoted prices for similar investments, interest rates, prepayment speeds, etc.)
- Level 3 – unobservable inputs (including the Fund's own assumptions based on the best information available)
Valuation techniques used to value the Fund's investments by major category are as follows:
Debt securities, including restricted securities, are valued based on evaluated prices received from third party pricing vendors or from brokers who make markets in such securities. Municipal securities are valued by pricing vendors who utilize matrix pricing which considers yield or price of bonds of comparable quality, coupon, maturity and type or by broker-supplied prices. When independent prices are unavailable or unreliable, debt securities may be valued utilizing pricing methodologies which consider similar factors that would be used by third party pricing vendors. Debt securities are generally categorized as Level 2 in the hierarchy but may be Level 3 depending on the circumstances.
Changes in valuation techniques may result in transfers in or out of an assigned level within the disclosure hierarchy. The aggregate value of investments by input level as of February 28, 2022 is included at the end of the Fund's Schedule of Investments.
Investment Transactions and Income. For financial reporting purposes, the Fund's investment holdings and NAV include trades executed through the end of the last business day of the period. The NAV per share for processing shareholder transactions is calculated as of the close of business of the New York Stock Exchange (NYSE), normally 4:00 p.m. Eastern time and includes trades executed through the end of the prior business day. Gains and losses on securities sold are determined on the basis of identified cost. Interest income is accrued as earned and includes coupon interest and amortization of premium and accretion of discount on debt securities as applicable. Debt obligations may be placed on non-accrual status and related interest income may be reduced by ceasing current accruals and writing off interest receivables when the collection of all or a portion of interest has become doubtful based on consistently applied procedures. A debt obligation is removed from non-accrual status when the issuer resumes interest payments or when collectability of interest is reasonably assured.
Expenses. Expenses directly attributable to a fund are charged to that fund. Expenses attributable to more than one fund are allocated among the respective funds on the basis of relative net assets or other appropriate methods. Expenses included in the accompanying financial statements reflect the expenses of that fund and do not include any expenses associated with any underlying mutual funds or exchange-traded funds. Although not included in a fund's expenses, a fund indirectly bears its proportionate share of these expenses through the net asset value of each underlying mutual fund or exchange-traded fund. Expense estimates are accrued in the period to which they relate and adjustments are made when actual amounts are known.
Income Tax Information and Distributions to Shareholders. Each year, the Fund intends to qualify as a regulated investment company under Subchapter M of the Internal Revenue Code, including distributing substantially all of its taxable income and realized gains. As a result, no provision for U.S. Federal income taxes is required. As of February 28, 2022, the Fund did not have any unrecognized tax benefits in the financial statements; nor is the Fund aware of any tax positions for which it is reasonably possible that the total amounts of unrecognized tax benefits will significantly change in the next twelve months. The Fund files a U.S. federal tax return, in addition to state and local tax returns as required. The Fund's federal income tax returns are subject to examination by the Internal Revenue Service (IRS) for a period of three fiscal years after they are filed. State and local tax returns may be subject to examination for an additional fiscal year depending on the jurisdiction.
Distributions are declared and recorded daily and paid monthly from net investment income. Distributions from realized gains, if any, are declared and recorded on the ex-dividend date. Income and capital gain distributions are determined in accordance with income tax regulations, which may differ from GAAP. In addition, the Fund claimed a portion of the payment made to redeeming shareholders as a distribution for income tax purposes.
Capital accounts within the financial statements are adjusted for permanent book-tax differences. These adjustments have no impact on net assets or the results of operations. Capital accounts are not adjusted for temporary book-tax differences which will reverse in a subsequent period.
Book-tax differences are primarily due to market discount, capital loss carryforwards and losses deferred due to wash sales.
The Fund purchases municipal securities whose interest, in the opinion of the issuer, is free from federal income tax. There is no assurance that the IRS will agree with this opinion. In the event the IRS determines that the issuer does not comply with relevant tax requirements, interest payments from a security could become federally taxable, possibly retroactively to the date the security was issued.
As of period end, the cost and unrealized appreciation (depreciation) in securities, and derivatives if applicable, for federal income tax purposes were as follows:
| Gross unrealized appreciation | $6,867,473 |
| Gross unrealized depreciation | (8,259,317) |
| Net unrealized appreciation (depreciation) | $(1,391,844) |
| Tax Cost | $719,985,126 |
The tax-based components of distributable earnings as of period end were as follows:
| Undistributed tax-exempt income | $21,461 |
| Capital loss carryforward | $(505,380) |
| Net unrealized appreciation (depreciation) on securities and other investments | $(1,391,844) |
Capital loss carryforwards are only available to offset future capital gains of the Fund to the extent provided by regulations and may be limited. The capital loss carryforward information presented below, including any applicable limitation, is estimated as of fiscal period end and is subject to adjustment.
| No expiration | |
| Short-term | $(443,986) |
| Long-term | (61,394) |
| Total capital loss carryforward | $(505,380) |
The tax character of distributions paid was as follows:
| February 28, 2022 | February 28, 2021 | |
| Tax-exempt Income | $9,309,704 | $10,462,333 |
| Long-term Capital Gains | 71,709 | 1,344,961 |
| Total | $9,381,413 | $ 11,807,294 |
Delayed Delivery Transactions and When-Issued Securities. During the period, certain Funds transacted in securities on a delayed delivery or when-issued basis. Payment and delivery may take place after the customary settlement period for that security. The price of the underlying securities and the date when the securities will be delivered and paid for are fixed at the time the transaction is negotiated. Securities purchased on a delayed delivery or when-issued basis are identified as such in the Schedule of Investments. Compensation for interest forgone in the purchase of a delayed delivery or when-issued debt security may be received. With respect to purchase commitments, each applicable Fund identifies securities as segregated in its records with a value at least equal to the amount of the commitment. Payables and receivables associated with the purchases and sales of delayed delivery securities having the same coupon, settlement date and broker are offset. Delayed delivery or when-issued securities that have been purchased from and sold to different brokers are reflected as both payables and receivables in the Statement of Assets and Liabilities under the caption "Delayed delivery", as applicable. Losses may arise due to changes in the value of the underlying securities or if the counterparty does not perform under the contract's terms, or if the issuer does not issue the securities due to political, economic, or other factors.
Restricted Securities (including Private Placements). Funds may invest in securities that are subject to legal or contractual restrictions on resale. These securities generally may be resold in transactions exempt from registration or to the public if the securities are registered. Disposal of these securities may involve time-consuming negotiations and expense, and prompt sale at an acceptable price may be difficult. Information regarding restricted securities held at period end is included at the end of the Schedule of Investments, if applicable.
3. Purchases and Sales of Investments.
Purchases and sales of securities, other than short-term securities and in-kind transactions, as applicable, are noted in the table below.
| Purchases ($) | Sales ($) | |
| Fidelity California Limited Term Tax-Free Bond Fund | 156,315,137 | 133,523,940 |
4. Fees and Other Transactions with Affiliates.
Management Fee. Fidelity Management & Research Company LLC (the investment adviser) and its affiliates provide the Fund with investment management related services for which the Fund pays a monthly management fee. The management fee is the sum of an individual fund fee rate that is based on an annual rate of .25% of the Fund's average net assets and an annualized group fee rate that averaged .10% during the period. The group fee rate is based upon the monthly average net assets of a group of registered investment companies with which the investment adviser has management contracts. The group fee rate decreases as assets under management increase and increases as assets under management decrease. For the reporting period, the total annual management fee rate was .35% of the Fund's average net assets.
Transfer Agent Fees. Fidelity Investments Institutional Operations Company LLC (FIIOC), an affiliate of the investment adviser, is the transfer, dividend disbursing and shareholder servicing agent for the Fund. FIIOC receives account fees and asset-based fees that vary according to account size and type of account. FIIOC pays for typesetting, printing and mailing of shareholder reports, except proxy statements. For the period, transfer agent fees were equivalent to an annual rate of .08% of average net assets.
Accounting Fees. Fidelity Service Company, Inc. (FSC), an affiliate of the investment adviser, maintains the Fund's accounting records. The accounting fee is based on the level of average net assets for each month. For the period, the fees were equivalent to the following annual rates:
| % of Average Net Assets | |
| Fidelity California Limited Term Tax-Free Bond Fund | .02 |
Interfund Trades. Funds may purchase from or sell securities to other Fidelity Funds under procedures adopted by the Board. The procedures have been designed to ensure these interfund trades are executed in accordance with Rule 17a-7 of the 1940 Act. Any interfund trades are included within the respective purchases and sales amounts shown in the Purchases and Sales of Investments note. Interfund trades during the period are noted in the table below.
| Purchases ($) | Sales ($) | Realized Gain (Loss) ($) | |
| Fidelity California Limited Term Tax-Free Bond Fund | 17,260,000 | 8,250,000 | – |
5. Committed Line of Credit.
Certain Funds participate with other funds managed by the investment adviser or an affiliate in a $4.25 billion credit facility (the "line of credit") to be utilized for temporary or emergency purposes to fund shareholder redemptions or for other short-term liquidity purposes. The participating funds have agreed to pay commitment fees on their pro-rata portion of the line of credit, which are reflected in Miscellaneous expenses on the Statement of Operations, and are listed below. During the period, there were no borrowings on this line of credit.
| Amount | |
| Fidelity California Limited Term Tax-Free Bond Fund | $1,306 |
6. Expense Reductions.
The investment adviser voluntarily agreed to reimburse the Fund to the extent annual operating expenses exceeded .35% of average net assets. Some expenses, for example the compensation of the independent Trustees, and certain miscellaneous expenses such as proxy and shareholder meeting expenses, are excluded from this reimbursement. During the period this reimbursement reduced the Fund's expenses by $874,303.
Through arrangements with the Fund's custodian, credits realized as a result of certain uninvested cash balances were used to reduce the Fund's expenses by $9,761.
In addition, during the period the investment adviser or an affiliate reimbursed and/or waived a portion of operating expenses in the amount of $9,464.
7. Other.
A fund's organizational documents provide former and current trustees and officers with a limited indemnification against liabilities arising in connection with the performance of their duties to the fund. In the normal course of business, a fund may also enter into contracts that provide general indemnifications. A fund's maximum exposure under these arrangements is unknown as this would be dependent on future claims that may be made against a fund. The risk of material loss from such claims is considered remote.
8. Coronavirus (COVID-19) Pandemic.
An outbreak of COVID-19 first detected in China during December 2019 has since spread globally and was declared a pandemic by the World Health Organization during March 2020. Developments that disrupt global economies and financial markets, such as the COVID-19 pandemic, may magnify factors that affect the Fund's performance.
Report of Independent Registered Public Accounting Firm
To the Board of Trustees of Fidelity California Municipal Trust and Shareholders of Fidelity California Limited Term Tax-Free Bond Fund
Opinion on the Financial Statements
We have audited the accompanying statement of assets and liabilities, including the schedule of investments, of Fidelity California Limited Term Tax-Free Bond Fund (one of the funds constituting Fidelity California Municipal Trust, referred to hereafter as the “Fund”) as of February 28, 2022, the related statement of operations for the year ended February 28, 2022, the statement of changes in net assets for each of the two years in the period ended February 28, 2022, including the related notes, and the financial highlights for each of the five years in the period ended February 28, 2022 (collectively referred to as the “financial statements”). In our opinion, the financial statements present fairly, in all material respects, the financial position of the Fund as of February 28, 2022, the results of its operations for the year then ended, the changes in its net assets for each of the two years in the period ended February 28, 2022 and the financial highlights for each of the five years in the period ended February 28, 2022 in conformity with accounting principles generally accepted in the United States of America.
Basis for Opinion
These financial statements are the responsibility of the Fund’s management. Our responsibility is to express an opinion on the Fund’s financial statements based on our audits. We are a public accounting firm registered with the Public Company Accounting Oversight Board (United States) (PCAOB) and are required to be independent with respect to the Fund in accordance with the U.S. federal securities laws and the applicable rules and regulations of the Securities and Exchange Commission and the PCAOB.
We conducted our audits of these financial statements in accordance with the standards of the PCAOB. Those standards require that we plan and perform the audit to obtain reasonable assurance about whether the financial statements are free of material misstatement, whether due to error or fraud.
Our audits included performing procedures to assess the risks of material misstatement of the financial statements, whether due to error or fraud, and performing procedures that respond to those risks. Such procedures included examining, on a test basis, evidence regarding the amounts and disclosures in the financial statements. Our audits also included evaluating the accounting principles used and significant estimates made by management, as well as evaluating the overall presentation of the financial statements. Our procedures included confirmation of securities owned as of February 28, 2022 by correspondence with the custodian and brokers; when replies were not received from brokers, we performed other auditing procedures. We believe that our audits provide a reasonable basis for our opinion.
/s/ PricewaterhouseCoopers LLP
Boston, Massachusetts
April 14, 2022
We have served as the auditor of one or more investment companies in the Fidelity group of funds since 1932.
Trustees and Officers
The Trustees, Members of the Advisory Board (if any), and officers of the trust and fund, as applicable, are listed below. The Board of Trustees governs the fund and is responsible for protecting the interests of shareholders. The Trustees are experienced executives who meet periodically throughout the year to oversee the fund's activities, review contractual arrangements with companies that provide services to the fund, oversee management of the risks associated with such activities and contractual arrangements, and review the fund's performance. Each of the Trustees oversees 292 funds.
The Trustees hold office without limit in time except that (a) any Trustee may resign; (b) any Trustee may be removed by written instrument, signed by at least two-thirds of the number of Trustees prior to such removal; (c) any Trustee who requests to be retired or who has become incapacitated by illness or injury may be retired by written instrument signed by a majority of the other Trustees; and (d) any Trustee may be removed at any special meeting of shareholders by a two-thirds vote of the outstanding voting securities of the trust. Each Trustee who is not an interested person (as defined in the 1940 Act) of the trust and the fund is referred to herein as an Independent Trustee. Each Independent Trustee shall retire not later than the last day of the calendar year in which his or her 75th birthday occurs. The Independent Trustees may waive this mandatory retirement age policy with respect to individual Trustees. Officers and Advisory Board Members hold office without limit in time, except that any officer or Advisory Board Member may resign or may be removed by a vote of a majority of the Trustees at any regular meeting or any special meeting of the Trustees. Except as indicated, each individual has held the office shown or other offices in the same company for the past five years.
The fund’s Statement of Additional Information (SAI) includes more information about the Trustees. To request a free copy, call Fidelity at 1-800-544-8544.
Experience, Skills, Attributes, and Qualifications of the Trustees. The Governance and Nominating Committee has adopted a statement of policy that describes the experience, qualifications, attributes, and skills that are necessary and desirable for potential Independent Trustee candidates (Statement of Policy). The Board believes that each Trustee satisfied at the time he or she was initially elected or appointed a Trustee, and continues to satisfy, the standards contemplated by the Statement of Policy. The Governance and Nominating Committee also engages professional search firms to help identify potential Independent Trustee candidates who have the experience, qualifications, attributes, and skills consistent with the Statement of Policy. From time to time, additional criteria based on the composition and skills of the current Independent Trustees, as well as experience or skills that may be appropriate in light of future changes to board composition, business conditions, and regulatory or other developments, have also been considered by the professional search firms and the Governance and Nominating Committee. In addition, the Board takes into account the Trustees' commitment and participation in Board and committee meetings, as well as their leadership of standing and ad hoc committees throughout their tenure.
In determining that a particular Trustee was and continues to be qualified to serve as a Trustee, the Board has considered a variety of criteria, none of which, in isolation, was controlling. The Board believes that, collectively, the Trustees have balanced and diverse experience, qualifications, attributes, and skills, which allow the Board to operate effectively in governing the fund and protecting the interests of shareholders. Information about the specific experience, skills, attributes, and qualifications of each Trustee, which in each case led to the Board's conclusion that the Trustee should serve (or continue to serve) as a trustee of the fund, is provided below.
Board Structure and Oversight Function. Abigail P. Johnson is an interested person and currently serves as Chairman. The Trustees have determined that an interested Chairman is appropriate and benefits shareholders because an interested Chairman has a personal and professional stake in the quality and continuity of services provided to the fund. Independent Trustees exercise their informed business judgment to appoint an individual of their choosing to serve as Chairman, regardless of whether the Trustee happens to be independent or a member of management. The Independent Trustees have determined that they can act independently and effectively without having an Independent Trustee serve as Chairman and that a key structural component for assuring that they are in a position to do so is for the Independent Trustees to constitute a substantial majority for the Board. The Independent Trustees also regularly meet in executive session. Michael E. Kenneally serves as Chairman of the Independent Trustees and as such (i) acts as a liaison between the Independent Trustees and management with respect to matters important to the Independent Trustees and (ii) with management prepares agendas for Board meetings.
Fidelity® funds are overseen by different Boards of Trustees. The fund's Board oversees Fidelity's investment-grade bond, money market, asset allocation and certain equity funds, and other Boards oversee Fidelity's high income and other equity funds. The asset allocation funds may invest in Fidelity® funds that are overseen by such other Boards. The use of separate Boards, each with its own committee structure, allows the Trustees of each group of Fidelity® funds to focus on the unique issues of the funds they oversee, including common research, investment, and operational issues. On occasion, the separate Boards establish joint committees to address issues of overlapping consequences for the Fidelity® funds overseen by each Board.
The Trustees operate using a system of committees to facilitate the timely and efficient consideration of all matters of importance to the Trustees, the fund, and fund shareholders and to facilitate compliance with legal and regulatory requirements and oversight of the fund's activities and associated risks. The Board, acting through its committees, has charged FMR and its affiliates with (i) identifying events or circumstances the occurrence of which could have demonstrably adverse effects on the fund's business and/or reputation; (ii) implementing processes and controls to lessen the possibility that such events or circumstances occur or to mitigate the effects of such events or circumstances if they do occur; and (iii) creating and maintaining a system designed to evaluate continuously business and market conditions in order to facilitate the identification and implementation processes described in (i) and (ii) above. Because the day-to-day operations and activities of the fund are carried out by or through FMR, its affiliates, and other service providers, the fund's exposure to risks is mitigated but not eliminated by the processes overseen by the Trustees. While each of the Board's committees has responsibility for overseeing different aspects of the fund's activities, oversight is exercised primarily through the Operations and Audit Committees. In addition, an ad hoc Board committee of Independent Trustees has worked with FMR to enhance the Board's oversight of investment and financial risks, legal and regulatory risks, technology risks, and operational risks, including the development of additional risk reporting to the Board. Appropriate personnel, including but not limited to the fund's Chief Compliance Officer (CCO), FMR's internal auditor, the independent accountants, the fund's Treasurer and portfolio management personnel, make periodic reports to the Board's committees, as appropriate, including an annual review of Fidelity's risk management program for the Fidelity® funds. The responsibilities of each standing committee, including their oversight responsibilities, are described further under "Standing Committees of the Trustees."
Interested Trustees*:
Correspondence intended for a Trustee who is an interested person may be sent to Fidelity Investments, 245 Summer Street, Boston, Massachusetts 02210.
Name, Year of Birth; Principal Occupations and Other Relevant Experience+
Abigail P. Johnson (1961)
Year of Election or Appointment: 2009
Trustee
Chairman of the Board of Trustees
Ms. Johnson also serves as Trustee of other Fidelity® funds. Ms. Johnson serves as Chairman (2016-present), Chief Executive Officer (2014-present), and Director (2007-present) of FMR LLC (diversified financial services company), President of Fidelity Financial Services (2012-present) and President of Personal, Workplace and Institutional Services (2005-present). Ms. Johnson is Chairman and Director of Fidelity Management & Research Company LLC (investment adviser firm, 2011-present). Previously, Ms. Johnson served as Chairman and Director of FMR Co., Inc. (investment adviser firm, 2011-2019), Vice Chairman (2007-2016) and President (2013-2016) of FMR LLC, President and a Director of Fidelity Management & Research Company (2001-2005), a Trustee of other investment companies advised by Fidelity Management & Research Company, Fidelity Investments Money Management, Inc. (investment adviser firm), and FMR Co., Inc. (2001-2005), Senior Vice President of the Fidelity® funds (2001-2005), and managed a number of Fidelity® funds. Ms. Abigail P. Johnson and Mr. Arthur E. Johnson are not related.
Jennifer Toolin McAuliffe (1959)
Year of Election or Appointment: 2016
Trustee
Ms. McAuliffe also serves as Trustee of other Fidelity® funds and as Trustee of Fidelity Charitable (2020-present). Previously, Ms. McAuliffe served as Co-Head of Fixed Income of Fidelity Investments Limited (now known as FIL Limited (FIL)) (diversified financial services company), Director of Research for FIL’s credit and quantitative teams in London, Hong Kong and Tokyo and Director of Research for taxable and municipal bonds at Fidelity Investments Money Management, Inc. Ms. McAuliffe previously served as a member of the Advisory Board of certain Fidelity® funds (2016). Ms. McAuliffe was previously a lawyer at Ropes & Gray LLP and currently serves as director or trustee of several not-for-profit entities.
* Determined to be an “Interested Trustee” by virtue of, among other things, his or her affiliation with the trust or various entities under common control with FMR.
+ The information includes the Trustee's principal occupation during the last five years and other information relating to the experience, attributes, and skills relevant to the Trustee's qualifications to serve as a Trustee, which led to the conclusion that the Trustee should serve as a Trustee for the fund.
Independent Trustees:
Correspondence intended for an Independent Trustee may be sent to Fidelity Investments, P.O. Box 55235, Boston, Massachusetts 02205-5235.
Name, Year of Birth; Principal Occupations and Other Relevant Experience+
Elizabeth S. Acton (1951)
Year of Election or Appointment: 2013
Trustee
Ms. Acton also serves as Trustee of other Fidelity® funds. Prior to her retirement, Ms. Acton served as Executive Vice President, Finance (2011-2012), Executive Vice President, Chief Financial Officer (2002-2011) and Treasurer (2004-2005) of Comerica Incorporated (financial services). Prior to joining Comerica, Ms. Acton held a variety of positions at Ford Motor Company (1983-2002), including Vice President and Treasurer (2000-2002) and Executive Vice President and Chief Financial Officer of Ford Motor Credit Company (1998-2000). Ms. Acton currently serves as a member of the Board and Audit and Finance Committees of Beazer Homes USA, Inc. (homebuilding, 2012-present). Ms. Acton previously served as a member of the Advisory Board of certain Fidelity® funds (2013-2016).
Ann E. Dunwoody (1953)
Year of Election or Appointment: 2018
Trustee
General Dunwoody also serves as Trustee of other Fidelity® funds. General Dunwoody (United States Army, Retired) was the first woman in U.S. military history to achieve the rank of four-star general and prior to her retirement in 2012 held a variety of positions within the U.S. Army, including Commanding General, U.S. Army Material Command (2008-2012). General Dunwoody currently serves as President of First to Four LLC (leadership and mentoring services, 2012-present), a member of the Board and Nomination and Corporate Governance Committees of Kforce Inc. (professional staffing services, 2016-present) and a member of the Board of Automattic Inc. (software engineering, 2018-present). Previously, General Dunwoody served as a member of the Advisory Board and Nominating and Corporate Governance Committee of L3 Technologies, Inc. (communication, electronic, sensor and aerospace systems, 2013-2019) and a member of the Board and Audit and Sustainability and Corporate Responsibility Committees of Republic Services, Inc. (waste collection, disposal and recycling, 2013-2016). Ms. Dunwoody also serves on several boards for non-profit organizations, including as a member of the Board, Chair of the Nomination and Governance Committee and a member of the Audit Committee of Logistics Management Institute (consulting non-profit, 2012-present), a member of the Council of Trustees for the Association of the United States Army (advocacy non-profit, 2013-present), a member of the Board of Florida Institute of Technology (2015-present) and a member of the Board of ThanksUSA (military family education non-profit, 2014-present). General Dunwoody previously served as a member of the Advisory Board of certain Fidelity® funds (2018).
John Engler (1948)
Year of Election or Appointment: 2014
Trustee
Mr. Engler also serves as Trustee of other Fidelity® funds. Previously, Mr. Engler served as Governor of Michigan (1991-2003), President of the Business Roundtable (2011-2017) and interim President of Michigan State University (2018-2019). Mr. Engler currently serves as a member of the Board of Stride, Inc. (formerly K12 Inc.) (technology-based education company, 2012-present). Previously, Mr. Engler served as a member of the Board of Universal Forest Products (manufacturer and distributor of wood and wood-alternative products, 2003-2019) and Trustee of The Munder Funds (2003-2014). Mr. Engler previously served as a member of the Advisory Board of certain Fidelity® funds (2014-2016).
Robert F. Gartland (1951)
Year of Election or Appointment: 2010
Trustee
Mr. Gartland also serves as Trustee of other Fidelity® funds. Prior to his retirement, Mr. Gartland held a variety of positions at Morgan Stanley (financial services, 1979-2007), including Managing Director (1987-2007) and Chase Manhattan Bank (1975-1978). Mr. Gartland previously served as Chairman and an investor in Gartland & Mellina Group Corp. (consulting, 2009-2019), as a member of the Board of National Securities Clearing Corporation (1993-1996) and as Chairman of TradeWeb (2003-2004).
Arthur E. Johnson (1947)
Year of Election or Appointment: 2008
Trustee
Mr. Johnson also serves as Trustee of other Fidelity® funds. Prior to his retirement, Mr. Johnson served as Senior Vice President of Corporate Strategic Development of Lockheed Martin Corporation (defense contractor, 1999-2009). Mr. Johnson currently serves as a member of the Board of Booz Allen Hamilton (management consulting, 2011-present). Mr. Johnson previously served as a member of the Board of Eaton Corporation plc (diversified power management, 2009-2019) and a member of the Board of AGL Resources, Inc. (holding company, 2002-2016). Mr. Johnson previously served as Chairman (2018-2021) and Vice Chairman (2015-2018) of the Independent Trustees of certain Fidelity® funds. Mr. Arthur E. Johnson is not related to Ms. Abigail P. Johnson.
Michael E. Kenneally (1954)
Year of Election or Appointment: 2009
Trustee
Chairman of the Independent Trustees
Mr. Kenneally also serves as Trustee of other Fidelity® funds and was Vice Chairman (2018-2021) of the Independent Trustees of certain Fidelity® funds. Prior to retirement in 2005, he was Chairman and Global Chief Executive Officer of Credit Suisse Asset Management, the worldwide fund management and institutional investment business of Credit Suisse Group. Previously, Mr. Kenneally was an Executive Vice President and the Chief Investment Officer for Bank of America. In this role, he was responsible for the investment management, strategy and products delivered to the bank’s institutional, high-net-worth and retail clients. Earlier, Mr. Kenneally directed the organization’s equity and quantitative research groups. He began his career as a research analyst and then spent more than a dozen years as a portfolio manager for endowments, pension plans and mutual funds. He earned the Chartered Financial Analyst (CFA) designation in 1991.
Marie L. Knowles (1946)
Year of Election or Appointment: 2001
Trustee
Ms. Knowles also serves as Trustee of other Fidelity® funds. Prior to her retirement, Ms. Knowles held several positions at Atlantic Richfield Company (diversified energy), including Executive Vice President and Chief Financial Officer (1996-2000), Senior Vice President (1993-1996) and President of ARCO Transportation Company (pipeline and tanker operations, 1993-1996). Ms. Knowles currently serves as a member of the Board of the Santa Catalina Island Company (real estate, 2009-present), a member of the Investment Company Institute Board of Governors and a member of the Governing Council of the Independent Directors Council (2014-present). Ms. Knowles also serves as a member of the Advisory Board for the School of Engineering of the University of Southern California. Ms. Knowles previously served as a member of the Board of McKesson Corporation (healthcare service, 2002-2021). In addition, Ms. Knowles previously served as Chairman (2015-2018) and Vice Chairman (2012-2015) of the Independent Trustees of certain Fidelity® funds.
Mark A. Murray (1954)
Year of Election or Appointment: 2016
Trustee
Mr. Murray also serves as Trustee of other Fidelity® funds. Previously, Mr. Murray served as Co-Chief Executive Officer (2013-2016), President (2006-2013) and Vice Chairman (2013-2020) of Meijer, Inc. Mr. Murray serves as a member of the Board (2009-present) and Public Policy and Responsibility Committee (2009-present) and Chair of the Nuclear Review Committee (2019-present) of DTE Energy Company (diversified energy company). Mr. Murray previously served as a member of the Board of Spectrum Health (not-for-profit health system, 2015-2019) and as a member of the Board and Audit Committee and Chairman of the Nominating and Corporate Governance Committee of Universal Forest Products, Inc. (manufacturer and distributor of wood and wood-alternative products, 2004-2016). Mr. Murray also serves as a member of the Board of many community and professional organizations. Mr. Murray previously served as a member of the Advisory Board of certain Fidelity® funds (2016).
+ The information includes the Trustee's principal occupation during the last five years and other information relating to the experience, attributes, and skills relevant to the Trustee's qualifications to serve as a Trustee, which led to the conclusion that the Trustee should serve as a Trustee for the fund.
Advisory Board Members and Officers:
Correspondence intended for an officer may be sent to Fidelity Investments, 245 Summer Street, Boston, Massachusetts 02210. Officers appear below in alphabetical order.
Name, Year of Birth; Principal Occupation
Robert W. Helm (1957)
Year of Election or Appointment: 2021
Member of the Advisory Board
Mr. Helm also serves as a Member of the Advisory Board of other Fidelity® funds. Mr. Helm was formerly Deputy Chairman (2003-2020), partner (1991-2020) and an associate (1984-1991) of Dechert LLP (formerly Dechert Price & Rhoads). Mr. Helm currently serves on boards and committees of several not-for-profit organizations.
Craig S. Brown (1977)
Year of Election or Appointment: 2019
Assistant Treasurer
Mr. Brown also serves as an officer of other funds. Mr. Brown serves as Assistant Treasurer of FIMM, LLC (2021-present) and is an employee of Fidelity Investments (2013-present).
John J. Burke III (1964)
Year of Election or Appointment: 2018
Chief Financial Officer
Mr. Burke also serves as Chief Financial Officer of other funds. Mr. Burke serves as Head of Investment Operations for Fidelity Fund and Investment Operations (2018-present) and is an employee of Fidelity Investments (1998-present). Previously Mr. Burke served as head of Asset Management Investment Operations (2012-2018).
David J. Carter (1973)
Year of Election or Appointment: 2020
Assistant Secretary
Mr. Carter also serves as Assistant Secretary of other funds. Mr. Carter serves as Vice President, Associate General Counsel (2010-present) and is an employee of Fidelity Investments (2005-present).
Jonathan Davis (1968)
Year of Election or Appointment: 2010
Assistant Treasurer
Mr. Davis also serves as an officer of other funds. Mr. Davis serves as Assistant Treasurer of FIMM, LLC (2021-present), FMR Capital, Inc. (2017-present), FD Funds GP LLC (2021-present), FD Funds Holding LLC (2021-present), and FD Funds Management LLC (2021-present); and is an employee of Fidelity Investments. Previously, Mr. Davis served as Vice President and Associate General Counsel of FMR LLC (diversified financial services company, 2003-2010).
Laura M. Del Prato (1964)
Year of Election or Appointment: 2018
President and Treasurer
Ms. Del Prato also serves as an officer of other funds. Ms. Del Prato serves as Assistant Treasurer of FIMM, LLC (2021-present) and is an employee of Fidelity Investments (2017-present). Previously, Ms. Del Prato served as President and Treasurer of The North Carolina Capital Management Trust: Cash Portfolio and Term Portfolio (2018-2020). Prior to joining Fidelity Investments, Ms. Del Prato served as a Managing Director and Treasurer of the JPMorgan Mutual Funds (2014-2017). Prior to JPMorgan, Ms. Del Prato served as a partner at Cohen Fund Audit Services (accounting firm, 2012-2013) and KPMG LLP (accounting firm, 2004-2012).
Colm A. Hogan (1973)
Year of Election or Appointment: 2016
Assistant Treasurer
Mr. Hogan also serves as an officer of other funds. Mr. Hogan serves as Assistant Treasurer of FIMM, LLC (2021-present) and FMR Capital, Inc. (2017-present) and is an employee of Fidelity Investments (2005-present). Previously, Mr. Hogan served as Deputy Treasurer of certain Fidelity® funds (2016-2020) and Assistant Treasurer of certain Fidelity® funds (2016-2018).
Cynthia Lo Bessette (1969)
Year of Election or Appointment: 2019
Secretary and Chief Legal Officer (CLO)
Ms. Lo Bessette also serves as an officer of other funds. Ms. Lo Bessette serves as CLO, Secretary, and Senior Vice President of Fidelity Management & Research Company LLC (investment adviser firm, 2019-present); CLO of Fidelity Management & Research (Hong Kong) Limited, FMR Investment Management (UK) Limited, and Fidelity Management & Research (Japan) Limited (investment adviser firms, 2019-present); Secretary of FD Funds GP LLC (2021-present), FD Funds Holding LLC (2021-present), and FD Funds Management LLC (2021-present); and Assistant Secretary of FIMM, LLC (2019-present). She is a Senior Vice President and Deputy General Counsel of FMR LLC (diversified financial services company, 2019-present), and is an employee of Fidelity Investments. Previously, Ms. Lo Bessette served as CLO, Secretary, and Senior Vice President of FMR Co., Inc. (investment adviser firm, 2019); Secretary of Fidelity SelectCo, LLC and Fidelity Investments Money Management, Inc. (investment adviser firms, 2019). Prior to joining Fidelity Investments, Ms. Lo Bessette was Executive Vice President, General Counsel (2016-2019) and Senior Vice President, Deputy General Counsel (2015-2016) of OppenheimerFunds (investment management company) and Deputy Chief Legal Officer (2013-2015) of Jennison Associates LLC (investment adviser firm).
Chris Maher (1972)
Year of Election or Appointment: 2013
Assistant Treasurer
Mr. Maher also serves as an officer of other funds. Mr. Maher serves as Assistant Treasurer of FIMM, LLC (2021-present) and FMR Capital, Inc. (2017-present), and is an employee of Fidelity Investments (2008-present). Previously, Mr. Maher served as Assistant Treasurer of certain funds (2013-2020); Vice President of Asset Management Compliance (2013), Vice President of the Program Management Group of FMR (investment adviser firm, 2010-2013), and Vice President of Valuation Oversight (2008-2010).
Jamie Pagliocco (1964)
Year of Election or Appointment: 2020
Vice President
Mr. Pagliocco also serves as Vice President of other funds. Mr. Pagliocco serves as President of Fixed Income (2020-present), and is an employee of Fidelity Investments (2001-present). Previously, Mr. Pagliocco served as Co-Chief Investment Officer – Bond (2017-2020), Global Head of Bond Trading (2016-2019), and as a portfolio manager.
Kenneth B. Robins (1969)
Year of Election or Appointment: 2020
Chief Compliance Officer
Mr. Robins also serves as an officer of other funds. Mr. Robins serves as Compliance Officer of Fidelity Management & Research Company LLC (investment adviser firm, 2016-present) and is an employee of Fidelity Investments (2004-present). Previously, Mr. Robins served as Compliance Officer of FMR Co., Inc. (investment adviser firm, 2016-2019), as Executive Vice President of Fidelity Investments Money Management, Inc. (investment adviser firm, 2013-2016) and served in other fund officer roles.
Brett Segaloff (1972)
Year of Election or Appointment: 2021
Anti-Money Laundering (AML) Officer
Mr. Segaloff also serves as an AML Officer of other funds and other related entities. He is Director, Anti-Money Laundering (2007-present) of FMR LLC (diversified financial services company) and is an employee of Fidelity Investments (1996-present).
Stacie M. Smith (1974)
Year of Election or Appointment: 2013
Assistant Treasurer
Ms. Smith also serves as an officer of other funds. Ms. Smith serves as Assistant Treasurer of FIMM, LLC (2021-present) and FMR Capital, Inc. (2017-present), is an employee of Fidelity Investments (2009-present), and has served in other fund officer roles. Prior to joining Fidelity Investments, Ms. Smith served as Senior Audit Manager of Ernst & Young LLP (accounting firm, 1996-2009). Previously, Ms. Smith served as Assistant Treasurer (2013-2019) and Deputy Treasurer (2013-2016) of certain Fidelity® funds.
Jim Wegmann (1979)
Year of Election or Appointment: 2021
Deputy Treasurer
Mr. Wegmann also serves as an officer of other funds. Mr. Wegmann serves as Assistant Treasurer of FIMM, LLC (2021-present) and is an employee of Fidelity Investments (2011-present). Previously, Mr. Wegmann served as Assistant Treasurer of certain Fidelity® funds (2019-2021).
Shareholder Expense Example
As a shareholder, you incur two types of costs: (1) transaction costs, which may include sales charges (loads) on purchase payments or redemption proceeds, as applicable and (2) ongoing costs, which generally include management fees, distribution and/or service (12b-1) fees and other Fund expenses. This Example is intended to help you understand your ongoing costs (in dollars) of investing in a fund and to compare these costs with the ongoing costs of investing in other mutual funds.
The Example is based on an investment of $1,000 invested at the beginning of the period and held for the entire period (September 1, 2021 to February 28, 2022).
Actual Expenses
The first line of the accompanying table provides information about actual account values and actual expenses. You may use the information in this line, together with the amount you invested, to estimate the expenses that you paid over the period. Simply divide your account value by $1,000.00 (for example, an $8,600 account value divided by $1,000.00 = 8.6), then multiply the result by the number in the first line for a class/Fund under the heading entitled "Expenses Paid During Period" to estimate the expenses you paid on your account during this period. If any fund is a shareholder of any underlying mutual funds or exchange-traded funds (ETFs) (the Underlying Funds), such fund indirectly bears its proportional share of the expenses of the Underlying Funds in addition to the direct expenses incurred presented in the table. These fees and expenses are not included in the annualized expense ratio used to calculate the expense estimate in the table below.
Hypothetical Example for Comparison Purposes
The second line of the accompanying table provides information about hypothetical account values and hypothetical expenses based on the actual expense ratio and an assumed rate of return of 5% per year before expenses, which is not the actual return. The hypothetical account values and expenses may not be used to estimate the actual ending account balance or expenses you paid for the period. You may use this information to compare the ongoing costs of investing in the Fund and other funds. To do so, compare this 5% hypothetical example with the 5% hypothetical examples that appear in the shareholder reports of the other funds. If any fund is a shareholder of any Underlying Funds, such fund indirectly bears its proportional share of the expenses of the Underlying Funds in addition to the direct expenses as presented in the table. These fees and expenses are not included in the annualized expense ratio used to calculate the expense estimate in the table below.
Please note that the expenses shown in the table are meant to highlight your ongoing costs only and do not reflect any transaction costs. Therefore, the second line of the table is useful in comparing ongoing costs only, and will not help you determine the relative total costs of owning different funds. In addition, if these transactional costs were included, your costs would have been higher.
| Annualized Expense Ratio-A | Beginning Account Value September 1, 2021 | Ending Account Value February 28, 2022 | Expenses Paid During Period-B September 1, 2021 to February 28, 2022 | |
| Fidelity California Limited Term Tax-Free Bond Fund | .35% | |||
| Actual | $1,000.00 | $973.40 | $1.71 | |
| Hypothetical-C | $1,000.00 | $1,023.06 | $1.76 |
A Annualized expense ratio reflects expenses net of applicable fee waivers.
B Expenses are equal to the annualized expense ratio, multiplied by the average account value over the period, multiplied by 181/ 365 (to reflect the one-half year period). The fees and expenses of any Underlying Funds are not included in each annualized expense ratio.
C 5% return per year before expenses
Distributions (Unaudited)
During fiscal year ended 2022, 100% of the fund's income dividends was free from federal income tax, and 0.00% of the fund's income dividends was subject to the federal alternative minimum tax.
The fund will notify shareholders in January 2023 of amounts for use in preparing 2022 income tax returns.
Board Approval of Investment Advisory Contracts and Management Fees
Fidelity California Limited Term Tax-Free Bond Fund
Each year, the Board of Trustees, including the Independent Trustees (together, the Board), votes on the renewal of the management contract with Fidelity Management & Research Company LLC (FMR) and the sub-advisory agreements (together, the Advisory Contracts) for the fund. FMR and the sub-advisers are referred to herein as the Investment Advisers. The Board, assisted by the advice of fund counsel and Independent Trustees' counsel, requests and considers a broad range of information relevant to the renewal of the Advisory Contracts throughout the year.The Board meets regularly and, at each of its meetings, covers an extensive agenda of topics and materials and considers factors that are relevant to its annual consideration of the renewal of the fund's Advisory Contracts, including the services and support provided to the fund and its shareholders. The Board has established four standing committees (Committees) — Operations, Audit, Fair Valuation, and Governance and Nominating — each composed of and chaired by Independent Trustees with varying backgrounds, to which the Board has assigned specific subject matter responsibilities in order to enhance effective decision-making by the Board. The Operations Committee, of which all of the Independent Trustees are members, meets regularly throughout the year and considers, among other matters, information specifically related to the annual consideration of the renewal of the fund's Advisory Contracts. The Board, acting directly and through its Committees, requests and receives information concerning the annual consideration of the renewal of the fund's Advisory Contracts. The Board also meets as needed to review matters specifically related to the Board's annual consideration of the renewal of the Advisory Contracts. Members of the Board may also meet with trustees of other Fidelity funds through joint ad hoc committees to discuss certain matters relevant to all of the Fidelity funds.At its September 2021 meeting, the Board unanimously determined to renew the fund's Advisory Contracts. In reaching its determination, the Board considered all factors it believed relevant, including (i) the nature, extent, and quality of the services provided to the fund and its shareholders (including the investment performance of the fund); (ii) the competitiveness relative to peer funds of the fund's management fee and total expense ratio; (iii) the total costs of the services provided by and the profits realized by Fidelity from its relationships with the fund; and (iv) the extent to which, if any, economies of scale exist and are realized as the fund grows, and whether any economies of scale are appropriately shared with fund shareholders.In considering whether to renew the Advisory Contracts for the fund, the Board reached a determination, with the assistance of fund counsel and Independent Trustees' counsel and through the exercise of its business judgment, that the renewal of the Advisory Contracts was in the best interests of the fund and its shareholders and that the compensation payable under the Advisory Contracts was fair and reasonable. The Board's decision to renew the Advisory Contracts was not based on any single factor, but rather was based on a comprehensive consideration of all the information provided to the Board at its meetings throughout the year. The Board, in reaching its determination to renew the Advisory Contracts, was aware that shareholders of the fund have a broad range of investment choices available to them, including a wide choice among funds offered by Fidelity's competitors, and that the fund's shareholders, who have the opportunity to review and weigh the disclosure provided by the fund in its prospectus and other public disclosures, have chosen to invest in this fund, which is part of the Fidelity family of funds.Nature, Extent, and Quality of Services Provided. The Board considered Fidelity's staffing as it relates to the fund, including the backgrounds of investment personnel of Fidelity, and also considered the fund's investment objective, strategies, and related investment philosophy. The Independent Trustees also had discussions with senior management of Fidelity's investment operations and investment groups. The Board considered the structure of the investment personnel compensation program and whether this structure provides appropriate incentives to act in the best interests of the fund. Additionally, the Board considered the portfolio managers' investments, if any, in the funds that they manage. The Board also considered the steps Fidelity had taken to ensure the continued provision of high quality services to the Fidelity funds during the COVID-19 pandemic, including the expansion of staff in client facing positions to maintain service levels in periods of high volumes and volatility.Resources Dedicated to Investment Management and Support Services. The Board reviewed the general qualifications and capabilities of Fidelity's investment staff, including its size, education, experience, and resources, as well as Fidelity's approach to recruiting, training, managing, and compensating investment personnel. The Board noted the resources devoted to Fidelity's global investment organization, and that Fidelity's analysts have extensive resources, tools and capabilities that allow them to conduct sophisticated quantitative and fundamental analysis, as well as credit analysis of issuers, counterparties and guarantors. Further, the Board considered that Fidelity's investment professionals have sufficient access to global information and data so as to provide competitive investment results over time, and that those professionals also have access to sophisticated tools that permit them to assess portfolio construction and risk and performance attribution characteristics continuously, as well as to transmit new information and research conclusions rapidly around the world. Additionally, in its deliberations, the Board considered Fidelity's trading, risk management, compliance, cybersecurity, and technology and operations capabilities and resources, which are integral parts of the investment management process.Shareholder and Administrative Services. The Board considered (i) the nature, extent, quality, and cost of advisory, administrative, and shareholder services performed by the Investment Advisers and their affiliates under the Advisory Contracts and under separate agreements covering transfer agency and pricing and bookkeeping services for the fund; (ii) the nature and extent of the supervision of third party service providers, principally custodians, subcustodians, and pricing vendors; and (iii) the resources devoted to, and the record of compliance with, the fund's compliance policies and procedures.The Board noted that the growth of fund assets over time across the complex allows Fidelity to reinvest in the development of services designed to enhance the value and convenience of the Fidelity funds as investment vehicles. These services include 24-hour access to account information and market information over the Internet and through telephone representatives, investor education materials and asset allocation tools. The Board also considered that it reviews customer service metrics such as telephone response times, continuity of services on the website and metrics addressing services at Fidelity Investor Centers.Investment in a Large Fund Family. The Board considered the benefits to shareholders of investing in a Fidelity fund, including the benefits of investing in a fund that is part of a large family of funds offering a variety of investment disciplines and providing a large variety of mutual fund investor services. The Board noted that Fidelity had taken, or had made recommendations to the Board that resulted in the Fidelity funds taking, a number of actions over the previous year that benefited particular funds, including: (i) continuing to dedicate additional resources to Fidelity's investment research process, which includes meetings with management of issuers of securities in which the funds invest; (ii) continuing efforts to enhance Fidelity's global research capabilities; (iii) launching new funds and ETFs with innovative structures, strategies and pricing and making other enhancements to meet client needs; (iv) launching new share classes of existing funds; (v) eliminating purchase minimums and broadening eligibility requirements for certain funds and share classes; (vi) reducing the holding period for the conversion of Class C shares to Class A shares; (vii) reducing management fees and total expenses for certain target date funds and classes and index funds; (viii) lowering expenses for certain existing funds and classes by implementing or lowering expense caps; (ix) rationalizing product lines and gaining increased efficiencies from fund mergers, liquidations, and share class consolidations; (x) continuing to develop, acquire and implement systems and technology to improve services to the funds and shareholders, strengthen information security, and increase efficiency; and (xi) continuing to implement enhancements to further strengthen Fidelity's product line to increase investors' probability of success in achieving their investment goals, including their retirement income goals.Investment Performance. The Board considered whether the fund has operated in accordance with its investment objective, as well as its record of compliance with its investment restrictions and its performance history.The Board took into account discussions that occur at Board meetings throughout the year with representatives of the Investment Advisers about fund investment performance. In this regard the Board noted that as part of regularly scheduled fund reviews and other reports to the Board on fund performance, the Board considers annualized return information for the fund for different time periods, measured against an appropriate securities market index (benchmark index) and an appropriate peer group of funds with similar objectives (peer group). The Board also reviews and considers information about performance attribution. In its evaluation of fund investment performance at meetings throughout the year, the Board gave particular attention to information indicating underperformance of certain Fidelity funds for specific time periods and discussed with the Investment Advisers the reasons for such underperformance.In addition to reviewing absolute and relative fund performance, the Independent Trustees periodically consider the appropriateness of fund performance metrics in evaluating the results achieved. In general, the Independent Trustees believe that fund performance should be evaluated based on gross performance (before fees and expenses but after transaction costs) compared to appropriate benchmark indices, over appropriate time periods that may include full market cycles, and on net performance (after fees and expenses) compared to appropriate peer groups, as applicable, over the same periods, taking into account relevant factors including the following: general market conditions; expectations for interest rate levels and credit conditions; issuer-specific information including credit quality; the potential for incremental return versus the fund's benchmark index weighed against the risks involved in obtaining that incremental return, including the risk of diminished or negative total returns; and fund cash flows and other factors. The Independent Trustees generally give greater weight to fund performance over longer time periods than over shorter time periods. Depending on the circumstances, the Independent Trustees may be satisfied with a fund's performance notwithstanding that it lags its benchmark index or peer group for certain periods.The Independent Trustees recognize that shareholders evaluate performance on a net basis over their own holding periods, for which one-, three-, and five-year periods are often used as a proxy. For this reason, the performance information reviewed by the Board also included net cumulative calendar year total return information for the fund and an appropriate benchmark index and peer group for the most recent one-, three-, and five-year periods. The Independent Trustees recognize that shareholders who are not investing through a tax-advantaged retirement account also consider tax consequences in evaluating performance.Based on its review, the Board concluded that the nature, extent, and quality of services provided to the fund under the Advisory Contracts should continue to benefit the shareholders of the fund.Competitiveness of Management Fee and Total Expense Ratio. The Board considered the fund's management fee and total expense ratio compared to "mapped groups" of competitive funds and classes created for the purpose of facilitating the Trustees' competitive analysis of management fees and total expenses. Fidelity creates "mapped groups" by combining similar Lipper investment objective categories that have comparable investment mandates. Combining Lipper investment objective categories aids the Board's management fee and total expense ratio comparisons by broadening the competitive group used for comparison.Management Fee. The Board considered two proprietary management fee comparisons for the 12-month periods shown in basis points (BP) in the chart below. The group of Lipper funds used by the Board for management fee comparisons is referred to below as the "Total Mapped Group" and is broader than the Lipper peer group used by the Board for performance comparisons. The Total Mapped Group comparison focuses on a fund's standing in terms of gross management fees before expense reimbursements or caps relative to the total universe of funds with comparable investment mandates, regardless of whether their management fee structures also are comparable. Funds with comparable investment mandates offer exposure to similar types of securities. Funds with comparable management fee structures have similar management fee contractual arrangements (e.g., flat rate charged for advisory services, all-inclusive fee rate, etc.). "TMG %" represents the percentage of funds in the Total Mapped Group that had management fees that were lower than the fund's. For example, a hypothetical TMG % of 20% would mean that 80% of the funds in the Total Mapped Group had higher, and 20% had lower, management fees than the fund. The fund's actual TMG %s and the number of funds in the Total Mapped Group are in the chart below. The "Asset-Sized Peer Group" (ASPG) comparison focuses on a fund's standing relative to a subset of non-Fidelity funds within the Total Mapped Group that are similar in size and management fee structure. For example, if a fund is in the first quartile of the ASPG, the fund's management fee ranks in the least expensive or lowest 25% of funds in the ASPG. The ASPG represents at least 15% of the funds in the Total Mapped Group with comparable asset size and management fee structures, subject to a minimum of 50 funds (or all funds in the Total Mapped Group if fewer than 50). Additional information, such as the ASPG quartile in which the fund's management fee rate ranked, is also included in the chart and was considered by the Board.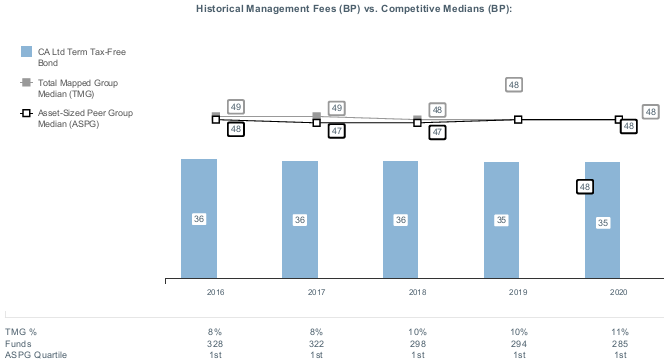
Liquidity Risk Management Program
The Securities and Exchange Commission adopted Rule 22e-4 under the Investment Company Act of 1940 (the Liquidity Rule) to promote effective liquidity risk management throughout the open-end investment company industry, thereby reducing the risk that funds will be unable to meet their redemption obligations and mitigating dilution of the interests of fund shareholders.
The Fund has adopted and implemented a liquidity risk management program pursuant to the Liquidity Rule (the Program) effective December 1, 2018. The Program is reasonably designed to assess and manage the Fund’s liquidity risk and to comply with the requirements of the Liquidity Rule. The Fund’s Board of Trustees (the Board) has designated the Fund’s investment adviser as administrator of the Program. The Fidelity advisers have established a Liquidity Risk Management Committee (the LRM Committee) to manage the Program for each of the Fidelity Funds. The LRM Committee monitors the adequacy and effectiveness of implementation of the Program and on a periodic basis assesses each Fund’s liquidity risk based on a variety of factors including (1) the Fund’s investment strategy, (2) portfolio liquidity and cash flow projections during normal and reasonably foreseeable stressed conditions, (3) shareholder redemptions, (4) borrowings and other funding sources and (5) in the case of exchange-traded funds, certain additional factors including the effect of the Fund’s prices and spreads, market participants, and basket compositions on the overall liquidity of the Fund’s portfolio, as applicable.
In accordance with the Program, each of the Fund’s portfolio investments is classified into one of four liquidity categories described below based on a determination of a reasonable expectation for how long it would take to convert the investment to cash (or sell or dispose of the investment) without significantly changing its market value.
- Highly liquid investments – cash or convertible to cash within three business days or less
- Moderately liquid investments – convertible to cash in three to seven calendar days
- Less liquid investments – can be sold or disposed of, but not settled, within seven calendar days
- Illiquid investments – cannot be sold or disposed of within seven calendar days
Liquidity classification determinations take into account a variety of factors including various market, trading and investment-specific considerations, as well as market depth, and generally utilize analysis from a third-party liquidity metrics service.
The Liquidity Rule places a 15% limit on a fund’s illiquid investments and requires funds that do not primarily hold assets that are highly liquid investments to determine and maintain a minimum percentage of the fund’s net assets to be invested in highly liquid investments (highly liquid investment minimum or HLIM). The Program includes provisions reasonably designed to comply with the 15% limit on illiquid investments and for determining, periodically reviewing and complying with the HLIM requirement as applicable.
At a recent meeting of the Fund’s Board of Trustees, the LRM Committee provided a written report to the Board pertaining to the operation, adequacy, and effectiveness of implementation of the Program for the annual period from December 1, 2020 through November 30, 2021. The report concluded that the Program has been implemented and is operating effectively and is reasonably designed to assess and manage the Fund’s liquidity risk.
![]()
CSI-ANN-0422
1.817077.116
Item 2.
Code of Ethics
As of the end of the period, February 28, 2022, Fidelity California Municipal Trust (the trust) has adopted a code of ethics, as defined in Item 2 of Form N-CSR, that applies to its President and Treasurer and its Chief Financial Officer. A copy of the code of ethics is filed as an exhibit to this Form N-CSR.
Item 3.
Audit Committee Financial Expert
The Board of Trustees of the trust has determined that Elizabeth S. Acton is an audit committee financial expert, as defined in Item 3 of Form N-CSR. Ms. Acton is independent for purposes of Item 3 of Form N-CSR.
Item 4.
Principal Accountant Fees and Services
Fees and Services
The following table presents fees billed by PricewaterhouseCoopers LLP (“PwC”) in each of the last two fiscal years for services rendered to Fidelity California Limited Term Tax-Free Bond Fund and Fidelity California Municipal Income Fund (the “Funds”):
Services Billed by PwC
February 28, 2022 FeesA
Audit Fees | Audit-Related Fees | Tax Fees | All Other Fees | |
Fidelity California Limited Term Tax-Free Bond Fund | $48,800 | $4,100 | $5,200 | $1,800 |
Fidelity California Municipal Income Fund | $44,400 | $3,800 | $5,300 | $1,600 |
February 28, 2021 FeesA
Audit Fees | Audit-Related Fees | Tax Fees | All Other Fees | |
Fidelity California Limited Term Tax-Free Bond Fund | $47,600 | $4,000 | $5,100 | $2,100 |
Fidelity California Municipal Income Fund | $43,500 | $3,700 | $5,100 | $2,000 |
A Amounts may reflect rounding.
The following table(s) present(s) fees billed by PwC that were required to be approved by the Audit Committee for services that relate directly to the operations and financial reporting of the Fund(s) and that are rendered on behalf of Fidelity Management & Research Company LLC ("FMR") and entities controlling, controlled by, or under common control with FMR (not including any sub-adviser whose role is primarily portfolio management and is subcontracted with or overseen by another investment adviser) that provide ongoing services to the Fund(s) (“Fund Service Providers”):
Services Billed by PwC
February 28, 2022A | February 28, 2021A | |
Audit-Related Fees | $8,239,800 | $9,436,200 |
Tax Fees | $354,200 | $14,300 |
All Other Fees | $- | $- |
A Amounts may reflect rounding.
“Audit-Related Fees” represent fees billed for assurance and related services that are reasonably related to the performance of the fund audit or the review of the fund's financial statements and that are not reported under Audit Fees.
“Tax Fees” represent fees billed for tax compliance, tax advice or tax planning that relate directly to the operations and financial reporting of the fund.
“All Other Fees” represent fees billed for services provided to the fund or Fund Service Provider, a significant portion of which are assurance related, that relate directly to the operations and financial reporting of the fund, excluding those services that are reported under Audit Fees, Audit-Related Fees or Tax Fees.
Assurance services must be performed by an independent public accountant.
* * *
The aggregate non-audit fees billed by PwC for services rendered to the Fund(s), FMR (not including any sub-adviser whose role is primarily portfolio management and is subcontracted with or overseen by another investment adviser), and any Fund Service Provider for each of the last two fiscal years of the Fund(s) are as follows:
Billed By | February 28, 2022A | February 28, 2021A |
PwC | $13,858,500 | $14,607,400 |
A Amounts may reflect rounding.
The trust's Audit Committee has considered non-audit services that were not pre-approved that were provided by PwC to Fund Service Providers to be compatible with maintaining the independence of PwC in its(their) audit of the Fund(s), taking into account representations from PwC, in accordance with Public Company Accounting Oversight Board rules, regarding its independence from the Fund(s) and its(their) related entities and FMR’s review of the appropriateness and permissibility under applicable law of such non-audit services prior to their provision to the Fund(s) Service Providers.
Audit Committee Pre-Approval Policies and Procedures
The trust’s Audit Committee must pre-approve all audit and non-audit services provided by a fund’s independent registered public accounting firm relating to the operations or financial reporting of the fund. Prior to the commencement of any audit or non-audit services to a fund, the Audit Committee reviews the services to determine whether they are appropriate and permissible under applicable law.
The Audit Committee has adopted policies and procedures to, among other purposes, provide a framework for the Committee’s consideration of non-audit services by the audit firms that audit the Fidelity funds. The policies and procedures require that any non-audit service provided by a fund audit firm to a Fidelity fund and any non-audit service provided by a fund auditor to a Fund Service Provider that relates directly to the operations and financial reporting of a Fidelity fund (“Covered Service”) are subject to approval by the Audit Committee before such service is provided.
All Covered Services must be approved in advance of provision of the service either: (i) by formal resolution of the Audit Committee, or (ii) by oral or written approval of the service by the Chair of the Audit Committee (or if the Chair is unavailable, such other member of the Audit Committee as may be designated by the Chair to act in the Chair’s absence). The approval contemplated by (ii) above is permitted where the Treasurer determines that action on such an engagement is necessary before the next meeting of the Audit Committee.
Non-audit services provided by a fund audit firm to a Fund Service Provider that do not relate directly to the operations and financial reporting of a Fidelity fund are reported to the Audit Committee periodically.
Non-Audit Services Approved Pursuant to Rule 2-01(c)(7)(i)(C) and (ii) of Regulation S-X (“De Minimis Exception”)
There were no non-audit services approved or required to be approved by the Audit Committee pursuant to the De Minimis Exception during the Fund’s(s’) last two fiscal years relating to services provided to (i) the Fund(s) or (ii) any Fund Service Provider that relate directly to the operations and financial reporting of the Fund(s).
Item 5.
Audit Committee of Listed Registrants
Not applicable.
Item 6.
Investments
(a)
Not applicable.
(b)
Not applicable.
Item 7.
Disclosure of Proxy Voting Policies and Procedures for Closed-End Management Investment Companies
Not applicable.
Item 8.
Portfolio Managers of Closed-End Management Investment Companies
Not applicable.
Item 9.
Purchase of Equity Securities by Closed-End Management Investment Company and Affiliated Purchasers
Not applicable.
Item 10.
Submission of Matters to a Vote of Security Holders
There were no material changes to the procedures by which shareholders may recommend nominees to the trust’s Board of Trustees.
Item 11.
Controls and Procedures
(a)(i) The President and Treasurer and the Chief Financial Officer have concluded that the trust’s disclosure controls and procedures (as defined in Rule 30a-3(c) under the Investment Company Act) provide reasonable assurances that material information relating to the trust is made known to them by the appropriate persons, based on their evaluation of these controls and procedures as of a date within 90 days of the filing date of this report.
(a)(ii) There was no change in the trust’s internal control over financial reporting (as defined in Rule 30a-3(d) under the Investment Company Act) that occurred during the period covered by this report that has materially affected, or is reasonably likely to materially affect, the trust’s internal control over financial reporting.
Item 12.
Disclosure of Securities Lending Activities for Closed-End Management
Investment Companies
Not applicable.
Item 13.
Exhibits
(a) | (1) | Code of Ethics pursuant to Item 2 of Form N-CSR is filed and attached hereto as EX-99.CODE ETH. |
(a) | (2) | |
(a) | (3) | Not applicable. |
(b) |
SIGNATURES
Pursuant to the requirements of the Securities Exchange Act of 1934 and the Investment Company Act of 1940, the registrant has duly caused this report to be signed on its behalf by the undersigned, thereunto duly authorized.
Fidelity California Municipal Trust
By: | /s/Laura M. Del Prato |
Laura M. Del Prato | |
President and Treasurer | |
Date: | April 21, 2022 |
Pursuant to the requirements of the Securities Exchange Act of 1934 and the Investment Company Act of 1940, this report has been signed below by the following persons on behalf of the registrant and in the capacities and on the dates indicated.
By: | /s/Laura M. Del Prato |
Laura M. Del Prato | |
President and Treasurer | |
Date: | April 21, 2022 |
By: | /s/John J. Burke III |
John J. Burke III | |
Chief Financial Officer | |
Date: | April 21, 2022 |