CORPORATE PROFILE
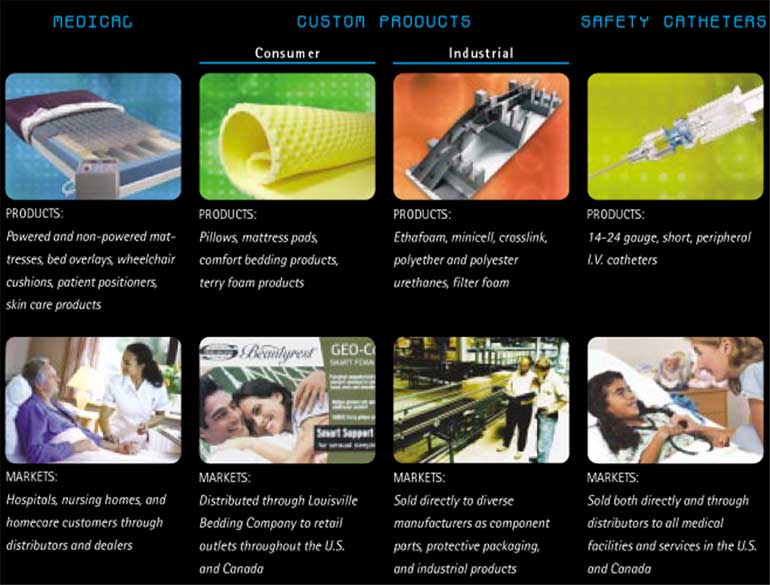
Span-America Medical Systems, Inc. manufactures and markets a comprehensive selection of pressure management products for the medical market, including Geo-Matt®, PressureGuard®, Geo-Mattress®, Span-Aids®, and Isch-Dish® products. The Company also supplies pillows and mattress overlays to the consumer bedding market and various custom engineered products to the industrial market. Span-America’s common stock trades on The Nasdaq Stock Market® under the symbol SPAN.
PRODUCTS OVERVIEW
FINANCIAL SUMMARY
| | | | | | | | | | | | | | |
| (Amounts in thousands, except per share and percent data) | | 2003 | | 2002 | | % Change |
| |
| |
| |
|
| Net sales | | $ | 41,575 | | | $ | 33,536 | | | | 24 | % |
| Operating income | | | 1,440 | | | | 1,717 | | | | -16 | % |
| Net income | | | 1,399 | | | | 1,658 | | | | -16 | % |
| Earnings per share: | | | | | | | | | | | | |
| | Basic | | | 0.55 | | | | 0.66 | | | | -17 | % |
| | Diluted | | | 0.53 | | | | 0.64 | | | | -17 | % |
| Return on net sales | | | 3.4 | % | | | 4.9 | % | | | | |
| Cash and securities | | | 5,955 | | | | 6,949 | | | | -14 | % |
| Current assets | | | 15,029 | | | | 14,331 | | | | 5 | % |
| Total assets | | | 23,991 | | | | 21,906 | | | | 10 | % |
| Current liabilities | | | 4,215 | | | | 3,273 | | | | 29 | % |
| Shareholders’ equity | | | 18,525 | | | | 17,394 | | | | 7 | % |
| Return on average shareholders’ equity | | | 7.8 | % | | | 9.9 | % | | | | |
| Number of shares outstanding at fiscal year end | | | 2,552 | | | | 2,539 | | | | 1 | % |
| Book value per share | | | 7.26 | | | | 6.85 | | | | 6 | % |

TABLE OF CONTENTS
LETTER TO SHAREHOLDERS 2 • SELECTED FINANCIAL INFORMATION 8 • QUARTERLY FINANCIAL DATA 9
MANAGEMENT’S DISCUSSION AND FINANCIAL ANALYSIS 10 • BALANCE SHEETS 16 • STATEMENTS OF INCOME 17
STATEMENTS OF SHAREHOLDERS’ EQUITY 18 • STATEMENTS OF CASH FLOWS 19 • NOTES TO FINANCIAL STATEMENTS 20
REPORT OF ELLIOTT DAVIS, LLC, INDEPENDENT AUDITORS 31 • DIRECTORS AND OFFICERS 32 • CORPORATE DATA IBC
1

TO OUR SHAREHOLDERS
Fiscal 2003 was a year of growth and investment for Span-America. Our sales rose 24% to a record $41.6 million with both the medical and custom products segments showing strong sales increases. Highlights for fiscal 2003 included earning ISO 9002 certification, a major accomplishment that attests to the quality of our operations. The company was also ranked number 63 by Fortune Small Business magazine in their annual list of 100 fastest growing publicly traded small companies. We increased our quarterly dividend by 17%, and we are pleased to report that Span-America’s stock provided a total return to shareholders of 43% during the fiscal year.
We reported earnings of $1.4 million in fiscal 2003, down 16% from fiscal 2002. As we announced last year, we expected our earnings to be lower in fiscal 2003 because of our planned investments in the new Secure I.V. business. We believe our development costs for Secure I.V. represent a solid investment in Span-America’s future and expect to generate our first revenues from this product line in fiscal 2004.
MEDICAL BUSINESS
Our medical business was a major contributor to growth and profitability in fiscal 2003. Medical sales were up 8% to $21.3 million compared with fiscal 2002 and represented about 51% of total sales for fiscal 2003. We believe our sales growth was very good for a market that became increasingly soft as the year progressed. Medicare funding cuts in October 2002 began to impact sales in the long-term care part of the market around April 2003, slowing our medical sales growth rate in the last half of the fiscal year. We are optimistic this trend will reverse due to the increased Medicare funding for the long-term care market that took effect in October 2003. We hope the higher funding will make it easier for our customers to purchase new products to upgrade their facilities.
2
MEDICAL BUSINESS (continued)
Total mattress sales jumped by 24% during the year. The majority of our medical sales growth was generated by our Geo-Mattress® and PressureGuard® therapeutic mattresses. These products have proven highly effective at preventing or promoting the healing of pressure ulcers in at-risk patients. We believe our mattresses provide comfort to patients and excellent clinical performance to our customers — at very competitive prices. Our product leaders during the year were the PressureGuard APM2® alternating pressure mattress and the newer PressureGuard Easy Air® low-air-loss mattress. We introduced an upgraded version of the APM2® in April called the Deuce Deluxe™. Market reception for the “Deuce” has been outstanding, and we expect continued success in our mattress business in fiscal 2004.
In other medical product lines, sales of our Span-Aids® patient positioners grew by 8%, and sales of Selan® skin care products increased 6%. We introduced the new Selan Herbal in June, and we are planning another Selan line extension for 2004. Sales of our mattress overlays, including Geo-Matt®, were down 10% in fiscal 2003 as customers continue a long-term trend of switching from overlays to therapeutic replacement mattresses. Sales of seating products dropped 24% compared with fiscal 2002 due to a large one-time sale in fiscal 2002.
Overall, we are pleased with the solid performance of the medical segment in fiscal 2003. We believe that medical sales will likely be soft in the first half of fiscal 2004. However, our long-term view of the medical business remains positive, and we expect it to be a major contributor to Span-America’s future value.
3
CUSTOM PRODUCTS BUSINESS
The custom products segment was the main engine for our sales growth in fiscal 2003. Sales of custom products were up by 46% to $20.2 million as a result of strong sales to Wal-Mart through our marketing partner, Louisville Bedding Company, the exclusive distributor for our consumer foam products in the United States. They are also one of the largest makers and sellers of bedding products in North America. Our companies have highly complimentary skills, and we are pleased with our partnership.
We established new sales programs with several national retailers during fiscal 2003. Sales of consumer bedding products were up 57% last year primarily due to new business with Wal-Mart. Our goal for consumer products is to combine Span-America’s skills with those of Louisville Bedding to provide retailers with fresh and innovative foam bedding products at competitive prices and best-in-class quality and service. We have enjoyed excellent success with this strategy since joining forces in 1999. We look forward to continued growth in consumer bedding sales, although at a slower rate than we experienced in fiscal 2003.
The other part of our custom products segment includes industrial foam products. The industrial product line consists of a wide variety of custom engineered foam products ranging from kayak components to automotive parts to returnable packaging products. Industrial sales were up 3% last year to $2.9 million. In this specialty business, we provide design and fabrication expertise for foam products to a variety of manufacturers in the southeast. We expect continued sales growth in the industrial product lines over the long term, subject to cycles affecting the regional manufacturing economy.
4

SECURE IV™ BUSINESS
We acquired the Secure I.V.® line of safety catheters in July 2002. Secure I.V. is a unique catheter that includes a patented valve that eliminates the flow of blood back through the catheter as it is inserted in the vein. This allows for bloodless I.V. starts without vein occlusion, giving healthcare workers maximum protection from blood and body fluids. The product has FDA 510(k) marketing approval and is protected by numerous U.S. and foreign patents.
We have been working diligently since the acquisition to complete product development, design and build the automated production process, and set up a distribution network. We have made tremendous progress to date and are now rigorously testing and validating the manufacturing process to ensure the quality and safety of each product. We expect to begin selling Secure I.V. in the first half of 2004. Pre-market interest in the product has been extremely high. We continue to believe that Secure I.V. is an exciting product line, providing an excellent growth opportunity for Span-America.

FINANCIAL RESULTS
Our financial performance for fiscal 2003 was somewhat mixed with sales jumping 24% to $41.6 million and earnings declining 16% to $1.4 million. Our results were very close to our expectations for the year.
Earnings were down in fiscal 2003 for several reasons. First, we received two price increases for foam, our single largest expense category. We anticipated some of the increases and worked to mitigate them by raising
5
sales prices as the market permitted. Second, expenses for Secure I.V. increased by $446,000 during the year. This included costs for design, development and pre-production of the new product line. Third, we incurred expenses of $286,000 for professional fees and other expenses related to renewal of our shareholder rights plan, which was set to expire this year, and the proposed tender offer and subsequent lawsuit by shareholder Jerry Zucker. We have settled the lawsuit and are in discussions with Mr. Zucker regarding his interests as outlined in his 13-D filing with the SEC. Finally, fiscal 2002 earnings included two one-time gains: a payment we received from settlement of a patent infringement lawsuit, the terms of which remain confidential; and a gain of $84,000 as a result of stock received from the demutualization of Prudential Insurance Company. Without these unusual or one-time items, earnings from our core medical and custom products business would have been up by 25% for fiscal 2003. Our employees stepped up and delivered solid results in a tough business environment.
Span-America’s financial condition remains strong. We finished fiscal 2003 with excellent liquidity, no bank debt and $18.5 million in shareholders’ equity. Cash flow for the year was a healthy $1.1 million. But it was down 23% from 2002 mostly because of increases in accounts receivable and inventory to support our higher sales levels. Even though receivables and inventory were up, both our collection time and inventory turnover improved for the year. Our capital expenditures for 2003 were $1.6 million, which was up significantly from the past several years. Most of the capital was invested for new tooling and equipment for the Secure I.V. product line. We believe our strong balance sheet provides us with a competitive advantage in volatile markets and we plan to work hard to maintain that edge while we search for additional growth and investment opportunities.
FUTURE OUTLOOK
We believe the outlook for Span-America is bright. We expect growth in sales and earnings in fiscal 2004 compared with 2003, although sales are not expected to reach the 24% growth rate of the past year.
We think our core medical business is well positioned for long-term growth and above average returns. The demographics of our country should provide a steadily increasing customer base for our medical products for many years to come. Our challenge will be to maintain and improve our medical market share by continuing to introduce innovative new products that meet our customers’ needs and exceed their expectations. We hope to expand our market presence by strengthening relationships with corporate accounts and group purchasing organizations. We will also explore private label opportunities with large customers. We hope our medical business will benefit from the recent increase in Medicare funding particularly in the long term care market. Export sales (mostly to Canada) doubled in fiscal 2003, and we will continue to look beyond our borders for sales growth opportunities for the medical business.
The custom products business has shown tremendous growth in the last four years due to our partnership with Louisville Bedding Company. The consumer market for our foam pads and pillows is large and filled with opportunity. To prosper in this market, we must provide a constant stream of innovative new products and creative packaging at very competitive prices — all backed by top flight quality, delivery and service. We have to deliver these benefits while at the same time continuing to focus on improving our margins in this price sensitive business.
Fiscal 2004 will be an important year for the Secure I.V. business. We expect to start up the automated production line and bring the product to market in the first half of 2004. Based on pre-market reaction to the product, we are optimistic about the growth opportunities for the safety catheter segment. We do not expect the Secure I.V. segment to begin contributing to earnings until fiscal 2005. We believe the Secure I.V. business is a good example of our efforts to redeploy cash for future growth. We will continue to look for similar opportunities to add value to Span-America.
6
We made a number of improvements in our manufacturing operations in fiscal 2003 that we believe will lower costs and improve efficiencies and customer service in 2004 and beyond. We automated two key production processes that reduced manufacturing costs and increased our capacity at the same time. We streamlined a key packaging process that significantly lowered labor costs. We also increased on-time shipping performance in several areas to improve service to our customers.
We are very proud of earning the prestigious ISO 9002 and ISO 13488 certifications in fiscal 2003 and expect to reap continued benefits from the certification process. The ISO 9002 certification allowed us to extend our sales for powered mattress products in Canada, a growing market for Span-America. We also instituted new disciplines in our business that enhanced our focus on quality and processes. We plan to extend these practices throughout our business in 2004 to improve our operations and further reduce our costs.
Span-America is a healthy and vibrant company. We have a broad line of high quality, cost effective products backed by an efficient manufacturing operation, an experienced sales and marketing group and a dedicated team of employees. We plan to devote all our energies and resources to building value for our customers and investors. We appreciate your interest and trust in Span-America. We look forward to reporting to you on our progress.
Sincerely,
| | | |
 | |  |
| JAMES D. FERGUSON | | THOMAS D. HENRION |
| President and CEO | | Chairman |

7
SELECTED FINANCIAL INFORMATION
FIVE-YEAR FINANCIAL SUMMARY
(Amounts in thousands, except per share and employee data)
| | | | | | | | | | | | | | | | | | | | | | | |
| | | | | 2003 | | 2002 | | 2001 | | 2000 | | 1999 |
| | | | |
| |
| |
| |
| |
|
| For the year: | | | | | | | | | | | | | | | | | | | | |
| | Net sales | | $ | 41,575 | | | $ | 33,536 | | | $ | 29,075 | | | $ | 26,568 | | | $ | 23,063 | |
| | Gross profit | | | 11,134 | | | | 10,175 | | | | 8,910 | | | | 7,621 | | | | 6,344 | |
| | Operating income (loss) | | | 1,440 | | | | 1,717 | | | | 1,297 | | | | 902 | | | | (166 | ) |
| | Net income | | | 1,399 | | | | 1,658 | | | | 1,260 | | | | 971 | | | | 498 | |
| | Cash flow from operations | | | 1,147 | | | | 1,486 | | | | 2,362 | | | | 1,483 | | | | 2,202 | |
| | Capital expenditures | | | 1,647 | | | | 559 | | | | 461 | | | | 413 | | | | 171 | |
| Per share: | | | | | | | | | | | | | | | | | | | | |
| | Net income: | | | | | | | | | | | | | | | | | | | | |
| | | Basic | | $ | 0.55 | | | $ | 0.66 | | | $ | 0.50 | | | $ | 0.39 | | | $ | 0.19 | |
| | | Diluted | | | 0.53 | | | | 0.64 | | | | 0.50 | | | | 0.39 | | | | 0.19 | |
| | Cash dividends declared | | | 0.14 | | | | 0.12 | | | | 0.12 | | | | 0.11 | | | | 0.10 | |
| At end of year: | | | | | | | | | | | | | | | | | | | | |
| | Working capital | | | 10,814 | | | | 11,058 | | | | 9,844 | | | | 8,671 | | | | 7,858 | |
| | Property and equipment — net | | | 4,817 | | | | 3,632 | | | | 3,425 | | | | 3,346 | | | | 3,460 | |
| | Total assets | | | 23,991 | | | | 21,906 | | | | 20,185 | | | | 19,161 | | | | 17,679 | |
| | Shareholders’ equity | | | 18,525 | | | | 17,394 | | | | 15,928 | | | | 14,904 | | | | 14,180 | |
| | Book value per share | | | 7.26 | | | | 6.85 | | | | 6.33 | | | | 5.95 | | | | 5.68 | |
| | Number of employees(1) | | | 299 | | | | 254 | | | | 228 | | | | 216 | | | | 194 | |
| Key ratios: | | | | | | | | | | | | | | | | | | | | |
| | Current ratio | | | 3.6 | | | | 4.4 | | | | 4.2 | | | | 3.8 | | | | 4.5 | |
| | Return on net sales | | | 3.4 | % | | | 4.9 | % | | | 4.3 | % | | | 3.7 | % | | | 2.2 | % |
| | Return on average shareholders’ equity | | | 7.8 | % | | | 9.9 | % | | | 8.2 | % | | | 6.7 | % | | | 3.3 | % |
| | Return on average total assets | | | 6.1 | % | | | 7.9 | % | | | 6.4 | % | | | 5.3 | % | | | 2.7 | % |
| (1) | | Past fiscal years have been restated to include temporary employees at fiscal year end. |
8
QUARTERLY FINANCIAL DATA
(Unaudited)
(Amounts in thousands, except per share data)
| | | | | | | | | | | | | | | | | | | | | | |
| | | | First | | Second | | Third | | Fourth | | Year |
| | | |
| |
| |
| |
| |
|
FOR FISCAL 2003 | | | | | | | | | | | | | | | | | | | | |
| Net sales | | $ | 7,892 | | | $ | 10,839 | | | $ | 10,609 | | | $ | 12,235 | | | $ | 41,575 | |
| Gross profit | | | 2,506 | | | | 2,633 | | | | 2,907 | | | | 3,088 | | | | 11,134 | |
| Operating income | | | 316 | | | | 177 | | | | 442 | | | | 505 | | | | 1,440 | |
| Net income | | | 333 | | | | 226 | | | | 392 | | | | 448 | | | | 1,399 | |
| Earnings per share | | | | | | | | | | | | | | | | | | | | |
| | Basic | | | 0.13 | | | | 0.09 | | | | 0.15 | | | | 0.18 | | | | 0.55 | |
| | Diluted | | | 0.13 | | | | 0.09 | | | | 0.15 | | | | 0.17 | | | | 0.53 | |
| Stock price data | | | | | | | | | | | | | | | | | | | | |
| | High | | | 8.08 | | | | 8.29 | | | | 10.03 | | | | 12.32 | | | | 12.32 | |
| | Low | | | 6.53 | | | | 7.21 | | | | 7.86 | | | | 8.50 | | | | 6.53 | |
FOR FISCAL 2002 | | | | | | | | | | | | | | | | | | | | |
| Net sales | | $ | 6,892 | | | $ | 7,557 | | | $ | 8,344 | | | $ | 10,743 | | | $ | 33,536 | |
| Gross profit | | | 2,219 | | | | 2,550 | | | | 2,529 | | | | 2,877 | | | | 10,175 | |
| Operating income | | | 345 | | | | 440 | | | | 388 | | | | 544 | | | | 1,717 | |
| Net income | | | 355 | | | | 462 | | | | 359 | | | | 482 | | | | 1,658 | |
| Earnings per share | | | | | | | | | | | | | | | | | | | | |
| | Basic | | | 0.14 | | | | 0.18 | | | | 0.14 | | | | 0.19 | | | | 0.66 | |
| | Diluted | | | 0.14 | | | | 0.18 | | | | 0.14 | | | | 0.18 | | | | 0.64 | |
| Stock price data | | | | | | | | | | | | | | | | | | | | |
| | High | | | 6.24 | | | | 8.00 | | | | 8.57 | | | | 8.20 | | | | 8.57 | |
| | Low | | | 4.86 | | | | 5.39 | | | | 6.46 | | | | 6.02 | | | | 4.86 | |
Span-America’s common stock trades on The Nasdaq Stock Market® under the symbol SPAN. As of December 4, 2003, there were 2,571,218 common shares outstanding. As of December 4, 2003, there were 277 shareholders of record and approximately 1,030 beneficial shareholders. The closing price of Span-America’s stock on December 4, 2003 was $11.85.
The Company has paid a regular quarterly cash dividend since January 1990. In April 2000, the Board of Directors increased the quarterly dividend to $0.03 per share from $0.025 per share. In October 2002, the Board of Directors increased the quarterly dividend to $0.035 per share from $0.03 per share. Future dividend payments will depend upon the Company’s earnings and liquidity position.

9
MANAGEMENT’S DISCUSSION AND FINANCIAL ANALYSIS
RESULTS OF OPERATIONS FISCAL 2003 VS. 2002
SUMMARY
Net sales in fiscal 2003 increased 24% to $41.6 million compared with $33.5 million in fiscal 2002. The increase was the result of sales growth in the Company’s custom products and medical business segments. Custom products sales rose 46% to $20.2 million. Medical segment sales increased 8% to $21.3 million.
Net income declined 16% in fiscal 2003 to $1.40 million, or $0.53 per diluted share, compared with $1.66 million or $0.64 per diluted share, in fiscal 2002. The Company’s decrease in earnings resulted from higher than forecasted raw material costs, expenses associated with the development and pre-production of the new Secure I.V.® safety catheter, increased professional fees, and two non-recurring income items included in fiscal 2002 results.
SALES
Sales in the Company’s medical segment rose 8% to $21.3 million in fiscal 2003 compared with $19.7 million the previous year. The medical sales growth was led by our proprietary lines of therapeutic replacement mattresses which increased by 24% over 2002 sales. Most of the mattress growth came from the Company’s PressureGuard® APM2® and the PressureGuard Easy Air® products. Sales of patient positioners increased by 8%, seating products declined 24% due to a large one-time order in fiscal 2002, and Selan® skin care products rose by 6%. Sales of overlays were down by 10%, continuing a long-term trend of customers switching to replacement mattresses from mattress overlays. We expect that total medical sales will increase during fiscal 2004 compared with 2003 levels.
Sales in the custom products segment jumped 46% during fiscal 2003 to $20.2 million from $13.8 million in fiscal 2002. Most of the custom products sales increase was due to higher unit volumes of Thera-FOAM™ mattress pads sold to Wal-Mart through Louisville Bedding Company. Louisville Bedding, which distributes the Company’s consumer products under a marketing and distribution agreement, is a leading manufacturer and distributor of bedding products in North America. Industrial sales, which are part of the custom products business, increased by 3% in fiscal 2003 to $2.9 million. Management believes that total custom products sales in fiscal 2004 will be higher than those of fiscal 2003, but the rate of increase will be lower than that achieved in fiscal 2003.
GROSS PROFIT
The Company’s gross profit increased by 9% to $11.1 million during fiscal 2003 from $10.2 million in fiscal 2002. The increase in gross profit level was primarily the result of higher sales volume during the year. The gross profit margin percentage declined to 26.8% for fiscal year 2003 compared with 30.3% for fiscal 2002. The decline in gross margin percentage resulted from raw material cost increases due to higher prices on foam (our largest volume raw material). The Company has received three price increases on foam raw material during the past 12 months and has only been partially successful at passing these higher costs along to customers. Higher sales of consumer products in 2003 compared with 2002 also reduced gross margins since consumer products generally carry lower gross margins than the Company’s medical products. The medical segment typically has a higher gross margin than the custom products segment because many of the Company’s medical products are patented and proprietary. Management expects the gross margin percentage during fiscal 2004 to be slightly higher than the gross margin percentage in fiscal 2003.
S G & A EXPENSES
Sales and marketing expenses increased 9% to $6.5 million, or 15.5% of sales, in fiscal 2003 compared with $5.9 million, or 17.6% of sales, in fiscal 2002. The increase occurred primarily in the medical segment and was due to higher commissions and mattress evaluation samples. The increase in sales and marketing expenses for 2003 also included $86,000 related to the Secure I.V. safety catheter acquired in July 2002 which is further discussed below. Management expects sales and marketing expenses to be higher in 2004 than those of 2003.
Research and development expenses increased 61% to $556,000 in fiscal 2003 compared with $346,000 in fiscal 2002. The increase was primarily due to $301,000 of design and development costs associated with the Secure I.V. product line. We anticipate that initial sales of Secure I.V. products will occur in fiscal 2004 and will only partially offset higher pre-production and marketing expenses related to the product line’s introduction during the period. The Company considers safety catheters to be a separate reportable segment based on product type and distribution channels. See Note 18 in the Notes to Financial Statements for additional information on the safety catheter segment. We
10
expect that total research and development expenses in fiscal 2004 will be moderately higher than 2003 levels.
General and administrative expenses increased 21% to $2.7 million in fiscal 2003 from $2.2 million in 2002. The Company incurred costs of approximately $286,000 in fiscal 2003 for professional fees and other expenses related to the renewal of the Company’s Shareholder Rights Plan, which was set to expire in 2003, and the proposed tender offer and subsequent lawsuit by Mr. Jerry Zucker as discussed below. Another factor affecting the increase was the receipt in the fourth quarter of fiscal 2002 of proceeds from the settlement of a patent infringement lawsuit, which reduced administrative expenses in fiscal 2002. Higher insurance costs in 2003 were partially offset by increased income on company-owned life insurance policies. Professional fees and other expenses associated with Secure I.V. added $110,000 to general and administrative expenses in fiscal 2003. General and administrative expenses for 2004 are expected to be higher than 2003 levels.
As noted above, Mr. Jerry Zucker filed suit against the Company on July 17, 2003 challenging certain aspects of the Company’s Shareholder Rights Plan (“the Plan”). In his suit, Mr. Zucker sought to have certain provisions of the Plan held unenforceable and an injunction precluding the Company from interpreting the Plan to restrict certain actions that he might take in the future. Both a committee of independent directors and the full board of directors have previously concluded that the Plan is in the best interests of the Company and its shareholders. The Plan is designed to help ensure that the Company’s shareholders receive fair treatment in the event of an unsolicited attempt to gain control of the Company and to discourage certain coercive takeover tactics. The Plan is not designed to deter a proxy contest or fair offer for the whole Company. In November 2003, Mr. Zucker and the Company reached a settlement agreement whereby Mr. Zucker agreed to dismiss his lawsuit without prejudice in exchange for the Company’s agreement to delete certain language in the definition of “Person” contained in the Shareholder rights agreement. The Company believes removal of the language clarifies the scope of the definition of “Person” but will not significantly change the protections afforded the Company and its shareholders by the shareholder rights agreement.
OTHER
Investment income decreased by 15% to $84,000 in fiscal 2003 compared with $100,000 in fiscal 2002. The decrease was the result of lower interest rates on the Company’s floating rate debt securities and lower average level of investments during fiscal 2003.
Royalty income decreased 1% to $598,000 in fiscal 2003 compared with $607,000 in fiscal 2002 as a result of lower sales volume of a shielded syringe product licensed to Becton Dickinson and Company (BD). The Company’s license agreement with BD will expire in December 2005, and no further royalty income will be received after the expiration date.
Other income for 2003 includes an $11,000 loss on the retirement of certain equipment. Other income for fiscal 2002 included a one-time pretax gain of $84,000 ($55,000 or 2 cents a share after taxes) as a result of common stock received through the demutualization of Prudential Insurance Company. Management expects total non-operating income for fiscal 2004 to be lower than 2003 levels.
During fiscal 2003, the Company paid dividends of $356,000, or 25% of net income, for the year. This amount represented four quarterly dividends of $0.035 per share.
The statements contained in “Results of Operations” and “Liquidity and Capital Resources” which are not historical facts are forward-looking statements that involve risks and uncertainties. Management wishes to caution the reader that these forward-looking statements, such as the Company’s expectations for future sales increases or expense changes compared with previous periods, are only predictions. Actual events or results may differ materially as a result of risks and uncertainties facing the Company, including (a) the loss of a major distributor of the Company’s medical or custom products, (b) the inability to achieve anticipated sales volumes of medical or custom products, (c) raw material cost increases, (d) changes in relationships with large customers, (e) the degree of success achieved in manufacturing and selling the Secure I.V. safety catheter product line, (f) the impact of competitive products and pricing, (g) government reimbursement changes in the medical market, (h) FDA regulation of medical device manufacturing, and other risks referenced in the Company’s Securities and Exchange Commission filings. The
11
Company disclaims any obligation to update any forward-looking statement whether as a result of new information, future events or otherwise.
RESULTS OF OPERATIONS FISCAL 2002 VS. 2001
SUMMARY
Net sales in fiscal 2002 rose 15% to $33.5 million compared with $29.1 million in fiscal 2001. The increase was the result of significant sales growth in the Company’s medical and custom products business segments. Medical sales grew by 13% to $19.7 million, and custom products sales increased by 18% to $13.8 million.
Net income rose 32% in fiscal 2002 to $1.66 million, or $0.64 per diluted share, compared with $1.26 million or $0.50 per diluted share, in fiscal 2001. The Company’s increased earnings were primarily due to higher sales volume, lower amortization expense as a result of the new accounting rules for goodwill, proceeds received from the settlement of a patent infringement lawsuit, and higher non-operating income.
SALES
Sales in the Company’s medical segment rose 13% to $19.7 million in fiscal 2002 compared with $17.4 million the previous year. The medical sales growth was led by our lines of therapeutic replacement mattresses, including Geo-Mattress, and PressureGuard, products, which increased by 39%, and seating products which grew by 30%. This growth more than offset declines in medical overlays and patient positioners, which were down in fiscal 2002 by 15% and 4%, respectively, compared with the prior year. The decline in medical overlay sales, which includes Geo-Matt® and convoluted foam products, is expected to continue as more customers seek to eliminate their use of single-patient overlays by purchasing therapeutic replacement mattresses instead.
Sales in the custom products segment increased 18% during fiscal 2002 to $13.8 million from $11.7 million in fiscal 2001. All of the custom products sales growth came from the consumer product line, which grew by 29% to $11.0 million. The sales increase came from higher volumes of the Company’s Geo-Systems™ line of mattress overlays sold through our partnership with Louisville Bedding Company. Industrial sales, which are part of the custom products business, declined in fiscal 2002 by 11% to $2.8 million because of the loss of two large customers in late fiscal 2001.
GROSS PROFIT
The Company’s gross profit increased by 14% to $10.2 million during fiscal 2002 from $8.9 million in fiscal 2001. The increase in gross profit level was primarily the result of higher sales volume during the year. The gross profit margin percentage decreased slightly to 30.3% for fiscal year 2002 compared with 30.6% for fiscal 2001. The decrease in gross margin percentage was due to a less profitable product mix within the consumer product line related to a seasonal promotion of consumer overlays.
S G&A EXPENSES
Sales and marketing expenses increased 17.3% to $5.9 million, or 17.6% of sales, in fiscal 2002 compared with $5.0 million, or 17.3% of sales, in fiscal 2001. The increase occurred primarily in the medical segment and was due to higher shipping costs, commissions, and mattress evaluation samples.
On July 15, 2002, the Company acquired assets related to the Secure I.V. product line from VADUS®, Inc., a privately owned designer and manufacturer of peripheral intravenous catheters. The assets consist primarily of patents and equipment related to the design, production and sale of the Secure I.V. catheter. The purchase price of the assets was $340,000 plus a royalty to be paid on future sales of the product. The Secure I.V. has FDA 510(k) approval and is protected by 11 patents. Expenses related to the new product line in fiscal 2002 were $59,000, consisting mostly of design and development costs.
Research and development expenses increased 25% to $346,000 in fiscal 2002 compared with to $278,000 in fiscal 2001. The increase was primarily due to expenses associated with the Secure I.V. product line as discussed above.
General and administrative expenses decreased 4% to $2.2 million in fiscal 2002. The decrease resulted mainly from two factors: lower amortization expense and funds received from settlement of a patent infringement lawsuit. The settlement agreement requires the terms of the settlement to remain confidential. Amortization expense decreased by $182,000 mostly as a result of the Company’s adoption at the beginning of fiscal 2002
12
of Statement of Financial Accounting Standards No. 142, “Goodwill and Other Intangible Assets.” See Note 5 in the Notes to Financial Statements for more information on goodwill amortization expense. These reduced expenses were largely offset by increases in property and casualty insurance expense and incentive compensation.
OTHER
Investment income decreased by 46% to $100,000 in fiscal 2002 compared with $185,000 in fiscal 2001. The decrease was the result of lower interest rates on the Company’s floating rate debt securities during fiscal 2002.
Royalty income increased 33% to $607,000 in fiscal 2002 compared with $456,000 in fiscal 2001 as a result of higher sales volume of a shielded syringe product licensed to Becton & Dickinson Company.
Other income for fiscal 2002 included a one-time pretax gain of $84,000 ($55,000 or 2 cents a share after taxes) as a result of common stock received through the demutualization of Prudential Insurance Company.
During fiscal 2002, the Company paid dividends of $303,400, or 18% of net income, for the year. This amount represented four quarterly dividends of $0.03 per share.
LIQUIDITY AND CAPITAL RESOURCES (FISCAL 2003 VS. 2002)
The Company generated cash from operations of approximately $1.1 million during fiscal 2003, representing a decline of $339,000 (23%) compared with cash flow of $1.5 million in fiscal 2002. The decline in cash flow resulted primarily from an increase in accounts receivable and inventory levels in fiscal 2003 and lower net income for the year. The effect of higher accounts receivable and inventory and lower net income was partially offset by an increase in accounts payable and accrued expenses related to higher sales volume during fiscal 2003.
Working capital decreased by $243,000, or 2%, to $10.8 million during fiscal 2003. The lower working capital was the result of sales of marketable securities to fund new equipment purchases and increases in accounts payable and accrued expenses. The Company’s current ratio decreased to 3.6 at September 27, 2003 from 4.4 at fiscal year end 2002.
Accounts receivable, net of allowances, increased 21% to $5.9 million at the end of fiscal 2003 compared with $4.9 million at the end of fiscal 2002. The majority of the increase resulted from higher sales of consumer products throughout fiscal 2003 compared with fiscal 2002. However, the days sales outstanding, calculated using a monthly average for accounts receivable over the entire year, improved to 45 days in 2003 compared with 47 days in 2002. All of the Company’s accounts receivable are unsecured.
Inventory, net of reserves, increased 30% to $2.5 million at September 27, 2003 compared with $2.0 million at September 28, 2002. Approximately 78% of the increase in inventory was due to higher levels of raw materials and finished goods in the consumer segment to support continuing scheduled shipments of consumer products. The balance of the increase in inventory occurred in the medical segment and is related to higher sales of medical mattresses. However, average inventory turnover improved by 17% in fiscal 2003 to 13.5 times from 11.5 times in fiscal 2002. Management expects inventory levels in fiscal 2004 to be slightly higher than those of fiscal 2003.
Net property and equipment increased by 33% during fiscal 2003. The change resulted primarily from the combination of normal depreciation expense and equipment purchases of $1.6 million. Purchases of tooling and equipment for the Secure I.V. product line totaled $1.0 million. Replacement of the HVAC system for the Greenville, South Carolina plant totaled approximately $300,000. Management expects capital expenditures to be higher in fiscal 2004 than in 2003.
From time to time, the Company purchases forward contracts for foreign currency to lock in exchange rates for future payments on manufacturing equipment ordered by the Company. The foreign exchange contracts are used to eliminate foreign currency fluctuations during the six to nine month period between when the order is placed and the time of final payment. Realized gains and losses, if any, are included in the cost of the related equipment. Unrealized gains and losses on open contracts are not material to the Company’s results of operations or financial conditions. There were no forward contracts held by the Company at September 27, 2003.
13
The Company’s trade accounts payable increased $765,000 or 45% in fiscal 2003 to $2.5 million. The increase in payables was the result of higher inventory purchases and other expenses in support of higher sales volumes in fiscal 2003 as discussed above. Accrued and sundry liabilities increased by 11% during the year to $1.7 million compared with $1.6 million last year. The increase was due to higher accrued payroll and payroll tax expense as well as accrued medical insurance claims.
Management believes that funds on hand and funds generated from operations are adequate to finance operations and expected capital requirements during fiscal 2004.
IMPACT OF INFLATION
Higher inflation rates could impact the Company through higher raw material and labor costs. The Company’s profit margin could be adversely affected to the extent that we are unable to pass cost increases along to our customers due to competitive conditions. Management considers it possible that foam raw material costs will increase during fiscal 2004. We will attempt to recover any such cost increases by sales prices increases and expense reductions. However, there can be no assurance that we will be able to offset potential raw material cost increases.
MARKET RISK
The Company is exposed to financial market risk in two areas: short-term investments and cash value of life insurance. As of September 27, 2003, the Company had short-term investments of $4.1 million which were classified as available for sale. These short-term investments consist primarily of high quality and highly liquid corporate commercial paper and bonds known as “variable rate demand notes” or “low floaters.” The bonds are issued by municipalities or companies and are backed by letters of credit from federally insured banks. The bonds carry the credit rating of the underlying bank and are therefore highly rated. The interest rate on the bonds is a floating rate which is reset weekly by the re-marketing agent based on market rates for comparable securities. The bonds can be liquidated by the Company at any time with seven days notice. Using the level of securities available for sale at fiscal year end 2003, a 1% change in interest rates for one year would change after-tax earnings by approximately $41,000.
In addition, the Company’s other assets at September 27, 2003 include $1.5 million in cash value of life insurance, which is subject to financial market risk related to equity pricing and interest rate changes. The cash value is generated from life insurance policies which are being used as the funding vehicle for a retirement program for the Company’s founder and former chairman. The cash value is invested in a combination of fixed income life insurance contracts and a portfolio of mutual funds managed by an insurance company. The fixed income contracts are similar to fixed income bond funds and are therefore subject to interest rate and company risk. The mutual fund portfolios invest in common stocks and bonds in accordance with their individual investment objectives. These portfolios are exposed to stock market and interest rate risk similar to comparable mutual funds. Management believes that substantial fluctuations in equity markets and interest rates and the resulting changes in cash value of life insurance would not have a material adverse effect on the financial position of the Company. During the fiscal year ended September 27, 2003, the Company’s cash value of life insurance increased by 10%, creating income of approximately $127,000.
CRITICAL ACCOUNTING POLICIES
This discussion and analysis of financial condition and results of operations is based on our financial statements which we prepare in conformity with accounting principles generally accepted in the United States of America. The preparation of our financial statements requires us to make estimates and assumptions that affect the reported amounts of assets, liabilities, revenues and expenses. These estimates and assumptions are based on historical experience and on various other factors that we believe are reasonable under the circumstances, the results of which form the basis for making judgments about the carrying values of assets and liabilities that are not readily apparent from other sources. These estimates and assumptions also require the application of certain accounting policies, many of which require us to make estimates and assumptions about future events and their impact on amounts reported in our financial statements and related notes. We periodically review our accounting policies and estimates and make adjustments when facts and circumstances dictate.
14
Actual results may differ from these estimates under different assumptions or conditions. Any differences may have a material impact on our financial condition and results of operations.
In addition to the accounting policies which are more fully described in the Notes to Financial Statements included in this report, we have identified the following critical accounting policies used in the preparation of our financial statements.
Allowance for Doubtful Accounts
Credit evaluations are undertaken to set credit limits for all customers. On a quarterly basis, we evaluate aged items in the accounts receivable aging analysis and provide adequate reserves for doubtful accounts. Customer business conditions may change and increase the risk of collectibility and may require additional provisions which would negatively impact our operating results. As of September 27, 2003, our provision for doubtful accounts represented approximately 3% of total accounts receivable.
Inventories
We regularly review inventory quantities on hand and adjust for excess and obsolete inventory based primarily on historical usage rates and our estimated forecast of product demand and production. Actual demand may differ from our estimate, in which case we may have understated or overstated the provision required for obsolete and excess inventory, which would have an impact on our operating results. As of September 27, 2003, our provision for excess and obsolete inventory represented approximately 5% of total inventories.
Warranty Obligations
We warrant certain of our products for a specific period of time against material defects. We provide for the estimated future cost of warranty obligations in cost of goods sold when the related revenue is recognized. The accrued warranty cost represents our best estimate at the time of sale of the total cost that we will incur to repair or replace product parts which fail while under warranty. The amount of accrued estimated warranty cost is primarily based on historical experience about product failure as well as current information on repair costs. Actual warranty cost could differ from the estimated amounts. On a quarterly basis, we review the accrued balances and update the historical warranty cost trends. If we were required to accrue additional warranty cost in the future, it would negatively affect operating results.
Impairment of Goodwill
The Company accounts for goodwill under SFAS No. 142. As required by this statement, we have made an annual assessment as to the carrying value of goodwill. We determined that the fair value of the reporting units, which are the industry segments as described in Note 18 “Operations and Industry Segments” of the Notes to Financial Statements, exceeded the carrying value and thus no impairment charge was required. We will continue to make assessments of impairment on an annual basis in the fourth quarter of our fiscal years or more frequently if certain indicators arise. In assessing the value of goodwill, we must make assumptions regarding estimated future cash flows and other factors to determine the fair value of the reporting units. If these estimates or their related assumptions change in the future, we may be required to record impairment charges which would negatively impact operating results. As of September 27, 2003, the carrying value of goodwill was $1.9 million.
Present Value of Deferred Compensation
The Company is obligated to make fixed payments under a retirement agreement over the remaining life of its founder as discussed in Note 10 “Deferred Compensation” in the Notes to Financial Statements. The Company has fully accrued the present value of the expected payments due over the executive’s estimated life expectancy. In calculating this present value the Company estimated an effective long term investment return of 8%. If actual long term interest rates declined significantly and we were required to accrue additional deferred compensation costs in the future, it would negatively affect operating results. As of September 27, 2003, the Company has recorded a deferred compensation liability of $1.0 million, including current and deferred portions.
15
BALANCE SHEETS
| | | | | | | | | | |
| | | | September 27, | | September 28, |
| | | | 2003 | | 2002 |
| | | |
| |
|
ASSETS | | | | | | | | |
| Current assets: | | | | | | | | |
| | Cash and cash equivalents | | $ | 1,811,332 | | | $ | 1,095,299 | |
| | Securities available for sale (Note 2) | | | 4,143,758 | | | | 5,853,717 | |
| | Accounts receivable, net of allowances of $340,000 (2003) and $381,000 (2002) | | | 5,941,774 | | | | 4,926,879 | |
| | Inventories (Note 3) | | | 2,539,325 | | | | 1,958,388 | |
| | Prepaid expenses and deferred income taxes | | | 592,997 | | | | 496,238 | |
| | | | |
| | | |
| |
| Total current assets | | | 15,029,186 | | | | 14,330,521 | |
| Property and equipment, net (Note 4) | | | 4,817,450 | | | | 3,631,867 | |
| Goodwill, net of accumulated amortization of $1,027,765 (2003 and 2002) (Note 5) | | | 1,924,131 | | | | 1,924,131 | |
| Other assets (Note 6) | | | 2,219,890 | | | | 2,019,334 | |
| | | | |
| | | |
| |
| | | $ | 23,990,657 | | | $ | 21,905,853 | |
| | | | |
| | | |
| |
LIABILITIES AND SHAREHOLDERS’ EQUITY | | | | | | | | |
| Current liabilities: | | | | | | | | |
| | Accounts payable | | $ | 2,467,524 | | | $ | 1,702,989 | |
| | Accrued and sundry liabilities (Note 8) | | | 1,747,385 | | | | 1,569,899 | |
| | | | |
| | | |
| |
| Total current liabilities | | | 4,214,909 | | | | 3,272,888 | |
| Deferred income taxes (Note 13) | | | 321,000 | | | | 282,000 | |
| Deferred compensation (Note 11) | | | 929,407 | | | | 957,299 | |
| Commitments and contingencies (Notes 11, 19, and 20) | | | | | | | | |
| Shareholders’ equity (Notes 12 and 14) | | | | | | | | |
| | Common stock, no par value, 20,000,000 shares authorized; issued and outstanding shares 2,552,154 (2003) and 2,538,870 (2002) | | | 283,981 | | | | 196,340 | |
| | Additional paid-in capital | | | 10,035 | | | | 8,527 | |
| | Retained earnings | | | 18,231,325 | | | | 17,188,799 | |
| | | | |
| | | |
| |
| Total shareholders’ equity | | | 18,525,341 | | | | 17,393,666 | |
| | | | |
| | | |
| |
| | | $ | 23,990,657 | | | $ | 21,905,853 | |
| | | | |
| | | |
| |
See accompanying notes.
16
STATEMENTS OF INCOME
| | | | | | | | | | | | | | |
| | | | September 27, | | September 28, | | September 29, |
| Years Ended | | 2003 | | 2002 | | 2001 |
| |
| |
| |
|
| Net sales | | $ | 41,574,603 | | | $ | 33,535,640 | | | $ | 29,074,958 | |
| Cost of goods sold | | | 30,440,681 | | | | 23,360,403 | | | | 20,165,299 | |
| | | |
| | | |
| | | |
| |
| Gross profit | | | 11,133,922 | | | | 10,175,237 | | | | 8,909,659 | |
| Selling and marketing expenses | | | 6,455,468 | | | | 5,895,730 | | | | 5,028,077 | |
| Research and development expenses | | | 556,421 | | | | 346,140 | | | | 277,755 | |
| General and administrative expenses | | | 2,682,221 | | | | 2,216,275 | | | | 2,307,326 | |
| | | |
| | | |
| | | |
| |
| | | | 9,694,110 | | | | 8,458,145 | | | | 7,613,158 | |
| Operating income | | | 1,439,812 | | | | 1,717,092 | | | | 1,296,501 | |
| Non-operating income (expense): | | | | | | | | | | | | |
| | Investment income | | | 84,046 | | | | 99,489 | | | | 184,909 | |
| | Royalty income | | | 597,687 | | | | 606,846 | | | | 456,429 | |
| | Other | | | (7,751 | ) | | | 89,305 | | | | 2,347 | |
| | | |
| | | |
| | | |
| |
| | | | 673,982 | | | | 795,640 | | | | 643,685 | |
| Income before income taxes | | | 2,113,794 | | | | 2,512,732 | | | | 1,940,186 | |
| Provision for income taxes (Note 13) | | | 715,000 | | | | 855,000 | | | | 680,000 | |
| | | |
| | | |
| | | |
| |
| Net income | | $ | 1,398,794 | | | $ | 1,657,732 | | | $ | 1,260,186 | |
| | | |
| | | |
| | | |
| |
| Earnings per share of common stock (Note 14) | | | | | | | | | | | | |
| Net income: | | | | | | | | | | | | |
| | Basic | | $ | 0.55 | | | $ | 0.66 | | | $ | 0.50 | |
| | Diluted | | $ | 0.53 | | | $ | 0.64 | | | $ | 0.50 | |
| Dividends per share of common stock | | $ | 0.14 | | | $ | 0.12 | | | $ | 0.12 | |
| Weighted average shares outstanding: | | | | | | | | | | | | |
| | Basic | | | 2,544,882 | | | | 2,527,416 | | | | 2,510,427 | |
| | Diluted | | | 2,659,699 | | | | 2,600,604 | | | | 2,532,539 | |
See accompanying notes.
17
STATEMENTS OF SHAREHOLDERS’ EQUITY
| | | | | | | | | | | | | | | | | | | | | | |
| | | | Common Stock | | Additional | | | | |
| | | |
| | Paid-in | | Retained | | |
| | | | Shares | | Amount | | Capital | | Earnings | | Total |
| | | |
| |
| |
| |
| |
|
| Balance at September 30, 2000 | | | 2,503,400 | | | $ | 28,000 | | | $ | — | | | $ | 14,875,581 | | | $ | 14,903,581 | |
| | | |
| | | |
| | | |
| | | |
| | | |
| |
| | Net income for the 2001 fiscal year | | | | | | | | | | | | | | | 1,260,186 | | | | 1,260,186 | |
| | Common stock issued to Directors | | | 8,000 | | | | 40,000 | | | | | | | | | | | | 40,000 | |
| | Common stock issued on exercise of stock options | | | 6,000 | | | | 23,725 | | | | | | | | | | | | 23,725 | |
| | Tax benefits for stock options exercised | | | | | | | | | | | 1,708 | | | | | | | | 1,708 | |
| | Cash dividends paid ($.12 per share) | | | | | | | | | | | | | | | (301,307 | ) | | | (301,307 | ) |
| | | |
| | | |
| | | |
| | | |
| | | |
| |
| Balance at September 29, 2001 | | | 2,517,400 | | | | 91,725 | | | | 1,708 | | | | 15,834,460 | | | | 15,927,893 | |
| | | |
| | | |
| | | |
| | | |
| | | |
| |
| | Net income for the 2002 fiscal year | | | | | | | | | | | | | | | 1,657,732 | | | | 1,657,732 | |
| | Common stock issued to Directors | | | 8,000 | | | | 47,600 | | | | | | | | | | | | 47,600 | |
| | Common stock issued on exercise of stock options | | | 13,470 | | | | 57,015 | | | | | | | | | | | | 57,015 | |
| | Tax benefits for stock options exercised | | | | | | | | | | | 6,819 | | | | | | | | 6,819 | |
| | Cash dividends paid ($.12 per share) | | | | | | | | | | | | | | | (303,393 | ) | | | (303,393 | ) |
| | | |
| | | |
| | | |
| | | |
| | | |
| |
| Balance at September 28, 2002 | | | 2,538,870 | | | | 196,340 | | | | 8,527 | | | | 17,188,799 | | | | 17,393,666 | |
| | | |
| | | |
| | | |
| | | |
| | | |
| |
| | Net income for the 2003 fiscal year | | | | | | | | | | | | | | | 1,398,794 | | | | 1,398,794 | |
| | Common stock issued to Directors | | | 8,000 | | | | 64,000 | | | | | | | | | | | | 64,000 | |
| | Common stock issued on exercise of stock options | | | 5,284 | | | | 23,641 | | | | | | | | | | | | 23,641 | |
| | Tax benefits for stock options exercised | | | | | | | | | | | 1,508 | | | | | | | | 1,508 | |
| | Cash dividends paid ($.14 per share) | | | | | | | | | | | | | | | (356,268 | ) | | | (356,268 | ) |
| | | |
| | | |
| | | |
| | | |
| | | |
| |
Balance at September 27, 2003 | | | 2,552,154 | | | $ | 283,981 | | | $ | 10,035 | | | $ | 18,231,325 | | | $ | 18,525,341 | |
| | | |
| | | |
| | | |
| | | |
| | | |
| |
See accompanying notes.
18
STATEMENTS OF CASH FLOWS
| | | | | | | | | | | | | | | |
| | | | | September 27, | | September 28, | | September 29, |
| Years Ended | | 2003 | | 2002 | | 2001 |
| |
| |
| |
|
OPERATING ACTIVITIES: | | | | | | | | | | | | |
| Net income | | $ | 1,398,794 | | | $ | 1,657,732 | | | $ | 1,260,186 | |
| Adjustments to reconcile net income to net cash provided by operating activities: | | | | | | | | | | | | |
| | Depreciation | | | 449,844 | | | | 411,898 | | | | 382,010 | |
| | Amortization | | | 77,203 | | | | 75,568 | | | | 257,546 | |
| | Income from insurance demutualization | | | | | | | (83,636 | ) | | | | |
| | Provision for losses on accounts receivable | | | 86,884 | | | | 62,293 | | | | 44,202 | |
| | Provision for deferred income taxes | | | 107,508 | | | | 62,819 | | | | 76,708 | |
| | Loss on sale and disposal of property and equipment | | | 10,864 | | | | | | | | | |
| | (Increase) decrease in cash value of life insurance | | | (126,809 | ) | | | 48,648 | | | | 73,432 | |
| | Deferred compensation | | | (27,892 | ) | | | (25,826 | ) | | | (23,913 | ) |
| | Changes in operating assets and liabilities: | | | | | | | | | | | | |
| | | Accounts receivable | | | (1,076,820 | ) | | | (994,304 | ) | | | 270,204 | |
| | | Inventories | | | (580,937 | ) | | | 144,774 | | | | (36,680 | ) |
| | | Prepaid expenses and other assets | | | (123,123 | ) | | | (48,285 | ) | | | 42,194 | |
| | | Accounts payable and accrued and sundry liabilities | | | 951,487 | | | | 174,515 | | | | 16,144 | |
| | | |
| | | |
| | | |
| |
| Net cash provided by operating activities | | | 1,147,003 | | | | 1,486,196 | | | | 2,362,033 | |
INVESTING ACTIVITIES: | | | | | | | | | | | | |
| Purchase of Secure I.V. assets | | | | | | | (339,524 | ) | | | | |
| Purchases of securities | | | | | | | (2,400,000 | ) | | | (1,510,000 | ) |
| Proceeds from sales of securities | | | 1,705,000 | | | | 2,100,000 | | | | 425,000 | |
| Purchases of property and equipment | | | (1,647,291 | ) | | | (558,516 | ) | | | (461,059 | ) |
| Proceeds from sale of property and equipment | | | 1,000 | | | | | | | | | |
| Payments for other assets | | | (147,586 | ) | | | (20,870 | ) | | | (51,664 | ) |
| | | |
| | | |
| | | |
| |
| Net cash used for investing activities | | | (88,877 | ) | | | (1,218,910 | ) | | | (1,597,723 | ) |
FINANCING ACTIVITIES: | | | | | | | | | | | | |
| Dividends paid | | | (356,268 | ) | | | (303,393 | ) | | | (301,307 | ) |
| Common stock issued upon exercise of options | | | 14,175 | | | | 57,015 | | | | 23,725 | |
| | | |
| | | |
| | | |
| |
| Net cash used for financing activities | | | (342,093 | ) | | | (246,378 | ) | | | (277,582 | ) |
| | | |
| | | |
| | | |
| |
| Increase in cash and cash equivalents | | | 716,033 | | | | 20,908 | | | | 486,728 | |
| Cash and cash equivalents at beginning of year | | | 1,095,299 | | | | 1,074,391 | | | | 587,663 | |
| | | |
| | | |
| | | |
| |
| Cash and cash equivalents at end of year | | $ | 1,811,332 | | | $ | 1,095,299 | | | $ | 1,074,391 | |
| | | |
| | | |
| | | |
| |
See accompanying notes.
19
NOTES TO FINANCIAL STATEMENTS
1. SIGNIFICANT ACCOUNTING POLICIES
DESCRIPTION OF BUSINESS
The Company manufactures and distributes replacement mattresses, mattress overlays, patient positioners, seating cushions, and skin care products for the medical market and pillows, mattress pads and various foam products for the custom products market throughout the United States and Canada. In addition the Company is preparing to manufacture and sell a line of safety catheters under the Secure I.V. brand name. The Secure I.V. product line is currently in the development phase.
CASH AND CASH EQUIVALENTS
The Company considers all cash equivalents to be highly liquid investments with a maturity when purchased of three months or less. Depending on market conditions, the Company may maintain a centralized cash management program whereby its excess cash balances are invested in commercial paper and are considered cash equivalents. Cash balances in the Company’s accounts usually exceed federally insured limits.
ACCOUNTS RECEIVABLE
The Company provides credit in the normal course of business and performs ongoing credit evaluations on certain of its customers, but generally does not require collateral to support such receivables. Accounts receivable are carried at original invoice amount less an estimate made for doubtful accounts based on a quarterly review of all outstanding amounts. Management establishes the allowance for doubtful accounts based upon factors surrounding the credit risk of specific customers, historical trends and other information. Trade receivables are written off when deemed uncollectible. Recoveries of trade receivables previously written off are recorded when received.
INVENTORIES
Inventories are valued at the lower of cost (first-in, first-out method) or market.
PROPERTY AND EQUIPMENT
Property and equipment is stated at cost. Maintenance, repairs, and minor replacements that do not improve or extend the useful lives of assets are expensed when incurred. Depreciation is computed using the straight-line method. Estimated useful lives for buildings and land improvements range from 15 to 35 years. The estimated useful lives of all other property and equipment range from 3 years to 15 years. For income tax purposes, principally all depreciation is computed using accelerated methods.
Construction in progress is stated at cost, which includes the cost of construction and other direct costs attributable to the construction. No provision for depreciation is made on construction in progress until such time as the relevant assets are completed and put into use. Construction in progress at September 27, 2003 represents machinery under assembly and installation. (See Note 4.)
INTANGIBLES
Intangible assets are amortized using the straight-line method. Costs of patents are amortized over periods ranging from 10 to 17 years, and trademarks are amortized over periods of 5 or 10 years. Goodwill, costs in excess of the fair value of net assets, acquired from two separate acquisitions, is accounted for under Statement of Financial Accounting Standards (SFAS) No. 142, “Goodwill and Other Intangible Assets.” (See Note 5.) Accumulated amortization of intangible assets at September 27, 2003 and September 28, 2002 was approximately $2,192,000 and $2,115,000, respectively. The Company reviews annually the recoverability of the carrying value of these assets in accordance with SFAS No. 142 and SFAS No. 144, “Accounting for the Impairment of Long-Lived Assets and for Long-Lived Assets to be Disposed Of.” The Company also reviews long-lived assets and the related intangible assets for impairment whenever events or changes in circumstances indicate the carrying amount of such assets may not be recoverable.
20
REVENUE RECOGNITION
Revenue is recognized by the Company when goods are shipped and title passes to the customer. There are no customer acceptance provisions, and the right to return exists only in cases of damaged product or non-compliance with customer specifications.
The Company has applied the accounting and disclosure requirements of Securities and Exchange Commission Staff Accounting Bulletin (SAB) No. 101.
ADVERTISING COSTS
Advertising costs are expensed as incurred.
FAIR VALUE OF FINANCIAL INSTRUMENTS
The carrying amounts reported in the balance sheet for cash and cash equivalents, securities available for sale, accounts receivable, cash value of life insurance, accounts payable, and debt approximate their fair values. The fair values of the Company’s securities available for sale are based on quoted market prices when available, or quoted market prices of financial instruments with similar characteristics.
EARNINGS PER SHARE OF COMMON SHARE
Earnings per share of common stock are computed based on the weighted average number of shares outstanding during each period in accordance with SFAS No. 128, “Earnings Per Share.” (See Note 14.)
STOCK-BASED COMPENSATION
The Company accounts for stock options under Accounting Principles Board Opinion 25, “Accounting for Stock Issued to Employees.” Accordingly, no compensation expense has been charged to operations. Had compensation expense for the plans been determined based on the fair value at the grant dates for awards under the plans consistent with the accounting method available under SFAS No. 123 “Accounting for Stock Based Compensation,” the Company’s net income and net income per common share would have been reduced to the proforma amounts indicated below:
| | | | | | | | | | | | | | |
| | | | 2003 | | 2002 | | 2001 |
| | | |
| |
| |
|
| Net income | | | | | | | | | | | | |
| | As reported | | $ | 1,398,794 | | | $ | 1,657,732 | | | $ | 1,260,186 | |
| | Stock option expense, net of taxes | | | 144,391 | | | | 87,840 | | | | 55,602 | |
| | | | |
| | | |
| | | |
| |
| | Pro forma | | $ | 1,254,403 | | | $ | 1,569,892 | | | $ | 1,204,584 | |
| | | | |
| | | |
| | | |
| |
| Basic net income per common share | | | | | | | | | | | | |
| | As reported | | $ | 0.55 | | | $ | 0.66 | | | $ | 0.50 | |
| | Stock option expense, net of taxes | | | 0.06 | | | | 0.04 | | | | 0.02 | |
| | | | |
| | | |
| | | |
| |
| | Pro forma | | $ | 0.49 | | | $ | 0.62 | | | $ | 0.48 | |
| | | | |
| | | |
| | | |
| |
| Diluted net income per common share | | | | | | | | | | | | |
| | As reported | | $ | 0.53 | | | $ | 0.64 | | | $ | 0.50 | |
| | Stock option expense, net of taxes | | | 0.06 | | | | 0.04 | | | | 0.02 | |
| | | | |
| | | |
| | | |
| |
| | Pro forma | | $ | 0.47 | | | $ | 0.60 | | | $ | 0.48 | |
| | | | |
| | | |
| | | |
| |
21
1. SIGNIFICANT ACCOUNTING POLICIES (continued)
The fair value of each option grant is estimated on the date of grant using the Black-Scholes option pricing model with the following weighted average assumptions for grants made in 2003, 2002, and 2001, respectively: risk-free interest rates of 3.26%, 3.45%, and 4.0%; dividend yields of 1.6%, 1.7%, and 2.0%; volatility factors of the expected market price of the Company’s common stock of 38.4%, 40.7%, and 42.4%; and a weighted average expected life of the option of eight years for all three years.
FISCAL YEAR
The Company’s fiscal year ends on the Saturday nearest to September 30. The 2003, 2002, and 2001, fiscal years were all 52-week years.
INCOME TAXES
In accordance with SFAS No. 109, “Accounting for Income Taxes,” the liability method is used in accounting for income taxes. Under this method, deferred tax assets and liabilities are determined based on differences between financial reporting and tax bases of assets and liabilities and are measured using the enacted tax rates and laws that are estimated to be in effect when the differences are expected to reverse.
USE OF ESTIMATES
The preparation of financial statements in conformity with accounting principles generally accepted in the United States of America requires management to make estimates and assumptions that affect the amounts reported in the financial statements and accompanying notes. Although these estimates are based on management’s knowledge of current events and actions planned for the future, the estimates may ultimately differ from actual results.
RECENT PRONOUNCEMENTS
The Financial Accounting Standards Board (FASB) has issued SFAS No. 144, “Accounting for the Impairment or Disposal of Long-Lived Assets”, which addresses financial accounting and reporting for the impairment or disposal of long-lived assets. The provisions of the statement are effective for financial statements issued for fiscal years beginning after December 15, 2001. The Company adopted the provisions of this statement as of September 29, 2002. Adoption of SFAS No. 144 did not have a material impact on the Company’s financial position or results of operations.
Additional standards that have been issued or proposed by the FASB do not require adoption until a future date and are not expected to have a material impact on the Company’s financial statements upon adoption.
2. SECURITIES AVAILABLE FOR SALE
Securities available for sale are carried at aggregate cost which approximates market. The Company had no unrealized holding gains or losses during fiscal years 2003, 2002, or 2001.
Securities available for sale at September 27, 2003 and September 28, 2002, consist principally of variable rate demand notes.
3. INVENTORIES
The components of inventories are as follows:
| | | | | | | | | |
| | | 2003 | | 2002 |
| | |
| |
|
| Raw materials | | $ | 1,763,001 | | | $ | 1,287,831 | |
| Finished goods | | | 776,324 | | | | 670,557 | |
| | | |
| | | |
| |
| | | $ | 2,539,325 | | | $ | 1,958,388 | |
| | | |
| | | |
| |
4. PROPERTY AND EQUIPMENT
Property and equipment, at cost, is summarized by major classification as follows:
| | | | | | | | | |
| | | 2003 | | 2002 |
| | |
| |
|
| Land | | $ | 317,343 | | | $ | 317,343 | |
| Land improvements | | | 246,172 | | | | 246,172 | |
| Buildings | | | 4,036,473 | | | | 3,727,761 | |
| Construction in progress | | | 1,030,932 | | | | | |
| Machinery and equipment | | | 6,311,639 | | | | 6,125,240 | |
| Furniture and fixtures | | | 538,045 | | | | 539,386 | |
| Automobiles | | | 9,520 | | | | 9,520 | |
| Leasehold improvements | | | 11,345 | | | | 11,345 | |
| | | |
| | | |
| |
| | | | 12,501,469 | | | | 10,976,767 | |
| Less accumulated depreciation | | | 7,684,019 | | | | 7,344,900 | |
| | | |
| | | |
| |
| | | $ | 4,817,450 | | | $ | 3,631,867 | |
| | | |
| | | |
| |
22
5. GOODWILL AND OTHER INTANGIBLES
On September 30, 2001, the Company adopted SFAS No. 142. As of September 27, 2003, the Company had goodwill (net of accumulated amortization) of $1,924,131 and patents and trademarks (net of accumulated amortization) of $639,445. These assets are part of the medical and safety catheter segments. The Company has re-assessed the useful lives of goodwill, patents, and trademarks. Goodwill was determined to have an indefinite useful life. Amortization of goodwill ceased on September 29, 2001. The useful lives of individual patents and trademarks were reviewed and no material changes were required. No impairment losses were recorded on the Company’s intangible assets as a result of the adoption of SFAS No. 142 based on the goodwill impairment test.
The following table reconciles the Company’s reported net income and earnings per share with pro forma balances from previous periods adjusted to exclude goodwill amortization expense, which is no longer recorded under SFAS No. 142.
| | | | | | | | | | | | | | |
| | | | 2003 | | 2002 | | 2001 |
| | | |
| |
| |
|
| Reported net income | | $ | 1,398,794 | | | $ | 1,657,732 | | | $ | 1,260,186 | |
| Add back: Goodwill amortization after-tax | | | — | | | | — | | | | 123,744 | |
| | | |
| | | |
| | | |
| |
| Adjusted net income | | $ | 1,398,794 | | | $ | 1,657,732 | | | $ | 1,383,930 | |
| | | |
| | | |
| | | |
| |
| Basic earnings per share: | | | | | | | | | | | | |
| | Reported net income | | $ | 0.55 | | | $ | 0.66 | | | $ | 0.50 | |
| | Goodwill amortization after-tax | | | — | | | | — | | | | 0.05 | |
| | | |
| | | |
| | | |
| |
| | Adjusted net income | | $ | 0.55 | | | $ | 0.66 | | | $ | 0.55 | |
| | | |
| | | |
| | | |
| |
| Diluted earnings per share: | | | | | | | | | | | | |
| | Reported net income | | $ | 0.53 | | | $ | 0.64 | | | $ | 0.50 | |
| | Goodwill amortization after-tax | | | — | | | | — | | | | 0.05 | |
| | | |
| | | |
| | | |
| |
| | Adjusted net income | | $ | 0.53 | | | $ | 0.64 | | | $ | 0.55 | |
| | | |
| | | |
| | | |
| |
Amortization expense for patents and trademarks during fiscal years 2003, 2002, and 2001 was $77,203, $75,568, and $110,123, respectively. Estimated amortization expense for the next five fiscal years is as follows:
| | | | | | | | | | | | | | | | | | | | | |
| Fiscal Years | | 2004 | | 2005 | | 2006 | | 2007 | | 2008 |
| |
| |
| |
| |
| |
|
| Estimated amortization expense | | $ | 87,630 | | | $ | 81,151 | | | $ | 70,950 | | | $ | 61,414 | | | $ | 59,704 | |
| | | |
| | | |
| | | |
| | | |
| | | |
| |
23
6. OTHER ASSETS
Other assets consist of the following:
| | | | | | | | | |
| | | 2003 | | 2002 |
| | |
| |
|
| Patents and trademarks, net of accumulated amortization of $1,164,332 (2003) and $1,087,128 (2002) | | $ | 639,445 | | | $ | 579,053 | |
| Cash value of life insurance policies | | | 1,457,005 | | | | 1,320,206 | |
| Other | | | 123,440 | | | | 120,075 | |
| | | |
| | | |
| |
| | | $ | 2,219,890 | | | $ | 2,019,334 | |
| | | |
| | | |
| |
7. ACQUISITION OF SECURE I.V.® ASSETS
On July 15, 2002, the Company purchased the assets related to the Secure I.V.® product line of VADUS®, Inc., a privately owned designer and manufacturer of peripheral intravenous catheters. The Secure I.V. product line assets consist primarily of patents and equipment related to the design, production, and sale of the Secure I.V. catheter. The purchase price was approximately $340,000 plus a royalty to be paid on future sales of the product. The purchase price was allocated $60,000 to equipment and $280,000 to patents and will be depreciated or amortized over the remaining useful lives of the assets which are five years for equipment and 10 years for patents.
8. ACCRUED AND SUNDRY LIABILITIES
| | | | | | | | | |
| | | 2003 | | 2002 |
| | |
| |
|
| Salaries and other compensation | | $ | 1,073,562 | | | $ | 1,025,049 | |
| Payroll taxes accrued and withheld | | | 175,789 | | | | 109,891 | |
| Property taxes | | | 117,900 | | | | 112,500 | |
| Medical insurance | | | 136,200 | | | | 96,728 | |
| Warranty reserve | | | 141,723 | | | | 138,107 | |
| Customer deposits | | | 35,551 | | | | 66,073 | |
| Other | | | 66,660 | | | | 21,551 | |
| | | |
| | | |
| |
| | | $ | 1,747,385 | | | $ | 1,569,899 | |
| | | |
| | | |
| |
9. PRODUCT WARRANTIES
The Company offers warranties of various lengths to its customers depending on the specific product sold. The Company’s warranties require it to repair or replace defective products during the warranty period at no cost to the customer. At the time revenue is recognized for covered products, the Company records a liability for estimated costs that may be incurred under its warranties. The costs are estimated based on historical experience and any specific warranty problems that have been identified. (Although historical warranty costs have been within expectations, there can be no assurance that future warranty costs will not exceed historical amounts.) The Company periodically assesses the adequacy of its recorded liability and adjusts the balance as necessary.
Changes in the Company’s product warranty liability for fiscal years 2003 and 2002 are as follows:
| | | | | | | | | |
| | | 2003 | | 2002 |
| | |
| |
|
| Accrued liability at beginning of year | | $ | 138,107 | | | $ | 150,500 | |
| Increases in reserve | | | 134,416 | | | | 112,207 | |
| Expenses | | | (130,800 | ) | | | (124,600 | ) |
| | | |
| | | |
| |
| Accrued liability at end of year | | $ | 141,723 | | | $ | 138,107 | |
| | | |
| | | |
| |
10. BORROWINGS
The Company paid no interest expense during fiscal years 2003, 2002, or 2001.
11. DEFERRED COMPENSATION
The Company is obligated to make fixed payments of approximately $114,000 per year under a retirement agreement to its founder and former chief executive officer over his remaining life. The Company has fully accrued the present value of the expected payments due over the executive’s estimated life expectancy. The Company recognized expenses of approximately $86,000 in 2003, $88,000 in 2002, and $90,000 in 2001 related to this agreement. An 8% discount rate was used in measuring the present value of the Company’s deferred compensation obligation.
24
12. SHAREHOLDERS’ EQUITY
In March 1997, the Board of Directors (the “Board”) adopted the 1997 Stock Option Plan (“1997 Plan”). The 1997 Plan authorized the Board to grant options to key officers and employees of the Company for up to 200,000 shares of the Company’s common stock. Options granted under the 1997 Plan are generally granted at the fair market value on the date of grant. These options become exercisable and vested at the greater of 1,000 shares per year or 20% of the grant. Vested options expire 10 years from the date of grant for continuing employees, or three months after termination for employees who leave the Company.
In November 1991, the Board adopted the 1991 Stock Option Plan (“1991 Plan”). The 1991 Plan authorized the Board to grant options of up to 200,000 shares of the Company’s common stock to officers and key employees and 50,000 shares to directors who are neither officers nor employees of the Company. All other terms and conditions of the 1991 Plan are similar to the 1997 Plan. The 1991 Plan was terminated on November 7, 2001. The termination does not affect options outstanding under the plan, but no further options can be granted under the 1991 Plan.
In March 1987, the Board adopted the 1987 Stock Option Plan (“1987 Plan”). The 1987 Plan authorized the Board to grant options of up to 200,000 shares of the Company’s common stock to officers and key employees of the Company. All other terms and conditions of the 1987 Plan are similar to the 1997 Plan. The 1987 Plan was terminated on March 31, 1997. The termination does not affect options outstanding under the plan, but no further options can be granted under the 1987 Plan.
A summary of activity under the Company’s three stock option plans is as follows.
| | | | | | | | | | | | | | | | | | | | | |
| | | | | | | Outstanding | | Exercisable |
| | | | | | |
| |
|
| | | | | | | | | | | Weighted | | | | | | Weighted |
| | | | | | | | | | | Average | | | | | | Average |
| | | Shares | | Number of | | Ex. Price | | Number of | | Ex. Price |
| | | Available | | Shares | | Per Share | | Shares | | Per Share |
| | |
| |
| |
| |
| |
|
| Balance at 9/30/00 | | | 239,800 | | | | 230,000 | | | $ | 4.85 | | | | 139,800 | | | $ | 5.14 | |
| | | |
| | | |
| | | |
| | | |
| | | |
| |
Fiscal Year 2001 | | | | | | | | | | | | | | | | | | | | |
| Granted | | | (63,250 | ) | | | 63,250 | | | | 5.29 | | | | | | | | | |
| Exercised | | | | | | | (6,000 | ) | | | 3.95 | | | | | | | | | |
| Forfeited | | | 22,500 | | | | (22,500 | ) | | | 5.73 | | | | | | | | | |
| Forfeitures terminated | | | (8,500 | ) | | | | | | | 4.00 | | | | | | | | | |
| | | |
| | | |
| | | |
| | | |
| | | |
| |
| Balance at 9/29/01 | | | 190,550 | | | | 264,750 | | | | 4.95 | | | | 169,250 | | | | 5.16 | |
| | | |
| | | |
| | | |
| | | |
| | | |
| |
Fiscal Year 2002 | | | | | | | | | | | | | | | | | | | | |
| Granted | | | (23,000 | ) | | | 23,000 | | | | 5.55 | | | | | | | | | |
| Exercised | | | | | | | (11,250 | ) | | | 4.35 | | | | | | | | | |
| Forfeited | | | 3,500 | | | | (3,500 | ) | | | 6.67 | | | | | | | | | |
| Forfeitures terminated | | | (3,500 | ) | | | | | | | 6.67 | | | | | | | | | |
| Plan terminated | | | (45,600 | ) | | | | | | | n/a | | | | | | | | | |
| | | |
| | | |
| | | |
| | | |
| | | |
| |
| Balance at 9/28/02 | | | 121,950 | | | | 273,000 | | | | 5.01 | | | | 239,400 | | | | 4.99 | |
| | | |
| | | |
| | | |
| | | |
| | | |
| |
Fiscal Year 2003 | | | | | | | | | | | | | | | | | | | | |
| Granted | | | (28,250 | ) | | | 28,250 | | | | 7.97 | | | | | | | | | |
| Exercised | | | | | | | (3,000 | ) | | | 4.73 | | | | | | | | | |
| Forfeited | | | 3,000 | | | | (3,000 | ) | | | 8.38 | | | | | | | | | |
| Forfeitures terminated | | | (3,000 | ) | | | | | | | 8.38 | | | | | | | | | |
| | | |
| | | |
| | | |
| | | |
| | | |
| |
| Balance at 9/27/03 | | | 93,700 | | | | 295,250 | | | $ | 5.26 | | | | 263,850 | | | $ | 5.13 | |
| | | |
| | | |
| | | |
| | | |
| | | |
| |
25
12. SHAREHOLDERS’ EQUITY (continued)
A summary of stock options outstanding and exercisable at fiscal year end 2003 is shown below.
| | | | | | | | | | | | | | | | | | | | | |
| | | | | | | Outstanding | | Exercisable |
| | | | | | |
| |
|
| | | | | | | Weighted | | Wtd. Avg. | | | | | | Weighted |
| | | | | | | Average | | Remaining | | | | | | Average |
| | | Number of | | Ex. Price | | Contract | | Number of | | Ex. Price |
| Ranges of Exercise Prices | | Shares | | Per Share | | Life (yrs) | | Shares | | Per Share |
| |
| |
| |
| |
| |
|
| $3.55—$4.91 | | | 129,500 | | | $ | 4.10 | | | | 4.4 | | | | 122,500 | | | $ | 4.07 | |
| 5.00 —5.55 | | | 107,500 | | | | 5.42 | | | | 5.2 | | | | 96,100 | | | | 5.42 | |
| 7.09 —7.97 | | | 58,250 | | | | 7.52 | | | | 6.8 | | | | 45,250 | | | | 7.39 | |
| | | |
| | | |
| | | |
| | | |
| | | |
| |
| $3.55—$7.97 | | | 295,250 | | | $ | 5.26 | | | | 5.2 | | | | 263,850 | | | $ | 5.13 | |
| | | |
| | | |
| | | |
| | | |
| | | |
| |
The Board adopted a stock purchase incentive plan in February 2000. The 2000 Stock Purchase Plan was created to encourage management employees of the Company to purchase and hold the Company’s common stock. Plan benefits are paid in shares of the Company’s common stock. Benefits earned and accrued under the plan were $11,310 in 2003, $8,217 in 2002, and $5,626 in 2001. The Company issued stock valued at $9,466 in 2003, leaving a vested balance of $11,310 at September 27, 2003.
In March 1997 the Board approved the 1997 Long-Term Incentive Stock Option Plan for certain executives of the Company based on achievement of specified financial goals by fiscal year end 1999. As of September 27, 2003, the Company has accrued compensation expense of $24,000 related to this plan.
13. INCOME TAXES
Deferred income taxes reflect the net tax effects of temporary differences between the carrying amounts of assets and liabilities for financial reporting purposes and the amounts used for income tax purposes. Significant components of the Company’s deferred tax liabilities and assets as of September 27, 2003 and September 28, 2002 are as follows:
| | | | | | | | | | |
| | | | 2003 | | 2002 |
| | | |
| |
|
| Deferred tax liabilities: | | | | | | | | |
| | Depreciation | | $ | 641,000 | | | $ | 656,000 | |
| | Other | | | 128,000 | | | | 105,000 | |
| | | | |
| | | |
| |
| Total deferred tax liabilities | | | 769,000 | | | | 761,000 | |
| Deferred tax assets: | | | | | | | | |
| | Deferred compensation | | | 306,000 | | | | 346,000 | |
| | Accrued expenses | | | 216,000 | | | | 249,000 | |
| | Intangible assets | | | 13,000 | | | | 28,000 | |
| | Other | | | 71,000 | | | | 81,000 | |
| | | | |
| | | |
| |
| Total deferred tax assets | | | 606,000 | | | | 704,000 | |
| | | | |
| | | |
| |
| Net deferred tax liabilities | | $ | 163,000 | | | $ | 57,000 | |
| | | | |
| | | |
| |
The Company made income tax payments, net of refunds, of approximately $782,000, $962,000, and $491,000 in fiscal years 2003, 2002, and 2001, respectively.
26
13. INCOME TAXES (continued)
Federal and state income tax provisions consist of the following:
| | | | | | | | | | | | | | |
| | | | 2003 | | 2002 | | 2001 |
| | | |
| |
| |
|
| Current: | | | | | | | | | | | | |
| | Federal | | $ | 541,000 | | | $ | 720,000 | | | $ | 530,000 | |
| | State | | | 52,000 | | | | 76,000 | | | | 75,000 | |
| | | | |
| | | |
| | | |
| |
| | | | 593,000 | | | | 796,000 | | | | 605,000 | |
| Deferred: | | | | | | | | | | | | |
| | Federal | | | 111,000 | | | | 54,000 | | | | 63,000 | |
| | State | | | 11,000 | | | | 5,000 | | | | 12,000 | |
| | | | |
| | | |
| | | |
| |
| | | | 122,000 | | | | 59,000 | | | | 75,000 | |
| | | | |
| | | |
| | | |
| |
| Income tax expense | | $ | 715,000 | | | $ | 855,000 | | | $ | 680,000 | |
| | | | |
| | | |
| | | |
| |
Income tax expense differs from the amounts computed by applying the federal tax rate to income before income taxes as follows:
| | | | | | | | | | | | | | |
| | | | 2003 | | 2002 | | 2001 |
| | | |
| |
| |
|
| Computed tax at the statutory rate | | $ | 719,000 | | | $ | 852,000 | | | $ | 660,000 | |
| Increases (decreases): | | | | | | | | | | | | |
| | State income taxes, net of federal tax benefit | | | 42,000 | | | | 54,000 | | | | 58,000 | |
| | Tax-exempt investment income | | | (22,000 | ) | | | (31,000 | ) | | | (55,000 | ) |
| | Other, net | | | (24,000 | ) | | | (20,000 | ) | | | 17,000 | |
| | | |
| | | |
| | | |
| |
| Income tax expense | | $ | 715,000 | | | $ | 855,000 | | | $ | 680,000 | |
| | | |
| | | |
| | | |
| |
14. EARNINGS PER SHARE OF COMMON STOCK
The following table sets forth the computation of basic and diluted earnings per share of common stock in accordance with SFAS No. 128.
| | | | | | | | | | | | | | |
| | | | 2003 | | 2002 | | 2001 |
| | | |
| |
| |
|
| Numerator for basic and diluted earnings per share: | | | | | | | | | | | | |
| Net income | | $ | 1,398,794 | | | $ | 1,657,732 | | | $ | 1,260,186 | |
| | | |
| | | |
| | | |
| |
| Denominator: | | | | | | | | | | | | |
| Denominator for basic earnings per share: | | | | | | | | | | | | |
| | Weighted average shares | | | 2,544,882 | | | | 2,527,416 | | | | 2,510,427 | |
| Effect of dilutive securities: | | | | | | | | | | | | |
| | Employee and board stock options | | | 114,817 | | | | 73,188 | | | | 22,112 | |
| | | |
| | | |
| | | |
| |
| Denominator for diluted earnings per share: | | | | | | | | | | | | |
| | Adjusted weighted average shares and assumed conversions | | | 2,659,699 | | | | 2,600,604 | | | | 2,532,539 | |
| | | |
| | | |
| | | |
| |
| Net income per share: | | | | | | | | | | | | |
| | Basic | | $ | 0.55 | | | $ | 0.66 | | | $ | 0.50 | |
| | Diluted | | $ | 0.53 | | | $ | 0.64 | | | $ | 0.50 | |
| | | |
| | | |
| | | |
| |
27
15. EMPLOYEE BENEFITS AND INCENTIVE PLANS
The Company has an employee savings and investment plan (401(k) plan) available to employees meeting eligibility requirements. The Company matches a percentage of the employee contributions, with certain limitations. Contributions by the Company amounted to approximately $144,000, $118,000, and $106,000, for the 2003, 2002, and 2001 fiscal years, respectively.
16. RELATED-PARTY TRANSACTIONS
The Company paid approximately $102,000 in 2003, $72,000 in 2002, and $37,000 in 2001 in legal fees to a firm having a member who is also a director of the Company.
17. MAJOR CUSTOMERS
The Company has a business relationship with a customer to distribute certain of its medical products to hospitals and other treatment facilities throughout the United States. Sales generated by this customer amounted to approximately 8% of total net sales in 2003, 11% in 2002, and 13% in 2001.
The Company has a business relationship with another customer to distribute certain of its consumer products. Sales to this customer amounted to 40% of net sales in 2003, 32% in 2002, and 26% in 2001.
See note 18 for further information about sales to major customers.
18. OPERATIONS AND INDUSTRY SEGMENTS
The Company reports on three segments of business: medical, custom products, and safety catheters. However, the safety catheters segment, acquired during fiscal 2002, had no sales in fiscal 2003 or 2002 because the Secure I.V. product line is still in the development phase. (See Note 7.) This industry segment information corresponds to the markets in the United States for which the Company manufactures and distributes its polyurethane foam, packaging, and other products and therefore complies with the requirements of SFAS No. 131, “Disclosures about Segments of an Enterprise and Related Information.”
Total sales by industry segment include sales from unaffiliated customers as reported in the Company’s statements of income. In calculating operating profit, non-allocable general corporate expenses, interest expense, other income, and income taxes are not included, but certain corporate operating expenses incurred for the benefit of all segments are included on an allocated basis.
Identifiable assets are those assets that are used in the operations of each segment on an allocated basis. Amounts shown for corporate assets consist primarily of cash, marketable securities, and cash surrender value of life insurance. All of the Company’s assets are located in the United States.
The Company has several customers whose sales represent significant portions of sales in their respective business segments. In the medical segment, sales to one of these customers represented 15% of net medical sales in 2003, 19% sales in 2002, and 22 % in 2001. In the custom products segment, sales to one customer accounted for 82% of net custom products sales in 2003, 77% in 2002, and 68% in 2001.
Export sales, primarily to Canada, were approximately $2,174,000 in 2003, $1,063,000 in 2002, and $1,207,000 in 2001.
28
18. OPERATIONS AND INDUSTRY SEGMENTS (continued)
The following table summarizes certain information on industry segments:
| | | | | | | | | | | | | | |
| | | | 2003 | | 2002 | | 2001 |
| | | |
| |
| |
|
| Net sales: | | | | | | | | | | | | |
| | Medical | | $ | 21,330,122 | | | $ | 19,707,865 | | | $ | 17,393,487 | |
| | Custom products | | | 20,244,481 | | | | 13,827,775 | | | | 11,681,471 | |
| | Safely catheters | | | | | | | | | | | | |
| | | | |
| | | |
| | | |
| |
| Total | | | 41,574,603 | | | | 33,535,640 | | | | 29,074,958 | |
| | | | |
| | | |
| | | |
| |
| Operating profit (loss): | | | | | | | | | | | | |
| | Medical | | $ | 2,469,596 | | | $ | 2,418,085 | | | $ | 1,693,483 | |
| | Custom products | | | 254,225 | | | | 645 | | | | 184,890 | |
| | Safety catheters | | | (504,575 | ) | | | (58,954 | ) | | | | |
| | | | |
| | | |
| | | |
| |
| Total | | | 2,219,246 | | | | 2,359,776 | | | | 1,878,373 | |
| Corporate expense | | | (779,433 | ) | | | (642,684 | ) | | | (581,872 | ) |
| Other income | | | 673,981 | | | | 795,640 | | | | 643,685 | |
| | | | |
| | | |
| | | |
| |
| Income before income taxes | | $ | 2,113,794 | | | $ | 2,512,732 | | | $ | 1,940,186 | |
| | | | |
| | | |
| | | |
| |
| Identifiable assets: | | | | | | | | | | | | |
| | Medical | | $ | 8,609,857 | | | $ | 8,977,161 | | | $ | 8,102,371 | |
| | Custom products | | | 6,406,753 | | | | 4,287,781 | | | | 4,099,220 | |
| | Safety catheters | | | 1,417,980 | | | | 332,865 | | | | | |
| | Corporate | | | 7,556,067 | | | | 8,308,046 | | | | 7,983,800 | |
| | | | |
| | | |
| | | |
| |
| | | $ | 23,990,657 | | | $ | 21,905,853 | | | $ | 20,185,391 | |
| | | | |
| | | |
| | | |
| |
| Depreciation and amortization expenses: | | | | | | | | | | | | |
| | Medical | | $ | 229,209 | | | $ | 266,995 | | | $ | 436,169 | |
| | Custom products | | | 251,150 | | | | 212,930 | | | | 202,612 | |
| | Safety catheters | | | 45,805 | | | | 6,659 | | | | | |
| | Corporate | | | 883 | | | | 882 | | | | 775 | |
| | | | |
| | | |
| | | |
| |
| | | $ | 527,047 | | | $ | 487,466 | | | $ | 639,556 | |
| | | | |
| | | |
| | | |
| |
| Capital expenditures: | | | | | | | | | | | | |
| | Medical | | $ | 302,546 | | | $ | 326,313 | | | $ | 304,410 | |
| | Custom products | | | 312,102 | | | | 232,203 | | | | 156,649 | |
| | Safety catheters | | | 1,032,643 | | | | | | | | | |
| | | | |
| | | |
| | | |
| |
| | | $ | 1,647,291 | | | $ | 558,516 | | | $ | 461,059 | |
| | | | |
| | | |
| | | |
| |
29
19. OPERATING LEASES
The Company leases truck equipment in South Carolina and manufacturing facilities in California. Both of the leases require the Company to pay insurance and maintenance costs.
Rental expense for all operating leases was $299,000 in 2003, $255,000 in 2002, and $235,000 in 2001.
Future minimum lease payments under noncancelable operating leases with initial terms of one year or more at September 27, 2003 were $231,000 for fiscal 2004, $230,000 for fiscal 2005, $240,000 for fiscal 2006, and $61,000 for fiscal 2007.
20. COMMITMENTS AND CONTINGENCIES
The Company is committed to purchases of $1,650,000 for machinery and equipment in fiscal year 2004 for the safety catheter segment.
The Company is committed to minimum purchases of $500,000 of Selan® skin care products per calendar year through 2005. For the fiscal years ended September 27, 2003 and September 28, 2002, purchases under this commitment were $622,000 and $730,000, respectively.
From time to time the Company is a defendant in legal actions involving claims arising in the normal course of business. The Company believes that, as a result of legal defenses and insurance arrangements, none of these actions should have a material adverse effect on its operations or financial condition.
30
REPORT OF ELLIOTT DAVIS, LLC — INDEPENDENT AUDITORS
Shareholders and Board of Directors
Span-America Medical Systems, Inc.
Greenville, South Carolina
We have audited the accompanying balance sheets of Span-America Medical Systems, Inc. as of September 27, 2003 and September 28, 2002 and the related statements of income, shareholders’ equity, and cash flows for each of the years in the three year period ended September 27, 2003. These financial statements are the responsibility of the Company’s management. Our responsibility is to express an opinion on these financial statements based on our audits.
We conducted our audits in accordance with auditing standards generally accepted in the United States of America. Those standards require that we plan and perform the audit to obtain reasonable assurance about whether the financial statements are free of material misstatement. An audit includes examining, on a test basis, evidence supporting the amounts and disclosures in the financial statements. An audit also includes assessing the accounting principles used and significant estimates made by management, as well as evaluating the overall financial statement presentation. We believe that our audits provide a reasonable basis for our opinion.
In our opinion, the financial statements referred to above present fairly, in all material respects, the financial position of Span-America Medical Systems, Inc., as of September 27, 2003 and September 28, 2002 and the results of its operations and its cash flows for each of the years in the three year period ended September 27, 2003 in conformity with accounting principles generally accepted in the United States of America.
| | | |
| | |  |
| Greenville, South Carolina | | |
| October 30, 2003 | | |
31
OFFICERS AND DIRECTORS
OFFICERS
James D. Ferguson
President and Chief Executive Officer
Robert E. Ackley
Vice President — Custom Products
Richard C. Coggins
Chief Financial Officer, Treasurer and Secretary
James R. O’Reagan
Vice President — R & D and Engineering
Clyde A. Shew
Vice President — Medical Sales and Marketing
DIRECTORS
Thomas D. Henrion
Chairman of the Board
Span-America Medical Systems, Inc.
President/Owner
Silver Thread Farms, LLC
La Grange, Kentucky
James D. Ferguson
President and Chief Executive Officer
Span-America Medical Systems, Inc.
Greenville, South Carolina
Richard C. Coggins
Chief Financial Officer, Treasurer and Secretary
Span-America Medical Systems, Inc.
Greenville, South Carolina
Robert H. Dick
President
R.H. Dick & Company, Inc.
Citra, Florida
Thomas F. Grady, Jr.
Retired Vice President
International Paper
Chapel Hill, North Carolina
Guy R. Guarch
Retired Vice President
C.R. Bard
Atlanta, Georgia
Douglas E. Kennemore, M.D.
Retired Neurosurgeon
Greenville, South Carolina
James M. Shoemaker, Jr.
Member
Wyche, Burgess, Freeman & Parham, P.A.
Greenville, South Carolina
32
CORPORATE DATA
| | | |
CORPORATE OFFICE
Span-America Medical Systems, Inc.
70 Commerce Center
Greenville, South Carolina 29615
(864) 288-8877
Mailing Address:
P.O. Box 5231
Greenville, South Carolina 29606-5231
Web Site: www.spanamerica.com
STOCK INFORMATION
The common stock of Span-America Medical Systems, Inc. trades on the National Market tier of the Nasdaq Stock Market® under the symbol SPAN.
STOCK TRANSFER AGENT
American Stock Transfer & Trust Company
59 Maiden Lane
Plaza Level
New York, New York 10038
(877) 777-0800 or (800) 937-5449
Inquiries regarding stock transfers, lost certificates, or address changes should be directed to the Stock Transfer Agent at the address above | | GENERAL COUNSEL
Wyche, Burgess, Freeman & Parham, P.A.
P.O. Box 728
Greenville, South Carolina 29602-0728
AUDITORS
Elliott Davis, LLC
P.O. Box 6286
Greenville, South Carolina 29606-6286
SHAREHOLDER INQUIRIES AND AVAILABILITY OF FORM 10-K REPORT
A copy of the Company’s Annual Report on Form 10-K for the year ended September 27, 2003 is available without charge to shareholders upon written request from the following:
Secretary
Span-America Medical Systems, Inc.
P.O. Box 5231
Greenville, South Carolina 29606-5231 |
| |
 | | |