Span-America manufactures and markets a comprehensive selection of pressure management products for the medical market, including Geo-Matt®, PressureGuard®, Geo-Mattress®, Span+Aids®, Isch-Dish®, and Selan® products. The Company also supplies custom foam and packaging products to the consumer and industrial markets. Span-America's stock is traded on The NASDAQ Stock Market's National Market under the symbol “SPAN.”
| Table of Contents | | |
| |
| Letter to Shareholders | | 2 |
| Selected Financial Information | | 8 |
| Quarterly Financial Data | | 9 |
| Management's Discussion and Financial Analysis | | 10 |
| Statements of Income | | 17 |
| Balance Sheets | | 18 |
| Statements of Cash Flows | | 19 |
| Statements of Shareholders' Equity | | 20 |
| Notes to Financial Statements | | 21 |
| Report of Elliott Davis, LLC, Independent Registered Public Accounting Firm | | 31 |
| Directors and Officers | | 32 |
| Corporate Data | | IBC |
| Financial Summary | | | | | | | | | | | |
| (Amounts in thousands, except per share and percent data) | | | | | | | | | | | |
| |
| | | | 2004 | | | | 2003 | | | % Change | |
|
| Net sales | | $ | 49,929 | | | $ | 41,575 | | | 20 | % |
| Gross profit | | | 12,691 | | | | 11,134 | | | 14 | % |
| Percent of net sales | | | 25.4 | % | | | 26.8 | % | | | |
| Operating income | | | 2,308 | | | | 1,440 | | | 60 | % |
| Percent of net sales | | | 4.6 | % | | | 3.5 | % | | | |
| Net income | | | 1,985 | | | | 1,399 | | | 42 | % |
| Percent of net sales | | | 4.0 | % | | | 3.4 | % | | | |
| Earnings per share: | | | | | | | | | | | |
| Basic | | | 0.77 | | | | 0.55 | | | 40 | % |
| Diluted | | | 0.73 | | | | 0.53 | | | 38 | % |
| |
| Cash and securities | | | 6,381 | | | | 5,955 | | | 7 | % |
| Current assets | | | 16,443 | | | | 15,029 | | | 9 | % |
| Total assets | | | 26,915 | | | | 23,991 | | | 12 | % |
| Current liabilities | | | 4,820 | | | | 4,215 | | | 14 | % |
| Shareholders' equity | | | 20,419 | | | | 18,525 | | | 10 | % |
| Return on average shareholders’ equity | | | 10.2 | % | | | 7.8 | % | | | |
| Number of shares outstanding at fiscal year end | | | 2,592 | | | | 2,552 | | | 2 | % |
| Book value per share | | | 7.88 | | | | 7.26 | | | 9 | % |

1

To o u rS H A R E H O L D E R S ,
C U S T O M E R S ,a n dE M P L O Y E E S
Span-America enjoyed an excellent year of progress in fiscal 2004. Our sales grew by 20% to a record $49.9 million. Net income was up 42% to $1.98 million, just short of a record, and earnings per share increased 38% to $0.73 a diluted share.
In response to the company’s strong financial performance, the board increased the regular quarterly dividend by 14% to an annual rate of $0.16 per share and later declared a special or one-time dividend of $0.40 per share payable to shareholders in January 2005. Our stock price also responded well to the results by providing shareholders with a total return of 14.2% during the fiscal year.
We are pleased to report that Span-America was included for the second consecutive year in the FSB 100, a list of the fastest growing small public companies published annually by FORTUNE Small Business magazine. Span-America ranked number 68 on this year’s list based on our earnings growth, revenue growth and stock performance over the last three years.
Our improved financial results for the past year came from strong sales in our medical and custom products business units, improved manufacturing efficiencies and a continuation of good cost controls throughout the company. In addition, we recorded the company’s first sales of our proprietary Secure I.V.® safety catheter late in the third quarter of fiscal 2004.
Custom products sales rose 31% in fiscal 2004 to $26.5 million and was our largest segment for the first time based on revenues. The custom products business is made up of foam mattress pads and pillows for the consumer bedding market and specialty foam products for the industrial market. In 2004, all of our sales growth in the custom products segment came from consumer bedding products, which were up by 36% for the year. Sales of industrial products were down 1%, as new business just about offset business lost from customers moving their manufacturing operations outside the United States.
In the consumer market, our foam mattress pads and pillows are distributed by our partner Louisville Bedding Company under an exclusive marketing and distribution agreement. We teamed up with Louisville Bedding almost six years ago to combine Span-America’s design and manufacturing capabilities with their sales and marketing expertise to supply foam bedding products to major retailers throughout the Unites States and Canada. It has been an excellent relationship for both companies.
2

Our products are currently sold through Louisville Bedding to companies like Wal-Mart, Linens & Things, May Company, Sears, and Mervyns.
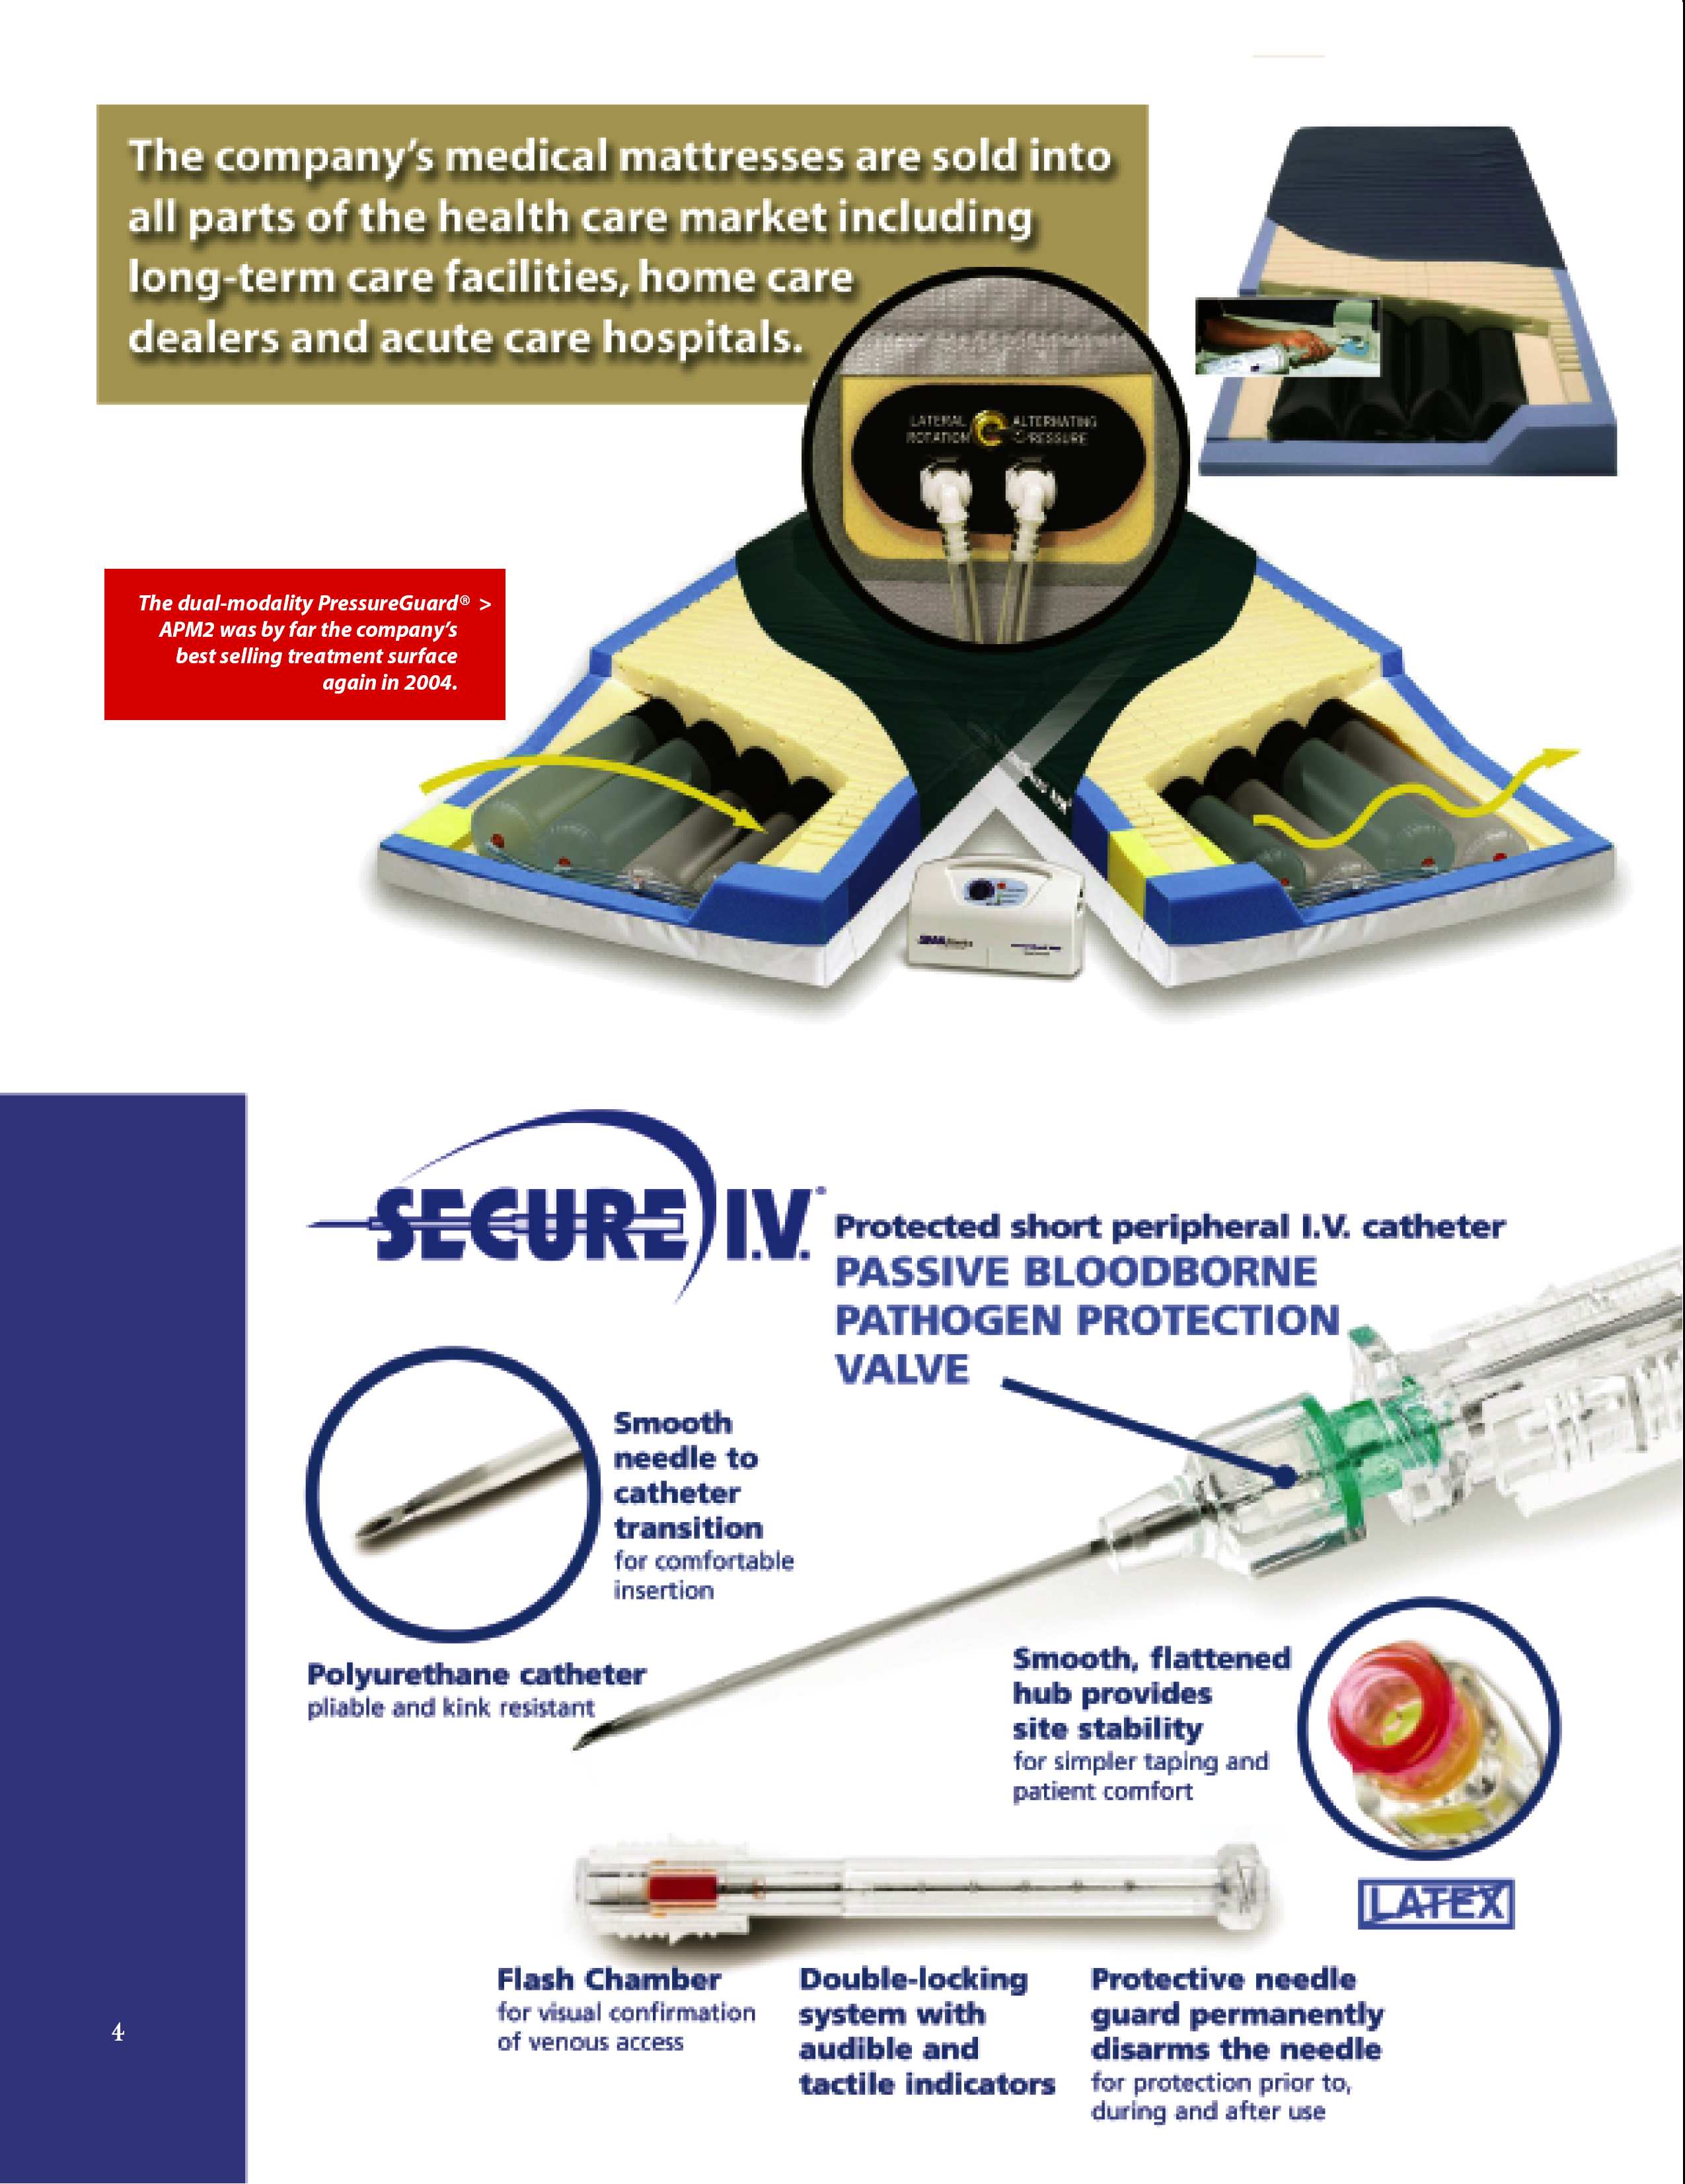
Our medical business posted strong results in fiscal 2004. Medical sales increased 9% during the year to $23.3 million compared with $21.3 million last year. The company’s medical products are sold into all parts of the health care market, including long-term care facilities, home care dealers and acute care hospitals. Most of the growth in the medical business during 2004 came from our PressureGuard® and Geo-Mattress® lines of therapeutic mattresses, particularly our new PressureGuard “Deuce Deluxe”, which has been one of our fastest growing new products. Total mattress sales were up 17% for the year. These products have proven to be highly cost effective for customers while delivering excellent clinical results. They are an attractive alternative to expensive rental beds. Mattress sales growth was about evenly split between powered surfaces like the PressureGuard APM2® and Easy Air® and non-powered surfaces like the PressureGuard CFT® and the Geo-Mattress Wings® products. We have an excellent lineup of mattress products, and we plan to expand that offering in the coming year.
In other medical product lines, sales of our Span-Aids® patient positioners increased by 4%, seating products grew by 9%, Selan® skin care products were up by 5%, and mattress overlays declined by 3%. The decline in overlays continues the long-term trend of customers switching from overlays to replacement mattresses. The medical business remains the most profitable part of the company and our primary strategic focus.
Our newest business unit is the safety catheter segment that we entered in July 2002 through the acquisition of patents and production equipment for the Secure I.V. ® product line. The Secure I.V. is a safety catheter that has the unique feature of a patented valve that eliminates the flow of blood back through the catheter as it is inserted into the vein. This allows for bloodless intravenouscatheter insertions without vein occlusion, giving health care workers maximum protection from blood exposure.
During fiscal 2004, we successfully scaled up from prototype to semi-automated production and completed initial validation of the six standard sizes of Secure I.V. Although the development phase took much longer than we expected, our focus was on quality, cost, product features and process design rather than speed to market.
We made our first market test shipments of Secure I.V. in the third quarter and recorded total sales of $59,000 in fiscal 2004. With the majority of the development work now behind us, we can turn our attention to design enhancements, sales, marketing, and manufacturing cost reduction in the coming year. We expect to improve our Secure I.V. sales performance in fiscal 2005.
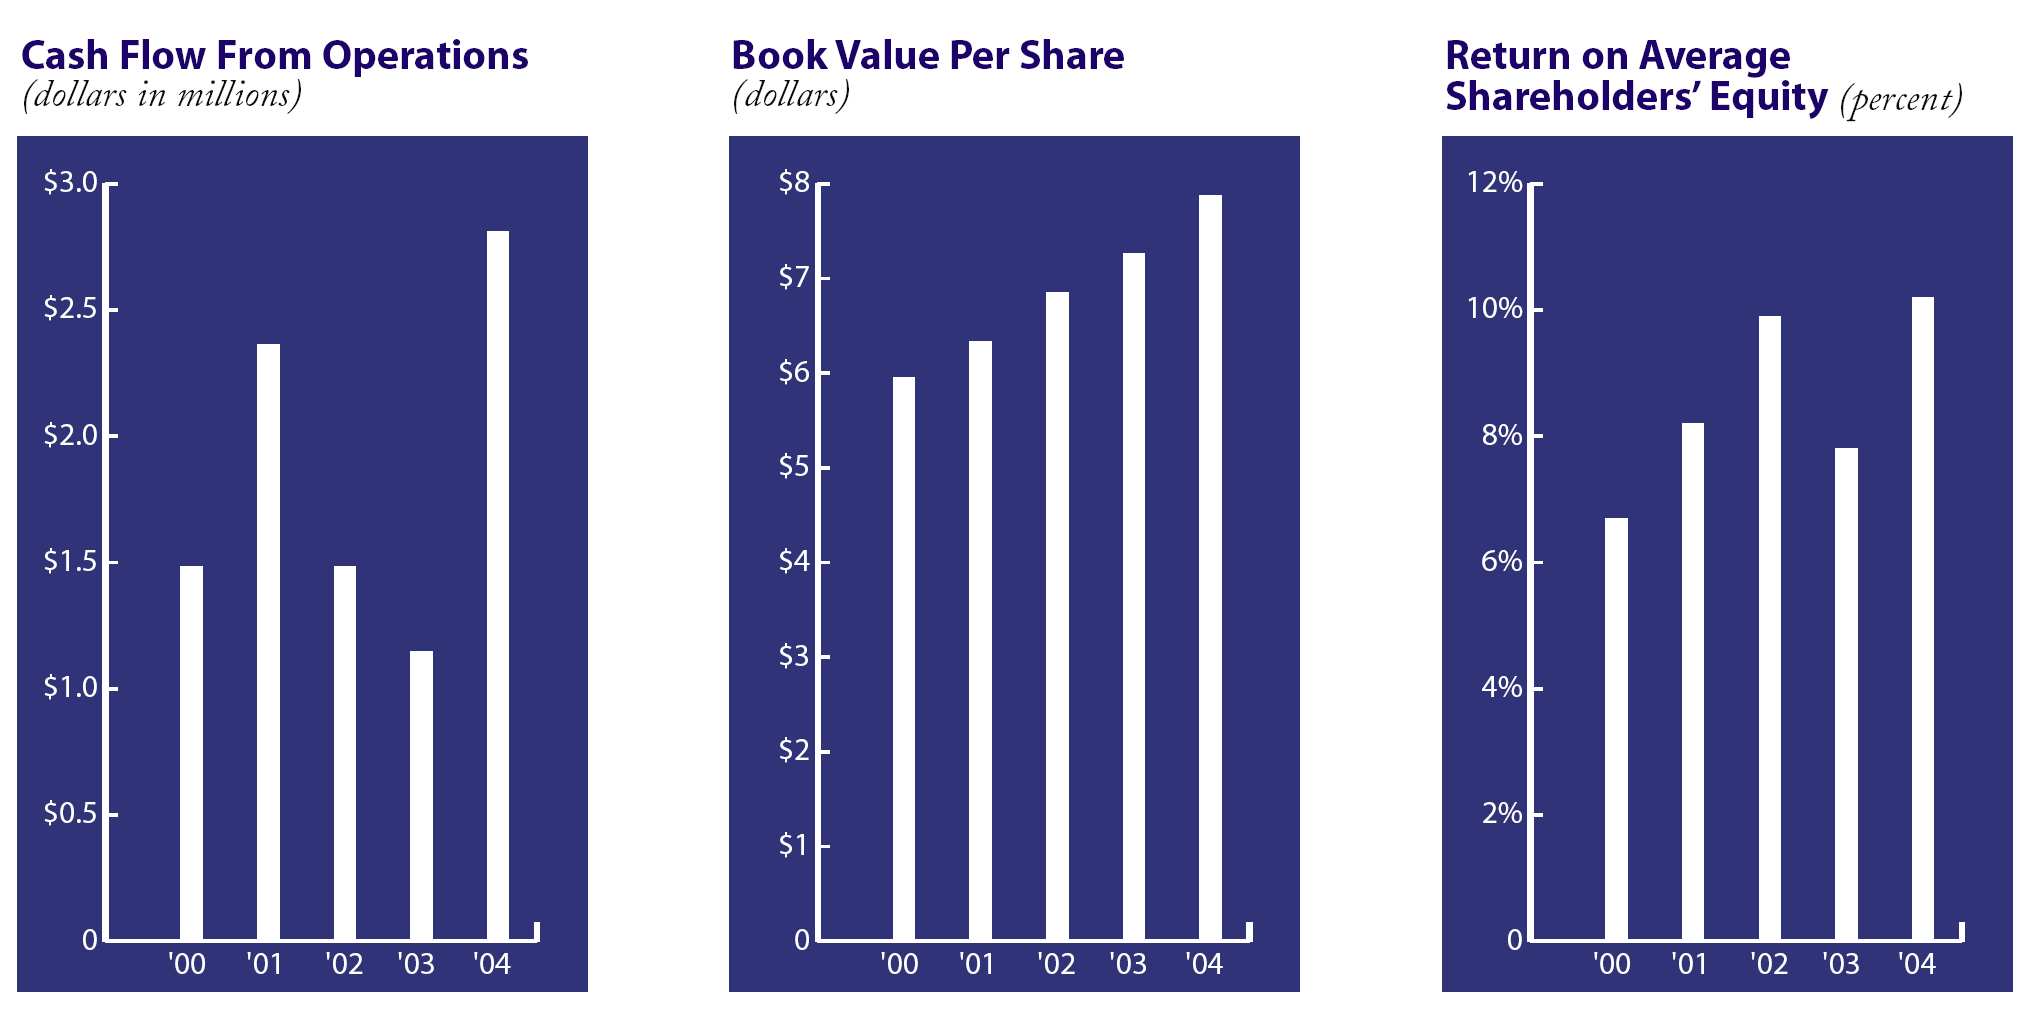
Our financial performance in fiscal 2004 was excellent by most measures. Total sales were up 20% to $49.9 million, while operating profit rose 60% to $2.3 million. Net income increased 42% to $2.0 million, and earnings per diluted share climbed 38% to 73 cents. Cash flow from operations increased 145% to $2.8 million. These results were driven by higher sales levels, improvements in our manufacturing processes and the continuation of good cost controls throughout the business.
The company’s gross profit was up 14% to $12.7 million mainly because of the higher sales volume. In addition to the higher sales levels, we improved several of our key manufacturing processes to make them faster and more efficient. This helped lower the labor costs on some of our products – an important improvement since many of our high volume consumer products have thin profit margins. Our gross margin declined slightly for the year to 25.4% because lower margin consumer products grew faster than higher margin medical products. The gross margin for 2004 was also affected by new depreciation expense on Secure I.V. production equipment.
Operating profit jumped 60% for the year to $2.3 million. The increase resulted from the combination of 20% sales growth with only a 7% growth in operating
5
expenses. Selling and marketing expenses were up by 7% to $6.9 million for the year due to higher costs in the medical segment for shipping, trade shows and advertising, and for a special promotion program in the custom products segment. R&D expenses rose 23% to $686,000 as a result of new product development efforts about evenly divided between the medical and safety catheter segments. Administrative expenses increased 3% to $2.8 million as higher insurance and compensation expense was offset to a large extent by lower professional fees and lower bad debt expense.
Non-operating income dropped by 5% during the year to $639,000 because of lower interest and royalty income. The reduction in interest income was caused by a lower average level of marketable securities during the year and lower interest rates during the first three quarters of fiscal 2004. Span-America receives a royalty on the Safety-Lok® syringe licensed to Becton, Dickinson and Company. Royalty income for 2004 was down 9% to $545,000 due to lower sales of the syringe. The royalty agreement expires in December 2005, and we do not expect to receive any further royalty payments after that time.
The company’s balance sheet remained particularly sound and liquid in 2004. Our unusually strong growth in operating cash flow allowed us to finish the year with slightly more cash and securities than last year in spite of higher capital expenditures during the year. We did a good job managing working capital needs with relatively small increases in accounts receivable and inventory. Our collection time improved, and inventory turnover increased to 14.2 times, our best performance in many years. Capital expenditures were $2.0 million and were mostly related to new production equipment for the Secure I.V. product line. We finished the year with total shareholders equity of $20.4 million, up 10% from 2003.
It is always a challenge to follow an excellent year like 2004 but we believe Span-America has many opportunities for continued growth in fiscal 2005. We expect the medical business to grow again next year at approximately the same rate achieved in 2004. As in the last several years, we expect the growth to come mostly from our mattress product lines. We are planning to add a number of new features to our existing medical products as well as a new mattress introduction in fiscal 2005. In addition, we look forward to working with Hill-Rom under a new license agreement that allows us to develop and manufacture private-label mattresses for some of their bed systems. We are pleased to be partnered with Hill-Rom and believe this will strengthen Span-America’s presence in the acute care market.
In the custom products segment, we do not expect to repeat our 2004 performance of 31% sales growth. A large part of last year’s growth came from new programs through Louisville Bedding to Wal-Mart. Selling to the world’s largest retailer is always a highly competitive and volatile process. We therefore think it is likely that custom products sales will be down slightly in 2005 from last year’s record levels. However, we will continue to look for growth opportunities in the retail bedding market. We work closely with Louisville Bedding on an ongoing basis to design new products, packaging and programs that provide fresh offerings to our retail customers and prospects. The consumer bedding market is large and growing, and we expect our custom products business to continue to grow over the long term.
Results in the new safety catheter segment are the most difficult to predict. In 2004, we completed the installation of a new production line and the initial validation process and made our first shipments of Secure I.V. This year our focus will shift from development and manufacturing to sales, marketing, distribution, and product cost reduction. We expect to make several design enhancements to the product line in early fiscal 2005 then increase production speed later in the year. So far, customer reaction to the concept of a bloodless start without vein occlusion has been very positive. We are currently scheduling product evaluations to gain customer feedback and gauge the success of Secure I.V. We will update you on our progress as we receive new information from the market. We continue to believe that Secure I.V. has excellent potential as a new product line for Span-America. However, we do not expect the
6

safety catheter segment to be profitable in fiscal 2005. We believe the operating loss for the segment in the coming year will be similar to that of 2004.
To support future growth, we recently completed preliminary work on plans to expand our manufacturing plant in Greenville, S.C. We plan to add 60,000 square feet of manufacturing and storage space to our existing 120,000 square foot facility. The addition will cost about $2.6 million and should be completed by September 2005. We believe the needed space and capacity will allow us to improve efficiencies in several of our production areas, add equipment that will lower our material costs, and consolidate leased space currently in an offsite building.
Overall, we are extremely pleased with Span-America’s results in fiscal 2004. It was a record year in many respects. We believe fiscal 2005 will be a more challenging year, but we expect continued growth in the company’s sales and earnings. We are well positioned ingrowing markets with a broad product line, strong distribution and customer relationships, top flight manufacturing capabilities, excellent people, and solid financial resources. Our goal is to combine these strengths and others to significantly increase the value of Span-America over time. We look forward to reporting to you on our progress.

James D. Ferguson | | 
Thomas D. Henrion |
| President and CEO | | Chairman |
7
Selected Financial Information
Five-Year Financial Summary
(Amounts in thousands, except per share and employee data)
| | | | 2004 | | | | 2003 | | | | 2002 | | | | 2001 | | | | 2000 | |
|
| For the year: | | | | | | | | | | | | | | | | | | | | |
| Net sales | | $ | 49,929 | | | $ | 41,575 | | | $ | 33,536 | | | $ | 29,075 | | | $ | 26,568 | |
| Gross profit | | | 12,691 | | | | 11,134 | | | | 10,175 | | | | 8,910 | | | | 7,621 | |
| Operating income | | | 2,308 | | | | 1,440 | | | | 1,717 | | | | 1,297 | | | | 902 | |
| Net income | | | 1,985 | | | | 1,399 | | | | 1,658 | | | | 1,260 | | | | 971 | |
| Cash flow from operations | | | 2,812 | | | | 1,147 | | | | 1,486 | | | | 2,362 | | | | 1,483 | |
| Capital expenditures | | | 1,997 | | | | 1,647 | | | | 559 | | | | 461 | | | | 413 | |
| |
| Per share: | | | | | | | | | | | | | | | | | | | | |
| Net income: | | | | | | | | | | | | | | | | | | | | |
| Basic | | $ | 0.77 | | | $ | 0.55 | | | $ | 0.66 | | | $ | 0.50 | | | $ | 0.39 | |
| Diluted | | | 0.73 | | | | 0.53 | | | | 0.64 | | | | 0.50 | | | | 0.39 | |
| Cash dividends declared | | | 0.145 | | | | 0.14 | | | | 0.12 | | | | 0.12 | | | | 0.11 | |
| |
| At end of year: | | | | | | | | | | | | | | | | | | | | |
| Working capital | | | 11,623 | | | | 10,814 | | | | 11,058 | | | | 9,844 | | | | 8,671 | |
| Property and equipment - net | | | 6,185 | | | | 4,817 | | | | 3,632 | | | | 3,425 | | | | 3,346 | |
| Total assets | | | 26,915 | | | | 23,991 | | | | 21,906 | | | | 20,185 | | | | 19,161 | |
| Shareholders' equity | | | 20,419 | | | | 18,525 | | | | 17,394 | | | | 15,928 | | | | 14,904 | |
| Book value per share | | | 7.88 | | | | 7.26 | | | | 6.85 | | | | 6.33 | | | | 5.95 | |
| Number of employees | | | 303 | | | | 299 | | | | 254 | | | | 228 | | | | 216 | |
| |
| Key ratios: | | | | | | | | | | | | | | | | | | | | |
| Current ratio | | | 3.4 | | | | 3.6 | | | | 4.4 | | | | 4.2 | | | | 3.8 | |
| Return on net sales | | | 4.0 | % | | | 3.4 | % | | | 4.9 | % | | | 4.3 | % | | | 3.7 | % |
| Return on average | | | | | | | | | | | | | | | | | | | | |
| shareholders' equity | | | 10.2 | % | | | 7.8 | % | | | 9.9 | % | | | 8.2 | % | | | 6.7 | % |
| Return on average total assets | | | 7.8 | % | | | 6.1 | % | | | 7.9 | % | | | 6.4 | % | | | 5.3 | % |

8
Quarterly Financial Data
(Unaudited) (Amounts in thousands, except per share data)
| | | | First | | | Second | | | Third | | | Fourth | | | Year |
|
| For Fiscal 2004 | | | | | | | | | | | | | | | |
| Net sales | | $ | 11,508 | | $ | 12,869 | | $ | 11,901 | | $ | 13,651 | | $ | 49,929 |
| Gross profit | | | 2,902 | | | 3,378 | | | 2,992 | | | 3,419 | | | 12,691 |
| Operating income | | | 490 | | | 599 | | | 535 | | | 684 | | | 2,308 |
| Net income | | | 422 | | | 498 | | | 470 | | | 595 | | | 1,985 |
| Earnings per share | | | | | | | | | | | | | | | |
| Basic | | | 0.16 | | | 0.19 | | | 0.18 | | | 0.23 | | | 0.77 |
| Diluted | | | 0.16 | | | 0.18 | | | 0.17 | | | 0.22 | | | 0.73 |
| Stock price data | | | | | | | | | | | | | | | |
| High | | | 13.72 | | | 14.97 | | | 13.99 | | | 13.68 | | | 14.97 |
| Low | | | 9.21 | | | 12.41 | | | 11.15 | | | 10.30 | | | 9.21 |
| | | | | | | | | | | | | | | | |
| For Fiscal 2003 | | | | | | | | | | | | | | | |
| Net sales | | $ | 7,892 | | $ | 10,839 | | $ | 10,609 | | $ | 12,235 | | $ | 41,575 |
| Gross profit | | | 2,506 | | | 2,633 | | | 2,907 | | | 3,088 | | | 11,134 |
| Operating income | | | 316 | | | 177 | | | 442 | | | 505 | | | 1,440 |
| Net income | | | 333 | | | 226 | | | 392 | | | 448 | | | 1,399 |
| Earnings per share | | | | | | | | | | | | | | | |
| Basic | | | 0.13 | | | 0.09 | | | 0.15 | | | 0.18 | | | 0.55 |
| Diluted | | | 0.13 | | | 0.09 | | | 0.15 | | | 0.17 | | | 0.53 |
| Stock price data | | | | | | | | | | | | | | | |
| High | | | 8.08 | | | 8.29 | | | 10.03 | | | 12.32 | | | 12.32 |
| Low | | | 6.53 | | | 7.21 | | | 7.86 | | | 8.50 | | | 6.53 |
Span-America's common stock trades on The Nasdaq Stock Market® under the symbol SPAN.As of October 2, 2004, there were 2,592,218 common shares outstanding. As of December 2, 2004, there were 251 shareholders of record and approximately 1,130 beneficial shareholders. The closing price of Span-America's stock on December 3, 2004 was $11.68.
The Company has paid a regular quarterly cash dividend since January 1990. In April 2000, the Board of Directors increased the quarterly dividend to $0.03 per share from $0.025 per share. In October 2002, the Board increased the quarterly dividend to $0.035 per share from $0.03 per share. In July 2004, the Board increased the quarterly dividend to $0.04 per share from $0.035 per share. In December 2004, the Board declared a special cash dividend of $0.40 per share payable on January 12, 2005 to all shareholders of record on December 22, 2004. Future dividend payments will depend upon the Company's earnings and liquidity position.
9
Management’s Discussion and Analysis of Financial Condition and Results of Operations
FORWARD-LOOKING STATEMENTS
The statements contained in “Results of Operations” and “Liquidity and Capital Resources” which are not historical facts are forward-looking statements that involve risks and uncertainties. Management wishes to caution the reader that these forward-looking statements, such as the Company’s expectations for future sales increases or expense changes compared with previous periods, are only predictions. Actual events or results may differ materially as a result of risks and uncertainties facing the Company, including (a) the loss of a major distributor of the Company’s medical or custom products, (b) the inability to achieve anticipated sales volumes of medical or custom products, (c) raw material cost increases, (d) the degree of success achieved in manufacturing and selling the Secure I.V. safety catheter product line, (e) potential problems arising from having a sole source contract manufacturer for the Secure I.V. product line (f) the potential for lost sales due to competition from low-cost foreign imports, (g) changes in relationships with large customers, (h) the impact of competitive products and pricing, (i) government reimbursement changes in the medical market, (j) FDA regulation of medical device manufacturing, and other risks referenced in the Company’s Securities and Exchange Commission filings. The Company disclaims any obligation to update any forward-looking statement whether as a result of new information, future events or otherwise.
RESULTS OF OPERATIONS FISCAL2004VS.2003
|
SUMMARY
Net sales in fiscal 2004 increased 20% to $49.9 million compared with $41.6 million in fiscal 2003. The increase was the result of sales growth in the Company’s custom products and medical business segments. Custom products sales were up 31% to $26.5 million. Sales in the medical segment rose by 9% to $23.3 million.
Net income increased 42% in fiscal 2004 to $2.0 million, or $0.73 per diluted share, compared with $1.4 million, or $0.53 per diluted share, in fiscal 2003. The Company’s increase in earnings resulted from higher sales volume, lower labor costs from manufacturing process improvements, and slower growth in selling and administrative expenses.
SALES
Sales in the custom products segment rose 31% during fiscal 2004 to $26.5 million from $20.2 million in fiscal 2003. The custom products segment consists of consumer bedding products and specialty foam products for the industrial market. Most of the 2004 sales increase in the custom products segment was due to higher unit volumes of pillows and Geo-Systems™ mattress pads sold to Wal-Mart and other major retailers through Louisville Bedding Company, our exclusive distributor for consumer foam products. Louisville Bedding is a leading manufacturer and distributor of bedding products in North America. Sales of consumer bedding products increased 36% in 2004 to $23.6 million. In the other part of the custom products segment, industrial sales declined by 1% to $2.9 million. The industrial sales decline was caused by the loss of business as some customers moved their manufacturing operations outside the United States. We believe that sales in the custom products segment in fiscal 2005 will be slightly lower than those of fiscal 2004 because of increased competition in the consumer bedding market.
Sales in the Company’s medical segment rose 9% to $23.3 million in fiscal 2004 compared with $21.3 million the previous year. The medical sales growth was led by our PressureGuard® and Geo-Mattress® therapeutic mattresses which increased by 17% over 2003 levels. Most of the mattress growth came from the Company’s PressureGuard® APM2®, CFT® and Geo-Mattress Wings® products. In other medical product lines, sales of patient positioners increased by 4%, seating products increased 9%, and Selan® skin care products rose by 5%. Sales of overlays were down by 3%, continuing a long-term trend of customers switching to replacement mattresses from mattress overlays. We expect that total medical sales will increase during fiscal 2005.
In the safety catheter segment, sales were $59,000 as we recorded the first shipments of the new Secure I.V. ® product line in the third and fourth quarters of fiscal 2004. We expect sales of Secure I.V. to increase in fiscal 2005, but the rate of increase is difficult to accurately predict because it will depend on manufacturing speed and reliability, selling price, and the market’s
10
acceptance of this new product. We plan to make several design enhancements to the product in early fiscal 2005 which will result in a slight production delay and a temporary increase in manufacturing costs. We continue to be optimistic about the future prospects for the safety catheter segment, but we do not expect the segment to be profitable in fiscal 2005. We believe the operating loss for the segment in fiscal 2005 will be similar to that of fiscal 2004.
GROSS PROFIT
The Company’s gross profit level increased by 14% to $12.7 million during fiscal 2004 from $11.1 million in fiscal 2003. The increase in gross profit level was due to higher sales volume and improved labor efficiencies. The gross profit margin percentage declined to 25.4% for fiscal year 2004 compared with 26.8% for fiscal 2003. The decline in gross margin percentage resulted from higher sales of consumer products in 2004 compared with 2003 as they carry lower margins than most of the Company's medical products. The medical segment typically has a higher gross margin than the custom products segment because many of the Company’s medical products are patented and proprietary. The gross margin percentage in 2004 was also lowered slightly by new depreciation expense for Secure I.V. production equipment. We expect the gross margin percentage during fiscal 2005 to be slightly higher than that of fiscal 2004.
SELLING, R&D AND ADMINISTRATIVE EXPENSES
Sales and marketing expenses increased 7% to $6.9 million, or 13.9% of sales, in fiscal 2004 compared with $6.5 million, or 15.5% of sales, in fiscal 2003. Most of the increase occurred in the medical segment and was due to higher expenditures for shipping, incentive compensation, advertising and trade shows. In addition, marketing expense in the custom products segment increased in 2004 due to a special promotion program for consumer bedding products. Sales and marketing expenses declined as a percent of sales because most of our sales growth for fiscal 2004 came from the custom products segment, which has much lower selling and marketing expenses than the medical segment. Management expects total sales and marketing expenses for fiscal 2005 to increase over 2004 levels.
Total research and development expenses increased 23% to $686,000 in fiscal 2004 compared with $556,000 in fiscal 2003. The increase was nearly evenly divided between the medical and safety catheter segments and stemmed from new product development efforts in both segments. R&D expense for the safety catheter segment in fiscal 2004 increased 21% to $364,000 compared with $301,000 last year. Management expects that sales of Secure I.V. during 2005 will only partially offset higher marketing and development expenses related to the product line’s introduction during the period. The Company considers safety catheters to be a separate reportable segment based on product type and distribution channels. See Note 17 in Notes to Financial Statements for additional information on the safety catheter segment. We expect that total research and development expenses in fiscal 2005 will be higher than those of 2004 because of ongoing product development efforts.
General and administrative expenses increased 3% to $2.8 million in fiscal 2004 from $2.7 million in 2003 due to higher property and casualty insurance costs and incentive compensation expense which was partly offset by lower professional fees and lower bad debt expense. General and administrative expenses for 2005 are expected to be higher than 2004 levels.
NON-OPERATING INCOME AND DIVIDENDS
Investment income increased by 21% to $102,000 in fiscal 2004 compared with $84,000 in fiscal 2003. The increase was the result of a $39,000 pre-tax gain on the sale of Prudential Financial common stock received through Prudential’s demutualization process. The gain was partially offset by a decline in investment income, which was the result of lower interest rates and a lower average balance of marketable securities in fiscal 2004.
Royalty income decreased 9% to $545,000 in fiscal 2004 compared with $598,000 in fiscal 2003 as a result of lower sales volume of the Safety-Lok® shielded syringe product licensed to Becton Dickinson and Company (BD). The Company’s license agreement with BD will expire in December 2005, and no further royalty income will be received after the expiration date.
Other income for 2004 also includes a $12,000 loss on the retirement of certain equipment. Management expects total non-operating income for fiscal 2005 to be lower than 2004 levels.
11
During fiscal 2004, the Company paid dividends of $374,000, or 19% of net income, for the year. This amount represented three quarterly dividends of $0.035 per share and one of $0.040 per share.
RESULTS OF OPERATIONS FISCAL2003VS.2002
|
SUMMARY
Net sales in fiscal 2003 increased 24% to $41.6 million compared with $33.5 million in fiscal 2002. The increase was the result of sales growth in the Company’s custom products and medical business segments. Custom products sales rose 46% to $20.2 million. Medical segment sales increased 8% to $21.3 million.
Net income declined 16% in fiscal 2003 to $1.40 million, or $0.53 per diluted share, compared with $1.66 million or $0.64 per diluted share, in fiscal 2002. The Company’s decrease in earnings resulted from higher raw material costs, expenses associated with the development of the new Secure I.V. ® safety catheter, increased professional fees, and two non-recurring income items included in fiscal 2002 results.
SALES
Sales in the Company’s medical segment rose 8% to $21.3 million in fiscal 2003 compared with $19.7 million the previous year. The medical sales growth was led by our proprietary lines of therapeutic replacement mattresses which increased by 24% over 2002 sales. Most of the mattress growth came from the Company’s PressureGuard® APM2® and the PressureGuard Easy Air® products. Sales of patient positioners increased by 8%, seating products declined 24% due to a large one-time order in fiscal 2002, and Selan® skin care products rose by 6%. Sales of overlays were down by 10%, continuing a long-term trend of customers switching to replacement mattresses from mattress overlays.
Sales in the custom products segment jumped 46% during fiscal 2003 to $20.2 million from $13.8 million in fiscal 2002. Most of the custom products sales increase was due to higher unit volumes of Thera-FOAM™ mattress pads sold to Wal-Mart through Louisville Bedding Company. Louisville Bedding, which distributes the Company’s consumer products under a marketing and distribution agreement, is a leading manufacturer and distributor of bedding products in North America. Industrial sales, which are part of the custom products business, increased by 3% in fiscal 2003 to $2.9 million.
GROSS PROFIT
The Company’s gross profit increased by 9% to $11.1 million during fiscal 2003 from $10.2 million in fiscal 2002. The increase in gross profit level was primarily the result of higher sales volume during the year. The gross profit margin percentage declined to 26.8% for fiscal year 2003 compared with 30.3% for fiscal 2002. The decline in gross margin percentage resulted from raw material cost increases due to higher prices on foam (our largest volume raw material). The Company received three price increases on foam raw material during fiscal 2003 and was partially successful at passing these higher costs along to customers. Higher sales of consumer products in 2003 compared with 2002 also reduced margins since they carry lower margins than those associated with the Company's medical business. The medical segment typically has a higher gross margin than the custom products segment because many of the Company’s medical products are patented and proprietary.
SELLING, R&D AND ADMINISTRATIVE EXPENSES
Sales and marketing expenses increased 9% to $6.5 million, or 15.5% of sales, in fiscal 2003 compared with $5.9 million, or 17.6% of sales, in fiscal 2002. The increase occurred primarily in the medical segment and was due to higher commissions and mattress evaluation samples. The increase in sales and marketing expenses for 2003 also included $86,000 related to the Secure I.V. safety catheter acquired in July 2002 which is further discussed below.
Research and development expenses increased 61% to $556,000 in fiscal 2003 compared with $346,000 in fiscal 2002. The increase was primarily due to $301,000 of design and development costs associated with the Secure I.V. product line. The Company considers safety catheters to be a separate reportable segment based on product type and distribution channels. See Note 17 in Notes to Financial Statements for additional information on the safety catheter segment.
12
General and administrative expenses increased 21% to $2.7 million in fiscal 2003 from $2.2 million in 2002. The Company incurred costs of approximately $286,000 in fiscal 2003 for professional fees and other expenses related to the renewal of the Company’s Shareholder Rights Plan, which was set to expire in 2003, and the proposed tender offer and subsequent lawsuit by Mr. Jerry Zucker as discussed below. Another factor affecting the increase was the receipt in the fourth quarter of fiscal 2002 of proceeds from the settlement of a patent infringement lawsuit, which reduced fiscal 2002 administrative expenses. Higher property and casualty insurance costs in 2003 were partially offset by increased income on company-owned life insurance policies. Professional fees and other expenses associated with Secure I.V. added $110,000 to general and administrative expenses in fiscal 2003.
As noted above, Mr. Jerry Zucker filed suit against the Company on July 17, 2003 challenging certain aspects of the Company’s Shareholder Rights Plan (“the Plan”). In his suit, Mr. Zucker sought to have certain provisions of the Plan held unenforceable and an injunction precluding the Company from interpreting the Plan to restrict certain actions that he might take in the future. Both a committee of independent directors and the full board of directors had previously concluded that the Plan was in the best interests of the Company and its shareholders. The Plan was designed to help ensure that the Company’s shareholders receive fair treatment in the event of an unsolicited attempt to gain control of the Company and to discourage certain coercive takeover tactics. The Plan was not designed to deter a proxy contest or fair offer for the whole Company. In November 2003, Mr. Zucker and the Company reached a settlement agreement whereby Mr. Zucker agreed to dismiss his lawsuit without prejudice in exchange for the Company’s agreement to delete certain language in the definition of “Person” contained in the shareholder rights agreement. The Company believes removal of the language clarifies the scope of the definition of “Person” but will not significantly change the protections afforded the Company and its shareholders by the shareholder rights agreement.
NON-OPERATING INCOME AND DIVIDENDS
Investment income decreased by 15% to $84,000 in fiscal 2003 compared with $100,000 in fiscal 2002. The decrease was the result of lower interest rates on the Company’s floating rate debt securities and lower average level of investments during fiscal 2003. Royalty income decreased 1% to $598,000 in fiscal 2003 compared with $607,000 in fiscal 2002 as a result of lower sales volume of a shielded syringe product licensed to Becton Dickinson and Company (BD).
Other income for 2003 includes a $11,000 loss on the retirement of certain equipment. Other income for fiscal 2002 included a one-time pretax gain of $84,000 ($55,000 or 2 cents a share after taxes) as a result of common stock received through the demutualization of Prudential Insurance Company.
During fiscal 2003, the Company paid dividends of $356,000, or 25% of net income, for the year. This amount represented four quarterly dividends of $0.035 per share.
LIQUIDITY AND CAPITAL RESOURCES
The Company generated cash from operations of approximately $2.8 million during fiscal 2004, representing an increase of $1.7 million (145%) compared with cash flow of $1.1 million in fiscal 2003. The increase in cash flow resulted primarily from higher net income in 2004 and smaller increases in accounts receivable and inventory levels compared with the previous year.
Working capital increased by $809,000, or 7%, to $11.6 million during fiscal 2004. The higher level of working capital was the result of increases in accounts receivable, marketable securities and prepaid expenses. The Company's current ratio decreased to 3.4 at October 2, 2004 from 3.6 at fiscal year end 2003.
Accounts receivable, net of allowances, increased 8% to $6.4 million at the end of fiscal 2004 compared with $5.9 million at the end of fiscal 2003. The majority of the increase resulted from higher consumer products sales particularly near the end of fiscal 2004 compared with the same period in fiscal 2003. In spite of the increase in accounts receivable, the days sales outstanding, calculated using a monthly average for accounts receivable over the entire year, improved to 43 days in 2004 compared with 45 days in 2003. All of the Company's accounts receivable are unsecured.
Inventory, net of reserves, increased 7% to $2.7 million at October 2, 2004 compared with $2.5 million at September 27, 2003. Inventory turns for fiscal 2004 improved to 14.2 times from 13.5 times in fiscal 2003. Management expects inventory levels in fiscal 2005 to be higher than those of fiscal 2004 due to an anticipated increase in Secure I.V. inventory.
13
Net property and equipment increased by 28% during fiscal 2004. The change resulted primarily from the combination of regular depreciation expense and equipment purchases of $2.0 million predominately in the Secure I.V. segment. We expect capital expenditures in fiscal 2005 to be greater than fiscal 2004 primarily because of the planned expansion of the Company’s Greenville S.C. manufacturing plant at an estimated cost of approximately $2.6 million. The expansion will add 60,000 square feet of manufacturing and storage space to the Company’s existing 120,000 square foot facility. It is expected to be completed by September 2005 at which time the Company will discontinue its lease of 22,000 square feet of off site warehouse space.
From time to time, the Company purchases forward contracts for foreign currency to lock in exchange rates for future payments on manufacturing equipment ordered by the Company. The foreign exchange contracts are used to eliminate foreign currency fluctuations during the six to nine month period between the date the order is placed and the date of final payment. Realized gains and losses, if any, are included in the cost of the related equipment. Unrealized gains and losses on open contracts are not material to the Company’s results of operations or financial condition. The Company held no forward contracts as of October 2, 2004.
The Company’s trade accounts payable increased 4% in fiscal 2004 to $2.6 million. The increase in payables was the result of normal monthly fluctuations. Accrued and sundry liabilities increased by 29% during the year to $2.2 million compared with $1.7 million last year. The increase was due to higher accruals for incentive compensation, income taxes, and warranty reserve.
In December 2004, the Company declared a special cash dividend of $0.40 per share payable on January 12, 2005 to shareholders of record on December 22, 2004.
Management believes that funds on hand and funds generated from operations are adequate to finance operations and expected capital requirements during fiscal 2005.
OFF-BALANCE-SHEET ARRANGEMENTS
The Company has no off-balance-sheet arrangements.
|
CONTRACTUAL OBLIGATIONS
The following table summarizes the Company’s significant contractual obligations and commercial commitments at October 2, 2004 and the future periods in which such obligations are expected to be settled in cash. For additional information regarding these obligations see the referenced footnotes to audited financial statements on pages 25 and 30.
| | | | | | | Less | | | | | | | | | More |
| Contractual Obligations | | | | | | than 1 | | | 1-3 | | | 3-5 | | | than 5 |
| (in thousands of dollars) | | | Total | | | year | | | years | | | years | | | years |
|
| Operating leases - Note 18 | | $ | 623 | | $ | 315 | | $ | 308 | | | | | | |
| Purchase obligations - Notes 19 and 20 | | | 3,214 | | | 3,214 | | | | | | | | | |
| Safety catheter inventory - Note 20 | | | 436 | | | 436 | | | | | | | | | |
| Special dividend - Note 20 | | | 1,038 | | | 1,038 | | | | | | | | | |
| Deferred compensation - Note 10 | | | 1,013 | | | 114 | | | 227 | | $ | 227 | | $ | 445 |
| |
|
| Total contractual obligations | | $ | 6,324 | | $ | 5,117 | | $ | 535 | | $ | 227 | | $ | 445 |
| |
|
IMPACT OF INFLATION AND COST OF RAW MATERIALS
Higher inflation rates could impact the Company through higher raw material and labor costs. The Company's profit margin could be adversely affected to the extent that we are unable to pass cost increases along to our customers due to competitive conditions. Management considers it likely that foam raw material costs will increase during fiscal 2005. We will attempt to recover cost increases by sales prices increases and expense reductions. However, there can be no assurance that we will be able to offset expected raw material cost increases.
14
MARKET RISK
The Company is exposed to market risk in two areas: short-term investments and cash value of life insurance. As of October 2, 2004, the Company had short-term investments of $4.7 million which were classified as available for sale. These short-term investments consist primarily of high quality and highly liquid corporate commercial paper and bonds known as “variable rate demand notes” or “low floaters.” The bonds are issued by municipalities or companies and are backed by letters of credit from federally insured banks. The bonds carry the credit rating of the underlying bank and are therefore highly rated. The interest rate on the bonds is a floating rate which is reset weekly by the re-marketing agent based on market rates for comparable securities. The bonds can be liquidated by the Company at any time with seven days notice. Using the level of securities available for sale at fiscal year end 2004, a 100 basis point increase or decrease in interest rates for one year would increase or decrease after-tax earnings by approximately $47,000.
In addition, the Company’s other assets at October 2, 2004 include $1.6 million in cash value of life insurance, which is subject to market risk related to equity pricing and interest rate changes. The cash value is generated from life insurance policies which are being used as the funding vehicle for a retirement program for the Company’s founder and former chairman. The cash value is invested in a combination of fixed income life insurance contracts and a portfolio of mutual funds managed by an insurance company. The fixed income contracts are similar to fixed income bond funds and are therefore subject to interest rate and company risk. The mutual fund portfolios invest in common stocks and bonds in accordance with their individual investment objectives. These portfolios are exposed to stock market and interest rate risk similar to comparable mutual funds. Management believes that substantial fluctuations in equity markets and interest rates and the resulting changes in cash value of life insurance would not have a material adverse effect on the financial position of the Company. During the fiscal year ended October 2, 2004, the Company’s cash value of life insurance increased by 8.3%, creating income of approximately $112,000.
CRITICAL ACCOUNTING POLICIES
This discussion and analysis of financial condition and results of operations is based on our financial statements which we prepare in conformity with accounting principles generally accepted in the United States of America. The preparation of our financial statements requires us to make estimates and assumptions that affect the reported amounts of assets, liabilities, revenues and expenses. These estimates and assumptions are based on historical experience and on various other factors that we believe are reasonable under the circumstances, the results of which form the basis for making judgments about the carrying values of assets and liabilities that are not readily apparent from other sources. These estimates and assumptions also require the application of certain accounting policies, many of which require us to make estimates and assumptions about future events and their impact on amounts reported in our financial statements and related notes. We periodically review our accounting policies and estimates and make adjustments when facts and circumstances dictate.
Actual results may differ from these estimates under different assumptions or conditions. Any differences may have a material impact on our financial condition and results of operations.
In addition to the accounting policies which are more fully described in the Notes to the Financial Statements included in this report, we have identified the following critical accounting policies used in the preparation of our financial statements.
Allowance for Doubtful Accounts
Credit evaluations are undertaken to set credit limits for all customers. On a quarterly basis, we evaluate past due items in the accounts receivable listing and provide what we estimate to be adequate reserves for doubtful accounts. Customer economic conditions may change and increase the risk of collectibility and may require additional provisions which would negatively impact our operating results. As of October 2, 2004, our provision for doubtful accounts represented approximately 5% of total accounts receivable, or $323,000.
Inventories
We regularly review inventory quantities on hand and adjust for excess and obsolete inventory based primarily on historical usage rates and our estimated forecast of product demand and production. Actual demand may differ from our estimate, in which case we may have understated or overstated the provision required for obsolete and excess inventory, which would have an impact on our operating results. As of October 2, 2004, our provision for excess and obsolete inventory represented approximately 3.4% of total inventories, or $95,000.
15
The Company had no inventory of the Secure I.V. product line at fiscal year end 2004. However, we expect to begin carrying Secure I.V. inventory in fiscal year 2005 with initial raw material purchases of approximately $436,000. Since we have limited sales and production history for this new product line, our future estimates for Secure I.V. inventory reserves could be more volatile than those in our medical and custom products segments.
Warranty Obligations
We warrant certain of our products for a specific period of time against manufacturing or performance defects. We provide for the estimated future cost of warranty obligations in cost of goods sold when the related revenue is recognized. The accrued warranty cost represents our best estimate at the time of sale of the total cost that we will incur to repair or replace covered products or parts. The amount of accrued estimated warranty cost is primarily based on historical experience as well as current information on repair costs. Actual warranty cost could differ from the estimated amounts. On a quarterly basis, we review the accrued balances and update the historical warranty cost trends. If we were required to accrue additional warranty cost in the future, it would negatively affect operating results. Our actual warranty expense was $157,000 in fiscal 2004 and $131,000 in fiscal 2003. See Notes 7 and 8 in the Notes to Financial Statements for more information on product warranties.
Impairment of Goodwill
As required by SFAS No. 142, we evaluate goodwill in our medical business unit for impairment at least annually or sooner if events occur or circumstances change that could reduce the fair value of our medical business unit. For fiscal year end 2004, we determined that the fair value of the medical business unit exceeded its carrying value and thus no impairment charge was required. In assessing the value of goodwill, we must make assumptions regarding estimated future cash flows and other factors to determine the fair value of the medical business unit. If these estimates or their related assumptions change in the future, we may be required to record impairment charges which would negatively impact operating results. As of October 2, 2004, the carrying value of goodwill was $1.9 million.
Impairment of Long-Lived Assets
As required by SFAS No. 144 we evaluate long-lived assets for potential impairment whenever events occur or circumstances indicate that the carrying amount of the assets may not be recoverable. The carrying amount of a long-lived asset is not recoverable if it exceeds the sum of the undiscounted cash flows expected to result from the use and eventual disposition of the asset. If the carrying amount of a long-lived asset is not recoverable and is greater than its fair value, the asset is impaired and an impairment loss must be recognized. To date the Company has had no indicators of impairment for long-lived assets. However, the Company’s investment in the safety catheter business unit raises the likelihood of a future impairment loss because the new business unit has little sales and production history and is still in a development phase. Management does not currently expect this segment to suffer impairment in the foreseeable future; however, there can be no assurance to this effect. If the assets associated with the safety catheter segment became impaired, the impairment loss could be up to $3.0 million as measured by the total assets of the safety catheter segment as of October 2, 2004. (See Note 17 in the Notes to Financial Statements.) If such an event occurred, the Company’s assets and operating income could be reduced by up to $3.0 million, and net income after taxes could be reduced by up to $1.9 million. The actual amount of any future impairment loss could be more or less, depending on the level of assets and the degree of impairment at the time the Company determines an impairment charge is necessary.
Present Value of Deferred Compensation
The Company is obligated to make fixed payments under a retirement agreement over the remaining life of its founder as discussed in Note 10 “Deferred Compensation” in the Notes to Financial Statements. The Company has fully accrued the present value of the expected payments due over the executive’s estimated life expectancy. In calculating this present value the Company estimated an effective long term interest rate of 8%. If actual long term interest rates declined significantly and we were required to accrue additional deferred compensation costs in the future, it would negatively affect operating results. As of October 2, 2004, the Company has recorded a deferred compensation liability of $1.0 million, including current and deferred portions. If the Company reduced the discount rate by 1%, the deferred compensation liability would be increased by $69,000 and pre-tax income would be reduced by the same amount.
16
Statements of Income
| | | Years Ended |
| | |
|
| | | October 2, | | September 27, | | September 28, |
| | | 2004 | | 2003 | | 2002 |
|
| | | | | | | | | | | | |
| Net sales | | $ | 49,929,129 | | | $ | 41,574,603 | | | $ | 33,535,640 |
| Cost of goods sold | | | 37,238,586 | | | | 30,440,681 | | | | 23,360,403 |
| |
|
| Gross profit | | | 12,690,543 | | | | 11,133,922 | | | | 10,175,237 |
| |
| Selling and marketing expenses | | | 6,924,720 | | | | 6,455,468 | | | | 5,895,730 |
| Research and development expenses | | | 686,413 | | | | 556,421 | | | | 346,140 |
| General and administrative expenses | | | 2,771,205 | | | | 2,682,221 | | | | 2,216,275 |
| |
|
| | | | 10,382,338 | | | | 9,694,110 | | | | 8,458,145 |
| |
| Operating income | | | 2,308,205 | | | | 1,439,812 | | | | 1,717,092 |
| |
| Non-operating income (expense): | | | | | | | | | | | | | | | |
| Investment income | | | 101,958 | | | | 84,046 | | | | 99,489 |
| Royalty income | | | 545,072 | | | | 597,687 | | | | 606,846 |
| Other | | | (8,326 | ) | | | (7,751 | ) | | | 89,305 |
| |
|
| | | | 638,704 | | | | 673,982 | | | | 795,640 |
| |
| Income before income taxes | | | 2,946,909 | | | | 2,113,794 | | | | 2,512,732 |
| Provision for income taxes (Note 12) | | | 962,000 | | | | 715,000 | | | | 855,000 |
| |
|
| Net income | | $ | 1,984,909 | | | $ | 1,398,794 | | | $ | 1,657,732 |
| |
|
| |
| |
| Earnings per share of common stock (Note 13) | | | | | | | | | | | | | | | |
| Net income: | | | | | | | | | | | | | | | |
| Basic | | $ | 0.77 | | | $ | 0.55 | | | $ | 0.66 |
| Diluted | | $ | 0.73 | | | $ | 0.53 | | | $ | 0.64 |
| |
| Dividends per share of common stock | | $ | 0.145 | | | $ | 0.14 | | | $ | 0.12 |
| |
| Weighted average shares outstanding: | | | | | | | | | | | | | |
| Basic | | | 2,579,451 | | | | 2,544,882 | | | | 2,527,416 |
| Diluted | | | 2,731,873 | | | | 2,659,699 | | | | 2,600,604 |
See accompanying notes.
17
Balance Sheets
| | | October 2, | | September 27, |
| | | 2004 | | 2003 |
|
ASSETS | | | | | | |
| Current assets: | | | | | | |
| Cash and cash equivalents | | $ | 1,707,598 | | $ | 1,811,332 |
| Securities available for sale (Note 2) | | | 4,673,528 | | | 4,143,758 |
| Accounts receivable, net of allowances of $323,000 | | | | | | |
| (2004) and $340,000 (2003) | | | 6,432,086 | | | 5,941,774 |
| Inventories (Note 3) | | | 2,717,573 | | | 2,539,325 |
| Prepaid expenses and deferred income taxes | | | 912,404 | | | 592,997 |
| |
|
| Total current assets | | | 16,443,189 | | | 15,029,186 |
| |
| Property and equipment, net (Note 4) | | | 6,184,786 | | | 4,817,450 |
| Goodwill, net of accumulated amortization of | | | | | | |
| $1,027,765 (2004 and 2003) (Note 5) | | | 1,924,131 | | | 1,924,131 |
| Other assets (Note 5 and 6) | | | 2,362,819 | | | 2,219,890 |
| |
|
| | | $ | 26,914,925 | | $ | 23,990,657 |
| |
|
| |
| LIABILITIES AND SHAREHOLDERS' EQUITY | | | | | | |
| Current liabilities: | | | | | | |
| Accounts payable | | $ | 2,570,352 | | $ | 2,467,524 |
| Accrued and sundry liabilities (Note 7) | | | 2,249,898 | | | 1,747,385 |
| |
|
| Total current liabilities | | | 4,820,250 | | | 4,214,909 |
| |
| Deferred income taxes (Note 12) | | | 776,000 | | | 321,000 |
| Deferred compensation (Note 10) | | | 899,283 | | | 929,407 |
| |
| Commitments and contingencies (Note 19) | | | | | | |
| |
| Shareholders' equity (Notes 11 and 13) | | | | | | |
Common stock, no par value, 20,000,000 shares authorized; issued | | | | | | |
and outstanding shares 2,592,218 (2004) and 2,552,154 (2003) | | | 557,856 | | | 283,981 |
| Additional paid-in capital | | | 19,297 | | | 10,035 |
| Retained earnings | | | 19,842,239 | | | 18,231,325 |
| |
|
| Total shareholders' equity | | | 20,419,392 | | | 18,525,341 |
| |
|
| | | $ | 26,914,925 | | $ | 23,990,657 |
| |
|
See accompanying notes.
18
Statements of Cash Flows
| | | Years Ended |
| | |
|
| | | October 2, | | September 27, | | September 28, |
| | | 2004 | | 2003 | | 2002 |
|
| | | | | | | | | | | | | |
| OPERATING ACTIVITIES: | | | | | | | | | | | | |
| Net income | | $ | 1,984,909 | | | $ | 1,398,794 | | | $ | 1,657,732 | |
| Adjustments to reconcile net income to net | | | | | | | | | | | | |
| cash provided by operating activities: | | | | | | | | | | | | |
| Depreciation | | | 618,559 | | | | 449,844 | | | | 411,898 | |
| Amortization | | | 98,449 | | | | 77,203 | | | | 75,568 | |
| Income from insurance demutualization | | | – | | | | – | | | | (83,636 | ) |
| Provision (recovery) for losses on accounts receivable | | | (6,830 | ) | | | 86,884 | | | | 62,293 | |
| Provision for deferred income taxes | | | 385,262 | | | | 107,508 | | | | 62,819 | |
| Loss on sale and disposal of property and equipment | | | 11,596 | | | | 10,864 | | | | – | |
| (Increase) decrease in cash value of life insurance | | | (121,464 | ) | | | (126,809 | ) | | | 48,648 | |
| Deferred compensation | | | (30,124 | ) | | | (27,892 | ) | | | (25,826 | ) |
| Changes in operating assets and liabilities: | | | | | | | | | | | | |
| Accounts receivable | | | (486,888 | ) | | | (1,076,820 | ) | | | (994,304 | ) |
| Inventory | | | (178,248 | ) | | | (580,937 | ) | | | 144,774 | |
| Prepaid expenses and other assets | | | (80,334 | ) | | | (123,123 | ) | | | (48,285 | ) |
| Accounts payable and accrued expenses | | | 616,651 | | | | 951,487 | | | | 174,515 | |
| |
|
| Net cash provided by operating activities | | | 2,811,538 | | | | 1,147,003 | | | | 1,486,196 | |
| |
| INVESTING ACTIVITIES: | | | | | | | | | | | | |
| Purchase of Secure I.V. assets | | | – | | | | – | | | | (339,524 | ) |
| Purchases of marketable securities | | | (1,800,000 | ) | | | – | | | | (2,400,000 | ) |
| Proceeds from sales of marketable securities | | | 1,273,636 | | | | 1,705,000 | | | | 2,100,000 | |
| Purchases of property and equipment | | | (1,997,491 | ) | | | (1,647,291 | ) | | | (558,516 | ) |
| Proceeds from sale of property and equipment | | | – | | | | 1,000 | | | | – | |
| Payments for other assets | | | (165,237 | ) | | | (147,586 | ) | | | (20,870 | ) |
| |
|
| Net cash used for investing activities | | | (2,689,092 | ) | | | (88,877 | ) | | | (1,218,910 | ) |
| |
| FINANCING ACTIVITIES: | | | | | | | | | | | | |
| Dividends paid | | | (373,995 | ) | | | (356,268 | ) | | | (303,393 | ) |
| Common stock issued upon exercise of options | | | 147,815 | | | | 14,175 | | | | 57,015 | |
| |
|
| Net cash used for financing activities | | | (226,180 | ) | | | (342,093 | ) | | | (246,378 | ) |
| |
|
| |
| (Decrease) Increase in cash and cash equivalents | | | (103,734 | ) | | | 716,033 | | | | 20,908 | |
| Cash and cash equivalents at beginning of year | | | 1,811,332 | | | | 1,095,299 | | | | 1,074,391 | |
| |
|
| Cash and cash equivalents at end of year | | $ | 1,707,598 | | | $ | 1,811,332 | | | $ | 1,095,299 | |
| |
|
See accompanying notes.
19
Statements of Shareholders' Equity
| | | Common Stock | | | Additional | | | | | | | | |
| |
| | | Paid-in | | | Retained | | | | | |
| | | Shares | | | Amount | | | Capital | | | Earnings | | | | Total | |
|
| Balance at September 29, 2001 | | 2,517,400 | | $ | 91,725 | | $ | 1,708 | | $ | 15,834,460 | | | $ | 15,927,893 | |
| |
|
| |
| Net income for the 2002 fiscal year | | | | | | | | | | | 1,657,732 | | | | 1,657,732 | |
| Common stock issued to Directors | | 8,000 | | | 47,600 | | | | | | | | | | 47,600 | |
| Common stock issued on | | | | | | | | | | | | | | | | |
| exercise of stock options | | 13,470 | | | 57,015 | | | | | | | | | | 57,015 | |
| Tax benefits for stock options exercised | | | | | | | | 6,819 | | | | | | | 6,819 | |
| Cash dividends paid or declared | | | | | | | | | | | | | | | | |
| ($0.12 per share) | | | | | | | | | | | (303,393 | ) | | | (303,393 | ) |
| |
|
| Balance at September 28, 2002 | | 2,538,870 | | | 196,340 | | | 8,527 | | | 17,188,799 | | | | 17,393,666 | |
| |
|
| |
| Net income for the 2003 fiscal year | | | | | | | | | | | 1,398,794 | | | | 1,398,794 | |
| Common stock issued to Directors | | 8,000 | | | 64,000 | | | | | | | | | | 64,000 | |
| Common stock issued on | | | | | | | | | | | | | | | | |
| exercise of stock options | | 5,284 | | | 23,641 | | | | | | | | | | 23,641 | |
| Tax benefits for stock options exercised | | | | | | | | 1,508 | | | | | | | 1,508 | |
| Cash dividends paid or declared | | | | | | | | | | | | | | | | |
| ($0.14 per share) | | | | | | | | | | | (356,268 | ) | | | (356,268 | ) |
| |
|
| Balance at September 27, 2003 | | 2,552,154 | | | 283,981 | | | 10,035 | | | 18,231,325 | | | | 18,525,341 | |
| |
|
| |
| Net income for the 2004 fiscal year | | | | | | | | | | | 1,984,909 | | | | 1,984,909 | |
| Common stock issued to Directors | | 8,500 | | | 114,750 | | | | | | | | | | 114,750 | |
| Common stock issued on | | | | | | | | | | | | | | | | |
| exercise of stock options | | 31,564 | | | 159,125 | | | | | | | | | | 159,125 | |
| Tax benefits for stock options exercised | | | | | | | | 9,262 | | | | | | | 9,262 | |
| Cash dividends paid or declared | | | | | | | | | | | | | | | | |
| ($0.145 per share) | | | | | | | | | | | (373,995 | ) | | | (373,995 | ) |
| |
|
| Balance at October 2, 2004 | | 2,592,218 | | $ | 557,856 | | $ | 19,297 | | $ | 19,842,239 | | | $ | 20,419,392 | |
| |
|
See accompanying notes.20
NOTES TO FINANCIAL STATEMENTS
October 2, 2004
|
1. SIGNIFICANT ACCOUNTING POLICIES
|
DESCRIPTION OF BUSINESS
The Company manufactures and distributes replacement mattresses, mattress overlays, patient positioners, seating cushions, and skin care products for the medical market and pillows, mattress pads and various foam products for the custom products market throughout the United States and Canada. The Company is also in the process of developing and introducing a short peripheral intravenous catheter to the health care market in North America. The catheter product line was acquired in early development stage in 2002.
CASH AND CASH EQUIVALENTS
The Company considers all cash equivalents to be highly liquid investments with a maturity when purchased of three months or less. Depending on market conditions, the Company may maintain a centralized cash management program whereby its excess cash balances are invested in commercial paper and are considered cash equivalents. Cash balances in the Company’s accounts usually exceed federally insured limits.
ACCOUNTS RECEIVABLE
The Company provides credit in the normal course of business and performs ongoing credit evaluations on certain of its customers, but generally does not require collateral to support such receivables. The Company also establishes an allowance for doubtful accounts based upon factors surrounding the credit risk of specific customers, historical trends and other information.
INVENTORIES
Inventories are valued at the lower of cost (first-in, first-out method) or market.
PROPERTY AND EQUIPMENT
Property and equipment is stated at cost. Maintenance, repairs, and minor replacements that do not improve or extend the useful lives of assets are expensed when incurred. Depreciation is computed using the straight-line method. Estimated useful lives for buildings and land improvements range from 15 to 35 years. The estimated useful lives of all other property and equipment range from 3 years to 15 years. For income tax purposes, substantially all depreciation is computed using accelerated methods.
Construction in progress is stated at cost, which includes the cost of construction and other direct costs attributable to the construction. No provision for depreciation is made on construction in progress until such time as the relevant assets are completed and put into use. Construction in progress represents a roof replacement in process at October 2, 2004 and machinery under assembly and installation at September 27, 2003. (See Note 4.)
INTANGIBLES
Intangible assets are amortized using the straight-line method. Costs of patents are amortized over periods ranging from 10 to 17 years, and trademarks are amortized over periods of 5 or 10 years. Goodwill, costs in excess of the fair value of net assets, acquired from two separate acquisitions, is accounted for under Statement of Financial Accounting Standards (SFAS) No. 142, "Goodwill and Other Intangible Assets." See Note 5. Accumulated amortization of intangible assets at October 2, 2004 and September 27, 2003 was approximately $2,291,000 and $2,192,000, respectively. The Company reviews annually the recoverability of the carrying value of these assets in accordance with SFAS No. 142 and SFAS No. 144 “Accounting for the Impairment of Long-Lived Assets and for Long-Lived Assets to be Disposed Of." The Company also reviews long-lived assets and the related intangible assets for impairment whenever events or changes in circumstances indicate the carrying amount of such assets may not be recoverable.
REVENUE RECOGNITION
Revenue is recognized by the Company when goods are shipped and title passes to the customer. There are no customer acceptance provisions, and the right to return exists only in cases of damaged product, non-compliance with customer specifications or warranty claims.
21
1. SIGNIFICANT ACCOUNTING POLICIES (continued)
The Company has applied the accounting and disclosure requirements of Securities and Exchange Commission Staff Accounting Bulletin (SAB) No. 101.
ADVERTISING COSTS
Advertising costs are expensed as incurred.
|
SHIPPING AND HANDLING COSTS
Shipping and handling costs that are not reimbursed by customers are charged to selling and marketing expenses and were approximately $1,439,000 in 2004, $1,374,000 in 2003 and $1,355,000 in 2002.
FAIR VALUE OF FINANCIAL INSTRUMENTS
The carrying amounts reported in the balance sheet for cash and cash equivalents, securities available for sale, accounts receivable, cash value of life insurance, accounts payable, and debt approximate their fair values. The fair values of the Company’s securities available for sale are based on quoted market prices when available, or quoted market prices of financial instruments with similar characteristics.
EARNINGS PER SHARE OF COMMON SHARE
Earnings per share of common stock are computed based on the weighted average number of shares outstanding during each period in accordance with SFAS No. 128, “Earnings Per Share.” (See Note 13).
STOCK-BASED COMPENSATION
The Company accounts for stock options under Accounting Principles Board Opinion 25, “Accounting for Stock Issued to Employees.” Accordingly, no compensation expense has been charged to operations. Had compensation expense for the plans been determined based on the fair value at the grant dates for awards under the plans consistent with the accounting method available under SFAS No. 123 “Accounting for Stock Based Compensation,” the Company's net income and net income per common share would have been reduced to the proforma amounts indicated below:
| | | 2004 | | 2003 | | 2002 |
| |
|
| Net income | | | | | | | | | |
| As reported | | $ | 1,984,909 | | $ | 1,398,794 | | $ | 1,657,732 |
| Stock option expense, net of taxes | | | 156,594 | | | 144,391 | | | 87,840 |
| |
|
| Pro forma | | $ | 1,828,315 | | $ | 1,254,403 | | $ | 1,569,892 |
| |
|
| |
| Basic net income per common share | | | | | | | | | |
| As reported | | $ | 0.77 | | $ | 0.55 | | $ | 0.66 |
| Stock option expense, net of taxes | | | 0.06 | | | 0.06 | | | 0.04 |
| |
|
| Pro forma | | $ | 0.71 | | $ | 0.49 | | $ | 0.62 |
| |
|
| |
| Diluted net income per common share | | | | | | | | | |
| As reported | | $ | 0.73 | | $ | 0.53 | | $ | 0.64 |
| Stock option expense, net of taxes | | | 0.06 | | | 0.06 | | | 0.04 |
| |
|
| Pro forma | | $ | 0.67 | | $ | 0.47 | | $ | 0.60 |
| |
|
The fair value of each option grant is estimated on the date of grant using the Black-Scholes option pricing model with the following weighted average assumptions for grants made in 2004, 2003, and 2002, respectively: risk-free interest rates of 4.14%, 3.26%, and 3.45%; dividend yields of 1.1%, 1.6%, and 1.7%; volatility factors of the expected market price of the Company's common stock of 38.9%, 38.4%, and 40.7%; and a weighted average expected life of the option of eight years for all three periods.
FISCAL YEAR
The Company’s fiscal year ends on the Saturday nearest to September 30. The 2004 year was a 53-week year while 2003 and 2002 fiscal years were 52-week years. Fiscal year 2005 will be a 52-week year.
22
INCOME TAXES
In accordance with SFAS No. 109, "Accounting for Income Taxes," the liability method is used in accounting for income taxes. Under this method, deferred tax assets and liabilities are determined based on differences between financial reporting and tax bases of assets and liabilities and are measured using the enacted tax rates and laws that will be in effect when the differences are expected to reverse.
USE OF ESTIMATES
The preparation of financial statements in conformity with accounting principles generally accepted in the United States of America requires management to make estimates and assumptions that affect the amounts reported in the financial statements and accompanying notes. Although these estimates are based on management’s knowledge of current events and actions planned for the future, the estimates may ultimately differ from actual results.
RECENTLY ISSUED ACCOUNTING STANDARDS
In March 2004, the FASB issued an exposure draft on “Share-Based Payment”. The proposed statement addresses the accounting for transactions in which an enterprise receives employee services in exchange for stock options. The proposed statement would eliminate the ability to account for share-based compensation transactions using APB No. 25, “Accounting for Stock Issued to Employees”, and generally would require instead that such transactions be accounted for using a fair-value-based method. This statement would be effective for stock options issued after October 1, 2005. Retrospective application of the statement is not permitted. The adoption of this statement, if approved, could have an impact on the Company’s financial position or results of operations. See Stock-Based Compensation above.
Other accounting standards that have been issued or proposed by FASB or other standards-setting bodies that do not require adoption until a future date are not expected to have a material impact on the consolidated financial statements upon adoption.
2. SECURITIES AVAILABLE FOR SALE
Securities available for sale are carried at aggregate cost which approximates market. The Company had no unrealized holding gains or losses during fiscal years 2004, 2003 or 2002.
Securities available for sale at October 2, 2004 and September 27, 2003 consist of variable rate demand notes.
3. INVENTORIES
| | | 2004 | | 2003 |
|
| Raw materials | | $ | 1,900,433 | | $ | 1,763,001 |
| Finished goods | | | 817,140 | | | 776,324 |
| |
|
| | | $ | 2,717,573 | | $ | 2,539,325 |
| |
|
4. PROPERTY AND EQUIPMENT
| | | 2004 | | 2003 |
|
| Land | | $ | 317,343 | | $ | 317,343 |
| Land improvements | | | 246,172 | | | 246,172 |
| Buildings | | | 4,041,391 | | | 4,036,473 |
| Construction in progress | | | 130,000 | | | 1,030,932 |
| Machinery and equipment | | | 8,647,093 | | | 6,311,639 |
| Furniture and fixtures | | | 433,128 | | | 538,045 |
| Automobiles | | | 9,520 | | | 9,520 |
| Leasehold improvements | | | 12,330 | | | 11,345 |
| |
|
| | | | 13,836,977 | | | 12,501,469 |
| Less accumulated depreciation | | | 7,652,191 | | | 7,684,019 |
| |
|
| | | $ | 6,184,786 | | $ | 4,817,450 |
| |
|
23
5. GOODWILL AND OTHER INTANGIBLES
|
As of October 2, 2004, the Company had goodwill (net of accumulated amortization) of $1,924,131 and patents and trademarks (net of accumulated amortization) of $706,232. All goodwill is part of the medical segment. Patents and trademarks are part of the medical and safety catheter segments. The Company has re-assessed the useful lives of goodwill and patents and trademarks. Goodwill was determined to have an indefinite useful life. Amortization of goodwill ceased on September 29, 2001 as a result of the Company’s adoption of SFAS No. 142 at the beginning of fiscal year 2002. The useful lives of individual patents and trademarks were reviewed and no material changes were required. No impairment losses were recorded on the Company's intangible assets as a result of the adoption of SFAS No. 142 based on the goodwill impairment test.
Amortization expense for patents and trademarks during fiscal years 2004, 2003, and 2002 was $98,449, $77,203 and $75,568, respectively. Estimated amortization expense for the next five fiscal years is as follows:
| | | Estimated |
| | | amortization |
| Fiscal years | | expense |
|
| 2005 | $ | 104,000 |
| 2006 | | 82,000 |
| 2007 | | 70,000 |
| 2008 | | 67,000 |
| 2009 | | 65,000 |
6. OTHER ASSETS
| | | 2004 | | 2003 |
|
| Patents, net of accumulated amortization | | | | | | |
| of $1,262,781(2004) and $1,164,332 (2003) | | $ | 706,232 | | $ | 639,445 |
| Cash value of life insurance policies | | | 1,578,469 | | | 1,457,005 |
| Other | | | 78,118 | | | 123,440 |
| |
|
| | | $ | 2,362,819 | | $ | 2,219,890 |
| |
|
7. ACCRUED AND SUNDRY LIABILITIES
| | | 2004 | | 2003 |
|
| Salaries and other compensation | | $ | 1,343,908 | | $ | 1,073,562 |
| Federal and state income taxes | | | 123,952 | | | 30,000 |
| Payroll taxes accrued and withheld | | | 128,926 | | | 175,789 |
| Property taxes | | | 129,054 | | | 117,900 |
| Medical insurance | | | 155,462 | | | 136,200 |
| Warranty reserve | | | 212,564 | | | 141,723 |
| Customer deposits | | | 119,326 | | | 35,551 |
| Other | | | 36,706 | | | 36,660 |
| |
|
| | | $ | 2,249,898 | | $ | 1,747,385 |
| |
|
8. PRODUCT WARRANTIES
The Company offers warranties of various lengths to its customers depending on the specific product sold. The Company's warranties require it to repair or replace non-performing products during the warranty period at no cost to the customer. At the time revenue is recognized for covered products, the Company records a liability for estimated costs that may be incurred under its warranties. The costs are estimated based on historical experience and any recent warranty trends that have been identified. (Although historical warranty costs have been within expectations, there can be no assurance that future warranty costs will not exceed historical amounts.) The Company periodically assesses the adequacy of its recorded liability and adjusts the balance as necessary.
24
Changes in the Company's product warranty liability for the years ended October 2, 2004 and September 27, 2003 are as follows:
| | | 2004 | | 2003 |
|
| Accrued warranty liability at beginning of year | | $ | 141,723 | | | $ | 138,107 | |
| Increases in reserve | | | 228,241 | | | | 134,416 | |
| Expenses | | | (157,400 | ) | | | (130,800 | ) |
| |
|
| Accrued warranty liability at end of year | | $ | 212,564 | | | $ | 141,723 | |
| |
|
9. BORROWINGS
The Company paid no interest expense during fiscal years 2004, 2003, or 2002.
10. DEFERRED COMPENSATION
The Company is obligated to make fixed payments of approximately $114,000 per year under a retirement agreement to its founder and former chief executive officer over his remaining life. The Company has fully accrued the present value of the expected payments due over the executive’s estimated life expectancy. The Company recognized expenses of approximately $83,000 in 2004, $86,000 in 2003, and $88,000 in 2002, related to this agreement. An 8% discount rate was used in measuring the present value of the Company's deferred compensation obligation.
In March 1997, the Board adopted the 1997 Stock Option Plan ("1997 Plan"). The 1997 Plan authorized the Board to grant options to key officers and employees of the Company for up to 200,000 shares of the Company's common stock. Options granted under the 1997 Plan are generally granted at the fair market value on the date of grant. These options become exercisable and vested at the greater of 1,000 shares per year or 20% of the grant. Vested options expire 10 years from the date of grant for continuing employees, or three months after termination for employees who leave the Company.
In November 1991, the Board adopted the 1991 Stock Option Plan ("1991 Plan"). The 1991 Plan authorized the Board to grant options of up to 200,000 shares of the Company's common stock to officers and key employees and 50,000 shares to directors who are neither officers nor employees of the Company. All other terms and conditions of the 1991 Plan are similar to the 1997 Plan. The 1991 Plan was terminated on November 7, 2001. The termination does not affect options outstanding under the plan, but no further options can be granted under the 1991 Plan.
In March 1987, the Board of Directors adopted the 1987 Stock Option Plan (“1987 Plan”). The 1987 Plan authorized the Board to grant options of up to 200,000 shares of the Company's common stock to officers and key employees of the Company. All other terms and conditions of the 1987 Plan are similar to the 1997 Plan. The 1987 Plan was terminated on March 31, 1997. The termination does not affect options outstanding under the plan, but no further options can be granted under the 1987 Plan.
25
11. SHAREHOLDERS' EQUITY (continued)
|
A summary of activity under the Company's three stock option plans is as follows.
| | | | | | Outstanding | | Exercisable |
| | | | |
| |
|
| | | | | | | | | Weighted | | | | Weighted |
| | | | | | | | | Average | | | | Average |
| | | Shares | | Number of | | Ex. Price | | Number of | | Ex. Price |
| | | Available | | Shares | | Per Share | | Shares | | Per Share |
| |
|
| Balance at 9/29/01 | | 190,550 | | | 264,750 | | | $ | 4.95 | | 169,250 | | $ | 5.16 |
| |
| |
|
| |
| Fiscal Year 2002 | | | | | | | | | | | | | | |
| | | | | | | | | | | | | | |
| Granted | | (23,000 | ) | | 23,000 | | | | 5.55 | | | | | |
| Exercised | | | | | (11,250 | ) | | | 4.35 | | | | | |
| Forfeited | | 3,500 | | | (3,500 | ) | | | 6.67 | | | | | |
| Forfeitures terminated | | (3,500 | ) | | | | | | 6.67 | | | | | |
| Plan terminated | | (45,600 | ) | | | | | | n/a | | | | | |
| |
| |
|
| Balance at 9/28/02 | | 121,950 | | | 273,000 | | | | 5.01 | | 239,400 | | | 4.99 |
| |
| |
|
| |
| Fiscal Year 2003 | | | | | | | | | | | | | | |
| | | | | | | | | | | | | | |
| Granted | | (28,250 | ) | | 28,250 | | | | 7.97 | | | | | |
| Exercised | | | | | (3,000 | ) | | | 4.73 | | | | | |
| Forfeited | | 3,000 | | | (3,000 | ) | | | 8.38 | | | | | |
| Forfeitures terminated | | (3,000 | ) | | | | | | 8.38 | | | | | |
| |
| |
|
| Balance at 9/27/03 | | 93,700 | | | 295,250 | | | | 5.26 | | 263,850 | | | 5.13 |
| |
| |
|
| |
| Fiscal Year 2004 | | | | | | | | | | | | | | |
| | | | | | | | | | | | | | |
| Granted | | (23,750 | ) | | 23,750 | | | | 13.58 | | | | | |
| Exercised | | | | | (29,500 | ) | | | 5.01 | | | | | |
| Forfeited | | | | | | | | | | | | | | |
| Forfeitures terminated | | | | | | | | | | | | | | |
| |
| |
|
| Balance at 10/2/04 | | 69,950 | | | 289,500 | | | $ | 5.97 | | 267,800 | | $ | 5.70 |
| |
| |
|
A summary of stock options outstanding and exercisable at fiscal year end 2004 is shown below.
| | | | | | | | Outstanding | | Exercisable |
| | | | | | | |
| |
|
| | | | | | | | | | | | | Weighted | | | | | |
| | | | | | | | | | Weighted | | Average | | | | Weighted |
| | | | | | | | | | Average | | Remaining | | | | Average |
| | | | | | | | Number of | | Ex. Price | | Contract | | Number of | | Ex. Price |
| Ranges of Exercise Prices | | Shares | | Per Share | | Life (yrs) | | Shares | | Per Share |
| |
|
| $ | 3.55 | | - | | $ | 4.91 | | 122,000 | | $ | 4.11 | | 3.4 | | 118,000 | | $ | 4.09 |
| 5.41 | | - | | | 7.97 | | 143,750 | | | 6.28 | | 5.3 | | 134,550 | | | 6.22 |
| 13.58 | | - | | | 13.58 | | 23,750 | | | 13.58 | | 9.4 | | 15,250 | | | 13.58 |
| | | | | | | |
| |
|
| $ | 3.55 | | - | | $ | 13.58 | | 289,500 | | $ | 5.97 | | 4.8 | | 267,800 | | $ | 5.70 |
| | | | | | | |
|
The Board of Directors adopted a stock purchase incentive plan in February 2000. The 2000 Stock Purchase Plan was created to encourage management employees of the Company to purchase and hold the Company's common stock. Plan benefits are paid in shares of the Company's common stock. Benefits earned and accrued under the plan were $11,977 in 2004, $11,310 in 2003, and $8,217 in 2002. The Company issued stock valued at $11,310 in 2004, leaving a vested balance of $11,977 at October 2, 2004.
26
In March 1997 the Board of Directors approved the 1997 Long-Term Incentive Stock Option Plan for certain executives of the Company based on achievement of specified financial goals by fiscal year end 1999. As of October 2, 2004, the Company has accrued compensation expense of $24,000 related to this plan.
Deferred income taxes reflect the net tax effects of temporary differences between the carrying amounts of assets and liabilities for financial reporting purposes and the amounts used for income tax purposes. Significant components of the Company’s deferred tax liabilities and assets as of October 2, 2004 and September 27, 2003 are as follows:
| | | 2004 | | 2003 |
|
| Deferred tax liabilities: | | | | | | |
| Depreciation | | $ | 1,083,000 | | $ | 641,000 |
| Other | | | 172,000 | | | 128,000 |
| |
|
| Total deferred tax liabilities | | | 1,255,000 | | | 769,000 |
| |
| Deferred tax assets: | | | | | | |
| Deferred compensation | | | 304,000 | | | 306,000 |
| Accrued expenses | | | 303,000 | | | 216,000 |
| Intangible assets | | | 3,000 | | | 13,000 |
| Other | | | 106,000 | | | 71,000 |
| |
|
| Total deferred tax assets | | | 716,000 | | | 606,000 |
| |
|
| Net deferred tax liabilities | | $ | 539,000 | | $ | 163,000 |
| |
|
The Company made income tax payments, net of refunds, of approximately $617,000, $782,000, and $962,000, in fiscal years 2004, 2003, and 2002, respectively.
Federal and state income tax provisions consist of the following:
| | | 2004 | | 2003 | | 2002 |
|
| Current: | | | | | | | | | |
| Federal | | $ | 443,000 | | $ | 541,000 | | $ | 720,000 |
| State | | | 90,000 | | | 52,000 | | | 76,000 |
| |
|
| | | | 533,000 | | | 593,000 | | | 796,000 |
| Deferred: | | | | | | | | | |
| Federal | | | 425,000 | | | 111,000 | | | 54,000 |
| State | | | 4,000 | | | 11,000 | | | 5,000 |
| |
|
| | | | 429,000 | | | 122,000 | | | 59,000 |
| |
|
| Income tax expense | | $ | 962,000 | | $ | 715,000 | | $ | 855,000 |
| |
|
Income tax expense differs from the amounts computed by applying the federal tax rate to income before income taxes as follows:
| | | 2004 | | 2003 | | 2002 |
|
| Computed tax at the statutory rate | | $ | 1,002,000 | | | $ | 719,000 | | | $ | 852,000 | |
| Increases (decreases): | | | | | | | | | | | | |
| State income taxes, net of federal tax benefit | | | 62,000 | | | | 42,000 | | | | 54,000 | |
| Tax-exempt investment income | | | (18,000 | ) | | | (22,000 | ) | | | (31,000 | ) |
| Extraterritorial income exclusion | | | (24,000 | ) | | | (9,000 | ) | | | (8,000 | ) |
| Officer's life insurance | | | (38,000 | ) | | | (43,000 | ) | | | 19,000 | |
| Other, net | | | (22,000 | ) | | | 28,000 | | | | (31,000 | ) |
| |
|
| Income tax expense | | $ | 962,000 | | | $ | 715,000 | | | $ | 855,000 | |
| |
|
27
13. EARNINGS PER SHARE OF COMMON STOCK
|
The following table sets forth the computation of basic and diluted earnings per share of common stock in accordance with SFAS No. 128.
| | 2004 | | 2003 | | 2002 |
|
| Numerator for basic and diluted | | | | | | | | | |
| earnings per share: | | | | | | | | | |
| Net income | | $ | 1,984,909 | | $ | 1,398,794 | | $ | 1,657,732 |
| |
|
| |
| Denominator: | | | | | | | | | |
| Denominator for basic earnings per share: | | | | | | | | | |
| Weighted average shares | | | 2,579,451 | | | 2,544,882 | | | 2,527,416 |
| Effect of dilutive securities: | | | | | | | | | |
| Employee and board stock options | | | 152,422 | | | 114,817 | | | 73,188 |
| |
|
| Denominator for diluted earnings per share: | | | | | | | | | |
| Adjusted weighted average shares | | | | | | | | | |
| and assumed conversions | | | 2,731,873 | | | 2,659,699 | | | 2,600,604 |
| |
|
| |
| Net income per share: | | | | | | | | | |
| Basic | | $ | 0.77 | | $ | 0.55 | | $ | 0.66 |
| Diluted | | $ | 0.73 | | $ | 0.53 | | $ | 0.64 |
| |
|
14. EMPLOYEE BENEFITS AND INCENTIVE PLANS
The Company has an employee savings and investment plan (401(k) plan) available to employees meeting eligibility requirements. The Company matches a percentage of the employee contributions, with certain limitations. Contributions by the Company amounted to approximately $158,000, $144,000, and $118,000, for the 2004, 2003, and 2002 fiscal years, respectively.
15. RELATED-PARTY TRANSACTIONS
|
The Company paid approximately $138,000 in 2004, $102,000 in 2003, and $72,000 in 2002, in legal fees to a firm having a member who was also a director of the Company at the time.
The Company has a business relationship with a customer to distribute certain of its medical products to hospitals and other treatment facilities throughout the United States. Sales generated by this customer amounted to approximately 6% of total net sales in 2004, 8% in 2003, and 11% in 2002.
The Company has a business relationship with another customer to distribute certain of its consumer products. Sales to this customer amounted to 47% of net sales in 2004, 40% in 2003, and 32% in 2002.
See Note 17 for further information about sales to major customers.
28
17. OPERATIONS AND INDUSTRY SEGMENTS
|
The Company reports on three segments of business: medical, custom products, and safety catheters. However, the safety catheters segment, acquired during fiscal 2002, had no sales in fiscal 2003 or 2002 because the Secure I.V. product line was still in the development phase . This industry segment information corresponds to the markets in the United States and Canada for which the Company manufactures and distributes its polyurethane foam, packaging, and other products and therefore complies with the requirements of SFAS No. 131, "Disclosures about Segments of an Enterprise and Related Information."
The following table summarizes certain information on industry segments:
| | | 2004 | | 2003 | | 2002 |
|
| Net sales: | | | | | | | | | | | | |
| Medical | | $ | 23,339,157 | | | $ | 21,330,122 | | | $ | 19,707,865 | |
| Custom products | | | 26,530,908 | | | | 20,244,481 | | | | 13,827,775 | |
| Safety catheters | | | 59,064 | | | | | | | | | |
| |
|
| Total | | $ | 49,929,129 | | | $ | 41,574,603 | | | $ | 33,535,640 | |
| |
|
| |
| Operating profit (loss): | | | | | | | | | | | | |
| Medical | | $ | 3,053,548 | | | $ | 2,469,596 | | | $ | 2,418,085 | |
| Custom products | | | 637,578 | | | | 254,225 | | | | 645 | |
| Safety catheters | | | (684,421 | ) | | | (504,575 | ) | | | (58,954 | ) |
| |
|
| Total | | | 3,006,705 | | | | 2,219,246 | | | | 2,359,776 | |
| |
| Corporate expense | | | (698,501 | ) | | | (779,433 | ) | | | (642,684 | ) |
| Other income | | | 638,705 | | | | 673,981 | | | | 795,640 | |
| |
|
| Income before income taxes | | $ | 2,946,909 | | | $ | 2,113,794 | | | $ | 2,512,732 | |
| |
|
| |
| Identifiable assets: | | | | | | | | | | | | |
| Medical | | $ | 8,862,678 | | | $ | 8,609,857 | | | $ | 8,977,161 | |
| Custom products | | | 6,808,154 | | | | 6,406,753 | | | | 4,287,781 | |
| Safety catheters | | | 2,996,127 | | | | 1,417,980 | | | | 332,865 | |
| Corporate | | | 8,247,966 | | | | 7,556,067 | | | | 8,308,046 | |
| |
|
| | | $ | 26,914,925 | | | $ | 23,990,657 | | | $ | 21,905,853 | |
| |
|
| |
| Depreciation and amortization expenses: | | | | | | | | | | | | |
| Medical | | $ | 230,407 | | | $ | 229,209 | | | $ | 266,995 | |
| Custom products | | | 283,019 | | | | 251,150 | | | | 212,930 | |
| Safety catheters | | | 202,682 | | | | 45,805 | | | | 6,659 | |
| Corporate | | | 900 | | | | 883 | | | | 882 | |
| |
|
| | | $ | 717,008 | | | $ | 527,047 | | | $ | 487,466 | |
| |
|
| |
| Capital expenditures: | | | | | | | | | | | | |
| Medical | | $ | 189,303 | | | $ | 302,546 | | | $ | 326,313 | |
| Custom products | | | 198,290 | | | | 312,102 | | | | 232,203 | |
| Safety catheters | | | 1,609,898 | | | | 1,032,643 | | | | | |
| |
|
| | | $ | 1,997,491 | | | $ | 1,647,291 | | | $ | 558,516 | |
| |
|
Total sales by industry segment include sales from unaffiliated customers as reported in the Company's statements of income. In calculating operating profit, non-allocable general corporate expenses, interest expense, other income, and income taxes are not included, but certain corporate operating expenses incurred for the benefit of all segments are included on an allocated basis.
29
17. OPERATIONS AND INDUSTRY SEGMENTS (continued)
Identifiable assets are those assets that are used in the operations of each segment on an allocated basis. Amounts shown for corporate assets consist primarily of cash, marketable securities, and cash surrender value of life insurance.
The Company has several customers whose sales represent significant portions of sales in their respective business segments. In the medical segment, sales to our top four distributors represented 52% net medical sales in 2004, 52% in 2003 and 49% in 2002. In the custom products segment, sales to one customer accounted for 89% of net custom products sales in 2004, 82% in 2003, and 77% in 2002.
Export sales, primarily to Canada, were approximately $2,988,000 in 2004, $2,174,000 in 2003 and $1,063,000 in 2002.
18. OPERATING LEASES
The Company leases truck equipment in South Carolina and manufacturing facilities in South Carolina and California. All of the leases require the Company to pay certain insurance and maintenance costs.
Rental expense for all operating leases was $339,000 in 2004, $299,000 in 2003, and $255,000 in 2002.
Future minimum lease payments under noncancelable operating leases with initial terms of one year or more at October 2, 2004 were $315,000 for fiscal 2005, $247,000 for fiscal 2006, and $61,000 for fiscal 2007.
19. COMMITMENTS AND CONTINGENCIES
|
The Company is committed to purchases of $130,000 for roof replacement in fiscal year 2005.
The Company is committed to minimum purchases of $500,000 of Selan® skin care products per calendar year through 2005. For the fiscal years ended 2004, 2003 and 2002, purchases under this commitment were $635,000, $622,000, and $730,000, respectively.
From time to time the Company is a defendant in legal actions involving claims arising in the normal course of business. The Company believes that, as a result of legal defenses and insurance arrangements, none of these actions should have a material adverse effect on its operations or financial condition.
20. SUBSEQUENT EVENTS (UNAUDITED)
|
In December 2004, the Company signed a letter of intent with a construction company to expand the Greenville, SC plant by approximately 60,000 square feet at an estimated cost of $2.6 million. The project is expected to be financed either from the Company’s existing cash and investments or conventional bank debt.
Also in December 2004, the Company declared a special cash dividend of $0.40 per share payable on January 12, 2005 to shareholders of record on December 22, 2004.
As of December 2004, the Company was in the process of negotiating new supply terms with the contract manufacturer for its Secure I.V. product line. The new terms may require the Company to purchase raw materials inventory of approximately $436,000 in fiscal year 2005.
30
Report of Independent Registered Public Accounting Firm
Shareholders and Board of Directors
Span-America Medical Systems, Inc.
Greenville, South Carolina
|
We have audited the accompanying balance sheets of Span-America Medical Systems, Inc. as of October 2, 2004 and September 27, 2003 and the related statements of income, shareholders’ equity, and cash flows for each of the years in the three year period ended October 2, 2004. These financial statements are the responsibility of the Company’s management. Our responsibility is to express an opinion on these financial statements based on our audits.
We conducted our audits in accordance with the Standards of the Public Company Accounting Oversight Board (United States). Those standards require that we plan and perform the audit to obtain reasonable assurance about whether the financial statements are free of material misstatement. An audit includes examining, on a test basis, evidence supporting the amounts and disclosures in the financial statements. An audit also includes assessing the accounting principles used and significant estimates made by management, as well as evaluating the overall financial statement presentation. We believe that our audits provide a reasonable basis for our opinion.
In our opinion, the financial statements referred to above present fairly, in all material respects, the financial position of Span-America Medical Systems, Inc., as of October 2, 2004 and September 27, 2003 and the results of its operations and its cash flows for each of the years in the three year period ended October 2, 2004 in conformity with accounting principles generally accepted in the United States of America.

Greenville, South Carolina
November 1, 2004
|
31
DIRECTORS
Thomas D. Henrion
Chairman of the Board
President / Owner
Silver Thread Farm, LLC
La Grange, Kentucky
James D. Ferguson
President and Chief Executive Officer
Richard C. Coggins
Chief Financial Officer
Treasurer and Secretary
Robert H. Dick
President
R. H. Dick & Company
Lowell, Florida
Thomas F. Grady, Jr.
Retired Vice President
International Paper
Chapel Hill, North Carolina
Guy R. Guarch
Retired Vice President
C. R. Bard
Atlanta, Georgia
Robert B. Johnston
Vice President of Strategic Planning
The InterTech Group, Inc.
North Charleston, South Carolina
Douglas E. Kennemore, M.D.
Retired Neurosurgeon
Greenville, South Carolina
Peter S. Nyberg
President and Co-founder
21 CD, Inc.
Durham, North Carolina
OFFICERS
James D. Ferguson
President and Chief Executive Officer
Robert E. Ackley
Vice President – Custom Products
Richard C. Coggins
Chief Financial Officer
Treasurer and Secretary
James R. O'Reagan
Vice President – R & D and Engineering
Clyde A. Shew
Vice President – Medical Sales and Marketing
Wanda J. Totton
Vice President – Quality
32
CORPORATE OFFICE
Span-America Medical Systems, Inc.
70 Commerce Center
Greenville, South Carolina 29615
(864) 288-8877
Mailing Address:
P.O. Box 5231
Greenville, South Carolina 29606
Web Site:
www.spanamerica.com
STOCK INFORMATION
The common stock of Span-America
Medical Systems, Inc. trades on the National
Market tier of The NASDAQ Stock Market® under
the symbol SPAN.
STOCK TRANSFER AGENT
American Stock Transfer & Trust Company
59 Maiden Lane
Plaza Level
New York, New York 10038
(877) 777-0800 or
(800) 937-5449
Inquiries regarding stock transfers, lost certificates,
or address changes should be directed to the Stock
Transfer Agent at the address above.
GENERAL COUNSEL
Wyche, Burgess, Freeman & Parham, P.A.
P.O. Box 728
Greenville, South Carolina 29602-
AUDITORS
Elliott Davis, LLC
P.O. Box 6286
Greenville, South Carolina 29606-6286
SHAREHOLDER INQUIRIES AND
AVAILABILITY OF FORM 10-K REPORT
A copy of the Company's Annual Report on
Form 10-K for the year ended October 2, 2004 is
available without charge to shareholders upon
written request from the following:
Secretary
Span-America Medical Systems, Inc.
P.O. Box 5231
Greenville, South Carolina 29606
Span-America Medical Systems, Inc.
70 Commerce Center
Greenville, South Carolina 29615
(864) 288-8877
www.spanamerica.com