UNITED STATES
SECURITIES AND EXCHANGE COMMISSION
Washington, D.C. 20549
FORM N-CSR
CERTIFIED SHAREHOLDER REPORT OF REGISTERED MANAGEMENT
INVESTMENT COMPANIES
Investment Company Act file number 811-03721
BNY Mellon Intermediate Municipal Bond Fund, Inc.
(Exact Name of Registrant as Specified in Charter)
c/o BNY Mellon Investment Adviser, Inc.
240 Greenwich Street
New York, New York 10286
(Address of Principal Executive Offices) (Zip Code)
Deirdre Cunnane, Esq.
240 Greenwich Street
New York, New York 10286
(Name and Address of Agent for Service)
Registrant's Telephone Number, including Area Code: (212) 922-6400
Date of fiscal year end: 5/31
Date of reporting period: 05/31/24
FORM N-CSR
Item 1. Reports to Stockholders.
BNY Mellon Intermediate Municipal Bond Fund, Inc. | ANNUAL MAY 31, 2024 |
Ticker – DITEX
This annual shareholder report contains important information about BNY Mellon Intermediate Municipal Bond Fund, Inc. (the “Fund”) for the period of June 1, 2023 to May 31, 2024. You can find additional information about the Fund at im.bnymellon.com/literaturecenter. You can also request this information by calling 1-800-373-9387 (inside the U.S. only) or by sending an e-mail request to info@bnymellon.com.
This report describes changes to the Fund that occurred during the reporting period.
What were the Fund’s costs for the last year?
(based on a hypothetical $10,000 investment)
Fund | Costs of a $10,000 investment | Costs paid as a percentage of a $10,000 investment |
BNY Mellon Intermediate | $67 | 0.66% |
* | During the period, fees were waived and/or expenses reimbursed pursuant to an agreement with the Fund’s investment adviser, BNY Mellon Investment Adviser, Inc. If this agreement is not extended in the future, expenses could be higher. |
How did the Fund perform last year?
• For the 12-month period ended May 31, 2024, the Fund’s shares returned 2.66%.
• In comparison, the Bloomberg Municipal Bond: 7 Year Index (6-8) returned 1.52% for the same period.
What affected the Fund’s performance?
• Inflationary pressure weighed on the fixed-income market for the majority of the reporting period, limiting performance potential. Demand for municipal bonds continued to benefit from absolute yield, strong fundamentals and technical factors.
• Security selections in certain segments, including special tax, continuing care retirement community, airports and education, drove the Fund’s relative outperformance. Selections among state general obligarion and local general obligation were also positive.
• The Fund’s slightly longer duration versus the index modestly detracted from relative performance. Also, security selection was disadvantageous in the hospital sector.
Not FDIC Insured. Not Bank-Guaranteed. May Lose Value |
|

How did the Fund perform over the past 10 years? The Fund’s past performance is not a good predictor of the Fund’s future performance. The graph and table do not reflect the deduction of taxes that a shareholder would pay on fund distributions or redemption of fund shares. | Cumulative Performance from June 1, 2014 through May 31, 2024
Years Ended 5/31 |
![10KLineChartData(Bloomberg U.S. Municipal Bond Index (broad-based index)*[BroadBasedIndex]|2014-05-31:10000,2015-05-31:10318,2016-05-31:10924,2017-05-31:11083,2018-05-31:11206,2019-05-31:11923,2020-05-31:12398,2021-05-31:12986,2022-05-31:12104,2023-05-31:12163,2024-05-31:12488|Bloomberg Municipal Bond: 7 Year Index (6-8)[AdditionalIndex]|2014-05-31:10000,2015-05-31:10212,2016-05-31:10729,2017-05-31:10920,2018-05-31:10877,2019-05-31:11583,2020-05-31:12061,2021-05-31:12482,2022-05-31:11727,2023-05-31:11858,2024-05-31:12038|BNY Mellon Intermediate Municipal Bond Fund, Inc.|2014-05-31:10000,2015-05-31:10200,2016-05-31:10738,2017-05-31:10869,2018-05-31:10903,2019-05-31:11534,2020-05-31:11782,2021-05-31:12382,2022-05-31:11554,2023-05-31:11634,2024-05-31:11943)](https://capedge.com/proxy/N-CSRA/0001741773-24-003570/img_f49011b6e5d04f2.jpg "10KLineChartData(Bloomberg U.S. Municipal Bond Index (broad-based index)*[BroadBasedIndex]|2014-05-31:10000,2015-05-31:10318,2016-05-31:10924,2017-05-31:11083,2018-05-31:11206,2019-05-31:11923,2020-05-31:12398,2021-05-31:12986,2022-05-31:12104,2023-05-31:12163,2024-05-31:12488|Bloomberg Municipal Bond: 7 Year Index (6-8)[AdditionalIndex]|2014-05-31:10000,2015-05-31:10212,2016-05-31:10729,2017-05-31:10920,2018-05-31:10877,2019-05-31:11583,2020-05-31:12061,2021-05-31:12482,2022-05-31:11727,2023-05-31:11858,2024-05-31:12038|BNY Mellon Intermediate Municipal Bond Fund, Inc.|2014-05-31:10000,2015-05-31:10200,2016-05-31:10738,2017-05-31:10869,2018-05-31:10903,2019-05-31:11534,2020-05-31:11782,2021-05-31:12382,2022-05-31:11554,2023-05-31:11634,2024-05-31:11943)")
The above graph compares a hypothetical $10,000 investment in the Fund’s shares to a hypothetical investment of $10,000 made in each of the Bloomberg U.S. Municipal Bond Index (a broad-based index) and Bloomberg Municipal Bond: 7 Year Index (6-8) on 5/31/2014. The performance shown takes into account applicable fees and expenses of the Fund, including management fees and other expenses. The Fund’s performance also assumes the reinvestment of dividends and capital gains. Unlike the Fund, the indexes are not subject to charges, fees and other expenses. Investors cannot invest directly in any index.
AVERAGE ANNUAL TOTAL RETURNS (AS OF 5/31/24) | ||||||
| 1YR | 5YR | 10YR | |||
BNY Mellon Intermediate Municipal Bond Fund, Inc. | 2.66% |
| 0.70% |
| 1.79% |
|
Bloomberg U.S. Municipal Bond Index (broad-based index)* | 2.67% |
| 0.93% |
| 2.25% |
|
Bloomberg Municipal Bond: 7 Year Index (6-8) | 1.52% |
| 0.77% |
| 1.87% |
|
* | In accordance with regulatory changes requiring the Fund’s primary benchmark to represent the overall applicable market, the Fund’s primary prospectus benchmark changed to the indicated benchmark effective as of May 31, 2024. |
The performance data quoted represent past performance, which is no guarantee of future results. For more current information visit im.bnymellon.com/literaturecenter.
KEY FUND STATISTICS (AS OF 5/31/24)
Fund Size (Millions) | Number of Holdings | Total Advisory Fee Paid During Period | Annual Portfolio Turnover |
$392 | 186 | $2,128,993 | 19.15% |
Not FDIC Insured. Not Bank-Guaranteed. May Lose Value |
|

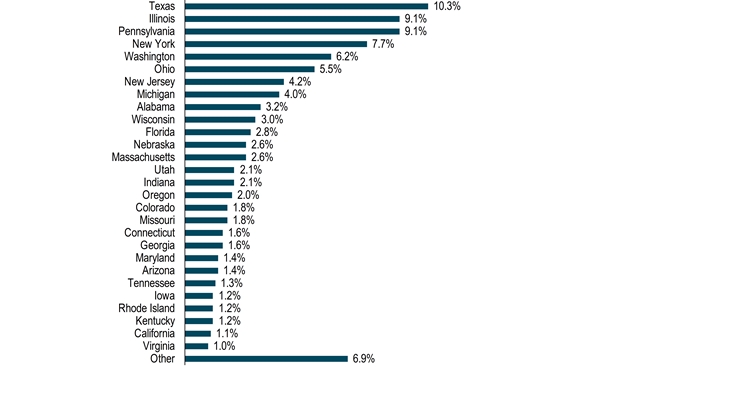
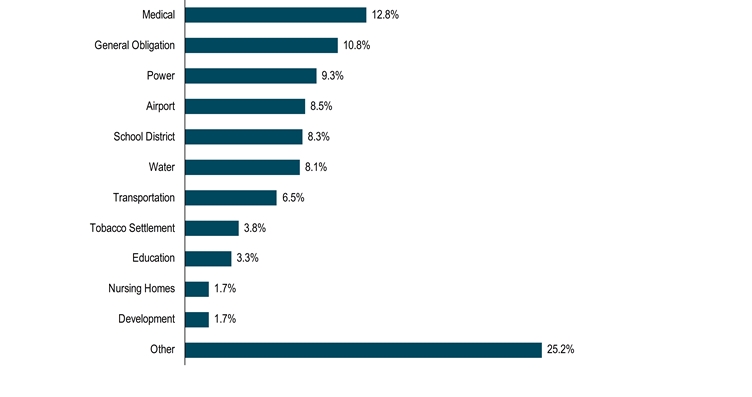
Portfolio Holdings (as of 5/31/24)
State Allocation (Based on Net Assets)
Sector Allocation (Based on Net Assets)
Not FDIC Insured. Not Bank-Guaranteed. May Lose Value |
|

How has the Fund changed?
• Effective January 1, 2024, the Fund’s management fee was lowered from 0.60% to 0.45% as an annual rate based on the Fund’s average daily net assets.
This is a summary of certain changes to the Fund since June 1, 2023. For more complete information, you may review the Fund’s next prospectus, which we expect to be available by September 30, 2024 at im.bnymellon.com/literaturecenter or upon request at 1-800-373-9387.
For additional information about the Fund, including its prospectus, financial information, portfolio holdings and proxy voting information, please visit im.bnymellon.com/literaturecenter.
© 2024 BNY Mellon Securities Corporation, Distributor, |
|

Item 2. Code of Ethics.
The Registrant has adopted a code of ethics that applies to the Registrant's principal executive officer, principal financial officer, principal accounting officer or controller, or persons performing similar functions. There have been no amendments to, or waivers in connection with, the Code of Ethics during the period covered by this Report.
Item 3. Audit Committee Financial Expert.
The Registrant's Board has determined that Alan H. Howard, a member of the Audit Committee of the Board, is an audit committee financial expert as defined by the Securities and Exchange Commission (the "SEC"). Mr. Howard is "independent" as defined by the SEC for purposes of audit committee financial expert determinations.
Item 4. Principal Accountant Fees and Services.
(a) Audit Fees. The aggregate fees billed for each of the last two fiscal years (the "Reporting Periods") for professional services rendered by the Registrant's principal accountant (the "Auditor") for the audit of the Registrant's annual financial statements or services that are normally provided by the Auditor in connection with the statutory and regulatory filings or engagements for the Reporting Periods, were $36,928 in 2023 and $37,666 in 2024.
(b) Audit-Related Fees. The aggregate fees billed in the Reporting Periods for assurance and related services by the Auditor that are reasonably related to the performance of the audit of the Registrant's financial statements and are not reported under paragraph (a) of this Item 4 were $13,303 in 2023 and $13,094 in 2024. These services consisted of (i) agreed upon procedures related to compliance with Internal Revenue Code section 817(h), (ii) security counts required by Rule 17f-2 under the Investment Company Act of 1940, as amended, (iii) advisory services as to the accounting or disclosure treatment of Registrant transactions or events and (iv) advisory services to the accounting or disclosure treatment of the actual or potential impact to the Registrant of final or proposed rules, standards or interpretations by the Securities and Exchange Commission, the Financial Accounting Standards Boards or other regulatory or standard-setting bodies..
The aggregate fees billed in the Reporting Periods for non-audit assurance and related services by the Auditor to the Registrant's investment adviser (not including any sub-investment adviser whose role is primarily portfolio management and is subcontracted with or overseen by another investment adviser), and any entity controlling, controlled by or under common control with the investment adviser that provides ongoing services to the Registrant ("Service Affiliates"), that were reasonably related to the performance of the annual audit of the Service Affiliate, which required pre-approval by the Audit Committee were $0 in 2023 and $0 in 2024.
(c) Tax Fees. The aggregate fees billed in the Reporting Periods for professional services rendered by the Auditor for tax compliance, tax advice, and tax planning ("Tax Services") were $3,342 in 2023 and $3,342 in 2024. These services consisted of: (i) review or preparation of U.S. federal, state, local and excise tax returns; (ii) U.S. federal, state and local tax planning, advice and assistance regarding statutory, regulatory or administrative developments; (iii) tax advice regarding tax qualification matters and/or treatment of various financial instruments held or proposed to be acquired or held, and (iv) determination of Passive Foreign Investment Companies. The aggregate fees billed in the Reporting Periods for Tax Services by the Auditor to Service Affiliates, which required pre-approval by the Audit Committee were $8,158 in 2023 and $8,503 in 2024.
(d) All Other Fees. The aggregate fees billed in the Reporting Periods for products and services provided by the Auditor, other than the services reported in paragraphs (a) through (c) of this Item, were $2,277 in 2023 and $2,586 in 2024. These services consisted of a review of the Registrant's anti-money laundering program.
The aggregate fees billed in the Reporting Periods for Non-Audit Services by the Auditor to Service Affiliates, other than the services reported in paragraphs (b) through (c) of this Item, which required pre-approval by the Audit Committee, were $0 in 2023 and $0 in 2024.
(e)(1) Audit Committee Pre-Approval Policies and Procedures. The Registrant's Audit Committee has established policies and procedures (the "Policy") for pre-approval (within specified fee limits) of the Auditor's engagements for non-audit services to the Registrant and Service Affiliates without specific case-by-case consideration. The pre-approved services in the Policy can include pre-approved audit services, pre-approved audit-related services, pre-approved tax services and pre-approved all other services. Pre-approval considerations include whether the proposed services are compatible with maintaining the Auditor's independence. Pre-approvals pursuant to the Policy are considered annually.
(e)(2) Note. None of the services described in paragraphs (b) through (d) of this Item 4 were approved by the Audit Committee pursuant to paragraph (c)(7)(i)(C) of Rule 2-01 of Regulation S-X.
(f) None of the hours expended on the principal accountant's engagement to audit the registrant's financial statements for the most recent fiscal year were attributed to work performed by persons other than the principal accountant's full-time, permanent employees.
Non-Audit Fees. The aggregate non-audit fees billed by the Auditor for services rendered to the Registrant, and rendered to Service Affiliates, for the Reporting Periods were $1,767,321 in 2023 and $1,744,889 in 2024.
Auditor Independence. The Registrant's Audit Committee has considered whether the provision of non-audit services that were rendered to Service Affiliates, which were not pre-approved (not requiring pre-approval), is compatible with maintaining the Auditor's independence.
(i) Not applicable.
(j) Not applicable.
Item 5. Audit Committee of Listed Registrants.
Not applicable
Item 6. Investments.
Not applicable.
BNY Mellon Intermediate Municipal Bond Fund, Inc.
ANNUAL FINANCIALS AND OTHER INFORMATION May 31, 2024 |
|

Class | Ticker |
Single Share | DITEX |
IMPORTANT NOTICE – CHANGES TO ANNUAL AND SEMI-ANNUAL REPORTS The Securities and Exchange Commission (the “SEC”) has adopted rule and form amendments which have resulted in changes to the design and delivery of annual and semi-annual fund reports (“Reports”). Reports are now streamlined to highlight key information. Certain information previously included in Reports, including financial statements, no longer appear in the Reports but will be available online within the Semi-Annual and Annual Financials and Other Information, delivered free of charge to shareholders upon request, and filed with the SEC. |
Save time. Save paper. View your next shareholder report online as soon as it’s available. Log into www.im.bnymellon.com and sign up for eCommunications. It’s simple and only takes a few minutes. |
The views expressed in this report reflect those of the portfolio manager(s) only through the end of the period covered and do not necessarily represent the views of BNY Mellon Investment Adviser, Inc. or any other person in the BNY Mellon Investment Adviser, Inc. organization. Any such views are subject to change at any time based upon market or other conditions and BNY Mellon Investment Adviser, Inc. disclaims any responsibility to update such views. These views may not be relied on as investment advice and, because investment decisions for a fund in the BNY Mellon Family of Funds are based on numerous factors, may not be relied on as an indication of trading intent on behalf of any fund in the BNY Mellon Family of Funds. |
Not FDIC-Insured • Not Bank-Guaranteed • May Lose Value |
Contents
T H E F U N D
Please note the Annual Financials and Other Information only contains Items 7-11 required in
Form N-CSR. All other required items will be filed with the SEC.
Item 7. Financial Statements and Financial Highlights for Open-End Management Investment Companies.
BNY Mellon Intermediate Municipal Bond Fund, Inc.
Statement of Investments
May 31, 2024
Description | Coupon | Maturity Date | Principal Amount ($) | Value ($) | |||||
Bonds and Notes - .6% | |||||||||
Collateralized Municipal-Backed Securities - .6% | |||||||||
Arizona Industrial Development Authority, Revenue Bonds, Ser. 2019-2 | 3.63 | 5/20/2033 | 1,603,871 | 1,451,719 | |||||
Washington Housing Finance Commission, Revenue Bonds, Ser. A1 | 3.50 | 12/20/2035 | 955,351 | 847,285 | |||||
Total Bonds and Notes | 2,299,004 | ||||||||
Long-Term Municipal Investments - 98.4% | |||||||||
Alabama - 3.2% | |||||||||
Birmingham-Jefferson Civic Center Authority, Special Tax Bonds, Ser. B | 5.00 | 7/1/2038 | 2,975,000 | 3,050,562 | |||||
Black Belt Energy Gas District, Revenue Bonds, Refunding | 4.00 | 12/1/2031 | 1,300,000 | a | 1,280,319 | ||||
Jefferson County, Revenue Bonds, Refunding | 5.00 | 10/1/2038 | 1,250,000 | 1,365,816 | |||||
Jefferson County, Revenue Bonds, Refunding | 5.25 | 10/1/2040 | 1,250,000 | 1,375,178 | |||||
The Lower Alabama Gas District, Revenue Bonds (Gas Project) | 4.00 | 12/1/2025 | 3,500,000 | a | 3,496,473 | ||||
The Lower Alabama Gas District, Revenue Bonds, Ser. A | 5.00 | 9/1/2031 | 2,000,000 | 2,083,352 | |||||
12,651,700 | |||||||||
Arizona - 1.0% | |||||||||
Arizona Industrial Development Authority, Revenue Bonds (Sustainable Bond) (Equitable School Revolving Fund Obligated Group) Ser. A | 5.00 | 11/1/2037 | 1,375,000 | 1,480,702 | |||||
Chandler Industrial Development Authority, Revenue Bonds (Intel Corp. Project) | 4.00 | 6/1/2029 | 1,000,000 | a | 991,711 | ||||
Phoenix Civic Improvement Corp., Revenue Bonds, Ser. B | 5.00 | 7/1/2030 | 1,500,000 | 1,577,936 | |||||
4,050,349 | |||||||||
Arkansas - .4% | |||||||||
Fort Smith Water & Sewer, Revenue Bonds, Refunding | 5.00 | 10/1/2035 | 1,500,000 | 1,579,680 | |||||
California - 1.1% | |||||||||
California Housing Finance Agency, Revenue Bonds, Ser. 2021-1 | 3.50 | 11/20/2035 | 1,428,308 | 1,333,792 | |||||
California Statewide Communities Development Authority, Revenue Bonds (Loma Linda University Medical Center Obligated Group) Ser. A | 5.00 | 12/1/2031 | 1,000,000 | b | 1,012,223 | ||||
San Francisco City & County Airport Comm-San Francisco International Airport, Revenue Bonds, Refunding, Ser. A | 5.00 | 5/1/2039 | 1,960,000 | 2,101,740 | |||||
4,447,755 | |||||||||
Colorado - 1.8% | |||||||||
Colorado Health Facilities Authority, Revenue Bonds, Refunding (AdventHealth Obligated Group) | 5.00 | 11/19/2026 | 2,270,000 | a | 2,330,518 | ||||
Colorado Health Facilities Authority, Revenue Bonds, Refunding (AdventHealth Obligated Group) | 5.00 | 11/19/2026 | 230,000 | a,c | 237,252 | ||||
Colorado Health Facilities Authority, Revenue Bonds, Refunding (CommonSpirit Health Obligated Group) Ser. A | 5.00 | 8/1/2034 | 1,000,000 | 1,058,937 | |||||
Colorado Health Facilities Authority, Revenue Bonds, Refunding (School Health System) Ser. A | 5.00 | 1/1/2030 | 1,750,000 | 1,894,328 | |||||
Weld County School District No. RE-4, GO (Insured; State Aid Withholding) | 5.00 | 12/1/2041 | 1,450,000 | 1,586,596 | |||||
7,107,631 | |||||||||
Connecticut - 1.6% | |||||||||
Connecticut, GO (Sustainable Bond) Ser. F | 5.00 | 11/15/2038 | 2,000,000 | 2,211,912 | |||||
3
Statement of Investments (continued)
Description | Coupon | Maturity Date | Principal Amount ($) | Value ($) | |||||
Long-Term Municipal Investments - 98.4% (continued) | |||||||||
Connecticut - 1.6% (continued) | |||||||||
Connecticut, GO, Ser. A | 4.00 | 1/15/2036 | 3,000,000 | 3,055,175 | |||||
Connecticut Health & Educational Facilities Authority, Revenue Bonds (Covenant Home) Ser. B | 5.00 | 12/1/2032 | 1,000,000 | 1,001,771 | |||||
6,268,858 | |||||||||
Delaware - .3% | |||||||||
Delaware Economic Development Authority, Revenue Bonds (ACTS Retirement-Life Communities Obligated Group) Ser. B | 5.00 | 11/15/2043 | 1,260,000 | 1,291,356 | |||||
District of Columbia - .6% | |||||||||
District of Columbia, Revenue Bonds, Ser. A | 5.00 | 7/1/2041 | 2,000,000 | 2,173,928 | |||||
Florida - 2.8% | |||||||||
Broward County Airport System, Revenue Bonds | 5.00 | 10/1/2036 | 2,000,000 | 2,053,905 | |||||
Central Florida Expressway Authority, Revenue Bonds (Insured; Assured Guaranty Municipal Corp.) Ser. D | 5.00 | 7/1/2035 | 1,500,000 | 1,641,482 | |||||
Florida Municipal Power Agency, Revenue Bonds (Requirements Power Supply Project) | 5.00 | 10/1/2030 | 1,250,000 | 1,267,343 | |||||
JEA Electric System, Revenue Bonds, Refunding, Ser. 3A | 4.00 | 10/1/2036 | 1,700,000 | 1,683,075 | |||||
South Miami Health Facilities Authority, Revenue Bonds, Refunding (Baptist Health South Florida Obligated Group) | 5.00 | 8/15/2031 | 1,750,000 | 1,810,120 | |||||
Sunshine Skyway Bridge, Revenue Bonds, Ser. A | 4.00 | 7/1/2033 | 2,500,000 | 2,512,698 | |||||
10,968,623 | |||||||||
Georgia - 1.6% | |||||||||
Fulton County Development Authority, Revenue Bonds, Ser. A | 5.00 | 4/1/2036 | 1,350,000 | 1,386,814 | |||||
Main Street Natural Gas, Revenue Bonds, Ser. A | 5.50 | 9/15/2028 | 2,530,000 | 2,610,004 | |||||
Main Street Natural Gas, Revenue Bonds, Ser. C | 5.00 | 9/1/2030 | 2,000,000 | a | 2,101,115 | ||||
6,097,933 | |||||||||
Hawaii - .8% | |||||||||
Hawaii Airports System, Revenue Bonds, Ser. A | 5.00 | 7/1/2031 | 1,615,000 | 1,675,020 | |||||
Hawaii Airports System, Revenue Bonds, Ser. A | 5.00 | 7/1/2030 | 1,500,000 | 1,558,014 | |||||
3,233,034 | |||||||||
Illinois - 9.1% | |||||||||
Chicago Board of Education, GO, Refunding (Insured; Assured Guaranty Municipal Corp.) Ser. C | 5.00 | 12/1/2030 | 2,500,000 | 2,587,572 | |||||
Chicago Board of Education, GO, Ser. A | 5.50 | 12/1/2038 | 1,500,000 | 1,608,920 | |||||
Chicago II, GO, Refunding, Ser. A | 4.00 | 1/1/2035 | 3,000,000 | 2,990,398 | |||||
Chicago Midway International Airport, Revenue Bonds, Refunding, Ser. C | 5.00 | 1/1/2034 | 1,900,000 | 2,045,506 | |||||
Chicago O'Hare International Airport, Revenue Bonds, Refunding, Ser. A | 5.00 | 1/1/2029 | 4,000,000 | 4,013,695 | |||||
Chicago Wastewater, Revenue Bonds, Refunding (Insured; Build America Mutual) Ser. A | 5.00 | 1/1/2041 | 1,350,000 | 1,467,417 | |||||
Greater Chicago Metropolitan Water Reclamation District, GO, Refunding, Ser. A | 5.00 | 12/1/2031 | 3,275,000 | 3,369,942 | |||||
Illinois, GO, Ser. B | 5.25 | 5/1/2038 | 1,250,000 | 1,368,323 | |||||
Illinois Finance Authority, Revenue Bonds, Refunding (OSF Healthcare System Obligated Group) Ser. A | 5.00 | 11/15/2028 | 1,205,000 | 1,219,934 | |||||
Illinois Finance Authority, Revenue Bonds, Refunding (Rush University Medical Center) Ser. B | 5.00 | 11/15/2033 | 2,140,000 | 2,152,302 | |||||
Illinois Municipal Electric Agency, Revenue Bonds, Refunding, Ser. A | 4.00 | 2/1/2035 | 1,750,000 | 1,665,564 | |||||
Illinois Toll Highway Authority, Revenue Bonds, Ser. A | 5.00 | 1/1/2042 | 1,110,000 | 1,154,645 | |||||
Regional Transportation Authority, Revenue Bonds (Insured; National Public Finance Guarantee Corp.) | 6.50 | 7/1/2030 | 2,500,000 | 2,812,324 | |||||
Sales Tax Securitization Corp., Revenue Bonds, Refunding, Ser. A | 5.00 | 1/1/2034 | 1,500,000 | 1,662,165 | |||||
4
Description | Coupon | Maturity Date | Principal Amount ($) | Value ($) | |||||
Long-Term Municipal Investments - 98.4% (continued) | |||||||||
Illinois - 9.1% (continued) | |||||||||
Sales Tax Securitization Corp., Revenue Bonds, Refunding, Ser. A | 5.00 | 1/1/2036 | 2,750,000 | 2,923,919 | |||||
The Illinois Sports Facilities Authority, Revenue Bonds, Refunding (Insured; Build America Mutual) | 5.00 | 6/15/2029 | 1,000,000 | 1,050,250 | |||||
University of Illinois, Revenue Bonds (Auxiliary Facilities System) Ser. A | 5.00 | 4/1/2032 | 1,655,000 | 1,657,606 | |||||
35,750,482 | |||||||||
Indiana - 2.1% | |||||||||
Indiana Finance Authority, Revenue Bonds, Refunding (CWA Authority Project) Ser. 1 | 4.00 | 10/1/2036 | 1,250,000 | 1,265,018 | |||||
Indiana Finance Authority, Revenue Bonds, Refunding (CWA Authority Project) Ser. 1 | 4.00 | 10/1/2035 | 1,500,000 | 1,531,777 | |||||
Indiana Municipal Power Agency, Revenue Bonds, Refunding, Ser. A | 5.00 | 1/1/2036 | 3,000,000 | 3,059,887 | |||||
Richmond Hospital Authority, Revenue Bonds, Refunding (Reid Hospital & Health Care Services Obligated Group) Ser. A | 5.00 | 1/1/2028 | 2,440,000 | 2,444,930 | |||||
8,301,612 | |||||||||
Iowa - 1.2% | |||||||||
Iowa Finance Authority, Revenue Bonds, Refunding (Iowa Fertilizer Co. Project) | 4.00 | 12/1/2032 | 1,000,000 | a | 1,032,008 | ||||
Iowa Finance Authority, Revenue Bonds, Refunding (Lifespace Communities Obligated Group) Ser. B | 7.25 | 5/15/2038 | 2,000,000 | 2,235,220 | |||||
Iowa Tobacco Settlement Authority, Revenue Bonds, Refunding, Ser. A2 | 4.00 | 6/1/2034 | 500,000 | 504,147 | |||||
PEFA, Revenue Bonds (Gas Project) | 5.00 | 9/1/2026 | 1,000,000 | a | 1,017,853 | ||||
4,789,228 | |||||||||
Kentucky - 1.2% | |||||||||
Kentucky Public Energy Authority, Revenue Bonds, Refunding, Ser. A1 | 5.25 | 2/1/2032 | 1,000,000 | a | 1,065,537 | ||||
Kentucky Public Energy Authority, Revenue Bonds, Ser. A | 4.00 | 6/1/2026 | 1,500,000 | a | 1,496,299 | ||||
Kentucky Public Energy Authority, Revenue Bonds, Ser. A1 | 4.00 | 8/1/2030 | 1,000,000 | a | 986,213 | ||||
Louisville & Jefferson County Metropolitan Government, Revenue Bonds (Norton Healthcare) Ser. C | 5.00 | 10/1/2026 | 1,000,000 | a | 1,018,276 | ||||
4,566,325 | |||||||||
Louisiana - .8% | |||||||||
Jefferson Sales Tax District, Revenue Bonds (Insured; Assured Guaranty Municipal Corp.) Ser. B | 4.00 | 12/1/2032 | 2,250,000 | 2,289,384 | |||||
St. John the Baptist Parish, Revenue Bonds, Refunding (Marathon Oil Corp.) | 2.20 | 7/1/2026 | 1,000,000 | a | 949,713 | ||||
3,239,097 | |||||||||
Maryland - 1.4% | |||||||||
Maryland Health & Higher Educational Facilities Authority, Revenue Bonds, Refunding (University of Maryland Medical System Obligated Group) Ser. B2 | 5.00 | 7/1/2027 | 2,350,000 | a | 2,419,519 | ||||
Maryland Stadium Authority, Revenue Bonds | 5.00 | 5/1/2037 | 3,090,000 | 3,241,111 | |||||
5,660,630 | |||||||||
Massachusetts - 2.6% | |||||||||
Massachusetts, GO, Ser. D | 4.00 | 5/1/2034 | 3,500,000 | 3,553,130 | |||||
Massachusetts Development Finance Agency, Revenue Bonds, Refunding (Partners Healthcare System) | 5.00 | 7/1/2034 | 2,630,000 | 2,686,632 | |||||
Massachusetts Transportation Trust Fund Metropolitan Highway System, Revenue Bonds, Refunding, Ser. A | 5.00 | 1/1/2034 | 3,500,000 | 3,764,979 | |||||
10,004,741 | |||||||||
5
Statement of Investments (continued)
Description | Coupon | Maturity Date | Principal Amount ($) | Value ($) | |||||
Long-Term Municipal Investments - 98.4% (continued) | |||||||||
Michigan - 4.0% | |||||||||
Great Lakes Water Authority Water Supply System, Revenue Bonds, Refunding, Ser. D | 5.00 | 7/1/2036 | 5,000,000 | 5,101,118 | |||||
Michigan Finance Authority, Revenue Bonds (Sustainable Bond) (Henry Ford) | 5.00 | 2/28/2038 | 1,550,000 | 1,683,467 | |||||
Michigan Finance Authority, Revenue Bonds, Refunding (Beaumont-Spectrum) | 5.00 | 4/15/2034 | 1,190,000 | 1,304,163 | |||||
Michigan Finance Authority, Revenue Bonds, Refunding (Trinity Health Corp. Obligated Group) Ser. A | 5.00 | 12/1/2034 | 2,000,000 | 2,070,549 | |||||
Michigan Strategic Fund, Revenue Bonds (AMT-I-75 Improvement Project) | 5.00 | 6/30/2031 | 4,395,000 | 4,499,028 | |||||
Utica Community Schools, GO, Refunding (Insured; Qualified School Bond Loan Fund) | 5.00 | 5/1/2032 | 940,000 | 1,012,194 | |||||
15,670,519 | |||||||||
Missouri - 1.8% | |||||||||
Missouri Health & Educational Facilities Authority, Revenue Bonds, Refunding (CoxHealth Obligated Group) Ser. A | 5.00 | 11/15/2035 | 3,705,000 | 3,723,730 | |||||
Missouri Joint Municipal Electric Utility Commission, Revenue Bonds, Refunding (Prairie State Project) Ser. A | 5.00 | 12/1/2030 | 3,270,000 | 3,300,692 | |||||
7,024,422 | |||||||||
Nebraska - 2.6% | |||||||||
Omaha Public Power District, Revenue Bonds, Ser. A | 5.00 | 2/1/2040 | 2,000,000 | 2,171,281 | |||||
Public Power Generation Agency, Revenue Bonds, Refunding | 5.00 | 1/1/2038 | 1,000,000 | 1,016,369 | |||||
Public Power Generation Agency, Revenue Bonds, Refunding (Whelan Energy Center Unit) | 5.00 | 1/1/2029 | 4,750,000 | 4,780,030 | |||||
Public Power Generation Agency, Revenue Bonds, Refunding (Whelan Energy Center Unit) | 5.00 | 1/1/2030 | 2,250,000 | 2,263,840 | |||||
10,231,520 | |||||||||
Nevada - .6% | |||||||||
Clark County School District, GO, Ser. A | 5.00 | 6/15/2039 | 1,500,000 | 1,634,639 | |||||
Reno, Revenue Bonds, Refunding | 5.00 | 6/1/2035 | 500,000 | 522,656 | |||||
2,157,295 | |||||||||
New Jersey - 4.2% | |||||||||
New Jersey Higher Education Student Assistance Authority, Revenue Bonds, Refunding, Ser. A | 5.00 | 12/1/2030 | 1,400,000 | 1,461,642 | |||||
New Jersey Transportation Trust Fund Authority, Revenue Bonds | 5.25 | 6/15/2039 | 2,500,000 | 2,761,118 | |||||
New Jersey Transportation Trust Fund Authority, Revenue Bonds, Refunding, Ser. AA | 5.00 | 6/15/2038 | 1,000,000 | 1,095,842 | |||||
New Jersey Transportation Trust Fund Authority, Revenue Bonds, Ser. BB | 5.00 | 6/15/2038 | 1,000,000 | 1,100,216 | |||||
New Jersey Turnpike Authority, Revenue Bonds, Refunding, Ser. E | 5.00 | 1/1/2031 | 1,250,000 | 1,310,392 | |||||
The Camden County Improvement Authority, Revenue Bonds, Refunding (Rowan University Project) (Insured; Build America Mutual) Ser. A | 5.00 | 7/1/2033 | 3,070,000 | 3,318,780 | |||||
Tobacco Settlement Financing Corp., Revenue Bonds, Refunding, Ser. A | 5.00 | 6/1/2037 | 3,150,000 | 3,279,381 | |||||
Tobacco Settlement Financing Corp., Revenue Bonds, Refunding, Ser. A | 5.00 | 6/1/2036 | 2,175,000 | 2,275,807 | |||||
16,603,178 | |||||||||
New York - 7.7% | |||||||||
Metropolitan Transportation Authority, Revenue Bonds, Refunding (Sustainable Bond) Ser. C1 | 5.00 | 11/15/2031 | 2,135,000 | 2,240,375 | |||||
Metropolitan Transportation Authority, Revenue Bonds, Refunding, Ser. D | 5.00 | 11/15/2030 | 1,365,000 | 1,407,863 | |||||
6
Description | Coupon | Maturity Date | Principal Amount ($) | Value ($) | |||||
Long-Term Municipal Investments - 98.4% (continued) | |||||||||
New York - 7.7% (continued) | |||||||||
Nassau County Interim Finance Authority, Revenue Bonds, Refunding, Ser. A | 4.00 | 11/15/2032 | 500,000 | 528,600 | |||||
New York City, GO, Ser. A1 | 4.00 | 8/1/2037 | 2,195,000 | 2,222,687 | |||||
New York City, GO, Ser. C | 4.00 | 8/1/2036 | 1,250,000 | 1,271,768 | |||||
New York City, GO, Ser. F1 | 4.00 | 3/1/2038 | 1,000,000 | 1,003,103 | |||||
New York City Transitional Finance Authority, Revenue Bonds, Ser. B1 | 4.00 | 11/1/2043 | 1,700,000 | 1,652,077 | |||||
New York City Transitional Finance Authority, Revenue Bonds, Ser. B1 | 4.00 | 8/1/2038 | 2,680,000 | 2,724,625 | |||||
New York State Urban Development Corp., Revenue Bonds (State of New York Personal Income Tax) Ser. A | 4.00 | 3/15/2039 | 3,420,000 | 3,394,885 | |||||
New York Transportation Development Corp., Revenue Bonds (Delta Air Lines) | 4.00 | 10/1/2030 | 2,500,000 | 2,485,753 | |||||
New York Transportation Development Corp., Revenue Bonds (JFK International Air Terminal) | 5.00 | 12/1/2035 | 3,850,000 | 4,073,832 | |||||
New York Transportation Development Corp., Revenue Bonds (LaGuardia Airport Terminal B Redevelopment Project) Ser. A | 5.00 | 7/1/2034 | 1,000,000 | 999,950 | |||||
New York Transportation Development Corp., Revenue Bonds (Sustainable Bond) (Insured; Assured Guaranty Municipal Corp.) | 5.50 | 6/30/2043 | 800,000 | 857,450 | |||||
Port Authority of New York & New Jersey, Revenue Bonds, Refunding | 5.00 | 1/15/2035 | 2,000,000 | 2,156,516 | |||||
TSASC, Revenue Bonds, Refunding, Ser. A | 5.00 | 6/1/2032 | 3,000,000 | 3,102,726 | |||||
30,122,210 | |||||||||
North Carolina - .8% | |||||||||
Charlotte Airport, Revenue Bonds, Refunding, Ser. B | 5.00 | 7/1/2038 | 1,360,000 | 1,451,775 | |||||
North Carolina Medical Care Commission, Revenue Bonds (The United Methodist Retirement Homes Inc Obligated Group) Ser. A | 5.00 | 10/1/2039 | 500,000 | 526,589 | |||||
The Charlotte-Mecklenburg Hospital Authority, Revenue Bonds (Atrium Health Obligated Group) | 5.00 | 12/1/2028 | 1,000,000 | a | 1,054,130 | ||||
3,032,494 | |||||||||
Ohio - 5.5% | |||||||||
Buckeye Tobacco Settlement Financing Authority, Revenue Bonds, Refunding, Ser. A2 | 5.00 | 6/1/2034 | 3,075,000 | 3,252,566 | |||||
Ohio, Revenue Bonds (Childrens Hospital Center) Ser. B | 5.00 | 8/15/2032 | 1,000,000 | a | 1,086,758 | ||||
Ohio, Revenue Bonds (Cleveland Clinic Health System Obligated Group) | 2.75 | 5/1/2028 | 1,500,000 | a | 1,437,629 | ||||
Ohio, Revenue Bonds, Refunding (Cleveland Clinic Health Systems Obligated Group) Ser. A | 5.00 | 1/1/2031 | 1,250,000 | 1,312,966 | |||||
Ohio, Revenue Bonds, Refunding, Ser. A | 5.00 | 1/15/2033 | 1,650,000 | 1,748,311 | |||||
Ohio Water Development Authority, Revenue Bonds, Ser. A | 5.00 | 12/1/2041 | 2,750,000 | 3,043,563 | |||||
Ohio Water Development Authority Water Pollution Control Loan Fund, Revenue Bonds (Sustainable Bond) Ser. A | 5.00 | 12/1/2041 | 1,500,000 | 1,667,126 | |||||
Ohio Water Development Authority Water Pollution Control Loan Fund, Revenue Bonds (Sustainable Bond) Ser. B | 5.00 | 12/1/2042 | 3,500,000 | 3,835,365 | |||||
Sycamore Community School District, GO, Refunding | 4.00 | 12/1/2030 | 4,115,000 | 4,243,038 | |||||
21,627,322 | |||||||||
Oregon - 2.0% | |||||||||
Medford Hospital Facilities Authority, Revenue Bonds, Refunding (Asante Project) Ser. A | 5.00 | 8/15/2033 | 500,000 | 534,517 | |||||
Oregon, GO (Article XI Q Project) Ser. A | 5.00 | 5/1/2040 | 1,500,000 | 1,664,258 | |||||
7
Statement of Investments (continued)
Description | Coupon | Maturity Date | Principal Amount ($) | Value ($) | |||||
Long-Term Municipal Investments - 98.4% (continued) | |||||||||
Oregon - 2.0% (continued) | |||||||||
Oregon Facilities Authority, Revenue Bonds, Refunding (Legacy Health Project) Ser. A | 5.00 | 6/1/2035 | 2,500,000 | 2,539,733 | |||||
Portland Sewer System, Revenue Bonds, Ser. A | 3.00 | 3/1/2036 | 3,500,000 | 3,099,246 | |||||
7,837,754 | |||||||||
Pennsylvania - 9.1% | |||||||||
Clairton Municipal Authority, Revenue Bonds, Refunding, Ser. B | 5.00 | 12/1/2030 | 1,675,000 | d | 1,741,033 | ||||
Commonwealth Financing Authority, Revenue Bonds (Tobacco Master Settlement Payment) | 5.00 | 6/1/2031 | 2,500,000 | 2,616,619 | |||||
Luzerne County Industrial Development Authority, Revenue Bonds, Refunding (Pennsylvania-American Water Co.) | 2.45 | 12/3/2029 | 1,000,000 | a | 884,891 | ||||
Montgomery County Higher Education & Health Authority, Revenue Bonds, Refunding (Thomas Jefferson University Obligated Group) Ser. A | 5.00 | 9/1/2032 | 1,000,000 | 1,035,651 | |||||
Pennsylvania Economic Development Financing Authority, Revenue Bonds (The Penndot Major Bridges) | 5.00 | 12/31/2033 | 4,125,000 | 4,464,225 | |||||
Pennsylvania Higher Education Assistance Agency, Revenue Bonds, Ser. A | 5.00 | 6/1/2031 | 1,000,000 | 1,051,015 | |||||
Pennsylvania Turnpike Commission, Revenue Bonds, Refunding | 5.00 | 12/1/2032 | 1,200,000 | 1,251,272 | |||||
Pennsylvania Turnpike Commission, Revenue Bonds, Refunding | 5.00 | 12/1/2031 | 2,400,000 | 2,506,720 | |||||
Philadelphia, GO, Ser. A | 5.00 | 5/1/2033 | 3,080,000 | 3,342,729 | |||||
Philadelphia Airport, Revenue Bonds, Refunding, Ser. B | 5.00 | 7/1/2031 | 1,000,000 | 1,019,878 | |||||
Philadelphia Water & Wastewater, Revenue Bonds, Refunding | 5.00 | 10/1/2033 | 1,500,000 | 1,638,464 | |||||
Philadelphia Water & Wastewater, Revenue Bonds, Refunding, Ser. B | 4.00 | 7/1/2035 | 2,000,000 | 2,001,531 | |||||
Southeastern Pennsylvania Transportation Authority, Revenue Bonds | 5.25 | 6/1/2039 | 1,700,000 | 1,894,075 | |||||
The Philadelphia School District, GO (Insured; State Aid Withholding) Ser. A | 4.00 | 9/1/2037 | 2,725,000 | 2,746,407 | |||||
The Philadelphia School District, GO (Insured; State Aid Withholding) Ser. A | 4.00 | 9/1/2035 | 1,500,000 | 1,511,367 | |||||
The Philadelphia School District, GO (Insured; State Aid Withholding) Ser. A | 5.00 | 9/1/2032 | 2,000,000 | 2,090,337 | |||||
The Philadelphia School District, GO (Insured; State Aid Withholding) Ser. A | 5.25 | 9/1/2036 | 1,250,000 | 1,392,216 | |||||
The Philadelphia School District, GO, Refunding (Insured; State Aid Withholding) Ser. F | 5.00 | 9/1/2030 | 2,490,000 | 2,541,016 | |||||
The Philadelphia School District, GO, Refunding (Insured; State Aid Withholding) Ser. F | 5.00 | 9/1/2026 | 10,000 | c | 10,340 | ||||
35,739,786 | |||||||||
Rhode Island - 1.2% | |||||||||
Rhode Island Health & Educational Building Corp., Revenue Bonds (Central Falls Public School) | 4.00 | 5/15/2043 | 5,000,000 | 4,764,017 | |||||
South Carolina - .8% | |||||||||
South Carolina Ports Authority, Revenue Bonds | 5.00 | 7/1/2031 | 2,000,000 | 2,073,566 | |||||
South Carolina Public Service Authority, Revenue Bonds, Refunding, Ser. A | 4.00 | 12/1/2036 | 1,000,000 | 996,553 | |||||
3,070,119 | |||||||||
Tennessee - 1.3% | |||||||||
Tennessee Energy Acquisition Corp., Revenue Bonds | 4.00 | 11/1/2025 | 2,000,000 | a | 1,998,702 | ||||
Tennessee Energy Acquisition Corp., Revenue Bonds, Ser. A | 5.25 | 9/1/2026 | 1,505,000 | 1,535,412 | |||||
The Metropolitan Nashville Airport Authority, Revenue Bonds, Ser. B | 5.00 | 7/1/2030 | 1,350,000 | 1,430,178 | |||||
4,964,292 | |||||||||
8
Description | Coupon | Maturity Date | Principal Amount ($) | Value ($) | |||||
Long-Term Municipal Investments - 98.4% (continued) | |||||||||
Texas - 10.3% | |||||||||
Arlington, Special Tax Bonds, Refunding (Insured; Assured Guaranty Municipal Corp.) | 5.00 | 2/15/2034 | 1,500,000 | 1,507,013 | |||||
Dayton Independent School District, GO (Insured; Permanent School Fund Guarantee Program) | 4.00 | 2/15/2040 | 2,000,000 | 1,950,958 | |||||
Garland Independent School District, GO (Insured; Permanent School Fund Guarantee Program) Ser. A | 5.00 | 2/15/2042 | 1,500,000 | 1,628,055 | |||||
Georgetown Utility System, Revenue Bonds (Insured; Assured Guaranteed Municipal Corp.) | 5.00 | 8/15/2035 | 1,000,000 | 1,096,093 | |||||
Harris County-Houston Sports Authority, Revenue Bonds, Refunding, Ser. A | 5.00 | 11/15/2029 | 2,325,000 | 2,331,260 | |||||
Harris County-Houston Sports Authority, Revenue Bonds, Refunding, Ser. A | 5.00 | 11/15/2028 | 2,770,000 | 2,778,125 | |||||
Houston Airport System, Revenue Bonds, Refunding (Insured; Assured Guaranteed Municipal Corp.) Ser. B | 5.00 | 7/1/2032 | 1,685,000 | 1,886,013 | |||||
Lower Colorado River Authority, Revenue Bonds, Refunding (LCRA Transmission Services Corp.) | 5.00 | 5/15/2032 | 2,000,000 | 2,133,001 | |||||
Lower Colorado River Authority, Revenue Bonds, Refunding (LCRA Transmission Services Corp.) | 5.00 | 5/15/2037 | 3,225,000 | 3,370,592 | |||||
New Hope Cultural Educational Facilities Finance Corp., Revenue Bonds, Refunding (Children's Health System Project) Ser. A | 5.00 | 8/15/2029 | 1,750,000 | 1,820,997 | |||||
North Texas Tollway Authority, Revenue Bonds, Refunding, Ser. A | 5.00 | 1/1/2031 | 3,000,000 | 3,015,286 | |||||
Northwest Independent School District, GO (Insured; Permanent School Fund Guarantee Program) | 4.00 | 2/15/2042 | 5,000,000 | 4,964,191 | |||||
Plano Independent School District, GO | 5.00 | 2/15/2043 | 1,000,000 | 1,074,165 | |||||
Tarrant County Cultural Education Facilities Finance Corp., Revenue Bonds (CHRISTUS Health Obligated Group) Ser. A | 5.00 | 7/1/2032 | 1,500,000 | a | 1,651,343 | ||||
Tarrant County Cultural Education Facilities Finance Corp., Revenue Bonds, Refunding (Baylor Scott & White Health Project) Ser. A | 5.00 | 11/15/2031 | 1,400,000 | 1,424,459 | |||||
Texas Municipal Gas Acquisition & Supply Corp. IV, Revenue Bonds, Ser. B | 5.50 | 1/1/2034 | 5,465,000 | a | 6,030,890 | ||||
University of Texas System Board of Regents, Revenue Bonds, Refunding, Ser. A | 5.00 | 8/15/2037 | 1,600,000 | 1,817,546 | |||||
40,479,987 | |||||||||
U.S. Related - .7% | |||||||||
Puerto Rico, GO, Ser. A1 | 5.63 | 7/1/2029 | 2,430,000 | 2,615,532 | |||||
Utah - 2.2% | |||||||||
Intermountain Power Agency, Revenue Bonds, Ser. A | 5.00 | 7/1/2038 | 3,000,000 | 3,311,222 | |||||
Salt Lake City, Revenue Bonds, Ser. A | 5.00 | 7/1/2036 | 5,000,000 | 5,091,837 | |||||
8,403,059 | |||||||||
Virginia - 1.0% | |||||||||
Virginia Commonwealth Transportation Board, Revenue Bonds, Refunding (Trans Capital Project) | 4.00 | 5/15/2035 | 2,855,000 | 2,945,289 | |||||
Virginia Small Business Financing Authority, Revenue Bonds, Refunding | 5.00 | 12/31/2042 | 1,000,000 | 1,028,348 | |||||
3,973,637 | |||||||||
Washington - 6.0% | |||||||||
Energy Northwest, Revenue Bonds, Refunding (Columbia Generating Station) | 5.00 | 7/1/2040 | 1,000,000 | 1,084,882 | |||||
Energy Northwest, Revenue Bonds, Refunding (Project 1) Ser. A | 5.00 | 7/1/2035 | 4,000,000 | 4,474,319 | |||||
King County Public Hospital District No. 1, GO, Refunding (Valley Medical Center) | 5.00 | 12/1/2030 | 6,930,000 | 7,079,545 | |||||
Port of Seattle, Revenue Bonds | 5.00 | 4/1/2028 | 1,500,000 | 1,554,828 | |||||
Port of Seattle, Revenue Bonds, Refunding | 5.00 | 8/1/2041 | 1,000,000 | 1,045,693 | |||||
Washington, GO, Refunding, Ser. R | 4.00 | 7/1/2036 | 2,270,000 | 2,348,181 | |||||
9
Statement of Investments (continued)
Description | Coupon | Maturity Date | Principal Amount ($) | Value ($) | |||||
Long-Term Municipal Investments - 98.4% (continued) | |||||||||
Washington - 6.0% (continued) | |||||||||
Washington, GO, Ser. B | 5.00 | 2/1/2043 | 2,500,000 | 2,717,714 | |||||
Washington Convention Center Public Facilities District, Revenue Bonds | 5.00 | 7/1/2033 | 1,330,000 | 1,368,621 | |||||
Washington Housing Finance Commission, Revenue Bonds, Refunding (Emerald Heights Project) Ser. A | 5.00 | 7/1/2038 | 1,590,000 | 1,676,321 | |||||
23,350,104 | |||||||||
Wisconsin - 3.0% | |||||||||
Milwaukee, GO (Insured; Assured Guarantee Municipal Corp.) Ser. B4 | 5.00 | 4/1/2036 | 1,515,000 | 1,671,437 | |||||
Public Finance Authority, Revenue Bonds (Astro Texas Land Project) | 5.50 | 12/15/2028 | 1,250,000 | b | 1,250,447 | ||||
Public Finance Authority, Revenue Bonds (KU Campus Development Project) | 5.00 | 3/1/2036 | 4,500,000 | 4,580,873 | |||||
Wisconsin Health & Educational Facilities Authority, Revenue Bonds, Refunding (Children's Hospital of Wisconsin Obligated Group) | 5.00 | 8/15/2034 | 1,835,000 | 1,901,245 | |||||
Wisconsin Health & Educational Facilities Authority, Revenue Bonds, Refunding (ProHealth Care Obligated Group) | 5.00 | 8/15/2033 | 2,250,000 | 2,253,449 | |||||
11,657,451 | |||||||||
Total Long-Term Municipal Investments | 385,507,660 | ||||||||
Total Investments (cost $399,012,821) | 99.0% | 387,806,664 | |||||||
Cash and Receivables (Net) | 1.0% | 3,846,865 | |||||||
Net Assets | 100.0% | 391,653,529 | |||||||
a These securities have a put feature; the date shown represents the put date and the bond holder can take a specific action to retain the bond after the put date.
b Security exempt from registration pursuant to Rule 144A under the Securities Act of 1933. These securities may be resold in transactions exempt from registration, normally to qualified institutional buyers. At May 31, 2024, these securities were valued at $2,262,670 or .58% of net assets.
c These securities are prerefunded; the date shown represents the prerefunded date. Bonds which are prerefunded are collateralized by U.S. Government securities which are held in escrow and are used to pay principal and interest on the municipal issue and to retire the bonds in full at the earliest refunding date.
d Security purchased on a when-issued or delayed basis for which the fund has not taken delivery as of May 31, 2024.
10
Summary of Abbreviations (Unaudited) | |||
ABAG | Association of Bay Area Governments | AGC | ACE Guaranty Corporation |
AGIC | Asset Guaranty Insurance Company | AMBAC | American Municipal Bond Assurance Corporation |
BAN | Bond Anticipation Notes | BSBY | Bloomberg Short-Term Bank Yield Index |
CIFG | CDC Ixis Financial Guaranty | COP | Certificate of Participation |
CP | Commercial Paper | DRIVERS | Derivative Inverse Tax-Exempt Receipts |
EFFR | Effective Federal Funds Rate | FGIC | Financial Guaranty Insurance Company |
FHA | Federal Housing Administration | FHLB | Federal Home Loan Bank |
FHLMC | Federal Home Loan Mortgage Corporation | FNMA | Federal National Mortgage Association |
GAN | Grant Anticipation Notes | GIC | Guaranteed Investment Contract |
GNMA | Government National Mortgage Association | GO | General Obligation |
IDC | Industrial Development Corporation | LOC | Letter of Credit |
LR | Lease Revenue | NAN | Note Anticipation Notes |
MFHR | Multi-Family Housing Revenue | MFMR | Multi-Family Mortgage Revenue |
MUNIPSA | Securities Industry and Financial Markets Association Municipal Swap Index Yield | OBFR | Overnight Bank Funding Rate |
PILOT | Payment in Lieu of Taxes | PRIME | Prime Lending Rate |
PUTTERS | Puttable Tax-Exempt Receipts | RAC | Revenue Anticipation Certificates |
RAN | Revenue Anticipation Notes | RIB | Residual Interest Bonds |
SFHR | Single Family Housing Revenue | SFMR | Single Family Mortgage Revenue |
SOFR | Secured Overnight Financing Rate | TAN | Tax Anticipation Notes |
TRAN | Tax and Revenue Anticipation Notes | TSFR | Term Secured Overnight |
USBMMY | U.S. Treasury Bill Money Market Yield | U.S. T-BILL | U.S. Treasury Bill |
XLCA | XL Capital Assurance | ||
See notes to financial statements.
11
STATEMENT OF ASSETS AND LIABILITIES
May 31, 2024
|
|
|
|
|
|
|
|
|
| Cost |
| Value |
|
Assets ($): |
|
|
|
| ||
Investments in securities—See Statement of Investments | 399,012,821 |
| 387,806,664 |
| ||
Cash |
|
|
|
| 4,439,373 |
|
Interest receivable |
| 5,821,666 |
| |||
Receivable for shares of Common Stock subscribed |
| 5,990 |
| |||
Prepaid expenses |
|
|
|
| 28,981 |
|
|
|
|
|
| 398,102,674 |
|
Liabilities ($): |
|
|
|
| ||
Due to BNY Mellon Investment Adviser, Inc. and affiliates—Note 3(b) |
| 176,817 |
| |||
Payable for investment securities purchased |
| 6,005,694 |
| |||
Payable for shares of Common Stock redeemed |
| 176,881 |
| |||
Directors’ fees and expenses payable |
| 7,080 |
| |||
Other accrued expenses |
|
|
|
| 82,673 |
|
|
|
|
|
| 6,449,145 |
|
Net Assets ($) |
|
| 391,653,529 |
| ||
Composition of Net Assets ($): |
|
|
|
| ||
Paid-in capital |
|
|
|
| 406,885,218 |
|
Total distributable earnings (loss) |
|
|
|
| (15,231,689) |
|
Net Assets ($) |
|
| 391,653,529 |
| ||
Shares Outstanding |
|
| ||
(300 million shares of $.001 par value Common Stock authorized) | 31,344,689 |
| ||
Net Asset Value Per Share ($) |
| 12.50 |
| |
|
|
|
|
|
See notes to financial statements. |
|
|
|
|
12
STATEMENT OF OPERATIONS
Year Ended May 31, 2024
|
|
|
|
|
|
|
|
|
|
|
|
|
|
Investment Income ($): |
|
|
|
| ||
Interest Income |
|
| 13,163,681 |
| ||
Expenses: |
|
|
|
| ||
Management fee—Note 3(a) |
|
| 2,254,166 |
| ||
Shareholder servicing costs—Note 3(b) |
|
| 439,423 |
| ||
Professional fees |
|
| 97,301 |
| ||
Directors’ fees and expenses—Note 3(c) |
|
| 41,063 |
| ||
Registration fees |
|
| 34,049 |
| ||
Prospectus and shareholders’ reports |
|
| 22,066 |
| ||
Chief Compliance Officer fees—Note 3(b) |
|
| 20,995 |
| ||
Loan commitment fees—Note 2 |
|
| 9,791 |
| ||
Custodian fees—Note 3(b) |
|
| 8,690 |
| ||
Miscellaneous |
|
| 43,448 |
| ||
Total Expenses |
|
| 2,970,992 |
| ||
Less—reduction in expenses due to undertaking—Note 3(a) |
|
| (125,173) |
| ||
Less—reduction in fees due to earnings credits—Note 3(b) |
|
| (93,081) |
| ||
Net Expenses |
|
| 2,752,738 |
| ||
Net Investment Income |
|
| 10,410,943 |
| ||
Realized and Unrealized Gain (Loss) on Investments—Note 4 ($): |
|
| ||||
Net realized gain (loss) on investments | (2,082,228) |
| ||||
Net change in unrealized appreciation (depreciation) on investments | 2,700,321 |
| ||||
Net Realized and Unrealized Gain (Loss) on Investments |
|
| 618,093 |
| ||
Net Increase in Net Assets Resulting from Operations |
| 11,029,036 |
| |||
|
|
|
|
|
|
|
See notes to financial statements. | ||||||
13
STATEMENT OF CHANGES IN NET ASSETS
|
|
|
| Year Ended May 31, | |||||
|
|
|
| 2024 |
| 2023 |
| ||
Operations ($): |
|
|
|
|
|
|
|
| |
Net investment income |
|
| 10,410,943 |
|
|
| 9,882,704 |
| |
Net realized gain (loss) on investments |
| (2,082,228) |
|
|
| (2,061,754) |
| ||
Net change in unrealized appreciation |
| 2,700,321 |
|
|
| (5,038,223) |
| ||
Net Increase (Decrease) in Net Assets | 11,029,036 |
|
|
| 2,782,727 |
| |||
Distributions ($): |
| ||||||||
Distributions to shareholders |
|
| (10,640,060) |
|
|
| (11,679,365) |
| |
Capital Stock Transactions ($): |
| ||||||||
Net proceeds from shares sold |
|
| 11,827,611 |
|
|
| 16,163,760 |
| |
Distributions reinvested |
|
| 8,852,838 |
|
|
| 9,754,038 |
| |
Cost of shares redeemed |
|
| (73,392,272) |
|
|
| (67,110,913) |
| |
Increase (Decrease) in Net Assets | (52,711,823) |
|
|
| (41,193,115) |
| |||
Total Increase (Decrease) in Net Assets | (52,322,847) |
|
|
| (50,089,753) |
| |||
Net Assets ($): |
| ||||||||
Beginning of Period |
|
| 443,976,376 |
|
|
| 494,066,129 |
| |
End of Period |
|
| 391,653,529 |
|
|
| 443,976,376 |
| |
Capital Share Transactions (Shares): |
| ||||||||
Shares sold |
|
| 947,925 |
|
|
| 1,286,255 |
| |
Shares issued for distributions reinvested |
|
| 706,514 |
|
|
| 780,474 |
| |
Shares redeemed |
|
| (5,865,000) |
|
|
| (5,363,033) |
| |
Net Increase (Decrease) in Shares Outstanding | (4,210,561) |
|
|
| (3,296,304) |
| |||
|
|
|
|
|
|
|
|
|
|
See notes to financial statements. | |||||||||
14
FINANCIAL HIGHLIGHTS
The following table describes the performance for the fiscal periods indicated. Net asset value total return is calculated assuming an initial investment made at the net asset value at the beginning of the period, reinvestment of all dividends and distributions at net asset value during the period, and redemption at net asset value on the last day of the period. Net asset value total return includes adjustments in accordance with accounting principles generally accepted in the United States of America and as such, the net asset value for financial reporting purposes and the returns based upon those net asset values may differ from the net asset value and returns for shareholder transactions.
Year Ended May 31, | ||||||
2024 | 2023 | 2022 | 2021 | 2020 | ||
Per Share Data ($): | ||||||
Net asset value, beginning of period | 12.49 | 12.72 | 13.96 | 13.61 | 13.72 | |
Investment Operations: | ||||||
Net investment incomea | .31 | .27 | .27 | .29 | .31 | |
Net realized and unrealized | .02 | (.19) | (1.19) | .39 | (.01) | |
Total from Investment Operations | .33 | .08 | (.92) | .68 | .30 | |
Distributions: | ||||||
Dividends from net | (.31) | (.28) | (.27) | (.28) | (.31) | |
Dividends from net realized | (.01) | (.03) | (.05) | (.05) | (.10) | |
Total Distributions | (.32) | (.31) | (.32) | (.33) | (.41) | |
Net asset value, end of period | 12.50 | 12.49 | 12.72 | 13.96 | 13.61 | |
Total Return (%) | 2.66 | .69 | (6.69) | 5.09 | 2.15 | |
Ratios/Supplemental Data (%): | ||||||
Ratio of total expenses | .71 | .76 | .75 | .74 | .74 | |
Ratio of net expenses | .66 | .70 | .72 | .74 | .74 | |
Ratio of net investment income | 2.49 | 2.12 | 2.00 | 2.07 | 2.22 | |
Portfolio Turnover Rate | 19.15 | 14.58 | 8.68 | 8.59 | 16.30 | |
Net Assets, end of period ($ x 1,000) | 391,654 | 443,976 | 494,066 | 577,833 | 570,421 | |
a Based on average shares outstanding.
See notes to financial statements.
15
NOTES TO FINANCIAL STATEMENTS
NOTE 1—Significant Accounting Policies:
BNY Mellon Intermediate Municipal Bond Fund, Inc. (the “fund”), which is registered under the Investment Company Act of 1940, as amended (the “Act”), is a diversified open-end management investment company. The fund’s investment objective is to seek the maximum amount of current income exempt from federal income tax as is consistent with the preservation of capital. BNY Mellon Investment Adviser, Inc. (the “Adviser”), a wholly-owned subsidiary of The Bank of New York Mellon Corporation (“BNY”), serves as the fund’s investment adviser. Insight North America LLC (the “Sub-Adviser”), an indirect wholly-owned subsidiary of BNY and an affiliate of the Adviser, serves as the fund’s sub-adviser. BNY Mellon Securities Corporation (the “Distributor”), a wholly-owned subsidiary of the Adviser, is the distributor of the fund’s shares, which are sold to the public without a sales charge.
The Financial Accounting Standards Board (“FASB”) Accounting Standards Codification (“ASC”) is the exclusive reference of authoritative U.S. generally accepted accounting principles (“GAAP”) recognized by the FASB to be applied by nongovernmental entities. Rules and interpretive releases of the SEC under authority of federal laws are also sources of authoritative GAAP for SEC registrants. The fund is an investment company and applies the accounting and reporting guidance of the FASB ASC Topic 946 Financial Services-Investment Companies. The fund’s financial statements are prepared in accordance with GAAP, which may require the use of management estimates and assumptions. Actual results could differ from those estimates.
The fund enters into contracts that contain a variety of indemnifications. The fund’s maximum exposure under these arrangements is unknown. The fund does not anticipate recognizing any loss related to these arrangements.
(a) Portfolio valuation: The fair value of a financial instrument is the amount that would be received to sell an asset or paid to transfer a liability in an orderly transaction between market participants at the measurement date (i.e., the exit price). GAAP establishes a fair value hierarchy that prioritizes the inputs of valuation techniques used to measure fair value. This hierarchy gives the highest priority to unadjusted quoted prices in active markets for identical assets or liabilities (Level 1 measurements) and the lowest priority to unobservable inputs (Level 3 measurements).
Additionally, GAAP provides guidance on determining whether the volume and activity in a market has decreased significantly and whether such a decrease in activity results in transactions that are not orderly. GAAP requires enhanced disclosures around valuation inputs and techniques used during annual and interim periods.
Various inputs are used in determining the value of the fund’s investments relating to fair value measurements. These inputs are summarized in the three broad levels listed below:
Level 1—unadjusted quoted prices in active markets for identical investments.
Level 2—other significant observable inputs (including quoted prices for similar investments, interest rates, prepayment speeds, credit risk, etc.).
Level 3—significant unobservable inputs (including the fund’s own assumptions in determining the fair value of investments).
The inputs or methodology used for valuing securities are not necessarily an indication of the risk associated with investing in those securities.
Changes in valuation techniques may result in transfers in or out of an assigned level within the disclosure hierarchy. Valuation techniques used to value the fund’s investments are as follows:
The fund’s Board of Directors (the “Board”) has designated the Adviser as the fund’s valuation designee to make all fair value determinations with respect to the fund’s portfolio investments, subject to the Board’s oversight and pursuant to Rule 2a-5 under the Act.
Investments in municipal securities are valued each business day by an independent pricing service (the “Service”) approved by the Board. Investments for which quoted bid prices are readily available and are representative of the bid side of the market in the judgment of the Service are valued at the mean between the quoted bid prices (as obtained by the Service from dealers in such securities) and asked prices (as calculated by the Service based upon its evaluation of the market for such securities). Municipal investments (which constitute a majority of the portfolio securities) are carried at fair value as determined by the Service, based on methods which include consideration of the following: yields or prices of municipal securities of comparable quality, coupon, maturity and type; indications as to values from dealers; and general market conditions. The Service is engaged under the general oversight of the Board. All of the preceding securities are generally categorized within Level 2 of the fair value hierarchy.
16
When market quotations or official closing prices are not readily available, or are determined not to accurately reflect fair value, such as when the value of a security has been significantly affected by events after the close of the exchange or market on which the security is principally traded, but before the fund calculates its net asset value, the fund may value these investments at fair value as determined in accordance with the procedures approved by the Board. Certain factors may be considered when fair valuing investments such as: fundamental analytical data, the nature and duration of restrictions on disposition, an evaluation of the forces that influence the market in which the securities are purchased and sold, and public trading in similar securities of the issuer or comparable issuers. These securities are either categorized within Level 2 or 3 of the fair value hierarchy depending on the relevant inputs used.
For securities where observable inputs are limited, assumptions about market activity and risk are used and such securities are generally categorized within Level 3 of the fair value hierarchy.
The following is a summary of the inputs used as of May 31, 2024 in valuing the fund’s investments:
Level 1-Unadjusted Quoted Prices | Level 2- Other Significant Observable Inputs | Level 3-Significant Unobservable Inputs | Total | |||
Assets ($) | ||||||
Investments in Securities:† | ||||||
Collateralized Municipal-Backed Securities | - | 2,299,004 | - | 2,299,004 | ||
Municipal Securities | - | 385,507,660 | - | 385,507,660 | ||
† See Statement of Investments for additional detailed categorizations, if any.
(b) Securities transactions and investment income: Securities transactions are recorded on a trade date basis. Realized gains and losses from securities transactions are recorded on the identified cost basis. Interest income, adjusted for accretion of discount and amortization of premium on investments, is earned from settlement date and recognized on the accrual basis. Securities purchased or sold on a when-issued or delayed delivery basis may be settled a month or more after the trade date.
(c) Market Risk: The value of the securities in which the fund invests may be affected by political, regulatory, economic and social developments, and developments that impact specific economic sectors, industries or segments of the market. In addition, turbulence in financial markets and reduced liquidity in equity, credit and/or fixed-income markets may negatively affect many issuers, which could adversely affect the fund. Global economies and financial markets are becoming increasingly interconnected, and conditions and events in one country, region or financial market may adversely impact issuers in a different country, region or financial market. These risks may be magnified if certain events or developments adversely interrupt the global supply chain; in these and other circumstances, such risks might affect companies world-wide.
Municipal Securities Risk: The amount of public information available about municipal securities is generally less than that for corporate equities or bonds. Special factors, such as legislative changes, and state and local economic and business developments, may adversely affect the yield and/or value of the fund’s investments in municipal securities. Other factors include the general conditions of the municipal securities market, the size of the particular offering, the maturity of the obligation and the rating of the issue. Changes in economic, business or political conditions relating to a particular municipal project, municipality, or state, territory or possession of the United States in which the fund invests may have an impact on the fund’s share price. Any such credit impairment could adversely impact the value of their bonds, which could negatively impact the performance of the fund.
(d) Dividends and distributions to shareholders: It is the policy of the fund to declare dividends daily from net investment income. Such dividends are paid monthly. Dividends from net realized capital gains, if any, are normally declared and paid annually, but the fund may make distributions on a more frequent basis to comply with the distribution requirements of the Internal Revenue Code of 1986, as amended (the “Code”). To the extent that net realized capital gains can be offset by capital loss carryovers, it is the policy of the fund not to distribute such gains. Income and capital gain distributions are determined in accordance with income tax regulations, which may differ from GAAP.
(e) Federal income taxes: It is the policy of the fund to continue to qualify as a regulated investment company, which can distribute tax-exempt dividends, by complying with the applicable provisions of the Code, and to make distributions of income and net realized capital gain sufficient to relieve it from substantially all federal income and excise taxes.
As of and during the period ended May 31, 2024, the fund did not have any liabilities for any uncertain tax positions. The fund recognizes interest and penalties, if any, related to uncertain tax positions as income tax expense in the Statement of Operations. During the period ended May 31, 2024, the fund did not incur any interest or penalties.
17
NOTES TO FINANCIAL STATEMENTS (continued)
Each tax year in the four–year period ended May 31, 2024 remains subject to examination by the Internal Revenue Service and state taxing authorities.
At May 31, 2024, the components of accumulated earnings on a tax basis were as follows: undistributed tax-exempt income $1,093,589, accumulated capital losses $4,809,537 and unrealized depreciation $11,515,741.
The fund is permitted to carry forward capital losses for an unlimited period. Furthermore, capital loss carryovers retain their character as either short-term or long-term capital losses.
The accumulated capital loss carryover is available for federal income tax purposes to be applied against future net realized capital gains, if any, realized subsequent to May 31, 2024. The fund has $774,843 of short-term capital losses and $4,034,694 of long-term capital losses which can be carried forward for an unlimited period.
The tax character of distributions paid to shareholders during the fiscal years ended May 31, 2024 and May 31, 2023 were as follows: tax-exempt income $10,369,551 and $10,487,939, ordinary income $270,509 and $68,729, and long-term capital gains $0 and $1,122,697, respectively.
NOTE 2—Bank Lines of Credit:
The fund participates with other long-term open-end funds managed by the Adviser in a $738 million unsecured credit facility led by Citibank, N.A. (the “Citibank Credit Facility”) and a $300 million unsecured credit facility provided by BNY (the “BNY Credit Facility”), each to be utilized primarily for temporary or emergency purposes, including the financing of redemptions (each, a “Facility”). The Citibank Credit Facility is available in two tranches: (i) Tranche A is in an amount equal to $618 million and is available to all long-term open-ended funds, including the fund, and (ii) Tranche B is an amount equal to $120 million and is available only to BNY Mellon Floating Rate Income Fund, a series of BNY Mellon Investment Funds IV, Inc. Prior to September 27, 2023, the Citibank Credit Facility was $823.5 million with Tranche A available in an amount equal to $688.5 million and Tranche B available in an amount equal to $135 million. In connection therewith, the fund has agreed to pay its pro rata portion of commitment fees for Tranche A of the Citibank Credit Facility and the BNY Credit Facility. Interest is charged to the fund based on rates determined pursuant to the terms of the respective Facility at the time of borrowing. During the period ended May 31, 2024, the fund did not borrow under the Facilities.
NOTE 3—Management Fee, Sub-Advisory Fee and Other Transactions with Affiliates:
(a) Pursuant to a management agreement (the “Agreement”) with the Adviser, the management fee is computed at the annual rate of .45% of the value of the fund’s average daily net assets and is payable monthly. Effective January 1, 2024, the Board approved a reduction in the management fee payable to the Adviser from an annual rate of .60% to an annual rate of .45% of the value of the fund’s average daily net assets. The Agreement provides that if in any fiscal year the aggregate expenses of the fund (excluding taxes, brokerage commissions, interest expense and extraordinary expenses) exceed 1½% of the value of the fund’s average daily net assets, the fund may deduct from the fees paid to the Adviser, or the Adviser will bear such excess expense. During the period ended May 31, 2024, there was no expense reimbursement pursuant to the Agreement.
The Adviser had contractually agreed, from June 1, 2023 through September 30, 2023, to waive receipt of a portion of its management fee in the amount of .05% of the value of the fund’s average daily net assets. The Adviser had also agreed, from October 1, 2023 through December 31, 2023 to waive receipt of a portion of its management fee, in the amount of .05% of the value of the fund’s average daily net assets. This waiver was voluntary, not contractual and was terminated at January 1, 2024. The reduction in expenses, pursuant to the undertaking, amounted to $125,173 during the period ended May 31, 2024.
Pursuant to a sub-investment advisory agreement between the Adviser and the Sub-Adviser, the Adviser pays the Sub-Adviser a monthly fee at an annual rate of .216% of the value of the fund’s average daily net assets Effective January 1, 2024, the Board approved a reduction in the sub-adviser fee payable to the Sub-Adviser from an annual rate of .288% to an annual rate of .216% of the value of the fund’s average daily.
(b) Under the Shareholder Services Plan, the fund reimburses the Distributor at an amount not to exceed an annual rate of .25% of the value of the fund’s average daily net assets for certain allocated expenses of providing certain services. These services provided may include personal services relating to shareholder accounts, such as answering shareholder inquiries regarding the fund, and services related to the maintenance of shareholder accounts. During the period ended May 31, 2024, the fund was charged $250,492 pursuant to the Shareholder Services Plan.
The fund has arrangements with BNY Mellon Transfer, Inc., (the “Transfer Agent”) and The Bank of New York Mellon (the “Custodian”), both a subsidiary of BNY and an affiliate of the Adviser, whereby the fund may receive earnings credits when positive
18
cash balances are maintained, which are used to offset Transfer Agent and Custodian fees. For financial reporting purposes, the fund includes transfer agent net earnings credits, if any, and custody net earnings credits, if any, as an expense offset in the Statement of Operations.
The fund compensates the Transfer Agent, under a transfer agency agreement, for providing transfer agency and cash management services for the fund. The majority of Transfer Agent fees are comprised of amounts paid on a per account basis, while cash management fees are related to fund subscriptions and redemptions. During the period ended May 31, 2024, the fund was charged $108,032 for transfer agency services. These fees are included in Shareholder servicing costs in the Statement of Operations. These fees were partially offset by earnings credits of $84,391.
The fund compensates the Custodian, under a custody agreement, for providing custodial services for the fund. These fees are determined based on net assets, geographic region and transaction activity. During the period ended May 31, 2024, the fund was charged $8,690 pursuant to the custody agreement. These fees were offset by earnings credits of $8,690.
The fund compensates the Custodian, under a shareholder redemption draft processing agreement, for providing certain services related to the fund’s check writing privilege. During the period ended May 31, 2024, the fund was charged $7,541 pursuant to the agreement, which is included in Shareholder servicing costs in the Statement of Operations.
During the period ended May 31, 2024, the fund was charged $20,995 for services performed by the fund’s Chief Compliance Officer and his staff. These fees are included in Chief Compliance Officer fees in the Statement of Operations.
The components of “Due to BNY Mellon Investment Adviser, Inc. and affiliates” in the Statement of Assets and Liabilities consist of: management fee of $150,870, Custodian fees of $3,250, Chief Compliance Officer fees of $5,257 and Transfer Agent fees of $17,440.
(c) Each board member of the fund also serves as a board member of other funds in the BNY Mellon Family of Funds complex. Annual retainer fees and meeting attendance fees are allocated to each fund based on net assets.
NOTE 4—Securities Transactions:
The aggregate amount of purchases and sales (including paydowns) of investment securities, excluding short-term securities, during the period ended May 31, 2024, amounted to $79,267,957 and $126,000,686, respectively.
At May 31, 2024, the cost of investments for federal income tax purposes was $399,322,405; accordingly, accumulated net unrealized depreciation on investments was $11,515,741, consisting of $2,311,732 gross unrealized appreciation and $13,827,473 gross unrealized depreciation.
19
REPORT OF INDEPENDENT REGISTERED
PUBLIC ACCOUNTING FIRM
To the Shareholders and the Board of Directors of BNY Mellon Intermediate Municipal Bond Fund, Inc.
Opinion on the Financial Statements
We have audited the accompanying statement of assets and liabilities of BNY Mellon Intermediate Municipal Bond Fund, Inc. (the “Fund”), including the statement of investments, as of May 31, 2024, and the related statement of operations for the year then ended, the statements of changes in net assets for each of the two years in the period then ended, the financial highlights for each of the five years in the period then ended and the related notes (collectively referred to as the “financial statements”). In our opinion, the financial statements present fairly, in all material respects, the financial position of the Fund at May 31, 2024, the results of its operations for the year then ended, the changes in its net assets for each of the two years in the period then ended and its financial highlights for each of the five years in the period then ended, in conformity with U.S. generally accepted accounting principles.
Basis for Opinion
These financial statements are the responsibility of the fund’s management. Our responsibility is to express an opinion on the Fund’s financial statements based on our audits. We are a public accounting firm registered with the Public Company Accounting Oversight Board (United States) (“PCAOB”) and are required to be independent with respect to the fund in accordance with the U.S. federal securities laws and the applicable rules and regulations of the Securities and Exchange Commission and the PCAOB.
We conducted our audits in accordance with the standards of the PCAOB. Those standards require that we plan and perform the audit to obtain reasonable assurance about whether the financial statements are free of material misstatement, whether due to error or fraud. The fund is not required to have, nor were we engaged to perform, an audit of the fund’s internal control over financial reporting. As part of our audits, we are required to obtain an understanding of internal control over financial reporting but not for the purpose of expressing an opinion on the effectiveness of the fund’s internal control over financial reporting. Accordingly, we express no such opinion.
Our audits included performing procedures to assess the risks of material misstatement of the financial statements, whether due to error or fraud, and performing procedures that respond to those risks. Such procedures included examining, on a test basis, evidence regarding the amounts and disclosures in the financial statements. Our procedures included confirmation of securities owned as of May 31, 2024, by correspondence with the custodian, brokers and others; when replies were not received from brokers and others, we performed other auditing procedures. Our audits also included evaluating the accounting principles used and significant estimates made by management, as well as evaluating the overall presentation of the financial statements. We believe that our audits provide a reasonable basis for our opinion.

We have served as the auditor of one or more investment companies in the BNY Mellon Family of Funds since at least 1957, but we are unable to determine the specific year.
New York, New York
July 23, 2024
20
IMPORTANT TAX INFORMATION (Unaudited)
In accordance with federal tax law, the fund hereby reports all the dividends paid from net investment income during the fiscal year ended May 31, 2024 as “exempt-interest dividends” (not generally subject to regular federal income tax). Where required by federal tax law rules, shareholders will receive notification of their portion of the fund’s taxable ordinary dividends (if any), capital gains distributions (if any) and tax-exempt dividends paid for the 2024 calendar year on Form 1099-DIV, which will be mailed in early 2025. Also, the fund hereby reports $.0083 per share as a short-term capital gain distribution paid on December 22, 2023.
21
BOARD MEMBERS INFORMATION (Unaudited)
INDEPENDENT BOARD MEMBERS
Independent Board Members
Chairman of the Board (1995)
Principal Occupation During Past 5 Years:
· Director or Trustee of funds in the BNY Mellon Family of Funds and certain other entities (as described in the fund’s Statement of Additional Information) (1995-Present)
Other Public Company Board Memberships During Past 5 Years:
· CBIZ, Inc., a public company providing professional business services, products and solutions, Director (1997-May 2023)
No. of Portfolios for which Board Member Serves: 83
———————
Joan Gulley (76)
Board Member (2017)
Principal Occupation During Past 5 Years:
· Nantucket Atheneum, public library, Chair (June 2018-June 2021) and Director (2015-June 2021)
· Orchard Island Club, golf and beach club, Governor (2016-Present) and President (February 2023-Present)
No. of Portfolios for which Board Member Serves: 43
———————
Alan H. Howard (64)
Board Member (2018)
Principal Occupation During Past 5 Years:
· Heathcote Advisors LLC, a financial advisory services firm, Managing Partner (2008-Present)
· Dynatech/MPX Holdings LLC, a global supplier and service provider of military aircraft parts, President (2012-May 2019); and Board Member of its two operating subsidiaries, Dynatech International LLC and Military Parts Exchange LLC (2012-December 2019), including Chief Executive Officer of an operating subsidiary, Dynatech International LLC (2013-May 2019)
· Rossoff & Co., an independent investment banking firm, Senior Advisor (2013-June 2021)
Other Public Company Board Memberships During Past 5 Years:
· Movado Group, Inc., a public company that designs, sources, markets and distributes watches, Director (1997-Present)
· Diamond Offshore Drilling, Inc., a public company that provides contract drilling services, Director (March 2020-April 2021)
No. of Portfolios for which Board Member Serves: 14
———————
22
Robin A. Melvin (60)
Board Member (1995)
Principal Occupation During Past 5 Years:
· Westover School, a private girls’ boarding school in Middlebury, Connecticut, Trustee (2019-June 2023)
· Mentor Illinois, a non-profit organization dedicated to increasing the quantity and quality of mentoring services in Illinois. Co-Chair (2014–March 2020); Board Member (2013-March 2020)
· JDRF, a non-profit juvenile diabetes research foundation, Board Member (June 2021-June 2022)
Other Public Company Board Memberships During Past 5 Years:
· HPS Corporate Lending Fund, a closed-end management investment company regulated as a business development company, Trustee (August 2021-Present)
· HPS Corporate Capital Solutions Fund, a close-end management investment company regulated as a business development company, Trustee, (December 2023-Present)
· Northwestern Memorial Hospital, an academic medical center, Board Member (March 2024-Present)
No. of Portfolios for which Board Member Serves: 65
———————
Burton N. Wallack (73)
Board Member (2006)
Principal Occupation During Past 5 Years:
Wallack Management Company, a real estate management company, President and Co-owner (1987-Present)
Other Public Company Board Memberships During Past 5 Years:
Mount Sinai Hospital Urology, Board Member (2017-Present)
No. of Portfolios for which Board Member Serves: 14
———————
Benaree Pratt Wiley (78)
Board Member (2016)
Principal Occupation During Past 5 Years:
· The Wiley Group, a firm specializing in strategy and business development. Principal (2005-Present)
Other Public Company Board Memberships During Past 5 Years:
· CBIZ, Inc., a public company providing professional business services, products and solutions, Director (2008-Present)
· Blue Cross-Blue Shield of Massachusetts, Director (2004-December 2020)
No. of Portfolios for which Board Member Serves: 54
———————
Gordon J. Davis (81)
Advisory Board Member (2021)
Principal Occupation During Past 5 Years:
· Venable LLP, a law firm, Partner (2012-Present)
Other Public Company Board Memberships During Past 5 Years:
· BNY Mellon Family of Funds (53 funds), Board Member (1995-August 2021)
No. of Portfolios for which Advisory Board Member Serves: 36
———————
The address of the Board Members and Officers is c/o BNY Mellon Investment Adviser, Inc., 240 Greenwich Street, New York, New York 10286. Additional information about each Board Member is available in the fund’s Statement of Additional Information which can be obtained from the Adviser free of charge by calling this toll free number: 1-800-373-9387.
23
OFFICERS OF THE FUND (Unaudited)
DAVID DIPETRILLO, President since January 2021.
Vice President and Director of the Adviser since February 2021; Head of North America Distribution, BNY Investments since February 2023; and Head of North America Product, BNY Investments from January 2018 to February 2023. He is an officer of 51 investment companies (comprised of 96 portfolios) managed by the Adviser or an affiliate of the Adviser. He is 46 years old and has been an employee of BNY since 2005.
JAMES WINDELS, Treasurer since November 2001.
Director of the Adviser since February 2023; Vice President of the Adviser since September 2020; and Director–BNY Fund Administration. He is an officer of 52 investment companies (comprised of 114 portfolios) managed by the Adviser or an affiliate of the Adviser. He is 65 years old and has been an employee of the Adviser since April 1985.
PETER M. SULLIVAN, Chief Legal Officer since July 2021 and Vice President and Assistant Secretary since March 2019.
Chief Legal Officer of the Adviser and Associate General Counsel of BNY since July 2021; Senior Managing Counsel of BNY from December 2020 to July 2021; and Managing Counsel of BNY from March 2009 to December 2020. He is an officer of 52 investment companies (comprised of 114 portfolios) managed by the Adviser or an affiliate of the Adviser. He is 56 years old and has been an employee of BNY since April 2004.
SARAH S. KELLEHER, Secretary since April 2024 and Vice President since April 2014.
Vice President of BNY Mellon ETF Investment Adviser; LLC since February 2020; Senior Managing Counsel of BNY since September 2021; and Managing Counsel of BNY from December 2017 to September 2021. She is an officer of 53 investment companies (comprised of 116 portfolios) managed by the Adviser or an affiliate of the Adviser. She is 48 years old and has been an employee of BNY since March 2013.
DEIRDRE CUNNANE, Vice President and Assistant Secretary since March 2019.
Managing Counsel of BNY since December 2021; and Counsel of BNY from August 2018 to December 2021. She is an officer of 52 investment companies (comprised of 114 portfolios) managed by the Adviser or an affiliate of the Adviser. She is 33 years old and has been an employee of BNY since August 2013.
LISA M. KING, Vice President and Assistant Secretary since March 2024.
Vice President and Assistant Secretary. Counsel of BNY since June 2023; and Regulatory Administration Group Manager at BNY Mellon Asset Servicing from February 2016 to June 2023. She is an officer of 52 investment companies (comprised of 114 portfolios) managed by the Adviser or an affiliate of the Adviser. She is 56 years old and has been an employee of BNY since February 2016.
JEFF PRUSNOFSKY, Vice President and Assistant Secretary since August 2005.
Senior Managing Counsel of BNY. He is an officer of 53 investment companies (comprised of 116 portfolios) managed by the Adviser or an affiliate of the Adviser. He is 59 years old and has been an employee of the Adviser since October 1990.
AMANDA QUINN, Vice President and Assistant Secretary since March 2020.
Managing Counsel of BNY since March 2024; Counsel of BNY from June 2019 to February 2024; and Regulatory Administration Manager at BNY Investment Management Services from September 2018 to May 2019. She is an officer of 52 investment companies (comprised of 114 portfolios) managed by the Adviser or an affiliate of the Adviser. She is 39 years old and has been an employee of BNY since June 2012.
JOANNE SKERRETT, Vice President and Assistant Secretary since March 2023.
Managing Counsel of BNY since June 2022; and Senior Counsel with the Mutual Fund Directors Forum, a leading funds industry organization, from 2016 to June 2022. She is an officer of 52 investment companies (comprised of 114 portfolios) managed by the Adviser or an affiliate of the Adviser. She is 52 years old and has been an employee of the Adviser since June 2022.
DANIEL GOLDSTEIN, Vice President since March 2022.
Head of Product Development of North America Distribution, BNY Investments since January 2018; Executive Vice President of North America Product, BNY Investments since April 2023; and Senior Vice President, Development & Oversight of North America Product, BNY Investments from 2010 to March 2023. He is an officer of 51 investment companies (comprised of 96 portfolios) managed by the Adviser or an affiliate of the Adviser. He is 54 years old and has been an employee of the Distributor since 1991.
JOSEPH MARTELLA, Vice President since March 2022.
Vice President of the Adviser since December 2022; Head of Product Management of North America Distribution, BNY Investments since January 2018; Executive Vice President of North America Product, BNY Investments since April 2023; and Senior Vice President of North America Product, BNY Investments from 2010 to March 2023. He is an officer of 51 investment companies (comprised of 96 portfolios) managed by the Adviser or an affiliate of the Adviser. He is 47 years old and has been an employee of the Distributor since 1999.
ROBERTO G. MAZZEO, Assistant Treasurer since June 2024.
Financial Reporting Manager - BNY Fund Administration. He is an officer of 52 investment companies (comprised of 114 portfolios) managed by the Adviser or an affiliate of the Adviser. He is 43 years old and has been an employee of the Adviser since October 2006.
GAVIN C. REILLY, Assistant Treasurer since December 2005.
Tax Manager–BNY Fund Administration. He is an officer of 52 investment companies (comprised of 114 portfolios) managed by the Adviser or an affiliate of the Adviser. He is 55 years old and has been an employee of the Adviser since April 1991.
ROBERT SALVIOLO, Assistant Treasurer since July 2007.
Senior Accounting Manager–BNY Fund Administration. He is an officer of 52 investment companies (comprised of 114 portfolios) managed by the Adviser or an affiliate of the Adviser. He is 57 years old and has been an employee of the Adviser since June 1989.
ROBERT SVAGNA, Assistant Treasurer since August 2005.
Senior Accounting Manager–BNY Fund Administration. He is an officer of 52 investment companies (comprised of 114 portfolios) managed by the Adviser or an affiliate of the Adviser. He is 57 years old and has been an employee of the Adviser since November 1990.
JOSEPH W. CONNOLLY, Chief Compliance Officer since October 2004.
Chief Compliance Officer of the BNY Mellon Family of Funds and BNY Mellon Funds Trust since 2004; and Chief Compliance Officer of the Adviser from 2004 until June 2021. He is the Chief Compliance Officer of 51 investment companies (comprised of 101 portfolios) managed by the Adviser. He is 66 years old.
CARIDAD M. CAROSELLA, Anti-Money Laundering Compliance Officer since January 2016.
Anti-Money Laundering Compliance Officer of the BNY Mellon Family of Funds and BNY Mellon Funds Trust. She is an officer of 45 investment companies (comprised of 107 portfolios) managed by the Adviser or an affiliate of the Adviser. She is 55 years old and has been an employee of the Distributor since 1997.
24
Item 8. Changes in and Disagreements with Accountants for Open-End Management Investment
Companies. (Unaudited)
25
Item 9. Proxy Disclosures for Open-End Management Investment Companies. (Unaudited)
26
Item 10. Remuneration Paid to Directors, Officers, and Others of Open-End Management Investment Companies. (Unaudited)
Each board member also serves as a board member of other funds in the BNY Mellon Family of Funds complex. Annual retainer fees and attendance fees are allocated to each fund based on net assets. Directors fees paid by the fund are within Item 7. Statement of Operations as Directors’ fees and expenses.
27
Item 11. Statement Regarding Basis for Approval of Investment Advisory Contract. (Unaudited)
28
This page intentionally left blank.
This page intentionally left blank.
© 2024 BNY Mellon Securities Corporation Code-0947NCSRAR0524 |
|

Item 12. Disclosure of Proxy Voting Policies and Procedures for Closed-End Management Investment Companies.
Not applicable.
Item 13. Portfolio Managers for Closed-End Management Investment Companies.
Not applicable.
Item 14. Purchases of Equity Securities By Closed-End Management Investment Companies and Affiliated Purchasers.
Not applicable.
Item 15. Submission of Matters to a Vote of Security Holders.
There have been no materials changes to the procedures applicable to Item 15.
Item 16. Controls and Procedures.
(a) The Registrant's principal executive and principal financial officers have concluded, based on their evaluation of the Registrant's disclosure controls and procedures as of a date within 90 days of the filing date of this report, that the Registrant's disclosure controls and procedures are reasonably designed to ensure that information required to be disclosed by the Registrant on Form N-CSR is recorded, processed, summarized and reported within the required time periods and that information required to be disclosed by the Registrant in the reports that it files or submits on Form N-CSR is accumulated and communicated to the Registrant's management, including its principal executive and principal financial officers, as appropriate to allow timely decisions regarding required disclosure.
(b) There were no changes to the Registrant's internal control over financial reporting that occurred during the period covered by this report that have materially affected, or are reasonably likely to materially affect, the Registrant's internal control over financial reporting.
Item 17. Disclosure of Securities Lending Activities for Closed-End Management Investment Companies.
Not applicable.
Item 18. Recovery of Erroneously Awarded Compensation.
Not applicable.
Item 19. Exhibits.
(a)(1) Code of ethics referred to in Item 2.
(a)(3) Not applicable.
SIGNATURES
Pursuant to the requirements of the Securities Exchange Act of 1934 and the Investment Company Act of 1940, the Registrant has duly caused this Report to be signed on its behalf by the undersigned, thereunto duly authorized.
BNY Mellon Intermediate Municipal Bond Fund, Inc.
By: /s/ David J. DiPetrillo
David J. DiPetrillo
President (Principal Executive Officer)
Date: August 13, 2024
Pursuant to the requirements of the Securities Exchange Act of 1934 and the Investment Company Act of 1940, this Report has been signed below by the following persons on behalf of the Registrant and in the capacities and on the dates indicated.
By: /s/ David J. DiPetrillo
David J. DiPetrillo
President (Principal Executive Officer)
Date: August 13, 2024
By: /s/ James Windels
James Windels
Treasurer (Principal Financial Officer)
Date: August 13, 2024
EXHIBIT INDEX
(a)(1) Code of ethics referred to in Item 2.
(a)(2) Certifications of principal executive and principal financial officers as required by Rule 30a-2(a) under the Investment Company Act of 1940. (EX-99.CERT)
(b) Certification of principal executive and principal financial officers as required by Rule 30a-2(b) under the Investment Company Act of 1940. (EX-99.906CERT)