
1 NASDAQ : STAA Q2 2013 Results – Investor Presentation July 31 , 2013
Forward - Looking Statements All statements in this press release that are not statements of historical fact are forward - looking statements, including statem ents about any of the following: any projections of earnings, revenue, sales, profit margins, cash, effective tax rate or any other financial items; the plans, strategies, an d o bjectives of management for future operations or prospects for achieving such plans; metrics for 2013; statements regarding new products, including but not limited to, expect ati ons for success of new products in the U.S. or international markets or government approval of new products; future economic conditions or size of market opportunities; exp ect ed IOL backorder position; expected costs of Monrovia facility expansion; expected costs and savings from business consolidation plans and the timetable for those plan s; statements of belief, including as to achieving 2013 growth plans or metrics; expected regulatory activities and approvals, product launches, and any statements of assumptio ns underlying any of the foregoing. Important additional factors that could cause actual results to differ materially from those indicated by such forward - looking statements are set forth in the company’s Annual Report on Form 10 - K for the year ended December 28, 2012, under the caption “Risk Factors,” which is on file with the Securities and Excha nge Commission and available in the “Investor Information” section of the company’s website under the heading “SEC Filings.” These statements are based on expectations and assumptions as of the date of this press release and are subject to numerous r isk s and uncertainties, which could cause actual results to differ materially from those described in the forward - looking statements. The risks and uncertainties include the fol lowing: our limited capital resources and limited access to financing; the negative effect of unstable global economic conditions on sales of products, especially products suc h a s the ICL used in non - reimbursed elective procedures; the challenge of managing our foreign subsidiaries; backlog as we prepare for our manufacturing facility consolid ati on; the risk of unfavorable changes in currency exchange rate; the discretion of regulatory agencies to approve or reject new products, or to require additional actions befo re approval; unexpected costs or delays that could reduce or eliminate the expected benefits of our consolidation plans; the risk that research and development efforts will not be successful or may be delayed in delivering for launch; the purchasing patterns of our distributors carrying inventory in the market; the willingness of surgeons and patient s t o adopt a new product and procedure; patterns of Visian ICL use that have typically limited our penetration of the refractive procedure market, and a general decline in th e d emand for refractive surgery particularly in the U.S. and the Asia Pacific region, which STAAR believes has resulted from both concerns about the safety and effectiveness of las er procedures and current economic conditions. The Visian Toric ICL and the Visian ICL with CentraFLOW are not yet approved for sale in the United States. In addition, to supplement the GAAP numbers, this presentation includes supplemental non - GAAP financial information, which STAAR believes investors will find helpful in understanding its operating performance. “Adjusted Net Income” excludes the following items that are included in “Net Income (L oss)” as calculated in accordance with U.S. generally accepted accounting principles (“GAAP”): manufacturing consolidation expenses, gain or loss on foreign currency tran sactions, Spain distribution transition cost, the fair value adjustment of outstanding warrants issued in 2007, and stock - based compensation expenses. A table reconciling the GA AP information to the non - GAAP information is included in our financial release which can be found in our Form 8 - K filed on March 1, 2013 and also available on our website . 2

Agenda 2013 Metric Update Barry G. Caldwell Chief Executive Officer Key Financial/Consolidation Updates Deborah Andrews Chief Financial Officer Regulatory/New Product Updates Barry G. Caldwell Chief Executive Officer 3 Q&A Session Your Questions
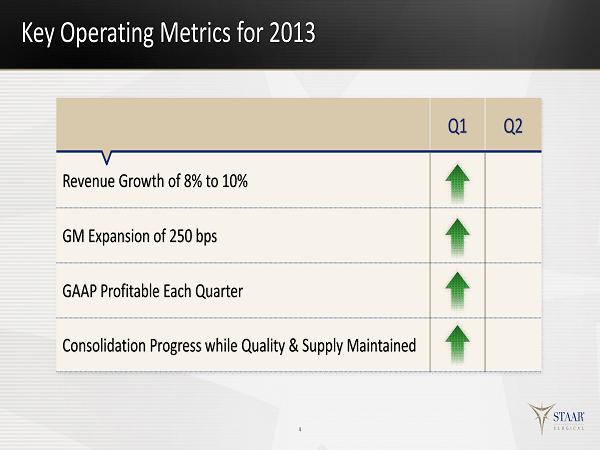
Key Operating Metrics for 2013 4 Q1 Q2 Revenue Growth of 8% to 10% GM Expansion of 250 bps GAAP Profitable Each Quarter Consolidation Progress while Quality & Supply Maintained
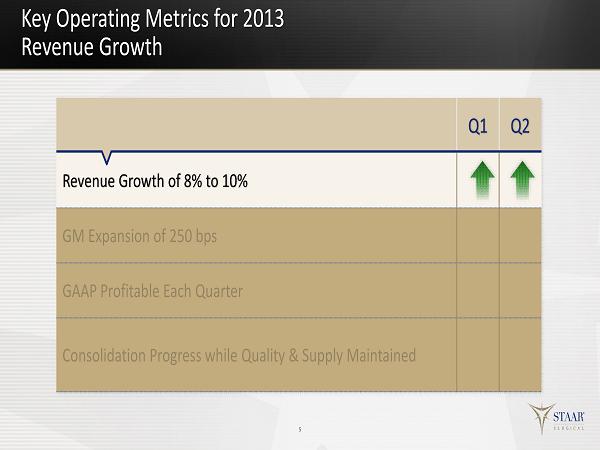
Key Operating Metrics for 2013 Revenue Growth 5 Q1 Q2 Revenue Growth of 8% to 10% GM Expansion of 250 bps GAAP Profitable Each Quarter Consolidation Progress while Quality & Supply Maintained
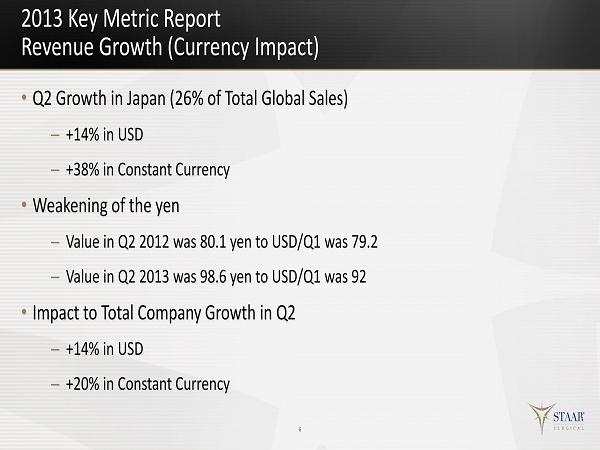
2013 Key Metric Report Revenue Growth (Currency Impact) • Q2 Growth in Japan (26% of Total Global Sales) – +14% in USD – +38% in Constant Currency • Weakening of the yen – Value in Q2 2012 was 80.1 yen to USD/Q1 was 79.2 – Value in Q2 2013 was 98.6 yen to USD/Q1 was 92 • Impact to Total Company Growth in Q2 – +14% in USD – +20% in Constant Currency 6
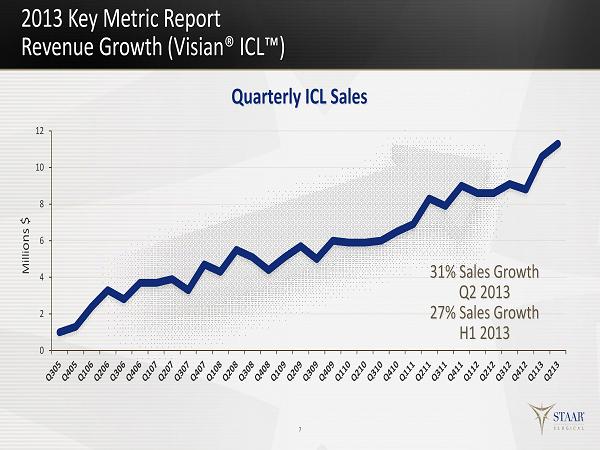
0 2 4 6 8 10 12 2013 Key Metric Report Revenue Growth ( Visian® ICL™) Milli ons $ Quarterly ICL Sales 7 31% Sales Growth Q2 2013 27% Sales Growth H1 2013
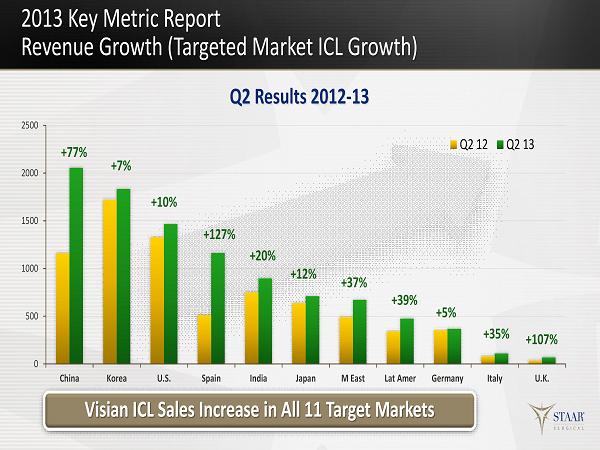
0 500 1000 1500 2000 2500 China Korea U.S. Spain India Japan M East Lat Amer Germany Italy U.K. Q2 12 Q2 13 2013 Key Metric Report Revenue Growth (Targeted Market ICL Growth) Q2 Results 2012 - 13 Visian ICL Sales Increase in All 11 Target Markets +127% +77% +10% +12% +20% +39% +37% + 5 % +35% + 107% +7%
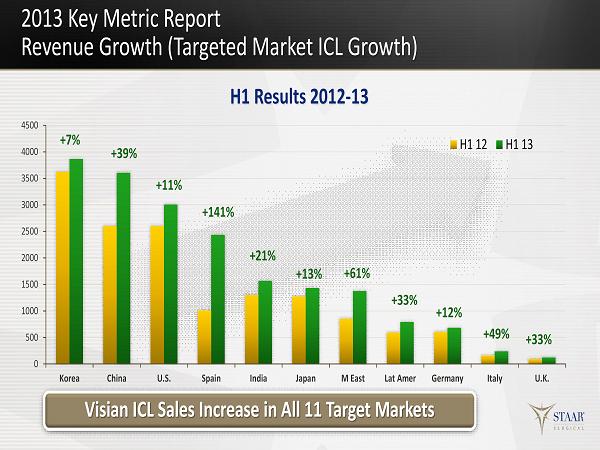
0 500 1000 1500 2000 2500 3000 3500 4000 4500 Korea China U.S. Spain India Japan M East Lat Amer Germany Italy U.K. H1 12 H1 13 2013 Key Metric Report Revenue Growth (Targeted Market ICL Growth) H1 Results 2012 - 13 Visian ICL Sales Increase in All 11 Target Markets +141% +7% +11% +13% +21% +33% +61% +12% +49% +33% +39%
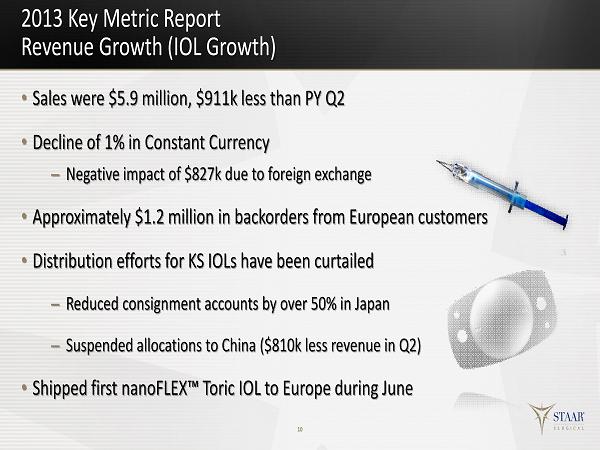
2013 Key Metric Report Revenue Growth (IOL Growth) • Sales were $5.9 million, $911k less than PY Q2 • Decline of 1 % in Constant Currency – Negative impact of $827k due to foreign exchange • Approximately $1.2 million in backorders from European customers • Distribution efforts for KS IOLs have been curtailed – Reduced consignment accounts by over 50% in Japan – Suspended allocations to China ($810k less revenue in Q 2 ) • Shipped first nanoFLEX™ Toric IOL to Europe during June 10
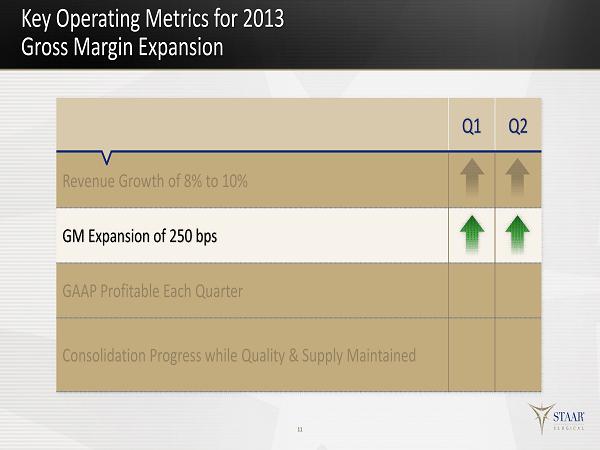
Key Operating Metrics for 2013 Gross Margin Expansion 11 Q1 Q2 Revenue Growth of 8% to 10% GM Expansion of 250 bps GAAP Profitable Each Quarter Consolidation Progress while Quality & Supply Maintained
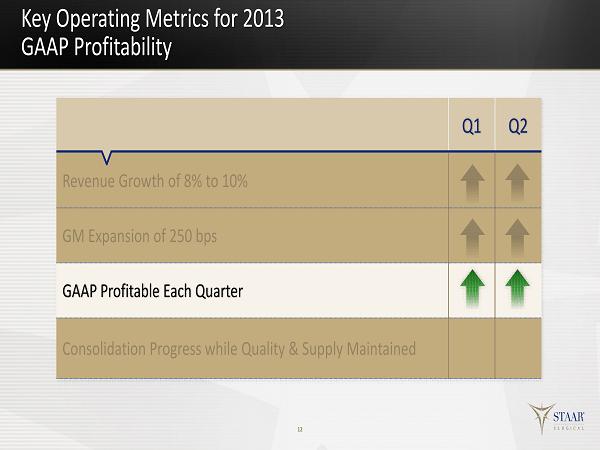
Key Operating Metrics for 2013 GAAP Profitability 12 Q1 Q2 Revenue Growth of 8% to 10% GM Expansion of 250 bps GAAP Profitable Each Quarter Consolidation Progress while Quality & Supply Maintained
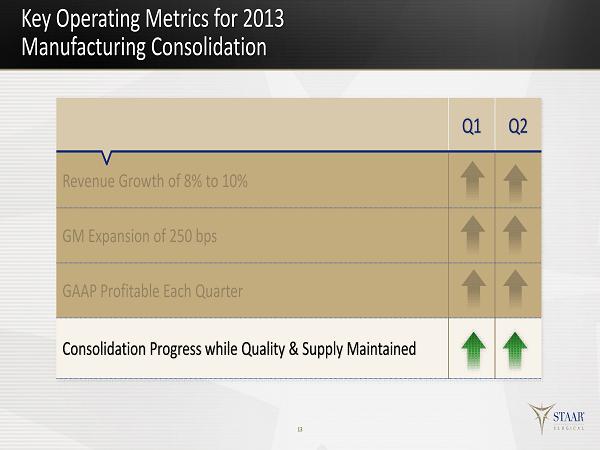
Key Operating Metrics for 2013 Manufacturing Consolidation 13 Q1 Q2 Revenue Growth of 8% to 10% GM Expansion of 250 bps GAAP Profitable Each Quarter Consolidation Progress while Quality & Supply Maintained
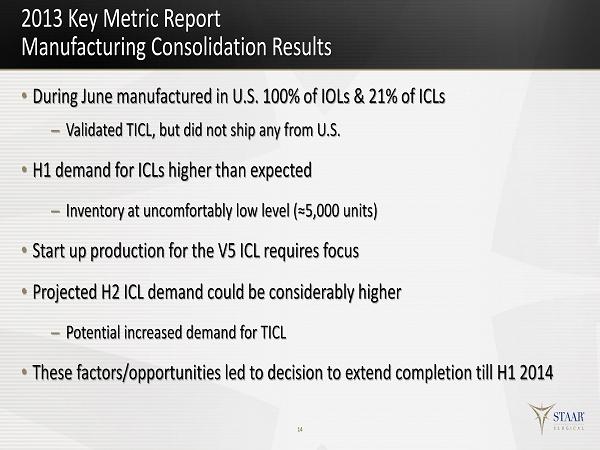
2013 Key Metric Report Manufacturing Consolidation Results • During June manufactured in U.S. 100% of IOLs & 21% of ICLs – Validated TICL, but did not ship any from U.S. • H1 demand for ICLs higher than expected – Inventory at uncomfortably low level (≈5,000 units) • Start up production for the V5 ICL requires focus • Projected H2 ICL demand could be considerably higher – Potential increased demand for TICL • These factors/opportunities led to decision to extend completion till H1 2014 14
Solid Start to 2013 Change to Outlook on Revenue Growth • Solid start on all Four Operating Metrics • Revenue growth rate increased from 8% - 10% to 12% to 14%: – Headwinds persist on the value of yen and on IOL supply – Direct model comparison in Spain for second half – New markets for ICL CentraFLOW™ technology – Expansion of nanoFLEX Toric IOL to additional European markets 15

Q2 Key Financial Results Topics to Discuss • Impact of Foreign Currency • Manufacturing Consolidation Timelines/Tax Impact • Gross Margin Expansion • GAAP and Non - GAAP Adjusted Net Income • Key First Half Results 16
Q2 Key Financial Results Impact of Foreign Currency • Negative Impact on Revenue of $1M During Q2/$1.8M H1 – $827k to IOLs, $143k to Other Sales Q2 • Value of Yen Impacted Key Financial Results – H1 95.3 vs. 79.7 H1 2012 • Negative Impact on Gross Margin • Positive Impact on Operating Expenses – $505k impact 17
Q2 Key Financial Results Consolidation Impacts • Expenses were $613k Q2, $1.5M for H1 – Now expected to be $750k for H2 – Total Three Year Expense of $6.2M vs. original forecast of $6M • Tax rate 68.3% Q2 – Now expect effective tax rate for the year to be 45% • During June 100% of IOLs and 21% of ICLs manufactured in U.S. • December expected U.S. manufactured product: – 100% of IOLs – Two thirds of ICLs and one third of TICLs – Remainder of ICL production will be to re - build inventory levels 18
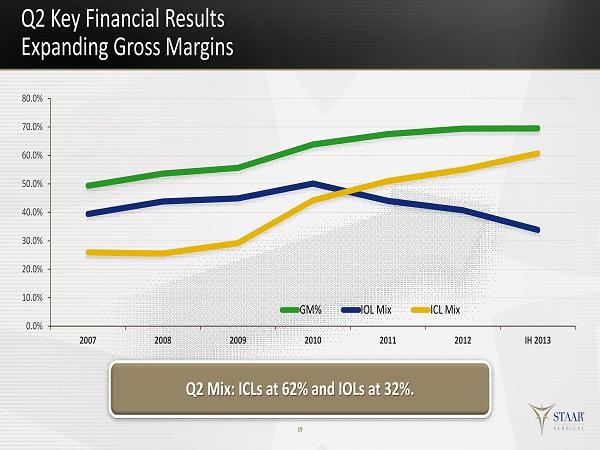
0.0% 10.0% 20.0% 30.0% 40.0% 50.0% 60.0% 70.0% 80.0% 2007 2008 2009 2010 2011 2012 IH 2013 GM% IOL Mix ICL Mix Q2 Key Financial Results Expanding Gross Margins 19 Q2 Mix: ICLs at 62% and IOLs at 32%.
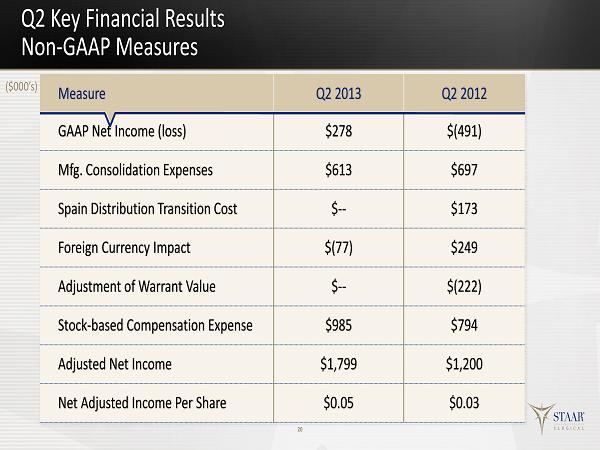
Q2 Key Financial Results Non - GAAP Measures 20 Measure Q2 2013 Q2 2012 GAAP Net Income (loss) $278 $(491) Mfg. Consolidation Expenses $613 $697 Spain Distribution Transition Cost $ -- $173 Foreign Currency Impact $(77) $249 Adjustment of Warrant Value $ -- $(222) Stock - based Compensation Expense $985 $794 Adjusted Net Income $1,799 $1,200 Net Adjusted Income Per Share $0.05 $0.03 ($000’s)
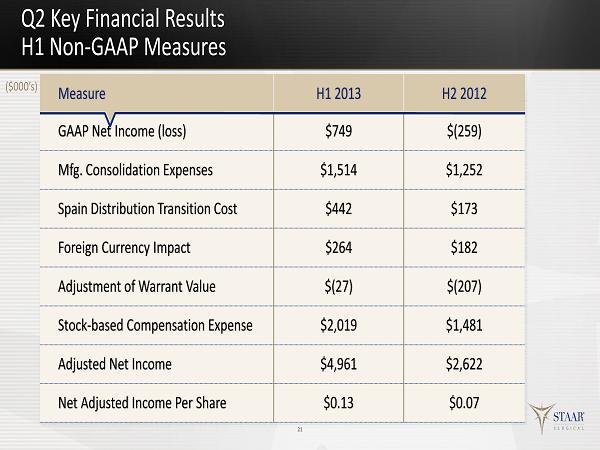
Q2 Key Financial Results H1 Non - GAAP Measures 21 Measure H1 2013 H2 2012 GAAP Net Income (loss) $749 $(259) Mfg. Consolidation Expenses $1,514 $1,252 Spain Distribution Transition Cost $442 $173 Foreign Currency Impact $264 $182 Adjustment of Warrant Value $ (27) $(207) Stock - based Compensation Expense $2,019 $1,481 Adjusted Net Income $4,961 $2,622 Net Adjusted Income Per Share $0.13 $0.07 ($000’s)
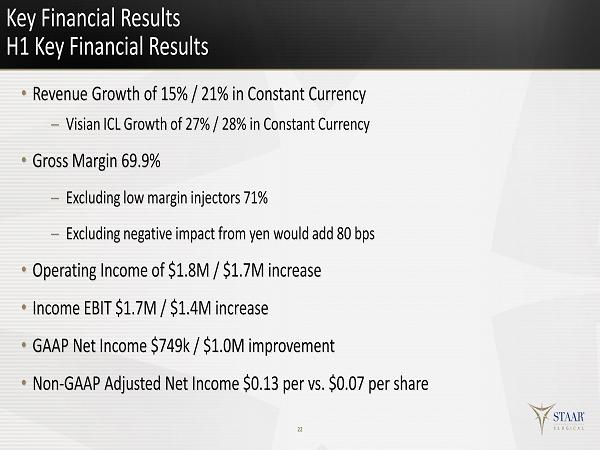
Key Financial Results H1 Key Financial Results • Revenue Growth of 15% / 21% in Constant Currency – Visian ICL Growth of 27% / 28% in Constant Currency • Gross Margin 69.9% – Excluding low margin injectors 71% – Excluding negative impact from yen would add 8 0 bps • Operating Income of $1.8M / $1.7M increase • Income EBIT $1.7M / $1.4M increase • GAAP Net Income $749k / $1.0M improvement • Non - GAAP Adjusted Net Income $0.13 per vs. $0.07 per share 22

Q2 Operational Updates Regulatory • Visian ICL CentraFLOW technology approved in Korea and Argentina in June – Official launch event this past weekend in Korea • Expected CentraFLOW approval in India any week • Working with FDA on protocol for CentraFLOW clinical t rial • Visian V5 ICL expected CE Mark approval l ate Q3 • Company has been told by FDA of their current intent to take TICL to Panel – Currently responding to questions from the FDA to prepare the Panel Package – Panel date has not yet been scheduled 23
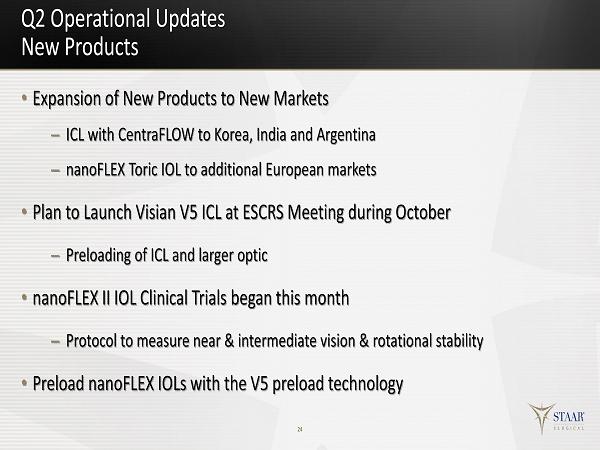
Q2 Operational Updates New Products • Expansion of New Products to New Markets – ICL with CentraFLOW to Korea, India and Argentina – nanoFLEX Toric IOL to additional European markets • Plan to Launch Visian V5 ICL at ESCRS Meeting during October – Preloading of ICL and larger optic • nanoFLEX II IOL Clinical Trials began this month – Protocol to measure near & intermediate vision & rotational stability • Preload nanoFLEX IOLs with the V5 preload technology 24

Upcoming Investor Meetings • Canaccord Genuity Growth Conference in Boston (August 14) • Canadian Trip (August 15 - 16) with William Blair • Stephens Bus Tour to Monrovia Facility (August 22) • ESCRS Meeting in Amsterdam (October 3 - 8) • Q3 Earnings Release and Call (October 30) 25

Thank You YOUR QUESTIONS PLEASE 26

27 NASDAQ : STAA “Fastest Growing Refractive Technology in t he World”