
1 Visian ICL, Fastest Growing Refractive Technology in the World NASDAQ: STAA May 7, 2014

Forward - Looking Statements All statements in this presentation that are not statements of historical fact are forward - looking statements, including stateme nts about any of the following: any projections of earnings, revenue, sales, profit margins, cash, effective tax rate or any other financial items ; t he plans, strategies, and objectives of management for future operations or prospects for achieving such plans; metrics for 2014; statements regarding new or improved products, including but not limited to, expectations for success of new or improved products in the U.S. or international markets or go ver nment approval of new products (including the TICL in the U.S.); future economic conditions or size of market opportunities; expected IOL backorder position; expected costs of Monrovia facility expansion; expected costs and savings from business consolidation plans and the timetable fo r those plans; statements of belief, including as to achieving 2014 growth plans or metrics; expected regulatory activities and approvals, p rod uct launches, and any statements of assumptions underlying any of the foregoing. Important additional factors that could cause actual results to diff er materially from those indicated by such forward - looking statements are set forth in the company’s Annual Report on Form 10 - K for the year ended January 3, 2014, under the caption “Risk Factors,” which is on file with the Securities and Exchange Commission and available in the “Investor Infor mat ion” section of the company’s website under the heading “SEC Filings.” These statements are based on expectations and assumptions as of the date of this press release and are subject to numerous r isk s and uncertainties, which could cause actual results to differ materially from those described in the forward - looking statements. The risks and unce rtainties include the following: our limited capital resources and limited access to financing; the negative effect of unstable global economic con dit ions on sales of products, especially products such as the ICL used in non - reimbursed elective procedures; the challenge of managing our foreign subsidiari es; backlog or supply delays as we prepare for our manufacturing facility consolidation; the risk of unfavorable changes in currency exchange rate; th e discretion of regulatory agencies to approve or reject new or improved products, or to require additional actions before approval (includin g b ut not limited FDA requirements regarding the TICL); unexpected costs or delays that could reduce or eliminate the expected benefits of our consolidation plans; the risk that research and development efforts will not be successful or may be delayed in delivering for launch (including but not limited to the V5 and V6 ICL products); the purchasing patterns of our distributors carrying inventory in the market; the willingness of surgeons and patients to ado pt a new product and procedure; patterns of Visian ICL use that have typically limited our penetration of the refractive procedure market, and a general decline in the demand for refractive surgery particularly in the U.S. and the Asia Pacific region, which STAAR believes has resulted from bo th concerns about the safety and effectiveness of laser procedures and current economic conditions. The Visian Toric ICL and the Visian ICL with Cent raFLOW are not yet approved for sale in the United States. In addition, to supplement the GAAP numbers, this presentation includes supplemental non - GAAP financial information, which STAAR believes investors will find helpful in understanding its operating performance. “Adjusted Net Income” excludes the following items that are included in “Net Income (Loss)” as calculated in accordance with U.S. generally accepted accounting principles (“GAAP”): manufacturing consolid ation expenses, gain or loss on foreign currency transactions, Spain distribution transition cost, the fair value adjustment of outstanding warrants issued in 2007, stock - based compensation expenses and FDA TICL Panel expenses. A table reconciling the GAAP information to the non - GAAP information is included in our financial release which can be found in our Form 8 - K filed on April 28, 2014 and also available on our website. 2
• Two Large Market Opportunities • Sustainable Competitive Advantages • Rapid Cadence of New Products • Increasing IP Position with New Technologies • Strong Balance Sheet While Investing for Future • 2014/15 Operating Leverage Enhances Profitability 3 Generating Strong Current and Future Growth
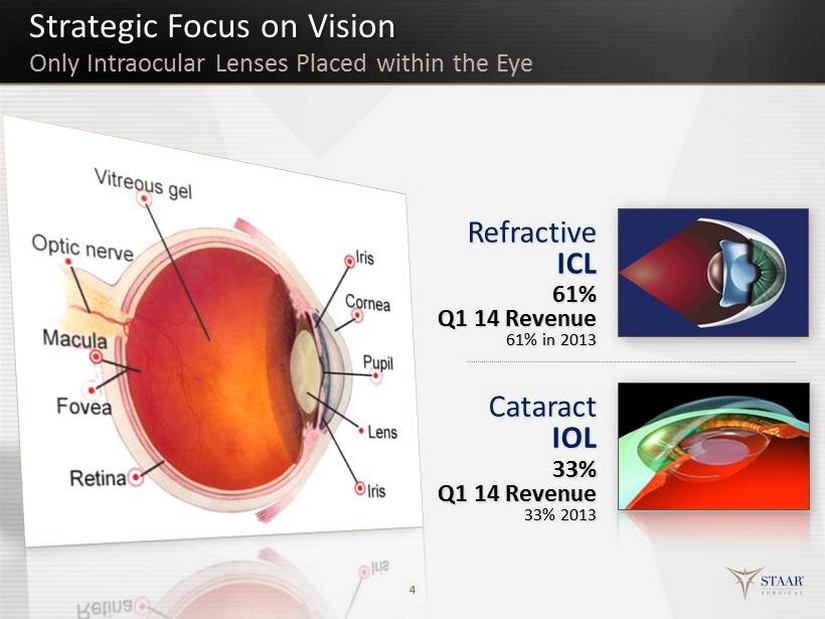
Strategic Focus on Vision 4 Cataract IOL Refractive ICL 61% Q1 14 Revenue 61% in 2013 33% Q1 14 Revenue 33% 2013 Only Intraocular Lenses Placed within the Eye
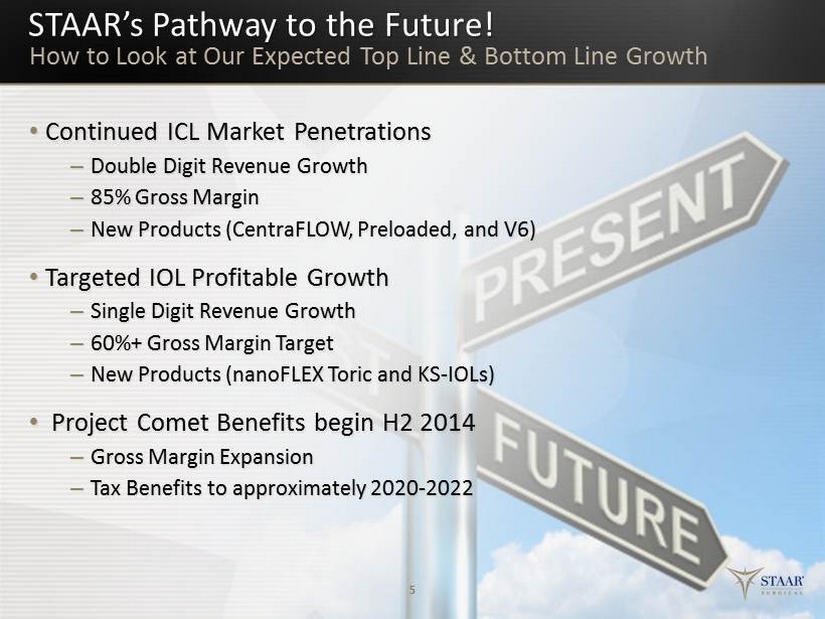
• Continued ICL Market Penetrations – Double Digit Revenue Growth – 85 % Gross Margin – New Products (CentraFLOW, Preloaded, and V6) • Targeted IOL Profitable Growth – Single Digit R evenue Growth – 60 %+ Gross Margin Target – New Products (nanoFLEX Toric and KS - IOLs) • Project Comet Benefits begin H2 2014 – Gross Margin Expansion – Tax Benefits to approximately 2020 - 2022 5 How to Look at Our Expected Top Line & Bottom Line Growth STAAR’s Pathway to the Future!
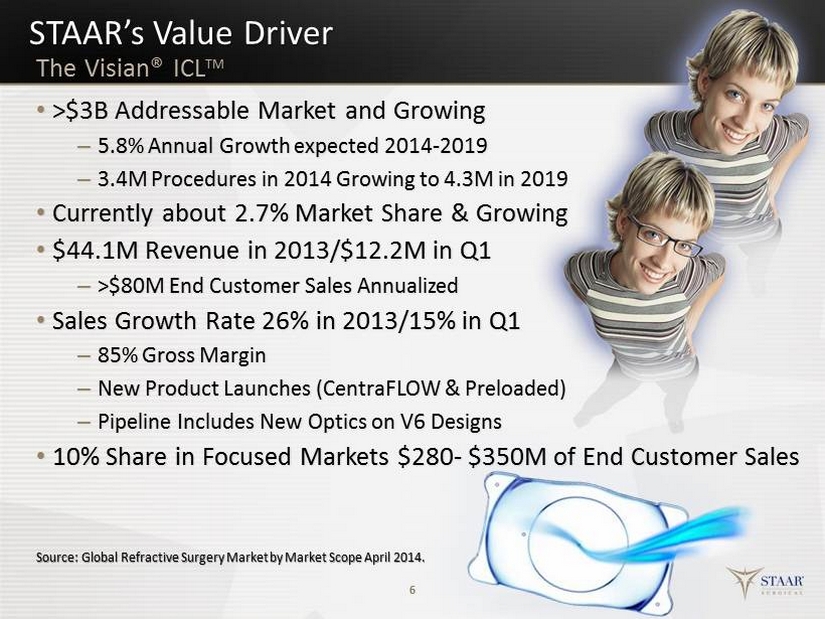
STAAR’s Value Driver • >$ 3B Addressable Market and Growing – 5.8% Annual Growth expected 2014 - 2019 – 3.4M Procedures in 2014 Growing to 4.3M in 2019 • Currently about 2.7% Market Share & Growing • $44.1M Revenue in 2013/$12.2M in Q1 – >$80M End Customer Sales Annualized • Sales Growth Rate 26% in 2013/15% in Q1 – 85% Gross Margin – New Product Launches (CentraFLOW & Preloaded) – Pipeline Includes New Optics on V6 Designs • 10% Share in Focused Markets $280 - $350M of End Customer Sales 6 The Visian® ICL TM Source: Global Refractive Surgery Market by Market Scope April 2014.
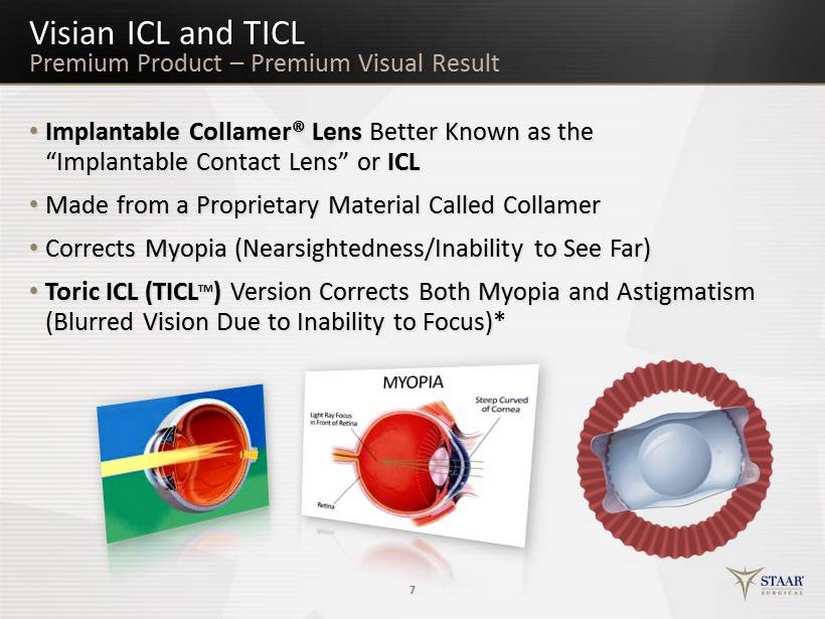
• Implantable Collamer® Lens Better Known as the “Implantable Contact Lens” or ICL • Made f rom a Proprietary Material Called Collamer • Corrects Myopia (Nearsightedness/Inability to See Far) • Toric ICL (TICL TM ) Version Corrects Both Myopia and Astigmatism (Blurred Vision D ue to Inability to Focus)* 7 Visian ICL and TICL Premium Product – Premium Visual Result
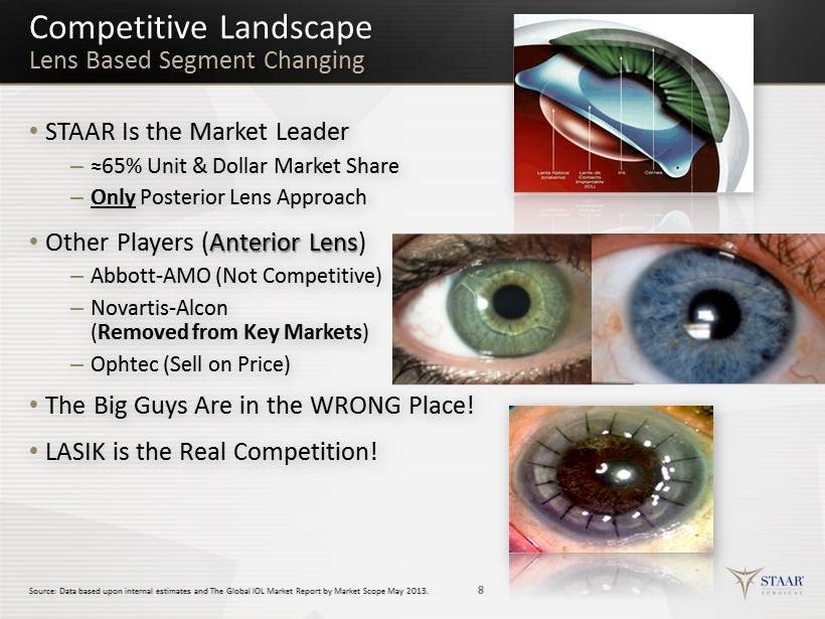
Competitive Landscape Lens Based Segment Changing • STAAR Is the Market Leader – ≈65% Unit & Dollar Market Share – Only Posterior Lens Approach • Other Players ( Anterior Lens ) – Abbott - AMO (Not Competitive) – Novartis - Alcon ( Removed from Key Markets ) – Ophtec (Sell on Price) • The Big Guys Are in the WRONG Place! • LASIK is the Real Competition! 8 Source: Data based upon internal estimates and The Global IOL Market Report by Market Scope May 2013.
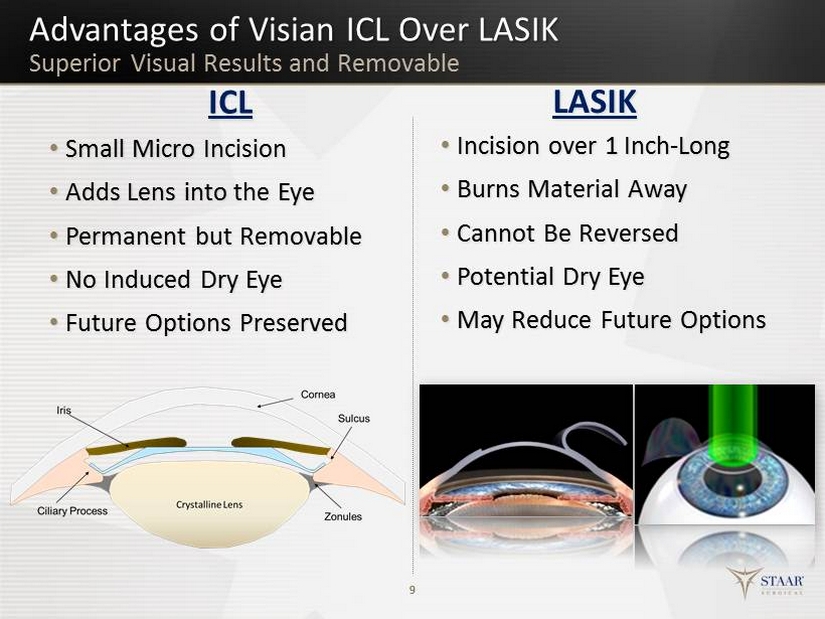
9 ICL • Small Micro Incision • Adds Lens into the Eye • Permanent but Removable • No Induced Dry Eye • Future Options Preserved LASIK • Incision over 1 Inch - Long • Burns Material Away • Cannot Be Reversed • Potential Dry Eye • May Reduce Future Options Advantages of Visian ICL Over LASIK Superior Visual Results and Removable
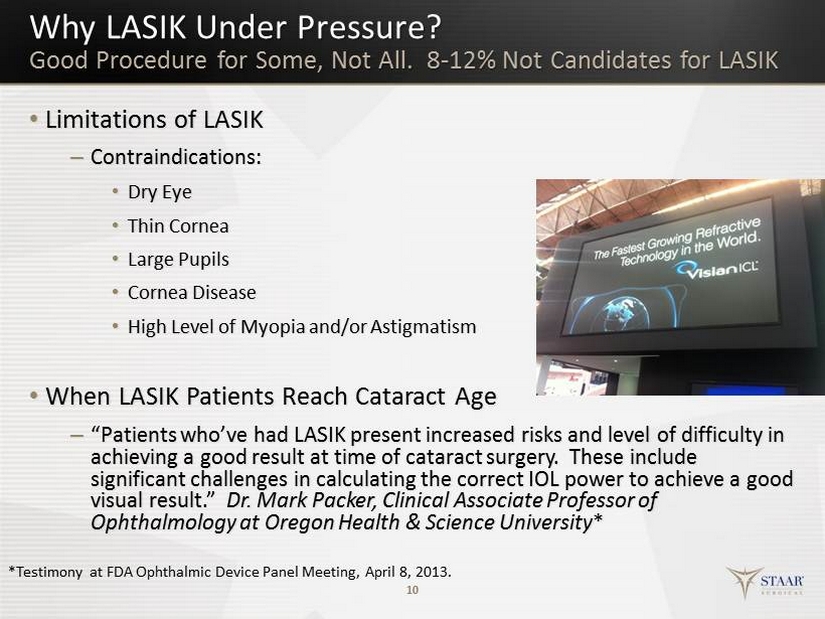
Why LASIK Under Pressure? Good Procedure for Some, Not All. 8 - 12% Not Candidates for LASIK • Limitations of LASIK – Contraindications: • Dry Eye • Thin Cornea • Large Pupils • Cornea Disease • High Level of Myopia and/or Astigmatism • When LASIK Patients Reach Cataract Age – “Patients who’ve had LASIK present increased risks and level of difficulty in achieving a good result at time of cataract surgery. These include significant challenges in calculating the correct IOL power to achieve a good visual result.” Dr. Mark Packer, Clinical Associate Professor of Ophthalmology at Oregon Health & Science University * 10 *Testimony at FDA Ophthalmic Device Panel Meeting, April 8, 2013.
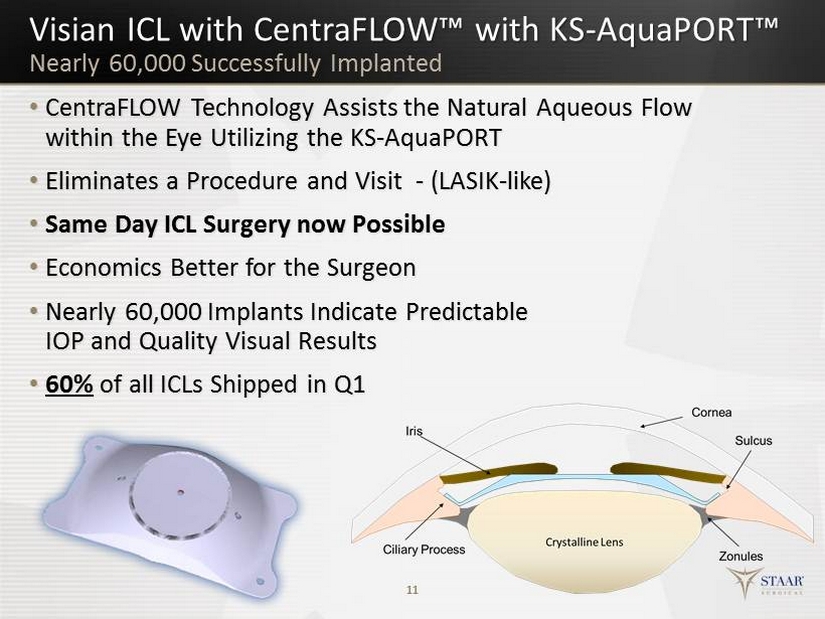
Visian ICL with CentraFLOW ™ with KS - AquaPORT™ • CentraFLOW Technology Assists the Natural Aqueous Flow within the Eye Utilizing the KS - AquaPORT • Eliminates a Procedure and Visit - (LASIK - like) • Same Day ICL Surgery now Possible • Economics Better for t he Surgeon • Nearly 60,000 Implants Indicate Predictable IOP and Quality Visual Results • 60% of all ICLs Shipped in Q1 11 Nearly 60,000 Successfully Implanted
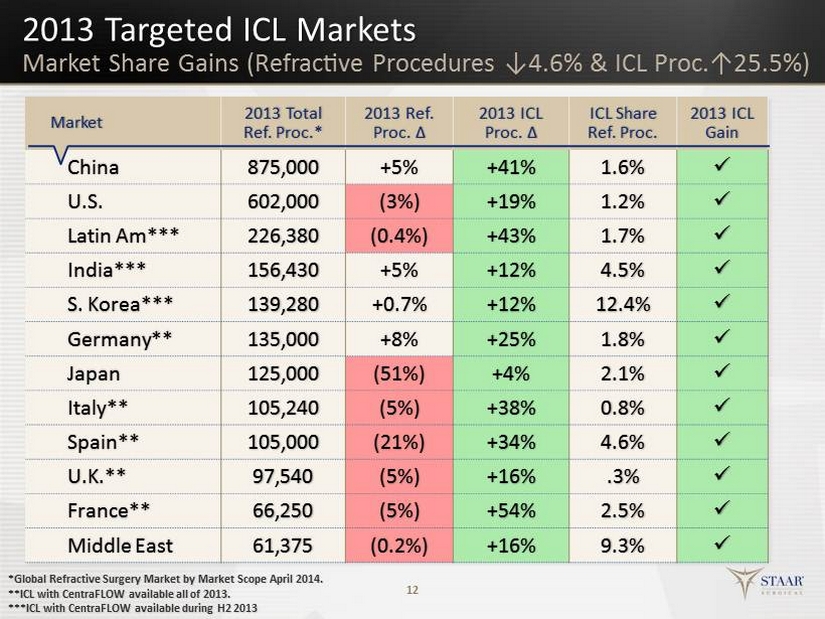
2013 Targeted ICL Markets 12 Market 2013 Total Ref. Proc.* 2013 Ref. Proc. ∆ 2013 ICL Proc. ∆ ICL Share Ref. Proc. 2013 ICL Gain China 875,000 +5% +41% 1.6% x U.S. 602,000 (3%) +19% 1.2% x Latin Am*** 226,380 (0.4%) +43% 1.7% x India*** 156,430 +5% +12% 4.5% x S. Korea*** 139,280 +0.7% +12% 12.4% x Germany** 135,000 +8% +25% 1.8% x Japan 125,000 (51%) +4% 2.1% x Italy** 105,240 (5%) +38% 0.8% x Spain** 105,000 (21%) +34% 4.6% x U.K.** 97,540 (5%) +16% .3% x France** 66,250 (5%) +54% 2.5% x Middle East 61,375 (0.2%) +16% 9.3% x *Global Refractive Surgery Market by Market Scope April 2014. **ICL with CentraFLOW available all of 2013. ***ICL with CentraFLOW available during H2 2013 Market Share Gains (Refractive Procedures ↓4.6% & ICL Proc.↑25.5%)
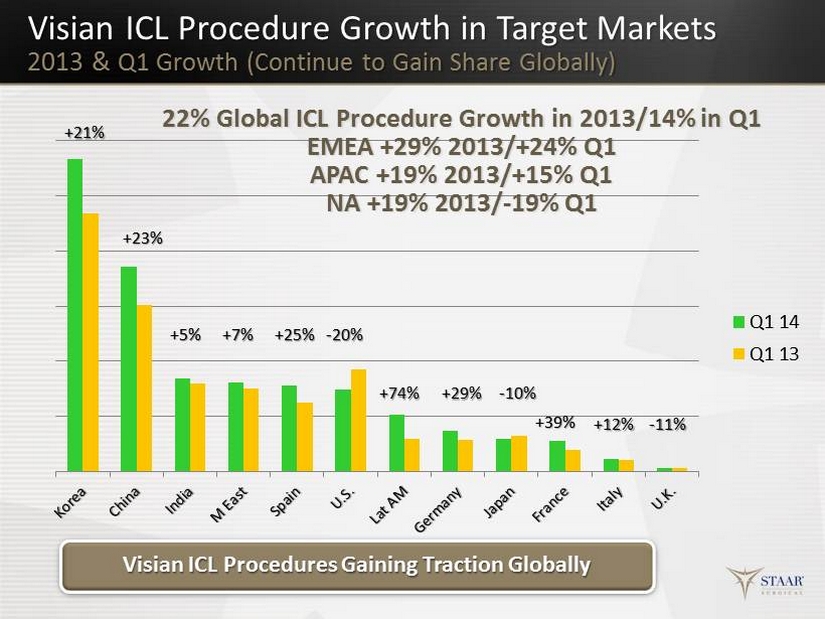
Q1 14 Q1 13 Visian ICL Procedures Gaining Traction Globally Visian ICL Procedure Growth in Target Markets 2013 & Q1 Growth (Continue to Gain Share Globally) +21% +23% + 5 % + 7 % - 20% +74 % +29% - 10% +39% +12% - 11% +25% 22% Global ICL Procedure Growth in 2013/14% in Q1 EMEA + 29% 2013/+24% Q1 APAC + 19% 2013/+15% Q1 NA +19% 2013/ - 19% Q1
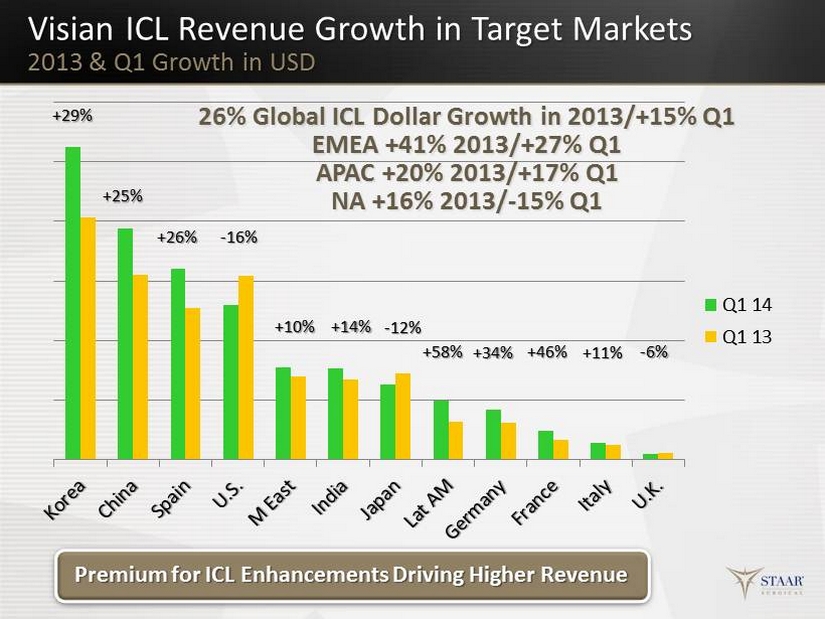
Q1 14 Q1 13 Premium for ICL Enhancements Driving Higher Revenue Visian ICL Revenue Growth in Target Markets 2013 & Q1 Growth in USD +26% +29% +25 % - 16% + 10% - 12% +14 % +46% + 34% + 58% - 6% + 11% 26% Global ICL Dollar Growth in 2013/+15% Q1 EMEA +41% 2013/+27% Q1 APAC +20% 2013/+17% Q1 NA +16% 2013/ - 15% Q1
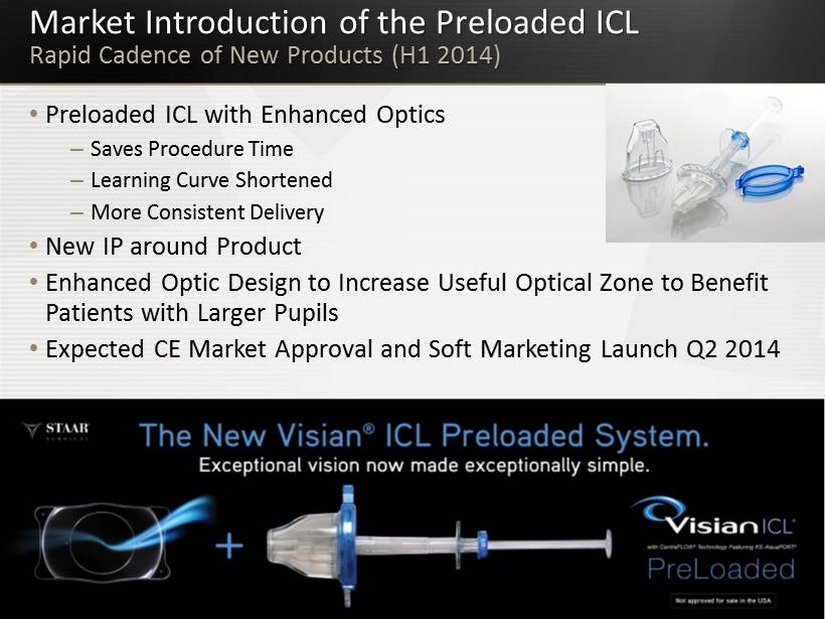
Market Introduction of the Preloaded ICL Rapid Cadence of New Products (H1 2014) 15 • Preloaded ICL with Enhanced Optics – Saves Procedure Time – Learning Curve Shortened – More Consistent Delivery • New IP around Product • Enhanced Optic Design to Increase U seful O ptical Z one to Benefit P atients with Larger Pupils • Expected CE Market Approval and Soft Marketing Launch Q2 2014
V6 ICL Next in Line (V6a ICL) Rapid Cadence of New Products (H1 2015) • Differentiates ICL for Myopic P atients N earing Age 40 Who Will Need Near & Intermediate Adds • Goal To Add Near - Vision Enhancement Capability – Treats the Early Onset and Progression of Presbyopia – Adds ≈2.0 Diopters of Near While Providing Good Intermediate • Increases ICL’s Advantages over LASIK and No Decision – Common Perception: “My LASIK has Worn Out” • Should Drive Adoption Further Down the Myopic Diopter Curve where Greater Opportunity Exists • Target Availability in EU Early 2015 16 Source: The Global Presbyopia Surgery Market by Market Scope October 2013.
V6 ICL Next in Line (V6b ICL) Rapid Cadence of New Products (H1 2016) • Targets New Market : Presbyopic Patients A ge 40 and Above – Solution to the Need for Permanent N ear & Intermediate V ision E nhancement – 100% of Population over Approximately A ge 50 Affected (Estimated 1.8 Billion Are Challenged with Presbyopia, 3.6 Billion Eyes ) • Goal To Treat Presbyopia W hile M aintaining N atural Lens – Utilizes Proven Platform of the ICL (>425,000 successful implants) • Expands the Market for ICL to Potentially the “Most E xciting S egment of Vision C orrection ” • Clinical Trials Likely Needed to Increase the Approved A ge Range • Estimated Date to Market 12 Months after V6a 17 Source: The Global Presbyopia Surgery Market by Market Scope October 2013.
Expanded Market Opportunities New Regulatory Submissions/Approvals • FDA Toric ICL Submission – Ophthalmic Device Panel Meeting Favorable Vote March 14 • CentraFLOW Submissions – Japan Approval on March 3 – Recent Approvals in Korea, India and Argentina – China Submission - May 15 th Experts Panel Meeting – U.S. Submission - Working on Clinical Protocol with Agency • Preloaded ICL Submission for CE Mark 18
Expanded Market Opportunities TICL Opportunity in U.S. • National Health and Nutrition Survey (NHANES; 1999 - 2004) – Myopia Prevalence 33.1% ( - 1.0D or higher) – Astigmatism Prevalence 36.2% (cylinder of 1.0D or higher) • Market Scope >100k Refractive Procedures >1.0D Astigmatism • In Markets Where B oth ICL and TICL Available: – Approximately 50% of Revenue and 40% of Units are TICL • Direct Pricing Model Suggests an Additional $200 for TICL • Potential TICL Approval I mpact to U.S. Market – Assuming U.S. Follows Patterns of other Markets Total ICL Sales S hould D ouble in First Y ear of Launch – How much Actual P ent Up Demand in the Market?? 19 Sources: Global Refractive Surgery Market by Market Scope January 2013 and Vitale, et al. Arch Ophthalmol . 2008;126(8):1111 - 1119. .
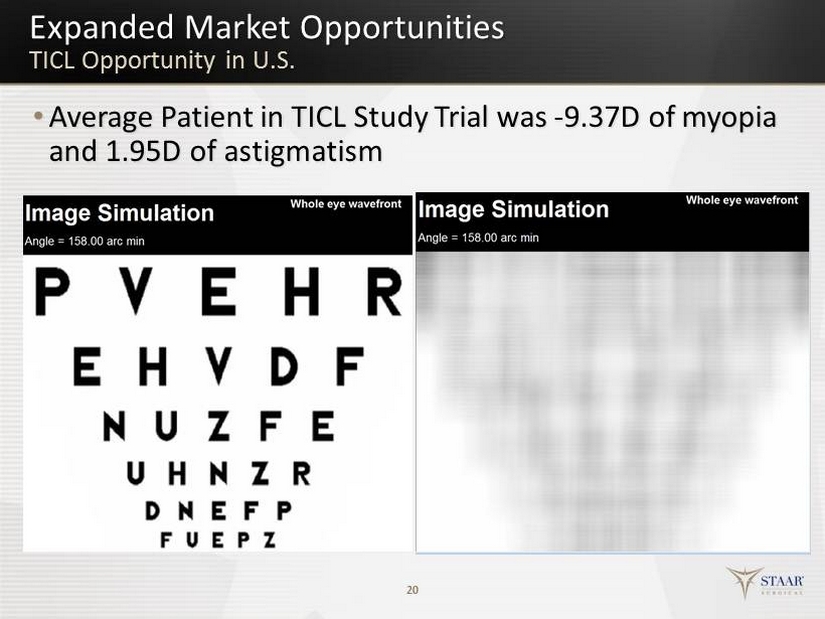
Expanded Market Opportunities TICL Opportunity in U.S. • Average Patient in TICL Study Trial was - 9.37D of myopia and 1.95D of astigmatism 20
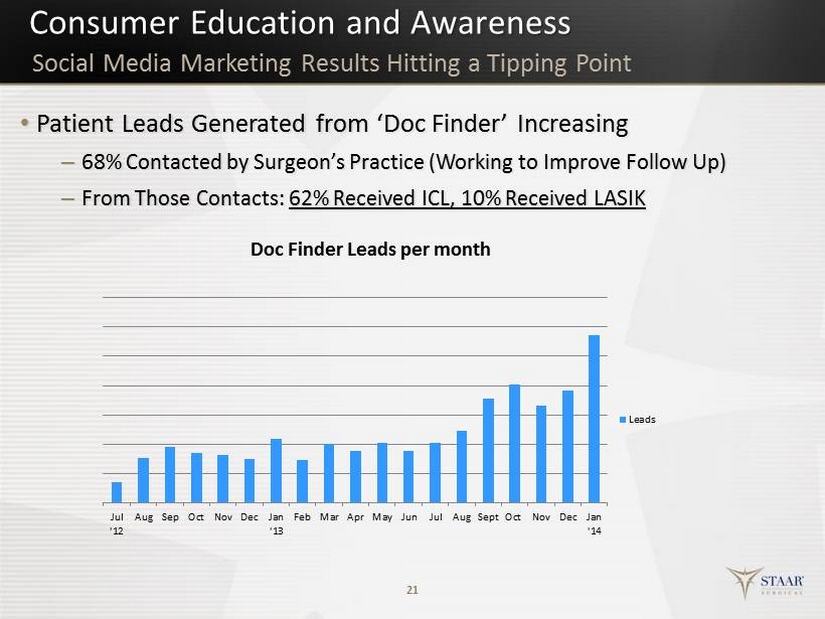
Consumer Education and Awareness • Patient Leads G enerated from ‘Doc Finder’ Increasing – 68% Contacted by Surgeon’s Practice (Working to Improve Follow Up) – From Those Contacts: 62% Received ICL, 10% Received LASIK 21 Social Media Marketing Results Hitting a Tipping Point Jul '12 Aug Sep Oct Nov Dec Jan '13 Feb Mar Apr May Jun Jul Aug Sept Oct Nov Dec Jan '14 Doc Finder Leads per month Leads
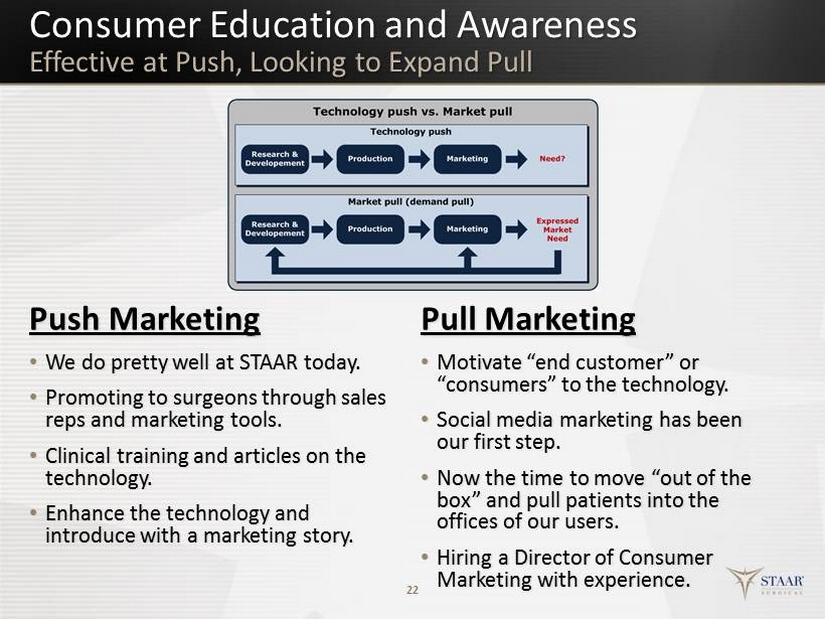
Consumer Education and Awareness Effective at Push, Looking to Expand Pull Push Marketing • We do pretty well at STAAR today. • Promoting to surgeons through sales reps and marketing tools. • Clinical training and articles on the technology. • Enhance the technology and introduce with a marketing story. Pull Marketing • Motivate “end customer” or “consumers” to the technology. • Social media marketing has been our first step. • Now the time to move “out of the box” and pull patients into the offices of our users. • Hiring a Director of Consumer Marketing with experience. 22
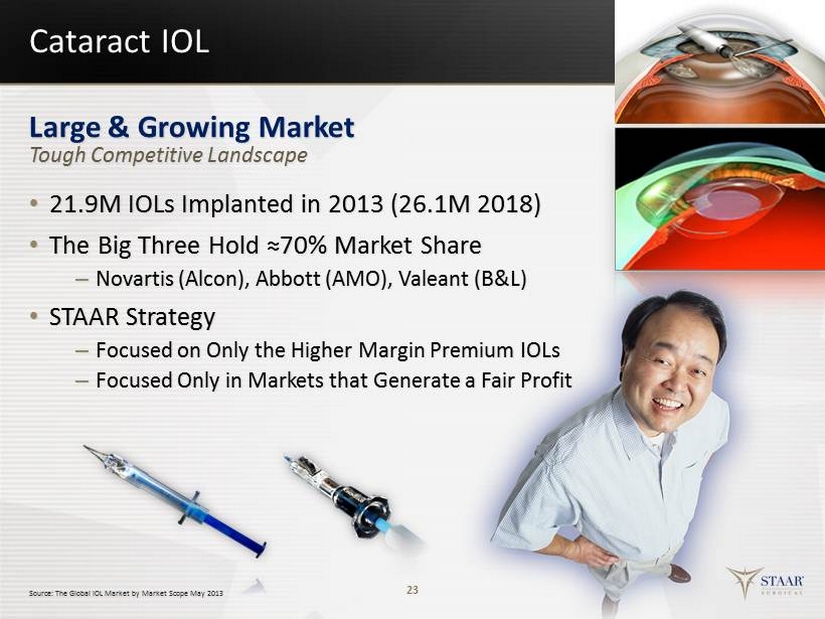
• 21.9M IOLs Implanted in 2013 ( 26.1M 2018) • The Big Three Hold ≈70% Market Share – Novartis (Alcon), Abbott (AMO), Valeant (B&L) • STAAR Strategy – Focused on Only the Higher Margin Premium IOLs – Focused Only in Markets that Generate a Fair Profit Large & Growing Market Tough Competitive Landscape 23 Source : The Global IOL Market by Market Scope May 2013 Cataract IOL
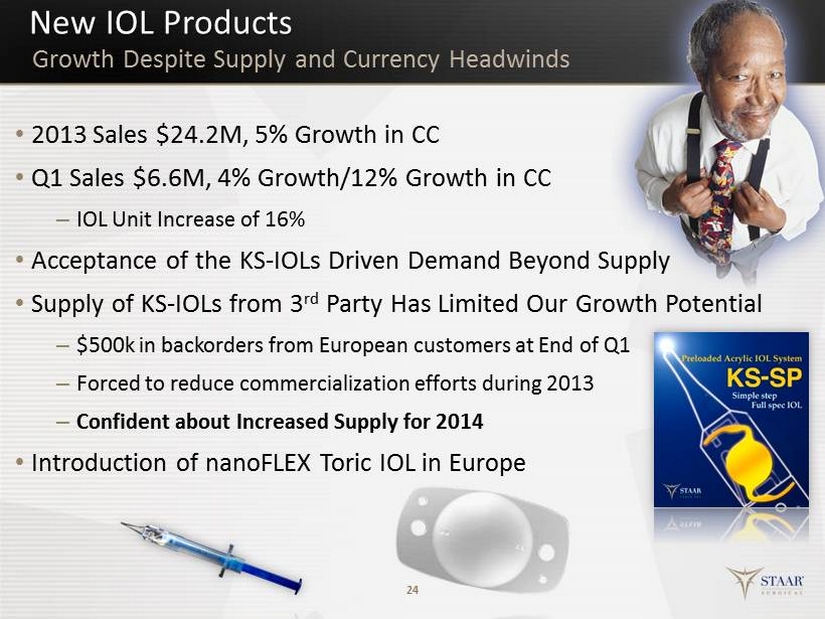
• 2013 Sales $24.2M, 5 % Growth in CC • Q1 Sales $6.6M, 4% Growth/12% Growth in CC – IOL Unit Increase of 16% • Acceptance of the KS - IOLs Driven Demand Beyond Supply • Supply of KS - IOLs from 3 rd Party H as L imited O ur Growth Potential – $500k in backorders from European customers at End of Q1 – Forced to reduce commercialization efforts during 2013 – Confident about Increased Supply for 2014 • Introduction of nanoFLEX Toric IOL in Europe 24 Growth Despite Supply and Currency Headwinds New IOL Products
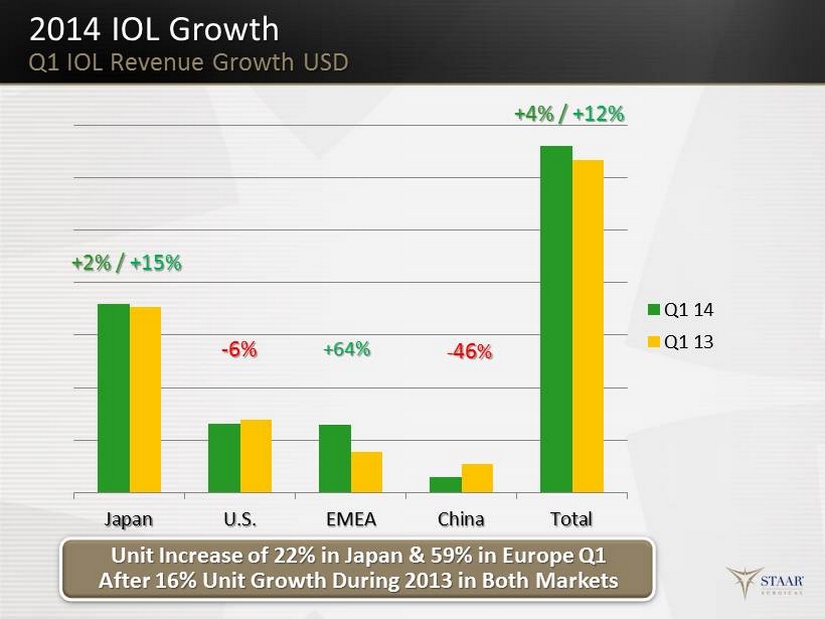
Japan U.S. EMEA China Total Q1 14 Q1 13 Unit Increase of 22% in Japan & 59% in Europe Q1 After 16% Unit Growth During 2013 in Both Markets 2014 IOL Growth Q1 IOL Revenue Growth USD +2% / +15% - 6% +64% - 46 % +4% / +12%
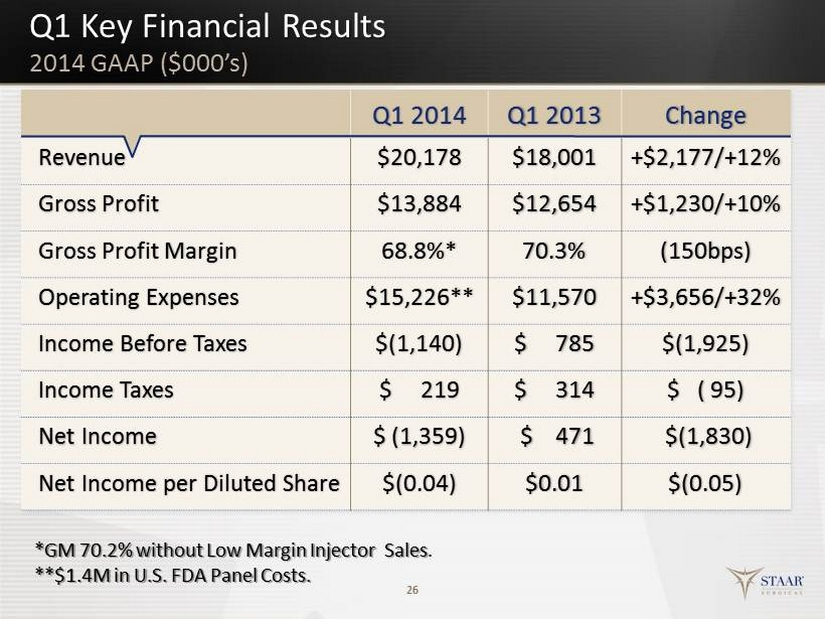
Q1 Key Financial Results 26 Q1 2014 Q1 2013 Change Revenue $20,178 $18,001 +$2,177/+12% Gross Profit $13,884 $12,654 +$1,230/+10% Gross Profit Margin 68.8%* 70.3% (150bps) Operating Expenses $15,226** $11,570 +$3,656/+32% Income Before Taxes $(1,140) $ 785 $(1,925) Income Taxes $ 219 $ 314 $ ( 95) Net Income $ ( 1,359) $ 471 $(1,830) Net Income per Diluted Share $(0.04) $0.01 $(0.05) 2014 GAAP ($000’s ) *GM 70.2% without Low Margin Injector Sales . **$1.4M in U.S. FDA Panel C osts.
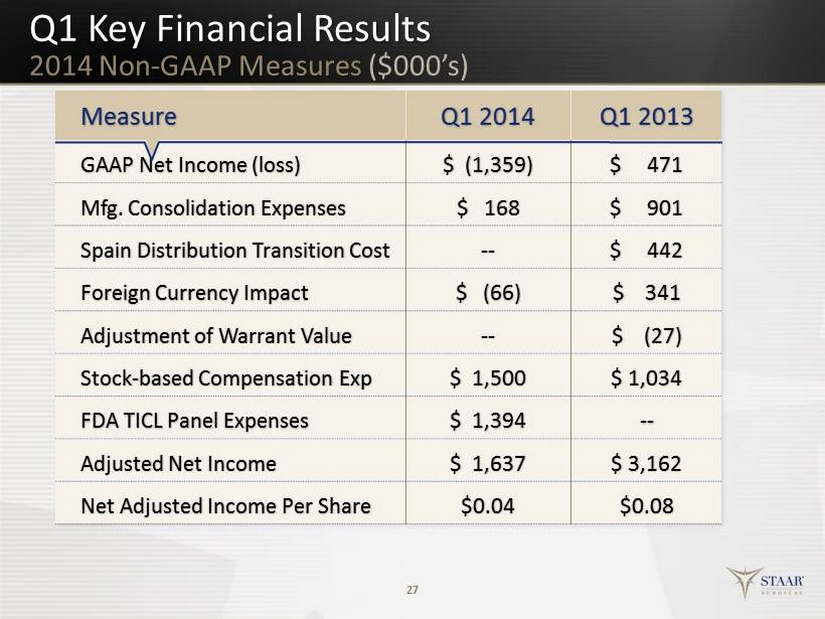
Q1 Key Financial Results 2014 Non - GAAP Measures ($000’s) 27 Measure Q1 2014 Q1 2013 GAAP Net Income (loss) $ (1,359) $ 471 Mfg. Consolidation Expenses $ 168 $ 901 Spain Distribution Transition Cost -- $ 442 Foreign Currency Impact $ (66) $ 341 Adjustment of Warrant Value -- $ ( 27 ) Stock - based Compensation Exp $ 1,500 $ 1,034 FDA TICL Panel Expenses $ 1,394 -- Adjusted Net Income $ 1,637 $ 3,162 Net Adjusted Income Per Share $0.04 $0.08
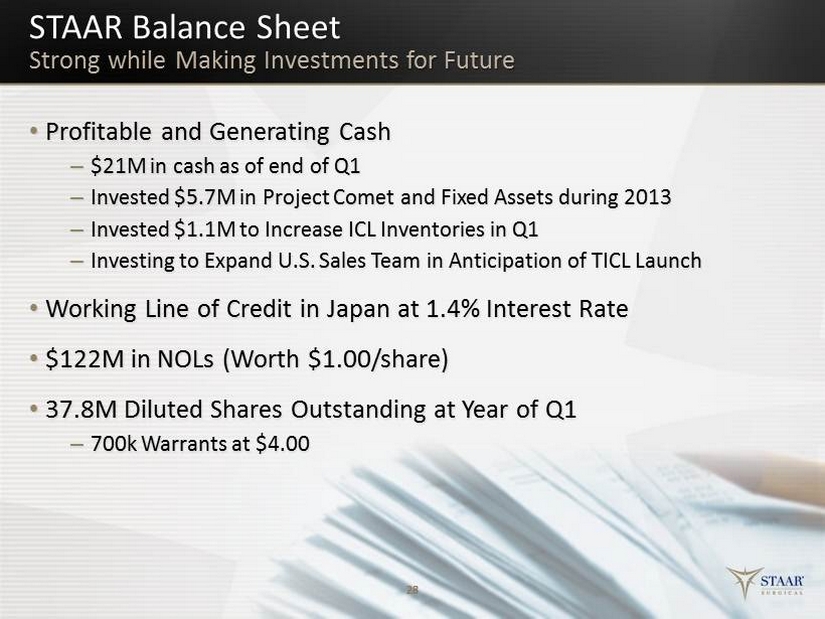
STAAR Balance Sheet Strong while Making Investments for Future • Profitable and Generating Cash – $21M in c ash as of end of Q1 – Invested $5.7M in Project Comet and Fixed Assets during 2013 – Invested $1.1M to Increase ICL Inventories in Q1 – Investing to Expand U.S. Sales Team in Anticipation of TICL Launch • Working L ine of C redit in Japan at 1.4% Interest Rate • $122M in NOLs (Worth $ 1.00/share) • 37.8M Diluted Shares Outstanding at Year of Q1 – 700k Warrants at $4.00 28
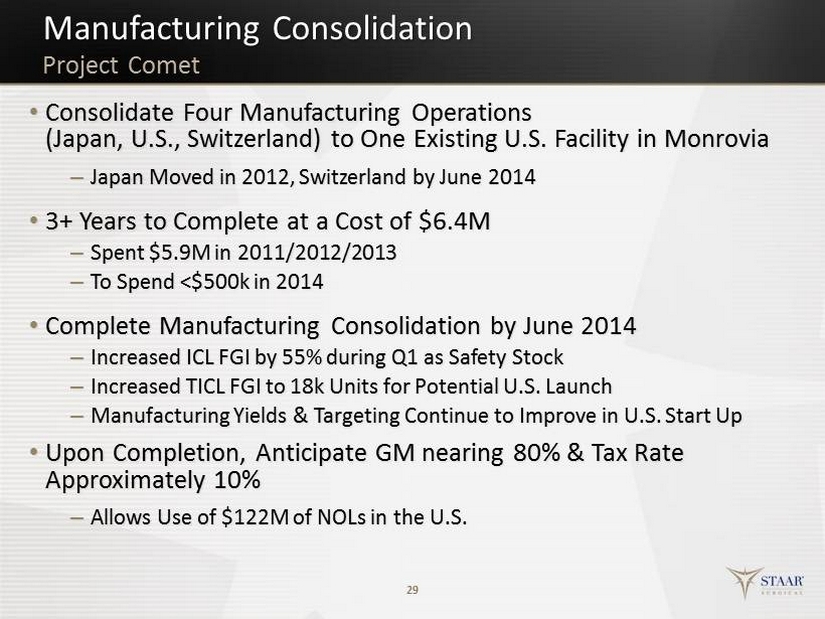
• Consolidate Four Manufacturing Operations (Japan , U.S., Switzerland) to One E xisting U.S. Facility in Monrovia – Japan Moved in 2012, Switzerland by June 2014 • 3 + Years to Complete at a Cost of $ 6.4M – Spent $5.9M in 2011/2012/2013 – To Spend <$500k in 2014 • Complete Manufacturing Consolidation by June 2014 – Increased ICL FGI by 55% during Q1 as Safety Stock – Increased TICL FGI to 18k Units for Potential U.S. Launch – Manufacturing Yields & Targeting Continue to Improve in U.S. Start Up • Upon Completion, Anticipate GM nearing 80% & Tax Rate Approximately 10% – Allows Use of $122M of NOLs in the U.S. 29 Manufacturing Consolidation Project Comet
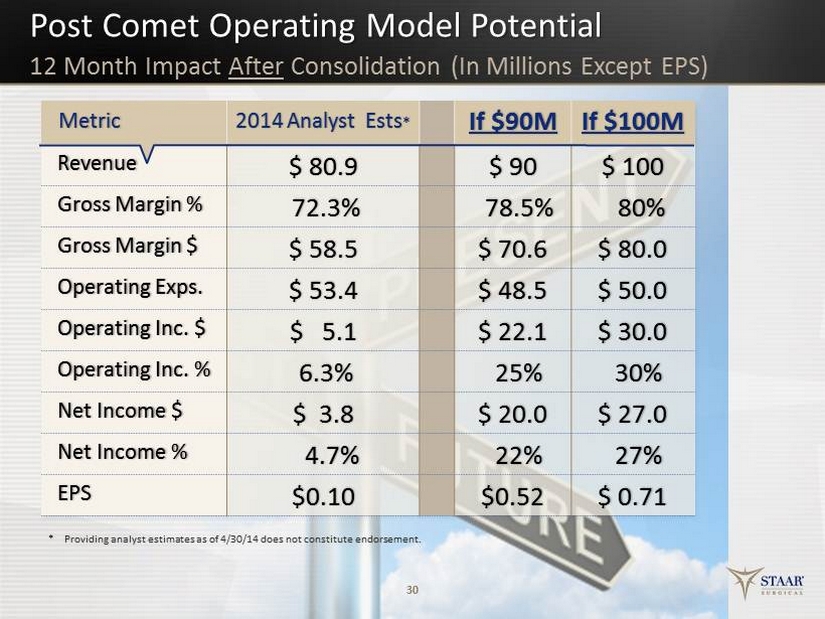
30 Metric 2014 Analyst Ests * If $90M If $100M Revenue $ 80.9 $ 90 $ 100 Gross Margin % 72.3% 78.5% 80% Gross Margin $ $ 58.5 $ 70.6 $ 80.0 Operating Exps. $ 53.4 $ 48.5 $ 50.0 Operating Inc. $ $ 5.1 $ 22.1 $ 30.0 Operating Inc. % 6.3% 25% 30% Net Income $ $ 3.8 $ 20.0 $ 27.0 Net Income % 4.7% 22% 27% EPS $0.10 $0.52 $ 0.71 * Providing a nalyst e stimates a s of 4 /30/14 d oes not c onstitute e ndorsement. 12 Month Impact After Consolidation (In Millions Except EPS) Post Comet Operating Model Potential
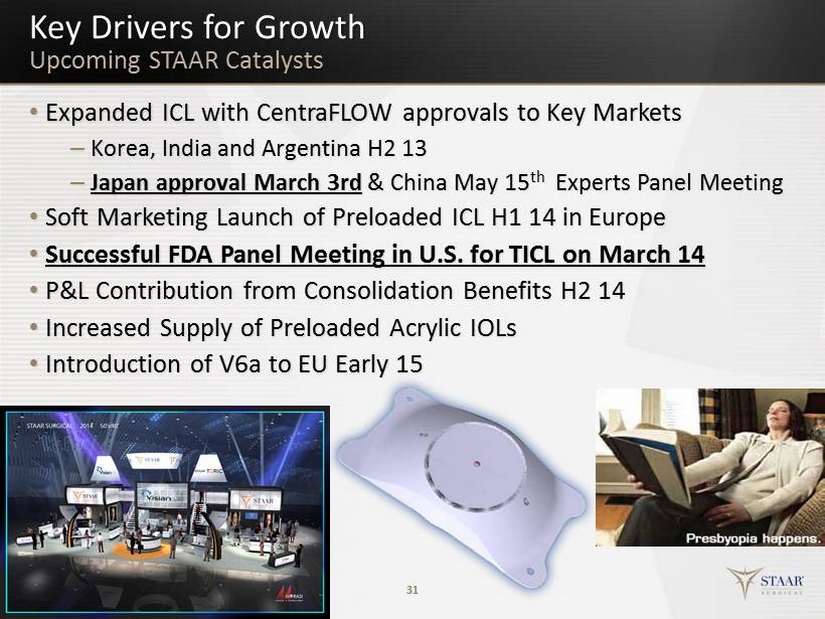
• Expanded ICL with CentraFLOW approvals to Key Markets – Korea, India and Argentina H2 13 – Japan approval March 3rd & China May 15 th Experts Panel Meeting • Soft Marketing Launch of Preloaded ICL H1 14 in Europe • Successful FDA Panel Meeting in U.S. for TICL on March 14 • P&L Contribution from Consolidation Benefits H2 14 • Increased Supply of Preloaded Acrylic IOLs • Introduction of V6a to EU E arly 15 31 Key Drivers for Growth Upcoming STAAR Catalysts
32 Visian ICL, Fastest Growing Refractive Technology in the World NASDAQ: STAA May 7, 2014