EXHIBIT 99.1
BCE INC.
2004 ANNUAL REPORT

Every day Bell is becoming an organization that is more
and more focused on our customers and their needs.
Over the past two years, we have articulated an explicit
vision of what we must do to transform Bell into a new
model communications company.
We will be: Clear; we have a clear strategy and are clear
on the challenges ahead. Most importantly we are clear on what
we need to do to meet those challenges. Simple; in the services
we offer, in how we relate to our customers and in our internal
processes. First; we will be the first choice of our customers
to provide technology that they can count on. True; to our
core values and legacy of service. Profitable; in our business.
Proud; of our 125-year history and our role as a responsible
corporate citizen.
Letters to Shareholders
Dear Fellow Shareholders,
Bell Canada was founded 125 years ago and for the past three of those years I have had the honour of serving as its Chairman. In that time, I have witnessed a company reaffirming its legacy. Bell “wired” Canada in the last century. Today, Bell is the company that is leading Canada into a new century of broadband connectivity. | To be at the end of the beginning implies that we are also at the beginning of something entirely new. That something, of course, is a new kind of telecommunications company, built on the platform of Internet Protocol (IP). For consumers and businesses, this will mean access to the full capabilities of Bell—wireline, wireless, Internet, and video—from a single source. As ever-more sophisticated technology arrives and data transfer speeds accelerate, the choices for consumers will increase. To package, organize and deliver these choices in ways consumers can use and to do so while maintaining Bell’s historically superior level of service and reliability and at materially lower cost will be the real challenge of this telecommunications transformation. |
2 Bell Canada Enterprises 2004 Annual Report

SBC’s proposed acquisition of AT&T, and in other U.S. transactions by other companies, involving wireless and satellite services, many are beginning to mirror and emulate Bell’s established model of comprehensive communications services. | Canadian business leader, has graciously declined to stand for re-election to the Board in order to eliminate any meaningful degree of interlocking directorships. On behalf of the Board, I want to recognize and thank him for his standards as well as his service.
|

3
be clear.
Dear Fellow Shareholders,
Early in February, I sat down for a thirty-minute meeting with a group of Bell Canada employees. Two and a half hours later, we adjourned. But I could have stayed all day. | I wanted to know what the mood of the company was. To know where our people stand. How they think we are doing. |
4 Bell Canada Enterprises 2004 Annual Report

and service on the highest-profile stage in the world. And it reinforces our position as the one truly national player in telecommunications. In 2004 we got serious about getting simple. For Bell, “Making it Simple” is much more than a tag line. It is our strategic direction, our rallying cry, and how we are building a new Bell Canada. | we will cut unnecessary steps and redundant functions. We will reduce re-work. And generate significant savings. Galileo is expected to contribute an estimated $1 billion to $1.5 billion in cost savings by the end of 2006. Savings that will improve shareholder returns and buy us freedom to invest in and grow new areas of our business. Steady performance, increased confidence With our financial performance in 2004, BCE has demonstrated that we can deliver steady progress even as we continue to build a more productive and more responsive business model. Total revenue for 2004 was $19.2 billion, a 2.4 per cent increase over 2003. Our EBITDA increased by 2.1 per cent to $7.6 billion. Among our most positive results was return on equity, which was 15.2 per cent. Earnings per share, excluding restructuring charges, were $2.02 , an increase of more than 6 per cent. |
5
The most significant restructuring charge taken in 2004 was $985 million associated with our Voluntary Employee Departure Program. We expect the voluntary departures—which reduced our workforce by approximately 10 per cent—to produce annual savings of approximately $390 million. A clear strategic plan Our confidence is based on the very real progress we made in 2004. While Galileo paves the way for better performance, we also developed a clear strategic framework for making the world’s first “new telecom.” Our plan rests on three strategic pillars. These foundations are not new. They are a clear expression of the strategy we set out two years ago. And against which we have already made significant progress. We will accelerate our progress over the next year as all of us at Bell drive the implementation of this plan. 1. Customer Experience | can be more productive and globally competitive. Our customers want our products and services to be easy to use, to work all the time. If there’s a problem they want us there to support them. 2. Reliable Bandwidth |
6 Bell Canada Enterprises 2004 Annual Report
Across this network will flow voice, video, music, business data, interactive gaming, the Internet and anything else that can be put into digital form. This is an area where we must lead. And we will. 3. Next-Generation Services A cultural transformation To reach these ambitious goals, we will draw fully on the great talents of all of our people. My meeting in February | with employees was just one of many. In thousands of conversations I have had with people at Bell, one thing is clear: all of us want and expect to deliver what our customers need and want— great experiences, reliable bandwidth, next-generation services. Where we are headed But every day we are working to get in step with the future. We are doing what it takes to instill a culture of confidence: an environment that promotes accountability, personal initiative and merit. A place that cultivates the creativity and the leadership of our people.
Michael J. Sabia |

7
Our Strategic Pillars
Customer Experience | ||||
Wewill face | We will face customers as one company, offering a single point of contact. One source for all of our customers’ communications— at home, at work, on the go. Bell will deliver the new freedom of digital technology free of frustrations. This is the Power of One. | |||
2004 Customer Experience Milestones
| Customer Experience in 2005
| |||
Reliable Bandwidth | ||||
Up to | In 2006, we will deliver up to 26 megabits per second data speed (about 8 times today’s DSL speeds) and, by 2008 we will be able to offer it to approximately 4.3 million households in the Québec City to Windsor corridor. With EVDO technology on the wireless side, we will deliver up to 2.4 megabits per second to mobile devices. | |||
2004 Bandwidth Milestones
| Reliable Bandwidth in 2005
| |||
Next Generation Services
Morethan
50%
ofOur Revenue
By 2006, more than 50% of our revenue is expected to come from next generation and new growth services. By the end of 2005, this will already be true in our business sectors. Our legacy businesses are slowing down. But customers are eager for new value delivered over the network. And we have laid the groundwork—bundling existing products, developing new communications products, and partnering to bring entirely new levels of value.
2004 Next Generation Services Milestones
Launch of Sympatico-MSN.ca portal
Introduction of MSN premium
Launch of wireless phone-to-phone video messaging
145,000 Enterprise Voice over IP lines
60% of major Enterprise customers buy Value-Added Solutions
Data is 50%+ of Bell’s wireless ARPU growth in 2004
57% of Mobility customers regularly use data
Launch of leading-edge wireless location-based services
Next Generation Services in 2005
70% of our major customers in the Enterprise market will purchase Value-Added Solutions, increasingly viewing us as a supplier of ICT services
In the SMB space, we will reinvent the way IT and telecom are integrated with the objective of increasing the number of SMB customers that view Bell as their technology advisor or “Virtual CIO”
We will start trials of IPTV, delivering video over ordinary phone wires
We will exploit our IP capability to achieve interoperability between wireline and wireless platforms
Introduce Internet Telephony for consumers
8 Bell Canada Enterprises 2004 Annual Report
| Financial and Operational Highlights
| ||||||
| Financial Highlights | 2004 | 2003 | 2002 | |||
| Revenue (in millions)(1) | 19,193 | 18,737 | 18,900 | |||
| EBITDA (in millions)(2) | 7,564 | 7,410 | 7,384 | |||
| Operating income (in millions) | 2,976 | 4,121 | 3,625 | |||
| Net earnings applicable to common shares (in millions) | 1,523 | 1,744 | 2,342 | |||
| Net earnings per common share | 1.65 | 1.90 | 2.66 | |||
| Net debt (in millions) | 12,705 | 13,315 | 15,158 | |||
| Net debt to capitalization ratio | 42.8 | % | 44.0 | % | 48.4 | % |
| Free cash flow (in millions)(2) | 898 | 1,589 | (783 | ) | ||
| Cash from operating activities (in millions) | 5,519 | 5,968 | 4,424 | |||
| Capital expenditures (in millions) | 3,364 | 3,167 | 3,709 | |||
| Capital intensity | 17.5 | % | 16.9 | % | 19.6 | % |
| Operational Highlights | 2004 | 2003 | 2002 | |||
| Customer connections (thousands) | ||||||
Local telephone | 12,905 | 13,051 | 13,154 | |||
Cellular and personal communications (PCS) | 4,925 | 4,412 | 3,898 | |||
Paging | 427 | 524 | 639 | |||
High-speed Internet access | 1,808 | 1,458 | 1,100 | |||
Dial-up Internet access | 743 | 869 | 957 | |||
Video | 1,503 | 1,387 | 1,304 | |||
Digital equivalent access lines | 4,335 | 3,867 | 3,683 | |||
| 26,646 | 25,568 | 24,735 | ||||
| Net activations (thousands) | ||||||
Cellular and personal communications (PCS) | 513 | 514 | 452 | |||
High-speed Internet access | 350 | 358 | 343 | |||
Video | 116 | 83 | 235 | |||
(1) Our financial results in 2004 and 2003 exclude the financial results of the directories business, which we sold in November 2002. Our financial results before that date, include those of that business. In 2002, the directories business contributed $501 million of revenues and $311 million of EBITDA. (2) The terms EBITDA (Earnings before interest, taxes, depreciation and amortization) and free cash flow do not have a standardized meaning prescribed by Canadian generally accepted accounting principles (GAAP) and may not be comparable to similar measures presented by other publicly traded companies. Refer to pages 32 to 34 of this Annual Report for a description of these terms.
| ||||||
be simple.

| be simple. | Galileo
| |
At Bell, we believe that a complex solution solves nothing. We know our customers—individuals and businesses alike—are excited by the promise of new communications technology, but fear adding yet another level of complexity to their lives and business. Which is why we strive to offer products and services that are easy and intuitive to use, and customer interactions as straightforward and hassle-free as possible.
| When Melanie Singh was given the task of designing a new way to deliver IP products, her first step was to throw out Bell’s standard operations manual. The result was the “IP Garage”—not just a tune up but a literal overhaul of how Bell goes about delivering services to its customers. As Bell Canada’s private think tank, the Garage focused the talents of the company’s top 25 IP specialists towards a single goal: to simplify the IP installation process. |

12 Bell Canada Enterprises 2004 Annual Report
| One Bell
| A New Network
| |
 |  | |
Last May, Bell Canada customer Lisa Bratina had a problem. Three problems, actually: her daughter had been pestering her for a cellphone for weeks, her son complained of slow Internet speeds when he got home from school, and her husband was always missing his favourite television programs. Lisa wanted to get these distractions behind her, but she also envisioned hours and hours of trying to order new services and sorting through confusing forms. She decided to call Bell first. | Everything over IP. One backbone, one network, across Canada. Sitting behind everything we do to offer customers smarter contact, reliable bandwidth and new services will be a new, IP-based network.
|
13
be first.

| be first.
| Way Better TV
| |
 | ||
Our goal is to be our customers’ first choice for the broadband future. Being first to us is more than bringing new technologies to the market, or establishing leading competitive positions in the markets we serve. At Bell, we use technology to develop and to deliver great products and services that have meaningful benefits to our customers, connecting, entertaining and informing them. Our goal is to package and integrate new technologies to help businesses be more productive and more competitive—locally or globally. | It’s harder than ever to be a couch potato. Thanks to the advent of new, interactive technology, watching television has never been less passive. A touch of a button allows viewers to pause and rewind live television, choose their own camera angles, play interactive games and preview one program while watching another. |
16 Bell Canada Enterprises 2004 Annual Report
Next Generation Wireless
| Family Friendly Internet
| |
 |  | |
We built a wireless network for voice. Today we are building a wireless network for voice, data, video, games and more. | Studies of our customers’ Internet usage have shown us that, as children enter school, Internet usage climbs significantly. It also spikes when children leave home to go away to university, because of the use of e-mail to keep in touch. It seems odd, then, that a service so vital to Canadian families should be so plagued with spam, computer viruses, spyware, and adware. In fact, one study concludes that over 90 per cent of computers are unwitting hosts to some type of computer virus. |
17
be true.

| be true.
| Service in the Field
| |
Service is the essence of Bell Canada. It is in our DNA. It is our single, unifying thread. It is why we are here. | In Sainte-Thérèse, Québec, at the top of a telephone pole, Bell Canada technician François Laporte has been splicing icy wires for hours. With several hours to go before his job is finished, François is glad his helmet has a flashlight. François is exceptional. But at Bell, he is not unusual. |
20 Bell Canada Enterprises 2004 Annual Report
A Culture of Confidence
| Moments of Truth
| |
 |  | |
When Stéphane Gemme, a call centre manager for Bell in Montréal, saw a competitor launch a voice product on the city’s South Shore, he didn’t wait for an order from the top before he took action. Stéphane simply saw an opportunity to help his company. In fact, he felt a responsibility to do so. | Every customer interaction is a moment of truth. Every call to customer service, every e-mail, every product installation, every time a bill arrives. Thousands of moments of truth for Bell, each and every day. If a customer has a negative experience with Bell, we fail those moments of truth—and we fail ourselves. |
21
be profitable.

| be profitable.
| The Broadband Home
| |
 | ||
The first duty of any corporation is to provide an increasing rate of return to its shareholders. At Bell, we are making the decisions that will result in profitable growth. | Millions of Bell consumers are already living in the broadband future—they just don’t know it. Millions more will be soon. Any house with Bell DSL (Digital Subscriber Line) is connected to the IP network that makes the broadband future a reality. When we complete our Fibre-to-the-Node (FTTN) installation by the end of 2008, a high-speed broadband connection eight times faster than today’s DSL lines will come through the line into nearly every Bell customer’s house in the Québec City to Windsor corridor. And because of that broadband connection, Bell will be able to offer a wider and more varied selection of services to our customers. |
24 Bell Canada Enterprises 2004 Annual Report
| Enterprise Moves to IP
| Bringing IT Management to SMBs
| |
 |  | |
Our 1,000 largest customers make up our Enterprise customer segment. These large organizations have unique telecommunications requirements, often extending into information technology and database management. | Everyone at the Ambassador Hotel in Kingston, Ontario has something to smile about. Thanks to a Bell Small-and-Medium-Business representative working with them to find the right wireless and wireline solutions. The hotel now features wireless technology allowing guests to browse the Internet at their leisure from the comfort of their room or from anywhere within the resort and allowing staff to offer curb-side check in. |
25
be proud.

be proud.
| Olympic Partnership
| |
 | ||
The employees and shareholders of Bell Canada have many reasons to be proud. Proud of what we have accomplished together, proud of the important role that the company plays in Canada, proud of what the future holds. For 125 years, Bell has formed an important part of the fabric of this country.
| We were honoured to be chosen by the Vancouver Organizing Committee to be the Premier National Partner for the 2010 Olympic and Paralympic Winter Games. These will be Canada’s games and we are excited about our opportunity to bring them to our country and bring Canada to the world. But of course, connecting Canadians to each other and to the rest of the world is what we’ve always done. |
28 Bell Canada Enterprises 2004 Annual Report
| Corporate Responsibility
| 125th Anniversary
| |
 |  | |
For 125 years, we have demonstrated our dedication to responsible corporate citizenship. Of course, corporate citizenship starts with running a successful business. Producing the goods and services that customers need. Creating meaningful jobs for Canadians. Generating a return for our shareholders so we can keep investing. But our commitment to corporate responsibility goes beyond the economic impact of our operations. We are proud of our strong and internationally recognized governance principles and structure that guide our approach to business. We take seriously our duty to help safeguard the environment and have substantially reduced our environmental impact. | We are the company that pioneered telecommunications in Canada. There aren’t many businesses that can say they helped connect a nation, but Bell Canada is one of them. There also aren’t many businesses that last 25 years, let alone 125 years, but Bell is one of those as well. |
29
be there.Providing connections Canada can count on. This has defined Bell Canada for the last 125 years. Despite changes in connectivity—wireline to wireless, cable to satellite, the advent of the Internet—our tireless desire to deliver those connections hasn’t changed. And as we turn to the years ahead, we will add to these connections. The power of new generations of services delivered simply and reliably. As this new century unfolds, we will continue to be there, for each and every one of our customers. |
31 Bell Canada Enterprises 2004 Annual Report
Please refer to the audited consolidated financial statements when reading this MD&A. You will find more information about BCE, including BCE Inc.’s annual information form for the year ended December 31, 2004 (BCE 2004 AIF) and recent financial reports, on BCE Inc.’s website at www.bce.ca, on SEDAR at www.sedar.com and on EDGAR at www.sec.gov. In this MD&A, we, us, our and BCE mean BCE Inc., its subsidiaries and joint ventures. All amounts in this MD&A are in millions of Canadian dollars, except where otherwise noted. A statement we make is forward-looking when it uses what we know and expect today to make a statement about the future. Forward-looking statements may include words such as anticipate, believe, could, expect, goal, guidance, intend, may, objective, outlook, plan, seek, should, strive, target and will. Non-GAAP Financial Measures This section describes the non-GAAP financial measures we used in the MD&A to explain our financial results. It also provides reconciliations of the non-GAAP financial measures to the most comparable Canadian GAAP financial measures. | Management’s Discussion and Analysis This management’s discussion and analysis of financial condition and results of operations (MD&A) comments on BCE’s operations, performance and financial condition for the years ended December 31, 2004 and 2003. About Forward-Looking Statements Securities laws encourage companies to disclose forward-looking information so that investors can get a better understanding of the company’s future prospects and make informed investment decisions.
Risks that could cause our actual results to materially differ from our current expectations are discussed throughout this MD&A and, in particular, in Risks that Could Affect Our Business. EBITDA The term EBITDA does not have any standardized meaning prescribed by Canadian generally accepted accounting principles (GAAP). It is therefore unlikely to be comparable to similar measures presented by other companies. EBITDA is presented on a consistent basis from period to period. | |||
32 Bell Canada Enterprises 2004 Annual Report
EBITDA We define EBITDA (earnings before interest, taxes, depreciation and amortization) as operating revenues less operating expenses, which means it represents operating income before amortization expense, net benefit plans cost, and restructuring and other items. | BCE | 2004 | 2003 | |||
| EBITDA | 7,564 | 7,410 | ||||
| Amortization expense | (3,108 | ) | (3,100 | ) | ||
| Net benefit plans cost | (256 | ) | (175 | ) | ||
| Restructuring and other items | (1,224 | ) | (14 | ) | ||
| Operating income | 2,976 | 4,121 | ||||
| BELL CANADA | 2004 | 2003 | ||||
| EBITDA | 7,111 | 7,001 | ||||
| Amortization expense | (2,962 | ) | (2,970 | ) | ||
| Net benefit plans cost | (235 | ) | (181 | ) | ||
| Restructuring and other items | (1,219 | ) | (14 | ) | ||
| Operating income | 2,695 | 3,836 | ||||
Operating Income Before Restructuring and Other Items The term operating income before restructuring and other items does not have any standardized meaning prescribed by Canadian GAAP. It is therefore unlikely to be comparable to similar measures presented by other companies. | ||||||
| 2004 | 2003 | ||||
| Operating income | 2,976 | 4,121 | |||
| Restructuring and other items | 1,224 | 14 | |||
Operating income before restructuring and other items | 4,200 | 4,135 | |||
Net Earnings Before Restructuring and Other Items and Net Gains on Investments The term net earnings before restructuring and other items and net gains on investments does not have any standardized meaning prescribed by Canadian GAAP. It is therefore unlikely to be comparable to similar measures presented by other companies. | |||||
| 2004 | 2003 | ||||||||
| TOTAL | PER SHARE | TOTAL | PER SHARE | ||||||
| Net earnings applicable to common shares | 1,523 | 1.65 | 1,744 | 1.90 | |||||
| Restructuring and other items | 772 | 0.83 | 3 | – | |||||
| Net gains on investments | (423 | ) | (0.46 | ) | 2 | – | |||
| Net earnings before restructuring and other items | |||||||||
| and net gains on investments | 1,872 | 2.02 | 1,749 | 1.90 | |||||
33 Bell Canada Enterprises 2004 Annual Report
Free Cash Flow We define free cash flow as cash from operating activities after capital expenditures, total dividends and other investing activities. | Management’s Discussion and Analysis Free Cash Flow The term free cash flow does not have any standardized meaning prescribed by Canadian GAAP. It is therefore unlikely to be comparable to similar measures presented by other companies. Free cash flow is presented on a consistent basis from period to period. | |||||
| 2004 | 2003 | |||||
| Cash from operating activities | 5,519 | 5,968 | ||||
| Capital expenditures | (3,364 | ) | (3,167 | ) | ||
| Total dividends paid | (1,381 | ) | (1,274 | ) | ||
| Other investing activities | 124 | 62 | ||||
| Free cash flow | 898 | 1,589 | ||||
| Restructuring and other items | 194 | – | ||||
Free cash flow before restructuring and other items | 1,092 | 1,589 | ||||
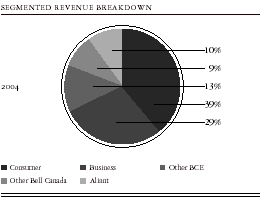
BCE is Canada’s largest communications company. Our primary focus is Bell Canada, which is Canada’s leading provider of wireline and wireless communications services, Internet access, data services and video services to residential and business customers, and represents the largest component of our business. We report Bell Canada’s results of operations in four segments. Each reflects a distinct customer group: Consumer, Business, Aliant and Other Bell Canada. All of our other activities are reported in the Other BCE segment. Our reporting structure reflects how we manage our business and how we classify our operations for planning and measuring performance. We discuss our consolidated operating results in this MD&A, as well as the operating results of each segment. See Note 2 to the consolidated financial statements for information about our segments. We also discuss our results by product line to give further insight into these results.
Consumer Segment The Consumer segment provides local telephone, long distance, wireless, Internet access, video and other services to Bell Canada’s residential customers, mainly in Ontario and Québec. Wireless services are also offered in Western Canada and video services are provided nationwide. The Business segment provides local telephone, long distance, wireless, data (including Internet access) and other services to Bell Canada’s small and medium-sized businesses (SMB) and large enterprise (Enterprise) |
34 Bell Canada Enterprises 2004 Annual Report
customers in Ontario and Québec, as well as business customers in Western Canada. Aliant Segment The Aliant segment provides local telephone, long distance, wireless, data (including Internet access) and other services to residential and business customers in Atlantic Canada, and represents the operations of our subsidiary, Aliant Inc. (Aliant). Other Bell Canada Segment The Other Bell Canada segment includes Bell Canada’s Wholesale business and the financial results of Télébec Limited Partnership (Télébec), NorthernTel Limited Partnership (NorthernTel) and Northwestel Inc. (Northwestel). Our Wholesale business provides local telephone, long distance, wireless, data and other services to competitors who resell these services. Télébec, NorthernTel and Northwestel provide telecommunications services to less populated areas of Québec, Ontario and Canada’s northern territories. Other BCE Segment The Other BCE segment includes the financial results of our media, satellite and information technology (IT) businesses as well as the costs incurred by our corporate office. This segment includes Bell Globemedia Inc. (Bell Globemedia), Telesat Canada (Telesat) and CGI Group Inc. (CGI). Bell Canada Products and Services Bell Canada is our primary focus and the largest component of our business. It has six major lines of business:
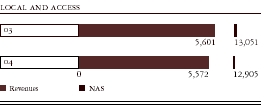
Local and Access Services Bell Canada operates an extensive local access network that provides local telephone services to business and residential customers. The 12.9 million local telephone lines, or network access services (NAS), we provide for our customers are key in establishing customer relationships and are the foundation for the other products and services we offer. |
35 Bell Canada Enterprises 2004 Annual Report
| Management’s Discussion and Analysis Local telephone service is the main source of local and access revenues. Other sources of local and access revenues include:
Rates for local telephone and value-added services in our incumbent territories are regulated by the Canadian Radio-television and Telecommunications Commission (CRTC). Long Distance Services We supply long distance voice services to business and residential customers. We also receive settlement payments from other carriers for completing their customers’ long distance calls in our territory. Wireless Services We offer a full range of wireless communications services to business and residential customers, including cellular, personal communications services (PCS) and paging. PCS customers can get wireless access to the Internet through our Mobile Browser service or send text messages. We also provide value-added services, such as call display and voicemail, and roaming services with other wireless service providers. Customers can choose to pay for their cellular and PCS services through a monthly rate plan (postpaid) or in advance (prepaid). At the end of 2004, we had more than 5.3 million cellular, PCS and paging customers.
In December 2004, we announced we were in trials for Canada’s first Evolution, Data Optimized (EVDO) network, which will provide wireless broadband speeds up to six times faster than data speeds available today. We expect to deploy EVDO in major urban centres across Canada in 2005 and 2006. Data Services High-speed Internet access service provided through digital subscriber line (DSL) technology for residential and SMB customers is a growth area for Bell Canada. At the end of 2004, we had over 1.8 million high-speed Internet customers. |
36 Bell Canada Enterprises 2004 Annual Report
We offer a full range of data services to business customers, including Internet access, Internet protocol (IP) based services, VAS and equipment sales. While we still offer legacy data services such as frame relay and asynchronous transfer mode (ATM), we began the process of discontinuing legacy data services by announcing in 2004 that we would not sell several of these services to customers who do not use them currently. Video Services We are Canada’s largest digital television provider, broadcasting nationally more than 400 video and CD-quality audio channels, including up to 25 high definition channels and unique interactive television services. At the end of 2004, we provided video services to more than 1.5 million customers. We currently distribute our video services to customers in one of two ways:
In the future, we plan to provide an IPTV service (video over Internet protocol) terrestrially to urban households in the Québec City to Windsor corridor. In 2004, we received CRTC approval of our broadcast licence application to deliver video services terrestrially to single family units (SFUs). We plan to conduct trials of our IPTV service in 2005. Terminal Sales and Other This category includes revenues from a number of other sources, including:
Discontinued Operations In the past two years, we have disposed of or approved formal plans for disposing of a number of our businesses. These include:
All of these business dispositions were treated as discontinued operations. Our Strategic Priorities The telecommunications industry continues to evolve rapidly as the industry moves from multiple service-specific networks to IP-based integrated communications networks where text, video, sound and voice all travel on a single network. While IP-based communications is creating a new competitive landscape with reduced barriers to entry, it also unleashes new growth opportunities and the ability to achieve significant cost savings. |
37 Bell Canada Enterprises 2004 Annual Report
| Management’s Discussion and Analysis opportunities created by IP-based communications should allow us to deliver on the guiding principles of our strategy of customer simplification, innovation and efficiency. This strategy is founded on three priorities: 1. Deliver an enhanced customer experience with the objective of enabling a significantly lower cost structure at Bell Canada. A year ago we announced a far-reaching, company-wide program called Galileo (Galileo) designed to simplify and enhance the customer experience. In the Consumer segment, Galileo aims to unify the customer experience across all product lines, and eliminate the costs of complexity associated with multiple systems and processes. In the Business segment, Galileo aims to deliver to customers a streamlined service offer based on IP, thereby eliminating the costs of multiple data networks and related processes. In our Consumer segment:
In our Business segment:
In 2005, we will continue to work on both of these areas. In Consumer, we will continue to deliver on our strategy to win the broadband home. In particular, we:
In Business, we will:
By the end of 2006, through our Galileo initiatives, we are targeting to remove between $1 billion and $1.5 billion in annual costs from our current cost structure. 2. Deliver abundant bandwidth to enable all the services of the future with the reliability and security that customers require. Over the next four years, we plan to make a significant investment to expand the reach and amount of bandwidth available to customers. We are aiming to be able to deliver by 2008 up to 26 Mbps to 85% of urban households in the Québec City to Windsor corridor, or |
38 Bell Canada Enterprises 2004 Annual Report
approximately 4.3 million households. Four million of these households will be SFUs that will be served using a fibre-to-the-node (FTTN) architecture capable of delivering IPTV service. The remaining 300,000 households will be MDUs served using VDSL. 3. Create the next-generation services to drive future growth. We continue to leverage our network capabilities, customer base and market knowledge to deliver innovative next-generation services. We plan to develop applications together with our wide array of partners, integrate them into useful services and bring these services to market using our strong brand, customer reach and channels.
For Enterprise customers, we launched our Managed IP Telephony service. By year end, Bell Canada had sold more than 145,000 IP-enabled lines on customer premises equipment (CPE). We also enhanced our portfolio of value-added services through the acquisitions of:
As part of our strategy to become the technology advisor of choice to SMB customers, we:
In 2005, we plan to introduce Internet telephony service for consumers. In the Enterprise unit, we are targeting to increase the proportion of our customers in the Enterprise market purchasing value-added solutions. In the SMB market, we intend to reinvent the way information technology and telecom are integrated with the objective of increasing the number of SMB customers that view Bell Canada as their virtual Chief Information Officer (VCIO). |
39 Bell Canada Enterprises 2004 Annual Report
The Year at a Glance This section reviews the key measures we use to assess our performance and how our results in 2004 compare to our results in 2003.
| Management’s Discussion and Analysis We will exploit the IP capability to achieve interoperability between wireless and wireline platforms. For instance, in 2005 we are targeting to bring to market an integrated single-voice mailbox for both cellular and land lines to allow customer access to voicemail messages through a single voicemail system. The results for 2004 demonstrate steady progress on our strategic objectives. We set a solid foundation for future growth, simplification of our customers’ experience and the transformation of our cost structure. Overall, our 2004 revenue growth performance exceeded the rate of growth achieved last year. The decrease in operating income was driven mainly by the restructuring and other items mainly related to the employee departure programs announced by Bell Canada and Aliant. Before restructuring and other items, operating income grew compared to last year, despite the negative impact of Aliant’s labour disruption. This growth reflected better operating performance at Bell Canada. Customer Connections |
| 2004 | CONNECTIONS AT | ||||
| (in thousands) | NET ADDS | DECEMBER 31, 2004 | |||
| NAS | (146 | ) | 12,905 | ||
| Digital equivalent access lines | 468 | 4,335 | |||
| High-speed Internet | 350 | 1,808 | |||
| Dial-up Internet | (126 | ) | 743 | ||
| Cellular and PCS | 513 | 4,925 | |||
| Paging | (97 | ) | 427 | ||
| Video | 116 | 1,503 | |||
| Total | 1,078 | 26,646 | |||
Wireless Our total cellular and PCS subscriber base grew 11.6% or 513,000 in 2004 to reach 4,925,000 at December 31, 2004. This reflects a similar level of net additions as in 2003. We also improved blended and postpaid churn by 0.1 and 0.2 percentage points, respectively, over 2003. | |||||
40 Bell Canada Enterprises 2004 Annual Report
Operating Income/EBITDA EBITDA margin is EBITDA divided by operating revenues.
| High-Speed Internet Our DSL high-speed Internet business added 350,000 customers in 2004, increasing our DSL customer base by 24% to reach 1,808,000 at December 31, 2004. The additions achieved in 2004 were slightly lower than the 358,000 subscribers added in 2003. We also more than doubled our subscriptions to Sympatico value-added solutions over December 31, 2003, to reach an end of period count of 624,000. Video We gained momentum in our video business in 2004, ending the year with over 1.5 million subscribers, growing by 8.4% over 2003. During the year, we had 116,000 net activations, an increase of 40% over 2003. Bell ExpressVu achieved its target in the deployment of VDSL to MDUs, signing access agreements for 335 buildings by year end. NAS Our NAS levels declined 1.1% or 146,000 in 2004, similar to the rate of decline in 2003, reflecting the substitution of wireline with wireless services and a reduction in the number of second lines as a result of growth in high-speed Internet access. Operating Revenues Operating revenues increased 2.4% or $456 million to $19,193 million in 2004, compared to 2003. This reflects a rate of growth which exceeded our 2003 performance. Bell Canada contributed most of the increase despite the trailing effects of the implementation of a new wireless billing system and a prolonged labour disruption at Aliant. Operating Income/EBITDA  Operating income for the year declined $1,145 million to $2,976 million in 2004, compared to 2003. This was mainly a result of restructuring and other items of $1,224 million recorded in 2004. The cost of the employee departure programs announced at Bell Canada in June of this year, encompassing a total of 5,052 employees, and at Aliant, announced in the fourth quarter this year encompassing a total of 693 employees, amounted to $1,063 million. In addition, the labour disruption at Aliant had an estimated negative impact of $68 million on operating income. |
41 Bell Canada Enterprises 2004 Annual Report
Net Earnings ROE (return on common shareholders’ equity) is calculated as net earnings applicable to common shares as a percentage of average common shareholders’ equity. Capital Expenditures Capital intensity is capital expenditures divided by operating revenues. It is a key financial measure that we use to assess our performance and that of our business units. | Management’s Discussion and Analysis EBITDA erosion in our legacy services was offset by a continued focus on productivity, as well as EBITDA contributions from IP connectivity, VAS and VCIO revenue gains in our Business segment. Net Earnings/Earnings per Share (EPS) 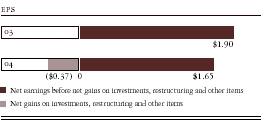 Net earnings applicable to common shares for 2004 were $1,523 million, or $1.65 per common share. This compared to net earnings of $1,744 million, or $1.90 per common share in 2003. ROE was 12.5% in 2004, compared to 15.1% last year. Included in 2004 net earnings were net losses of $349 million after taxes and non-controlling interest, or $0.37 per common share, consisting primarily of:
This compared to net losses of $5 million included in 2003 net earnings due mainly to the loss on sale of Emergis’ US Health operations, which was partly offset by a gain on sale of an interest in YPG. Capital Expenditures
Capital expenditures increased 6.2% or $197 million to $3,364 million in 2004, compared to 2003. Capital spending as a percentage of revenues was 17.5% in 2004, compared to 16.9% in 2003. Capital intensity at Bell Canada also increased from 17.4% to 18.0%. Capital spending at Bell Canada in 2004 reflected a mix of higher investment in the growth areas of the business and reduced expenditures in legacy areas. |

42 Bell Canada Enterprises 2004 Annual Report
Cash Flows Net debt to capitalization ratio is a key measure we use to assess our financial condition. It shows how much net debt (debt due within one year and long-term debt, net of cash) we have in relation to our capitalization (total net debt, non-controlling interest and shareholders’ equity). | Cash Flows
Cash from operating activities decreased 7.5% or $449 million to $5,519 million in 2004, compared to 2003. The decline resulted mainly from cash tax refunds of $440 million received in 2003 that did not recur this year, higher cash payments related to the employee departure programs and higher working capital requirements, partly offset by the receipt of $75 million from the settlement of lawsuits against MTS and Allstream Inc. (Allstream). New Labour Agreements During the year, Bell Canada reached a new four-year agreement with approximately 7,100 technicians represented by the Communications, Energy and Paperworkers Union of Canada (CEP). This agreement will expire in November 2007. Rewarding Shareholders On December 15, 2004, having achieved a solid capital structure and traction on our strategic initiatives, we announced, subject to being declared by the board of directors, a 10%, or $0.12 per share, increase in our annual dividend on BCE Inc. common shares. |

43 Bell Canada Enterprises 2004 Annual Report
This section shows selected financial and operational data. EBITDA to interest ratio is EBITDA divided by interest expense. Operating margin is operating income divided by operating revenues. Net debt to EBITDA is net debt divided by EBITDA. Total debt to total assets is total long-term debt (including debt due within one year) divided by total assets. Long-term debt to equity is long-term debt (including portion due within one year) divided by shareholders’ equity. Cash flow per share is calculated by dividing cash from operating activities less capital expenditures by the average number of common shares outstanding. Cash flow yield is cash from operating activities less capital expenditures, other investing activities, dividends on preferred shares and dividends paid by subsidiaries to non-controlling interest, divided by the number of common shares outstanding at the end of the year and multiplied by the share price at the end of the year. | Management’s Discussion and Analysis
The tables below show selected consolidated financial data for each year from 2000 to 2004. We discuss the factors that have caused our results to vary over the past two years throughout this MD&A. | |||||||||||
| 2004 | 2003 | 2002 | 2001 | 2000 | ||||||||
Operations | ||||||||||||
Operating revenues | 19,193 | 18,737 | 18,900 | 18,473 | 16,202 | |||||||
Operating expenses | (11,629 | ) | (11,327 | ) | (11,516 | ) | (11,603 | ) | (9,725 | ) | ||
EBITDA | 7,564 | 7,410 | 7,384 | 6,870 | 6,477 | |||||||
Amortization expense | (3,108 | ) | (3,100 | ) | (3,024 | ) | (3,313 | ) | (2,981 | ) | ||
Net benefit plans (cost) credit | (256 | ) | (175 | ) | 33 | 121 | 109 | |||||
Restructuring and other items | (1,224 | ) | (14 | ) | (768 | ) | (977 | ) | – | |||
Operating income | 2,976 | 4,121 | 3,625 | 2,701 | 3,605 | |||||||
Other income | 411 | 175 | 2,408 | 4,063 | 82 | |||||||
Impairment charge | – | – | (765 | ) | – | – | ||||||
Interest expense | (1,005 | ) | (1,105 | ) | (1,120 | ) | (968 | ) | (887 | ) | ||
Pre-tax earnings from continuing operations | 2,382 | 3,191 | 4,148 | 5,796 | 2,800 | |||||||
Income taxes | (710 | ) | (1,119 | ) | (1,614 | ) | (1,674 | ) | (1,284 | ) | ||
Non-controlling interest | (174 | ) | (201 | ) | (663 | ) | (360 | ) | (403 | ) | ||
Earnings from continuing operations | 1,498 | 1,871 | 1,871 | 3,762 | 1,113 | |||||||
Discontinued operations | 26 | (56 | ) | 536 | (3,326 | ) | 3,592 | |||||
Net earnings before extraordinary gain | 1,524 | 1,815 | 2,407 | 436 | 4,705 | |||||||
Extraordinary gain | 69 | – | – | – | – | |||||||
Net earnings | 1,593 | 1,815 | 2,407 | 436 | 4,705 | |||||||
Dividends on preferred shares | (70 | ) | (64 | ) | (59 | ) | (64 | ) | (79 | ) | ||
Premium on redemption of preferred shares | – | (7 | ) | (6 | ) | – | – | |||||
Net earnings applicable to common shares | 1,523 | 1,744 | 2,342 | 372 | 4,626 | |||||||
Included in net earnings: | ||||||||||||
Net gains on investments | ||||||||||||
Continuing operations | 389 | 84 | 1,341 | 3,184 | (3 | ) | ||||||
Discontinued operations | 34 | (86 | ) | 607 | (1,943 | ) | 4,807 | |||||
Restructuring and other items | (772 | ) | (3 | ) | (441 | ) | (462 | ) | – | |||
Impairment charge | – | – | (527 | ) | – | – | ||||||
Goodwill amortization | – | – | – | (971 | ) | (485 | ) | |||||
Other | – | – | – | (44 | ) | – | ||||||
Net earnings per common share: | ||||||||||||
Continuing operations – basic | 1.55 | 1.96 | 2.11 | 4.58 | 1.54 | |||||||
Continuing operations – diluted | 1.55 | 1.95 | 2.09 | 4.52 | 1.50 | |||||||
Net earnings – basic | 1.65 | 1.90 | 2.66 | 0.46 | 7.20 | |||||||
Net earnings – diluted | 1.65 | 1.89 | 2.62 | 0.46 | 6.81 | |||||||
Ratios | ||||||||||||
EBITDA margin (%) | 39.4 | % | 39.5 | % | 39.1 | % | 37.2 | % | 40.0 | % | ||
EBITDA to interest ratio (times) | 7.53 | 6.71 | 6.59 | 7.10 | 7.30 | |||||||
Operating margin (%) | 15.5 | % | 22.0 | % | 19.2 | % | 14.6 | % | 22.3 | % | ||
ROE (%) | 12.5 | % | 15.1 | % | 17.8 | % | 2.4 | % | 29.0 | % | ||
44 Bell Canada Enterprises 2004 Annual Report
Market capitalization is BCE Inc.’s share price at the end of the year multiplied by the number of common shares outstanding. Book value per share is common shareholders’ equity divided by number of common shares outstanding. Common dividend yield is dividends paid on common shares divided by BCE Inc.’s share price at the end of the year multiplied by the number of common shares outstanding. Common dividend payout ratio is dividends paid on common shares divided by net earnings applicable to common shares. Price to earnings ratio is BCE Inc.’s share price at the end of the year divided by earnings per share. Price to book ratio is BCE Inc.’s share price divided by the book value per share. Price to cash flow ratio is BCE Inc.’s share price at the end of the year divided by cash flow per share. | 2004 | 2003 | 2002 | 2001 | 2000 | |||||||
Balance Sheet | ||||||||||||
Total assets | 39,143 | 39,420 | 39,142 | 53,687 | 50,909 | |||||||
Long-term debt (including current portion) | 12,930 | 13,872 | 14,684 | 11,812 | 10,370 | |||||||
Net debt | 12,705 | 13,315 | 15,158 | 12,872 | 14,014 | |||||||
Total capitalization | 29,651 | 30,291 | 31,350 | 35,053 | 34,759 | |||||||
Preferred shares | 1,670 | 1,670 | 1,510 | 1,300 | 1,300 | |||||||
Common shareholders’ equity | 12,362 | 11,903 | 11,098 | 15,274 | 15,832 | |||||||
Ratios | ||||||||||||
Net debt to total capitalization (%) | 42.8 | % | 44.0 | % | 48.4 | % | 36.7 | % | 40.3 | % | ||
Net debt to EBITDA (times) | 1.68 | 1.80 | 2.05 | 1.87 | 2.16 | |||||||
Total debt to total assets (times) | 0.33 | 0.35 | 0.39 | 0.24 | 0.27 | |||||||
Long-term debt to equity (times) | 0.92 | 1.02 | 1.16 | 0.71 | 0.61 | |||||||
Cash Flows | ||||||||||||
Cash flows from operating activities | 5,519 | 5,968 | 4,424 | 4,116 | 2,177 | |||||||
Cash flows from investing activities | (3,864 | ) | (3,002 | ) | (7,032 | ) | (731 | ) | (6,551 | ) | ||
Capital expenditures | (3,364 | ) | (3,167 | ) | (3,709 | ) | (4,894 | ) | (3,581 | ) | ||
Business acquisitions | (1,299 | ) | (115 | ) | (6,471 | ) | (327 | ) | (3,521 | ) | ||
Business dispositions | 20 | 55 | 3,190 | 248 | 654 | |||||||
Other investing activities | 124 | 62 | 12 | (83 | ) | (103 | ) | |||||
Cash flows from financing activities | (2,190 | ) | (2,905 | ) | 3,362 | (1,951 | ) | 3,112 | ||||
Net issuance (repayment) of equity instruments | 32 | 172 | 2,819 | (120 | ) | (348 | ) | |||||
Net issuance (repayment) of debt instruments | (740 | ) | (1,781 | ) | 2,005 | (1,520 | ) | 4,357 | ||||
Financing activities of subsidiaries with third parties | (50 | ) | 24 | 92 | 1,010 | 181 | ||||||
Cash dividends paid on common shares | (1,108 | ) | (1,029 | ) | (999 | ) | (969 | ) | (849 | ) | ||
Cash dividends paid on preferred shares | (85 | ) | (61 | ) | (43 | ) | (64 | ) | (79 | ) | ||
Cash dividends paid by subsidiaries to non-controlling interest | (188 | ) | (184 | ) | (468 | ) | (357 | ) | (240 | ) | ||
Cash provided by (used in) discontinued operations | 193 | 355 | (1,017 | ) | (1,125 | ) | (873 | ) | ||||
Ratios | ||||||||||||
Free cash flow | 898 | 1,589 | (783 | ) | (2,251 | ) | (2,675 | ) | ||||
Capital intensity (%) | 17.5 | % | 16.9 | % | 19.6 | % | 26.5 | % | 22.1 | % | ||
Cash flow per share (dollars) | 2.33 | 3.04 | 0.84 | (0.96 | ) | (2.10 | ) | |||||
Cash flow yield (%) | 7.5 | % | 9.8 | % | 0.8 | % | (4.4 | %) | (5.2 | %) | ||
Share Information | ||||||||||||
Average number of common shares (millions) | 924.6 | 920.3 | 847.9 | 807.9 | 670.0 | |||||||
Common shares outstanding at end of year (millions) | 925.9 | 924.0 | 915.9 | 808.5 | 809.9 | |||||||
Market capitalization | 26,777 | 26,704 | 26,103 | 29,114 | 35,069 | |||||||
Dividends declared per common share (dollars) | 1.20 | 1.20 | 1.20 | 1.20 | 1.24 | |||||||
Book value per share (dollars) | 13.35 | 12.88 | 12.12 | 18.89 | 19.55 | |||||||
Total dividends declared on common shares | (1,110 | ) | (1,105 | ) | (1,031 | ) | (969 | ) | (849 | ) | ||
Total dividends declared on preferred shares | (70 | ) | (64 | ) | (59 | ) | (64 | ) | (79 | ) | ||
Market price per common share (dollars) | ||||||||||||
High | 30.00 | 32.35 | 36.87 | 43.50 | 199.75 | |||||||
Low | 25.75 | 26.60 | 23.00 | 32.75 | 31.75 | |||||||
Close | 28.92 | 28.90 | 28.50 | 36.01 | 43.30 | |||||||
Ratios | ||||||||||||
Common dividend yield (%) | 4.1 | % | 3.9 | % | 3.8 | % | 3.3 | % | 2.4 | % | ||
Common dividend payout ratio (%) | 72.8 | % | 59.0 | % | 42.7 | % | 260.5 | % | 18.4 | % | ||
Price to earnings ratio (times) | 17.53 | 15.21 | 10.71 | 78.28 | 6.01 | |||||||
Price to book ratio (times) | 2.17 | 2.24 | 2.35 | 1.91 | 2.22 | |||||||
Price to cash flow ratio (times) | 12.41 | 9.51 | 33.93 | (37.51 | ) | (20.62 | ) | |||||
Other Data | ||||||||||||
Number of employees (thousands) – unaudited | 62 | 64 | 64 | 73 | 73 | |||||||
45 Bell Canada Enterprises 2004 Annual Report
Digital equivalent access lines are derived by converting low capacity data lines (DS-3 and lower) to the equivalent number of voice-grade access lines. ARPU (average revenue per unit) and ARPS (average revenue per subscriber) represent a measurement of the average revenue generated by each unit or subscriber, expressed as a rate per month for the year. Churn is the rate at which existing subscribers cancel their services. Churn is calculated as the number of subscribers disconnected divided by the average subscriber base. Costs of acquisition (COA) are also referred to as subscriber acquisition costs. This measure is expressed per gross activation. It includes costs associated with acquiring a customer such as hardware subsidies, marketing and distribution costs.
| Management’s Discussion and Analysis
Annual Operational Information The table below shows selected data on our operations from 2002 to 2004.
| |||||||
| 2004 | 2003 | 2002 | ||||||
Wireline | ||||||||
Local network access services (thousands) | 12,905 | 13,051 | 13,154 | |||||
Long distance conversation minutes (millions) | 18,070 | 19,132 | 19,034 | |||||
Long distance average revenue per minute (cents) | 11.7 | 12.4 | 12.6 | |||||
Data | ||||||||
Digital equivalent access lines (thousands) | 4,335 | 3,867 | 3,683 | |||||
High-speed Internet net activations (thousands) | 350 | 358 | 343 | |||||
High-speed Internet subscribers (thousands) | 1,808 | 1,458 | 1,100 | |||||
Dial-up Internet subscribers (thousands) | 743 | 869 | 957 | |||||
Wireless | ||||||||
Cellular and PCS net activations (thousands) | 513 | 514 | 452 | |||||
Cellular and PCS subscribers (thousands) | 4,925 | 4,412 | 3,898 | |||||
Average revenue per unit ($/month) | 49 | 48 | 47 | |||||
Churn (%) (average per month) | 1.3 | % | 1.4 | % | 1.7 | % | ||
Cost of acquisition ($/subscriber) | 411 | 426 | 429 | |||||
Paging subscribers (thousands) | 427 | 524 | 639 | |||||
Video | ||||||||
Video net activations (thousands) | 116 | 83 | 235 | |||||
Video subscribers (thousands) | 1,503 | 1,387 | 1,304 | |||||
Average revenue per subscriber ($/month) | 49 | 46 | 44 | |||||
Churn (%) (average per month) | 1.0 | % | 1.1 | % | 1.0 | % | ||
Cost of acquisition ($/subscriber) | 571 | 532 | 520 | |||||
46 Bell Canada Enterprises 2004 Annual Report
Quarterly Financial Information The table below shows selected consolidated financial data by quarter for 2004 and 2003. This quarterly information is unaudited but has been prepared on the same basis as the annual consolidated financial statements. The factors that have caused our results to vary over the past eight quarters are discussed throughout this MD&A. | ||||||||||||||||||||||
| 2004 | 2003 | |||||||||||||||||||||
| YEAR | Q4 | Q3 | Q2 | Q1 | YEAR | Q4 | Q3 | Q2 | Q1 | |||||||||||||
Operating revenues | 19,193 | 4,989 | 4,781 | 4,782 | 4,641 | 18,737 | 4,818 | 4,627 | 4,673 | 4,619 | ||||||||||||
EBITDA | 7,564 | 1,831 | 1,936 | 1,953 | 1,844 | 7,410 | 1,847 | 1,895 | 1,895 | 1,773 | ||||||||||||
Amortization expense | (3,108 | ) | (803 | ) | (769 | ) | (769 | ) | (767 | ) | (3,100 | ) | (775 | ) | (801 | ) | (774 | ) | (750 | ) | ||
Net benefit plans cost | (256 | ) | (67 | ) | (61 | ) | (65 | ) | (63 | ) | (175 | ) | (46 | ) | (44 | ) | (43 | ) | (42 | ) | ||
Restructuring and other items | (1,224 | ) | (126 | ) | (1,081 | ) | (14 | ) | (3 | ) | (14 | ) | (13 | ) | (1 | ) | – | – | ||||
Operating income | 2,976 | 835 | 25 | 1,105 | 1,011 | 4,121 | 1,013 | 1,049 | 1,078 | 981 | ||||||||||||
Earnings from continuing operations | 1,498 | 367 | 102 | 544 | 485 | 1,871 | 486 | 453 | 466 | 466 | ||||||||||||
Discontinued operations | 26 | (2 | ) | (2 | ) | 27 | 3 | (56 | ) | (86 | ) | 11 | 12 | 7 | ||||||||
Extraordinary gain | 69 | 69 | – | – | – | – | – | – | – | – | ||||||||||||
Net earnings | 1,593 | 434 | 100 | 571 | 488 | 1,815 | 400 | 464 | 478 | 473 | ||||||||||||
Net earnings applicable to common shares | 1,523 | 417 | 82 | 554 | 470 | 1,744 | 386 | 446 | 461 | 451 | ||||||||||||
| Included in net earnings: | ||||||||||||||||||||||
Net gains on investments | ||||||||||||||||||||||
Continuing operations | 389 | 64 | 325 | – | – | 84 | 84 | – | – | – | ||||||||||||
Discontinued operations | 34 | (2 | ) | (2 | ) | 31 | 7 | (86 | ) | (94 | ) | 8 | – | – | ||||||||
Restructuring and other items | (772 | ) | (62 | ) | (725 | ) | 16 | (1 | ) | (3 | ) | (9 | ) | 6 | – | – | ||||||
Net earnings per common share | ||||||||||||||||||||||
Continuing operations – basic | 1.55 | 0.38 | 0.09 | 0.57 | 0.51 | 1.96 | 0.50 | 0.48 | 0.49 | 0.49 | ||||||||||||
Continuing operations – diluted | 1.55 | 0.38 | 0.09 | 0.57 | 0.51 | 1.95 | 0.50 | 0.47 | 0.49 | 0.49 | ||||||||||||
Net earnings – basic | 1.65 | 0.45 | 0.09 | 0.60 | 0.51 | 1.90 | 0.41 | 0.49 | 0.50 | 0.50 | ||||||||||||
Net earnings – diluted | 1.65 | 0.45 | 0.09 | 0.60 | 0.51 | 1.89 | 0.41 | 0.48 | 0.50 | 0.50 | ||||||||||||
Average number of common shares outstanding (millions) | 924.6 | 925.3 | 924.6 | 924.3 | 924.1 | 920.3 | 923.4 | 921.5 | 919.3 | 917.1 | ||||||||||||
47 Bell Canada Enterprises 2004 Annual Report
This section provides detailed information and analysis about our performance over the past two years. It focuses on our consolidated operating results and provides financial information for each of our operating segments.
| Management’s Discussion and Analysis
Financial Results Analysis Consolidated Analysis | |||||||
| 2004 | 2003 | % CHANGE | ||||||
| Operating revenues | 19,193 | 18,737 | 2.4 | % | ||||
| Operating expenses | (11,629) | (11,327) | (2.7 | %) | ||||
| EBITDA | 7,564 | 7,410 | 2.1 | % | ||||
| Amortization expense | (3,108 | ) | (3,100 | ) | (0.3 | %) | ||
| Net benefit plans cost | (256 | ) | (175 | ) | (46.3 | %) | ||
| Restructuring and other items | (1,224 | ) | (14 | ) | N/M | |||
| Operating income | 2,976 | 4,121 | (27.8 | %) | ||||
| Other income | 411 | 175 | 134.9 | % | ||||
| Interest expense | (1,005 | ) | (1,105 | ) | 9.0 | % | ||
Pre-tax earnings from continuing operations | 2,382 | 3,191 | (25.4 | %) | ||||
| Income taxes | (710 | ) | (1,119 | ) | 36.6 | % | ||
| Non-controlling interest | (174 | ) | (201 | ) | 13.4 | % | ||
Earnings from continuing operations | 1,498 | 1,871 | (19.9 | %) | ||||
| Discontinued operations | 26 | (56 | ) | 146.4 | % | |||
Net earnings before extraordinary gain | 1,524 | 1,815 | (16.0 | %) | ||||
| Extraordinary gain | 69 | – | N/M | |||||
| Net earnings | 1,593 | 1,815 | (12.2 | %) | ||||
| Dividends on preferred shares | (70 | ) | (64 | ) | (9.4 | %) | ||
| Premium on redemption of preferred shares | – | (7 | ) | N/M | ||||
Net earnings applicable to common shares | 1,523 | 1,744 | (12.7 | %) | ||||
| EPS | 1.65 | 1.90 | (13.2 | %) | ||||
| N/M: Not meaningful | ||||||||
Operating revenues grew 2.4% or $456 million to $19,193 million in 2004, compared to 2003, a rate of growth which exceeded our 2003 performance. Operating Income Operating income declined 28% or $1,145 million to $2,976 million in 2004, compared to 2003. This was mainly because of an increase in restructuring and other items and a higher net benefit plans cost. Excluding the impact of the restructuring and other items, operating income increased 1.6% or $65 million to $4,200 million in 2004. This increase stemmed from operating income growth in our Consumer and Business segments, as well as improvements in Bell Globemedia and Telesat in the Other BCE segment, driven by the underlying growth in these sectors. EBITDA Our EBITDA grew 2.1% or $154 million to $7,564 million in 2004, compared to 2003. This represented a growth rate of 3.0%, excluding the estimated negative impact of $71 million from the Aliant labour disruption, from improvements at Bell Canada and the Other BCE segment. |
48 Bell Canada Enterprises 2004 Annual Report
Amortization Expense The amount of our amortization expense in any year is affected by: Each year, we review our estimate of the useful life of our capital assets. Net Benefit Plans Cost The amount of the net benefit plans cost in a year mainly depends on: Restructuring and Other Items This category includes various income and expenses that are not directly related to the operating revenues generated during the year. Examples are costs related to streamlining initiatives, asset write-downs and other types of income or charges. | EBITDA growth at Bell Canada was driven by continued improvement in wireless, Internet access and video services. EBITDA erosion in our legacy services was offset by a continued focus on productivity as well as EBITDA contributions from IP-based connectivity service, and VAS and VCIO revenue gains in our Business segment. Amortization Expense Amortization expense increased 0.3% or $8 million to $3,108 million in 2004, compared to 2003. This was a result of an increase in our capital asset base from capital spending that continues to be higher than asset retirements. This was partly offset by an increase from three to four years in the useful life of Bell Canada’s internal use software. Net Benefit Plans Cost The net benefit plans cost increased by 46% or $81 million to $256 million in 2004, compared to 2003. The increase resulted mainly from a higher accrued benefit obligation based on our most recent actuarial valuation. This was partly offset by the positive fund performance in 2003, which resulted in an actuarial gain and increased the fair value of plan assets. Restructuring and Other Items We recorded $1,224 million in restructuring and other items in 2004, consisting of:
|
49 Bell Canada Enterprises 2004 Annual Report
| Management’s Discussion and Analysis
These charges were partly offset by income of $75 million recorded in the second quarter relating to an agreement reached between BCE Inc. and MTS to settle lawsuits. The terms of the settlement included:
We recorded $14 million in restructuring and other items in 2003, which included a charge of $15 million relating to a restructuring at Aliant’s subsidiary, Xwave Solutions Inc. (xwave). Net Earnings/Earnings per Share (EPS) EPS of $1.65 in 2004 was negatively impacted by net losses resulting from the after-tax restructuring and other items of $0.83 per share relating mainly to the employee departure programs at Bell Canada and Aliant. These were partly offset by:
Similar items in 2003 had no net impact on the reported EPS of $1.90 . Segmented Analysis 
|
50 Bell Canada Enterprises 2004 Annual Report
| 2004 | 2003 | % CHANGE | ||||||
Operating revenues | ||||||||
Consumer | 7,502 | 7,203 | 4.2 | % | ||||
Business | 5,851 | 5,827 | 0.4 | % | ||||
Aliant | 2,033 | 2,059 | (1.3 | %) | ||||
Other Bell Canada | 1,939 | 2,015 | (3.8 | %) | ||||
Inter-segment eliminations | (538 | ) | (490 | ) | (9.8 | %) | ||
Bell Canada | 16,787 | 16,614 | 1.0 | % | ||||
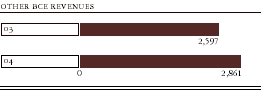
Other BCE | 2,861 | 2,597 | 10.2 | % | ||||
Inter-segment eliminations | (455 | ) | (474 | ) | 4.0 | % | ||
Total operating revenues | 19,193 | 18,737 | 2.4 | % | ||||
Operating income | ||||||||
Consumer | 2,119 | 2,019 | 5.0 | % | ||||
Business | 896 | 781 | 14.7 | % | ||||
Aliant | 268 | 415 | (35.4 | %) | ||||
Other Bell Canada | (588 | ) | 621 | (194.7 | %) | |||
Bell Canada | 2,695 | 3,836 | (29.7 | %) | ||||
Other BCE | 281 | 285 | (1.4 | %) | ||||
Total operating income | 2,976 | 4,121 | (27.8 | %) | ||||
Consumer segment revenues grew 4.2% or $299 million to $7,502 million in 2004, compared to 2003. The increase was the result of continued strength in our wireless, Internet access and video businesses from strong gains in the number of subscribers to these services. This was partly offset by steady rates of decline in local and access and long distance revenues. Wireless Consumer wireless revenues grew 15.2% in 2004, compared to 2003. The increase was achieved through strong subscriber growth, particularly as a result of the sales programs initiated during the first four months of the year. Although revenue performance was solid, we believe that our call centre’s focus on handling billing inquiries following the implementation of our new billing platform somewhat diminished our ability to sell more services to our customers and delayed the implementation of planned price increases. Video Video revenues grew 12.0% in 2004, compared to 2003. This was driven by the growth in our subscriber base and average revenue per unit (ARPU). Our total video customer base reached 1,503,000 at December 31, 2004, an increase of 8.4% compared to last year. Data Consumer data revenues grew 21% in 2004, compared to 2003. This was driven by growth of 22% in our high-speed Internet subscriber base and a 49% increase in revenues from our Sympatico-MSN.ca web portal. |
51 Bell Canada Enterprises 2004 Annual Report
Management’s Discussion and Analysis
subscriptions in the fourth quarter of 2004 increased 118% over the previous quarter. Wireline Local and access revenues declined slightly in 2004, compared to 2003, mainly due to lower NAS and related SmartTouch feature revenues, partly offset by higher revenues from wireline insurance and maintenance plans.  Consumer operating income increased 5.0% or $100 million to $2,119 million in 2004, compared to 2003. The improvement related mainly to the increase in revenues, lower COA in wireless, and productivity savings. These were partly offset by increased operating expenses related to salaries, cost of goods sold and higher net benefit plans cost. Business 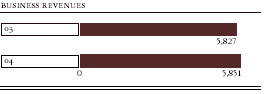 Business segment revenues grew slightly by $24 million to $5,851 million in 2004, compared to 2003.  Business segment operating income grew 14.7% or $115 million to $896 million in 2004, compared to 2003. This demonstrates that our strategy of driving the shift to IP along with improved profitability achieved through ongoing productivity has traction and is delivering. |
52 Bell Canada Enterprises 2004 Annual Report
Enterprise Enterprise revenues declined in 2004, compared to 2003, as a result of lower local and access, long distance and data revenues. These declines were partly offset by increases in wireless and terminal sales and other revenues. SMB SMB revenues increased in 2004, compared to 2003, as a result of higher data, wireless and terminal sales and other revenues. These gains were partly offset by revenue declines in local and access and long distance revenues. Bell West Bell West continued to grow its customer base leading to increases in local and access and long distance revenues in 2004, compared to 2003. In 2001, we were awarded a contract by the Government of Alberta to build a next-generation network (SuperNet) to bring high-speed Internet and broadband capabilities to rural communities in Alberta. Mechanical construction of the network was completed in December 2004. The decline in data revenues in 2004 reflects a decrease of approximately $43 million as this contract was nearing completion. Aliant  Aliant segment revenues declined 1.3% or $26 million to $2,033 million in 2004, compared to 2003. The labour disruption that started on April 23, 2004 and ended on September 20, 2004 negatively impacted revenues by an estimated $40 million. This represents fewer new customers, reduced product sales, additional |
53 Bell Canada Enterprises 2004 Annual Report
Management’s Discussion and Analysis
promotional activities and reduced levels of fieldwork activity during the labour disruption. Strong growth in wireless and Internet services was more than offset by declines in other areas due to the labour disruption, the ongoing impact of competition, and the regulatory restrictions, including those on bundling, customer win-back activities, and rates charged for price-regulated services.
Intense long distance competition, the difficulty in maintaining win-back efforts during the labour disruption and substitution of long distance calling with Internet and wireless options by customers resulted in long distance revenue declines in 2004, compared to last year. Consumer minute volumes were down due to customer losses to competition and the capping of minutes on certain long distance plans in late 2003. Business long distance pricing declines continued to reflect the impact of competitive pressures, as did long distance volume declines, in addition to a reduction of contact centre activity.  Aliant’s operating income declined 35% or $147 million to $268 million in 2004, compared to 2003. This was largely due to:
The remaining decrease of $12 million is a result of higher operating expenses from:
These increases were partly offset by lower operating costs stemming from the xwave restructuring in 2003 and the sale of non-core operations in the second and third quarters. |
54 Bell Canada Enterprises 2004 Annual Report
driven by revenue growth and productivity improvements, as well as the absence of the restructuring charge and costs associated with the labour disruption. These positive impacts are expected to be partially offset by increased costs associated with Aliant’s growth services and higher net benefit plans cost. Other Bell Canada 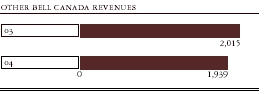 The Other Bell Canada segment revenues declined 3.8% or $76 million to $1,939 million in 2004, compared to 2003. This was due to:
 The Other Bell Canada segment had an operating loss of $588 million in 2004, a $1,209 million decrease when compared to operating income of $621 million in 2003. Other BCE |
| 2004 | 2003 | % CHANGE | ||||||
| Operating revenues | ||||||||
| Bell Globemedia | 1,420 | 1,363 | 4.2 | % | ||||
| Telesat | 362 | 345 | 4.9 | % | ||||
| CGI | 1,019 | 838 | 21.6 | % | ||||
| Other | 60 | 51 | 17.6 | % | ||||
| Total operating revenues | 2,861 | 2,597 | 10.2 | % | ||||
| Operating income | ||||||||
| Bell Globemedia | 240 | 167 | 43.7 | % | ||||
| Telesat | 141 | 124 | 13.7 | % | ||||
| CGI | 94 | 91 | 3.3 | % | ||||
| Other | (194 | ) | (97 | ) | (100.0 | %) | ||
| Total operating income | 281 | 285 | (1.4 | %) | ||||
The Other BCE segment revenues grew 10.2% or $264 million to $2,861 million in 2004, compared to 2003. This growth was driven by revenue growth at Bell Globemedia, Telesat and CGI.  The Other BCE segment operating income declined 1.4% or $4 million to $281 million in 2004, compared to 2003. This decline was due to higher corporate expenses, which more than offset higher operating income at Bell Globemedia, Telesat and CGI. The increase in corporate expenses is a result of higher net benefit plans cost and an increased level of corporate activities. Bell Globemedia Bell Globemedia’s revenues grew 4.2% or $57 million to $1,420 million in 2004, compared to 2003. This was the result of:
| ||||||||
55 Bell Canada Enterprises 2004 Annual Report
Management’s Discussion and Analysis
This increase was partly offset by a decline in production and other revenues of 13.8% or $13 million in 2004 as a result of the sale of a 50% interest in Dome Productions Inc. in January 2004. Telesat Telesat’s revenues grew 4.9% or $17 million to $362 million in 2004, compared to 2003. This increase was the result of higher telecommunications revenues, which more than offset lower consulting fees. CGI Our share of CGI’s revenues grew 22% or $181 million to $1,019 million in 2004, compared to 2003. Our share of CGI’s operating income grew 3.3% or $3 million to $94 million in 2004, compared to 2003. In each case, the increase was driven mainly by CGI’s acquisition of AMS in May 2004. Product Line Analysis In addition to discussing our financial results by business segment, we believe that a separate discussion of Bell Canada’s consolidated revenues by product line provides further insight into management’s view of our financial results. The table to the right shows Bell Canada’s consolidated revenues by product line.  |
| 2004 | 2003 | % CHANGE | ||||||
| Local and access | 5,572 | 5,601 | (0.5 | %) | ||||
| Long distance | 2,327 | 2,544 | (8.5 | %) | ||||
| Wireless | 2,818 | 2,461 | 14.5 | % | ||||
| Data | 3,640 | 3,717 | (2.1 | %) | ||||
| Video | 850 | 759 | 12.0 | % | ||||
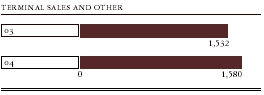
| Terminal sales and other | 1,580 | 1,532 | 3.1 | % | ||||
| 16,787 | 16,614 | 1.0 | % | |||||
Local and Access
Local and access revenues declined 0.5% or $29 million to $5,572 million in 2004, compared to 2003. | ||||||||
56 Bell Canada Enterprises 2004 Annual Report
This decline was a result of:
The decline was partly offset by gains from wireline insurance and maintenance plans.
In 2005, we expect continued erosion of our NAS in service due to these trends, as well as the launches of VoIP telephony by cable providers. Long Distance Long distance revenues declined 8.5% or $217 million to $2,327 million in 2004, compared to 2003. This decline stemmed from:
Overall, the volume of conversation minutes declined 5.6% in 2004. This was accompanied by a 5.6%, or $0.007 , decrease in average revenue per minute (ARPM) to $0.117 . Wireless 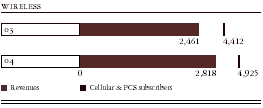 In 2004, our wireless business continued to demonstrate strong growth.
During the year, we accomplished a key operational initiative: to migrate our postpaid wireless customers to a new billing platform. The new platform will enable the consolidation of wireless into a single bill, which will provide simplified information to our customers, lower costs to Bell Canada, and enhance our ability to bundle our products and services. |
57 Bell Canada Enterprises 2004 Annual Report
Other Income Other income includes income that we receive from activities that are not part of our business operations, such as: | Management’s Discussion and Analysis
representatives, the high volume of calls meant customers experienced slower response times during the second half of the year. Data  Data revenues decreased 2.1% or $77 million to $3,640 million in 2004, compared to 2003, in spite of the growth in high-speed Internet services and revenues related to business acquisitions. This was because of:
The number of high-speed Internet subscribers increased by 350,000 in 2004, resulting in 1,808,000 subscribers at December 31, 2004. The subscriber growth achieved this year was similar to that of last year, even as competition increased. At the end of 2004, we had a total of 743,000 dial-up customers compared to 869,000 last year. Video  See Segmented Analysis – Consumer for a discussion of revenues from our video services. Terminal Sales and Other
Terminal sales and other revenues increased 3.1% or $48 million to $1,580 million in 2004, compared to 2003. This increase reflected:
Other Items Other Income Other income increased 135% or $236 million to $411 million in 2004, compared to 2003. The increase was a result of higher net gains on investments and other miscellaneous income. These were partly offset by lower foreign currency gains and lower interest income.
|
58 Bell Canada Enterprises 2004 Annual Report
Non-Controlling Interest The non-controlling interest in the statements of operations reflects the percentage of a subsidiary that we do not own multiplied by the amount of the subsidiary’s after-tax earnings. |
Capital loss carryforwards fully sheltered the taxes on these gains.
In April 2003, we entered into forward contracts to hedge US$200 million of long-term debt at Bell Canada that previously had not been hedged. This removed the foreign currency risk on the principal amount of that debt. Interest Expense Interest expense declined 9% or $100 million to $1,005 million in 2004, compared to 2003. This was a result of a lower average debt level of approximately $1,370 million in 2004, mainly from the positive free cash flows achieved in the last two years. The average interest rate on our debt in 2004 and 2003 was 7.1% . Income Taxes Income taxes declined 37% or $409 million to $710 million in 2004, compared to 2003. The decline was mainly due to:
As a result of these items, the effective tax rate was 29.8% in 2004, compared to 35.1% in 2003. Non-Controlling InterestNon-controlling interest decreased 13.4% or $27 million to $174 million in 2004, compared to 2003. The decrease was a result of:
The decrease was partly offset by higher net earnings at Bell Globemedia. Discontinued Operations The net gain from discontinued operations of $26 million in 2004 consisted of:
The net loss from discontinued operations of $56 million in 2003 consisted of a loss of $160 million relating to Emergis’ sale of its US Health operations in the fourth quarter.
Extraordinary Gain We purchased the Canadian operations of 360networks in the fourth quarter of 2004 for $293 million in cash. The fair value of the net assets acquired exceeded the purchase price by approximately $227 million. For accounting purposes, the excess was eliminated by:
|
59 Bell Canada Enterprises 2004 Annual Report
Capital Structure | Management’s Discussion and Analysis
Capital Structure
| |||||
AT DECEMBER 31 | 2004 | 2003 | ||||
Debt due within one year | 1,276 | 1,519 | ||||
Long-term debt | 11,809 | 12,381 | ||||
Less: cash and cash equivalents | (380 | ) | (585 | ) | ||
Total net debt | 12,705 | 13,315 | ||||
Non-controlling interest | 2,914 | 3,403 | ||||
Total shareholders’ equity | 14,032 | 13,573 | ||||
Total capitalization | 29,651 | 30,291 | ||||
Net debt to capitalization | 42.8 | % | 44.0 | % | ||
| ||||||
Outstanding share data (in millions) | ||||||
Common shares | 925.9 | 924.0 | ||||
Stock options | 28.5 | 25.8 | ||||
|
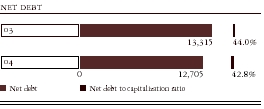 Our net debt to capitalization ratio was 42.8% at the end of 2004, an improvement from 44.0% at the end of 2003. This was a result of improvements in net debt and total shareholders’ equity, which was partly offset by lower non-controlling interest.
These were partly offset by the $1.3 billion invested in business acquisitions in 2004. Outstanding Share Data We had 925.9 million common shares outstanding at the end of 2004, an increase of 1.9 million over 2003. The increase was entirely from the exercise of stock options in 2004.
Starting in 2004, most of the stock options granted contain specific performance targets that must be met before the option can be exercised. Cash Flows We generated free cash flow for the year totalling $898 million or $1,092 million before restructuring and other items. Compared to 2003, free cash flow was down $691 million, mainly reflecting the $449 million decline in cash from operating activities and higher capital expenditures of $197 million.  | |||
60 Bell Canada Enterprises 2004 Annual Report
The table below is a summary of the flow of cash into and out of BCE in 2004 and 2003. | ||||||
| 2004 | 2003 | |||||
Cash from operating activities | 5,519 | 5,968 | ||||
Capital expenditures | (3,364 | ) | (3,167 | ) | ||
Other investing activities | 124 | 62 | ||||
Cash dividends paid on common shares | (1,108 | ) | (1,029 | ) | ||
Cash dividends paid on preferred shares | (85 | ) | (61 | ) | ||
Cash dividends paid by subsidiaries to non-controlling interest | (188 | ) | (184 | ) | ||
Free cash flow | 898 | 1,589 | ||||
Business acquisitions | (1,299 | ) | (115 | ) | ||
Business dispositions | 20 | 55 | ||||
Change in investments accounted for under the cost and equity methods | 655 | 163 | ||||
Net issuance of equity instruments | 32 | 172 | ||||
Net repayment of debt instruments | (740 | ) | (1,781 | ) | ||
Financing activities of subsidiaries with third parties | (50 | ) | 24 | |||
Cash provided by discontinued operations | 193 | 355 | ||||
Other financing activities | (51 | ) | (46 | ) | ||
Net increase (decrease) in cash and cash equivalents | (342 | ) | 416 | |||
|
Cash from operating activities decreased 7.5% or $449 million to $5,519 million in 2004, compared to 2003. This was mainly a result of less favourable changes in working capital that were mostly due to:
These were partly offset by:
Capital Expenditures We continue to make investments to expand and update our networks and to meet customer demand for new services. Capital expenditures were $3,364 million in 2004, or 17.5% of revenues. This was 6.2% or $197 million higher than capital expenditures of $3,167 million, or 16.9% of revenues, in 2003. The increase reflects a mix of:
Bell Canada’s capital expenditures accounted for 90% of our consolidated capital expenditures in 2004. Bell Canada’s consolidated capital intensity ratio increased to 18.0% in 2004, compared to 17.4% in 2003. Other Investing Activities Cash from other investing activities totalled $124 million in 2004. This included $179 million of insurance proceeds that Telesat received for a progressive power failure on the Anik F1 satellite.
Other items relate to changes in long-term notes receivable and payments by Bell Globemedia relating to CRTC benefits owing on previous business combinations. Cash Dividends Paid on Common Shares We paid a dividend of $1.20 per common share in 2004, which is the same as the dividend we paid in 2003. | |||
61 Bell Canada Enterprises 2004 Annual Report
Debt Instruments | Management’s Discussion and Analysis
Total dividends paid on common shares increased 7.7% or $79 million to $1,108 million in 2004, compared to 2003. Business Acquisitions We invested $1,299 million in business acquisitions in 2004. This consisted of:
We invested $115 million in business acquisitions in 2003. This consisted mainly of:
Business Dispositions We did not have any significant business dispositions in 2004. Change in Investments Accounted for under the Cost and Equity Methods In the third quarter of 2004, we sold our remaining 3.24% interest in YPG for net cash proceeds of $123 million and our 15.96% interest in MTS for net cash proceeds of $584 million. Equity Instruments We did not have any significant issues or redemptions of equity instruments in 2004. Debt Instruments We made $740 million in debt repayments (net of issues) in 2004:
Most of the issues were at Bell Canada, which issued $450 million in debentures, and Bell Globemedia, which issued $300 million of senior notes.
We also repaid $295 million of notes payable and bank advances. The issues were mainly at Bell Canada, which issued $600 million in debentures, and Bell Globemedia, which issued $300 million of senior notes. | |||
62 Bell Canada Enterprises 2004 Annual Report
Credit Ratings | Cash Relating to Discontinued Operations Cash from discontinued operations was $193 million in 2004. This consisted mainly of net cash proceeds of $315 million from the sale of our investment in Emergis, which were partly offset by the deconsolidation of Emergis’ cash on hand of $137 million at December 31, 2003. Credit Ratings The table below lists our key credit ratings at March 2, 2005. | |||||||||||||
| BCE INC. | BELL CANADA | |||||||||||||
| S&P(1) | DBRS(2) | MOODY’S(3) | S&P(1) | DBRS(2) | MOODY’S(3) | |||||||||
| Commercial paper | A-1 (mid) / | R-1 (low) / | P-2 | / | A-1 (mid) / | R-1 (mid) / | P-2 | / | ||||||
| stable | stable | stable | stable | stable | stable | |||||||||
| Extendable commercial notes | A-1 (mid) / | R-1 (low) / | A-1 (mid) / | R-1 (mid) / | ||||||||||
| stable | stable | – | stable | stable | – | |||||||||
| Long-term debt | Baa1 / | A (high) / | A3 | / | ||||||||||
| A– / stable | A / stable | stable | A / stable | stable | stable | |||||||||
| Preferred shares | P-2 (high) / | Pfd-2 / | P-2 (high) / | Pfd-2 (high) / | ||||||||||
| stable | stable | – | stable | stable | – | |||||||||
| (1) Standard & Poor’s, a division of The McGraw-Hill Companies, Inc. (S&P) (2) Dominion Bond Rating Services Limited (DBRS) (3) Moody’s Investors Service, Inc. (Moody’s) | ||||||||||||||
Our plan is to generate enough cash from our operating activities to pay for capital expenditures and dividends. In other words, we are targeting to have positive free cash flow in the short term and in the long term. Cash Requirements In 2005, we will need cash mainly for capital expenditures, dividend payments, the payment of contractual obligations and other cash requirements. Capital Expenditures We spent $3.4 billion on capital expenditures in 2004, representing 17.5% of our revenues for the year. Our target is for Bell Canada’s capital expenditures to be in the range of 18% to 19% of its total revenues in 2005. Dividends In December 2004, the board of directors of BCE Inc. approved an increase of 10% or $0.12 per common share in the annual dividend on BCE Inc.’s common shares. As a result, starting with the quarterly dividend to be paid on April 15, 2005, subject to being declared by the board of directors, we expect to pay quarterly dividends on BCE Inc.’s common shares of approximately $305 million, based on the revised dividend policy. This assumes that there are no significant changes to the number of outstanding common shares. These quarterly dividends equal $0.33 per common share, based on approximately 925 million common shares outstanding at December 31, 2004. Contractual Obligations The table on the next page is a summary of our contractual obligations at December 31, 2004 that are due in each of the next five years and after 2009. | ||||
63 Bell Canada Enterprises 2004 Annual Report
| Management’s Discussion and Analysis
| |||||||||||||||
| AFTER | |||||||||||||||
| 2005 | 2006 | 2007 | 2008 | 2009 | 2009 | TOTAL | |||||||||
Long-term debt (excluding capital leases) | 1,018 | 989 | 1,726 | 1,091 | 1,701 | 6,000 | 12,525 | ||||||||
Notes payable and bank advances | 155 | – | – | – | – | – | 155 | ||||||||
Capital leases | 103 | 70 | 59 | 47 | 31 | 95 | 405 | ||||||||
Operating leases | 399 | 296 | 258 | 232 | 209 | 1,459 | 2,853 | ||||||||
Commitments for capital expenditures | 210 | 121 | 45 | 2 | 2 | 28 | 408 | ||||||||
Other purchase obligations | 576 | 375 | 231 | 184 | 175 | 401 | 1,942 | ||||||||
Other long-term liabilities (including current portion) | 97 | 86 | 91 | 79 | 78 | – | 431 | ||||||||
Total | 2,558 | 1,937 | 2,410 | 1,635 | 2,196 | 7,983 | 18,719 | ||||||||
|
At December 31, 2004, we had other long-term liabilities that are not included in the table. They consisted of an accrued employee benefit liability, future income tax liabilities, deferred revenue and gains on assets and various other long-term liabilities.
We did not include deferred revenue and gains on assets because they do not represent future cash payments. Other Cash Requirements Our cash requirements may also be affected by the liquidity risks related to our contingencies, off-balance sheet arrangements and derivative instruments. We may not be able to quantify all of these risks. Off-Balance Sheet Arrangements Guarantees – As a regular part of our business, we enter into agreements that provide for indemnification and guarantees to counterparties in transactions involving business dispositions, sales of assets, sales of services, purchases and development of assets, securitization agreements and operating leases. | |||
64 Bell Canada Enterprises 2004 Annual Report
| Securitization of accounts receivable – Bell Canada and Aliant have agreements in place to provide us with a less expensive form of financing than debt financing. Derivative Instruments We use derivative instruments to manage our exposure to interest rate risk, foreign currency risk and changes in the price of BCE Inc. common shares. We do not use derivative instruments for speculative purposes. Since we do not trade actively in derivative instruments, we are not exposed to any significant liquidity risks relating to them. Litigation We become involved in various claims and litigation as a part of our business. While we cannot predict the final outcome of claims and litigation that were pending at December 31, 2004, based on information currently available, management believes that these claims and litigation will not have a material and negative effect on our consolidated financial position or results of operation. Commitment under the Deferral Account The deferral account is a mechanism resulting from the CRTC’s second price cap decision of May 2002, which requires us to fund initiatives such as service improvements, reduced customer rates and/or customer rebates. We estimate our commitment under the deferral account to be approximately $202 million at December 31, 2004. We expect to clear most of this amount in 2005 by implementing various initiatives. Provision for Contract Loss In 2001, we entered into a contract with the Government of Alberta to build a next-generation network to bring high-speed Internet and broadband capabilities to rural communities in Alberta. Mechanical construction of the network was completed in December 2004. We identified cost overruns on the construction contract and recorded an additional provision of $128 million in 2004. Acceptance of the network by the Government of Alberta was initially due by January 24, 2005. Based on discussions with the Government of Alberta, Bell Canada has agreed to have the network completed and accepted by the Government of Alberta by the end of September 2005. There is a risk that we could incur higher than currently anticipated costs in completing the acceptance of the network by the Government of Alberta. Sources of Liquidity While we do not expect a cash shortfall in the foreseeable future, we expect to cover any shortfall through the financing facilities we currently have in place. | |||
65 Bell Canada Enterprises 2004 Annual Report
Risks that Could Affect A risk is the possibility that an event might happen in the future that could have a negative effect on the financial condition, results of operations or business of one or more BCE group companies. Part of managing our business is to understand what these potential risks could be and to minimize them where we can. | Management’s Discussion and Analysis
The table below is a summary of our outstanding lines of credit, bank facilities and commercial paper programs at December 31, 2004. | ||||||
| NON- | |||||||
| COMMITTED | COMMITTED | TOTAL | |||||
Commercial paper credit lines | 1,290 | 2,000 | 3,290 | ||||
| Other credit facilities | 1,171 | 411 | 1,582 | ||||
| Total | 2,461 | 2,411 | 4,872 | ||||
| Drawn | 537 | – | 537 | ||||
| Undrawn | 1,924 | 2,411 | 4,335 | ||||
BCE Inc., Bell Canada and Aliant may issue notes under their commercial paper programs up to the amount of their supporting committed lines of credit. The total amount of these supporting committed lines of credit available (net of letters of credit) was $1.3 billion at December 31, 2004. BCE Inc., Bell Canada and Aliant had $135 million in commercial paper outstanding at December 31, 2004. BCE Inc. and Bell Canada can issue Class E notes under their commercial paper programs. These notes are not supported by committed lines of credit and may be extended in certain circumstances. BCE Inc. may issue up to $360 million of Class E notes and Bell Canada may issue up to $400 million. BCE Inc. and Bell Canada had no Class E notes outstanding at December 31, 2004. The drawn portion of our total credit facilities includes $414 million in letters of credit under our committed facilities. Risks that Could Affect Our Business Bell Canada is our most important subsidiary, which means our financial performance depends in large part on how well Bell Canada performs financially. The risks that could affect Bell Canada and its subsidiaries are more likely to have a significant impact on our financial condition, results of operations and business than the risks that could affect other BCE group companies. Risks that Could Affect All BCE Group Companies Strategies and Plans We plan to achieve our business objectives through various strategies and plans.
Our strategic direction involves significant changes in our processes, in how we approach our markets, and in how we develop and deliver products and services. This means we will need to be responsive in adapting to these changes. It also means that a shift in employee skills will be necessary. Economic and Market Conditions Our business is affected by general economic conditions, consumer confidence and spending, and the demand for, and prices of, our products and services. When there is a decline in economic growth and in retail and commercial activity, there tends to be a lower demand for our products and services. During these periods, customers may delay buying our products and services, or reduce or discontinue using them. | |||||||
66 Bell Canada Enterprises 2004 Annual Report
Competition
| Weak economic conditions may negatively affect our profitability and cash flows from operations. They could also negatively affect the financial condition and credit risk of our customers, which could increase uncertainty about our ability to collect receivables and potentially increase our bad debt expenses. Increasing Competition We face intense competition from traditional competitors, as well as from new entrants to the markets in which we operate. We compete not only with other telecommunications, media, television, satellite and information technology service providers, but also with other businesses and industries. These include cable, software and Internet companies, a variety of companies that offer network services, such as providers of business information systems, systems integrators and other companies that deal with, or have access to, customers through various communications networks. Wireline and Long Distance We experience significant competition in the provision of long distance service from dial-around providers, prepaid card providers, VoIP service providers and others, and from traditional competitors such as inter-exchange carriers and resellers. We also face increasing cross-platform competition as customers replace traditional services with new technologies. For example, our wireline business competes with VoIP, wireless and Internet services, including chat services, instant messaging and e-mail. We also expect to face competitive pressure from cable companies as they implement voice services over their networks and from other emerging competitors such as electrical utilities. These alternative technologies, products and services are now making significant inroads in our legacy services, which typically represent our higher margin business. | |||
67 Bell Canada Enterprises 2004 Annual Report
Anticipating
| Management’s Discussion and Analysis
Internet Access Cable companies and independent Internet service providers (ISPs) have increased competition in the broadband and Internet access services business. In particular, competition from cable companies has focused on increased bandwidth and discounted pricing on bundles. Competition has led to pricing for Internet access in Canada that is among the lowest in the world. Wireless The Canadian wireless telecommunications industry is also highly competitive. We compete directly with other wireless service providers that aggressively introduce, price and market their products and services, and with wireline service providers. We expect competition to intensify as new technologies, products and services are developed. Video Bell ExpressVu competes directly with another DTH satellite television provider and with cable companies across Canada. These cable companies have upgraded their networks, operational systems and services, which could improve their competitiveness. This could materially and negatively affect the financial performance of Bell ExpressVu. Improving Productivity and Containing Capital Intensity We continue to implement several productivity improvements while containing our capital intensity. There will be a material and negative effect on our profitability if we do not continue to successfully implement these productivity improvements, reduce costs and manage capital intensity while maintaining the quality of our service. For example, each year between 2002 and 2004, we were required to reduce the price of certain services offered by the Bell Canada companies that are subject to regulatory price caps, and may be required to do so again in 2005. In addition, we have reduced our prices in some business data services that are not regulated in order to remain competitive, and we may have to continue doing so in the future. The profits of the Bell Canada companies will decline if they cannot reduce their expenses at the same rate. There would also be a material and negative effect on our profitability if market factors or other regulatory actions result in lower revenues and we cannot reduce our expenses at the same rate. Anticipating Technological Change We may face additional financial risks as we develop new products, services and technologies, and update our networks to stay competitive. Newer technologies, for example, may quickly become obsolete or may need more capital than expected. Development could be delayed for reasons beyond our control. Substantial investments usually need to be made before new technologies prove to be commercially viable. There is also a significant risk that current regulation could be expanded to apply to newer technologies. A regulatory change could delay our launch of new services and restrict our ability to market these services if, for example, new pricing rules or marketing or bundling restrictions were introduced or existing ones extended. | |||
68 Bell Canada Enterprises 2004 Annual Report
Liquidity Litigation, Regulatory Matters and Changes in Laws Please see the BCE 2004 AIF for a detailed description of:
Please also see Risks that Could Affect Certain BCE Group Companies – Bell Canada Companies – Changes to Wireline Regulation in this MD&A for a description of certain regulatory initiatives and proceedings that could affect the Bell Canada companies.
| There is no assurance that we will be successful in developing, implementing and marketing new technologies, products, services or enhancements in a reasonable time, or that they will have a market. There is also no assurance that efficiencies will increase as expected. New products or services that use new or evolving technologies could make our existing ones unmarketable or cause their prices to fall. Liquidity In general, we finance our capital needs in four ways:
Financing through equity offerings would dilute the holdings of existing equity investors. An increased level of debt financing could lower our credit ratings, increase our borrowing costs and give us less flexibility to take advantage of business opportunities.
Any of these possibilities could have a material and negative effect on our cash flow from operations and growth prospects. Making Acquisitions Our growth strategy includes making strategic acquisitions and entering into joint ventures. There is no assurance that we will find suitable companies to acquire or to partner with, or that we will have the financial resources needed to complete any acquisition or to enter into any joint venture. There could also be difficulties in integrating the operations of acquired companies with our existing operations or in operating joint ventures. Litigation, Regulatory Matters and Changes in Laws Pending or future litigation, regulatory initiatives or regulatory proceedings could have a material and negative effect on our businesses, operating results and financial condition. Changes in laws or regulations or in how they are interpreted, and the adoption of new laws or regulations (including changes in, or the adoption of, new tax laws that result in higher tax rates or new taxes) could also materially and negatively affect us. | |||
69 Bell Canada Enterprises 2004 Annual Report
Funding and Control Renegotiating Labour Agreements
| Management’s Discussion and Analysis
Funding and Control of Subsidiaries If BCE Inc. or Bell Canada decides to stop funding any of its subsidiaries and that subsidiary does not have other sources of funding, this would have a material and negative effect on the subsidiary’s results of operations and financial condition and on the value of its securities. Pension Fund Contributions Most of our pension plans had pension fund surpluses as of our most recent actuarial valuation. As a result, we have not had to make regular contributions to the pension funds in the past few years. Renegotiating Labour Agreements The following important collective agreements have expired:
Negotiations continue regarding the renewal of both collective agreements.
| |||
70 Bell Canada Enterprises 2004 Annual Report
Holding Company Structure Stock Market Volatility
| Renegotiating collective agreements could result in higher labour costs and work disruptions, including work stoppages or work slowdowns. Difficulties in renegotiations or other labour unrest could significantly hurt our businesses, operating results and financial condition. Bell Canada has established a program to implement a number of measures to help minimize disruptions and seek to ensure that customers continue to receive normal service during labour disruptions. There can be no assurance that a strike, if one occurs, would not disrupt service to Bell Canada’s customers. In addition, work disruptions at our service providers, including work slowdowns and work stoppages due to strikes, could significantly hurt our business, including our customer relationships and results of operations. Events Affecting Our Networks Network failures could materially hurt our business, including our customer relationships and operating results. Our operations depend on how well we protect our networks, equipment, applications and the information stored in our data centres against damage from fire, natural disaster, power loss, hacking, computer viruses, disabling devices, acts of war or terrorism and other events. Our operations also depend on the timely replacement and maintenance of our networks and equipment. Any of these events could cause our operations to be shut down indefinitely. Software and System Upgrades Many aspects of the BCE group companies’ businesses including, but not limited to, the provision of telecommunication services and customer billing, depend to a large extent on various IT systems and software, which must be improved and upgraded on a regular basis and replaced from time to time. The implementation of system and software upgrades and conversions is a very complex process, which may have several adverse consequences including billing errors and delays in customer service. Any of these events could significantly hurt our customer relationships and businesses and have a material and adverse effect on our results of operations. Risks that Could Affect BCE Inc. Holding Company Structure BCE Inc.’s cash flow and its ability to service its debt and to pay dividends on its shares all depend on dividends or other distributions it receives from its subsidiaries, joint ventures and significantly influenced companies and, in particular, from Bell Canada. BCE Inc.’s subsidiaries, joint ventures and significantly influenced companies are separate legal entities. They are not required to pay dividends or make any other distributions to BCE Inc. Stock Market Volatility Differences between BCE Inc.’s actual or anticipated financial results and the published expectations of financial analysts may also contribute to volatility in BCE Inc.’s common shares. A major decline in the capital markets in general, or an adjustment in the market price or trading volumes of BCE Inc.’s common shares or other securities, may materially and negatively affect our ability to raise capital, issue debt, retain employees, make strategic acquisitions or enter into joint ventures. Risks that Could Affect Certain BCE Group Companies Bell Canada Companies Contract with the Government of Alberta In 2001, we entered into a contract with the Government of Alberta to build a next-generation network to bring high-speed Internet and broadband capabilities to rural communities in Alberta. Mechanical construction of the network was completed in December 2004. We identified cost overruns on the construction contract and recorded an additional provision of $128 million in 2004. Acceptance of the network by the Government of Alberta was initially due by January 24, 2005. Based on discussions with the | |||
71 Bell Canada Enterprises 2004 Annual Report
Decisions of Regulatory Agencies Competitor Digital Network Service
| Management’s Discussion and Analysis
Government of Alberta, Bell Canada has agreed to have the network completed and accepted by the Government of Alberta by the end of September 2005. There is a risk that we could incur higher than currently anticipated costs in completing the acceptance of the network by the Government of Alberta. Changes to Wireline Regulation Second Price Cap Decision In May 2002, the CRTC issued decisions relating to new price cap rules that will govern incumbent telephone companies for a four-year period starting in June 2002. These decisions:
The CRTC also established a deferral account and, on March 24, 2004, initiated a public proceeding inviting proposals on the disposition of the amounts accumulated in the accounts of the incumbent telephone companies during the first two years of the price cap period.
On January 28, 2005, Aliant filed its proposal for the disposition of any amounts in its deferral account. Its proposal included:
It is expected that this proceeding will close in the second half of 2005. Competitor Digital Network Service The CRTC’s decision concerning CDN services includes many changes that will affect both Bell Canada and Aliant as providers of CDN services in their respective operating territories and as buyers of those services elsewhere in Canada. The CRTC has determined that the scope of CDN services should be broadened from access elements only to also include intra-exchange facilities, inter-exchange facilities in certain metropolitan areas, channelization and co-location links (expanded CDN services). However, other than for the access and link components, the CRTC determined that these expanded CDN services should not be priced as essential facilities but will be priced to include “appropriate mark-ups” so as to encourage competitors to construct their own facilities. | |||
72 Bell Canada Enterprises 2004 Annual Report
| Retail Quality of Service Indicators As part of the second price cap decision, incumbent telephone companies are also subject to an interim penalty mechanism for retail quality of service. Under this mechanism, these companies could pay a penalty of up to 5% of their annual revenues from total local retail, business and residential services that are regulated. For Bell Canada, the potential penalty amount could be as much as approximately $262 million annually. Decision on Incumbent Affiliates On December 12, 2002, the CRTC released its decision on incumbent affiliates, which requires Bell Canada and its carrier affiliates to receive CRTC approval on contracts that bundle tariffed and non-tariffed products and services. This means that:
On September 23, 2003, the CRTC issued a decision that requires Bell Canada and its carrier affiliates to include a detailed description of the bundled services they provide to customers when they file tariffs with the CRTC. The customer’s name will be kept confidential, but the pricing and service arrangements it has with the Bell Canada companies will be available on the public record. Allstream and Call-Net Application Concerning Customer-Specific Arrangements On January 23, 2004, Allstream Corp. (Allstream) and Call-Net Enterprises Inc. (Call-Net) filed a joint application asking the CRTC to order Bell Canada to stop providing service under any customer-specific arrangements that are currently filed with the CRTC and are not yet approved. Public Notice on Changes to Minimum Prices On October 23, 2003, the CRTC issued a public notice asking for comments on its preliminary view that revised rules may be needed for setting minimum prices for the regulated services of incumbent telephone companies and for how they price their services, | |||
73 Bell Canada Enterprises 2004 Annual Report
Licences and Changes to Wireless Regulation
| Management’s Discussion and Analysis
service bundles and customer contracts. The CRTC sought comments on proposed pricing restrictions on volume or term contracts for retail tariffed services. It issued an amended public notice on December 8, 2003. The record of this proceeding was completed with the filing of arguments on June 11, 2004 and reply arguments on June 25, 2004. Application Seeking Consistent Regulation On November 6, 2003, Bell Canada filed an application requesting that the CRTC start a public hearing to review how similar services offered by cable companies and telephone companies are regulated. This would allow consistent rules to be developed that recognize and support the growing competition between these sectors. Bell Canada also requested that this proceeding address any rules that might be needed to govern VoIP services provided by cable companies and others. Licences for Broadcasting On November 18, 2004, the CRTC issued Broadcasting Decision CRTC 2004-496, which approved Bell Canada’s applications for licences to operate terrestrial broadcasting distribution undertakings, using its wireline facilities, to serve large cities in Southern Ontario and Québec. Bell Canada will be licensed under the same terms and conditions that apply to major cable operators, without any delays or other conditions that would negatively affect its ability to compete with them. The licences will be issued once Bell Canada informs the CRTC that it is ready to commence operations and will expire on August 31, 2011. Bell Canada is required to have the terrestrial broadcasting distribution undertakings operational no later than November 18, 2006, unless an extension of time is approved by the CRTC. Licences and Changes to Wireless Regulation As a result of an Industry Canada decision, the cellular and PCS licences of Bell Mobility and of Aliant Telecom Inc. and MT&T Mobility Inc. (two subsidiaries of Aliant), which would have expired on March 31, 2006, will now expire in 2011. The PCS licences that were awarded in the 2001 PCS auction will expire on November 29, 2011. As a result, these Bell Canada companies’ cellular and PCS licences are now classified as spectrum licences with a 10-year licence term. While we expect that they will be renewed at term, | |||
74 Bell Canada Enterprises 2004 Annual Report
| there is no assurance that this will happen. Industry Canada can revoke a company’s licence at any time if the company does not comply with the licence’s conditions. While we believe that we comply with the conditions of our licences, there is no assurance that Industry Canada will agree. Should there be a disagreement, this could have a material and negative effect on the Bell Canada companies. Revenue from Major Customers A significant amount of revenue earned by Bell Canada’s Enterprise unit comes from a small number of major customers. If we lose contracts with these major customers and cannot replace them, it could have a material and negative effect on our financial results. Voluntary Departure Programs In 2004, we announced an early retirement program and early departure program for Bell Canada employees. We estimate annual savings of approximately $390 million relating to these programs because of lower salaries, bonuses and non-pension benefits. There is a risk that the amount we expect to save each year from these programs will be lower than expected if, for example, we incur outsourcing, replacement and other costs. Competition Bureau’s Investigation Concerning System Access Fees On December 9, 2004, Bell Canada was notified by the Competition Bureau that the Commissioner of Competition had initiated an inquiry under the misleading advertising provisions of the Competition Act concerning Bell Mobility’s description or representation of system access fees (SAFs) and was served with a court order, under section 11 of the Competition Act, compelling Bell Mobility to produce certain records and other information that would be relevant to the Competition Bureau’s investigation. Increased Accidents from Using Cellphones Some studies suggest that using handheld cellphones while driving may result in more accidents. It is possible that this could lead to new regulations or legislation banning the use of handheld cellphones while driving, as it has in Newfoundland and Labrador and in several U.S. states. If this happens, cellphone use in vehicles could decline, which would negatively affect the business of the Bell Canada companies. Health Concerns about Radio Frequency Emissions It has been suggested that some radio frequency emissions from cellphones may be linked to certain medical conditions. In addition, some interest groups have requested investigations into claims that digital transmissions from handsets used with digital wireless | |||
75 Bell Canada Enterprises 2004 Annual Report
Bell ExpressVu | Management’s Discussion and Analysis
technologies pose health concerns and cause interference with hearing aids and other medical devices. This could lead to additional government regulation, which could have a material and negative effect on the business of the Bell Canada companies. In addition, actual or perceived health risks of wireless communications devices could result in fewer new network subscribers, lower network usage per subscriber, higher churn rates, product liability lawsuits or less outside financing being available to the wireless communications industry. Any of these would have a negative effect on the business of the Bell Canada companies. Bell ExpressVu In order to restore the backup capacity for Bell ExpressVu, which was diminished by the partial failure of Nimiq 2, Telesat reached an agreement with DirecTV for an existing spare in-orbit satellite (Nimiq 3). Telesat received approval from Industry Canada to relocate this satellite to the orbital slots currently occupied by Nimiq 1 or Nimiq 2. In July 2004, the CRTC granted final approval to the agreement between Bell ExpressVu and Telesat to lease the full capacity of Nimiq 3. Bell Globemedia Dependence on Advertising A large part of Bell Globemedia’s revenue from its television and print businesses comes from advertising revenues. Bell Globemedia’s advertising revenues are affected by competitive pressures, including its ability to attract and retain viewers and readers. In addition, | |||
76 Bell Canada Enterprises 2004 Annual Report
| the amount advertisers spend is directly related to economic growth. An economic downturn tends to make it more difficult for Bell Globemedia to maintain or increase revenues. Advertisers have historically been sensitive to general economic cycles and, as a result, Bell Globemedia’s business, financial condition and results of operations could be materially and negatively affected by a downturn in the economy. In addition, most of Bell Globemedia’s advertising contracts are short-term contracts that the advertiser can cancel on short notice. Increasing Fragmentation in Television Markets Television advertising revenue largely depends on the number of viewers and the attractiveness of programming in a given market. The viewing market has become increasingly fragmented over the past decade and this trend is expected to continue as new services and technologies increase the choices available to consumers. As a result, there is no assurance that Bell Globemedia will be able to maintain or increase its advertising revenues or its ability to reach or retain viewers with attractive programming. Revenues from Distributing Television Services A significant portion of revenues from CTV’s specialty television operations comes from contractual arrangements with distributors who are mainly cable and DTH operators. Competition has increased in the specialty television market. As a result, there is no assurance that contracts with distributors will be renewed on equally favourable terms. Increased Competition for Fewer Print Customers Print advertising revenue largely depends on circulation and readership. The existence of a competing national newspaper and commuter papers in Toronto has increased competition, while the total circulation and readership of Canadian newspapers have continued to decline. This has resulted in higher costs, more competition in advertising rates and lower profit margins at The Globe and Mail. Broadcast Licences and CRTC Decisions Each of CTV’s conventional and specialty services operates under licences issued by the CRTC for a fixed term of up to seven years. These licences are subject to the requirements of the Broadcasting Act, the policies and decisions of the CRTC and the conditions of each licensing or renewal decision, all of which may change. While these are expected to be renewed at the appropriate times, there can be no assurance that any or all of CTV’s licences will be renewed. Any renewals, changes or amendments to licences and any decisions by the CRTC from time to time that affect the industry as a whole or CTV in particular may have a material and negative effect on Bell Globemedia. Telesat Satellite Risks There is a risk that the delivery of Telesat’s satellites under construction could be delayed as a result of delays in the construction of the satellites, delays in the construction of the launch vehicle, the failure of a launch vehicle that is similar to the model which Telesat intends to use to launch a satellite, or the unavailability of a reliable launch opportunity. A delay in delivery could have an adverse effect on Telesat’s ability to provide service and could result in additional costs. Telesat seeks to mitigate the impact of such a delay through various contractual measures including late delivery charges and by planning for contingency measures as required. | |||
77 Bell Canada Enterprises 2004 Annual Report
Our Accounting Policies Employee Benefit Plans | Management’s Discussion and Analysis
Where insurance coverage is available on commercially reasonable terms and conditions, Telesat seeks to protect itself against some of the consequences of launch and in-orbit failures by purchasing satellite insurance. However, there is no assurance that Telesat will be able to obtain or renew launch and in-orbit insurance coverage for its satellites for the full satellite value, nor is there any assurance that coverage will be obtained at a favourable premium rate.
In December 2004, Telesat ceased to insure its interest in the residual value of Nimiq 2 following the arrival in orbit of the leased satellite Nimiq 3 (formerly DirecTV3) a satellite that complements the capacity of Nimiq 1 and 2 and which, following operational changes, could be used to provide capacity and continuity of service in the event of a failure of either Nimiq 1 or Nimiq 2. Critical Accounting Estimates Under Canadian GAAP, we are required to make estimates when we account for and report assets, liabilities, revenues and expenses, and to disclose contingent assets and liabilities in our financial statements. We are also required to continually evaluate the estimates that we use. Employee Benefit Plans We perform a valuation at least every three years to determine the actuarial present value of the accrued | |||
78 Bell Canada Enterprises 2004 Annual Report
Discount Rate | pension and other retirement benefits. The valuation uses management’s assumptions for the discount rate, expected long-term rate of return on plan assets, rate of compensation increase, health-care cost trend and expected average remaining years of service of employees. Discount Rate We determine the appropriate discount rate at the end of every year. Our discount rate was 6.2% at December 31, 2004, a decrease from 6.5% at December 31, 2003. The table below shows the impact on the net benefit plans cost for 2005 and the accrued benefit asset at December 31, 2005 of a 0.5% increase and a 0.5% decrease in the discount rate. | |||||
| IMPACT ON | ||||||
| ACCRUED | ||||||
| IMPACT ON | BENEFIT | |||||
| NET BENEFIT | ASSET AT | |||||
| PLANS COST | DECEMBER 31, | |||||
| FOR 2005 | 2005 | |||||
Discount rate increased to 6.7% | ||||||
Consumer | (27 | ) | 27 | |||
Business | (24 | ) | 24 | |||
Aliant | (12 | ) | 12 | |||
Other Bell Canada | (12 | ) | 12 | |||
Other BCE | (5 | ) | 5 | |||
| Total | (80 | ) | 80 | |||
Discount rate decreased to 5.7% | ||||||
Consumer | 28 | (28 | ) | |||
Business | 25 | (25 | ) | |||
Aliant | 10 | (10 | ) | |||
Other Bell Canada | 12 | (12 | ) | |||
Other BCE | 5 | (5 | ) | |||
| Total | 80 | (80 | ) | |||
Expected Long-Term Rate of Return The expected long-term rate of return is a weighted average rate of our forward-looking view of long-term returns on each of the major plan asset categories in our funds. | ||||
| . | IMPACT ON | |||||
| ACCRUED | ||||||
| IMPACT ON | BENEFIT | |||||
| NET BENEFIT | ASSET AT | |||||
| PLANS COST | DECEMBER 31, | |||||
| FOR 2005 | 2005 | |||||
| Expected rate of return increased to 8.0% | ||||||
Consumer | (24 | ) | 24 | |||
Business | (21 | ) | 21 | |||
Aliant | (5 | ) | 5 | |||
Other Bell Canada | (10 | ) | 10 | |||
Other BCE | (5 | ) | 5 | |||
| Total | (65 | ) | 65 | |||
| Expected rate of return decreased to 7.0% | ||||||
Consumer | 24 | (24 | ) | |||
Business | 21 | (21 | ) | |||
Aliant | 5 | (5 | ) | |||
Other Bell Canada | 10 | (10 | ) | |||
Other BCE | 5 | (5 | ) | |||
| Total | 65 | (65 | ) | |||
Although there is no immediate impact on our balance sheet, poor fund performance results in a lower fair value of plan assets and a lower pension surplus. This means that we may have to increase any cash contributions to the plan. | ||||||
79 Bell Canada Enterprises 2004 Annual Report
Goodwill Impairment Contingencies | Management’s Discussion and Analysis
Goodwill Impairment We generally measure for impairment using a projected discounted cash flow method and confirm our assessment using other valuation methods. If the asset’s carrying value is more than its fair value, we record the difference as a reduction in the amount of goodwill on the balance sheet and an impairment charge in the statement of operations. Contingencies We accrue a potential loss if we believe the loss is probable and it can be reasonably estimated. We base our decision on information that is available at the time. We estimate the amount of the loss by consulting with the outside legal counsel that is handling our defence. This involves analyzing potential outcomes and assuming various litigation and settlement strategies. Income Taxes Management believes that it has adequately provided for income taxes based on all of the information that is currently available. The calculation of income taxes in many cases, however, requires significant judgment in interpreting tax rules and regulations, which are constantly changing. Each of our operating segments may be affected. Recent Changes to Accounting Standards Please see Note 1 to the consolidated financial statements for more information about the accounting policies we adopted in 2004. These are the result of new accounting standards for:
| |||
80 Bell Canada Enterprises 2004 Annual Report
| Future Changes to Accounting Standards Financial Instruments The CICA issued revisions to section 3860 of the CICA Handbook, Financial Instruments – Disclosure and Presentation. The revisions change the accounting for certain financial instruments that have liability and equity characteristics. It requires instruments that meet specific criteria to be classified as liabilities on the balance sheet. Some of these financial instruments were previously classified as equities. Comprehensive Income The CICA issued section 1530 of the CICA Handbook, Comprehensive Income. The section is effective for fiscal years beginning on or after October 1, 2006. It describes how to report and disclose comprehensive income and its components.
The CICA also made changes to section 3250 of the CICA Handbook, Surplus, and reissued it as section 3251, Equity. The section is also effective for fiscal years beginning on or after October 1, 2006. The changes in how to report and disclose equity and changes in equity are consistent with the new requirements of section 1530, Comprehensive Income.
Financial Instruments – Recognition and Measurement The CICA issued section 3855 of the CICA Handbook, Financial Instruments – Recognition and Measurement. The section is effective for fiscal years beginning on or after October 1, 2006. It describes the standards for recognizing and measuring financial assets, financial liabilities and non-financial derivatives.
We are currently evaluating the impact on our consolidated financial statements of adopting this section on January 1, 2007. Hedges The CICA recently issued section 3865 of the CICA Handbook, Hedges. The section is effective for fiscal years beginning on or after October 1, 2006, and describes when and how hedge accounting can be used.
Hedge accounting makes sure that all gains, losses, revenues and expenses from the derivative and the item it hedges are recorded in the statement of operations in the same period. | |||
81 Bell Canada Enterprises 2004 Annual Report
This section of our annual report contains the audited consolidated financial statements of BCE and detailed notes with explanations and additional information. The financial statements contain our results and financial history for the past three years. The notes are an important part of understanding our financial results. They explain how we arrived at the numbers in the financial statements, describe significant events or changes that affect the numbers, and explain certain items in the financial statements. They also include details about our results that do not appear in the financial statements. BCE consists of many businesses, including subsidiaries and joint ventures. We present the financial information for all of our holdings as one consolidated company. Except in the auditors’ report,we,us,ourandBCE mean BCE Inc., its subsidiaries and joint ventures.
| Consolidated Financial Statements These financial statements form the basis for all of the financial information that appears in this annual report. Michael J. Sabia President and Chief Executive Officer
| |
Auditors’ Report To the Shareholders of BCE Inc.: We have audited the consolidated balance sheets of BCE Inc. as at December 31, 2004 and 2003, and the consolidated statements of operations, deficit and cash flows for each of the years in the three-year period ended December 31, 2004. These consolidated financial statements are the responsibility of BCE Inc.’s management. Our responsibility is to express an opinion on these consolidated financial statements based on our audits. Deloitte & Touche LLP Chartered Accountants Montréal, Canada |
82 Bell Canada Enterprises 2004 Annual Report
| Consolidated Statements of Operations
| ||||||||||
FOR THE YEAR ENDED DECEMBER 31(in $ millions, except share amounts) | NOTES | 2004 | 2003 | 2002 | ||||||
Operating revenues | 19,193 | 18,737 | 18,900 | |||||||
Operating expenses | (11,629 | ) | (11,327 | ) | (11,516 | ) | ||||
Amortization expense | (3,108 | ) | (3,100 | ) | (3,024 | ) | ||||
Net benefit plans (cost) credit | 23 | (256 | ) | (175 | ) | 33 | ||||
Restructuring and other items | 4 | (1,224 | ) | (14 | ) | (768 | ) | |||
Total operating expenses | (16,217 | ) | (14,616 | ) | (15,275 | ) | ||||
Operating income | 2,976 | 4,121 | 3,625 | |||||||
Other income | 5 | 411 | 175 | 2,408 | ||||||
Impairment charge | 6 | – | – | (765 | ) | |||||
Interest expense | 7 | (1,005 | ) | (1,105 | ) | (1,120 | ) | |||
Pre-tax earnings from continuing operations | 2,382 | 3,191 | 4,148 | |||||||
Income taxes | 8 | (710 | ) | (1,119 | ) | (1,614 | ) | |||
Non-controlling interest | (174 | ) | (201 | ) | (663 | ) | ||||
Earnings from continuing operations | 1,498 | 1,871 | 1,871 | |||||||
Discontinued operations | 9 | 26 | (56 | ) | 536 | |||||
Net earnings before extraordinary gain | 1,524 | 1,815 | 2,407 | |||||||
Extraordinary gain | 3 | 69 | – | – | ||||||
Net earnings | 1,593 | 1,815 | 2,407 | |||||||
Dividends on preferred shares | (70 | ) | (64 | ) | (59 | ) | ||||
Premium on redemption of preferred shares | – | (7 | ) | (6 | ) | |||||
Net earnings applicable to common shares | 1,523 | 1,744 | 2,342 | |||||||
Net earnings (loss) per common share – basic | 10 | |||||||||
Continuing operations | 1.55 | 1.96 | 2.11 | |||||||
Discontinued operations | 0.03 | (0.06 | ) | 0.55 | ||||||
Extraordinary gain | 0.07 | – | – | |||||||
Net earnings | 1.65 | 1.90 | 2.66 | |||||||
Net earnings (loss) per common share – diluted | 10 | |||||||||
Continuing operations | 1.55 | 1.95 | 2.09 | |||||||
Discontinued operations | 0.03 | (0.06 | ) | 0.53 | ||||||
Extraordinary gain | 0.07 | – | – | |||||||
Net earnings | 1.65 | 1.89 | 2.62 | |||||||
Dividends per common share | 1.20 | 1.20 | 1.20 | |||||||
Average number of common shares outstanding – basic (millions) | 924.6 | 920.3 | 847.9 | |||||||
| Consolidated Statements of Deficit
| ||||||||||
FOR THE YEAR ENDED DECEMBER 31(in $ millions) | NOTES | 2004 | 2003 | 2002 | ||||||
Balance at beginning of year, as previously reported | (5,830 | ) | (6,435 | ) | (7,686 | ) | ||||
Accounting policy change for asset retirement obligations | 1 | (7 | ) | (7 | ) | (7 | ) | |||
Balance at beginning of year, as restated | (5,837 | ) | (6,442 | ) | (7,693 | ) | ||||
Consolidation of variable interest entity | 1 | – | (25 | ) | – | |||||
Net earnings | 1,593 | 1,815 | 2,407 | |||||||
Dividends declared on common shares | (1,110 | ) | (1,105 | ) | (1,031 | ) | ||||
Dividends declared on preferred shares | (70 | ) | (64 | ) | (59 | ) | ||||
Costs relating to the issuance of common shares, net of $22 million of taxes | – | – | (62 | ) | ||||||
Premium on redemption of preferred shares | – | (7 | ) | (6 | ) | |||||
Other | – | (9 | ) | 2 | ||||||
Balance at end of year | (5,424 | ) | (5,837 | ) | (6,442 | ) | ||||
83 Bell Canada Enterprises2004Annual Report
| Consolidated Balance Sheets
| ||||||||
| AT DECEMBER31(in $ millions) | NOTES | 2004 | 2003 | |||||
Assets | ||||||||
Current assets | ||||||||
Cash and cash equivalents | 380 | 585 | ||||||
Accounts receivable | 11 | 2,119 | 2,061 | |||||
Other current assets | 12 | 1,211 | 739 | |||||
Current assets of discontinued operations | 9 | – | 280 | |||||
Total current assets | 3,710 | 3,665 | ||||||
Capital assets | 13 | 21,398 | 21,114 | |||||
Other long-term assets | 14 | 2,656 | 3,459 | |||||
Indefinite-life intangible assets | 15 | 2,916 | 2,910 | |||||
Goodwill | 16 | 8,413 | 7,761 | |||||
Non-current assets of discontinued operations | 9 | 50 | 511 | |||||
Total assets | 39,143 | 39,420 | ||||||
Liabilities | ||||||||
Current liabilities | ||||||||
Accounts payable and accrued liabilities | 3,700 | 3,046 | ||||||
Interest payable | 183 | 194 | ||||||
Dividends payable | 297 | 294 | ||||||
Debt due within one year | 17 | 1,276 | 1,519 | |||||
Current liabilities of discontinued operations | 9 | – | 285 | |||||
Total current liabilities | 5,456 | 5,338 | ||||||
Long-term debt | 18 | 11,809 | 12,381 | |||||
Other long-term liabilities | 19 | 4,932 | 4,705 | |||||
Non-current liabilities of discontinued operations | 9 | – | 20 | |||||
Total liabilities | 22,197 | 22,444 | ||||||
Non-controlling interest | 2,914 | 3,403 | ||||||
Commitments and contingencies | 24 | |||||||
Shareholders’ Equity | ||||||||
Preferred shares | 21 | 1,670 | 1,670 | |||||
Common shareholders’ equity | ||||||||
Common shares | 21 | 16,781 | 16,749 | |||||
Contributed surplus | 1,061 | 1,037 | ||||||
Deficit | (5,424 | ) | (5,837 | ) | ||||
Currency translation adjustment | (56 | ) | (46 | ) | ||||
Total common shareholders’ equity | 12,362 | 11,903 | ||||||
Total shareholders’ equity | 14,032 | 13,573 | ||||||
Total liabilities and shareholders’ equity | 39,143 | 39,420 | ||||||
On behalf of the board of directors: Director |
Director |

84 Bell Canada Enterprises 2004 Annual Report
| Consolidated Statements of Cash Flows
| ||||||||
| FOR THE YEAR ENDED DECEMBER 31(in $ millions) | 2004 | 2003 | 2002 | |||||
Cash flows from operating activities | ||||||||
Earnings from continuing operations | 1,498 | 1,871 | 1,871 | |||||
Adjustments to reconcile earnings from continuing operations to cash flows from operating activities: | ||||||||
Amortization expense | 3,108 | 3,100 | 3,024 | |||||
Net benefit plans cost (credit) | 256 | 175 | (33 | ) | ||||
Restructuring and other items | 1,224 | 14 | 768 | |||||
Impairment charge | – | – | 765 | |||||
Net gains on investments | (319 | ) | (76 | ) | (2,401 | ) | ||
Future income taxes | (34 | ) | 418 | 563 | ||||
Non-controlling interest | 174 | 201 | 663 | |||||
Contributions to employee pension plans | (112 | ) | (160 | ) | (21 | ) | ||
Other employee future benefit plan payments | (81 | ) | (87 | ) | (76 | ) | ||
Payments of restructuring and other items | (253 | ) | (124 | ) | (338 | ) | ||
Operating assets and liabilities | 58 | 636 | (361 | ) | ||||
Cash flows from operating activities | 5,519 | 5,968 | 4,424 | |||||
Cash flows from investing activities | ||||||||
Capital expenditures | (3,364 | ) | (3,167 | ) | (3,709 | ) | ||
Business acquisitions | (1,299 | ) | (115 | ) | (6,471 | ) | ||
Business dispositions | 20 | 55 | 3,190 | |||||
Change in investments accounted for under the cost and equity methods | 655 | 163 | (54 | ) | ||||
Other | 124 | 62 | 12 | |||||
Cash used in investing activities | (3,864 | ) | (3,002 | ) | (7,032 | ) | ||
Cash flows from financing activities | ||||||||
Increase (decrease) in notes payable and bank advances | 130 | (295 | ) | (213 | ) | |||
Issue of long-term debt | 1,521 | 1,986 | 4,909 | |||||
Repayment of long-term debt | (2,391 | ) | (3,472 | ) | (2,691 | ) | ||
Issue of common shares | 32 | 19 | 2,693 | |||||
Costs relating to the issuance of common shares | – | – | (78 | ) | ||||
Issue of preferred shares | – | 510 | 510 | |||||
Redemption of preferred shares | – | (357 | ) | (306 | ) | |||
Issue of equity securities by subsidiaries to non-controlling interest | 8 | 132 | 92 | |||||
Redemption of equity securities by subsidiaries from non-controlling interest | (58 | ) | (108 | ) | – | |||
Cash dividends paid on common shares | (1,108 | ) | (1,029 | ) | (999 | ) | ||
Cash dividends paid on preferred shares | (85 | ) | (61 | ) | (43 | ) | ||
Cash dividends paid by subsidiaries to non-controlling interest | (188 | ) | (184 | ) | (468 | ) | ||
Other | (51 | ) | (46 | ) | (44 | ) | ||
Cash provided by (used in) financing activities | (2,190 | ) | (2,905 | ) | 3,362 | |||
Cash provided by (used in) continuing operations | (535 | ) | 61 | 754 | ||||
Cash provided by (used in) discontinued operations | 193 | 355 | (1,017 | ) | ||||
Net increase (decrease) in cash and cash equivalents | (342 | ) | 416 | (263 | ) | |||
Cash and cash equivalents at beginning of year | 722 | 306 | 569 | |||||
Cash and cash equivalents at end of year | 380 | 722 | 306 | |||||
Consists of: | ||||||||
Cash and cash equivalents of continuing operations | 380 | 585 | 208 | |||||
Cash and cash equivalents of discontinued operations | – | 137 | 98 | |||||
Total | 380 | 722 | 306 | |||||
85 Bell Canada Enterprises 2004 Annual Report
All amounts are in millions of Canadian dollars, except where noted. See Note 27,Reconciliation of Canadian GAAP to United States GAAP, for a description and reconciliation of the significant differences between Canadian GAAP and United States GAAP that affect our financial statements.
| Notes to Consolidated Financial Statements Note 1: Significant Accounting Policies Basis of PresentationWe have prepared the consolidated financial statements according to Canadian generally accepted accounting principles (GAAP). We have reclassified some of the figures for the comparative periods in the consolidated financial statements to make them consistent with the presentation for the current period.
When preparing financial statements according toGAAP, management makes estimates and assumptions relating to:
Actual results could be different from these estimates. Recognizing RevenueWe recognize operating revenues when they are earned, specifically when:
In particular, we recognize:
We may enter into arrangements with subcontractors who provide services to our customers. When we act as the principal in these arrangements, we recognize revenue based on the amounts billed to customers. Otherwise, we recognize the net amount that we keep as revenue. We accrue an estimated amount for sales returns, based on our past experience, when revenue is recognized. We record payments we receive in advance as deferred revenues until we provide the service or deliver the product to customers. Deferred revenues are presented inAccounts payable and accrued liabilitiesor inOther long-term liabilitieson the balance sheet. Cash and Cash Equivalents We generally classify highly liquid investments with a short-term maturity of three months or less asCash and cash equivalents. Securitization of Accounts Receivable We consider a transfer of accounts receivable to be a sale when we give up control of them in exchange for proceeds from a trust (other than our retained beneficial interest in the accounts receivable). |
86 Bell Canada Enterprises 2004 Annual Report
Equity Method Cost Method | and other key assumptions. We recognize a loss on this kind of transaction, which is included inOther income. The loss partly depends on the carrying amount of the accounts receivable that are transferred. We allocate this amount to accounts receivable sold, or to our retained interest, according to its relative fair value on the day the transfer is made.
We carry capital assets at cost, less accumulated amortization. Most of our telecommunications assets are amortized using the group depreciation method. When we retire assets in the ordinary course of business, we charge their original cost to accumulated amortization. In general, we amortize capital assets on a straight-line basis over the estimated useful lives of the assets. We review the estimates of the useful lives of the assets every year and adjust them if needed. |
Goodwill Goodwill is created when we acquire a business. It is calculated by deducting the fair value of the net assets acquired from the consideration given and represents the value of factors that contribute to greater earning power, such as a good reputation, customer loyalty or intellectual capital. | ESTIMATED USEFUL LIFE | ||
| Telecommunications assets | 10 to 25 years | ||
| Machinery and equipment | 2 to 20 years | ||
| Buildings | 10 to 40 years | ||
| Satellites | 10 to 15 years | ||
| Finite-life intangible assets | |||
Software | 3 to 7 years | ||
Customer relationships | 5 to 40 years | ||
| We capitalize construction costs, labour and overhead (including interest) related to assets we build or develop. We capitalize some of the costs of developing or buying software for internal use. We expense software maintenance and training costs when they are incurred. The expense is included inOperating expensesin the statement of operations. We assess capital assets for impairment when events or changes in circumstances indicate that we may not be able to recover their carrying value. We calculate impairment by deducting the asset’s fair value, based on discounted cash flows expected from its use and disposition, from its carrying value. Any excess is deducted from earnings. Accounting for Investments We use the following methods to account for investments that are not consolidated or proportionately consolidated in our financial statements:
We include investments inOther long-term assetson the balance sheet. Earnings from investments are included inOther incomein the statement of operations. Costs of Issuing Debt and Equity The costs of issuing debt are capitalized inOther long-term assets. They are amortized on a straight-line basis over the term of the related debt and are included inInterest expensein the statement of operations. The costs of issuing equity are reflected in the statement of deficit. Indefinite-Life Intangible Assets Our indefinite-life intangible assets consist mainly of the Bell brand name, spectrum licences and television licences. We assess these assets for impairment in the fourth quarter of every year and when events or changes in circumstances indicate that an asset might be impaired. We calculate the impairment by deducting the asset’s fair value, based on estimates of discounted future cash flows or other valuation methods, from its carrying value. Any excess is deducted from earnings. GoodwillWe assess goodwill of individual reporting units for impairment in the fourth quarter of every year and when events or changes in circumstances indicate that goodwill might be impaired. We assess goodwill for impairment in two steps:
|
87 Bell Canada Enterprises 2004 Annual Report
|
Translation of Foreign
| Notes to Consolidated Financial Statements
cash flows or other valuation methods. When the fair value of the reporting unit is less than its carrying value, we allocate the fair value to all of its assets and liabilities, based on their fair values. The amount that the fair value of the reporting unit exceeds the total of the amounts assigned to its assets and liabilities is the fair value of goodwill.
Translation of Foreign Currencies Self-Sustaining Foreign OperationsFor self-sustaining foreign operations, we use:
Translation exchange gains and losses are reflected as a currency translation adjustment in shareholders’ equity. When we reduce our net investment in a self-sustaining foreign operation, we recognize a portion of the currency translation adjustment in earnings. Integrated Foreign OperationsFor integrated foreign operations, we use:
Translation exchange gains and losses are included inOther incomein the statement of operations. Domestic Transactions and Balances in Foreign Currencies For domestic transactions made in foreign currencies, we use:
Translation exchange gains and losses are included inOther incomein the statement of operations. Derivative Financial Instruments We use various derivative financial instruments to hedge against:
We do not use derivative financial instruments for speculative or trading purposes.
We assess how effective derivatives are in managing risk when the hedge is put in place, and on an ongoing basis. If a hedge becomes ineffective, we stop using hedge accounting.
|
88 Bell Canada Enterprises 2004 Annual Report
The following describes our policies for specific kinds of derivatives. Interest Rate Swap Agreements We use interest rate swap agreements to help manage the fixed and floating interest rate mix of our total debt portfolio. These agreements often involve exchanging interest payments without exchanging the notional principal amount that the payments are based on. We record the exchange of payments as an adjustment of interest expense on the hedged debt. We include the related amount payable or receivable from counterparties inOther long-term assets or liabilities. Foreign Currency Swap Agreements We use foreign currency swap agreements to manage the foreign exchange rate exposure of some of our debt that is denominated in foreign currencies. We designate these agreements as hedges of firm commitments to pay interest and/or principal on the foreign currency risk. We recognize gains and losses on these contracts the same way we recognize the gains and losses on the hedged item. Unrealized gains or losses are included inOther long-term assets or liabilities. Forward ContractsWe use forward contracts to manage:
We recognize gains and losses on these contracts the same way we recognize the gains and losses on the hedged item. Unrealized gains or losses are included inOther long-term assets or liabilities. Employee Benefit Plans(i) Defined Benefit Plans We maintain defined benefit (DB) plans that provide pension benefits for some of our employees. Benefits are based on the employee’s length of service and average rate of pay during his or her last five years of service. Most employees are not required to contribute to the plans. The plans provide increasing pension benefits to help protect a portion of the income of retired employees against inflation.
We do not fund the other employee future benefit plans.
We value pension plan assets at fair value, which is determined using current market values. We use a market-related value to calculate the expected return on plan assets. This value is based on a four-year weighted average of the fair value of the pension plan assets. |
89 Bell Canada Enterprises 2004 Annual Report
|
Curtailment
Settlement | Notes to Consolidated Financial Statements
We amortize past service costs from plan amendments on a straight-line basis over the average remaining service period of employees who were active on the day of the amendment. This represents the period that we expect to realize economic benefits from the amendments. (ii) Defined Contribution Plans Some of our subsidiaries offer defined contribution (DC) plans that provide certain employees with pension benefits. Current income tax expense is the estimated income taxes payable for the current year before any refunds or the use of losses incurred in previous years. We use the asset and liability method to account for future income taxes. Future income taxes reflect:
We calculate future income taxes using the rates enacted by tax law and those substantively enacted. A tax law is substantively enacted when it has been tabled in the legislature but may not have been passed into law. The effect of a change in tax rates on future income tax assets and liabilities is included in earnings in the period when the change is substantively enacted. Subscriber Acquisition Costs We expense all subscriber acquisition costs when services are activated. Stock-Based Compensation Plans BCE Inc.’s stock-based compensation plans include employee savings plans (ESPs), restricted share units (RSUs) and long-term incentive plans. Before2000, the long-term incentive plans often includedSCPs.
We credit to share capital any amount employees pay when they exercise their stock options or buy shares. We recognize the contributionsBCE Inc. makes under ESPs as compensation expense. We also recognize compensation expense or recovery relating toSCPs. |
90 Bell Canada Enterprises2004Annual Report
Black-Scholes Option Pricing Model The Black-Scholes option pricing model is a financial model we use to calculate the weighted average fair value of a stock option granted using four key assumptions: stock dividend yield, expected stock volatility, risk-free interest rate and expected life of the stock option. | RSUs For eachRSUgranted we record a compensation expense that equals the market value of aBCE Inc. common share at the date of grant prorated over the vesting period. The compensation expense is adjusted for future changes in the market value ofBCE Inc. common shares until the vesting date. The cumulative effect of the change in value is recognized in the period of the change. VestedRSUs will be paid inBCE Inc. common shares purchased on the open market or in cash, as the holder chooses, as long as minimum share ownership requirements are met. Stock Options Recent Changes to Accounting Standards Asset Retirement ObligationsEffective January 1,2004, we retroactively adopted section3110of theCICA Handbook,Asset Retirement Obligations. This section describes how to recognize and measure liabilities related to the legal obligations of retiring property, plant and equipment. These obligations are initially measured at fair value and are adjusted for any changes resulting from age, and any changes to the timing or the amount of the original estimate of undiscounted cash flows. The asset retirement cost is capitalized as part of the related assets and is amortized into earnings over time. The impact on our consolidated statements of operations for the year ended December 31,2004and the comparative periods was negligible. At December 31,2003and2002, this resulted in:
Impairment of Long-Lived Assets Effective January 1,2004, we adopted section3063of theCICA Handbook,Impairment of Long-Lived Assets. Adopting this section affects how we recognize, measure and disclose the impairment of long-lived assets. Effective January 1,2004, we adopted Accounting Guideline13,Hedging Relationships. The guideline specifies when hedge accounting can be used, and includes requirements for documenting and designating hedge relationships. It also requires companies to regularly and frequently assess the effectiveness of these hedging relationships. The guideline does not change the method of accounting for derivative instruments in hedging relationships. Adopting this guideline did not affect our consolidated financial statements. All outstanding hedges that previously qualified for hedge accounting continue to qualify for hedge accounting under this guideline. Consolidation of Variable Interest Entities |
91 Bell Canada Enterprises2004Annual Report
| Notes to Consolidated Financial Statements
Future Changes to Accounting Standards Financial InstrumentsThe CICA issued revisions to section 3860 of the CICA Handbook,Financial Instruments – Disclosure and Presentation. The revisions change the accounting for certain financial instruments that have liability and equity characteristics. It requires instruments that meet specific criteria to be classified as liabilities on the balance sheet. Some of these financial instruments were previously classified as equities. These revisions come into effect on January 1, 2005. Because we do not have any instruments with these characteristics, adopting this section on January 1, 2005 will not affect our consolidated financial statements. Comprehensive Income
The CICA also made changes to section 3250 of the CICA Handbook,Surplus, and reissued it as section 3251,Equity. The section is also effective for fiscal years beginning on or after October 1, 2006. The changes in how to report and disclose equity and changes in equity are consistent with the new requirements of section 1530,Comprehensive Income.
The CICA issued section 3855 of the CICA Handbook,Financial Instruments – Recognition and Measurement. The section is effective for fiscal years beginning on or after October 1, 2006. It describes the standards for recognizing and measuring financial assets, financial liabilities and non-financial derivatives. This section requires that:
We are currently evaluating the impact on our consolidated financial statements of adopting this section on January 1, 2007. HedgesThe CICA recently issued section 3865 of the CICA Handbook,Hedges. The section is effective for fiscal years beginning on or after October 1, 2006, and describes when and how hedge accounting can be used. Hedging is an activity used by a company to change an exposure to one or more risks by creating an offset between:
Hedge accounting makes sure that all gains, losses, revenues and expenses from the derivative and the item it hedges are recorded in the statement of operations in the same period. |
92 Bell Canada Enterprises 2004 Annual Report
In the first quarter of 2004, we changed our internal organizational structure and started reporting our results of operations under five segments:Consumer, Business,Aliant,Other Bell CanadaandOther BCE. Our reporting structure reflects how we manage our business and how we classify our operations for planning and measuring performance. |
93 Bell Canada Enterprises 2004 Annual Report
|
The accounting policies used by the segments are the same as those we describe in Note 1,Significant Accounting Policies. Segments negotiate sales with each other as if they were unrelated parties. | Notes to Consolidated Financial Statements
The table below is a summary of financial information by segment. We have not presented comparative figures for2002because information is not available. | |||||||||||||||||||
| INTER- | ||||||||||||||||||||
| SEGMENT | INTER- | |||||||||||||||||||
| ELIMINA- | SEGMENT | |||||||||||||||||||
| OTHER | TIONS | ELIMINA- | ||||||||||||||||||
| BELL | – BELL | BELL | OTHER | TIONS | CONSOLI- | |||||||||||||||
| CONSUMER | BUSINESS | ALIANT | CANADA | CANADA | CANADA | BCE | – OTHER | DATED | ||||||||||||
For the year ended December 31, 2004 | ||||||||||||||||||||
| Operating revenues | ||||||||||||||||||||
External customers | 7,440 | 5,622 | 1,894 | 1,736 | – | 16,692 | 2,501 | – | 19,193 | |||||||||||
Inter-segment | 62 | 229 | 139 | 203 | (538 | ) | 95 | 360 | (455 | ) | – | |||||||||
Total operating revenues | 7,502 | 5,851 | 2,033 | 1,939 | (538 | ) | 16,787 | 2,861 | (455 | ) | 19,193 | |||||||||
Operating income (loss) | 2,119 | 896 | 268 | (588 | ) | – | 2,695 | 281 | – | 2,976 | ||||||||||
Other income | 411 | |||||||||||||||||||
Interest expense | (1,005 | ) | ||||||||||||||||||
Income taxes | (710 | ) | ||||||||||||||||||
Non-controlling interest | (174 | ) | ||||||||||||||||||
Earnings from continuing operations | 1,498 | |||||||||||||||||||
Segment assets | 13,014 | 13,491 | 3,707 | 2,757 | – | 32,969 | 6,174 | – | 39,143 | |||||||||||
Investments at equity | – | – | – | 4 | – | 4 | 106 | – | 110 | |||||||||||
Capital expenditures | (1,481 | ) | (898 | ) | (295 | ) | (352 | ) | – | (3,026 | ) | (338 | ) | – | (3,364 | ) | ||||
For the year ended December 31, 2003 | ||||||||||||||||||||
Operating revenues | ||||||||||||||||||||
External customers | 7,142 | 5,544 | 1,909 | 1,868 | – | 16,463 | 2,274 | – | 18,737 | |||||||||||
Inter-segment | 61 | 283 | 150 | 147 | (490 | ) | 151 | 323 | (474 | ) | – | |||||||||
Total operating revenues | 7,203 | 5,827 | 2,059 | 2,015 | (490 | ) | 16,614 | 2,597 | (474 | ) | 18,737 | |||||||||
Operating income | 2,019 | 781 | 415 | 621 | – | 3,836 | 285 | – | 4,121 | |||||||||||
Other income | 175 | |||||||||||||||||||
Interest expense | (1,105 | ) | ||||||||||||||||||
Income taxes | (1,119 | ) | ||||||||||||||||||
Non-controlling interest | (201 | ) | ||||||||||||||||||
Earnings from continuing operations | 1,871 | |||||||||||||||||||
Segment assets | 13,321 | 11,648 | 3,862 | 4,698 | – | 33,529 | 5,891 | – | 39,420 | |||||||||||
Investments at equity | – | – | – | 398 | – | 398 | 98 | – | 496 | |||||||||||
Capital expenditures | (1,287 | ) | (936 | ) | (333 | ) | (336 | ) | – | (2,892 | ) | (275 | ) | – | (3,167 | ) | ||||
94 Bell Canada Enterprises 2004 Annual Report
AGTI provides business and IT consulting, project and change management, and productivity improvement services. Infostream is a systems and storage technology firm that provides networking solutions for voice over Internet protocol (VoIP), storage area networks and network management. Charon is a full-service IT solutions provider that specializes in server-based computing, systems integration, IT security, software development and IT consulting. AMS is a business and technology consulting firm to government and to the health-care, financial services and telecommunications industries. Elix offers technology consulting, integration and implementation of call routing and management systems, IT application integration, and design and implementation of electronic voice-driven response systems. Cognicase provides technology services, including implementing e-business solutions.
| Note 3: Business Acquisitions and Dispositions The consolidated statements of operations include the results of acquired businesses from the date they were purchased. Business AcquisitionsWe made a number of business acquisitions in 2004, including:
During 2003, CGI acquired 100% of the outstanding common shares of Cognicase Inc. (Cognicase). It issued Class A subordinate shares to pay part of the purchase price, which reduced BCE’s equity interest in CGI to 29.9% from 31.5% . BCE recognized a dilution gain of $5 million. |
95 Bell Canada Enterprises 2004 Annual Report
| Notes to Consolidated Financial Statements | ||||||||||||||
| 2004 | 2003 | |||||||||||||
| BCE’S | BCE’S | |||||||||||||
| CANADIAN | 40% | PROPOR- | ALL OTHER | PROPOR- | ||||||||||
| OPERATIONS | INTEREST | TIONATE | BUSINESS | TIONATE | ||||||||||
| OF | IN BELL | SHARE | ACQUI- | SHARE OF | ||||||||||
| 360NETWORKS | WEST | OF AMS | SITIONS | TOTAL | COGNICASE | |||||||||
Consideration received: | ||||||||||||||
Non-cash working capital | (9 | ) | – | (59 | ) | 11 | (57 | ) | (32 | ) | ||||
Capital assets | – | (15 | ) | 90 | 16 | 91 | 9 | |||||||
Other long-term assets | 429 | 5 | – | 10 | 444 | 36 | ||||||||
Goodwill | – | 395 | 161 | 171 | 727 | 96 | ||||||||
Long-term debt | – | – | – | – | – | (18 | ) | |||||||
Other long-term liabilities | (58 | ) | – | (21 | ) | – | (79 | ) | – | |||||
Non-controlling interest | – | 261 | – | – | 261 | – | ||||||||
| 362 | 646 | 171 | 208 | 1,387 | 91 | ||||||||
Cash and cash equivalents (bank indebtedness) at acquisition | – | – | 13 | (3 | ) | 10 | 7 | |||||||
Net assets acquired | 362 | 646 | 184 | 205 | 1,397 | 98 | ||||||||
Extraordinary gain | 69 | 69 | ||||||||||||
Consideration given: | ||||||||||||||
Cash | 283 | 645 | 178 | 185 | 1,291 | 54 | ||||||||
Acquisition costs | 10 | 1 | 6 | 1 | 18 | 2 | ||||||||
Future cash payment | – | – | – | 4 | 4 | |||||||||
Issuance of 582,081 Aliant common shares | 15 | 15 | ||||||||||||
Issuance of 19,850,245 CGI | ||||||||||||||
Class A subordinate shares(1) | 42 | |||||||||||||
| 293 | 646 | 184 | 205 | 1,328 | 98 | |||||||||
| (1) The value of the CGI shares that were issued as payment was calculated using the weighted average closing share price on the Toronto Stock Exchange for the 10 trading days before the day the terms of the acquisition were agreed on and announced. | ||||||||||||||
Business Disposition Sale of Certen Inc. (Certen) On July 2, 2003, Bell Canada sold its 89.9% ownership interest in Certen to a subsidiary of Amdocs Limited for $89 million in cash. |
96 Bell Canada Enterprises 2004 Annual Report
| Note 4: Restructuring and Other Items
| ||||||||
| 2004 | 2003 | 2002 | ||||||
Employee departure programs | (1,063 | ) | – | (302 | ) | |||
Provision for contract loss | (128 | ) | – | – | ||||
Settlement with MTS | 75 | – | – | |||||
Write-down of Bell Canada’s accounts receivable | – | – | (272 | ) | ||||
Write-off of deferred costs | – | – | (93 | ) | ||||
Pay equity settlement | – | – | (79 | ) | ||||
Other charges | (108 | ) | (14 | ) | (22 | ) | ||
Restructuring and other items | (1,224 | ) | (14 | ) | (768 | ) | ||
| 2004 Employee Departure Program – Bell Canada In2004, we recorded a pre-tax charge of$985million related to the employee departure program that Bell Canada announced in June 2004. The cost was included in the Other Bell Canada segment. The program consisted of two phases:
Almost all of the employees who chose to take advantage of the program left Bell Canada in2004. The rest will leave during2005. Employee Departure Program – Aliant Aliant recorded a pre-tax charge of$67million. Under the plan,693employees chose to receive a cash allowance. The program is expected to be completed by the end of2005. The table below provides a summary of the costs recognized in2004, as well as the corresponding liability at December 31,2004. | ||||||||
| BELL | CONSOLI- | |||||||
| CANADA | ALIANT | DATED | ||||||
| Employee departure program costs | 985 | 67 | 1,052 | |||||
| Less: | ||||||||
Cash payments | (194 | ) | – | (194 | ) | |||
Pension and other post- retirement benefits applied to: | ||||||||
Other long-term assets | (660 | ) | – | (660 | ) | |||
Other long-term liabilities | (11 | ) | – | (11 | ) | |||
Balance in accounts payable and accrued liabilities at December 31, 2004 | 120 | 67 | 187 | |||||
Provision for Contract Loss In2001, we entered into a contract with the Government of Alberta to build a next-generation network to bring high-speed Internet and broadband capabilities to rural communities in Alberta. Mechanical construction of the network was completed in December 2004. We identified cost overruns on the construction contract and recorded an additional provision of$128million in2004. Settlement with MTSOn May 20, 2004, Bell Canada filed a lawsuit against MTS after MTS announced it would purchase Allstream Inc. (Allstream). Bell Canada sought damages and an injunction that would prevent MTS from breaching the terms and conditions of the commercial agreements it had with Bell Canada. On June 3, 2004, Bell Canada also filed a lawsuit against Allstream seeking damages related to the same announcement.
| ||||||||
97 Bell Canada Enterprises 2004 Annual Report
| Notes to Consolidated Financial Statements
$75 million payment. We sold our interest in MTS in September 2004. See Note 5,Other Income, for more information.
During 2004, we recorded other pre-tax charges totalling $108 million. These costs consisted mostly of future lease costs for facilities that were no longer needed, asset write-downs and other provisions, net of a reversal of previously recorded restructuring charges that were no longer necessary because of the introduction of a new employee departure program. 2003 Restructuring of Xwave Solutions Inc. Aliant recorded a pre-tax restructuring charge of $15 million in 2003. This was a result of a restructuring plan at its subsidiary Xwave Solutions Inc. Costs associated with the restructuring include severance and related benefits, technology lease cancellation penalties and real estate rationalization costs. The restructuring was completed in 2004. Bell Canada ChargesIn 2003, Bell Canada recorded other charges of $65 million that related to various asset write-downs and other provisions. These charges were offset by a credit of $66 million relating to the reversal of the restructuring charges recorded in 2002, which were no longer necessary because fewer employees were terminated than expected. This was because of an increase in the number of employees being transferred to other positions within Bell Canada. 2002Restructuring and Other Charges at Bell Canada Bell Canada recorded a pre-tax charge of $302 million in 2002. This included restructuring charges of $232 million and other charges of $70 million. BCE Inc. recorded a pre-tax charge of $93 million in 2002. This represented a write-off of deferred costs relating to various convergence initiatives after it was determined that these costs would not be recovered. Pay Equity SettlementOn September 25, 2002, the members of the Canadian Telecommunications Employees’ Association (CTEA) ratified a settlement reached between the CTEA and Bell Canada relating to the 1994 pay equity complaints that the CTEA had filed on behalf of its members before the Canadian Human Rights Commission. The settlement included a cash payout of $128 million and related pension benefits of approximately $50 million. Write-down of Bell Canada’s Accounts Receivable At the same time it was developing its new billing system, Bell Canada adopted a new and more precise method for analyzing receivables by customer and by product. This method allows us to more accurately determine the validity of amounts that customers owe to Bell Canada. The analysis indicated that a write-down of accounts receivable of $272 million was appropriate. |
98 Bell Canada Enterprises 2004 Annual Report
| to 2002. It determined that these amounts were the cumulative result of a series of individually immaterial events and transactions relating to its legacy accounts receivable systems dating back to the early 1990s.
| ||||||||
| Note 5: Other Income
| ||||||||
| 2004 | 2003 | 2002 | ||||||
| Net gains on investments | 319 | 76 | 2,401 | |||||
| Interest income | 32 | 69 | 62 | |||||
| Foreign currency gains | 3 | 33 | 13 | |||||
| Other | 57 | (3 | ) | (68 | ) | |||
| Other income | 411 | 175 | 2,408 | |||||
Net gains on investments of $76 million in 2003 were mainly from:
Net gains on investments of $2,401 million in 2002 were mainly from:
In 2002, we completed our annual impairment test for goodwill for all of our reporting units. As a result, we recognized a charge of $765 million to pre-tax earnings relating to impaired goodwill of reporting units in Bell Globemedia ($715 million) and Aliant ($50 million). In each case, the goodwill was written down to its estimated fair value, which was determined based on estimates of discounted future cash flows and confirmed by market-related values. | ||||||||
| Note 7: Interest Expense
| ||||||||
| 2004 | 2003 | 2002 | ||||||
| Interest expense on long-term debt | (960 | ) | (1,035 | ) | (1,000 | ) | ||
| Interest expense on other debt | (45 | ) | (70 | ) | (120 | ) | ||
| Total interest expense | (1,005 | ) | (1,105 | ) | (1,120 | ) | ||
The table below is a reconciliation of income tax expense at Canadian statutory rates of 34.3% in 2004, 35.4% in 2003 and 37.4% in 2002, and the amount of reported income tax expense in the statements of operations.
| ||||||||
| 2004 | 2003 | 2002 | ||||||
| Income taxes computed at statutory rates | 817 | 1,130 | 1,551 | |||||
| Net gains on investments | (120 | ) | (28 | ) | (299 | ) | ||
| Large corporations tax | 37 | 46 | 28 | |||||
| Goodwill impairment | – | – | 289 | |||||
| Other | (24 | ) | (29 | ) | 45 | |||
| Total income tax expense | 710 | 1,119 | 1,614 | |||||
99 Bell Canada Enterprises 2004 Annual Report
|
Emergis provides e-business solutions to the financial services industry in North America and the health-care industry in Canada. It automates transactions between companies and allows them to interact and transact electronically. Before Emergis sold its Security business it also provided organizations with the related security services. Before Emergis sold its US Health operations, it also operated cost containment networks that process medical claims for health-care payers, including insurance companies and self-insured entities. | Notes to Consolidated Financial Statements
The table below shows the significant components of income tax expense relating to earnings from continuing operations.
| |||||||
| 2004 | 2003 | 2002 | ||||||
| Current income taxes | 744 | 701 | 1,051 | |||||
| Future income taxes | ||||||||
Utilization (recognition) of loss carryforwards | 38 | 404 | (259 | ) | ||||
Change in statutory rate | 2 | 21 | (16 | ) | ||||
Change in temporary differences and other | (74 | ) | (7 | ) | 838 | |||
| Total income tax expense | 710 | 1,119 | 1,614 | |||||
The table below shows future income taxes resulting from temporary differences between the carrying amounts of assets and liabilities for accounting purposes and the amounts used for tax purposes, as well as tax loss carryforwards. | ||||||||
| 2004 | 2003 | |||||
| Non-capital loss carryforwards | 826 | 467 | ||||
| Capital loss carryforwards | 23 | 22 | ||||
| Capital assets | (348 | ) | (176 | ) | ||
| Indefinite-life intangible assets | (339 | ) | (363 | ) | ||
| Employee benefit plans | 91 | (148 | ) | |||
| Investment tax credits carryforwards | 126 | – | ||||
| Investments | 49 | 46 | ||||
| Other | (878 | ) | (754 | ) | ||
| Total future income taxes | (450 | ) | (906 | ) | ||
| Future income taxes are comprised of: | ||||||
Future income tax asset – current portion | 489 | 197 | ||||
Future income tax asset – long-term portion | 772 | 704 | ||||
Future income tax liability – current portion | (16 | ) | (13 | ) | ||
Future income tax liability – long-term portion | (1,695 | ) | (1,794 | ) | ||
| Total future income taxes | (450 | ) | (906 | ) | ||
At December 31, 2004, BCE had $4,225 million in capital loss carryforwards, which can be carried forward indefinitely. We:
|
| Note 9: Discontinued Operations
| ||||||||
| 2004 | 2003 | 2002 | ||||||
| Emergis | 23 | (154 | ) | (55 | ) | |||
| Teleglobe Inc. (Teleglobe) | – | 39 | 893 | |||||
| Bell Canada International Inc. (BCI) | – | – | (316 | ) | ||||
| Aliant’s emerging | ||||||||
| business segment | – | (4 | ) | (20 | ) | |||
| Aliant’s remote | ||||||||
| communications segment | – | 63 | 34 | |||||
| Other | 3 | – | – | |||||
Net gain (loss) from discontinued operations | 26 | (56 | ) | 536 | ||||
The table below is a summarized statement of operations for the discontinued operations. | ||||||||
| 2004 | 2003 | 2002 | ||||||
| Revenue | 128 | 962 | 1,804 | |||||
Operating gain (loss) from discontinued operations, before tax | (52 | ) | 67 | (222 | ) | |||
Gain (loss) from discontinued operations, before tax | 70 | (70 | ) | (407 | ) | |||
Income tax recovery (expense) on operating loss (gain) | (11 | ) | (30 | ) | 85 | |||
Income tax recovery (expense) on loss (gain) | (3 | ) | 17 | 1,068 | ||||
Non-controlling interest | 22 | (40 | ) | 12 | ||||
| Net gain (loss) from | ||||||||
| discontinued operations | 26 | (56 | ) | 536 | ||||
Emergis In May 2004, our board of directors approved the sale of our 63.9% interest in Emergis. In June 2004, BCE completed the sale of its interest in Emergis by way of a secondary public offering. | ||||||||
100 Bell Canada Enterprises 2004 Annual Report
Teleglobe provided international voice and data telecommunications services. It also provided retail telecommunications services through its investment in the Excel Communications group until the second quarter of 2002. These services included long distance, paging and Internet services to residential and business customers in North America. BCI developed and operated communications companies in markets outside Canada. Its main focus was on Latin America until July 2002, when it sold its interest in Telecom Américas Ltd. BCI held most of its investments through Telecom Américas Ltd. Aliant’s emerging business segment consisted mainly of Aliant’s investments in iMagicTV Inc., Prexar LLC and AMI Offshore Inc. iMagicTV Inc. is a software development company that provides broadband TV software and solutions to service providers around the world. Prexar LLC is an Internet services provider. AMI Offshore Inc. provides process and systems control technical services, and contracts manufacturing solutions to offshore oil and gas and other industries. Aliant’s remote communications segment consisted of Aliant’s 53.2% investment in Stratos. Stratos offers Internet Protocol (IP), data and voice access services through a range of newly emerging and established technologies, including satellite and microwave, to customers in remote locations.
| In June 2004, Bell Canada paid $49 million to Emergis for:
These transactions were recorded on a net basis. The net proceeds from the sale of Emergis were $285 million (net of $22 million of selling costs and a $49 million consideration given to Emergis). The gain on the transaction was $58 million. Effective April 24, 2002, we started presenting the financial results of Teleglobe as discontinued operations. They were previously presented as a separate segment.
Effective January 1, 2002, we started presenting the financial results of BCI as discontinued operations. They were previously presented in the BCE Ventures segment. Effective June 30, 2002, we stopped consolidating BCI’s financial results and started accounting for our investment in BCI at cost. We recorded a charge of $316 million in 2002, which represented a writedown of the investment to our estimate of its net realizable value. BCI will be liquidated once all of its assets have been disposed of and all claims against it have been determined. A final distribution will be made to BCI’s creditors and shareholders with the approval of the court. BCI is publicly traded. BCE Inc. owns a 62.2% interest in BCI. Aliant’s Emerging Business Segment Effective May 2003, we started presenting the financial results of Aliant’s emerging business segment as discontinued operations. They were previously presented in the Bell Canada segment. Aliant’s Remote Communications Segment Effective December 2003, we started presenting the financial results of Aliant’s remote communications segment as discontinued operations. They were previously presented in the Bell Canada segment. | |
101 Bell Canada Enterprises 2004 Annual Report
| Notes to Consolidated Financial Statements
In December 2003, Aliant completed the sale of Stratos, after receiving the required regulatory approvals. Aliant received $340 million ($320 million net of selling costs) in cash for the sale. The transaction resulted in a gain on sale of $105 million ($48 million after taxes and non-controlling interest). The table below is a reconciliation of the numerator and the denominator used in the calculation of basic and diluted earnings per common share from continuing operations. | ||||||||
| 2004 | 2003 | 2002 | ||||||
Earnings from continuing operations (numerator) | ||||||||
Earnings from continuing operations | 1,498 | 1,871 | 1,871 | |||||
Dividends on preferred shares | (70 | ) | (64 | ) | (59 | ) | ||
Premium on redemption of preferred shares | – | (7 | ) | (6 | ) | |||
Earnings from continuing operations – basic | 1,428 | 1,800 | 1,806 | |||||
Assumed exercise of put options by CGI shareholders(1) | – | – | 12 | |||||
Earnings from continuing operations – diluted | 1,428 | 1,800 | 1,818 | |||||
Weighted average number of common shares outstanding (denominator)(in millions) | ||||||||
Weighted average number of common shares outstanding – basic | 924.6 | 920.3 | 847.9 | |||||
Assumed exercise of stock options(2) | 0.6 | 1.6 | 2.0 | |||||
Assumed exercise of put options by CGI shareholders(1) | – | – | 13.0 | |||||
Weighted average number of common shares outstanding – diluted | 925.2 | 921.9 | 862.9 | |||||
| (1) On July 24, 2003, BCE and CGI signed a new shareholder agreement. As a result, the put options were cancelled. (2) The calculation of the assumed exercise of stock options includes the effect of the average unrecognized future compensation cost of dilutive options. It does not include anti-dilutive options. These are options that would not be exercised because their exercise price is higher than the average market value of a BCE Inc. common share for each of the periods shown in the table. Including them would cause our diluted earnings per share to be overstated. The number of excluded options was 26,693,305 in 2004, 22,176,302 in 2003 and 20,770,155 in 2002.
| ||||||||
| Note 11: Accounts Receivable
| ||||||
| 2004 | 2003 | |||||
| Trade accounts receivable | 2,165 | 2,119 | ||||
| Other accounts receivable | 98 | 170 | ||||
| Allowance for doubtful accounts | (144 | ) | (228 | ) | ||
| 2,119 | 2,061 | |||||
Bell Canada sold an interest in a pool of accounts receivable to a securitization trust for a total of $1 billion in cash at December 31, 2004 ($900 million at December 31, 2003), under a revolving sales agreement that came into effect on December 12, 2001. The agreement expires on December 12, 2006. Bell Canada had a retained interest of $133 million in the pool of accounts receivable at December 31, 2004 ($128 million at December 31, 2003), which equals the amount of overcollateralization in the receivables it sold. | ||||||
102 Bell Canada Enterprises 2004 Annual Report
In 2004, we recognized a pre-tax loss of $26 million on the revolving sale of accounts receivable for the combined securitizations, compared to a pre-tax loss of $33 million in 2003. | ||||||||
| RANGE | 2004 | 2003 | ||||||
Securitized interest in accounts receivable | 1,125 | 1,030 | ||||||
Retained interest | 176 | 157 | ||||||
Servicing liability | 1.3 | 1.4 | ||||||
Average accounts receivable managed | 1,323 | 1,265 | ||||||
Assumptions: | ||||||||
Cost of funds | 2.25%–3.05 | % | 2.55 | % | 3.22 | % | ||
Average delinquency ratio | 7.61%–8.24 | % | 8.24 | % | 7.58 | % | ||
Average net credit loss ratio | 0.91%–1.07 | % | 1.03 | % | 0.95 | % | ||
Weighted average life (days) | 32–35 | 32 | 35 | |||||
Servicing fee liability | 2.00 | % | 2.00 | % | 2.00 | % | ||
| ||||||
| 2004 | 2003 | |||||
| Collections reinvested in revolving sales | 14,331 | 13,612 | ||||
| Increase (decrease) in sale proceeds | 95 | (5 | ) | |||
Note 12: Other Current Assets
| ||||||||
| NOTE | 2004 | 2003 | ||||||
| Future income taxes | 8 | 489 | 197 | |||||
| Inventory | 357 | 295 | ||||||
| Prepaid expenses | 256 | 195 | ||||||
| Other | 109 | 52 | ||||||
| 1,211 | 739 | |||||||
Note 13: Capital Assets
| |||||||||||||
| 2004 | 2003 | ||||||||||||
| ACCUMULATED | NET BOOK | ACCUMULATED | NET BOOK | ||||||||||
| COST | AMORTIZATION | VALUE | COST | AMORTIZATION | VALUE | ||||||||
| Telecommunications assets | |||||||||||||
Inside plant | 20,066 | 13,836 | 6,230 | 20,234 | 13,588 | 6,646 | |||||||
Outside plant | 12,627 | 8,008 | 4,619 | 12,221 | 7,658 | 4,563 | |||||||
Station equipment | 2,788 | 1,625 | 1,163 | 2,759 | 1,526 | 1,233 | |||||||
| Machinery and equipment | 5,529 | 3,039 | 2,490 | 5,179 | 2,790 | 2,389 | |||||||
| Buildings | 2,682 | 1,384 | 1,298 | 2,551 | 1,308 | 1,243 | |||||||
| Plant under construction | 1,605 | – | 1,605 | 1,372 | – | 1,372 | |||||||
| Satellites | 1,769 | 758 | 1,011 | 1,376 | 704 | 672 | |||||||
| Land | 95 | – | 95 | 96 | – | 96 | |||||||
| Other | 278 | 97 | 181 | 506 | 225 | 281 | |||||||
Total property, plant and equipment | 47,439 | 28,747 | 18,692 | 46,294 | 27,799 | 18,495 | |||||||
Finite-life intangible assets | |||||||||||||
Software | 3,242 | 1,295 | 1,947 | 2,934 | 1,063 | 1,871 | |||||||
Customer relationships | 603 | 42 | 561 | 603 | 21 | 582 | |||||||
Other | 279 | 81 | 198 | 224 | 58 | 166 | |||||||
| Total capital assets | 51,563 | 30,165 | 21,398 | 50,055 | 28,941 | 21,114 | |||||||
103 Bell Canada Enterprises 2004 Annual Report
| Notes to Consolidated Financial Statements
The cost of assets under capital leases was $850 million at December 31, 2004 and $842 million at December 31, 2003. The net book value of these assets was $531 million at December 31, 2004, and $567 million at December 31, 2003.
|
| NOTES | 2004 | 2003 | ||||
Accrued benefit asset | 23 | 1,128 | 1,728 | ||||
Future income taxes | 8 | 772 | 704 | ||||
Investments at cost | 261 | 253 | |||||
Long-term notes and other receivables | 135 | 91 | |||||
Investments at equity | 110 | 496 | |||||
Deferred debt issuance costs | 82 | 92 | |||||
Deferred development costs | 8 | 11 | |||||
Other | 160 | 84 | |||||
| 2,656 | 3,459 | ||||||
Investments at equity include goodwill of $28 million at December 31, 2004, and $199 million at December 31, 2003. Amortization of deferred charges was $12 million in 2004, $14 million in 2003 and $39 million in 2002. | |||||||
Note 15: Indefinite-Life Intangible Assets
| |||||
| 2004 | 2003 | ||||
| Brand name | 1,986 | 1,986 | |||
| Spectrum licences | 778 | 778 | |||
| Television licences | 134 | 128 | |||
| Cable licences | 18 | 18 | |||
| Total | 2,916 | 2,910 | |||
| ||||||||||||||||
| OTHER | |||||||||||||||
| BELL | OTHER | CONSOLI- | |||||||||||||
| NOTE | CONSUMER | BUSINESS | ALIANT | CANADA | BCE | DATED | |||||||||
Balance – December 31, 2003 | 3,058 | 1,382 | 531 | 214 | 2,576 | 7,761 | ||||||||||
Additions | 3 | 4 | 451 | 31 | 75 | 166 | 727 | |||||||||
Disposals | – | – | – | – | (18 | ) | (18 | ) | ||||||||
Foreign exchange and other | – | – | – | – | (57 | ) | (57 | ) | ||||||||
Balance – December 31, 2004 | 3,062 | 1,833 | 562 | 289 | 2,667 | 8,413 | ||||||||||
Note 17: Debt Due Within One Year
| |||||||||||
| WEIGHTED | WEIGHTED | ||||||||||
| AVERAGE | AVERAGE | ||||||||||
| NOTE | INTEREST RATE | MATURITY | 2004 | 2003 | |||||||
| Bank advances | 2.58 | % | N/A | 18 | 24 | ||||||
| Notes payable | 2.45 | % | 30 days | 137 | 4 | ||||||
| BCE Inc. Series P retractable preferred shares | – | 351 | |||||||||
| Long-term debt due within one year | 18 | 1,121 | 1,140 | ||||||||
| Total debt due within one year | 1,276 | 1,519 | |||||||||
| N/A: Not applicable. | |||||||||||
104 Bell Canada Enterprises2004Annual Report
| Restrictions Some of the credit agreements:
We are in compliance with all conditions and restrictions.
| ||||||||||||
| WEIGHTED | |||||||||||
| AVERAGE | |||||||||||
| NOTE | INTEREST RATE | MATURITY | 2004 | 2003 | |||||||
BCE Inc. – Notes(a) | 6.86 | % | 2006–2009 | 2,000 | 2,000 | |||||||
Bell Canada | ||||||||||||
Debentures and notes(b) | 7.34 | % | 2005–2054 | 8,246 | 8,789 | |||||||
Subordinated debentures | 8.21 | % | 2026–2031 | 275 | 275 | |||||||
Capital leases(c) | 7.45 | % | 2006–2015 | 400 | 471 | |||||||
Other | 75 | 212 | ||||||||||
Total – Bell Canada | 8,996 | 9,747 | ||||||||||
Aliant | ||||||||||||
Debentures, notes and bonds(d) | 8.02 | % | 2005–2025 | 885 | 985 | |||||||
Other | 11 | 5 | ||||||||||
Total – Aliant | 896 | 990 | ||||||||||
Bell Globemedia | ||||||||||||
Revolving reducing term credit agreements(e) | 2.56 | % | 2006 | 40 | 60 | |||||||
Notes | 6.44 | % | 2009–2014 | 450 | 150 | |||||||
Total – Bell Globemedia | 490 | 210 | ||||||||||
Telesat – Notes and other | 8.11 | % | 2006–2009 | 289 | 347 | |||||||
Other | 146 | 86 | ||||||||||
Total debt | 12,817 | 13,380 | ||||||||||
Unamortized premium(f) | 113 | 141 | ||||||||||
Less: Amount due within one year | 17 | (1,121 | ) | (1,140 | ) | |||||||
Long-term debt | 11,809 | 12,381 | ||||||||||
(a) BCE Inc. All notes are unsecured. BCE Inc. has the option to redeem $1.7 billion in notes at any time. (b) Bell Canada (c) Bell Canada |
105 Bell Canada Enterprises 2004 Annual Report
| Notes to Consolidated Financial Statements
(d) Aliant (e) Bell Globemedia (f) Unamortized Premium Restrictions
We are in compliance with all conditions and restrictions.
|
| NOTES | 2004 | 2003 | |||||
| Future income taxes | 8 | 1,695 | 1,794 | ||||
| Accrued benefit liability | 23 | 1,519 | 1,383 | ||||
| Deferred revenue and gains on assets | 535 | 357 | |||||
| Deferred contract payments | 24 | 254 | 301 | ||||
| CRTC benefits packages | 80 | 130 | |||||
| Other | 849 | 740 | |||||
| Total other long-term liabilities | 4,932 | 4,705 | |||||
We use derivative instruments to manage our exposure to interest rate risk, foreign currency risk and changes in the price of BCE Inc. common shares. We do not use derivative instruments for speculative purposes. Since we do not trade actively in derivative instruments, we are not exposed to any significant liquidity risks relating to them.
We are exposed to credit risk if counterparties to our derivative instruments are unable to meet their obligations. We expect that they will be able to meet their obligations because we deal with institutions that have strong credit ratings and we regularly monitor our credit risk and credit exposure. |
106Bell Canada Enterprises2004Annual Report
Currency Exposures We use cross-currency swaps and forward contracts to hedge debt that is denominated in foreign currencies. We also use forward contracts to hedge foreign currency risk on anticipated transactions. Derivatives that qualify for hedge accounting, and the underlying hedged items, are marked to current rates. We use interest rate swaps to manage the mix of fixed and floating interest rates on our debt. We have entered into interest rate swaps with a notional amount of $195 million, maturing in 2006 and 2011, as follows:
We have also issued swaptions for the right to enter into interest rate swap transactions for a notional amount of $90 million. If exercised, these swaptions will involve the payment of fixed interest rates of 10.5% and 11.1% in exchange for the receipt of the three-month bankers’ acceptance floating rate from 2006 until maturity in 2013. Fair ValueFair value is the amount that willing parties would accept to exchange a financial instrument based on the current market for instruments with the same risk, principal and remaining maturity. We base fair values on estimates using present value and other valuation methods. |
2004 | 2003 | |||||||||
| CARRYING | FAIR | CARRYING | FAIR | |||||||
| VALUE | VALUE | VALUE | VALUE | |||||||
Investment in Nortel(1) | 54 | 59 | 57 | 77 | ||||||
Long-term debt due within one year | 1,121 | 1,134 | 1,140 | 1,154 | ||||||
Long-term debt | 11,809 | 13,747 | 12.381 | 14,250 | ||||||
Derivative financial instruments, net asset (liability) position: | ||||||||||
Forward contracts – BCE Inc. shares | (37 | ) | (41 | ) | (37 | ) | (41 | ) | ||
Currency contracts(2) | (74 | ) | (97 | ) | (92 | ) | (97 | ) | ||
Interest rate swaps | (10 | ) | (29 | ) | (9 | ) | (25 | ) | ||
| (1) We have designated four million of our approximately 14 million Nortel common shares to manage our exposure to outstanding rights to SCPs. (2) Currency contracts include cross-currency interest rate swaps and foreign currency forward contracts. Some of the cross-currency interest rate swaps are economic hedges that do not qualify for hedge accounting. We carry these at fair value and all gains or losses are recorded in the statement of operations. | ||||||||||
107 Bell Canada Enterprises 2004 Annual Report
| Notes to Consolidated Financial Statements Preferred Shares BCE Inc.’s articles of amalgamation provide for an unlimited number of First Preferred Shares and Second Preferred Shares. The terms set out in the articles authorize BCE Inc.’s directors to issue the shares in oneor more Series and to set the number of shares and conditions for each series. |
NUMBER OF SHARES | STATED CAPITAL | |||||||||||||||||||
| SERIES | ANNUAL | CONVERT- IBLE INTO | CONVERSION DATE | REDEMPTION DATE | REDEMP- TION PRICE | AUTHORIZED | ISSUED | AT | ||||||||||||
| 2004 | 2003 | |||||||||||||||||||
| Q | floating | Series R | December 1, 2010 | At any time | $25.50 | 8,000,000 | – | – | – | |||||||||||
| R | $1.5435 | Series Q | December 1, 2005 | December 1, 2005 | $25.00 | 8,000,000 | 8,000,000 | 200 | 200 | |||||||||||
| S | floating | Series T | November 1, 2006 | At any time | $25.50 | 8,000,000 | 8,000,000 | 200 | 200 | |||||||||||
| T | fixed | Series S | November 1, 2011 | November 1, 2011 | $25.00 | 8,000,000 | – | – | – | |||||||||||
| Y | floating | Series Z | December 1, 2007 | At any time | $25.50 | 10,000,000 | 1,147,380 | 29 | 29 | |||||||||||
| Z | $1.3298 | Series Y | December 1, 2007 | December 1, 2007 | $25.00 | 10,000,000 | 8,852,620 | 221 | 221 | |||||||||||
| AA | $1.3625 | Series AB | September 1, 2007 | September 1, 2007 | $25.00 | 20,000,000 | 20,000,000 | 510 | 510 | |||||||||||
| AB | floating | Series AA | September 1, 2012 | At any time | $25.50 | 20,000,000 | – | – | – | |||||||||||
| AC | $1.3850 | Series AD | March 1, 2008 | March 1, 2008 | $25.00 | 20,000,000 | 20,000,000 | 510 | 510 | |||||||||||
| AD | floating | Series AC | March 1, 2013 | At any time | $25.50 | 20,000,000 | – | – | – | |||||||||||
| 1,670 | 1,670 | |||||||||||||||||||
Voting Rights All of the issued and outstanding preferred shares at December 31, 2004 were non-voting, except under special circumstances when the holders are entitled to one vote per share. Entitlement to DividendsHolders of Series R, Z, AA and AC shares are entitled to fixed cumulative quarterly dividends. The dividend rate on these shares is reset every five years, as set out in BCE Inc.’s articles of amalgamation. All of the issued and outstanding preferred shares at December 31, 2004 are convertible at the holder’s option into another associated Series of preferred shares on a one-for-one basis as per the terms set out in BCE Inc.’s articles of amalgamation. Redemption FeaturesBCE Inc. may redeem Series R, Z, AA and AC shares on the redemption date and every five years after that date. Common Shares and Class B Shares BCE Inc.’s articles of amalgamation provide for an unlimited number of voting common shares and non-voting Class B shares. The common shares and the Class B shares rank equally in the payment of dividends and in the distribution of assets if BCE Inc. is liquidated, dissolved or wound up, after payments due to the holders of preferred shares. | ||||||||||||||||||||
108 Bell Canada Enterprises 2004 Annual Report
| The table below provides details about the outstanding common shares of BCE Inc. No Class B shares were outstanding at December 31, 2004 and 2003. | ||||||||||
| 2004 | 2003 | |||||||||
| NUMBER | STATED | NUMBER | STATED | ||||||
| OF SHARES | CAPITAL | OF SHARES | CAPITAL | ||||||
Outstanding, beginning of year | 923,988,818 | 16,749 | 915,867,928 | 16,520 | ||||||
Shares issued: | ||||||||||
under employee savings plans | – | – | 4,951,199 | 145 | ||||||
under dividend reinvestment plan | – | – | 2,807,899 | 82 | ||||||
under employee stock option plans | 1,946,864 | 32 | 552,681 | 9 | ||||||
Shares purchased for cancellation | – | – | (190,889 | ) | (7 | ) | ||||
Outstanding, end of year | 925,935,682 | 16,781 | 923,988,818 | 16,749 | ||||||
Dividend Reinvestment Plan The dividend reinvestment plan allows eligible common shareholders to use their dividends to buy additional common shares. A trustee buys BCE Inc. common shares for the participants on the open market, by private purchase or from BCE Inc. (where the shares are issued from treasury). BCE Inc. chooses the method the trustee uses to buy the shares.
Employee Savings Plans (ESPs) ESPs are designed to encourage employees of BCE Inc. and its participating subsidiaries to own shares of BCE Inc. Each year, employees who participate in the plans can choose to have up to a certain percentage of their annual earnings withheld through regular payroll deductions to buy BCE Inc. common shares. In some cases, the employer may also contribute up to a maximum percentage of the employee’s annual earnings to the plan. Under BCE Inc.’s long-term incentive programs, BCE Inc. may grant options to key employees to buy BCE Inc. common shares. The subscription price is usually equal to the market value of the shares on the last trading day before the grant comes into effect. At December 31, 2004, 25,777,551 common shares were authorized for issue under these programs. |
109 Bell Canada Enterprises 2004 Annual Report
| Notes to Consolidated Financial Statements
Special vesting provisions may apply if:
When the Nortel common shares were distributed in May 2000, each outstanding BCE Inc. stock option was cancelled and replaced by two new stock options. The first option gives the holder the right to buy one BCE Inc. common share. The second option gives the holder the right to buy approximately 1.57 post-split common shares of Nortel (Nortel option) at exercise prices that maintain the holder’s economic position.
BCE Inc. may exercise all Nortel options that expire unexercised or are forfeited. The exercise price paid to Nortel is given back to BCE Inc. We credit an amount to retained earnings that is equal to the market share price of Nortel. The table below is a summary of the status of BCE Inc.’s stock option programs.
|
| 2004 | 2003 | 2002 | |||||||||||
WEIGHTED | WEIGHTED | WEIGHTED | |||||||||||
| AVERAGE | AVERAGE | AVERAGE | |||||||||||
| NUMBER | EXERCISE | NUMBER | EXERCISE | NUMBER | EXERCISE | ||||||||
| OF SHARES | PRICE ($ | ) | OF SHARES | PRICE ($ | ) | OF SHARES | PRICE ($) | ||||||
| Outstanding, January 1 | 25,750,720 | $32 | 24,737,423 | $34 | 28,732,342 | $36 | |||||||
| Granted | 5,911,576 | $30 | 6,008,051 | $28 | 8,051,159 | $32 | |||||||
| Exercised | (1,946,864 | ) | $16 | (552,681 | ) | $17 | (479,873 | ) | $14 | ||||
| Expired/forfeited | (1,233,753 | ) | $34 | (4,442,073 | ) | $35 | (11,566,205 | ) | $39 | ||||
| Outstanding, December 31 | 28,481,679 | $32 | 25,750,720 | $32 | 24,737,423 | $34 | |||||||
| Exercisable, December 31 | 14,633,433 | $34 | 10,722,294 | $33 | 10,735,043 | $35 | |||||||
The table below shows you more about BCE Inc.’s stock option programs at December 31, 2004. | |||||||||||
| OPTIONS OUTSTANDING | OPTIONS EXERCISABLE | ||||||||||
| WEIGHTED | WEIGHTED | WEIGHTED | |||||||||
| AVERAGE | AVERAGE | AVERAGE | |||||||||
| RANGE OF | REMAINING | EXERCISE | EXERCISE | ||||||||
EXERCISE PRICES | NUMBER | LIFE | PRICE ($) | NUMBER | PRICE ($) | ||||||
| Below $20 | 1,609,697 | 3 years | $14 | 1,609,697 | $14 | ||||||
| $20–$30 | 12,377,141 | 7 years | $29 | 2,052,600 | $28 | ||||||
| $30–$40 | 8,123,342 | 7 years | $34 | 5,419,524 | $34 | ||||||
| Over $40 | 6,371,499 | 6 years | $41 | 5,551,612 | $41 | ||||||
| 28,481,679 | $32 | 14,633,433 | $34 | ||||||||
110 Bell Canada Enterprises 2004 Annual Report
| Assumptions Used in Stock Option Pricing Model The table below shows the assumptions used to determine stock-based compensation expense, using the Black-Scholes option pricing model. | ||||||
| 2004 | 2003 | |||||
Compensation expense ($ millions) | 29 | 26 | ||||
Number of stock options granted | 5,911,576 | 6,008,051 | ||||
Weighted average fair value per option granted ($) | 4 | 6 | ||||
Weighted average assumptions: | ||||||
Dividend yield | 4.0 | % | 3.6 | % | ||
Expected volatility | 27 | % | 30 | % | ||
Risk-free interest rate | 3.1 | % | 4.0 | % | ||
Expected life (years) | 3.5 | 4.5 | ||||
Restricted Share Units (RSUs) In 2004, BCE Inc. granted RSUs to executives and other key employees. The value of an RSU is always equal to the value of one BCE Inc. common share. Dividends in the form of additional RSUs are credited to the participant’s account on each dividend payment date and are equivalent in value to the dividend paid on BCE Inc. common shares. Each executive is granted a specific number of RSUs for a given performance period, based on his or her position and level of contribution. At the end of each given performance period, RSUs will vest if performance objectives are met or will be forfeited. The table below is a summary of the status of RSUs. | ||||||
| NUMBER OF RSUS | ||||
| Outstanding, January 1, 2004 | – | |||
| Granted | 1,986,513 | |||
| Dividends credited | 61,086 | |||
| Expired/forfeited | (51,077 | ) | ||
| Outstanding, December 31, 2004 | 1,996,522 | |||
| Vested, December 31, 2004 | – | |||
Special Compensation Payments (SCPs) Before 2000, when BCE Inc. granted options to officers, vice-presidents and other key employees, related rights to SCPs were also often granted. SCPs are cash payments representing the amount that the market value of the shares on the date of exercise of the related options exceeds the exercise price of these options.
All of the outstanding SCPs cover the same number of shares as the options to which they relate. It is the employer’s responsibility to make the payments under the SCPs. There was income related to SCPs of $14 million in 2004, income of $29 million in 2003 and an expense of $1 million in 2002. The amounts include a recovery of SCP expense previously established at $14 million for 2004, $50 million for 2003, and $59 million for 2002, relating to forfeitures of SCPs. |
111 Bell Canada Enterprises 2004 Annual Report
| Notes to Consolidated Financial Statements
Note 23: Employee Benefit Plans We provide pension, other retirement and post-employment benefits for almost all of our employees. These include DB pension plans, plans that provide other employee future benefits and DC pension plans. Components of Accrued Benefit Asset (Liability) The table below shows the change in benefit obligations, change in fair value of plan assets and the funded status of the DB plans. | ||||||||||
| PENSION BENEFITS | OTHER BENEFITS | |||||||||
| 2004 | 2003 | 2004 | 2003 | |||||||
Accrued benefit obligation, beginning of year | 12,505 | 11,815 | 1,615 | 1,628 | ||||||
Current service cost | 228 | 217 | 31 | 31 | ||||||
Interest cost on accrued benefit obligation | 806 | 757 | 104 | 105 | ||||||
Actuarial (gains) losses | 772 | 513 | 102 | (52 | ) | |||||
Benefit payments | (725 | ) | (716 | ) | (81 | ) | (87 | ) | ||
Employee contributions | 8 | 6 | – | – | ||||||
Special termination costs (1) | 660 | (27 | ) | (12 | ) | – | ||||
Plan amendment(2) | 77 | 4 | 14 | 2 | ||||||
Divestitures and other(3) | 17 | (64 | ) | (1 | ) | (12 | ) | |||
| Accrued benefit obligation, end of year | 14,348 | 12,505 | 1,772 | 1,615 | ||||||
Fair value of plan assets, beginning of year | 12,569 | 11,587 | 133 | 125 | ||||||
Actual return on plan assets | 1,074 | 1,583 | 4 | 8 | ||||||
Benefit payments | (725 | ) | (716 | ) | (81 | ) | (87 | ) | ||
Employer contributions | 97 | 155 | 81 | 87 | ||||||
Employee contributions | 8 | 6 | – | – | ||||||
Divestitures and other(3) | 7 | (46 | ) | – | – | |||||
Fair value of plan assets, end of year | 13,030 | 12,569 | 137 | 133 | ||||||
Plan surplus (deficit) | (1,318 | ) | 64 | (1,635 | ) | (1,482 | ) | |||
Unamortized net actuarial (gains) losses | 2,304 | 1,682 | 47 | (58 | ) | |||||
Unamortized past service costs | 129 | 71 | 17 | 2 | ||||||
Unamortized transitional (asset) obligation | (35 | ) | (80 | ) | 227 | 270 | ||||
Valuation allowance | (127 | ) | (124 | ) | – | – | ||||
Accrued benefit asset (liability), end of year | 953 | 1,613 | (1,344 | ) | (1,268 | ) | ||||
Accrued benefit asset included in other long-term assets | 1,128 | 1,728 | – | – | ||||||
Accrued benefit liability included in other long-term liabilities | (175 | ) | (115 | ) | (1,344 | ) | (1,268 | ) | ||
(1) Costs in 2004 relate to the employee departure programs announced at Bell Canada. See Note 4,Restructuring and Other Items, for more information.
For DB pension plans with an accrued benefit obligation that was less than plan assets:
| ||||||||||
112 Bell Canada Enterprises 2004 Annual Report
| Components of Net Benefit Plans Cost (Credit) The table below shows the net benefit plans cost (credit) before and after recognizing its long-term nature. The recognized net benefit plan cost (credit) reflects the amount reported in our statement of operations and is calculated according to our accounting policy.
| ||||||||||||||
| . | PENSION BENEFITS | OTHER BENEFITS | ||||||||||||
FOR THE YEAR ENDED DECEMBER 31 | 2004 | 2003 | 2002 | 2004 | 2003 | 2002 | ||||||||
Current service cost | 243 | 222 | 223 | 31 | 31 | 35 | ||||||||
Interest cost on accrued benefit obligation | 806 | 757 | 749 | 104 | 105 | 94 | ||||||||
Actual (return) loss on plan assets | (1,074 | ) | (1,583 | ) | 854 | (4 | ) | (8 | ) | (1 | ) | |||
Past service costs arising during period | 77 | 4 | 50 | 14 | 2 | – | ||||||||
Actuarial loss (gain) on accrued benefit obligation | 772 | 513 | (19 | ) | 102 | (52 | ) | 173 | ||||||
Elements of employee future benefit plans cost (credit), before recognizing its long-term nature | 824 | (87 | ) | 1,857 | 247 | 78 | 301 | |||||||
Excess (deficiency) of actual return over expected return(1) | 121 | 648 | (1,981 | ) | (6 | ) | (1 | ) | (10 | ) | ||||
Deferral of amounts arising during period: | ||||||||||||||
Past service costs | (77 | ) | (4 | ) | (50 | ) | (14 | ) | (2 | ) | – | |||
Actuarial (loss) gain on accrued benefit obligation | (772 | ) | (513 | ) | 19 | (102 | ) | 52 | (173 | ) | ||||
Amortization of previously deferred amounts: | ||||||||||||||
Past service costs | 10 | 9 | 6 | – | – | – | ||||||||
Net actuarial losses | 33 | 23 | 1 | 1 | – | – | ||||||||
Transitional (asset) obligation | (44 | ) | (44 | ) | (56 | ) | 30 | 30 | 39 | |||||
Adjustments to recognize long-term nature of employee future benefit plans cost (credit) | (729 | ) | 119 | (2,061 | ) | (91 | ) | 79 | (144 | ) | ||||
Increase (decrease) in valuation allowance | 3 | (12 | ) | 14 | – | – | – | |||||||
Other | 2 | (2 | ) | – | – | – | – | |||||||
Net benefit plans cost (credit), recognized | 100 | 18 | (190 | ) | 156 | 157 | 157 | |||||||
Comprised of: | ||||||||||||||
Defined benefit plans cost | 85 | 13 | (190 | ) | 156 | 157 | 157 | |||||||
Defined contribution plans cost | 15 | 5 | – | – | – | – | ||||||||
(1) The expected return on plan assets for a given year is calculated based on the market-related value of plan assets as at the beginning of that year. The market-related value of pension plan assets was $13,044 million at January 1, 2004, $12,542 million at January 1, 2003, and $13,922 million at January 1, 2002. | ||||||||||||||
We used the following key assumptions to measure the accrued benefit obligation and the net benefit plans cost (credit) for the DB pension plans and plans that provide other employee future benefits. These assumptions are long-term, which is consistent with the nature of employee benefit plans.
| ||||||||||||||
| PENSION BENEFITS | OTHER BENEFITS | |||||||||||||
| 2004 | 2003 | 2002 | 2004 | 2003 | 2002 | |||||||||
At December 31 | ||||||||||||||
Accrued benefit obligation: | ||||||||||||||
Discount rate, end of year | 6.2 | % | 6.5 | % | 6.5 | % | 6.2 | % | 6.5 | % | 6.5 | % | ||
Rate of compensation increase, end of year | 3.5 | % | 3.5 | % | 3.5 | % | 3.5 | % | 3.5 | % | 3.5 | % | ||
For the year ended December 31 | ||||||||||||||
Net benefit plans cost (credit): | ||||||||||||||
Discount rate, end of preceding year | 6.5 | % | 6.5 | % | 6.5 | % | 6.5 | % | 6.5 | % | 6.5 | % | ||
Expected return on plan assets, end of preceding year | 7.5 | % | 7.5 | % | 8.3 | % | 7.5 | % | 7.5 | % | 8.3 | % | ||
Rate of compensation increase, end of preceding year | 3.5 | % | 3.5 | % | 3.5 | % | 3.5 | % | 3.5 | % | 3.5 | % | ||
113 Bell Canada Enterprises 2004 Annual Report
| Notes to Consolidated Financial Statements
We assumed the following trend rates in health-care costs:
Assumed trend rates in health-care costs have a significant effect on the amounts reported for the health-care plans. The table below, for example, shows the effect of a 1% change in the assumed trend rates in health-care costs.
|
| 1% INCREASE | 1% DECREASE | |||||
Effect on other benefits – total service and interest cost | 16 | (13 | ) | |||
Effect on other benefits – accrued obligation | 156 | (137 | ) | |||
Pension Plan Assets The investment strategy for the major benefit plans is to maintain a diversified portfolio of assets, invested in a prudent manner to maintain the security of funds while maximizing returns within our guidelines. | ||||||
| WEIGHTED | ||||||||||
| WEIGHTED | PERCENTAGE | AVERAGE | ||||||||
| AVERAGE | OF PLAN | EXPECTED | ||||||||
| TARGET | ASSETS AT | LONG-TERM | ||||||||
| ALLOCATION | DECEMBER 31 | RATE OF RETURN | ||||||||
| ASSET CATEGORY | 2004 | 2004 | 2003 | 2004 | ||||||
| Equity securities | 45%–65 | % | 57 | % | 56 | % | 9.0 | % | ||
| Debt securities | 35%–55 | % | 43 | % | 44 | % | 5.5 | % | ||
| Total/Average | 100 | % | 100 | % | 7.5 | % | ||||
Equity securities included approximately $95 million of BCE Inc. common shares or 0.7% of total plan assets at December 31, 2004, and approximately $111 million of BCE Inc. common shares or 0.9% of total plan assets at December 31, 2003. Debt securities included approximately $8 million of BCE Inc. and affiliates’ debentures or 0.1% of total plan assets at December 31, 2004, and $108 million or 0.9% of total plan assets at December 31, 2003. Projected Cash Flows We are responsible for adequately funding our DB pension plans. We make contributions to them based on various actuarial cost methods that are permitted by pension regulatory bodies. Contributions reflect actuarial assumptions about future investment returns, salary projections and future service benefits. The table below shows the amounts we contributed to the DB and DC pension plans and the payments made to beneficiaries under other employee benefit plans. |
PENSION BENEFITS | OTHER BENEFITS | ||||||||||||
| 2004 | 2003 | 2002 | 2004 | 2003 | 2002 | |||||||
Aliant | 67 | 125 | 9 | 4 | 4 | 3 | |||||||
Bell Canada | 20 | 17 | 4 | 77 | 83 | 73 | |||||||
Bell Globemedia | 17 | 11 | 3 | – | – | – | |||||||
BCE Inc. | 8 | 7 | 5 | – | – | – | |||||||
Total | 112 | 160 | 21 | 81 | 87 | 76 | |||||||
Comprised of: | |||||||||||||
Contributions to DB plans | 97 | 155 | 21 | 81 | 87 | 76 | |||||||
Contributions to DC plans | 15 | 5 | – | – | – | – | |||||||
114 Bell Canada Enterprises 2004 Annual Report
We expect to contribute approximately $200 million to the DB pension plans in 2005, subject to actuarial valuations being completed. We expect to pay $93 million to beneficiaries under other employee benefit plans in 2005. We expect to contribute $24 million to the DC pension plans in 2005. Estimated Future Benefit Payments The table below shows the estimated future benefit payments for the next 10 years as at December 31, 2004.
| |||||
| PENSION | OTHER | ||||
| BENEFITS | BENEFITS | ||||
2005 | 847 | 93 | |||
2006 | 867 | 99 | |||
2007 | 886 | 105 | |||
2008 | 904 | 112 | |||
2009 | 923 | 120 | |||
2010–2014 | 4,878 | 722 | |||
Total estimated future benefit payments | 9,305 | 1,251 | |||
Note 24: Commitments and Contingencies Contractual Obligations The table below is a summary of our contractual obligations at December 31,2004that are due in each of the next five years and after2009. | |||||
| AFTER | |||||||||||||||
| 2005 | 2006 | 2007 | 2008 | 2009 | 2009 | TOTAL | |||||||||
Long-term debt (excluding capital leases) | 1,018 | 989 | 1,726 | 1,091 | 1,701 | 6,000 | 12,525 | ||||||||
Notes payable and bank advances | 155 | – | – | – | – | – | 155 | ||||||||
Capital leases | 103 | 70 | 59 | 47 | 31 | 95 | 405 | ||||||||
Operating leases | 399 | 296 | 258 | 232 | 209 | 1,459 | 2,853 | ||||||||
Commitments for capital expenditures | 210 | 121 | 45 | 2 | 2 | 28 | 408 | ||||||||
Other purchase obligations | 576 | 375 | 231 | 184 | 175 | 401 | 1,942 | ||||||||
Other long-term liabilities (including current portion) | 97 | 86 | 91 | 79 | 78 | – | 431 | ||||||||
| Total | 2,558 | 1,937 | 2,410 | 1,635 | 2,196 | 7,983 | 18,719 | ||||||||
At December 31, 2004, we had other long-term liabilities that are not included in the table. They consisted of an accrued employee benefit liability, future income tax liabilities, deferred revenue and gains on assets, and various other long-term liabilities.
|
115 Bell Canada Enterprises 2004 Annual Report
| Notes to Consolidated Financial Statements
We did not include deferred revenue and gains on assets because they do not represent future cash payments. Commitment under the Deferral Account The deferral account is a mechanism resulting from the CRTC’s second price cap decision of May 2002, which requires us to fund initiatives such as service improvements, reduced customer rates and/or customer rebates. We estimate our commitment under the deferral account to be approximately $202 million at December 31, 2004. We expect to clear most of this amount in 2005 by implementing various initiatives. LitigationTeleglobe Lending Syndicate Lawsuit On July 12, 2002, some members of the Teleglobe and Teleglobe Holdings (U.S.) Corporation lending syndicate (the plaintiffs) filed a lawsuit against BCE Inc. in the Ontario Superior Court of Justice. The claim makes several allegations, including that BCE Inc. and its management, in effect, made a legal commitment to repay the advances the plaintiffs made as members of the lending syndicate, and that the court should disregard Teleglobe as a corporate entity and hold BCE Inc. responsible to repay the advances as Teleglobe’s alter ego. On November 2, 2004, Canadian Imperial Bank of Commerce and Canadian Imperial Bank of Commerce, N.Y. Agency withdrew from the lawsuit. In February 2003, a lawsuit was filed in the Ontario Superior Court of Justice by Kroll Restructuring Ltd., in its capacity as interim receiver of Teleglobe, against five former directors of Teleglobe. This lawsuit was filed in connection with Teleglobe’s redemption of its third series preferred shares in April 2001 and the retraction of its fifth series preferred shares in March 2001. Teleglobe Unsecured Creditors Lawsuit On May 26, 2004, a lawsuit was filed in the United States Bankruptcy Court for the District of Delaware. The United States District Court for the District of Delaware subsequently withdrew the reference from the Bankruptcy Court and the matter is now pending in the District Court for the District of Delaware. The lawsuit is against BCE Inc. and 10 former directors and officers of Teleglobe and certain of its subsidiaries. The plaintiffs are comprised of Teleglobe Communications Corporation, certain of its affiliated debtors and debtors in possession, and the Official Committee of Unsecured Creditors of these debtors. The lawsuit alleges breach of an alleged funding commitment of BCE Inc. towards the debtors, promissory estoppel, misrepresentation by BCE Inc. and breach and aiding and abetting breaches of fiduciary duty by the defendants. The plaintiffs seek an unspecified amount of damages against the defendants. |
116 Bell Canada Enterprises 2004 Annual Report
Other Litigation We become involved in various other claims and litigation as a part of our business. While we cannot predict the final outcome of claims and litigation that were pending at December 31, 2004, based on information currently available, management believes that the resolution of these claims and litigation will not have a material and negative effect on our consolidated financial position or results of operations. Note 25: Guarantees As a regular part of our business, we enter into agreements that provide for indemnifications and guarantees to counterparties that may require us to pay for costs and losses incurred in various types of transactions. We cannot reasonably estimate the maximum potential amount we could be required to pay counterparties. While some of the agreements specify a maximum potential exposure, many do not specify a maximum amount or limited period. The amount also depends on the outcome of future events and conditions, which cannot be predicted. Historically, we have not made any significant payments under these indemnifications or guarantees. Sales of Assets and Businesses In transactions involving business dispositions and sales of assets, we may be required to pay counterparties for costs and losses incurred as a result of various events. These could include:
Some of the agreements specify a maximum potential exposure of $2 billion, but many do not specify a maximum amount or limited period. A total of $18 million has been accrued in the consolidated balance sheet relating to this type of indemnification or guarantee at December 31, 2004. Sales of ServicesIn transactions involving sales of services, we may be required to pay counterparties for costs and losses incurred as a result of:
Some of the agreements specify a maximum potential exposure of $305 million, but many do not specify a maximum amount or limited period. No amount has been accrued in the consolidated balance sheet relating to this type of indemnification or guarantee at December 31, 2004. Purchases and Development of Assets In transactions involving purchases and development of assets, we may be required to pay counterparties for costs and losses incurred as a result of breaches of:
Some of the agreements specify a maximum potential exposure of $1.5 billion, but many do not specify a maximum amount or limited period. No amount has been accrued in the consolidated balance sheet relating to this type of indemnification or guarantee at December 31, 2004. Other Transactions As part of other transactions, such as securitization agreements and operating leases, we may be required to pay counterparties for costs and losses incurred as a result of:
|
117 Bell Canada Enterprises 2004 Annual Report
| Notes to Consolidated Financial Statements
Some of the agreements specify a maximum potential exposure of $26 million, but many do not specify a maximum amount or limited period. No amount has been accrued in the consolidated balance sheet relating to this type of indemnification or guarantee at December 31, 2004.
| |||||||
| 2004 | 2003 | 2002 | |||||
| Interest paid on long-term debt | 987 | 1,109 | 1,019 | ||||
| Income taxes paid (net of refunds) | 216 | (24 | ) | 1,284 | |||
We have prepared these consolidated financial statements according to Canadian GAAP. The tables below are a reconciliation of significant differences relating to the statement of operations and total shareholders’ equity reported according to Canadian GAAP and United States GAAP. Reconciliation of Net Earnings (Loss) | ||||||||
| 2004 | 2003 | 2002 | ||||||
Canadian GAAP – Earnings from continuing operations | 1,498 | 1,871 | 1,871 | |||||
Adjustments: | ||||||||
Deferred costs(a) | 7 | (2 | ) | 18 | ||||
Employee future benefits(b) | (75 | ) | (132 | ) | (14 | ) | ||
Derivative instruments(j) | – | (12 | ) | 15 | ||||
Other | 1 | (8 | ) | 2 | ||||
United States GAAP – Earnings from continuing operations | 1,431 | 1,717 | 1,892 | |||||
Discontinued operations – United States GAAP(g) | 84 | (56 | ) | 727 | ||||
Cumulative effect of change in accounting policy(k) | – | (25 | ) | (7,268 | ) | |||
United States GAAP – Net earnings (loss) before extraordinary gain | 1,515 | 1,636 | (4,649 | ) | ||||
Extraordinary gain | 69 | – | – | |||||
United States GAAP – Net earnings (loss) | 1,584 | 1,636 | (4,649 | ) | ||||
Dividends on preferred shares(j) | (85 | ) | (70 | ) | (59 | ) | ||
Premium on redemption of preferred shares | – | (7 | ) | (6 | ) | |||
United States GAAP – Net earnings (loss) applicable to common shares | 1,499 | 1,559 | (4,714 | ) | ||||
Other comprehensive earnings (loss) items | ||||||||
Change in currency translation adjustment | (10 | ) | (56 | ) | 30 | |||
Change in unrealized gain (loss) on investments(h) | (12 | ) | 17 | 9 | ||||
Additional minimum liability for pension obligation(b) | (72 | ) | (40 | ) | (81 | ) | ||
Comprehensive earnings (loss) | 1,405 | 1,480 | (4,756 | ) | ||||
Net earnings (loss) per common share – basic | ||||||||
Continuing operations | 1.46 | 1.78 | 2.14 | |||||
Discontinued operations and change in accounting policy | 0.09 | (0.09 | ) | (8.23 | ) | |||
Extraordinary gain | 0.07 | – | – | |||||
Net earnings (loss) | 1.62 | 1.69 | (6.09 | ) | ||||
Net earnings (loss) per common share – diluted | ||||||||
Continuing operations | 1.46 | 1.78 | 2.11 | |||||
Discontinued operations and change in accounting policy | 0.09 | (0.09 | ) | (8.23 | ) | |||
Extraordinary gain | 0.07 | – | – | |||||
Net earnings (loss) | 1.62 | 1.69 | (6.12 | ) | ||||
Dividends per common share | 1.20 | 1.20 | 1.20 | |||||
Average number of common shares outstanding (millions) | 924.6 | 920.3 | 847.9 | |||||
118 Bell Canada Enterprises 2004 Annual Report
| Statements of Accumulated Other Comprehensive Loss
| ||||||||
| 2004 | 2003 | 2002 | ||||||
| Currency translation adjustment | (56 | ) | (46 | ) | 10 | |||
| Unrealized gain (loss) on investments(h) | 4 | 16 | (1 | ) | ||||
| Additional minimum liability for pensions(b) | (193 | ) | (121 | ) | (81 | ) | ||
Accumulated other comprehensive loss | (245 | ) | (151 | ) | (72 | ) | ||
| Reconciliation of Total Shareholders’ Equity | ||||||||
| 2004 | 2003 | 2002 | ||||||
| Canadian GAAP | 14,032 | 13,573 | 12,608 | |||||
| Adjustments | ||||||||
Deferred costs(a) | (67 | ) | (77 | ) | (78 | ) | ||
Employee future benefits(b) | (543 | ) | (260 | ) | 17 | |||
Gain on disposal of investments and on reduction of ownership in subsidiary companies(c) | 163 | 163 | 163 | |||||
Other | 114 | 132 | 172 | |||||
Tax effect of the above adjustments(e) | 81 | (16 | ) | (124 | ) | |||
Non-controlling interest effect of the above adjustments(f) | 95 | 55 | 47 | |||||
Discontinued operations(g) | – | (58 | ) | (58 | ) | |||
Unrealized gain (loss) on investments(h) | 4 | 16 | (1 | ) | ||||
| United States GAAP | 13,879 | 13,528 | 12,746 | |||||
Under Canadian GAAP, certain expenses can be deferred and amortized if they meet certain criteria. Under United States GAAP, these costs are expensed as incurred. (b) Employee Future BenefitsThe accounting for future benefits for employees under Canadian GAAP and United States GAAP is essentially the same, except for the recognition of certain unrealized gains and losses. (c) Gains or Losses on Investments Under Canadian GAAP and United States GAAP, gains or losses on investments are calculated in a similar manner. Differences in Canadian GAAP and United States GAAP, however, may cause the underlying carrying value of the investment to be different. This will cause the resulting gain or loss to be different. (d) Equity Income Under Canadian GAAP, we account for our joint venture investment in CGI using the proportionate consolidation method. Effective July 2003, as a result of the new agreement with CGI, we present CGI as an equity investment under United States GAAP. There is no impact on net earnings.
|
119 Bell Canada Enterprises 2004 Annual Report
| Notes to Consolidated Financial Statements
(e) Income Taxes The income tax adjustment represents the impact the United States GAAP adjustments that we describe above have on income taxes. The accounting for income taxes under Canadian GAAP and United States GAAP is essentially the same, except that:
The non-controlling interest adjustment represents the impact the United States GAAP adjustments that we describe above have on non-controlling interest. (g) Discontinued OperationsDifferences between Canadian GAAP and United States GAAP will cause the historical carrying values of the net assets of discontinued operations to be different. (h) Change in Unrealized Gain (Loss) on Investments Our portfolio investments are recorded at cost under Canadian GAAP. They would be classified as available-for-sale under United States GAAP and would be carried at fair value, with any unrealized gains or losses included in other comprehensive loss, net of tax. (i) Accounting for Stock-Based Compensation In December 2002, the Financial Accounting Standards Board (FASB) issued Statement of Financial Accounting Standards (SFAS) No. 148,Accounting for Stock-Based Compensation – Transition and Disclosure. It applies to fiscal years ending after December 15, 2002. It amends the transitional provisions of SFAS No. 123 for companies that choose to recognize stock-based compensation under the fair value-based method of SFAS No. 123, instead of choosing to continue following the intrinsic value method of Accounting Principles Board (APB) Opinion No. 25.
| ||||||||
| 2004 | 2003 | 2002 | |||||
Net earnings (loss), as reported | 1,584 | 1,636 | (4,649 | ) | ||||
Compensation cost included | ||||||||
in net earnings | 54 | 29 | 27 | |||||
Total compensation cost | (63 | ) | (51 | ) | (68 | ) | ||
Pro forma net earnings (loss) | 1,575 | 1,614 | (4,690 | ) | ||||
Pro forma net earnings (loss) per common share (basic) | 1.61 | 1.67 | (6.13 | ) | ||||
Pro forma net earnings (loss) per common share (diluted) | 1.61 | 1.67 | (6.15 | ) | ||||
(j) Accounting for Derivative Instruments and Hedging Activities (SFAS No. 133) On January 1, 2001, we adopted SFAS 133,Accounting for Derivative Instruments and Hedging Activities, as amended by SFAS 138. Under this standard, all derivatives must be recorded on the balance sheet at fair value under United States GAAP. In addition, certain economic hedging strategies, such as using dividend rate swaps to hedge preferred share dividends and hedging SCPs, no longer qualify for hedge accounting under United States GAAP. | ||||||||
120 Bell Canada Enterprises 2004 Annual Report
Under Canadian GAAP, the proceeds are being deferred and amortized against the dividends on these preferred shares over the remaining original terms of the swaps. Under United States GAAP, these dividend rate swaps did not qualify for hedge accounting and were recorded on the balance sheet at fair value. As a result, the amortization of the deferred gain under Canadian GAAP is reversed for purposes of United States GAAP. (k) Impact of Adopting Recent Changes to Accounting Standards Goodwill and Other Intangible Assets Effective January 1, 2002, we followed the requirements of SFAS No. 142,Goodwill and Other Intangible Assets. This standard required us to stop amortizing goodwill and indefinite-life intangible assets to earnings and to assess them for impairment each year. It includes a transitional impairment test. Effective June 30, 2002, we:
In performing the transitional impairment test, we:
We determined a transitional impairment loss of $7,268 million net of tax in the second quarter of 2002. We recorded it as a cumulative effect of a change in accounting policy as of January 1, 2002, as required by the transitional provisions of SFAS No. 142. Under Canadian GAAP, the transitional impairment loss is recorded as an adjustment to opening retained earnings. The impairment loss related to impaired goodwill of reporting units in Teleglobe ($6,604 million), Bell Globemedia ($545 million) and Emergis ($119 million). Consolidation of Variable Interest Entities Effective July 1, 2003, we adopted FASB Interpretation (FIN) No. 46,Consolidation of Variable Interest Entities, on a prospective basis. This interpretation clarifies how to apply ARB No. 51,Consolidated Financial Statements, to variable interest entities when equity investors are not considered to have a controlling financial interest or they have not invested enough equity to allow the entity to finance its activities without additional subordinated financial support from other parties. Acquisition of Nexxlink Technologies Inc. (Nexxlink) As of February 21, 2005, Bell Canada had bought 89% of all the outstanding shares of Nexxlink, a provider of integrated IT solutions, for $59 million in cash. Bell Canada intends to buy the remaining shares in a subsequent transaction by way of amalgamation, which is expected to be approved at a shareholders’ meeting on April 7, 2005. Issuance of Series M-18 Debentures On February 11, 2005, Bell Canada issued $700 million in Series M-18 Medium Term Note Debentures having a maturity date of February 15, 2017 and a fixed interest rate of 5.00% . Following the issuance, Bell Canada swapped the fixed interest rate to a floating rate. The net proceeds from the issuance of the debentures will be used to repay maturing short-term debt and for general corporate purposes. |
121 Bell Canada Enterprises 2004 Annual Report
| Board of DirectorsAs at March 2, 2005
| ||||||||
André Bérard, O.C. Ronald A. Brenneman Richard J. Currie, O.C. Anthony S. Fell, O.C. | Donna Soble Kaufman Thomas E. Kierans, O.C. Brian M. Levitt The Honourable | Judith Maxwell, C.M. John H. McArthur Thomas C. O’Neill, F.C.A. James A. Pattison, O.C., O.B.C. | Robert C. Pozen Michael J. Sabia Paul M. Tellier, P.C., C.C., Q.C. Victor L. Young, O.C. | |||||
| Committees of the Board Members of Committees of the Board | |||||||||
| Audit | Corporate Governance | Management Resources | Pension Fund | ||||||
| T.C. O’Neill – Chair | D. Soble Kaufman – Chair | and Compensation | R.C. Pozen – Chair | ||||||
| A. Bérard | A.S. Fell | R.J. Currie – Chair | T.E. Kierans | ||||||
| J. Maxwell | T.E. Kierans | R.A. Brenneman | B.M. Levitt | ||||||
| R.C. Pozen | The Honourable E.C. Lumley | A.S. Fell | P.M. Tellier | ||||||
| V.L. Young | J.H. McArthur | J.H. McArthur | |||||||
| V.L. Young | |||||||||
The committees of the board of directors, and their purpose, are identified below. The Audit Committee
The Corporate Governance Committee
| The Management Resources and Compensation Committee
The MRCC also assists the board in the oversight of BCE’s health and safety policies and practices. The Pension Fund Committee
| ||||||||
122 Bell Canada Enterprises 2004 Annual Report
| ExecutivesAs at March 2, 2005
| ||||||||
Michael J. Sabia William D. Anderson Pierre J. Blouin Laurier (Larry) J. Boisvert Mark R. Bruneau | Isabelle Courville Peter Daniel Ivan Fecan Lawson A.W. Hunter Robert Odendaal | Patricia A. Olah Patrick Pichette Eugene Roman Karen H. Sheriff | Martine Turcotte Siim A. Vanaselja Stephen G. Wetmore Mahes S. Wickramasinghe | |||||
123 Bell Canada Enterprises 2004 Annual Report
The shareholder meeting will take place at 9:30 a.m. (Eastern time), Wednesday, May 25, 2005, at the Metro Toronto Convention Centre, 222 Bremner Blvd., Toronto, Ontario. 2005 Quarterly Earnings Release Dates First quarter May 4, 2005 Quarterly and annual reports as well as other corporate documents can be found on our website. If you wish to be notified electronically when documents are posted, register online atwww.bce.cafor our service “News Alerts.” Corporate documents can also be requested from the Investor Relations group. Share Facts Symbol Listings Common Shares Outstanding Stock Splits Quarterly Dividend* 2005 Dividend Schedule* | Tax Information Dividends and Capital Gains on Your BCE Shares BCE common shareholders are required to pay tax on dividends as well as any capital gains they realize when they sell their shares or are deemed to have sold them. If you received Nortel Networks common shares in May 2000, you should contact the Investor Relations group to learn more on the tax implications of the BCE/Nortel Plan of Arrangement or visitwww.bce.ca. Foreign Investors Dividends on BCE shares paid or credited to nonresidents of Canada are subject to a 25% withholding tax unless reduced by treaty. Under current tax treaties, U.S. and U.K. residents are subject to a 15% withholding tax. U.S. Investors BCE is required to solicit taxpayer identi-fication numbers (TIN) and Internal Revenue Service (IRS) Form W-9 certifications of residency from certain U.S. investors. Where these have not been received, BCE may be required to deduct the IRS’ specified backup withholding tax. The backup withholding rate on dividends is currently 28%. Shareholders who did not provide their TIN and W-9 certification of residency and had the backup withholding tax applied on their dividends can obtain a refund or credit against their U.S. federal income tax through the filing of their income tax return the following year. For additional information, please contact your tax advisor. | Shareholder Services Dividend Reinvestment and Stock Purchase Plan This plan provides a convenient method for eligible holders of BCE common shares to reinvest their dividends and make optional cash contributions to purchase additional common shares without brokerage costs. Dividend Direct Deposit Service Avoid postal delays and trips to the bank by joining the dividend direct deposit service. E-delivery Service Enrol in our e-delivery service to receive the proxy material, the annual report and/or quarterly documents by e-mail. Duplicate Mailings Help us control costs and eliminate duplicate mailings by consolidating your accounts. Contact Information Transfer Agent and Registrar For information on shareholder services or any other inquiries regarding your account (including stock transfer, address change, lost certificates and tax forms), contact: Computershare Trust Company of Canada e-mail bce@computershare.com BCE Inc. e-mail investor.relations@bce.ca | ||||
| * Subject to approval by the Board of Directors | ||||||
Trademarks: The following is a list of all our trademarks referred to and used as such in this annual report. BCE is a trademark of BCE Inc. The rings and head design, Bell Canada Enterprises corporate logo, Bell, Sympatico, Sympatico.ca, Bell Mobility, ProConnect are trademarks of Bell Canada.The Globe and Mailis a trademark of Bell Globemedia Publishing Inc. Mobile Browser is a trademark of Bell Mobility. CTV is a trademark of CTV Inc. Nimiq, Anik and Telesat are trademarks of Telesat Canada. ExpressVu is a trademark of Bell ExpressVu L.P. Any other trademarks, or corporate, trade or domain names used in this report are the property of their owners. We believe that our trademarks and domain names are very important to our success. Our exclusive trademark rights are perpetual provided that their registrations are timely renewed and that the trademarks are used in commerce by us or our licensees. We take appropriate measures to protect, renew and defend our trademarks. We also spend considerable time and resources overseeing, registering, renewing, licensing and protecting our trademarks and prosecuting those who infringe on them. We take great care not to infringe on the intellectual property and trademarks of others. Cette publication est disponible en français. BCE’s Annual Report is printed with vegetable-based ink and is recyclable Printed in Canada Design: VSA Inc. Partners,Principal photography: Robert FrançoisPrinting: Press BlanchetteFinancial typesetting: Moveable Inc. | ||||||
| Communications | email bcecomms@bce.ca Tel 1 888 932-6666 Fax (514) 870-4385 |
| Investor Relations | email investor.relations@bce.ca Tel 1 800 339-6353 Fax (514) 786-3970 |
