Exhibit 99.2
| MANAGEMENT’S DISCUSSION AND ANALYSIS |
In this management’s discussion and analysis of financial condition and results of operations (MD&A),we, us, our, BCE andthe companymean, as the context may require, either BCE Inc. or, collectively, BCE Inc., its subsidiaries, joint arrangements and associates.Bell means our Bell Wireless, Bell Wireline and Bell Media segments on an aggregate basis.Bell Aliantmeans, as the context may require, until December 31, 2014, either Bell Aliant Inc. or, collectively, Bell Aliant Inc. and its subsidiaries and associates, or, after December 31, 2014, either Bell Aliant Regional Communications Inc. or, collectively, Bell Aliant Regional Communications Inc. and its subsidiaries and associates.
All amounts in this MD&A are in millions of Canadian dollars, except where noted. Please refer to section 10.2,Non-GAAP financial measures and key performance indicators (KPIs)on pages 106 to 109 for a list of defined non-GAAP financial measures and key performance indicators. Also refer to the glossary on page 155 for a list of defined terms.
Please refer to BCE’s audited consolidated financial statements for the year ended December 31, 2014 when reading this MD&A.
In preparing this MD&A, we have taken into account information available to us up to March 5, 2015, the date of this MD&A, unless otherwise stated.
You will find BCE’s audited consolidated financial statements for the year ended December 31, 2014, BCE’s annual information form for the year ended December 31, 2014, dated March 5, 2015 (BCE 2014 AIF) and recent financial reports on BCE’s website at BCE.ca, on SEDAR at sedar.comand on EDGAR atsec.gov.
This MD&A comments on our business operations, performance, financial position and other matters for the two years ended December 31, 2014 and 2013.
| CAUTION REGARDING FORWARD-LOOKING STATEMENTS |
BCE’s 2014 annual report including this MD&A and, in particular, but without limitation, section 1.3,Key corporate developments, section 1.4,Capital markets strategy, section 2,Strategic imperatives, section 3.2,Business outlook and assumptions, section 5,Business segment analysisand section 6.8,Liquidityof this MD&A, contain forward-looking statements. These forward-looking statements include, but are not limited to, BCE’s business outlook, objectives, plans and strategic priorities, BCE’s 2015 annualized common share dividend and common share dividend policy, BCE’s credit policies and the expected return of BCE’s Net Debt leverage ratio within BCE’s Net Debt leverage ratio target range, the sources of liquidity we expect to use to meet our anticipated 2015 cash requirements, our expected 2015 post-employment benefit plan funding, our network deployment plans, the expected timing and completion of BCE’s proposed acquisition of all of the issued and outstanding shares of Glentel Inc. (Glentel) and of BCE’s proposed disposition of a 50% ownership interest in Glentel to Rogers Communications Inc. (Rogers), and certain benefits expected to result from the Bell Aliant Privatization (as defined in section 1.1,Introduction) and from the proposed acquisition of Glentel. Forward-looking statements also include any other statements that do not refer to historical facts. A statement we make is forward-looking when it uses what we know and expect today to make a statement about the future. Forward-looking statements are typically identified by the wordsassumption,goal,guidance,objective,outlook,project,strategy,targetand other similar expressions or future or conditional verbs such asaim,anticipate,believe,could,expect,intend,may,plan,seek,should,striveandwill. All such forward-looking statements are made pursuant to the ‘safe harbour’ provisions of applicable Canadian securities laws and of the United StatesPrivate Securities Litigation Reform Act of 1995. Unless otherwise indicated by us, forward-looking statements in BCE’s 2014 annual report, including in this MD&A, describe our expectations as at March 5, 2015 and, accordingly, are subject to change after this date. Except as may be required by Canadian securities laws, we do not undertake any obligation to update or revise any forward-looking statements, whether as a result of new information, future events or otherwise.
Forward-looking statements, by their very nature, are subject to inherent risks and uncertainties and are based on several assumptions, both general and specific, which give rise to the possibility that actual results or events could differ materially from our expectations expressed in, or implied by, such forward-looking statements and that our business outlook, objectives, plans and strategic priorities may not be achieved. As a result, we cannot guarantee that any forward-looking statement will materialize and we caution you against relying on any of these forward-looking statements. Forward-looking statements are presented in BCE’s 2014 annual report, including in this MD&A, for the purpose of assisting investors and others in understanding our objectives, strategic priorities and business outlook as well as our anticipated operating environment. Readers are cautioned, however, that such information may not be appropriate for other purposes.
We have made certain economic, market and operational assumptions in preparing the forward-looking statements contained in BCE’s 2014 annual report and, in particular, but without limitation, the forward-looking statements contained in the above-mentioned sections of this MD&A. These assumptions include, without limitation, the assumptions described in the various sections of this MD&A entitledBusiness outlook and assumptions, which sections are incorporated by reference in this cautionary statement. We believe that these assumptions were reasonable at March 5, 2015. If our assumptions turn out to be inaccurate, our actual results could be materially different from what we expect.
Important risk factors including, without limitation, regulatory, competitive, economic, financial, operational and technological risks that could cause actual results or events to differ materially from those expressed in, or implied by, the above-mentioned forward-looking statements and other forward-looking statements in BCE’s 2014 annual report, in particular in this MD&A, include, but are not limited to, the risks described in section 9,Business risks, which section is incorporated by reference in this cautionary statement.
We caution readers that the risks described in the above-mentioned section and in other sections of this MD&A are not the only ones that could affect us. Additional risks and uncertainties not currently known to us or that we currently deem to be immaterial may also have a material adverse effect on our financial position, financial performance, cash flows, business or reputation. Except as otherwise indicated by us, forward-looking statements do not reflect the potential impact of any special items or of any dispositions, monetizations, mergers, acquisitions, other business combinations or other transactions that may be announced or that may occur after March 5, 2015. The financial impact of these transactions and special items can be complex and depends on the facts particular to each of them. We therefore cannot describe the expected impact in a meaningful way or in the same way we present known risks affecting our business.
24 BCE Inc. 2014 ANNUAL REPORT | |||
MD&A | OVERVIEW | 1 |
| 1 OVERVIEW |
1.1 Introduction
At a glance
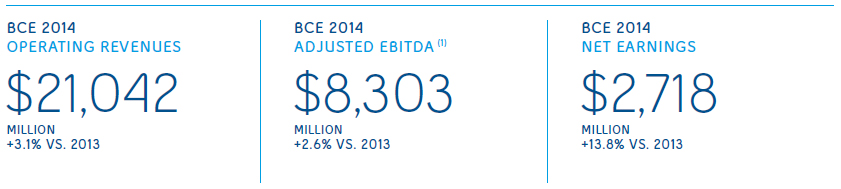
BCE is Canada’s largest communications company, providing residential, business and wholesale customers with a wide range of solutions for all their communications needs. BCE’s shares are publicly traded on the Toronto Stock Exchange and on the New York Stock Exchange (TSX, NYSE: BCE).
In 2014 and 2013, we reported the results of our operations in four segments: Bell Wireless, Bell Wireline, Bell Media and Bell Aliant.
Bell Wireless provides wireless voice and data communication products and services to Bell’s residential, small and medium-sized business and large enterprise customers across Canada.
Bell Wireline provides data, including Internet access and television (TV), local telephone, long distance, and other communications products and services to Bell’s residential, small and medium-sized business and large enterprise customers, primarily in the urban areas of Ontario and Québec. In addition, this segment includes our wholesale business, which buys and sells data, local telephone, long distance and other services from or to resellers and other carriers.
Bell Media provides conventional, specialty and pay TV, digital media, and radio broadcasting services to customers across Canada and out-of-home (OOH) advertising services. On July 5, 2013, BCE acquired 100% of the issued and outstanding shares of Astral Media Inc. (Astral). The results of Astral are included in our Bell Media segment from the date of acquisition.
Bell Aliant provides Internet, data, TV, local telephone, long distance, wireless, home security and value-added business solutions to residential and business customers in the Atlantic provinces and in rural and regional areas of Ontario and Québec. At December 31, 2013, BCE owned 44.1% of Bell Aliant, with the remaining 55.9% publicly held. BCE consolidated Bell Aliant as control was achieved through its right to appoint a majority of the board of directors of Bell Aliant. On October 31, 2014, BCE completed its acquisition of all of the issued and outstanding common shares of Bell Aliant that it did not already own (Privatization). Beginning January 1, 2015, the results of operations of Bell Aliant are included within our Bell Wireless and Bell Wireline segments, with prior periods restated for comparative purposes. Consequently, beginning in 2015, our reportable segments are Bell Wireless, Bell Wireline and Bell Media.

We also hold investments in a number of other assets, including:
- a 28% indirect equity interest in Maple Leaf Sports & Entertainment Ltd. (MLSE)
- a 35.4% indirect equity interest in Q9 Networks Inc. (Q9)
- an 18.4% indirect equity interest in entities that operate the Montréal Canadiens Hockey Club and the Bell Centre in Montréal
- a 15% equity interest in The Globe and Mail
BCE Inc. 2014 ANNUAL REPORT 25 | |||
1 | OVERVIEW | MD&A |
| BCE Customer Connections |

| Our goal |
Our goal is to be recognized by customers as Canada’s leading communications company. Our primary business objectives are to maximize subscribers, revenues, operating profit, Free Cash Flow(1) and return on invested capital by further enhancing our position as the foremost provider in Canada of comprehensive communications services to residential and business customers. We seek to take advantage of opportunities to leverage our networks, infrastructure, sales channels, and brand and marketing resources across our various lines of business to create value for both our customers and other stakeholders.
Our strategy is centred on our disciplined focus and execution of six strategic imperatives. The six strategic imperatives that underlie Bell’s business plan are:

| (1) | Adjusted EBITDA and Free Cash Flow are non-GAAP financial measures and do not have any standardized meaning under International Financial Reporting Standards (IFRS). Therefore, they are unlikely to be comparable to similar measures presented by other issuers. See section 10.2,Non-GAAP financial measures and key performance indicators (KPIs) – Adjusted EBITDA and Adjusted EBITDA marginandFree Cash Flow and Free Cash Flow per Sharefor more details, including, for Free Cash Flow, a reconciliation to the most comparable IFRS financial measure. |
26 BCE Inc. 2014 ANNUAL REPORT | |||
MD&A | OVERVIEW | 1 |
| 1.2 About BCE |
In 2014, we reported the results of our operations in four segments: Bell Wireless, Bell Wireline, Bell Media and Bell Aliant. Bell, which encompasses our core operations, is comprised of our Bell Wireless, Bell Wireline and Bell Media segments. We describe our product lines by segment below, to provide further insight into our operations.
| Our products and services |
Bell Wireless
SEGMENT DESCRIPTION
- Provides integrated digital wireless voice and data communications products andservices to residential and business customers across Canada
- Includes the results of operations of Bell Mobility Inc. (Bell Mobility) and wireless-relatedproduct sales from The Source (Bell) Electronics Inc. (The Source)

OUR NETWORKS AND REACH
We hold licensed national wireless spectrum, with holdings across various spectrum bands totalling more than 4,200 million Megahertz per Population (MHz-POP)
We have deployed and operate a number of leading nationwide wireless broadband networks compatible with global standards that deliver high-quality and reliable voice and high-speed data services to virtually all of the Canadian population
Fourth-generation (4G) long-term evolution (LTE) network launched in September 2011:
- Provides mobile Internet data access speeds as fast as150 megabits per second (Mbps) (typical speeds of 12 to 40 Mbps)
- Covered 86% of the Canadian population coast-to-coast atDecember 31, 2014
- Reverts to the High-speed packet access plus (HSPA+) networkoutside LTE urban coverage area, ensuring continuity of service
HSPA+ network launched in November 2009:
- Provides high-speed mobile access of up to 21 Mbps in mostareas (typical speeds of 3.5 to 8 Mbps), and as high as 42 Mbpsin areas with dual cell capability when using compatible devices(typical speeds of 7 to 14 Mbps)
- Covered over 98% of the Canadian population coast to coast atDecember 31, 2014
- Supports international roaming in more than 220 countries
National 3G code division multiple access (CDMA) network, which we began decommissioning in 2014
Largest wireless fidelity (Wi-Fi) network across Canada:
- Over 4,000 public Wi-Fi hotspots at participating McDonald’s, Tim Hortons and Chapters/Indigo retail outlets across Canada, in addition to thousands of private Wi-Fi networks managed through our Bell Business Markets unit at enterprise customer locations
Approximately 1,600 Bell-branded stores and The Source locations across Canada
OUR PRODUCTS AND SERVICES
- Voice and data plans: available on either postpaidor prepaid options
- Extensive selection of devices: including leading 4G LTEsmartphones and tablets
- Data: e-mail, web browsing, social networking, text messaging,picture and video messaging and call features
- Mobile TV: over 35 live and 12 on-demand channels onsmartphones and tablets
- Entertainment: games, text alerts, ringtones, wallpapers,ringback tones
- Mobile Internet: Turbo Stick, Turbo Hub and MiFi
- Mobile commerce: secure debit and credit purchases usingBell Mobility smartphones
- Mobile business services: push-to-talk, workforce management,worker safety, dispatch, mobile device management
- Travel: roaming services with other wireless service providersin more than 220 countries worldwide and Travel Data Passes
- Machine-to-machine (M2M) applications: connected car andusage-based insurance vehicle tracking, asset management,remote monitoring and telematics
BCE Inc. 2014 ANNUAL REPORT 27 | |||
1 | OVERVIEW | MD&A |
Bell Wireline
SEGMENT DESCRIPTION
- Provides data (including TV, Internet access and information and communicationstechnology (ICT) solutions), local telephone, long distance and other communicationsservices to residential and business customers primarily in the urban areas ofOntario and Québec. We also offer competitive local exchange carrier (CLEC)services in Alberta and British Columbia
- Includes the results of our wholesale business, which provides data, local telephone,long distance and other services to resellers and other carriers, and the wirelineoperations of NorthwesTel Inc. (NorthwesTel), which provides telecommunicationsservices in Canada’s Northern Territories
- Includes wireline-related product sales from our wholly-owned subsidiary, nationalconsumer electronics retailer The Source

OUR NETWORKS AND REACH
- Extensive local access network primarily in the urban areas ofOntario and Québec, as well as in Canada’s Northern Territories
- Broadband fibre network, consisting of fibre-to-the-node(FTTN), fibre-to-the-home (FTTH) and fibre-to-the-building (FTTB),covering 6.5 million locations in Ontario and Québec
- Bell Fibe TV service footprint encompassing 5 million householdsacross Ontario and Québec at December 31, 2014
- Largest Internet protocol (IP) multi-protocol label switchingfootprint of any Canadian provider, enabling us to offer businesscustomers a virtual private network (VPN) service for IP trafficand to optimize bandwidth for real-time voice and TV
- Access to the largest data centre footprint in Canada with25 locations in 7 provinces, enabling us to offer data centreco-location and hosted services to business customersacross Canada
- Approximately 1,600 Bell-branded stores and The Sourcelocations across Canada
OUR PRODUCTS AND SERVICES
RESIDENTIAL
- Bell TV: Fibe TV (our Internet Protocol Television (IPTV) service)and direct-to-home (DTH) Satellite TV, providing extensivecontent options and innovative features such as Restart, wirelessreceiver, Whole Home personal video recorder (PVR), on-demandprogramming, and a remote control application (app)
- Bell Internet: High-speed Internet access through fibreoptic broadband technology or digital subscriber line (DSL)with a wide range of options, including unlimited usage,a comprehensive suite of security solutions, e-mail, Home Huball-in-one modem and Wi-Fi router, and mobile Internet.Our fibre optic Internet service, marketed as Bell Fibe Internet,offers speeds up to 50 Mbps with FTTN or 175 Mbps with FTTH.
- Bell Home Phone: local telephone service with long distance andadvanced calling features
- Bell Bundles: three and four product bundles of services withmonthly discounts
BUSINESS
- IP-based services: IP VPN, business Internet and IP Telephony
- ICT solutions: hosting and cloud services, managed solutions,professional services and infrastructure services that supportand complement our data connectivity services
- Voice: local and long distance and unified communicationsservices, including audio and video conferencing, webcastingand web conferencing, and business terminal equipment
28 BCE Inc. 2014 ANNUAL REPORT | |||
MD&A | OVERVIEW | 1 |
Bell Media
SEGMENT DESCRIPTION
- Canada’s premier multimedia company with leading assets in TV, radio,OOH advertising and digital media
- Revenues are derived primarily from advertising and subscriber fees
- Conventional TV revenue is derived from advertising
- Specialty TV revenue is generated from subscription fees and advertising
- Pay TV revenue is received from subscription fees
- Radio revenue is generated from advertising aired over our stations
- OOH revenues are generated from advertising

OUR ASSETS AND REACH
TV
- 30 conventional TV stations, including CTV, Canada’s leadingTV network based on viewership
- 35 specialty TV channels, including TSN, Canada’s leadingspecialty channel and RDS, Canada’s leading French-languagespecialty channel
- Four pay TV services, including The Movie Network andSuper Écran
RADIO
- 106 licensed radio stations in 54 markets across Canada
OOH ADVERTISING
- Network of more than 9,500 advertising faces in Québec, Ontario, Alberta and British Columbia
DIGITAL MEDIA
- More than 200 websites, includingTheLoop.ca
SPORTS BROADCAST RIGHTS
- Bell Media has secured long-term media rights to many of the key sports properties that are most important to Canadians, including being the official Canadian broadcaster of the Super Bowl, Grey Cup, IIHF World Junior Championship and FIFA Women’s World Cup Canada 2015. Bell Media’s slate of live sports coverage also includes the Toronto Maple Leafs, Montréal Canadiens, Winnipeg Jets and Ottawa Senators games, NFL, NBA, MLS, FIFA World Cup events through to 2022, Season of Champions Curling, UEFA Euro 2016, MLB, Barclays Premier League, UEFA Champions League, golf’s major championships, NASCAR Sprint Cup, Formula 1, Grand Slam Tennis and NCAA March Madness.
OTHER ASSETS
- Equity stake in digital startup Hubub, a new digital platform forexploring and discussing interests
- Investment in Cirque du Soleil Media, a joint venture with Cirquedu Soleil to develop media content for TV, film, digital, andgaming platforms
- 50% interest in Dome Productions Partnership, one of NorthAmerica’s leading providers of sports and other event productionand broadcast facilities
OUR PRODUCTS AND SERVICES
- Varied and extensive array of TV programming to broadcastdistributors across Canada
- Advertising on our TV, radio, OOH and digital media propertiesto both local and national advertisers across a wide range ofindustry sectors
- Mobile TV service with live and on-demand access to contentfrom our conventional TV networks, CTV and CTV Two, BNN,TSN, RDS, Discovery and other brands in news, sports andentertainment. This mobile content is offered on commercialterms to all Canadian wireless providers
- CraveTV subscription on-demand TV streaming serviceoffering the largest collection of premium content in one place,including HBO’s programming library, on set-top boxes (STBs),mobile devices and online. CraveTV is offered to all CanadianTV providers
- TV Everywhere services, including CTV GO, TMN GO, TSN GOand RDS GO, which provide on-demand content deliveredover mobile and Wi-Fi networks to smartphones, tabletsand computers
BCE Inc. 2014 ANNUAL REPORT 29 | |||
1 | OVERVIEW | MD&A |
Bell Aliant
SEGMENT DESCRIPTION
- One of the largest regional telecommunications service providers in North America,that was privatized by BCE on October 31, 2014
- Provides a complete range of communications, information and entertainmentservices, including Internet, data, TV, voice, wireless, home security, and value-added business solutions to residential and business customers in Canada’s Atlanticprovinces, as well as in rural and regional areas of Ontario and Québec
- Beginning January 1, 2015, the results of operations of Bell Aliant are included withinour Bell Wireless and Bell Wireline segments. Consequently, beginning in 2015, ourreportable segments are Bell Wireless, Bell Wireline and Bell Media.

OUR NETWORKS AND REACH
- Reaching over 5 million Canadians in six provinces (Nova Scotia,New Brunswick, Newfoundland and Labrador, Prince EdwardIsland, Ontario and Québec)
- Extensive local access network in Atlantic Canada, as well as incertain areas of Ontario and Québec not serviced by Bell
- Extensive broadband fibre infrastructure, consisting primarily ofan FTTH network covering more than 1 million locations
OUR PRODUCTS AND SERVICES
- Residential service bundles that have a combination of Internetservice (FibreOP or DSL), TV (FibreOP TV, Bell Aliant TV, or BellSatellite TV), home phone, local features, long distance plansand cellular service (over digital wireless networks in certainterritories in Québec and Ontario or Bell Mobility)
- In business markets, we provide combined service offerings inthe form of business bundles and customized solutions
Other BCE investments
BCE also holds investments in a number of other assets, including:
- MLSE: 28% indirect equity interest
- Q9: 35.4% indirect equity interest
- Montréal Canadiens Hockey Club: 18.4% indirect equity interest
- The Globe and Mail: 15% equity interest

| Our people |
EMPLOYEES
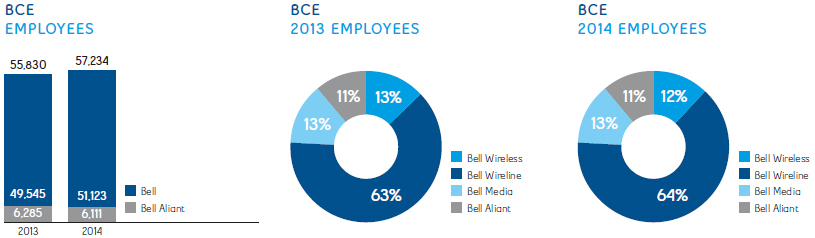
At the end of 2014, our team included 57,234 employees dedicated to driving shareholder return and improving customer service.
30 BCE Inc. 2014 ANNUAL REPORT | |||
MD&A | OVERVIEW | 1 |
The total number of BCE employees at the end of 2014 increased by 1,404 employees compared to the end of 2013, due primarily to the repatriation of activities from certain suppliers to Bell, as well as an increased workforce in our field services operations to support our ongoing IPTV roll-out and service quality initiatives. This increase was offset partly by a decreased workforce across our Bell Wireless and Bell Aliant segments attributable to normal attrition, retirements and productivity improvements.
Approximately 43% of total BCE employees are represented by labour unions.
BELL CODE OF BUSINESS CONDUCT
The ethical business conduct of our people is core to the integrity with which we operate our business. The Bell Code of Business Conduct sets out specific expectations and accountabilities, providing employees with practical guidelines to conduct business in an ethical manner. Our commitment to the Code of Business Conduct is renewed by employees each year in an ongoing effort to ensure that all employees are aware of and adhere to Bell’s standards of conduct.
| 1.3 Key corporate developments |
Bell Aliant Privatization and note exchange
On July 23, 2014, BCE announced its offer to acquire all of the issued and outstanding common shares of Bell Aliant Inc. that it did not already own for a total consideration of approximately $3.95 billion. On the same day, BCE also announced its offer to exchange all of the issued and outstanding preferred shares of Bell Aliant Preferred Equity Inc. (Prefco) for newly issued first preferred shares of BCE, with the same financial terms as the existing Prefco preferred shares (Preferred Share Exchange). The Bell Aliant Privatization was completed on October 31, 2014 and the Preferred Share Exchange was completed on November 1, 2014. The Bell Aliant Privatization is expected to simplify BCE’s corporate structure and increase overall operating and capital investment efficiencies, while supporting BCE’s broadband investment strategy and dividend growth objective with strong annualized Free Cash Flow accretion. As BCE already consolidated the financial results of Bell Aliant Inc., the Bell Aliant Privatization has been accounted for as an equity transaction.
On November 20, 2014, Bell Canada and Bell Aliant Regional Communications, Limited Partnership (Bell Aliant LP) completed a transaction to exchange all Bell Aliant LP medium term and floating rate medium term notes in the aggregate principal amount of $2.3 billion (collectively, the Bell Aliant LP Notes) for Bell Canada debentures guaranteed by BCE and having the same financial terms (including with respect to coupon, maturity and redemption price) as those of the Bell Aliant LP Notes (the Bell Aliant Note Exchange). The note exchange transaction is part of BCE’s strategy to simplify its capital structure and enhance administrative efficiencies by concentrating public debt into a single issuer.
As a result of the above-mentioned transactions, each of Bell Aliant Inc., Prefco, Bell Aliant Regional Communications Inc. and Bell Aliant LP ceased to be reporting issuers as of December 18, 2014. Bell Aliant Inc. was dissolved effective December 31, 2014, and Bell Canada now directly owns all of the issued and outstanding shares of Bell Aliant Regional Communications Inc.
| Acquisition of mobile phone distributor Glentel |
On November 28, 2014, BCE announced the signing of a definitive agreement to acquire all of the issued and outstanding shares of Glentel for a total consideration of $594 million. The total transaction is valued at approximately $670 million, including net debt and non-controlling interest (NCI). The transaction consideration will consist of a combination of 50% in cash, to be funded from available liquidity, and 50% in BCE common shares. Glentel shareholder approval was obtained at a special meeting of shareholders held on January 12, 2015, and court approval was obtained on January 14, 2015. The transaction is expected to close in the spring of 2015, subject to closing conditions, including regulatory approvals. Glentel is a Canadian-based dual-carrier, multi-brand mobile products distributor. The transaction will enhance our strategy to accelerate wireless and improve customer service.
On December 24, 2014, BCE announced that following the closing of the Glentel acquisition, it will divest 50% of its ownership interest in Glentel to Rogers. Rogers will pay BCE approximately $392 million in cash. In addition, Rogers will pay 50% of any additional equity contribution made by BCE after the closing of the Glentel acquisition to repay Glentel outstanding debt. The transaction with Rogers is expected to close shortly after the acquisition of Glentel by BCE, subject to customary closing conditions, including regulatory approvals.
BCE Inc. 2014 ANNUAL REPORT 31 | |||
1 | OVERVIEW | MD&A |
| New Chief Financial Officer (CFO) of BCE named |
On October 14, 2014, BCE announced that Siim Vanaselja, CFO of BCE and Bell Canada, will retire in the second quarter of 2015. Glen LeBlanc, former CFO of Bell Aliant, will become CFO of BCE and Bell Canada at that time. BCE’s succession plan for the CFO role leverages the exceptional executive talent at the BCE group of companies to ensure a smooth transition. Mr. Vanaselja will retire after BCE’s 2015 Annual General Meeting of Shareholders, scheduled for April 30, 2015, and before the end of Q2 2015. He will continue to serve on the board of directors of MLSE. Until Mr. Vanaselja’s retirement, Mr. LeBlanc is serving as Senior Vice-President, Finance for BCE and Bell Canada.
| 1.4 Capital markets strategy |
We seek to deliver sustainable shareholder returns through consistent dividend growth. That objective is underpinned by continued growth in Free Cash Flow, a healthy level of ongoing capital investment in the business, a strong balance sheet and an investment-grade credit profile.
| Dividend growth and payout policy |

On February 5, 2015, we announced a 5.3%, or 13 cent, increase in the annualized dividend payable on BCE’s common shares for 2015 to $2.60 per share from $2.47 per share in 2014, starting with the quarterly dividend payable on April 15, 2015. This represents BCE’s 11th increase to its annual common share dividend, representing a 78% increase, since the fourth quarter of 2008.
The dividend increase for 2015 is consistent with BCE’s common share dividend policy of a target payout between 65% and 75% of Free Cash Flow. We intend to grow BCE’s common share dividend if we achieve Free Cash Flow growth. BCE’s dividend policy and the declaration of dividends are subject to the discretion of BCE’s Board.
We have a strong alignment of interest between shareholders and our management’s equity-based long-term incentive compensation plan. The vesting of performance share units depends on the realization of our dividend growth policy, while stock options reflect our commitment to increase the share price for our shareholders. Simply put, as we grow our Free Cash Flow and common dividend, we create value for our shareholders and management alike.

- Stringent share ownership requirements
- Emphasis on pay-at-risk for executive compensation
- Double trigger change in control policy
- Anti-hedging policy on share ownership and incentive compensation
- Clawbacks for the President and chief executive officer (CEO) and allExecutive Vice-Presidents as well as all option holders
- Caps on all supplemental executive retirement plans (SERP) and annualbonus payouts, in addition to mid-term and long-term incentive grants
- Vesting criteria fully aligned to shareholders interests
32 BCE Inc. 2014 ANNUAL REPORT | |||
MD&A | OVERVIEW | 1 |
| Use of excess cash |
Our dividend payout policy allows BCE to retain a high level of excess cash. Consistent with our capital markets objective to deliver sustainable shareholder returns through dividend growth while maintaining appropriate levels of capital investment, investment-grade credit ratings and considerable overall financial flexibility, we deploy excess cash in a balanced manner.
Uses of excess cash include, but are not limited to:
- Voluntary contributions to BCE’s defined benefit (DB) pension plans to improve the funded position of the plans and help minimize volatility of future funding requirements
- Financing of strategic acquisitions and investments (includingwireless spectrum purchases) that support the growth ofour business
- Debt reduction
- Share buybacks through normal course issuer bid(NCIB) programs
In 2014, BCE’s excess cash of $851 million was directed towards the purchase of 700 MHz wireless spectrum, to partially finance the Privatization of Bell Aliant and a voluntary contribution to our DB pension plan.
| Total shareholder return performance |
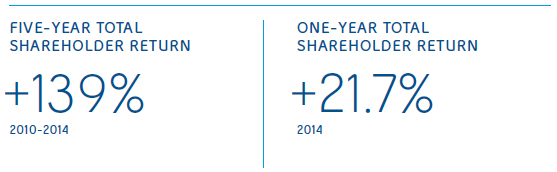

This graph compares the yearly change in the cumulative annual total shareholder return of BCE common shares to the cumulative annual total return of the S&P/TSX Composite Index, for the five-year period ending December 31, 2014, assuming an initial investment of $100 on December 31, 2009 and quarterly reinvestment of all dividends.
| (1) | Based on BCE common share price on the Toronto Stock Exchange and assumes the reinvestment of dividends. |
| (2) | With approximately 95% coverage of the Canadian equities market, the S&P/TSX Composite Index is the primary gauge against which to measure total shareholder return for Canadian-based, Toronto Stock Exchange-listed companies. |
| Strong capital structure |
BCE’s capital structure and strong liquidity position provide us with a solid financial foundation and a high level of overall financial flexibility. BCE is well-positioned with an attractive long-term debt maturity profile and manageable near-term requirements to repay debt. We continue to monitor the capital markets for opportunities where we can further reduce our cost of debt and our cost of capital. We proactively manage financial risk in terms of currency exposure of our U.S. dollar-denominated purchases, as well as equity risk exposure under BCE’s long-term equity-based incentive plans and interest rate and foreign currency exposure under our various debt instruments. We also seek to maintain investment-grade credit ratings with stable outlooks.
ATTRACTIVE LONG-TERM DEBT MATURITY PROFILE
| STRONG LIQUIDITY POSITION
| INVESTMENT-GRADE CREDIT PROFILE
|
BCE Inc. 2014 ANNUAL REPORT 33 | |||
1 | OVERVIEW | MD&A |
We successfully accessed the capital markets in September 2014, raising a total of $1.25 billion in gross proceeds from the issuance of Bell Canada medium-term note (MTN) debentures on attractive terms. Approximately $1 billion of the net proceeds from the offering were used to fund payment of the 25% cash consideration associated with the Privatization and the balance for general corporate purposes. On November 20, 2014, we completed a transaction to exchange $2.3 billion of Bell Aliant LP Notes for Bell Canada debentures having the same financial terms as those of Bell Aliant LP Notes. The Bell Aliant Note Exchange was part of Bell’s strategy to simplify its capital structure and enhance administrative efficiencies by concentrating all public debt into a single issuer.
At the end of 2014, BCE’s average annual pre-tax cost of debenture debt declined to 4.7% (3.4% on an after-tax basis) from 4.8% (3.5% on an after-tax basis) in 2013, with an average term to maturity of 8.9 years.
As a result of financing a number of strategic acquisitions made over the past few years, including Astral, CTV, MLSE and Bell Aliant, voluntary funding contributions to reduce our pension solvency deficit, wireless spectrum purchases, and the incremental Bell Aliant debt that was assumed pursuant to the Bell Aliant Note Exchange, Bell Canada increased its Net Debt(1) leverage ratio target range, concurrent with the announcement of the Privatization on July 23, 2014, from 1.5 to 2.0 times Adjusted EBITDA to 1.75 to 2.25 times Adjusted EBITDA. The new target range remains aligned with our investment-grade credit rating policy and is supported by BCE’s improved business risk profile, larger scale and strong Free Cash Flow generation relative to when the previous target range was established in 2009. Neither the change in the Net Debt leverage ratio target range nor the Net Debt leverage ratio resulting from the Privatization affected BCE’s or Bell Canada’s credit ratings or outlooks. That ratio is expected to improve over time and return within the Net Debt leverage ratio target range through growth in Free Cash Flow and applying a portion of excess cash to the reduction of BCE’s indebtedness.
BCE CREDIT POLICIES | INTERNAL TARGET | DECEMBER 31, 2014 | ||
Net Debt to Adjusted EBITDA | 1.75–2.25 | 2.59 | ||
Adjusted EBITDA to Net Interest Expense | >7.5 | 8.38 |
| 1.5 Corporate governance and risk management |
Corporate governance philosophy
BCE’s Board and management believe that strong corporate governance practices contribute to superior results in creating and maintaining shareholder value. That is why we continually seek to strengthen our leadership in corporate governance and ethical business conduct by adopting best practices, and providing full transparency and accountability to our stakeholders.
Key governance strengths and actions in support of our governance philosophy include:
- Separation of the Board Chair and CEO roles
- Director independence standards
- Board committee memberships restricted toindependent directors
- Annual director effectiveness and performance assessments
- Ongoing reporting to Board committees regarding ethicsprograms and the oversight of corporate policies across BCE
- Share ownership guidelines for directors and executives
- Executive compensation programs tied to BCE’s abilityto grow its common share dividend
In 2013, the BCE Board was recognized by the Canadian Coalition for Good Governance, receiving the organization’s Gavel Award for best corporate governance disclosure, which underscores the importance of effective communication between corporations and their shareholders. The Canadian Society of Corporate Secretaries also named BCE the winner of its first-ever award for best overall corporate governance, recognizing our long history of best practices in building and sustaining shareholder and stakeholder value. In addition, BCE received the Best Overall Corporate Governance Award – International at the Corporate Secretary Corporate Governance Awards in New York. These achievements recognize the expertise and guidance provided by the BCE Board, and the hard work and dedication of the BCE team in ensuring rigorous governance over our company’s operations.
For more information, please refer to BCE’s most recent notice of annual general shareholder meeting and management proxy circular filed with the Canadian provincial securities regulatory authorities, available on SEDAR at sedar.comand on BCE’s website at BCE.ca.
| (1) | Net Debt is a non-GAAP financial measure and does not have any standardized meaning under IFRS. Therefore, it is unlikely to be comparable to similar measures presented by other issuers. See section 10.2,Non-GAAP financial measures and key performance indicators (KPIs) – Net Debtfor more details, including a reconciliation to the most comparable IFRS financial measure. |
34 BCE Inc. 2014 ANNUAL REPORT | |||
MD&A | OVERVIEW | 1 |
| Risk governance framework |
BOARD OVERSIGHT
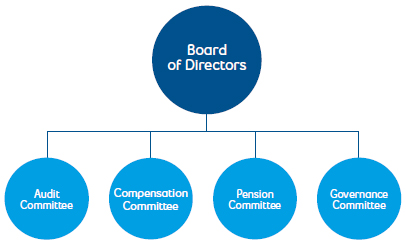
BCE’s full Board is entrusted with the responsibility for identifying and overseeing the principal risks to which our business is exposed and seeking to ensure there are processes in place to effectively identify, monitor and manage them. These processes seek to mitigate rather than eliminate risk. A risk is the possibility that an event might happen in the future that could have a negative effect on our financial position, financial performance, cash flows, business or reputation. The Board delegates responsibility for the execution of certain elements of the risk oversight program to Board committees in order to ensure that they are treated with appropriate expertise, attention and diligence, reporting to the Board in the ordinary course of business. The Board retains overall responsibility for, as well as direct oversight of, other risks, such as those relating to our regulatory environment, competitive environment, complexity, service and operational effectiveness, strategic network evolution, information technology (IT), strategy development and business integration.
Risk information is reviewed by the Board or the relevant committee throughout the year and business leaders present regular updates on the execution of business strategies, risks and mitigation activities.
The Audit Committee oversees financial reporting and disclosure as well as overseeing that appropriate risk management processes are in place across the organization. As part of its risk management oversight activities, the Audit Committee reviews the organization’s risk reports and ensures that responsibility for each principal risk is formally assigned to a specific committee or the full Board, as appropriate. The Audit Committee also regularly considers risks relating to financial reporting, legal proceedings, physical security, performance of critical infrastructure, information security, privacy and records management, business continuity and the environment. The Management Resources and Compensation Committee (Compensation Committee) oversees risks relating to compensation, succession planning and health and safety practices. The Pension Committee has oversight responsibility for risks associated with the pension fund. The Corporate Governance Committee assists the Board in developing and implementing BCE’s corporate governance guidelines and determining the composition of the Board and its committees. In addition, the Corporate Governance Committee oversees matters such as the organization’s policies concerning business conduct, ethics and public disclosure of material information.
RISK MANAGEMENT CULTURE
Bell has a strong culture of risk ownership which is actively promoted by the Board and the company’s President and CEO at all levels within the organization. It has become a part of how the company operates on a day-to-day basis and is woven into the structure and operating principles, guiding the implementation of the organization’s strategic imperatives.
The President and CEO, selected by the Board, has set his strategic focus through the execution of six strategic imperatives and focuses risk management around the factors that could impact the achievement of those strategic imperatives. While the constant change in the economic environment and the industry creates challenges, the clarity around strategic objectives, performance expectations, risk management and integrity in execution ensures discipline and balance in all aspects of Bell’s business.
RISK MANAGEMENT FRAMEWORK
While the Board is responsible for Bell’s risk oversight program, operational business units are central to the proactive identification and management of risk. They are supported by a range of corporate support functions that provide independent expertise to reinforce implementation of risk management approaches in collaboration with the operational business units. The Internal Audit function provides a further element of expertise and assurance, working to provide insight and support to the operational business units and corporate support functions while also providing the Audit Committee with an independent perspective on the state of risk and control within the organization. Collectively, these elements can be thought of as a “Three Lines of Defence” approach to risk management, which is aligned with industry best practices and endorsed by the Institute of Internal Auditors.

BCE Inc. 2014 ANNUAL REPORT 35 | |||
1 | OVERVIEW | MD&A |
FIRST LINE OF DEFENCE – OPERATIONAL MANAGEMENT
The first line refers to management within Bell’s operational business segments (Bell Wireless, Bell Wireline and Bell Media) who are expected to understand their operations in great detail and the financial results which underpin them. There are regular reviews of operating performance involving the organization’s executive and senior management. The discipline and precision associated with this process, coupled with the alignment and focus around performance goals, creates a high degree of accountability and transparency, in support of Bell’s risk management practices.
As risks emerge in the business environment, they are discussed in a number of regular forums to share details and explore their relevance across the organization. Executive and senior management is integral to these activities in driving the identification of risks, assessment, mitigation and reporting at all levels. Formal risk reporting occurs through strategic planning sessions, management presentations to the Board and formal enterprise risk reporting which is shared with the Board and the Audit Committee during the year.
Management is also responsible for maintaining effective internal controls and for executing risk and control procedures on a day-to-day basis. Each operational business unit develops its own operating controls and procedures that fit the needs of its unique environment.
SECOND LINE OF DEFENCE – CORPORATE SUPPORT FUNCTIONS
Bell is a large enterprise with approximately 51,000 employees, multiple business units and a diverse portfolio of risks which can change as a result of internal and external factors. In a large organization, it is common to manage certain functions centrally for efficiency, scale and consistency. While the first line of defence is often central to identification and management of business risks, in many instances operational management works both collaboratively with, and also relies on, the corporate functions which make up the second line of defence for support in these areas. These corporate functions include Finance, Corporate Security and Corporate Risk Management, as well as others such as Legal and Regulatory, Corporate Responsibility, Real Estate and Procurement.
Finance function: Bell’s Finance function plays a pivotal role in seeking to identify, assess and manage risks through a number of different activities which include financial performance management, external reporting, capital management and oversight and execution practices related to the United StatesSarbanes-Oxley Act of 2002.
Corporate Security function: This function is responsible for all aspects of security, which requires a deep understanding of the business, the risk environment and the external stakeholder environment. Based on this understanding, Corporate Security sets the standards of performance required across the organization through security policy definitions and monitors the organization’s performance against these policies. In high and emerging risk areas such as cybersecurity, Corporate Security leverages its experience and competence and, through collaboration with the operational business units, develops strategies intended to mitigate the organization’s risks.
Corporate Risk Management function: This function works across the company to gather information and report on the organization’s assessment of its principal risks and the related exposures. Annually, senior management participates in a risk survey which provides an important reference point in the overall risk assessment process.
The second line of defence is critical in building and operating the oversight mechanisms which bring focus to relevant areas of risk and reinforce the bridges between the first and second lines of defence, thereby seeking to ensure that there is a clear understanding of emerging risks, their relevance to the organization and the proposed mitigation plans. To further coordinate efforts between the first and second lines of defence, Bell has established a Security, Environmental and Health & Safety Committee (SEHS). A significant number of Bell’s most senior leaders are members of this committee, whose purpose is to oversee Bell’s strategic security, environmental, health and safety risks and opportunities. This cross-functional committee seeks to ensure that relevant risks are adequately recognized and mitigation activities are well-integrated and aligned across the organization and are supported with sufficient resources.
THIRD LINE OF DEFENCE – INTERNAL AUDIT FUNCTION
Internal Audit is a part of the overall management information and control system and has the responsibility to act as an independent appraisal function. Its purpose is to provide the Audit Committee and management with objective evaluations of the company’s risk and control environment, to support management in delivering against Bell’s strategic imperatives and to maintain an audit presence throughout Bell and its subsidiaries.
36 BCE Inc. 2014 ANNUAL REPORT | |||
MD&A | STRATEGIC IMPERATIVES | 2 |
| 2 STRATEGIC IMPERATIVES |
| Our success is built on the Bell team’s dedicated execution of the six Strategic Imperatives that support our goal to be recognized by customers as Canada’s leading communications company. |
2.1 Accelerate wireless

Our objective is to grow our Bell Wireless business profitably by focusing on postpaid subscriber acquisition and retention, maximizing average revenue per user (ARPU) by targeting high-value smartphone subscribers in all geographic markets we operate in, leveraging our wireless networks, maintaining device and mobile content leadership to drive greater wireless data penetration and usage, as well as by increasing our share of in-bound global roaming traffic.
2014 PROGRESS
- Acquired 35% and 46% of total new postpaid gross and netactivations, respectively, among the three major wirelesscarriers, while achieving leading ARPU and Adjusted EBITDAgrowth of 4.9% and 9.6%, respectively, as well as service marginexpansion of 1.3 percentage points over 2013
- Expanded the number of smartphone users at the end of 2014to 76% of our total postpaid subscribers, up from 73% at the endof 2013
- Expanded our leading smartphone lineup with over 40 newdevices, including the Apple iPhone 6 and iPhone 6 Plus,Samsung Galaxy S5, Samsung Galaxy Note 4, Google Nexus 6,HTC One M8, LG G3, Sony Xperia Z3 and BlackBerry Classic,adding to our extensive selection of 4G LTE-capable devices.In addition, the Apple iPad Air 2 and iPad mini 3 are alsoavailable directly from Bell.
- Announced an agreement to acquire Glentel, a Canadian-baseddual-carrier, multi-brand mobile products distributor, of whichwe expect to retain a 50% ownership interest, to maintain Bell’scompetitive position by securing long-term access to Glentel’seffective wireless retail distribution network
- Launched a secure mobile payment solution, RBC Wallet, withRoyal Bank of Canada (RBC) in January 2014, which allowscustomers to use their compatible Bell Mobility smartphones tomake secure debit and credit purchases at retail locations thataccept contactless payments. During the year, we announcedthree additional partnerships with, TD Canada Trust, CanadianImperial Bank of Commerce (CIBC) and Desjardins Group, tolaunch similar secure mobile payment solutions. With thesepartnerships, Bell provides consumers with access to the mostchoices for mobile payment services in Canada.
- Continued to reduce the cost of mobile roaming in the countriesCanadians travel to the most, with reductions in voice and dataroaming prices for Cuba, Japan and South Korea. This followspreviously announced significant roaming rate decreases forthe United States (U.S.), most European nations, China, Mexico,Turkey, Australia and New Zealand, Bermuda, and most otherCaribbean islands.
- Introduced Easy Purchase Plan, an instalment program for tabletpurchases for existing Bell Mobility customers, allowing them tospread a portion of the cost of a new tablet over two years whenpaired with a tablet plan
2015 FOCUS
- Profitably grow wireless postpaid subscriber base whilemaintaining market share momentum of incumbent postpaidsubscriber activations
- Further narrow the ARPU gap versus incumbent competitors
- Manage the financial and churn impacts from unusual marketactivity that could arise from the significantly increased numberof customers with two- or three-year service contracts whowill be eligible to renew their plans or change carriers over thenext two years as a result of the mandatory code of conductfor providers of retail mobile wireless voice and data servicesin Canada (Wireless Code) implemented in 2013, to the extentthat the Canadian Radio-television and TelecommunicationsCommission’s (CRTC) June 3, 2015 Wireless Code applicationdate is found to be valid
- Offer the latest handsets and devices in a timely mannerto enable customers to benefit from ongoing technologicalimprovements by manufacturers and from faster data speedsto optimize the use of our services
- Accelerate new revenue streams by driving the commercialization of next generation mobile commerce and M2M servicesand applications
BCE Inc. 2014 ANNUAL REPORT 37 | |||
2 | STRATEGIC IMPERATIVES | MD&A |
| 2.2 Leverage wireline momentum |

We focus on leveraging our fibre-based TV and Internet services to develop attractive residential offers that drive higher multi-product bundle sales and improve customer satisfaction and retention. These new services contribute to the ongoing shift of our operating mix away from legacy wireline voice services.
In our business markets, we remain focused on expanding our broadband network and strengthening our delivery of integrated solutions to Canadian businesses, while continuing to manage the transformation of our business from legacy network services to a fully-integrated data hosting, cloud computing and managed services provider.
2014 PROGRESS
- Increased our total number of Bell Fibe TV subscribers by 46.1%to 700,533
- Increased the number of three-product households – those thatbuy TV, Internet and Home Phone – by 15% over 2013, fuelled byour Fibe TV service, which drove higher pull-through attach ratesfor Home Phone and Internet services, with 77% of all Bell Fibe TVcustomers taking three products
- Launched the Home Hub Internet modem and Wi-Fi router,featuring the latest 802.11 AC wireless standard that deliversWi-Fi speeds up to three times faster than most residential Wi-Firouters and offers a range of integrated tools for customersto manage access and usage by multiple users and devices inthe home
- Made several enhancements to Fibe TV service, including Fullhigh-definition (HD) movies and the ability to add programmingright from a user’s remote. We also added more live andon-demand programming, including more than 5,000 episodesof children’s shows with Kids Suite, more HD games with MajorLeague Baseball Extra Innings and a new premium channelbeIN Sports
- Launched Business Bundles, which include services such asunlimited Fibe Internet, phone lines with calling features andonline security, with guaranteed pricing for 36 months
- Launched an exclusive and unique optical network terminal(ONT) for business service, supporting up to four voice linesand 4 gigabit Ethernet interfaces that offer full 1 gigabitper second (Gbps) throughput, making it an ideal solutionfor business customers
2015 FOCUS
- Continue to enhance our Fibe TV service
- In February 2015, we introduced an innovative Fibe TV feature called Restart, enabling customers to rewind and watch TV shows already in progress from the beginning. In addition, we further enhanced the Fibe TV on-screen menu and channel guide with fast access to the main menu from anywhere in the Fibe TV experience, a larger channel preview window, a Last Peek feature that shows picture-in-picture for the last 5 channels tuned, and an improved universal search.
- Expand our total base and market share of TV and Internetsubscribers profitably
- Continue to reduce total wireline residential net losses
- Increase residential household ARPU through greaterthree-product household penetration
- Increase share of wallet of large enterprise customersthrough greater focus on business service solutions andconnectivity growth
- Expand and improve sales distribution and coverage in ourmid-sized business segment
- Increase the number of net new customer relationships inboth large and mid-sized business and reduce small businesscustomer losses
- Complete the integration of Bell Aliant to generate operatingcost and capital investment synergies
| 2.3 Expand media leadership |

We continue to deliver leading sports, news, entertainment and business content across multiple broadband platforms – TV, Internet, smartphones and tablets. Our objectives are to grow audiences, introduce new services and create new revenue streams for our media assets. We also plan to create more of our own content, ensuring that Canadian attitudes, opinions, values and artistic creativity are reflected in our programming and in our coverage of events in Canada and around the world.
2014 PROGRESS
- Maintained CTV’s #1 ranking as the most-watched networkin Canada for the 13th year in a row, and continued to leadwith a majority of the Top 20 programs nationally in allkey demographics
- Expanded TSN, Canada’s sports leader and the leading specialtyTV network in the country, from two to five national feeds,fully leveraging Bell Media’s unparalleled portfolio of premiumsports programming
- In December 2014, Bell Media concluded a multi-year broadcastrights agreement with UEFA, making TSN and RDS theprimary Canadian broadcasters of the crown jewels ofclub soccer – the UEFA Champions League and UEFA EuropaLeague – beginning in 2015
- Concluded a comprehensive media rights agreement with theUnited States Golf Association for exclusive Canadian coverageof the U.S. Open on TSN and RDS through to 2022
- Concluded an agreement with CBC/Radio-Canada to be theofficial sports specialty broadcaster for the PyeongChang 2018Winter Olympic Games and the Tokyo 2020 SummerOlympic Games
38 BCE Inc. 2014 ANNUAL REPORT | |||
MD&A | STRATEGIC IMPERATIVES | 2 |
- Launched CraveTV subscription video on-demand (SVOD)TV streaming service, offering the largest collection of premiumcontent in one place with more than 10,000 hours of TVprogramming and approximately 350 unique titles of popularseries and movies within the first year on STBs, mobile devicesand online
- Acquired the exclusive Canadian multi-platform rights, includingSVOD, to HBO’s off-air catalogue of TV programming, complementing a multi-year, multi-platform agreement that will seeHBO Canada exclusively deliver the entire past-season libraryof every HBO scripted series currently on air
- Expanded TV Everywhere offerings with the launch of TSN GO,enabling subscribers to access more than 6,000 hours of livesports and on-demand coverage of the most popular anddiverse lineup of sports programming in Canada on theirsmartphones, tablets and computers at no additional charge.We also launched Super Écran GO, providing instant andunlimited access to Super Écran programming. Bell Medianow offers 12 mobile GO products, including TMN GO, CTV GO,RDS GO and Bravo GO
- Invested in Canadian digital startup Hubub, a new digitalplatform for exploring and discussing interests, and obtainedthe exclusive rights to monetize Hubub in Canada
2015 FOCUS
- Maintain strong audience levels and ratings acrossall TV and radio properties
- Reinforce industry leadership in conventional TV, pay TV,sports media and radio
- Grow viewership and scale of new CraveTV on-demandTV streaming service
- Develop in-house production and content creation fordistribution and use across all platforms and screens
- Expand live and on-demand content through TV Everywhere services
- Grow French media properties
- Leverage cross-platform and integrated sales and sponsorship
- In support of the above focus areas, in January 2015, Bell Mediaconcluded a long-term content licensing and trademarkagreement to bring the Showtime brand to Canada for the firsttime with hundreds of hours of past, present and future Showtime-owned programming being made available across all platforms inEnglish and French, including CraveTV and TMN
| 2.4 Invest in broadband networks and services |

We invest in wireline and wireless broadband platforms to deliver the most advanced wireless, TV, Internet and other IP-based services available, to support continued subscriber and data growth across all our residential product lines as well as the needs of our business market customers.
2014 PROGRESS
- Expanded our next-generation 4G LTE wireless network to reach86% of the Canadian population coast to coast
- Increased mobile 4G LTE network speeds by up to 45% acrossour entire service footprint, giving Bell Mobility and Virgin Mobilecustomers faster mobile access to the Internet and data services
- Acquired 31 licences for 480 million MHz-POP of nationwide700 MHz spectrum for $566 million following Industry Canada’sfederal wireless spectrum auction, bringing Bell’s total spectrumholdings to more than 4,200 million MHz-POP nationally
- Launched Canada’s first 700 MHz spectrum LTE network inHamilton, Ontario in early April
- Launched 4G LTE mobile service in 52 communities in AtlanticCanada and in seven communities in the Northwest Territories
- Extended our Fibe TV service coverage to reach more than5 million households across Ontario and Québec, up fromapproximately 4.3 million at the end of 2013. IncludingBell Aliant’s FibreOP service area, BCE’s total IPTV footprintnow covers 6 million homes, up from 5.1 million at the endof 2013, including 2.1 million passed with FTTH.
- Began the deployment of an FTTH network that will bringadvanced Bell Fibe TV and Internet services to Kingston, Ontario.Kingston is the second municipality, after Québec City, in Bell’sincumbent Ontario and Québec wireline footprint, where we aredeploying FTTH city-wide, bringing high-speed fibre technologydirectly into homes and businesses.
2015 FOCUS
- Continue broadband fibre deployment and IPTV service coverage expansion with increasing focus on growing FTTH footprint
- Complete 4G LTE wireless network build and manage wirelessnetwork capacity
BCE Inc. 2014 ANNUAL REPORT 39 | |||
2 | STRATEGIC IMPERATIVES | MD&A |
| 2.5 Achieve a competitive cost structure |

Cost containment is a core element of our financial performance. It remains a key factor in our objective to preserve steady margins as we continue to experience revenue declines in our legacy wireline voice and data services and further shift our product mix towards growth services. We aim to accomplish this through operating our business in the most cost-effective way possible to extract maximum operational efficiency and productivity gains.
2014 PROGRESS
- Maintained relatively stable Bell Wireline and consolidatedAdjusted EBITDA margins(1)compared to 2013
- Reduced Bell Mobility call centre costs per customer by 30%since 2010 through investment in enhanced call centre systemsand online self-serve options for customers
- Realized fully the cost synergies from the integration of Astralinto Bell Media
- Continued to tightly manage travel and discretionary spending
- Raised $1.25 billion in gross proceeds from public debt offerings thatlowered Bell Canada’s average after-tax rate of borrowing to 3.4%
- Completed the Privatization of Bell Aliant and began itsintegration into Bell’s operations, simplifying BCE’s corporate structure and increasing overall operating and capital investment efficiencies, including wholesale cost savings, as we move Atlantic branches of major business customers onto the national Bell network
2015 FOCUS
- Realize operating cost and capital expenditure synergiesfrom the integration of Bell Aliant into our Bell Wireline andBell Wireless segments
- Deliver cost savings from cost of revenue initiatives, reductionsin sales, general and administrative expenses, and labourefficiencies across Bell to support maintenance of a stableconsolidated Adjusted EBITDA margin
| 2.6 Improve customer service |

Our objective is to enhance customers’ overall experience with Bell by delivering call centre efficiency, meeting commitments for the installation and timely repair of services, increasing network quality, and implementing process improvements to simplify customer transactions and interactions with our front-line employees and self-serve tools. All of these will help differentiate us from our competitors and gain long-term customer loyalty. We intend to achieve this by making the investments we need to improve our front-line service capabilities, our networks, our products and our distribution channels to win and keep customers.
2014 PROGRESS
- Launched two new eBill features, the Personalized Bill Explainer and Mobility Bill Interactive Tour, to enhance the customer experience by proactively addressing the most common billing questions:
- Personalized Bill Explainer generates custom messaging onevery eBill to explain various bill components that are uniqueto each customer
- Mobility Bill Interactive Tour provides an interactive tour tohelp customers better understand their bill the first time theylog into their account
- Reduced customer calls to our service centres by 34%since 2011 through growing use of self-serve and improvedfirst-call resolution
- Reduced Fibe TV installation time by 10% in 2014 and 27% sincethe beginning of 2012
- Introduced two-hour appointment windows forFibe TV installations
- Introduced flexible evening and weekend repair and installationappointments for small business customers and reduced the timebetween ordering and installation from four days to two days
- Introduced Bell Tech Expert premium tech support, offering BellInternet customers setup, troubleshooting, training and optimization services for any connected device
- Launched Device Hub, a pilot program that integrates thein-store process with other Bell systems for a more seamlessrepair service
- Launched the Bell Business Concierge program, offering smallbusinesses front of the line access to dedicated advisors,customer service representatives and technical support whocan deliver faster, more tailored service
- Launched a Business Self-Serve portal to provide small businesscustomers with a secure, no-cost and easy way to manage theiraccount information, including the ability to view and pay billsanytime from anywhere they have an Internet connection, set uppre-authorized payments, download, save or print bills, accessaccount information and get customer service support from anonline agent
2015 FOCUS
- Invest over $100 million in customer service initiatives, simplifying complexity for all customers including billing
- In January 2015, began to introduce personalized videos for new Mobility customers that explain what to expect on the first bill, how to check usage and update phone features, and how to manage accounts throughMyBell.caand the MyBell mobile app
- Reduce total volume of wireline and wireless customer callsto our residential and wireless services call centres
- Further improve customer satisfaction scores
- Achieve better consistency in customer experience
- Improve customer personalization
| (1) | Adjusted EBITDA margin is a non-GAAP financial measure and does not have any standardized meaning under IFRS. Therefore, it is unlikely to be comparable to similar measures presented by other issuers. See section 10.2,Non-GAAP financial measures and key performance indicators (KPIs) – Adjusted EBITDA and Adjusted EBITDA marginfor more details. |
40 BCE Inc. 2014 ANNUAL REPORT | |||
MD&A | PERFORMANCE TARGETS, OUTLOOK, ASSUMPTIONS AND RISKS | 3 |
| 3 PERFORMANCE TARGETS, OUTLOOK, ASSUMPTIONS AND RISKS |
This section provides information pertaining to our performance against 2014 targets, our consolidated business outlook and operating assumptions for 2015 and our principal business risks.
| 3.1 2014 performance vs. guidance targets |
| FINANCIAL GUIDANCE | 2014 TARGET | 2014 PERFORMANCE AND RESULTS | ACHIEVED | ||
| BELL | Revenue growth | 2%–4% | 3.5% | Increase reflected revenue growth of 6.7% at Bell Wireless and 14.9% at Bell Media, driven by the acquisition of Astral, moderated by a 0.6% decrease at Bell Wireline. |
|
| Adjusted EBITDA growth | 3%–5% | 3.7% | Driven by the increased contribution of Bell growth services (wireless, TV, Internet/ other wireline broadband and media), which delivered a 5.5% year-over-year increase in revenues, outpacing the decline in traditional wireline voice services. This, together with tight operating cost control, drove a 10 basis point improvement in Adjusted EBITDA margin to 37.7%. |
| |
| Capital intensity | 16%–17% | 16.8% | Bell invested $3,142 million in new capital in 2014, an increase of 4.7% over 2013, corresponding to a capital intensity ratio of 16.8%. These investments supported the continued deployment of broadband fibre to homes and businesses to expand our Fibe TV service footprint and enable faster Internet speeds; the continuing roll-out of 4G LTE mobile service in markets across Canada; higher spending on network capacity to support increasing Internet bandwidth usage and mobile data consumption; and enhancements to our customer service delivery systems. |
| |
| BCE | Adjusted Net Earnings Per Share (Adjusted EPS)(1) | $3.10–$3.20 | $3.18 | Increase in Adjusted net earnings reflected higher Adjusted EBITDA, driven by strong Bell Wireless and Bell Media Adjusted EBITDA growth of 9.6% and 7.5%, respectively, lower net pension financing cost and mark-to-market gains realized on equity derivatives used as economic hedges of share-based compensation and U.S. dollar purchases. This was partly offset by a 0.7% decrease in Bell Wireline Adjusted EBITDA, which represented a significant improvement in the pace of decline compared to 2013, and a net impairment charge, mainly in conventional TV, resulting from ongoing softness in the overall Canadian TV advertising market and higher content costs. |
|
| Free Cash Flow growth | 3%–7% | 6.7% | Higher Free Cash Flow of $2,744 million in 2014 was driven by healthy Adjusted EBITDA growth partly offset by increased capital expenditures. With the Privatization of Bell Aliant on October 31, 2014, BCE’s Free Cash Flow in 2014 included two months of contribution from Bell Aliant, rather than cash dividends received from Bell Aliant. |
| |
3.2 Business outlook and assumptions
Outlook
BCE’s 2015 outlook builds on the positive wireless and wireline momentum we delivered in 2014 and reflects continued progress in the execution of our six Strategic Imperatives to drive healthy projected revenues, Adjusted EBITDA, earnings and Free Cash Flow growth from operations, which is expected to support substantial capital investment programs in strategic network infrastructure and a higher BCE common share dividend for 2015.
The key 2015 operational priorities for Bell are to:
- Maintain market share momentum of incumbent postpaid subscriber activations, while managing the financial and churn impacts from unusual market activity that could result from the significantly increased number of customers with two- or three-year service contracts who will be eligible to renew their plans and change carriers over the next two years as a result of the Wireless Code, to the extent that the CRTC’s June 3, 2015 Wireless Code application date is found to be valid
- Drive above industry-average wireless blended ARPU andAdjusted EBITDA growth
- Complete 4G LTE wireless network build and manage wirelessnetwork capacity
- Continue broadband fibre deployment with increasing focus onexpanding FTTH footprint
- Increase total net residential subscriber activations and drivegreater three-product household penetration through targetedbundle offers led by Fibe TV
- Deliver positive full-year wireline revenue and AdjustedEBITDA growth
| (1) | Adjusted net earnings and Adjusted EPS are non-GAAP financial measures and do not have any standardized meaning under IFRS. Therefore, they are unlikely to be comparable to similar measures presented by other issuers. See section 10.2,Non-GAAP financial measures and key performance indicators (KPIs) - Adjusted net earnings and Adjusted EPSin this MD&A for more details, including reconciliation to the most comparable IFRS financial measures. |
BCE Inc. 2014 ANNUAL REPORT 41 | |||
3 | PERFORMANCE TARGETS, OUTLOOK, ASSUMPTIONS AND RISKS | MD&A |
- Slow the pace of revenue and Adjusted EBITDA decline in ourBell Business Markets unit
- Increase the scale of Bell Media’s new CraveTV on-demandTV streaming service
- Control rising TV and multi-platform media content costs
- Realize operating cost and capital expenditure synergiesfrom the integration of Bell Aliant into our Bell Wireline andBell Wireless operating segments
- Continue to drive customer service improvement while executing on cost reductions across the Bell organization to support healthy Adjusted EBITDA margins across all our businesses
Our planned financial performance for 2015 enabled the company to increase the annualized BCE common dividend by 13 cents, or 5.3%, to $2.60 per share, maintaining our payout ratio comfortably within our target policy range of 65% to 75% of Free Cash Flow.
| Assumptions |
ASSUMPTIONS ABOUT THE CANADIAN ECONOMY
- Slower economic growth, given the Bank of Canada’s mostrecent estimate for Canadian gross domestic product growthof approximately 2.1% in 2015, compared to estimatedgrowth of 2.3% in 2014
- Weaker employment growth compared to 2014, as the overalllevel of business investment is expected to remain soft
- Interest rates to remain largely unchanged in 2015 or slightlydecrease year-over-year
MARKET ASSUMPTIONS
- A sustained level of wireline and wireless competition in bothconsumer and business markets
- Higher, but slowing, wireless industry penetration andsmartphone adoption
- A relatively stable media advertising market and escalatingcosts to secure TV programming
- Industry pricing discipline maintained on a higher expectednumber of subscriber renewals resulting from the expiryof 2 or 3 year service contracts due to the Wireless Codeimplemented in 2013
| 3.3 Principal business risks |
Provided below is a summary description of certain of our principal business risks that could have a material adverse effect on all of our segments. Certain additional business segment-specific risks are reported in section 5,Business segment analysis. For a detailed description of the risks relating to our regulatory environment and a description of the other principal risks that could have a material adverse effect on our business, refer to section 8,Regulatory environment, and section 9,Business risks, respectively.
| Regulatory environment |
Although most of BCE’s wireline and wireless services are forborne from price regulation under theTelecommunications Act, the Government of Canada and its relevant departments and agencies, including the CRTC, Industry Canada, Canadian Heritage and the Competition Bureau, continue to play a significant role in telecommunications and broadcasting policy and regulation, such as spectrum auctions, approval of acquisitions, foreign ownership and broadcasting, and this may adversely affect our competitive position. The federal government may take positions against the telecommunications and media industries in general, or specifically against Bell Canada or certain of its subsidiaries. More precisely, the following are examples of regulatory matters that could have negative financial, operational, competitive and reputational consequences for our business:
- Increasing regulatory and government intervention
- Adverse changes in the Canadian regulatory framework, suchas the introduction of new regulatory standards, the increasingregulation of our wireless business, or other regulatory decisionscontrary to our business interests more generally
| Competitive environment |
We face intense competition across all business segments and key product lines that could adversely affect our market shares, service volumes and pricing strategies and, consequently, our financial results. The rapid development of new technologies, services and products has altered the traditional lines between telecommunications, Internet and broadcasting services and brought new global competitors to our markets, which are redefining customer expectations. Technology substitution and IP networks, in particular, continue to reduce barriers to entry in our industry. This has allowed competitors to launch new products and services and gain market share with far less investment in financial, marketing, personnel and technological and network resources than has historically been required. In particular, some competitors sell their services through the use of our networks, without the need to invest to build their own networks. Such lower necessary investment has enabled some competitors to be very disruptive in their pricing. We expect these trends to continue in the future, which could adversely affect our growth and our financial performance.
The nature and degree of competition in all of our markets are constantly evolving with changing market and economic conditions as well as expansion into new business areas, such as media, that can be more cyclical. Competition can intensify as markets mature, market structure changes through vertical integration, the state of the economy impacts advertising and new competitors bring aggressive promotional offers and adjusted strategic brand positioning. BCE’s
42 BCE Inc. 2014 ANNUAL REPORT | |||
MD&A | PERFORMANCE TARGETS, OUTLOOK, ASSUMPTIONS AND RISKS | 3 |
telecommunications and media network assets are challenged by changes such as the proliferation of cheaper IP-based communication, over-the-top (OTT) delivery mechanisms, cloud services and PVR technologies, and the influence of global brands. Such a competitive environment could negatively impact our business including, without limitation, in the following ways:
- Wireline pricing pressures, product substitutions and spendingrationalization by business customers could result in anacceleration of NAS line erosion beyond our current expectations
- As wireless penetration in Canada reaches higher levels,acquiring new customers could become more difficult
- Competitors’ aggressive market offers could result in pricingpressures, and increased costs of acquisition and retention
- A fundamental separation of content and connectivity isemerging, allowing the expansion and market penetrationof low-cost OTT TV providers and other alternative serviceproviders, which is changing our TV and media ecosystemsand could affect our business negatively
- Programming costs continue to rise for TV providers
For a discussion of our competitive environment and competition risk, as well as a list of our main competitors, on a segmented basis, refer toCompetitive landscape and industry trendsandPrincipal business risksin section 5,Business segment analysis.
| Economic and financial market conditions |
Our businesses are affected by general economic and financial market conditions, consumer confidence and spending, and the demand for and prices of our products and services. Adverse economic conditions, such as economic downturns or recessions, adverse conditions in the financial markets, or a declining level of retail and commercial activity, could have a negative impact on the demand for our wireline, wireless and media products and services.
More specifically, adverse economic and financial market conditions could result in:
- Customers delaying or reducing purchases of our productsand services or discontinuing using them
- A decrease in advertising revenues for our media businesses
- A decline in the creditworthiness of our customers, which couldincrease our bad debt expense
| Information security (cyber and other threats) |
Our operations, service performance and reputation depend on how well we protect our networks, systems, applications, data centres and electronic and physical records, and the business and personal information stored therein, against cyber attacks, unauthorized access or entry, damage from fire, natural disaster and other events referred to in section 9,Business risks – Performance of critical infrastructure. The protection and the effective organization of our systems, applications and information repositories are central to the secure operation of our networks and business as electronic and physical records of proprietary business and personal data, such as confidential customer and employee information, are all sensitive from a market and privacy perspective. In particular, cyber threats, which include cyber attacks such as, but not limited to, hacking, computer viruses, denial of service attacks, industrial espionage, unauthorized access to confidential, proprietary or sensitive information or other breaches of network or IT security, are constantly evolving and IT defences need to be constantly monitored and adapted. Vulnerabilities could harm our brand and reputation as well as our customer relationships and may lead to:
- Network operating failures and service disruptions, whichcould directly impact our customers’ ability to maintain normalbusiness operations and deliver critical services
- The theft, loss or leakage of confidential information, includingcustomer or employee information, that could result in financialloss, exposure to claims of damages by customers and employees,and difficulty in accessing materials to defend legal cases
- The potential for loss of subscribers or impairment of our abilityto attract new ones
| Complexity and service and operational effectiveness |
Business performance can be difficult in a complex multi-product environment with multiple technology platforms, billing systems, marketing databases and a myriad of rate plans, promotions and product offerings. In addition, our product offerings and related pricing plans may be too complex for customers to fully evaluate, while other service providers may benefit from simpler distribution models. Providing service that is consistently recognized by customers as superior is a differentiator. As the foundation of effective customer service stems from our ability to deliver simple solutions to customers in an expeditious manner, complexity in our operations may limit BCE’s ability to respond quickly to market changes and reduce costs. Complexity in our operations may also lead to customer confusion or billing errors which could adversely affect customer satisfaction, acquisition and retention.
Complexity and service and operational effectiveness challenges that could adversely affect BCE’s business, including our ability to efficiently manage networks, deliver services and control costs, include:
- The integration of multiple technology platforms to support ourmulti-product strategy
- The development of new technological platforms andassociated processes to support new business models anddelivery mechanisms
- The increasing number of smartphone users and our growingBell Fibe TV customer base, which could require more supportfrom our customer contact centres than currently anticipated
- The ability to leverage our electronic ecosystem to makecustomer interaction simpler and more efficient
BCE Inc. 2014 ANNUAL REPORT 43 | |||
4 | CONSOLIDATED FINANCIAL ANALYSIS | MD&A |
| 4 CONSOLIDATED FINANCIAL ANALYSIS |
This section provides detailed information and analysis about BCE’s performance in 2014 compared with 2013. It focuses on BCE’s consolidated operating results and provides financial information for each of our businesses. For further discussion and analysis of our Bell Wireless, Bell Wireline, Bell Media and Bell Aliant business segments, refer to section 5,Business segment analysis.
4.1 Introduction
BCE consolidated income statements
| 2014 | 2013 | $ CHANGE | % CHANGE | ||||
Operating revenues | 21,042 | 20,400 | 642 | 3.1 | % | |||
Bell | 18,734 | 18,109 | 625 | 3.5 | % | |||
Bell Aliant | 2,757 | 2,759 | (2 | ) | (0.1 | %) | ||
Inter-segment eliminations | (449 | ) | (468 | ) | 19 | 4.1 | % | |
Operating costs | (12,739 | ) | (12,311 | ) | (428 | ) | (3.5 | %) |
Adjusted EBITDA | 8,303 | 8,089 | 214 | 2.6 | % | |||
Bell | 7,066 | 6,817 | 249 | 3.7 | % | |||
Bell Aliant | 1,237 | 1,272 | (35 | ) | (2.8 | %) | ||
Adjusted EBITDA margin | 39.5 | % | 39.7 | % | (0.2 | %) | ||
Bell | 37.7 | % | 37.6 | % | 0.1 | % | ||
Bell Aliant | 44.9 | % | 46.1 | % | (1.2 | %) | ||
Severance, acquisition and other costs | (216 | ) | (406 | ) | 190 | 46.8 | % | |
Depreciation | (2,880 | ) | (2,734 | ) | (146 | ) | (5.3 | %) |
Amortization | (572 | ) | (646 | ) | 74 | 11.5 | % | |
Finance costs | ||||||||
Interest expense | (929 | ) | (931 | ) | 2 | 0.2 | % | |
Interest on post-employment benefit obligations | (101 | ) | (150 | ) | 49 | 32.7 | % | |
Other income (expense) | 42 | (6 | ) | 48 | n.m. | |||
Income taxes | (929 | ) | (828 | ) | (101 | ) | (12.2 | %) |
Net earnings | 2,718 | 2,388 | 330 | 13.8 | % | |||
Net earnings attributable to: | ||||||||
Common shareholders | 2,363 | 1,975 | 388 | 19.6 | % | |||
Preferred shareholders | 137 | 131 | 6 | 4.6 | % | |||
Non-controlling interest | 218 | 282 | (64 | ) | (22.7 | %) | ||
Net earnings | 2,718 | 2,388 | 330 | 13.8 | % | |||
Adjusted net earnings attributable to common shareholders | 2,524 | 2,317 | 207 | 8.9 | % | |||
Net earnings per common share (EPS) | 2.98 | 2.55 | 0.43 | 16.9 | % | |||
Adjusted EPS | 3.18 | 2.99 | 0.19 | 6.4 | % |
n.m.: not meaningful
BCE had a successful 2014, delivering revenue and Adjusted EBITDA growth of 3.1% and 2.6%, respectively, with a relatively stable year-over-year Adjusted EBITDA margin of 39.5% in 2014 compared to 39.7% in 2013, higher Adjusted net earnings growth of 8.9%, and a Free Cash Flow increase of 6.7%. This performance was driven by continued strong Bell Wireless results together with an improved Bell Wireline financial profile and a favourable contribution from Bell Media, which benefitted from the acquisition of Astral on July 5, 2013.
Net earnings in 2014 increased 13.8% compared to 2013, reflecting Adjusted EBITDA growth, a decrease in severance, acquisition and other costs and net mark-to-market gains realized on derivatives used as economic hedges of share-based compensation and U.S. dollar purchases, partly offset by higher net depreciation and amortization expense and a net impairment charge, mainly in conventional TV, resulting from ongoing softness in the overall Canadian TV advertising market and higher content costs.
Our earnings and Free Cash Flow supported increased capital investment in our strategic priorities, particularly our broadband wireless and wireline networks and services, which helped to drive higher wireless, TV and Internet subscribers, while supporting the return of value to BCE shareholders through higher dividends.
44 BCE Inc. 2014 ANNUAL REPORT | |||
MD&A | CONSOLIDATED FINANCIAL ANALYSIS | 4 |
| 4.2 Customer connections |
TOTAL BCE CONNECTIONS
| 2014 | 2013 | % CHANGE | |||
Wireless subscribers | 8,118,628 | 7,925,032 | 2.4 | % | ||
Postpaid | 7,110,047 | 6,798,093 | 4.6 | % | ||
High-speed Internet subscribers | 3,297,026 | 3,136,636 | 5.1 | % | ||
TV (satellite and IPTV subscribers) | 2,642,608 | 2,489,248 | 6.2 | % | ||
IPTV | 933,547 | 657,513 | 42.0 | % | ||
Total growth services | 14,058,262 | 13,550,916 | 3.7 | % | ||
Wireline NAS lines | 7,130,852 | 7,595,569 | (6.1 | %) | ||
Total services | 21,189,114 | 21,146,485 | 0.2 | % | ||
| ||||||
BCE NET ACTIVATIONS | ||||||
| 2014 | 2013 | % CHANGE | |||
Wireless subscribers | 193,596 | 220,608 | (12.2 | %) | ||
Postpaid | 311,954 | 381,740 | (18.3 | %) | ||
High-speed Internet subscribers | 160,390 | 91,401 | 75.5 | % | ||
TV (Satellite and IPTV subscribers) | 153,360 | 177,183 | (13.4 | %) | ||
IPTV | 276,034 | 286,195 | (3.6 | %) | ||
Total growth services | 507,346 | 489,192 | 3.7 | % | ||
Wireline NAS lines | (464,717 | ) | (540,740 | ) | 14.1 | % |
Total services | 42,629 | (51,548 | ) | n.m. | ||
n.m.: not meaningful
BCE added 507,346 net new customer connections to its growth services in 2014, up 3.7% year over year. This was comprised of:
- 311,954 postpaid wireless customers, partly offset by the net lossof 118,358 prepaid wireless customers
- 160,390 high-speed Internet customers
- 153,360 TV customers, including 276,034 net new IPTV customers
NAS net losses of 464,717 in 2014 improved 14.1% compared to last year.
Total BCE customer connections across all services grew 0.2% in 2014, reflecting an increase of 3.7% in growth services connections along with a moderating decline in legacy wireline NAS lines of 6.1% compared to last year. At the end of 2014, BCE customer connections totalled 21,189,114 and were comprised of the following:
- 8,118,628 wireless subscribers, up 2.4%, which included7,110,047 postpaid wireless subscribers, an increase of 4.6% sincethe end of last year
- 3,297,026 high-speed Internet subscribers, 5.1% higheryear over year
- 2,642,608 total TV subscribers, up 6.2%, which included933,547 IPTV customers, up 42.0% year over year
- 7,130,852 total NAS lines, a decline of 6.1% compared to last year
| 4.3 Operating revenues |

| 2014 | 2013 | $ CHANGE | % CHANGE | ||||
Bell Wireless | 6,241 | 5,849 | 392 | 6.7 | % | |||
Bell Wireline | 10,040 | 10,097 | (57 | ) | (0.6 | %) | ||
Bell Media | 2,937 | 2,557 | 380 | 14.9 | % | |||
Inter-segment eliminations | (484 | ) | (394 | ) | (90 | ) | (22.8 | %) |
Bell | 18,734 | 18,109 | 625 | 3.5 | % | |||
Bell Aliant | 2,757 | 2,759 | (2 | ) | (0.1 | %) | ||
Inter-segment eliminations | (449 | ) | (468 | ) | 19 | 4.1 | % | |
Total BCE operating revenues | 21,042 | 20,400 | 642 | 3.1 | % |
BCE Inc. 2014 ANNUAL REPORT 45 | |||
4 | CONSOLIDATED FINANCIAL ANALYSIS | MD&A |
BCE
Total operating revenues for BCE were up 3.1% in 2014 due to higher revenues at Bell. Bell Aliant revenues were essentially unchanged compared to 2013
BELL
- Bell operating revenues increased 3.5% in 2014, due to higherrevenues at both Bell Wireless and Bell Media, which included thefavourable impact from the acquisition of Astral. This was partlyoffset by lower revenues at Bell Wireline.
- Operating revenues for Bell in 2014 were comprised of servicerevenues of $17,133 million, which were 3.8% higher than in 2013,and product revenues of $1,601 million, which were essentiallyunchanged compared to last year
BELL WIRELESS
Revenue growth of 6.7% in 2014 was driven by:
- A larger postpaid customer base and growth in blended ARPUattributable to higher average monthly rates and greater datausage consistent with an increased smartphone customer mix aswell as increased usage of data applications
- Wireless service and product revenues increased 6.4% and 11.8%respectively, compared to 2013
BELL WIRELINE
Revenues decreased 0.6% in 2014, which reflected:
- Continued declines in legacy voice and data revenues, competitive pricing in the business and wholesale markets, and decreased product sales to business customers and at The Source
This was partly offset by:
- Higher Internet and TV service revenues in 2014, as well as growth in IP connectivity and business service solutions revenues
BELL MEDIA
Revenue growth of 14.9% in 2014 reflected:
- The acquisition of Astral on July 5, 2013
- Higher subscriber fee revenues driven by increasedmarket-based rates for Bell Media’s specialty services
This was partly offset by:
- Lower advertising revenues, due to general softness in the advertising market and a shift in advertising dollars to the broadcaster of the Sochi 2014 Winter Olympic Games and 2014 FIFA World Cup Soccer
BELL ALIANT
Revenues were essentially unchanged compared to 2013, decreasing 0.1%, as continued declines in local and access, and long distance revenues, as well as reduced equipment and other revenues, were mostly offset by growth in Internet, TV, and other IP broadband connectivity service revenues
| 4.4 Operating costs |
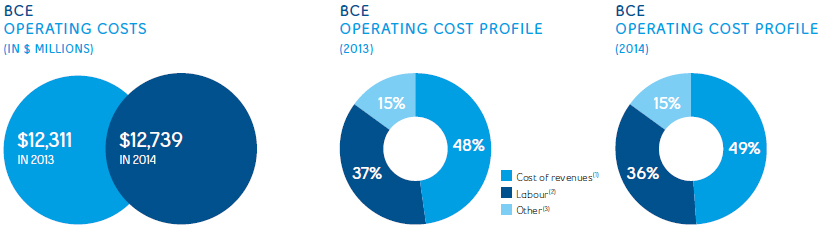
| 2014 | 2013 | $ CHANGE | % CHANGE | ||||
Bell Wireless | (3,677 | ) | (3,509 | ) | (168 | ) | (4.8 | %) |
Bell Wireline | (6,272 | ) | (6,303 | ) | 31 | 0.5 | % | |
Bell Media | (2,203 | ) | (1,874 | ) | (329 | ) | (17.6 | %) |
Inter-segment eliminations | 484 | 394 | 90 | 22.8 | % | |||
Bell | (11,668 | ) | (11,292 | ) | (376 | ) | (3.3 | %) |
Bell Aliant | (1,520 | ) | (1,487 | ) | (33 | ) | (2.2 | %) |
Inter-segment eliminations | 449 | 468 | (19 | ) | (4.1 | %) | ||
Total BCE operating costs | (12,739 | ) | (12,311 | ) | (428 | ) | (3.5 | %) |
| (1) | Cost of revenues includes costs of wireless devices and other equipment sold, network and content costs, and payments to other carriers. |
| (2) | Labour costs (net of capitalized costs) include wages, salaries, and related taxes and benefits, post-employment benefit plans service cost, and other labour costs, including contractor and outsourcing costs. |
| (3) | Other operating costs include marketing, advertising and sales commission costs, bad debt expense, taxes other than income taxes, IT costs, professional service fees and rent. |
46 BCE Inc. 2014 ANNUAL REPORT | |||
MD&A | CONSOLIDATED FINANCIAL ANALYSIS | 4 |
BCE
Total operating costs increased 3.5% in 2014, driven by higher operating costs at Bell compared to 2013, due mainly to the acquisition of Astral, as well as an increase in operating costs at Bell Aliant
BELL
Total Bell operating costs increased 3.3% in 2014, reflecting higher operating costs in our Bell Wireless and Bell Media segments, partly offset by lower operating costs at Bell Wireline
BELL WIRELESS
The 4.8% increase in operating costs over the previous year was driven by:
- Higher investment in customer retention spending driven by anincreased number of smartphone upgrades
- Higher payments to other carriers from greater datausage volumes
- Increased network operating costs attributable to LTE networkexpansion and usage
This was moderated by:
- Decreased labour costs due to reduced customer call volumes, lower bad debt expense, and a decline in wireless content costs
BELL WIRELINE
Operating costs decreased $31 million or 0.5% in 2014, reflecting:
- Lower cost of goods sold, driven by reduced data product andequipment sales
- Reduced bad debt expense
- Lower post-employment benefit plans service cost resultingfrom a higher discount rate used in 2014 compared to 2013 tovalue post-employment benefit obligations
- Reduced labour costs driven mainly by lower call volumes
Additionally, the year-over-year decrease reflected a charge recorded in Q1 2013 relating to a CRTC decision with respect to our wholesale high-speed access services business that did not recur this year.
The year-over-year decrease in operating costs was partly offset by higher programming costs for Bell TV driven by a higher number of subscribers, increased costs to support a larger Fibe TV and Internet subscriber base, and greater payments to other carriers, as well as increased marketing and sales costs.
BELL MEDIA
Operating costs increased 17.6% in 2014, as a result of:
- The acquisition of Astral
- Increased costs for sports broadcast rights
This was partly offset by:
- Cost synergies realized from the integration of Astral into Bell Media in 2014
BELL ALIANT
Operating costs increased 2.2% in 2014 due to:
- Higher IPTV content costs
- Increased customer service costs related to growing andsupporting customers on Bell Aliant’s FibreOP services
This was offset in part by:
- Negotiated reductions in payments to other carriers
- Ongoing workforce restructuring
- Lower post-employment benefit plans service costs from ahigher discount rate used in 2014 compared to 2013 to valuepost-employment benefit obligations
| 4.5 Adjusted EBITDA |

| 2014 | 2013 | $ CHANGE | % CHANGE | ||||
Bell Wireless | 2,564 | 2,340 | 224 | 9.6 | % | |||
Bell Wireline | 3,768 | 3,794 | (26 | ) | (0.7 | %) | ||
Bell Media | 734 | 683 | 51 | 7.5 | % | |||
Bell | 7,066 | 6,817 | 249 | 3.7 | % | |||
Bell Aliant | 1,237 | 1,272 | (35 | ) | (2.8 | %) | ||
Total BCE Adjusted EBITDA | 8,303 | 8,089 | 214 | 2.6 | % |
BCE
Adjusted EBITDA increased 2.6% in 2014, with an Adjusted EBITDA margin of 39.5% compared to 39.7% in 2013. The year-over-year increase in Adjusted EBITDA reflected growth at Bell, partly offset by decreased Adjusted EBITDA at Bell Aliant.
BCE Inc. 2014 ANNUAL REPORT 47 | |||
4 | CONSOLIDATED FINANCIAL ANALYSIS | MD&A |

BELL
Bell’s Adjusted EBITDA increased 3.7% in 2014, driven by:
- Strong Bell Wireless Adjusted EBITDA growth that was partly offset by slightly lowerBell Wireline Adjusted EBITDA compared to 2013
- Our acquisition of Astral on July 5, 2013, which contributed to higher Bell MediaAdjusted EBITDA
Bell’s Adjusted EBITDA margin in 2014 remained relatively stable at 37.7%, compared to 37.6% in 2013. This reflected:
- The flow-through impact of higher year-over-year wireless ARPU
- Lower wireline voice erosion and stabilizing year-over-year businessmarkets performance
- Increasing Fibe TV scale and growth in three-product households
- Lower wireline operating costs
This was partly offset by:
- Increased wireless customer retention spending
- Higher costs to support a larger Fibe TV and Internet subscriber base
- A greater percentage of lower margin media revenues in Bell’s revenue mixdue to the Astral acquisition
BELL WIRELESS
Bell Wireless Adjusted EBITDA grew 9.6% in 2014, as a result of:
- Higher operating revenues, driven by a larger postpaid customerbase and higher ARPU
- Disciplined subscriber acquisition and retention spending
BELL WIRELINE
Bell Wireline’s Adjusted EBITDA decline of 0.7% in 2014 was driven mainly by:
- The ongoing loss of high-margin voice and legacy data revenues
- Competitive pricing pressure in our business andwholesale markets
This was mitigated in part by:
- Growth in Internet and TV revenues
- Reduced post-employment benefit plans service cost
BELL MEDIA
Bell Media Adjusted EBITDA growth of 7.5% in 2014 reflected:
- The incremental financial contribution from the acquisition of Astral on July 5, 2013
This was offset in part by:
- Higher TV content costs primarily for our specialty TV sports properties
BELL ALIANT
Bell Aliant’s Adjusted EBITDA declined 2.8% in 2014 as a result of:
- Increased operating costs, reflecting higher expenses related togrowing its FibreOP services
- Higher TV content costs due to IPTV customer growth
| 4.6 Severance, acquisition and other costs |
This category includes various income and expenses that are not related directly to the operating revenues generated during the year.
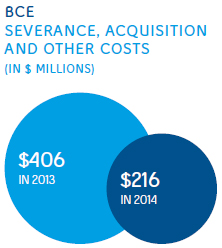
2014
Severance, acquisition and other costs included:
- Severance costs related to voluntary and involuntary workforce reduction initiativesof $82 million
- Acquisition and other costs of $134 million, including severance and integration costsrelating to the Privatization of Bell Aliant as well as transaction costs, such as legal andfinancial advisory fees, related to completed or potential acquisitions
2013
Severance, acquisition and other costs included:
- Severance costs related to voluntary and involuntary workforce reduction initiativesof $116 million
- Acquisition and other costs of $290 million, primarily related to the acquisition of Astral,including $230 million relating to the CRTC tangible benefit obligation that we wereordered to pay over seven years to benefit the Canadian broadcasting system
48 BCE Inc. 2014 ANNUAL REPORT | |||
MD&A | CONSOLIDATED FINANCIAL ANALYSIS | 4 |
| 4.7 Depreciation and amortization |
The amount of our depreciation and amortization in any year is affected by:
- How much we invested in new property,plant and equipment and intangibleassets in previous years
- How many assets we retired duringthe year
- Estimates of the useful lives of assets

DEPRECIATION
Depreciation in 2014 increased $146 million compared to 2013 due to a higher depreciable asset base as we continued to invest in our broadband and wireless networks, as well as our IPTV service. Depreciation was further increased by accelerated depreciation as a result of a reduction in useful lives of certain network assets, as described in section 10.1,Our accounting policies – Critical accounting estimates and key judgements,and our acquisition of Astral on July 5, 2013.
AMORTIZATION
Amortization in 2014 decreased $74 million compared to 2013, due mainly to an increase in useful lives of certain IT software assets from five to seven years, as described in section 10.1,Our accounting policies – Critical accounting estimates and key judgements, partly offset by a higher net asset base and increased amortization from our acquisition of Astral on July 5, 2013.
| 4.8 Finance costs |

INTEREST EXPENSE
Interest expense in 2014 decreased $2 million compared to 2013 as a result of higher capitalized interest and lower average interest rates, partly offset by higher average debt levels primarily related to our acquisition of Astral and the Privatization of Bell Aliant.
INTEREST ON POST-EMPLOYMENT BENEFIT OBLIGATIONS
Interest on our post-employment benefit obligations is based on market conditions that existed at the beginning of the year.
In 2014, interest expense decreased $49 million compared to last year due to a lower post-employment benefit obligation as a result of the higher discount rate, which increased from 4.4% on January 1, 2013 to 4.9% on January 1, 2014.
The impacts of changes in market conditions during the year are recognized in other comprehensive income (OCI).
BCE Inc. 2014 ANNUAL REPORT 49 | |||
4 | CONSOLIDATED FINANCIAL ANALYSIS | MD&A |
| 4.9 Other income (expense) |
Other income (expense) includes income and expense, such as:
- Net mark-to-market gains or losses on derivatives used aseconomic hedges
- Net gains or losses on investments, including gains or losseswhen we dispose of, write down or reduce our ownershipin investments
- Impairment of assets
- Losses on disposal and retirement of software, plantand equipment
- Interest income on cash and cash equivalents
- Equity income (loss) from investments in associates andjoint ventures
- Early debt redemption costs

2014
Other income included net mark-to-market gains of $134 million on derivatives used as economic hedges of share-based compensation and U.S. dollar purchases, dividend income of $42 million from earnings generated in trust prior to the divestiture of Bell Media assets held for sale and foreign exchange gains in 2014. These were partly offset by a net impairment charge of $105 million, mainly relating to Bell Media’s conventional TV properties resulting from a softness in the overall Canadian TV advertising market and higher TV content costs, losses on disposal of software, plant and equipment of $51 million, and early debt redemption costs of $29 million.
2013
Other expense included early debt redemption costs of $55 million, losses on disposal and retirement of capital assets of $44 million and an equity loss of $32 million, which included our $25 million share of a goodwill impairment charge and a write-down of customer relationship intangibles recognized by an equity investee. These expenses were partly offset by net mark-to-market gains of $94 million on derivatives used as economic hedges of share-based compensation and U.S. dollar purchases and a distribution of a $36 million pension surplus.
| 4.10 Income taxes |

Income taxes in 2014 increased $101 million compared to 2013 due to higher taxable income in 2014 and the lower value of uncertain tax positions favourably resolved in 2014 compared to 2013.
Our effective tax rate remained relatively stable at 25.5% in 2014 compared to 25.7% in 2013.
50 BCE Inc. 2014 ANNUAL REPORT | |||
MD&A | CONSOLIDATED FINANCIAL ANALYSIS | 4 |
| 4.11 Net earnings and EPS |

Net earnings attributable to common shareholders in 2014 increased $388 million, or $0.43 per common share, due to higher Adjusted EBITDA, lower severance, acquisition and other costs, lower NCI due to the Privatization of Bell Aliant and higher other income, partly offset by higher income taxes and higher net depreciation and amortization expense.
Excluding the impact of severance, acquisition and other costs, net gains (losses) on investments, and early debt redemption costs, Adjusted net earnings in 2014 were $2,524 million, or $3.18 per common share, compared to $2,317 million, or $2.99 per common share in 2013.
| 4.12 Capital expenditures |

BCE capital expenditures were up $146 million, or 4.1%, in 2014, reflecting higher spending at Bell, and a modest increase at Bell Aliant. As a percentage of revenue, capital expenditures for BCE were 17.7% compared to 17.5% in 2013. These investments supported further expansion of our Fibe TV service footprint in Québec and Ontario and Bell Aliant’s FibreOP footprint in Atlantic Canada, the deployment of broadband fibre to directly connect more homes and businesses, the roll-out of 4G LTE mobile service in additional markets across Canada, as well as continued spending to increase network capacity to support greater data consumption and higher LTE speeds.
| 4.13 Cash flows |
In 2014, BCE’s cash flows from operating activities decreased $235 million compared to 2013, as a result of a $350 million voluntary DB pension plan contribution made in 2014 and higher income taxes paid, partly offset by higher Adjusted EBITDA and an improvement in working capital.
Free Cash Flow available to BCE’s common shareholders increased $173 million in 2014, driven mainly by higher Adjusted EBITDA and an improvement in working capital, partly offset by higher income taxes paid and increased capital expenditures.
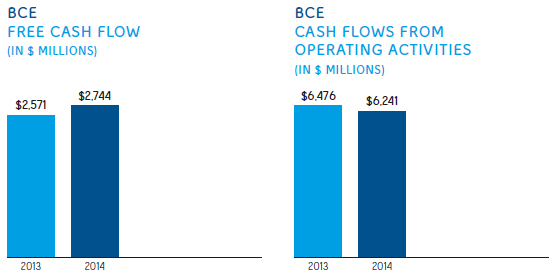
BCE Inc. 2014 ANNUAL REPORT 51 | |||
5 | BUSINESS SEGMENT ANALYSIS | MD&A |
| 5 BUSINESS SEGMENT ANALYSIS |
5.1 Bell Wireless
| In 2014, we achieved industry-leading profitability through disciplined postpaid customer acquisition and retention, increasing ARPU by driving higher smartphone adoption and mobile data usage, and reducing customer churn. |
Key elements of relevant strategic imperatives

ACCELERATE WIRELESS
2014 PROGRESS
- Acquired 35% and 46% of total new postpaid gross and netactivations, respectively, among the three major wirelesscarriers, while achieving leading ARPU and Adjusted EBITDAgrowth of 4.9% and 9.6%, respectively, as well as service marginexpansion of 1.3 percentage points over 2013
- Expanded the number of smartphone users at the end of 2014to 76% of our total postpaid subscribers, up from 73% at the endof 2013
- Expanded our leading smartphone lineup with over 40 new devices,adding to our extensive selection of 4G LTE-capable devices
- Announced an agreement to acquire Glentel, a Canadian-baseddual-carrier, multi-brand mobile products distributor, of whichwe expect to retain a 50% ownership interest, to maintain Bell’scompetitive position by securing long-term access to Glentel’seffective wireless retail distribution network
- Launched a secure mobile payment solution, RBC Wallet, withRBC in January 2014, and announced three additional partnerships during the year with, TD Canada Trust, CIBC and DesjardinsGroup, to launch similar secure mobile payment solutions
- Continued to reduce the cost of mobile roaming in the countriesCanadians travel to the most
- Introduced Easy Purchase Plan, an instalment program for tabletpurchases for existing Bell Mobility customers, allowing them tospread a portion of the cost of a new tablet over two years whenpaired with a tablet plan
2015 FOCUS
- Profitably grow our wireless postpaid subscriber base whilemaintaining market share momentum of incumbent postpaidsubscriber activations
- Narrow our ARPU gap versus incumbent competitors
- Manage the financial and churn impacts from unusual marketactivity that could arise from the significantly increased numberof customers with two- or three-year service contracts whowill be eligible to renew their plans or change carriers over thenext two years as a result of the Wireless Code implementedin 2013, to the extent that the CRTC’s June 3, 2015 Wireless Codeapplication date is found to be valid
- Offer the latest handsets and devices in a timely mannerto enable customers to benefit from ongoing technologicalimprovements by manufacturers and from faster data speedsto optimize the use of our services
- Accelerate new revenue streams by driving the commercialization of next-generation mobile commerce and M2M servicesand applications

INVEST IN BROADBAND NETWORKS AND SERVICES
2014 PROGRESS
- Expanded our next-generation 4G LTE wireless network to reach86% of the Canadian population coast to coast
- Increased mobile 4G LTE network speeds by up to 45% across ourentire service footprint
- Acquired 31 licences for 480 million MHz-POP of nationwide700 MHz spectrum for $566 million following Industry Canada’sfederal wireless spectrum auction
- Launched Canada’s first 700 MHz spectrum LTE network inHamilton, Ontario in early April
- Launched 4G LTE mobile service in 52 communities in AtlanticCanada and in seven communities in the Northwest Territories
2015 FOCUS
- Complete 4G LTE wireless network build and manage wireless network capacity

ACHIEVE A COMPETITIVE COST STRUCTURE
2014 PROGRESS
- Reduced Bell Mobility call centre costs per customer by 30% since 2010 through investment in enhanced call centre systems and online self-serve options for customers
2015 FOCUS
- Realize operating cost and capital expenditure synergiesfrom the integration of Bell Aliant into our Bell Wireline andBell Wireless segments
- Deliver cost savings from cost of revenue initiatives, reductionsin sales, general and administrative expenses, and labourefficiencies across Bell to support maintenance of a stableconsolidated Adjusted EBITDA margin
52 BCE Inc. 2014 ANNUAL REPORT | |||
MD&A | BUSINESS SEGMENT ANALYSIS | 5 |

IMPROVE CUSTOMER SERVICE
2014 PROGRESS
- Launched two new eBill features, the Personalized Bill Explainerand Mobility Bill Interactive Tour, to enhance the customerexperience by proactively addressing the most commonbilling questions
- Reduced customer calls to our service centres by 34%since 2011 through growing use of self-serve and improvedfirst call resolution
2015 FOCUS
- Invest in customer service initiatives, simplifying complexity for all customers including billing
- In January 2015, began to introduce personalized videos for new Mobility customers that explain what to expect on the first bill, how to check usage and update phone features, and how to manage accounts throughMyBell.caand the MyBell mobile app
- Reduce total volume of wireless customer calls to our wireless services call centres
| Financial performance analysis |
2014 PERFORMANCE HIGHLIGHTS
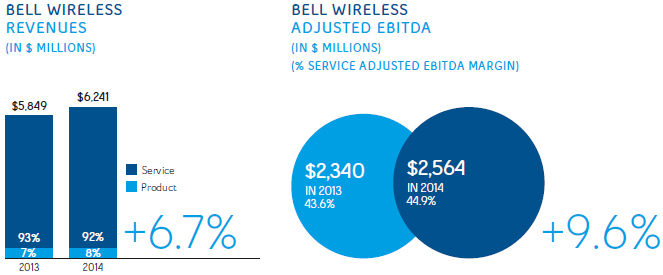

BCE Inc. 2014 ANNUAL REPORT 53 | |||
5 | BUSINESS SEGMENT ANALYSIS | MD&A |
BELL WIRELESS RESULTS
REVENUES
| 2014 | 2013 | $ CHANGE | % CHANGE | ||||
Service | 5,705 | 5,362 | 343 | 6.4 | % | |||
Product | 483 | 432 | 51 | 11.8 | % | |||
Total external revenues | 6,188 | 5,794 | 394 | 6.8 | % | |||
Inter-segment revenues | 53 | 55 | (2 | ) | (3.6 | %) | ||
Total Bell Wireless revenues | 6,241 | 5,849 | 392 | 6.7 | % |
Bell Wireless operating revenues increased 6.7% in 2014 as a result of both higher service and product revenues compared to 2013.
- Service revenues were up 6.4% in 2014, driven by a greaternumber of postpaid subscribers in our customer base andblended ARPU growth attributable to higher average monthlyrates and increased data usage, reflecting higher smartphonepenetration and usage of data applications, as well as broader4G LTE network coverage and increased network speeds. Theyear-over-year growth in service revenues was moderated by
lower wireless voice revenues, due mainly to the prevalence of unlimited nationwide talk plans and substitution for data applications.
- Bell Wireless data revenues in 2014 were 22.2% higher comparedto 2013, whereas wireless voice revenues declined 4.5%
- Product revenues increased 11.8% in 2014, reflecting a greaternumber of higher-end smartphone devices in our sales mix andan increased number of handset upgrades compared to 2013
OPERATING COSTS AND ADJUSTED EBITDA
| 2014 | 2013 | $ CHANGE | % CHANGE | ||||
Operating costs | (3,677 | ) | (3,509 | ) | (168 | ) | (4.8 | %) |
Adjusted EBITDA | 2,564 | 2,340 | 224 | 9.6 | % | |||
Total Adjusted EBITDA margin | 41.1 | % | 40.0 | % | 1.1 | % | ||
Service Adjusted EBITDA margin | 44.9 | % | 43.6 | % | 1.3 | % |
Bell Wireless operating costs increased 4.8% in 2014 as a result of:
- Higher investment in customer retention spending due to agreater number of subsidized smartphone upgrades
- Higher payments to other carriers due to greater datausage volume
- Increased network operating costs attributable to LTE networkexpansion and usage
These factors were partly offset by:
- Decreased labour costs reflecting reduced customer call volumes, lower bad debt expense, and lower content expenses in 2014
Subscriber acquisition costs in 2014 were largely stable compared to last year, reflecting fewer year-over-year gross activations and pricing discipline.
Bell Wireless Adjusted EBITDA grew 9.6% in 2014, driven by higher operating revenues, as described above, and well-controlled operating costs. As a result of the higher flow-through of revenues to Adjusted EBITDA, Bell Wireless Adjusted EBITDA margin, based on wireless service revenues, expanded to 44.9% in 2014 from 43.6% in 2013.
BELL WIRELESS OPERATING METRICS
| 2014 | 2013 | CHANGE | % CHANGE | ||||
Blended ARPU ($/month) | 60.07 | 57.25 | 2.82 | 4.9 | % | |||
Gross activations | 1,614,364 | 1,694,055 | (79,691 | ) | (4.7 | %) | ||
Postpaid | 1,271,599 | 1,332,423 | (60,824 | ) | (4.6 | %) | ||
Prepaid | 342,765 | 361,632 | (18,867 | ) | (5.2 | %) | ||
Net activations | 192,368 | 217,768 | (25,400 | ) | (11.7 | %) | ||
Postpaid | 308,504 | 378,121 | (69,617 | ) | (18.4 | %) | ||
Prepaid | (116,136 | ) | (160,353 | ) | 44,217 | 27.6 | % | |
Blended churn % (average per month) | 1.52 | % | 1.60 | % | 0.08 | % | ||
Postpaid | 1.22 | % | 1.25 | % | 0.03 | % | ||
Prepaid | 3.43 | % | 3.55 | % | 0.12 | % | ||
Subscribers(1) | 7,970,702 | 7,778,334 | 192,368 | 2.5 | % | |||
Postpaid | 6,986,196 | 6,677,692 | 308,504 | 4.6 | % | |||
Prepaid | 984,506 | 1,100,642 | (116,136 | ) | (10.6 | %) | ||
Cost of acquisition (COA) ($/subscriber) | 443 | 421 | (22 | ) | (5.2 | %) |
| (1) | In 2013, our postpaid subscriber base was reduced by 99,098 customers to exclude all M2M subscribers following a review of our wireless subscriber metrics. Additionally, our postpaid subscriber base was reduced by 18,354 subscribers to adjust for customer deactivations and by 8,022 subscribers subsequent to a review of customer accounts. Our prepaid subscriber base was increased by 5,008 customers subsequent to a review of subscriber metrics. |
54 BCE Inc. 2014 ANNUAL REPORT | |||
MD&A | BUSINESS SEGMENT ANALYSIS | 5 |
Blended ARPU of $60.07 reflects an increase of 4.9% in 2014. This was due to higher postpaid ARPU driven by growth in data usage attributable to a higher proportion of customers using smartphones combined with increased traffic on our 4G LTE network, higher rates from the new two-year rate plan pricing that came into effect in the third quarter of 2013 following the implementation of the Wireless Code, and a higher percentage of postpaid customers in our subscriber base. This was partly offset by lower year-over-year voice ARPU as customers continue to substitute voice with data services.
- Data ARPU increased 20.5% in 2014, due mainly to rate planincreases and disciplined pricing, together with an increasedadoption of smartphones and other data devices such astablets, which are driving greater use of e-mail, web browsing,social networking, text messaging, mobile TV, and picture andvideo messaging, as well as entertainment services such asvideo streaming, music downloads and gaming. In addition, theroll-out of increased 4G LTE network speeds in August 2014 alsocontributed to the growth in data ARPU. The year-over-yeargrowth in data ARPU was moderated by the impact of richerrate plans with higher data usage thresholds and lower roamingrates, as well as increased use of Wi-Fi hotspots by customers.
- Voice ARPU declined 5.9% in 2014, reflecting more customerson all-inclusive plans offering unlimited local and long distancecalling, competitive pricing pressures, and lower overall voiceusage as customers increasingly substitute voice services fordata features and services
Total gross wireless activations decreased 4.7% in 2014, due to lower postpaid and prepaid gross activations.
- Postpaid gross activations declined 4.6% in 2014, reflecting theimpact of increased rate plan pricing in the first half of the yeardriven by the move from three-year to two-year contractsresulting from the implementation of the Wireless Code, coupledwith a maturing wireless market. The year-over-year decreasein postpaid gross activations was moderated by the favourableimpact of the Apple iPhone 6 launch in September 2014 as wellas strong activations over the holiday period compared to theprevious year, and higher tablet activations reflecting the launchof Bell Mobility’s Easy Purchase Plan, an instalment program fortablet purchases, in the third quarter of 2014.
- Prepaid gross activations decreased 5.2% in 2014, due to ourcontinued focus on postpaid customer acquisitions
- Smartphone users as a percentage of postpaid subscribersincreased to 76% at December 31, 2014 compared to 73% at theend of 2013
Blended wireless churn improved 0.08 percentage points in 2014 to 1.52%, reflecting improvements in both postpaid and prepaid churn. This was attributed to a greater percentage of postpaid subscribers in our total subscriber base compared to last year as postpaid customers typically have a lower churn rate than prepaid customers.
- Postpaid churn improved 0.03 percentage points in 2014 to1.22%, despite aggressive promotions from other incumbentsand newer entrants and increased activity from the AppleiPhone 6 launch, reflecting the positive impact of our customerretention strategy
- Prepaid churn improved 0.12 percentage points in 2014 to3.43% as a result of marketing initiatives that resulted in fewercustomer deactivations compared to 2013
Postpaid net activations decreased 18.4% in 2014, due to the combined impact of lower gross activations and a higher number of customer deactivations.
Prepaid net customer losses improved 27.6% in 2014 as a result of fewer customer deactivations, partly offset by lower gross activations.
Wireless subscribers at December 31, 2014 totalled 7,970,702 representing an increase of 2.5% since the end of 2013. The proportion of Bell Wireless customers subscribing to postpaid service increased to 88% in 2014 from 86% last year.
COA per gross activation in 2014 increased $22 over last year to $443, due to a higher mix of postpaid customer activations and the sale of more premium smartphones.
Retention costs as a percentage of service revenue increased to 11.0% in 2014 compared to 10.3% in 2013, as a result of a greater number of subsidized customer upgrades coupled with an increased mix of more expensive smartphone models.
| Competitive landscape and industry trends |
COMPETITIVE LANDSCAPE
The wireless market is the largest sector of the Canadian telecommunications industry, representing 47% of total revenues, and is currently growing at a mid-single digit rate annually.
There are nearly 29 million wireless subscribers in Canada. The three large national incumbents, Bell, TELUS Corporation (TELUS) and Rogers, account for over 90% of industry subscribers and revenues. Rogers holds the largest share by virtue of its legacy global system for mobile (GSM) network. However, Bell has recaptured significant subscriber market share, as well as the largest proportion of industry revenue and Adjusted EBITDA growth since 2009, helped by the launch of our HSPA+ and 4G LTE networks, expanded retail distribution, the purchase of Virgin Mobile, a refreshed brand, improved customer service and a new management team with extensive experience in the Canadian wireless industry.
Canada’s wireless penetration was approximately 81% at the end of 2014, compared to over 100% for the U.S. and up to 182% in Europe. Canada’s wireless sector is expected to continue growing at a steady pace for the foreseeable future, driven by the increased adoption and usage of data services, and the expansion of 4G LTE service in the more rural and remote regions of Canada enabled through the deployment of 700 MHz spectrum.
BCE Inc. 2014 ANNUAL REPORT 55 | |||
5 | BUSINESS SEGMENT ANALYSIS | MD&A |
Competitors
Large facilities-based national wireless service providers Rogers and TELUS.
Smaller regional facilities-based wireless service providers Saskatchewan Telecommunications Holding Corporation (SaskTel) and Manitoba Telecom Services Inc. (MTS Mobility).
Newer entrants in their respective service areas:
- Vidéotron Ltée (Vidéotron), which provides service in Montréaland other parts of Québec
- WIND Mobile, which provides service in Toronto, Calgary,Vancouver, Edmonton, Ottawa, as well as in several communitiesin southwestern Ontario
- Mobilicity(1), which provides wireless service in Toronto, Ottawa,Vancouver, Calgary and Edmonton
- EastLink, which launched service in Nova Scotia andPrince Edward Island in February 2013
Mobile virtual network operators (MVNOs), who resell competitors’ wireless networks such as PC Mobile and Primus Telecommunications Canada Inc. (Primus).

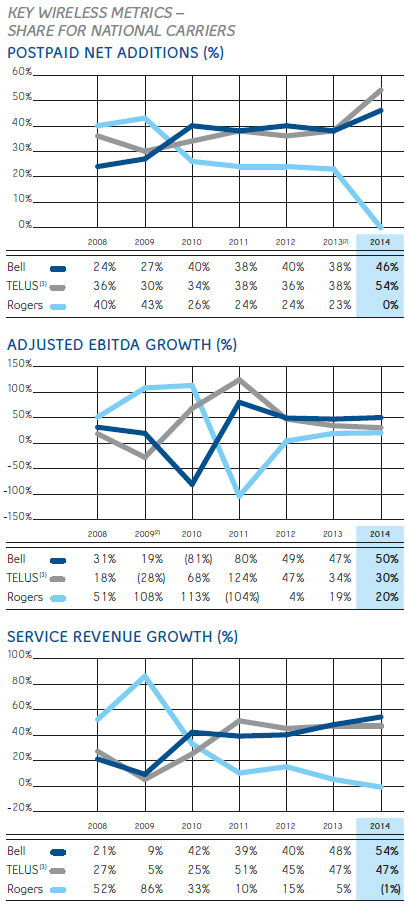
| (1) | Data & Audio Visual Enterprises Wireless Inc. (DAVE), carrying on business under the Mobilicity brand, has been operating under Companies’ Creditors Arrangement Act protection since September 2013. |
| (2) | Percentages may not add to 100 due to rounding. |
| (3) | TELUS metrics shown exclude Public Mobile Inc. (acquired on November 29, 2013) |
56 BCE Inc. 2014 ANNUAL REPORT | |||
MD&A | BUSINESS SEGMENT ANALYSIS | 5 |
INDUSTRY TRENDS
ACCELERATING DATA CONSUMPTION
Wireless industry revenue growth continues to be driven by the increased adoption and usage of data services. In 2014, wireless data ARPU in Canada represented approximately 50% of industry blended ARPU, compared to 44% in 2013. Data growth continued to be driven by the ongoing adoption of smartphones and tablets, and associated data plans. The demand for wireless data services is expected to continue to grow, due to ongoing investment in faster network technologies such as 4G LTE that provide a richer user experience, the growing appetite for mobile connectivity and social networking, greater affordability and selection of smartphones and tablets and increasing adoption of multiple devices by families. Greater customer adoption of services, including mobile TV, mobile commerce, mobile banking, and other M2M applications in the areas of retail and transportation (connected car, asset tracking, remote monitoring) should also contribute to growth. In the consumer market, M2M is projected to be a future growth area for the industry as wireless connectivity on everyday devices from home automation to cameras becomes ubiquitous.
NEED FOR MORE WIRELESS SPECTRUM AND CARRIER AGGREGATION
Fast growth in mobile data traffic is increasingly putting a strain on wireless carriers’ networks and their ability to manage and service this traffic. Industry Canada’s 700 MHz spectrum auction that concluded in February 2014 provided wireless carriers with prime spectrum to roll out faster next-generation wireless networks and build greater capacity, especially in rural areas. In addition, Industry Canada held, on March 3, 2015, the AWS-3 spectrum auction and, in April 2015 will hold the 2500 MHz spectrum auction, providing other opportunities for Bell and other wireless carriers to acquire additional spectrum to enhance their LTE networks and meet the demand of both urban and rural markets. Furthermore, carrier aggregation (specifically, 4G LTE Advanced CA) is a technology currently being employed by Canadian wireless carriers (and which is expected to be used more extensively in the future) that allows for multiple spectrum channels to be used together, thereby significantly increasing capacity and data transfer rates.
GREATER SPENDING ON CUSTOMER RETENTION
As wireless penetration in Canada increases at a continued high level of competitive intensity, even greater focus will be required on improving customer service, enhancing existing service offerings and spending more to retain existing customers through discounted handset upgrades. In particular, as a result of the Wireless Code implemented in 2013, which has limited wireless terms to two years from three years, there is the potential for unusually high market activity from the significantly greater number of customers who will be eligible to renew their plans or change carriers over the next two years.
| Business outlook and assumptions |
2015 OUTLOOK
We expect continued revenue growth driven by a greater number of postpaid subscribers, accelerating data usage from smartphone customers and higher rate plans for two-year contracts. We will seek to achieve higher revenues from data growth, delivered through our HSPA+ and 4G LTE networks, higher demand for services such as web browsing, music and video streaming and community portals such as Facebook and YouTube, as well as new services including mobile commerce and other M2M applications. Our intention is to introduce these new products and services to the market in a way that balances innovation with profitability.
Three-year contracts established before the Wireless Code came into effect and a new wave of two-year contracts will expire in 2015, to the extent that the CRTC’s June 3, 2015 Wireless Code application date is found to be valid, leading to a higher level of activity across the Canadian wireless industry. This highlights the critical importance of our continual focus on improving customer satisfaction and increasing investment in customer retention. We plan to generate Bell Wireless Adjusted EBITDA growth in 2015 from increasing revenues, which is expected to be moderated by higher activation and retention spend driven by market activity.
ASSUMPTIONS
- Higher, but slowing, Canadian wireless industry penetrationand smartphone adoption
- Sustained level of competition in both consumer andbusiness markets
- Maintained Bell’s market share momentum of incumbent wirelesspostpaid subscriber activations
- Continued adoption of smartphone devices, tablets and dataapplications, as well as the introduction of more 4G LTE devicesand new data services
- Our ability to monetize increasing data usage and customersubscription to new data services
- Convergence of three-year and two-year plan expiries leadingto an increase in the number of subscribers who are eligiblefor upgrades
- Higher subscriber acquisition and retention spending, drivenby a greater number of year-over-year gross additions andcustomer device upgrades
- Higher than industry-average blended ARPU and AdjustedEBITDA growth, driven by a greater mix of postpaid smartphonecustomers and accelerating data consumption on the 4G LTEnetwork, and higher access rates on new two-year contracts
- Completion of the LTE network expected to cover 98% of theCanadian population
- Ongoing technological improvements by handset manufacturersand from faster data network speeds that allow customers tooptimize the use of our services
- Industry pricing discipline maintained on a higher expectednumber of subscriber renewals resulting from the expiry of 2 or3 year service contracts due to the Wireless Code of Conductimplemented in 2013
- No material financial, operational or competitive consequencesof changes in regulations affecting our wireless business
BCE Inc. 2014 ANNUAL REPORT 57 | |||
5 | BUSINESS SEGMENT ANALYSIS | MD&A |
| Key growth drivers |
- Increasing Canadian wireless industry penetration
- Continued adoption of two-year rate plans
- Increasing adoption of smartphones, tablets and other 4G LTE devices to increase mobile data usage
- Expansion of 4G LTE network service in non-urban markets
- Customer adoption of new data applications and services such as M-commerce and M-banking
| Principal business risks |
This section discusses certain principal business risks which specifically affect the Bell Wireless segment. For a detailed description of the principal risks that could have a material adverse effect on our business, refer to section 9,Business risks.
AGGRESSIVE COMPETITION RISK
IMPACT
| REGULATORY ENVIRONMENT RISK
IMPACT
| WIRELESS CODE RISK
IMPACT
|
58 BCE Inc. 2014 ANNUAL REPORT | |||
MD&A | BUSINESS SEGMENT ANALYSIS | 5 |
| 5.2 Bell Wireline |
| In 2014, Bell Wireline achieved improved year-over-year financial performance, with positive revenue and Adjusted EBITDA growth in Q4, driven by an increased mix of growth services and improving business markets results. |
Key elements of relevant strategic imperatives

LEVERAGE WIRELINE MOMENTUM
2014 PROGRESS
- Increased our total number of Bell Fibe TV subscribers by 46.1%to 700,533
- Increased the number of three-product households – those thatbuy TV, Internet and Home Phone – by 15% over 2013, fuelled byour Fibe TV service, which drove higher pull-through attach ratesfor Home Phone and Internet services, with 77% of all Bell Fibe TVcustomers taking three products
- Launched the Home Hub Internet modem and Wi-Fi router,featuring the latest 802.11 AC wireless standard
- Launched Business Bundles, which include services such asunlimited Fibe Internet, phone lines with calling features andonline security, with guaranteed pricing for 36 months
2015 FOCUS
- Continue to enhance our Fibe TV service
- In February 2015, we introduced an innovative Fibe TV feature called Restart, enabling customers to rewind and watch TV shows already in progress from the beginning. In addition, we further enhanced the Fibe TV on-screen menu and channel guide with fast access to the main menu from anywhere in the Fibe TV experience, a larger channel preview window, a Last Peek feature that shows picture-in-picture for the last 5 channels tuned, and an improved universal search.
- Expand our total base and market share of TV and Internetsubscribers profitably
- Continue to reduce total wireline residential net losses
- Increase residential household ARPU through greaterthree-product household penetration
- Increase share of wallet of large enterprise customersthrough greater focus on business service solutions andconnectivity growth
- Expand and improve sales distribution and coverage in ourmid-sized business segment
- Increase the number of net new customer relationships inboth large and mid-sized business and reduce small businesscustomer losses
- Complete the integration of Bell Aliant to generate operatingcost and capital investment synergies

INVEST IN BROADBAND NETWORKS AND SERVICES
2014 PROGRESS
- Extended our Fibe TV service coverage to reach more than5 million households across Ontario and Québec, up fromapproximately 4.3 million at the end of 2013. IncludingBell Aliant’s FibreOP service area, BCE’s total IPTV footprint nowcovers 6 million homes, up from 5.1 million at the end of 2013,including 2.1 million passed with FTTH.
- Began the deployment of an FTTH network that will bringadvanced Bell Fibe TV and Internet services to Kingston, Ontario
2015 FOCUS
- Continue broadband fibre deployment and IPTV service coverage expansion with increasing focus on growing FTTH footprint

ACHIEVE A COMPETITIVE COST STRUCTURE
2014 PROGRESS
- Maintained relatively stable Bell Wireline Adjusted EBITDAmargin compared to 2013
- Completed the Privatization of Bell Aliant and began itsintegration into Bell’s operations, simplifying BCE’s corporatestructure and increasing overall operating and capital investment efficiencies, including wholesale cost savings, as we moveAtlantic branches of major business customers onto the nationalBell network
2015 FOCUS
- Realize operating cost and capital expenditure synergiesfrom the integration of Bell Aliant into our Bell Wireline andBell Wireless segments
- Deliver cost savings from cost of revenue initiatives, reductionsin sales, general and administrative expenses, and labourefficiencies across Bell to support maintenance of a stableconsolidated Adjusted EBITDA margin
BCE Inc. 2014 ANNUAL REPORT 59 | |||
5 | BUSINESS SEGMENT ANALYSIS | MD&A |

IMPROVE CUSTOMER SERVICE
2014 PROGRESS
- Reduced customer calls to our service centres by 34%since 2011 through growing use of self-serve and improvedfirst-call resolution
- Reduced Fibe TV installation time by 10% in 2014and 27% since the beginning of 2012
- Introduced two-hour appointment windowsfor Fibe TV installations
- Introduced flexible evening and weekend repair and installationappointments for small business customers and reduced the timebetween ordering and installation from four days to two days
- Launched Device Hub, a pilot program that integrates thein-store process with other Bell systems for a more seamlessrepair service
- Launched the Bell Business Concierge program, offering smallbusinesses front-of-the-line access to dedicated advisors,customer service representatives and technical support who candeliver faster, more tailored service
2015 FOCUS
- Invest in customer service initiatives, simplifying complexity forall customers including billing
- Reduce total volume of wireline customer calls to our residentialservices call centres
- Further improve customer satisfaction scores
- Achieve better consistency in customer experience
- Improve customer personalization
| Financial performance analysis |
2014 PERFORMANCE HIGHLIGHTS


60 BCE Inc. 2014 ANNUAL REPORT | |||
MD&A | BUSINESS SEGMENT ANALYSIS | 5 |
BELL WIRELINE RESULTS
REVENUES
| 2014 | 2013 | $ CHANGE | % CHANGE | ||||
Data | 5,991 | 5,828 | 163 | 2.8 | % | |||
Local and access | 2,364 | 2,497 | (133 | ) | (5.3 | %) | ||
Long distance | 668 | 722 | (54 | ) | (7.5 | %) | ||
Equipment and other | 664 | 707 | (43 | ) | (6.1 | %) | ||
Total external revenues | 9,687 | 9,754 | (67 | ) | (0.7 | %) | ||
Inter-segment revenues | 353 | 343 | 10 | 2.9 | % | |||
Total Bell Wireline revenues | 10,040 | 10,097 | (57 | ) | (0.6 | %) |
Bell Wireline operating revenues decreased 0.6% in 2014 as a result of lower local and access, long distance, and equipment and other revenues, partly offset by higher data revenues. This represents a slower pace of decline compared to the 1.2% year-over-year decrease in 2013, reflecting further Fibe TV and Fibe Internet subscriber base growth, slowing voice revenue erosion, price increases across all residential services, and improved year-over-year Bell Business Markets performance.
- Data revenues increased 2.8% in 2014, reflecting increasedInternet and TV service revenues driven by Fibe customergrowth, greater customer demand for higher bandwidth Internetservice, and price increases across all of our residential services.Additionally, higher IP broadband connectivity revenuesgenerated by our business and wholesale customers, as well asincreased business service solutions sales, contributed to thegrowth in data revenues. This was partly offset by a continueddecline in basic legacy data revenues from ongoing customermigration to IP-based systems, pricing pressures in our businessand wholesale markets, and reduced levels of business dataproduct sales compared to last year.
- Local and access revenues declined 5.3% in 2014, which represented an improvement over the 7.1% year-over-year decline in2013. The decline in 2014 was driven by the ongoing loss of residential and business NAS lines due to technological substitutionto wireless and Internet-based services, large business customerconversions to IP-based data services and networks from legacyvoice services, as well as competitive pricing pressures in 2014in our business and wholesale markets. However, the rate oflocal and access revenue erosion was tempered by increasesin monthly local rates combined with fewer residential NAS linelosses compared to 2013.
- Long distance revenues decreased 7.5% in 2014, representingimproved performance over the previous year’s decline of9.9%. The decrease in 2014 reflected fewer minutes of use byresidential customers as a result of NAS line losses, technologysubstitution to wireless and OTT Internet-based services, andongoing rate pressures in our business and wholesale markets.Residential price increases and higher sales of internationallong distance minutes in our wholesale market moderated theyear-over-year decline.
- Equipment and other revenues decreased 6.1% in 2014, due tolower consumer electronics equipment sales at The Source anddecreased business voice equipment sales
OPERATING COSTS AND ADJUSTED EBITDA
| 2014 | 2013 | $ CHANGE | % CHANGE | ||||
Operating costs | (6,272 | ) | (6,303 | ) | 31 | 0.5 | % | |
Adjusted EBITDA | 3,768 | 3,794 | (26 | ) | (0.7 | %) | ||
Adjusted EBITDA margin | 37.5 | % | 37.6 | % | (0.1 | %) |
Bell Wireline operating costs were $31 million lower in 2014 compared to last year as a result of:
- Lower cost of goods sold consistent with decreasedequipment sales
- Lower labour costs resulting from a reduction in call volumes
- Decreased bad debt expense
- Reduced post-employment benefit plans service cost resultingfrom a higher discount rate used in 2014 compared to 2013 tovalue post-employment benefit obligations
- A charge recorded in Q1 2013 related to a CRTC decision inrespect of our wholesale high-speed access services businessthat did not recur this year
These factors were partly offset by:
- Higher payments to other carriers in our business and wholesale markets driven by increased volumes
- Higher programming costs for Bell TV due to a higher numberof subscribers
- Increased costs to support a larger Fibe TV and Internetsubscriber base
- Higher marketing and sales expense
Bell Wireline Adjusted EBITDA was 0.7% lower in 2014, while Adjusted EBITDA margin of 37.5% remained stable in 2014 compared to 37.6% in 2013. The year-over-year decrease in Bell Wireline Adjusted EBITDA was due to:
- The ongoing loss of higher-margin legacy voice and dataservice revenues
- Ongoing competitive pricing pressures in our business andwholesale markets
- Lower consumer electronic sales at The Source, dueto a competitive marketplace which resulted in lower traffic
BCE Inc. 2014 ANNUAL REPORT 61 | |||
5 | BUSINESS SEGMENT ANALYSIS | MD&A |
This was largely offset by:
- Growth in our Internet and IPTV businesses
- Reduced post-employment benefit plans service cost
This result for 2014 represents an improvement over the 3.2% Adjusted EBITDA decline reported for Bell��Wireline in 2013 due to:
- Stronger data revenue growth driven by increased scale in ourTV and Internet businesses
- A slowing voice revenue decline
- Improved business market performance
- Lower year-over-year operating costs
BELL WIRELINE OPERATING METRICS
Data
High-speed Internet
| 2014 | 2013 | CHANGE | % CHANGE | ||||
High-speed Internet net activations | 102,946 | 57,722 | 45,224 | 78.3 | % | |||
High-speed Internet subscribers | 2,287,489 | 2,184,543 | 102,946 | 4.7 | % |
High-speed Internet subscriber net activations in 2014 increased 78.3%, or 45,224, to 102,946. This represents our highest number of annual net activations since 2007. The growth in high-speed Internet net activations in 2014 was driven by the pull-through of Bell Fibe TV customer activations, higher wholesale customer gains, and lower residential customer churn. Lower residential churn can be attributed to a higher percentage of subscribers on higher-speed fibre-based Internet service due to an expanding IPTV footprint, which typically has a lower customer churn rate compared to subscribers on DSL service.
High-speed Internet subscribers at December 31, 2014 totalled 2,287,489, up 4.7% from the end of 2013.
TV
| 2014 | 2013 | CHANGE | % CHANGE | ||||
Net subscriber activations | 98,452 | 122,450 | (23,998 | ) | (19.6 | %) | ||
Fibe TV | 221,103 | 231,132 | (10,029 | ) | (4.3 | %) | ||
Total subscribers | 2,376,885 | 2,278,433 | 98,452 | 4.3 | % | |||
Fibe TV | 700,533 | 479,430 | 221,103 | 46.1 | % |
Fibe TV subscriber net activations decreased by 4.3% or 10,029 to 221,103 compared to 2013, due to aggressive offers for service bundles from the cable competitors, which impacted both deactivations and gross activations. The year-over-year decrease in Fibe TV net activations also reflected less IPTV footprint expansion compared to the previous year, as well as the benefit in the previous year from the launch of wireless receivers.
Satellite TV net customer losses of 122,651 were 12.9% higher in 2014, mainly as a result of a lower number of retail activations driven by aggressive offers from cable TV competitors in our service areas where Fibe TV is not available, coupled with lower wholesale activations due to the roll-out of IPTV service by competing wholesale providers in Western and Atlantic Canada.
Total TV net subscriber activations (Fibe TV and Satellite TV combined) decreased 19.6%, or 23,998, to 98,452 as a result of lower Fibe TV and Satellite TV net activations compared to 2013.
Fibe TV subscribers at December 31, 2014 totalled 700,533, up 46.1% from 479,430 subscribers reported at the end of 2013.
Satellite TV subscribers at December 31, 2014 totalled 1,676,352, down 6.8% from 1,799,003 subscribers at the end of 2013.
Total TV subscribers (Fibe TV and Satellite TV combined) at December 31, 2014 equalled 2,376,885, representing a 4.3% increase since the end of 2013.
Local and access
| 2014 | 2013 | CHANGE | % CHANGE | ||||
NAS LINES | ||||||||
Residential | 2,435,471 | 2,652,429 | (216,958 | ) | (8.2 | %) | ||
Business | 2,457,765 | 2,589,820 | (132,055 | ) | (5.1 | %) | ||
Total | 4,893,236 | 5,242,249 | (349,013 | ) | (6.7 | %) | ||
NAS NET LOSSES | ||||||||
Residential | (216,958 | ) | (287,885 | ) | 70,927 | 24.6 | % | |
Business | (132,055 | ) | (114,805 | ) | (17,250 | ) | (15.0 | %) |
Total | (349,013 | ) | (402,690 | ) | 53,677 | 13.3 | % |
62 BCE Inc. 2014 ANNUAL REPORT | |||
MD&A | BUSINESS SEGMENT ANALYSIS | 5 |
NAS net losses improved 13.3%, or by 53,677 lines, in 2014, reflecting fewer residential NAS losses, offset in part by higher business access line losses.
Residential NAS net losses were 24.6%, or 70,927 lines, fewer in 2014 than in 2013. The year-over-year improvement reflected the pull-through impact of our Fibe TV service bundle offers, as well as reduced rate of residential NAS turnover in our Fibe TV service areas that reflect the operational benefit of continued IPTV footprint expansion in helping to drive greater NAS customer retention through the acquisition of three-product households. The improvements in residential NAS net losses were moderated by ongoing wireless and Internet-based technology substitution for local services.
Business NAS net losses increased 15.0% or by 17,250 lines in 2014 compared to 2013. The year-over-year increase was the result of higher deactivations among large business market customers due to ongoing customer conversion of voice lines to IP-based and wireless services, the deactivation of excess dial-up ports given the customer shift to high-speed fibre Internet access from older technologies, and the removal of a greater number of public payphones. Additionally, the relatively low level of new business formation and employment growth in the economy has resulted in continued soft demand for new access line installations.
The annualized rate of NAS erosion in our customer base decreased to 6.7% in 2014 from 7.1% in 2013, reflecting improvements in the rate of erosion for residential NAS as a result of fewer line losses. At December 31, 2014, we had 4,893,236 NAS lines, compared to 5,242,249 at the end of 2013.
| Competitive landscape and industry trends |
COMPETITIVE LANDSCAPE
The financial performance of the overall Canadian wireline telecommunications market in recent years has been impacted by continued declines in legacy voice service revenues resulting from technological substitution to wireless and OTT services, as well as by ongoing conversion to IP-based data services and networks by large business customers. Aggressive competition from cable companies also continues to erode traditional telephone providers’ market share of residential local telephony. Canada’s four largest cable companies had nearly 4.3 million telephony subscribers at the end of 2014, representing a national residential market share of 43%, up two percentage points from 2013.
Competition for residential local and long distance services comes primarily from substitution to wireless services, including our own Bell Mobility and Virgin Mobile offerings. Approximately 25% of households in Ontario and Québec are estimated to be wireless only.
In 2014, cable companies continued to increase the speeds of their Internet offerings while promoting aggressive customer acquisition offers. At the end of the year, the four largest cable companies had 6.1 million Internet subscribers, representing 55% of the total Internet market, while incumbent local exchange carriers (ILECs) held the remaining 45% or 5.0 million subscribers. Although the residential Internet market is maturing, with approximately 81% penetration across Canada, subscriber growth is expected to continue over the next several years.
ILECs offering IPTV service grew their subscriber base by 24% in 2014 to 2.0 million customers driven by expanded network coverage, enhanced service offerings, and marketing and promotions focused on IPTV. This growth came at the expense of Canada’s four largest cable companies, which saw their TV market share in 2014 decline two percentage points to 59%.
Competitors
Cable TV providers offering cable TV, Internet and cable telephony services, including:
- Rogers in Ontario
- Vidéotron in Québec
- Cogeco Cable Inc. (a subsidiary ofCogeco Inc.) (Cogeco) in Ontarioand Québec
- Shaw Communications Inc. (Shaw) inBritish Columbia, Alberta, Saskatchewan,Manitoba and Ontario
- Shaw Direct, providing DTH satellite TVservice nationwide
- EastLink in every province exceptSaskatchewan, where it does not providecable TV and Internet service
ILECs TELUS and MTS provide local, long distance and IPTV services in various regions, as well as wholesale products and services across Canada.
Various others (such as Vonage Canada (a division of Vonage Holdings Corp.) (Vonage) and Primus) that offer resale or Voice over Internet Protocol (VoIP)-based local, long distance and Internet services.
OTT voice and video services such as Skype, Netflix and iTunes.
Digital media streaming devices such as Apple TV and Roku.
Business voice and data services:
- Other Canadian ILECs and cable TV operators
Substitution to wireless services, including those offered by Bell
ICT solutions:
- Systems integratorssuch as CGI Group Inc.,EDS (a division of HP Enterprise Services)and IBM
- Outsourcers and professionalservice firms
Wholesale competitors include cable operators, domestic CLECs, U.S. or other international carriers for certain services, and electrical utility-based telecommunications providers.

BCE Inc. 2014 ANNUAL REPORT 63 | |||
5 | BUSINESS SEGMENT ANALYSIS | MD&A |
INDUSTRY TRENDS
INVESTMENT IN BROADBAND FIBRE DEPLOYMENT In recent years, ILECs have made substantial investments in deploying FTTN and FTTH within their territories. These investments have enabled the delivery of IPTV service in order to better compete with cable TV offerings in urban areas. IPTV is considered a superior video product to traditional cable TV, given innovative features such as a next-generation user interface, wireless receivers and Restart, which enables customers to rewind and watch TV shows already in progress from the beginning. FTTN enables speeds of up to 25 Mbps, which can be doubled to 50 Mbps with pair bonding, while FTTH delivers broadband speeds of up to 175 Mbps, higher than any other technology. Going forward, ILECs are expected to maintain high levels of capital spending, primarily for the ongoing expansion of their broadband fibre networks, with an increasing emphasis on FTTH deployment. | WIRELESS SUBSTITUTION Wireless substitution is the most significant driver of residential NAS losses and voice revenue declines for telecommunication companies. Wireless-only households were estimated to represent approximately 25% of households in Canada at the end of 2014, compared to approximately 44% in the U.S. Wireless substitution has been increasing at a faster rate in the U.S. than in Canada, due to structural differences as well as economic disparities. To mitigate the impact of wireless substitution, wireline service providers have been packaging voice services with Internet and TV and offering discounted triple-play bundles. Wireless substitution is expected to continue to steadily increase in 2015. | ALTERNATIVE TV SERVICES The growing popularity of watching TV anywhere is expected to continue as customers adopt services that enable them to view content on multiple screens, including computers, smartphones and tablets, as well as on their TVs. OTT content providers are competing for share of viewership. To date, these OTT services have largely complemented existing TV services. However, to mitigate the threat of video substitution, TV and Internet service providers have launched customer-authenticated on-demand TV streaming services that provide programming content over mobile and Wi-Fi networks to smartphones, tablets and computers. Additionally, sports and live event programming are important differentiators for traditional TV providers as they face increasing competition from OTT content providers. As OTT offers become more compelling and consumers demand greater flexibility in choosing the content most relevant to them, the disconnection of and reduction in spending for traditional TV continues to rise. While this trend is increasing, it is anticipated that growth in Internet subscriptions and Internet-only households will help to offset the decline in TV as OTT video increases the value proposition of broadband. | BUSINESS CUSTOMER ADOPTION OF IP-BASED SERVICES The convergence of IT and telecommunications, facilitated by the ubiquity of IP, continues to shape competitive investments for business customers. Telecommunications companies are providing professional and managed services, as well as other IT services and support, while IT service providers are bundling network connectivity with their software as service offerings. In addition, manufacturers continue to bring all-IP and converged (IP plus legacy) equipment to market, enabling ongoing migration to IP-based solutions. The development of IP-based platforms, which provide combined IP voice, data and video solutions, creates potential cost efficiencies that compensate, in part, for reduced margins resulting from the continuing shift from legacy to IP-based services. The evolution of IT has created significant opportunities for Bell Business Markets, such as cloud services and data hosting, that can have greater business impact than traditional telecommunications services.
|
64 BCE Inc. 2014 ANNUAL REPORT | |||
MD&A | BUSINESS SEGMENT ANALYSIS | 5 |
| Business outlook and assumptions |
2015 OUTLOOK
We expect positive full-year revenue and Adjusted EBITDA growth for our Bell Wireline segment in 2015. This is predicated on continued year-over-year improvement in residential wireline net activations, as we leverage our growing IPTV footprint to drive greater three-product household penetration, higher broadband and TV market share, as well as fewer residential NAS customer losses attributable to targeted retention and service bundle offers as well as a continued high pull-through rate from Bell’s Fibe TV and Bell Aliant’s FibreOP TV services.
Increased TV net subscriber acquisition is expected through higher projected customer adoption of Fibe TV as we further extend our IPTV broadband fibre footprint, primarily in areas of Ontario and Québec. We also intend to seek greater penetration within the multiple-dwelling units (MDU) market and capitalize on our extensive retail distribution network and to leverage our market leadership position in high-definition (HD) programming and on-demand streaming services to drive incremental subscriber growth and higher revenue per customer.
Internet subscriber acquisition is expected to improve in 2015 through increased fibre coverage as we leverage the speed and reliability of our broadband Internet network to drive greater IPTV expansion and Internet attach rates. This is expected to have an associated positive impact on ARPU growth and customer churn.
Residential wireline revenues in 2015 are also anticipated to benefit from price increases implemented in the previous year, which followed similar pricing actions by our cable competitors, a higher volume of customer promotion expiries, as well as the positive impact of product enhancements to our Fibe TV service.
In our Bell Business Markets unit, leveraging our expanded fibre footprint to grow broadband connectivity and related business data services should moderate economy-related and competitive market challenges, as well as continued customer migration to IP-based systems and lead to a slower rate of decline in this unit’s revenue and Adjusted EBITDA results compared to 2014. We will seek to minimize the overall decline in revenues from legacy voice and data services through ongoing service innovation and product value enhancements. We intend to target marketing initiatives to slow NAS erosion while investing in new solutions in key portfolios such as Internet and private networks, data centre and cloud services, unified communications, and security services. We will continue to deliver network-centric managed and professional services solutions to large business and public sector clients that increase the value of connectivity services. We expect to experience continued competitive intensity in our small and mid-sized business segments as cable operators and other telecom competitors continue to intensify their focus on the business segment. We also intend to introduce service offerings that help drive innovative solutions and value for our small and mid-sized customers by leveraging Bell’s network assets, broadband fibre expansion and service capabilities to expand our relationships with them. We will maintain a focus on overall profitability by seeking to increase revenue per customer and customer retention, as well as through improving our processes to achieve further operating efficiencies and productivity gains.
Operating cost reduction will continue to be a key focus, helping to offset costs related to growth in IPTV and Internet subscribers, the ongoing erosion of high-margin wireline voice revenues and other legacy revenues, as well as competitive repricing pressures in our business and wholesale markets. This, combined with further service-level improvements and operating synergies from the integration of Bell Aliant within the Bell Wireline segment, is expected to support our objective of maintaining our consolidated Adjusted EBITDA margin stable year over year.
We also aim to continue investing significantly in broadband infrastructure and fibre expansion and upgrades to support our IPTV and residential Internet services, as well as new business solutions in key portfolios such as Internet and private networks, data centre and cloud services, unified communications and security services. We intend to pursue pricing methods that allow us to cover the capital costs of upgrading the network, providing new services and expanding capacity to meet growing data consumption.
ASSUMPTIONS
- Positive full-year revenue and Adjusted EBITDA growth
- IPTV contributing to TV and broadband Internet market sharegrowth, as well as fewer residential NAS losses, resulting in feweryear-over-year total wireline residential net customer lossesand higher penetration of three-product households
- Increasing wireless and Internet-based technological substitution
- Residential services ARPU growth from increased penetrationof three-product households, promotion expiries andprice increases
- Aggressive residential service bundle offers from cable TVcompetitors in our local wireline areas
- Improving year-over-year rate of decline in Bell BusinessMarkets revenue and Adjusted EBITDA
- Continued large business customer migration toIP-based systems
- Ongoing competitive reprice pressures in our business andwholesale markets
- Continued competitive intensity in our small and mid-sizedbusiness segments as cable operators and other telecom competitors continue to intensify their focus on the business segment
- New broadband fibre deployment expected to be largelyFTTH/fibre-to-the-premise (FTTP)
- Growing consumption of OTT TV services and on-demandstreaming video, projected growth in TV Everywhere as wellas the proliferation of devices, such as tablets, that consumevast quantities of bandwidth, will require considerable ongoingcapital investment
- No material financial, operational or competitive consequencesof changes in regulations affecting our wireline business
BCE Inc. 2014 ANNUAL REPORT 65 | |||
5 | BUSINESS SEGMENT ANALYSIS | MD&A |
| Key growth drivers |
- Increasing Fibe TV penetration of IPTV households reached
- Higher market share of industry TV and Internet subscribers
- Greater penetration of three-product households
- Faster pace of economic expansion and employment growthdriving increased business customer spending, new businessformation and higher demand for connectivity and otherprofessional and managed services
- Expansion of our customer relationships to drive higher revenueper customer
- Ongoing service innovation and product value enhancements
- Improved customer retention
| Principal business risks |
This section discusses certain principal business risks which specifically affect the Bell Wireline segment. For a detailed description of the principal risks that could have a material adverse effect on our business, refer to section 9,Business risks.
AGGRESSIVE COMPETITION RISK
IMPACT
| REGULATORY ENVIRONMENT RISK
IMPACT
| TV SUBSCRIBERS PENETRATION RISK
IMPACT
|
66 BCE Inc. 2014 ANNUAL REPORT | |||
MD&A | BUSINESS SEGMENT ANALYSIS | 5 |
| 5.3 Bell Media |
| Bell Media delivered consistently strong ratings across its TV and radio properties in 2014, while generating higher revenues, Adjusted EBITDA and cash flow that reflected the financial contribution from the acquisition of Astral. |
Key elements of relevant strategic imperatives

EXPAND MEDIA LEADERSHIP
2014 PROGRESS
- Maintained CTV’s #1 ranking as the most-watched networkin Canada for the 13th year in a row, and continued to leadwith a majority of the Top 20 programs nationally in allkey demographics
- Expanded TSN, Canada’s sports leader and the leading specialtyTV network in the country, from two to five national feeds,fully leveraging Bell Media’s unparalleled portfolio of premiumsports programming
- In December 2014, Bell Media concluded a multi-year broadcastrights agreement with UEFA, making TSN and RDS the primaryCanadian broadcasters of the crown jewels of club soccer – theUEFA Champions League and UEFA Europa League – beginningin 2015
- Concluded a multi-year agreement with the Formula One group,providing TSN and RDS with exclusive multi-platform mediarights to all Grand Prix races through to 2019
- Concluded a comprehensive media rights agreement with theUnited States Golf Association for exclusive Canadian coverageof the U.S. Open on TSN and RDS through to 2022
- Launched CraveTV SVOD TV streaming service, offering thelargest collection of premium content in one place on STBs,mobile devices and online
- Acquired the exclusive Canadian multi-platform rights, includingSVOD, to HBO’s off-air catalogue of TV programming, complementing a multi-year, multi-platform agreement that will seeHBO Canada exclusively deliver the entire past-season library ofevery HBO-scripted series currently on air
- Expanded TV Everywhere offerings with the launch of TSN GOand Super Écran GO
2015 FOCUS
- Maintain strong audience levels and ratings across all TV andradio properties
- Reinforce industry leadership in conventional TV, pay TV,sports media and radio
- Grow viewership and scale of new CraveTV on-demandTV streaming service
- Develop in-house production and content creation fordistribution and use across all platforms and screens
- Expand live and on-demand content through TV Everywhere services
- Grow French media properties
- Leverage cross-platform and integrated sales and sponsorship
- In support of the above focus areas, in January 2015, Bell Mediaconcluded a long-term content licensing and trademark agreement to bring the Showtime brand to Canada for the first time

ACHIEVE A COMPETITIVE COST STRUCTURE
2014 PROGRESS
- Realized fully the cost synergies from the integration of Astral into Bell Media
2015 FOCUS
- Continue to drive cost efficiencies to help partially offset revenue and content cost pressures
BCE Inc. 2014 ANNUAL REPORT 67 | |||
5 | BUSINESS SEGMENT ANALYSIS | MD&A |
| Financial performance analysis |
2014 PERFORMANCE HIGHLIGHTS
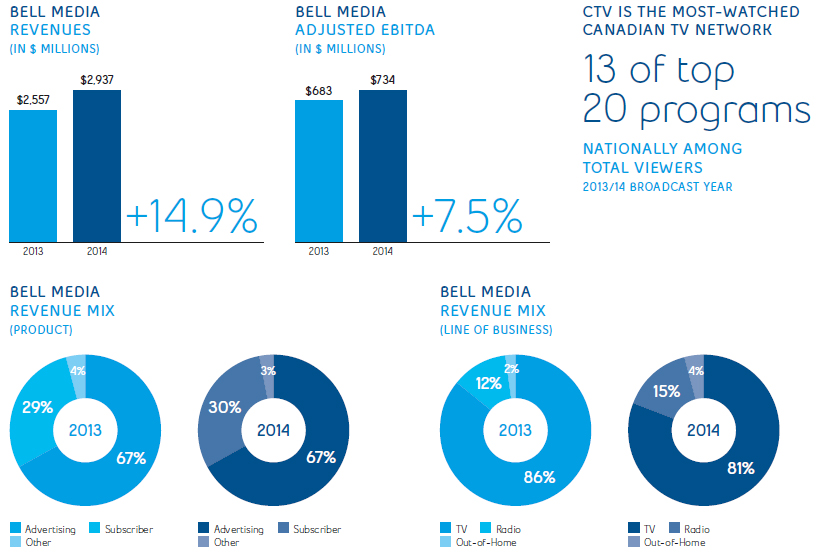
BELL MEDIA RESULTS
REVENUES
| 2014 | 2013 | $ CHANGE | % CHANGE | ||||
Total external revenues | 2,642 | 2,342 | 300 | 12.8 | % | |||
Inter-segment revenues | 295 | 215 | 80 | 37.2 | % | |||
Total Bell Media revenues | 2,937 | 2,557 | 380 | 14.9 | % |
Bell Media revenues grew 14.9% in 2014, due primarily to the acquisition of Astral on July 5, 2013, which contributed to growth in overall advertising and subscriber fee revenues in the first half of the year.
Advertising revenues in 2014, excluding Astral, decreased year-over-year, despite growth in full-day audience levels reflecting:
- General market softness
- A shift in advertising dollars to the main broadcaster ofthe Sochi 2014 Winter Olympic Games and 2014 FIFA WorldCup Soccer
- Increased spending for online services
- Lower digital advertising revenues due to continued shift ofadvertising dollars to global players like Google and Facebook
Despite the above pressures, revenues increased year-over-year in our specialty sports services, TSN and RDS, due to the strength of our programming as well as our OOH business from both strategic acquisitions and organic growth.
Subscriber fee revenues in 2014, excluding Astral, increased compared to last year, due to the flow-through of market-based rate increases for Bell Media’s specialty services, and higher revenues generated from our new TV Everywhere GO products. This was offset partly by the recognition of retroactive subscriber fee revenues in 2013 with certain BDUs that did not recur this year and the loss of revenue from services that ceased operations in 2014 (regional hockey feeds and Viewers Choice).
Additionally, Bell Media year-over-year revenues were unfavourably impacted by the recognition in Q4 2013 of retroactive revenues relating to retransmission royalties.
68 BCE Inc. 2014 ANNUAL REPORT | |||
MD&A | BUSINESS SEGMENT ANALYSIS | 5 |
OPERATING COSTS AND ADJUSTED EBITDA
| 2014 | 2013 | $ CHANGE | % CHANGE | ||||
Operating costs | (2,203 | ) | (1,874 | ) | (329 | ) | (17.6 | %) |
Adjusted EBITDA | 734 | 683 | 51 | 7.5 | % | |||
Adjusted EBITDA margin | 25.0 | % | 26.7 | % | (1.7 | %) |
Bell Media operating costs were up 17.6% in 2014 compared to last year mainly as a result of the acquisition of Astral combined with increased costs for sports broadcast rights and higher costs associated with our new TV Everywhere GO products. Partly offsetting the increase were cost synergies realized in 2014 from the integration of Astral into Bell Media and lower costs associated with the discontinuance of the Viewer’s Choice channel.
Bell Media Adjusted EBITDA increased 7.5% in 2014, mainly due to the contribution from the Astral acquisition, offset in part by higher year-over-year TV content expenses, particularly for sports broadcast rights.
BELL MEDIA OPERATING METRICS
- Achieved industry-leading revenue market share driven by Bell Media’s leadership in Canadian and international news, sports and entertainment programming
- Broadcasted all 4 of the top 4 programs among viewers aged25 to 54 for the first 12 weeks of the 2014 Fall season
- Maintained leading position in Québec as Bell Media’sproperties reached an average of 83% of the French-languagepopulation weekly
- Remained Canada’s top radio broadcaster, reaching 17.4 millionlisteners who spend 84 million hours tuned in each week
- Ranked first in digital media among all Canadian broadcast andvideo network competitors, and 7th among all online propertiesin the country, with monthly averages of 16.4 million visitors,3.3 million viewers, 340 million page views, 125 million visits and85 million videos
- Astral Out-of-Home is one of Canada’s leading OOH advertisingcompanies with over 9,500 advertising faces strategicallylocated in the markets of Québec, Ontario, Alberta andBritish Columbia
| Competitive landscape and industry trends |
COMPETITIVE LANDSCAPE
The Canadian media industry is highly competitive, with competitors having significant scale and financial resources. In recent years, there has been increased consolidation of traditional media assets across the Canadian media landscape. The majority of players have become more vertically integrated to better enable the acquisition and monetization of premium content.
Bell Media competes in the TV, radio and OOH advertising markets:
- TV: The TV market has become increasingly fragmented and thistrend is expected to continue as new services and technologiesincrease the diversity of information and entertainment outletsavailable to consumers
- Radio: Competition within the radio broadcasting industryoccurs primarily in discrete local market areas amongindividual stations
- OOH: The Canadian OOH advertising industry is fragmented,consisting of a few large companies as well as numerous smallerand local companies operating in a few local markets
Consumers have also been shifting their media consumption towards digital media, mobile devices and on-demand content. This has caused new business models to emerge and advertisers to shift portions of their spending to digital platforms.
BCE Inc. 2014 ANNUAL REPORT 69 | |||
5 | BUSINESS SEGMENT ANALYSIS | MD&A |
Competitors
TV
- Conventional Canadian TV stations (local and distant signals) and specialty and paychannels, such as those owned by Shaw, Corus Entertainment Inc. (Corus), Rogers,Québecor Media Inc. (Québecor), Canadian Broadcasting Corporation (CBC)/SociétéRadio-Canada (SRC) and Groupe V
- U.S. conventional TV stations and specialty channels
- OTT providers such as Netflix and Apple
Radio
- Large radio operators, such as Rogers, Corus, Cogeco and Newcap Inc. (Newcap) thatalso own and operate radio station clusters in various local markets
- Radio stations in specific local markets
- Satellite radio provider SiriusXM
- Newer technologies such as online music streaming services, music downloading,portable devices that store and play digital music and online music streaming service
- Other media such as newspapers, local weeklies, local TV, magazines, TV, outdooradvertising and the Internet
OOH Advertising
- Large outdoor advertisers, such as Jim Pattison Broadcast Group (Pattison), OutfrontMedia, Cieslok Media (Cieslok), Québecor and Dynamic
- Numerous smaller and local companies operating a limited number of display faces in afew local markets
- Other media such as TV, radio, print media and the Internet

INDUSTRY TRENDS
TECHNOLOGY AND CONSUMER HABITS TRANSFORMING THE WAY TV IS DELIVERED
Technology used in the media industry continues to evolve rapidly, which has led to alternative methods for the distribution, storage and consumption of content. These technological developments have driven and reinforced changes in consumer behaviour as consumers seek more control over when, where and how they consume content. For example, consumer electronics innovations have enabled consumers to view content on TVs, computers, tablets, smartphones and other mobile electronic devices. The number of Canadian users who are connected to the Internet through their TVs is growing as connection becomes easier and more affordable. Changes in technology and consumer behaviour have resulted in a number of challenges for content aggregators and distributors. The technological developments may disrupt traditional distribution platforms by enabling content owners to provide content directly to distributors and consumers, thus bypassing traditional content aggregators.
GROWTH OF ALTERNATIVES TO TRADITIONAL LINEAR TV
Consumers now have improved access to online entertainment and information alternatives that did not exist a few years ago. While traditional linear TV was the only way to access consumer primetime programming in the past, many people today watch TV in non-traditional ways for at least a portion of their viewing. In particular, today’s viewers are consuming more content online, watching less scheduled programming live, time-shifting original broadcasts through PVRs, viewing more TV on mobile devices, and catching up on past programming on demand. In addition, many consumers are spending considerable time with online alternatives to traditional TV. This is evident in the growing popularity of OTT video services like Netflix. To date, these OTT services have largely complemented existing TV services. Media companies are evolving their content and launching their own solutions to better compete with these non-traditional offerings through services such as Bell Media’s CraveTV on-demand TV streaming service and authenticated TV Everywhere services such as CTV GO, TSN GO and TMN GO.
ESCALATING CONTENT COSTS AND SHIFTS IN ADVERTISING
Viewership and usage trends suggest that online and mobile Internet video consumption is increasing rapidly. Changing content consumption patterns and growth of alternative content providers could exert downward pressure on rates and advertising revenues for traditional media broadcasters. However, live sports and special events should continue to draw audiences and advertisers, which is expected to result in pricing pressure on future broadcasting rights. Additionally, while access to premium content has become increasingly important to media companies in attracting viewers and advertisers, there is now increased competition for these rights. This has resulted in higher TV program rights costs, which is a trend that is expected to continue into the future.
| (1) | Broadcast year-end at August 31, 2014, 2+ age category, Fall 2014 for radio |
70 BCE Inc. 2014 ANNUAL REPORT | |||
MD&A | BUSINESS SEGMENT ANALYSIS | 5 |
| Business outlook and assumptions |
2015 OUTLOOK
Bell Media’s financial results in 2015 are expected to be impacted by increases in programming costs (including higher costs related to sports broadcast rights), investments in new initiatives such as CraveTV and higher regulatory Canadian content spending. CraveTV is designed to complement existing TV offerings as an additive service featuring exclusive premium programming and, therefore, distribution of the product will be through licensed BDUs. Management will focus on increasing the distribution of the CraveTV product in 2015. The impact on cash flow from escalating costs to secure TV programming and investment in new media service initiatives should be partly mitigated by lower year-over-year capital expenditures. We will also continue to carefully manage costs by leveraging assets, achieving productivity gains and pursuing operational efficiencies across all of our properties, while continuing to invest in premium content for all four screens.
While overall advertising markets are expected to remain relatively stable in 2015, we anticipate some advertiser demand to return to Bell Media following a shift in 2014 to the main broadcaster of the Sochi 2014 Winter Olympic Games and 2014 FIFA World Cup Soccer. Subscriber fee revenues are projected to increase, driven by growth in TV Everywhere and scaling of CraveTV, which should help offset expected declines in specialty and pay TV.
In conventional TV, we intend to leverage the strength of our market position to continue offering advertisers, both nationally and locally, premium opportunities to reach their target audiences. Success in this area requires that we focus on a number of factors, including:
- Successfully acquiring highly-rated programmingand differentiated content
- Building and maintaining strategic supply arrangementsfor content on four screens
- Producing and commissioning high-quality Canadian content,including market-leading news, enhancements throughinvestments in HD broadcasting and improvements to ournews programming
In sports specialty TV, as evidenced by TSN’s expansion to five national feeds (the TSN multiplex channels), we will aim to continue delivering premium content and exceptional viewing experiences to our viewers. Investment in the integration of our digital platforms will be an integral part of our strategy to further engage viewers. We have secured key hockey and other sports content that is important to Canadians. 2015 represents the first full year under a number of programming agreements entered into in 2014, as well as the first full year with the impact of the TSN multiplex channels, both of which will drive year-over-year cost increases and rate increases due to escalations in existing BDU contracts. We also intend to continue creating innovative high-quality productions in the areas of sports news and editorial coverage.
In non-sports specialty and pay TV, audiences and advertising revenues are expected to be driven by investment in quality programming and production. The agreement entered into with Home Box Office (HBO) in 2014, which secures the exclusive Canadian multi-platform rights to HBO’s off-air catalogue, is one example of our continuing investment in premium content. Additionally, we will continue to develop key brand partnership initiatives on our existing services and we intend to continue strengthening our pay TV offerings.
Our English-language specialty services will attempt to capitalize on Space, Bravo and Discovery’s leading position in the market, and we will focus on rebuilding audiences and revitalizing the brands and content of our TV services that appeal to younger viewers.
In our French-language pay and specialty services, we will optimize the CRTC tangible benefits in order to maximize quality content on screen and deploy such content on authenticated multi platforms. We will leverage our newly-launched Canal D Investigation channel that features reality documentaries and crime dramas as well as Super Écran’s new original fiction series.
In radio, we intend to leverage the strength of our market position to continue offering advertisers, both nationally and locally, premium opportunities to reach their target audiences. Additionally, in conjunction with local TV assets, we will pursue opportunities that can leverage our promotional capabilities, provide an expanded platform for content sharing, and offer synergistic colocation and efficiencies where practical.
In our OOH operations, we plan to leverage the strength of our products to provide advertisers with premium opportunities in Toronto and Montréal, as well as in certain Western markets. We will also continue to seek new opportunities in digital markets, including leveraging acquisitions made in 2014.
ASSUMPTIONS
- Lower year-over-year Adjusted EBITDA and margin, due toescalating costs to secure TV programming, including risingsports-rights costs and market rates for specialty content,CraveTV investment, higher regulatory Canadian contentspending, the expiry of certain CRTC benefits as well as thecompletion of the Local Programming Improvement Fund
- Ability to successfully acquire highly rated programming anddifferentiated content
- Building and maintaining strategic supply arrangements forcontent on all four screens
- Successful scaling of CraveTV
- TV unbundling and growth in OTT viewing expected to resultin moderately lower subscriber levels for many Bell MediaTV properties
- No material financial, operational or competitive consequencesof changes in regulations affecting our media business
BCE Inc. 2014 ANNUAL REPORT 71 | |||
5 | BUSINESS SEGMENT ANALYSIS | MD&A |
| Key growth drivers |
- Stronger economic growth that drives increased advertiser demand and spending, particularly in the key automotive, entertainmentequipment, telecommunications and consumer goods sectors
- Higher audience levels from strong ratings maintained across all TV and radio properties, as well as from securing multi-platform rights
- Investing in the best content, including more in-house productions
| Principal business risks |
This section discusses certain principal business risks which specifically affect the Bell Media segment. For a detailed description of the principal risks that could have a material adverse effect on our business, refer to section 9,Business risks.
AGGRESSIVE COMPETITION RISK
IMPACT
| ADVERTISING REVENUE UNCERTAINTY RISK
IMPACT
| RISING CONTENT COSTS AND ABILITY TO SECURE KEY CONTENT RISK
IMPACT
|
72 BCE Inc. 2014 ANNUAL REPORT | |||
MD&A | BUSINESS SEGMENT ANALYSIS | 5 |
| 5.4 Bell Aliant |
| Bell Aliant’s expanded FTTH network drove strong Internet and IPTV subscriber growth in 2014, helping to offset continued customer declines in its traditional voice business. The Privatization of Bell Aliant simplifies BCE’s corporate structure, while providing increased broadband scale with over 1.4 million combined Internet, TV and wireless customers and strong annualized Free Cash Flow accretion. |
Key strategic imperative achievements in 2014
- Expanded FTTH network footprint to an additional 211,000 homesand businesses, bringing total coverage to 1,016,582 customerpremises in communities across Atlantic Canada, Ontarioand Québec
- Enhanced TV offerings through various initiatives:
- Added 29 new HD channels, bringing the total numberof HD channels to 160
- Launched the CTV GO, TMN GO and TSN GO apps, enablingTV customers to stream content on their tablets, computersand smartphones
- Launched the FibreOP Remote app, which allows customers to usetheir smartphone or tablet as a remote to browse and surf theguide, search for programs and set up recordings while on the go
- Launched CraveTV subscription on-demand TV streamingservice, offering a large collection of premium TV content
- Enhanced Internet offerings with the introduction of a wirelessextender to FibreOP customers, ensuring they have the bestwireless coverage throughout their home
- Increased FibreOP Internet download speeds by at least 50%
- Began construction of a new data centre in Saint John,New Brunswick, which will provide the capacity to meet thedemands of Bell Aliant’s expanding ICT sector customers andsecuring Bell Aliant’s position as the leading provider of dataservices in Atlantic Canada
- Acquired O.N.TEL Inc. (Ontera), a full-service telecom companyoperating in Northeastern Ontario. Ontera’s network runsadjacent to Bell Aliant’s and includes 2,200 kilometres of fibre,which is expected to provide the opportunity for synergies
| Financial performance analysis |
2014 PERFORMANCE HIGHLIGHTS

BCE Inc. 2014 ANNUAL REPORT 73 | |||
5 | BUSINESS SEGMENT ANALYSIS | MD&A |
BELL ALIANT RESULTS
REVENUES
| 2014 | 2013 | $ CHANGE | % CHANGE | ||||
Data | 994 | 887 | 107 | 12.1 | % | |||
Local and access | 1,056 | 1,109 | (53 | ) | (4.8 | %) | ||
Long distance | 254 | 286 | (32 | ) | (11.2 | %) | ||
Wireless | 99 | 97 | 2 | 2.1 | % | |||
Equipment and other | 122 | 131 | (9 | ) | (6.9 | %) | ||
Total external revenues | 2,525 | 2,510 | 15 | 0.6 | % | |||
Inter-segment revenues | 232 | 249 | (17 | ) | (6.8 | %) | ||
Total Bell Aliant revenues | 2,757 | 2,759 | (2 | ) | (0.1 | %) |
Bell Aliant operating revenues remained essentially stable in 2014 despite competitive pricing pressures, as growth in data revenues was offset by lower local and access, long distance, and equipment and other revenues.
- Data revenues increased 12.1% in 2014, due to growth in Internetand IPTV services, along with higher IP data services revenuedriven by the expansion of Bell Aliant’s next-generation networktechnology and increased data product sales. The increase inInternet revenues was driven by FibreOP Internet customergrowth combined with higher residential high-speed InternetARPU attributable to increased customer adoption of higherbandwidth plans and price increases. Higher IPTV servicerevenues reflected growth in Bell Aliant’s FibreOP TV customerbase and the expiry of pricing offers.
- Local and access revenues decreased 4.8% in 2014 as a result ofthe continued erosion in Bell Aliant’s NAS customer base due tothe effect of aggressive discounting of bundled services by cablecompetitors, and continued migration of customers to wirelessand IP-based solutions
- Long distance revenues were down 11.2% in 2014, due to a lowerNAS base, substitution of traditional wireline service with e-mail,wireless calling and VoIP services, as well as customer migrationfrom per-minute plans to fixed rate plans
- Wireless revenues were up 2.1% in 2014 as a result of a higherwireless postpaid customer base
- Equipment and other revenues declined 6.9% in 2014, driven bythe loss of revenue generated by a contact centre subsidiarywhich ceased operations in late 2013, as well as lower volume ofcustom work
OPERATING COSTS AND ADJUSTED EBITDA
| 2014 | 2013 | $ CHANGE | % CHANGE | ||||
Operating costs | (1,520 | ) | (1,487 | ) | (33 | ) | (2.2 | %) |
Adjusted EBITDA | 1,237 | 1,272 | (35 | ) | (2.8 | %) | ||
Adjusted EBITDA margin | 44.9 | % | 46.1 | % | (1.2 | %) |
Bell Aliant operating costs increased 2.2% in 2014, reflecting higher IPTV content costs, increased customer service-related costs to support a growing FibreOP subscriber base, and greater advertising expenses. This was offset in part by negotiated reductions in payments to other carriers, lower labour costs from ongoing workforce restructuring, and lower post-employment benefit plans service cost.
Bell Aliant Adjusted EBITDA decreased 2.8% in 2014, mainly as a result of higher operating costs. Adjusted EBITDA margin declined to 44.9% in 2014 from 46.1% last year, as the impact from continued declines in higher-margin voice revenues was not fully offset by growth in lower-margin data service revenues.
74 BCE Inc. 2014 ANNUAL REPORT | |||
MD&A | BUSINESS SEGMENT ANALYSIS | 5 |
BELL ALIANT OPERATING METRICS
| 2014 | 2013 | CHANGE | % CHANGE | ||||
HIGH-SPEED INTERNET | ||||||||
High-speed Internet net activations | 57,444 | 33,679 | 23,765 | 70.6 | % | |||
High-speed Internet subscribers | 1,009,537 | 952,093 | 57,444 | 6.0 | % | |||
FibreOP Internet customers included in High-speed Internet customers | 257,552 | 183,971 | 73,581 | 40.0 | % | |||
IPTV | ||||||||
Net subscriber activations | 54,931 | 55,063 | (132 | ) | (0.2 | %) | ||
Total subscribers | 233,014 | 178,083 | 54,931 | 30.8 | % | |||
FibreOP TV | 218,537 | 158,044 | 60,493 | 38.3 | % | |||
NAS LINES | ||||||||
Residential | 1,372,402 | 1,462,462 | (90,060 | ) | (6.2 | %) | ||
Business | 865,214 | 890,858 | (25,644 | ) | (2.9 | %) | ||
Total | 2,237,616 | 2,353,320 | (115,704 | ) | (4.9 | %) | ||
NAS NET LOSSES | ||||||||
Residential | (90,060 | ) | (108,737 | ) | 18,677 | 17.2 | % | |
Business | (25,644 | ) | (29,313 | ) | 3,669 | 12.5 | % | |
Total | (115,704 | ) | (138,050 | ) | 22,346 | 16.2 | % | |
WIRELESS | ||||||||
Subscribers | 147,926 | 146,698 | 1,228 | 0.8 | % |
High-speed Internet subscriber net activations increased 70.6%, or by 23,765 subscribers, in 2014 to 57,444, reflecting fewer residential customer deactivations due to competitive pricing actions and continued steady demand for FibreOP service bundles, as well as higher wholesale customer activations. At December 31, 2014, Bell Aliant had 1,009,537 high-speed Internet subscribers, up 6.0% from 952,093 subscribers at the end of 2013.
IPTV net activations of 54,931 subscribers decreased 0.2% in 2014 as a result of slower growth in the Atlantic region due to a more mature footprint, partly offset by new footprint expansion in Québec and Ontario. At December 31, 2014, Bell Aliant had 233,014 IPTV customers, which included 218,537 FibreOP TV customers, compared to 178,083 IPTV customers at the end of 2013, which included 158,044 FibreOP TV customers.
NAS net losses improved 16.2%, or by 22,346 customers, in 2014 as a result of fewer customer deactivations in residential FibreOP markets due to competitive pricing actions, and higher residential activations from winbacks related to the launch of FibreOP in new markets. These results were achieved despite customer losses as a result of sustained competitive intensity from cable providers and continued customer substitution to wireless and IP-based solutions. At December 31, 2014, Bell Aliant had 2,237,616 NAS lines, representing a 4.9% decline compared to 2,353,320 NAS lines at the end of 2013.
Wireless customers totalled 147,926 at December 31, 2014, representing a 0.8% increase since the end of 2013.
BCE Inc. 2014 ANNUAL REPORT 75 | |||
5 | BUSINESS SEGMENT ANALYSIS | MD&A |
| Competitive landscape and industry trends |
COMPETITIVE LANDSCAPE
Cable companies are the most significant competitive threat to Bell Aliant. At the end of 2014, Bell Aliant’s competitive footprint overlap with cable companies was approximately 76.5% of residential households in its markets, representing a 0.7 percentage point increase from 2013. In addition, the rapid development of new technologies, services and products has facilitated the entry of other competitors into Bell Aliant’s markets, enabling these competitors to offer their customers an alternative to traditional voice services through wireless and IP-based technologies. Bell Aliant actively employs marketing strategies to remain competitive in all of its operating markets and continues to innovate and develop new and enhanced services to meet the communication needs of its customers.
Competition for residential local and long distance services also comes from substitution of wireless services, including Bell Mobility and Virgin Mobile wireless offerings.
Competitors
Cable TV providers offer cable TV, Internet and cable telephony services, including:
- EastLink in Atlantic Canada and rural Ontario
- Rogers in Newfoundland and Labrador, New Brunswickand Ontario
- Vidéotron in rural Québec
- Cogeco in rural Québec
- Shaw in rural Ontario
- Shaw Direct, providing DTH satellite TV service nationwide
- Some smaller private cable companies in rural communities
Various other companies, such as Vonage and Primus, that offer resale or VoIP-based local, long distance and Internet services.
OTT voice and video services such as Skype, Netflix and iTunes.
Digital media streaming devices such as Apple TV and Roku.
Market Facts
- There are 2.5 million households in Bell Aliant’s territory, whichincludes Atlantic Canada and rural Ontario and Québec
- Approximately 77% of the households in its territory have a cabletelephony alternative
- Over 85% of the households in its territory have access toBell Aliant’s high-speed Internet services; Internet penetrationis estimated to be between 70% to 75% across its territories
Beginning January 1, 2015, the results of operations of Bell Aliant are included within our Bell Wireless and Bell Wireline segments, with prior periods restated for comparative purposes. As a result, no discussion relating toIndustry trends, Business outlook and assumptions, Key growth drivers or Principal business risksis being provided for Bell Aliant. For a discussion concerning these items, refer to sections 5.1,Bell Wirelessand 5.2,Bell Wirelinein this MD&A.
76 BCE Inc. 2014 ANNUAL REPORT | |||
MD&A | FINANCIAL AND CAPITAL MANAGEMENT | 6 |
| 6 FINANCIAL AND CAPITAL MANAGEMENT |
This section tells you how we manage our cash and capital resources to carry out our strategy and deliver financial results. It provides an analysis of our financial condition, cash flows and liquidity on a consolidated basis.
| 6.1 Net Debt(1) |
| DECEMBER 31, 2014 | DECEMBER 31, 2013 | $ CHANGE | % CHANGE | ||||
Debt due within one year(2) | 3,743 | 2,571 | 1,172 | 45.6 | % | |||
Long-term debt | 16,355 | 16,341 | 14 | 0.1 | % | |||
Preferred shares(3) | 2,002 | 1,698 | 304 | 17.9 | % | |||
Cash and cash equivalents | (566 | ) | (335 | ) | (231 | ) | (69.0 | %) |
Net Debt | 21,534 | 20,275 | 1,259 | 6.2 | % |
| (1) | Net Debt is a non-GAAP financial measure and does not have any standardized meaning under IFRS. Therefore, it is unlikely to be comparable to similar measures presented by other issuers. See section 10.2,Non-GAAP financial measures and key performance indicators (KPIs) – Net Debtin this MD&A for more details. |
| (2) | Includes bank advances, notes payable and loans secured by trade receivables. |
| (3) | 50% of outstanding preferred shares of $4,004 million and $3,395 million in 2014 and 2013, respectively, are classified as debt as it is consistent with the treatment by some credit rating agencies. |
The increase of $1,186 million in debt due within one year and long-term debt was due to:
- The issuance of MTN debentures at Bell Canada with a totalprincipal amount of $1.25 billion and of MTNs at Bell Aliant witha total principal amount of $150 million
- An increase in our notes payable and bank advances (net ofrepayments) of $469 million
Partly offset by:
- $350 million early debt redemption of MTNs at Bell Aliant
- $300 million repayment of CTV Specialty Television Inc.(CTV Specialty) notes on February 18, 2014
- $33 million net repayments of finance leases and other debt
The increase in preferred shares was due to the issuance of BCE Cumulative Redeemable First Preferred Shares, Series AM, Series AO and Series AQ, for a total value of $609 million, as a result of the Preferred Share Exchange. See section 1.3,Key corporate developments – Bell Aliant Privatization and note exchange.
The increase in cash and cash equivalents of $231 million was due to:
- $2,744 million of Free Cash Flow
- $784 million net issuance of debt instruments
- $720 million total proceeds from BCE’s divestitures of TV servicesand radio stations
Partly offset by:
- $1,893 million dividends paid on common shares
- $989 million cash consideration paid in connection with thePrivatization of Bell Aliant
- $566 million payment for the acquisition of 700 MHz wirelessspectrum assets
- $350 million voluntary DB pension plan contribution
- $131 million of acquisition costs paid due mainly to CRTC tangiblebenefit payment requirements and Privatization costs
| 6.2 Outstanding share data |
COMMON SHARES OUTSTANDING | NUMBER OF SHARES | |
Outstanding, January 1, 2014 | 775,892,556 | |
Shares issued for the Privatization of Bell Aliant | 60,879,365 | |
Shares issued under employee stock option plan | 1,372,006 | |
Shares issued under employee savings plan (ESP) | 2,186,426 | |
Outstanding, December 31, 2014 | 840,330,353 |
| WEIGHTED AVERAGE | |||
STOCK OPTIONS OUTSTANDING | NUMBER OF OPTIONS | EXERCISE PRICE ($) | ||
Outstanding, January 1, 2014 | 7,870,231 | 40 | ||
Granted | 2,915,361 | 48 | ||
Exercised(1) | (1,372,006 | ) | 36 | |
Forfeited | (135,396 | ) | 44 | |
Outstanding, December 31, 2014 | 9,278,190 | 43 | ||
Exercisable, December 31, 2014 | 865,600 | 36 |
| (1) | The weighted average share price for options exercised in 2014 was $49. |
At March 5, 2015, 841,610,645 common shares and 11,153,196 stock options were outstanding.
BCE Inc. 2014 ANNUAL REPORT 77 | |||
6 | FINANCIAL AND CAPITAL MANAGEMENT | MD&A |
| 6.3 Cash flows |
| 2014 | 2013 | $ CHANGE | % CHANGE | ||||
Cash flows from operating activities | 6,241 | 6,476 | (235 | ) | (3.6 | %) | ||
Bell Aliant dividends paid to BCE | 95 | 191 | (96 | ) | (50.3 | %) | ||
Capital expenditures | (3,717 | ) | (3,571 | ) | (146 | ) | (4.1 | %) |
Cash dividends paid on preferred shares | (134 | ) | (127 | ) | (7 | ) | (5.5 | %) |
Cash dividends paid by subsidiaries to non-controlling interest | (145 | ) | (283 | ) | 138 | 48.8 | % | |
Acquisition costs paid | 131 | 80 | 51 | 63.8 | % | |||
Voluntary defined benefit pension plan contribution | 350 | – | 350 | n.m. | ||||
Bell Aliant free cash flow | (77 | ) | (195 | ) | 118 | 60.5 | % | |
Free cash flow | 2,744 | 2,571 | 173 | 6.7 | % | |||
Bell Aliant free cash flow, excluding dividends paid | (18 | ) | 4 | (22 | ) | n.m. | ||
Acquisition costs paid | (131 | ) | (80 | ) | (51 | ) | (63.8 | %) |
Voluntary defined benefit pension plan contribution | (350 | ) | – | (350 | ) | n.m. | ||
Business acquisitions | (18 | ) | (2,850 | ) | 2,832 | 99.4 | % | |
Business dispositions | 720 | 1 | 719 | n.m. | ||||
Acquisition of spectrum licences | (566 | ) | – | (566 | ) | n.m. | ||
Other investing activities | 11 | 19 | (8 | ) | (42.1 | %) | ||
Net issuance of debt instruments | 784 | 2,215 | (1,431 | ) | (64.6 | %) | ||
Reduction in securitized trade receivables | – | (14 | ) | 14 | n.m. | |||
Early debt redemption costs | (4 | ) | (55 | ) | 51 | 92.7 | % | |
Privatization of Bell Aliant | (989 | ) | – | (989 | ) | n.m. | ||
Issue of common shares | 49 | 13 | 36 | n.m. | ||||
Issue of equity securities by subsidiaries to non-controlling interest | – | 230 | (230 | ) | n.m. | |||
Cash dividends paid on common shares | (1,893 | ) | (1,795 | ) | (98 | ) | (5.5 | %) |
Other financing activities | (108 | ) | (53 | ) | (55 | ) | n.m. | |
Net increase in cash and cash equivalents | 231 | 206 | 25 | 12.1 | % | |||
Free cash flow per share(1) | $3.46 | $3.31 | $0.15 | 4.5 | % |
| (1) | Free Cash Flow per share is a non-GAAP financial measure and does not have any standardized meaning under IFRS. Therefore, it is unlikely to be comparable to similar measures presented by other issuers. See section 10.2,Non-GAAP financial measures and key performance indicators (KPIs) – Free Cash Flow and Free Cash Flow per sharein this MD&A for more details. |
| n.m.: not meaningful | |
| Cash flows from operating activities and Free Cash Flow |
In 2014, BCE’s cash flows from operating activities decreased $235 million compared to 2013 as a result of a $350 million voluntary DB pension plan contribution made in 2014 and higher income taxes paid, partly offset by higher Adjusted EBITDA and an improvement in working capital.
Free Cash Flow in 2014 increased $173 million, driven mainly by higher Adjusted EBITDA and an improvement in working capital, partly offset by higher income taxes paid and increased capital expenditures.
Free Cash Flow per share in 2014 was $3.46 per common share, compared to $3.31 per common share in 2013.
78 BCE Inc. 2014 ANNUAL REPORT | |||
MD&A | FINANCIAL AND CAPITAL MANAGEMENT | 6 |
| Capital expenditures |
| 2014 | 2013 | $ CHANGE | % CHANGE | ||||
Bell | 3,142 | 3,001 | (141 | ) | (4.7 | %) | ||
Capital intensity ratio | 16.8 | % | 16.6 | % | (0.2 | %) | ||
Bell Aliant | 575 | 570 | (5 | ) | (0.9 | %) | ||
Capital intensity ratio | 20.9 | % | 20.7 | % | (0.2 | %) | ||
BCE | 3,717 | 3,571 | (146 | ) | (4.1 | %) | ||
Capital intensity ratio | 17.7 | % | 17.5 | % | (0.2 | %) |
BCE capital expenditures increased $146 million, or 4.1%, in 2014, reflecting higher spending at both Bell and Bell Aliant. Capital expenditures as a percentage of revenue (capital intensity ratio) for BCE was 17.7% in 2014 compared to 17.5% last year.
Bell capital expenditures were $141 million, or 4.7%, higher in 2014, corresponding to a capital intensity ratio of 16.8%, up 0.2 percentage points over 2013. The year-over-year increase reflected:
- Higher wireline capital expenditures to further expand our Fibe TV service footprint, in order to connect more homes and businesses directly with broadband fibre and to support the execution of business customer contracts
- Increased wireless capital spending for the continued deployment of our 4G LTE network, which reached approximately 86%of the Canadian population at December 31, 2014, as well asongoing investments to increase network capacity to accommodate increasing data usage and enable higher LTE speeds
- Higher media capital expenditures as a result of the Astralacquisition, and from increasing broadcasting capacity andTV production equipment related to the expansion of TSN fromtwo to five national feeds
Bell Aliant capital expenditures increased a modest $5 million, or 0.9%, corresponding to a capital intensity ratio of 20.9% compared to 20.7% in 2013. The increase in spending was attributable to continued expansion of the broadband fibre network, offset in part by lower capital expenditures for legacy services.
| Voluntary DB pension plan contribution |
In 2014, we made a voluntary contribution of $350 million to fund our post-employment benefit obligation and aligned the funded status of Bell Aliant’s DB pension plan with the strong solvency position of the Bell Canada plans. The voluntary contribution was funded from cash on hand at the end of 2014 and will reduce the amount of BCE’s future pension obligations.
| Business acquisitions |
Business acquisitions in 2013 reflect our acquisition of Astral of $2,844 million, net of $32 million of cash acquired.
| Business dispositions |
In 2014, we completed the sale of certain TV services and radio stations for total cash proceeds of $720 million.
| Acquisition of spectrum licences |
On April 2, 2014, Bell acquired 700 MHz spectrum licences in every province and territorial market, comprised of 31 licences for $566 million.
BCE Inc. 2014 ANNUAL REPORT 79 | |||
6 | FINANCIAL AND CAPITAL MANAGEMENT | MD&A |
| Debt instruments |
We use a combination of short-term and long-term debt to finance our operations. Our short-term debt consists mostly of bank facilities, notes payable under commercial paper programs and loans securitized by trade receivables. We usually pay fixed rates of interest on our long-term debt and floating rates on our short-term debt. As at December 31, 2014, all of our debt was denominated in Canadian dollars with the exception of one of our credit facilities and a portion of our commercial paper, which are denominated in U.S. dollars, all of which have been hedged for foreign currency fluctuations through forward currency contracts.
2014
We issued $784 million of debt, net of repayments. This included the issuance of Series M-30 and Series M-31 MTN debentures at Bell Canada with a principal amount of $1.25 billion and MTNs at Bell Aliant with a principal amount of $150 million, as well as $469 million of notes payable and bank advances, partly offset by repayments of financial leases and other debt of $435 million, $350 million of early debt redemption of MTNs at Bell Aliant and $300 million of CTV Specialty notes on February 18, 2014.
2013
We issued $2,215 million of debt, net of repayments. This included the issuance of Series M-26, Series M-27, Series M-28 and Series M-29 MTN debentures at Bell Canada with a total principal amount of $3 billion, $1 billion drawn under Bell Canada’s unsecured committed-term acquisition credit facility to fund a portion of the purchase price of Astral, the issuance of MTNs at Bell Aliant with a total principal amount of $400 million, and an increase in our notes payable and bank advances, net of repayments, of $272 million. This was partly offset by the early debt redemption of Series M-20 MTN debentures at Bell Canada amounting to $1 billion, $440 million of payments under finance leases, $400 million of early debt redemption of Series 3 MTNs at Bell Aliant, $397 million of repayment of debt assumed on the acquisition of Astral, $150 million of early debt redemption of Series EA debentures at Bell Canada and $70 million repayment of Series AA debentures at Bell Aliant.
| Privatization of Bell Aliant |
In 2014, we paid $989 million in connection with the Privatization of Bell Aliant, representing 25% of the consideration for the acquisition of the outstanding publicly held common shares of Bell Aliant that we did not already own. Refer to section 1.3,Key corporate developments – Bell Aliant Privatization and note exchange,for details on the Privatization.
| Issue of equity securities by subsidiaries to NCI |
In 2013, Bell Aliant Preferred Equity Inc., an indirect subsidiary of Bell Aliant, issued preferred shares for gross proceeds of $230 million.
| Cash dividends paid on common shares |
The BCE Board approved increases in the common share dividend in 2014 and 2013. Accordingly, in 2014, the cash dividend paid on a BCE common share increased to $2.47 per common share, compared to a cash dividend of $2.315 per common share in 2013.
| 6.4 Post-employment benefit plans |
For the year ended December 31, 2014, we recorded an increase in our post-employment benefit obligations and a loss, before taxes and NCI, in OCI of $938 million. This was due to a lower actual discount rate of 4.0% at December 31, 2014, compared to 4.9% at December 31, 2013, partly offset by a higher-than-expected return on plan assets.
For the year ended December 31, 2013, we recorded a decrease in our post-employment benefit obligations and a gain, before taxes and NCI, in OCI of $1,416 million. This was due to an increase in the discount rate to 4.9% at December 31, 2013, compared to 4.4% at December 31, 2012, partly offset by a lower-than-expected return on plan assets.
| 6.5 Privatization of Bell Aliant |
The Privatization was accounted for as an equity transaction which increased BCE’s deficit by $2,143 million, BCE’s common shares by $2,928 million and preferred shares by $609 million, and reduced NCI by $877 million and contributed surplus by $1,499 million. Refer to section 1.3,Key corporate developments – Bell Aliant Privatization and note exchange,for details on the Privatization.
80 BCE Inc. 2014 ANNUAL REPORT | |||
MD&A | FINANCIAL AND CAPITAL MANAGEMENT | 6 |
| 6.6 Financial risk management |
Management’s objectives are to protect BCE and its subsidiaries on a consolidated basis against material economic exposures and variability of results from various financial risks that include credit risk, liquidity risk, foreign currency risk, interest rate risk and equity price risk. These risks are further described in Note 2,Significant accounting policies, Note 9,Other income (expense)and Note 24,Financial and capital management.
The following table outlines our financial risks, how we manage these risks and their financial statement classification.
| FINANCIAL RISK | DESCRIPTION OF RISK | MANAGEMENT OF RISK AND FINANCIAL STATEMENT CLASSIFICATION |
| Credit risk | We are exposed to credit risk from operating activities and certain financing activities, the maximum exposure of which is represented by the carrying amounts reported on the statements of financial position. We are exposed to credit risk if counterparties to our trade receivables and derivative instruments are unable to meet their obligations. Our trade receivables and allowance for doubtful accounts balances at December 31, 2014 were $3,068 million and $69 million, respectively. |
|
| Liquidity risk | We are exposed to liquidity risk for financial liabilities. Refer to section 6.8,Liquidity – Contractual obligations, for a maturity analysis of our recognized financial liabilities. |
|
| Currency risk | We are exposed to currency risk related to anticipated transactions and certain foreign currency debt. Refer to the followingFair valuesection for details on our derivative financial instruments. |
|
| Interest rate risk | We are exposed to risk on the interest rates of our debt and our post-employment benefit plans.
|
|
| Equity price risk | We are exposed to risk on our cash flow related to share-based payment plans. Refer to the followingFair value section for details on our derivative financial instruments |
|
.
BCE Inc. 2014 ANNUAL REPORT 81 | |||
6 | FINANCIAL AND CAPITAL MANAGEMENT | MD&A |
| Fair value |
Fair value is the price that would be received to sell an asset or paid to transfer a liability in an orderly transaction between market participants at the measurement date.
Certain fair value estimates are affected by assumptions we make about the amount and timing of future cash flows and discount rates, all of which reflect varying degrees of risk. Income taxes and other expenses that would be incurred on disposition of financial instruments are not reflected in the fair values. As a result, the fair values are not the net amounts that would be realized if these instruments were settled.
The carrying values of our cash and cash equivalents, trade and other receivables, assets held for sale, trade payables and accruals, compensation payable, severance and other costs payable, interest payable, notes payable, bank advances and loans secured by trade receivables approximate fair value as they are short term.
The following table provides the fair value details of financial instruments measured at amortized cost in the statements of financial position.
| DECEMBER 31, 2014 | DECEMBER 31, 2013 | |||||||||
| CARRYING | FAIR | CARRYING | FAIR | |||||||
| CLASSIFICATION | FAIR VALUE METHODOLOGY | VALUE | VALUE | VALUE | VALUE | |||||
CRTC tangible benefits obligation | Other current and non-current liabilities | Present value of estimated future cash flows discounted using observable market interest rates | 285 | 289 | 350 | 350 | ||||
CRTC deferral account obligation | Other current and non-current liabilities | Present value of estimated future cash flows discounted using observable market interest rates | 174 | 191 | 264 | 283 | ||||
Debentures, finance leases and other debt | Debt due within one year and long-term debt | Quoted market price of debt or present value of future cash flows discounted using observable market interest rates | 17,723 | 20,059 | 17,019 | 18,714 | ||||
The following table provides the fair value details of financial instruments measured at fair value in the statements of financial position.
|
| FAIR VALUE AT DECEMBER 31 | |||||||
|
| QUOTED PRICES IN | |||||||
|
| CARRYING VALUE OF | ACTIVE MARKETS FOR | OBSERVABLE | NON-OBSERVABLE | ||||
|
| ASSET (LIABILITY) AT | IDENTICAL ASSETS | MARKET DATA | MARKET INPUTS | ||||
| CLASSIFICATION | DECEMBER 31 | (LEVEL 1) | (LEVEL 2) | (1) | (LEVEL 3) | (2) | ||
2014 |
| ||||||||
AFS publicly-traded and privately-held investments(3) | Other non-current assets | 107 | 17 | – | 90 | ||||
Derivative financial instruments | Other current assets, Trade payables and other liabilities, Other non-current assets and liabilities | 276 | – | 276 | – | ||||
MLSE financial liability(4) | Other non-current liabilities | (135 | ) | – | – | (135 | ) | ||
Other | Other non-current assets and liabilities | 12 | – | 22 | (10 | ) | |||
2013 |
| ||||||||
AFS publicly-traded and privately-held investments | Other non-current assets | 91 | 14 | – | 77 | ||||
Derivative financial instruments | Other current assets, Trade payables and other liabilities, Other non-current assets and liabilities | 209 | – | 209 | – | ||||
MLSE financial liability | Other non-current liabilities | (135 | ) | – | – | (135 | ) | ||
| (1) | Observable market data such as equity prices, interest rates, swap rate curves and foreign currency exchange rates. |
| (2) | Non-observable market inputs such as discounted cash flows. A reasonable change in our assumptions would not result in a significant increase (decrease) to our level 3 financial instruments. |
| (3) | Unrealized gains and losses on AFS financial assets are recorded in OCI and are reclassified toOther income (expense)in the income statements when realized or when an impairment is determined. |
| (4) | Represents BCE’s obligation to repurchase the BCE Master Trust Fund’s (Master Trust) 9% interest in MLSE at a price not less than an agreed minimum price should the Master Trust exercise its put option. |
82 BCE Inc. 2014 ANNUAL REPORT | |||
MD&A | FINANCIAL AND CAPITAL MANAGEMENT | 6 |
| 6.7 Credit ratings |
Credit ratings generally address the ability of a company to repay principal and pay interest on debt or dividends on issued and outstanding preferred shares.
Our ability to raise financing depends on our ability to access the public equity and debt capital markets as well as the bank credit market. Our ability to access such markets and the cost and amount of funding available partly depends on the quality of our credit ratings at the time capital is raised. Investment-grade credit ratings usually mean that when we borrow money, we qualify for lower interest rates than companies that have ratings lower than investment-grade. A ratings downgrade could result in adverse consequences for our funding capacity or ability to access the capital markets.
The following table provides BCE’s and Bell Canada’s credit ratings as at March 5, 2015 from S&P, DBRS and Moody’s.
| Key credit ratings |
| BELL CANADA(1) | |||||
AT MARCH 5, 2015 | DBRS | MOODY'S | S&P | |||
Commercial paper | R-1 (low) | P-2 | A-1 (Low) (Canadian scale) | |||
| A-2 (Global scale) | |||||
Long-term debt | A (low) | Baa1 | BBB+ | |||
Subordinated long-term debt | BBB | Baa2 | BBB | |||
| BCE(1) | |||||
| DBRS | MOODY'S | S&P | |||
Preferred shares | Pfd-3 (high) | – | P-2 (Low) (Canadian scale) | |||
| BBB – (Global scale) | |||||
| (1) | Outlooks on all ratings are stable. These credit ratings are not recommendations to buy, sell or hold any of the securities referred to above, and they may be revised or withdrawn at any time by the assigning rating organization. Each credit rating should be evaluated independently of any other credit rating. |
| 6.8 Liquidity |
Sources of liquidity
Our cash and cash equivalents balance at the end of 2014 was $566 million. We expect that this balance, our 2015 estimated cash flows from operations, and possible capital markets financing, including commercial paper, will permit us to meet our cash requirements in 2015 for capital expenditures, post-employment benefit plans funding, dividend payments, the payment of contractual obligations, maturing debt, ongoing operations, the purchase of spectrum, and other cash requirements.
Should our 2015 cash requirements exceed our cash and cash equivalents balance, cash generated from our operations, and capital markets financings, we would cover such a shortfall by drawing under committed revolving credit facilities that are currently in place or through new facilities, to the extent available.
Our cash flows from operations, cash and cash equivalents balance, capital markets financings and credit facilities should give us flexibility in carrying out our plans for future growth, including business acquisitions and contingencies.
| COMMERCIAL | |||||||||
| TOTAL | LETTERS OF | PAPER | NET | ||||||
AT DECEMBER 31, 2014 | AVAILABLE | DRAWN | CREDIT | OUTSTANDING | AVAILABLE | |||||
Committed credit facilities | ||||||||||
Unsecured revolving facility(1)(2) | 2,500 | – | – | 1,453 | 1,047 | |||||
Unsecured committed term credit facility (Astral)(3) | 1,018 | 1,018 | – | – | – | |||||
Other | 100 | – | 98 | – | 2 | |||||
Total committed credit facilities | 3,618 | 1,018 | 98 | 1,453 | 1,049 | |||||
Total non-committed credit facilities | 1,101 | – | 626 | – | 475 | |||||
Total committed and non-committed credit facilities | 4,719 | 1,018 | 724 | 1,453 | 1,524 |
| (1) | Bell Canada’s $2,500 million revolving facility expires in November 2019. Bell Aliant’s $750 million revolving facility was cancelled in 2014. |
| (2) | As of December 31, 2014, Bell Canada’s outstanding commercial paper included $431 million U.S. ($501 million Canadian) which has been hedged for foreign currency fluctuations through forward currency contracts. |
| (3) | Bell Canada may borrow up to 1 billion Canadian dollars in either Canadian or equivalent U.S. dollars under this credit facility. Bell Canada’s outstanding balance at December 31, 2014 was $1,018 million Canadian ($877 million U.S.), which has been hedged using cross currency basis swaps. |
BCE Inc. 2014 ANNUAL REPORT 83 | |||
6 | FINANCIAL AND CAPITAL MANAGEMENT | MD&A |
Bell Canada may issue notes in an aggregate amount of up to 2 billion dollars in either Canadian or U.S. dollars under its commercial paper program, supported by a committed revolving bank credit facility. The total amount of this credit facility may be drawn at any time. Some of our credit agreements require us to meet specific financial ratios and to offer to repay and cancel the credit agreement upon a change of control of BCE or Bell Canada. We are in compliance with all conditions and restrictions.
| Cash requirements |
CAPITAL EXPENDITURES
In 2015, our capital spending is planned to focus on our strategic imperatives, reflecting an appropriate level of investment in our networks and services.
POST-EMPLOYMENT BENEFIT PLANS FUNDING
Our post-employment benefit plans include DB pension and defined contribution (DC) pension plans, as well as other post-employment benefits (OPEBs). The funding requirements of our post-employment benefit plans, resulting from valuations of our plan assets and liabilities, depend on a number of factors, including actual returns on post-employment benefit plan assets, long-term interest rates, plan demographics, and applicable regulations and actuarial standards. Our expected funding for 2015 is detailed in the following table and is subject to actuarial valuations that will be completed in mid-2015. An actuarial valuation was last performed for our significant post-employment benefit plans as at December 31, 2013.
2015 EXPECTED FUNDING | TOTAL | |
DB pension plans – service cost | 212 | |
DB pension plans – deficit | 13 | |
DB pension plans | 225 | |
OPEBs | 80 | |
DC pension plans | 95 | |
Total net post-employment benefit plans | 400 |
BCE closed the membership of its DB pension plans to new employees in January 2005 to reduce the impact of pension volatility on earnings over time. Generally, new employees now enrol in the DC pension plans. In 2006, we announced the phase-out, over a ten-year period, of OPEBs for most employees, which will result in OPEBs funding being phased out gradually after 2016.
In the first quarter of 2015, the Bell Canada Pension Plan (the Plan) entered into an investment arrangement to hedge part of the Plan’s exposure to potential increases in longevity which covers approximately $5 billion of post-employment benefit obligations. This arrangement requires no additional cash contributions from BCE.
DIVIDEND PAYMENTS
In 2015, the cash dividends to be paid on BCE’s common shares are expected to be higher than in 2014 as BCE’s annual common share dividend increased by 5.3% to $2.60 per common share from $2.47 per common share at the end of 2014. This increase is consistent with BCE’s common share dividend policy of a target payout between 65% and 75% of Free Cash Flow. BCE’s dividend policy and the declaration of dividends are subject to the discretion of the BCE Board.
84 BCE Inc. 2014 ANNUAL REPORT | |||
MD&A | FINANCIAL AND CAPITAL MANAGEMENT | 6 |
CONTRACTUAL OBLIGATIONS
The following table is a summary of our contractual obligations at December 31, 2014 that are due in each of the next five years and thereafter.
| THERE- | |||||||||||||
| 2015 | 2016 | 2017 | 2018 | 2019 | AFTER | TOTAL | |||||||
Recognized financial liabilities | ||||||||||||||
Long-term debt | 1,031 | 2,389 | 1,130 | 1,729 | 1,309 | 7,924 | 15,512 | |||||||
Notes payable and bank advances | 1,454 | – | – | – | – | – | 1,454 | |||||||
Minimum future lease payments under finance leases | 491 | 444 | 313 | 260 | 237 | 1,405 | 3,150 | |||||||
Loans secured by trade receivables | 921 | – | – | – | – | – | 921 | |||||||
Interest payable on long-term debt, notes payable, bank advances and loan secured by trade receivables | 652 | 554 | 510 | 470 | 415 | 4,548 | 7,149 | |||||||
MLSE financial liability | – | – | 135 | – | – | – | 135 | |||||||
Net interest receipts on derivatives | (23 | ) | (22 | ) | (11 | ) | – | – | – | (56 | ) | |||
Commitments (off-balance sheet) | ||||||||||||||
Operating leases | 295 | 249 | 211 | 161 | 134 | 748 | 1,798 | |||||||
Commitments for property, plant and equipment and intangible assets | 851 | 573 | 441 | 450 | 321 | 1,617 | 4,253 | |||||||
Purchase obligations | 1,443 | 448 | 360 | 188 | 178 | 1,005 | 3,622 | |||||||
Glentel acquisition | 670 | – | – | – | – | – | 670 | |||||||
Total | 7,785 | 4,635 | 3,089 | 3,258 | 2,594 | 17,247 | 38,608 |
BCE’s significant finance leases are for satellites and office premises. The leases for satellites, used to provide programming to our Bell TV customers, have a term of 15 years. The satellite leases are non-cancellable. The office leases have a typical lease term of 25 years. Minimum future lease payments under finance leases include future finance costs of $929 million.
BCE’s significant operating leases are for office premises, cellular tower sites and retail outlets with lease terms ranging from 1 to 33 years. These leases are non-cancellable and are renewable at the end of the lease period. Rental expense relating to operating leases was $335 million in 2014 and $300 million in 2013.
Purchase obligations consist of contractual obligations under service and product contracts, for operating expenditures. Our commitments for property, plant and equipment and intangible assets include program and feature film rights, investments to expand and update our networks to meet customer demand.
INDEMNIFICATIONS AND GUARANTEES
As a regular part of our business, we enter into agreements that provide for indemnifications and guarantees to counterparties in transactions involving business dispositions, sales of assets, sales of services, purchases and development of assets, securitization agreements and operating leases.
We cannot reasonably estimate the maximum potential amount we could be required to pay counterparties because of the nature of almost all of these indemnifications and guarantees. As a result, we cannot determine how they could affect our future liquidity, capital resources or credit risk profile. We have not made any significant payments under indemnifications or guarantees in the past.
| Litigation |
We become involved in various legal proceedings as a part of our business. While we cannot predict the final outcome or timing of the legal proceedings that were pending at March 5, 2015, based on information currently available and management’s assessment of the merits of such legal proceedings, management believes that the resolution of these legal proceedings will not have a material and negative effect on our financial statements. We believe that we have strong defences and we intend to vigorously defend our positions.
You will find a description of the principal legal proceedings pending at March 5, 2015 in the BCE 2014 AIF.
BCE Inc. 2014 ANNUAL REPORT 85 | |||
7 | SELECTED ANNUAL AND QUARTERLY INFORMATION | MD&A |
| 7 SELECTED ANNUAL AND QUARTERLY INFORMATION |
7.1 Annual financial information
The following table shows selected consolidated financial data of BCE for 2014, 2013 and 2012, prepared in accordance with IFRS as issued by the International Accounting Standards Board (IASB). We discuss the factors that caused our results to vary over the past two years throughout this MD&A.
| 2014 | (1) | 2013 | (2) | 2012 | (3) |
CONSOLIDATED INCOME STATEMENTS | ||||||
Operating revenues | 21,042 | 20,400 | 19,978 | |||
Operating costs | (12,739 | ) | (12,311 | ) | (12,090 | ) |
Adjusted EBITDA | 8,303 | 8,089 | 7,888 | |||
Severance, acquisition and other costs | (216 | ) | (406 | ) | (133 | ) |
Depreciation | (2,880 | ) | (2,734 | ) | (2,678 | ) |
Amortization | (572 | ) | (646 | ) | (714 | ) |
Finance costs | ||||||
Interest expense | (929 | ) | (931 | ) | (865 | ) |
Interest on post-employment benefit obligations | (101 | ) | (150 | ) | (131 | ) |
Other income (expense) | 42 | (6 | ) | 269 | ||
Income taxes | (929 | ) | (828 | ) | (760 | ) |
Net earnings | 2,718 | 2,388 | 2,876 | |||
Net earnings attributable to: | ||||||
Common shareholders | 2,363 | 1,975 | 2,456 | |||
Preferred shareholders | 137 | 131 | 139 | |||
Non-controlling interest | 218 | 282 | 281 | |||
Net earnings | 2,718 | 2,388 | 2,876 | |||
Net earnings per common share | ||||||
Basic | 2.98 | 2.55 | 3.17 | |||
Diluted | 2.97 | 2.54 | 3.17 | |||
Included in net earnings: | ||||||
Severance, acquisition and other costs | (148 | ) | (299 | ) | (94 | ) |
Net gains (losses) on investments | 8 | (7 | ) | 256 | ||
Early debt redemption costs | (21 | ) | (36 | ) | – | |
Adjusted net earnings | 2,524 | 2,317 | 2,294 | |||
Adjusted EPS | 3.18 | 2.99 | 2.96 | |||
RATIOS | ||||||
Adjusted EBITDA margin (%) | 39.5 | % | 39.7 | % | 39.5 | % |
Return on equity (%) | 21.0 | % | 17.9 | % | 23.2 | % |
| (1) | On October 31, 2014, BCE completed its acquisition of all the issued and outstanding common shares of Bell Aliant that it did not already own. Refer to section 1.3,Key corporate developments – Bell Aliant Privatization and note exchangefor further details of the transaction. |
| (2) | On July 5, 2013, BCE acquired 100% of the issued and outstanding shares of Astral. As part of its approval of the Astral acquisition, the CRTC ordered BCE to spend $246.9 million in new benefits for French- and English-language TV, radio and film content development, support for emerging Canadian musical talent, training and professional development for Canadian media, and new consumer participation initiatives. The present value of this tangible benefits obligation, amounting to $230 million, was recorded as an acquisition cost inSeverance, acquisition and other costsin 2013. Total acquisition costs relating to Astral, including the tangible benefits obligation, amounted to $266 million in 2013. |
| (3) | In December 2012, a joint operation owned 50% by BCE sold certain spectrum licences and network equipment to its owners, with BCE and the non-related venturer each purchasing 50% of the assets with a fair value of $1,181 million and a carrying value of $250 million. As a result, BCE recorded a gain on investments of $233 million inOther income (expense)in 2012, representing 50% of the gain relating to the assets sold to the non-related venturer. |
86 BCE Inc. 2014 ANNUAL REPORT | |||
MD&A | SELECTED ANNUAL AND QUARTERLY INFORMATION | 7 |
| 2014 | 2013 | 2012 | |||
CONSOLIDATED STATEMENTS OF FINANCIAL POSITION | ||||||
Total assets | 46,297 | 45,384 | 40,969 | |||
Cash and cash equivalents | 566 | 335 | 129 | |||
Debt due within one year (including bank advances, notes payable and loan secured by trade receivables) | 3,743 | 2,571 | 2,136 | |||
Long-term debt | 16,355 | 16,341 | 13,886 | |||
Total non-current liabilities | 21,969 | 21,244 | 19,498 | |||
Equity attributable to BCE shareholders | 14,946 | 15,011 | 13,875 | |||
Total equity | 15,239 | 16,250 | 14,725 | |||
RATIOS | ||||||
Total debt to total assets (times) | 0.43 | 0.42 | 0.39 | |||
Total debt to total equity (times) | 1.16 | 1.05 | 0.98 | |||
CONSOLIDATED STATEMENTS OF CASH FLOWS | ||||||
Cash flows from operating activities | 6,241 | 6,476 | 5,560 | |||
Cash flows used in investing activities | (3,570 | ) | (6,401 | ) | (4,101 | ) |
Capital expenditures | (3,717 | ) | (3,571 | ) | (3,515 | ) |
Business acquisitions | (18 | ) | (2,850 | ) | (13 | ) |
Business dispositions | 720 | 1 | – | |||
Acquisition of spectrum licences | (566 | ) | – | – | ||
Increase in investments | (38 | ) | (3 | ) | (593 | ) |
Cash flows (used in) from financing activities | (2,440 | ) | 131 | (1,507 | ) | |
Repurchase of common shares | – | – | (107 | ) | ||
Issue of common shares | 49 | 13 | 39 | |||
Issue of preferred shares | – | – | 280 | |||
Net issuance of debt instruments | 784 | 2,215 | 486 | |||
Cash dividends paid on common shares | (1,893 | ) | (1,795 | ) | (1,683 | ) |
Privatization of Bell Aliant | (989 | ) | – | – | ||
Cash dividends paid on preferred shares | (134 | ) | (127 | ) | (133 | ) |
Cash dividends paid by subsidiaries to non-controlling interest | (145 | ) | (283 | ) | (340 | ) |
Free cash flow | 2,744 | 2,571 | 2,428 | |||
SHARE INFORMATION | ||||||
Average number of common shares (millions) | 793.7 | 775.8 | 774.3 | |||
Common shares outstanding at end of year (millions) | 840.3 | 775.9 | 775.4 | |||
Market capitalization | 44,771 | 35,691 | 33,055 | |||
Dividends declared per common share (dollars) | 2.47 | 2.33 | 2.22 | |||
Book value per share (dollars) | 13.02 | 14.97 | 13.52 | |||
Dividends declared on common shares | (1,960 | ) | (1,807 | ) | (1,720 | ) |
Dividends declared on preferred shares | (137 | ) | (131 | ) | (138 | ) |
Market price per common share (dollars) | ||||||
High (end of day) | 54.21 | 48.43 | 45.06 | |||
Low (end of day) | 45.27 | 41.57 | 39.37 | |||
Close | 53.28 | 46.00 | 42.63 | |||
Total shareholder return | 21.7 | % | 13.6 | % | 5.9 | % |
RATIOS | ||||||
Capital intensity (%) | 17.7 | % | 17.5 | % | 17.6 | % |
Price to earnings ratio (times) | 17.88 | 18.04 | 13.45 | |||
Price to book ratio (times) | 4.09 | 3.07 | 3.15 | |||
Price to cash flow ratio (times) | 16.75 | 12.30 | 16.15 | |||
OTHER DATA | ||||||
Number of employees (thousands) | 57 | 56 | 56 |
BCE Inc. 2014 ANNUAL REPORT 87 | |||
7 | SELECTED ANNUAL AND QUARTERLY INFORMATION | MD&A |
| 7.2 Quarterly financial information |
The following table shows selected BCE consolidated financial data by quarter for 2014 and 2013. This quarterly information is unaudited but has been prepared on the same basis as the annual consolidated financial statements. We discuss the factors that caused our results to vary over the past eight quarters throughout this MD&A.
| 2014 | 2013 | ||||||||||||||
| Q4 | Q3 | Q2 | Q1 | Q4 | Q3 | Q2 | Q1 | ||||||||
Operating revenues | 5,528 | 5,195 | 5,220 | 5,099 | 5,382 | 5,099 | 5,000 | 4,919 | ||||||||
Adjusted EBITDA | 2,022 | 2,115 | 2,144 | 2,022 | 1,998 | 2,063 | 2,066 | 1,962 | ||||||||
Severance, acquisition and other costs | (58 | ) | (66 | ) | (54 | ) | (38 | ) | (48 | ) | (297 | ) | (28 | ) | (33 | ) |
Depreciation | (734 | ) | (739 | ) | (708 | ) | (699 | ) | (695 | ) | (683 | ) | (681 | ) | (675 | ) |
Amortization | (118 | ) | (116 | ) | (171 | ) | (167 | ) | (160 | ) | (162 | ) | (161 | ) | (163 | ) |
Net earnings | 594 | 703 | 707 | 714 | 593 | 452 | 671 | 672 | ||||||||
Net earnings attributable to common shareholders | 542 | 600 | 606 | 615 | 495 | 343 | 571 | 566 | ||||||||
Net earnings per common share | ||||||||||||||||
Basic | 0.64 | 0.77 | 0.78 | 0.79 | 0.64 | 0.44 | 0.74 | 0.73 | ||||||||
Diluted | 0.63 | 0.77 | 0.78 | 0.79 | 0.63 | 0.44 | 0.74 | 0.73 | ||||||||
Included in net earnings: | ||||||||||||||||
Severance, acquisition and other costs | (42 | ) | (45 | ) | (38 | ) | (23 | ) | (33 | ) | (222 | ) | (21 | ) | (23 | ) |
Net (losses) gains on investments | (8 | ) | – | 4 | 12 | (12 | ) | 2 | 1 | 2 | ||||||
Early debt redemption costs | (18 | ) | (3 | ) | – | – | – | (21 | ) | (3 | ) | (12 | ) | |||
Adjusted net earnings | 610 | 648 | 640 | 626 | 540 | 584 | 594 | 599 | ||||||||
Adjusted EPS | 0.72 | 0.83 | 0.82 | 0.81 | 0.70 | 0.75 | 0.77 | 0.77 | ||||||||
Average number of common shares outstanding – basic (millions) | 837.7 | 782.1 | 777.7 | 776.5 | 775.9 | 775.9 | 775.9 | 775.7 | ||||||||
| Fourth quarter highlights |
OPERATING REVENUES | Q4 2014 | Q4 2013 | $ CHANGE | % CHANGE | ||||
Bell Wireless | 1,649 | 1,505 | 144 | 9.6 | % | |||
Bell Wireline | 2,628 | 2,601 | 27 | 1.0 | % | |||
Bell Media | 789 | 821 | (32 | ) | (3.9 | %) | ||
Inter-segment eliminations | (126 | ) | (114 | ) | (12 | ) | (10.5 | %) |
Bell | 4,940 | 4,813 | 127 | 2.6 | % | |||
Bell Aliant | 700 | 688 | 12 | 1.7 | % | |||
Inter-segment eliminations | (112 | ) | (119 | ) | 7 | 5.9 | % | |
Total BCE operating revenues | 5,528 | 5,382 | 146 | 2.7 | % | |||
| ||||||||
ADJUSTED EBITDA | Q4 2014 | Q4 2013 | $ CHANGE | % CHANGE | ||||
Bell Wireless | 585 | 529 | 56 | 10.6 | % | |||
Bell Wireline | 953 | 934 | 19 | 2.0 | % | |||
Bell Media | 192 | 230 | (38 | ) | (16.5 | %) | ||
Bell | 1,730 | 1,693 | 37 | 2.2 | % | |||
Bell Aliant | 292 | 305 | (13 | ) | (4.3 | %) | ||
Total BCE Adjusted EBITDA | 2,022 | 1,998 | 24 | 1.2 | % | |||
BCE operating revenues in Q4 2014 were 2.7% higher compared to Q4 2013, reflecting higher revenues at Bell and Bell Aliant.
BCE Adjusted EBITDA in Q4 2014 increased 1.2% year over year, due to growth at Bell partly offset by lower Adjusted EBITDA at Bell Aliant.
Bell operating revenues were 2.6% higher in Q4 2014 compared to Q4 2013, driven by a strong year-over-year increase at Bell Wireless and positive overall Bell Wireline growth. Bell Media revenues were down compared to Q4 2013.
Bell Adjusted EBITDA increased 2.2% in Q4 2014 compared to Q4 2013, reflecting increases of 10.6% at Bell Wireless and 2.0% at Bell Wireline. Overall growth in the quarter was moderated by a 16.5% decline at Bell Media. Bell’s consolidated Adjusted EBITDA margin remained essentially unchanged at 35.0% compared to 35.2% in Q4 2013.
88 BCE Inc. 2014 ANNUAL REPORT | |||
MD&A | SELECTED ANNUAL AND QUARTERLY INFORMATION | 7 |
Bell Wireless operating revenues were 9.6% higher in Q4 2014, reflecting an 8.1% service revenue growth driven by a higher mix of postpaid subscribers in 2014, along with blended ARPU growth of 5.5% fuelled by greater data usage and higher average rate plan pricing. Bell Wireless operating revenues also reflected higher product sales in Q4 2014 with growth of 24.6% compared to Q4 2013 as a result of a greater number of upgrades and postpaid gross activations. Bell Wireless Adjusted EBITDA grew 10.6% in Q4 2014, yielding a 0.9 percentage point expansion in service Adjusted EBITDA margin to 39.8%, even with higher year-over-year customer retention spending and subscriber acquisition costs.
Bell Wireline operating revenues grew 1%, representing the first quarter of positive growth since Q2 2010. This growth was led by positive total residential net subscriber activations driven by strong Internet and Fibe TV customer acquisitions in the quarter, a slower pace of voice revenue erosion due to fewer NAS losses, higher sales of international long distance minutes, price increases, and improved year-over-year Bell Business Markets revenue performance from increased sales of business service solutions and data equipment. Bell Wireline Adjusted EBITDA was up 2.0%, driving a 40 basis point margin improvement to 36.3%, with an increasing mix of growth services, improved Business Markets results and tight operating cost control.
Bell Media operating revenues in Q4 2014 were 3.9% lower compared to Q4 2013, reflecting the recognition of retroactive subscriber fee and retransmission royalty revenues in Q4 2013 that did not recur this year, and the loss of revenue from services that ceased operations in 2014 (regional hockey feeds and Viewers Choice). Advertising revenues in Q4 2014 increased slightly compared to Q4 2013, attributable to the programming strength at TSN and RDS, Bell Media’s specialty sports services and growth in specialty news channel audiences, which offset declines in conventional advertising. Bell Media Adjusted EBITDA declined 16.5% in Q4 2014, due to lower operating revenues combined with higher content costs for sports broadcast rights and the launch of CraveTV on-demand TV streaming services on December 11, 2014, offset in part by lower amortization of the fair value of certain programming rights.
Bell Aliant operating revenues in Q4 2014 were 1.7% higher compared to Q4 2013 as growth in data revenues, mainly from Internet and IPTV, more than offset continuing local and access and long distance revenue erosion.
Bell Aliant Adjusted EBITDA decreased 4.3%, year over year, reflecting higher TV content costs resulting from IPTV customer growth, and higher expenses to support a growing FibreOP subscriber base.
Bell capital expenditures totalled $932 million in Q4 2014, which was $60 million lower than Q4 2013, corresponding to a 1.7 percentage-point decline in capital intensity to 18.9%. The decrease in capital expenditures was primarily due to timing of capital spend compared to the same period last year.
BCE depreciation of $734 million increased $39 million year over year, due to a higher depreciable asset base in 2014 as we continued to invest in our broadband wireline and wireless networks, and a reduction in the estimates of useful lives of certain assets, as described in section 10.1,Our accounting policies – Critical accounting estimates and key judgements.
BCE amortization was $118 million in Q4 2014, down from $160 million in Q4 2013, due to an increase in the estimates of useful lives of certain assets from five to seven years, as described in section 10.1,Our accounting policies – Critical accounting estimates and key judgements.
BCE cash flow from operating activities was $1,527 million in Q4 2014 compared to $1,838 million Q4 2013, due to the $350 million voluntary contribution made to post-employment benefit plans in the fourth quarter of 2014.
BCE Free Cash Flow generated in Q4 2014 was $833 million, or 23.6% higher than in Q4 2013, driven by higher Adjusted EBITDA and lower planned capital expenditures. With the Privatization of Bell Aliant completed on October 31, 2014, BCE’s Free Cash Flow in Q4 2014 included two months of Free Cash Flow contribution from Bell Aliant.
BCE net earnings attributable to common shareholders of $542 million in Q4 2014, or $0.64 per share, were 9.5% higher than the $495 million, or $0.64 per share, reported in Q4 2013. Adjusted net earnings increased 13.0% to $610 million, and Adjusted EPS grew 2.9% in Q4 2014 to $0.72 from $0.70 last year, driven by higher Adjusted EBITDA from continued strong wireless profitability and positive overall wireline growth, mark-to-market gains realized on equity derivatives used as economic hedges of share-based compensation and U.S. dollar purchases, and lower NCI, resulting from the Privatization of Bell Aliant completed on October 31, 2014. This was partly offset by a net impairment charge, mainly in conventional TV, resulting from ongoing softness in the overall Canadian TV advertising market and higher content costs.
| Seasonality considerations |
Some of our segments’ revenues and expenses vary slightly by season, which may impact quarter-to-quarter operating results.
Bell Wireless operating results are influenced by the timing of our marketing and promotional expenditures and higher levels of subscriber additions and handset discounts, resulting in higher subscriber acquisition and activation-related expenses in certain quarters. In particular, Bell Wireless Adjusted EBITDA tends to be lower in the fourth quarter due to higher subscriber acquisition costs associated with a higher number of new subscriber activations during the holiday season. Additionally, the third quarter has become more significant in terms of wireless subscriber additions in recent years as a result of back-to-school offers, while subscriber additions have typically been lowest in the first quarter.
Bell Wireline revenues tend to be higher in the fourth quarter because of higher data and equipment product sales to business customers and higher consumer electronics equipment sales during the Q4 holiday period. Home Phone, TV and Internet subscriber activity is subject to modest seasonal fluctuations, attributable largely to residential moves during the summer months and the back-to-school period in the third quarter. Targeted marketing efforts conducted during various times of the year to coincide with special events or broad-based marketing campaigns also may have an impact on overall wireline operating results.
Bell Media revenues and related expenses from TV and radio broadcasting are largely derived from the sale of advertising, the demand for which is affected by prevailing economic conditions, as well as cyclical and seasonal variations. Seasonal variations are driven by the strength of TV ratings, particularly during the fall programming season, major sports league seasons and other special sporting events such as the Olympic Games, NHL playoffs and World Cup soccer, as well as fluctuations in consumer retail activity during the year.
BCE Inc. 2014 ANNUAL REPORT 89 | |||
8 | REGULATORY ENVIRONMENT | MD&A |
| 8 REGULATORY ENVIRONMENT |
8.1 Introduction
This section describes certain legislation that governs our businesses and provides highlights of recent regulatory initiatives and proceedings, government consultations and government positions that affect us and that influence our business and may continue to affect our flexibility to compete in the marketplace. Bell Canada and several of its direct and indirect subsidiaries, including Bell Mobility, Bell ExpressVu Limited Partnership, Bell Aliant Regional Communications Inc. (Bell Aliant Regional), Bell Aliant LP, NorthernTel, Limited Partnership (NorthernTel), Télébec, Limited Partnership (Télébec) and NorthwesTel, are governed by theTelecommunications Act, theBroadcasting Act, theRadiocommunication Actand/or theBell Canada Act. They are also subject to regulations and policies enforced by the CRTC. Our business is affected by decisions made by various regulatory agencies, including the CRTC, a quasi-judicial agency of the Government of Canada responsible for regulating Canada’s telecommunications and broadcasting industries. Other aspects of the businesses of these companies are regulated in various ways by federal government departments, in particular Industry Canada.
The CRTC regulates the prices we can charge for telecommunications services in areas where it determines there is not enough competition to protect the interests of consumers. The CRTC has determined that competition was sufficient to grant forbearance from retail price regulation under theTelecommunications Actfor the vast majority of our residential and business telephone services, as well as for our wireless and Internet services. Under theBroadcasting Act, our TV distribution business is not subject to retail price regulation.
Although most of our wireline and wireless services are forborne from price regulation under theTelecommunications Act, the Government of Canada and its relevant departments and agencies, including the CRTC, Industry Canada, Canadian Heritage and the Competition Bureau, continue to play a significant role in telecommunications and broadcasting policy and regulation, such as spectrum auctions, approval of acquisitions, foreign ownership and broadcasting, and this may adversely affect our competitive position. The federal government significantly increased its focus on consumer protection, especially in the wireless sector, and adopted more stringent regulations. This increased focus on consumer protection is evidenced by the adoption in 2013 of the Wireless Code by the CRTC, which, as discussed in more detail in section 8.2,Telecommunications Act – Adoption of a national wireless services consumer code, could decrease our flexibility in the marketplace. The federal government may take positions against the telecommunications and media industries in general, or specifically against Bell Canada or certain of its subsidiaries. Failure to positively influence changes in any of these areas, adverse decisions by regulatory agencies or increasing regulation, could have negative financial, operational, reputational or competitive consequences for our business.
| 8.2 Telecommunications Act |
TheTelecommunications Actgoverns telecommunications in Canada. It defines the broad objectives of Canada’s telecommunications policy and provides the Government of Canada with the power to give general direction to the CRTC on any of its policy objectives. It applies to several of the BCE group companies and partnerships, including Bell Canada, Bell Mobility, Bell Aliant LP, NorthernTel, Télébec and NorthwesTel.
Under theTelecommunications Act, all facilities-based telecommunications service providers in Canada, known as telecommunications common carriers (TCCs), must seek regulatory approval for all proposed tariffs for telecommunications services, unless the services are exempt from regulation or forborne from regulation. The CRTC may exempt an entire class of carriers from regulation under theTelecommunications Actif the exemption meets the objectives of Canada’s telecommunications policy. A few large TCCs, including the BCE group TCCs, must also meet certain Canadian ownership requirements. BCE monitors and periodically reports on the level of non-Canadian ownership of its common shares.
| Complaint regarding pricing of broadcasting content accessed via mobile devices |
On January 29, 2015, the CRTC issued a decision concerning a complaint against Bell Mobility about the pricing of our Bell Mobile TV service compared with what we charge to consumers to access programming content received via mobile devices over the Internet. The CRTC found that we are conferring an ‘undue preference’ on our Mobile TV service by not subjecting it to data charges. The CRTC ordered us to stop exempting our Mobile TV service from data charges by April 29, 2015.
On February 20, 2015, Bell Canada filed a motion seeking leave to appeal the CRTC’s Mobile TV decision in the Federal Court of Appeal. On February 23, 2015, Bell Canada filed a motion seeking a stay of the CRTC’s Mobile TV decision in the Federal Court of Appeal pending the court’s final decision on the appeal. We expect to receive the court’s ruling on the stay application by April 2015. A decision on whether the court will grant Bell Canada leave to hear its appeal of the Mobile TV decision is expected in late June 2015.
90 BCE Inc. 2014 ANNUAL REPORT | |||
MD&A | REGULATORY ENVIRONMENT | 8 |
| Proceedings regarding wholesale domestic wireless services |
On February 20, 2014, the CRTC launched Telecom Notice of Consultation 2014-76 (TNC 2014-76) to determine whether the wholesale mobile wireless services market is sufficiently competitive. Greater regulation of wholesale mobile wireless services (e.g. roaming, tower and site sharing) could limit Bell’s marketing flexibility, improve the business position of Bell’s competitors and negatively impact the financial performance of Bell’s mobile wireless business. A decision on this CRTC proceeding is expected in early 2015.
On March 28, 2014, the federal government introduced amendments to theTelecommunications Actrelating to wireless domestic roaming as part of theEconomic Action Plan 2014 Act, No. 1. The amendments establish interim caps on the wholesale roaming rates which carriers charge to each other for domestic voice, data and short message service (SMS) roaming. These caps are set at the average per unit retail price a carrier charged to its own retail end-customers for these services in the previous year. The amendments came into force with the enactment and royal assent of theEconomic Action Plan 2014 Act, No. 1on June 19, 2014. The legislation is designed to apply these three roaming caps at least until the CRTC issues a decision on whether (and, if so, how) to regulate wholesale wireless roaming in the TNC 2014-76 proceeding. The financial impact of the caps established by theEconomic Action Plan 2014 Act, No. 1, and any possible CRTC initiatives relating to the regulation of wholesale roaming rates, towers or other wholesale wireless services resulting from the TNC 2014-76 proceeding, is unclear at this time.
On July 31, 2014, the CRTC issued a decision in another proceeding related to wireless roaming wherein it prohibited the use of exclusivity provisions in wholesale roaming agreements. This decision is not expected to have a material impact on our operations.
| Wholesale wireline services framework review |
On October 15, 2013, the CRTC initiated a review of wholesale wireline telecommunications services and associated policies. This comprehensive review, which ended in December 2014, notably examined whether currently mandated wholesale wireline services should be forborne, whether currently forborne wholesale services should be reregulated and whether additional wholesale high-speed access services should be mandated, including for FTTP facilities. The CRTC has specifically excluded from this review any consideration of wholesale wireless services (which are being dealt with in a different proceeding as described above). Modifications to the regulatory regime applicable to our wholesale wireline telecommunications services could have significant impacts on our wholesale telecommunications business and potentially, by extension, on certain retail markets. A decision is expected in the spring of 2015.
| Adoption of a national wireless services consumer code |
On June 3, 2013, the CRTC issued Telecom Regulatory Policy CRTC 2013-271, which established the Wireless Code. The Wireless Code applies to all wireless services provided to individual and small business consumers (e.g. businesses that on average spend less than $2,500 per month on telecom services) in all provinces and territories.
The Wireless Code establishes regulations related to unlocking mobile phones, calculating early cancellation fees, and setting default caps for data roaming charges and data overage charges, among other measures. The Wireless Code also stipulates that wireless service providers may not charge an early cancellation fee after a customer has been under contract for 24 months and that handset subsidies must be recovered in two years or less. These requirements reduce the incentive for wireless service providers to offer contracts with longer terms.
Where an obligation in the Wireless Code relates to a specific contractual relationship between a wireless service provider and a customer, the Wireless Code applies if the contract was entered into, amended, renewed or extended on or after December 2, 2013. The Wireless Code will apply to and modify all contracts, no matter when they were entered into, on June 3, 2015. As a result, all three-year contracts entered into on or after June 4, 2012, and before December 1, 2013, will retroactively become subject to the Wireless Code on June 3, 2015, despite having been entered into before the Wireless Code came into effect. During 2015, to the extent that the CRTC’s June 3, 2015 Wireless Code application date is found to be valid, customers on three-year contracts that were established before the Wireless Code came into effect and customers on new two-year plans could potentially create unusual market activity as their contracts expire, driving higher expiries and higher transaction volumes. This could result in Adjusted EBITDA pressure and higher industry churn.
On July 3, 2013, Bell Mobility, together with Rogers, TELUS Corporation, SaskTel and MTS Mobility, filed an application with the Federal Court of Appeal seeking leave to appeal this retroactive application of the Wireless Code. The Federal Court of Appeal granted leave to appeal on September 24, 2013. The Federal Court of Appeal hearing took place on November 12, 2014 and the court reserved judgement. A decision is expected in May 2015. If the appeal is successful, consumer contracts entered into by December 1, 2013 would remain exempt from the Wireless Code’s application and would be permitted to run to their contracted three-year end dates.
| Canada’s telecommunications foreign ownership rules |
Under theTelecommunications Act, there are no foreign investment restrictions applicable to TCCs that have less than a 10% share of the total Canadian telecommunications market as measured by annual revenues. However, foreign investment in telecommunications companies can still be refused by the government under theInvestment Canada Act. The absence of foreign ownership restrictions on such small or new entrant TCCs could result in more foreign companies entering the Canadian market, including by acquiring spectrum licences or Canadian TCCs. Under theBroadcasting Act, foreign ownership restrictions continue to apply to broadcasters such as licensed cable and satellite TV service providers, and programming licensees such as Bell Media Inc.
BCE Inc. 2014 ANNUAL REPORT 91 | |||
8 | REGULATORY ENVIRONMENT | MD&A |
| 8.3 Broadcasting Act |
TheBroadcasting Actdefines the broad objectives of Canada’s broadcasting policy and assigns the regulation and supervision of the broadcasting system to the CRTC. Key policy objectives of theBroadcasting Actare to protect and strengthen the cultural, political, social and economic fabric of Canada and to encourage the development of Canadian expression.
Most broadcasting activities require a programming licence or broadcasting distribution licence from the CRTC. The CRTC may exempt broadcasting undertakings from complying with certain licensing and regulatory requirements if it is satisfied that non-compliance will not materially affect the implementation of Canadian broadcasting policy. A corporation must also meet certain Canadian ownership and control requirements to obtain a broadcasting or broadcasting distribution licence and corporations must have the CRTC’s approval before they can transfer effective control of a broadcasting licensee.
The TV distribution business of our Bell TV business unit (Bell TV) and Bell Media’s TV and radio broadcasting operations are subject to the requirements of theBroadcasting Act, the policies and decisions of the CRTC and their respective broadcasting licences. Any changes in theBroadcasting Act, amendments to regulations or the adoption of new ones, or amendments to licences, could negatively affect Bell TV’s or Bell Media’s competitive positions or the cost of providing services.
| CRTC proceedings on the future of Canada’s TV system |
In October 2013, the CRTC invited Canadian consumers to comment on the future of Canada’s TV system and followed this with a second consultation phase launched in February 2014. In conjunction with these public consultations, the federal government, pursuant to section 15 of theBroadcasting Act, issued an order-in-council mandating the CRTC to report on how the ability of Canadian consumers to subscribe to pay and specialty TV services on a service-by-service basis can be maximized in a manner that most appropriately furthers the implementation of the broadcasting policy for Canada.
On April 24, 2014, the CRTC launched a third phase (Phase 3) of its consultation, issuing Broadcasting Notice of Consultation CRTC 2014-190 (BNC 2014-190), and issued its report in response to the order-in-council. BNC 2014-190 invited comments on issues that were raised during the first two phases, including maximizing choice and flexibility through proposed new packaging models for TV channels; simultaneous substitution and possible alternatives; rules regarding genre exclusivity, mandatory carriage and the distribution of foreign-owned channels in Canada; support for Canadian and local programming; and possible rules or a code of conduct for BDU-subscriber relationships. The report in response to the order-in-council set out proposed new packaging models that were also considered during Phase 3.
The CRTC held a two-week hearing on these issues in September 2014, with wide-ranging implications for the TV system in Canada. The CRTC has begun releasing its decisions and is expected to continue to do so through the first half of 2015. On January 29, 2015, the CRTC released two decisions relating to simultaneous substitution and local TV. In them, the CRTC announced it would eliminate simultaneous substitution for the Super Bowl and for specialty services and would enact new penalties for broadcasters and require BDUs to pay consumer rebates for simultaneous substitution errors. The decisions also did not provide any additional support for local programming. Together, these decisions could have an adverse impact on Bell Media’s conventional TV businesses and financial results, the extent of which is unclear at this time. Other regulatory changes resulting from these processes could also have an adverse impact on Bell TV’s and Bell Media’s businesses and financial results, the extent of which is also unclear at this time.
On March 2, 2015, Bell Canada filed an application with the Federal Court of Appeal for leave to appeal the CRTC’s decision relating to simultaneous substitution in so far as it: (i) prohibits simultaneous substitution for the Super Bowl starting in 2017; (ii) prohibits simultaneous substitution for specialty channels; and (iii) purports to grant the CRTC authority to impose penalties on broadcasters and requires BDUs to pay rebates for errors in the performance of simultaneous substitution. Bell Canada is challenging the legal validity of these rules on the basis of the following arguments: (i) unlawful interference with Bell Canada’s vested economic rights as the exclusive Canadian rights holder of the Super Bowl; (ii) administrative law discrimination by eliminating the benefits of simultaneous substitution for Bell Canada’s Super Bowl broadcast while maintaining the benefits of simultaneous substitution for others; (iii) breach of procedural fairness in the CRTC’s failure to give notice that the prohibition of simultaneous substitution was a live issue in the TV Policy Review; (iv) the unreasonableness of the decision in light of the broadcasting policy for Canada as set out in theBroadcasting Actand in light of the CRTC’s acknowledgement of the benefits of simultaneous substitution; and (v) that the CRTC has no authority to enact regulations empowering it to penalize broadcasters or impose rebates on BDUs for errors in carrying out simultaneous substitution.
| 8.4 Radiocommunication Act |
Industry Canada regulates the use of radio spectrum under the Radiocommunication Act. Under theRadiocommunication Act, Industry Canada ensures that radiocommunication in Canada is developed and operated efficiently. Under theRadiocommunication Regulations, companies that are eligible for radio licences, such as Bell Canada and Bell Mobility, must meet the same ownership requirements that apply to companies under theTelecommunications Act.
Companies must have a spectrum licence to operate a wireless system in Canada. While we anticipate that the licences under which we provide wireless services will be renewed upon expiry, there is no assurance that this will happen, or of the terms under which renewal will be granted. Industry Canada can revoke a company’s licence at any time if the licensee does not comply with the licence’s conditions. While we believe that we comply with the conditions of our licences, there is no assurance that Industry Canada will agree. Should there be a disagreement, this could have a negative effect on our business and financial performance.
92 BCE Inc. 2014 ANNUAL REPORT | |||
MD&A | REGULATORY ENVIRONMENT | 8 |
| AWS-3 spectrum auction |
On December 18, 2014, Industry Canada released its decision for the advanced wireless services-3 (AWS-3) licensing framework relating to the auction of 50 MHz of spectrum in the AWS-3 band. Three paired blocks are to be made available for licensing on a Tier 2 (essentially a provincial/regional) basis. Of the 50 MHz of available spectrum, one 30 MHz block is reserved as a new entrant set aside. Qualified new entrants would be those who have deployed their 2008 AWS auction spectrum and who are actually serving customers. The remaining 20 MHz of spectrum is to be auctioned in two blocks and available to any bidder, including large national or provincially-based incumbents. The spectrum will be awarded using the sealed bid auction format and applying the second price rule. The latter rule means the party that bids the most wins the spectrum, but the winning party pays the second-highest amount bid for that spectrum. Our ability to acquire our preferred spectrum blocks in this auction may be affected by the auction strategies of other participants. Industry Canada proposes that the auctioned licences would have a 20 year-term and be subject to deployment requirements at five and ten years following licence issuance. The sealed bid auction held by Industry Canada closed on March 3, 2015. Industry Canada indicated that the announcement and publication of provisional licence winners would occur within four days of the close of the auction.
| 600 MHz spectrum consultation |
On December 18, 2014, Industry Canada announced a consultation relating to repurposing 600 MHz spectrum for mobile use. This spectrum is currently used primarily by over-the-air (OTA) TV broadcasters for local TV transmissions. It is not yet clear how much of the 600 MHz spectrum currently used for OTA broadcasting will be repurposed. Among the issues on which Industry Canada is seeking comments are: (i) should Canada repurpose Canadian 600 MHz spectrum in a joint process along with the US, or do so separately; (ii) should we adopt the US 600 MHz band plan and repurpose the same amount of spectrum as the US; and (iii) a variety of technical issues. On January 15, 2015, Industry Canada announced it had extended the deadline for comments by one month and comments were filed on February 26, 2015. Reply comments are due two weeks after Industry Canada posts these comments on its website. The consultation document indicates that if Industry Canada determines to repurpose the 600 MHz band jointly with the US, then there will be a further consultation on the policy, technical and licensing framework-related issues at a later date.
| Licensing framework for broadband radio services (BRS) – 2500 MHz |
On January 10, 2014, Industry Canada announced its framework for the licensing of 2500 MHz spectrum, which sets out the rules and procedures for participation in the 2500 MHz auction scheduled to begin on April 14, 2015. The framework includes details related to the auction format and rules, the application process and timelines, and the conditions of licence that will apply to licences issued following the auction process, as well as to existing BRS spectrum licences. The auctioned licences will be issued for 20-year terms, with a 10-year build-out requirement. In aggregate, 61 service areas and 318 individual licences across the country will be auctioned. A spectrum aggregation limit of 40 MHz will apply in each individual service area, except for the Northwest Territories, Yukon and Nunavut, where no such limit will apply. A five-year moratorium will further apply to the transfer of 2500 MHz spectrum to an entity that exceeds or would exceed the aggregation limit.
To the extent that Bell Mobility, or any other qualified bidder, wishes to acquire 2500 MHz spectrum in areas where it currently is at or over the aggregation limit, it would need to return sufficient spectrum to Industry Canada or apply to transfer it to a third party such that it is below the aggregation limit before the start of the auction. Our ability to acquire our preferred spectrum blocks in this auction may be affected by the auction strategies of other participants and the extent to which foreign entities participate in the auction. The 2500 MHz spectrum will be auctioned under a combinatorial clock auction format, using multiple rounds in much the same manner as the 2014 auction of 700 MHz spectrum. Like the AWS-3 spectrum auction, it will use the second price rule.
| Spectrum licence transfers |
On June 28, 2013, Industry Canada released a decision revising its policy regarding spectrum licence transfers. This decision significantly increases the number of criteria, many of which are highly subjective, that Industry Canada may consider when determining whether to approve or deny such transfers. One of Industry Canada’s main considerations in reviewing prospective licence transfers, divisions and subordination requests is the impact the proposed transfer would have on the concentration of spectrum in a region. This framework may make it more difficult for incumbent wireless providers, such as Bell Mobility, to acquire additional spectrum via transfers and acquisitions than it would be for new entrant providers to acquire such spectrum. In addition to subjecting all licence transfers and licence subordination arrangements to these new rules, the decision also requires that prospective and option arrangements (i.e. those designed to transfer spectrum at a future date) would also have to be submitted for review within 15 days of entering into such a business arrangement. Such arrangements would have to be withdrawn within 90 days if Industry Canada denies the proposed transfer. Industry Canada had previously noted that the new licence transfer framework is one of several initiatives the government is taking to promote at least four wireless competitors in each region of the country.
BCE Inc. 2014 ANNUAL REPORT 93 | |||
8 | REGULATORY ENVIRONMENT | MD&A |
| 8.5 Bell Canada Act |
Under theBell Canada Act, the CRTC must approve any sale or other disposal of Bell Canada voting shares that are held by BCE, unless the sale or disposal would result in BCE retaining at least 80% of all of the issued and outstanding voting shares of Bell Canada. Except in the ordinary course of business, the sale or other disposal of facilities integral to Bell Canada’s telecommunications activities must also receive CRTC approval.
| 8.6 Other key legislation |
Paper bills and administrative monetary penalties
On October 23, 2014, the federal government introduced Bill C-43 entitledEconomic Action Plan 2014 Act, No. 2. TheEconomic Action Plan 2014 Act, No. 2prohibits telecommunications service providers and broadcasting undertakings from charging subscribers for providing them with paper bills.
On December 16, 2014, theEconomic Action Plan 2014 Act, No. 2received royal assent and amended theTelecommunications Actby giving the CRTC the power to impose administrative monetary penalties (AMPs) for violations of most provisions of the Act, including charging for a paper bill. The pre-existing AMPs regime relating to unsolicited telecommunications remains in force. For corporations, the maximum fine under the new AMPs provisions would be $10 million for a first offence and $15 million for a subsequent offence. The Economic Action Plan 2014 Act, No. 2also amended theBroadcasting Actto make charging for a paper bill a criminal offence. If convicted, corporations would face a maximum fine of $250,000 for a first offence and $500,000 for a subsequent offence.
TheEconomic Action Plan 2014 Act, No. 2also introduced new AMPs provisions under theRadiocommunication Act, to be administered by the Minister of Industry. These AMPs generally relate to the sale, import, operation and distribution of unauthorized radio equipment and to non-compliance with spectrum auction rules. The maximum fines are identical to those described above under the Telecommunications Act.
| Personal Information Protection and Electronic Documents Act |
Bill S-4, theDigital Privacy Act(AnActto amend thePersonal Information Protection and Electronic Documents Act (PIPEDA)and to make a consequential amendment to another Act) is under review by a committee of the House of Commons. This bill could implement mandatory data breach notification requirements and fines of up to $100,000 per occurrence for organizations that fail to comply.
Under PIPEDA, the Office of the Privacy Commissioner (OPC) is investigating Bell’s Relevant Advertisements Initiative (the Initiative) to determine if it complies with PIPEDA. The Initiative uses non-sensitive and aggregated information about mobile browsing activities and account information of participating Bell Mobility subscribers to provide more relevant advertisements during mobile browsing. A negative finding could significantly impact Bell’s online advertising activities in the short and medium term. A final report is expected from the OPC in the first quarter of 2015. The Initiative is also the subject of an application before the CRTC and an inquiry by the Québec privacy commissioner. Both application and inquiry are reviewing the potential impact of the Initiative on privacy.
| Canada’s anti-spam legislation |
Federal legislation referred to asCanada’s anti-spam legislation(CASL) came into force on July 1, 2014. Pursuant to CASL, commercial electronic messages (CEMs) can be sent only if the recipient has provided prior consent and the message complies with certain formalities, including the ability to unsubscribe easily from subsequent messages. As of January 15, 2015, CASL also requires that an organization have prior informed consent before downloading software to an end-user’s computer. Penalties for non-compliance include administrative monetary penalties of up to $10 million and a private right of action is scheduled to come into force on July 1, 2017. CASL limits the ability of the various BCE group companies to market to prospective customers, and imposes additional costs and processes with respect to communicating with existing and prospective customers.
94 BCE Inc. 2014 ANNUAL REPORT | |||
MD&A | BUSINESS RISKS | 9 |
| 9 BUSINESS RISKS |
A risk is the possibility that an event might happen in the future that could have a negative effect on our financial position, financial performance, cash flows, business or reputation. The actual effect of any event could be materially different from what we currently anticipate. The risks described in this MD&A are not the only ones that could affect us. Additional risks and uncertainties not currently known to us or that we currently deem to be immaterial may also materially and adversely affect our financial position, financial performance, cash flows, business or reputation.
This section describes the principal business risks that could have a material adverse effect on our financial position, financial performance, cash flows, business or reputation, and cause actual results or events to differ materially from our expectations expressed in or implied by our forward-looking statements. As indicated in the table below, certain of such principal business risks have already been discussed in other sections of this MD&A and we refer the reader to those sections for a discussion of such risks. All of the risk discussions set out in the sections referred to in the table below are incorporated by reference in this section 9.
| RISKS DISCUSSED IN OTHER |
|
| SECTIONS OF THIS MD&A | SECTION REFERENCES |
| Regulatory Environment | Section 3.3,Principal business risks |
| Competitive Environment | Section 3.3,Principal business risks |
| Economic and Financial Market Conditions | Section 3.3,Principal business risks |
| Information Security (Cyber and Other Threats) | Section 3.3,Principal business risks |
| Complexity and Service and Operational Effectiveness | Section 3.3,Principal business risks |
| Risks Specifically Relating to our Bell Wireless, Bell Wireline and Bell Media Segments | Section 5,Business segment analysis (Principal business riskssection for each segment) |
The other principal business risks that also could have a material adverse effect on our financial position, financial performance, cash flows, business or reputation are discussed below.
| Strategic network evolution |
The failure to carry out our network evolution activities successfully could have an adverse effect on our business and financial performance.
Ongoing technological advances, in conjunction with changing market demand and competition, continue to put significant pressure on bandwidth and speed. Bell Fibe and Bell Aliant’s FibreOP Internet and TV services are competitive differentiators but they require rapid fibre deployment involving significant capital and time investment. In addition, in order to maintain a competitive mobile network, our wireless network further requires strategic capital investment based on an understanding of market demographics, technology evolution and spectrum needs.
At the same time, a significant number of our existing wireline voice, data and wireless networks have been in operation for many years and continue to be used to deliver our services. Legacy circuit-based infrastructures are difficult and expensive to operate and maintain and very significant resources and efforts are required to perform life-cycle management and upgrades to maintain operational status of these legacy networks. As time passes, maintenance spares for certain critical network elements may cease to exist due to manufacturers’ discontinuation of support and the unavailability of compatible spares from third parties. We continue to migrate voice and data traffic from our legacy circuit-based infrastructures to newer and more efficient IP- and packet-based infrastructures. As part of this transformation, we are also planning to discontinue certain services that depend on circuit-based infrastructure and for which there is now very low customer demand in order to improve capital and operating efficiencies. In some cases, this discontinuation could be delayed or prevented by customer complaints or regulatory actions. If we cannot discontinue these services and have to maintain the operational status of the affected legacy infrastructures longer than planned, we may not be able to achieve the expected efficiencies and related savings, which may have an adverse effect on our financial performance.
Strategic evolution of our networks is a critical element in a competitive environment and all the network deployment, upgrading, maintenance and migration activities compete for capital, development and engineering resources. Our network evolution activities seek to enable, for instance, the support of new IP-based competitive offerings while maintaining network availability and performance on all deployed networks and delivery of service offerings. They also seek to enable the upgrade and deployment of networks on a timely basis, and within our capital intensity target, to expand our footprint in desired areas and to support growing data demand. Our inability to carry out any of our network evolution activities successfully could have an adverse effect on our business and financial results.
BCE Inc. 2014 ANNUAL REPORT 95 | |||
9 | BUSINESS RISKS | MD&A |
| Technological change |
We need to anticipate technological change and invest in or develop new technologies, products and services that will gain market acceptance.
We operate in markets that are affected by constant technological change, evolving industry standards, changing customer needs, frequent introductions of new products and services, and short product life cycles. Rapidly evolving technology brings new competitive threats, as well as new service opportunities, on an almost continuous basis. Globalization of competition is changing customer expectations for faster market responses and enhanced user experiences. Investment in our networks and in new technologies, products and services, as well as our ability to launch, on a timely basis, technologies, products and services that will gain market acceptance, are critical to increasing the number of our subscribers and achieving our financial objectives. However, as discussed in more detail in section 3.3,Principal business risks – Complexity and service and operational effectiveness, the complexity of a multi-product environment combined with the complexity of our network and IT structures may challenge our ability to achieve nimble service evolution. Failure to understand new technologies, to evolve in the appropriate direction in an environment of changing business models, or to optimize network deployment timelines considering customer demand and competitor activities, could have an adverse impact on our business and financial results.
We may face additional risks as we develop new products, services and technologies, and update our networks to stay competitive. New technologies, for example, may quickly become obsolete or may require more capital than initially expected. Development could be delayed for reasons beyond our control, and substantial investments usually need to be made before new technologies prove to be commercially viable. There is also a risk that current regulations could be expanded to apply to new technologies, which could delay our launch of new services. New products or services that use new or evolving technologies could reduce demand for our existing offerings or cause prices for those services to decline, and could result in shorter estimated useful lives for existing technologies, which could increase depreciation and amortization expense.
We have incurred significant capital expenditures in order to deploy next-generation fibre and wireless networks and offer faster Internet speeds. If we fail to make continued investments in our Internet and wireless networks that enable us to offer Internet and wireless services at increasingly faster speeds, and to offer a different range of products and services than our competitors, this could adversely affect our ability to compete, the pricing of our products and services, and our financial results. In particular, the introduction of mandated wholesale services over FTTH or of a more burdensome wholesale regime on FTTN or wireless networks by the CRTC may undermine our incentives to invest in next-generation wireline and wireless networks.
Our TV and media viewing models are being challenged by an increasing number of alternative viewing options available in the market and changing customer behaviour. Such changes may accelerate the disconnection of TV services, diminish our ability to acquire new customers or accelerate the reduction of TV spending, all of which could have an adverse effect on our business and financial performance. For more details, refer to section 5.3, Bell Media – Competitive landscape and industry trends.
| Information technology |
The failure to implement or maintain effective IT systems on a timely basis, and the complexity and costs of our IT environment, could have an adverse effect on our business and financial performance.
We currently use a very large number of interconnected operational and business support systems that are relevant to most aspects of our operations, including provisioning, networking, distribution, broadcast management, billing and accounting. We also have various IT system and process change initiatives that are in progress or are proposed for implementation. The development and launch of a new service typically requires significant systems development and integration. The associated developmental and ongoing operational costs are a significant factor in maintaining a competitive position and profit margins. As next-generation services are introduced, they should be designed to work with both legacy and next-generation support systems, which introduces uncertainty with respect to the cost and effectiveness of solutions and the evolution of systems.
There can be no assurance that any of our proposed IT systems or process change initiatives will be implemented successfully, that they will be implemented in accordance with anticipated timelines, or that sufficiently skilled personnel will be available to complete such initiatives. If we fail to implement and maintain effective IT systems on a timely basis, fail to create and maintain an effective governance and operating framework to support the management of a largely outsourced staff, or fail to understand and streamline our significant number of legacy systems and proactively meet constantly evolving business requirements, this could have an adverse effect on our business and financial performance.
| Network capacity pressures |
If we fail to maintain optimal network operating performance in the context of increasing customer demand, this could have an adverse effect on our reputation, business and financial performance.
Network capacity demands for TV and other bandwidth-intensive applications on our Internet and wireless networks have been growing at unprecedented rates. It is expected that growth in such demands will continue to accelerate, especially in the case of wireless data-driven traffic, due to the increasing adoption of smartphones and other mobile devices such as tablets, which consume large amounts of data. New innovative applications and services are constantly made available over the Internet. Our customers may choose to accelerate their adoption of these new services or rapidly change their behaviour and preference in the way they communicate, or access entertainment and information over the Internet. These constantly changing factors and the associated traffic growth could drive unexpected capacity pressures on our Internet and wireless networks and may result in network performance issues. Consequently, we may need to incur significant capital expenditures beyond those expenditures already anticipated by our subscriber and traffic planning forecasts in order to provide additional capacity
96 BCE Inc. 2014 ANNUAL REPORT | |||
MD&A | BUSINESS RISKS | 9 |
and to reduce network congestion on our Internet and wireless networks. In addition, network construction and deployment on municipal or private property requires the issuance of municipal or landlord consents, respectively, for the installation of network equipment. There is no assurance that such consents will be issued or that they will be issued in time to meet our expected deployment schedules, which could result in our inability to upgrade and/or deploy our networks in certain areas or in significant delays in our pace of upgrade and/or deployment.
Failure to complete the planned and unplanned upgrades or expansion in capacities of our Internet and wireless networks within predetermined schedules due to factors beyond our control could result in short-term congestions or disruptions of our networks beyond our normal network performance level until the upgrades are completed and normal network performance level is restored. These short-term sub-optimal network performance periods could affect our ability to keep existing or attract new customers and could have an adverse effect on our reputation, business and financial performance.
| Human resources |
Our business depends on the performance of, and our ability to retain, our employees.
Our business depends on the efforts, engagement and expertise of our employees. Competition for highly skilled management and customer service employees is intense in our industry. In addition, the increasing technical and operational complexity of our businesses creates a challenging environment for hiring, retaining and developing skilled technical resources. Failure to appropriately train, motivate, remunerate or deploy employees on initiatives that further our strategic imperatives, or to efficiently replace retiring employees, could have an adverse impact on our ability to attract and retain talent and drive performance across the organization. Deterioration in employee morale and engagement resulting from staff reductions, reorganizations or ongoing cost reductions could also adversely affect our business and financial results.
Our senior executives and other key employees are important to our success because they have been instrumental in setting our strategic direction, operating our business, identifying, recruiting and training key personnel, and identifying business opportunities. The loss of one or more of these key individuals could impair our business until qualified replacements are found. There can be no assurance that these individuals could be replaced quickly with persons of equal experience and capabilities.
Renegotiating collective bargaining agreements could result in higher labour costs and work disruptions.
Approximately 43% of our employees are represented by unions and are covered by collective bargaining agreements. Renegotiating collective bargaining agreements could result in higher labour costs, project delays and work disruptions, including work stoppages or work slowdowns. There can be no assurance that should a strike or work disruption occur, it would not adversely affect service to our customers and, in turn, our customer relationships and financial performance. In addition, work disruptions, including work slowdowns or work stoppages due to strikes, experienced by our third-party suppliers and other telecommunications carriers to whose networks ours are connected, could harm our business, including our customer relationships and financial performance.
| Post-employment benefit obligations |
The economic environment, pension rules and ineffective governance could have an adverse effect on our pension obligations, liquidity and financial performance.
With a large pension plan membership, significant DB plans that are subject to the pressures of the global economic environment, coupled with changing regulatory and reporting requirements, our pension obligations are exposed to potential volatility. Failure to understand economic exposure, pension rule changes or ensure that effective governance is in place for management and funding of the pension assets and obligations, could have an adverse impact on our liquidity and financial performance.
We may be required to increase contributions to our post-employment benefit plans in the future.
The funding requirements of our post-employment benefit plans, based on valuations of plan assets and obligations, depend on a number of factors, including actual returns on post-employment benefit plan assets, long-term interest rates, plan demographics, and applicable regulations and actuarial standards. Changes in these factors could cause future contributions to significantly differ from our current estimates and could require us to increase contributions to our post-employment benefit plans in the future and, therefore, could have a negative effect on our liquidity and financial performance.
There is no assurance that the assets of our post-employment benefit plans will earn their assumed rate of return. A substantial portion of our post-employment benefit plans’ assets is invested in public equity and debt securities. As a result, the ability of our post-employment benefit plans’ assets to earn the rate of return that we have assumed significantly depends on the performance of capital markets. Market conditions also impact the discount rate used to calculate our solvency obligations and, therefore, could also significantly affect our cash funding requirements.
Our expected funding for 2015 is in accordance with the latest post-employment benefit plan valuations as of December 31, 2013, filed in June 2014, and takes into account voluntary contributions of $350 million in 2014.
BCE Inc. 2014 ANNUAL REPORT 97 | |||
9 | BUSINESS RISKS | MD&A |
| Performance of critical infrastructure |
Our operations and business continuity depend on how well we protect, test, maintain and replace our networks, equipment and other facilities.
It is imperative that our critical infrastructure and facilities provide a consistent, secure and reliable environment to operate network and IT infrastructure and house employees. Accordingly, our operations depend on how well we protect our networks, as well as other infrastructure and facilities, against damage from fire, natural disaster (including seismic and severe weather-related events such as ice, snow and wind storms, flooding, hurricanes, tornadoes and tsunamis), power loss, building cooling loss, unauthorized access or entry, cyber threats, disabling devices, acts of war or terrorism, sabotage, vandalism, actions of neighbours and other events. Establishing response strategies and business continuity protocols to maintain service consistency if any disruptive event materializes is critical to the achievement of effective customer service. Any of the above-mentioned events, as well as the failure to complete the planned testing, maintenance or replacement of our networks, equipment and other facilities due to factors beyond our control, could disrupt our operations (including through disruptions such as network failures, billing errors or delays in customer service), require significant resources and result in significant remediation costs, which in turn could have an adverse effect on our business and financial performance or impair our ability to keep existing subscribers, or attract new ones.
Satellites used by Bell TV are subject to significant operational risks that could have an adverse effect on Bell TV’s business and financial performance.
Pursuant to a set of commercial arrangements between Bell TV and Telesat Canada (Telesat), Bell TV currently has two satellites under contract with Telesat. Telesat operates or directs the operation of these satellites. Satellites utilize highly complex technology and operate in the harsh environment of space and are therefore subject to significant operational risks while in orbit. These risks include in-orbit equipment failures, malfunctions and other problems commonly referred to as anomalies that could reduce the commercial usefulness of a satellite used by Bell TV. Acts of war or terrorism, magnetic, electrostatic or solar storms, and space debris or meteoroids could also damage the satellites used by Bell TV. Any loss, failure, manufacturing defect, damage or destruction of these satellites, of Bell TV’s terrestrial broadcasting infrastructure or of Telesat’s tracking, telemetry and control facilities to operate the satellites, could have an adverse effect on Bell TV’s business and financial performance and could result in customers terminating their subscriptions to Bell TV’s DTH satellite TV service.
| Vendor, supply chain and contract management |
We depend on key third-party suppliers to provide products and services that we need to operate our business.
We depend on key third-party suppliers over which we have no operational or financial control for certain products and services that are critical to our operations. These critical products and services may be available from only a limited number of suppliers, some of which dominate their global market. The increased number of global competitors in our various businesses could have an adverse effect on our relationship with such key suppliers, including our ability to purchase critical products and services at an affordable cost from them. Access to such key products and services, allowing us to meet customer demand, is critical to our ability to retain existing customers and acquire new ones.
If, at any time, suppliers cannot provide us with products or services that are critical to our customer offerings on a timely basis and at an acceptable cost including, without limitation, billing, IT support and customer contact centre services, as well as telecommunications equipment, software and maintenance services that comply with evolving telecommunications standards and are compatible with our equipment, IT systems and software, our business and financial performance could be adversely affected. In addition, if telecommunications equipment and other products, such as handsets, that we sell or otherwise provide to customers, or the telecommunications equipment and other products that we use to provide services, have manufacturing defects, our ability to offer our products and services and to roll out our advanced services, along with the quality of such services and networks, may be negatively impacted. In addition, network deployment and expansion could be impeded, and our business, strategy and financial performance could be adversely affected.
Various factors may affect our suppliers’ ability to provide us with critical products and services.
The businesses and operations of our suppliers, and their ability to continue to provide us with products and services, could be adversely affected by various factors including, without limitation, general economic and financial market conditions, the intensity of competitive activity, natural disasters (including seismic and severe weather-related events such as ice, snow and wind storms, flooding, hurricanes, tornadoes and tsunamis), commodity or component shortages (whether local or regional), labour disruptions, litigation, the availability of and access to capital, bankruptcy or other insolvency proceedings, changes in technological standards and other events, including those referred to inPerformance of critical infrastructurein this section 9.
Some of our suppliers may rely substantially or entirely on the Internet to deliver their products and services, or to conduct electronic transactions. Temporary disruption of their Internet access due to technical or operational difficulties or other events or threats including, but not limited to, those referred to in section 3.3,Principal business risks – Information security (cyber and other threats), may affect their delivery of critical products and services to us.
Our networks are connected with the networks of other telecommunications carriers and suppliers, and we rely on them to deliver some of our services. Temporary or permanent operational failures or service interruptions by these carriers and suppliers due to technical difficulties or other events including, but not limited to, those referred to in the paragraph above, could have an adverse effect on our networks, services, business and financial performance.
98 BCE Inc. 2014 ANNUAL REPORT | |||
MD&A | BUSINESS RISKS | 9 |
| Litigation and other legal matters |
Legal proceedings and, in particular, class actions, could have an adverse effect on our business and financial performance.
We become involved in various legal proceedings as part of our business. Plaintiffs within Canada are able to launch and obtain certification of class actions on behalf of a large group of people with increasing ease. Pending or future litigation, including an increase in certified class actions which, by their nature, could result in sizeable damage awards and costs relating to litigation, could have an adverse effect on our business and financial performance. For a description of the principal legal proceedings involving us, please see the section entitledLegal Proceedingscontained in the BCE 2014 AIF.
Changes in applicable laws could have an adverse effect on our business and financial performance.
Changes in laws or regulations or in how they are interpreted, and the adoption of new laws or regulations, could negatively affect us. In particular, the adoption by the federal and provincial governments, or agencies thereof, of increasingly stringent consumer protection laws, and the regulations, rules or policies thereunder, could have an adverse effect on our business and financial results.
In addition, Canadian securities laws in various provinces contain provisions setting out statutory civil liability for misrepresentations in continuous disclosure. These provisions facilitate the introduction in Canada of class action lawsuits by secondary market investors against public companies for alleged misrepresentations in public disclosure documents and oral statements. Significant damages could be awarded by courts in these types of actions should they be successful. Such awards of damages and costs relating to litigation could adversely affect our financial performance.
| Financial and capital management |
If we are unable to raise the capital we need and generate sufficient cash flows from operations, we may need to limit our capital expenditures or our investments in new businesses, or try to raise capital by disposing of assets.
Our ability to meet our cash requirements and provide for planned growth depends on having access to adequate sources of capital and on our ability to generate cash flows from operations, which is subject to regulatory, competitive, economic, financial, technological and other risk factors described in this MD&A, most of which are not within our control.
Our ability to raise financing depends on our ability to access the public equity and debt capital markets, as well as the bank credit market. Our ability to access such markets and the cost and amount of funding available depend largely on prevailing market conditions and the outlook for our business and credit ratings at the time capital is raised. Risk factors such as capital market disruptions, sovereign credit concerns in Europe, fiscal and public indebtedness issues in the U.S., central bank monetary policies, increased bank capitalization regulations, reduced bank lending in general or fewer banks as a result of reduced activity or consolidation, could reduce capital available or increase the cost of such capital. In addition, an increased level of debt borrowings could result in lower credit ratings, increased borrowing costs and a reduction in the amount of funding available to us, including through equity offerings. Business acquisitions could also adversely affect our outlook and credit ratings and have similar adverse consequences. In addition, participants in the public capital and bank credit markets have internal policies limiting their ability to invest in, or extend credit to, any single entity or entity group or to a particular industry.
Our bank credit facilities, including credit facilities supporting our commercial paper program, are provided by various financial institutions. While it is our intention to renew certain of such credit facilities from time to time, there are no assurances that these facilities will be renewed on favourable terms or in similar amounts.
If we cannot access the capital we need or generate cash flows to implement our business plan or meet our financial obligations on acceptable terms, we may have to limit our ongoing capital expenditures, limit our investment in new businesses, or try to raise additional capital by selling or otherwise disposing of assets. Any of these could have an adverse effect on our cash flows from operations and on our growth prospects.
The expected return of BCE’s Net Debt leverage ratio within its Net Debt leverage ratio target range is subject to certain risks.
The expected return of BCE’s Net Debt leverage ratio within its Net Debt leverage ratio target range is subject to certain assumptions including, in particular, growth in BCE’s Free Cash Flow as well as the application of a portion of excess cash to the reduction of BCE’s indebtedness. Free Cash Flow growth is, in turn, subject to the risk factors and assumptions disclosed in this MD&A. In addition, other acquisitions made by BCE in the future could have an adverse effect on BCE’s Net Debt leverage ratio.
We are exposed to various credit, liquidity and market risks.
Our exposure to credit, liquidity and market risks, including equity price, interest rate and currency fluctuations, is discussed in section 6.6,Financial risk managementin this MD&A, and in Note 24 to BCE’s 2014 consolidated financial statements.
Our failure to identify and manage our exposure to changes in interest rates, foreign exchange rates, BCE’s share price and other market conditions could lead to missed opportunities, cash flow shortages, reputational damage, stock and debenture devaluations and challenges in raising capital on market competitive terms.
BCE Inc. 2014 ANNUAL REPORT 99 | |||
9 | BUSINESS RISKS | MD&A |
| Change management and integration |
Ineffective change management and the failure to successfully integrate assets could adversely affect our business and our ability to achieve our strategic imperatives.
Corporate restructurings, system replacements and upgrades, process redesigns and the integration of business acquisitions and existing business units must be managed carefully to ensure that we capture the intended benefits of such changes. There can be no assurance that planned efficiency initiatives will be completed or that such initiatives, once implemented, will provide the expected benefits. Ineffective change management may adversely affect our operations, financial performance, employee engagement or customer service.
Achieving the anticipated benefits from the integration of business acquisitions and existing business units depends in part on successfully integrating operations, procedures and personnel in a timely and efficient manner, as well as on our ability to realize the anticipated growth opportunities and synergies from combining the businesses and operations. Integration requires the dedication of substantial management effort, time and resources, which may divert management’s focus from other strategic opportunities and operational matters during this process. The integration of the activities of our Bell Aliant segment within Bell following the Privatization of Bell Aliant and other integration processes may lead to greater-than-expected operational challenges and costs, expenses, customer loss and business disruption for us and, consequently, the failure to realize, in whole or in part, the anticipated benefits.
| Fraud |
The failure to evolve practices to effectively monitor and control fraudulent activities could result in financial loss and brand degradation.
Economic volatility, the complexity of modern networks and the increasing sophistication of criminal organizations create challenges in monitoring, preventing and detecting fraudulent activities. Fraud affecting BCE group companies has evolved beyond the traditional subscription fraud and now includes service, technical, payment and occupational fraud. The failure to evolve practices to effectively monitor and control fraudulent activities could result in financial loss and brand degradation.
Copyright theft and other unauthorized use of our content could have an adverse effect on Bell Media’s business and financial performance.
Bell Media’s monetization of its intellectual property relies partly on the exclusivity of the content in its offerings and platforms. Copyright theft and other forms of unauthorized use undermine such exclusivity and could potentially divert users to unlicensed or otherwise illegitimate platforms, thus impacting our ability to derive distribution and advertising revenues. Although piracy is not a new risk to content, new technologies (including tools that undermine technology protection measures) coupled with the failure to enact adequate copyright protection and enforcement measures to keep up with those technologies, present the possibility of increased erosion of content exclusivity.
The theft of our DTH satellite TV services has an adverse effect on Bell TV’s business and financial performance.
Bell TV faces a loss of revenue resulting from the theft of its DTH satellite TV services. As is the case for all other TV distributors, Bell TV has experienced, and continues to experience, ongoing efforts to steal its services by way of compromise or circumvention of Bell TV’s signal security systems. The theft of Bell TV’s services has an adverse effect on Bell TV’s business and financial performance.
| Strategy execution and development |
Should we fail to achieve any of our strategic imperatives, this could have an adverse effect on our future growth, business and financial results.
We continue to pursue our goal to be recognized by customers as Canada’s leading communications company through focused execution of our six strategic imperatives. Executing on our strategic imperatives requires shifts in employee skills and capital investments to implement our strategies and operating priorities. If our management, processes or employees are not able to adapt to these changes or if required capital is not available on favourable terms, we may fail to achieve certain or all of our strategic imperatives, which could have an adverse effect on our business, financial performance and growth prospects. In particular, our strategies require us to continue to transform our cost structure. Our objectives for targeted cost reductions continue to be aggressive but there is no assurance that we will be successful in reducing costs, especially since incremental cost savings are more difficult to achieve on an ongoing basis. Our cost reduction objectives require aggressive negotiations with our key suppliers and there can be no assurance that such negotiations will be successful or that replacement products or services provided will not lead to operational issues. The inability to continue to reduce costs could have an adverse effect, in particular, on our Bell Wireline segment’s profitability.
Successful development of our business strategy is critical to enable the long term success of our business.
Strategy development is critical to the long-term success of any organization. Failure to effectively develop a strategy that balances short-term and long-term vision and to adequately communicate and manage such strategy across business units, could hinder the growth of our business. Failure to achieve strategic alignment within and among business units could have an adverse effect on our long-term growth.
100 BCE Inc. 2014 ANNUAL REPORT | |||
MD&A | BUSINESS RISKS | 9 |
| Tax matters |
Income and commodity tax amounts may materially differ from the amounts expected.
Our complex business operations are subject to various tax laws and the adoption of new tax laws or regulations or rules thereunder, or changes thereto or in the interpretation thereof, could result in higher tax rates, new taxes or other adverse tax implications. In addition, while we believe that we have adequately provided for all income and commodity taxes based on all of the information that is currently available, the calculation of income taxes and the applicability of commodity taxes in many cases require significant judgement interpreting tax rules and regulations. Our tax filings are subject to government audits that could result in material changes to the amount of current and deferred income tax assets and liabilities and other liabilities and could, in certain circumstances, result in an assessment of interest and penalties.
| Health and environmental matters |
Health concerns about radiofrequency emissions from wireless communication devices, as well as epidemics and other health risks, could have an adverse effect on our business.
Many studies have been performed to assess whether wireless phones, networks and towers pose a potential health risk. Some studies have indicated that radiofrequency emissions may be linked to certain medical conditions, while other studies could not establish such a link between adverse health effects and exposure to radiofrequency emissions. In May 2011, the International Agency for Research on Cancer (IARC) of the World Health Organization (WHO) classified radiofrequency electromagnetic fields from wireless phones as possibly carcinogenic to humans, but also indicated that chance, bias or confounding could not be ruled out with reasonable confidence. The IARC also called for additional research into long-term heavy use of mobile phones. In its June 2011 fact sheet on mobile phones, the WHO stated that to date, no adverse health effects have been established as being caused by mobile phone use. There can be no assurance that the conclusions drawn by other health studies concerning radiofrequency emissions will not have an adverse effect on our business and financial performance.
As we deploy new technologies, especially in the wireless area, we face current and potential lawsuits relating to alleged adverse health effects on customers who use such technologies, including wireless communications devices, as well as those relating to our marketing and disclosure practices in connection therewith. As with any litigation, we cannot predict the final outcome of any of the above-mentioned lawsuits and such lawsuits could have an adverse effect on our business and financial performance.
Increasing concern over the use of wireless communication devices, exposure to radiofrequency emissions and the possible related health risks could lead to additional government regulation, which could have an adverse effect on our business and financial performance. Actual or perceived health risks of using wireless communication devices and exposure to radiofrequency emissions could result in fewer new network subscribers, lower network usage per subscriber, higher churn rates, higher costs as a result of modifying handsets, wireless internet modems and TV receivers, and relocation of wireless towers or Wi-Fi antennas or addressing incremental legal requirements, an increase in the number of lawsuits filed against us, or reduced outside financing being available to the wireless communications industry.
In addition, public concerns could result in a slower deployment of, or in our inability to deploy, new wireless networks, towers and antennas, or other wireless services such as TV receivers and private or public access points. Industry Canada is responsible for approving radiofrequency equipment and performing compliance assessments. It has chosen Health Canada’s Safety Code 6, which sets the limits for safe exposure to radiofrequency at home or at work, as its exposure standard. The Safety Code 6 also outlines safety requirements for the installation and operation of devices that emit radiofrequency fields such as mobile phones, Wi-Fi technologies and base station antennas. Industry Canada has made compliance to Safety Code 6 mandatory for all proponents and operators of radio installations. We believe that the handsets and devices we sell, as well as our network equipment, comply with all Canadian government safety standards. We also rely on our suppliers to ensure that the network and customer equipment supplied to us meets all applicable safety and regulatory requirements.
In addition, epidemics, pandemics and other health risks could also occur, which could adversely affect our ability to maintain operational networks and provide services to our customers. Any of these events could have an adverse effect on our business and financial performance.
Climate change and other environmental concerns could have an adverse effect on our business.
Global climate change could exacerbate certain of the threats facing our business, including the frequency and severity of weather-related events referred to inPerformance of critical infrastructurein this section 9. In addition, increases in energy prices are partly influenced by government policies to address climate change which, combined with a growing data demand that increases our energy requirements, could increase our energy costs beyond our current expectations.
Several areas of our operations further raise environmental considerations, such as the storage of fuels, disposal of hazardous residual materials and recovery and recycling of end-of-life electronic products we sell or lease. Failure to recognize and adequately respond to changing governmental and public expectations on environmental matters could result in fines, missed opportunities, additional regulatory scrutiny, or harm our brand and reputation.
BCE Inc. 2014 ANNUAL REPORT 101 | |||
9 | BUSINESS RISKS | MD&A |
| Shareholder distributions and stock market volatility |
BCE is dependent on the ability of its subsidiaries, joint arrangements and other entities in which it has an interest to pay dividends or otherwise make distributions to it.
BCE has no material sources of income or assets of its own, other than the interests that it has in its subsidiaries, joint arrangements and other entities, including, in particular, its direct ownership of the equity of Bell Canada. BCE’s cash flow and, consequently, its ability to pay dividends on its equity securities and service its indebtedness are therefore dependent upon the ability of its subsidiaries, joint arrangements and other entities in which it has an interest to pay dividends or otherwise make distributions to it.
BCE’s subsidiaries, joint arrangements and other entities in which it has an interest are separate and distinct legal entities and have no obligation, contingent or otherwise, to pay any dividends or make any other distributions to BCE. In addition, any right of BCE to receive assets of its subsidiaries, joint arrangements and other entities in which it has an interest upon their liquidation or reorganization is structurally subordinated to the prior claims of creditors of such subsidiaries, joint arrangements and other entities.
We cannot guarantee that BCE’s dividend policy will be maintained or that dividends will be declared.
The BCE Board reviews from time to time the adequacy of BCE’s dividend policy with the objective of allowing sufficient financial flexibility to continue investing in our business while growing returns to shareholders. Under the current dividend policy, increases in the common share dividend are directly linked to growth in BCE’s Free Cash Flow. BCE’s dividend policy and the declaration of dividends on any of its outstanding shares are subject to the discretion of the BCE Board and, consequently, there can be no guarantee that BCE’s dividend policy will be maintained or that dividends will be declared.
A major decline in the market price of BCE’s securities may negatively impact our ability to raise capital, issue debt, retain employees, make strategic acquisitions or enter into joint arrangements.
Differences between BCE’s actual or anticipated financial results and the published expectations of financial analysts, as well as events affecting our business or operating environment, may contribute to volatility in BCE’s securities. A major decline in the capital markets in general, or an adjustment in the market price or trading volumes of BCE’s securities, may negatively affect our ability to raise capital, issue debt, retain senior executives and other key employees, make strategic acquisitions or enter into joint arrangements.
| Proposed Glentel acquisition |
The expected timing and completion of the proposed acquisition of Glentel and of the subsequent divestiture of a 50% ownership stake to Rogers are subject to closing conditions and other risks and uncertainties.
The expected timing and completion of the proposed acquisition by BCE of all of the issued and outstanding shares of wireless retailer Glentel is subject to customary closing conditions, termination rights and other risks and uncertainties including, without limitation, any required regulatory approvals. In addition, the subsequent divestiture of a 50% ownership interest in Glentel to Rogers following the closing of BCE’s acquisition of Glentel is also subject to customary closing conditions, termination rights and other risks and uncertainties including, without limitation, any required regulatory approvals. There can be no assurance that the proposed transactions will occur, or that they will occur on the timetable or on the terms and conditions currently contemplated. The proposed transactions could be modified, restructured or terminated. There can also be no assurance that the strategic benefits expected to result from the transactions will be fully realized.
102 BCE Inc. 2014 ANNUAL REPORT | |||
MD&A | FINANCIAL MEASURES, ACCOUNTING POLICIES AND CONTROLS | 10 |
| 10 FINANCIAL MEASURES, ACCOUNTING POLICIES AND CONTROLS |
10.1 Our accounting policies
This section discusses key estimates and assumptions that management has made and how they affect the amounts reported in the financial statements and notes. It also describes key changes in accounting standards and our accounting policies, and how they affect our financial statements.
We have prepared our consolidated financial statements using IFRS. Other significant accounting policies, not involving the same level of measurement uncertainty as those discussed in this section, are nevertheless important to an understanding of our financial statements. See Note 2 to BCE’s 2014 consolidated financial statements for more information about the accounting principles we use to prepare our consolidated financial statements.
| Critical accounting estimates and key judgements |
When preparing financial statements, management makes estimates and judgements relating to:
- reported amounts of revenues and expenses
- reported amounts of assets and liabilities
- disclosure of contingent assets and liabilities.
We base our estimates on a number of factors, including historical experience, current events and actions that the company may undertake in the future, and other assumptions that we believe are reasonable under the circumstances. By their nature, these estimates and judgements are subject to measurement uncertainty and actual results could differ.
We consider the estimates and judgements described in this section to be an important part of understanding our financial statements because they require management to make assumptions about matters that were highly uncertain at the time the estimate and judgement were made, and changes to these estimates and judgements could have a material impact on our financial statements and our segments.
Our senior management has reviewed the development and selection of the critical accounting estimates and judgements described in this section with the Audit Committee of the BCE Board.
Any sensitivity analysis included in this section should be used with caution as the changes are hypothetical and the impact of changes in each key assumption may not be linear.
Our more significant estimates and judgements are described below.
ESTIMATES
USEFUL LIVES OF PROPERTY, PLANT AND EQUIPMENT AND FINITE-LIFE INTANGIBLE ASSETS
We review our estimates of the useful lives of property, plant and equipment and finite-life intangible assets on an annual basis and adjust depreciation or amortization on a prospective basis, if needed.
Property, plant and equipment represent a significant proportion of our total assets. Changes in technology or our intended use of these assets, as well as changes in business prospects or economic and industry factors, may cause the estimated useful lives of these assets to change.
The estimated useful lives of property, plant and equipment and finite-life intangible assets are determined by internal asset life studies, which take into account actual and expected future usage, physical wear and tear, replacement history and assumptions about technology evolution. When factors indicate that assets’ useful lives are different from the prior assessment, we depreciate or amortize the remaining carrying value prospectively over the adjusted estimated useful lives.
Change in accounting estimates
As part of our ongoing annual review of property, plant and equipment and finite-life intangible assets, and to better reflect their useful lives, we increased the lives of certain IT software assets from five years to seven years and reduced the lives of certain network assets, including our CDMA network. The changes have been applied prospectively effective July 1, 2014 and did not have a significant impact on our financial statements.
In 2013, we changed the useful lives of fibre optic cable (excluding submarine cable) from 20 to 25 years, certain customer premise equipment from three and eight years to five years, certain IT and network software from a range of three to five years to a range of three to 12 years, and certain broadcasting equipment from 15 to 20 years to better reflect their useful lives. The changes include increases and decreases to useful lives and have been applied prospectively effective January 1, 2013. On a net basis, depreciation and amortization expense for these assets decreased by $139 million as a result of the changes.
POST-EMPLOYMENT BENEFIT PLANS
The amounts reported in the financial statements relating to DB pension plans and OPEBs are determined using actuarial calculations that are based on several assumptions.
Our actuaries perform a valuation at least every three years to determine the actuarial present value of the accrued DB pension plan and OPEB obligations. The actuarial valuation uses management’s assumptions for, among other things, the discount rate, life expectancy, the rate of compensation increase, trends in healthcare costs and expected average remaining years of service of employees.
While we believe that these assumptions are reasonable, differences in actual results or changes in assumptions could materially affect post-employment benefit obligations and future net post-employment benefit plans cost.
We account for differences between actual and expected results in benefit obligations and plan performance in OCI, which are then recognized immediately in the deficit.
The most significant assumptions used to calculate the net post-employment benefit plans cost are the discount rate and life expectancy.
BCE Inc. 2014 ANNUAL REPORT 103 | |||
10 | FINANCIAL MEASURES, ACCOUNTING POLICIES AND CONTROLS | MD&A |
A discount rate is used to determine the present value of the future cash flows that we expect will be needed to settle post-employment benefit obligations.
The discount rate is based on the yield on long-term, high-quality corporate fixed income investments with maturities matching the estimated cash flows of the post-employment benefit plans. Life expectancy is based on publicly available Canadian mortality tables and is adjusted for the company’s specific experience.
A lower discount rate and a higher life expectancy result in a higher net post-employment benefit obligation and a higher current service cost.
Sensitivity analysis
The following table shows a sensitivity analysis of key assumptions used to measure the net post-employment benefit obligations and the net post-employment benefit plans cost for our DB pension plans and OPEB plans.
| IMPACT ON NET POST-EMPLOYMENT BENEFIT PLANS COST FOR 2014 – INCREASE / (DECREASE) | IMPACT ON POST-EMPLOYMENT BENEFIT OBLIGATION AT DECEMBER 31, 2014 – INCREASE / (DECREASE) | ||||||||
| ||||||||||
| ||||||||||
| CHANGE IN | INCREASE IN | DECREASE IN | INCREASE IN | DECREASE IN | |||||
| ASSUMPTION | ASSUMPTION | ASSUMPTION | ASSUMPTION | ASSUMPTION | |||||
Discount rate | 1 | % | (175 | ) | 148 | (2,978 | ) | 3,428 | ||
Mortality rate | 25 | % | (73 | ) | 78 | (1,423 | ) | 1,518 | ||
IMPAIRMENT OF NON-FINANCIAL ASSETS
Goodwill and indefinite-life intangible assets are tested for impairment annually or when there is an indication that the asset may be impaired. Property, plant and equipment and finite-life intangible assets are tested for impairment if events or changes in circumstances, assessed quarterly, indicate that their carrying amount may not be recoverable. For the purpose of impairment testing, assets other than goodwill are grouped at the lowest level for which there are separately identifiable cash inflows.
Impairment losses are recognized and measured as the excess of the carrying value of the assets over their recoverable amount. An asset’s recoverable amount is the higher of its fair value less costs to sell and its value in use. Previously recognized impairment losses, other than those attributable to goodwill, are reviewed for possible reversal at each reporting date and, if the asset’s recoverable amount has increased, all or a portion of the impairment is reversed.
We make a number of estimates when calculating recoverable amounts using discounted future cash flows or other valuation methods to test for impairment. These estimates include the assumed growth rates for future cash flows, the number of years used in the cash flow model, and the discount rate. When impairment charges occur they are recorded inOther income (expense).
In 2014, we recorded a net impairment charge of $105 million relating mainly to our Conventional TV cash generating units (CGU) within our Bell Media segment, of which $67 million was allocated to property, plant and equipment and $38 million to indefinite-life intangible assets. The impairment resulted from a softness in the overall Canadian TV advertising market and higher TV content costs. The charge was determined by comparing the carrying value of the CGU to its fair value less costs of disposal, based on the expected future discounted cash flows for the period of January 1, 2015 to December 31, 2017 using a discount rate of 9.5% and a perpetuity growth rate of nil. The carrying value of our conventional TV CGUs was $327 million at December 31, 2014.
Goodwill impairment testing
We perform an annual test for goodwill impairment in the fourth quarter for each of our CGUs or groups of CGUs to which goodwill is allocated and whenever there is an indication that goodwill might be impaired.
A CGU is the smallest identifiable group of assets that generates cash inflows that are independent of the cash inflows from other assets or groups of assets.
We identify any potential impairment by comparing the carrying value of a CGU or groups of CGUs to its recoverable amount. The recoverable amount of a CGU or groups of CGUs is the higher of its fair value less costs of disposal and its value in use. Fair value less costs of disposal is based on estimates of discounted future cash flows or other valuation methods. Cash flows are projected based on past experience, actual operating results and business plans. When the recoverable amount of a CGU or groups of CGUs is less than its carrying value, the recoverable amount is determined for its identifiable assets and liabilities. The excess of the recoverable amount of the CGU or groups of CGUs over the total of the amounts assigned to its assets and liabilities is the recoverable amount of goodwill.
An impairment charge is deducted from earnings for any excess of the carrying value of goodwill over its recoverable amount. For purposes of impairment testing of goodwill, BCE’s CGUs or groups of CGUs correspond to our reporting segments as disclosed in Note 5 to BCE’s 2014 consolidated financial statements.
Any significant change in each of the estimates used could have a material impact on the calculation of the recoverable amount and resulting impairment charge. As a result, we are unable to reasonably quantify the changes in our overall financial performance if we had used different assumptions.
We cannot predict whether an event that triggers impairment will occur, when it will occur or how it will affect the asset values we have reported.
For the Bell Media group of CGUs, a decrease of (0.3%) in the perpetuity growth rate or an increase of 0.2% in the discount rate, would have resulted in its recoverable amount being equal to its carrying value. There were no goodwill impairment charges in 2014 or 2013.
DEFERRED TAXES
Deferred tax assets and liabilities are calculated at the tax rates that are expected to apply when the asset or liability is recovered or settled. Both our current and deferred tax assets and liabilities are calculated using tax rates that have been enacted or substantively enacted at the reporting date.
Deferred taxes are provided on temporary differences arising from investments in subsidiaries, joint arrangements and associates, except where we control the timing of the reversal of the temporary difference and it is probable that the temporary difference will not reverse in the foreseeable future.
The amount of deferred tax assets is estimated with consideration given to the timing, sources and amounts of future taxable income.
104 BCE Inc. 2014 ANNUAL REPORT | |||
MD&A | FINANCIAL MEASURES, ACCOUNTING POLICIES AND CONTROLS | 10 |
FAIR VALUE OF FINANCIAL INSTRUMENTS
Certain financial instruments, such as investments in equity securities, derivative financial instruments and certain elements of borrowings, are carried in the statements of financial position at fair value, with changes in fair value reflected in the income statements and the statements of comprehensive income. Fair values are estimated by reference to published price quotations or by using other valuation techniques that may include inputs that are not based on observable market data, such as discounted cash flows.
CONTINGENCIES
We become involved in various litigation matters as a part of our business. Pending litigations represent a potential cost to our business. We estimate the amount of the loss by analyzing potential outcomes and assuming various litigation and settlement strategies, based on information that is available at the time.
If the final resolution of a legal or regulatory matter results in a judgement against us or requires us to pay a large settlement, it could have a material effect on our consolidated financial statements in the period in which the judgement or settlement occurs. Any accrual would be charged to earnings and included inTrade payables and other liabilitiesorOther non-current liabilities. Any cash settlement would be deducted from cash from operating activities.
ONEROUS CONTRACTS
A provision for onerous contracts is recognized when the unavoidable costs of meeting our obligations under a contract exceed the expected benefits to be received from a contract. The provision is measured at the present value of the lower of the expected cost of terminating the contract and the expected net cost of completing the contract.
JUDGEMENTS
POST-EMPLOYMENT BENEFIT PLANS
The determination of the discount rate used to value our post-employment benefit obligations requires judgement. The rate is set by reference to market yields of high quality corporate bonds at the beginning of each fiscal year. Significant judgement is required when setting the criteria for bonds to be included in the population from which the yield curve is derived. The most significant criteria considered for the selection of bonds include the size of the issue and credit quality, along with the identification of outliers, which are excluded.
INCOME TAXES
The calculation of income taxes requires judgement in interpreting tax rules and regulations. There are transactions and calculations for which the ultimate tax determination is uncertain. Our tax filings are also subject to audits, the outcome of which could change the amount of current and deferred tax assets and liabilities. Management believes that it has sufficient amounts accrued for outstanding tax matters based on information that currently is available.
Management judgement is used to determine the amounts of deferred tax assets and liabilities and future tax liabilities to be recognized. In particular, judgement is required when assessing the timing of the reversal of temporary differences to which future income tax rates are applied.
MULTIPLE ELEMENT ARRANGEMENTS
Determining the amount of revenue to be recognized for multiple element arrangements requires judgement to establish the separately identifiable components and the allocation of the total price between those components.
CASH GENERATING UNITS
The determination of CGUs or groups of CGUs for the purpose of annual impairment testing requires judgement.
CONTINGENCIES
We accrue a potential loss if we believe a loss is probable and an outflow of resources is likely and can be reasonably estimated, based on information that is available at the time. Any accrual would be charged to earnings and included inTrade payables and other liabilitiesorOther non-current liabilities. Any cash settlement would be deducted from cash from operating activities. We estimate the amount of a loss by analyzing potential outcomes and assuming various litigation and settlement strategies.
The determination of whether a loss is probable from litigation and whether an outflow of resources is likely requires judgement.
| Adoption of new or amended accounting standards |
As required, effective January 1, 2014, we adopted the following new or amended accounting standards and interpretations on a retrospective basis, none of which had a significant impact on our financial statements.
| STANDARD | DESCRIPTION | IMPACT |
| Amendments to IAS 36 – Impairment of Assets | Provides guidance on recoverable amount disclosures for non-financial assets. | This amendment did not have a significant impact on our financial statements. |
| Amendments to IAS 39 – Financial Instruments: Recognition and Measurement | Provides guidance on novation of over-the-counter derivatives and continued designation for hedge accounting. | This amendment did not have a significant impact on our financial statements. |
| Amendments to IAS 32 – Financial Instruments: Presentation | Clarifies the application of the offsetting requirements of financial assets and financial liabilities. | This amendment did not have a significant impact on our financial statements. |
| International Financial Reporting Interpretations Committee (IFRIC) 21 – Levies | Provides guidance on when to recognize a liability for a levy imposed by a government, both for levies that are accounted for in accordance with IAS 37– Provisions, Contingent Liabilities and Contingent Assets, and those where the timing and amount of the levy is certain. | IFRIC 21 did not have a significant impact on our financial statements. |
BCE Inc. 2014 ANNUAL REPORT 105 | |||
10 | FINANCIAL MEASURES, ACCOUNTING POLICIES AND CONTROLS | MD&A |
| Future changes to accounting standards |
The following new or amended standards issued by the IASB have an effective date after December 31, 2014 and have not yet been adopted by BCE.
| STANDARD | DESCRIPTION | IMPACT | EFFECTIVE DATE |
| IFRS 9 – Financial Instruments | Sets out the requirements for recognizing and measuring financial assets, financial liabilities and some contracts to buy and sell non-financial items. IFRS 9 replaces IAS 39 – Financial Instruments: Recognition and Measurement. The new standard establishes a single classification and measurement approach for financial assets that reflects the business model in which they are managed and their cash flow characteristics. It also provides guidance on an entity’s own credit risk relating to financial liabilities and has modified the hedge accounting model to better link the economics of risk management with its accounting treatment. Additional disclosures will also be required under the new standard. | We are currently evaluating the impact of IFRS 9 on our financial statements. | Annual periods beginning on or after January 1, 2018, with early adoption permitted. |
| Amendments to IAS 16 – Property, Plant and Equipment and IAS 38 – Intangible Assets | Clarifies that a revenue-based approach to calculate depreciation and amortization generally is not appropriate as it does not reflect the consumption of the economic benefits embodied in the related asset. | The amendments to IAS 16 and IAS 38 are not expected to have a significant impact on our financial statements. | Annual periods beginning on or after January 1, 2016, applied prospectively. |
| Amendments to IFRS 11 – Joint Arrangements | Provides guidance on the accounting for acquisitions of interests in joint operations in which the activity constitutes a business, as defined in IFRS 3 – Business Combinations. The amended standard requires the acquirer to apply all of the principles on accounting for business combinations in IFRS 3 and other IFRSs except for any principles that conflict with IFRS 11. | The amendments to IFRS 11 are not expected to have a significant impact on our financial statements. | Annual periods beginning on or after January 1, 2016, applied prospectively. |
| IFRS 15 – Revenue from Contracts with Customers | Establishes principles to record revenues from contracts for the sale of goods or services, unless the contracts are in the scope of IAS 17 – Leases or other IFRSs. Under IFRS 15, revenue is recognized at an amount that reflects the expected consideration receivable in exchange for transferring goods or services to a customer, applying the following five steps: 1. Identify the contract with a customer 2. Identify the performance obligations in the contract 3. Determine the transaction price 4. Allocate the transaction price to the performance obligations in the contract 5. Recognize revenue when (or as) the entity satisfies a performance obligation The new standard also provides guidance relating to contract costs and for the measurement and recognition of gains and losses on the sale of certain non-financial assets such as property and equipment. Additional disclosures will also be required under the new standard. | IFRS 15 will affect how we account for revenues and contract costs for Bell Wireless and our other segments. We are currently evaluating the impact of IFRS 15 on our financial statements. | Annual periods beginning on or after January 1, 2017, using either a full retrospective approach for all periods presented in the period of adoption or a modified retrospective approach. |
| 10.2 Non-GAAP financial measures and key performance indicators (KPIs) |
This section describes the non-GAAP financial measures and KPIs we use in this MD&A to explain our financial results. It also provides reconciliations of the non-GAAP financial measures to the most comparable IFRS financial measures.
| Adjusted EBITDA and Adjusted EBITDA margin |
Beginning with Q2 2014, we reference Adjusted EBITDA and Adjusted EBITDA margin as non-GAAP financial measures. These terms replace the previously referenced non-GAAP financial measures EBITDA and EBITDA margin. Our definitions of Adjusted EBITDA and Adjusted EBITDA margin are unchanged from our former definition of EBITDA and EBITDA margin, respectively. Accordingly, this change in terminology has no impact on our reported financial results for prior periods.
The terms Adjusted EBITDA and Adjusted EBITDA margin do not have any standardized meaning under IFRS. Therefore, they are unlikely to be comparable to similar measures presented by other issuers.
We define Adjusted EBITDA as operating revenues less operating costs, as shown in BCE’s consolidated income statements. Adjusted EBITDA for BCE’s segments is the same as segment profit as reported in Note 5 to BCE’s 2014 consolidated financial statements. We define Adjusted EBITDA margin as Adjusted EBITDA divided by operating revenues.
106 BCE Inc. 2014 ANNUAL REPORT | |||
MD&A | FINANCIAL MEASURES, ACCOUNTING POLICIES AND CONTROLS | 10 |
We use Adjusted EBITDA and Adjusted EBITDA margin to evaluate the performance of our businesses as they reflect their ongoing profitability. We believe that certain investors and analysts use Adjusted EBITDA to measure a company’s ability to service debt and to meet other payment obligations or as a common measurement to value companies in the telecommunications industry. We believe that certain investors and analysts also use Adjusted EBITDA and Adjusted EBITDA margin to evaluate the performance of our businesses. Adjusted EBITDA is also one component in the determination of short-term incentive compensation for all management employees.
Adjusted EBITDA and Adjusted EBITDA margin have no directly comparable IFRS financial measure. Alternatively, the following table provides a reconciliation of net earnings to Adjusted EBITDA.
| 2014 | 2013 | ||
Net earnings | 2,718 | 2,388 | ||
Severance, acquisition and other costs | 216 | 406 | ||
Depreciation | 2,880 | 2,734 | ||
Amortization | 572 | 646 | ||
Finance costs | ||||
Interest expense | 929 | 931 | ||
Interest on post-employment benefit obligations | 101 | 150 | ||
Other (income) expense | (42 | ) | 6 | |
Income taxes | 929 | 828 | ||
Adjusted EBITDA | 8,303 | 8,089 | ||
BCE operating revenues | 21,042 | 20,400 | ||
Adjusted EBITDA margin | 39.5 | % | 39.7 | % |
| Adjusted net earnings and Adjusted EPS |
The terms Adjusted net earnings and Adjusted EPS do not have any standardized meaning under IFRS. Therefore, they are unlikely to be comparable to similar measures presented by other issuers.
We define Adjusted net earnings as net earnings attributable to common shareholders before severance, acquisition and other costs, net (gains) losses on investments, and early debt redemption costs.We define Adjusted EPS as Adjusted net earnings per BCE common share.
We use Adjusted net earnings and Adjusted EPS, and we believe that certain investors and analysts use these measures, among other ones, to assess the performance of our businesses without the effects of severance, acquisition and other costs, net (gains) losses on investments, and early debt redemption costs, net of tax and NCI. We exclude these items because they affect the comparability of our financial results and could potentially distort the analysis of trends in business performance. Excluding these items does not imply they are non-recurring.
The most comparable IFRS financial measures are net earnings attributable to common shareholders and EPS. The following table is a reconciliation of net earnings attributable to common shareholders and EPS to Adjusted net earnings on a consolidated basis and per BCE common share (Adjusted EPS), respectively.
| 2014 | 2013 | ||||||
| TOTAL | PER SHARE | TOTAL | PER SHARE | ||||
Net earnings attributable to common shareholders | 2,363 | 2.98 | 1,975 | 2.55 | ||||
Severance, acquisition and other costs | 148 | 0.18 | 299 | 0.38 | ||||
Net (gains) losses on investments | (8 | ) | (0.01 | ) | 7 | 0.01 | ||
Early debt redemption costs | 21 | 0.03 | 36 | 0.05 | ||||
Adjusted net earnings | 2,524 | 3.18 | 2,317 | 2.99 | ||||
BCE Inc. 2014 ANNUAL REPORT 107 | |||
10 | FINANCIAL MEASURES, ACCOUNTING POLICIES AND CONTROLS | MD&A |
| Free Cash Flow and Free Cash Flow per share |
The terms Free Cash Flow and Free Cash Flow per share do not have any standardized meaning under IFRS. Therefore, they are unlikely to be comparable to similar measures presented by other issuers.
As of November 1, 2014, BCE’s Free Cash Flow includes 100% of Bell Aliant’s Free Cash Flow rather than cash dividends received from Bell Aliant. We define Free Cash Flow as cash flows from operating activities, excluding acquisition costs paid and voluntary pension funding, less capital expenditures, preferred share dividends and dividends paid by subsidiaries to NCI.
Prior to November 1, 2014, Free Cash Flow was defined as cash flows from operating activities, excluding acquisition costs paid and voluntary pension funding, plus dividends received from Bell Aliant, less capital expenditures, preferred share dividends, dividends paid by subsidiaries to NCI and Bell Aliant Free Cash Flow.
We define Free Cash Flow per share as Free Cash Flow divided by the average number of common shares outstanding.
We consider Free Cash Flow and Free Cash Flow per share to be important indicators of the financial strength and performance of our businesses because they show how much cash is available to pay dividends, repay debt and reinvest in our company.
We believe that certain investors and analysts use Free Cash Flow to value a business and its underlying assets. We believe that certain investors and analysts also use Free Cash Flow and Free Cash Flow per share to evaluate the financial strength and performance of our businesses.
The most comparable IFRS financial measure is cash flows from operating activities. The following table is a reconciliation of cash flows from operating activities to Free Cash Flow on a consolidated basis.
| 2014 | 2013 | ||
Cash flows from operating activities | 6,241 | 6,476 | ||
Bell Aliant dividends to BCE | 95 | 191 | ||
Capital expenditures | (3,717 | ) | (3,571 | ) |
Cash dividends paid on preferred shares | (134 | ) | (127 | ) |
Cash dividends paid by subsidiaries to non-controlling interest | (145 | ) | (283 | ) |
Acquisition costs paid | 131 | 80 | ||
Voluntary defined benefit pension plan contribution | 350 | – | ||
Bell Aliant free cash flow | (77 | ) | (195 | ) |
Free cash flow | 2,744 | 2,571 | ||
Average number of common shares outstanding (millions) | 793.7 | 775.8 | ||
Free cash flow per share | 3.46 | 3.31 |
| Net Debt |
The term Net Debt does not have any standardized meaning under IFRS. Therefore, it is unlikely to be comparable to similar measures presented by other issuers.
We define Net Debt as debt due within one year plus long-term debt and 50% of preferred shares, less cash and cash equivalents, as shown in BCE’s consolidated statement of financial position. We include 50% of outstanding preferred shares in our Net Debt as it is consistent with the treatment by certain credit rating agencies.
We consider Net Debt to be an important indicator of the company’s financial leverage because it represents the amount of debt that is not covered by available cash and cash equivalents. We believe that certain investors and analysts use Net Debt to determine a company’s financial leverage. Net Debt has no directly comparable IFRS financial measure, but rather is calculated using several asset and liability categories from the statements of financial position, as shown in the following table.
| 2014 | 2013 | ||
Debt due within one year | 3,743 | 2,571 | ||
Long-term debt | 16,355 | 16,341 | ||
50% of outstanding preferred shares | 2,002 | 1,698 | ||
Cash and cash equivalents | (566 | ) | (335 | ) |
Net Debt | 21,534 | 20,275 |
108 BCE Inc. 2014 ANNUAL REPORT | |||
MD&A | FINANCIAL MEASURES, ACCOUNTING POLICIES AND CONTROLS | 10 |
| KPIs |
We use a number of KPIs to measure the success of our strategic imperatives. These KPIs are not accounting measures and may not be comparable to similar measures presented by other issuers.
| KPI | DEFINITION |
| Capital intensity | Capital expenditures divided by operating revenues. |
| ARPU | Average revenue per user or subscriber is certain service revenues divided by the average subscriber base for the specified period. |
| Churn | Churn is the rate at which existing subscribers cancel their services, expressed as a percentage. Churn is calculated as the number of subscribers disconnected divided by the average subscriber base. It is a measure of monthly customer turnover. |
| COA | COA is also referred to as subscriber acquisition costs. COA represents the total cost associated with acquiring a customer and includes costs such as hardware discounts, marketing and distribution costs. This measure is expressed per gross activation during the period. |
| Dividend payout ratio | Dividends paid on common shares divided by Free Cash Flow. |
| Net Debt to Adjusted EBITDA | As of Q4 2014, we report Net Debt to Adjusted EBITDA ratio at the BCE level as opposed to the Bell level. Comparative figures are also reported at the BCE level. Net Debt to Adjusted EBITDA is BCE Net Debt divided by Adjusted EBITDA. Net Debt is debt due within one year plus long-term debt and 50% of preferred shares less cash and cash equivalents. For the purposes of calculating our Net Debt to Adjusted EBITDA ratio, Adjusted EBITDA is defined as twelve-month trailing BCE Adjusted EBITDA. |
| Adjusted EBITDA to net interest expense | As of Q4 2014, we report Adjusted EBITDA to net interest expense ratio at the BCE level as opposed to the Bell level. Comparative figures are also reported at the BCE level. Adjusted EBITDA to net interest expense is Adjusted EBITDA divided by net interest expense. For the purposes of calculating our Adjusted EBITDA to net interest expense ratio, Adjusted EBITDA is defined as twelve-month trailing BCE Adjusted EBITDA. Net interest expense is twelve-month trailing BCE interest expense excluding interest on post-employment benefit obligations and including 50% of preferred dividends. |
| 10.3 Effectiveness of internal controls |
Disclosure controls and procedures
Our disclosure controls and procedures are designed to provide reasonable assurance that information required to be disclosed by us in reports filed or submitted under Canadian or U.S. securities laws is recorded, processed, summarized and reported within the time periods specified under those laws, and include controls and procedures that are designed to ensure that the information is accumulated and communicated to management, including BCE’s President and CEO and Executive Vice-President and CFO, to allow timely decisions regarding required disclosure.
As at December 31, 2014, management evaluated, under the supervision of and with the participation of the CEO and the CFO, the effectiveness of our disclosure controls and procedures, as defined in Rule 13a-15(e) under the U.S.Securities Exchange Act of 1934,as amended, and under National Instrument 52-109 –Certification of Disclosure in Issuers’ Annual and Interim Filings.
Based on that evaluation, the CEO and CFO concluded that our disclosure controls and procedures were effective as at December 31, 2014.
| Internal control over financial reporting |
Management is responsible for establishing and maintaining adequate internal control over financial reporting, as defined in Rule 13a-15(f) under the U.S.Securities Exchange Act of 1934,as amended, and under National Instrument 52-109. Our internal control over financial reporting is a process designed under the supervision of the CEO and CFO to provide reasonable assurance regarding the reliability of financial reporting and the preparation of financial statements for external purposes in accordance with IFRS. However, because of its inherent limitations, internal control over financial reporting may not prevent or detect misstatements on a timely basis.
Management evaluated, under the supervision of and with the participation of the CEO and the CFO, the effectiveness of our internal control over financial reporting as at December 31, 2014, based on the criteria established in the2013 Internal Control – Integrated Frameworkissued by the Committee of Sponsoring Organizations of the Treadway Commission (2013 COSO Framework).
Based on that evaluation, the CEO and CFO concluded that our internal control over financial reporting was effective as at December 31, 2014.
There have been no changes during the year ended December 31, 2014 in our internal control over financial reporting that have materially affected, or are reasonably likely to materially affect, our internal control over financial reporting.
BCE Inc. 2014 ANNUAL REPORT 109 |
CONSOLIDATED FINANCIAL STATEMENTS |
| CONSOLIDATED FINANCIAL STATEMENTS |
Management’s responsibility for financial reporting
These financial statements form the basis for all of the financial information that appears in this annual report.
The financial statements and all of the information in this annual report are the responsibility of the management of BCE Inc. (BCE) and have been reviewed and approved by the board of directors. The board of directors is responsible for ensuring that management fulfills its financial reporting responsibilities. Deloitte LLP, Independent Registered Chartered Professional Accountants, have audited the financial statements.
Management has prepared the financial statements according to International Financial Reporting Standards (IFRS). Under these principles, management has made certain estimates and assumptions that are reflected in the financial statements and notes. Management believes that these financial statements fairly present BCE’s consolidated financial position, results of operations and cash flows.
Management has a system of internal controls designed to provide reasonable assurance that the financial statements are accurate and complete in all material respects. This is supported by an internal audit group that reports to the Audit Committee, and includes communication with employees about policies for ethical business conduct. Management believes that the internal controls provide reasonable assurance that our financial records are reliable and form a proper basis for preparing the financial statements, and that our assets are properly accounted for and safeguarded.
The board of directors has appointed an Audit Committee, which is made up of unrelated and independent directors. The Audit Committee’s responsibilities include reviewing the financial statements and other information in this annual report, and recommending them to the board of directors for approval. You will find a description of the Audit Committee’s other responsibilities on page 156 of this annual report. The internal auditors and the shareholders’ auditors have free and independent access to the Audit Committee.
(signed) George A. Cope
President and Chief Executive Officer
(signed) Siim A. Vanaselja
Executive Vice-President and Chief Financial Officer
(signed) Thierry Chaumont
Senior Vice-President and Controller
March 5, 2015
112 BCE Inc. 2014 ANNUAL REPORT | |||
CONSOLIDATED FINANCIAL STATEMENTS | |||
Report of independent registered public accounting firm
To the Board of Directors and Shareholders of BCE Inc.
We have audited the accompanying consolidated financial statements of BCE Inc. and subsidiaries (the “Company”), which comprise the consolidated statements of financial position as at December 31, 2014 and December 31, 2013, and the consolidated income statements, consolidated statements of comprehensive income, consolidated statements of changes in equity, and consolidated statements of cash flows for the years then ended, and a summary of significant accounting policies and other explanatory information.
MANAGEMENT’S RESPONSIBILITY FOR THE CONSOLIDATED FINANCIAL STATEMENTS
Management is responsible for the preparation and fair presentation of these consolidated financial statements in accordance with International Financial Reporting Standards as issued by the International Accounting Standards Board, and for such internal control as management determines is necessary to enable the preparation of consolidated financial statements that are free from material misstatement, whether due to fraud or error.
AUDITOR’S RESPONSIBILITY
Our responsibility is to express an opinion on these consolidated financial statements based on our audits. We conducted our audits in accordance with Canadian generally accepted auditing standards and the standards of the Public Company Accounting Oversight Board (United States). Those standards require that we comply with ethical requirements and plan and perform the audit to obtain reasonable assurance about whether the consolidated financial statements are free from material misstatement.
An audit involves performing procedures to obtain audit evidence about the amounts and disclosures in the consolidated financial statements. The procedures selected depend on the auditor’s judgement, including the assessment of the risks of material misstatement of the consolidated financial statements, whether due to fraud or error. In making those risk assessments, the auditor considers internal control relevant to the entity’s preparation and fair presentation of the consolidated financial statements in order to design audit procedures that are appropriate in the circumstances. An audit also includes evaluating the appropriateness of accounting policies used and the reasonableness of accounting estimates made by management, as well as evaluating the overall presentation of the consolidated financial statements.
We believe that the audit evidence we have obtained in our audits is sufficient and appropriate to provide a basis for our audit opinion.
OPINION
In our opinion, the consolidated financial statements present fairly, in all material respects, the financial position of BCE Inc. and subsidiaries as at December 31, 2014 and December 31, 2013, and their financial performance and their cash flows for the years then ended in accordance with International Financial Reporting Standards as issued by the International Accounting Standards Board.
OTHER MATTER
We have also audited, in accordance with the standards of the Public Company Accounting Oversight Board (United States), the Company’s internal control over financial reporting as of December 31, 2014, based on the criteria established in Internal Control – Integrated Framework (2013) issued by the Committee of Sponsoring Organizations of the Treadway Commission and our report dated March 5, 2015 expressed an unqualified opinion on the Company’s internal control over financial reporting.
(signed) Deloitte LLP(1)
Independent Registered Chartered Professional Accountants
Montréal, Canada
March 5, 2015
(1) CPA auditor, CA, public accountancy permit No. A104644
BCE Inc. 2014 ANNUAL REPORT 113 | |||
CONSOLIDATED FINANCIAL STATEMENTS | |||
| Consolidated income statements |
FOR THE YEAR ENDED DECEMBER 31 | ||||||
(IN MILLIONS OF CANADIAN DOLLARS, EXCEPT SHARE AMOUNTS) | NOTE | 2014 | 2013 | |||
Operating revenues | 5 | 21,042 | 20,400 | |||
Operating costs | 5,6 | (12,739 | ) | (12,311 | ) | |
Severance, acquisition and other costs | 5,7 | (216 | ) | (406 | ) | |
Depreciation | 5,14 | (2,880 | ) | (2,734 | ) | |
Amortization | 5,15 | (572 | ) | (646 | ) | |
Finance costs | ||||||
Interest expense | 8 | (929 | ) | (931 | ) | |
Interest on post-employment benefit obligations | 22 | (101 | ) | (150 | ) | |
Other income (expense) | 9 | 42 | (6 | ) | ||
Income taxes | 10 | (929 | ) | (828 | ) | |
Net earnings | 2,718 | 2,388 | ||||
Net earnings attributable to: |
|
|
|
|
|
|
Common shareholders | 2,363 | 1,975 | ||||
Preferred shareholders | 137 | 131 | ||||
Non-controlling interest | 29 | 218 | 282 | |||
Net earnings | 2,718 | 2,388 | ||||
Net earnings per common share |
|
|
|
|
|
|
Basic | 11 | 2.98 | 2.55 | |||
Diluted | 11 | 2.97 | 2.54 | |||
Average number of common shares outstanding – basic (millions) | 793.7 | 775.8 |
Consolidated statements of comprehensive income
FOR THE YEAR ENDED DECEMBER 31 | ||||||
(IN MILLIONS OF CANADIAN DOLLARS) | NOTE | 2014 | 2013 | |||
Net earnings | 2,718 | 2,388 | ||||
Other comprehensive (loss) income, net of income taxes | ||||||
Items that will be reclassified subsequently to net earnings | ||||||
Net change in value of available-for-sale financial assets, net of income taxes of nil for 2014 and 2013 | 58 | (6 | ) | |||
Net change in value of derivatives designated as cash flow hedges, net of income taxes of ($13) million and ($9) million for 2014 and 2013, respectively | 34 | 28 | ||||
Items that will not be reclassified to net earnings | ||||||
Actuarial (losses) gains on post-employment benefit plans, net of income taxes of $253 million and ($380) million for 2014 and 2013, respectively | 22 | (685 | ) | 1,036 | ||
Other comprehensive (loss) income | (593 | ) | 1,058 | |||
Total comprehensive income | 2,125 | 3,446 | ||||
Total comprehensive income attributable to: |
|
|
|
|
|
|
Common shareholders | 1,862 | 2,872 | ||||
Preferred shareholders | 137 | 131 | ||||
Non-controlling interest | 29 | 126 | 443 | |||
Total comprehensive income | 2,125 | 3,446 |
114 BCE Inc. 2014 ANNUAL REPORT | |||
CONSOLIDATED FINANCIAL STATEMENTS | |||
| Consolidated statements of financial position |
(IN MILLIONS OF CANADIAN DOLLARS) | NOTE | DECEMBER 31, 2014 | DECEMBER 31, 2013 | |||
ASSETS | ||||||
Current assets | ||||||
Cash | 142 | 220 | ||||
Cash equivalents | 424 | 115 | ||||
Trade and other receivables | 12 | 3,069 | 3,043 | |||
Inventory | 13 | 333 | 383 | |||
Prepaid expenses | 379 | 415 | ||||
Assets held for sale | 4 | 3 | 719 | |||
Other current assets | 198 | 175 | ||||
Total current assets | 4,548 | 5,070 | ||||
Non-current assets | ||||||
Property, plant and equipment | 14 | 21,327 | 20,743 | |||
Intangible assets | 15 | 10,224 | 9,552 | |||
Deferred tax assets | 10 | 162 | 165 | |||
Investments in associates and joint ventures | 16 | 776 | 775 | |||
Other non-current assets | 17 | 875 | 698 | |||
Goodwill | 18 | 8,385 | 8,381 | |||
Total non-current assets | 41,749 | 40,314 | ||||
Total assets | 46,297 | 45,384 | ||||
LIABILITIES | ||||||
Current liabilities | ||||||
Trade payables and other liabilities | 19 | 4,398 | 4,339 | |||
Interest payable | 145 | 147 | ||||
Dividends payable | 534 | 466 | ||||
Current tax liabilities | 269 | 367 | ||||
Debt due within one year | 20 | 3,743 | 2,571 | |||
Total current liabilities | 9,089 | 7,890 | ||||
Non-current liabilities | ||||||
Long-term debt | 21 | 16,355 | 16,341 | |||
Deferred tax liabilities | 10 | 1,321 | 1,318 | |||
Post-employment benefit obligations | 22 | 2,772 | 2,127 | |||
Other non-current liabilities | 23 | 1,521 | 1,458 | |||
Total non-current liabilities | 21,969 | 21,244 | ||||
Total liabilities | 31,058 | 29,134 | ||||
Commitments and contingencies | 27 | |||||
EQUITY | ||||||
Equity attributable to BCE shareholders | ||||||
Preferred shares | 3,25 | 4,004 | 3,395 | |||
Common shares | 3,25 | 16,717 | 13,629 | |||
Contributed surplus | 3 | 1,141 | 2,615 | |||
Accumulated other comprehensive income | 97 | 14 | ||||
Deficit | 3 | (7,013 | ) | (4,642 | ) | |
Total equity attributable to BCE shareholders | 14,946 | 15,011 | ||||
Non-controlling interest | 3,29 | 293 | 1,239 | |||
Total equity | 15,239 | 16,250 | ||||
Total liabilities and equity | 46,297 | 45,384 |
BCE Inc. 2014 ANNUAL REPORT 115 | |||
CONSOLIDATED FINANCIAL STATEMENTS | |||
Consolidated statements of changes in equity
| ATTRIBUTABLE TO BCE SHAREHOLDERS | |||||||||||||||||
| ACCUMU- | |||||||||||||||||
| LATED | |||||||||||||||||
| OTHER | |||||||||||||||||
| COMPRE- | NON- | ||||||||||||||||
| CONTRI- | HENSIVE | CONTROL- | |||||||||||||||
FOR THE YEAR ENDED DECEMBER 31, 2014 | PREFERRED | COMMON | BUTED | INCOME | LING | TOTAL | ||||||||||||
(IN MILLIONS OF CANADIAN DOLLARS) | NOTE | SHARES | SHARES | SURPLUS | (LOSS) | DEFICIT | TOTAL | INTEREST | EQUITY | |||||||||
Balance at January 1, 2014 | 3,395 | 13,629 | 2,615 | 14 | (4,642 | ) | 15,011 | 1,239 | 16,250 | |||||||||
Net earnings | – | – | – | – | 2,500 | 2,500 | 218 | 2,718 | ||||||||||
Other comprehensive (loss) income | – | – | – | 90 | (591 | ) | (501 | ) | (92 | ) | (593 | ) | ||||||
Total comprehensive income | – | – | – | 90 | 1,909 | 1,999 | 126 | 2,125 | ||||||||||
Common shares issued under stock option plan | 25 | – | 53 | (4 | ) | – | – | 49 | – | 49 | ||||||||
Common shares issued under employee savings plan | 25 | – | 107 | – | – | – | 107 | – | 107 | |||||||||
Other share-based compensation | – | – | 29 | – | (4 | ) | 25 | 7 | 32 | |||||||||
Dividends declared on BCE common and preferred shares | – | – | – | – | (2,098 | ) | (2,098 | ) | – | (2,098 | ) | |||||||
Dividends declared by subsidiaries to non-controlling interest | – | – | – | – | – | – | (145 | ) | (145 | ) | ||||||||
Privatization of Bell Aliant | 3 | 609 | 2,928 | (1,499 | ) | (7 | ) | (2,143 | ) | (112 | ) | (877 | ) | (989 | ) | |||
Privatization transaction costs | – | – | – | – | (35 | ) | (35 | ) | (5 | ) | (40 | ) | ||||||
Other | – | – | – | – | – | – | (52 | ) | (52 | ) | ||||||||
Balance at December 31, 2014 | 4,004 | 16,717 | 1,141 | 97 | (7,013 | ) | 14,946 | 293 | 15,239 | |||||||||
| ATTRIBUTABLE TO BCE SHAREHOLDERS | |||||||||||||||||
| ACCUMU- | |||||||||||||||||
| LATED | |||||||||||||||||
| OTHER | |||||||||||||||||
| COMPRE- | NON- | ||||||||||||||||
| CONTRI- | HENSIVE | CONTROL- | |||||||||||||||
FOR THE YEAR ENDED DECEMBER 31, 2013 | PREFERRED | COMMON | BUTED | INCOME | LING | TOTAL | ||||||||||||
(IN MILLIONS OF CANADIAN DOLLARS) | NOTE | SHARES | SHARES | SURPLUS | (LOSS) | DEFICIT | TOTAL | INTEREST | EQUITY | |||||||||
Balance at January 1, 2013 | 3,395 | 13,611 | 2,557 | (6 | ) | (5,682 | ) | 13,875 | 850 | 14,725 | ||||||||
Net earnings | – | – | – | – | 2,106 | 2,106 | 282 | 2,388 | ||||||||||
Other comprehensive income | – | – | – | 20 | 877 | 897 | 161 | 1,058 | ||||||||||
Total comprehensive income | – | – | – | 20 | 2,983 | 3,003 | 443 | 3,446 | ||||||||||
Common shares issued under stock option plan | 25 | – | 14 | (1 | ) | – | – | 13 | – | 13 | ||||||||
Common shares issued under employee savings plan | 25 | – | 4 | – | – | – | 4 | – | 4 | |||||||||
Other share-based compensation | – | – | 59 | – | 2 | 61 | 5 | 66 | ||||||||||
Dividends declared on BCE common and preferred shares | – | – | – | – | (1,938 | ) | (1,938 | ) | – | (1,938 | ) | |||||||
Dividends declared by subsidiaries to non-controlling interest | – | – | – | – | – | – | (290 | ) | (290 | ) | ||||||||
Equity securities issued by subsidiaries to non-controlling interest | – | – | – | – | – | – | 225 | 225 | ||||||||||
Equity transaction with non-controlling interest | – | – | – | – | (7 | ) | (7 | ) | 6 | (1 | ) | |||||||
Balance at December 31, 2013 | 3,395 | 13,629 | 2,615 | 14 | (4,642 | ) | 15,011 | 1,239 | 16,250 | |||||||||
116 BCE Inc. 2014 ANNUAL REPORT | |||
CONSOLIDATED FINANCIAL STATEMENTS | |||
Consolidated statements of cash flows
FOR THE YEAR ENDED DECEMBER 31 | ||||||
(IN MILLIONS OF CANADIAN DOLLARS) | NOTE | 2014 | 2013 | |||
Cash flows from operating activities | ||||||
Net earnings | 2,718 | 2,388 | ||||
Adjustments to reconcile net earnings to cash flows from operating activities | ||||||
Severance, acquisition and other costs | 7 | 216 | 406 | |||
Depreciation and amortization | 14,15 | 3,452 | 3,380 | |||
Post-employment benefit plans cost | 22 | 377 | 442 | |||
Net interest expense | 921 | 924 | ||||
(Gains) losses on investments | 9 | (10 | ) | 7 | ||
Income taxes | 10 | 929 | 828 | |||
Contributions to post-employment benefit plans | 22 | (683 | ) | (341 | ) | |
Payments under other post-employment benefit plans | 22 | (73 | ) | (73 | ) | |
Severance and other costs paid | (190 | ) | (203 | ) | ||
Acquisition costs paid | (131 | ) | (80 | ) | ||
Interest paid | (907 | ) | (879 | ) | ||
Income taxes paid (net of refunds) | (743 | ) | (470 | ) | ||
Net change in operating assets and liabilities | 365 | 147 | ||||
Cash flows from operating activities | 6,241 | 6,476 | ||||
Cash flows used in investing activities | ||||||
Capital expenditures | 5 | (3,717 | ) | (3,571 | ) | |
Business acquisitions | 4 | (18 | ) | (2,850 | ) | |
Business dispositions | 4 | 720 | 1 | |||
Acquisition of spectrum licences | 15 | (566 | ) | – | ||
Other investing activities | 11 | 19 | ||||
Cash flows used in investing activities | (3,570 | ) | (6,401 | ) | ||
Cash flows (used in) from financing activities | ||||||
Increase in notes payable and bank advances | 469 | 272 | ||||
Issue of long-term debt | 21 | 1,428 | 4,438 | |||
Repayment of long-term debt | 21 | (1,113 | ) | (2,495 | ) | |
Early debt redemption costs | 9,21 | (4 | ) | (55 | ) | |
Privatization of Bell Aliant | 3 | (989 | ) | – | ||
Issue of common shares | 49 | 13 | ||||
Issue of equity securities by subsidiaries to non-controlling interest | – | 230 | ||||
Cash dividends paid on common shares | (1,893 | ) | (1,795 | ) | ||
Cash dividends paid on preferred shares | (134 | ) | (127 | ) | ||
Cash dividends paid by subsidiaries to non-controlling interest | (145 | ) | (283 | ) | ||
Other financing activities | (108 | ) | (67 | ) | ||
Cash flows (used in) from financing activities | (2,440 | ) | 131 | |||
Net (decrease) increase in cash | (78 | ) | 101 | |||
Cash at beginning of period | 220 | 119 | ||||
Cash at end of period | 142 | 220 | ||||
Net increase in cash equivalents | 309 | 105 | ||||
Cash equivalents at beginning of period | 115 | 10 | ||||
Cash equivalents at end of period | 424 | 115 |
BCE Inc. 2014 ANNUAL REPORT 117 | |||
NOTES TO CONSOLIDATED FINANCIAL STATEMENTS | |||
| NOTES TO CONSOLIDATED FINANCIAL STATEMENTS |
We,us,our,BCE andthe companymean, as the context may require, either BCE Inc. or, collectively, BCE Inc., its subsidiaries, joint arrangements and associates;Bellmeans our Bell Wireless, Bell Wireline and Bell Media segments on an aggregate basis; andBell Aliant means, as the context may require, until December 31, 2014, either Bell Aliant Inc. or, collectively, Bell Aliant Inc., its subsidiaries and associates, or after December 31, 2014, Bell Aliant Regional Communications Inc. or, collectively, Bell Aliant Regional Communications Inc. and its subsidiaries and associates.
| Note 1 Corporate information |
BCE is incorporated and domiciled in Canada. BCE’s head office is located at 1, Carrefour Alexander-Graham-Bell, Verdun, Québec, Canada. BCE is a telecommunications and media company providing wireless, wireline, Internet and television (TV) services to residential, business and wholesale customers in Canada. Our Bell Media segment provides conventional, specialty and pay TV, digital media, and radio broadcasting services to customers across Canada and out-of-home advertising services. The consolidated financial statements (financial statements) were approved by BCE’s board of directors on March 5, 2015.
| Note 2 Significant accounting policies |
a) Basis of presentation
The financial statements were prepared in accordance with International Financial Reporting Standards (IFRS), as issued by the International Accounting Standards Board (IASB). The financial statements have been prepared on a historical cost basis, except for certain financial instruments that are measured at fair value as described in our accounting policies.
All amounts are in millions of Canadian dollars, except where noted.
FUNCTIONAL CURRENCY
The financial statements are presented in Canadian dollars, the company’s functional currency.
| b) Basis of consolidation |
We consolidate the financial statements of all our subsidiaries. Subsidiaries are entities we control, where control is achieved when the company is exposed or has the right to variable returns from its involvement with the investee and has the current ability to direct the activities of the investee that significantly affect the investee’s returns.
The results of subsidiaries acquired (sold) during the year are (de-)consolidated from the date of acquisition (disposal). Where necessary, adjustments are made to the financial statements of acquired subsidiaries to conform their accounting policies with ours. All intercompany transactions, balances, income and expenses are eliminated on consolidation.
Changes in BCE’s ownership interest in a subsidiary that do not result in a change of control are accounted for as equity transactions, with no effect on net earnings or on other comprehensive income.
At December 31, 2013, BCE owned 44.1% of Bell Aliant, with the remaining 55.9% publicly held. BCE consolidated Bell Aliant as control was achieved through its right to appoint a majority of the board of directors of Bell Aliant. On October 31, 2014, BCE completed its acquisition of all of the issued and outstanding common shares of Bell Aliant that it did not already own (Privatization). Refer to Note 3, Privatization of Bell Aliant for further information.
| c) Revenue recognition |
We recognize revenues from the sale of products or the rendering of services when they are earned; specifically when all the following conditions are met:
- the significant risks and rewards of ownership are transferredto customers and we retain neither continuing managerial involvement nor effective control
- there is clear evidence that an arrangement exists
- the amount of revenues and related costs can be measured reliably
- it is probable that the economic benefits associated with the transaction will flow to the company
In particular, we recognize:
- fees for local, long distance and wireless services when we provide the services
- other fees, such as network access fees, licence fees, hostingfees, maintenance fees and standby fees, over the term of the contract
- subscriber revenues when customers receive the service
118 BCE Inc. 2014 ANNUAL REPORT | |||
NOTES TO CONSOLIDATED FINANCIAL STATEMENTS | |||
- revenues from the sale of equipment when the equipment is delivered and accepted by customers
- revenues on long-term contracts as services are provided,equipment is delivered and accepted, and contract milestones are met
- advertising revenue, net of agency commissions, when advertisements are aired on radio or TV, posted on our website, or appear on the company’s advertising panels and street furniture
We measure revenues at the fair value of the arrangement consideration. We record payments we receive in advance, including upfront non-refundable payments, as deferred revenues until we provide the service or deliver the product to customers. Deferred revenues are presented in Trade payables and other liabilitiesor inOther non-current liabilities on the consolidated statements of financial position (statements of financial position).
Revenues are reduced for customer rebates and allowances and exclude sales and other taxes we collect from our customers.
We expense subscriber acquisition costs when the related services are activated.
MULTIPLE-ELEMENT ARRANGEMENTS
We enter into arrangements that may include the sale of a number of products and services together, primarily to our wireless and business customers. When two or more products or services have value to our customers on a stand-alone basis, we separately account for each product or service according to the methods previously described. The total price to the customer is allocated to each product or service based on its relative fair value. When an amount allocated to a delivered item is contingent upon the delivery of additional items or meeting specified performance conditions, the amount allocated to that delivered item is limited to the non-contingent amount.
If the conditions to account for each product or service separately are not met, we recognize revenues proportionately over the term of the sale agreement.
SUBCONTRACTED SERVICES
We may enter into arrangements with subcontractors and others who provide services to our customers. When we act as the principal in these arrangements, we recognize revenues based on the amounts billed to our customers. Otherwise, we recognize the net amount that we retain as revenues.
| d) Share-based payments |
Our equity-settled share-based payment arrangements include stock options, restricted share units and performance share units (RSUs/ PSUs), deferred share units (DSUs) and employee savings plans (ESPs).
STOCK OPTIONS
We use a fair value-based method to measure the cost of our employee stock options, based on the number of stock options that are expected to vest. Compensation expense is adjusted for subsequent changes in management’s estimate of the number of stock options that are expected to vest.
We credit contributed surplus for stock option expense recognized over the vesting period. When stock options are exercised, we credit share capital for the amount received and the amounts previously credited to contributed surplus.
RSUs/PSUs
For each RSU/PSU granted, we recognize compensation expense equal to the market value of a BCE common share at the date of grant based on the number of RSUs/PSUs expected to vest, recognized over the term of the vesting period, with a corresponding credit to contributed surplus. Additional RSUs/PSUs are issued to reflect dividends declared on the common shares.
Compensation expense is adjusted for subsequent changes in management’s estimate of the number of RSUs/PSUs that are expected to vest. The effect of these changes is recognized in the period of the change. Upon settlement of the RSUs/PSUs, any difference between the cost of shares purchased on the open market and the amount credited to contributed surplus is reflected in the deficit. Vested RSUs/PSUs are settled in BCE common shares, DSUs, or a combination thereof.
DSUs
If compensation is elected to be taken in DSUs we issue DSUs equal to the fair value of the services received. Additional DSUs are issued to reflect dividends declared on the common shares. DSUs are settled in BCE common shares purchased on the open market following the cessation of employment or when a director leaves the board. We credit contributed surplus for the fair value of DSUs at the issue date. Upon settlement of the DSUs, any difference between the cost of shares purchased on the open market and the amount credited to contributed surplus is reflected in the deficit.
ESPs
We recognize our contributions to our ESPs as compensation expense. Employer ESP contributions accrue over a two-year vesting period. We credit contributed surplus for the ESP expense recognized over the vesting period, based on management’s estimate of the accrued contributions that are expected to vest. Upon settlement of the ESPs, any difference between the cost of shares purchased on the open market and the amount credited to contributed surplus is reflected in the deficit.
| e) Income and other taxes |
Current and deferred income tax expense is recognized in the consolidated income statements (income statements), except to the extent that the expense relates to items recognized in other comprehensive income or directly in equity.
A current or non-current tax asset (liability) is the estimated tax receivable (payable) on taxable earnings for the current or past periods. We also record future tax liabilities, which are included in Other non-current liabilities.
BCE Inc. 2014 ANNUAL REPORT 119 | |||
NOTES TO CONSOLIDATED FINANCIAL STATEMENTS | |||
We use the liability method to account for deferred tax assets and liabilities, which arise from:
- temporary differences between the carrying amount of assetsand liabilities recognized in the statements of financial position and their corresponding tax bases
- the carryforward of unused tax losses and credits, to the extent they can be used in the future
Deferred tax assets and liabilities are calculated at the tax rates that are expected to apply when the asset or liability is recovered or settled. Both our current and deferred tax assets and liabilities are calculated using tax rates that have been enacted or substantively enacted at the reporting date.
Deferred taxes are provided on temporary differences arising from investments in subsidiaries, joint arrangements and associates, except where we control the timing of the reversal of the temporary difference and it is probable that the temporary difference will not reverse in the foreseeable future.
Tax liabilities are, where permitted, offset against tax assets within the same taxable entity and tax jurisdiction.
INVESTMENT TAX CREDITS (ITCs), OTHER TAX CREDITS AND GOVERNMENT GRANTS
We recognize ITCs, other tax credits and government grants given on eligible expenditures when it is reasonably assured that they will be realized. They are presented as part of Trade and other receivables when they are expected to be utilized in the next year. We use the cost reduction method to account for ITCs and government grants, under which the credits are applied against the expense or asset to which the ITC or government grant relates.
| f) Cash equivalents |
Cash equivalents are comprised of highly liquid investments with original maturities of three months or less from the date of purchase.
| g) Securitization of trade receivables |
Proceeds on the securitization of trade receivables are recognized as a collateralized borrowing as we do not transfer control and substantially all the risks and rewards of ownership to another entity.
| h) Inventory |
We measure inventory at the lower of cost and net realizable value. Inventory includes all costs to purchase, convert and bring the inventories to their present location and condition. We determine cost using specific identification for major equipment held for resale and the weighted average cost formula for all other inventory. We maintain inventory valuation reserves for inventory that is slow-moving or obsolete, calculated using an inventory ageing analysis.
| i) Property, plant and equipment |
We record property, plant and equipment at historical cost. Historical cost includes expenditures that are attributable directly to the acquisition or construction of the asset, including the purchase cost, and labour.
Borrowing costs are capitalized for qualifying assets if the time to build or develop is in excess of one year.
We initially measure and record asset retirement obligations at management’s best estimate using a present value methodology, adjusted subsequently for any changes in the timing or amount of the cash flows and changes in discount rates. We capitalize asset retirement costs as part of the related assets and amortize them into earnings over time. We also increase the asset retirement obligation and record a corresponding amount in interest expense to reflect the passage of time.
Gains or losses on the sale or retirement of property, plant and equipment are recorded in Other income (expense) in the income statements.
LEASES
Leases of property, plant and equipment are recognized as finance leases when we obtain substantially all the risks and rewards of ownership of the underlying assets. At the inception of the lease, we record an asset together with a corresponding long-term lease liability, at the lower of the fair value of the leased asset or the present value of the minimum future lease payments. If there is reasonable certainty that the lease transfers ownership of the asset to us by the end of the lease term, the asset is amortized over its useful life. Otherwise, the asset is amortized over the shorter of its useful life and the lease term. The long-term lease liability is measured at amortized cost using the effective interest method.
All other leases are classified as operating leases. Operating lease payments are expensed on a straight-line basis over the term of the lease.
120 BCE Inc. 2014 ANNUAL REPORT | |||
NOTES TO CONSOLIDATED FINANCIAL STATEMENTS | |||
| j) Intangible assets |
FINITE-LIFE INTANGIBLE ASSETS
Finite-life intangible assets are carried at cost less accumulated amortization and accumulated impairment losses, if any.
SOFTWARE
We record internal-use software at historical cost. Cost includes expenditures that are attributable directly to the acquisition or development of the software, including the purchase cost, and labour.
Software development costs are capitalized when all the following conditions are met:
- technical feasibility can be demonstrated
- management has the intent and the ability to complete the asset for use or sale
- it is probable that economic benefits will be generated
- costs attributable to the asset can be measured reliably
CUSTOMER RELATIONSHIPS
Customer relationship assets are acquired through business combinations and are recorded at fair value at the date of acquisition.
PROGRAM AND FEATURE FILM RIGHTS
We account for program and feature film rights as intangible assets when these assets are acquired for the purpose of broadcasting. Program and feature film rights, which include producer advances and licence fees paid in advance of receipt of the program or film, are stated at acquisition cost less accumulated amortization and accumulated impairment losses, if any. Programs and feature films under licence agreements are recorded as assets and liabilities for rights acquired and obligations incurred when:
- the company receives a broadcast master and the cost is knownor reasonably determinable for new program and feature film licences
- the licence term commences for licence period extensions or syndicated programs.
Programs and feature films are classified as non-current assets with related liabilities classified as current or non-current, based on the payment terms. Amortization of program and feature film rights is recorded in Operating costs in the income statements.
INDEFINITE-LIFE INTANGIBLE ASSETS
Brand assets, mainly comprised of the Bell and Bell Media brands, and broadcast licences are acquired through business combinations and are recorded at fair value at the date of acquisition, less accumulated impairment losses, if any. Wireless spectrum licences are recorded at acquisition cost, including borrowing costs when the time to build or develop the related network is in excess of one year.
Currently there are no legal, regulatory, competitive or other factors that limit the useful lives of our brands or spectrum licences.
| k) Depreciation and amortization |
We depreciate property, plant and equipment and amortize finite-life intangible assets on a straight-line basis over their estimated useful lives. We review our estimates of useful lives on an annual basis and adjust depreciation and amortization on a prospective basis, if needed. Land and assets under construction or development are not depreciated.
| ESTIMATED USEFUL LIFE | |
Property, plant and equipment | ||
Network infrastructure and equipment | 2 to 50 years | |
Buildings | 5 to 50 years | |
Finite-life intangible assets | ||
Software | 2 to 12 years | |
Customer relationships | 6 to 30 years | |
Program and feature film rights | Up to 5 years |
| l) Investments in associates and joint arrangements |
Our financial statements incorporate our share of the results of our associates and joint ventures using the equity method of accounting, except when the investment is classified as held for sale. Equity income from investments is recorded in Other income (expense) in the income statements.
Investments in associates and joint ventures are recognized initially at cost and adjusted thereafter to include the company’s share of income or loss and comprehensive income on an after-tax basis. Investments are reviewed for impairment by comparing their recoverable amount to their carrying amount.
We recognize our share of the assets, liabilities, revenues and expenses of joint operations in accordance with the related contractual agreements.
BCE Inc. 2014 ANNUAL REPORT 121 | |||
NOTES TO CONSOLIDATED FINANCIAL STATEMENTS | |||
| m) Business combinations and goodwill |
Business combinations are accounted for using the acquisition method. The consideration transferred in a business combination is measured at fair value at the date of acquisition. Acquisition-related transaction costs are expensed as incurred.
Identifiable assets and liabilities, including intangible assets, of acquired businesses are recorded at their fair values at the date of acquisition. When we acquire control of a business, any previously-held equity interest also is remeasured to fair value. The excess of the purchase consideration and any previously-held equity interest over the fair value of identifiable net assets acquired is goodwill. If the fair value of identifiable net assets acquired exceeds the purchase consideration and any previously-held equity interest, the difference is recognized in earnings immediately as a bargain purchase gain.
Changes in our ownership interest in subsidiaries that do not result in a loss of control are accounted for as equity transactions. Any difference between the change in the carrying amount of non-controlling interest (NCI) and the consideration paid or received is attributed to owner’s equity.
| n) Impairment of non-financial assets |
Goodwill and indefinite-life intangible assets are tested for impairment annually or when there is an indication that the asset may be impaired. Property, plant and equipment and finite-life intangible assets are tested for impairment if events or changes in circumstances, assessed quarterly, indicate that their carrying amount may not be recoverable. For the purpose of impairment testing, assets other than goodwill are grouped at the lowest level for which there are separately identifiable cash inflows.
Impairment losses are recognized and measured as the excess of the carrying value of the assets over their recoverable amount. An asset’s recoverable amount is the higher of its fair value less costs of disposal and its value in use. Previously recognized impairment losses, other than those attributable to goodwill, are reviewed for possible reversal at each reporting date and, if the asset’s recoverable amount has increased, all or a portion of the impairment is reversed.
GOODWILL IMPAIRMENT TESTING
We perform an annual test for goodwill impairment in the fourth quarter for each of our cash generating units (CGUs) or groups of CGUs to which goodwill is allocated and whenever there is an indication that goodwill might be impaired.
A CGU is the smallest identifiable group of assets that generates cash inflows that are independent of the cash inflows from other assets or groups of assets.
We identify any potential impairment by comparing the carrying value of a CGU or groups of CGU to its recoverable amount. The recoverable amount of a CGU or group of CGUs is the higher of its fair value less costs of disposal and its value in use. Fair value less costs of disposal is based on estimates of discounted future cash flows or other valuation methods. Cash flows are projected based on past experience, actual operating results and business plans. When the recoverable amount of a CGU or group of CGUs is less than its carrying value, the recoverable amount is determined for its identifiable assets and liabilities. The excess of the recoverable amount of the CGU or group of CGUs over the total of the amounts assigned to its assets and liabilities is the recoverable amount of goodwill.
An impairment charge is deducted from earnings for any excess of the carrying value of goodwill over its recoverable amount. For purposes of impairment testing of goodwill, BCE’s CGUs or groups of CGUs correspond to our reporting segments as disclosed in Note 5, Segmented information.
| o) Financial instruments |
AVAILABLE-FOR-SALE (AFS) FINANCIAL ASSETS
Our portfolio investments in equity securities are classified as AFS and are presented in our statements of financial position as Other non-current assets. They have been designated as such based on management’s intentions or because they are not classified in any other categories. These securities are recorded at fair value on the date of acquisition, including related transaction costs, and are adjusted to fair value at each reporting date. The corresponding unrealized gains and losses are recorded in other comprehensive income and are reclassified toOther income (expense) in the income statements when realized or when an impairment is determined.
TRADE AND OTHER RECEIVABLES
Trade and other receivables, which include trade receivables and other short-term receivables, are measured at amortized cost using the effective interest method, net of any allowance for doubtful accounts. An allowance for doubtful accounts is established based on individually significant exposures or on historical trends. Factors considered when establishing an allowance include current economic conditions, historical information and the reason for the delay in payment. Amounts considered uncollectible are written off.
OTHER FINANCIAL LIABILITIES
Other financial liabilities, which include trade payables and accruals, compensation payable, obligations imposed by the Canadian Radio-television and Telecommunications Commission (CRTC), interest payable and long-term debt, are recorded at amortized cost using the effective interest method.
COSTS OF ISSUING DEBT AND EQUITY
The cost of issuing debt is included as part of long-term debt and is accounted for at amortized cost using the effective interest method. The cost of issuing equity is reflected in the consolidated statements of changes in equity as a charge to the deficit.
122 BCE Inc. 2014 ANNUAL REPORT | |||
NOTES TO CONSOLIDATED FINANCIAL STATEMENTS | |||
| p) Derivative financial instruments |
We use derivative financial instruments to manage interest rate risk, foreign currency risk and cash flow exposures related to share-based payment plans, capital expenditures, long-term debt instruments and purchase commitments. We do not use derivative financial instruments for speculative or trading purposes.
HEDGE ACCOUNTING
To qualify for hedge accounting, we document the relationship between the derivative and the related identified risk exposure and our risk management objective and strategy. This includes associating each derivative to a specific asset or liability, a specific firm commitment, or a specific anticipated transaction.
We assess the effectiveness of a derivative in managing an identified risk exposure when hedge accounting is initially applied, and on an ongoing basis thereafter. If a hedge becomes ineffective, we stop using hedge accounting.
FAIR VALUE HEDGES
Our fair value hedges consist of interest rate swaps used to manage the effect of changes in interest rates relating to fixed-rate long-term debt. These swaps involve exchanging interest payments without exchanging the notional amount on which the payments are based. We record the exchange of payments as an adjustment to interest expense on the hedged debt. We include the related net receivable or payable from counterparties in Other current assetsorTrade payables and other liabilities for swaps due within one year and in Other non-current assets orOther non-current liabilitiesfor swaps that have a maturity of more than one year. Changes in the fair value of these derivatives and the related long-term debt are recognized inOther income (expense) in the income statements and offset, unless a portion of the hedging relationship is ineffective.
CASH FLOW HEDGES
Our cash flow hedges are used to mitigate foreign currency risk on certain long-term debt instruments and purchase commitments, as well as interest rate risk related to future debt issuances. We use foreign currency forward contracts to manage the exposure to anticipated transactions denominated in foreign currencies. Changes in the fair value of these derivatives are recognized in our consolidated statements of comprehensive income (statements of comprehensive income), except for any ineffective portion, which is recognized immediately in earnings. Realized gains and losses in Accumulated other comprehensive income (loss) are reclassified to the income statements in the same periods as the corresponding hedged items are recognized in earnings. Cash flow hedges that mature within one year are included inOther current assetsorTrade payables and other liabilities, whereas hedges that have a maturity of more than one year are included inOther non-current assets or Other non-current liabilities.
We use cross currency basis swaps to manage our U.S. dollar borrowings under our unsecured committed term credit facility. Changes in the fair value of these derivatives and the related credit facility are recognized in Other income (expense) in the income statements and offset, unless a portion of the hedging relationship is ineffective.
DERIVATIVES USED AS ECONOMIC HEDGES
Derivatives used to manage cash flow exposures related to share-based payment plans and capital expenditures are marked to market each reporting period because they do not qualify for hedge accounting. The changes in fair value of these financial assets and liabilities are recorded in Other income (expense) in the income statements.
| q) Post-employment benefit plans |
DEFINED BENEFIT (DB) AND OTHER POST-EMPLOYMENT BENEFIT (OPEB) PLANS
We maintain DB pension plans that provide pension benefits for certain employees. Benefits are based on the employee’s length of service and average rate of pay during the highest paid consecutive five years of service. Most employees are not required to contribute to the plans. The plans provide cost of living adjustments to help protect the income of retired employees against inflation.
We are responsible for adequately funding our DB pension plans. We make contributions to them based on various actuarial cost methods permitted by pension regulatory bodies. Contributions reflect actuarial assumptions about future investment returns, salary projections and future service.
We provide OPEBs to some of our employees, including:
- healthcare and life insurance benefits during retirement,which are being phased out over a ten-year period ending on December 31, 2016. We do not fund most of these OPEB plans.
- other benefits, including workers’ compensation and medicalbenefits to former or inactive employees, their beneficiariesand dependants, from the time their employment ends until their retirement starts, under certain circumstances.
We accrue our obligations and related costs under post-employment benefit plans, net of the fair value of the benefit plan assets. Pension and OPEB costs are determined using:
- the projected unit credit method, prorated on years of service, which takes into account future pay levels
- a discount rate based on market interest rates of high-qualitycorporate bonds with maturities that match the timing of benefits expected to be paid under the plans
- management’s best estimate of pay increases, retirement ages of employees, expected healthcare costs and life expectancy
We value post-employment benefit plan assets at fair value using current market values.
Post-employment benefit plans current service cost is included in operating costs. Interest on our post-employment benefit obligations is recognized in net earnings and represents the accretion of interest on the net obligations under the post-employment benefit plans. The interest rate is based on market conditions that existed at the beginning of the year. Actuarial gains and losses for all post-employment benefit plans are recorded in other comprehensive income in the period in which they occur and are recognized immediately in the deficit.
BCE Inc. 2014 ANNUAL REPORT 123 | |||
NOTES TO CONSOLIDATED FINANCIAL STATEMENTS | |||
December 31 is the measurement date for our significant post-employment benefit plans. Our actuaries perform a valuation at least every three years to determine the actuarial present value of the accrued DB pension plan and OPEB obligations. The most recent actuarial valuation of our significant pension plans was December 31, 2013.
DEFINED CONTRIBUTION (DC) PENSION PLANS
We maintain DC pension plans that provide certain employees with benefits. Under these plans, we are responsible for contributing a predetermined amount to an employee’s retirement savings, based on a percentage of the employee’s salary.
We recognize a post-employment benefit plans service cost for DC pension plans when the employee provides service to the company, essentially coinciding with our cash contributions.
Generally, new employees can participate only in the DC pension plans.
| r) Provisions |
Provisions are recognized when all the following conditions are met:
- the company has a present legal or constructive obligation based on past events
- it is probable that an outflow of economic resources will be required to settle the obligation
- the amount can be reasonably estimated
Provisions are measured at the present value of the estimated expenditures expected to settle the obligation, if the effect of the time value of money is material. The present value is determined using current market assessments of the discount rate and risks specific to the obligation. The obligation increases as a result of the passage of time, resulting in interest expense.
| s) Estimates and key judgements |
When preparing financial statements, management makes estimates and judgements relating to:
- reported amounts of revenues and expenses
- reported amounts of assets and liabilities
- disclosure of contingent assets and liabilities
We base our estimates on a number of factors, including historical experience, current events and actions that the company may undertake in the future, and other assumptions that we believe are reasonable under the circumstances. By their nature, these estimates and judgements are subject to measurement uncertainty and actual results could differ. Our more significant estimates and judgements are described below.
ESTIMATES
USEFUL LIVES OF PROPERTY, PLANT AND EQUIPMENT AND FINITE-LIFE INTANGIBLE ASSETS
Property, plant and equipment represent a significant proportion of our total assets. Changes in technology or our intended use of these assets, as well as changes in business prospects or economic and industry factors, may cause the estimated useful lives of these assets to change.
POST-EMPLOYMENT BENEFIT PLANS
The amounts reported in the financial statements relating to DB pension plans and OPEBs are determined using actuarial calculations that are based on several assumptions.
The actuarial valuation uses management’s assumptions for, among other things, the discount rate, life expectancy, the rate of compensation increase, trends in healthcare costs and expected average remaining years of service of employees.
The most significant assumptions used to calculate the net post-employment benefit plans cost are the discount rate and life expectancy.
The discount rate is based on the yield on long-term, high-quality corporate fixed income investments, with maturities matching the estimated cash flows of the post-employment benefit plans. Life expectancy is based on publicly available Canadian mortality tables and is adjusted for the company’s specific experience.
A lower discount rate and a higher life expectancy result in a higher net post-employment benefit obligation and a higher current service cost.
IMPAIRMENT OF NON-FINANCIAL ASSETS
We make a number of estimates when calculating recoverable amounts using discounted future cash flows or other valuation methods to test for impairment. These estimates include the assumed growth rates for future cash flows, the number of years used in the cash flow model, and the discount rate.
DEFERRED TAXES
The amount of deferred tax assets is estimated with consideration given to the timing, sources and amounts of future taxable income.
FAIR VALUE OF FINANCIAL INSTRUMENTS
Certain financial instruments, such as investments in equity securities, derivative financial instruments and certain elements of borrowings, are carried in the statements of financial position at fair value, with changes in fair value reflected in the income statements and the statements of comprehensive income. Fair values are estimated by reference to published price quotations or by using other valuation techniques that may include inputs that are not based on observable market data, such as discounted cash flows.
CONTINGENCIES
We become involved in various litigation matters as a part of our business. Pending litigations represent a potential cost to our business. We estimate the amount of a loss by analyzing potential outcomes and assuming various litigation and settlement strategies, based on information that is available at the time.
124 BCE Inc. 2014 ANNUAL REPORT | |||
NOTES TO CONSOLIDATED FINANCIAL STATEMENTS | |||
ONEROUS CONTRACTS
A provision for onerous contracts is recognized when the unavoidable costs of meeting our obligations under a contract exceed the expected benefits to be received from a contract. The provision is measured at the present value of the lower of the expected cost of terminating the contract and the expected net cost of completing the contract.
JUDGEMENTS
POST-EMPLOYMENT BENEFIT PLANS
The determination of the discount rate used to value our post-employment benefit obligations requires judgement. The rate is set by reference to market yields of high-quality corporate bonds at the beginning of each fiscal year. Significant judgement is required when setting the criteria for bonds to be included in the population from which the yield curve is derived. The most significant criteria considered for the selection of bonds include the size of the issue and credit quality, along with the identification of outliers, which are excluded.
INCOME TAXES
The calculation of income taxes requires judgement in interpreting tax rules and regulations. There are transactions and calculations for which the ultimate tax determination is uncertain. Our tax filings are also subject to audits, the outcome of which could change the amount of current and deferred tax assets and liabilities. Management believes that it has sufficient amounts accrued for outstanding tax matters based on information that currently is available.
Management judgement is used to determine the amounts of deferred tax assets and liabilities and future tax liabilities to be recognized. In particular, judgement is required when assessing the timing of the reversal of temporary differences to which future income tax rates are applied.
MULTIPLE ELEMENT ARRANGEMENTS
Determining the amounts of revenue to be recognized for multiple element arrangements requires judgement to establish the separately identifiable components and the allocation of the total price between those components.
CASH GENERATING UNITS
The determination of CGUs or groups of CGUs for the purpose of annual impairment testing requires judgement.
CONTINGENCIES
The determination of whether a loss is probable from litigation and whether an outflow of resources is likely requires judgement.
| t) Change in accounting estimate |
As part of our ongoing annual review of property, plant and equipment and finite-life intangible assets, and to better reflect their useful lives, we increased the lives of certain information technology (IT) software assets from 5 to 7 years and reduced the lives of certain network assets, including our code division multiple access (CDMA) network. The changes have been applied prospectively effective July 1, 2014 and did not have a significant impact on our financial statements.
| u) Adoption of new or amended accounting standards |
As required, effective January 1, 2014, we adopted the following new or amended accounting standards and interpretations on a retrospective basis, none of which had a significant impact on our financial statements.
| STANDARD | DESCRIPTION | IMPACT |
Amendments to International Accounting Standard (IAS) 36 – Impairment of Assets | Provides guidance on recoverable amount disclosures for non-financial assets. | This amendment did not have a significant impact on our financial statements. |
Amendments to IAS 39 – Financial Instruments: Recognition and Measurement | Provides guidance on novation of over-the-counter derivatives and continued designation for hedge accounting. | This amendment did not have a significant impact on our financial statements. |
Amendments to IAS 32 – Financial Instruments: Presentation | Clarifies the application of the offsetting requirements of financial assets and financial liabilities. | This amendment did not have a significant impact on our financial statements. |
International Financial Reporting Interpretations Committee (IFRIC) 21 – Levies | Provides guidance on when to recognize a liability for a levy imposed by a government, both for levies that are accounted for in accordance with IAS 37 – Provisions, Contingent Liabilities and Contingent Assets, and those where the timing and amount of the levy is certain. | IFRIC 21 did not have a significant impact on our financial statements. |
BCE Inc. 2014 ANNUAL REPORT 125 | |||
NOTES TO CONSOLIDATED FINANCIAL STATEMENTS | |||
| v) Future changes to accounting standards |
The following new or amended standards issued by the IASB have an effective date after December 31, 2014 and have not yet been adopted by BCE.
| STANDARD | DESCRIPTION | IMPACT | EFFECTIVE DATE |
IFRS 9 – Financial Instruments | Sets out the requirements for recognizing and measuring financial assets, financial liabilities and some contracts to buy and sell non-financial items. IFRS 9 replaces IAS 39 – Financial Instruments: Recognition and Measurement. The new standard establishes a single classification and measurement approach for financial assets that reflects the business model in which they are managed and their cash flow characteristics. It also provides guidance on an entity’s own credit risk relating to financial liabilities and has modified the hedge accounting model to better link the economics of risk management with its accounting treatment. Additional disclosures will also be required under the new standard. | We are currently evaluating the impact of IFRS 9 on our financial statements. | Annual periods beginning on or after January 1, 2018, with early adoption permitted. |
Amendments to IAS 16 – Property, Plant and Equipment and IAS 38 – Intangible Assets | Clarifies that a revenue-based approach to calculate depreciation and amortization generally is not appropriate as it does not reflect the consumption of the economic benefits embodied in the related asset. | The amendments to IAS 16 and IAS 38 are not expected to have a significant impact on our financial statements. | Annual periods beginning on or after January 1, 2016, applied prospectively. |
Amendments to IFRS 11 – Joint Arrangements | Provides guidance on the accounting for acquisitions of interests in joint operations in which the activity constitutes a business, as defined in IFRS 3 – Business Combinations. The amended standard requires the acquirer to apply all of the principles on accounting for business combinations in IFRS 3 and other IFRSs except for any principles that conflict with IFRS 11. | The amendments to IFRS 11 are not expected to have a significant impact on our financial statements. | Annual periods beginning on or after January 1, 2016, applied prospectively. |
IFRS 15 – Revenue from Contracts with Customers | Establishes principles to record revenues from contracts for the sale of goods or services, unless the contracts are in the scope of IAS 17 – Leases or other IFRSs. Under IFRS 15, revenue is recognized at an amount that reflects the expected consideration receivable in exchange for transferring goods or services to a customer, applying the following five steps: 1. Identify the contract with a customer 2. Identify the performance obligations in the contract 3. Determine the transaction price 4. Allocate the transaction price to the performance obligations in the contract 5. Recognize revenue when (or as) the entity satisfies a performance obligation The new standard also provides guidance relating to contract costs and for the measurement and recognition of gains and losses on the sale of certain non-financial assets such as property and equipment. Additional disclosures will also be required under the new standard. | IFRS 15 will affect how we account for revenues and contract costs for Bell Wireless and our other segments. We are currently evaluating the impact of IFRS 15 on our financial statements. | Annual periods beginning on or after January 1, 2017, using either a full retrospective approach for all periods presented in the period of adoption or a modified retrospective approach. |
| Note 3 Privatization of Bell Aliant |
On July 23, 2014, BCE announced its offer to acquire all of the issued and outstanding common shares of Bell Aliant that it did not already own for a total consideration of approximately $3.95 billion. BCE already controlled Bell Aliant which provides local telephone, long distance, Internet, data, TV, wireless, home security and value-added business solutions to residential and business customers in the Atlantic provinces and in rural and regional areas of Ontario and Québec. On the same day, BCE also announced its offer to exchange all of the issued and outstanding preferred shares of Bell Aliant Preferred Equity Inc. (Prefco) for newly issued First Preferred Shares of BCE, with the same financial terms as the existing Prefco preferred shares (Preferred Share Exchange).
The Privatization was completed on October 31, 2014 and the Preferred Share Exchange was completed on November 1, 2014. The Privatization is expected to simplify BCE’s corporate structure and increase overall operating and capital investment efficiencies, while supporting BCE’s broadband investment strategy and dividend growth objective.
126 BCE Inc. 2014 ANNUAL REPORT | |||
NOTES TO CONSOLIDATED FINANCIAL STATEMENTS | |||
As BCE already consolidated the financial results of Bell Aliant, the Privatization was accounted for as an equity transaction. The following table summarizes the impacts of the Privatization on our consolidated statement of financial position.
FOR THE YEAR ENDED DECEMBER 31 | NOTE | 2014 | ||
Consideration | ||||
Issuance of 60.9 million BCE common shares(1) | 25 | 2,928 | ||
Cash | 989 | |||
Exchange of Prefco preferred shares for BCE First Preferred Shares(1) | 25 | 609 | ||
Total | 4,526 | |||
Allocated to: | ||||
Carrying value of Bell Aliant non-controlling interest | 877 | |||
Contributed surplus | 25 | 1,499 | ||
Accumulated other comprehensive income | 7 | |||
Deficit | 2,143 | |||
Total | 4,526 |
| (1) | The stated capital for the BCE common and First Preferred Shares was recorded at fair value on the date of issuance. |
The following table outlines the BCE First Preferred Shares for which the existing Prefco preferred shares were exchanged as part of the Preferred Share Exchange.
STATED | |||||||||||||||
NUMBER OF SHARES | CAPITAL | ||||||||||||||
| ANNUAL |
| ||||||||||||||
| DIVIDEND | CONVERTIBLE | REDEMPTION | ISSUED AND |
| |||||||||||
| SERIES | RATE | INTO | CONVERSION DATE | REDEMPTION DATE | (1) | PRICE | AUTHORIZED | OUTSTANDING |
| ||||||
| AM | 4.85 | % | AN | March 31, 2016 | March 31, 2016 | $25.00 | 30,000,000 | 11,500,000 | 263 | ||||||
| AO | 4.55 | % | AP | March 31, 2017 | March 31, 2017 | $25.00 | 30,000,000 | 4,600,000 | 118 | ||||||
| AQ | 4.25 | % | AR | September 30, 2018 | September 30, 2018 | $25.00 | 30,000,000 | 9,200,000 | 228 | ||||||
609 | |||||||||||||||
| (1) | BCE may redeem each of these series of preferred shares on the applicable redemption date and every five years after that date. |
Additionally in 2014, $35 million was charged to the deficit to record the transaction costs incurred related to the Privatization. These costs include financial advisory, filing and legal fees.
| Note 4 Acquisitions |
Glentel Inc. (Glentel) acquisition
On November 28, 2014, BCE announced the signing of a definitive agreement to acquire all of the issued and outstanding shares of Glentel for a total consideration of $594 million. The total transaction is valued at approximately $670 million, including net debt and non-controlling interest. The transaction consideration will consist of a combination of 50% in cash, to be funded from available liquidity, and 50% in BCE common shares. Glentel shareholder approval was obtained at a special meeting of shareholders held on January 12, 2015, and court approval was obtained on January 14, 2015. The transaction is expected to close in the spring of 2015, subject to closing conditions, including regulatory approvals. Glentel is a Canadian-based dual-carrier, multi-brand mobile products distributor. The transaction will enhance Bell’s strategy to accelerate wireless and improve customer service.
On December 24, 2014, BCE announced that following the closing of the Glentel acquisition, it will divest 50% of its ownership interest in Glentel to Rogers Communications Inc. (Rogers). Rogers will pay BCE approximately $392 million in cash. In addition, Rogers will pay 50% of any additional equity contribution made by BCE after the closing of the Glentel acquisition to repay Glentel outstanding debt. The transaction with Rogers is expected to close shortly after the acquisition of Glentel by BCE, subject to customary closing conditions, including regulatory approvals.
BCE Inc. 2014 ANNUAL REPORT 127 | |||
NOTES TO CONSOLIDATED FINANCIAL STATEMENTS | |||
| Astral acquisition |
On July 5, 2013, BCE acquired 100% of the issued and outstanding shares of Astral Media Inc. (Astral). Astral is a media company that operates specialty and pay TV channels, radio stations and digital media properties across Canada and provides out-of-home advertising services. BCE acquired Astral to enhance our competitive position in French-language broadcasting in Québec, control content costs, and increase opportunities for cross-platform innovation and advertising packages spanning digital, TV, radio and out-of-home advertising. Astral’s results are included in our Bell Media segment.
The purchase price allocation was completed in 2014 and includes certain estimates. There has been no significant change to the purchase price allocation as disclosed in Note 4, Acquisition of Astral in our consolidated financial statements for the year ended December 31, 2013. The goodwill arising from the acquisition of Astral was allocated to our Bell Media group of CGUs.
As part of its approval of the Astral acquisition, the CRTC ordered BCE to spend $247 million in new benefits for French- and English-language TV, radio and film content development, support for emerging Canadian musical talent, training and professional development for Canadian media, and new consumer participation initiatives. The present value of this tangible benefits obligation, amounting to $245 million, was recorded as an acquisition cost in Severance, acquisition and other costsin the income statement as disclosed in Note 7,Severance, acquisition and other costs. Total acquisition costs relating to Astral, including the tangible benefits obligation, amounted to $26 million and $266 million for the years ended December 31, 2014 and 2013, respectively.
| Assets held for sale |
As a result of BCE’s acquisition of Astral and consistent with the CRTC’s Common Ownership Policy for radio, BCE was required to sell ten Bell Media and Astral English-language radio stations. BCE also was required to sell eleven Astral TV services in order to comply with conditions attached to the Competition Bureau and CRTC approvals.
As required by the CRTC and the Competition Bureau, the management and control of the assets to be divested was transferred to an independent trustee pending their sale to third parties. These assets were classified as Assets held for sale in the statement of financial position and were recorded at their net realizable value.
In 2014, we completed the sale of the radio stations and TV services for total proceeds of $720 million.
| Note 5 Segmented information |
The accounting policies used in our segment reporting are the same as those we describe in Note 2, Significant accounting policies. Our earnings are reported in four segments:Bell Wireless,Bell Wireline,Bell MediaandBell Aliant. Our segments reflect how we manage our business and how we classify our operations for planning and measuring performance. Accordingly, we operate and manage our segments as strategic business units organized by products and services. Segments negotiate sales with each other as if they were unrelated parties.
We measure the performance of each segment based on segment profit, which is equal to operating revenues less operating costs for the segment. We report severance, acquisition and other costs and depreciation and amortization by segment for external reporting purposes. Substantially all of our finance costs and other income (expense) are managed on a corporate basis and, accordingly, are not reflected in segment results.
Our operations and virtually all of our assets are located in Canada. Below is a description of our segments at December 31, 2014:
Our Bell Wireless segment provides wireless voice and data communication products and services to Bell’s residential, small and medium-sized business and large enterprise customers across Canada.
Our Bell Wireline segment provides data, including Internet access and TV, local telephone, long distance, as well as other communications services and products to Bell’s residential, small and medium-sized business and large enterprise customers, primarily in the urban areas of Ontario and Québec. In addition, this segment includes our wholesale business, which buys and sells local telephone, long distance, data and other services from or to resellers and other carriers.
Our Bell Media segment provides conventional, specialty and pay TV, digital media, and radio broadcasting services to customers across Canada and out-of-home advertising services. On July 5, 2013, BCE acquired 100% of the issued and outstanding shares of Astral. The results of Astral are included in our Bell Media segment from the date of acquisition.
Our Bell Aliant segment provides Internet, data, TV, local telephone, long distance, wireless, home security and value-added business solutions to residential and business customers in the Atlantic provinces and in rural and regional areas of Ontario and Québec.
128 BCE Inc. 2014 ANNUAL REPORT | |||
NOTES TO CONSOLIDATED FINANCIAL STATEMENTS | |||
| Segmented information |
FOR THE YEAR ENDED DECEMBER 31, 2014 | INTER- | INTER- | ||||||||||||||||
| SEGMENT | SEGMENT | |||||||||||||||||
| BELL | BELL | BELL | ELIMINA- | BELL | ELIMINA- | |||||||||||||
| NOTE | WIRELESS | WIRELINE | MEDIA | TIONS | BELL | ALIANT | TIONS | BCE | ||||||||||
Operating revenues | ||||||||||||||||||
External customers | 6,188 | 9,687 | 2,642 | – | 18,517 | 2,525 | – | 21,042 | ||||||||||
Inter-segment | 53 | 353 | 295 | (484 | ) | 217 | 232 | (449 | ) | – | ||||||||
Total operating revenues | 6,241 | 10,040 | 2,937 | (484 | ) | 18,734 | 2,757 | (449 | ) | 21,042 | ||||||||
Operating costs | 6 | (3,677 | ) | (6,272 | ) | (2,203 | ) | 484 | (11,668 | ) | (1,520 | ) | 449 | (12,739 | ) | |||
Segment profit(1) | 2,564 | 3,768 | 734 | – | 7,066 | 1,237 | – | 8,303 | ||||||||||
Severance, acquisition and other costs | 7 | (5 | ) | (78 | ) | (46 | ) | – | (129 | ) | (87 | ) | – | (216 | ) | |||
Depreciation and amortization | 14,15 | (545 | ) | (2,254 | ) | (126 | ) | – | (2,925 | ) | (527 | ) | – | (3,452 | ) | |||
Finance costs | ||||||||||||||||||
Interest expense | 8 | (929 | ) | |||||||||||||||
Interest on post-employment benefit obligations | 22 | (101 | ) | |||||||||||||||
Other income | 9 | 42 | ||||||||||||||||
Income taxes | 10 | (929 | ) | |||||||||||||||
Net earnings | 2,718 | |||||||||||||||||
Goodwill | 18 | 2,302 | 2,521 | 2,592 | – | 7,415 | 970 | – | 8,385 | |||||||||
Indefinite-life intangible assets | 15 | 3,063 | 1,315 | 2,680 | – | 7,058 | 340 | – | 7,398 | |||||||||
Capital expenditures | 671 | 2,334 | 137 | – | 3,142 | 575 | – | 3,717 |
| (1) | The chief operating decision maker uses primarily one measure of profit to make decisions and assess performance, being operating revenues less operating costs. |
FOR THE YEAR ENDED DECEMBER 31, 2013 | INTER- | INTER- | ||||||||||||||||
| SEGMENT | SEGMENT | |||||||||||||||||
| BELL | BELL | BELL | ELIMINA- | BELL | ELIMINA- | |||||||||||||
| NOTE | WIRELESS | WIRELINE | MEDIA | TIONS | BELL | ALIANT | TIONS | BCE | ||||||||||
Operating revenues | ||||||||||||||||||
External customers | 5,794 | 9,754 | 2,342 | – | 17,890 | 2,510 | – | 20,400 | ||||||||||
Inter-segment | 55 | 343 | 215 | (394 | ) | 219 | 249 | (468 | ) | – | ||||||||
Total operating revenues | 5,849 | 10,097 | 2,557 | (394 | ) | 18,109 | 2,759 | (468 | ) | 20,400 | ||||||||
Operating costs | 6 | (3,509 | ) | (6,303 | ) | (1,874 | ) | 394 | (11,292 | ) | (1,487 | ) | 468 | (12,311 | ) | |||
Segment profit(1) | 2,340 | 3,794 | 683 | – | 6,817 | 1,272 | – | 8,089 | ||||||||||
Severance, acquisition and other costs | 7 | (2 | ) | (110 | ) | (283 | ) | – | (395 | ) | (11 | ) | – | (406 | ) | |||
Depreciation and amortization | 14,15 | (479 | ) | (2,248 | ) | (110 | ) | – | (2,837 | ) | (543 | ) | – | (3,380 | ) | |||
Finance costs | ||||||||||||||||||
Interest expense | 8 | (931 | ) | |||||||||||||||
Interest on post-employment benefit obligations | 22 | (150 | ) | |||||||||||||||
Other expense | 9 | (6 | ) | |||||||||||||||
Income taxes | 10 | (828 | ) | |||||||||||||||
Net earnings | 2,388 | |||||||||||||||||
Goodwill | 18 | 2,302 | 2,521 | 2,588 | – | 7,411 | 970 | – | 8,381 | |||||||||
Indefinite-life intangible assets | 15 | 2,502 | 1,315 | 2,708 | – | 6,525 | 340 | – | 6,865 | |||||||||
Capital expenditures | 639 | 2,247 | 115 | – | 3,001 | 570 | – | 3,571 |
| (1) | The chief operating decision maker uses primarily one measure of profit to make decisions and assess performance, being operating revenues less operating costs. |
BCE Inc. 2014 ANNUAL REPORT 129 | |||
NOTES TO CONSOLIDATED FINANCIAL STATEMENTS | |||
| Revenues by product |
FOR THE YEAR ENDED DECEMBER 31 | 2014 | 2013 | ||
Wireless | 5,705 | 5,362 | ||
Data | 5,991 | 5,828 | ||
Local and access | 2,364 | 2,497 | ||
Long distance | 668 | 722 | ||
Media | 2,642 | 2,342 | ||
Equipment and other | 1,147 | 1,139 | ||
Total external revenues | 18,517 | 17,890 | ||
Inter-segment revenues | 217 | 219 | ||
Bell | 18,734 | 18,109 | ||
Bell Aliant | 2,757 | 2,759 | ||
Inter-segment eliminations | (449 | ) | (468 | ) |
BCE | 21,042 | 20,400 |
| Note 6 Operating costs |
FOR THE YEAR ENDED DECEMBER 31 | NOTE | 2014 | 2013 | |||
Labour costs | ||||||
Wages, salaries and related taxes and benefits(1) | (4,351 | ) | (4,232 | ) | ||
Post-employment benefit plans service cost (net of capitalized amounts) | 22 | (276 | ) | (292 | ) | |
Other labour costs(1)(2) | (957 | ) | (969 | ) | ||
Less: | ||||||
Capitalized labour(1) | 1,002 | 960 | ||||
Total labour costs | (4,582 | ) | (4,533 | ) | ||
Cost of revenues(1)(3) | (6,265 | ) | (5,956 | ) | ||
Other operating costs(1)(4) | (1,892 | ) | (1,822 | ) | ||
Operating costs | (12,739 | ) | (12,311 | ) |
| (1) | We have reclassified amounts for the prior year to make them consistent with the presentation for the current year. |
| (2) | Other labour costs include contractor and outsourcing costs. |
| (3) | Cost of revenues includes costs of wireless devices and other equipment sold, network and content costs, and payments to other carriers. |
| (4) | Other operating costs include marketing, advertising and sales commission costs, bad debt expense, taxes other than income taxes, information technology costs, professional service fees and rent. |
Research and development expenses of $167 million and $201 million are included in operating costs for 2014 and 2013, respectively.
| Note 7 Severance, acquisition and other costs |
FOR THE YEAR ENDED DECEMBER 31 | 2014 | 2013 | ||
Severance | (82 | ) | (116 | ) |
Acquisition and other | (134 | ) | (290 | ) |
Total severance, acquisition and other costs | (216 | ) | (406 | ) |
130 BCE Inc. 2014 ANNUAL REPORT | |||
NOTES TO CONSOLIDATED FINANCIAL STATEMENTS | |||
| Acquisition and other costs |
Acquisition and other costs consist of transaction costs, such as legal and financial advisory fees, related to completed or potential acquisitions, employee severance costs related to the purchase of a business and the costs to integrate acquired companies into Bell’s operations, when the integration costs are significant. Acquisition and other costs also include severance and integration costs relating to the Privatization of Bell Aliant. Refer to Note 3, Privatization of Bell Aliant.
Acquisition and other costs for the year ended December 31, 2013 include $230 million relating to the CRTC tangible benefits obligation as part of our acquisition of Astral described in Note 4, Acquisitions.
| Note 8 Interest expense |
FOR THE YEAR ENDED DECEMBER 31 | 2014 | 2013 | ||
Interest expense on long-term debt | (865 | ) | (850 | ) |
Interest expense on other debt | (97 | ) | (97 | ) |
Capitalized interest | 33 | 16 | ||
Total interest expense | (929 | ) | (931 | ) |
Interest expense on long-term debt includes interest on finance leases of $166 million and $174 million for 2014 and 2013, respectively.
Capitalized interest was calculated using an average rate of 4.49% and 5.03% for 2014 and 2013, respectively, which represents the weighted average interest rate on our outstanding long-term debt.
| Note 9 Other income (expense) |
FOR THE YEAR ENDED DECEMBER 31 | NOTE | 2014 | 2013 | |||
Net mark-to-market gains on derivatives used as economic hedges | 134 | 94 | ||||
Dividend income from assets held for sale | 42 | – | ||||
Gains (losses) on investments | 10 | (7 | ) | |||
Impairment of assets | 14,15 | (105 | ) | (15 | ) | |
Losses on disposal/retirement of software, plant and equipment | (51 | ) | (44 | ) | ||
Early debt redemption costs | 21 | (29 | ) | (55 | ) | |
Equity losses from investments in associates and joint ventures | 16 | (12 | ) | (32 | ) | |
Pension surplus distribution | – | 36 | ||||
Other | 53 | 17 | ||||
Other income (expense) | 42 | (6 | ) |
| Impairment of assets |
In 2014, we recorded an impairment charge of $105 million relating mainly to our Conventional TV CGU within our Bell Media segment, of which $67 million was allocated to property, plant and equipment and $38 million to indefinite-life intangible assets. The impairment resulted from a softness in the overall Canadian TV advertising market and higher TV content costs. The charge was determined by comparing the carrying value of the CGU to its fair value less costs of disposal, based on the expected future discounted cash flows for the period of January 1, 2015 to December 31, 2017 using a discount rate of 9.5% and a perpetuity growth rate of nil. The carrying value of our Conventional TV CGU was $327 million at December 31, 2014.
| Equity investees |
In 2014 and 2013, we recorded equity losses of $16 million and $25 million, respectively, representing our share of goodwill impairment charges recognized by an equity investee. The charge recorded in 2013 also related to a write-down of customer relationship intangibles.
BCE Inc. 2014 ANNUAL REPORT 131 | |||
NOTES TO CONSOLIDATED FINANCIAL STATEMENTS | |||
| Note 10 Income taxes |
The following table shows the significant components of income taxes deducted from net earnings.
FOR THE YEAR ENDED DECEMBER 31 | 2014 | 2013 | ||
Current taxes | ||||
Current taxes | (789 | ) | (888 | ) |
Resolution of uncertain tax positions | 1 | 51 | ||
Change in estimate relating to prior periods | 93 | 53 | ||
Utilization of previously unrecognized tax credits | 23 | – | ||
Deferred taxes | ||||
Deferred taxes relating to the origination and reversal of temporary differences | (165 | ) | 72 | |
Effect of change in provincial corporate tax rate | – | (6 | ) | |
Change in estimate relating to prior periods | (82 | ) | (33 | ) |
Recognition and utilization of loss carryforwards | (10 | ) | (68 | ) |
Resolution of uncertain tax positions | – | (10 | ) | |
Other | – | 1 | ||
Total income taxes | (929 | ) | (828 | ) |
The following table reconciles the amount of reported income taxes in the income statements with income taxes calculated at a statutory income tax rate of 26.6% for each of 2014 and 2013.
FOR THE YEAR ENDED DECEMBER 31 | 2014 | 2013 | ||
Earnings before income taxes | 3,647 | 3,216 | ||
Applicable statutory tax rate | 26.6 | % | 26.6 | % |
Income taxes computed at applicable statutory rates | (970 | ) | (855 | ) |
Non-taxable portion of gains on investments | 4 | – | ||
Resolution of uncertain tax positions | 1 | 41 | ||
Utilization of previously unrecognized tax credits | 23 | – | ||
Effect of change in provincial corporate tax rate | – | (6 | ) | |
Change in estimate relating to prior periods | 11 | 20 | ||
Other | 2 | (28 | ) | |
Total income taxes | (929 | ) | (828 | ) |
Average effective tax rate | 25.5 | % | 25.7 | % |
The following table shows aggregate current and deferred taxes relating to items recognized outside the income statements.
AT DECEMBER 31 | 2014 | 2013 | ||||||||
| OTHER | OTHER | ||||||||
| COMPREHENSIVE | COMPREHENSIVE | ||||||||
| INCOME | DEFICIT | INCOME | DEFICIT | NCI | |||||
Current taxes | 12 | 8 | 1 | 1 | – | |||||
Deferred taxes | 228 | 11 | (390 | ) | 7 | 1 | ||||
Total income tax recovery (expense) | 240 | 19 | (389 | ) | 8 | 1 | ||||
132 BCE Inc. 2014 ANNUAL REPORT | |||
NOTES TO CONSOLIDATED FINANCIAL STATEMENTS | |||
The following table shows deferred taxes resulting from temporary differences between the carrying amounts of assets and liabilities recognized in the statements of financial position and their corresponding tax basis, as well as tax loss carryforwards.
| PROPERTY, | |||||||||||||||||
| PLANT AND | |||||||||||||||||
| NON- | EQUIPMENT | ||||||||||||||||
| CAPITAL | POST- | INDEFINITE- | AND | ||||||||||||||
| LOSS | EMPLOYMENT | LIFE | FINITE-LIFE | PARTNERSHIP | CRTC | ||||||||||||
| CARRY- | BENEFIT | INTANGIBLE | INTANGIBLE | INVESTMENT | INCOME | TANGIBLE | |||||||||||
NET DEFERRED TAX LIABILITY | FORWARDS | PLANS | ASSETS | ASSETS | TAX CREDITS | DEFERRAL | (1) | BENEFITS | OTHER | TOTAL | ||||||||
January 1, 2013 | 104 | 927 | (1,269 | ) | (453 | ) | (60 | ) | (88 | ) | 46 | 276 | (517 | ) | ||||
Income statement | (68 | ) | (3 | ) | (56 | ) | (105 | ) | 39 | 85 | 46 | 18 | (44 | ) | ||||
Other comprehensive income | – | (384 | ) | – | – | – | – | – | (6 | ) | (390 | ) | ||||||
Deficit | – | – | – | – | – | – | – | 7 | 7 | |||||||||
Acquisition of Astral | – | 7 | (202 | ) | (43 | ) | – | – | 1 | 30 | (207 | ) | ||||||
NCI | – | – | – | – | – | – | – | 1 | 1 | |||||||||
Other | – | – | 6 | – | – | – | – | (9 | ) | (3 | ) | |||||||
December 31, 2013 | 36 | 547 | (1,521 | ) | (601 | ) | (21 | ) | (3 | ) | 93 | 317 | (1,153 | ) | ||||
Income statement | (10 | ) | (75 | ) | (33 | ) | (98 | ) | 14 | 3 | (18 | ) | (40 | ) | (257 | ) | ||
Other comprehensive income | – | 242 | – | – | – | – | – | (14 | ) | 228 | ||||||||
Deficit | – | – | – | – | – | – | – | 11 | 11 | |||||||||
Other | – | – | – | – | – | – | – | 12 | 12 | |||||||||
December 31, 2014 | 26 | 714 | (1,554 | ) | (699 | ) | (7 | ) | – | 75 | 286 | (1,159 | ) |
| (1) | The taxation year-end of certain of Bell Aliant’s corporate subsidiaries differed, in prior years, from the partnership year-end. This resulted in a deferral of partnership income for tax purposes. |
At December 31, 2014, BCE had $212 million of non-capital loss carryforwards. We:
- recognized a deferred tax asset of $26 million, of which$14 million related to Bell Media, for $99 million of the non-capitalloss carryforwards. These non-capital loss carryforwards expire in varying annual amounts from 2029 to 2034.
- did not recognize a deferred tax asset for $113 million ofnon-capital loss carryforwards. This balance expires in varying annual amounts from 2026 to 2032.
At December 31, 2014, BCE had $766 million of unrecognized capital loss carryforwards which can be carried forward indefinitely.
At December 31, 2013, BCE had $214 million of non-capital loss carryforwards. We:
- recognized a deferred tax asset of $36 million, of which$27 million related to Bell Media, for $138 million of the non-capitalloss carryforwards. These non-capital loss carryforwards expire in varying annual amounts from 2026 to 2033.
- did not recognize a deferred tax asset for $76 million ofnon-capital loss carryforwards. This balance expires in varying annual amounts from 2023 to 2032.
At December 31, 2013, BCE had $828 million of unrecognized capital loss carryforwards which can be carried forward indefinitely.
| Note 11 Earnings per share |
The following table shows the components used in the calculation of basic and diluted earnings per common share for earnings attributable to common shareholders.
FOR THE YEAR ENDED DECEMBER 31 | 2014 | 2013 | ||
Net earnings attributable to common shareholders – basic | 2,363 | 1,975 | ||
Dividends declared per common share (in dollars) | 2.47 | 2.33 | ||
Weighted average number of common shares outstanding (in millions) | ||||
Weighted average number of common shares outstanding – basic | 793.7 | 775.8 | ||
Assumed exercise of stock options(1) | 0.9 | 0.6 | ||
Weighted average number of common shares outstanding – diluted | 794.6 | 776.4 |
| (1) | The calculation of the assumed exercise of stock options includes the effect of the average unrecognized future compensation cost of dilutive options. It excludes options for which the exercise price is higher than the average market value of a BCE common share. The number of excluded options was 2,871,730 in 2014 and 2,621,806 in 2013. |
BCE Inc. 2014 ANNUAL REPORT 133 | |||
NOTES TO CONSOLIDATED FINANCIAL STATEMENTS | |||
| Note 12 Trade and other receivables |
FOR THE YEAR ENDED DECEMBER 31 | NOTE | 2014 | 2013 | |||
Trade receivables(1) | 3,068 | 3,074 | ||||
Allowance for doubtful accounts | 24 | (69 | ) | (79 | ) | |
Allowance for revenue adjustments | (86 | ) | (90 | ) | ||
Current tax receivable | 87 | 36 | ||||
Other accounts receivable | 69 | 102 | ||||
Total trade and other receivables | 3,069 | 3,043 |
| (1) | The details of securitized trade receivables are set out in Note 20,Debt due within one year. |
| Note 13 Inventory |
FOR THE YEAR ENDED DECEMBER 31 | 2014 | 2013 | ||
Work in progress | 57 | 65 | ||
Finished goods | 297 | 342 | ||
Provision | (21 | ) | (24 | ) |
Total inventory | 333 | 383 |
The total amount of inventory subsequently recognized as an expense in cost of revenues was $2,421 million in 2014 and $2,352 million in 2013.
| Note 14 Property, plant and equipment |
| NETWORK | |||||||||
| INFRASTRUCTURE | LAND AND | ASSETS UNDER | |||||||
FOR THE YEAR ENDED DECEMBER 31, 2014 | NOTE | AND EQUIPMENT | BUILDINGS | CONSTRUCTION | TOTAL | (1) | ||||
COST | ||||||||||
January 1, 2014 | 54,674 | 4,996 | 1,276 | 60,946 | ||||||
Additions | 2,150 | 84 | 1,640 | 3,874 | ||||||
Acquisition through business combinations | 2 | – | – | 2 | ||||||
Transfers | 1,108 | 67 | (1,487 | ) | (312 | ) | ||||
Retirements and disposals | (2,923 | ) | (23 | ) | (2 | ) | (2,948 | ) | ||
Impairment losses recognized in earnings | 9 | (43 | ) | (24 | ) | – | (67 | ) | ||
December 31, 2014 | 54,968 | 5,100 | 1,427 | 61,495 | ||||||
ACCUMULATED DEPRECIATION | ||||||||||
January 1, 2014 | 37,665 | 2,538 | – | 40,203 | ||||||
Depreciation | 2,690 | 190 | – | 2,880 | ||||||
Retirements and disposals | (2,868 | ) | (19 | ) | – | (2,887 | ) | |||
Other | (26 | ) | (2 | ) | – | (28 | ) | |||
December 31, 2014 | 37,461 | 2,707 | – | 40,168 | ||||||
NET CARRYING AMOUNT | ||||||||||
January 1, 2014 | 17,009 | 2,458 | 1,276 | 20,743 | ||||||
December 31, 2014 | 17,507 | 2,393 | 1,427 | 21,327 |
| (1) | Includes assets under finance leases. |
134 BCE Inc. 2014 ANNUAL REPORT | |||
NOTES TO CONSOLIDATED FINANCIAL STATEMENTS | |||
| NETWORK | |||||||
| INFRASTRUCTURE | LAND AND | ASSETS UNDER | |||||
FOR THE YEAR ENDED DECEMBER 31, 2013 | AND EQUIPMENT | BUILDINGS | CONSTRUCTION | TOTAL | (1) | |||
COST | ||||||||
January 1, 2013 | 52,925 | 4,789 | 1,202 | 58,916 | ||||
Additions | 2,014 | 60 | 1,623 | 3,697 | ||||
Acquisition through business combinations | 159 | 39 | 2 | 200 | ||||
Transfers | 1,066 | 125 | (1,551 | ) | (360 | ) | ||
Retirements and disposals | (1,490 | ) | (17 | ) | – | (1,507 | ) | |
December 31, 2013 | 54,674 | 4,996 | 1,276 | 60,946 | ||||
ACCUMULATED DEPRECIATION | ||||||||
January 1, 2013 | 36,539 | 2,370 | – | 38,909 | ||||
Depreciation | 2,545 | 189 | – | 2,734 | ||||
Retirements and disposals | (1,414 | ) | (14 | ) | – | (1,428 | ) | |
Other | (5 | ) | (7 | ) | – | (12 | ) | |
December 31, 2013 | 37,665 | 2,538 | – | 40,203 | ||||
NET CARRYING AMOUNT | ||||||||
January 1, 2013 | 16,386 | 2,419 | 1,202 | 20,007 | ||||
December 31, 2013 | 17,009 | 2,458 | 1,276 | 20,743 |
| (1) | Includes assets under finance leases. |
| Finance leases |
BCE’s significant finance leases are for satellites and office premises. The office leases have a typical lease term of 25 years. The leases for satellites, used to provide programming to our Bell TV customers, have a term of 15 years. The satellite leases are non-cancellable.
The following table shows additions to and the net carrying amount of assets under finance leases.
| ADDITIONS | NET CARRYING AMOUNT | ||||||
FOR THE YEAR ENDED DECEMBER 31 | 2014 | 2013 | 2014 | 2013 | ||||
Network infrastructure and equipment | 317 | 319 | 1,605 | 1,655 | ||||
Land and buildings | 12 | 3 | 519 | 556 | ||||
Total | 329 | 322 | 2,124 | 2,211 | ||||
The following table provides a reconciliation of our minimum future lease payments to the present value of our finance lease obligations.
| THERE- | |||||||||||||||
AT DECEMBER 31, 2014 | NOTE | 2015 | 2016 | 2017 | 2018 | 2019 | AFTER | TOTAL | ||||||||
Minimum future lease payments | 24 | 491 | 444 | 313 | 260 | 237 | 1,405 | 3,150 | ||||||||
Less: | ||||||||||||||||
Future finance costs | (146 | ) | (132 | ) | (120 | ) | (108 | ) | (97 | ) | (326 | ) | (929 | ) | ||
Present value of future lease obligations | 345 | 312 | 193 | 152 | 140 | 1,079 | 2,221 |
BCE Inc. 2014 ANNUAL REPORT 135 | |||
NOTES TO CONSOLIDATED FINANCIAL STATEMENTS | |||
| Note 15 Intangible assets |
| FINITE-LIFE | INDEFINITE-LIFE | ||||||||||||||||||||
YEAR ENDED | NOTE | SOFTWARE | CUSTOMER RELATION- SHIPS | PROGRAM AND FEATURE FILM RIGHTS | OTHER | TOTAL | BRAND | SPECTRUM AND OTHER LICENCES | (1) | BROADCAST LICENCES | TOTAL | TOTAL INTANGIBLE ASSETS | ||||||||||
COST | ||||||||||||||||||||||
January 1, 2014 | 6,041 | 865 | 389 | 293 | 7,588 | 2,344 | 2,132 | 2,389 | 6,865 | 14,453 | ||||||||||||
Additions(1) | 271 | – | 885 | – | 1,156 | – | 578 | – | 578 | 1,734 | ||||||||||||
Transfers | 322 | – | – | (6 | ) | 316 | – | – | – | – | 316 | |||||||||||
Retirements and disposals | (336 | ) | – | – | – | (336 | ) | – | (7 | ) | – | (7 | ) | (343 | ) | |||||||
Impairment losses | ||||||||||||||||||||||
recognized in earnings | 9 | – | – | – | – | – | (11 | ) | (10 | ) | (17 | ) | (38 | ) | (38 | ) | ||||||
Amortization included in operating costs | – | – | (750 | ) | – | (750 | ) | – | – | – | – | (750 | ) | |||||||||
December 31, 2014 | 6,298 | 865 | 524 | 287 | 7,974 | 2,333 | 2,693 | 2,372 | 7,398 | 15,372 | ||||||||||||
ACCUMULATED AMORTIZATION | ||||||||||||||||||||||
January 1, 2014 | 4,429 | 368 | – | 104 | 4,901 | – | – | – | – | 4,901 | ||||||||||||
Amortization | 502 | 51 | – | 19 | 572 | – | – | – | – | 572 | ||||||||||||
Retirements and disposals | (336 | ) | – | – | – | (336 | ) | – | – | – | – | (336 | ) | |||||||||
Other | 11 | – | – | – | 11 | – | – | – | – | 11 | ||||||||||||
December 31, 2014 | 4,606 | 419 | – | 123 | 5,148 | – | – | – | – | 5,148 | ||||||||||||
NET CARRYING AMOUNT | ||||||||||||||||||||||
January 1, 2014 | 1,612 | 497 | 389 | 189 | 2,687 | 2,344 | 2,132 | 2,389 | 6,865 | 9,552 | ||||||||||||
December 31, 2014 | 1,692 | 446 | 524 | 164 | 2,826 | 2,333 | 2,693 | 2,372 | 7,398 | 10,224 | ||||||||||||
| (1) | On April 2, 2014, Bell acquired 700 megahertz spectrum licences in every province and territorial market, comprised of 31 licences for $566 million. |
| FINITE-LIFE | INDEFINITE-LIFE | ||||||||||||||||||||
YEAR ENDED | NOTE | SOFTWARE | CUSTOMER RELATION- SHIPS | PROGRAM AND FEATURE FILM RIGHTS | OTHER | TOTAL | BRAND | SPECTRUM AND OTHER LICENCES | BROADCAST LICENCES | TOTAL | TOTAL INTANGIBLE ASSETS | |||||||||||
COST | ||||||||||||||||||||||
January 1, 2013 | 5,949 | 847 | 263 | 270 | 7,329 | 2,242 | 2,128 | 1,293 | 5,663 | 12,992 | ||||||||||||
Additions | 238 | – | 570 | – | 808 | – | 4 | – | 4 | 812 | ||||||||||||
Acquisition through business combinations | 14 | 25 | 101 | 23 | 163 | 102 | – | 1,136 | 1,238 | 1,401 | ||||||||||||
Transfers | 377 | – | – | – | 377 | – | – | (25 | ) | (25 | ) | 352 | ||||||||||
Retirements and disposals | (537 | ) | (7 | ) | – | – | (544 | ) | – | – | – | – | (544 | ) | ||||||||
Impairment losses recognized in earnings | 9 | – | – | – | – | – | – | – | (15 | ) | (15 | ) | (15 | ) | ||||||||
Amortization included in operating costs | – | – | (545 | ) | – | (545 | ) | – | – | – | – | (545 | ) | |||||||||
December 31, 2013 | 6,041 | 865 | 389 | 293 | 7,588 | 2,344 | 2,132 | 2,389 | 6,865 | 14,453 | ||||||||||||
ACCUMULATED AMORTIZATION | ||||||||||||||||||||||
January 1, 2013 | 4,399 | 325 | – | 85 | 4,809 | – | – | – | – | 4,809 | ||||||||||||
Amortization | 577 | 50 | – | 19 | 646 | – | – | – | – | 646 | ||||||||||||
Retirements and disposals | (535 | ) | (7 | ) | – | – | (542 | ) | – | – | – | – | (542 | ) | ||||||||
Other | (12 | ) | – | – | – | (12 | ) | – | – | – | – | (12 | ) | |||||||||
December 31, 2013 | 4,429 | 368 | – | 104 | 4,901 | – | – | – | – | 4,901 | ||||||||||||
NET CARRYING AMOUNT | ||||||||||||||||||||||
January 1, 2013 | 1,550 | 522 | 263 | 185 | 2,520 | 2,242 | 2,128 | 1,293 | 5,663 | 8,183 | ||||||||||||
December 31, 2013 | 1,612 | 497 | 389 | 189 | 2,687 | 2,344 | 2,132 | 2,389 | 6,865 | 9,552 | ||||||||||||
136 BCE Inc. 2014 ANNUAL REPORT | |||
NOTES TO CONSOLIDATED FINANCIAL STATEMENTS | |||
| Note 16 Investments in associates and joint ventures |
The following table provides summarized financial information in respect to BCE’s associates and joint ventures. For a list of associates and joint ventures please see Note 28, Related party transactions.
FOR THE YEAR ENDED DECEMBER 31 | 2014 | 2013 | ||
Assets | 3,910 | 3,878 | ||
Liabilities | (2,202 | ) | (2,164 | ) |
Total net assets | 1,708 | 1,714 | ||
BCE’s share of net assets | 776 | 775 | ||
Revenues | 871 | 805 | ||
Expenses | (918 | ) | (912 | ) |
Total net losses | (47 | ) | (107 | ) |
BCE’s share of net losses | (12 | ) | (32 | ) |
| Note 17 Other non-current assets |
FOR THE YEAR ENDED DECEMBER 31 | NOTE | 2014 | 2013 | |||
Net assets of post-employment benefit plans | 22 | 151 | 136 | |||
AFS publicly-traded and privately-held investments | 24 | 107 | 91 | |||
Long-term notes and other receivables | 47 | 45 | ||||
Derivative assets | 269 | 199 | ||||
Other | 301 | 227 | ||||
Total other non-current assets | 875 | 698 |
| Note 18 Goodwill |
The following table provides details about the changes in the carrying amounts of goodwill for the years ended December 31, 2014 and 2013. BCE’s groups of CGUs correspond to our reporting segments.
| BELL | BELL | BELL | BELL | ||||||
| WIRELESS | WIRELINE | MEDIA | ALIANT | BCE | |||||
Balance at January 1, 2013 | 2,302 | 2,521 | 1,393 | 969 | 7,185 | |||||
Acquisitions and other | – | – | 1,195 | 1 | 1,196 | |||||
Balance at December 31, 2013 | 2,302 | 2,521 | 2,588 | 970 | 8,381 | |||||
Acquisitions and other | – | – | 4 | – | 4 | |||||
Balance at December 31, 2014 | 2,302 | 2,521 | 2,592 | 970 | 8,385 |
| Impairment testing |
As described in Note 2, Significant accounting policies, goodwill is tested annually for impairment by comparing the carrying value of a group of CGUs to the recoverable amount, where the recoverable amount is the higher of fair value less costs of disposal or value in use.
VALUE IN USE
The value in use for our groups of CGUs is determined by discounting five-year cash flow projections from business plans reviewed by senior management. The projections reflect management’s expectations of revenue, segment profit, capital expenditures, working capital and operating cash flows, based on past experience and future expectations of operating performance.
Cash flows beyond the five-year period are extrapolated using perpetuity growth rates. None of the perpetuity growth rates exceed the long-term historical growth rates for the markets in which we operate.
The discount rates are applied to the cash flow projections and are derived from the weighted average cost of capital for each group of CGUs.
BCE Inc. 2014 ANNUAL REPORT 137 | |||
NOTES TO CONSOLIDATED FINANCIAL STATEMENTS | |||
The following table shows the key assumptions used to estimate the recoverable amounts of the groups of CGUs.
| ASSUMPTIONS USED | |||
| PERPETUITY | |||
GROUPS OF CGUs | GROWTH RATE | DISCOUNT RATE | ||
Bell Wireless | 0.8 | % | 9.1 | % |
Bell Wireline | 0.9 | % | 7.2 | % |
Bell Media | 1.0 | % | 8.2 | % |
Bell Aliant | 0.2 | % | 6.1 | % |
We believe that any reasonable possible change in the key assumptions on which the estimate of recoverable amounts of the Bell Wireless, Bell Wireline and Bell Aliant groups of CGUs is based would not cause their carrying amounts to exceed their recoverable amounts.
For the Bell Media group of CGUs, a decrease of (0.3%) in the perpetuity growth rate or an increase of 0.2% in the discount rate, would have resulted in its recoverable amount being equal to its carrying value.
| Note 19 Trade payables and other liabilities |
FOR THE YEAR ENDED DECEMBER 31 | NOTE | 2014 | 2013 | |||
Trade payables and accruals | 2,415 | 2,373 | ||||
Compensation payable | 631 | 576 | ||||
Deferred revenues | 764 | 743 | ||||
Taxes payable | 115 | 136 | ||||
Severance and other costs payable | 69 | 73 | ||||
CRTC deferral account obligation | 24 | 24 | 80 | |||
CRTC tangible benefits obligation | 24 | 63 | 100 | |||
Other current liabilities | 317 | 258 | ||||
Total trade payables and other liabilities | 4,398 | 4,339 |
| Note 20 Debt due within one year |
| WEIGHTED AVERAGE | |||||||
FOR THE YEAR ENDED DECEMBER 31 | NOTE | INTEREST RATE | 2014 | 2013 | ||||
Bank advances | – | 129 | ||||||
Notes payable(1) | 0.95 | % | 1,454 | 843 | ||||
Total bank advances and notes payable | 24 | 1,454 | 972 | |||||
Loans secured by trade receivables | 24 | 1.78 | % | 921 | 921 | |||
Long-term debt due within one year(2) | ||||||||
Bell Canada | 4.10 | % | 1,330 | 340 | ||||
CTV Specialty Television Inc. (CTV Specialty) | 3.48 | % | 7 | 305 | ||||
Bell Aliant | 4.06 | % | 39 | 40 | ||||
| 1,376 | 685 | ||||||
Net unamortized discount | (1 | ) | (2 | ) | ||||
Unamortized debt issuance costs | (7 | ) | (5 | ) | ||||
Total long-term debt due within one year | 21 | 1,368 | 678 | |||||
Total debt due within one year | 3,743 | 2,571 |
| (1) | Includes commercial paper of $501 million Canadian dollars ($431 million U.S. dollars) which was drawn under our U.S. commercial paper program and has been hedged for foreign currency fluctuations through forward currency contracts. Refer to Note 24,Financial and capital management. |
| (2) | Included in long-term debt due within one year is the current portion of finance leases of $345 million at December 31, 2014 and $337 million at December 31, 2013. |
138 BCE Inc. 2014 ANNUAL REPORT | |||
NOTES TO CONSOLIDATED FINANCIAL STATEMENTS | |||
| Securitized trade receivables |
Our securitized trade receivable programs are recorded as floating rate revolving loans secured by certain trade receivables and expire on November 30, 2016 and December 31, 2017.
The following table provides further details on our securitized trade receivables.
FOR THE YEAR ENDED DECEMBER 31 | 2014 | 2013 | ||
Average interest rate | 1.89 | % | 1.82 | % |
Secured trade receivables | 2,091 | 2,061 |
We continue to service these trade receivables. The buyers’ interest in the collection of these trade receivables ranks ahead of our interests, which means that we are exposed to certain risks of default on the amounts securitized.
We have provided various credit enhancements in the form of overcollateralization and subordination of our retained interests.
The buyers will reinvest the amounts collected by buying additional interests in our trade receivables until the securitized trade receivables agreements expire or are terminated. The buyers and their investors have no further claim on our other assets if customers do not pay amounts owed.
| Credit facilities |
Bell Canada may issue notes in an aggregate amount of up to 2 billion dollars in either Canadian or U.S. dollars under its commercial paper program, supported by a committed revolving bank credit facility. The total amount of this credit facility may be drawn at any time.
The table below is a summary of our total bank credit facilities at December 31, 2014.
| COMMERCIAL PAPER | |||||||||
| TOTAL AVAILABLE | DRAWN | LETTERS OF CREDIT | OUTSTANDING | NET AVAILABLE | |||||
Committed credit facilities | ||||||||||
Unsecured revolving facility(1)(2) | 2,500 | – | – | 1,453 | 1,047 | |||||
Unsecured committed term credit facility (Astral)(3) | 1,018 | 1,018 | – | – | – | |||||
Other | 100 | – | 98 | – | 2 | |||||
Total committed credit facilities | 3,618 | 1,018 | 98 | 1,453 | 1,049 | |||||
Total non-committed credit facilities | 1,101 | – | 626 | – | 475 | |||||
Total committed and non-committed credit facilities | 4,719 | 1,018 | 724 | 1,453 | 1,524 |
| (1) | Bell Canada’s $2,500 million revolving facility expires in November 2019. Bell Aliant’s $750 million revolving facility was cancelled in 2014. |
| (2) | As of December 31, 2014, Bell Canada’s outstanding commercial paper included $431 million U.S. dollars ($501 million Canadian dollars). All of Bell Canada’s commercial paper outstanding is included in debt due within one year. |
| (3) | Bell Canada may borrow up to 1 billion Canadian dollars in either Canadian or equivalent U.S. dollars under this credit facility. Bell Canada’s outstanding balance at December 31, 2014 was $1,018 million Canadian dollars ($877 million U.S. dollars), which is included in long-term debt and has been hedged using cross currency basis swaps. Refer to Note 24,Financial and capital management. |
| Restrictions |
Some of our credit agreements:
- require us to meet specific financial ratios
- require us to offer to repay and cancel the credit agreement upon a change of control of BCE or Bell Canada
We are in compliance with all conditions and restrictions under such credit agreements.
BCE Inc. 2014 ANNUAL REPORT 1 | |||
NOTES TO CONSOLIDATED FINANCIAL STATEMENTS | |||
| Note 21 Long-term debt |
| WEIGHTED AVERAGE | |||||||||
FOR THE YEAR ENDED DECEMBER 31 | NOTE | INTEREST RATE | MATURITY | 2014 | 2013 | |||||
Bell Canada | ||||||||||
Debentures | ||||||||||
1997 trust indenture | 4.39 | % | 2015–2044 | 12,900 | 9,350 | |||||
1976 trust indenture | 9.54 | % | 2021–2054 | 1,100 | 1,100 | |||||
Subordinated debentures | 8.21 | % | 2026–2031 | 275 | 275 | |||||
Finance leases | �� | 7.28 | % | 2015–2047 | 2,129 | 2,166 | ||||
Unsecured committed term credit facility (Astral)(1) | 1.16 | % | 2016 | 1,018 | 1,000 | |||||
Other | 170 | 197 | ||||||||
Total – Bell Canada | 17,592 | 14,088 | ||||||||
CTV Specialty | ||||||||||
Notes | – | 300 | ||||||||
Finance leases | 3.48 | % | 2015–2019 | 21 | 19 | |||||
Total – CTV Specialty | 21 | 319 | ||||||||
Bell Aliant | ||||||||||
Debentures and notes | 6.24 | % | 2016–2020 | 49 | 2,559 | |||||
Finance leases | 3.92 | % | 2015–2017 | 71 | 63 | |||||
Total – Bell Aliant | 120 | 2,622 | ||||||||
Total debt | 17,733 | 17,029 | ||||||||
Net unamortized premium | 30 | 40 | ||||||||
Unamortized debt issuance costs | (40 | ) | (50 | ) | ||||||
Less: | ||||||||||
Amount due within one year | 20 | (1,368 | ) | (678 | ) | |||||
Total long-term debt | 16,355 | 16,341 |
| (1) | Represents $1,018 million Canadian dollars ($877 million U.S. dollars) which was drawn under Bell Canada’s unsecured committed credit facility and has been hedged using cross currency basis swaps. Refer to Note 24,Financial and capital management. |
All debentures and subordinated debentures have been issued in Canadian dollars and bear a fixed rate of interest.
Interest payments on debt for a principal amount of $700 million have been swapped from fixed to floating. See Note 24, Financial and capital management for additional details.
| Restrictions |
Some of our debt agreements:
- require us to meet specific financial ratios
- impose covenants, maintenance tests and new issue tests
- require us to make an offer to repurchase certain series of debentures upon the occurrence of a change of control event as defined in the relevant debt agreements
We are in compliance with all conditions and restrictions under such debt agreements.
140 BCE Inc. 2014 ANNUAL REPORT | |||
NOTES TO CONSOLIDATED FINANCIAL STATEMENTS | |||
| Bell Canada |
All outstanding debentures are issued under trust indentures and are unsecured. All debentures are issued in series and certain series are redeemable at Bell Canada’s option prior to maturity at the prices, times and conditions specified for each series.
On November 20, 2014, all Bell Aliant Regional Communications, Limited Partnership medium term notes (MTN) and floating rate MTNs (collectively, Bell Aliant notes) in the aggregate principal amount of $2.3 billion were exchanged for Bell Canada debentures having the same financial terms as the Bell Aliant notes, including with respect to coupon rate, maturity date and redemption price. As a result, $25 million of deferred costs related to the Bell Aliant debt were expensed and recorded as early debt redemption costs in Other income (expense) in the income statement.
The following Bell Canada debentures were issued in exchange for the previously held Bell Aliant notes.
| SERIES | COUPON RATE | MATURITY DATE | PRINCIPAL AMOUNT | |||
| M-32 | 5.41 | % | September 26, 2016 | 500 | ||
| M-33 | 5.52 | % | February 26, 2019 | 300 | ||
| M-34 | 6.17 | % | February 26, 2037 | 300 | ||
| M-35 | 4.37 | % | September 13, 2017 | 350 | ||
| M-36 | 4.88 | % | April 26, 2018 | 300 | ||
| M-37 | 3.54 | % | June 12, 2020 | 400 | ||
| M-38 | floating | April 22, 2016 | 150 | |||
| Total | 2,300 |
On September 29, 2014, Bell Canada issued 3.15% Series M-30 MTN debentures under its 1997 trust indenture, with a principal amount of $750 million which mature on September 29, 2021. In addition, on the same date, Bell Canada issued 4.75% Series M-31 MTN debentures under its 1997 trust indenture, with a principal amount of $500 million, which mature on September 29, 2044.
On September 10, 2013, Bell Canada issued 4.70% Series M-29 MTN debentures under its 1997 trust indenture, with a principal amount of $600 million, which mature on September 11, 2023. In addition, on the same date, Bell Canada issued 3.50% Series M-28 MTN debentures under its 1997 trust indenture, with a principal amount of $400 million, which mature on September 10, 2018.
On August 9, 2013, Bell Canada redeemed early its 4.85% Series M-20 MTN debentures, issued under its 1997 trust indenture, having an outstanding principal amount of $1 billion which were due on June 30, 2014. We incurred a $28 million charge for the early debt redemption costs which was recorded in Other income (expense) in the income statement.
On July 5, 2013, Bell Canada borrowed $1 billion under its unsecured committed term acquisition credit facility which matures on July 5, 2016.
On June 17, 2013, Bell Canada issued 3.25% Series M-27 MTN debentures under its 1997 trust indenture, with a principal amount of $1 billion, which mature on June 17, 2020.
On March 22, 2013, Bell Canada issued 3.35% Series M-26 MTN debentures under its 1997 trust indenture, with a principal amount of $1 billion, which mature on March 22, 2023.
On February 11, 2013, Bell Canada redeemed early its 10.0% Series EA debentures, issued under its 1976 trust indenture, having an outstanding principal amount of $150 million which was due on June 15, 2014. We incurred a $17 million charge for the early debt redemption costs which was recorded in Other income (expense) in the income statement.
| CTV Specialty |
On February 18, 2014, all of the outstanding CTV Specialty notes of $300 million were repaid upon maturity.
| Bell Aliant |
On November 20, 2014, Bell Aliant notes in the aggregate principal amount of $2.3 billion were exchanged for Bell Canada debentures.
On October 30, 2014, Bell Aliant redeemed early its 6.29% MTNs with a principal amount of $350 million which were due on February 17, 2015. We incurred a $4 million charge for the early debt redemption costs which was recorded in Other income (expense) in 2014 in the income statement.
On April 22, 2014, Bell Aliant issued floating rate MTNs, with a principal amount of $150 million, which would have matured on April 22, 2016. These MTNs were exchanged for Bell Canada debentures on November 20, 2014.
On June 25, 2013, Bell Aliant redeemed early its 4.95% MTNs with a principal amount of $400 million. We incurred a $10 million charge for the early debt redemption costs which was recorded in Other income (expense) in the income statement.
On June 14, 2013, Bell Aliant issued 3.54% MTNs, with a principal amount of $400 million, which mature on June 12, 2020. These MTNs were exchanged for Bell Canada debentures on November 20, 2014.
BCE Inc. 2014 ANNUAL REPORT 141 | |||
NOTES TO CONSOLIDATED FINANCIAL STATEMENTS | |||
| Note 22 Post-employment benefit plans |
Post-employment benefit plans cost
We provide pension and other benefits for most of our employees. These include DB pension plans, DC pension plans and OPEBs.
We operate our DB and DC pension plans under applicable Canadian and provincial pension legislation, which prescribes minimum and maximum DB funding requirements. Plan assets are held in trust and the oversight of governance of the plans, including investment decisions, contributions to DB plans and the selection of the DC plans investment options offered to plan participants, lies with the Pension Fund Committee, a committee of our board of directors.
The interest rate risk is managed using a liability matching approach which reduces the exposure of the DB plan to a mismatch between investment growth and obligation growth.
COMPONENTS OF POST-EMPLOYMENT BENEFIT PLANS SERVICE COST
FOR THE YEAR ENDED DECEMBER 31 | 2014 | 2013 | ||
DB pension | (214 | ) | (252 | ) |
DC pension | (94 | ) | (81 | ) |
OPEBs | (9 | ) | (7 | ) |
Plan amendment gain on OPEBs | – | 1 | ||
Less: | ||||
Capitalized benefit plans cost | 41 | 47 | ||
Total post-employment benefit plans service cost included in operating costs | (276 | ) | (292 | ) |
Other (costs) benefits recognized in Severance, acquisition and other costs | (29 | ) | 6 | |
Total post-employment benefit plans service cost | (305 | ) | (286 | ) |
COMPONENTS OF POST-EMPLOYMENT BENEFIT PLANS FINANCING COST
FOR THE YEAR ENDED DECEMBER 31 | 2014 | 2013 | ||
DB pension | (35 | ) | (87 | ) |
OPEBs | (66 | ) | (63 | ) |
Total interest on post-employment benefit obligations | (101 | ) | (150 | ) |
The statements of comprehensive income include the following amounts before income taxes.
| 2014 | 2013 | ||
Cumulative losses recognized directly in equity, January 1 | (2,036 | ) | (3,452 | ) |
Actuarial (losses) gains in other comprehensive income(1) | (933 | ) | 1,403 | |
(Increase) decrease in the effect of the asset limit(2) | (5 | ) | 13 | |
Cumulative losses recognized directly in equity, December 31 | (2,974 | ) | (2,036 | ) |
| (1) | The cumulative actuarial losses recognized in the statements of comprehensive income are $3,234 million in 2014. |
| (2) | The cumulative decrease in the effect of the asset limit recognized in the statements of comprehensive income is $260 million in 2014. |
142 BCE Inc. 2014 ANNUAL REPORT | |||
NOTES TO CONSOLIDATED FINANCIAL STATEMENTS | |||
COMPONENTS OF POST-EMPLOYMENT BENEFIT (OBLIGATIONS) ASSETS
The following table shows the change in post-employment benefit obligations and the fair value of plan assets.
| DB PENSION PLANS | OPEB PLANS | TOTAL | |||||||||
| 2014 | 2013 | 2014 | 2013 | 2014 | 2013 | ||||||
Post-employment benefit obligations, January 1 | (18,672 | ) | (19,542 | ) | (1,641 | ) | (1,707 | ) | (20,313 | ) | (21,249 | ) |
Current service cost | (214 | ) | (252 | ) | (9 | ) | (7 | ) | (223 | ) | (259 | ) |
Interest on obligations | (901 | ) | (850 | ) | (78 | ) | (73 | ) | (979 | ) | (923 | ) |
Actuarial (losses) gains(1) | (2,240 | ) | 1,025 | (56 | ) | 69 | (2,296 | ) | 1,094 | |||
Net curtailment (loss) gain | (29 | ) | 4 | – | 3 | (29 | ) | 7 | ||||
Business combinations | – | (143 | ) | – | (3 | ) | – | (146 | ) | |||
Benefit payments | 1,076 | 1,088 | 77 | 77 | 1,153 | 1,165 | ||||||
Employee contributions | (5 | ) | (6 | ) | – | – | (5 | ) | (6 | ) | ||
Other | (3 | ) | 4 | – | – | (3 | ) | 4 | ||||
Post-employment benefit obligations, December 31 | (20,988 | ) | (18,672 | ) | (1,707 | ) | (1,641 | ) | (22,695 | ) | (20,313 | ) |
Fair value of plan assets, January 1 | 18,082 | 17,727 | 241 | 220 | 18,323 | 17,947 | ||||||
Expected return on plan assets(2) | 866 | 763 | 12 | 10 | 878 | 773 | ||||||
Actuarial gains | 1,351 | 294 | 12 | 15 | 1,363 | 309 | ||||||
Business combinations | – | 120 | – | – | – | 120 | ||||||
Benefit payments | (1,076 | ) | (1,088 | ) | (77 | ) | (77 | ) | (1,153 | ) | (1,165 | ) |
Employer contributions | 591 | 260 | 73 | 73 | 664 | 333 | ||||||
Employee contributions | 5 | 6 | – | – | 5 | 6 | ||||||
Fair value of plan assets, December 31 | 19,819 | 18,082 | 261 | 241 | 20,080 | 18,323 | ||||||
Plan deficit | (1,169 | ) | (590 | ) | (1,446 | ) | (1,400 | ) | (2,615 | ) | (1,990 | ) |
Effect of asset limit | (6 | ) | (1 | ) | – | – | (6 | ) | (1 | ) | ||
Post-employment benefit liability, December 31 | (1,175 | ) | (591 | ) | (1,446 | ) | (1,400 | ) | (2,621 | ) | (1,991 | ) |
Post-employment benefit assets included in other non-current assets | 151 | 136 | – | – | 151 | 136 | ||||||
Post-employment benefit obligations | (1,326 | ) | (727 | ) | (1,446 | ) | (1,400 | ) | (2,772 | ) | (2,127 | ) |
| (1) | Actuarial (losses) gains include experience gains of $1,534 million in 2014 and $424 million in 2013. |
| (2) | The actual return on plan assets was $2,241 million or 12.6% in 2014 and $1,082 million or 6.4% in 2013. |
FUNDED STATUS OF POST-EMPLOYMENT BENEFIT PLANS COST
The following table shows the funded status of our post-employment benefit obligations.
| FUNDED | PARTIALLY FUNDED(1) | UNFUNDED(2) | TOTAL | ||||||||||||
FOR THE YEAR ENDED DECEMBER 31 | 2014 | 2013 | 2014 | 2013 | 2014 | 2013 | 2014 | 2013 | ||||||||
Present value of post-employment benefit obligations | (20,375 | ) | (18,134 | ) | (1,906 | ) | (1,820 | ) | (414 | ) | (359 | ) | (22,695 | ) | (20,313 | ) |
Fair value of plan assets | 19,783 | 18,048 | 297 | 275 | – | – | 20,080 | 18,323 | ||||||||
Plan deficit | (592 | ) | (86 | ) | (1,609 | ) | (1,545 | ) | (414 | ) | (359 | ) | (2,615 | ) | (1,990 | ) |
| (1) | The partially funded plans consist of supplementary executive retirement plans (SERPs) for eligible employees and OPEBs. The company partially funds the SERPs through letters of credit and a retirement compensation arrangement account with Canada Revenue Agency. Certain paid-up life insurance benefits are funded through life insurance contracts. |
| (2) | Our unfunded plans consist of OPEBs, which are pay-as-you-go. |
BCE Inc. 2014 ANNUAL REPORT 143 | |||
NOTES TO CONSOLIDATED FINANCIAL STATEMENTS | |||
SIGNIFICANT ASSUMPTIONS
We used the following key assumptions to measure the post-employment benefit obligations and the net benefit plans cost for the DB pension plans and OPEB plans. These assumptions are long-term, which is consistent with the nature of post-employment benefit plans.
| DB PENSION PLANS AND OPEB PLANS | |||
| 2014 | 2013 | ||
At December 31 | ||||
Post-employment benefit obligations | ||||
Discount rate | 4.0 | % | 4.9 | % |
Rate of compensation increase | 2.5 | % | 2.8 | % |
Cost of living indexation rate(1) | 1.6 | % | 1.7 | % |
Life expectancy at age 65 (years) | 23.0 | 22.4 | ||
For the year ended December 31 | ||||
Net post-employment benefit plans cost | ||||
Discount rate | 4.9 | % | 4.4 | % |
Rate of compensation increase | 2.8 | % | 3.0 | % |
Cost of living indexation rate(1) | 1.7 | % | 1.8 | % |
Life expectancy at age 65 (years) | 22.4 | 20.9 | ||
| (1) | Cost of living indexation rate is only applicable to DB pension plans. |
The weighted average duration of the post-employment benefit obligation is 15 years.
We assumed the following trend rates in healthcare costs:
- an annual increase of 4.0% in the cost per person of covereddental benefits and 4.5% in the cost per person of other covered healthcare benefits for 2014 and the foreseeable future
- an annual increase of 5.0% for retirees under age 65 and 4.5%for retirees over age 65 in the cost of medication for 2014 and the foreseeable future
Assumed trend rates in healthcare costs have a significant effect on the amounts reported for the healthcare plans.
The following table shows the effect of a 1% change in the assumed trend rates in healthcare costs.
EFFECT ON POST-EMPLOYMENT | ||||
BENEFITS – INCREASE/(DECREASE) | 1% INCREASE | 1% DECREASE | ||
Total service and interest cost | 7 | (6 | ) | |
Post-employment benefit obligations | 147 | (128 | ) |
SENSITIVITY ANALYSIS
The following table shows a sensitivity analysis of key assumptions used to measure the net post-employment benefit obligations and the net post-employment benefit plans cost for our DB pension plans and OPEB plans.
| IMPACT ON NET POST-EMPLOYMENT BENEFIT PLANS COST FOR 2014 – INCREASE/(DECREASE) | IMPACT ON POST-EMPLOYMENT BENEFIT OBLIGATIONS AT DECEMBER 31, 2014 – INCREASE/(DECREASE) | |||||||||
| CHANGE IN | INCREASE IN | DECREASE IN | INCREASE IN | DECREASE IN | ||||||
| ASSUMPTION | ASSUMPTION | ASSUMPTION | ASSUMPTION | ASSUMPTION | ||||||
| Discount rate | 1 | % | (175 | ) | 148 | (2,978 | ) | 3,428 | ||
| Mortality rate | 25 | % | (73 | ) | 78 | (1,423 | ) | 1,518 | ||
POST-EMPLOYMENT BENEFIT PLAN ASSETS
The investment strategy for the post-employment benefit plan assets is to maintain a diversified portfolio of assets invested in a prudent manner to maintain the security of funds.
The following table shows the target allocations for 2014 and the allocation of our post-employment benefit plan assets at December 31, 2014 and 2013.
| WEIGHTED AVERAGE | TOTAL PLAN ASSETS FAIR VALUE AT DECEMBER 31 (%) | ||||
| TARGET ALLOCATION | |||||
ASSET CATEGORY | 2014 | 2014 | 2013 | |||
Equity securities | 20%–35 | % | 30 | % | 33 | % |
Debt securities | 55%–70 | % | 62 | % | 59 | % |
Alternative investments | 0%–25 | % | 8 | % | 8 | % |
Total | 100 | % | 100 | % | ||
144 BCE Inc. 2014 ANNUAL REPORT | |||
NOTES TO CONSOLIDATED FINANCIAL STATEMENTS | |||
The fair value of the DB pension plan assets at the end of the year for each category are tabled below.
FOR THE YEAR ENDED DECEMBER 31 | 2014 | 2013 | ||
Observable markets | ||||
Equity securities | ||||
Canadian | 1,195 | 1,278 | ||
Foreign | 4,657 | 4,692 | ||
Debt securities | ||||
Canadian | 10,986 | 9,491 | ||
Foreign | 921 | 792 | ||
Money market | 463 | 376 | ||
Unobservable inputs | ||||
Alternative investments | ||||
Private equities | 947 | 873 | ||
Hedge funds | 651 | 602 | ||
Other | (1 | ) | (22 | ) |
Total | 19,819 | 18,082 |
Equity securities included approximately $1 million of BCE common shares, or 0.01% of total plan assets, at December 31, 2014 and approximately $2 million BCE common shares or 0.01% of total plan assets, at December 31, 2013.
Debt securities included approximately $2 million of Bell Canada and Bell Aliant debentures, or 0.01% of total plan assets, at December 31, 2014 and approximately $14 million of Bell Canada debentures, or 0.08% of total plan assets, at December 31, 2013.
In the first quarter of 2015, the Bell Canada Pension Plan (the Plan) entered into an investment arrangement to hedge part of the Plan’s exposure to potential increases in longevity which covers approximately $5 billion of post-employment benefit obligations. This arrangement requires no additional cash contributions from BCE.
CASH FLOWS
We are responsible for adequately funding our DB pension plans. We make contributions to them based on various actuarial cost methods that are permitted by pension regulatory bodies. Contributions reflect actuarial assumptions about future investment returns, salary projections and future service benefits. Changes in these factors could cause actual future contributions to differ from our current estimates and could require us to increase contributions to our post-employment benefit plans in the future, which could have a negative effect on our liquidity and financial performance.
We contribute to the DC pension plans as employees provide service.
The following table shows the amounts we contributed to the DB and DC pension plans and the payments made to beneficiaries under OPEB plans.
| PENSION PLANS | OPEB PLANS | ||||||
FOR THE YEAR ENDED DECEMBER 31 | 2014 | 2013 | 2014 | 2013 | ||||
Bell Canada | (348 | ) | (245 | ) | (64 | ) | (64 | ) |
Bell Media | (43 | ) | (40 | ) | (1 | ) | – | |
Bell Aliant | (292 | ) | (56 | ) | (8 | ) | (9 | ) |
Total | (683 | ) | (341 | ) | (73 | ) | (73 | ) |
Comprised of: | ||||||||
Contributions to DB pension plans and OPEB plans(1) | (591 | ) | (260 | ) | (73 | ) | (73 | ) |
Contributions to DC pension plans | (92 | ) | (81 | ) | – | – | ||
| (1) | Includes voluntary contributions of $350 million in 2014. |
We expect to contribute approximately $225 million to our DB pension plans in 2015, subject to actuarial valuations being completed. We expect to pay approximately $80 million to beneficiaries under OPEB plans and to contribute approximately $95 million to the DC pension plans in 2015.
BCE Inc. 2014 ANNUAL REPORT 145 | |||
NOTES TO CONSOLIDATED FINANCIAL STATEMENTS | |||
| Note 23 Other non-current liabilities |
FOR THE YEAR ENDED DECEMBER 31 | NOTE | 2014 | 2013 | |||
Long-term disability benefits obligation | 261 | 224 | ||||
CRTC tangible benefits obligation | 24 | 222 | 250 | |||
CRTC deferral account obligation | 24 | 150 | 184 | |||
Maple Leaf Sports and Entertainment Ltd. (MLSE) financial liability(1) | 24 | 135 | 135 | |||
Deferred revenue on long-term contracts | 96 | 99 | ||||
Future tax liabilities | 81 | 88 | ||||
Other | 576 | 478 | ||||
Total other non-current liabilities | 1,521 | 1,458 |
| (1) | Represents BCE’s obligation to repurchase the BCE Master Trust Fund’s (Master Trust) 9% interest in MLSE at a price not less than an agreed minimum price should the Master Trust exercise its put option. The obligation to repurchase is marked to market each reporting period and the gain or loss is recorded inOther income (expense). |
| Note 24 Financial and capital management |
Financial management
Management’s objectives are to protect BCE and its subsidiaries on a consolidated basis against material economic exposures and variability of results from various financial risks that include credit risk, liquidity risk, foreign currency risk, interest rate risk and equity price risk.
DERIVATIVES
We use derivative instruments to manage our exposure to foreign currency risk, interest rate risk and changes in the price of BCE common shares under our share-based payment plans.
The following derivative instruments were outstanding during 2014 and/or 2013:
- foreign currency forward contracts and options that manage the foreign currency risk of certain purchase commitments
- interest rate swaps that hedge interest rate risk on a portion of our long-term debt
- forward contracts on BCE common shares that mitigate the cash flow exposure related to share-based payment plans
- cross currency basis swaps that hedge foreign currency risk on a portion of our long-term debt due within one year
- interest rate locks on future debt issuances
FAIR VALUE
Fair value is the price that would be received to sell an asset or paid to transfer a liability in an orderly transaction between market participants at the measurement date.
Certain fair value estimates are affected by assumptions we make about the amount and timing of future cash flows and discount rates, all of which reflect varying degrees of risk. Income taxes and other expenses that would be incurred on disposition of financial instruments are not reflected in the fair values. As a result, the fair values are not the net amounts that would be realized if these instruments were settled.
The carrying values of our cash and cash equivalents, trade and other receivables, assets held for sale, trade payables and accruals, compensation payable, severance and other costs payable, interest payable, notes payable, bank advances, and loans secured by trade receivables approximate fair value as they are short-term.
The following table provides the fair value details of financial instruments measured at amortized cost in the statements of financial position.
| DECEMBER 31, 2014 | DECEMBER 31, 2013 | ||||||||||
| CARRYING | FAIR | CARRYING | FAIR | ||||||||
| FAIR VALUE METHODOLOGY | NOTE | VALUE | VALUE | VALUE | VALUE | ||||||
CRTC tangible benefits obligation | Present value of estimated future cash flows discounted using observable market interest rates | 19,23 | 285 | 289 | 350 | 350 | |||||
CRTC deferral account obligation | Present value of estimated future cash flows discounted using observable market interest rates | 19,23 | 174 | 191 | 264 | 283 | |||||
Debentures, finance leases and other debt | Quoted market price of debt or present value of future cash flows discounted using observable market interest rates | 21 | 17,723 | 20,059 | 17,019 | 18,714 | |||||
146 BCE Inc. 2014 ANNUAL REPORT | |||
NOTES TO CONSOLIDATED FINANCIAL STATEMENTS | |||
The following table provides the fair value details of financial instruments measured at fair value in the statements of financial position.
| FAIR VALUE AT DECEMBER 31 | |||||||||
| QUOTED PRICES IN | |||||||||
| CARRYING VALUE OF | ACTIVE MARKETS FOR | OBSERVABLE MARKET | NON-OBSERVABLE | ||||||
| ASSET (LIABILITY) AT | IDENTICAL ASSETS | DATA | MARKET INPUTS | ||||||
| NOTE | DECEMBER 31 | (LEVEL 1) | (LEVEL 2) | (1) | (LEVEL 3) | (2) | |||
2014 | ||||||||||
AFS publicly-traded and privately-held investments | 17 | 107 | 17 | – | 90 | |||||
Derivative financial instruments | 276 | – | 276 | – | ||||||
MLSE financial liability | 23 | (135 | ) | – | – | (135 | ) | |||
Other | 12 | – | 22 | (10 | ) | |||||
2013 | ||||||||||
AFS publicly-traded and privately-held investments | 17 | 91 | 14 | – | 77 | |||||
Derivative financial instruments | 209 | – | 209 | – | ||||||
MLSE financial liability | 23 | (135 | ) | – | – | (135 | ) | |||
| (1) | Observable market data such as equity prices, interest rates, swap rate curves and foreign currency exchange rates. |
| (2) | Non-observable market inputs such as discounted cash flows. A reasonable change in our assumptions would not result in a significant increase (decrease) to our level 3 financial instruments. |
CREDIT RISK
We are exposed to credit risk from operating activities and certain financing activities, the maximum exposure of which is represented by the carrying amounts reported on the statements of financial position.
We are exposed to credit risk if counterparties to our trade receivables and derivative instruments are unable to meet their obligations. The concentration of credit risk from our customers is minimized because we have a large and diverse customer base. There was minimal credit risk relating to derivative instruments at December 31, 2014 and 2013. We deal with institutions that have investment-grade credit ratings and as such we expect that they will be able to meet their obligations. We regularly monitor our credit risk and credit exposure.
The following table provides the change in allowance for doubtful accounts for trade receivables.
| 2014 | 2013 | ||
Balance, January 1 | (79 | ) | (97 | ) |
Additions | (101 | ) | (123 | ) |
Use | 111 | 145 | ||
Acquisition through business combinations | – | (4 | ) | |
Balance, December 31 | (69 | ) | (79 | ) |
The following table provides further details on trade receivables not impaired.
AT DECEMBER 31 | 2014 | 2013 | ||
Trade receivables not past due | 2,267 | 2,274 | ||
Trade receivables past due and not impaired | ||||
Under 60 days | 317 | 325 | ||
60 to 120 days | 352 | 365 | ||
Over 120 days | 63 | 31 | ||
Trade receivables, net of allowance for doubtful accounts | 2,999 | 2,995 |
In many instances, trade receivables are written off directly to bad debt expense if the account has not been collected after a predetermined period of time.
LIQUIDITY RISK
We generate enough cash from our operating activities to fund our operations and fulfill our obligations as they become due. We have sufficient committed bank facilities in place should our cash requirements exceed cash generated from our operations.
The following table is a maturity analysis for recognized financial liabilities at December 31, 2014 for each of the next five years and thereafter.
AT DECEMBER 31, 2014 | NOTE | 2015 | 2016 | 2017 | 2018 | 2019 | THEREAFTER | TOTAL | ||||||||
Long-term debt | 21 | 1,031 | 2,389 | 1,130 | 1,729 | 1,309 | 7,924 | 15,512 | ||||||||
Notes payable and bank advances | 20 | 1,454 | – | – | – | – | – | 1,454 | ||||||||
Minimum future lease payments under finance leases | 14 | 491 | 444 | 313 | 260 | 237 | 1,405 | 3,150 | ||||||||
Loan secured by trade receivables | 20 | 921 | – | – | – | – | – | 921 | ||||||||
Interest payable on long-term debt, notes payable, bank advances and loan secured by trade receivables | 652 | 554 | 510 | 470 | 415 | 4,548 | 7,149 | |||||||||
MLSE financial liability | 23 | – | – | 135 | – | – | – | 135 | ||||||||
Net interest receipts on derivatives | (23 | ) | (22 | ) | (11 | ) | – | – | – | (56 | ) | |||||
Total | 4,526 | 3,365 | 2,077 | 2,459 | 1,961 | 13,877 | 28,265 |
We are also exposed to liquidity risk for financial liabilities due within one year as shown in the statements of financial position.
BCE Inc. 2014 ANNUAL REPORT 147 | |||
NOTES TO CONSOLIDATED FINANCIAL STATEMENTS | |||
MARKET RISK
CURRENCY EXPOSURES
We use forward contracts, options and cross currency basis swaps to manage foreign currency risk related to anticipated transactions and certain foreign currency debt.
A 10% depreciation (appreciation) in the value of the Canadian dollar relative to the U.S. dollar would result in a gain of $9 million (loss of $21 million) recognized in net earnings at December 31, 2014 and a gain (loss) of $57 million recognized in other comprehensive income at December 31, 2014, with all other variables held constant.
The following table provides further details on our outstanding foreign currency forward contracts, options and cross currency basis swaps as at December 31, 2014.
| BUY | AMOUNTS TO | AMOUNTS | ||||||||||
| TYPE OF HEDGE | CURRENCY | RECEIVE IN USD | SELL CURRENCY | TO PAY IN CAD | MATURITY | HEDGED ITEM | ||||||
| Cash flow | USD | 409 | CAD | 445 | 2015 | Purchase commitments | ||||||
| Cash flow | USD | 431 | CAD | 498 | 2015 | Commercial paper | ||||||
| Cash flow | USD | 269 | CAD | 291 | 2016–2017 | Purchase commitments | ||||||
| Cash flow | USD | 877 | CAD | 1,000 | 2015 | Credit facility | ||||||
| Economic | USD | 146 | CAD | 162 | 2015 | Purchase commitments | ||||||
| Economic – call options | USD | 253 | CAD | 272 | 2015 | Purchase commitments | ||||||
| Economic – put options | USD | 506 | CAD | 543 | 2015 | Purchase commitments |
INTEREST RATE EXPOSURES
We use interest rate swaps to manage the mix of fixed and floating interest rates of our debt. We also use interest rate locks to hedge the interest rates on future debt issuances.
As at December 31, 2014, we had interest rate locks with a notional amount of $500 million which mature in 2015.
The following table shows the interest rate swap outstanding at December 31, 2014.
| TYPE OF HEDGE | NOTIONAL AMOUNT | RECEIVE INTEREST RATE | PAY INTEREST RATE | MATURITY | HEDGED ITEM | |||||
| Fair value | 700 | 5.00 | % | 3-month CDOR(1) + 0.42 | % | 2017 | Long-term debt |
| (1) | Canadian dollar offered rate. |
In 2014, we recognized a loss of $15 million (2013 – $22 million) on an interest rate swap used as a fair value hedge of long-term debt and an offsetting gain of $15 million (2013 – $21 million) on the corresponding long-term debt.
A 1% decrease (increase) in interest rates would result in a gain (loss) of $27 million recognized in net earnings at December 31, 2014 and in a gain of $32 million (loss of $36 million) recognized on other comprehensive income as at December 31, 2014.
For our post-employment benefit plans, the interest rate risk is managed using a liability matching approach which reduces the exposure of the DB plan to a mismatch between investment growth and obligation growth.
EQUITY PRICE EXPOSURES
We use equity forward contracts on BCE’s common shares to economically hedge the cash flow exposure related to share-based payment plans. See Note 26, Share-based payments for details on our share-based payment arrangements. The fair value of our equity forward contracts at December 31, 2014 was $157 million (2013 – $100 million).
A 10% increase (decrease) in the market price of BCE’s common shares at December 31, 2014 would result in a gain (loss) of $69 million recognized in net earnings for 2014, all other variables held constant.
| Capital management |
We have various capital policies, procedures and processes which are utilized to achieve our objectives for capital management. These include optimizing our cost of capital and maximizing shareholder return while balancing the interests of our stakeholders.
Our definition of capital includes equity attributable to BCE shareholders, debt, and cash and cash equivalents.
Concurrent with the announcement of the Privatization of Bell Aliant on July 23, 2014, Bell Canada increased its net debt(1)leverage ratio target range from 1.5 to 2.0 times Adjusted EBITDA(2) to 1.75 to 2.25 times Adjusted EBITDA. We monitor our capital structure and make adjustments, including to our dividend policy, as required. At December 31, 2014, we had exceeded our internal net debt to Adjusted EBITDA ratio by 0.34. This increase over our internal ratio does not create risk to our investment-grade credit rating.
On February 4, 2015, the board of directors of BCE approved an increase of 5.3% in the annual dividend on BCE’s common shares, from $2.47 to $2.60 per common share. In addition, the board of directors declared a quarterly dividend of $0.65 per common share, payable on April 15, 2015 to shareholders of record at March 16, 2015.
| (1) | We define net debt as debt due within one year plus long-term debt and 50% of preferred shares less cash and cash equivalents. |
| (2) | For the purposes of calculating the net debt leverage ratio, Adjusted EBITDA is twelve-month trailing Adjusted EBITDA defined as operating revenues less operating costs as shown in our income statement. |
148 BCE Inc. 2014 ANNUAL REPORT | |||
NOTES TO CONSOLIDATED FINANCIAL STATEMENTS | |||
On February 5, 2014, the board of directors of BCE approved an increase of 6.0% in the annual dividend on BCE’s common shares, from $2.33 to $2.47 per common share.
The following table summarizes some of our key ratios used to monitor and manage Bell Canada’s capital structure. As of 2014, we report these ratios at the BCE level as opposed to the Bell level. Comparative figures are also reported at the BCE level.
AT DECEMBER 31 | 2014 | 2013 | ||
Net debt to Adjusted EBITDA | 2.59 | 2.51 | ||
Adjusted EBITDA to net interest expense(1) | 8.38 | 8.17 |
| (1) | Net interest expense excludes interest on post-employment benefit obligations and includes 50% of preferred dividends. |
| Note 25 Share capital |
Preferred shares
BCE’s articles of amalgamation provide for an unlimited number of First Preferred Shares and Second Preferred Shares, all without par value. The terms set out in the articles authorize BCE’s directors to issue the shares in one or more series and to set the number of shares and the conditions for each series.
The following table is a summary of the principal terms of BCE’s First Preferred Shares. There were no Second Preferred Shares issued and outstanding at December 31, 2014. BCE’s articles of amalgamation, as amended, describe the terms and conditions of these shares in detail.
| NUMBER OF SHARES | STATED CAPITAL | |||||||||||||||||
| ANNUAL | ||||||||||||||||||
| DIVIDEND | CONVERTIBLE | REDEMP- | ISSUED AND | DEC. 31, | DEC. 31, | |||||||||||||
| SERIES | RATE | INTO | CONVERSION DATE | REDEMPTION DATE | TION PRICE | AUTHORIZED | OUTSTANDING | 2014 | 2013 | |||||||||
| Q | floating | Series R | December 1, 2015 | At any time | $25.50 | 8,000,000 | – | – | – | |||||||||
| R(1) | 4.49% | Series Q | December 1, 2015 | December 1, 2015 | $25.00 | 8,000,000 | 8,000,000 | 200 | 200 | |||||||||
| S | floating | Series T | November 1, 2016 | At any time | $25.50 | 8,000,000 | 3,606,225 | 90 | 90 | |||||||||
| T(1) | 3.393% | Series S | November 1, 2016 | November 1, 2016 | $25.00 | 8,000,000 | 4,393,775 | 110 | 110 | |||||||||
| Y | floating | Series Z | December 1, 2017 | At any time | $25.50 | 10,000,000 | 8,772,468 | 219 | 219 | |||||||||
| Z(1) | 3.152% | Series Y | December 1, 2017 | December 1, 2017 | $25.00 | 10,000,000 | 1,227,532 | 31 | 31 | |||||||||
| AA(1) | 3.45% | Series AB | September 1, 2017 | September 1, 2017 | $25.00 | 20,000,000 | 10,144,302 | 259 | 259 | |||||||||
| AB | floating | Series AA | September 1, 2017 | At any time | $25.50 | 20,000,000 | 9,855,698 | 251 | 251 | |||||||||
| AC(1) | 3.55% | Series AD | March 1, 2018 | March 1, 2018 | $25.00 | 20,000,000 | 5,069,935 | 129 | 129 | |||||||||
| AD | floating | Series AC | March 1, 2018 | At any time | $25.50 | 20,000,000 | 14,930,065 | 381 | 381 | |||||||||
| AE | floating | Series AF | February 1, 2015 | At any time | $25.50 | 24,000,000 | 1,422,900 | 36 | 36 | |||||||||
| AF(1) | 4.541% | Series AE | February 1, 2015 | February 1, 2015 | $25.00 | 24,000,000 | 14,577,100 | 364 | 364 | |||||||||
| AG(1) | 4.50% | Series AH | May 1, 2016 | May 1, 2016 | $25.00 | 22,000,000 | 10,841,056 | 271 | 271 | |||||||||
| AH | floating | Series AG | May 1, 2016 | At any time | $25.50 | 22,000,000 | 3,158,944 | 79 | 79 | |||||||||
| AI(1) | 4.15% | Series AJ | August 1, 2016 | August 1, 2016 | $25.00 | 22,000,000 | 10,754,990 | 269 | 269 | |||||||||
| AJ | floating | Series AI | August 1, 2016 | At any time | $25.50 | 22,000,000 | 3,245,010 | 81 | 81 | |||||||||
| AK(1) | 4.15% | Series AL | December 31, 2016 | December 31, 2016 | $25.00 | 25,000,000 | 25,000,000 | 625 | 625 | |||||||||
| AL(2) | floating | Series AK | December 31, 2021 | 25,000,000 | – | – | – | |||||||||||
| AM(1) | 4.85% | Series AN | March 31, 2016 | March 31, 2016 | $25.00 | 30,000,000 | 11,500,000 | 263 | – | |||||||||
| AN(2) | floating | Series AM | March 31, 2021 | 30,000,000 | – | – | – | |||||||||||
| AO(1) | 4.55% | Series AP | March 31, 2017 | March 31, 2017 | $25.00 | 30,000,000 | 4,600,000 | 118 | – | |||||||||
| AP(2) | floating | Series AO | March 31, 2022 | 30,000,000 | – | – | – | |||||||||||
| AQ(1) | 4.25% | Series AR | September 30, 2018 | September 30, 2018 | $25.00 | 30,000,000 | 9,200,000 | 228 | – | |||||||||
| AR(2) | floating | Series AQ | September 30, 2023 | 30,000,000 | – | – | – | |||||||||||
| 4,004 | 3,395 | |||||||||||||||||
| (1) | BCE may redeem each of these series of First Preferred Shares on the applicable redemption date and every five years after that date. |
| (2) | If Series AL, AN, AP or AR First Preferred Shares are issued on December 31, 2016, March 31, 2016, March 31, 2017 and September 30, 2018, respectively, BCE may redeem such shares at $25.00 per share on December 31, 2021, March 31, 2021, March 31, 2022 and September 30, 2023, respectively, and every five years thereafter (collectively, a Series conversion date). Alternatively, BCE may redeem Series AL, AN, AP or AR First Preferred Shares at $25.50 per share on any date after December 31, 2016, March 31, 2016, March 31, 2017 and September 30, 2018, respectively, which is not a Series conversion date. |
VOTING RIGHTS
All of the issued and outstanding First Preferred Shares at December 31, 2014 are non-voting, except under special circumstances, when the holders are entitled to one vote per share.
BCE Inc. 2014 ANNUAL REPORT 149 | |||
NOTES TO CONSOLIDATED FINANCIAL STATEMENTS | |||
PRIORITY AND ENTITLEMENT TO DIVIDENDS
The First Preferred Shares of all series rank on a parity with each other and in priority to all other shares of BCE with respect to payment of dividends and with respect to distribution of assets in the event of liquidation, dissolution or winding up of BCE.
Holders of Series R, T, Z, AA, AC, AF, AG, AI, AK, AM, AO and AQ First Preferred Shares are entitled to fixed cumulative quarterly dividends. The dividend rate on these shares is reset every five years, as set out in BCE’s articles of amalgamation, as amended.
Holders of Series S, Y, AB, AD, AE, AH and AJ First Preferred Shares are entitled to floating adjustable cumulative monthly dividends. The floating dividend rate on these shares is calculated every month, as set out in BCE’s articles of amalgamation, as amended.
Dividends on all series of First Preferred Shares are paid as and when declared by the board of directors of BCE.
CONVERSION FEATURES
All of the issued and outstanding First Preferred Shares at December 31, 2014 are convertible at the holder’s option into another associated series of First Preferred Shares on a one-for-one basis according to the terms set out in BCE’s articles of amalgamation, as amended.
ISSUE OF BCE FIRST PREFERRED SHARES IN EXCHANGE FOR PREFCO PREFERRED SHARES
BCE issued Series AM, AO and AQ First Preferred Shares in exchange for the issued and outstanding preferred shares of Prefco, having the same financial terms as the existing Prefco preferred shares, as described in Note 3, Privatization of Bell Aliant.
CONVERSION OF FIRST PREFERRED SHARES
On February 1, 2015, 7,904,105 of BCE’s 14,577,100 Cumulative Redeemable First Preferred Shares, Series AF (Series AF Preferred Shares) were converted, on a one-for-one basis, into Cumulative Redeemable First Preferred Shares, Series AE (Series AE Preferred Shares). In addition, on February 1, 2015, 34,872 of BCE’s 1,422,900 Series AE Preferred Shares were converted, on a one-for-one basis, into Series AF Preferred Shares. As a result, 6,707,867 Series AF Preferred Shares and 9,292,133 Series AE Preferred Shares remain outstanding.
For the five year period beginning on February 1, 2015, the Series AF Preferred Shares will pay a quarterly fixed dividend based on an annual dividend rate of 3.11%. The Series AE Preferred Shares will continue to pay a monthly floating adjustable cash dividend.
| Common shares and Class B shares |
BCE’s articles of amalgamation provide for an unlimited number of voting common shares and non-voting Class B shares, all without par value. The common shares and the Class B shares rank equally in the payment of dividends and in the distribution of assets if BCE is liquidated, dissolved or wound up, after payments due to the holders of preferred shares. No Class B shares were outstanding at December 31, 2014 and 2013.
The following table provides details about the outstanding common shares of BCE.
| 2014 | 2013 | ||||||||
| NOTE | NUMBER OF SHARES | STATED CAPITAL | NUMBER OF SHARES | STATED CAPITAL | |||||
Outstanding, January 1 | 775,892,556 | 13,629 | 775,381,645 | 13,611 | ||||||
Shares issued for the Privatization of Bell Aliant | 3 | 60,879,365 | 2,928 | – | – | |||||
Shares issued under employee stock option plan | 26 | 1,372,006 | 53 | 420,822 | 14 | |||||
Shares issued under ESP | 2,186,426 | 107 | 90,089 | 4 | ||||||
Outstanding, December 31 | 840,330,353 | 16,717 | 775,892,556 | 13,629 | ||||||
CONTRIBUTED SURPLUS
Contributed surplus in 2014 includes premiums in excess of par value upon the issuance of BCE common shares.
As described in Note 3, Privatization of Bell Aliant, contributed surplus decreased in 2014 by $1,499 million, as compared to 2013, which represents primarily the amount originally recorded to contributed surplus from the distribution of fund units to the holders of BCE common shares by way of a return of capital when Bell Aliant converted from a corporate structure to an income fund in 2006.
| Note 26 Share-based payments |
The following share-based payment amounts are included in the income statements as operating costs.
FOR THE YEAR ENDED DECEMBER 31 | 2014 | 2013 | ||
ESPs | (30 | ) | (35 | ) |
RSUs/PSUs | (49 | ) | (44 | ) |
Deferred share plans – Bell Aliant | (10 | ) | (10 | ) |
Other(1) | (10 | ) | (9 | ) |
Total share-based payments | (99 | ) | (98 | ) |
| (1) | Includes DSUs and stock options. |
150 BCE Inc. 2014 ANNUAL REPORT | |||
NOTES TO CONSOLIDATED FINANCIAL STATEMENTS | |||
| Description of the plans |
ESPs
ESPs are designed to encourage employees of BCE and its participating subsidiaries to own shares of BCE. Each year, employees can choose to have a certain percentage of their eligible annual earnings withheld through regular payroll deductions for the purchase of BCE common shares. In some cases, the employer also will contribute a percentage of the employee’s eligible annual earnings to the plan, up to a specified maximum. Dividends are credited to the participant’s account on each dividend payment date and are equivalent in value to the dividends paid on BCE common shares.
The BCE ESP allows employees to contribute up to 12% of their annual earnings with a maximum employer contribution of 2%.
Employer contributions to the BCE plan are subject to employees holding their shares for a two-year vesting period. Dividends related to employer contributions are also subject to the two-year vesting period.
The trustee of the ESP buys BCE common shares for the participants on the open market, by private purchase or from treasury. BCE determines the method the trustee uses to buy the shares.
At December 31, 2014, 10,135,275 common shares were authorized for issuance from treasury under the BCE ESP.
The following table summarizes the status of unvested employer contributions at December 31, 2014 and 2013.
NUMBER OF ESPs | 2014 | 2013 | ||
Unvested contributions, January 1 | 1,230,265 | 1,290,286 | ||
Contributions(1) | 631,038 | 659,568 | ||
Dividends credited | 60,621 | 65,067 | ||
Vested | (645,141 | ) | (687,157 | ) |
Forfeited | (123,130 | ) | (97,499 | ) |
Unvested contributions, December 31 | 1,153,653 | 1,230,265 |
| (1) | The weighted average fair value of the ESPs contributed was $49 and $45 in 2014 and 2013, respectively. |
RSUs/PSUs
RSUs/PSUs are granted to executives and other key employees. The value of an RSU/PSU at the grant date is equal to the value of one BCE common share. Dividends in the form of additional RSUs/PSUs are credited to the participant’s account on each dividend payment date and are equivalent in value to the dividend paid on BCE common shares. Executives and other key employees are granted a specific number of RSUs/PSUs for a given performance period based on their position and level of contribution. RSUs/PSUs vest fully after three years of continuous employment from the date of grant and, in certain cases, if performance objectives are met as determined by the board of directors.
The following table summarizes outstanding RSUs/PSUs at December 31, 2014 and 2013.
NUMBER OF RSUs/PSUs | 2014 | 2013 | ||
Outstanding, January 1 | 3,733,830 | 2,468,405 | ||
Granted(1) | 1,058,031 | 1,219,042 | ||
Dividends credited | 184,590 | 174,989 | ||
Settled | (1,259,067 | ) | (68,182 | ) |
Forfeited | (100,417 | ) | (60,424 | ) |
Outstanding, December 31 | 3,616,967 | 3,733,830 | ||
Vested, December 31(2) | 1,307,824 | 1,210,791 |
| (1) | The weighted average fair value of the RSUs/PSUs granted was $48 and $45 in 2014 and 2013, respectively. |
| (2) | The RSUs/PSUs vested on December 31, 2014 were fully settled in February 2015 with BCE common shares and/or DSUs. |
DEFERRED SHARE PLANS – BELL ALIANT
Participants have the option to receive either BCE common shares or a cash equivalent for each vested deferred share upon qualifying for payout under the terms of the grant. The carrying amount of the liability recorded in the statement of financial position and related to the deferred share plans was $52 million at December 31, 2014.
STOCK OPTIONS
Under BCE’s long-term incentive plans, BCE may grant options to executives to buy BCE common shares. The subscription price of a grant is based on the higher of:
- the volume-weighted average of the trading price on the trading day immediately prior to the effective date of the grant
- the volume-weighted average of the trading price for the last five consecutive trading days ending on the trading day immediately prior to the effective date of the grant
At December 31, 2014, 22,881,173 common shares were authorized for issuance under these plans. Options vest fully after three years of continuous employment from the date of grant. All options become exercisable when they vest and can be exercised for a period of seven years from the date of grant. Special vesting provisions may apply if:
- there is a change in control of BCE and the option holder’s employment ends
- the option holder is employed by a designated subsidiary of BCEand BCE’s ownership interest in that subsidiary falls below the percentage set out in the plan
BCE Inc. 2014 ANNUAL REPORT 151 | |||
NOTES TO CONSOLIDATED FINANCIAL STATEMENTS | |||
The following table summarizes BCE’s outstanding stock options at December 31, 2014 and 2013.
| 2014 | 2013 | ||||||||
| WEIGHTED AVERAGE | WEIGHTED AVERAGE | ||||||||
| NOTE | NUMBER OF OPTIONS | EXERCISE PRICE ($) | NUMBER OF OPTIONS | EXERCISE PRICE ($) | |||||
Outstanding, January 1 | 7,870,231 | $40 | 5,310,356 | $37 | ||||||
Granted | 2,915,361 | $48 | 2,993,902 | $44 | ||||||
Exercised(1) | 25 | (1,372,006 | ) | $36 | (420,822 | ) | $30 | |||
Forfeited | (135,396 | ) | $44 | (13,205 | ) | $40 | ||||
Outstanding, December 31 | 9,278,190 | $43 | 7,870,231 | $40 | ||||||
Exercisable, December 31 | 865,600 | $36 | – | – | ||||||
| (1) | The weighted average share price for options exercised was $49 and $45 in 2014 and 2013, respectively. |
The following table provides additional information about BCE’s stock option plans at December 31, 2014.
| STOCK OPTIONS OUTSTANDING | |||||
| WEIGHTED AVERAGE | WEIGHTED AVERAGE | ||||
RANGE OF EXERCISE PRICES | NUMBER | REMAINING LIFE | EXERCISE PRICE ($) | |||
$30–$39 | 865,600 | 3.9 | $36 | |||
$40 or more | 8,412,590 | 5.9 | $44 | |||
| 9,278,190 | 5.7 | $43 | |||
ASSUMPTIONS USED IN STOCK OPTION PRICING MODEL
The fair value of options granted was determined using a variation of a binomial option pricing model that takes into account factors specific to the share incentive plans, such as the vesting period. The following table shows the principal assumptions used in the valuation.
| 2014 | |
Weighted average fair value per option granted | $2.37 | |
Weighted average share price | $48 | |
Weighted average exercise price | $48 | |
Dividend yield | 5.2 | % |
Expected volatility | 15 | % |
Risk-free interest rate | 1.5 | % |
Expected life (years) | 4.5 |
Expected volatilities are based on the historical volatility of BCE’s share price. The risk-free rate used is equal to the yield available on Government of Canada bonds at the date of grant with a term equal to the expected life of the options.
DSUs
Eligible bonuses and RSUs/PSUs may be paid in the form of DSUs when executives or other key employees elect to or are required to participate in the plan. The value of a DSU at the issuance date is equal to the value of one BCE common share. For non-management directors, compensation is paid in DSUs until the minimum share ownership requirement is met or as elected by the directors thereafter. There are no vesting requirements relating to DSUs. Dividends in the form of additional DSUs are credited to the participant’s account on each dividend payment date and are equivalent in value to the dividends paid on BCE common shares. DSUs are settled when the holder leaves the company.
The following table summarizes the status of outstanding DSUs at December 31, 2014 and 2013.
NUMBER OF DSUs | 2014 | 2013 | ||
Outstanding, January 1 | 3,625,053 | 3,305,861 | ||
Issued(1) | 142,231 | 230,718 | ||
Settlement of RSUs/PSUs | 415,091 | – | ||
Dividends credited | 202,885 | 182,065 | ||
Settled | (268,733 | ) | (93,591 | ) |
Outstanding, December 31 | 4,116,527 | 3,625,053 |
| (1) | The weighted average fair value of the DSUs issued was $48 and $44 in 2014 and 2013, respectively. |
152 BCE Inc. 2014 ANNUAL REPORT | |||
NOTES TO CONSOLIDATED FINANCIAL STATEMENTS | |||
| Note 27 Commitments and contingencies |
Commitments
The following table is a summary of our contractual obligations at December 31, 2014 that are due in each of the next five years and thereafter.
| THERE- | |||||||||||||||
| NOTE | 2015 | 2016 | 2017 | 2018 | 2019 | AFTER | TOTAL | ||||||||
Operating leases | 295 | 249 | 211 | 161 | 134 | 748 | 1,798 | |||||||||
Commitments for property, plant and equipment and intangible assets | 851 | 573 | 441 | 450 | 321 | 1,617 | 4,253 | |||||||||
Purchase obligations | 1,443 | 448 | 360 | 188 | 178 | 1,005 | 3,622 | |||||||||
Glentel acquisition | 4 | 670 | – | – | – | – | – | 670 | ||||||||
Total | 3,259 | 1,270 | 1,012 | 799 | 633 | 3,370 | 10,343 |
BCE’s significant operating leases are for office premises, cellular tower sites and retail outlets with lease terms ranging from 1 to 33 years. These leases are non-cancellable and are renewable at the end of the lease period. Rental expense relating to operating leases was $335 million in 2014 and $300 million in 2013.
Purchase obligations consist of contractual obligations under service and product contracts for operating expenditures. Our commitments for property, plant and equipment and intangible assets include program and feature film rights and investments to expand and update our networks to meet customer demand.
| Contingencies |
We become involved in various legal proceedings as a part of our business. While we cannot predict the final outcome or timing of the legal proceedings pending at December 31, 2014, based on the information currently available and management’s assessment of the merits of such legal proceedings, management believes that the resolution of these legal proceedings will not have a material and negative effect on our financial statements. We believe that we have strong defences and we intend to vigorously defend our positions.
| Note 28 Related party transactions |
Subsidiaries
The following table shows BCE’s significant subsidiaries at December 31, 2014. BCE has other subsidiaries which have not been included in the table as each represents less than 10% individually and less than 20% in aggregate of total consolidated revenues.
All of these subsidiaries are incorporated in Canada and provide services to each other in the normal course of operations. The value of these transactions is eliminated on consolidation.
| OWNERSHIP PERCENTAGE | |||
SUBSIDIARY | 2014 | 2013 | ||
Bell Canada | 100.0 | % | 100.0 | % |
Bell Mobility Inc. | 100.0 | % | 100.0 | % |
Bell Aliant(1) | 100.0 | % | 44.1 | % |
Bell Media Inc. | 100.0 | % | 100.0 | % |
| (1) | In 2014, BCE acquired all of the issued and outstanding common shares of Bell Aliant that it did not already own. Refer to Note 3,Privatization of Bell Aliant. At December 31, 2013, BCE controlled Bell Aliant through its right to appoint a majority of the board of directors of Bell Aliant. |
| Transactions with joint arrangements and associates |
During 2014 and 2013, BCE provided telecommunication services and received programming content and other services in the normal course of business on an arm’s length basis to and from its joint arrangements and associates. Our joint arrangements are comprised of MLSE, Inukshuk, Enstream Inc., Cirque du Soleil Media Limited Partnership and Dome Productions Partnership. Our associates are comprised of Summerhill Ventures LLP, Q9 Networks Inc., The NHL Network Inc., Suretap Wallet Inc. and, until July 2013, Viewer’s Choice Canada Inc.
BCE recognized revenues and incurred expenses with our associates and joint arrangements of $6 million (2013 – $7 million) and $56 million (2013 – $56 million), respectively.
BCE Inc. 2014 ANNUAL REPORT 153 | |||
NOTES TO CONSOLIDATED FINANCIAL STATEMENTS | |||
| BCE Master Trust Fund |
Bimcor Inc. (Bimcor), a wholly-owned subsidiary of Bell Canada, is the administrator of the Master Trust. Bimcor recognized management fees of $12 million from the Master Trust for 2014 and 2013. The details of BCE’s post-employment benefit plans are set out in Note 22, Post-employment benefit plans.
| Compensation of key management personnel and board of directors |
The following table includes compensation of the key management personnel and board of directors for the years ended December 31, 2014 and 2013 included in our income statements. Key management personnel are the company’s Chief Executive Officer (CEO) and the executives who report directly to the CEO.
FOR THE YEAR ENDED DECEMBER 31 | 2014 | 2013 | ||
Wages, salaries, fees and related taxes and benefits | (24 | ) | (24 | ) |
Post-employment benefit plans and OPEBs cost | (4 | ) | (4 | ) |
Share-based compensation | (26 | ) | (25 | ) |
Key management personnel and board of directors compensation expense | (54 | ) | (53 | ) |
| Note 29 Significant partly-owned subsidiaries |
The following tables show summarized financial information for our subsidiaries with significant NCI.
Summarized statements of financial position
| BELL ALIANT | (1) | CTV SPECIALTY(1) | |||
FOR THE YEAR ENDED DECEMBER 31 | 2013 | 2014 | 2013 | |||
Current assets | 408 | 255 | 378 | |||
Non-current assets | 4,584 | 999 | 1,004 | |||
Total assets | 4,992 | 1,254 | 1,382 | |||
Current liabilities | 712 | 152 | 448 | |||
Non-current liabilities | 3,117 | 185 | 189 | |||
Total liabilities | 3,829 | 337 | 637 | |||
Total equity attributable to BCE shareholders | 221 | 643 | 522 | |||
NCI(2) | 942 | 274 | 223 | |||
| (1) | In 2014, BCE acquired all the issued and outstanding shares of Bell Aliant that it did not already own, therefore eliminating the 55.9% ownership interest held by NCI. Refer to Note 3,Privatization of Bell Aliant. At December 31, 2013 and 2014, the ownership interest held by NCI in CTV Specialty was 29.9%. Both of Bell Aliant and CTV Specialty were incorporated and operated in Canada as at such dates. |
| (2) | The Bell Aliant NCI was greater than its share of net assets by $662 million for 2013, primarily due to preferred shares, all of which were owned by the NCI. |
| Selected income and cash flow information |
| BELL ALIANT(1) | CTV SPECIALTY(2) | ||||||
FOR THE YEAR ENDED DECEMBER 31 | 2014 | 2013 | 2014 | 2013 | ||||
Operating revenues | 2,757 | 2,759 | 807 | 781 | ||||
Net earnings | 328 | 379 | 174 | 190 | ||||
Net earnings attributable to NCI | 165 | 224 | 53 | 58 | ||||
Total comprehensive income | 171 | 664 | 175 | 194 | ||||
Total comprehensive income attributable to NCI | 72 | 384 | 54 | 59 | ||||
Cash dividends paid to NCI | 143 | 270 | 2 | 13 | ||||
| (1) | Bell Aliant net earnings and total comprehensive income include $22 million and $28 million of dividends declared on preferred shares for 2014 and 2013, respectively. |
| (2) | CTV Specialty net earnings and total comprehensive income includes $2 million directly attributable to NCI for 2014 and 2013. |
154 BCE Inc. 2014 ANNUAL REPORT | |||
GLOSSARY | |||
| GLOSSARY |
| BOOK VALUE PER SHARE Total equity attributable to BCE shareholders, excluding preferred shares, divided by the number of common shares outstanding. DIVIDENDS DECLARED PER COMMON SHARE Common dividends declared divided by common shares outstanding at the end of the year. MARKET CAPITALIZATION BCE’s common share price at the end of the year multiplied by the number of common shares outstanding at the end of the year. PRICE TO BOOK RATIO BCE’s common share price at the end of the year divided by the book value per share at the end of the year. PRICE TO CASH FLOW RATIO BCE’s common share price at the end of the year divided by cash flow per common share. Cash flow per common share is cash flow from operating activities less capital expenditures, divided by the average number of common shares outstanding. | PRICE TO EARNINGS RATIO BCE’s common share price at the end of the year divided by earnings per share. RETURN ON EQUITY Net earnings attributable to common shareholders divided by total average equity attributable to BCE shareholders excluding preferred shares. TOTAL DEBT TO TOTAL ASSETS Total debt (including debt due within one year) divided by total assets. TOTAL DEBT TO TOTAL EQUITY Total debt (excluding notes payable and bank advances) divided by total equity. TOTAL SHAREHOLDER RETURN The change in the BCE share price for a specified period plus BCE dividends reinvested, divided by the BCE share price at the beginning of the period. |
BCE Inc. 2014 ANNUAL REPORT 155 |