Exhibit 99.1


For Bell to be recognized
by customers as Canada’s
leading communications
company
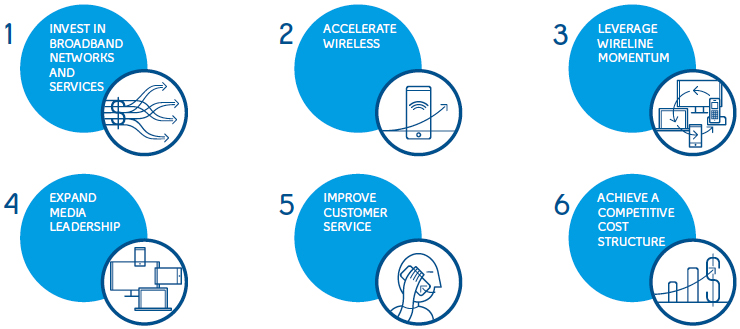
| OUR STRATEGIC IMPERATIVES | |
| Invest in broadband networks and services | 11 |
| Accelerate wireless | 12 |
| Leverage wireline momentum | 14 |
| Expand media leadership | 16 |
| Improve customer service | 18 |
| Achieve a competitive cost structure | 20 |

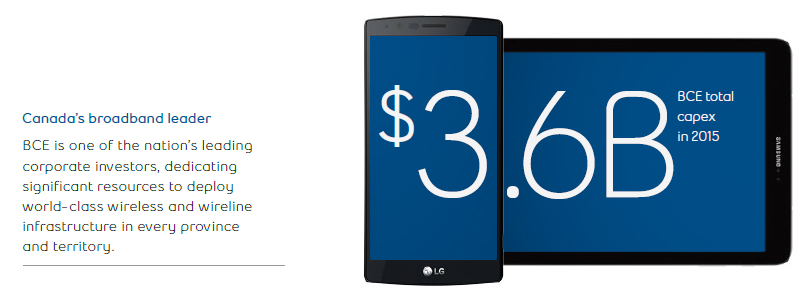
Bell is leading Canada’s broadband communications revolution, investing more than any other communications company in the fibre networks that carry advanced services, in the products and content that make the most of the power of those networks, and in the customer service that makes all of it accessible.
Through the rigorous execution of our 6 Strategic Imperatives, we gained further ground in the marketplace and delivered financial results that enable us to continue to invest in growth services that now account for 81% of revenue.
| Financial and operational highlights | 4 |
| Letters to shareholders | 6 |
| Strategic imperatives | 11 |
| Community investment | 22 |
| Bell archives | 24 |
| Management’s discussion and analysis (MD&A) | 28 |
| Reports on internal control | 112 |
| Consolidated financial statements | 116 |
| Notes to consolidated financial statements | 120 |
2
We have re-energized one of Canada’s most respected brands, transforming Bell into a competitive force in every communications segment. Achieving all our financial targets for 2015, we strengthened our financial position and continued to create value for shareholders. |  |

| 2015 FINANCIAL PERFORMANCE |
| | Actual | Target | Result |
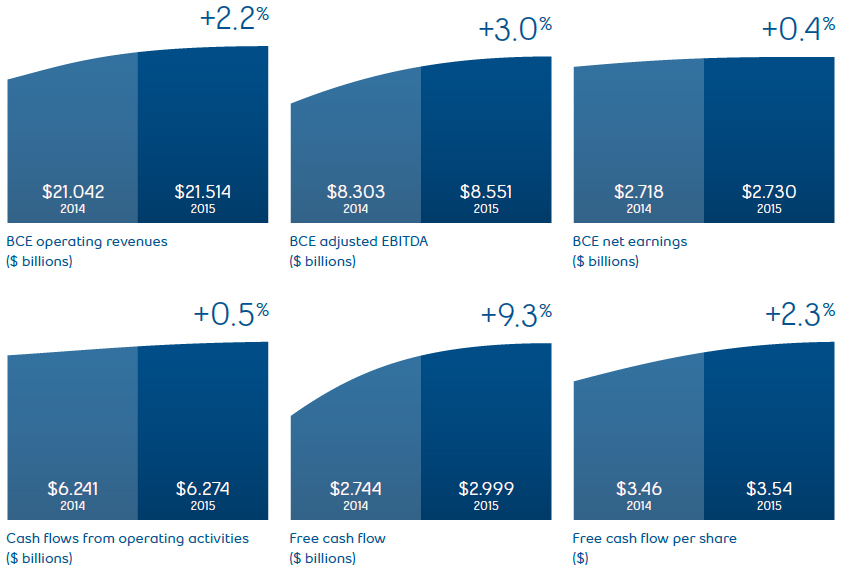
| Revenue growth | 2.2% | 1%–3% |  |
| Adjusted EBITDA growth(3) | 3.0% | 2%–4% | |
| Capital intensity | 16.9% | ~17% | |
| Adjusted EPS(3) | $3.36 | $3.28–$3.38 | |
| Free cash flow growth(3) | 9.3% | ~8%–15% | |
| COMPARATIVE TOTAL RETURN(1) |
| | 2015 | Since
the end
of 2008 |
| BCE | 5.3% | 208% |
| S&P/TSX Composite Index | -8.3% | 78% |
| S&P/TSX Telecom Index | 7.0% | 138% |
| (1) | Assumes the reinvestment of dividends. |
| (2) | Total return since the end of 2008, the year Bell implemented its transformational strategy. |
| (3) | Adjusted EBITDA, adjusted EPS and free cash flow are non-GAAP financial measures and do not have any standardized meaning under International Financial Reporting Standards (IFRS). Therefore, they are unlikely to be comparable to similar measures presented by other issuers. For a full description of these measures, see section 10.2,Non-GAAP financial measures and key performance indicators (KPIs)on pp. 108 to 110 of the MD&A. |
3
| FINANCIAL AND OPERATIONAL HIGHLIGHTS |
Growth services fuelled by
broadband innovation
 | Bell’s success in 2015 and in the future lies in wireless, TV, Internet and media growth services. To deliver Canada’s best broadband, we invest more in state-of-the-art fibre and mobile networks and product R&D than any other communications company – and customers are responding. |
| BCE SUBSCRIBERS*(MILLIONS) | | | |
| | 2015 | 2014 | Growth |
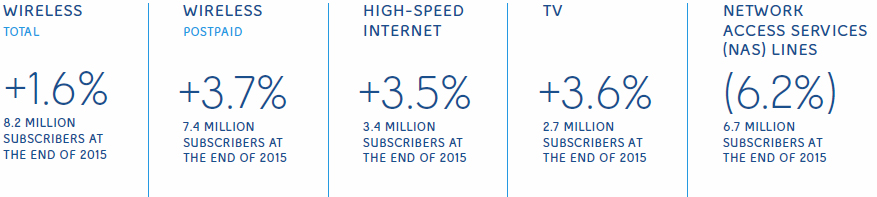
| Wireless | 8.2 | 8.1 | +1.6% |
| High-speed Internet | 3.4 | 3.3 | +3.5% |
| Television | 2.7 | 2.6 | +3.6% |
| Total growth services | 14.4 | 14.1 | +2.4% |
| Local telephone services | 6.7 | 7.1 | -6.2% |
| Total subscribers | 21.1 | 21.2 | -0.5% |

* Rounding in numbers may affect total figures presented.
4

For more information, please refer to Section 7 of the MD&A –Selected annual and quarterly information, page 88.
5
| MESSAGE FROM THE CHAIR OF THE BOARD |
Innovation strategy
plus strong execution
equals outstanding returns
BCE celebrated 135 years of communications leadership in 2015 with an incredible list of achievements.
Our team has re-energized one of the nation’s most enduring institutions, rebuilding Bell into a competitive leader in every segment of Canadian communications as we deliver increasing shareholder value.
I have had the honour and privilege to serve as your Chair over the last 7 years as BCE has executed a bold strategy to regain the top spot in Canadian communications with a commitment to lead our nation’s broadband revolution.
And lead we have. 2015 was yet another year of strong progress as the Bell group of companies moved to the forefront of wireless, TV, Internet and media – the growth services of modern broadband communications. Dedicated to ongoing innovation, efficient operation and a better customer experience at every level, Bell has become an outstanding operator that rivals the best telecoms around the globe.
Bell’s growing success in the communications marketplace and strong financial performance, which saw us achieve all of our guidance targets in 2015, is backed by a capital markets strategy focused on enabling investment in broadband innovation to support our growth services and deliver sustainable shareholder returns.
We maintain an investment-grade balance sheet and credit ratings, while taking full advantage of favourable market conditions to advance our financial strategy.
Capitalizing on opportunity
BCE raised $863 million in common share equity capital in Q4 2015 to reduce debt and further strengthen our balance sheet. It was our first such public equity issuance since 2002 and we were pleased to see that strong market demand outstripped supply by some 15%.
Successfully accessing the debt markets in both March and October 2015, Bell Canada raised a total of $1.5 billion in gross proceeds from the issuance of 30-year and 7-year MTN debentures, the latter issuance carrying an annual interest rate of 3%, the lowest fixed coupon ever achieved by Bell Canada on any MTN debenture issuance.
We also continued to prudently manage our pension obligations. We made a further voluntary contribution of $250 million to our defined benefit pension plan in December, and announced a groundbreaking longevity insurance agreement with Sun Life, the first of its kind in North America.
We enter 2016 with a strong financial position of approximately $2.5 billion in available liquidity and expectations for continued substantial free cash flow generation, all supporting our capital investment and dividend growth objectives. Our credit profile is favourable with investment-grade ratings and stable outlooks.
Our success in the marketplace coupled with our healthy financial position enabled us to announce a 5% increase in the common share dividend in February 2016. It was the twelfth time in the last 7 years that we have raised the BCE common share dividend – a total increase of 87%. Since the end of 2008, total shareholder return has grown a remarkable 208%.
6

Changes to the Board
I will be retiring from the BCE Board of Directors at the Annual General Shareholder Meeting, passing the Chair to Gordon Nixon, the former President and CEO of Royal Bank of Canada. We are also pleased to announce the nominations of 2 more eminent Canadian business figures to our Board: Monique Leroux, Chair, President and CEO of Desjardins Group, and Calin Rovinescu, President and CEO of Air Canada.
Changes to the Board in 2015 included the departure of Carole Taylor, who had joined us in August 2010 and served with distinction on the Corporate Governance and Pension Fund committees. In August 2015, we welcomed Katherine Lee, former President and CEO of GE Capital Canada, who now serves on the Audit and Pension Fund committees.
An outstanding CEO
Congratulations to George Cope for being named Outstanding CEO of the Year in 2015, alongside his investiture in the Order of Canada and Bell’s recognition as one of the Top Employers in Canada earlier in the year. These are well-deserved honours for George’s leadership in the industry and the community, and for his ability to engage team members in making Bell better every day.
Thank you
I would like to express my appreciation and thanks to all my fellow Board members for their wisdom and support through the years. Your Board is a skilled, distinguished and dedicated group of business leaders that always upholds the highest standards of good governance in serving the interests of BCE shareholders.
My thanks to George, his unparalleled senior management group and the entire BCE team in every province and territory for their total commitment to moving Bell forward.
Finally, my gratitude to my fellow shareholders for continuing to believe in Bell’s ability to compete and win. It has been my great pleasure to serve you during one of the most transformative and successful eras in Bell’s long and distinguished history. Thank you all for your confidence and support.


Thomas C. O’Neill
Chair of the Board BCE Inc.
7
| MESSAGE FROM THE PRESIDENT & CEO |
Investing in Canada’s
broadband leadership
to deliver for all Bell
stakeholders
BCE did what we promised to do in 2015: lead the deployment of advanced broadband networks to outperform in wireless, TV, Internet and media growth services, deliver more value to customers and shareholders, and take investment in the national community further with Bell Let’s Talk.

135 years after our company’s founding, Bell is a highly successful competitor in a dynamic Canadian communications marketplace, ranked in 2015 as the leading brand in our sector and one of the most valuable in Canada.
Our motivation to exceed rests on our team’s shared goal: for Bell to be recognized by customers as Canada’s leading communications company.
This goal is Bell’s responsibility and our challenge in a competitive and fast-changing industry. We execute a highly effective strategy in order to achieve it, in the form of 6 Strategic Imperatives that leverage Bell’s strengths:
- Invest in broadbandnetworks and services
- Accelerate wireless
- Leverage wireline momentum
- Expand media leadership
- Improve customer service
- Achieve a competitivecost structure

Bell’s business is built on networks and we lead the way in deploying advanced broadband wireless and wireline infrastructure that is a match for any in the world. We are now in the second year of our plan to invest $20 billion in Canada’s broadband future by the end of 2020, expanding the reach and speed of our best-in-class wireless network and connecting more homes and businesses directly with broadband fibre.
Our award-winning 4G LTE network propelled Bell to the top spot in Canadian wireless in 2015. We gained the largest share of new smartphone postpaid customers and increased average revenue per user, revenue and adjusted EBITDA faster than any of our national peers.
8
The Fibe network has been key to our outperformance in residential services. In 2015, we became Canada’s largest TV provider and built on our lead as the country’s #1 Internet company. Bell Gigabit Fibe now delivers the fastest Internet speeds in Canada on a massive scale, while Fibe TV is a superior television product with a steady stream of innovations, like Restart and Trending, available from no one else.
At Bell Media, we’re getting ahead of changing consumer viewing choices with new options like CraveTV, now the top Canadian video streaming service, and building on our #1 position in TV, radio and digital with exclusive content partnerships with the biggest names in media, including HBO, SHOWTIME and iHeartRadio.
We invest in people, training and tools to deliver a better customer service experience at every level, to match the speed, reliability and growth possibilities we deliver with world-class broadband communications.
Marketplace success, combined with our commitment to operate as efficiently as possible in all that we do, resulted in exceptional financial performance in 2015. We met all financial targets for the year, which featured our 41stconsecutive quarter of adjusted EBITDA growth and outstanding free cash flow generation, supporting both continued broadband network investment and our 5% increase to the common share dividend for 2016.
Bell Let’s Talk increased engagement in the mental health movement across Canada and worldwide to unprecedented levels. After 5 years of strong progress in driving mental health awareness and action, we extended the Bell Let’s Talk initiative for a further 5 years with a target of at least $100 million in Bell funding by the end of 2020.
On behalf of all shareholders and the BCE team, I would like to thank and congratulate our retiring Chair, Thomas C. O’Neill, for successfully guiding your company through a critical period in our transformation, while growing the strength and diversity of your Board. A Director from 2003 and our Chair since 2009, Tom is a brilliant financial mind, an authority on corporate governance, and an affable leader respected across Canadian industry and the broader community.
As Bell was in 1880, we are today: the key builder of the nation’s next-generation communications infrastructure and a technology pacesetter standing alongside the world’s best. My thanks to our national team for their determined execution of our strategy. Building upon Bell’s long and respected legacy of service and innovation, we are dedicated to earning our position as Canada’s leading communications company.
To paraphrase Alexander Graham Bell: we shall continue to concentrate all our thoughts upon the work at hand. Thank you for your support of BCE and the Bell transformation.

George A. Cope
President and Chief Executive Officer BCE Inc. and Bell Canada
9

Invest
in broadband
networks and
services

To mark our 135thanniversary in 2015, Bell announced plans to invest $20 billion in network infrastructure by the end of 2020. One of Canada’s biggest capital investment programs, this would further solidify our nation’s lead in communications innovation and accessibility.

In 2015, our investments of more than $3.6 billion connected more Canadians to broadband fibre, and brought the fastest 4G LTE wireless speeds to millions more from coast to coast.
World-leading 4G LTE wireless broadband
Bell’s 4G LTE mobile network reached 96% of Canadians in 2015 and is expected to be available to 98% by the end of 2016.
In early 2015, Bell launched its Dual-band LTE Advanced (LTE-A) service, offering data speeds up to 260 Mbps. And in August 2015, in a North American first, Bell gave LTE wireless a speed boost with the launch of Tri-band LTE-A technology, taking peak speeds up to 335 Mbps, the fastest network technology anywhere. With typical average speeds of 18-74 Mbps for Dual-band and 25-100 Mbps for Tri-band, LTE-A is capable of supporting virtually seamless HD video streaming, complex business tools and videoconferencing with virtually no wait time.
LTE-A service was available to approximately half of Canadians in 2015, with coverage in parts of British Columbia, Alberta, Ontario, Atlantic Canada, Yukon and Northwest Territories, and is on track to reach 75% of the population in 2016.
In 2015, we also increased our 2500 MHz spectrum holdings to support service to smaller communities and rural areas. In total, we’ve invested $7 billion in spectrum and new mobile networks since 2006.
Canada’s largest Gigabit footprint
While our broadband fibre network already supported superfast Internet and the most innovative TV services, in 2015 we launched Gigabit Fibe and Gigabit FibreOP, offering North America’s fastest Internet speeds.
As part of the Gigabit Fibe rollout, we’re investing $1.14 billion in Toronto to connect 1.1 million homes and businesses in the city to our new fibre network. The Toronto build is Bell’s single largest infrastructure expansion project ever and is expected to be substantially completed by the end of 2017.
Bell’s Gigabit Fibe footprint is already the largest Gigabit network in the country, with availability to more than 2.2 million homes in Québec, Ontario and the Atlantic region and is growing rapidly. In 2016, Bell plans to invest another $3.7 billion in network capital, approximately $1 billion in fibre alone, to expand Gigabit Fibe service capability to 3 million homes and businesses by the end of the year.
11
Accelerate wireless

2015 was the 30thanniversary of wireless communications in Canada, and Bell leveraged a mobile 4G LTE network acknowledged as Canada’s fastest to take the lead in smartphone postpaid customer net additions, as well as revenue and adjusted EBITDA growth.
In an intensely competitive double cohort year, when twice as many wireless customer contracts expired compared to 2014, Bell outperformed the industry and gained 43% of net new postpaid subscribers among all wireless incumbents in 2015 – and half of all new postpaid customers in the competitive fourth quarter period.
Accelerating smartphone and mobile data usage
The success of Bell wireless is built on our award-winning 4G LTE network, which is growing in speed and scope every day. It’s a network that enables customers to have an amazing wireless experience on an unmatched portfolio of devices, including more than 30 new smartphones and tablets introduced in 2015 from leading manufacturers like Samsung, Apple, Sony, BlackBerry and HTC.
As Canadians increasingly adopt advances in mobile payments technology, Bell took another significant step forward in mobile commerce with Suretap. This new mobile app lets Bell customers use their smartphones to make day-today purchases with one quick tap, collect points on popular loyalty cards and redeem gift cards from popular retailers.
Innovations in Canada’s leading mobile TV service continued in 2015 and early this year with new content from CP24, E! and the Comedy Network, as well as premier sports events, including the NBA All-Star game in Toronto, and up to 900 live games with the new NBA League Pass.
Customers have responded positively to enhancements in mobile self-serve account management. About 160 million times last year, customers went online for billing updates, to order new features, check their mobile and Internet data usage, or choose roaming plans for travel.
In 2015, we made it easier and more affordable to travel with a Bell wireless device. With the Roam Better

12

U.S. package, customers travelling in the U.S. can take advantage of unlimited talk, text and 100 MB of data for just $5 a day. Launched in early 2016, Roam Better International offers the same generous data, talk and text for $10 in 110 destinations across Europe, the Americas, Asia and the Middle East, Australia and South Africa, the most of any comparable Canadian plan, and more international coverage than any other competitor.
A leader in wireless growth
For the full year, we grew our base of postpaid customers by 3.7% and increased revenue by 8.7%, driven largely by the 68% of postpaid customers now using our award-winning 4G LTE network. ARPU climbed 5.3% for the year to $63.09.
Bell Wireless adjusted EBITDA increased 7.8%, despite $184 million in additional spending to attract and keep subscribers, particularly during the height of the double cohort period.
From net new postpaid customers to growth in ARPU, service revenue and operating profit, as well as network speed – Bell leads the Canadian wireless industry as we enter 2016.
Bell products in more places
Bell built on our leadership as the industry’s #1 retailer of mobile, residential and small business communications products through our strategic investment in Glentel Inc., one of Canada’s most successful mobile product distributors. With the addition of Glentel’s familiar WIRELESS WAVE, Tbooth Wireless and WIRELESS etc. brands, Bell products are now available in more than 2,500 corporate stores, Virgin Mobile, The Source and other dealer and retail locations across the country.
As part of continued investment in store design, we enhanced our stores including our newest flagship location at the busy Toronto Eaton Centre, featuring more than 350 square metres of the best of Bell products and services in innovative interactive displays developed in partnership with Bell Media.
Over the busy holiday sales season, Bell was the exclusive communications company connected with the biggest movie event of the year –Star Wars: The Force Awakens. We showcased our technology in a massive Star Wars-themed marketing campaign that included store décor, extensive advertising, and collector pins.

13
Leverage wireline
momentum
2015 was a milestone year for Bell Wireline, defined by advances in broadband technology and product innovations that have dramatically reshaped the communications services that Bell delivers to millions of residential and business customers today.
Fibe: a new revolution in TV
A major driver of customer and revenue growth, Bell Fibe TV and FibreOP TV in Atlantic Canada were the top 2 TV services in Canada last year, and made Bell the largest provider of television service across the country with 2.7 million total customers.
Next-generation innovation has been key to Fibe’s popularity and Bell continued to lead in this fast-changing sector with new features that no competitor can match:
- Fibe TV app – the first of its kind inthe world, the app brings the FibeTV experience to smartphones andtablets with 300 channels at home,170 channels on mobile and morethan 20,000 hours of on-demandprogramming.
- Restart, a popular new feature letscustomers rewind and watch showsfrom the beginning or up to30 hours after they started.
- Trending, another Fibe exclusive thathighlights the 5 most-watchedEnglish or French language showsin Canada at any given time.
- Direct access to the full Netflixcatalogue of on-demand andoriginal content from the Fibe TVset-top box.
Bell continued to set the pace early in 2016 by introducing the Fibe TV 4K Whole Home PVR, the most advanced on the market.
Canada’s Internet leader
At a time when Canadians increasingly view broadband Internet service as the most valuable connection in the home, Bell solidified its position as the largest Internet provider in the country with 3.4 million subscribers, an increase of 3.5% over 2014. Bell gained more net new Internet

14

customers in 2015 than any other company in Canada, and more than all our major competitors combined.
That growth was propelled by investment in broadband network capacity expansion and the next evolution in Internet service – Gigabit Fibe. Designed to meet the growing data demands of Canadians at home and at work, Gigabit Fibe delivers the fastest available Internet with download speeds of up to 940 Mbps, with plans to increase to 1,000 Mbps (1 gigabit per second) or faster in 2016, as equipment evolves to support these speeds.
Market-leading growth in Bell Internet and TV services coupled with operating cost reductions across our wireline groups drove positive adjusted EBITDA and cash flow growth in 2015, and contributed to maintaining an industry-leading adjusted EBITDA margin.
Innovations for business
The #1 choice for business customers in Canada, Bell offered an expanding range of products and services for organizations of all sizes. We continued to invest in the country’s largest network of 27 data centres with major expansions in Montréal and St. John’s and a new centre in Saint John. Connected by our leading broadband fibre networks, Bell data centres deliver secure managed hosting and cloud solutions to business and government without the high costs of maintaining in-house facilities.
In 2015, the new Bell Control Centre offered a secure cloud-based platform, enabling companies to securely manage network connected devices over Bell’s 4G LTE wireless network. Investments in next-generation networks continued in 2016 when Bell announced a partnership with IBM to enhance the Bell Business Cloud, giving companies a seamless and secure way to connect to the IBM Cloud.

15
Expand media
leadership

Building on its #1 position in conventional TV, specialty channels, pay TV, radio and digital media in 2015, Bell Media signed blockbuster entertainment and sports content partnerships, delivered new ways for Canadians to watch and listen, and earned significant recognition for leadership in news, sports and entertainment broadcasting in both English and French.
Bell Media’s lead in Canadian multimedia is built on providing the richest possible collection of information and entertainment to Canadians with cutting-edge broadcast innovation.
Bell Media became the exclusive operator of HBO Canada with a historic agreement covering the entire HBO library of current and past programming. The agreement includes Bell Media distribution rights for linear TV broadcast as well as on-demand and over-the-top platforms, and a partnership to produce original content. With sole rights to HBO content in Canada, Bell Media also expanded The Movie Network into Western and Northern Canada to become a national pay TV service.
In another landmark Canadian first signed in 2015, Bell Media reached an exclusive agreement with CBS to bring the vast SHOWTIME catalogue to Canada. Hundreds of hours of past, present, and future SHOWTIME programming will now be available across Bell Media platforms in both English and French.
In music, an exclusive new partnership will bring iHeartRadio’s popular digital streaming service, featuring content from Bell Media’s national radio network, to Canada. mMuch Digital Studios is a multi-channel network capitalizing on the creativity of Canadian and international YouTube artists to drive a new vision for the Much brand.
Leading sports content
With live sports a key part of Bell Media’s strategy, TSN and RDS also secured new broadcast rights and extensions for numerous world-class properties, including the FIFA World Cup through to 2026, The Masters, French Open, and FIBA world championship basketball tournaments. Bell Media is also the primary broadcast partner with CBC for the Olympic Games through 2024.
TSN and RDS extended their exclusive media rights to all Canadian Football League games, including the Grey Cup, across linear TV, digital properties and TSN Radio stations in Toronto, Ottawa, Montréal, Vancouver, Winnipeg, Edmonton, and Hamilton. In 2015, Bell made a strategic investment to add the CFL’s Toronto Argonauts to its significant sports holdings in Maple Leafs Sports and Entertainment (MLSE) and the Montréal Canadiens.
Our live-sports strategy is leading to record audiences, including the most watched FIFA Women’s World Cup in history, when Canada hosted the tournament in 2015. Bell Media also delivered the biggest sports events to Canadian fans with coverage of Super Bowl 50 and the 2016 NBA All-Star Weekend in Toronto. Since expanding to 5 national feeds, TSN has nearly doubled the number of live events it broadcasts to approximately 2,400, breaking more than 20 audience records along the way.
16

The 2015 World Juniors gold medal game became the most-watched telecast in Canadian specialty TV history with 7 million viewers, and January 2015 became the second most-watched month in the network’s 30-year history – behind only the Vancouver 2010 Olympic Winter Games.
Bell Media’s French-language specialty and pay channels delivered a record 164 new programs in 2015. Investments of $57 million in independent, Québec-based productions enabled the creation of approximately 1,000 hours of original, high-quality French-language TV content.
No other broadcaster attracts as many Canadians with its specialty programming in French and English. Bell Media reaches 82% of all French-language TV viewers in the average week, operating 4 of the 5 top channels – Canal D, RDS, Super Écran and Canal Vie.
We reached 83% of English-language TV viewers, with leading specialty channels like Discovery, which had more programs in the Top 10 than any other Canadian entertainment specialty network in 2015, and CTV, the most-watched conventional network for the 14thstraight year.
CTV had more Top 10, Top 20 and Top 30 shows than all other Canadian TV networks combined in 2015. Our original production, The Amazing Race Canada, remained the most-watched summer program in the country for the third straight year.
Bell Media radio reached approximately 17 million listeners each week in 2015, making us Canada’s top radio broadcaster. Astral Out of Home continued to grow its reach with new advertising partnerships in 2015 with the Halifax, Vancouver, and Ottawa international airports and the Québec City transit system, and further expanded its reach with the acquisition of Métromédia in early 2016.
Broadcast innovation
TSN produced the first 4K Ultra HD production of a live event – a Toronto Raptors vs. Boston Celtics game – in North America. In addition to setting the pace in 4K sports broadcasting with Raptors, Toronto Maple Leafs and Ottawa Senators games, Bell Media’s Discovery GO also began streaming select titles, including the groundbreaking original series How Hard Can it Be? in 4K. Discovery Canada announced its first original scripted drama, Frontier, is being shot in 4K for broadcast later in 2016 as part of Bell Media’s expanding library of UHD (Ultra High Definition) content.
We extended the already popular CraveTV direct to consumers in January 2016, offering thousands of hours of the best in TV entertainment to all of Canada’s more than 11 million Internet subscribers for $7.99 a month. CraveTV continues to expand its catalogue with more distribution agreements with Canadian TV providers, its first original series – Letterkenny – and the addition of new titles from major Hollywood studios, including Warner Bros., Disney ABC, 20th Century Fox, and NBCUniversal.
Bell Media and our partners received 53 awards at the 2015 Canadian Screen Awards – including for Lisa LaFlamme who for the second year in a row was named Best National News Anchor. We were also honoured with 12 awards for original French programming productions at the 30thannual Gala des Prix Gémeaux.

17
Improve
customer service
Throughout 2015, Bell continued to focus on improved customer service as a key competitive differentiator in all lines of business and across all markets.
Making customer self-serve even easier
Bell online systems have become an increasingly essential customer service tool, supporting more than 160 million online self-serve visits, customer views and transactions in 2015 – an increase of 9 million over 2014.
In 2015, we launched a completely redesigned bill for Bell residential customers, making it simpler to follow any changes from month to month. The new, streamlined online bill is easy to read and offers personalized interactive features, including historical data usage trends. We’ve also made it much easier to use online self-serve and added new Internet usage notifications to give customers more control over their online data consumption.
On the Mobility side, we introduced personalized videos explaining to new customers what to expect on their bill, how to check their usage and change features, and how to use MyBell.ca and the MyBell mobile app.
For small business customers, we significantly improved the ordering experience, with new call centre tools reducing ordering times by 60%.
With ongoing enhancement to our self-serve tools like MyBell.ca and the MyBell app in 2015, the ease with which customers can now use online tools to manage virtually every aspect of their accounts is dramatically reducing the need for calls to Bell service centres, which are down 6 million in just the last year.
Overall, calls to Bell are down 37% – a reduction of 28 million calls – since 2011.
We’ve invested heavily in new and innovative tracking and scheduling technology and it’s paying off by ensuring our technicians get to the customer in record time.

18

In the last 4 years, we’ve cut Bell Fibe TV installation times by 30% –10% in 2015 alone. In the last year, Bell delivered service within a 2-hour appointment window to more than 600,000 customers, 7 times more than a year earlier. And in 2015, we extended 2-hour service windows to Internet and Home Phone repairs.
We also increased Same Day completion for both residential and business customers by 24% over 2014.
During the very busy summer move period in Québec, our technicians connected a record number of customers to Bell services within 2 days of ordering. On July 1 alone, more than 2,000 technicians were on the road and serving Bell customers to meet our service delivery commitments.
Our Bell Business Markets, Field Services and Network teams also stepped up to meet the exceptional demand during the federal election campaign in the fall, setting up 220 returning stations within 5 days. We also reduced the IP VPN provisioning time for business customers by 12 days in 2015.
And in another move forward for service, we introduced evening appointments for small business customers and delivered repair service more often on the same day.
But just as important as improving response times, we’ve also seen significant improvement in customer satisfaction with our technicians. Despite the high demand and the complexity of work involved with Fibe technology, 92% of Bell customers were highly satisfied with the quality of installation and repair service provided by technicians, compared to 85% in 2011.
It’s our customers doing the talking
Over the last 5 years Bell has invested more than $850 million in service improvements and the results are clear, not just in what our customers are telling us, but in what they’re telling the world.
We asked Bell Mobility customers if they would recommend Bell to people they know. The result was a Net Promoter Score improvement of 14% over 2014, for a total increase of 55% since 2011. And our leading-edge Bell Fibe TV and Bell Aliant FibreOP TV were the top two TV services most recommended by customers in Canada in 2015.*
Positive service improvement was also noted by J.D. Power. In 2015, J.D. Power reported that Virgin Mobile provided the “Highest Ranked Purchase Experience among Wireless Providers” in Canada.**
Across Bell Mobility, investments in sales associate training, store designs and purchasing systems continue to enhance the customer experience and make the buying process even faster and more efficient.
We’re also starting to see traction in improved results with the Commissioner for Complaints for Telecommunications Services (CCTS). Its most recent report showed a 2% reduction in Bell customer issues between August 2014 and July 2015. Bell’s own tracking shows that with our significant investments to improve customer service, including new training programs and projects like our enhanced customer invoices, we saw a 17% reduction in CCTS-level complaints in 2015, and are on track for further improvement in 2016.
* Nielsen Consumer Insights findings published in Customer Interaction Metric study (October 2015)
** Virgin Mobile received the highest numerical score in the proprietary J.D. Power 2015 Canadian Wireless Purchase Experience StudySM. Study based on responses from 5,120 consumers, includes 8 wireless providers, and measures opinions of consumers who purchased a wireless product or service within the last 12 months. Proprietary study results are based on experiences and perceptions of consumers surveyed October 2014-March 2015. Your experiences may vary. Visit jdpower.com
19
Achieve
a competitive
cost structure
We closely managed our operating cost structure in 2015 with restructuring initiatives to address changing market conditions, new efficiencies in the way we provide customer service and ongoing reductions in discretionary and supplier spending.
We are realizing ongoing savings from the integration of Bell Aliant following the privatization of our Atlantic Canada affiliate in November 2014, through the alignment of our national capital investment strategy, reduced wholesale costs and the elimination of duplicate functions associated with operating a separate public company. Organizational restructurings at Bell Media and Bell Wireline to address competitive, technological and regulatory change, and an ongoing soft business economy, are expected to save us approximately $100 million in operating costs in 2016.
Process and productivity advances
Our Information Technology team partners with Customer Operations to drive productivity savings, while improving the customer experience.
That included more effective dispatch processes for our Field Services technicians, improving our on-time record for installations and repairs. With more and improved customer self-serve options, the number of transactions carried out by both mobile and residential customers themselves increased significantly, reducing the need for customers to choose the higher-cost option of contacting us by phone.
Calls to our call centres dropped 11% in 2015, while Bell Mobility customer satisfaction – measured by the number who would recommend Bell services – jumped by 14% (and 55% since 2011).

20

Ongoing spending discipline
Bell uses the technology we offer customers to reduce our own discretionary spending. For instance, we continue to significantly reduce employee travel costs by substituting video and teleconferences for flights. We also negotiate with vendors large and small to reduce our spending on outsourcing contracts and we continue to promote electronic billing, which enables us to save millions of dollars on paper, printing and postage each year.
A focus on sustainability helps reduce both our impact on the environment and our costs as we transform Bell.
The first telecom company in Canada certified to the ISO 14001 international standard for environmental management, Bell was ranked by Newsweek in 2015 as Canada’s greenest communications company.
We reduced fuel usage by approximately 3 million litres in 2015 through service fleet modernization, enforcing our no-idling policy and implementing more efficient dispatching systems. Using a variety of energy-saving strategies in our networks, IT infrastructure and buildings, we reduced electrical consumption in 2015 by approximately 26 gigawatt hours.
We also work to maximize the satisfaction and productivity of Bell team members with competitive benefits, including leadership in workplace mental health support; leading engagement and career development programs; and award-winning new grad initiatives. Bell was ranked as a Top Employer in both Montréal and across Canada in 2015.
To learn more about BCE’s environmental progress, employee initiatives, and community investment, please see our Bell Corporate Responsibility Report at BCE.ca.

21
Bell Let’s Talk:
Mental health
engagement grows in
Canada and beyond

Launched in 2010 to promote Canadian mental health, the Bell Let’s Talk initiative is built on 4 action pillars: research; care and access; workplace mental health; and ending the stigma of mental illness that prevents so many people who need help from seeking it.
In 2015, we extended our Bell Let’s Talk commitment for another 5 years, with a minimum of $100 million for Canadian mental health programs, and we had the most successful Bell Let’s Talk Day yet in January 2016.
Making progress
Bell Let’s Talk is clearly making a difference. A 2015 Nielsen survey* found that 4 out of 5 Canadians – and 9 out of 10 young people –are more aware of mental health than 5 years ago. 70% of all Canadians surveyed (and 79% of young people) believe attitudes toward mental illness have changed for the better, while 57% believe stigma has been reduced (65% of young people).
Since 2010, approximately 450,000 Canadians have received mental health support through programs funded by Bell Let’s Talk, including 240,000 children and youth. Another 730,000 people have been helped through crisis lines and 6,000 volunteers have received training.
At Bell, more than 8,000 managers have received mental health training to help them identify and support team members dealing with mental health issues. We’ve improved employee benefits for mental health care, and enhanced our return-to-work process to address the unique needs of team members who have been on disability leave due to mental illness. Overall, we’ve seen a 19% decline in mental health related short-term disability claims.

22

Another record Bell Let’s Talk Day
We redoubled our efforts to build a stigma-free Canada with the sixth Bell Let’s Talk Day on January 27, 2016, which set all new records for engagement. Led by Bell Let’s Talk national spokesperson Clara Hughes, Canadians and people worldwide made a record 125,915,295 texts, calls, tweets and shares in support of mental health.
With Bell donating 5 cents for every interaction, this added $6,295,764.75 to our commitment to Canadian mental health, which has now reached $79,919,178.55.
#BellLetsTalk was the top Twitter trend in Canada on Bell Let’s Talk Day, and the most-used hashtag around the world with 6,826,114 total tweets and retweets – 43% more than last year.
Joining millions of Canadians in the Twitter conversation were prominent Canadian and global figures, including Governor General David Johnston, Prime Minister Justin Trudeau, The Duke and Duchess of Cambridge (William and Kate) and Prince Harry, and a cross section of Canadian and international celebrities including Michael Bublé, Justin Bieber, Sarah McLachlan, Alice Cooper, Ellen DeGeneres and Ricky Gervais.
Major funding initiatives
In addition to support for several major health care and research institutions in 2015, including Vancouver General Hospital, Le centre hospitalier universitaire Sainte-Justine in Montréal and the Nunatsiavut government, we also gave grants totalling approximately $1 million through the Bell Let’s Talk Community Fund to 55 organizations that provide mental health services at the local level. We also announced 15 grants totalling $250,000 from the Bell True Patriot Love Fund for organizations that provide essential mental health support to military members, veterans and their families.
In early 2016, we announced further initiatives including a partnership with the Canadian Red Cross to add mental health training to its first aid programs; $1 million to support research into the early detection of mental illness by l’Institut universitaire en santé mentale de Québec; and a $1 million partnership with Royal Bank to support Rise Asset Development’s program of low-interest loans, training and mentorship to entrepreneurs who have struggled with mental illness.
Recognition for Bell Let’s Talk
Recognition for Bell Let’s Talk in 2015 included the Workplace Benefits Awards for Mental Health from Benefits Canada, Corporate Social Responsibility Award from the Global Carrier Awards, and the top prize for the Cause + Action awards. In Québec, Bell was recognized as the Outstanding Corporation of the Year by the Québec Association of Fundraising Professionals for its contributions to mental health, and by The Healthy Enterprises Group for its workplace program.

23
Alexander Graham Bell:
Inspiring 135 years of
communications innovation
Alexander Graham Bell was looking for a new way for people to talk across distances. Little did he know how his invention would lead us to transform the way people interact with each other and their world in 2015.

It takes imagination to see the device below as the ancestor of the smartphones we use today. But it is a prized possession of the Bell Historical Collection in Montréal, and a reminder of how far investment in innovation has taken us.
135 years later, what would Alexander Graham Bell think of the Canadian industry he created?
We believe a person as curious and committed to communication as Bell would jump into our national team effort to develop new ways to boost broadband speed and coverage, maximize mobile data options, take TV further and help move data to the secure cloud. And maybe take a few smartphone selfies with the Bell team just to try it.
Inspired by his mother, who experienced hearing loss, and the work of his father, a pioneering elocutionist, Bell worked in Boston teaching deaf children and adults while pondering ways to improve our ability to communicate across distances.
But he spent his summers at the Bell family home in Brantford, Ontario, now a National Historic Site supported by Bell Canada. There Bell conceived the principle of the telephone. He received one of the most valuable patents ever granted on March 7, 1876, and made the first telephone call on March 10 in Boston. On April 29, 1880, The Bell Telephone Company of Canada was incorporated by Federal charter in Montréal.
While Bell is most famously remembered for his invention of the telephone, the range of his technological interests knew no bounds. Over the course of his career, Bell and his partners received 31 U.S. patents. While 13 of those related to the telephone and telegraph, 10 involved “kites, flying machines and hydrodromes.” He was even involved in research into alternative fuels.
Much of Bell’s later research was conducted at his Cape Breton summer home, Beinn Bhreagh, near Baddeck, Nova Scotia. It was there that he led

24

the Aerial Experiment Association (AEA) founded in 1907. Two years later, in February 1909, Bell watched the AEA’s Silver Dart make Canada’s first powered aircraft flight.
Bell’s Baddeck laboratory also developed the HD-4 hydrofoil, which set a record marine speed of 114 km/h in 1919. Bell died at Beinn Bhreagh on August 2, 1922 at age 75, and Baddeck is home to another National Historic Site commemorating Bell.
Bell once said his “greatest invention” was the photophone, patented in December 1880. Six months earlier, he had used this device to transmit a voice message between 2 buildings... wirelessly!
Alexander Graham Bell is renowned as the inventor of the telephone, but he was ultimately a tireless innovator across multiple technologies, just a few of which we’ve touched on here. His spirit lives on in the Bell team as we continue to chart new insights into the world of wireless, TV, Internet and media for the benefit of all Canadians.
For more information, please write to BellArchives@BCE.ca.

25

Table of contents
| MANAGEMENT’S DISCUSSION AND ANALYSIS | |
| 1 | OVERVIEW | |
| | 1.1 | Introduction | 29 |
| | 1.2 | About BCE | 31 |
| | 1.3 | Key corporate developments | 35 |
| | 1.4 | Capital markets strategy | 36 |
| | 1.5 | Corporate governance and risk management | 38 |
| |
| 2 | STRATEGIC IMPERATIVES | |
| | 2.1 | Invest in broadband networks and services | 41 |
| | 2.2 | Accelerate wireless | 42 |
| | 2.3 | Leverage wireline momentum | 43 |
| | 2.4 | Expand media leadership | 44 |
| | 2.5 | Improve customer service | 45 |
| | 2.6 | Achieve a competitive cost structure | 45 |
| |
| 3 | PERFORMANCE TARGETS, OUTLOOK, ASSUMPTIONS AND RISKS | |
| | 3.1 | 2015 performance vs. guidance targets | 46 |
| | 3.2 | Business outlook and assumptions | 46 |
| | 3.3 | Principal business risks | 47 |
| |
| 4 | CONSOLIDATED FINANCIAL ANALYSIS | |
| | 4.1 | Introduction | 49 |
| | 4.2 | Customer connections | 50 |
| | 4.3 | Operating revenues | 51 |
| | 4.4 | Operating costs | 52 |
| | 4.5 | Adjusted EBITDA | 53 |
| | 4.6 | Severance, acquisition and other costs | 54 |
| | 4.7 | Depreciation and amortization | 54 |
| | 4.8 | Finance costs | 55 |
| | 4.9 | Other (expense) income | 55 |
| | 4.10 | Income taxes | 56 |
| | 4.11 | Net earnings and EPS | 56 |
| | 4.12 | Capital expenditures | 57 |
| | 4.13 | Cash flows | 57 |
| |
| 5 | BUSINESS SEGMENT ANALYSIS | |
| | 5.1 | Bell Wireless | 58 |
| | 5.2 | Bell Wireline | 65 |
| | 5.3 | Bell Media | 73 |
| |
| 6 | FINANCIAL AND CAPITAL MANAGEMENT | |
| | 6.1 | Net debt | 79 |
| | 6.2 | Outstanding share data | 79 |
| | 6.3 | Cash flows | 80 |
| | 6.4 | Post-employment benefit plans | 82 |
| | 6.5 | Privatization of Bell Aliant | 83 |
| | 6.6 | Financial risk management | 83 |
| | 6.7 | Credit ratings | 85 |
| | 6.8 | Liquidity | 86 |
| |
| 7 | SELECTED ANNUAL AND QUARTERLY INFORMATION | |
| | 7.1 | Annual financial information | 88 |
| | 7.2 | Quarterly financial information | 90 |
| |
| 8 | REGULATORY ENVIRONMENT | 93 |
| |
| 9 | BUSINESS RISKS | 98 |
| |
| 10 | FINANCIAL MEASURES, ACCOUNTING POLICIES AND CONTROLS | 104 |
| REPORTS ON INTERNAL CONTROL | |
| Management’s report on internal control over financial reporting | 112 |
| Report of independent registered public accounting firm | 113 |
| |
| CONSOLIDATED FINANCIAL STATEMENTS | |
| Management’s responsibility for financial reporting | 114 |
| Report of independent registered public accounting firm | 115 |
| Consolidated income statements | 116 |
| Consolidated statements of comprehensive income | 116 |
| Consolidated statements of financial position | 117 |
| Consolidated statements of changes in equity | 118 |
| Consolidated statements of cash flows | 119 |
| |
| NOTES TO CONSOLIDATED FINANCIAL STATEMENTS | |
| Note 1 | Corporate information | 120 |
| Note 2 | Significant accounting policies | 120 |
| Note 3 | Business acquisitions and dispositions | 129 |
| Note 4 | Segmented information | 129 |
| Note 5 | Operating costs | 131 |
| Note 6 | Severance, acquisition and other costs | 131 |
| Note 7 | Interest expense | 132 |
| Note 8 | Other (expense) income | 132 |
| Note 9 | Income taxes | 133 |
| Note 10 | Earnings per share | 135 |
| Note 11 | Trade and other receivables | 135 |
| Note 12 | Inventory | 135 |
| Note 13 | Property, plant and equipment | 136 |
| Note 14 | Intangible assets | 137 |
| Note 15 | Investments in associates and joint ventures | 138 |
| Note 16 | Other non-current assets | 138 |
| Note 17 | Goodwill | 139 |
| Note 18 | Trade payables and other liabilities | 139 |
| Note 19 | Debt due within one year | 140 |
| Note 20 | Long-term debt | 141 |
| Note 21 | Post-employment benefit plans | 142 |
| Note 22 | Other non-current liabilities | 146 |
| Note 23 | Financial and capital management | 146 |
| Note 24 | Privatization of Bell Aliant | 150 |
| Note 25 | Share capital | 151 |
| Note 26 | Share-based payments | 152 |
| Note 27 | Commitments and contingencies | 155 |
| Note 28 | Related party transactions | 156 |
| Note 29 | Significant partly-owned subsidiaries | 157 |
| |
| BOARD OF DIRECTORS | 158 |
| EXECUTIVES | 159 |
| INVESTOR INFORMATION | 160 |
BCE Inc. 2015 ANNUAL REPORT 27 |
| | | MD&A | |
Management’s discussion and analysis
In this management’s discussion and analysis of financial condition and results of operations (MD&A),we,us,our,BCE andthe companymean, as the context may require, either BCE Inc. or, collectively, BCE Inc., Bell Canada, their subsidiaries, joint arrangements and associates.Bell means, as the context may require, either Bell Canada or, collectively, Bell Canada, its subsidiaries, joint arrangements and associates.Bell Aliantmeans, as the context may require, until December 31, 2014, either Bell Aliant Inc. or, collectively, Bell Aliant Inc., its subsidiaries and associates, or after December 31, 2014 and up to, and including, June 30, 2015, either Bell Aliant Regional Communications Inc. or, collectively, Bell Aliant Regional Communications Inc., its subsidiaries and associates, or after June 30, 2015 the Bell Aliant brand.
All amounts in this MD&A are in millions of Canadian dollars, except where noted. Please refer to section 10.2,Non-GAAP financial measures and key performance indicators (KPIs)on pages 108 to 110 for a list of defined non-GAAP financial measures and key performance indicators.
Please refer to BCE’s audited consolidated financial statements for the year ended December 31, 2015 when reading this MD&A.
In preparing this MD&A, we have taken into account information available to us up to March 3, 2016, the date of this MD&A, unless otherwise stated.
You will find BCE’s audited consolidated financial statements for the year ended December 31, 2015, BCE’s annual information form for the year ended December 31, 2015, dated March 3, 2016 (BCE 2015 AIF) and recent financial reports on BCE’s website atBCE.ca, on SEDAR atsedar.comand on EDGAR atsec.gov.
This MD&A comments on our business operations, performance, financial position and other matters for the two years ended December 31, 2015 and 2014.
| |
| CAUTION REGARDING FORWARD-LOOKING STATEMENTS |
BCE’s 2015 annual report including this MD&A and, in particular, but without limitation, section 1.4,Capital markets strategy, section 2, Strategic imperatives, section 3.2,Business outlook and assumptions, section 5,Business segment analysisand section 6.8,Liquidityof this MD&A, contain forward-looking statements. These forward-looking statements include, but are not limited to, BCE’s 2016 annualized common share dividend and common share dividend policy, the expected improvement of BCE’s net debt leverage ratio and return thereof within BCE’s target range, the sources of liquidity we expect to use to meet our anticipated 2016 cash requirements, our expected 2016 post-employment benefit plans funding, our network deployment plans, the value of network infrastructure capital investments we plan to make by the end of 2020, and BCE’s business outlook, objectives, plans and strategic priorities. Forward-looking statements also include any other statements that do not refer to historical facts. A statement we make is forward-looking when it uses what we know and expect today to make a statement about the future. Forward-looking statements are typically identified by the wordsassumption,goal,guidance,objective,outlook,project,strategy,targetand other similar expressions or future or conditional verbs such asaim,anticipate,believe,could,expect,intend,may,plan,seek,should,striveandwill. All such forward-looking statements are made pursuant to the safe harbour provisions of applicable Canadian securities laws and of the United StatesPrivate Securities Litigation Reform Act of 1995. Unless otherwise indicated by us, forward-looking statements in BCE’s 2015 annual report, including in this MD&A, describe our expectations as at March 3, 2016 and, accordingly, are subject to change after this date. Except as may be required by Canadian securities laws, we do not undertake any obligation to update or revise any forward-looking statements, whether as a result of new information, future events or otherwise.
Forward-looking statements, by their very nature, are subject to inherent risks and uncertainties and are based on several assumptions, both general and specific, which give rise to the possibility that actual results or events could differ materially from our expectations expressed in, or implied by, such forward-looking statements and that our business outlook, objectives, plans and strategic priorities may not be achieved. As a result, we cannot guarantee that any forward-looking statement will materialize and we caution you against relying on any of these forward-looking statements. Forward-looking statements are presented in BCE’s 2015 annual report, including in this MD&A, for the purpose of assisting investors and others in understanding our objectives, strategic priorities and business outlook as well as our anticipated operating environment. Readers are cautioned, however, that such information may not be appropriate for other purposes.
We have made certain economic, market and operational assumptions in preparing the forward-looking statements contained in BCE’s 2015 annual report and, in particular, but without limitation, the forward-looking statements contained in the previously-mentioned sections of this MD&A. These assumptions include, without limitation, the assumptions described in the various sections of this MD&A entitled Business outlook and assumptions, which sections are incorporated by reference in this cautionary statement. In addition, the value of network infrastructure capital investments we plan to make by the end of 2020 assumes that capital investments will continue at current levels. However, there can be no assurance that such investment levels will be maintained with the result that the value of actual capital investments made by us by the end of 2020 could materially differ from current expectations. We believe that our assumptions were reasonable at March 3, 2016. If our assumptions turn out to be inaccurate, our actual results could be materially different from what we expect.
Important risk factors including, without limitation, regulatory, competitive, technological, economic, financial and other risks that could cause actual results or events to differ materially from those expressed in, or implied by, the previously-mentioned forward-looking statements and other forward-looking statements contained in BCE’s 2015 annual report, and in particular in this MD&A, include, but are not limited to, the risks described or referred to in section 9,Business risks, which section is incorporated by reference in this cautionary statement.
We caution readers that the risks described in the previously-mentioned section and in other sections of this MD&A are not the only ones that could affect us. Additional risks and uncertainties not currently known to us or that we currently deem to be immaterial may also have a material adverse effect on our financial position, financial performance, cash flows, business or reputation. Except as otherwise indicated by us, forward-looking statements do not reflect the potential impact of any special items or of any dispositions, monetizations, mergers, acquisitions, other business combinations or other transactions that may be announced or that may occur after March 3, 2016. The financial impact of these transactions and special items can be complex and depends on the facts particular to each of them. We therefore cannot describe the expected impact in a meaningful way or in the same way we present known risks affecting our business.
| 28 BCE Inc. 2015 ANNUAL REPORT |
| | 1 | OVERVIEW | MD&A |
1 Overview
1.1 Introduction
At a glance
BCE is Canada’s largest communications company, providing residential, business and wholesale customers with a wide range of solutions for all their communications needs. BCE’s shares are publicly traded on the Toronto Stock Exchange and on the New York Stock Exchange (TSX, NYSE: BCE).
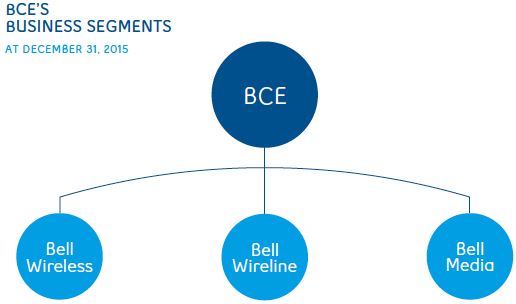
Beginning January 1, 2015, our results are reported in three segments: Bell Wireless,Bell WirelineandBell Media. Due to the privatization of Bell Aliant in 2014 as outlined in section 6.5,Privatization of Bell Aliant, the results of our former Bell Aliant segment are included within our Bell Wireless and Bell Wireline segments, with prior periods reclassified for comparative purposes.
Bell Wireless provides wireless voice and data communications products and services to our residential, small and medium-sized business and large enterprise customers across Canada.
Bell Wireline provides data, including Internet access and Internet protocol television (IPTV), local telephone, long distance, as well as other communications services and products to our residential, small and medium-sized business and large enterprise customers, primarily in Ontario, Québec and the Atlantic provinces, while Satellite television (TV) service and connectivity to business customers are available nationally across Canada. In addition, this segment includes our wholesale business, which buys and sells local telephone, long distance, data and other services from or to resellers and other carriers.
Bell Media provides conventional, specialty and pay TV, digital media, and radio broadcasting services to customers across Canada and out of home (OOH) advertising services.
BCE is Canada’s
largest communications company
We also hold investments in a number of other assets, including:
- a 28% indirect equity interest in Maple Leaf Sports & Entertainment Ltd. (MLSE)
- a 50% indirect equity interest in Glentel Inc. (Glentel)
- a 35.4% indirect equity interest in Q9 Networks Inc. (Q9)
- an 18.4% indirect equity interest in entities that operate the Montréal Canadiens Hockey Club and the Bell Centre in Montréal
- a 50% indirect equity interest in the Toronto Argonauts Football Club (Argos)
BCE Inc. 2015 ANNUAL REPORT 29 |
1 | OVERVIEW | MD&A | |

Our goal is to be recognized by customers as Canada’s leading communications company. Our primary business objectives are to maximize subscribers, revenues, operating profit, free cash flow(1)and return on invested capital by further enhancing our position as the foremost provider in Canada of comprehensive communications services to residential and business customers. We seek to take advantage of opportunities to leverage our networks, infrastructure, sales channels, and brand and marketing resources across our various lines of business to create value for both our customers and other stakeholders.
Our strategy is centred on our disciplined focus and execution of six strategic imperatives. The six strategic imperatives that underlie BCE’s business plan are:
| (1) | Adjusted EBITDA and free cash flow are non-GAAP financial measures and do not have any standardized meaning under International Financial Reporting Standards (IFRS). Therefore, they are unlikely to be comparable to similar measures presented by other issuers. See section 10.2,Non-GAAP financial measures and key performance indicators (KPIs) – Adjusted EBITDA and adjusted EBITDA marginandFree cash flow and free cash flow per sharefor more details, including, for free cash flow, a reconciliation to the most comparable IFRS financial measure. |
| 30 BCE Inc. 2015 ANNUAL REPORT |
| | 1 | OVERVIEW | MD&A |
In 2015, we reported the results of our operations in three segments: Bell Wireless, Bell Wireline and Bell Media, with prior periods reclassified for comparative purposes to include our former Bell Aliant segment. We describe our product lines by segment below, to provide further insight into our operations.
| |
| Our products and services |
SEGMENT DESCRIPTION
- Provides integrated digital wireless voice and datacommunications products and services to residential andbusiness customers across Canada
- Includes the results of operations of Bell Mobility Inc. (BellMobility) and wireless-related product sales from The Source(Bell) Electronics Inc. (The Source)
OUR BRANDS INCLUDE

OUR NETWORKS AND REACH
We hold licensed national wireless spectrum, with holdings across various spectrum bands, totalling more than 4,500 million Megahertz per Population (MHz-pop), corresponding to a weighted-average of approximately 135 MHz-pop of spectrum across Canada.
We have deployed and operate a number of leading nationwide wireless broadband networks compatible with global standards that deliver high-quality and reliable voice and high-speed data services to virtually all of the Canadian population.
- Fourth Generation (4G) Long-term Evolution (LTE) network launched in September 2011:
- Provides mobile Internet data access speeds as fast as 150 megabits per second (Mbps) (typical speeds of 12 to 40 Mbps)
- Covered 96% of the Canadian population coast to coast at December 31, 2015
- Expansion of our LTE services supported by continued re-purposing of wireless spectrum to increase capacity and coverage
- Reverts to the High-speed packet access plus (HSPA+) network outside LTE coverage area, ensuring continuity of service
- Supports international roaming in more than 75 destinations
- LTE Advanced (LTE-A) network service launched in February 2015:
- Dual-band LTE-A provides mobile Internet data access speeds as fast as 260 Mbps (typical speeds of 18 to 74 Mbps)
- Covered 48% of the Canadian population in parts of British Columbia, Alberta, Ontario and Atlantic Canada, Yukon and the Northwest Territories at December 31, 2015
- In August 2015, we began the deployment of Tri-band LTE, delivering speeds of up to 335 Mbps (typical speeds of 25 to 100 Mbps), in parts of Southern Ontario and select cities in Atlantic Canada
- HSPA+ network launched in November 2009:
- Provides high-speed mobile access of up to 21 Mbps in most areas (typical speeds of 3.5 - 8 Mbps), and as high as 42 Mbps in areas with dual cell capability when using compatible devices (typical speeds of 7 to 14 Mbps)
- Covered over 98% of the Canadian population coast to coast at December 31, 2015
- International roaming in more than 230 destinations
- National third generation (3G) code division multiple access (CDMA) network, which we began decommissioning in 2014.
- Largest wireless fidelity (Wi-Fi) network across Canada:
- Approximately 4,000 public Wi-Fi hotspots at participating McDonald’s, Tim Hortons and Chapters/Indigo retail outlets across Canada, in addition to thousands of Wi-Fi networks managed through our Bell Business Markets unit at enterprise customer locations.
- Approximately 2,500 retail points of distribution across Canada, including more than 1,400 Bell-branded stores and The Source locations, Glentel-operated stores (WIRELESSWAVE, Tbooth wireless and WIRELESS etc...) as well as other third-party dealer and retail locations.
OUR PRODUCTS AND SERVICES
- Voice and data plans: available on either postpaid orprepaid options
- Extensive selection of devices: including leading 4G LTE andLTE-A smartphones and tablets
- Data: e-mail, web browsing, social networking, messaging(text, picture and video), call features and applications
- Mobile TV: over 45 live and on-demand channels on smartphonesand tablets
- Mobile Internet: Turbo Stick, Turbo Hub, MiFi
- Mobile payments: Suretap mobile wallet for quick, easy andsecure payments using smartphones
- Travel: roaming services with other wireless service providersin more than 230 destinations worldwide, LTE roaming in over75 destinations, Travel Data Passes and Roam Better feature
- Mobile business services: push-to-talk, workforce management,worker safety, dispatch solutions, mobile device management
- Internet of Things (IoT) solutions: asset management, fleetmanagement, digital signage, wireless point-of-sale, remotemonitoring, telematics
BCE Inc. 2015 ANNUAL REPORT 31 |
1 | OVERVIEW | MD&A | |
SEGMENT DESCRIPTION
- Provides data, including Internet access and IPTV, local telephone, long distance,as well as other communications services and products to residential, small andmedium-sized business and large enterprise customers, primarily in Ontario,Québec and the Atlantic provinces, while Satellite TV service and connectivityto business customers are available nationally across Canada. We also offercompetitive local exchange carrier (CLEC) services in Alberta and British Columbia
- Includes the results of our wholesale business, which buys and sells local telephone,long distance, data and other services from or to resellers and other carriers, andthe wireline operations of Northwestel Inc. (Northwestel), which provides telecommunications services in Canada’s Northern Territories
- Includes wireline-related product sales from our wholly-owned subsidiary, nationalconsumer electronics retailer The Source
OUR BRANDS INCLUDE

OUR NETWORKS AND REACH
- Extensive local access network in Ontario, Québec and theAtlantic provinces, as well as in Canada’s Northern Territories
- Largest fibre network in Canada, spanning over 196,000 km
- Broadband fibre network, consisting of fibre-to-the-node(FTTN) and fibre-to-the-premise (FTTP) locations, covering8 million homes and businesses in Ontario, Québec and theAtlantic provinces
- IPTV service footprint encompassing 6.2 million householdsacross Ontario, Québec and the Atlantic provinces
- Largest Internet protocol (IP) multi-protocol label switchingfootprint of any Canadian provider, enabling us to offer businesscustomers a virtual private network (VPN) service for IP trafficand to optimize bandwidth for real-time voice and TV
- Access to the largest data centre footprint in Canada with27 locations in seven provinces, enabling us to offer datacentre co-location and hosted services to business customersacross Canada
- More than 1,400 Bell-branded stores and The Source locationsacross Canada
OUR PRODUCTS AND SERVICES
RESIDENTIAL
- TV: Bell Fibe TV and Bell Aliant FibreOP TV (our IPTV services) anddirect-to-home (DTH) Satellite TV, provide extensive contentoptions with Whole Home personal video recorder (PVR) andon-demand and 4K Ultra high-definition (HD) programming. OurIPTV service also offers consumers innovative features, includingRestart, the Fibe TV app and wireless TV
- Internet: high-speed Internet access through fibre opticbroadband technology or digital subscriber line (DSL)with a wide range of options, including unlimited usage, acomprehensive suite of security solutions, Home Hub all-in-onemodem and Wi-Fi router and mobile Internet. Our fibre opticInternet service, marketed as Fibe Internet and FibreOP Internet,offers speeds up to 50 Mbps with FTTN or 940 Mbps with FTTP
- Home Phone: local telephone service, long distance andadvanced calling features
- NextGen Home Security: a digital Internet-based serviceavailable in select locations in Atlantic Canada, providing homesecurity and monitoring with next-generation automationcapabilities, including remote management via web portal andmobile devices, appliance controls, and secure video monitoring
- Bundles: multi-product bundles of TV, Internet and voice serviceswith monthly discounts
BUSINESS
- IP-based services: business Internet, IP VPN, point-to-pointdata networks, global network solutions
- Business service solutions: hosting and cloud services, managedservices, professional services and infrastructure services thatsupport and complement our data connectivity services
- Voice and unified communications: IP telephony, local andlong distance, web and audio conferencing, e-mail solutions
| 32 BCE Inc. 2015 ANNUAL REPORT |
| | 1 | OVERVIEW | MD&A |
SEGMENT DESCRIPTION
- Canada’s premier multimedia company with leading assets in TV, radio, OOH advertising and digital media
- Revenues are derived primarily from advertising and subscriber fees
- Conventional TV revenue is derived from advertising
- Specialty TV revenue is generated from subscription fees and advertising
- Pay TV revenue is received from subscription fees
- Radio revenue is generated from advertising aired over our stations
- OOH revenues are generated from advertising
OUR BRANDS INCLUDE

OUR ASSETS AND REACH
TV
- 30 conventional TV stations, including CTV, Canada’s leadingTV network based on viewership
- 34 specialty TV channels, including TSN, Canada’s leadingspecialty channel and RDS, Canada’s leading French-languagespecialty channel based on viewership
- Four national pay TV services, including The MovieNetwork (TMN) and Super Écran
RADIO
- 106 licensed radio stations in 54 markets across Canada
OOH ADVERTISING
- Network of more than 30,500 advertising faces in British Columbia, Alberta, Ontario, Québec and Nova Scotia
DIGITAL MEDIA
- More than 200 websites and over 50 Internet applications (apps)
BROADCAST RIGHTS
- Sports: Bell Media has secured long-term media rights tomany of the key sports properties that are most important toCanadians, including being the official Canadian broadcasterof the Super Bowl, Grey Cup and International Ice HockeyFederation (IIHF) World Junior Championship. Bell Media’s slateof live sports coverage also includes the Toronto Maple Leafs,Montréal Canadiens, Winnipeg Jets and Ottawa Senators games,National Football League (NFL), National Basketball League (NBA),Major League Soccer (MLS), Fédération Internationale deFootball Association (FIFA) World Cup events through to 2022,Season of Champions Curling, Union of European FootballAssociations (UEFA) 2016 European Championship, Major LeagueBaseball (MLB), Barclays Premier League, UEFA ChampionsLeague, golf’s major championships, National Associationfor Stock Car Auto Racing (NASCAR) Sprint Cup, Formula 1,Grand Slam Tennis and National Collegiate Athletic Association(NCAA) March Madness
- HBO: long-term agreement to deliver all current-season,past-season and library HBO programming in Canadaexclusively on our linear, on-demand and over-the-top(OTT) platforms
- SHOWTIME: long-term content licensing and trademarkagreement for past, present and future SHOWTIME-ownedprogramming
- iHeartRadio: exclusive partnership for digital and streamingmusic services in Canada
OTHER ASSETS
- 50% interest in Dome Productions Partnership, one of North America’s leading providers of sports and other event production and broadcast facilities
OUR PRODUCTS AND SERVICES
- Varied and extensive array of TV programming to broadcastdistributors across Canada
- Advertising on our TV, radio, OOH, and digital media propertiesto both local and national advertisers across a wide rangeof industry sectors
- Mobile TV service with live and on-demand access to contentfrom our conventional TV networks, CTV and CTV Two, BNN,TSN, RDS, Discovery and other brands in news, sports andentertainment. This mobile content is offered on commercialterms to all Canadian wireless providers
- CraveTV subscription on-demand TV streaming service offering alarge collection of premium content in one place, including HBOand SHOWTIME programming, on set-top boxes (STBs), mobiledevices and online. CraveTV is offered through a number ofCanadian TV providers and is available directly to all CanadianInternet subscribers as an over-the-top (OTT) service
- TV Everywhere services, including CTV GO, Discovery GO,TMN GO, TSN GO, and RDS GO which provide live and on-demandcontent delivered over mobile and Wi-Fi networks tosmartphones, tablets and computers
BCE Inc. 2015 ANNUAL REPORT 33 |
1 | OVERVIEW | MD&A | |
BCE also holds investments in a number of other assets, including:
- a 28% indirect equity interest in MLSE, a sports and entertainment companythat owns several sports teams as well as real estate and entertainmentassets in Toronto
- a 50% indirect equity interest in Glentel, a Canadian-based dual-carrier,multi-brand mobile products distributor
- a 35.4% indirect equity interest in Q9, a provider of outsourced data centresolutions, such as hosting, co-location and cloud services
- an 18.4% indirect equity interest in entities that operate the Montréal CanadiensHockey Club and the Bell Centre in Montréal
- a 50% indirect equity interest in the Argos

EMPLOYEES
At the end of 2015, our team included 49,968 employees dedicated to driving shareholder return and improving customer service.
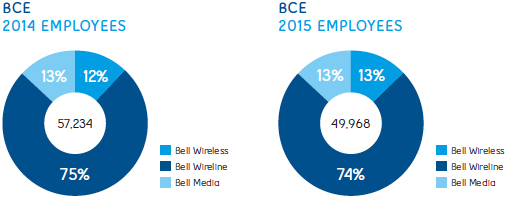
The total number of BCE employees at the end of 2015 decreased by 7,266 employees compared to the end of 2014, due primarily to the sale of a call centre subsidiary, workforce restructuring initiatives at our Bell Media and Bell Wireline segments to confront changing consumer preferences, new TV unbundling rules, a soft business market as a result of the economy and declines in home phone subscribers, as well as other workforce reductions attributable to normal attrition, retirements and productivity improvements, including synergies realized from the privatization of Bell Aliant.
Approximately 45% of total BCE employees are represented by labour unions.
BELL CODE OF BUSINESS CONDUCT
The ethical business conduct of our people is core to the integrity with which we operate our business. The Bell Code of Business Conduct sets out specific expectations and accountabilities, providing employees with practical guidelines to conduct business in an ethical manner. Our commitment to the Code of Business Conduct is renewed by employees each year in an ongoing effort to ensure that all employees are aware of, and adhere to, Bell’s standards of conduct.
| 34 BCE Inc. 2015 ANNUAL REPORT |
| | 1 | OVERVIEW | MD&A |
| |
| 1.3 Key corporate developments |
Bell Mobility acquires new wireless spectrum licences
In April 2015, Bell Mobility acquired advanced wireless services-3 (AWS-3) wireless spectrum in key urban and rural markets as part of Industry Canada’s (now Innovation, Science and Economic Development Canada (ISED)) AWS-3 spectrum auction. Bell Mobility acquired 13 licences for 169 million MHz-pop of AWS-3 spectrum for $500 million. This band of spectrum is strategically valuable in providing Bell Mobility with future incremental broadband capacity to meet growing consumer and business demand for mobile data services as well as for carrier aggregation.
In May 2015, Bell Mobility acquired an additional 243 million MHz-pop of 2500 MHz wireless spectrum for $29 million as part of Industry Canada’s spectrum auction, supplementing existing holdings in key urban and rural markets across Canada. Bell Mobility will use the additional 2500 MHz spectrum to further support 4G LTE services in eastern and western Ontario, Québec, Atlantic Canada, Alberta, British Columbia and all three Territories.
| |
| Acquisition of mobile phone distributor Glentel completed |
On May 20, 2015, BCE completed the previously announced acquisition of all of the issued and outstanding common shares of Glentel, a Canadian-based dual-carrier multi-brand mobile products distributor, for a total consideration of $592 million, of which $296 million ($284 million, net of cash on hand) was paid in cash and the balance through the issuance of 5,548,908 BCE common shares. Immediately following the closing of the acquisition, BCE repaid Glentel’s outstanding debt in the amount of approximately $112 million and contributed $53 million in exchange for additional Glentel common shares. Subsequently, also on May 20, 2015 and further to an agreement dated December 24, 2014, BCE divested 50% of its ownership interest in Glentel to Rogers Communications Inc. (Rogers) for a total cash consideration of approximately $473 million ($407 million, net of divested cash and transaction costs).
| |
| Bell Media signs HBO exclusive and expands TMN nationally |
In November 2015, Bell Media signed a long-term agreement with HBO whereby it would exclusively deliver in Canada all current, past and library HBO programming across linear, on-demand and OTT platforms, and also entered into a new original co-production partnership. Bell Media further announced that it would expand TMN into a national pay TV service and become the sole operator of HBO Canada in the first quarter of 2016 following Corus Entertainment Inc. (Corus)’s waiver of its HBO content rights and wind down of the operations of its Movie Central and Encore Avenue pay TV services in Western and Northern Canada. TMN was successfully launched nationally on March 1, 2016 and Movie Central and Encore Avenue’s operations ceased on the same day.
| |
| Joint acquisition of Toronto Argonauts Football Club |
On December 31, 2015, Bell Canada jointly acquired the Argos of the Canadian Football League (CFL) with a partner in MLSE, Larry Tanenbaum’s Kilmer Group. Live sports have become increasingly important to executing Bell’s media leadership strategy. By acquiring the Argos, Bell strengthens its media strategy by adding another iconic brand to an already extensive sports line-up.
| |
| Bell is Canada’s most valuable communications brand |
Bell moved up two spots to number three in Brand Finance’s annual rankings of Canada’s most valuable brands for 2015. Bell Canada was the only company in the top five from outside the financial services sector. The top 100 brands are compiled by global brand valuation firm Brand Finance in partnership with The Globe and Mail’s Report on Business magazine. Bell Canada was the only Canadian company to earn a AAA brand rating from Brand Finance, which factors in brand strength, risk and potential relative to competitors. A brand’s value reflects a company’s reputation and loyalty from customers, employees and investors, as well as future revenues attributable to the brand’s strength.
| |
| Thomas O’Neill to retire as BCE Chair, Board to nominate Gordon Nixon |
Thomas C. O’Neill will retire as Chair of the board of directors of BCE (BCE Board or Board) at the BCE Annual General Shareholder Meeting scheduled for April 28, 2016 in Montréal. The Board plans to nominate BCE director Gordon M. Nixon as Chair contingent upon his re-election as a director by BCE shareholders at the April 28 annual meeting.
A director of BCE since November 2014, Gordon Nixon was President and Chief Executive Officer (CEO) of the Royal Bank of Canada from 2001 until 2014, and CEO of RBC Dominion Securities from 1999 to 2001. A member of the Order of Canada, Mr. Nixon is a director of George Weston Limited and of BlackRock Inc. He also serves as Chair of scientific research and collaboration centre MaRS and of the Queen’s University Capital Campaign.
BCE Inc. 2015 ANNUAL REPORT 35 |
1 | OVERVIEW | MD&A | |
| |
| 1.4 Capital markets strategy |
We seek to deliver sustainable shareholder returns through consistent dividend growth. That objective is underpinned by continued growth in free cash flow, a healthy level of ongoing capital investment in the business, a strong balance sheet and an investment-grade credit profile.
Dividend growth and payout policy

On February 4, 2016, we announced a 5.0%, or 13 cent, increase in the annualized dividend payable on BCE’s common shares for 2016 to $2.73 per share from $2.60 per share in 2015, starting with the quarterly dividend payable on April 15, 2016. This represents BCE’s 12th increase to its annual common share dividend, representing an 87% increase, since the fourth quarter of 2008.
The dividend increase for 2016 is consistent with BCE’s common share dividend policy of a target payout between 65% and 75% of free cash flow. We intend to grow BCE’s common share dividend if we achieve free cash flow growth. BCE’s dividend policy and the declaration of dividends are subject to the discretion of the BCE Board and, consequently, there can be no guarantee that BCE’s dividend policy will be maintained or that dividends will be declared.
We have a strong alignment of interest between shareholders and our management’s equity-based long-term incentive compensation plan. The vesting of performance share units depends on the realization of our dividend growth policy, while stock options reflect our objective to increase the share price for our shareholders.

- Stringent share ownership requirements
- Emphasis on pay-at-risk for executive compensation
- Double trigger change in control policy
- Anti-hedging policy on share ownership and incentive compensation
- Clawbacks for the President and CEO and all Executive Vice-Presidents as well as all option holders
- Caps on all supplemental executive retirement plans (SERP) and annual bonus payouts, in addition to mid-term and long-term incentive grants
- Vesting criteria fully aligned to shareholder interests
Our dividend payout policy allows BCE to retain a high level of excess cash. Consistent with our capital markets objective to deliver sustainable shareholder returns through dividend growth while maintaining appropriate levels of capital investment, investment-grade credit ratings and considerable overall financial flexibility, we deploy excess cash in a balanced manner.
Uses of excess cash include, but are not limited to:
- Voluntary contributions to BCE’s defined benefit (DB) pension plans to improve the funded position of the plans and help minimize volatility of future funding requirements
- Financing of strategic acquisitions and investments(including wireless spectrum purchases) that supportthe growth of our business
- Debt reduction
- Share buybacks through normal course issuer bid(NCIB) programs
In 2015, BCE’s excess cash of $830 million was directed towards the purchase of AWS-3 and 2500 MHz wireless spectrum and a voluntary contribution to Bell Canada’s DB pension plan.
| 36 BCE Inc. 2015 ANNUAL REPORT |
| | 1 | OVERVIEW | MD&A |
| |
| Total shareholder return performance |


This graph compares the yearly change in the cumulative annual total shareholder return of BCE common shares against the cumulative annual total return of the S&P/TSX Composite Index(2), for the five-year period ending December 31, 2015, assuming an initial investment of $100 on December 31, 2010 and the quarterly reinvestment of all dividends.
| (1) | Based on BCE’s common share price on the Toronto Stock Exchange and assumes the reinvestment of dividends. |
| (2) | As the headline index for the Canadian equity market, the S&P/TSX Composite Index is the primary gauge against which to measure total shareholder return for Canadian-based, Toronto Stock Exchange-listed companies. |
BCE’s balance sheet is supported by substantial liquidity and an investment-grade credit profile, providing the company with a solid financial foundation and a high level of overall financial flexibility. BCE is well-positioned with an attractive long-term debt maturity profile and manageable near-term requirements to repay debt. We continue to monitor the capital markets for opportunities where we can further reduce our cost of debt and our cost of capital. We seek to proactively manage financial risk in terms of currency exposure of our U.S. dollar-denominated purchases, as well as equity risk exposure under BCE’s long-term equity-based incentive plans and interest rate and foreign currency exposure under our various debt instruments. We also seek to maintain investment-grade credit ratings with stable outlooks.
| | | | | |
ATTRACTIVE LONG-TERM DEBT MATURITY PROFILE Average term of Bell Canada’smedium-term note (MTN) debentures:9.2 years Average after-tax cost of MTNdebentures: 3.38% $1 billion to $2 billion of long-term debtmaturing annually over next five years
| | STRONG LIQUIDITY POSITION $1.3 billion available under our$3 billion multi-year committedcredit facilities $500 million accounts receivablesecuritization available capacity $613 million cash and cashequivalents on hand at theend of 2015
| | FAVOURABLE CREDIT PROFILE |
The committed amount under Bell Canada’s unsecured revolving facility was increased from $2.5 billion to $3 billion in the first quarter of 2015, providing us with additional financing flexibility.
In February 2015, Bell Canada renewed its MTN program, enabling it to offer up to $4 billion of MTN debentures from time to time until December 14, 2016. The MTN debentures will be fully and unconditionally guaranteed by BCE. Consistent with past practice, the MTN program was renewed to continue to provide Bell Canada with financial flexibility and efficient access to the Canadian and United States (U.S.) capital markets.
Pursuant to this MTN program, Bell Canada successfully accessed the capital markets in March 2015 and October 2015, raising a total of $1.5 billion in gross proceeds from the issuance of 30-year and seven-year MTN debentures. The October 2015 issuance of seven-year MTN debentures, which carries an annual interest rate of 3%, represented the lowest coupon ever achieved by Bell Canada on any MTN debenture issuance. The net proceeds of these offerings were used for the repayment of MTN debentures prior to their maturity, as well as for general corporate purposes including to repay outstanding commercial paper and to fund capital expenditures.
BCE Inc. 2015 ANNUAL REPORT 37 |
1 | OVERVIEW | MD&A | |
BCE also completed a public bought deal common share offering in December 2015, the first by the company since 2002. The base equity offering of $750 million, and the exercise of the 15% over-allotment option, that together resulted in the sale of 15,111,000 common shares at the offering price of $57.10 per share, generated total gross proceeds of $863 million. These proceeds were principally used to support debt reduction through the early redemption of $700 million principal amount of Bell Canada MTN debentures maturing in 2016, thereby contributing to the maintenance of a healthy balance sheet.
As a result of financing a number of strategic acquisitions made since 2010, including CTV, Astral Media Inc. (Astral), MLSE and Bell Aliant, voluntary pension plan funding contributions to reduce our pension solvency deficit, wireless spectrum purchases, and the incremental debt that was assumed as a result of the privatization of Bell Aliant, our net debt(1)leverage ratio(2)has, as shown in the table below, increased above the limit of our internal target range of 1.75 to 2.25 times adjusted EBITDA. That ratio is expected to improve over time and return within the net debt leverage ratio target range through growth in free cash flow and applying a portion of excess cash to the reduction of BCE’s indebtedness.
BCE CREDIT RATIOS | INTERNAL TARGET | | DECEMBER 31, 2015 | |
Net debt leverage ratio | 1.75–2.25 | | 2.53 | |
Adjusted EBITDA to net interest expense ratio(2) | >7.5 | | 8.76 | |
| (1) | Net debt is a non-GAAP financial measure and does not have any standardized meaning under IFRS. Therefore, it is unlikely to be comparable to similar measures presented by other issuers. See section 10.2,Non-GAAP financial measures and key performance indicators (KPIs) – Net debtfor more details, including a reconciliation to the most comparable IFRS financial measure. |
| (2) | Net debt leverage ratio and adjusted EBITDA to net interest expense ratio are non-GAAP financial measures and do not have any standardized meaning under IFRS. Therefore, they are unlikely to be comparable to similar measures presented by other issuers. See section 10.2,Non-GAAP financial measures and key performance indicators (KPIs) – Net debt leverage ratioandAdjusted EBITDA to net interest expense ratiofor more details. |
| |
| 1.5 Corporate governance and risk management |
Corporate governance philosophy
The BCE Board and management believe that strong corporate governance practices contribute to superior results in creating and maintaining shareholder value. That is why we continually seek to strengthen our leadership in corporate governance and ethical business conduct by adopting best practices, and providing full transparency and accountability to our stakeholders.
Key governance strengths and actions in support of our governance philosophy include:
- Separation of the Board Chair and CEO roles
- Director independence standards
- Board committee memberships restricted toindependent directors
- Annual director effectiveness and performance assessments
- Ongoing reporting to Board committees regarding ethicsprograms and the oversight of corporate policies across BCE
- Share ownership guidelines for directors and executives
- Executive compensation programs tied to BCE’s ability to growits common share dividend
For more information, please refer to BCE’s most recent notice of annual general shareholder meeting and management proxy circular filed with the Canadian provincial securities regulatory authorities (available atsedar.com) and with the United States Securities and Exchange Commission (available atsec.gov), and available on BCE’s website atBCE.ca.
| |
| Risk governance framework |
BOARD OVERSIGHT
BCE’s full Board is entrusted with the responsibility for identifying and overseeing the principal risks to which our business is exposed and seeking to ensure there are processes in place to effectively identify, monitor and manage them. These processes seek to mitigate rather than eliminate risk. A risk is the possibility that an event might happen in the future that could have a negative effect on our financial position, financial performance, cash flows, business or reputation. The Board delegates responsibility for the execution of certain elements of the risk oversight program to Board committees in order to ensure that they are treated with appropriate expertise, attention and diligence, with reporting to the Board in the ordinary course. The Board retains overall responsibility for, as well as direct oversight of, other risks or elements thereof, such as those relating to our regulatory environment, competitive environment, customer experience, technology/infrastructure transformation, operational performance and vendor oversight.

Risk information is reviewed by the Board or the relevant committee throughout the year and business leaders present regular updates on the execution of business strategies, risks and mitigation activities.
| 38 BCE Inc. 2015 ANNUAL REPORT |
| | 1 | OVERVIEW | MD&A |
The Audit Committee is responsible for overseeing financial reporting and disclosure as well as overseeing that appropriate risk management processes are in place across the organization. As part of its risk management activities, the Audit Committee reviews the organization’s risk reports and ensures that responsibility for each principal risk is formally assigned to a specific committee or the full Board, as appropriate. The Audit Committee also regularly considers risks relating to financial reporting, legal proceedings, performance of critical infrastructure, information, cyber and physical security, journalistic independence, privacy and records management, business continuity and the environment. The Management Resources and Compensation Committee (Compensation Committee) oversees risks relating to compensation, succession planning, and health and safety practices. The Pension Fund Committee (Pension Committee) has oversight responsibility for risks associated with the pension fund. The Corporate Governance Committee (Governance Committee) assists the Board in developing and implementing BCE’s corporate governance guidelines and determining the composition of the Board and its committees. In addition, the Governance Committee oversees matters such as the organization’s policies concerning business conduct, ethics and public disclosure of material information.
RISK MANAGEMENT CULTURE
There is a strong culture of risk management at BCE that is actively promoted by the Board and the company’s President and CEO at all levels within the organization. It has become a part of how the company operates on a day-to-day basis and is woven into its structure and operating principles, guiding the implementation of the organization’s strategic imperatives.
The President and CEO, selected by the Board, has set his strategic focus through the establishment of six strategic imperatives and focuses risk management around the factors that could impact the achievement of those strategic imperatives. While the constant state of change in the economic environment and the industry creates challenges to be managed, the clarity around strategic objectives, performance expectations, risk management and integrity in execution ensures discipline and balance in all aspects of our business.
RISK MANAGEMENT FRAMEWORK
While the Board is responsible for BCE’s risk oversight program, operational business units are central to the proactive identification and management of risk. They are supported by a range of corporate support functions that provide independent expertise to reinforce implementation of risk management approaches in collaboration with the operational business units. The Internal Audit function provides a further element of expertise and assurance, working to provide insight and support to the operational business units and corporate support functions, while also providing the Audit Committee with an independent perspective on the state of risk and control within the organization. Collectively, these elements can be thought of as a “Three Lines of Defence” approach to risk management, that is aligned with industry best practices and is endorsed by the Institute of Internal Auditors.
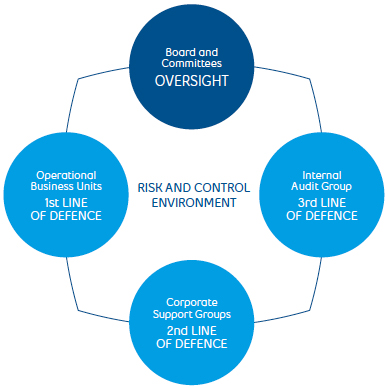
FIRST LINE OF DEFENCE – OPERATIONAL MANAGEMENT
The first line refers to management within our operational business segments (Bell Wireless, Bell Wireline and Bell Media) who are expected to understand their operations in great detail and the financial results that underpin them. There are regular reviews of operating performance involving the organization’s executive and senior management. The discipline and precision associated with this process, coupled with the alignment and focus around performance goals, create a high degree of accountability and transparency in support of our risk management practices.
As risks emerge in the business environment, they are discussed in a number of regular forums to share details and explore their relevance across the organization. Executive and senior management are integral to these activities in driving the identification, assessment, mitigation and reporting of risks at all levels. Formal risk reporting occurs through strategic planning sessions, management presentations to the Board and formal enterprise risk reporting, which is shared with the Board and the Audit Committee during the year.
Management is also responsible for maintaining effective internal controls and for executing risk and control procedures on a day-today basis. Each operational business unit develops its own operating controls and procedures that fit the needs of its unique environment.
BCE Inc. 2015 ANNUAL REPORT 39 |
1 | OVERVIEW | MD&A | |
SECOND LINE OF DEFENCE – CORPORATE SUPPORT FUNCTIONS
BCE is a very large enterprise with approximately 50,000 employees, multiple business units and a diverse portfolio of risks that is constantly evolving based on internal and external factors. In a large organization, it is common to manage certain functions centrally for efficiency, scale and consistency. While the first line of defence is often central to identification and management of business risks, in many instances operational management works both collaboratively with, and also relies on, the corporate functions that make up the second line of defence for support in these areas. These corporate functions include Finance, Corporate Security and Corporate Risk Management, as well as others such as Legal and Regulatory, Corporate Responsibility, Real Estate and Procurement.
Finance function: BCE’s Finance function plays a pivotal role in seeking to identify, assess and manage risks through a number of different activities, which include financial performance management, external reporting, pension management, capital management, and oversight and execution practices related to the United States Sarbanes-Oxley Act of 2002.
Corporate Security function: This function is responsible for all aspects of security, which requires a deep understanding of the business, the risk environment and the external stakeholder environment. Based on this understanding, Corporate Security sets the standards of performance required across the organization through security policy definitions and monitors the organization’s performance against these policies. In high and emerging risk areas such as cybersecurity, Corporate Security leverages its experience and competence and, through collaboration with the operational business units, develops strategies intended to mitigate the organization’s risks.
Corporate Risk Management function: This function works across the company to gather information and report on the organization’s assessment of its principal risks and the related exposures. Annually, senior management participates in a risk survey that provides an important reference point in the overall risk assessment process.
In addition to the activities described above, the second line of defence is also critical in building and operating the oversight mechanisms that bring focus to relevant areas of risk and reinforce the bridges between the first and second lines of defence, thereby seeking to ensure that there is a clear understanding of emerging risks, their relevance to the organization and the proposed mitigation plans. To further coordinate efforts between the first and second lines of defence, BCE has established a Security, Environmental and Health and Safety Committee (SEHS). A significant number of BCE’s most senior leaders are members of this committee, whose purpose is to oversee BCE’s strategic security, environmental, health and safety risks and opportunities. This cross-functional committee seeks to ensure that relevant risks are adequately recognized and mitigation activities are well-integrated and aligned across the organization and are supported with sufficient resources.
THIRD LINE OF DEFENCE – INTERNAL AUDIT FUNCTION
Internal Audit is a part of the overall management information and control system and has the responsibility to act as an independent appraisal function. Its purpose is to provide the Audit Committee and management with objective evaluations of the company’s risk and control environment, to support management in delivering against BCE’s strategic imperatives and to maintain an audit presence throughout BCE and its subsidiaries.
| 40 BCE Inc. 2015 ANNUAL REPORT |
| | 2 | STRATEGIC IMPERATIVES | MD&A |
2 Strategic imperatives
| Our success is built on the BCE team’s dedicated execution of the six Strategic Imperatives that support our goal to be recognized by customers as Canada’s leading communications company. |
2.1 Invest in broadband networks and services

We invest in wireline and wireless broadband platforms to deliver the most advanced wireless, TV, Internet and other IP-based services available, to support continued subscriber and data growth across all our residential product lines as well as the needs of our business market customers.
2015 PROGRESS
- Expanded our 4G LTE wireless network to reach 96% of the Canadian population coast to coast
- Launched Dual-band LTE-A network service, delivering mobile data speeds of up to 260 Mbps (typical speeds of 18 to 74 Mbps), to 48% of the Canadian population in parts of British Columbia, Alberta, Ontario, Atlantic Canada, Yukon and the Northwest Territories. We also began the rollout of Tri-band LTE-A, delivering speeds of up to 335 Mbps (typical speeds of 25 to 100 Mbps), in parts of Southern Ontario and select cities in Atlantic Canada.
- Acquired 13 licences for 169 million MHz-pop of AWS-3 spectrum in key urban and rural markets for $500 million following Industry Canada’s wireless spectrum auction, growing Bell’s capacity to meet heavy consumer and business demand for mobile data services
- Acquired an additional 243 million MHz-pop of 2500 MHz spectrum for $29 million as part of Industry Canada’s spectrum auction, supplementing existing holdings in key urban and rural markets across Canada
- Bell’s 4G LTE wireless network was ranked as the fastest mobile LTE network in Canada by PCMag, Rootmetrics and OpenSignal
- Began the buildout of broadband fibre directly to 1.1 millionhomes and businesses across the City of Toronto as part of Bell’ssingle largest infrastructure expansion project, with a plannedcapital investment of approximately $1.14 billion. The majority ofthe build-out is expected to be completed by the end of 2017.
- Launched Gigabit Fibe and Gigabit FibreOP Internet service tomore than 2.2 million homes across Québec, Ontario and theAtlantic provinces, offering speeds of up to 940 Mbps at launchand rising to a full 1 Gigabit per second (Gbps) or faster in 2016as equipment evolves to support these speeds. Gigabit Fibe andGigabit FibreOP are enabled by the ongoing deployment of ourFTTP network, bringing high-speed fibre technology directly intohomes and businesses.
2016 FOCUS
- Expand FTTP footprint to 8.2 million locations passed
- Accelerate FTTP deployment in Toronto and other major citiesand expand availability of Gigabit Fibe and Gigabit FibreOPInternet service
- Complete our 4G LTE wireless network build to 98% of Canadianpopulation and manage wireless network capacity
- Expand LTE-A coverage to reach 75% of the Canadian population
BCE Inc. 2015 ANNUAL REPORT 41 |
2 | STRATEGIC IMPERATIVES | MD&A | |

Our objective is to grow our Bell Wireless business profitably by focusing on postpaid subscriber acquisition and retention, maximizing average revenue per user (ARPU) by targeting premium smartphone subscribers in all geographic markets we operate in, leveraging our wireless networks, and maintaining device and mobile content leadership to drive greater wireless data penetration and usage.
2015 PROGRESS
- Acquired 36% and 43% of total new postpaid gross and netactivations, respectively, among the three national wirelesscarriers, while achieving leading service revenue, ARPU andadjusted EBITDA growth of 7.6%, 5.3% and 7.8%, respectively
- Expanded the number of smartphone users at the end of 2015to 78% of our total postpaid subscribers, up from 76% at theend of 2014
- Expanded our smartphone lineup with over 30 new devices,including the Apple iPhone 6S and 6S Plus, Samsung GalaxyS6 and S6 Edge, Samsung Galaxy Note 5, Motorola Moto G, HTCOne M9 and LG G4, adding to our extensive selection of 4GLTE-capable devices
- Completed the acquisition of Glentel
- Launched Suretap, an open wallet payment system based onnear field communications (NFC) subscriber identity module (SIM)cards and backed by Bell, TELUS Corporation (TELUS) and Rogersand available to other carriers. With support for 40 paymentcards and more than 30 gift card brands, the Suretap appis available to more than 90% of Android and BlackBerrydevices sold.
- Launched Roam Better roaming feature that gives customersaccess to specialized roaming rates while traveling, providingunlimited voice and text messages across the U.S. and back toCanada as well as an additional 100 megabit (MB) of data usagefor $5 per day
- Launched the Bell Control Centre, a secure cloud-based platformthat lets Canadian businesses manage network connecteddevices within their operations over our 4G LTE network
2016 FOCUS
- Profitably grow our wireless postpaid subscriber base, whilemaintaining market share momentum of incumbent postpaidsubscriber activations
- Continue to increase ARPU
- Expand the number of postpaid smartphone subscribers usingour 4G LTE and LTE-A networks
- Continue to manage the financial and churn impacts fromincreased market activity arising from the significantlyincreased number of off-contract customers as a result ofthe mandatory code of conduct for providers of retail mobilewireless voice and data services in Canada (Wireless Code)implemented in 2013, which has applied to all wireless contractssince June 3, 2015
- Offer the latest handsets and devices in a timely mannerto enable customers to benefit from ongoing technologicalimprovements by manufacturers and from faster data speedsto optimize the use of our services
- Accelerate new revenue streams by continuing to drive thecommercialization of mobile payments and IoT servicesand applications
| 42 BCE Inc. 2015 ANNUAL REPORT |
| | 2 | STRATEGIC IMPERATIVES | MD&A |
| |
| 2.3 Leverage wireline momentum |

We focus on leveraging our fibre-based TV and Internet services to develop attractive residential offers that drive higher multi-product bundle sales and improve customer satisfaction and retention. These new services contribute to the ongoing shift of our operating mix away from legacy wireline voice services.
In our business markets, we remain focused on expanding our broadband network and strengthening our delivery of integrated solutions to Canadian businesses, while continuing to manage the transformation of our business from legacy network services to a fully-integrated data hosting, cloud computing and managed services provider.
2015 PROGRESS
- Became Canada’s largest TV provider with 2,738,496 subscribers, up 3.6% over 2014, and increased our total number of IPTV subscribers by 26.7% to 1,182,791
- Built on our position as the leading Internet service provider in Canada with a high-speed Internet subscriber base of 3,413,147, up 3.5% over 2014
- Increased the number of multi-product households – those that buy TV, Internet and Home Phone – by 11% over 2014, fuelled by our IPTV service, which drove higher pull-through attach rates for Home Phone and Internet services, with 64% of all new IPTV customers taking three products
- Continued to lead IPTV innovation in Canada by making several enhancements to our Fibe TV and FibreOP TV services with exclusive features like Restart, enabling customers to rewind and watch TV shows already in progress from the beginning
- Further enhanced Restart with a “Look Back” feature, allowing viewers to go back in time to watch and Restart shows that aired in the previous 30 hours
- Introduced other new features including “Trending”, available on Fibe TV, which highlights the five most-watched shows in Canada at any given time and allows viewers to watch them live or Restart from the beginning; and “Resume”, which allows viewers to change channels while replaying a show and then change back to the original channel and pick up where they left off
- Launched the Fibe TV app, which recreates the full Fibe TV experience on any screen, with access to more than 300 live and on-demand channels at home, or up to 170 on the go
- Upgraded all Fibe and FibreOP customer TV receivers to enable quick access to Netflix video streaming
- Bell Fibe TV and Bell Aliant FibreOP TV were the top two TV services most recommended by customers in Canada(1)
- Opened a state-of-the-art data centre in Saint John, New Brunswick, the first in Atlantic Canada and one of just 11 in Canada to achieve Tier III designation, which certifies full redundancy in all mission critical infrastructures
- Expanded Bell’s data hosting facility in Montréal, already the largest in Québec, to offer a total IT load capacity of 6.8 megawatts in a 60,000 square foot (5,574 m2) location, supporting business technology growth in Québec and reinforcing Bell’s leadership in hosting, connectivity and cloud computing
2016 FOCUS
- Continue to enhance our IPTV service
- In January 2016, we launched the Fibe TV 4K Whole Home PVR for customers in Toronto, Montréal, Ottawa and Québec City. Bell’s 4K Whole Home PVR is the smallest available on the market and has the largest recording capacity. In February 2016, the availability of the 4K Whole Home PVR for purchase was expanded to all Bell Fibe TV customers and to Bell Aliant FibreOP TV customers in Atlantic Canada. The rental program as well as HDR (high dynamic range) ready capabilities will be available early in the second quarter of 2016.
- Expand our total base and market share of TV and Internet subscribers profitably
- Continue to reduce total wireline residential net losses
- Increase residential household ARPU through greater multi-product household penetration
- Increase share of wallet of large enterprise customers through greater focus on business service solutions and connectivity growth
- In February 2016, we announced a new partnership with IBM Canada Limited (IBM) to expand the cloud computing services available through our Bell Business Cloud service, giving businesses across Canada access to the IBM Cloud service via a secure, high-speed connection from Bell, simplifying the way customers adopt and build out their hybrid clouds
- Increase the number of net new customer relationships in both large and mid-sized businesses and reduce small business customer losses
| (1) | Nielsen Consumer Insights findings published in Customer Interaction Metric study (October 2015) |
BCE Inc. 2015 ANNUAL REPORT 43 |
2 | STRATEGIC IMPERATIVES | MD&A | |
| |
| 2.4 Expand media leadership |

We strive to deliver leading sports, news, entertainment and business content across multiple broadband platforms – TV, Internet, smartphones and tablets (four screens) – to grow audiences. We also plan to create more of our own content, ensuring that Canadian attitudes, opinions, values and artistic creativity are reflected in our programming and in our coverage of events in Canada and around the world, and to introduce new services in support of new revenue streams.
2015 PROGRESS
- Maintained CTV’s #1 ranking as the most-watched networkin Canada for the 14th year in a row, and continued to leadwith a majority of the Top 20 programs nationally in allkey demographics
- Concluded a comprehensive, long-term agreement with HBOgiving Bell Media the ability to deliver all current-season,past-season and library HBO programming in Canada exclusively on our linear, on-demand and OTT platforms. Bell Mediaand HBO will also partner to co-produce original Canadianprogramming for their platforms and for distribution worldwide.
- Announced the expansion of TMN into a national pay TV servicein 2016 as Bell Media becomes the sole operator of HBO Canadaafter Corus winds down operations of its Movie Central andEncore Avenue pay TV services in Western and Northern Canada
- Concluded a long-term content licensing and trademark agreement to bring the SHOWTIME brand to Canada for the first timewith past, present and future SHOWTIME-owned programmingbeing made available across all platforms in English and French,including CraveTV and TMN
- Concluded a licensing agreement with Twentieth Century FoxTelevision Distribution that will deliver first-run theatrical titlesfrom Twentieth Century Fox, Fox Searchlight, and Fox 2000 toTMN and TMN Encore subscribers
- Extended our broadcast agreement with the CFL by threeyears through to the end of the 2021 season. TSN and RDS holdexclusive television rights for CFL football, including pre-season,regular season, playoff and Grey Cup games. In additionto broadcast and digital rights, the deal features exclusiveGrey Cup radio rights for Bell Media stations.
- Concluded an agreement with CBC/Radio-Canada to bethe official sports specialty broadcaster for the Beijing 2022Winter Olympic Games and the 2024 Summer Olympic Games,extending our partnership which already covers Rio 2016,PyeongChang 2018 and Tokyo 2020
- Extended a long-term media rights agreement for French Opentennis through to 2024, ensuring TSN and RDS will continue todeliver exclusive coverage of all four Grand Slam tennis events
- Astral OOH was awarded long-term contracts with a numberof Canadian airports, including: an eight-year contract by theOttawa Macdonald-Cartier International airport to replace allof the existing advertising infrastructure at the airport witha complete line of digital products; an eight-year contract withthe Vancouver International Airport; and a 10-year contract withHalifax’s Stanfield International Airport
- Astral OOH secured a 10-year business agreement for transitshelter and bus advertising in Québec city with the Réseau detransport de la Capitale
- Acquired the Argos of the CFL jointly with Larry Tanenbaum’sKilmer Group, a partner in MLSE, strengthening our mediastrategy by adding another iconic brand to our alreadyextensive sports line-up
2016 FOCUS
- Maintain strong audience levels and ratings across all TV and radio properties
- Reinforce industry leadership in conventional TV, pay TV, sports media and radio
- In January 2016, we announced an exclusive partnership with iHeartRadio to bring its digital and streaming music services to Canada in 2016
- Also in January 2016, TSN became the first broadcaster to produce a live 4K Ultra HD broadcast in North America with the Toronto Raptors vs. Boston Celtics basketball game on January 20, 2016
- Grow viewership and scale of CraveTV on-demand TV streaming service
- In January 2016, we launched CraveTV direct to consumers as a standalone product available to all Canadians with an Internet subscription
- Expand TMN into a national pay TV service
- Develop in-house production and content creation for distribution and use across all platforms and screens
- Expand live and on-demand content through our TV Everywhere services
- Become the OOH leader in Canada
- In January 2016, we acquired Métromédia CMR Plus Inc. (Métromédia), Cogeco Inc.’s OOH advertising subsidiary, allowing Astral OOH to expand its advertising assets in the public transit market
- Grow French media properties
- Leverage cross-platform and integrated sales and sponsorship
| 44 BCE Inc. 2015 ANNUAL REPORT |
| | 2 | STRATEGIC IMPERATIVES | MD&A |
| |
| 2.5 Improve customer service |

Our objective is to enhance customers’ overall experience by delivering call centre efficiency, meeting commitments for the installation and timely repair of services, increasing network quality, and implementing process improvements to simplify customer transactions and interactions with our front-line employees and self-serve tools. All of these will help differentiate us from our competitors and gain long-term customer loyalty. We intend to achieve this by making the investments we need to improve our front-line service capabilities, our networks, our products and our distribution channels to win and keep customers.
2015 PROGRESS
- Invested over $850 million since 2011, including approximately$100 million in 2015, to improve the customer experience
- Reduced customer calls to our service centres by 6 million in2015 through our continued investments in service and a focuson simplification
- Reduced Fibe TV installation time for FTTP customers by 10%in 2015 and 30% since the beginning of 2012
- Increased availability of two-hour appointment windows for FibeTV installations by seven times over 2014 and extended two-hourwindow availability to Internet and Home Phone repairs
- Achieved Same Day Next Day service completion rates of 92%for repairing service issues with Home Phone, TV and Internetand increased Same Day completion for both residential andbusiness customers by 24% over 2014
- Improved customer satisfaction with technicians to 92% forinstallations and repairs
- Reduced IP VPN provisioning time by 12 days forbusiness customers
- Improved Net Promoter Score, a measure of overall customersatisfaction, by 14% in 2015 and 55% since 2011 for Bell Mobility
- Bell was the most improved wireless carrier among full servicecarriers and Virgin Mobile Canada (Virgin Mobile) was #1 amongnational carriers in customer service and wireless purchaseexperience satisfaction(1)
- Launched a redesigned and simplified bill for residentialcustomers with an intuitive grid format, making it easier forcustomers to follow changes month over month
- Introduced personalized videos for new Bell Mobility customersthat explain what to expect on the first bill, how to check usageand update phone features, and how to manage accountsthrough MyBell.ca and the MyBell mobile app
- Introduced a faster registration process for our onlineself-serve platform
- Introduced a new Internet usage notification program, enablingcustomers to better manage their Internet usage
- Launched a new suite of call centre tools to improve the orderingexperience for small business customers, reducing orderingtimes by 60%
- Handled more than 160 million online self-serve visits, infoviewsand transactions, an increase of 9 million over 2014
2016 FOCUS
- Continue to invest in customer service initiatives to simplifycomplexity for all customers including billing
- Reduce further the total volume of wireline and wireless customer calls to our residential and wireless services call centres
- Further improve customer satisfaction scores
- Achieve better consistency in customer experience
- Improve customer personalization
| |
| 2.6 Achieve a competitive cost structure |

Cost containment is a core element of our financial performance. It remains a key factor in our objective to preserve steady margins as we continue to experience revenue declines in our legacy wireline voice and data services and further shift our product mix towards growth services. We aim to accomplish this through operating our business in the most cost-effective way possible to extract maximum operational efficiency and productivity gains.
2015 PROGRESS
- Maintained stable BCE consolidated adjusted EBITDA margin(2)compared to 2014
- Reduced wireline operating costs by 1.6%, contributingto Bell Wireline adjusted EBITDA margin improvement of0.7 pts over 2014
- Realized operating cost and capital expenditure synergiesfrom the integration of Bell Aliant into our Bell Wireline andBell Wireless segments
- Restructured Bell Media’s organization to grow the team’scompetitiveness in the fast-changing media landscape
- Restructured our Business Markets unit to maximize service and support for our mid-sized and enterprise business customers and enhance Bell’s leadership in these markets
2016 FOCUS
- Realize additional operating cost and capital expendituresynergies from the integration of Bell Aliant
- Execute on labour savings from workforce reductions atBell Media and Bell Wireline
- Deliver cost savings from workforce reductions undertakenin 2015, ongoing service improvements, and savings relatedto the deployment of FTTP to support a stable consolidatedadjusted EBITDA margin
| (1) | J.D. Power and Associates 2015 Canadian Wireless Customer Care Study |
| (2) | Adjusted EBITDA margin is a non-GAAP financial measure and does not have any standardized meaning under IFRS. Therefore, it is unlikely to be comparable to similar measures presented by other issuers. See section 10.2,Non-GAAP financial measures and key performance indicators (KPIs) – Adjusted EBITDA and adjusted EBITDA marginfor more details. |
BCE Inc. 2015 ANNUAL REPORT 45 |
3 | PERFORMANCE TARGETS, OUTLOOK,
ASSUMPTIONS AND RISKS | MD&A | |
3 Performance targets, outlook, assumptions and risks
This section provides information pertaining to our performance against 2015 targets, our consolidated business outlook and operating assumptions for 2016 and our principal business risks.
3.1 2015 performance vs. guidance targets
| | FINANCIAL
GUIDANCE | 2015
TARGET | 2015
PERFORMANCE AND RESULTS | ACHIEVED |
BCE | Revenue growth | 1%–3% | 2.2% | Driven by strong Bell Wireless revenue growth of 8.7% along with Bell Media revenue growth of 1.3%, moderated by a modest decline in Bell Wireline revenue of 0.5%. |  |
| Adjusted EBITDA growth | 2%–4% | 3.0% | Increase reflected 4.3% higher revenues from Bell growth services (wireless, wireline broadband and TV as well as media), offsetting the decline in traditional wireline voice service revenues. This, along with effective cost containment, resulted in a relatively stable adjusted EBITDA margin of 39.7%. | |
| Capital intensity | Approx. 17% | 16.9% | BCE invested $3,626 million in new capital in 2015 resulting in a capital intensity ratio of 16.9% compared to 17.7% in 2014. Capital spending was focused on the ongoing deployment of our broadband fibre, the continued rollout of our 4G LTE and LTE-A mobile services, expansion of network capacity to support greater speeds and increasing data usage, as well as enhancements to our customer service delivery systems. | |
| Adjusted net earnings per share (adjusted EPS)(1) | $3.28–$3.38 | $3.36 | Adjusted net earnings(1)in 2015 increased by $321 million, or $0.18 per common share, driven by higher adjusted EBITDA, lower non-controlling interest as a result of the privatization of Bell Aliant, lower amortization expense and reduced interest expense, partly offset by higher other expense. The average number of BCE common shares outstanding increased, as a result of the privatization of Bell Aliant, our investment in Glentel and shares issued under a public bought deal offering, which moderated the increase in adjusted EPS. | |
| Free cash flow growth | Approx. 8%–15% | 9.3% | Increase in free cash flow of $255 million in 2015 was driven by higher adjusted EBITDA, the favourable impact of the privatization of Bell Aliant and lower capital expenditures, partly offset by lower cash from working capital. | |
3.2 Business outlook and assumptions
Outlook
BCE’s 2016 outlook builds on the sound financial results achieved in 2015 and reflects continued progress in the execution of our six strategic imperatives to drive healthy projected revenues, adjusted EBITDA, net earnings and free cash flow growth from operations, which is expected to support substantial capital investment programs in strategic network infrastructure and a higher BCE common share dividend for 2016. Our outlook also reflects the confidence we have in continuing to successfully manage our Bell Wireless, Bell Wireline and Bell Media businesses within the context of a highly competitive and dynamic market.
The key 2016 operational priorities for BCE are to:
- Maintain market share momentum of incumbent wirelesspostpaid subscriber activations
- Drive higher wireless adjusted EBITDA through wireless postpaidsubscriber base expansion and higher blended ARPU, drivenby a higher smartphone mix, increased data consumptionon 4G LTE and LTE-A networks, and higher access rates fromprice increases
- Complete our 4G LTE network build, significantly expand ourLTE-A network footprint and manage wireless network capacity
- Continue broadband fibre deployment with a focus onexpanding our FTTP footprint
- Generate positive full-year wireline adjusted EBITDA growth
- Deliver positive full-year residential net subscriber activationswithin our wireline incumbent local exchange carrier (ILEC)footprint, driven by continued IPTV growth and an expandedFTTP network that are expected to support the pull-throughof Internet and residential NAS services, leading to a higherpenetration of multi-product households
- Increase residential services household ARPU from increasedpenetration of multi-product households, promotion expiries andprice increases
- Limit downsizing of current TV packages by our customers asa result of the implementation of TV channel unbundling
| (1) | Adjusted net earnings and adjusted EPS are non-GAAP financial measures and do not have any standardized meaning under IFRS. Therefore, they are unlikely to be comparable to similar measures presented by other issuers. See section 10.2,Non-GAAP financial measures and key performance indicators (KPIs) - Adjusted net earnings and adjusted EPSin this MD&A for more details, including a reconciliation to the most comparable IFRS financial measures. |
| 46 BCE Inc. 2015 ANNUAL REPORT |
| | 3 | PERFORMANCE TARGETS, OUTLOOK,
ASSUMPTIONS AND RISKS | MD&A |
- Deliver positive Bell Media full-year adjusted EBITDA growthand margin improvement, driven by CraveTV subscriber growth,national expansion of TMN and labour savings from workforcereductions undertaken in 2015
- Continue scaling Bell Media’s CraveTV on-demand streamingservice through growth in the number of broadcastingdistribution undertakings’ (BDUs) offering the service to their TVcustomers and growth in OTT users following our direct-to-consumer launch in January 2016
- Control rising TV programming and sports rights costs as well asmulti-platform media content costs
- Realize operating cost savings from workforce reductions undertaken in 2015 across the Bell Media and Bell Wireline organizations, realize further operating cost synergies from the integration of Bell Aliant into our Bell Wireline and Bell Wireless operating segments, and continue to drive customer service improvements to help maintain BCE’s adjusted EBITDA margin essentially stable year over year
Our projected financial performance for 2016 enabled us to increase the annualized BCE common share dividend for 2016 by 13 cents, or 5.0%, to $2.73 per share, maintaining our payout ratio within our target policy range of 65% to 75% of free cash flow.
ASSUMPTIONS ABOUT THE CANADIAN ECONOMY
- Gradual strengthening of the economy driven by activity in thenon-resource sector, given the Bank of Canada’s most recentestimated growth in Canadian gross domestic product of 1.4% in2016, compared to 1.2% in 2015
- Sustained weak employment growth, as the overall level ofbusiness investment is expected to remain soft
- Interest rates to remain relatively stable through 2016
- Canadian dollar to remain at near current levels, with any furthermovements impacted by the degree of strength of the U.S. dollarand changes in commodity prices
MARKET ASSUMPTIONS
- A sustained level of wireline and wireless competition in bothconsumer and business markets
- Higher but slowing wireless industry penetration andsmartphone adoption
- Wireless industry pricing discipline maintained on a higherexpected number of customers with expired contracts resultingfrom the expiry of two- or three-year service contracts due tothe Wireless Code
- A relatively stable media advertising market and escalatingcosts to secure TV programming
| |
| 3.3 Principal business risks |
Provided below is a summary description of certain of our principal business risks that could have a material adverse effect on all of our segments. Certain additional business segment-specific risks are reported in section 5,Business segment analysis. For a detailed description of the principal risks relating to our regulatory environment and a description of the other principal business risks that could have a material adverse effect on our financial position, financial performance, cash flows, business or reputation, refer to section 8,Regulatory environment, and section 9,Business risks, respectively.
Although most of our retail services are not price-regulated, government agencies and departments such as the Canadian Radio-television and Telecommunications Commission (CRTC), Innovation, Science and Economic Development Canada (ISED) (previously called Industry Canada), Canadian Heritage and the Competition Bureau continue to play a significant role in regulatory matters such as mandatory access to networks, net neutrality, spectrum auctions, approval of acquisitions, broadcast licensing and foreign ownership requirements. Adverse decisions by regulatory agencies or increased regulation could have negative financial, operational, reputational or competitive consequences for our business. For a discussion of our regulatory environment and the principal risks related thereto, refer to section 8,Regulatory environment.
As the scope of our businesses increases and evolving technologies drive new services, new delivery models and creative strategic partnerships, our competitive landscape expands to include new and emerging competitors, certain of which were historically our partners or suppliers, as well as other global scale competitors including, in particular, OTT TV service and voice over Internet protocol (VoIP) providers. Pricing and investment decisions of market participants are based on many factors, such as strategy, market position, technology evolution, customer confidence and economic climate, and collectively these could adversely affect our market shares, service volumes and pricing strategies and, consequently, our financial results. Technology substitution and IP networks, in particular, continue to reduce barriers to entry in our industry. This has allowed competitors to launch new products and services and
BCE Inc. 2015 ANNUAL REPORT 47 |
3 | PERFORMANCE TARGETS, OUTLOOK,
ASSUMPTIONS AND RISKS | MD&A | |
gain market share with far less investment in financial, marketing, human, technological and network resources than has historically been required. In particular, some competitors sell their services through the use of our networks, without the need to invest to build their own networks. Such lower necessary investment has enabled some competitors to be very disruptive in their pricing. We expect these trends to continue in the future, which could negatively impact our business including, without limitation, in the following ways:
- Competitors’ aggressive market offers could result in pricingpressures and increased costs of customer acquisition andretention while higher Canadian wireless penetration could slowopportunities for new customer acquisition
- Product substitutions and spending rationalization by businesscustomers could result in an acceleration of NAS erosion beyondour current expectations
- A fundamental separation of content and connectivity is emerging, allowing the expansion and market penetration of low-costOTT TV providers and other alternative service providers, whichis changing our TV and media ecosystems and could affect ourbusiness negatively
- The increasing dependence on apps for content delivery, sales,customer engagement and service experience drives the needfor new and scarce capabilities (sourced internally or externally),which may not be available, as well as the need for associatedoperating processes integrated into ongoing operations
- Competition with global competitors such as Netflix, in additionto traditional Canadian competitors, for programming contentcould drive significant increases in content acquisition costswhile other global scale entities such as Google disruptlocal market dynamics as a result of innovative globalmarket strategies
- Adverse economic conditions, such as economic downturns orrecessions, adverse conditions in the financial markets, or adeclining level of retail and commercial activity could have anegative impact on the demand for, and prices of, our wireline,wireless and media products and services, as well as drivean increase in bad debts as the creditworthiness of somecustomers declines
- The continued market expansion of VoIP service providersand traditional software players delivering low-cost voice linealternatives, which is changing our approach to service offersand pricing, could have an adverse effect on our business
- Foreign competitors could enter the Canadian market andleverage their global scale advantage
- Our changing competitive landscape could also resultin challenges in optimizing the benefit of creative strategicpartnerships such as Glentel, MLSE and Q9
For a further discussion of our competitive environment and competition risk, as well as a list of our main competitors, on a segmented basis, refer toCompetitive landscape and industry trendsandPrincipal business risksin section 5,Business segment analysis.
Our operations, service performance and reputation depend on how well we protect our assets, including networks, information technology (IT) systems, offices and sensitive information, from events and attacks such as those referred to in section 9,Business risks – Operational performance – Our operations and business continuity depend on how well we protect, test, maintain and replace our networks, IT systems, equipment and other facilities. The protection and effective organization of our systems, applications and information repositories are central to the secure and continuous operation of our networks and business as electronic and physical records of proprietary business and personal data, such as confidential customer and employee information, are all sensitive from a market and privacy perspective. In particular, cyber threats, which include cyber attacks such as, but not limited to, hacking, computer viruses, denial of service attacks, industrial espionage, unauthorized access to confidential, proprietary or sensitive information or other breaches of network or IT security, are constantly evolving and our IT defences need to be constantly monitored and adapted. We are also exposed to cyber threats as a result of actions that may be taken by our customers or by our employees, whether malicious or not, including as a result of the use of social media and IT consumerization. In addition, cloud-based solutions may increase the risk of security and data leakage exposure if security control protocols are bypassed. Vulnerabilities could harm our brand and reputation as well as our customer relationships and may lead to:
- Network operating failures and service disruptions, whichcould directly impact our customers’ ability to maintain normalbusiness operations and deliver critical services and/or theability of third-party suppliers to deliver critical services to us
- The theft, loss or leakage of confidential information, includingcustomer or employee information, that could result in financialloss, exposure to claims for damages by customers andemployees, and difficulty in accessing materials to defendlegal cases
- Physical damage to network assets impacting service continuity
- Fines and sanctions from credit card providers for failing tocomply with payment card industry data security standards forprotection of cardholder data
- Increased audit and regulatory scrutiny that could divertresources from project delivery
- Increased fraud as criminals leverage stolen information againstus, our employees or our customers
- The potential for loss of subscribers or impairment of our abilityto attract new ones
| 48 BCE Inc. 2015 ANNUAL REPORT |
| | 4 | CONSOLIDATED FINANCIAL ANALYSIS | MD&A |
4 Consolidated financial analysis
This section provides detailed information and analysis about BCE’s performance in 2015 compared with 2014. It focuses on BCE’s consolidated operating results and provides financial information for each of our businesses. For further discussion and analysis of our Bell Wireless, Bell Wireline, and Bell Media business segments, refer to section 5,Business segment analysis.
4.1 Introduction
BCE consolidated income statements
| 2015 | | 2014 | | $ CHANGE | | % CHANGE | |
Operating revenues | 21,514 | | 21,042 | | 472 | | 2.2 | % |
Operating costs | (12,963 | ) | (12,739 | ) | (224 | ) | (1.8 | %) |
Adjusted EBITDA | 8,551 | | 8,303 | | 248 | | 3.0 | % |
Adjusted EBITDA margin | 39.7 | % | 39.5 | % | | | 0.2 | % |
Severance, acquisition and other costs | (446 | ) | (216 | ) | (230 | ) | n.m. | |
Depreciation | (2,890 | ) | (2,880 | ) | (10 | ) | (0.3 | %) |
Amortization | (530 | ) | (572 | ) | 42 | | 7.3 | % |
Finance costs | | | | | | | | |
Interest expense | (909 | ) | (929 | ) | 20 | | 2.2 | % |
Interest on post-employment benefit obligations | (110 | ) | (101 | ) | (9 | ) | (8.9 | %) |
Other (expense) income | (12 | ) | 42 | | (54 | ) | n.m. | |
Income taxes | (924 | ) | (929 | ) | 5 | | 0.5 | % |
Net earnings | 2,730 | | 2,718 | | 12 | | 0.4 | % |
Net earnings attributable to: | | | | | | | | |
Common shareholders | 2,526 | | 2,363 | | 163 | | 6.9 | % |
Preferred shareholders | 152 | | 137 | | 15 | | 10.9 | % |
Non-controlling interest | 52 | | 218 | | (166 | ) | (76.1 | %) |
Net earnings | 2,730 | | 2,718 | | 12 | | 0.4 | % |
Adjusted net earnings attributable to common shareholders | 2,845 | | 2,524 | | 321 | | 12.7 | % |
Net earnings per common share (EPS) | 2.98 | | 2.98 | | – | | – | |
Adjusted EPS | 3.36 | | 3.18 | | 0.18 | | 5.7 | % |
n.m.: not meaningful
BCE had a successful 2015, delivering revenue and adjusted EBITDA growth of 2.2% and 3.0%, respectively that yielded a stable adjusted EBITDA margin of 39.7% compared to 39.5% in 2014. This drove adjusted net earnings growth of 12.7% and healthy free cash flow growth of 9.3%.
BCE’s strong adjusted EBITDA performance was led by continued revenue growth from our wireless, Internet, IPTV and media businesses together with disciplined management of our operating costs, including cost reductions and synergy savings achieved from the Bell Aliant integration. This more than offset the higher spending on customer retention and postpaid subscriber acquisition at Bell Wireless, the erosion in traditional voice and data revenues at Bell Wireline and escalating content costs at Bell Media.
Net earnings in 2015 increased 0.4% compared to 2014, reflecting adjusted EBITDA growth, lower amortization expense due to an increase in the useful life of application software and reduced interest expense on various Bell Canada debt instruments. This was partly offset by higher severance, acquisition and other costs and higher other expense.
In 2015, BCE’s cash flows from operating activities increased $33 million compared to 2014, as a result of higher adjusted EBITDA, a lower voluntary DB pension plan contribution made in 2015 and lower income taxes paid in 2015, partly offset by lower cash from working capital and higher acquisition and other costs paid, mainly due to the payment in full satisfaction of the judgment rendered in a litigation claim for Satellite TV signal piracy as well as severance and integration costs relating to the privatization of Bell Aliant.
Our earnings and free cash flow supported our capital investment in our strategic priorities, particularly our broadband wireless and wireline networks and services, which helped to drive higher wireless, TV and Internet subscribers, while supporting the return of value to BCE shareholders through higher dividends.
BCE Inc. 2015 ANNUAL REPORT 49 |
4 | CONSOLIDATED FINANCIAL ANALYSIS | MD&A | |
TOTAL BCE CONNECTIONS
| 2015 | | 2014 | | % CHANGE | |
Wireless subscribers | 8,245,831 | | 8,118,628 | | 1.6 | % |
Postpaid | 7,375,416 | | 7,110,047 | | 3.7 | % |
High-speed Internet subscribers(1)(2) | 3,413,147 | | 3,297,026 | | 3.5 | % |
TV (Satellite and IPTV subscribers)(1)(2) | 2,738,496 | | 2,642,608 | | 3.6 | % |
IPTV(1)(2) | 1,182,791 | | 933,547 | | 26.7 | % |
Total growth services | 14,397,474 | | 14,058,262 | | 2.4 | % |
Wireline NAS lines(1)(2) | 6,688,666 | | 7,130,852 | | (6.2 | %) |
Total services | 21,086,140 | | 21,189,114 | | (0.5 | %) |
| (1) | Our Q1 2015 Internet, IPTV, total TV, and NAS subscriber base included a beginning of period adjustment to reduce the number of subscribers by 7,505, 2,236, 7,702, and 4,409, respectively, for deactivations as a result of the CRTC decision to eliminate the 30-day notice period required to cancel services. |
| (2) | Subsequent to a review of our subscriber metrics, our Q1 2015 beginning of period Internet, IPTV and total TV subscriber base was reduced by 31,426, 1,849 and 3,790 subscribers, respectively, while our NAS base was increased by 657 subscribers. These adjustments primarily consisted of older balances. |
BCE NET ACTIVATIONS
| 2015 | | 2014 | | % CHANGE | |
Wireless subscribers | 127,203 | | 193,596 | | (34.3 | %) |
Postpaid | 265,369 | | 311,954 | | (14.9 | %) |
High-speed Internet subscribers | 155,052 | | 160,390 | | (3.3 | %) |
TV (Satellite and IPTV subscribers) | 107,380 | | 153,360 | | (30.0 | %) |
IPTV | 253,329 | | 276,034 | | (8.2 | %) |
Total growth services | 389,635 | | 507,346 | | (23.2 | %) |
Wireline NAS lines | (438,434 | ) | (464,717 | ) | 5.7 | % |
Total services | (48,799 | ) | 42,629 | | n.m. | |
n.m.: not meaningful
BCE added 389,635 net new customer connections to its growth services in 2015, down 23.2% year over year. This was comprised of:
- 265,369 postpaid wireless customers, partly offset by thenet loss of 138,166 prepaid wireless customers
- 155,052 high-speed Internet customers
- 253,329 net new IPTV customers, partly offset by the net loss of145,949 Satellite TV customers
NAS net losses of 438,434 in 2015 improved by 5.7% compared to last year.
Total BCE customer connections across all services declined by 0.5% in 2015, reflecting an aggregate increase of 2.4% in our growth services subscriber bases, moderated by a stable year-over-year decline in wireline NAS of 6.2%. At the end of 2015, BCE customer connections totalled 21,086,140 and were comprised of the following:
- 8,245,831 wireless subscribers, up 1.6%, which included7,375,416 postpaid wireless subscribers, an increase of 3.7%since the end of last year
- 3,413,147 high-speed Internet subscribers, 3.5% higher yearover year
- 2,738,496 total TV subscribers, up 3.6%, which included1,182,791 IPTV customers, up 26.7% year over year
- 6,688,666 total NAS lines, a decline of 6.2% compared to last year
| 50 BCE Inc. 2015 ANNUAL REPORT |
| | 4 | CONSOLIDATED FINANCIAL ANALYSIS | MD&A |

| 2015 | | 2014 | | $ CHANGE | | % CHANGE | |
Bell Wireless | 6,876 | | 6,327 | | 549 | | 8.7 | % |
Bell Wireline | 12,258 | | 12,324 | | (66 | ) | (0.5 | %) |
Bell Media | 2,974 | | 2,937 | | 37 | | 1.3 | % |
Inter-segment eliminations | (594 | ) | (546 | ) | (48 | ) | (8.8 | %) |
Total BCE operating revenues | 21,514 | | 21,042 | | 472 | | 2.2 | % |
BCE
Total operating revenues for BCE increased by 2.2% in 2015, attributable to strong growth in our Bell Wireless segment together with higher revenues in our Bell Media segment, offset in part by a modest decline in our Bell Wireline segment. This was comprised of service revenues of $19,757 million, which grew by 2.2% compared to 2014, and product revenues of $1,757 million, which increased by 2.9% year over year.
BELL WIRELESS
Bell Wireless revenue growth of 8.7%, reflected 7.6% higher service revenues driven by a larger postpaid subscriber base combined with increased blended ARPU, resulting from higher average rate plan pricing, as customers continued to shift from three-year contracts to two-year contracts. Additionally, the growth in data usage, driven by higher smartphone penetration and greater usage of data applications along with improved collections of termination charges, further contributed to the growth in wireless revenues. This was partly offset by lower voice usage. Product revenues increased 22.2% in 2015, as a result of increased pricing on certain handsets, a greater number of premium smartphone devices in our sales mix and increased sales following the commencement of the convergence of three-year and two-year contract expiries (referred to as the “double cohort” in the wireless industry) due to the Wireless Code.
BELL WIRELINE
Bell Wireline revenues decreased a modest 0.5% in 2015, compared to last year, reflecting the continued erosion in our traditional voice and data revenues as well as a reduction in spending by business customers on data equipment as a result of continued slow economic growth, and competitive pricing pressures. The negative impact of legislation enacted in December 2014, which eliminated charges for paper bills in our residential market, also contributed to the decline. This was partly offset by higher Internet and TV service revenues, driven by subscriber growth and higher household ARPU.
BELL MEDIA
Bell Media revenues were up 1.3% compared to prior year, driven by increased conventional TV and OOH advertising, as well as higher subscriber revenues from growth in CraveTV, our streaming service launched in December 2014, and our broad suite of TV Everywhere services. This was partly offset by lower revenues from the discontinuance of Viewers Choice, which ceased operations in 2014, and a reduction in pay TV subscribers.
BCE Inc. 2015 ANNUAL REPORT 51 |
4 | CONSOLIDATED FINANCIAL ANALYSIS | MD&A | |
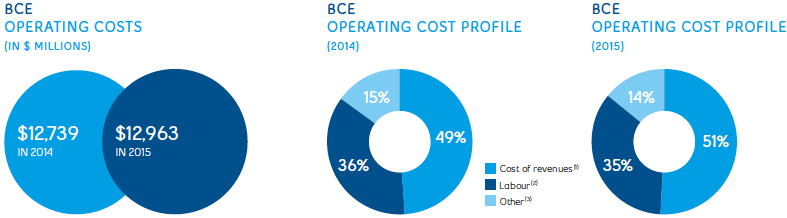
| 2015 | | 2014 | | $ CHANGE | | % CHANGE | |
Bell Wireless | (4,048 | ) | (3,703 | ) | (345 | ) | (9.3 | %) |
Bell Wireline | (7,258 | ) | (7,379 | ) | 121 | | 1.6 | % |
Bell Media | (2,251 | ) | (2,203 | ) | (48 | ) | (2.2 | %) |
Inter-segment eliminations | 594 | | 546 | | 48 | | 8.8 | % |
Total BCE operating costs | (12,963 | ) | (12,739 | ) | (224 | ) | (1.8 | %) |
BCE
Total BCE operating costs increased by 1.8% compared to 2014, mainly as a result of higher revenues. Operating cost increases at Bell Wireless and Bell Media were moderated by cost savings realized at our Bell Wireline segment.
BELL WIRELESS
The 9.3%, or $345 million, year-over-year increase in operating costs, was attributable to:
- Greater investment in customer retention resulting from higheractivity in the market as a result of the double cohort combinedwith a greater proportion of smartphone upgrades
- Increased subscriber acquisition costs associated with higherpostpaid gross activations
- Higher bad debt expense generated by increased revenues
- Higher network operating costs driven by LTE networkexpansion and increased usage
- Increased payments to other carriers resulting from higherdata usage volume
These factors were partly offset by lower advertising expense and reduced content costs.
BELL WIRELINE
Operating costs improved by 1.6%, or $121 million, compared to last year, as a result of:
- Cost savings generated by the synergies from the privatizationof Bell Aliant
- Lower labour costs resulting from headcount reductions, vendorcontract savings and lower call volumes
- Decreased general and administration costs driven by lowerbad debt, fleet costs, operating taxes and professional fees
- Reduced cost of goods sold attributable to lowerequipment sales
- Marketing and sales savings, due to disciplined spendingand higher costs incurred in the first quarter of 2014 for theSochi 2014 Winter Olympic Games
- Lower payments to other carriers driven by volume declines
These factors were partly offset by higher TV programming costs, due to a larger IPTV subscriber base, programming rate increases and the launch of CraveTV in December 2014.
BELL MEDIA
Operating costs increased by 2.2%, or $48 million, over 2014, primarily from greater content and programming costs related to CraveTV and sports broadcast rights, the expiry of certain CRTC benefits including the completion of the Local Programming Improvement Fund (LPIF) and higher spending on Canadian programming. This was partly offset by the loss of the broadcast rights for the 2015 NHL playoffs, reduced amortization of the fair value of certain programming rights, lower costs from the discontinuance of the Viewers Choice channel and disciplined expense management.
| (1) | Cost of revenues includes costs of wireless devices and other equipment sold, network and content costs, and payments to other carriers. |
| (2) | Labour costs (net of capitalized costs) include wages, salaries, and related taxes and benefits, post-employment benefit plans service cost, and other labour costs, including contractor and outsourcing costs. |
| (3) | Other operating costs include marketing, advertising and sales commission costs, bad debt expense, taxes other than income taxes, information technology (IT) costs, professional service fees and rent. |
| 52 BCE Inc. 2015 ANNUAL REPORT |
| | 4 | CONSOLIDATED FINANCIAL ANALYSIS | MD&A |
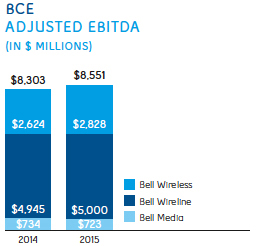
| 2015 | | 2014 | | $ CHANGE | | % CHANGE | |
Bell Wireless | 2,828 | | 2,624 | | 204 | | 7.8 | % |
Bell Wireline | 5,000 | | 4,945 | | 55 | | 1.1 | % |
Bell Media | 723 | | 734 | | (11 | ) | (1.5 | %) |
Total BCE adjusted EBITDA | 8,551 | | 8,303 | | 248 | | 3.0 | % |

BCE
BCE’s adjusted EBITDA was 3.0% higher in 2015 compared to last year, due to strong Bell Wireless performance and positive Bell Wireline growth, offset in part by a modest decline in Bell Media.
BCE’s adjusted EBITDA margin of 39.7% in 2015 remained relatively stable compared to 39.5% achieved in 2014, reflecting organic growth in revenues, tight operating cost control, and integration synergies from the privatization of Bell Aliant. This result was achieved even with higher wireless customer retention and postpaid subscriber acquisition spending, business markets softness and escalating content costs at Bell Media.
BELL WIRELESS
Bell Wireless adjusted EBITDA increased by 7.8% in 2015, compared to 2014, reflecting strong service revenue growth, partly offset by increased spending on customer retention and acquisitions driven by an increased number of customer contract expirations and a higher level of promotional activity as a result of the double cohort.
BELL WIRELINE
Bell Wireline adjusted EBITDA increased by 1.1% in 2015, compared to last year, attributable to:
- Ongoing growth in our Internet and IPTV revenues
- Synergies achieved from the privatization of Bell Aliant
- Continued effective cost management
This was offset in part by:
- Loss of higher-margin legacy voice and data service revenues
- The impact of overall market softness on our Bell BusinessMarkets unit reflecting the impact of reduced customer spendingand competitive pricing pressures
BELL MEDIA
Bell Media adjusted EBITDA declined by 1.5% in 2015 compared to last year, as a result of increased content and programming costs, which was moderated in part by revenue growth and lower amortization of the fair value of certain programming rights.
BCE Inc. 2015 ANNUAL REPORT 53 |
4 | CONSOLIDATED FINANCIAL ANALYSIS | MD&A | |
| |
| 4.6 Severance, acquisition and other costs |
This category includes various income and expenses that are not related directly to the operating revenues generated during the year.

2015
Severance, acquisition and other costs included:
- Severance costs related to involuntary and voluntary workforce reduction initiativesof $197 million incurred mainly in our Bell Media and Bell Wireline segments to addressincreasing competition, media industry regulation, a soft business market and declines inhome phone subscribers
- Acquisition and other costs of $249 million related mainly to a charge of $142 millionincurred for the payment in full satisfaction of the judgment rendered in a litigation claimfor Satellite TV signal piracy, severance and integration costs relating to the privatizationof Bell Aliant, as well as transaction costs, such as legal and financial advisory fees,related to completed or potential acquisitions.
2014
Severance, acquisition and other costs included:
- Severance costs related to involuntary and voluntary workforce reduction initiativesof $82 million
- Acquisition and other costs of $134 million, including severance and integration costsrelating to the privatization of Bell Aliant as well as transaction costs, such as legal andfinancial advisory fees, related to completed or potential acquisitions
| |
| 4.7 Depreciation and amortization |
The amount of our depreciation and amortization in any year is affected by:
- How much we invested in newproperty, plant and equipment andintangible assets in previous years
- How many assets we retiredduring the year
- Estimates of the useful livesof assets
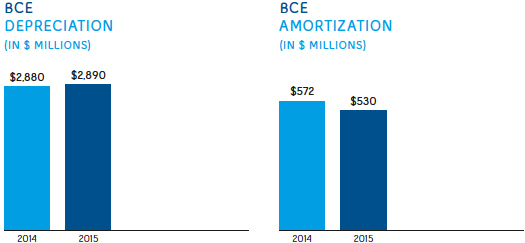
DEPRECIATION
Depreciation in 2015 increased by $10 million compared to 2014 due to a higher net depreciable asset base as we continued to invest in our broadband and wireless networks, as well as our IPTV service, partly offset by a reduction in the estimates of useful lives of certain network assets starting July 1, 2014 which increased depreciation expense in 2014, as described in section 10.1,Our accounting policies – Critical accounting estimates and key judgments.
AMORTIZATION
Amortization in 2015 decreased by $42 million compared to 2014, due mainly to an increase in 2014 in the estimates of useful lives of certain IT software assets from five to seven years, which was applied prospectively effective July 1, 2014, as described in section 10.1,Our accounting policies – Critical accounting estimates and key judgments, partly offset by a higher net asset base.
| 54 BCE Inc. 2015 ANNUAL REPORT |
| | 4 | CONSOLIDATED FINANCIAL ANALYSIS | MD&A |

INTEREST EXPENSE
Interest expense in 2015 decreased by $20 million compared to 2014 as a result of higher capitalized interest and lower average interest rates, partly offset by higher average debt levels.
INTEREST ON POST-EMPLOYMENT BENEFIT OBLIGATIONS
Interest on our post-employment benefit obligations is based on market conditions that existed at the beginning of the year.
In 2015, interest expense increased by $9 million compared to last year due to a higher post-employment benefit obligation and a lower discount rate, which decreased from 4.9% on January 1, 2014 to 4.0% on January 1, 2015.
The impacts of changes in market conditions during the year are recognized in other comprehensive income (loss) (OCI).
| |
| 4.9 Other (expense) income |
Other (expense) income includes income and expense, such as:
- Net mark-to-market gains or losses on derivatives used as economic hedges
- Net gains or losses on investments, including gains or losses when we dispose of,write down or reduce our ownership in investments
- Impairment of assets
- Losses on disposal and retirement of software, plant and equipment
- Equity (loss) income from investments in associates and joint ventures
- Early debt redemption costs

2015
Other expense included losses on disposal of software, plant and equipment of $55 million, a net impairment charge of $49 million mainly related to Bell Media’s music properties resulting from revenue and profitability declines from lower viewership and higher TV content costs, and losses totalling $49 million from our equity investments which included a loss on investments of $54 million representing our share of an obligation to repurchase at fair value the minority interest in one of BCE’s joint ventures. These factors were partly offset by a gain on investments of $72 million mainly due to a $94 million gain on the sale of our 50% ownership interest in Glentel to Rogers, and net mark-to-market gains of $54 million on derivatives used as economic hedges of share-based compensation and U.S. dollar purchases.
2014
Other income included net mark-to-market gains of $134 million on derivatives used as economic hedges of share-based compensation and U.S. dollar purchases, dividend income of $42 million from earnings generated in trust prior to the divestiture of Bell Media assets held for sale and foreign exchange gains in 2014. These were partly offset by a net impairment charge of $105 million, mainly relating to Bell Media’s conventional TV properties resulting from a softness in the overall Canadian TV advertising market and higher TV content costs, losses on disposal of software, plant and equipment of $51 million, and early debt redemption costs of $29 million.
BCE Inc. 2015 ANNUAL REPORT 55 |
4 | CONSOLIDATED FINANCIAL ANALYSIS | MD&A | |
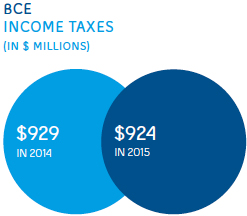
The following table provides information and reconciles the amount of reported income taxes in the income statements with income taxes calculated at a statutory income tax rate of 26.9% and 26.6% for 2015 and 2014, respectively.
FOR THE YEAR ENDED DECEMBER 31 | 2015 | | 2014 | |
Net earnings | 2,730 | | 2,718 | |
Add back income taxes | 924 | | 929 | |
Earnings before income taxes | 3,654 | | 3,647 | |
Applicable statutory tax rate | 26.9 | % | 26.6 | % |
Income taxes computed at applicable statutory rates | (983 | ) | (970 | ) |
Non-taxable portion of gains on investments | 26 | | 4 | |
Resolution of uncertain tax positions | 41 | | 1 | |
Utilization of previously unrecognized tax credits | 5 | | 23 | |
Effect of change in provincial corporate tax rate | (6 | ) | – | |
Change in estimate relating to prior periods | 8 | | 11 | |
Other | (15 | ) | 2 | |
Total income taxes | (924 | ) | (929 | ) |
Average effective tax rate | 25.3 | % | 25.5 | % |
| |
| 4.11 Net earnings and EPS |

Net earnings attributable to common shareholders in 2015 increased by $163 million, due to higher adjusted EBITDA, lower non-controlling interest due to the privatization of Bell Aliant, lower amortization expense due to an increase in the useful life of application software, and reduced interest expense on various Bell Canada debt instruments. This was partly offset by higher severance, acquisition and other costs and higher other expense.
Excluding the impact of severance, acquisition and other costs, net gains (losses) on investments, and early debt redemption costs, adjusted net earnings in 2015 were $2,845 million, or $3.36 per common share, compared to $2,524 million, or $3.18 per common share in 2014. The increase in adjusted EPS was partly offset by an increase in the average number of BCE common shares outstanding as a result of the privatization of Bell Aliant, our investment in Glentel and shares issued under a public bought deal offering.
| 56 BCE Inc. 2015 ANNUAL REPORT |
| | 4 | CONSOLIDATED FINANCIAL ANALYSIS | MD&A |
| |
| 4.12 Capital expenditures |
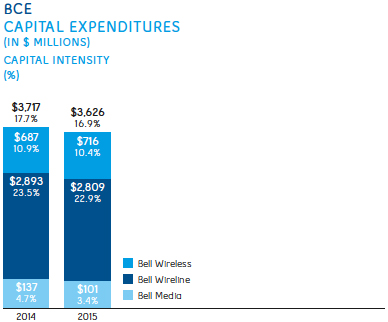
BCE capital expenditures declined by $91 million, or 2.4%, in 2015 due to lower spending in our Bell Wireline and Bell Media segments, partly offset by increased spending at Bell Wireless. As a percentage of revenue, BCE capital expenditures were 16.9% compared to 17.7% in 2014. Our capital investment supported the ongoing deployment of broadband fibre, including the build-out of Gigabit Fibe in Toronto and other urban locations, the continued rollout of our 4G LTE and LTE-A mobile services, expansion of our network capacity to support greater LTE speeds and increasing data consumption, as well as enhancements to our customer service delivery systems.
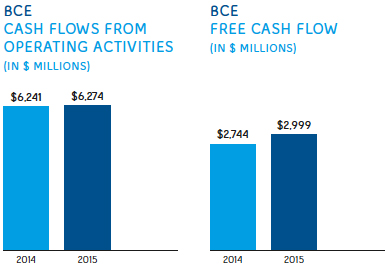
In 2015, BCE’s cash flows from operating activities increased $33 million compared to 2014, as a result of higher adjusted EBITDA, a lower voluntary DB pension plan contribution made in 2015 and lower income taxes paid in 2015, partly offset by lower cash from working capital and higher acquisition and other costs paid, mainly due to the payment in full satisfaction of the judgment rendered in a litigation claim for Satellite TV signal piracy as well as severance and integration costs relating to the privatization of Bell Aliant.
Free cash flow available to BCE’s common shareholders increased $255 million in 2015, driven by the favourable impact of the privatization of Bell Aliant, lower capital expenditures and higher cash flows from operating activities.
BCE Inc. 2015 ANNUAL REPORT 57 |
5 | BUSINESS SEGMENT ANALYSIS
BELL WIRELESS | MD&A | |
5 Business segment analysis
5.1 Bell Wireless
| In 2015, we achieved industry-leading profitability through disciplined postpaid customer acquisition and retention and increasing ARPU by driving higher smartphone adoption and mobile data usage. |
Key elements of relevant strategic imperatives

INVEST IN BROADBAND NETWORKS AND SERVICES
2015 PROGRESS
- Expanded our 4G LTE wireless network to reach 96% of the Canadian population coast to coast
- Launched Dual-band LTE-A network service, delivering mobile data speeds of up to 260 Mbps (typical speeds of 18 to 74 Mbps), to 48% of the Canadian population in parts of British Columbia, Alberta, Ontario, Atlantic Canada, Yukon and the Northwest Territories. We also began the rollout of Tri-band LTE-A, delivering speeds of up to 335 Mbps (typical speeds of 25 to 100 Mbps), in parts of Southern Ontario and select cities in Atlantic Canada.
- Acquired 13 licences for 169 million MHz-pop of AWS-3 spectrum in key urban and rural markets for $500 million following Industry Canada’s wireless spectrum auction, growing Bell’s capacity to meet heavy consumer and business demand for mobile data services
- Acquired an additional 243 million MHz-pop of 2500 MHz spectrum for $29 million as part of Industry Canada’s spectrum auction, supplementing existing holdings in key urban and rural markets across Canada
- Bell’s 4G LTE wireless network was ranked as the fastest mobile LTE network in Canada by PCMag, Rootmetrics, and OpenSignal
2016 FOCUS
- Complete our 4G LTE wireless network build to 98% of theCanadian population and manage wireless network capacity
- Expand LTE-A coverage to reach 75% of the Canadian population

ACCELERATE WIRELESS
2015 PROGRESS
- Acquired 36% and 43% of total new postpaid gross and net activations, respectively, among the three national wireless carriers, while achieving leading service revenue, ARPU and adjusted EBITDA growth of 7.6%, 5.3% and 7.8%, respectively
- Expanded the number of smartphone users at the end of 2015 to78% of our total postpaid subscribers, up from 76% at the end of 2014
- Expanded our smartphone lineup with over 30 new devices,including the Apple iPhone 6S and 6S Plus, Samsung GalaxyS6 and S6 Edge, Samsung Galaxy Note 5, Motorola Moto G, HTCOne M9 and LG G4, adding to our extensive selection of 4GLTE-capable devices
- Completed the acquisition of Glentel
- Launched Suretap, an open wallet payment system basedon NFC SIM cards and backed by Bell, TELUS and Rogers andavailable to other carriers. With support for 40 payment cardsand more than 30 gift card brands, the Suretap app is availableto more than 90% of Android and BlackBerry devices sold.
2016 FOCUS
- Profitably grow our wireless postpaid subscriber base, whilemaintaining market share momentum of incumbent postpaidsubscriber activations
- Continue to increase ARPU
- Expand the number of postpaid smartphone subscribers usingour 4G LTE and LTE-A networks
- Continue to manage the financial and churn impacts fromincreased market activity arising from the significantlyincreased number of off-contract customers as a result ofthe Wireless Code, which has applied to all wireless contractssince June 3, 2015
- Offer the latest handsets and devices in a timely mannerto enable customers to benefit from ongoing technologicalimprovements by manufacturers and from faster data speedsto optimize the use of our services
- Accelerate new revenue streams by continuing to drive thecommercialization of mobile payments and IoT servicesand applications

IMPROVE CUSTOMER SERVICE
2015 PROGRESS
- Reduced customer calls to our service centres by 6 million in2015 through our continued investments in service and a focuson simplification
- Bell was the most improved wireless carrier among fullservice carriers and Virgin Mobile was #1 among nationalcarriers in customer service and wireless purchaseexperience satisfaction(1)
| (1) | J.D. Power and Associates 2015 Canadian Wireless Customer Care Study |
| 58 BCE Inc. 2015 ANNUAL REPORT |
| | 5 | BUSINESS SEGMENT ANALYSIS
BELL WIRELESS | MD&A |
- Launched a redesigned and simplified bill for residentialcustomers with an intuitive grid format, making it easier forcustomers to follow changes month over month
- Introduced personalized videos for new Bell Mobility customersthat explain what to expect on the first bill, how to check usageand update phone features, and how to manage accountsthrough MyBell.caand the MyBell mobile app
2016 FOCUS
- Continue to invest in customer service initiatives to simplifycomplexity for all customers including billing
- Reduce further the total volume of customer callsto our wireless service call centres

ACHIEVE A COMPETITIVE COST STRUCTURE
2015 PROGRESS
- Realized operating cost and capital expenditure synergies from the integration of Bell Aliant
2016 FOCUS
- Deliver cost savings from ongoing service improvements
| |
| Financial performance analysis |
2015 PERFORMANCE HIGHLIGHTS


BELL WIRELESS RESULTS
REVENUES
| 2015 | | 2014 | | $ CHANGE | | % CHANGE | |
Service | 6,246 | | 5,806 | | 440 | | 7.6 | % |
Product | 590 | | 483 | | 107 | | 22.2 | % |
Total external revenues | 6,836 | | 6,289 | | 547 | | 8.7 | % |
Inter-segment revenues | 40 | | 38 | | 2 | | 5.3 | % |
Total Bell Wireless revenues | 6,876 | | 6,327 | | 549 | | 8.7 | % |
| (1) | J.D. Power and Associates 2015 Canadian Wireless Customer Care Study |
BCE Inc. 2015 ANNUAL REPORT 59 |
5 | BUSINESS SEGMENT ANALYSIS
BELL WIRELESS | MD&A | |
Bell Wireless operating revenues increased 8.7% in 2015 compared to last year, as a result of higher service and product revenues.
- Service revenues were up 7.6% in 2015 compared to the prioryear, reflecting a greater number of postpaid subscribersin our customer base combined with blended ARPU growth.ARPU growth was driven by higher average monthly accessrates as customers continued to shift from three-year plans totwo-year plans, improved collections of termination chargesand increased data usage from greater smartphone penetrationand data usage stimulated by broader 4G LTE network coverageand greater speeds. Lower wireless voice revenues, resulting from greater adoption of unlimited nationwide talk plans and the ongoing substitution for data applications, moderated the year-over-year growth in service revenues.
- Bell Wireless data revenues in 2015 were 23.6% higher compared to 2014
- Bell Wireless voice revenues declined by 6.7% compared to last year
- Product revenues were up 22.2% compared to 2014, mainly due to increased handset pricing combined with a greater proportion of premium smartphone devices in our sales mix and a greater number of device upgrades. The increase in market activity was stimulated by the start of the double cohort at the beginning of June 2015.
OPERATING COSTS AND ADJUSTED EBITDA
| 2015 | | 2014 | | $ CHANGE | | % CHANGE | |
Operating costs | (4,048 | ) | (3,703 | ) | (345 | ) | (9.3 | %) |
Adjusted EBITDA | 2,828 | | 2,624 | | 204 | | 7.8 | % |
Total adjusted EBITDA margin | 41.1 | % | 41.5 | % | | | (0.4 | %) |
Service adjusted EBITDA margin | 45.3 | % | 45.2 | % | | | 0.1 | % |
Bell Wireless operating costs increased 9.3% in 2015 compared to last year, as a result of:
- Higher investment in customer retention that reflected a greaternumber of subsidized upgrades, due primarily to the impactof the double cohort combined with a greater proportion ofpremium smartphone upgrades
- Increased subscriber acquisition costs attributable to higherpostpaid gross activations
- Higher bad debt expense driven by increased revenues
- Higher network operating costs associated with LTE networkexpansion and increased usage
- Greater payments to other carriers due to higher datausage volumes
These factors were offset partly by lower advertising expense and lower wireless content expenses.
Bell Wireless adjusted EBITDA grew 7.8% in 2015 compared to last year, fuelled by higher operating revenues, as described above, which was moderated by greater customer retention spending and subscriber acquisition costs, higher bad debt expense, increased payments to other carriers and higher network operating costs. This resulted in relatively stable year-over-year adjusted EBITDA margin, based on service revenues, of 45.3% in 2015 compared to 45.2% achieved in 2014.
BELL WIRELESS OPERATING METRICS
| 2015 | | 2014 | | CHANGE | | % CHANGE | |
Blended ARPU ($/month) | 63.09 | | 59.92 | | 3.17 | | 5.3 | % |
Gross activations | 1,600,147 | | 1,643,451 | | (43,304 | ) | (2.6 | %) |
Postpaid | 1,338,141 | | 1,291,207 | | 46,934 | | 3.6 | % |
Prepaid | 262,006 | | 352,244 | | (90,238 | ) | (25.6 | %) |
Net activations | 127,203 | | 193,596 | | (66,393 | ) | (34.3 | %) |
Postpaid | 265,369 | | 311,954 | | (46,585 | ) | (14.9 | %) |
Prepaid | (138,166 | ) | (118,358 | ) | (19,808 | ) | (16.7 | %) |
Blended churn % (average per month) | 1.51 | % | 1.52 | % | | | 0.01 | % |
Postpaid | 1.28 | % | 1.22 | % | | | (0.06 | %) |
Prepaid | 3.32 | % | 3.44 | % | | | 0.12 | % |
Subscribers | 8,245,831 | | 8,118,628 | | 127,203 | | 1.6 | % |
Postpaid | 7,375,416 | | 7,110,047 | | 265,369 | | 3.7 | % |
Prepaid | 870,415 | | 1,008,581 | | (138,166 | ) | (13.7 | %) |
Cost of acquisition (COA) ($/subscriber) | 467 | | 441 | | (26 | ) | (5.9 | %) |
| 60 BCE Inc. 2015 ANNUAL REPORT |
| | 5 | BUSINESS SEGMENT ANALYSIS
BELL WIRELESS | MD&A |
Blended ARPU of $63.09 reflected a year-over-year increase of 5.3% in 2015 compared to last year, due to an increased mix of customers on higher-rate two year plans, disciplined pricing, greater data usage, improved collection of termination charges and a higher percentage of postpaid customers in our total subscriber base. This was partly offset by lower voice ARPU, compared to last year, as customers continue to substitute voice with data services.
- Data ARPU increased 21% in 2015 compared to 2014, driven bygreater penetration of smartphones and other data devicessuch as tablets that are driving greater data consumption frome-mail, web browsing, social networking, text messaging, mobileTV, picture and video messaging, as well as entertainmentservices such as video streaming, music downloads and gaming.The higher speeds enabled by the expansion of our 4G-LTE andLTE-A networks also contributed to the growth in data ARPU. Theimpact of a higher number of subscribers on premium rate planswith higher data usage thresholds and a greater mix of sharedplans moderated the year-over-year growth in data ARPU.
- Voice ARPU declined 8.5% in 2015 compared to last year,primarily as a result of greater adoption of all-inclusive rateplans for both local and long distance calling, competitive pricingand lower overall voice usage due to ongoing substitution ofvoice services with data services
Total gross wireless activations decreased 2.6% in 2015, compared to last year, due to lower prepaid activations. Postpaid activations were higher year over year.
- Postpaid gross activations increased 3.6% in 2015 compared to2014, driven by greater activity in the Canadian wireless marketfrom the impact of the double cohort that began in June 2015
- Prepaid gross activations decreased 25.6% in 2015 comparedto last year, due to our continued focus on postpaidcustomer acquisitions
Smartphone users as a percentage of postpaid subscribers increased to 78% at December 31, 2015 compared to 76% at the end of 2014.
Blended wireless churn of 1.51% in 2015 remained relatively stable compared to 1.52% in 2014, despite higher deactivations due to a greater number of total subscribers compared to last year.
- Postpaid churn increased 0.06% in 2015, compared to 2014, to1.28%, due to greater market activity and a larger number ofoff-contract customers driven by the double cohort
- Prepaid churn improved 0.12% in 2015, compared to last year,to 3.32%, as a result of fewer customer deactivations comparedto last year
Postpaid net activations decreased 14.9% in 2015, compared to the prior year, due to higher customer deactivations.
Prepaid net customer losses increased 16.7% in 2015, compared to last year, as a result of lower gross activations.
Wireless subscribers at December 31, 2015 totalled 8,245,831 representing an increase of 1.6% since the end of 2014. The proportion of Bell Wireless customers subscribing to postpaid service increased to 89% in 2015 from 88% last year.
COA per gross activation in 2015 increased $26 over last year to $467, due to a higher proportion of postpaid smartphone customers in our activation mix combined with greater promotional pricing.
Retention costs as a percentage of service revenue increased to 12.6% in 2015 compared to 11.0% in 2014, as a result of more subsidized customer upgrades reflecting increased market activity as a result of the double cohort, the ongoing shift to more expensive smartphone models in our upgrade mix and greater promotional pricing.
| |
| Competitive landscape and industry trends |
COMPETITIVE LANDSCAPE
The wireless market is the largest sector of the Canadian telecommunications industry, representing 48% of total revenues, and is currently growing at a mid-single digit rate annually.
There are over 29 million wireless subscribers in Canada. The three large national incumbents, Bell, TELUS and Rogers, account for over 90% of industry subscribers and revenues. Rogers holds the largest share by virtue of its legacy global system for mobile (GSM) network. However, Bell has recaptured significant subscriber market share, as well as the largest proportion of industry revenue and adjusted EBITDA growth since 2009, helped by the launch of our HSPA+ and 4G LTE networks, expanded retail distribution, the purchase of Virgin Mobile, a refreshed brand and improved customer service.
Canada’s wireless penetration was approximately 82% at the end of 2015, compared to 110% for the U.S. and as high as 180% in certain countries in Europe. Canada’s wireless sector is expected to continue growing at a steady pace for the foreseeable future, driven by the increasing usage of data services, the further expansion of 4G LTE service in the more rural and remote regions of Canada and the deployment of LTE-A network service enabled by the aggregation of multiple channels of wireless spectrum.
BCE Inc. 2015 ANNUAL REPORT 61 |
5 | BUSINESS SEGMENT ANALYSIS
BELL WIRELESS | MD&A | |
Competitors
Large facilities-based national wireless service providers Rogers and TELUS.
Smaller facilities-based wireless service provider WIND Mobile(1), which provides service in Toronto, Calgary, Vancouver, Edmonton, Ottawa, as well as in several communities in southwestern Ontario.
Regional facilities-based wireless service providers Vidéotron Ltée (Vidéotron), which provides service in Montréal and other parts of Québec; Saskatchewan Telecommunications Holding Corporation (SaskTel), which provides service in Saskatchewan; Manitoba Telecom Services Inc. (MTS Mobility), which provides service in Manitoba; and EastLink, which launched service in Nova Scotia and Prince Edward Island in February 2013.
Mobile virtual network operators (MVNOs), who resell competitors’ wireless networks such as PC Mobile.
Canadian wireless market share
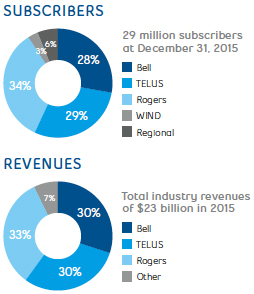
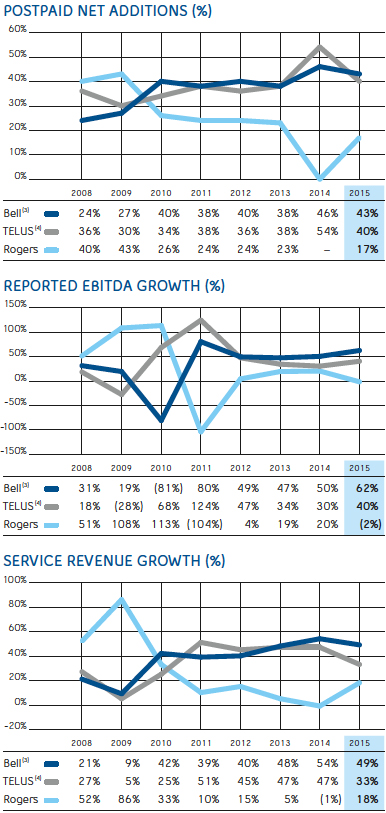
| (1) | Shaw Communications Inc. (Shaw) completed its acquisition of WIND Mobile on March 1, 2016. |
| (2) | Percentages may not add to 100 due to rounding. |
| (3) | Bell metrics shown include Bell Aliant as of 2015. |
| (4) | TELUS metrics shown include Public Mobile Inc. as of 2015. |
| 62 BCE Inc. 2015 ANNUAL REPORT |
| | 5 | BUSINESS SEGMENT ANALYSIS
BELL WIRELESS | MD&A |
INDUSTRY TRENDS
ACCELERATING DATA CONSUMPTION
Wireless data growth continues to be driven by the ongoing adoption of smartphones and tablets, and associated data plans. The demand for wireless data services is expected to continue to grow, due to ongoing investment in faster network technologies, such as 4G LTE and LTE-A that provide a richer user experience, a larger appetite for mobile connectivity and social networking, greater selection of smartphones and tablets, as well as increasing adoption of shared plans with multiple devices by families. Greater customer adoption of data services, including mobile TV, data roaming for travel, mobile commerce, mobile banking, and other IoT applications in the areas of retail and transportation (connected car, asset tracking, remote monitoring) should also contribute to the growth. In the consumer market, IoT is projected to be a future growth area for the industry as wireless connectivity on everyday devices, from home automation to cameras, becomes ubiquitous.
NEED FOR MORE WIRELESS SPECTRUM AND CARRIER AGGREGATION
Fast growth in mobile data traffic is increasingly putting a strain on wireless carriers’ networks and their ability to manage and service this traffic. Industry Canada’s 700 MHz, AWS-3, and 2500 MHz spectrum auctions that concluded in 2014 and 2015 provided wireless carriers with prime spectrum to roll out faster next-generation wireless networks and build greater capacity. Furthermore, carrier aggregation (CA) is a technology currently being employed by Canadian wireless carriers (and which is expected to be used more extensively in the future) that allows for multiple spectrum channels to be used together, thereby significantly increasing capacity and data transfer rates.
GREATER SPENDING ON CUSTOMER RETENTION
As wireless penetration in Canada increases further, together with a growing number of off-contract subscribers and a continued high level of competitive intensity, even greater focus will be required to improve customer service, enhance existing service offerings and spend on upgrading more customers to new devices. In particular, as a result of the Wireless Code, which has limited wireless contract terms to two years from three years previously, a higher level of transactional market activity is expected as a result of a growing number of customers who will be eligible to renew their plans or change carriers. However, as the number of customer contract migrations from three-year to two-year contracts slows down, ARPU growth is expected to moderate.
| |
| Business outlook and assumptions |
2016 OUTLOOK
We expect continued revenue growth driven by a greater number of postpaid subscribers, accelerating data usage from smartphone customers and higher rate plan pricing for both two-year contracts and bring-your-own-device (BYOD) plans. We will seek to achieve higher revenues from data growth, delivered through our HSPA+, 4G LTE and LTE-A networks, higher demand for services such as web browsing, music and video streaming and community portals such as Facebook and YouTube, as well as nascent services including mobile commerce and other IoT applications. Our intention is to introduce these new products and services to the market in a way that balances innovation with profitability.
Three-year contracts established before the Wireless Code came into effect and, a new wave of two-year contracts, expired in 2015, leading to a higher level of transactional market activity across the Canadian wireless industry. This higher level of activity is expected to continue into 2016 and highlights the critical importance of our ongoing focus on improving customer satisfaction and maintaining discipline in subscriber acquisition and retention spending to acquire and retain high-quality postpaid subscribers. We plan to deliver adjusted EBITDA growth in 2016 from continued solid revenue growth, which should be partly offset by higher acquisition and retention investment consistent with the expected increase in market activity.
ASSUMPTIONS
- Maintain our market share momentum of incumbent wirelesspostpaid subscriber activations
- Continued adoption of smartphone devices, tablets and dataapplications, as well as the introduction of more 4G LTE devicesand new data services
- Earlier expiries under two-year contracts compared tothree-year contracts, leading to an increase in the numberof subscribers who are eligible for upgrades
- Higher subscriber acquisition and retention spending, drivenby higher handset costs and more customer device upgrades,reflecting a higher number of off-contract subscribers due toearlier expiries under two-year contracts
- Higher blended ARPU, driven by a higher postpaid smartphonemix, increased data consumption on 4G LTE and LTE-A networks,and higher access rates from price increases
- Completion of the LTE network buildout to 98% of the Canadianpopulation and expansion of the LTE-A network coverage toapproximately 75% of the Canadian population
- Ability to monetize increasing data usage and customersubscriptions to new data services
- Ongoing technological improvements by handset manufacturersand from faster data network speeds that allow customers tooptimize the use of our services
- No material financial, operational or competitive consequencesof changes in regulations affecting our wireless business
BCE Inc. 2015 ANNUAL REPORT 63 |
5 | BUSINESS SEGMENT ANALYSIS
BELL WIRELESS | MD&A | |
- Increasing Canadian wireless industry penetration
- Continued customer adoption of two-year rate plans
- Increasing customer adoption of smartphones, tablets and other4G LTE devices to increase mobile data usage
- Greater number of postpaid customers on our 4G LTEand LTE-A networks
- Customer usage of new data applications and services suchas M-commerce and M-banking
This section discusses certain principal business risks specifically related to the Bell Wireless segment. For a detailed description of the principal risks that could have a material adverse effect on our business, refer to section 9,Business risks.
| AGGRESSIVE COMPETITION RISK - The intensity of competitive activity from incumbent wireless operators, newer wireless entrants, non-traditional players and resellers
POTENTIAL IMPACT - Pressure on our adjusted EBITDA, ARPU and cost of acquisition and retention, as well as increased churn, would likely result if competitors aggressively increase discounts for handsets and price plans or offer other incentives, such as new data plans or multi-product bundles, to attract new customers
| | REGULATORY ENVIRONMENT RISK - Greater regulation of wholesale mobile wireless services (e.g. more stringent regulation of wholesale roaming rates), additional mandated access to wireless networks and limitations placed on future spectrum bidding
POTENTIAL IMPACT - Such greater regulation could limit our flexibility, influence the market structure, improve the business positions of our competitors and negatively impact the financial performance of our mobile wireless business
| | CONTINUING IMPACT OF THE WIRELESS CODE RISK - A large number of subscribers who, as a result of the adoption of the Wireless Code, are off-contract could switch to other carriers due, in particular, to aggressive market pricing
POTENTIAL IMPACT - Potentially elevated churn, relative to our historical churn rates, could result in subscriber losses as well as higher costs
|
| 64 BCE Inc. 2015 ANNUAL REPORT |
| | 5 | BUSINESS SEGMENT ANALYSIS
BELL WIRELINE | MD&A |
| Our Bell Wireline segment achieved positive adjusted EBITDA and cash flow growth in 2015 driven by growing TV and Internet scale as well as lower operating costs, which contributed to maintaining an industry-best adjusted EBITDA margin. |
Key elements of relevant strategic imperatives

INVEST IN BROADBAND NETWORKS AND SERVICES
2015 PROGRESS
- Began the buildout of broadband fibre directly to 1.1 millionhomes and businesses across the City of Toronto as part of Bell’ssingle largest infrastructure expansion project, with a plannedcapital investment of approximately $1.14 billion. The majority ofthe build-out is expected to be completed by the end of 2017.
- Launched Gigabit Fibe and Gigabit FibreOP Internet service tomore than 2.2 million homes across Québec, Ontario and theAtlantic provinces, offering speeds of up to 940 Mbps at launchand rising to a full 1 Gbps or faster in 2016 as equipment evolvesto support these speeds. Gigabit Fibe and Gigabit FibreOPare enabled by the ongoing deployment of our FTTP network,bringing high-speed fibre technology directly into homesand businesses.
- Extended our residential IPTV service coverage to reach6.2 million households across Ontario, Québec and the Atlanticprovinces, up from approximately 5.9 million at the end of 2014
2016 FOCUS
- Expand our FTTP footprint to 8.2 million locations passed
- Accelerate FTTP deployment in Toronto and other major citiesand expand availability of Gigabit Fibe and Gigabit FibreOP
Internet service

LEVERAGE WIRELINE MOMENTUM
2015 PROGRESS
- Became Canada’s largest TV provider with 2,738,496 subscribers,up 3.6% over 2014, and increased our total number of IPTVsubscribers by 26.7% to 1,182,791
- Built on our position as the leading Internet service provider inCanada with a high-speed Internet subscriber base of 3,413,147,up 3.5% over 2014
- Increased the number of multi-product households – those thatbuy TV, Internet and Home Phone – by 11% over 2014, fuelled byour IPTV service, which drove higher pull-through attach ratesfor Home Phone and Internet services, with 64% of all new IPTVcustomers taking three products
- Continued to lead IPTV innovation in Canada by making severalenhancements to our Fibe TV and FibreOP TV services withexclusive features like Restart, Look Back, Trending, availableon Fibe TV, Resume and the Fibe TV app
- Bell Fibe TV and Bell Aliant FibreOP TV were the top twoTV services most recommended by customers in Canada(1)
2016 FOCUS
- Continue to enhance our IPTV service
- In January 2016, we launched the Fibe TV 4K Whole Home PVR for customers in Toronto, Montréal, Ottawa and Québec City. Bell’s 4K Whole Home PVR is the smallest available on the market and has the largest recording capacity. In February 2016, the availability of the 4K Whole Home PVR for purchase was expanded to all Bell Fibe TV customers and to Bell Aliant FibreOP TV customers in Atlantic Canada. The rental program as well as HDR ready capabilities will be available early in the second quarter of 2016.
- Expand our total base and market share of TV and Internet subscribers profitably
- Continue to reduce total wireline residential net losses
- Increase residential household ARPU through greater multi-product household penetration
- Increase share of wallet of large enterprise customers through greater focus on business service solutions and connectivity growth
- In February 2016, we announced a new partnership with IBM to expand the cloud computing services available through our Bell Business Cloud service, giving businesses across Canada access to the IBM Cloud service via a secure, high-speed connection from Bell, simplifying the way customers adopt and build out their hybrid clouds
- Increase the number of net new customer relationships in both large and mid-sized business and reduce small business customer losses
| (1) | Nielsen Consumer Insights findings published in Customer Interaction Metric study (October 2015) |
BCE Inc. 2015 ANNUAL REPORT 65 |
5 | BUSINESS SEGMENT ANALYSIS
BELL WIRELINE | MD&A | |

IMPROVE CUSTOMER SERVICE
2015 PROGRESS
- Reduced customer calls to our service centres by 6 million in2015 through our continued investments in service and a focuson simplification
- Reduced Fibe TV installation time for FTTP customers by10% in 2015 and 30% since the beginning of 2012
- Increased availability of two-hour appointment windows for FibeTV installations by seven times over 2014 and extended two-hourwindow availability to Internet and Home Phone repairs
- Achieved Same Day Next Day service completion rates of92% for repairing service issues with Home Phone, TV and Internetand increased Same Day completion for both residential andbusiness customers by 24% over 2014
- Improved customer satisfaction with technicians to 92% forinstallations and repairs
- Launched a redesigned and simplified bill for residentialcustomers with an intuitive grid format, making it easier forcustomers to follow changes month over month
2016 FOCUS
- Continue to invest in customer service initiatives to simplifycomplexity for all customers including billing
- Reduce further the total volume of wireline customer callsto our residential service call centres
- Further improve customer satisfaction scores
- Achieve better consistency in customer experience
- Improve customer personalization

ACHIEVE A COMPETITIVE COST STRUCTURE
2015 PROGRESS
- Reduced wireline operating costs by 1.6%, contributingto Bell Wireline adjusted EBITDA margin improvementof 0.7% over 2014
- Realized operating cost and capital expenditure synergies fromthe integration of Bell Aliant
- Restructured our Business Markets unit to maximize service andsupport for our mid-sized and enterprise business customersand enhance Bell’s leadership in these markets
2016 FOCUS
- Realize additional operating cost and capital expendituresynergies from the integration of Bell Aliant
- Execute on labour savings from workforce reductionsat Bell Wireline
- Deliver cost savings from ongoing service improvements andsavings related to the deployment of FTTP to support a stableconsolidated adjusted EBITDA margin
| |
| Financial performance analysis |
2015 PERFORMANCE HIGHLIGHTS
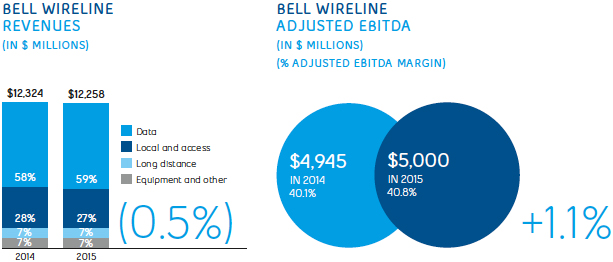

| 66 BCE Inc. 2015 ANNUAL REPORT |
| | 5 | BUSINESS SEGMENT ANALYSIS
BELL WIRELINE | MD&A |

BELL WIRELINE RESULTS
REVENUES
| 2015 | | 2014 | | $ CHANGE | | % CHANGE | |
Data | 7,163 | | 6,978 | | 185 | | 2.7 | % |
Local and access | 3,271 | | 3,420 | | (149 | ) | (4.4 | %) |
Long distance | 831 | | 922 | | (91 | ) | (9.9 | %) |
Equipment and other | 778 | | 791 | | (13 | ) | (1.6 | %) |
Total external revenues | 12,043 | | 12,111 | | (68 | ) | (0.6 | %) |
Inter-segment revenues | 215 | | 213 | | 2 | | 0.9 | % |
Total Bell Wireline revenues | 12,258 | | 12,324 | | (66 | ) | (0.5 | %) |
Bell Wireline operating revenues decreased by 0.5% in 2015 compared to last year, as a result of lower local and access, long distance and equipment and other revenues, as well as the negative impact of legislation enacted in December 2014 which eliminated charges for paper bills. This decline was moderated by the growth in data revenues.
Bell Wireline service revenues have remained essentially stable, year over year, due to growth at our Bell Residential Services unit driven by the continued expansion of our IPTV and Internet subscriber bases, higher household ARPU and stable voice revenue erosion. This was largely offset by the year-over-year decline at Bell Business Markets reflecting market softness and competitive pricing.
- Data revenue growth of 2.7% in 2015, compared to 2014,was led by our Bell Residential Services unit and attributableto increased Internet and TV services revenues from ahigher number of IPTV subscribers, price increases and greaterdemand for higher bandwidth Internet service. Higher wholesaleInternet revenues also contributed to the overall growth in datarevenues. This was partly offset by a decline in our Bell BusinessMarkets unit, due to slow economic growth that resulted ina lower volume of product sales, and repricing pressures. The continued erosion in our traditional legacy data services inboth our business and wholesale markets also moderated datarevenue growth.
- Local and access revenues declined by 4.4% in 2015,compared to last year, representing an improvement overthe 5.2% year-over-year decline in 2014. The decrease in 2015was driven by the ongoing loss of NAS lines due to technologicalsubstitution to wireless and Internet-based services, largebusiness customer conversions to IP-based data services, as wellas pricing pressures in our business market. This was moderatedby rate increases on our residential services combined withfewer residential NAS line losses compared to 2014.
- Long distance revenues decreased by 9.9% in 2015 compared to2014, reflecting fewer minutes of use by residential and businesscustomers as a result of NAS line losses, technology substitutionto wireless and OTT Internet-based services, as well as ongoingrate pressures in our residential market attributable to customeradoption of premium rate plans
- Equipment and other revenues decreased by 1.6% in 2015compared to 2014, driven by reduced business equipment sales,partly offset by increased consumer electronic equipmentsales at The Source
OPERATING COSTS AND ADJUSTED EBITDA
| 2015 | | 2014 | | $ CHANGE | | % CHANGE | |
Operating costs | (7,258 | ) | (7,379 | ) | 121 | | 1.6 | % |
Adjusted EBITDA | 5,000 | | 4,945 | | 55 | | 1.1 | % |
Adjusted EBITDA margin | 40.8 | % | 40.1 | % | | | 0.7 | % |
Bell Wireline operating costs were $121 million, or 1.6%, lower in 2015 compared to last year, driven by:
- Operational cost savings generated by synergies from theprivatization of Bell Aliant
- Lower labour costs attributable to headcount reductions, vendorcontract savings and reduced call volumes
- Reduced general and administration costs driven by lower baddebt expense, fleet costs, operating taxes and professional fees
- Lower cost of goods sold consistent with reduced businessequipment sales
- Decreased marketing and sales expense, due to loweradvertising spend and higher advertising costs incurred in thefirst quarter of 2014 for the Sochi 2014 Winter Olympic Games
- Lower payments to other carriers driven by reduced volumes
BCE Inc. 2015 ANNUAL REPORT 67 |
5 | BUSINESS SEGMENT ANALYSIS
BELL WIRELINE | MD&A | |
These factors were partly offset by:
- Escalating programming costs related to our IPTV services driven by a higher number of subscribers, programming rate increases and the launch of CraveTV in December 2014
Bell Wireline adjusted EBITDA grew by 1.1% in 2015 with a corresponding increase in adjusted EBITDA margin to 40.8% from 40.1% in 2014. This was attributable to:
- Continued Internet and IPTV growth
- Synergies achieved from the privatization of Bell Aliant•Effective cost containment
This was partly offset by:
- The ongoing, but moderating, loss of higher-margin legacy voice and data service revenues
- The impact of market softness resulting in reduced customer spending and competitive pricing pressures in our Bell Business Markets unit
BELL WIRELINE OPERATING METRICS
Data
High-speed Internet
| 2015 | | 2014 | | CHANGE | | % CHANGE | |
High-speed Internet net activations | 155,052 | | 160,390 | | (5,338 | ) | (3.3 | %) |
High-speed Internet subscribers(1)(2) | 3,413,147 | | 3,297,026 | | 116,121 | | 3.5 | % |
| (1) | Our Q1 2015 subscriber base included a beginning of period adjustment to reduce the number of subscribers by 7,505 for deactivations as a result of the CRTC’s decision to eliminate the 30-day notice period required to cancel services. |
| (2) | Subsequent to a review of our subscriber metrics, our Q1 2015 beginning of period subscriber base was reduced by 31,426 subscribers. This adjustment primarily consisted of older balances. |
High-speed Internet subscriber net activations in 2015 declined 3.3%, or 5,338, to 155,052 compared to 2014, due to lower net activations in our small and large business markets. Residential net activations remained relatively stable, year over year, despite more aggressive bundle offers from cable competitors as we continued to benefit from the favourable pull-through impact of IPTV subscriber activations.
High-speed Internet subscribers at December 31, 2015 totalled 3,413,147, up 3.5% from the end of 2014.
TV
| 2015 | | 2014 | | CHANGE | | % CHANGE | |
Net subscriber activations | 107,380 | | 153,360 | | (45,980 | ) | (30.0 | %) |
IPTV | 253,329 | | 276,034 | | (22,705 | ) | (8.2 | %) |
Total subscribers(1)(2) | 2,738,496 | | 2,642,608 | | 95,888 | | 3.6 | % |
IPTV(1)(2) | 1,182,791 | | 933,547 | | 249,244 | | 26.7 | % |
| (1) | Our Q1 2015 IPTV and total TV subscriber base included a beginning of period adjustment to reduce the number of subscribers by 2,236 and 7,702, respectively, for deactivations as a result of the CRTC’s decision to eliminate the 30-day notice period required to cancel services. |
| (2) | Subsequent to a review of our subscriber metrics, our Q1 2015 beginning of period IPTV and total TV subscriber base was reduced by 1,849 and 3,790 subscribers, respectively. These adjustments primarily consisted of older balances. |
IPTV subscriber net activations decreased by 8.2%, or 22,705 to 253,329 compared to 2014, reflecting aggressive offers for service bundles from cable competitors and a slowdown in the pace of our IPTV footprint expansion. This was partly offset by lower residential customer churn attributable to a more mature subscriber base.
Satellite TV net customer losses of 145,949 were 19.0% higher in 2015, compared to 2014, mainly as a result of a reduced number of retail activations driven by aggressive offers from cable TV competitors, particularly in our service areas where our IPTV services are not available, combined with lower wholesale net activations driven by the roll-out of IPTV services by other competing providers in Western Canada. This was moderated by lower residential customer churn resulting from a more mature subscriber base.
Total TV net subscriber activations (IPTV and Satellite TV combined) decreased 30.0%, or 45,980, to 107,380 compared to 2014, due to lower IPTV and Satellite TV net activations compared to 2014.
IPTV subscribers at December 31, 2015 totalled 1,182,791, up 26.7% from 933,547 at the end of 2014.
Satellite TV subscribers at December 31, 2015 totalled 1,555,705, down 9.0% from 1,709,061 at the end of 2014.
Total TV subscribers (IPTV and Satellite TV combined) at December 31, 2015 totalled 2,738,496, representing a 3.6% increase since the end of 2014.
| 68 BCE Inc. 2015 ANNUAL REPORT |
| | 5 | BUSINESS SEGMENT ANALYSIS
BELL WIRELINE | MD&A |
Local and access
| 2015 | | 2014 | | CHANGE | | % CHANGE | |
NAS LINES | | | | | | | | |
Residential(1)(2) | 3,533,732 | | 3,815,608 | | (281,876 | ) | (7.4 | %) |
Business | 3,154,934 | | 3,315,244 | | (160,310 | ) | (4.8 | %) |
Total | 6,688,666 | | 7,130,852 | | (442,186 | ) | (6.2 | %) |
NAS NET LOSSES | | | | | | | | |
Residential | (278,124 | ) | (305,729 | ) | 27,605 | | 9.0 | % |
Business | (160,310 | ) | (158,988 | ) | (1,322 | ) | (0.8 | %) |
Total | (438,434 | ) | (464,717 | ) | 26,283 | | 5.7 | % |
| (1) | Our Q1 2015 subscriber base included a beginning of period adjustment to reduce the number of subscribers by 4,409 for deactivations as a result of the CRTC’s decision to eliminate the 30-day notice period required to cancel services. |
| (2) | Subsequent to a review of our subscriber metrics, our Q1 2015 beginning of period subscriber base was increased by 657 subscribers. This adjustment primarily consisted of older balances. |
NAS net losses improved 5.7%, or by 26,283 lines, in 2015 compared to 2014, reflecting fewer residential NAS losses, offset in part by higher business access line losses.
Residential NAS net losses were 9.0%, or 27,605 lines, fewer in 2015 than in 2014. The year-over-year improvement reflected the favourable pull-through impact of IPTV activations and greater NAS customer retention through the acquisition of a greater number of multi-product households. The reduction in residential NAS net losses was partly offset by more aggressive promotions and service bundle discounts offered by the cable TV operators, as well as from ongoing wireless and Internet-based technology substitution for local services.
Business NAS net losses increased 0.8%, or by 1,322 lines, in 2015 compared to 2014, as a result of higher large business market and wholesale customer deactivations and the ongoing conversion of voice lines to wireless and IP-based services. Additionally, the relatively low level of new business formation and employment growth in the economy has resulted in continued soft demand for new access line installations. This was moderated by reduced customer losses in our small and mid-business markets.
The annualized rate of NAS erosion in our customer base was essentially stable in 2015 at 6.2%, compared to rate of decline of 6.1% in 2014. At December 31, 2015, we had 6,688,666 NAS lines, compared to 7,130,852 at the end of 2014.
| |
| Competitive landscape and industry trends |
COMPETITIVE LANDSCAPE
The financial performance of the overall Canadian wireline telecommunications market in recent years has been impacted by continued declines in legacy voice service revenues resulting from technological substitution to wireless and OTT services, as well as by ongoing conversion to IP-based data services and networks by large business customers. Aggressive competition from cable companies also continues to erode traditional telephone providers’ market share of residential local telephony. Canada’s four largest cable companies had over 4.1 million telephony subscribers at the end of 2015, representing a national residential market share of 44%, unchanged from 2014.
Competition for residential local and long distance services comes primarily from substitution to wireless services, including our own Bell Mobility and Virgin Mobile offerings. Approximately 29% of households in Ontario and Québec are estimated to be wireless only.
In 2015, cable companies continued to increase the speeds of their Internet offerings while promoting aggressive customer acquisition offers. At the end of the year, the four largest cable companies had 6.3 million Internet subscribers, representing 55% of the total Internet market based on publicly reported data, while incumbent local exchange carriers (ILECs) held the remaining 45% or 5.2 million subscribers. Although the residential Internet market is maturing, with approximately 87% penetration across Canada, subscriber growth is expected to continue over the next several years.
ILECs offering IPTV service grew their subscriber bases by 17% in 2015 to 2.3 million customers, driven by expanded network coverage, enhanced service offerings, and marketing and promotions focused on IPTV. This growth came at the expense of Canada’s four largest cable companies, which saw their collective TV market share in 2015 decline two percentage points to 57%.
BCE Inc. 2015 ANNUAL REPORT 69 |
5 | BUSINESS SEGMENT ANALYSIS
BELL WIRELINE | MD&A | |
Competitors
- Cable TV providers offering cable TV, Internet and cable telephony services, including:
- ILECs TELUS and MTS provide local, long distance and IPTV services in various regions.
- TELUS and Allstream provide wholesale products and services across Canada.
- Various others (such as TekSavvy Solutions, Distributel, VMedia, and Vonage Canada (a division of Vonage Holdings Corp.) (Vonage)) offer resale or VoIP-based local, long distance and Internet services.
- OTT voice and video services such as Skype, Netflix and Shomi.
- Digital media streaming devices such as Apple TV, Roku and Google Chromecast.
- Business voice and data services:
- Other Canadian ILECs and cable TV operators
Substitution to wireless services, including those offered by Bell.Business service solutions:- Systems integrators such as CGI Group Inc., EDS (a division of HP Enterprise Services) and IBM
- Outsourcers and professional service firms
Wholesale competitors include cable operators, domestic CLECs, U.S. or other international carriers for certain services, and electrical utility-based telecommunications providers.

INDUSTRY TRENDS
INVESTMENT IN BROADBAND FIBRE DEPLOYMENT
The Canadian ILECs have made substantial investments in deploying broadband fibre within their territories. These investments have enabled the delivery of IPTV and high-speed Internet service in order to better compete with cable TV offerings in urban areas. IPTV is considered a superior video product to traditional cable TV, given innovative features such as a next-generation user interface, wireless receivers, Restart, which enables customers to rewind and watch TV shows already in progress from the beginning, and Trending (available on Fibe TV), which highlights in real time the five most-watched shows in the country and lets you switch to watch them live or Restart from the beginning. FTTN enables speeds of up to 25 Mbps, which can be doubled to 50 Mbps with pair bonding, while FTTP delivers broadband speeds of up to 940 Mbps (higher than any other technology), and is expected to rise to a full 1 Gbps or faster in 2016 as equipment evolves to support these speeds. Going forward, ILECs are expected to maintain high levels of capital spending, primarily for the ongoing expansion of their broadband fibre networks, with an increasing emphasis on upgrading current FTTN networks to FTTP. Fibre architecture has significant structural and operating cost advantages over cable, enabling the ILECs, such as Bell, to achieve significantly higher speeds more quickly.
ALTERNATIVE TV AND OTT SERVICES
The growing popularity of watching TV anywhere is expected to continue as customers adopt services that enable them to view content on multiple screens, including computers, smartphones and tablets, as well as on their TVs. OTT content providers are competing for share of viewership. To date, these OTT services have largely complemented existing TV services. However, to mitigate the threat of video substitution, TV and Internet service providers have launched customer-authenticated on-demand streaming services that provide programming content over mobile and Wi-Fi networks to smartphones, tablets and computers. Additionally, sports and live event programming are important differentiators for traditional TV providers as they face increasing competition from OTT content providers. As OTT offers become more compelling and consumers demand greater flexibility in choosing the content most relevant to them, the disconnection of and reduction in spending for traditional TV continues to rise. While this trend is increasing, it is anticipated that growth in Internet subscriptions and Internet-only households, as well as the introduction of direct-to-consumer on-demand streaming services by the incumbent wireline telecom and cable companies, will help to offset the decline in TV as OTT video increases the value of broadband Internet.
UNBUNDLING OF TV SERVICES
As a result of new TV “pick and pay” rules to be implemented in 2016, TV distributors’ revenues are expected to come under pressure as households reduce their TV spending by choosing to subscribe to fewer TV channels and/or smaller TV packages, particularly as the number and breadth of OTT services that substitute for traditional linear TV programming grows. Similarly, lower revenue growth is expected for the TV broadcasting industry as a result of TV channel unbundling, due to lower anticipated channel penetration as well as the loss of ratings and advertising dollars from fewer channels.
WIRELESS SUBSTITUTION
Wireless substitution is the most significant driver of residential NAS losses and voice revenue declines for telecommunication companies. Wireless-only households were estimated to represent approximately 29% of households in Ontario and Québec at the end of 2015, compared to approximately 25% at the end of 2014. To mitigate the impact of wireless substitution, wireline service providers have
| 70 BCE Inc. 2015 ANNUAL REPORT |
| | 5 | BUSINESS SEGMENT ANALYSIS
BELL WIRELINE | MD&A |
been packaging voice services with Internet and TV and offering discounted triple-play bundles. Wireless substitution is expected to continue to steadily increase in 2016.
ADOPTION OF IP-BASED SERVICES
The convergence of IT and telecommunications, facilitated by the ubiquity of IP, continues to shape competitive investments for business customers. Telecommunications companies are providing professional and managed services, as well as other IT services and support, while IT service providers are bundling network connectivity with their
software as service offerings. In addition, manufacturers continue to bring all-IP and converged (IP plus legacy) equipment to market, enabling ongoing migration to IP-based solutions. The development of IP-based platforms, which provide combined IP voice, data and video solutions, creates potential cost efficiencies that compensate, in part, for reduced margins resulting from the continuing shift from legacy to IP-based services. The evolution of IT has created significant opportunities for our Business Markets unit, such as cloud services and data hosting, that can have a greater business impact than traditional telecommunications services.
| |
| Business outlook and assumptions |
2016 OUTLOOK
We expect positive full-year adjusted EBITDA growth for our Bell Wireline segment in 2016. This is predicated on delivering positive residential net activations, as we leverage our IPTV footprint to drive greater multi-product household penetration, higher broadband and TV market share, as well as fewer residential NAS customer losses attributable to targeted retention and service bundle offers as well as a continued high pull-through rate from IPTV services.
TV subscriber growth is expected to be driven by continued strong customer adoption of IPTV as we increase penetration of existing IPTV-enabled neighbourhoods, further extend our IPTV broadband fibre footprint, and drive ongoing innovation in IPTV services. We also intend to seek greater penetration within the multiple-dwelling units (MDU) market, capitalize on our extensive retail distribution network, and leverage our market leadership position in HD and 4K programming and on-demand streaming services to drive incremental subscriber growth and higher revenue per household.
Internet subscriber acquisition is expected to improve in 2016 through increased FTTP coverage as we leverage the speed and reliability of our broadband Internet network to drive greater IPTV expansion and Internet attach rates. This is expected to have an associated positive impact on ARPU growth and customer churn.
Residential wireline revenues in 2016 are also anticipated to benefit from price increases, which followed similar pricing actions by our cable competitors, a higher penetration of multi-product households, and the positive impact of product enhancements to our IPTV service. Additionally, in late 2015, the sales and marketing functions for small business services were transferred from our Business Markets unit to our Residential Services group. Given the many similarities in product and service offerings for small business and residential customers, this organizational restructuring enables us to better leverage our residential wireline scale in sales and marketing, pricing and product development.
In our Bell Business Markets unit, the ongoing economy-related and competitive market challenges, together with continued customer migration to IP-based systems, will likely continue to negatively impact overall business markets results in 2016. We intend on seeking to minimize the overall revenue decline from legacy services by leveraging our market position to develop unique services and value enhancements. We intend to use marketing initiatives to slow NAS erosion, while investing in new solutions in key portfolios such as Internet and private networks, data centre and cloud services, unified communications, and security services. We will continue to deliver network-centric managed and professional services solutions to large business and public sector clients that increase the value of connectivity services. We expect to experience continued competitive intensity in our mid-sized business segment as cable operators and other telecom competitors continue to intensify their focus on the business segment. We also intend to introduce service offerings that help drive innovative solutions and value for our mid-sized customers by leveraging Bell’s network assets, broadband fibre expansion and service capabilities to expand our relationships with them. We will maintain a focus on overall profitability by seeking to increase revenue per customer and customer retention, as well as through improving our processes to achieve further operating efficiencies and productivity gains.
Operating cost reduction will continue to be a key focus for our Bell Wireline segment, helping to offset costs related to growth in IPTV subscribers, Internet subscribers, IP broadband services and hosted IP voice subscribers, the ongoing erosion of high-margin wireline voice revenues and other legacy revenues, as well as competitive repricing pressures in our business and wholesale markets. This, combined with further service-level improvements and operating synergies from the integration of Bell Aliant, is expected to support our objective of maintaining our consolidated adjusted EBITDA margin stable year over year.
We also aim to continue investing significantly in broadband infrastructure and fibre expansion and upgrades to support our IPTV and residential Internet services, as well as new business solutions in key portfolios such as Internet and private networks, data centre and cloud services, unified communications and security services. We intend to pursue pricing methods that will assist us in covering the capital costs of upgrading our networks, providing new services and expanding capacity to meet growing data consumption.
ASSUMPTIONS
- Positive full-year adjusted EBITDA growth
- Positive full-year residential net customer additions withinour wireline footprint, driven by continued IPTV growth andan expanded FTTP network that support the pull-through offibre-based Internet service and residential NAS, resulting inhigher penetration of multi-product households
- Increasing wireless and Internet-based technological substitution
- Residential services household ARPU growth from increasedpenetration of multi-product households, promotion expiries andprice increases
BCE Inc. 2015 ANNUAL REPORT 71 |
5 | BUSINESS SEGMENT ANALYSIS
BELL WIRELINE | MD&A | |
- Aggressive residential service bundle offers from cable TVcompetitors in our local wireline areas
- Continued large business customer migration toIP-based systems
- Ongoing competitive repricing pressures in our business andwholesale markets
- Continued competitive intensity in our small and mid-sizedbusiness units as cable operators and other telecom competitorscontinue to intensify their focus on business customers
- Growing consumption of OTT TV services and on-demandstreaming video, projected growth in TV Everywhere services,as well as the proliferation of devices, such as tablets, thatconsume vast quantities of bandwidth, will require considerableongoing capital investment
- Limited downsizing of current TV packages by customersas a result of the implementation of TV unbundling
- Realization of cost savings related to management workforceattrition and retirements, lower contracted rates from oursuppliers and reduction of traffic that is not on our network
- No material financial, operational or competitive consequencesof changes in regulations affecting our wireline business
- Increasing IPTV penetration of households
- Higher market share of industry TV and Internet subscribers
- Greater penetration of multi-product households
- Increased business customer spending on connectivity servicesand managed and professional services solutions, as well asgreater new business formation as the economy strengthensand employment rates improve
- Expansion of our business customer relationships to drive higherrevenue per customer
- Ongoing service innovation and product value enhancements
- Improved customer retention
This section discusses certain principal business risks specifically related to the Bell Wireline segment. For a detailed description of the principal risks that could have a material adverse effect on our business, refer to section 9,Business risks.
| AGGRESSIVE COMPETITION RISK - The intensity of competitive activity from incumbent operators, cable companies, non-traditional players and wholesalers
POTENTIAL IMPACT - Higher churn, increased retention expenses and use of promotional competitive offers to keep customers, all of which would put pressure on Bell Wireline’s adjusted EBITDA
| | REGULATORY ENVIRONMENT RISK - The Governor in Council does notvary the CRTC’s decision mandatingthat a new disaggregated wholesalehigh-speed access service must alsobe made available on FTTP facilities
- Market response to the introductionof the mandated “à la carte” TVsubscription model
POTENTIAL IMPACT - The maintenance of the CRTC’sdecision mandating that a newdisaggregated wholesale high-speedaccess service must also be madeavailable on FTTP facilities couldimprove the business positionof our competitors and changeour investment strategy, especiallyin relation to investment innext-generation wireline networks insmaller communities and rural areas
- À la carte services may changecustomer buying practices leadingto reduced subscribers, lowerrevenues and higher fixed costsadversely impacting our businessand financial results
| | TV SUBSCRIBERS PENETRATION RISK - The traditional TV viewing model (i.e., subscription for bundled channels) is challenged by an increasing number of viewing options available in the market offered by traditional, non-traditional and global players, as well as a developing trend of disconnecting TV services or reducing TV spending
POTENTIAL IMPACT - Our market penetration and number ofTV subscribers could decline as a resultof BDUs offerings and an increasingnumber of domestic and globalunregulated OTT providers
- BDUs may offer smaller and/orless expensive package options toattract subscribers
- The proliferation of IP-based products,including OTT content offerings, mayaccelerate the disconnection of TVservices or the reduction of TV spending
|
| 72 BCE Inc. 2015 ANNUAL REPORT |
| | 5 | BUSINESS SEGMENT ANALYSIS
BELL WIRELINE | MD&A |
| Bell Media delivered higher revenue in 2015, driven by strong TV ratings and the launch of CraveTV, while adjusted EBITDA declined, as expected, due to the increased cost of sports broadcast rights and content investments in TV and on-demand programming to drive future growth. |
Key elements of relevant strategic imperatives

EXPAND MEDIA LEADERSHIP
2015 PROGRESS
- Concluded a comprehensive, long-term agreement with HBOgiving Bell Media the ability to deliver all current-season, past-season and library HBO programming in Canada exclusivelyon our linear, on-demand and OTT platforms. Bell Mediaand HBO will also partner to co-produce original Canadianprogramming for their platforms and for distribution worldwide.
- Announced the expansion of TMN into a national pay TVservice in 2016 as Bell Media becomes the sole operator ofHBO Canada after Corus winds down operations of its MovieCentral and Encore Avenue pay TV services in Western andNorthern Canada
- Concluded a long-term content licensing and trademarkagreement to bring the SHOWTIME brand to Canada for thefirst time with past, present and future SHOWTIME-ownedprogramming being made available across all platformsin English and French, including CraveTV and TMN
- Extended our broadcast agreement with the CFL by threeyears through to the end of the 2021 season. TSN and RDS holdexclusive television rights for CFL football, including pre-season,regular season, playoff and Grey Cup games. In additionto broadcast and digital rights, the deal features exclusiveGrey Cup radio rights for Bell Media stations.
- Extended a long-term media rights agreement for French Opentennis through to 2024, ensuring TSN and RDS will continue todeliver exclusive coverage of all four Grand Slam tennis events
2016 FOCUS
- Maintain strong audience levels and ratings across all TV and radio properties
- Reinforce industry leadership in conventional TV, pay TV, sports media and radio
- In January 2016, we announced an exclusive partnership with iHeartRadio to bring its digital and streaming music services to Canada in 2016
- Also in January 2016, TSN became the first broadcaster to produce a live 4K Ultra HD broadcast in North America with the Toronto Raptors vs. Boston Celtics basketball game on January 20, 2016
- Grow viewership and scale of CraveTV on-demand TV streaming service
- In January 2016, we launched CraveTV direct to consumers as a standalone product available to all Canadians with an Internet subscription
- Expand TMN into a national pay TV service
- Expand live and on-demand content through our TV Everywhere services

ACHIEVE A COMPETITIVE COST STRUCTURE
2015 PROGRESS
- Restructured Bell Media’s organization to grow the team’s competitiveness in the fast-changing media landscape
2016 FOCUS
- Execute on labour savings from workforce reductions at Bell Media
BCE Inc. 2015 ANNUAL REPORT 73 |
5 | BUSINESS SEGMENT ANALYSIS
BELL WIRELINE | MD&A | |
| |
| Financial performance analysis |
2015 PERFORMANCE HIGHLIGHTS

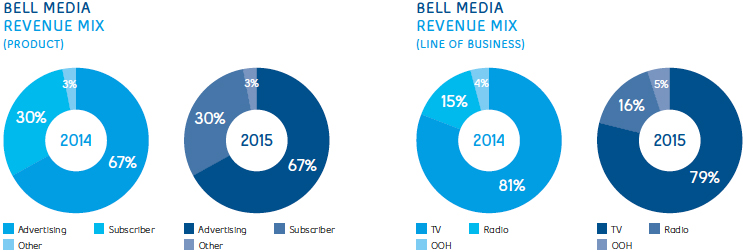
BELL MEDIA RESULTS
REVENUES
| | 2015 | | 2014 | | $ CHANGE | | % CHANGE | |
| Total external revenues | 2,635 | | 2,642 | | (7 | ) | (0.3 | %) |
| Inter-segment revenues | 339 | | 295 | | 44 | | 14.9 | % |
| Total Bell Media revenues | 2,974 | | 2,937 | | 37 | | 1.3 | % |
Bell Media revenues grew 1.3% in 2015 compared to last year, due to higher advertising and subscriber revenues.
Advertising revenues increased in 2015, reflecting:
- Growth in conventional TV advertising revenues, which benefitted from the strong performance of Bell Media’s primetime line-up, the federal election, and the live broadcast of certain programs, notably the Academy Awards, the Super Bowl and the Emmy Awards. Additionally, Bell Media recaptured advertising dollars following the shift last year to the principal broadcaster of the Sochi 2014 Winter Olympic Games.
- Higher OOH revenues attributable to new contract wins in 2015 along with strategic acquisitions in 2014
This was partly offset by:- Decreased specialty TV advertising revenues, due mainly to the loss of the broadcast of NHL playoff hockey, which was moderated by continued growth in audience levels from our English non-sports specialty services at Space and Discovery TV
- Lower radio advertising revenues, reflecting general market softness
Subscriber revenues increased in 2015 compared to 2014, primarily due to growth from CraveTV, our streaming service launched in December 2014, and from our TV Everywhere services. This was partly offset by the discontinuance of Viewers Choice, which ceased operations in the third quarter of 2014, as well as a reduction in pay TV service subscribers.
| 74 BCE Inc. 2015 ANNUAL REPORT |
| | 5 | BUSINESS SEGMENT ANALYSIS
BELL WIRELINE | MD&A |
OPERATING COSTS AND ADJUSTED EBITDA
| | 2015 | | 2014 | | $ CHANGE | | % CHANGE | |
| Operating costs | (2,251 | ) | (2,203 | ) | (48 | ) | (2.2 | %) |
| Adjusted EBITDA | 723 | | 734 | | (11 | ) | (1.5 | %) |
| Adjusted EBITDA margin | 24.3 | % | 25.0 | % | | | (0.7 | %) |
Bell Media operating costs increased by 2.2%, or $48 million, in 2015, due to escalating programming and content costs related to CraveTV and sports broadcasting rights, and greater spending on Canadian programming. The expiry of certain CRTC benefits, including the completion of the LPIF, also contributed to the year-over-year increase in operating costs. This was moderated by lower costs due to the loss of broadcast rights for the NHL playoffs, lower amortization of the fair value of certain programming rights, reduced costs from the discontinuance of Viewer’s Choice and disciplined management of other operating costs.Bell Media adjusted EBITDA declined by 1.5% in 2015, compared to last year, driven by increasing content and programming costs, moderated by higher year-over-year operating revenues and lower amortization of the fair value of certain programming rights.
BELL MEDIA OPERATING METRICS
- Maintained CTV’s #1 ranking as the most-watchednetwork in Canada for the 14th year in a row, and continuedto lead with a majority of the Top 20 programs nationallyin all key demographics
- Bell Media’s specialty and pay TV properties reached 83% of allCanadian English specialty and pay TV viewers on an averageweekly basis in 2015. Discovery channel reclaimed the topentertainment specialty position in full day audience levels,among the key viewers aged 25 to 54.
- In Québec, Bell Media maintained its leadership position in theFrench Specialty market, reaching 82% of French TV viewersin the average week. Four of the top five specialty channelsamong the key viewers aged 25 to 54 were Bell Media properties(Canal D, RDS, Super Écran and Canal Vie).
- Bell Media continued to rank first in digital media amongCanadian broadcast and video network competitors, andseventh among online properties in the country, with 17 millionunique visitors per month, reaching 57% of the digital audience
- Bell Media remained Canada’s top radio broadcaster, reaching16.9 million listeners who spent 81 million hours tuned in eachweek during 2015
- Astral OOH maintained its leadership in Québec and Ontarioand pursued its growth across Canada with the latest contractwins of the Vancouver International Airport, the HalifaxStanfield International Airport, the Ottawa Macdonald-CartierInternational Airport as well as the Réseau de transportde la Capitale for the transit shelters and bus advertising spacein Québec city
| |
| Competitive landscape and industry trends |
COMPETITIVE LANDSCAPE
The Canadian media industry is highly competitive, with competitors having significant scale and financial resources. In recent years, there has been increased consolidation of traditional media assets across the Canadian media landscape. The majority of players have become more vertically integrated to better enable the acquisition and monetization of premium content.
Bell Media competes in the TV, radio and OOH advertising markets:
- TV: The TV market has become increasingly fragmented and thistrend is expected to continue as new services and technologiesincrease the diversity of information and entertainment outletsavailable to consumers
- Radio: Competition within the radio broadcasting industryoccurs primarily in discrete local market areas amongindividual stations
- OOH: The Canadian OOH advertising industry is fragmented,consisting of a few large companies as well as numerous smallerand local companies operating in a few local markets
Consumers have also been shifting their media consumption towards digital media, mobile devices and on-demand content. This has caused new business models to emerge and advertisers to shift portions of their spending to digital platforms.
BCE Inc. 2015 ANNUAL REPORT 75 |
5 | BUSINESS SEGMENT ANALYSIS
BELL WIRELINE | MD&A | |
Competitors
TV
- Conventional Canadian TV stations (local and distant signals) and specialty and paychannels, such as those owned by Shaw(1), Corus, Rogers, Québecor Media Inc. (Québecor),Canadian Broadcasting Corporation (CBC)/Société Radio-Canada (SRC) and Groupe V
- U.S. conventional TV stations and specialty channels
- OTT streaming providers such as Netflix
- Video-sharing websites such as YouTube
RADIO
- Large radio operators, such as Rogers, Corus, Cogeco and Newcap Inc. (Newcap)that also own and operate radio station clusters in various local markets
- Radio stations in specific local markets
- Satellite radio provider SiriusXM
- Music streaming services such as Spotify and Apple Music
- Music downloading services such as Apple’s iTunes Store
- Other media such as newspapers, local weeklies, TV, magazines,outdoor advertising and the Internet
OOH ADVERTISING
- Large outdoor advertisers, such as Jim Pattison Broadcast Group (Pattison), OutfrontMedia, Cieslok Media (Cieslok), Québecor, Dynamic and Clear Channel Outdoor
- Numerous smaller and local companies operating a limited number of display facesin a few local markets
- Other media such as TV, radio, print media and the Internet

INDUSTRY TRENDS
TECHNOLOGY AND CONSUMER HABITS TRANSFORMING THE WAY TV IS DELIVERED
Technology used in the media industry continues to evolve rapidly, which has led to alternative methods for the distribution, storage and consumption of content. These technological developments have driven and reinforced changes in consumer behaviour as consumers seek more control over when, where and how they consume content. For example, consumer electronics innovations have enabled consumers to view content on TVs, computers, tablets, smartphones and other mobile electronic devices. The number of Canadian users who are connected to the Internet through their TVs is growing as connection becomes easier and more affordable. Changes in technology and consumer behaviour have resulted in a number of challenges for content aggregators and distributors. The technological developments may disrupt traditional distribution platforms by enabling content owners to provide content directly to distributors and consumers, thus bypassing traditional content aggregators.
GROWTH OF ALTERNATIVES TO TRADITIONAL LINEAR TV
Consumers now have improved access to online entertainment and information alternatives that did not exist a few years ago. While traditional linear TV was the only way to access primetime programming in the past, many consumers now watch TV in non-traditional ways for at least a portion of their viewing. In particular, today’s viewers are consuming more content online, watching less scheduled programming live, time-shifting original broadcasts through PVRs, viewing more TV on mobile devices, and catching up on past programming on-demand. In addition, many consumers are spending considerable time viewing online alternatives to traditional TV. This is evident in the growing number and popularity of OTT video services like Netflix. To date, these OTT services have largely complemented existing TV services. Media companies are evolving their content and launching their own solutions to better compete with these non-traditional offerings through services such as Bell Media’s CraveTV on-demand TV streaming service and authenticated TV Everywhere services such as CTV GO, TSN GO, RDS GO, Discovery GO and TMN GO.
ESCALATING CONTENT COSTS AND SHIFTS IN ADVERTISING
Viewership and usage trends suggest that online and mobile Internet video consumption is increasing rapidly. Changing content consumption patterns and growth of alternative content providers could exert downward pressure on rates and advertising revenues for traditional media broadcasters. However, live sports and special events should continue to draw audiences and advertisers, which is expected to result in pricing pressure on future broadcasting rights. Growing interest in 4K content could also drive additional programming acquisition and production costs. Additionally, while access to premium content has become increasingly important to media companies in attracting viewers and advertisers, there is now increased competition for these rights. This has resulted in higher TV program rights costs, which is a trend that is expected to continue into the future.
| (1) | On January 13, 2016, Corus announced its proposed acquisition of Shaw Media Inc. |
| (2) | Broadcast year-end at August 31, 2015, 2+ age category, Fall 2015 for radio |
| 76 BCE Inc. 2015 ANNUAL REPORT |
| | 5 | BUSINESS SEGMENT ANALYSIS
BELL WIRELINE | MD&A |
| |
| Business outlook and assumptions |
2016 OUTLOOK
Bell Media’s financial results in 2016 are expected to be positively impacted by growth of CraveTV, the national expansion of our English-language pay TV service (TMN), and labour savings from workforce reductions undertaken in 2015. These factors are anticipated to more than offset higher content costs to secure TV programming, continued CraveTV investment and the financial impact of TV unbundling. CraveTV growth is projected to accelerate with the direct-to-consumer launch in January 2016 and increased customer penetration from partnering with licensed BDUs. We will also continue to carefully manage costs by leveraging assets, achieving productivity gains and pursuing operational efficiencies across all of our media properties, while continuing to invest in premium content for all four screens.
While the advertising market is expected to remain relatively stable in 2016, we anticipate that the strength of our programming, which includes the 2016 UEFA European Championship, and the benefit from numerous contract wins in 2015 and our recent Métromédia acquisition in our Astral OOH business, will offset some advertising pressure from an expected shift in spending to the main broadcaster of the Rio 2016 Summer Olympic Games. Subscriber fee revenues are projected to increase, driven by CraveTV subscriber growth and the national expansion of TMN, which should help offset potential declines in specialty TV as the industry transitions to new rules governing the packaging of channels to consumers.
In conventional TV, we intend to leverage the strength of our market position to continue offering advertisers, both nationally and locally, premium opportunities to reach their target audiences. Success in this area requires that we focus on a number of factors, including:
- Successfully acquiring highly-rated programmingand differentiated content
- Building and maintaining strategic supply arrangementsfor content on four screens
- Producing and commissioning high-quality Canadian content,including market-leading news
Our sports specialty TV offerings are expected to continue to deliver premium content and exceptional viewing experiences to our viewers. Investment in 4K content, combined with the integration of our digital platforms, are integral parts of our strategy to enhance viewership and engagement. Contractual price increases for strategic sports properties, along with planned new investments in other sports and events, are the principal factors driving continued increases in sports rights costs. We will also continue to focus on creating innovative high-quality productions in the areas of sports news and editorial coverage.
In non-sports specialty TV, audiences and advertising revenues are expected to be driven by investment in quality programming and production. As part of our objective to drive revenue growth, we intend to capitalize on our leading position in key specialty services to improve both channel strength and channel selection.In pay TV, we will continue to leverage our investments in premium content (including HBO and SHOWTIME) in order to attract subscribers. In addition, we will focus on driving growth and increased scale with our planned national expansion of TMN.
In our French-language pay and specialty services, we will optimize the CRTC tangible benefits in order to maximize quality content on screen and deploy such content on authenticated multi platforms.
In radio, we intend to leverage the strength of our market position to continue offering advertisers, both nationally and locally, premium opportunities to reach their target audiences. We also plan to focus on launching our iHeartRadio digital service in Canada that will showcase content from our 106 licensed radio stations in 54 markets across the country. Additionally, in conjunction with our local TV properties, we will continue to pursue opportunities that leverage our promotional capabilities, provide an expanded platform for content sharing, and offer synergistic co-location and efficiencies.
In our OOH operations, we plan to leverage the strength of our products and recent contract wins to provide advertisers with premium opportunities in key Canadian markets. We will also continue to seek new opportunities in digital markets, including integrating and leveraging our recent Métromédia acquisition.
ASSUMPTIONS
- Positive full-year adjusted EBITDA growth and margin improvement, driven by CraveTV growth, national expansion of our TMNpay TV service, and labour savings from workforce reductionsin 2015, more than offsetting higher TV programming and sportsrights costs, continued CraveTV investment and the financialimpact of TV unbundling
- Continued scaling of CraveTV, including a successfuldirect-to-consumer launch
- Ability to successfully acquire highly rated programmingand differentiated content
- Building and maintaining strategic supply arrangementsfor content on all four screens
- TV unbundling and growth in OTT viewing expected to resultin moderately lower subscriber levels for many Bell MediaTV properties
- No material financial, operational or competitive consequencesof changes in regulations affecting our media business
BCE Inc. 2015 ANNUAL REPORT 77 |
5 | BUSINESS SEGMENT ANALYSIS
BELL WIRELINE | MD&A | |
- Stronger economic growth that drives increased advertiser demand and spending, particularly in the key automotive, entertainment equipment, telecommunications and consumer goods sectors
- Higher audience levels from strong ratings maintainedacross all TV and radio properties, as well as from securingmulti-platform rights
- Investing in the best content, including morein-house productions
This section discusses certain principal business risks specifically related to the Bell Media segment. For a detailed description of the principal risks that could have a material adverse effect on our business, refer to section 9,Business risks.
AGGRESSIVE COMPETITION AND REGULATORY CHANGES RISK The intensity of competitive activity from traditional TV services, as well as from new technologies and alternative distribution platforms such as unregulated OTT content offerings, video on demand, personal video platforms and video services over mobile devices and the Internet, in combination with regulations that require all BDUs to make TV services available à la carte
POTENTIAL IMPACT | | ADVERTISING REVENUE UNCERTAINTY RISK POTENTIAL IMPACT | | RISING CONTENT COSTS AND ABILITY TO SECURE KEY CONTENT RISK POTENTIAL IMPACT Rising programming costs could requireus to incur unplanned expenses whichcould result in negative pressure onadjusted EBITDA Our inability to acquire popularprogramming content could adverselyaffect Bell Media’s viewership andsubscription levels and, consequently,advertising and subscription revenues
|
| 78 BCE Inc. 2015 ANNUAL REPORT |
| | 6 | FINANCIAL AND CAPITAL MANAGEMENT | MD&A |
6 Financial and capital management
This section tells you how we manage our cash and capital resources to carry out our strategy and deliver financial results. It provides an analysis of our financial condition, cash flows and liquidity on a consolidated basis.
6.1 Net debt(1)
| | DECEMBER 31, 2015 | | DECEMBER 31, 2014 | | $ CHANGE | | % CHANGE | |
| Debt due within one year | 4,895 | | 3,743 | | 1,152 | | 30.8 | % |
| Long-term debt | 15,390 | | 16,355 | | (965 | ) | (5.9 | %) |
| Preferred shares(2) | 2,002 | | 2,002 | | – | | – | |
| Cash and cash equivalents | (613 | ) | (566 | ) | (47 | ) | (8.3 | %) |
| Net debt | 21,674 | | 21,534 | | 140 | | 0.7 | % |
| (1) | Net debt is a non-GAAP financial measure and does not have any standardized meaning under IFRS. Therefore, it is unlikely to be comparable to similar measures presented by other issuers. See section 10.2,Non-GAAP financial measures and key performance indicators (KPIs) – Net debtin this MD&A for more details. |
| (2) | 50% of outstanding preferred shares of $4,004 million in both 2015 and 2014 are classified as debt as it is consistent with the treatment by some credit rating agencies. |
The increase of $187 million in debt due within one year and long-term debt was due to:- The issuances of MTN debentures at Bell Canada with a total principal amount of $1.5 billion•
- A net increase of $111 million in our finance lease obligations and other debt
- An increase in our notes payable (net of repayments) of $76 million
Partly offset by:
- The repayment of MTN debentures at Bell Canada with a total principal amount of $1 billion
- The partial repayment of approximately $500 million of the borrowings under our unsecured committed term credit facility that was used to partially fund the acquisition of Astral
The increase in cash and cash equivalents of $47 million was due to:
- $2,999 million of free cash flow
- $952 million issuances of common shares primarily from15.1 million shares issued under a public bought deal offering
- The disposition of 50% of our ownership interest in Glentel to Rogers for a total cash consideration of approximately $473 million ($407 million, net of divested cash and transaction costs)
Partly offset by:
- $2,319 million of dividends paid on common and preferred shares
- $535 million for the acquisition of wireless spectrum licences
- $510 million of debt repayments (net of issuances)
- $296 million ($284 million, net of cash on hand) cashconsideration paid for the acquisition of Glentel
- $292 million of acquisition and other costs paid mainly as a resultof the payment in full satisfaction of the judgment rendered ina litigation claim for Satellite TV signal piracy and severance andintegration costs relating to the privatization of Bell Aliant
- $250 million voluntary DB pension plan contribution
- $138 million for the purchase on the open market of shares forthe settlement of share-based payments
| |
| 6.2 Outstanding share data |
COMMON SHARES OUTSTANDING | NUMBER OF SHARES | |
Outstanding, January 1, 2015 | 840,330,353 | |
Shares issued under bought deal offering | 15,111,000 | |
Shares issued for the acquisition of Glentel | 5,548,908 | |
Shares issued under employee stock option plan | 2,289,677 | |
Shares issued under ESP | 2,334,250 | |
Outstanding, December 31, 2015 | 865,614,188 | |
| | | WEIGHTED AVERAGE | |
STOCK OPTIONS OUTSTANDING | NUMBER OF OPTIONS | | EXERCISE PRICE ($) | |
Outstanding, January 1, 2015 | 9,278,190 | | $43 | |
Granted | 2,835,667 | | $56 | |
Exercised(1) | (2,289,677 | ) | $39 | |
Forfeited | (157,276 | ) | $49 | |
Outstanding, December 31, 2015 | 9,666,904 | | $48 | |
Exercisable, December 31, 2015 | 1,174,191 | | $38 | |
| (1) | The weighted average share price for options exercised in 2015 was $56. |
At March 3, 2016, 868,085,742 common shares and 11,204,584 stock options were outstanding.
BCE Inc. 2015 ANNUAL REPORT 79 |
6 | FINANCIAL AND CAPITAL MANAGEMENT | MD&A | |
| 2015 | | 2014 | | $ CHANGE | | % CHANGE | |
Cash flows from operating activities | 6,274 | | 6,241 | | 33 | | 0.5 | % |
Bell Aliant dividends paid to BCE | – | | 95 | | (95 | ) | (100.0 | %) |
Capital expenditures | (3,626 | ) | (3,717 | ) | 91 | | 2.4 | % |
Cash dividends paid on preferred shares | (150 | ) | (134 | ) | (16 | ) | (11.9 | %) |
Cash dividends paid by subsidiaries to non-controlling interest | (41 | ) | (145 | ) | 104 | | 71.7 | % |
Acquisition and other costs paid | 292 | | 131 | | 161 | | n.m. | |
Voluntary defined benefit pension plan contribution | 250 | | 350 | | (100 | ) | (28.6 | %) |
Bell Aliant free cash flow | – | | (77 | ) | 77 | | 100.0 | % |
Free cash flow | 2,999 | | 2,744 | | 255 | | 9.3 | % |
Bell Aliant free cash flow, excluding dividends paid | – | | (18 | ) | 18 | | 100.0 | % |
Business acquisitions | (311 | ) | (18 | ) | (293 | ) | n.m. | |
Acquisition and other costs paid | (292 | ) | (131 | ) | (161 | ) | n.m. | |
Voluntary defined benefit pension plan contribution | (250 | ) | (350 | ) | 100 | | 28.6 | % |
Business dispositions | 409 | | 720 | | (311 | ) | (43.2 | %) |
Acquisition of spectrum licences | (535 | ) | (566 | ) | 31 | | 5.5 | % |
Other investing activities | (51 | ) | 11 | | (62 | ) | n.m. | |
Net (repayment) issuance of debt instruments | (510 | ) | 784 | | (1,294 | ) | n.m. | |
Privatization of Bell Aliant | – | | (989 | ) | 989 | | 100.0 | % |
Issue of common shares | 952 | | 49 | | 903 | | n.m. | |
Common shares issuance cost | (35 | ) | – | | (35 | ) | n.m. | |
Repurchase of shares for settlement of share-based payments | (138 | ) | (83 | ) | (55 | ) | (66.3 | %) |
Cash dividends paid on common shares | (2,169 | ) | (1,893 | ) | (276 | ) | (14.6 | %) |
Other financing activities | (22 | ) | (29 | ) | 7 | | 24.1 | % |
Net increase in cash and cash equivalents | 47 | | 231 | | (184 | ) | (79.7 | %) |
Free cash flow per share(1) | $3.54 | | $3.46 | | $0.08 | | 2.3 | % |
| (1) | Free cash flow per share is a non-GAAP financial measure and does not have any standardized meaning under IFRS. Therefore, it is unlikely to be comparable to similar measures presented by other issuers. See section 10.2,Non-GAAP financial measures and key performance indicators (KPIs) – Free cash flow and free cash flow per sharein this MD&A for more details. |
| n.m.: not meaningful |
| |
| Cash flows from operating activities and free cash flow |
In 2015, BCE’s cash flows from operating activities increased $33 million compared to 2014, as a result of higher adjusted EBITDA, lower voluntary DB pension plan contribution made in 2015 and lower income taxes paid in 2015, partly offset by lower cash from working capital, higher acquisition and other costs paid mainly due to the payment in full satisfaction of the judgment rendered in a litigation claim for Satellite TV signal piracy and severance and integration costs relating to the privatization of Bell Aliant.
Free cash flow available to BCE’s common shareholders increased $255 million in 2015, driven by the favourable impact of the privatization of Bell Aliant, lower capital expenditures and higher cash flows from operating activities.
Free cash flow per share in 2015 was $3.54 per common share, compared to $3.46 per common share in 2014.
| 80 BCE Inc. 2015 ANNUAL REPORT |
| | 6 | FINANCIAL AND CAPITAL MANAGEMENT | MD&A |
| 2015 | | 2014 | | $ CHANGE | | % CHANGE | |
Bell Wireless | 716 | | 687 | | (29 | ) | (4.2 | %) |
Capital intensity ratio | 10.4 | % | 10.9 | % | | | 0.5 | % |
Bell Wireline | 2,809 | | 2,893 | | 84 | | 2.9 | % |
Capital intensity ratio | 22.9 | % | 23.5 | % | | | 0.6 | % |
Bell Media | 101 | | 137 | | 36 | | 26.3 | % |
Capital intensity ratio | 3.4 | % | 4.7 | % | | | 1.3 | % |
BCE | 3,626 | | 3,717 | | 91 | | 2.4 | % |
Capital intensity ratio | 16.9 | % | 17.7 | % | | | 0.8 | % |
BCE capital expenditures declined by $91 million, or 2.4%, compared to 2014, due to reduced spending in our Bell Wireline and Bell Media segments, offset in part by higher capital spending in our Bell Wireless segment. Capital expenditures as a percentage of revenue (capital intensity ratio) was 16.9% in 2015, compared to 17.7% in 2014. This reflected:
- Higher wireless capital spending of $29 million in 2015, primarily attributable to the continued expansion of our 4G LTE mobile network, which reached approximately 96% of the Canadian population at December 31, 2015, the rollout of our LTE-A network, and ongoing investments to increase network capacity in order to support greater data consumption and higher LTE speeds
- Lower wireline capital expenditures of $84 million in 2015,compared to the previous year, mainly driven by the substantialcompletion of our FibreOP deployment in Atlantic Canada andless new IPTV service footprint expansion in Québec and Ontario.
Our 2015 capital investments were focused on the continuedrollout of broadband fibre and the further expansion of our FTTPfootprint including the Gigabit Fibe infrastructure build-out in thecity of Toronto that was announced on June 25, 2015, and withincreased spending to support customer service improvementinitiatives and execution of business customer contracts. - Lower capital expenditures at Bell Media of $36 million in 2015,as a result of greater capital spending in 2014 for increasedbroadcasting capacity and new TV production equipmentrelated to the expansion of TSN from two to five national feeds
| |
| Voluntary DB pension plan contribution |
In 2015, we made a voluntary contribution of $250 million, compared to a voluntary contribution of $350 million in 2014, to fund our post-employment benefit obligation. The voluntary contributions were funded from cash on hand at the end of 2015 and 2014 and will reduce the amount of BCE’s future pension funding obligations.
On May 20, 2015, BCE completed the acquisition of all of Glentel’s issued and outstanding common shares for a total consideration of $592 million, of which $296 million ($284 million net of cash on hand) was paid in cash and the balance through the issuance of 5,548,908 BCE common shares.
Additionally, Bell Media paid a deposit of $21 million to Corus in 2015 in connection with the national expansion of HBO Canada and TMN. Subsequent to year end, Bell Media completed the final payment of $190 million which will be recorded in our consolidated statements of cash flows in the first quarter of 2016. TMN was successfully launched nationally on March 1, 2016 and Movie Central and Encore Avenue’s operations ceased on the same day at which point the transaction was recorded in our consolidated statements of financial position.
Business dispositions of $409 million in 2015 reflect BCE’s divestiture of 50% of its ownership interest in Glentel to Rogers for a total cash consideration of approximately $473 million ($407 million net of divested cash and transaction costs).
In 2014, we completed the sale of certain radio stations and TV services for total proceeds of $720 million.
BCE Inc. 2015 ANNUAL REPORT 81 |
6 | FINANCIAL AND CAPITAL MANAGEMENT | MD&A | |
| |
| Acquisition of spectrum licences |
On April 21, 2015, Bell Mobility acquired AWS-3 wireless spectrum in key urban and rural markets as part of Industry Canada’s AWS-3 spectrum auction. Bell Mobility acquired 13 licences for 169 million MHz-pop of AWS-3 spectrum for $500 million.
On May 12, 2015, Bell Mobility acquired an additional 243 million MHz-pop of 2500 MHz wireless spectrum for $29 million. This acquisition increased Bell Mobility’s 2500 MHz spectrum holdings in a number of urban and rural markets.
On April 2, 2014, Bell Mobility acquired 700 MHz spectrum licences in every province and territorial market, comprised of 31 licences for $566 million.
We use a combination of short-term and long-term debt to finance our operations. Our short-term debt consists mostly of notes payable under commercial paper programs, loans securitized by trade receivables and bank facilities. We usually pay fixed rates of interest on our long-term debt and floating rates on our short-term debt. As at December 31, 2015, all of our debt was denominated in Canadian dollars with the exception of one of our credit facilities and a portion of our commercial paper, which are denominated in U.S. dollars, all of which have been hedged for foreign currency fluctuations through forward currency contracts.
2015
We repaid $510 million of debt, net of issuances. This included the repayment of approximately $500 million of our unsecured committed term credit facility, redemption of Series M-21 MTN debentures at Bell Canada with a principal amount of $1 billion, a $474 million repayment
of finance leases and other debt, and a $112 million repayment of Glentel’s outstanding debt. These repayments were partly offset by the issuance of Series M-39 and M-40 MTN debentures at Bell Canada with principal amounts of $500 million and $1 billion, respectively, and the issuance, net of repayments, of $76 million of notes payable.
2014
We issued $784 million of debt, net of repayments. This included the issuance of Series M-30 and Series M-31 MTN debentures at Bell Canada with a principal amount of $1.25 billion and MTNs at Bell Aliant with a principal amount of $150 million, as well as $469 million of notes payable, partly offset by repayments of finance leases and other debt of $435 million, $350 million of early debt redemption of MTNs at Bell Aliant and $300 million of CTV Specialty Television Inc. notes on February 18, 2014.
| |
| Privatization of Bell Aliant |
In 2014, we paid $989 million in connection with the privatization of Bell Aliant, representing 25% of the consideration for the acquisition of the outstanding publicly held common shares of Bell Aliant that we did not already own. Refer to section 6.5,Privatization of Bell Aliant, for details on the privatization.
In 2015, we issued 15,111,000 BCE common shares for $863 million under a public bought deal offering.
| |
| Cash dividends paid on common shares |
In 2015, cash dividends paid on common shares increased by $276 million, compared to 2014, due to a higher number of outstanding common shares as a result of the issuance of shares in connection with the privatization of Bell Aliant and the purchase of our investment in Glentel, and a higher dividend paid in 2015 of $2.5675 per common share compared to $2.435 per common share in 2014.
| |
| 6.4 Post-employment benefit plans |
For the year ended December 31, 2015, we recorded a decrease in our post-employment benefit obligations and a gain, before taxes and non-controlling interest (NCI), in OCI of $590 million. This was due to a higher actual discount rate of 4.2% at December 31, 2015, compared to 4.0% at December 31, 2014, and a higher-than-expected return on plan assets.
For the year ended December 31, 2014, we recorded an increase in our post-employment benefit obligations and a loss, before taxes and NCI, in OCI of $938 million. This was due to a lower actual discount rate of 4.0% at December 31, 2014, compared to 4.9% at December 31, 2013, partly offset by a higher-than-expected return on plan assets.
| 82 BCE Inc. 2015 ANNUAL REPORT |
| | 6 | FINANCIAL AND CAPITAL MANAGEMENT | MD&A |
| |
| 6.5 Privatization of Bell Aliant |
On July 23, 2014, BCE announced its offer to acquire all of the issued and outstanding common shares of Bell Aliant that it did not already own for a total consideration of approximately $3.95 billion. BCE already controlled Bell Aliant which provided local telephone, long distance, Internet, data, TV, wireless, home security and value-added business solutions to residential and business customers in the Atlantic provinces and in rural and regional areas of Ontario and Québec. On the same day, BCE also announced its offer to exchange all of the issued and outstanding preferred shares of Bell Aliant Preferred Equity Inc. (Prefco) for newly issued First Preferred Shares of BCE, with the same financial terms as the existing Prefco preferred shares (Preferred Share Exchange).
The privatization was completed on October 31, 2014 and the Preferred Share Exchange was completed on November 1, 2014. The privatization has simplified BCE’s corporate structure and increased overall operating and capital investment efficiencies, while supporting BCE’s broadband investment strategy and dividend growth objective.
The privatization of Bell Aliant in 2014 was accounted for as an equity transaction which increased BCE’s deficit by $2,143 million, BCE’s common shares by $2,928 million and preferred shares by $609 million, and reduced NCI by $877 million and contributed surplus by $1,499 million.
| |
| 6.6 Financial risk management |
Management’s objectives are to protect BCE and its subsidiaries on a consolidated basis against material economic exposures and variability of results from various financial risks that include credit risk, liquidity risk, foreign currency risk, interest rate risk, equity price risk and longevity risk. These risks are further described in Note 2,Significant accounting policies, Note 8,Other (expense) income, Note 21,Post-employment benefit plansand Note 23,Financial and capital managementin BCE’s 2015 consolidated financial statements.
The following table outlines our financial risks, how we manage these risks and their financial statement classification.
| FINANCIAL RISK | DESCRIPTION OF RISK | MANAGEMENT OF RISK AND FINANCIAL STATEMENT CLASSIFICATION |
| Credit risk | We are exposed to credit risk from operating activities and certain financing activities, the maximum exposure of which is represented by the carrying amounts reported in the statements of financial position. We are exposed to credit risk if counterparties to our trade receivables and derivative instruments are unable to meet their obligations. | - Large and diverse customer base
- Deal with institutions with investment-grade credit ratings
- Regularly monitor our credit risk and exposure
- Our trade receivables and allowance for doubtful accounts balancesat December 31, 2015 were $2,969 million and $64 million, respectively
|
| Liquidity risk | We are exposed to liquidity risk for financial liabilities. | - Sufficient cash from operating activities, possible capital marketsfinancing and committed bank facilities to fund our operations and fulfillour obligations as they become due
- Refer to section 6.8,Liquidity – Contractual obligations, for a maturityanalysis of our recognized financial liabilities
|
| Foreign currency risk | We are exposed to foreign currency risk related to anticipated transactions and certain foreign currency debt. Refer to the followingFair valuesection for details on our derivative financial instruments. | - Foreign currency forward contracts and options on our purchase commitments and commercial paper maturing in 2016 to 2018 of $1.8 billion U.S. ($2.3 billion Canadian) at December 31, 2015, to manage foreign currency risk related to anticipated transactions and foreign currency debt
- For cash flow hedges, changes in the fair value are recognized in OCI, except for any ineffective portion, which is recognized immediately in earnings in Other (expense) income. Realized gains and losses in Accumulated OCI are reclassified to Operating costs in the income statements in the same periods as the corresponding hedged items are recognized in earnings
- For economic hedges, changes in the fair value are recognized in Other (expense) income
- Cross currency basis swaps on one of our credit facilities maturing in 2016 of $380 million U.S. ($508 million Canadian) at December 31, 2015, to hedge foreign currency risk on a portion of our long-term debt due within one year
- Changes in the fair value and the related credit facility are recognized in Other (expense) income in the income statements and offset, unless a portion of the hedging relationship is ineffective
|
BCE Inc. 2015 ANNUAL REPORT 83 |
6 | FINANCIAL AND CAPITAL MANAGEMENT | MD&A | |
| FINANCIAL RISK | DESCRIPTION OF RISK | MANAGEMENT OF RISK AND FINANCIAL STATEMENT CLASSIFICATION |
| Interest rate risk | We are exposed to risk on the interest rates of our debt, our post-employment benefit plans and on dividend rate resets on our preferred shares. Refer to the followingFair valuesection for details on our derivative financial instruments. | - Interest rate swaps maturing in 2017 with a notional amount of $700 million at December 31, 2015, to hedge interest rate risk on a portion of our long-term debt
- Changes in the fair value and the related long-term debt are recognized in Other (expense) income in the income statements and offset, unless a portion of the hedging relationship is ineffective
- Interest rate locks maturing in 2025 with a notional amount of $500 million at December 31, 2015, to hedge the interest rates on future debt issuance
- Changes in the fair value are recognized in OCI, except for any ineffective portion, which is recognized immediately in earnings in Other (expense) income. Realized gains and losses in Accumulated OCI are reclassified to Interest expense in the income statements in the same periods as the interest expense on the debt is recognized in earnings
- Interest rate locks maturing in 2020 with a notional amount of $350 million at December 31, 2015, to hedge the interest rate risk on future preferred share rate resets
- Changes in fair value are recognized immediately in earnings in Other (expense) income
- For our post-employment benefit plans, the interest rate risk is managed using a liability matching approach which reduces the exposure of the DB pension plans to a mismatch between investment growth and obligation growth
|
| Equity price risk | We are exposed to risk on our cash flow related to share-based payment plans. Refer to the followingFair valuesection for details on our derivative financial instruments. | - Equity forward contracts with a fair value of $86 million at December 31, 2015, on BCE’s common shares to economically hedge the cash flow exposure related to share-based payment plans
- Changes in fair value are recorded in the income statement in Operating costs for derivatives used to hedge a cash-settled share based payment plan and Other (expense) income for derivatives used to hedge equity settled share-based payment plans
|
| Longevity risk | We are exposed to life expectancy risk on our post-employment benefit plans. | - The Bell Canada pension plan entered into an investment arrangement to hedge part of its exposure to potential increases in longevity which covers approximately $5 billion of post-employment benefit obligations
|
Fair value is the price that would be received to sell an asset or paid to transfer a liability in an orderly transaction between market participants at the measurement date.
Certain fair value estimates are affected by assumptions we make about the amount and timing of future cash flows and discount rates, all of which reflect varying degrees of risk. Income taxes and other expenses that would be incurred on disposition of financial instruments are not reflected in the fair values. As a result, the fair values are not the net amounts that would be realized if these instruments were settled.
The carrying values of our cash and cash equivalents, trade and other receivables, trade payables and accruals, compensation payable, severance and other costs payable, interest payable, dividends payable, notes payable and loans secured by trade receivables approximate fair value as they are short term.
The following table provides the fair value details of financial instruments measured at amortized cost in the statements of financial position.
| | | | DECEMBER 31, 2015 | | DECEMBER 31, 2014 |
| | | | CARRYING | | FAIR | | CARRYING | | FAIR | |
| | CLASSIFICATION | FAIR VALUE METHODOLOGY | VALUE | | VALUE | | VALUE | | VALUE | |
CRTC tangible benefits obligation | Other current and non-current liabilities | Present value of estimated future cash flows discounted using observable market interest rates | 227 | | 234 | | 285 | | 289 | |
CRTC deferral account obligation | Other current and non-current liabilities | Present value of estimated future cash flows discounted using observable market interest rates | 154 | | 163 | | 174 | | 191 | |
Debentures, finance leases and other debt | Debt due within one year and long-term debt | Quoted market price of debt or present value of future cash flows discounted using observable market interest rates | 17,688 | | 19,764 | | 17,723 | | 20,059 | |
| 84 BCE Inc. 2015 ANNUAL REPORT |
| | 6 | FINANCIAL AND CAPITAL MANAGEMENT | MD&A |
The following table provides the fair value details of financial instruments measured at fair value in the statements of financial position.
| | | | FAIR VALUE AT DECEMBER 31 |
| | | | QUOTED PRICES IN | | | | | |
| | CARRYING VALUE OF | | ACTIVE MARKETS FOR | | OBSERVABLE | | NON-OBSERVABLE | |
| | ASSET (LIABILITY) AT | | IDENTICAL ASSETS | | MARKET DATA | | MARKET INPUTS | |
| CLASSIFICATION | DECEMBER 31 | | (LEVEL 1) | | (LEVEL 2) | (1) | (LEVEL 3) | (2) |
2015 | | | | | | | | | |
Available-for-sale (AFS) publicly-traded and privately-held investments(3) | Other non-current assets | 128 | | 16 | | – | | 112 | |
Derivative financial instruments | Other current assets, trade payables and other liabilities, other non-current assets and liabilities | 256 | | – | | 256 | | – | |
MLSE financial liability(4) | Other non-current liabilities | (135 | ) | – | | – | | (135 | ) |
Other | Other non-current assets and liabilities | 30 | | – | | 56 | | (26 | ) |
2014 | | | | | | | | | |
AFS publicly-traded and privately-held investments(3) | Other non-current assets | 107 | | 17 | | – | | 90 | |
Derivative financial instruments | Other current assets, trade payables and other liabilities, other non-current assets and liabilities | 276 | | – | | 276 | | – | |
MLSE financial liability(4) | Other non-current liabilities | (135 | ) | – | | – | | (135 | ) |
Other | Other non-current assets and liabilities | 12 | | – | | 22 | | (10 | ) |
| (1) | Observable market data such as equity prices, interest rates, swap rate curves and foreign currency exchange rates. |
| (2) | Non-observable market inputs such as discounted cash flows and earnings multiples. A reasonable change in our assumptions would not result in a significant increase (decrease) to our level 3 financial instruments. |
| (3) | Unrealized gains and losses on AFS financial assets are recorded in OCI and are reclassified toOther (expense) incomein the income statements when realized or when an impairment is determined. |
| (4) | Represents BCE’s obligation to repurchase the BCE Master Trust Fund’s (Master Trust) 9% interest in MLSE at a price not less than an agreed minimum price should the Master Trust exercise its put option. |
Credit ratings generally address the ability of a company to repay principal and pay interest on debt or dividends on issued and outstanding preferred shares.
Our ability to raise financing depends on our ability to access the public equity and debt capital markets as well as the bank credit market. Our ability to access such markets and the cost and amount of funding available partly depends on the quality of our credit ratings at the time capital is raised. Investment-grade credit ratings usually mean that when we borrow money, we qualify for lower interest rates than companies that have ratings lower than investment-grade. A ratings downgrade could result in adverse consequences for our funding capacity or ability to access the capital markets.
The following table provides BCE’s and Bell Canada’s credit ratings, which are considered investment grade, as at March 3, 2016 from DBRS and Moody’s and S&P.
| | BELL CANADA(1) |
| MARCH 3, 2016 | DBRS | | MOODY'S | | S&P | |
| Commercial paper | R-1 (low) | | P-2 | | A-1 (Low) (Canadian scale) | |
| | | | | | A-2 (Global scale) | |
| Long-term debt | A (low) | | Baa 1 | | BBB+ | |
| Subordinated long-term debt | BBB | | Baa 2 | | BBB | |
| | | | | | | |
| | BCE(1) |
| | DBRS | | MOODY'S | | S&P | |
| Preferred shares | Pfd-3 (high) | | – | | P-2 (low) (Canadian scale) | |
| | | | | | BBB- (Global scale) | |
| (1) | Outlooks on all ratings are stable. These credit ratings are not recommendations to buy, sell or hold any of the securities referred to above, and they may be revised or withdrawn at any time by the assigning rating organization. Each credit rating should be evaluated independently of any other credit rating. |
BCE Inc. 2015 ANNUAL REPORT 85 |
6 | FINANCIAL AND CAPITAL MANAGEMENT | MD&A | |
Sources of liquidity
Our cash and cash equivalents balance at the end of 2015 was $613 million. We expect that this balance, our 2016 estimated cash flows from operations, and possible capital markets financing, including commercial paper, will permit us to meet our cash requirements in 2016 for capital expenditures, post-employment benefit plans funding, dividend payments, the payment of contractual obligations, maturing debt, ongoing operations, and other cash requirements.
Should our 2016 cash requirements exceed our cash and cash equivalents balance, cash generated from our operations, and capital markets financing, we would expect to cover such a shortfall by drawing under committed revolving credit facilities that are currently in place or through new facilities, to the extent available.
Our cash flows from operations, cash and cash equivalents balance, capital markets financing and credit facilities should give us flexibility in carrying out our plans for future growth, including business acquisitions and contingencies.
| TOTAL | | | | LETTERS OF | | COMMERCIAL PAPER | | NET | |
DECEMBER 31, 2015 | AVAILABLE | | DRAWN | | CREDIT | | OUTSTANDING | | AVAILABLE | |
Committed credit facilities | | | | | | | | | | |
Unsecured revolving facility(1)(2) | 3,000 | | – | | – | | 1,659 | | 1,341 | |
Unsecured committed term credit facility (Astral)(3) | 526 | | 526 | | – | | – | | – | |
Other | 121 | | – | | 119 | | – | | 2 | |
Total committed credit facilities | 3,647 | | 526 | | 119 | | 1,659 | | 1,343 | |
Total non-committed credit facilities | 1,372 | | – | | 676 | | – | | 696 | |
Total committed and non-committed credit facilities | 5,019 | | 526 | | 795 | | 1,659 | | 2,039 | |
| (1) | Bell Canada’s $2.5 billion revolving facility expires in November 2020 and its $500 million expansion facility expires in November 2018. |
| (2) | As of December 31, 2015, Bell Canada’s outstanding commercial paper included $856 million in U.S. dollars ($1,185 million in Canadian dollars). All of Bell Canada’s commercial paper outstanding is included in debt due within one year. |
| (3) | The outstanding balance at December 31, 2015 was $380 million in U.S. dollars ($526 million in Canadian dollars), which is included in debt due within one year and has been hedged using cross currency basis swaps. |
Bell Canada may issue notes in an aggregate amount of up to $2 billion in either Canadian or U.S. dollars under its commercial paper program, supported by a committed revolving bank credit facility. The total amount of this credit facility may be drawn at any time. Some of our credit agreements require us to meet specific financial ratios and to offer to repay and cancel the credit agreement upon a change of control of BCE or Bell Canada. We are in compliance with all conditions and restrictions under such agreements.
Subsequent to year end, on January 11, 2016, Bell Canada redeemed, prior to maturity, its 4.64% Series M-19 MTN debentures, having an outstanding principal amount of $200 million which were due on February 22, 2016, as well as its 3.65% Series M-23 MTN debentures, having an outstanding principal amount of $500 million which were due on May 19, 2016.
In addition, on February 29, 2016, Bell Canada issued 3.55% Series M-41 MTN debentures under its 1997 trust indenture, with a principal amount of $750 million, which mature on March 2, 2026.
CAPITAL EXPENDITURES
In 2016, our planned capital spending will be focused on our strategic imperatives, reflecting an appropriate level of investment in our networks and services.
POST-EMPLOYMENT BENEFIT PLANS FUNDING
Our post-employment benefit plans include DB pension and defined contribution (DC) pension plans, as well as other post-employment benefits (OPEBs). The funding requirements of our post-employment benefit plans, resulting from valuations of our plan assets and liabilities, depend on a number of factors, including actual returns on post-employment benefit plan assets, long-term interest rates, plan demographics, and applicable regulations and actuarial standards. Our expected funding for 2016 is detailed in the following table and is subject to actuarial valuations that will be completed in mid-2016. An actuarial valuation was last performed for our significant post-employment benefit plans as at December 31, 2014.
2016 EXPECTED FUNDING | TOTAL | |
DB pension plans – service cost | 216 | |
DB pension plans – deficit | 19 | |
DB pension plans | 235 | |
OPEBs | 85 | |
DC pension plans | 105 | |
Total net post-employment benefit plans | 425 | |
BCE closed the membership of its DB pension plans to new employees in January 2005 to reduce the impact of pension volatility on earnings over time. Generally, new employees now enrol in the DC pension plans. In 2006, we announced the phase-out, over a 10-year period, of OPEBs for most employees, which will result in OPEBs funding being phased out gradually after 2016.
| 86 BCE Inc. 2015 ANNUAL REPORT |
| | 6 | FINANCIAL AND CAPITAL MANAGEMENT | MD&A |
DIVIDEND PAYMENTS
In 2016, the cash dividends to be paid on BCE’s common shares are expected to be higher than in 2015 as BCE’s annual common share dividend increased by 5.0% to $2.73 per common share from $2.60 per common share effective with the dividend payable on April 15, 2016. This increase is consistent with BCE’s common share dividend policy of a target payout between 65% and 75% of free cash flow. BCE’s dividend policy and the declaration of dividends are subject to the discretion of the BCE Board.
CONTRACTUAL OBLIGATIONS
The following table is a summary of our contractual obligations at December 31, 2015 that are due in each of the next five years and thereafter.
| 2016 | | 2017 | | 2018 | | 2019 | | 2020 | | THERE-
AFTER | | TOTAL | |
Recognized financial liabilities | | | | | | | | | | | | | | |
Long-term debt | 1,899 | | 1,107 | | 1,731 | | 1,309 | | 1,401 | | 7,995 | | 15,442 | |
Notes payable | 1,666 | | – | | – | | – | | – | | – | | 1,666 | |
Minimum future lease payments under finance leases | 544 | | 484 | | 337 | | 261 | | 240 | | 1,199 | | 3,065 | |
Loans secured by trade receivables | 931 | | – | | – | | – | | – | | – | | 931 | |
Interest payable on long-term debt, notes payable and loan secured by trade receivables | 728 | | 639 | | 575 | | 506 | | 457 | | 5,077 | | 7,982 | |
MLSE financial liability | – | | 135 | | – | | – | | – | | – | | 135 | |
Net interest receipts on derivatives | (25 | ) | (12 | ) | – | | – | | – | | – | | (37 | ) |
Commitments (off-balance sheet) | | | | | | | | | | | | | | |
Operating leases | 287 | | 257 | | 206 | | 178 | | 154 | | 814 | | 1,896 | |
Commitments for property, plant and equipment and intangible assets | 946 | | 650 | | 570 | | 497 | | 448 | | 1,373 | | 4,484 | |
Purchase obligations | 1,140 | | 578 | | 541 | | 525 | | 452 | | 1,645 | | 4,881 | |
National expansion of TMN(1) | 190 | | – | | – | | – | | – | | – | | 190 | |
Total | 8,306 | | 3,838 | | 3,960 | | 3,276 | | 3,152 | | 18,103 | | 40,635 | |
| (1) | This commitment was settled in the first quarter of 2016. |
BCE’s significant finance leases are for satellites and office premises. The leases for satellites, used to provide programming to our Bell TV customers, have a term of 15 years. The satellite leases are non-cancellable. The office leases have a typical lease term of 25 years. Minimum future lease payments under finance leases include future finance costs of $805 million.
BCE’s significant operating leases are for office premises, cellular tower sites and retail outlets with lease terms ranging from 1 to 42 years. These leases are non-cancellable and are renewable at the end of the lease period. Rental expense relating to operating leases was $340 million in 2015 and $335 million in 2014.
Our commitments for property, plant and equipment and intangible assets include program and feature film rights and investments to expand and update our networks to meet customer demand.
Purchase obligations consist of contractual obligations under service and product contracts for operating expenditures.
INDEMNIFICATIONS AND GUARANTEES (OFF-BALANCE SHEET)
As a regular part of our business, we enter into agreements that provide for indemnifications and guarantees to counterparties in transactions involving business dispositions, sales of assets, sales of services, purchases and development of assets, securitization agreements and operating leases. While some of the agreements specify a maximum potential exposure, many do not specify a maximum amount or termination date.
We cannot reasonably estimate the maximum potential amount we could be required to pay counterparties because of the nature of almost all of these indemnifications and guarantees. As a result, we cannot determine how they could affect our future liquidity, capital resources or credit risk profile. We have not made any significant payments under indemnifications or guarantees in the past.
We become involved in various legal proceedings as a part of our business. While we cannot predict the final outcome or timing of the legal proceedings that were pending at March 3, 2016, based on information currently available and management’s assessment of the merits of such legal proceedings, management believes that the resolution of these legal proceedings will not have a material and negative effect on our financial statements. We believe that we have strong defences and we intend to vigorously defend our positions.
You will find a description of the principal legal proceedings pending at March 3, 2016 in the BCE 2015 AIF.
BCE Inc. 2015 ANNUAL REPORT 87 |
7 | SELECTED ANNUAL AND
QUARTERLY INFORMATION | MD&A | |
7 Selected annual and quarterly information
7.1 Annual financial information
The following table shows selected consolidated financial data of BCE for 2015, 2014 and 2013, prepared in accordance with IFRS as issued by the International Accounting Standards Board (IASB). We discuss the factors that caused our results to vary over the past two years throughout this MD&A.
| 2015 | | 2014 | (1) | 2013 | (2) |
CONSOLIDATED INCOME STATEMENTS | | | | | | |
Operating revenues | 21,514 | | 21,042 | | 20,400 | |
Operating costs | (12,963 | ) | (12,739 | ) | (12,311 | ) |
Adjusted EBITDA | 8,551 | | 8,303 | | 8,089 | |
Severance, acquisition and other costs | (446 | ) | (216 | ) | (406 | ) |
Depreciation | (2,890 | ) | (2,880 | ) | (2,734 | ) |
Amortization | (530 | ) | (572 | ) | (646 | ) |
Finance costs | | | | | | |
Interest expense | (909 | ) | (929 | ) | (931 | ) |
Interest on post-employment benefit obligations | (110 | ) | (101 | ) | (150 | ) |
Other (expense) income | (12 | ) | 42 | | (6 | ) |
Income taxes | (924 | ) | (929 | ) | (828 | ) |
Net earnings | 2,730 | | 2,718 | | 2,388 | |
Net earnings attributable to: | | | | | | |
Common shareholders | 2,526 | | 2,363 | | 1,975 | |
Preferred shareholders | 152 | | 137 | | 131 | |
Non-controlling interest | 52 | | 218 | | 282 | |
Net earnings | 2,730 | | 2,718 | | 2,388 | |
Net earnings per common share | | | | | | |
Basic | 2.98 | | 2.98 | | 2.55 | |
Diluted | 2.98 | | 2.97 | | 2.54 | |
Included in net earnings: | | | | | | |
Severance, acquisition and other costs | (327 | ) | (148 | ) | (299 | ) |
Net gains (losses) on investments | 21 | | 8 | | (7 | ) |
Early debt redemption costs | (13 | ) | (21 | ) | (36 | ) |
Adjusted net earnings | 2,845 | | 2,524 | | 2,317 | |
Adjusted EPS | 3.36 | | 3.18 | | 2.99 | |
RATIOS | | | | | | |
Adjusted EBITDA margin (%) | 39.7 | % | 39.5 | % | 39.7 | % |
Return on equity (%)(3) | 21.1 | % | 21.0 | % | 17.9 | % |
| (1) | On October 31, 2014, BCE completed its acquisition of all the issued and outstanding common shares of Bell Aliant that it did not already own. Refer to section 6.5, Privatization of Bell Aliant for further details on the transaction. |
| (2) | On July 5, 2013, BCE acquired 100% of the issued and outstanding shares of Astral. As part of its approval of the Astral acquisition, the CRTC ordered BCE to spend $246.9 million in new benefits for French- and English-language TV, radio and film content development, support for emerging Canadian musical talent, training and professional development for Canadian media, and new consumer participation initiatives. The present value of this tangible benefits obligation, amounting to $230 million, was recorded as an acquisition cost in Severance, acquisition and other costs in 2013. Total acquisition and other costs relating to Astral, including the tangible benefits obligation, amounted to $266 million in 2013. |
| (3) | Net earnings attributable to common shareholders divided by total average equity attributable to BCE shareholders excluding preferred shares. |
| 88 BCE Inc. 2015 ANNUAL REPORT |
| | 7 | SELECTED ANNUAL AND
QUARTERLY INFORMATION | MD&A |
| 2015 | | 2014 | | 2013 | |
CONSOLIDATED STATEMENTS OF FINANCIAL POSITION | | | | | | |
Total assets | 47,993 | | 46,297 | | 45,384 | |
Cash and cash equivalents | 613 | | 566 | | 335 | |
Debt due within one year (including bank advances, notes payable and loan secured by trade receivables) | 4,895 | | 3,743 | | 2,571 | |
Long-term debt | 15,390 | | 16,355 | | 16,341 | |
Total non-current liabilities | 20,672 | | 21,969 | | 21,244 | |
Equity attributable to BCE shareholders | 17,023 | | 14,946 | | 15,011 | |
Total equity | 17,329 | | 15,239 | | 16,250 | |
CONSOLIDATED STATEMENTS OF CASH FLOWS | | | | | | |
Cash flows from operating activities | 6,274 | | 6,241 | | 6,476 | |
Cash flows used in investing activities | (4,114 | ) | (3,570 | ) | (6,401 | ) |
Capital expenditures | (3,626 | ) | (3,717 | ) | (3,571 | ) |
Business acquisitions | (311 | ) | (18 | ) | (2,850 | ) |
Business dispositions | 409 | | 720 | | 1 | |
Acquisition of spectrum licences | (535 | ) | (566 | ) | – | |
Cash flows (used in) from financing activities | (2,113 | ) | (2,440 | ) | 131 | |
Issue of common shares | 952 | | 49 | | 13 | |
Net (repayment) issuance of debt instruments | (510 | ) | 784 | | 2,215 | |
Common shares issuance cost | (35 | ) | – | | – | |
Cash dividends paid on common shares | (2,169 | ) | (1,893 | ) | (1,795 | ) |
Privatization of Bell Aliant | – | | (989 | ) | – | |
Cash dividends paid on preferred shares | (150 | ) | (134 | ) | (127 | ) |
Cash dividends paid by subsidiaries to non-controlling interest | (41 | ) | (145 | ) | (283 | ) |
Free cash flow | 2,999 | | 2,744 | | 2,571 | |
SHARE INFORMATION | | | | | | |
Average number of common shares (millions) | 847.1 | | 793.7 | | 775.8 | |
Common shares outstanding at end of year (millions) | 865.6 | | 840.3 | | 775.9 | |
Market capitalization(1) | 46,275 | | 44,771 | | 35,691 | |
Dividends declared per common share (dollars) | 2.60 | | 2.47 | | 2.33 | |
Dividends declared on common shares | (2,213 | ) | (1,960 | ) | (1,807 | ) |
Dividends declared on preferred shares | (152 | ) | (138 | ) | (131 | ) |
Closing market price per common share (dollars) | 53.46 | | 53.28 | | 46.00 | |
Total shareholder return(2) | 5.3 | % | 21.7 | % | 13.6 | % |
RATIOS | | | | | | |
Capital intensity (%) | 16.9 | % | 17.7 | % | 17.5 | % |
Price to earnings ratio (times)(3) | 17.94 | | 17.88 | | 18.04 | |
Price to cash flow ratio (times)(4) | 17.08 | | 16.75 | | 12.30 | |
OTHER DATA | | | | | | |
Number of employees (thousands) | 50 | | 57 | | 56 | |
| (1) | BCE’s common share price at the end of the year multiplied by the number of common shares outstanding at the end of the year. |
| (2) | The change in BCE’s common share price for a specified period plus BCE common share dividends reinvested, divided by BCE’s common share price at the beginning of the year. |
| (3) | BCE’s common share price at the end of the year divided by earnings per share. |
| (4) | BCE’s common share price at the end of the year divided by cash flow per common share. Cash flow per common share is cash flow from operating activities less capital expenditures, divided by the average number of common shares outstanding. |
BCE Inc. 2015 ANNUAL REPORT 89 |
7 | SELECTED ANNUAL AND
QUARTERLY INFORMATION | MD&A | |
| |
| 7.2 Quarterly financial information |
The following table shows selected BCE consolidated financial data by quarter for 2015 and 2014. This quarterly information is unaudited but has been prepared on the same basis as the annual consolidated financial statements. We discuss the factors that caused our results to vary over the past eight quarters throughout this MD&A.
| 2015 | 2014 |
| Q4 | | Q3 | | | Q2 | | Q1 | | Q4 | | Q3 | | Q2 | | Q1 | |
Operating revenues | 5,603 | | 5,345 | | | 5,326 | | 5,240 | | 5,528 | | 5,195 | | 5,220 | | 5,099 | |
Adjusted EBITDA | 2,073 | | 2,187 | | | 2,197 | | 2,094 | | 2,022 | | 2,115 | | 2,144 | | 2,022 | |
Severance, acquisition and other costs | (152 | ) | (46 | ) | | (24 | ) | (224 | ) | (58 | ) | (66 | ) | (54 | ) | (38 | ) |
Depreciation | (731 | ) | (727 | ) | | (720 | ) | (712 | ) | (734 | ) | (739 | ) | (708 | ) | (699 | ) |
Amortization | (136 | ) | (133 | ) | | (134 | ) | (127 | ) | (118 | ) | (116 | ) | (171 | ) | (167 | ) |
Net earnings | 542 | | 791 | | | 814 | | 583 | | 594 | | 703 | | 707 | | 714 | |
Net earnings attributable to common shareholders | 496 | | 739 | | | 759 | | 532 | | 542 | | 600 | | 606 | | 615 | |
Net earnings per common share | | | | | | | | | | | | | | | | | |
Basic | 0.58 | | 0.87 | | | 0.90 | | 0.63 | | 0.64 | | 0.77 | | 0.78 | | 0.79 | |
Diluted | 0.58 | | 0.87 | | | 0.90 | | 0.63 | | 0.63 | | 0.77 | | 0.78 | | 0.79 | |
Included in net earnings: | | | | | | | | | | | | | | | | | |
Severance, acquisition and other costs | (112 | ) | (35 | ) | | (16 | ) | (164 | ) | (42 | ) | (45 | ) | (38 | ) | (23 | ) |
Net (losses) gains on investments | (1 | ) | (16 | ) | | 40 | | (2 | ) | (8 | ) | – | | 4 | | 12 | |
Early debt redemption costs | (6 | ) | – | | | – | | (7 | ) | (18 | ) | (3 | ) | – | | – | |
Adjusted net earnings | 615 | | 790 | | | 735 | | 705 | | 610 | | 648 | | 640 | | 626 | |
Adjusted EPS | 0.72 | | 0.93 | | | 0.87 | | 0.84 | | 0.72 | | 0.83 | | 0.82 | | 0.81 | |
Average number of common shares outstanding – basic (millions) | 853.5 | | 848.9 | | | 844.9 | | 841.0 | | 837.7 | | 782.1 | | 777.7 | | 776.5 | |
OTHER INFORMATION | | | | | | | | | | | | | | | | | |
Cash flows from operating activities | 1,510 | | 1,878 | | | 1,841 | | 1,045 | | 1,527 | | 1,882 | | 1,850 | | 982 | |
Free cash flow | 916 | | 921 | | | 931 | | 231 | | 833 | | 834 | | 815 | | 262 | |
Capital expenditures | 958 | | 927 | | | 914 | | 827 | | 1,076 | | 975 | | 937 | | 729 | |
| |
| Fourth quarter highlights |
| OPERATING REVENUES | Q4 2015 | | Q4 2014 | | $ CHANGE | | % CHANGE | |
Bell Wireless | 1,770 | | 1,671 | | 99 | | 5.9 | % |
Bell Wireline | 3,161 | | 3,210 | | (49 | ) | (1.5 | %) |
Bell Media | 816 | | 789 | | 27 | | 3.4 | % |
Inter-segment eliminations | (144 | ) | (142 | ) | (2 | ) | (1.4 | %) |
Total BCE operating revenues | 5,603 | | 5,528 | | 75 | | 1.4 | % |
| ADJUSTED EBITDA | Q4 2015 | | Q4 2014 | | $ CHANGE | | % CHANGE | |
Bell Wireless | 641 | | 600 | | 41 | | 6.8 | % |
Bell Wireline | 1,248 | | 1,230 | | 18 | | 1.5 | % |
Bell Media | 184 | | 192 | | (8 | ) | (4.2 | %) |
Total BCE adjusted EBITDA | 2,073 | | 2,022 | | 51 | | 2.5 | % |
| 90 BCE Inc. 2015 ANNUAL REPORT |
| | 7 | SELECTED ANNUAL AND
QUARTERLY INFORMATION | MD&A |
BCE operating revenues were 1.4% higher in Q4 2015, compared to Q4 2014, driven by solid performance in both our Bell Wireless and Bell Media segments, partly offset by a 1.5% decline in our Bell Wireline segment, due to the impact of continued slow economic growth and competitive pricing pressures on service and product revenue in our Business Markets unit.
BCE adjusted EBITDA grew by 2.5% in Q4 2015, compared to Q4 2014, reflecting year-over-year increases at Bell Wireless of 6.8% and at Bell Wireline of 1.5%. This was moderated by a 4.2% decline at Bell Media. BCE adjusted EBITDA margin expanded to 37.0% compared to 36.6% in Q4 2014.
Bell Wireless operating revenues were 5.9% higher in Q4 2015 compared to last year, reflecting service revenue growth of 6.3% driven by a larger postpaid subscriber base and blended ARPU growth of 4.4%, driven by higher average monthly rates due to the ongoing migration by customers from three-year to two-year rate plans, as well as increased data usage. Bell Wireless operating revenues also reflected higher product sales in Q4 2015 with growth of 2.4%, as a result of a higher number of customer upgrades and postpaid gross additions compared to Q4 2014. Bell Wireless adjusted EBITDA was up 6.8%, year over year, yielding a 0.2 percentage point expansion in adjusted EBITDA service margin to 40.4%, despite higher customer retention spending and subscriber acquisition costs, attributable to more subsidized customer upgrades and postpaid gross activations, mainly as a result of the double cohort.
Bell Wireline operating revenues in Q4 2015 decreased by 1.5%, year over year, due to pressures in our Business Markets unit from a soft economy that contributed to reduced customer spending on connectivity services, business service solutions and data and voice equipment, as well as competitive pricing pressures. Additionally, continued voice erosion in our residential market, the sale of a call centre subsidiary on September 1, 2015 and lower international long distance minute sales further reduced operating revenues. The decline was moderated by Internet and IPTV subscriber growth and price increases across our residential services. Bell Wireline adjusted EBITDA in Q4 2015 was up 1.5%, year over year, with a corresponding adjusted EBITDA margin improvement to 39.5% from 38.3% in Q4 2014, reflecting effective management of our operating costs, including Bell Aliant integration synergies and workforce reductions.
Bell Media operating revenues in Q4 2015 increased by 3.4%, compared to Q4 2014, reflecting higher conventional TV advertising revenues, driven by the federal election and Bell Media’s strong fall season primetime line-up, and an increase in OOH advertising revenues due to new contract wins. This was partly offset by modest declines in specialty TV and radio advertising revenues. Subscriber revenues were up year over year, due to continued growth from CraveTV and TV Everywhere services, as well as favourable rate adjustments with certain BDUs. Bell Media adjusted EBITDA decreased by 4.2% in Q4 2015, as a result of higher content and programming costs related to CraveTV combined with escalating costs for sports broadcast rights and a return to normalized spending for Canadian programming expenditures following a one-time benefit in the fourth quarter of 2014.
BCE capital expenditures totalled $958 million in Q4 2015, which was $118 million lower than Q4 2014, corresponding to a 2.4 percentage-point decline in capital intensity to 17.1%. The decrease in capital expenditures reflected lower spending across all our segments, due to timing of spend and the substantial completion of our FibreOP deployment in Atlantic Canada as well as less new IPTV service footprint expansion in Québec and Ontario. Our capital investment supported the continued rollout of broadband fibre, including the build-out of Gigabit Fibe infrastructure in Toronto and other urban locations, the deployment of our 4G LTE and LTE-A wireless networks as well as increases in wireless and Internet network capacity to support greater speeds and growing data usage.
BCE severance, acquisition and other costs of $152 million in Q4 2015 increased by $94 million mainly due to costs related to workforce reduction initiatives at our Bell Media and Bell Wireline segments to address increasing competition, media industry regulation, a soft business market and declines in home phone subscribers.
BCE depreciation of $731 million in Q4 2015 decreased by $3 million, year over year, due to a reduction in the estimates of useful lives of certain network assets starting July 2014, which increased depreciation expense in 2014, as described in section 10.1,Our accounting policies – Critical accounting estimates and key judgments, partly offset by a higher depreciable asset base as we continued to invest in our broadband wireline and wireless networks, as well as our IPTV service.
BCE amortization was $136 million in Q4 2015, up from $118 million in Q4 2014, as a result of a higher net asset base, partly offset by an increase in the estimates of useful lives of certain assets from five to seven years, as described in section 10.1,Our accounting policies – Critical accounting estimates and key judgments.
BCE net earnings attributable to common shareholders of $496 million in Q4 2015, or $0.58 per share, were lower than the $542 million, or $0.64 per share, reported in Q4 2014. The year-over-year decrease was due to higher severance, acquisition and other costs, related mainly to workforce reduction initiatives, and lower mark-to-market gains on equity derivative contracts entered into to economically hedge future payments under our share-based compensation plans. This was partly offset by higher adjusted EBITDA, lower asset impairment charges at Bell Media, and lower income taxes. Adjusted net earnings increased by 0.8% to $615 million, and adjusted EPS remained flat at $0.72.
BCE cash flow from operating activities was $1,510 million in Q4 2015 compared to $1,527 million in Q4 2014. The decrease is mainly attributable to higher acquisition and other costs paid in 2015, due largely to the payment in full satisfaction of the judgment rendered in a litigation claim for Satellite TV signal piracy, and lower cash from working capital, partly offset by lower voluntary contribution made to post-employment benefit plans, compared to Q4 2014, and higher adjusted EBITDA.
BCE free cash flow generated in Q4 2015 was $916 million, or 10.0%, higher than in Q4 2014. This was driven by higher adjusted EBITDA, lower capital expenditures and the favourable impact of the privatization of Bell Aliant, partly offset by lower cash from working capital.
BCE Inc. 2015 ANNUAL REPORT 91 |
7 | SELECTED ANNUAL AND
QUARTERLY INFORMATION | MD&A | |
| |
| Seasonality considerations |
Some of our segments’ revenues and expenses vary slightly by season, which may impact quarter-to-quarter operating results.
Bell Wireless operating results are influenced by the timing of our marketing and promotional expenditures and higher levels of subscriber additions and handset discounts, resulting in higher subscriber acquisition and activation-related expenses in certain quarters. In particular, subscriber activations are typically lowest in the first quarter, while adjusted EBITDA tends to be lower in the third and fourth quarters, due to higher subscriber acquisition and retention costs associated with a higher number of new subscriber activations and upgrades during the back-to-school, Black Friday and Christmas holiday periods.
Bell Wireline revenues tend to be higher in the fourth quarter because of higher data and equipment product sales to business customers and higher consumer electronics equipment sales during the Q4 Christmas holiday period. However, this may vary from year to year depending on the strength of the economy and the presence of targeted sales initiatives, which can influence customer spending. Home Phone, TV and Internet subscriber activity is subject to modest seasonal fluctuations, attributable largely to residential moves during the summer months and the back-to-school period in the third quarter. Targeted marketing efforts conducted during various times of the year to coincide with special events or broad-based marketing campaigns also may have an impact on overall wireline operating results.
Bell Media revenues and related expenses from TV and radio broadcasting are largely derived from the sale of advertising, the demand for which is affected by prevailing economic conditions, as well as cyclical and seasonal variations. Seasonal variations are driven by the strength of TV ratings, particularly during the fall programming season, major sports league seasons and other special sporting events such as the Olympic Games, NHL playoffs and World Cup soccer, as well as fluctuations in consumer retail activity during the year.
| 92 BCE Inc. 2015 ANNUAL REPORT |
| | 8 | REGULATORY ENVIRONMENT | MD&A |
8 Regulatory environment
8.1 Introduction
This section describes certain legislation that governs our businesses and provides highlights of recent regulatory initiatives and proceedings, government consultations and government positions that affect us, influence our business and may continue to affect our flexibility to compete in the marketplace. Bell Canada and several of its direct and indirect subsidiaries, including Bell Mobility, Bell ExpressVu Limited Partnership (Bell ExpressVu), NorthernTel, Limited Partnership (NorthernTel), Télébec, Limited Partnership (Télébec) and Northwestel, are governed by theTelecommunications Act, theBroadcasting Act, theRadiocommunication Actand/or theBell Canada Act. They are also subject to regulations and policies enforced by the CRTC. Our business is affected by decisions made by various regulatory agencies, including the CRTC, a quasi-judicial agency of the Government of Canada responsible for regulating Canada’s telecommunications and broadcasting industries. Other aspects of the businesses of these entities are regulated in various ways by federal government departments, in particular Innovation, Science and Economic Development Canada (ISED, previously called Industry Canada).
The CRTC regulates the prices we can charge for telecommunications services in areas where it determines there is not enough competition to protect the interests of consumers. The CRTC has determined that competition was sufficient to grant forbearance from retail price regulation under theTelecommunications Actfor the vast majority of our residential and business telephone services, as well as for our wireless (except our domestic wholesale wireless roaming service) and Internet services (except in certain parts of Northwestel’s territory, where the CRTC re-regulated Internet services in 2013). Our TV distribution business is subject to theBroadcasting Actand is, for the most part, not subject to retail price regulation. However, the CRTC has recently mandated that all TV providers offer a “small entry-level” package consisting of only Canadian conventional TV services, certain public-interest services and, if the TV provider chooses to include them, one set of American over-the-air (OTA) stations. The price of this package cannot exceed $25 per month.
Although most of our retail services are not price-regulated, government agencies and departments such as the CRTC, ISED, Canadian Heritage and the Competition Bureau continue to play a significant role in regulatory matters such as mandatory access to networks, net neutrality, spectrum auctions, approval of acquisitions, broadcast licensing and foreign ownership requirements. Adverse decisions by regulatory agencies or increasing regulation could have negative financial, operational, reputational or competitive consequences for our business.
| |
| 8.2 Telecommunications Act |
TheTelecommunications Actgoverns telecommunications in Canada. It defines the broad objectives of Canada’s telecommunications policy and provides the Government of Canada with the power to give general direction to the CRTC on any of its policy objectives. It applies to several of the BCE group companies and partnerships, including Bell Canada, Bell Mobility, NorthernTel, Télébec and Northwestel.
Under theTelecommunications Act, all facilities-based telecommunications service providers in Canada, known as telecommunications common carriers (TCCs), must seek regulatory approval for all proposed tariffs for telecommunications services, unless the services are exempt from regulation or forborne from regulation. The CRTC may exempt an entire class of carriers from regulation under theTelecommunications Actif the exemption meets the objectives of Canada’s telecommunications policy. In addition, a few large TCCs, including the BCE group TCCs, must also meet certain Canadian ownership requirements. BCE monitors and periodically reports on the level of non-Canadian ownership of its common shares.
| |
| Review of basic telecommunications services |
On April 9, 2015, the CRTC launched Telecom Notice of Consultation CRTC 2015-134,Review of basic telecommunications services. In this proceeding, the CRTC requests parties to comment on which telecommunications services Canadians require to participate in the digital economy and what the CRTC’s role should be in ensuring access to these services for all Canadians. As a result of this proceeding, the CRTC may make modifications to its basic service objective and obligation to serve policies, which currently describe the level of voice service that ILECs must provide tocustomers in regulated areas that they serve. Potential modifications could involve the introduction of new regulation to support the delivery of broadband services, including the implementation of a new contribution mechanism or “tax” regime on all large telecommunications service providers to fund access to broadband services. Such modifications could have a significant impact on our business and investment decisions. A decision is not expected before late 2016.
BCE Inc. 2015 ANNUAL REPORT 93 |
8 | REGULATORY ENVIRONMENT | MD&A | |
| |
| Complaint regarding pricing of broadcasting content accessed via mobile devices |
On January 29, 2015, the CRTC issued a decision (Mobile TV decision) concerning a complaint against Bell Mobility about the pricing of our Bell Mobile TV service compared with the rates applicable when consumers access programming content received via mobile devices over the Internet. The CRTC found that we were conferring an “undue preference” on our Mobile TV service by not subjecting it to the standard data charges. In accordance with the CRTC’s Mobile TV decision, we have ceased exempting our Mobile TV service from data charges as of April 29, 2015.
On February 20, 2015, Bell Canada filed a motion seeking leave to appeal the CRTC’s Mobile TV decision in the Federal Court of Appeal, which was granted on April 2, 2015. Bell Canada alleges that the CRTC made certain errors in law in conjunction with the Mobile TV decision. The appeal was heard on January 19, 2016 and a decision is expected later this year.
| |
| Proceedings regarding wholesale domestic wireless services |
On May 5, 2015, the CRTC released Telecom Regulatory Policy CRTC 2015-177 (TRP 2015-177), which concluded its investigation into the competitiveness of wholesale wireless markets in Canada. TRP 2015-177 requires Bell Mobility, Rogers Communications Partnership (now Rogers Communications Canada Inc.) (Rogers Canada) and Telus Communications Company to issue tariffs for domestic wholesale roaming services based on the GSM standard, which are provided to all other Canadian wireless carriers but not to each other. As a condition of offering GSM-based wholesale roaming services, Bell Mobility, Rogers Canada and Telus Communications Company must provide domestic roaming service to all subscribers served by their wholesale roaming customers, including the subscribers of any MVNOs operating on their roaming customers’ networks. The CRTC is expected to grant final approval of Bell Mobility’s, Rogers Canada’s and Telus Communications Company’s proposed wholesale roaming rates later in 2016.
On August 3, 2015, the Canadian Network Operators Consortium (CNOC) applied to the CRTC to review and vary TRP 2015-177. CNOC’s application sought: (i) a CRTC order mandating full MVNO services on the networks of Bell Mobility, Rogers Canada and Telus Communications Company at regulated rates; and (ii) a follow-up regulatory proceeding to determine whether wholesale tower and site sharing services should also be mandated, and if so, on what terms and conditions. On February 18, 2016, the CRTC denied both of CNOC’s requests, leaving the determinations in TRP 2015-177 unaltered.
| |
| Wholesale wireline services framework review |
On July 22, 2015, the CRTC issued Telecom Decision 2015-326, which concluded a review of its wholesale wireline telecommunications policies. The CRTC mandated the introduction of a new disaggregated wholesale high-speed access service, including over FTTP facilities, which had so far been exempt from mandated wholesale high-speed access. While this new service is mandated for all major incumbent telephone companies and cable carriers, the first stage of its implementation is to take place only in Ontario and Québec, our two largest markets. No wholesale service previously forborne was re-regulated.
On October 20, 2015, we requested that the Governor in Council vary the CRTC’s decision so that it does not implement legacy wholesale regulation for FTTP or next-generation DOCSIS 3.1 cable networks.
The CRTC’s decision would continue to apply to legacy broadband technology, such as DSL, FTTN, and cable broadband based on DOCSIS 3.0 providing speeds up to 100 Mbps, where it exists today. Also on October 20, 2015, we filed an application with the CRTC requesting the addition of conditions regarding competitor eligibility for the new disaggregated wholesale high-speed access service.
The introduction of mandated wholesale services over FTTP by the CRTC will undermine the incentives for facilities-based digital infrastructure providers to invest in next-generation wireline networks, particularly in smaller communities and rural areas.
| 94 BCE Inc. 2015 ANNUAL REPORT |
| | 8 | REGULATORY ENVIRONMENT | MD&A |
| |
| National wireless services consumer code |
On June 3, 2013, the CRTC issued Telecom Regulatory Policy CRTC 2013-271, which established the Wireless Code. The Wireless Code applies to all wireless services provided to individual and small business consumers (i.e. businesses that on average spend less than $2,500 per month on telecom services) in all provinces and territories.
The Wireless Code establishes regulations related to unlocking mobile phones, limiting the amount of early cancellation fees, price changes for different categories of services, and setting default caps for data roaming charges and data overage charges, among other measures. The Wireless Code also stipulates that wireless service providers may not charge an early cancellation fee after a customer has been under contract for 24 months and that handset subsidies must be recovered in two years or less. These requirements reduce the incentive for wireless service providers to offer contracts with terms greater than two years.
The Wireless Code has applied to all wireless contracts since June 3, 2015.
| |
| Canada’s telecommunications foreign ownership rules |
Under theTelecommunications Act, there are no foreign investment restrictions applicable to TCCs that have less than a 10% share of the total Canadian telecommunications market as measured by annual revenues. However, foreign investment in telecommunications companies can still be refused by the government under theInvestment Canada Act. The absence of foreign ownership restrictions on such small or new entrant TCCs could result in more foreign companies entering the Canadian market, including by acquiring spectrum licences or Canadian TCCs. Under theBroadcasting Act, foreign ownership restrictions continue to apply to broadcasters such as licensed cable and Satellite TV service providers, and programming licensees such as Bell Media.
TheBroadcasting Actoutlines the broad objectives of Canada’s broadcasting policy and assigns the regulation and supervision of the broadcasting system to the CRTC. Key policy objectives of theBroadcasting Actare to protect and strengthen the cultural, political, social and economic fabric of Canada and to encourage the development of Canadian expression.
Most broadcasting activities require a programming or broadcasting distribution licence from the CRTC. The CRTC may exempt broadcasting undertakings from complying with certain licensing and regulatory requirements if it is satisfied that non-compliance will not materially affect the implementation of Canadian broadcasting policy. A corporation must also meet certain Canadian ownership and control requirements to obtain a broadcasting or broadcasting distribution licence and corporations must have the CRTC’s approval before they can transfer effective control of a broadcasting licensee.
The TV distribution business of our Bell TV business unit (Bell TV) and Bell Media’s TV and radio broadcasting operations are subject to the requirements of theBroadcasting Act, the policies and decisions of the CRTC and their respective broadcasting licences. Any changes in theBroadcasting Act, amendments to regulations or the adoption of new ones, or amendments to licences could negatively affect Bell TV’s or Bell Media’s competitive position or the cost of providing services.
| |
| Changes to simultaneous substitution |
On January 29, 2015, the CRTC announced in Broadcasting Regulatory Policy 2015-25 that it would eliminate simultaneous substitution for specialty channels starting December 1, 2015 and for the Super Bowl starting in 2017, and that it would enact new penalties for broadcasters and require BDUs to pay consumer rebates for simultaneous substitution errors. This decision, as far as it relates to the elimination of simultaneous substitution for the Super Bowl, could have an adverse impact on Bell Media’s conventional TV businesses and financial results, the full extent of which is unclear at this time.
On March 2, 2015, Bell Canada and Bell Media filed an application with the Federal Court of Appeal for leave to appeal the CRTC’s decision relating to simultaneous substitution in so far as it: (i) prohibits simultaneous substitution for the Super Bowl starting in 2017; (ii) prohibits simultaneous substitution for specialty channels; and (iii) purports to grant the CRTC authority to impose penalties on broadcasters and requires BDUs to pay rebates for errors in the performance of simultaneous substitution. Bell Canada and Bell Media are challenging the legal validity of these rules on the basis of the following arguments: (i) unlawful interference with Bell Media’s vested economic rights as the exclusive Canadian rights holder of the Super Bowl; (ii) administrative law discrimination by eliminating the benefits of simultaneous substitution for Bell Media’s Super Bowl broadcast while maintaining the benefits of simultaneous substitution for others; (iii) breach of procedural fairness in the CRTC’s failure to give notice that the prohibition of simultaneous substitution was a live issue in the TV Policy Review; (iv) the unreasonableness of the decision in light of the broadcasting policy for Canada as set out in theBroadcasting Actand in light of the CRTC’s acknowledgement of the benefits of simultaneous substitution; and (v) that the CRTC has no authority to enact regulations that empower it to penalize broadcasters or impose rebates on BDUs for errors in carrying out simultaneous substitution. The Federal Court of Appeal granted our application for leave to appeal on May 5, 2015. On November 19, 2015, the CRTC released an additional decision stating, for the first time, new grounds for its decision relating to simultaneous substitution. On December 14, 2015, Bell Canada and Bell Media filed an application with the Federal Court of Appeal for leave to appeal this decision as well. The hearing of these appeals is now expected to take place later this year.
BCE Inc. 2015 ANNUAL REPORT 95 |
8 | REGULATORY ENVIRONMENT | MD&A | |
| |
| Unbundling of TV services |
On March 19, 2015, the CRTC released Broadcasting Regulatory Policy 2015-96, which deals primarily with issues related to the distribution of TV services. In it, the CRTC mandates that all TV providers offer a “small entry-level” package consisting of only Canadian conventional TV services, certain public-interest services and, if the TV provider chooses to include them, one set of American OTA stations. The price of this package cannot exceed $25 per month exclusive of equipment. The small entry-level offer had to be introduced by March 1, 2016. The decision also requires all TV providers to offer every channel not included in a small entry-level package on both a standalone (à la carte) basis and in either build-your-own packages (e.g. “pick 10”) or small theme packs of no more than 10 channels. The CRTC did not regulate the price at which such packages can be sold. Either a standalone, build-your-own package, or small theme pack option must be offered by March 1, 2016 and both standalone and one of build-your-own package or small theme pack options must be offered by December 1, 2016. TV providers can continue to offer TV services in other packages, including their existing package options, as long as they also offer the mandated alternatives. The CRTC also decided that, with the exception of mainstream national news services, TV channels that previously had “access rights”, in that TV providers were required to carry them, will lose those rights when they renew their licences beginning in September 2017. A TV provider will, therefore, be able to cease to offer any of these services that it does not wish to carry. While the impact of the decision on Bell Media is potentially negative, the extent of the impact on Bell Media’s business and financial results is unclear at this time.
On September 24, 2015, the CRTC released Broadcasting Regulatory Policy 2015-438, announcing a new Wholesale Code. The Wholesale Code governs the commercial arrangements between BDUs, programming services and digital media services, including imposing additional restrictions on the sale of TV channels at wholesale and the carriage of TV channels by BDUs. On October 23, 2015, Bell Canada and Bell Media filed with the Federal Court of Appeal an application for leave to appeal the CRTC’s decision to implement the Wholesale Code, which application was granted on December 22, 2015. We allege that the CRTC’s implementation of the Wholesale Code conflicts with theCopyright Actand is outside the CRTC’s jurisdiction under theBroadcasting Act. A decision on the appeal is not expected until later in the year.
| |
| 8.4 Radiocommunication Act |
ISED regulates the use of radio spectrum under theRadiocommunication Act. Under theRadiocommunication Act, ISED ensures that radiocommunication in Canada is developed and operated efficiently. Under theRadiocommunication Regulations, companies that are eligible for radio licences, such as Bell Canada and Bell Mobility, must meet the same ownership requirements that apply to companies under theTelecommunications Act.
Companies must have a spectrum licence to operate a wireless system in Canada. While we anticipate that the licences under which we provide wireless services will be renewed upon expiry, there is no assurance that this will happen, or of the terms under which renewal will be granted. ISED can revoke a company’s licence at any time if the licensee does not comply with the licence’s conditions. While we believe that we comply with the conditions of our licences, there is no assurance that ISED will agree. Should there be a disagreement, this could have a negative effect on our business and financial performance.
| |
| 600 MHz spectrum consultation |
Industry Canada (now ISED) held a consultation in December 2014 seeking comments on various questions related to repurposing the 600 MHz broadcasting band for mobile use. This spectrum is currently used primarily by OTA TV broadcasters for local TV transmissions. This was the first step of a multistep process on the matter. The two key questions related to whether Industry Canada should repurpose the band to include commercial mobile broadband and whether to participate in a joint spectrum repacking process with the United States. In addition, Industry Canada also sought comments regarding the anticipated future spectrum requirements for OTA TV broadcasting, taking into consideration the overall changes in the broadcasting industry.
On August 14, 2015, Industry Canada announced its decision on the results of the consultation. Industry Canada determined it would proceed with the repacking initiative for the 600 MHz band to include commercial mobile use and that it would jointly establish a new digital TV (DTV) allotment plan in collaboration with the U.S. ISED has indicated that it is waiting for the results of the U.S. auction, which is expected to take place in March or April 2016, before proceeding with further consultation concerning the final 600 MHz band plan to be adopted and its auction process, as ISED’s auction parameters will be coordinated with the band plan that results from the auction in the U.S. The repurposing of 600 MHz spectrum will have an impact on existing Bell Media TV broadcasting stations, which will need to transition to alternative spectrum. The extent of such impact is not yet known.
| 96 BCE Inc. 2015 ANNUAL REPORT |
| | 8 | REGULATORY ENVIRONMENT | MD&A |
Under theBell Canada Act, the CRTC must approve any sale or other disposal of Bell Canada voting shares that are held by BCE, unless the sale or disposal would result in BCE retaining at least 80% of all of the issued and outstanding voting shares of Bell Canada. Except inthe ordinary course of business, the sale or other disposal of facilities integral to Bell Canada’s telecommunications activities must also receive CRTC approval.
| |
| 8.6 Other key legislation |
Personal Information Protection and Electronic Documents Act
TheDigital Privacy Actamending thePersonal Information Protection and Electronic Documents Act(PIPEDA) received Royal Assent on June 18, 2015. The amendments introduce mandatory notification requirements that must be followed in relation to the loss or unauthorized disclosure of personal information held by anorganization resulting from a breach of the organization’s security safeguards. Failure to comply with these notification requirements, or to log security breaches, may result in a fine of up to $100,000 per occurrence. These provisions dealing with notification requirements will come into force when related regulations are brought into force.
| |
| Canada’s anti-spam legislation |
Federal legislation referred to as Canada’s anti-spam legislation (CASL) came into force on July 1, 2014. Pursuant to CASL, commercial electronic messages (CEMs) can be sent only if the recipient has provided prior consent and the message complies with certain formalities, including the ability to unsubscribe easily from subsequent messages. As of January 15, 2015, CASL also requires that an organization have prior informed consent before downloading software to an end-user’s computer. Penalties for non-compliance include administrative monetary penalties of up to $10 million and a private right of action is scheduled to come into force on July 1, 2017. CASL limits the ability of the various BCE group companies to contact prospective customers, and imposes additional costs and processes with respect to communicating with existing and prospective customers.
BCE Inc. 2015 ANNUAL REPORT 97 |
9 | BUSINESS RISKS | MD&A | |
9 Business risks
A risk is the possibility that an event might happen in the future that could have a negative effect on our financial position, financial performance, cash flows, business or reputation. The actual effect of any event could be materially different from what we currently anticipate. The risks described in this MD&A are not the only ones that could affect us. Additional risks and uncertainties not currently known to us or that we currently deem to be immaterial may also materially and adversely affect our financial position, financial performance, cash flows, business or reputation.
This section describes the principal business risks that could have a material adverse effect on our financial position, financial performance, cash flows, business or reputation, and cause actual results or events to differ materially from our expectations expressed in, or implied by, our forward-looking statements. As indicated in the table below, certain of these principal business risks have already been discussed in other sections of this MD&A, and we refer the reader to those sections for a discussion of such risks. All of the risk discussions set out in the sections referred to in the table below are incorporated by reference in this section 9.
RISKS DISCUSSED IN OTHER
SECTIONS OF THIS MD&A | SECTION REFERENCES |
Regulatory environment | Section 3.3,Principal business risks
Section 8,Regulatory environment |
Competitive environment | Section 3.3,Principal business risks
Section 5,Business segment analysis(Competitive landscape and industry trendssection for each segment) |
Security management | Section 3.3,Principal business risks |
Risks specifically relating to our Bell Wireless,
Bell Wireline and Bell Media segments | Section 5,Business segment analysis(Principal business riskssection for each segment) |
The other principal business risks that could also have a material adverse effect on our financial position, financial performance, cash flows, business or reputation are discussed below.
Driving a positive customer experience in all aspects of our engagement with customers by embracing new approaches and challenging operational limitations is important to avoid adverse impacts on our business and financial performance
As the bar continues to be raised based on customers’ evolving expectations of service and value, failure to get ahead of such expectations and build a more robust service experience could hinder products and services differentiation and customer loyalty. With the proliferation of connectivity services, apps and devices, customers are accustomed to doing things when, how and where they want through websites, self-serve options, web chat, call centres, facebook, twitter and other social media forums. Failure to embrace these new media in a positive way, incorporate them into multiple elements of our service delivery and ensure that we understand their potential impact on customer perceptions could adversely affect our reputation and brand value. As the foundation of effective customer service stems from our ability to deliver simple solutions to customers in an expeditious manner, on mutually agreeable terms, complexity in our operations resulting from multiple technology platforms, billing systems, marketing databases and a myriad of rate plans, promotions and product offerings may limit our ability to respond quickly to market changes and reduce costs. Complexity in our operations may also lead to customer confusion or billing errors, which could adversely affect customer satisfaction, acquisition and retention.
| |
| Technology/infrastructure transformation |
The failure to optimize network and IT deployment and upgrading timelines, accurately assess the potential of new technologies, and invest and evolve in the appropriate direction, could have an adverse impact on our business and financial results
Globalization, increased competition and ongoing technological advances are driving customer expectations of faster market responses, enhanced user experiences and cost-effective delivery. Meeting these expectations requires the deployment of new service and product technologies that are network-neutral and based on a more collaborative and integrated development environment. Change can be difficult and may present unforeseen obstacles which might impact successful execution, and this transition is made more challenging by the complexity of our multi-product environment, combined with the complexity of our network and IT structures. In addition, new technologies may quickly become obsolete or their launch may be delayed. The failure to optimize network and IT deployment and upgrading timelines, considering customer demand and competitor activities, to accurately assess the potential of new technologies and to invest and evolve in the appropriate direction in an environment of changing business models could have an adverse impact on our business and financial results.
In particular, our network and IT evolution activities seek to install FTTP and enable an integrated IP-based competitive network offering that facilitates rapid development of new product and service offerings.
| 98 BCE Inc. 2015 ANNUAL REPORT |
| | 9 | BUSINESS RISKS | MD&A |
If this cannot be achieved in accordance with our deployment schedules while maintaining network availability and performance through the migration process, we may lose customers as a result of poor service performance, which could adversely affect our ability to achieve our operational and financial objectives. Failure to leverage IP across all facets of our network and product and service portfolio could inhibit a fully customer-centric approach, limiting or preventing comprehensive self-serve convenience, real-time provisioning, cost savings and flexibility in delivery and consumption, leading to negative business and financial outcomes.
Parallel to our focus on next-generation investment, adverse regulatory decisions may impact the specific nature, magnitude, location and timing of investment decisions. In particular, the introduction by the CRTC of mandated wholesale services over FTTP or wireless networks will undermine the incentives for facilities-based digital infrastructure providers to invest in next-generation wireline and wireless networks, particularly in smaller communities and rural areas. Failure to continue investment in a disciplined and strategic manner in next-generation capabilities, including real-time information-based customer service strategies, could limit our ability to compete effectively and achieve desired business and financial results.
Other examples of risks to achieving our desired technology/ infrastructure transformation include:
- Network construction and deployment on municipal or privateproperty requires the issuance of municipal and property ownerconsents, respectively, for the installation of network equipment,which could cause delays to FTTP rollout
- New products, services or apps could reduce demand for ourexisting more profitable service offerings or cause prices forthose services to decline, and could result in shorter estimateduseful lives for existing technologies, which could increasedepreciation and amortization expense
- As consumption habits evolve and TV viewing alternativesexpand, our ability to develop alternative delivery vehicles,which may require significant IT investment, in order to competein new markets is essential to maintaining customer engagementand revenue streams
- Our ability to leverage new opportunities, such as thoseintroduced by “Big Data”, which is subject to many challenges,including evolving customer perceptions as well as legal andregulatory developments. If we cannot build market-leadingcompetencies in this field across sales, service and operationalplatforms that respect societal values and legal and regulatoryrequirements, we may miss important opportunities to growour business through enhanced market intelligence and a moreproactive customer service model.
Our networks, IT systems and data centre assets are the foundation of high-quality consistent services which are critical to meeting service expectations
Our ability to provide consistent wireless, wireline, media broadcasting, satellite and data centre services to customers in a complex and constantly changing operating environment is crucial for sustained success. In particular, network capacity demands for TV and other bandwidth-intensive applications on our Internet and wireless networks have been growing at unprecedented rates. Unexpected capacity pressures on our networks may negatively affect our network performance and our ability to provide services. Issues relating to network availability, speed, consistency and traffic management on our more current as well as aging networks could have an adverse impact on our business and financial performance.
In addition, we currently use a very large number of interconnected operational and business support systems including for provisioning, networking, distribution, broadcast management, billing and accounting. If we fail to implement or maintain highly effective customer-facing IT systems supported by an effective governance and operating framework, this may lead to inconsistent performance and dissatisfied customers, which over time could result in higher churn.
Further examples of risks to operational performance that could impact our reputation, business operations and financial performance include the following:
- We may need to incur significant capital expenditures beyond those already anticipated by our capital intensity target in order to provide additional capacity and reduce network congestion on our wireline and wireless networks, and we may not be able to generate sufficient cash flows or raise the capital we need to fund such capital expenditures, which may result in service degradation
- Corporate restructurings, system replacements and upgrades,process redesigns and the integration of business acquisitionsmay not deliver the benefits contemplated and could adverselyimpact our ongoing operations
- If we fail to streamline our significant IT legacy system portfolioand proactively improve operating performance, this couldadversely affect our business and financial outcomes
- A shortage of technicians or contact centre staff couldresult in the failure to achieve a desired level of customerservice satisfaction
- There may be a lack of competent and cost-effective resourcesto perform the life-cycle management and upgrades necessaryto maintain operational status of legacy networks
Our operations and business continuity depend on how well we protect, test, maintain and replace our networks, IT systems, equipment and other facilities
Our operations depend on how well we and our contracted service providers protect our networks and IT systems, as well as other infrastructure and facilities, against damage from fire, natural disaster (including, without limitation, seismic and severe weather-related events such as ice, snow and wind storms, flooding, hurricanes, tornados and tsunamis), power loss, building cooling loss, unauthorized access or entry, cyber threats, disabling devices, acts of war or terrorism, sabotage, vandalism, actions of neighbours and other events. Establishing response strategies and business continuity protocols to maintain service consistency if any disruptive event materializes is critical to the achievement of effective customer service. Any of the above-mentioned events, as well as the failure to complete the planned testing, maintenance or replacement of our networks, equipment and other facilities due to factors beyond our control, could disrupt our operations (including through disruptions such as network failures, billing errors or delays in customer service), require significant resources and result in significant remediation
BCE Inc. 2015 ANNUAL REPORT 99 |
9 | BUSINESS RISKS | MD&A | |
costs, which in turn could have an adverse effect on our business and financial performance, or impair our ability to keep existing subscribers or attract new ones.
Satellites used by Bell TV are subject to significant operational risks that could have an adverse effect on Bell TV’s business and financial performance
Pursuant to a set of commercial arrangements between Bell TV and Telesat Canada (Telesat), Bell TV currently has two satellites under contract with Telesat. Telesat operates or directs the operation of these satellites. Satellites utilize highly complex technology and operate in the harsh environment of space and are therefore subject to significant operational risks while in orbit. These risks include in-orbit equipment failures, malfunctions and other problems, commonly referred to as anomalies, that could reduce the commercial usefulness of a satellite used by Bell TV. Acts of war or terrorism, magnetic, electrostatic or solar storms, and space debris or meteoroids could also damage the satellites used by Bell TV. Any loss, failure, manufacturing defect, damage or destruction of these satellites, of Bell TV’s terrestrial broadcasting infrastructure or of Telesat’s tracking, telemetry and control facilities to operate the satellites could have an adverse effect on Bell TV’s business and financial performance and could result in customers terminating their subscriptions to Bell TV’s DTH Satellite TV service.
We depend on third-party suppliers and outsourcers, some of which are critical, to provide an uninterrupted supply of the products and services we need to operate our business
We depend on key third-party suppliers and outsourcers, over which we have no operational or financial control, for products and services, some of which are critical to our operations. If there are gaps in our supplier governance and oversight models established to ensure full risk transparency at point of purchase and throughout the relationship, including any contract renegotiations, there is the potential for a breakdown in supply, which could impact our ability to make sales, service customers and achieve our business and financial objectives. The outsourcing of services generally involves transfer of risk, and we must take appropriate steps to ensure that the outsourcers’ approach to risk management is aligned with our own standards in order to maintain continuity of supply and brand strength. Further, as cloud-based supplier models continue to evolve, our procurement and vendor management practices must also continue to evolve to fully address associated risk exposures.
Other examples of risks associated with vendor oversight include the following:
- Demand for products and services available from only a limited number of suppliers, some of which dominate their global market, may lead to decreased availability, increased costs or delays in the delivery of such products and services since suppliers may choose to favour global competitors that are larger than we are and, accordingly, purchase a larger volume of products and services. In addition, production issues affecting any such suppliers, or other suppliers, could result in decreased quantities, or a total lack of supply of products or services. Any of these events could potentially adversely impact our ability to meet customer commitments and demand.
- Cloud-based solutions may increase the risk of security anddata leakage exposure if security control protocols affecting oursuppliers are bypassed
- Failure to maintain strong discipline around vendor administration (especially around initial account setup) may maskpotential financial or operational risks and complicate futureproblem resolution
- If products and services important to our operations havemanufacturing defects or do not comply with applicablegovernment regulations and standards (including product safetypractices), our ability to sell products and provide serviceson a timely basis may be negatively impacted. We work withour suppliers to identify serious product defects (includingsafety incidents) and develop appropriate remedial strategies.
Remedial strategies may include a recall of products. To theextent that a supplier does not actively participate in, and/orbear primary financial responsibility for, a recall of its products,our ability to perform such recall program at a reasonable costand/or in a timely fashion may be negatively impacted. Any ofthe events referred to above could have an adverse effect onour operations and financial results. - Temporary or permanent operational failures or service interruptions of the networks of other telecommunications carriers andsuppliers on which we rely to deliver services could adverselyaffect our ability to provide services using such carriers’ andsuppliers’ networks and could, consequently, have an adverseeffect on our business and financial performance
| 100 BCE Inc. 2015 ANNUAL REPORT |
| | 9 | BUSINESS RISKS | MD&A |
Our employees and contractors are key resources and there is a broad and complex range of risks which must be managed effectively to drive a winning corporate culture and outstanding performance
Our business depends on the efforts, engagement and expertise of our management and non-management employees and contractors, who must be able to operate safely and securely based on the tasks they are completing and the environment in which they are functioning. If we fail to achieve this basic expectation, this could adversely affect our organizational culture, reputation and financial results as well as our ability to attract high-performing team members. Competition for highly skilled team members is intense, which makes the development of approaches to identify and secure high-performing candidates for a broad range of job functions, roles and responsibilities essential. Failure to appropriately train, motivate, remunerate or deploy employees on initiatives that further our strategic imperatives, or to efficiently replace retiring employees, could have an adverse impact on our ability to attract and retain talent and drive performance across the organization. The positive engagement of members of our team represented by unions is contingent on negotiating collective agreements which deliver competitive labour conditions and uninterrupted service, both of which are critical to achieving our business objectives. In addition, if the skill sets, diversity and size of the workforce do not match the operational requirements of the business and foster a winning culture, we will likely not be able to sustain our performance.
Other examples of people-related risks include the following:
- The increasing technical and operational complexity of ourbusinesses creates a challenging environment for hiring,retaining and developing skilled technical resources
- Failure to establish a complete and effective succession plan,including preparation of internal talent and identification ofpotential external candidates where relevant for key roles, couldimpair our business until qualified replacements are found
- Approximately 45% of our employees are represented byunions and are covered by collective bargaining agreements.Renegotiating collective bargaining agreements could resultin higher labour costs, project delays and work disruptions,including work stoppages or work slowdowns, which couldadversely affect service to our customers and, in turn, ourcustomer relationships and financial performance.
- Ensuring the safety and security of our workforce operating indifferent environments, including, manholes, telephone poles, celltowers, vehicles, foreign news bureaus and war zones, requiresfocus, effective processes and flexibility to avoid injury, serviceinterruption, fines and reputational impact
- Deterioration in employee morale and engagement resultingfrom staff reductions, ongoing cost reductions or reorganizations could adversely affect our business and financial results
If we are unable to raise the capital we need or generate sufficient cash flows from operations, we may need to limit our capital expenditures or our investments in new businesses, or try to raise capital by disposing of assets
Our ability to meet our cash requirements and provide for planned growth depends on having access to adequate sources of capital and on our ability to generate cash flows from operations, which is subject to various risks, including those described in this MD&A.
Our ability to raise financing depends on our ability to access the public equity and debt capital markets, as well as the bank credit market. Our ability to access such markets and the cost and amount of funding available depend largely on prevailing market conditions and the outlook for our business and credit ratings at the time capital is raised. Risk factors such as capital market disruptions, sovereign credit concerns in Europe, central bank monetary policies, increased bank capitalization regulations, reduced bank lending in general or fewer banks as a result of reduced activity or consolidation could reduce capital available or increase the cost of such capital. In addition, an increased level of debt borrowings could result in lower credit ratings, increased borrowing costs and a reduction in the amount of funding available to us, including through equity offerings. Business acquisitions could also adversely affect our outlook and credit ratings and have similar adverse consequences. In addition, participants in the public capital and bank credit markets have internal policies limiting their ability to invest in, or extend credit to, any single entity or entity group or a particular industry.
Our bank credit facilities, including credit facilities supporting our commercial paper program, are provided by various financial institutions. While it is our intention to renew certain of such credit facilities from time to time, there are no assurances that these facilities will be renewed on favourable terms or in similar amounts.
Differences between BCE’s actual or anticipated financial results and the published expectations of financial analysts, as well as events affecting our business or operating environment, may contribute to volatility in BCE’s securities. A major decline in the capital markets in general, or an adjustment in the market price or trading volumes of BCE’s securities, may negatively affect our ability to raise capital, issue debt, retain senior executives and other key employees, make strategic acquisitions or enter into joint arrangements.
If we cannot access the capital we need or generate cash flows to implement our business plan or meet our financial obligations on acceptable terms, we may have to limit our ongoing capital expenditures and our investment in new businesses or try to raise additional capital by selling or otherwise disposing of assets. Any of these could have an adverse effect on our cash flows from operations and on our growth prospects.
We cannot guarantee that BCE’s dividend policy will be maintained or that dividends will be declared
The BCE Board reviews from time to time the adequacy of BCE’s dividend policy with the objective of allowing sufficient financial flexibility to continue investing in our business while growing returns to shareholders. Under the current dividend policy, increases in the common share dividend are directly linked to growth in BCE’s free cash flow. BCE’s dividend policy and the declaration of dividends on any of its outstanding shares are subject to the discretion of the BCE Board and, consequently, there can be no guarantee that BCE’s
BCE Inc. 2015 ANNUAL REPORT 101 |
9 | BUSINESS RISKS | MD&A | |
dividend policy will be maintained or that dividends will be declared. The declaration of dividends by the BCE Board is ultimately dependent on BCE’s operations and financial results which are, in turn, subject to various assumptions and risks, including those set out in this MD&A.
We are exposed to various credit, liquidity and market risks
Our exposure to credit, liquidity and market risks, including equity price, interest rate and currency fluctuations, is discussed in section 6.6,Financial risk managementin this MD&A and in Note 23 to BCE’s 2015 consolidated financial statements.
Our failure to identify and manage our exposure to changes in interest rates, foreign exchange rates, BCE’s share price and other market conditions could lead to missed opportunities, cash flow shortages, inability to complete planned capital expenditures, reputational damage, stock and debenture devaluations and challenges in raising capital on market-competitive terms.
The economic environment, pension rules or ineffective governance could have an adverse effect on our pension obligations, liquidity and financial performance, and we may be required to increase contributions to our post-employment benefit plans in the future
With a large pension plan membership and DB pension plans that are subject to the pressures of the global economic environment and changing regulatory and reporting requirements, our pension obligations are exposed to potential volatility. Failure to recognize and manage economic exposure and pension rule changes or to ensure that effective governance is in place for management and funding of pension plan assets and obligations could have an adverse impact on our liquidity and financial performance.
The funding requirements of our post-employment benefit plans, based on valuations of plan assets and obligations, depend on a number of factors, including actual returns on post-employment benefit plan assets, long-term interest rates, plan demographics, and applicable regulations and actuarial standards. Changes in these factors could cause future contributions to significantly differ from our current estimates and could require us to increase contributions to our post-employment benefit plans in the future and, therefore, could have a negative effect on our liquidity and financial performance.
There is no assurance that the assets of our post-employment benefit plans will earn their assumed rate of return. A substantial portion of our post-employment benefit plans’ assets is invested in public equity and debt securities. As a result, the ability of our post-employment benefit plans’ assets to earn the rate of return that we have assumed significantly depends on the performance of capital markets. Market conditions also impact the discount rate used to calculate our solvency obligations and could therefore also significantly affect our cash funding requirements.
Our expected funding for 2016 is in accordance with the latest post-employment benefit plan valuations as of December 31, 2014, filed in June 2015, and takes into account a voluntary contribution of $250 million in 2015.
Income and commodity tax amounts may materially differ from the expected amounts
Our complex business operations are subject to various tax laws and the adoption of new tax laws, or regulations or rules thereunder, or changes thereto or in the interpretation thereof, could result in higher tax rates, new taxes or other adverse tax implications. In addition, while we believe that we have adequately provided for all income and commodity taxes based on all of the information that is currently available, the calculation of income taxes and the applicability of commodity taxes in many cases require significant judgment in interpreting tax rules and regulations. Our tax filings are subject to government audits that could result in material changes to the amount of current and deferred income tax assets and liabilities and other liabilities and could, in certain circumstances, result in an assessment of interest and penalties.
The failure to reduce costs as well as unexpected increases in costs could adversely affect our ability to achieve our strategic imperatives and our financial results
Our objectives for targeted cost reductions continue to be aggressive but there is no assurance that we will be successful in reducing costs, especially since incremental cost savings are more difficult to achieve on an ongoing basis. Our cost reduction objectives require aggressive negotiations with our suppliers and there can be no assurance that such negotiations will be successful or that replacement products or services provided will not lead to operational issues.
Examples of risks to our ability to reduce costs or of potential cost increases include:
- Achieving timely cost reductions while moving to an IP-basednetwork is dependent on disciplined network decommissioning,which can be delayed by customer contractual commitments,regulatory considerations and other unforeseen obstacles
- Fluctuations in energy prices are partly influenced bygovernment policies to address climate change which, combined with growing data demand that increases our energyrequirements, could increase our energy costs beyond ourcurrent expectations
- Failure to successfully deliver on our contractual commitments,whether due to security events, operational challenges or otherreasons, may result in financial penalties and loss of revenues
The failure to evolve practices to effectively monitor and control fraudulent activities could result in financial loss and brand degradation
As a public company with a range of desirable and valuable products and services and approximately 50,000 employees, fraud requires a disciplined program covering governance, exposure identification and assessment, prevention, detection and reporting that considers corruption, misappropriation of assets and intentional manipulation of financial statements by employees and/or external parties. Fraud events can result in financial loss and brand degradation.
Specific examples relevant to us include:
- Subscription fraud on accounts established with a false identityor paid with a stolen credit card
- Network usage fraud such as call/sell operations using ourwireline or wireless networks
- Copyright theft and other forms of unauthorized use that undermine the exclusivity of Bell Media’s content offerings and couldpotentially divert users to unlicensed or otherwise illegitimateplatforms, thus impacting our ability to derive distribution andadvertising revenues
- TV distributors including Bell TV are subject to ongoing effortsto steal their services through compromise or circumvention ofsignal security systems, causing revenue loss
| 102 BCE Inc. 2015 ANNUAL REPORT |
| | 9 | BUSINESS RISKS | MD&A |
| |
| Litigation and legal obligations |
Legal proceedings, changes in applicable laws and the failure to proactively address our legal and regulatory obligations could have an adverse effect on our business and financial performance
We become involved in various legal proceedings as part of our business. Plaintiffs within Canada are able to launch and obtain certification of class actions on behalf of a large group of people with increasing ease, and Canadian provincial securities laws facilitate the introduction in Canada of class action lawsuits by secondary market investors against public companies for alleged misrepresentations in public disclosure documents and oral statements. Changes in laws or regulations, or in how they are interpreted, and the adoption of new laws or regulations, as well as pending or future litigation, including an increase in certified class actions which, by their nature, could result in sizeable damage awards and costs relating to litigation, could have an adverse effect on our business and financial performance.
Examples of legal and regulatory obligations that we must comply with include those resulting from:
- As discussed in more detail in section 8,Regulatory environment,decisions, policies and other initiatives of the CRTC, ISED, theCompetition Bureau and other governmental agencies, as well aslaws of a regulatory nature
- Consumer protection laws
- Tax legislation
- Corporate and securities legislation
- IFRS requirements
- Environmental protection laws
- Payment card industry standards for the protection againstcustomer credit card infractions
For a description of the principal legal proceedings involving us, please see the section entitledLegal Proceedingscontained in the BCE 2015 AIF.
| |
| Health and environmental concerns |
Health concerns about radiofrequency emissions from wireless communication devices, as well as epidemics and other health risks, could have an adverse effect on our business
Many studies have been performed or are ongoing to assess whether wireless phones, networks and towers pose a potential health risk. While some studies suggest links to certain conditions, others conclude there is no established causation between mobile phone usage and adverse health effects. ISED is responsible for approving radiofrequency equipment and performing compliance assessments and has chosen Health Canada’s Safety Code 6, which sets the limits for safe exposure to radiofrequency emissions at home or at work, as its exposure standard. This code also outlines safety requirements for the installation and operation of devices that emit radiofrequency fields such as mobile phones, Wi-Fi technologies and base station antennas. ISED has made compliance to Safety Code 6 mandatory for all proponents and operators of radio installations.
Our business is heavily dependent on radiofrequency technologies, which could present significant challenges to our business and financial performance, such as the following:
- We face current and potential lawsuits relating to alleged adverse health effects on customers, as well as to our marketing and disclosure practices in connection therewith, and the likely outcome of such lawsuits is unpredictable and may change over time
- Changes in scientific evidence and/or public perceptionscould lead to additional government regulations and costs forretrofitting infrastructure and handsets to achieve compliance
- Public concerns could result in a slower deployment of, or in ourinability to deploy, infrastructure necessary to maintain and/orexpand our wireless network as required by market evolution
In addition, epidemics, pandemics and other health risks could also occur, which could adversely affect our ability to maintain operational networks and provide services to our customers. Any of these events could have an adverse effect on our business and financial performance.
Climate change and other environmental concerns could have an adverse effect on our business
Global climate change could exacerbate certain of the threats facing our business, including the frequency and severity of weather-related events referred to inOperational performance – Our operations and business continuity depend on how well we protect, test, maintain and replace our networks, IT systems, equipment and other facilitiesin this section 9. Several areas of our operations further raise environmental considerations, such as fuel storage, greenhouse gas emissions, disposal of hazardous residual materials, and recovery and recycling of end-of-life electronic products we sell or lease. Failure to recognize and adequately respond to changing governmental and public expectations on environmental matters could result in fines, missed opportunities, additional regulatory scrutiny or harm our brand and reputation.
BCE Inc. 2015 ANNUAL REPORT 103 |
10 | FINANCIAL MEASURES,
ACCOUNTING POLICIES AND CONTROLS | MD&A | |
10 Financial measures, accounting policies and controls
10.1 Our accounting policies
This section discusses key estimates and assumptions that management has made and how they affect the amounts reported in the financial statements and notes. It also describes key changes in accounting standards and our accounting policies, and how they affect our financial statements.
We have prepared our consolidated financial statements using IFRS. Other significant accounting policies, not involving the same level of measurement uncertainty as those discussed in this section, are nevertheless important to an understanding of our financial statements. See Note 2 to BCE’s 2015 consolidated financial statements for more information about the accounting principles we use to prepare our consolidated financial statements.
| |
| Critical accounting estimates and key judgments |
When preparing financial statements, management makes estimates and judgments relating to:
- reported amounts of revenues and expenses
- reported amounts of assets and liabilities
- disclosure of contingent assets and liabilities
We base our estimates on a number of factors, including historical experience, current events and actions that the company may undertake in the future, and other assumptions that we believe are reasonable under the circumstances. By their nature, these estimates and judgments are subject to measurement uncertainty and actual results could differ.
We consider the estimates and judgments described in this section to be an important part of understanding our financial statements because they require management to make assumptions about matters that were highly uncertain at the time the estimate and judgment were made, and changes to these estimates and judgments could have a material impact on our financial statements and our segments.
Our senior management has reviewed the development and selection of the critical accounting estimates and judgments described in this section with the Audit Committee of the BCE Board.
Any sensitivity analysis included in this section should be used with caution as the changes are hypothetical and the impact of changes in each key assumption may not be linear.
Our more significant estimates and judgments are described below.
ESTIMATES
USEFUL LIVES OF PROPERTY, PLANT AND EQUIPMENT AND FINITE-LIFE INTANGIBLE ASSETS
We review our estimates of the useful lives of property, plant and equipment and finite-life intangible assets on an annual basis and adjust depreciation or amortization on a prospective basis, if needed.
Property, plant and equipment represent a significant proportion of our total assets. Changes in technology or our intended use of these assets, as well as changes in business prospects or economic and industry factors, may cause the estimated useful lives of these assets to change.
The estimated useful lives of property, plant and equipment and finite-life intangible assets are determined by internal asset life studies, which take into account actual and expected future usage, physical wear and tear, replacement history and assumptions about technology evolution. When factors indicate that assets’ useful lives are different from the prior assessment, we depreciate or amortize the remaining carrying value prospectively over the adjusted estimated useful lives.
Change in accounting estimate
In 2014, as part of our ongoing annual review of property, plant and equipment and finite-life intangible assets, and to better reflect their useful lives, we increased the lives of certain IT software assets from five years to seven years and reduced the lives of certain network assets, including our CDMA network. The changes have been applied prospectively effective July 1, 2014 and did not have a significant impact on our financial statements.
POST-EMPLOYMENT BENEFIT PLANS
The amounts reported in the financial statements relating to DB pension plans and OPEBs are determined using actuarial calculations that are based on several assumptions.
Our actuaries perform a valuation at least every three years to determine the actuarial present value of the accrued DB pension plan and OPEB obligations. The actuarial valuation uses management’s assumptions for, among other things, the discount rate, life expectancy, the rate of compensation increase, trends in healthcare costs and expected average remaining years of service of employees.
While we believe that these assumptions are reasonable, differences in actual results or changes in assumptions could materially affect post-employment benefit obligations and future net post-employment benefit plans cost.
We account for differences between actual and expected results in benefit obligations and plan performance in OCI, which are then recognized immediately in the deficit.
The most significant assumptions used to calculate the net post-employment benefit plans cost are the discount rate and life expectancy.
A discount rate is used to determine the present value of the future cash flows that we expect will be needed to settle post-employment benefit obligations.
The discount rate is based on the yield on long-term, high-quality corporate fixed income investments, with maturities matching the estimated cash flows of the post-employment benefit plans. Life
| 104 BCE Inc. 2015 ANNUAL REPORT |
| | 10 | FINANCIAL MEASURES,
ACCOUNTING POLICIES AND CONTROLS | MD&A |
expectancy is based on publicly available Canadian mortality tables and is adjusted for the company’s specific experience.
A lower discount rate and a higher life expectancy result in a higher net post-employment benefit obligation and a higher current service cost.
Sensitivity analysis
The following table shows a sensitivity analysis of key assumptions used to measure the net post-employment benefit obligations and the net post-employment benefit plans cost for our DB pension plans and OPEB plans.
| | | IMPACT ON NET POST-EMPLOYMENT
BENEFIT PLANS COST FOR 2015 –
INCREASE (DECREASE) | IMPACT ON POST-EMPLOYMENT BENEFIT
OBLIGATIONS AT DECEMBER 31, 2015 –
INCREASE (DECREASE) |
| | |
| | |
| CHANGE IN | | INCREASE IN | | DECREASE IN | | INCREASE IN | | DECREASE IN | |
| ASSUMPTION | | ASSUMPTION | | ASSUMPTION | | ASSUMPTION | | ASSUMPTION | |
Discount rate | 1 | % | (148 | ) | 112 | | (2,783 | ) | 3,178 | |
Mortality rate | 25 | % | (66 | ) | 70 | | (1,386 | ) | 1,477 | |
IMPAIRMENT OF NON-FINANCIAL ASSETS
Goodwill and indefinite-life intangible assets are tested for impairment annually or when there is an indication that the asset may be impaired. Property, plant and equipment and finite-life intangible assets are tested for impairment if events or changes in circumstances, assessed at each reporting period, indicate that their carrying amount may not be recoverable. For the purpose of impairment testing, assets other than goodwill are grouped at the lowest level for which there are separately identifiable cash inflows.
Impairment losses are recognized and measured as the excess of the carrying value of the assets over their recoverable amount. An asset’s recoverable amount is the higher of its fair value less costs of disposal and its value in use. Previously recognized impairment losses, other than those attributable to goodwill, are reviewed for possible reversal at each reporting date and, if the asset’s recoverable amount has increased, all or a portion of the impairment is reversed.
We make a number of estimates when calculating recoverable amounts using discounted future cash flows or other valuation methods to test for impairment. These estimates include the assumed growth rates for future cash flows, the number of years used in the cash flow model, and the discount rate. When impairment charges occur they are recorded inOther (expense) income.
In 2015, we recorded an impairment charge of $49 million, of which $38 million was allocated to indefinite-life intangible assets, $9 million to finite-life intangible assets and $2 million to property, plant and equipment. The impairment charge related mainly to our music cash generating unit (CGU) within our Bell Media segment and resulted from revenue and profitability declines from lower viewership and higher TV content costs. The charge was determined by comparing the carrying value of the CGU to its fair value less costs of disposal. We estimated the fair value of the CGU using both discounted cash flows and market-based valuation models which include five-year cash flow projections from business plans reviewed by senior management for the period of January 1, 2016 to December 31, 2020, using a discount rate of 9.0% and a perpetuity growth rate of nil, as well as market multiple data from public companies and market transactions. The carrying value of our music CGU was $171 million at December 31, 2015.
In 2014, we recorded an impairment charge of $105 million, of which $67 million was allocated to property, plant and equipment and $38 million to indefinite-life intangible assets. The impairment charge related mainly to our Conventional TV CGU within our Bell Media segment and resulted from a softness in the overall Canadian TV advertising market and higher TV content costs. The charge was determined by comparing the carrying value of the CGU to its fair value less costs of disposal, based on five-year expected future discounted cash flows from business plans reviewed by senior management for the period of January 1, 2015 to December 31, 2019 using a discount rate of 9.5% and a perpetuity growth rate of nil. The carrying value of our conventional TV CGU was $327 million at December 31, 2014.
Goodwill impairment testing
We perform an annual test for goodwill impairment in the fourth quarter for each of our CGUs or groups of CGUs to which goodwill is allocated and whenever there is an indication that goodwill might be impaired.
A CGU is the smallest identifiable group of assets that generates cash inflows that are independent of the cash inflows from other assets or groups of assets.
We identify any potential impairment by comparing the carrying value of a CGU or groups of CGUs to its recoverable amount. The recoverable amount of a CGU or groups of CGUs is the higher of its fair value less costs of disposal and its value in use. Fair value less costs of disposal is based on estimates of discounted future cash flows or other valuation methods. Cash flows are projected based on past experience, actual operating results and business plans. When the recoverable amount of a CGU or groups of CGUs is less than its carrying value, the recoverable amount is determined for its identifiable assets and liabilities. The excess of the recoverable amount of the CGU or groups of CGUs over the total of the amounts assigned to its assets and liabilities is the recoverable amount of goodwill.
An impairment charge is deducted from earnings for any excess of the carrying value of goodwill over its recoverable amount. For purposes of impairment testing of goodwill, BCE’s CGUs or groups of CGUs correspond to our reporting segments as disclosed in Note 4 to BCE’s 2015 consolidated financial statements.
Any significant change in each of the estimates used could have a material impact on the calculation of the recoverable amount and resulting impairment charge. As a result, we are unable to reasonably quantify the changes in our overall financial performance if we had used different assumptions.
We cannot predict whether an event that triggers impairment will occur, when it will occur or how it will affect the asset values we have reported.
For the Bell Media group of CGUs, a decrease of (0.3%) in the perpetuity growth rate or an increase of 0.2% in the discount rate, would have resulted in its recoverable amount being equal to its carrying value.
There were no goodwill impairment charges in 2015 or 2014.
BCE Inc. 2015 ANNUAL REPORT 105 |
10 | FINANCIAL MEASURES,
ACCOUNTING POLICIES AND CONTROLS | MD&A | |
DEFERRED TAXES
Deferred tax assets and liabilities are calculated at the tax rates that are expected to apply when the asset or liability is recovered or settled. Both our current and deferred tax assets and liabilities are calculated using tax rates that have been enacted or substantively enacted at the reporting date.
Deferred taxes are provided on temporary differences arising from investments in subsidiaries, joint arrangements and associates, except where we control the timing of the reversal of the temporary difference and it is probable that the temporary difference will not reverse in the foreseeable future.
The amount of deferred tax assets is estimated with consideration given to the timing, sources and amounts of future taxable income.
FAIR VALUE OF FINANCIAL INSTRUMENTS
Certain financial instruments, such as investments in equity securities accounted for as AFS, derivative financial instruments and certain elements of borrowings, are carried in the statements of financial position at fair value, with changes in fair value reflected in the income statements and the statements of comprehensive income. Fair values are estimated by reference to published price quotations or by using other valuation techniques that may include inputs that are not based on observable market data, such as discounted cash flows.
CONTINGENCIES
We become involved in various litigation matters as a part of our business. Pending litigations represent a potential cost to our business. We estimate the amount of the loss by analyzing potential outcomes and assuming various litigation and settlement strategies, based on information that is available at the time.
If the final resolution of a legal or regulatory matter results in a judgment against us or requires us to pay a large settlement, it could have a material adverse effect on our consolidated financial statements in the period in which the judgment or settlement occurs. Any accrual would be charged to earnings and included inTrade payables and other liabilitiesorOther non-current liabilities. Any payment as a result of a judgment or cash settlement would be deducted from cash from operating activities.
ONEROUS CONTRACTS
A provision for onerous contracts is recognized when the unavoidable costs of meeting our obligations under a contract exceed the expected benefits to be received from a contract. The provision is measured at the present value of the lower of the expected cost of terminating the contract and the expected net cost of completing the contract.
JUDGMENTS
POST-EMPLOYMENT BENEFIT PLANS
The determination of the discount rate used to value our post-employment benefit obligations requires judgement. The rate is set by reference to market yields of high quality corporate fixed income investments at the beginning of each fiscal year. Significant judgement is required when setting the criteria for fixed income investments to be included in the population from which the yield curve is derived. The most significant criteria considered for the selection of investments include the size of the issue and credit quality, along with the identification of outliers, which are excluded.
INCOME TAXES
The calculation of income taxes requires judgment in interpreting tax rules and regulations. There are transactions and calculations for which the ultimate tax determination is uncertain. Our tax filings are also subject to audits, the outcome of which could change the amount of current and deferred tax assets and liabilities. Management believes that it has sufficient amounts accrued for outstanding tax matters based on information that currently is available.
Management judgment is used to determine the amounts of deferred tax assets and liabilities and future tax liabilities to be recognized. In particular, judgment is required when assessing the timing of the reversal of temporary differences to which future income tax rates are applied.
MULTIPLE ELEMENT ARRANGEMENTS
Determining the amount of revenue to be recognized for multiple element arrangements requires judgment to establish the separately identifiable components and the allocation of the total price between those components.
CASH GENERATING UNITS
The determination of CGUs or groups of CGUs for the purpose of annual impairment testing requires judgment.
CONTINGENCIES
We accrue a potential loss if we believe a loss is probable and an outflow of resources is likely and can be reasonably estimated, based on information that is available at the time. Any accrual would be charged to earnings and included inTrade payables and other liabilitiesorOther non-current liabilities. Any cash settlement would be deducted from cash from operating activities. We estimate the amount of a loss by analyzing potential outcomes and assuming various litigation and settlement strategies.
The determination of whether a loss is probable from litigation and whether an outflow of resources is likely requires judgment.
| |
| Future changes to accounting standards |
The following new or amended standards issued by the IASB have an effective date after December 31, 2015 and have not yet been adopted by BCE.
| STANDARD | DESCRIPTION | IMPACT | EFFECTIVE DATE |
| Amendments to International Accounting Standard (IAS) 16 – Property, Plant and Equipment and IAS 38 – Intangible Assets | Clarifies that a revenue-based approach to calculate depreciation and amortization generally is not appropriate as it does not reflect the consumption of the economic benefits embodied in the related asset. | The amendments to IAS 16 and IAS 38 are not expected to have a significant impact on our financial statements. | Annual periods beginning on or after January 1, 2016, applied prospectively. |
| 106 BCE Inc. 2015 ANNUAL REPORT |
| | 10 | FINANCIAL MEASURES,
ACCOUNTING POLICIES AND CONTROLS | MD&A |
| STANDARD | DESCRIPTION | IMPACT | EFFECTIVE DATE |
| Amendments to IFRS 11 – Joint Arrangements | Provides guidance on the accounting for acquisitions of interests in joint operations in which the activity constitutes a business, as defined in IFRS 3 – Business Combinations. The amended standard requires the acquirer to apply all of the principles on accounting for business combinations in IFRS 3 and other IFRSs except for any principles that conflict with IFRS 11. | The amendments to IFRS 11 are not expected to have a significant impact on our financial statements. | Annual periods beginning on or after January 1, 2016, applied prospectively. |
| Amendments to IAS 7 – Statement of Cash Flows | Requires enhanced disclosures about changes in liabilities arising from financing activities, including changes from financing cash flows, changes arising from obtaining or losing control of subsidiaries or other businesses, the effect of changes in foreign exchange rates and changes in fair values. | We are currently evaluating the impact of the amendments to IAS 7 on our financial statements. | Annual periods beginning on or after January 1, 2017, applied prospectively. |
| IFRS 15 – Revenue from Contracts with Customers | Establishes principles to record revenues from contracts for the sale of goods or services, unless the contracts are in the scope of IAS 17 – Leases or other IFRSs. Under IFRS 15, revenue is recognized at an amount that reflects the expected consideration receivable in exchange for transferring goods or services to a customer, applying the following five steps: 1. Identify the contract with a customer 2. Identify the performance obligations in the contract3. Determine the transaction price 4. Allocate the transaction price to the performance obligations in the contract5. Recognize revenue when (or as) the entity satisfies a performance obligation The new standard also provides guidance relating to contract costs and for the measurement and recognition of gains and losses on the sale of certain non-financial assets such as property and equipment. Additional disclosures will also be required under the new standard. | IFRS 15 will principally affect the timing of revenue recognition and how we classify revenues as between product and service, how we account for costs to obtain a contract and contract fulfilment costs. Under multiple element arrangements, although the total revenue recognized during the term of a contract will be largely unaffected, the revenue allocated to a delivered item will no longer be limited to the non-contingent amount, which may accelerate the recognition of revenue ahead of the associated cash inflows. This would result in a change in the upfront classification of revenues to an asset on the balance sheet which would be realized over the term of the contract. Although we have made progress in our implementation of IFRS 15, it is not yet possible to make a reliable estimate of the impact of the new standard on our financial statements as we are required to implement significant changes to our systems and processes across the organization in order to collect the new data requirements, as well as compile historical comparatives. It is expected that the changes will be most pronounced in our Bell Wireless segment. | Annual periods beginning on or after January 1, 2018, using either a full retrospective approach for all periods presented in the period of adoption or a modified retrospective approach. |
| IFRS 9 – Financial Instruments | Sets out the requirements for recognizing and measuring financial assets, financial liabilities and some contracts to buy and sell non-financial items. IFRS 9 replaces IAS 39 – Financial Instruments: Recognition and Measurement. The new standard establishes a single classification and measurement approach for financial assets that reflects the business model in which they are managed and their cash flow characteristics. It also provides guidance on an entity’s own credit risk relating to financial liabilities and has modified the hedge accounting model to better link the economics of risk management with its accounting treatment. Additional disclosures will also be required under the new standard. | We are currently evaluating the impact of IFRS 9 on our financial statements. | Annual periods beginning on or after January 1, 2018, with early adoption permitted. |
| IFRS 16 – Leases | Eliminates the distinction between operating and finance leases for lessees, requiring instead that leases be capitalized by recognizing the present value of the lease payments and showing them either as lease assets (right-of-use assets) or together with property, plant and equipment. If lease payments are made over time, an entity recognizes a financial liability representing its obligation to make future lease payments. A depreciation charge for the lease asset is recorded within operating costs and an interest expense on the lease liability is recorded within finance costs. IFRS 16 does not require a lessee to recognize assets and liabilities for short-term leases and leases of low-value assets, nor does it substantially change lease accounting for lessors. | We are currently evaluating the impact of IFRS 16 on our financial statements. | Annual periods beginning on or after January 1, 2019, using either a full retrospective approach for all periods presented in the period of adoption or a modified retrospective approach, with early adoption permitted if an entity has adopted IFRS 15. |
BCE Inc. 2015 ANNUAL REPORT 107 |
10 | FINANCIAL MEASURES,
ACCOUNTING POLICIES AND CONTROLS | MD&A | |
| |
| 10.2 Non-GAAP financial measures and key performance indicators (KPIs) |
This section describes the non-GAAP financial measures and KPIs we use in this MD&A to explain our financial results. It also provides reconciliations of the non-GAAP financial measures to the most comparable IFRS financial measures.
| |
| Adjusted EBITDA and adjusted EBITDA margin |
The terms adjusted EBITDA and adjusted EBITDA margin do not have any standardized meaning under IFRS. Therefore, they are unlikely to be comparable to similar measures presented by other issuers.
We define adjusted EBITDA as operating revenues less operating costs, as shown in BCE’s consolidated income statements. Adjusted EBITDA for BCE’s segments is the same as segment profit as reported in Note 4 to BCE’s 2015 consolidated financial statements. We define adjusted EBITDA margin as adjusted EBITDA divided by operating revenues.
We use adjusted EBITDA and adjusted EBITDA margin to evaluate the performance of our businesses as they reflect their ongoing profitability. We believe that certain investors and analysts use adjusted EBITDA to measure a company’s ability to service debt and to meet other payment obligations or as a common measurement to value companies in the telecommunications industry. We believe that certain investors and analysts also use adjusted EBITDA and adjusted EBITDA margin to evaluate the performance of our businesses. Adjusted EBITDA is also one component in the determination of short-term incentive compensation for all management employees.
Adjusted EBITDA and adjusted EBITDA margin have no directly comparable IFRS financial measure. Alternatively, the following table provides a reconciliation of net earnings to adjusted EBITDA.
| | 2015 | | 2014 | |
Net earnings | 2,730 | | 2,718 | |
Severance, acquisition and other costs | 446 | | 216 | |
Depreciation | 2,890 | | 2,880 | |
Amortization | 530 | | 572 | |
Finance costs | | | | |
Interest expense | 909 | | 929 | |
Interest on post-employment benefit obligations | 110 | | 101 | |
Other expense (income) | 12 | | (42 | ) |
Income taxes | 924 | | 929 | |
Adjusted EBITDA | 8,551 | | 8,303 | |
BCE Operating revenues | 21,514 | | 21,042 | |
Adjusted EBITDA margin | 39.7 | % | 39.5 | % |
| |
| Adjusted net earnings and adjusted EPS |
The terms adjusted net earnings and adjusted EPS do not have any standardized meaning under IFRS. Therefore, they are unlikely to be comparable to similar measures presented by other issuers.
We define adjusted net earnings as net earnings attributable to common shareholders before severance, acquisition and other costs, net (gains) losses on investments, and early debt redemption costs. We define adjusted EPS as adjusted net earnings per BCE common share.
We use adjusted net earnings and adjusted EPS, and we believe that certain investors and analysts use these measures, among other ones, to assess the performance of our businesses without the effects of severance, acquisition and other costs, net (gains) losses on investments, and early debt redemption costs, net of tax and NCI. We exclude these items because they affect the comparability of our financial results and could potentially distort the analysis of trends in business performance. Excluding these items does not imply they are non-recurring.
| 108 BCE Inc. 2015 ANNUAL REPORT |
| | 10 | FINANCIAL MEASURES,
ACCOUNTING POLICIES AND CONTROLS | MD&A |
The most comparable IFRS financial measures are net earnings attributable to common shareholders and EPS. The following table is a reconciliation of net earnings attributable to common shareholders and EPS to adjusted net earnings on a consolidated basis and per BCE common share (adjusted EPS), respectively.
| 2015 | 2014 |
| | TOTAL | | PER SHARE | | TOTAL | | PER SHARE | |
Net earnings attributable to common shareholders | 2,526 | | 2.98 | | 2,363 | | 2.98 | |
Severance, acquisition and other costs | 327 | | 0.38 | | 148 | | 0.18 | |
Net (gains) losses on investments | (21 | ) | (0.02 | ) | (8 | ) | (0.01 | ) |
Early debt redemption costs | 13 | | 0.02 | | 21 | | 0.03 | |
Adjusted net earnings | 2,845 | | 3.36 | | 2,524 | | 3.18 | |
| |
| Free cash flow and free cash flow per share |
The terms free cash flow and free cash flow per share do not have any standardized meaning under IFRS. Therefore, they are unlikely to be comparable to similar measures presented by other issuers.
As of November 1, 2014, BCE’s free cash flow includes 100% of Bell Aliant’s free cash flow rather than cash dividends received from Bell Aliant. We define free cash flow as cash flows from operating activities, excluding acquisition and other costs paid (which include significant litigation costs) and voluntary pension funding, less capital expenditures, preferred share dividends and dividends paid by subsidiaries to NCI.
Prior to November 1, 2014, free cash flow was defined as cash flows from operating activities, excluding acquisition and other costs paid (which include significant litigation costs) and voluntary pension funding, plus dividends received from Bell Aliant, less capital expenditures, preferred share dividends, dividends paid by subsidiaries to NCI and Bell Aliant free cash flow.
We define free cash flow per share as free cash flow divided by the average number of common shares outstanding.
We consider free cash flow and free cash flow per share to be important indicators of the financial strength and performance of our businesses because they show how much cash is available to pay dividends, repay debt and reinvest in our company.
We believe that certain investors and analysts use free cash flow to value a business and its underlying assets. We believe that certain investors and analysts also use free cash flow and free cash flow per share to evaluate the financial strength and performance of our businesses.
The most comparable IFRS financial measure is cash flows from operating activities. The following table is a reconciliation of cash flows from operating activities to free cash flow on a consolidated basis.
| | 2015 | | 2014 | |
Cash flows from operating activities | 6,274 | | 6,241 | |
Bell Aliant dividends to BCE | – | | 95 | |
Capital expenditures | (3,626 | ) | (3,717 | ) |
Cash dividends paid on preferred shares | (150 | ) | (134 | ) |
Cash dividends paid by subsidiaries to non-controlling interest | (41 | ) | (145 | ) |
Acquisition and other costs paid | 292 | | 131 | |
Voluntary defined benefit pension plan contribution | 250 | | 350 | |
Bell Aliant free cash flow | – | | (77 | ) |
Free cash flow | 2,999 | | 2,744 | |
Average number of common shares outstanding (millions) | 847.1 | | 793.7 | |
Free cash flow per share | 3.54 | | 3.46 | |
BCE Inc. 2015 ANNUAL REPORT 109 |
10 | FINANCIAL MEASURES,
ACCOUNTING POLICIES AND CONTROLS | MD&A | |
The term net debt does not have any standardized meaning under IFRS. Therefore, it is unlikely to be comparable to similar measures presented by other issuers.
We define net debt as debt due within one year plus long-term debt and 50% of preferred shares, less cash and cash equivalents, as shown in BCE’s consolidated statement of financial position. We include 50% of outstanding preferred shares in our net debt as it is consistent with the treatment by certain credit rating agencies.
We consider net debt to be an important indicator of the company’s financial leverage because it represents the amount of debt that is not covered by available cash and cash equivalents. We believe that certain investors and analysts use net debt to determine a company’s financial leverage. Net debt has no directly comparable IFRS financial measure, but rather is calculated using several asset and liability categories from the statements of financial position, as shown in the following table.
| | 2015 | | 2014 | |
Debt due within one year | 4,895 | | 3,743 | |
Long-term debt | 15,390 | | 16,355 | |
50% of outstanding preferred shares | 2,002 | | 2,002 | |
Cash and cash equivalents | (613 | ) | (566 | ) |
Net debt | 21,674 | | 21,534 | |
The net debt leverage ratio does not have any standardized meaning under IFRS. Therefore, it is unlikely to be comparable to similar measures presented by other issuers. We use, and believe that certain investors and analysts use, the net debt leverage ratio as a measure of financial leverage.
The net debt leverage ratio represents net debt divided by adjusted EBITDA.
| |
| Adjusted EBITDA to net interest expense ratio |
The ratio of adjusted EBITDA to net interest expense does not have any standardized meaning under IFRS. Therefore, it is unlikely to be comparable to similar measures presented by other issuers. We use, and believe that certain investors and analysts use, the adjusted EBITDA to net interest expense ratio as a measure of financial health of the company.
The adjusted EBITDA to net interest expense ratio represents adjusted EBITDA divided by net interest expense. Net interest expense represents net interest expense as shown in our statements of cash flows, plus 50% of declared preferred share dividends as shown in our income statements.
In addition to the non-GAAP financial measures previously described, we use a number of KPIs to measure the success of our strategic imperatives. These KPIs are not accounting measures and may not be comparable to similar measures presented by other issuers.
| KPI | DEFINITION |
| Capital intensity | Capital expenditures divided by operating revenues. |
| ARPU | Average revenue per user or subscriber represents the measurement of certain service revenues divided by the average subscriber base for the specified period. |
| Churn | Churn is the rate at which existing subscribers cancel their services, expressed as a percentage. Churn is calculated as the number of subscribers disconnected divided by the average subscriber base. It is a measure of monthly customer turnover. |
| COA | COA is also referred to as subscriber acquisition costs. COA represents the total cost associated with acquiring a customer and includes costs such as hardware discounts, marketing and distribution costs. This measure is expressed per gross activation during the period. |
| Dividend payout ratio | Dividends paid on common shares divided by free cash flow. |
| 110 BCE Inc. 2015 ANNUAL REPORT |
| | 10 | FINANCIAL MEASURES,
ACCOUNTING POLICIES AND CONTROLS | MD&A |
| |
| 10.3 Effectiveness of internal controls |
| Disclosure controls and procedures |
Our disclosure controls and procedures are designed to provide reasonable assurance that information required to be disclosed by us in reports filed or submitted under Canadian and U.S. securities laws is recorded, processed, summarized and reported within the time periods specified under those laws, and include controls and procedures that are designed to ensure that the information is accumulated and communicated to management, including BCE’s President and CEO and Executive Vice-President and CFO, to allow timely decisions regarding required disclosure.
As at December 31, 2015, management evaluated, under the supervision of and with the participation of the CEO and the CFO, the effectiveness of our disclosure controls and procedures, as defined in Rule 13a-15(e) under the U.S.Securities Exchange Act of 1934, as amended, and under National Instrument 52-109 –Certification of Disclosure in Issuers’ Annual and Interim Filings.
Based on that evaluation, the CEO and CFO concluded that our disclosure controls and procedures were effective as at December 31, 2015.
| |
| Internal control over financial reporting |
Management is responsible for establishing and maintaining adequate internal control over financial reporting, as defined in Rule 13a-15(f) under the U.S.Securities Exchange Act of 1934, as amended, and under National Instrument 52-109. Our internal control over financial reporting is a process designed under the supervision of the CEO and CFO to provide reasonable assurance regarding the reliability of financial reporting and the preparation of financial statements for external purposes in accordance with IFRS. However, because of its inherent limitations, internal control over financial reporting may not prevent or detect misstatements on a timely basis.
Management evaluated, under the supervision of and with the participation of the CEO and the CFO, the effectiveness of our internal control over financial reporting as at December 31, 2015, based on the criteria established in theInternal Control – Integrated Framework (2013)issued by the Committee of Sponsoring Organizations of the Treadway Commission (COSO).
Based on that evaluation, the CEO and CFO concluded that our internal control over financial reporting was effective as at December 31, 2015.
There have been no changes during the year ended December 31, 2015 in our internal control over financial reporting that have materially affected, or are reasonably likely to materially affect, our internal control over financial reporting.
BCE Inc. 2015 ANNUAL REPORT 111 |
| REPORTS ON INTERNAL CONTROL | |
Reports on internal control
Management’s report on internal control over financial reporting
The management of BCE Inc. (BCE) is responsible for establishing and maintaining adequate internal control over financial reporting. Our internal control over financial reporting is a process designed under the supervision of the President and Chief Executive Officer and the Executive Vice-President and Chief Financial Officer of BCE to provide reasonable assurance regarding the reliability of financial reporting and the preparation of financial statements for external purposes in accordance with International Financial Reporting Standards (IFRS) as issued by the International Accounting Standards Board (IASB).
Due to its inherent limitations, internal control over financial reporting may not prevent or detect misstatements on a timely basis. Also, projections of any evaluation of the effectiveness of internal control over financial reporting to future periods are subject to the risk that the controls may become inadequate because of changes in conditions, or that the degree of compliance with the policies or procedures may deteriorate.
Management evaluated, under the supervision of and with the participation of the President and Chief Executive Officer and the Executive Vice-President and Chief Financial Officer, the effectiveness of our internal control over financial reporting as at December 31, 2015, based on the criteria established inInternal Control – Integrated Framework (2013)issued by the Committee of Sponsoring Organizations of the Treadway Commission (COSO).
Based on that evaluation, the President and Chief Executive Officer and the Executive Vice-President and Chief Financial Officer concluded that our internal control over financial reporting was effective as at December 31, 2015. There were no material weaknesses that have been identified by BCE’s management in internal control over financial reporting as at December 31, 2015.
Our internal control over financial reporting as at December 31, 2015 has been audited by Deloitte LLP, Independent Registered Public Accounting Firm, who also audited our consolidated financial statements for the year ended December 31, 2015. Deloitte LLP issued an unqualified opinion on the effectiveness of our internal control over financial reporting as at December 31, 2015.
(signed) George A. Cope
President and Chief Executive Officer
(signed) Glen LeBlanc
Executive Vice-President and Chief Financial Officer
(signed) Thierry Chaumont
Senior Vice-President and Controller
March 3, 2016
| 112 BCE Inc. 2015 ANNUAL REPORT |
| | REPORTS ON INTERNAL CONTROL |
Report of independent registered public accounting firm
To the Board of Directors and Shareholders of BCE Inc.
We have audited the internal control over financial reporting of BCE Inc. and subsidiaries (the “Company”) as of December 31, 2015, based on the criteria established in Internal Control – Integrated Framework (2013) issued by the Committee of Sponsoring Organizations of the Treadway Commission. The Company’s management is responsible for maintaining effective internal control over financial reporting and for its assessment of the effectiveness of internal control over financial reporting, included in the accompanying Management Report on Internal Control over Financial Reporting. Our responsibility is to express an opinion on the Company’s internal control over financial reporting based on our audit.
We conducted our audit in accordance with the standards of the Public Company Accounting Oversight Board (United States). Those standards require that we plan and perform the audit to obtain reasonable assurance about whether effective internal control over financial reporting was maintained in all material respects. Our audit included obtaining an understanding of internal control over financial reporting, assessing the risk that a material weakness exists, testing and evaluating the design and operating effectiveness of internal control based on the assessed risk, and performing such other procedures as we considered necessary in the circumstances. We believe that our audit provides a reasonable basis for our opinion.
A company’s internal control over financial reporting is a process designed by, or under the supervision of, the company’s principal executive and principal financial officers, or persons performing similar functions, and effected by the company’s board of directors, management, and other personnel to provide reasonable assurance regarding the reliability of financial reporting and the preparation of financial statements for external purposes in accordance with International Financial Reporting Standards as issued by the International Accounting Standards Board. A company’s internal control over financial reporting includes those policies and procedures that (1) pertain to the maintenance of records that, in reasonable detail, accurately and fairly reflect the transactions and dispositions of the assets of the company; (2) provide reasonable assurance that transactions are recorded as necessary to permit preparation of financial statements in accordance with International Financial Reporting Standards as issued by the International Accounting Standards Board, and that receipts and expenditures of the company are being made only in accordance with authorizations of management and directors of the company; and (3) provide reasonable assurance regarding prevention or timely detection of unauthorized acquisition, use, or disposition of the company’s assets that could have a material effect on the financial statements.
Because of the inherent limitations of internal control over financial reporting, including the possibility of collusion or improper management override of controls, material misstatements due to error or fraud may not be prevented or detected on a timely basis. Also, projections of any evaluation of the effectiveness of the internal control over financial reporting to future periods are subject to the risk that the controls may become inadequate because of changes in conditions, or that the degree of compliance with the policies or procedures may deteriorate.
In our opinion, the Company maintained, in all material respects, effective internal control over financial reporting as of December 31, 2015, based on the criteria established in Internal Control – Integrated Framework (2013) issued by the Committee of Sponsoring Organizations of the Treadway Commission.
We have also audited, in accordance with Canadian generally accepted auditing standards and the standards of the Public Company Accounting Oversight Board (United States), the consolidated financial statements as of and for the year ended December 31, 2015 of the Company and our report dated March 3, 2016 expressed an unmodified/unqualified opinion on those financial statements.
/s/ Deloitte LLP[1]
Montréal, Canada
March 3, 2016
(1)CPA auditor, CA, public accountancy permit No. A104630
BCE Inc. 2015 ANNUAL REPORT 113 |
| CONSOLIDATED FINANCIAL STATEMENTS | |
Consolidated financial statements
Management’s responsibility for financial reporting
These financial statements form the basis for all of the financial information that appears in this annual report.
The financial statements and all of the information in this annual report are the responsibility of the management of BCE Inc. (BCE) and have been reviewed and approved by the board of directors. The board of directors is responsible for ensuring that management fulfills its financial reporting responsibilities. Deloitte LLP, Independent Registered Public Accounting Firm, have audited the financial statements.
Management has prepared the financial statements according to International Financial Reporting Standards (IFRS) as issued by the International Accounting Standards Board. Under these principles, management has made certain estimates and assumptions that are reflected in the financial statements and notes. Management believes that these financial statements fairly present BCE’s consolidated financial position, results of operations and cash flows.
Management has a system of internal controls designed to provide reasonable assurance that the financial statements are accurate and complete in all material respects. This is supported by an internal audit group that reports to the Audit Committee, and includes communication with employees about policies for ethical business conduct. Management believes that the internal controls provide reasonable assurance that our financial records are reliable and form a proper basis for preparing the financial statements, and that our assets are properly accounted for and safeguarded.
The board of directors has appointed an Audit Committee, which is made up of unrelated and independent directors. The Audit Committee’s responsibilities include reviewing the financial statements and other information in this annual report, and recommending them to the board of directors for approval. You will find a description of the Audit Committee’s other responsibilities on page 158 of this annual report. The internal auditors and the shareholders’ auditors have free and independent access to the Audit Committee.
(signed) George A. Cope
President and Chief Executive Officer
(signed) Glen LeBlanc
Executive Vice-President and Chief Financial Officer
(signed) Thierry Chaumont
Senior Vice-President and Controller
March 3, 2016
| 114 BCE Inc. 2015 ANNUAL REPORT |
| | CONSOLIDATED FINANCIAL STATEMENTS |
Report of independent registered public accounting firm
To the Board of Directors and Shareholders of BCE Inc.
We have audited the accompanying consolidated financial statements of BCE Inc. and its subsidiaries (the “Company”), which comprise the consolidated statements of financial position as at December 31, 2015 and December 31, 2014, and the consolidated income statements, consolidated statements of comprehensive income, consolidated statements of changes in equity, and consolidated statements of cash flows for the years then ended, and a summary of significant accounting policies and other explanatory information.
MANAGEMENT’S RESPONSIBILITY FOR THE CONSOLIDATED FINANCIAL STATEMENTS
Management is responsible for the preparation and fair presentation of these consolidated financial statements in accordance with International Financial Reporting Standards as issued by the International Accounting Standards Board, and for such internal control as management determines is necessary to enable the preparation of consolidated financial statements that are free from material misstatement, whether due to fraud or error.
AUDITOR’S RESPONSIBILITY
Our responsibility is to express an opinion on these consolidated financial statements based on our audits. We conducted our audits in accordance with Canadian generally accepted auditing standards and the standards of the Public Company Accounting Oversight Board (United States). Those standards require that we comply with ethical requirements and plan and perform the audit to obtain reasonable assurance about whether the consolidated financial statements are free from material misstatement.
An audit involves performing procedures to obtain audit evidence about the amounts and disclosures in the consolidated financial statements. The procedures selected depend on the auditor’s judgment, including the assessment of the risks of material misstatement of the consolidated financial statements, whether due to fraud or error. In making those risk assessments, the auditor considers internal control relevant to the entity’s preparation and fair presentation of the consolidated financial statements in order to design audit procedures that are appropriate in the circumstances. An audit also includes evaluating the appropriateness of accounting policies used and the reasonableness of accounting estimates made by management, as well as evaluating the overall presentation of the consolidated financial statements.
We believe that the audit evidence we have obtained in our audits is sufficient and appropriate to provide a basis for our audit opinion.
OPINION
In our opinion, the consolidated financial statements present fairly, in all material respects, the financial position of BCE Inc. and its subsidiaries as at December 31, 2015 and December 31, 2014, and their financial performance and their cash flows for the years then ended in accordance with International Financial Reporting Standards as issued by the International Accounting Standards Board.
OTHER MATTER
We have also audited, in accordance with the standards of the Public Company Accounting Oversight Board (United States), the Company’s internal control over financial reporting as of December 31, 2015, based on the criteria established inInternal Control – Integrated Framework (2013)issued by the Committee of Sponsoring Organizations of the Treadway Commission and our report dated March 3, 2016 expressed an unqualified opinion on the Company’s internal control over financial reporting.
/s/ Deloitte LLP[1]
Montréal, Canada
March 3, 2016
(1)CPA auditor, CA, public accountancy permit No. A104630
BCE Inc. 2015 ANNUAL REPORT 115 |
| CONSOLIDATED FINANCIAL STATEMENTS | |
| |
| Consolidated income statements |
FOR THE YEAR ENDED DECEMBER 31 | | | | | | |
(IN MILLIONS OF CANADIAN DOLLARS, EXCEPT SHARE AMOUNTS) | NOTE | | 2015 | | 2014 | |
Operating revenues | 4 | | 21,514 | | 21,042 | |
Operating costs | 4, 5 | | (12,963 | ) | (12,739 | ) |
Severance, acquisition and other costs | 4, 6 | | (446 | ) | (216 | ) |
Depreciation | 4, 13 | | (2,890 | ) | (2,880 | ) |
Amortization | 4, 14 | | (530 | ) | (572 | ) |
Finance costs | | | | | | |
Interest expense | 7 | | (909 | ) | (929 | ) |
Interest on post-employment benefit obligations | 21 | | (110 | ) | (101 | ) |
Other (expense) income | 8 | | (12 | ) | 42 | |
Income taxes | 9 | | (924 | ) | (929 | ) |
Net earnings | | | 2,730 | | 2,718 | |
Net earnings attributable to: | | | | | | |
Common shareholders | | | 2,526 | | 2,363 | |
Preferred shareholders | | | 152 | | 137 | |
Non-controlling interest | 29 | | 52 | | 218 | |
Net earnings | | | 2,730 | | 2,718 | |
Net earnings per common share | | | | | | |
Basic | 10 | | 2.98 | | 2.98 | |
Diluted | 10 | | 2.98 | | 2.97 | |
Average number of common shares outstanding – basic (millions) | | | 847.1 | | 793.7 | |
| |
| Consolidated statements of comprehensive income |
FOR THE YEAR ENDED DECEMBER 31 | | | | | | |
(IN MILLIONS OF CANADIAN DOLLARS) | NOTE | | 2015 | | 2014 | |
Net earnings | | | 2,730 | | 2,718 | |
Other comprehensive income (loss), net of income taxes | | | | | | |
Items that will be subsequently reclassified to net earnings | | | | | | |
Net change in value of available-for-sale (AFS) financial assets, net of income taxes of nil for 2015 and 2014 | | | 23 | | 58 | |
Net change in value of derivatives designated as cash flow hedges, net of income taxes of ($2) million and ($13) million for 2015 and 2014, respectively | | | 1 | | 34 | |
Items that will not be reclassified to net earnings | | | | | | |
Actuarial gains (losses) on post-employment benefit plans, net of income taxes of ($161) million and $253 million for 2015 and 2014, respectively | 21 | | 429 | | (685 | ) |
Other comprehensive income (loss) | | | 453 | | (593 | ) |
Total comprehensive income | | | 3,183 | | 2,125 | |
Total comprehensive income attributable to: | | | | | | |
Common shareholders | | | 2,977 | | 1,862 | |
Preferred shareholders | | | 152 | | 137 | |
Non-controlling interest | 29 | | 54 | | 126 | |
Total comprehensive income | | | 3,183 | | 2,125 | |
| 116 BCE Inc. 2015 ANNUAL REPORT |
| | CONSOLIDATED FINANCIAL STATEMENTS |
| |
| Consolidated statements of financial position |
(IN MILLIONS OF CANADIAN DOLLARS) | NOTE | | DECEMBER 31, 2015 | | DECEMBER 31, 2014 | |
ASSETS | | | | | | |
Current assets | | | | | | |
Cash | | | 100 | | 142 | |
Cash equivalents | | | 513 | | 424 | |
Trade and other receivables | 11 | | 3,009 | | 3,069 | |
Inventory | 12 | | 416 | | 333 | |
Prepaid expenses | | | 393 | | 379 | |
Other current assets | | | 377 | | 201 | |
Total current assets | | | 4,808 | | 4,548 | |
Non-current assets | | | | | | |
Property, plant and equipment | 13 | | 21,630 | | 21,327 | |
Intangible assets | 14 | | 11,176 | | 10,224 | |
Deferred tax assets | 9 | | 89 | | 162 | |
Investments in associates and joint ventures | 3, 15 | | 1,119 | | 776 | |
Other non-current assets | 16 | | 794 | | 875 | |
Goodwill | 17 | | 8,377 | | 8,385 | |
Total non-current assets | | | 43,185 | | 41,749 | |
Total assets | | | 47,993 | | 46,297 | |
LIABILITIES | | | | | | |
Current liabilities | | | | | | |
Trade payables and other liabilities | 18 | | 4,287 | | 4,398 | |
Interest payable | | | 148 | | 145 | |
Dividends payable | | | 576 | | 534 | |
Current tax liabilities | | | 86 | | 269 | |
Debt due within one year | 19 | | 4,895 | | 3,743 | |
Total current liabilities | | | 9,992 | | 9,089 | |
Non-current liabilities | | | | | | |
Long-term debt | 20 | | 15,390 | | 16,355 | |
Deferred tax liabilities | 9 | | 1,824 | | 1,321 | |
Post-employment benefit obligations | 21 | | 2,038 | | 2,772 | |
Other non-current liabilities | 22 | | 1,420 | | 1,521 | |
Total non-current liabilities | | | 20,672 | | 21,969 | |
Total liabilities | | | 30,664 | | 31,058 | |
Commitments and contingencies | 27 | | | | | |
EQUITY | | | | | | |
Equity attributable to BCE shareholders | | | | | | |
Preferred shares | 24, 25 | | 4,004 | | 4,004 | |
Common shares | 24, 25 | | 18,100 | | 16,717 | |
Contributed surplus | 24, 25 | | 1,150 | | 1,141 | |
Accumulated other comprehensive income | | | 119 | | 97 | |
Deficit | 24 | | (6,350 | ) | (7,013 | ) |
Total equity attributable to BCE shareholders | | | 17,023 | | 14,946 | |
Non-controlling interest | 24, 29 | | 306 | | 293 | |
Total equity | | | 17,329 | | 15,239 | |
Total liabilities and equity | | | 47,993 | | 46,297 | |
BCE Inc. 2015 ANNUAL REPORT 117 |
| CONSOLIDATED FINANCIAL STATEMENTS | |
| |
| Consolidated statements of changes in equity |
FOR THE YEAR ENDED DECEMBER 31, 2015
(IN MILLIONS OF CANADIAN DOLLARS) | | | ATTRIBUTABLE TO BCE SHAREHOLDERS | | | | | |
| | | | | | | | | ACCUMU- | | | | | | | | | |
| | | | | | | | | LATED | | | | | | | | | |
| | | | | | | | | OTHER | | | | | | NON- | | | |
| | | | | | | CONTRI- | | COMPRE- | | | | | | CONTROL- | | | |
| | | PREFERRED | | COMMON | | BUTED | | HENSIVE | | | | | | LING | | TOTAL | |
| NOTE | | SHARES | | SHARES | | SURPLUS | | INCOME | | DEFICIT | | TOTAL | | INTEREST | | EQUITY | |
Balance at January 1, 2015 | | | 4,004 | | 16,717 | | 1,141 | | 97 | | (7,013 | ) | 14,946 | | 293 | | 15,239 | |
Net earnings | | | – | | – | | – | | – | | 2,678 | | 2,678 | | 52 | | 2,730 | |
Other comprehensive income | | | – | | – | | – | | 22 | | 429 | | 451 | | 2 | | 453 | |
Total comprehensive income | | | – | | – | | – | | 22 | | 3,107 | | 3,129 | | 54 | | 3,183 | |
Common shares issued under employee stock option plan | 25 | | – | | 96 | | (7 | ) | – | | – | | 89 | | – | | 89 | |
Common shares issued under employee savings plan | 25 | | – | | 128 | | – | | – | | – | | 128 | | – | | 128 | |
Other share-based compensation | | | – | | – | | 16 | | – | | (53 | ) | (37 | ) | – | | (37 | ) |
Dividends declared on BCE common and preferred shares | | | – | | – | | – | | – | | (2,365 | ) | (2,365 | ) | – | | (2,365 | ) |
Dividends declared by subsidiaries to non-controlling interest | | | – | | – | | – | | – | | – | | – | | (41 | ) | (41 | ) |
Common shares issued under bought deal offering | 25 | | – | | 863 | | – | | – | | (26 | ) | 837 | | – | | 837 | |
Common shares issued for the acquisition of Glentel Inc. | 3, 25 | | – | | 296 | | – | | – | | – | | 296 | | – | | 296 | |
Balance at December 31, 2015 | | | 4,004 | | 18,100 | | 1,150 | | 119 | | (6,350 | ) | 17,023 | | 306 | | 17,329 | |
FOR THE YEAR ENDED DECEMBER 31, 2014
(IN MILLIONS OF CANADIAN DOLLARS) | | | ATTRIBUTABLE TO BCE SHAREHOLDERS | | | | | |
| | | | | | | | | ACCUMU- | | | | | | | | | |
| | | | | | | | | LATED | | | | | | | | | |
| | | | | | | | | OTHER | | | | | | | | | |
| | | | | | | | | COMPRE- | | | | | | NON- | | | |
| | | | | | | CONTRI- | | HENSIVE | | | | | | CONTROL- | | | |
| | | PREFERRED | | COMMON | | BUTED | | INCOME | | | | | | LING | | TOTAL | |
| NOTE | | SHARES | | SHARES | | SURPLUS | | (LOSS) | | DEFICIT | | TOTAL | | INTEREST | | EQUITY | |
Balance at January 1, 2014 | | | 3,395 | | 13,629 | | 2,615 | | 14 | | (4,642 | ) | 15,011 | | 1,239 | | 16,250 | |
Net earnings | | | – | | – | | – | | – | | 2,500 | | 2,500 | | 218 | | 2,718 | |
Other comprehensive (loss) income | | | – | | – | | – | | 90 | | (591 | ) | (501 | ) | (92 | ) | (593 | ) |
Total comprehensive income | | | – | | – | | – | | 90 | | 1,909 | | 1,999 | | 126 | | 2,125 | |
Common shares issued under employee stock option plan | 25 | | – | | 53 | | (4 | ) | – | | – | | 49 | | – | | 49 | |
Common shares issued under employee savings plan | 25 | | – | | 107 | | – | | – | | – | | 107 | | – | | 107 | |
Other share-based compensation | | | – | | – | | 29 | | – | | (4 | ) | 25 | | 7 | | 32 | |
Dividends declared on BCE common and preferred shares | | | – | | – | | – | | – | | (2,098 | ) | (2,098 | ) | – | | (2,098 | ) |
Dividends declared by subsidiaries to non-controlling interest | | | – | | – | | – | | – | | – | | – | | (145 | ) | (145 | ) |
Privatization of Bell Aliant | 24, 25 | | 609 | | 2,928 | | (1,499 | ) | (7 | ) | (2,143 | ) | (112 | ) | (877 | ) | (989 | ) |
Privatization transaction costs | 24 | | – | | – | | – | | – | | (35 | ) | (35 | ) | (5 | ) | (40 | ) |
Other | | | – | | – | | – | | – | | – | | – | | (52 | ) | (52 | ) |
Balance at December 31, 2014 | | | 4,004 | | 16,717 | | 1,141 | | 97 | | (7,013 | ) | 14,946 | | 293 | | 15,239 | |
| 118 BCE Inc. 2015 ANNUAL REPORT |
| | CONSOLIDATED FINANCIAL STATEMENTS |
| |
| Consolidated statements of cash flows |
FOR THE YEAR ENDED DECEMBER 31 | | | | | | |
(IN MILLIONS OF CANADIAN DOLLARS) | NOTE | | 2015 | | 2014 | |
Cash flows from operating activities | | | | | | |
Net earnings | | | 2,730 | | 2,718 | |
Adjustments to reconcile net earnings to cash flows from operating activities | | | | | | |
Severance, acquisition and other costs | 6 | | 446 | | 216 | |
Depreciation and amortization | 13, 14 | | 3,420 | | 3,452 | |
Post-employment benefit plans cost | 21 | | 391 | | 377 | |
Net interest expense | | | 900 | | 921 | |
Gains on investments | 8 | | (72 | ) | (10 | ) |
Income taxes | 9 | | 924 | | 929 | |
Contributions to post-employment benefit plans | 21 | | (566 | ) | (683 | ) |
Payments under other post-employment benefit plans | 21 | | (75 | ) | (73 | ) |
Severance and other costs paid | | | (190 | ) | (190 | ) |
Interest paid | | | (911 | ) | (907 | ) |
Income taxes paid (net of refunds) | | | (672 | ) | (743 | ) |
Acquisition and other costs paid | | | (292 | ) | (131 | ) |
Net change in operating assets and liabilities | | | 241 | | 365 | |
Cash flows from operating activities | | | 6,274 | | 6,241 | |
Cash flows used in investing activities | | | | | | |
Capital expenditures | 4 | | (3,626 | ) | (3,717 | ) |
Business acquisitions | 3 | | (311 | ) | (18 | ) |
Business dispositions | 3 | | 409 | | 720 | |
Acquisition of spectrum licences | 14 | | (535 | ) | (566 | ) |
Other investing activities | | | (51 | ) | 11 | |
Cash flows used in investing activities | | | (4,114 | ) | (3,570 | ) |
Cash flows used in financing activities | | | | | | |
Increase in notes payable | | | 76 | | 469 | |
Issue of long-term debt | 20 | | 1,498 | | 1,428 | |
Repayment of long-term debt | 20 | | (2,084 | ) | (1,113 | ) |
Privatization of Bell Aliant | 24 | | – | | (989 | ) |
Issue of common shares | 25 | | 952 | | 49 | |
Common shares issuance cost | 25 | | (35 | ) | – | |
Repurchase of shares for settlement of share-based payments | 26 | | (138 | ) | (83 | ) |
Cash dividends paid on common shares | | | (2,169 | ) | (1,893 | ) |
Cash dividends paid on preferred shares | | | (150 | ) | (134 | ) |
Cash dividends paid by subsidiaries to non-controlling interest | | | (41 | ) | (145 | ) |
Other financing activities | | | (22 | ) | (29 | ) |
Cash flows used in financing activities | | | (2,113 | ) | (2,440 | ) |
Net decrease in cash | | | (42 | ) | (78 | ) |
Cash at beginning of year | | | 142 | | 220 | |
Cash at end of year | | | 100 | | 142 | |
Net increase in cash equivalents | | | 89 | | 309 | |
Cash equivalents at beginning of year | | | 424 | | 115 | |
Cash equivalents at end of year | | | 513 | | 424 | |
BCE Inc. 2015 ANNUAL REPORT 119 |
| NOTES TO CONSOLIDATED FINANCIAL STATEMENTS | |
Notes to consolidated financial statements
We, us,our, BCE andthe companymean, as the context may require, either BCE Inc. or, collectively, BCE Inc., its subsidiaries, joint arrangements and associates.Bell Aliant means, as the context may require, until December 31, 2014, either Bell Aliant Inc. or, collectively, Bell Aliant Inc., its subsidiaries and associates, or after December 31, 2014 and up to, and including, June 30, 2015, either Bell Aliant Regional Communications Inc. or, collectively, Bell Aliant Regional Communications Inc., its subsidiaries and associates.
| |
| Note 1 Corporate information |
BCE is incorporated and domiciled in Canada. BCE’s head office is located at 1, Carrefour Alexander-Graham-Bell, Verdun, Québec, Canada. BCE is a telecommunications and media company providing wireless, wireline, Internet and television (TV) services to residential, business and wholesale customers in Canada. Our Bell Media segment provides conventional, specialty and pay TV, digital media and radio broadcasting services to customers across Canada and out-of-home advertising services. The consolidated financial statements (financial statements) were approved by BCE’s board of directors on March 3, 2016.
| |
| Note 2 Significant accounting policies |
a) Basis of presentation
The financial statements were prepared in accordance with International Financial Reporting Standards (IFRS), as issued by the International Accounting Standards Board (IASB). The financial statements have been prepared on a historical cost basis, except for certain financial instruments that are measured at fair value as described in our accounting policies.
All amounts are in millions of Canadian dollars, except where noted.
FUNCTIONAL CURRENCY
The financial statements are presented in Canadian dollars, the company’s functional currency.
| |
| b) Basis of consolidation |
We consolidate the financial statements of all of our subsidiaries. Subsidiaries are entities we control, where control is achieved when the company is exposed or has the right to variable returns from its involvement with the investee and has the current ability to direct the activities of the investee that significantly affect the investee’s returns.
The results of subsidiaries acquired during the year are consolidated from the date of acquisition and the results of subsidiaries sold during the year are deconsolidated from the date of disposal. Where necessary, adjustments are made to the financial statements of acquired subsidiaries to conform their accounting policies to ours. All intercompany transactions, balances, income and expenses are eliminated on consolidation.
Changes in BCE’s ownership interest in a subsidiary that do not result in a change of control are accounted for as equity transactions, with no effect on net earnings or on other comprehensive income.
We recognize revenues from the sale of products or the rendering of services when they are earned; specifically when all the following conditions are met:
- the significant risks and rewards of ownership are transferredto customers and we retain neither continuing managerialinvolvement nor effective control
- there is clear evidence that an arrangement exists
- the amount of revenues and related costs can be measured reliably
- it is probable that the economic benefits associated with the transaction will flow to the company
In particular, we recognize:
- fees for local, long distance and wireless services when we provide the services
- other fees, such as network access fees, licence fees, hosting fees, maintenance fees and standby fees over the term of the contract
- subscriber revenues when customers receive the service
- revenues from the sale of equipment when the equipment is delivered and accepted by customers
- revenues on long-term contracts as services are provided, equipment is delivered and accepted, and contract milestones are met
- advertising revenue, net of agency commissions, when advertisements are aired on radio or TV, posted on our website or appear on the company’s advertising panels and street furniture
| 120 BCE Inc. 2015 ANNUAL REPORT |
| | NOTES TO CONSOLIDATED FINANCIAL STATEMENTS |
We measure revenues at the fair value of the arrangement consideration. We record payments we receive in advance, including upfront non-refundable payments, as deferred revenues until we provide the service or deliver the product to customers. Deferred revenues are presented in Trade payables and other liabilitiesor in Other non-current liabilitieson the consolidated statements of financial position (statements of financial position).
Revenues are reduced for customer rebates and allowances and exclude sales and other taxes we collect from our customers.
We expense subscriber acquisition costs when the related services are activated.
MULTIPLE ELEMENT ARRANGEMENTS
We enter into arrangements that may include the sale of a number of products and services together, primarily to our wireless and business customers. When two or more products or services have value to our customers on a stand-alone basis, we separately account for each product or service according to the methods previously described. The total price to the customer is allocated to each product or service based on its relative fair value. When an amount allocated to a delivered item is contingent upon the delivery of additional items or meeting specified performance conditions, the amount allocated to that delivered item is limited to the non-contingent amount.
If the conditions to account for each product or service separately are not met, we recognize revenues proportionately over the term of the sale agreement.
SUBCONTRACTED SERVICES
We may enter into arrangements with subcontractors and others who provide services to our customers. When we act as the principal in these arrangements, we recognize revenues based on the amounts billed to our customers. Otherwise, we recognize the net amount that we retain as revenues.
Our share-based payment arrangements include stock options, restricted share units and performance share units (RSUs/PSUs), deferred share units (DSUs), an employee savings plan (ESP) and a deferred share plan (DSP).
STOCK OPTIONS
We use a fair value-based method to measure the cost of our employee stock options, based on the number of stock options that are expected to vest. Compensation expense is adjusted for subsequent changes in management’s estimate of the number of stock options that are expected to vest.
We credit contributed surplus for stock option expense recognized over the vesting period. When stock options are exercised, we credit share capital for the amount received and the amounts previously credited to contributed surplus.
RSUs/PSUs
For each RSU/PSU granted, we recognize compensation expense in operating costs on the consolidated income statements (income statements) equal to the market value of a BCE common share at the date of grant and based on the number of RSUs/PSUs expected to vest, recognized over the term of the vesting period, with a corresponding credit to contributed surplus. Additional RSUs/PSUs are issued to reflect dividends declared on the common shares.
Compensation expense is adjusted for subsequent changes in management’s estimate of the number of RSUs/PSUs that are expected to vest. The effect of these changes is recognized in the period of the change. Upon settlement of the RSUs/PSUs, any difference between the cost of shares purchased on the open market and the amount credited to contributed surplus is reflected in the deficit. Vested RSUs/PSUs are settled in BCE common shares, DSUs or a combination thereof.
DSUs
If compensation is elected to be taken in DSUs, we issue DSUs equal to the fair value of the services received. Additional DSUs are issued to reflect dividends declared on the common shares. DSUs are settled in BCE common shares purchased on the open market following the cessation of employment or when a director leaves the board. We credit contributed surplus for the fair value of DSUs at the issue date. Upon settlement of the DSUs, any difference between the cost of shares purchased on the open market and the amount credited to contributed surplus is reflected in the deficit.
ESP
We recognize our contributions to our ESP as compensation expense in operating costs on the income statements. Employer ESP contributions accrue over a two-year vesting period. We credit contributed surplus for the ESP expense recognized over the vesting period, based on management’s estimate of the accrued contributions that are expected to vest. Upon settlement of shares under the ESP, any difference between the cost of shares purchased on the open market and the amount credited to contributed surplus is reflected in the deficit.
DSP
For each deferred share granted under the DSP, we recognize compensation expense in operating costs on the income statements equal to the market value of a BCE common share and based on the number of deferred shares expected to vest, recognized over the term of the vesting period. Additional deferred shares are issued to reflect dividends declared on the common shares.
Compensation expense is adjusted for subsequent changes in the market value of BCE common shares and any change in management’s estimate of the number of deferred shares that are expected to vest. The cumulative effect of any change in value is recognized in the period of the change. Participants have the option to receive either BCE common shares or a cash equivalent for each vested deferred share upon qualifying for payout under the terms of the grant.
BCE Inc. 2015 ANNUAL REPORT 121 |
| NOTES TO CONSOLIDATED FINANCIAL STATEMENTS | |
| |
| e) Income and other taxes |
Current and deferred income tax expense is recognized in the income statements, except to the extent that the expense relates to items recognized in other comprehensive income or directly in equity.
A current or non-current tax asset (liability) is the estimated tax receivable (payable) on taxable earnings for the current or past periods. We also record future tax liabilities, which are included in Other non-current liabilitiesin the statements of financial position.
We use the liability method to account for deferred tax assets and liabilities, which arise from:
- temporary differences between the carrying amount of assetsand liabilities recognized in the statements of financial positionand their corresponding tax bases
- the carryforward of unused tax losses and credits, to the extentthey can be used in the future
Deferred tax assets and liabilities are calculated at the tax rates that are expected to apply when the asset or liability is recovered or settled. Both our current and deferred tax assets and liabilities are calculated using tax rates that have been enacted or substantively enacted at the reporting date.
Deferred taxes are provided on temporary differences arising from investments in subsidiaries, joint arrangements and associates, except where we control the timing of the reversal of the temporary difference and it is probable that the temporary difference will not reverse in the foreseeable future.
Tax liabilities are, where permitted, offset against tax assets within the same taxable entity and tax jurisdiction.
INVESTMENT TAX CREDITS (ITCs), OTHER TAX CREDITS AND GOVERNMENT GRANTS
We recognize ITCs, other tax credits and government grants given on eligible expenditures when it is reasonably assured that they will be realized. They are presented as part ofTrade and other receivableswhen they are expected to be utilized in the next year. We use the cost reduction method to account for ITCs and government grants, under which the credits are applied against the expense or asset to which the ITC or government grant relates.
Cash equivalents are comprised of highly liquid investments with original maturities of three months or less from the date of purchase.
| |
| g) Securitization of trade receivables |
Proceeds on the securitization of trade receivables are recognized as a collateralized borrowing as we do not transfer control and substantially all the risks and rewards of ownership to another entity.
We measure inventory at the lower of cost and net realizable value. Inventory includes all costs to purchase, convert and bring the inventories to their present location and condition. We determine cost using specific identification for major equipment held for resale and the weighted average cost formula for all other inventory. We maintain inventory valuation reserves for inventory that is slow-moving or potentially obsolete, calculated using an inventory ageing analysis.
| |
| i) Property, plant and equipment |
We record property, plant and equipment at historical cost. Historical cost includes expenditures that are attributable directly to the acquisition or construction of the asset, including the purchase cost, and labour.
Borrowing costs are capitalized for qualifying assets if the time to build or develop is in excess of one year at a rate that is based on our weighted average interest rate on our outstanding long-term debt. Gains or losses on the sale or retirement of property, plant and equipment are recorded inOther (expense) income in the income statements.
LEASES
Leases of property, plant and equipment are recognized as finance leases when we obtain substantially all the risks and rewards of ownership of the underlying assets. At the inception of the lease, we record an asset, together with a corresponding long-term lease liability, at the lower of the fair value of the leased asset or the present value of the minimum future lease payments. If there is reasonable certainty that the lease transfers ownership of the asset to us by the end of the lease term, the asset is amortized over its useful life. Otherwise, the asset is amortized over the shorter of its useful life and the lease term. The long-term lease liability is measured at amortized cost using the effective interest method.
All other leases are classified as operating leases. Operating lease payments are expensed on a straight-line basis over the term of the lease.
ASSET RETIREMENT OBLIGATIONS
We initially measure and record asset retirement obligations at management’s best estimate using a present value methodology, adjusted subsequently for any changes in the timing or amount of the cash flows and changes in discount rates. We capitalize asset retirement costs as part of the related assets and amortize them into earnings over time. We also increase the asset retirement obligation and record a corresponding amount in interest expense to reflect the passage of time.
| 122 BCE Inc. 2015 ANNUAL REPORT |
| | NOTES TO CONSOLIDATED FINANCIAL STATEMENTS |
FINITE-LIFE INTANGIBLE ASSETS
Finite-life intangible assets are carried at cost less accumulated amortization and accumulated impairment losses, if any.
SOFTWARE
We record internal-use software at historical cost. Cost includes expenditures that are attributable directly to the acquisition or development of the software, including the purchase cost, and labour.
Software development costs are capitalized when all the following conditions are met:
- technical feasibility can be demonstrated
- management has the intent and the ability to complete the asset for use or sale
- it is probable that economic benefits will be generated
- costs attributable to the asset can be measured reliably
CUSTOMER RELATIONSHIPS
Customer relationship assets are acquired through business combinations and are recorded at fair value at the date of acquisition.
PROGRAM AND FEATURE FILM RIGHTS
We account for program and feature film rights as intangible assets when these assets are acquired for the purpose of broadcasting. Program and feature film rights, which include producer advances and licence fees paid in advance of receipt of the program or film, are stated at acquisition cost less accumulated amortization and accumulated impairment losses, if any. Programs and feature films under licence agreements are recorded as assets for rights acquired and Iiabilities for obligations incurred when:
- the company receives a broadcast master and the cost is knownor reasonably determinable for new program and featurefilm licences
- the licence term commences for licence period extensions or syndicated programs
Programs and feature films are classified as non-current assets with related liabilities classified as current or non-current, based on the payment terms. Amortization of program and feature film rights is recorded inOperating costs in the income statements.
INDEFINITE-LIFE INTANGIBLE ASSETS
Brand assets, mainly comprised of the Bell and Bell Media brands, and broadcast licences are acquired through business combinations, and are recorded at fair value at the date of acquisition, less accumulated impairment losses, if any. Wireless spectrum licences are recorded at acquisition cost, including borrowing costs when the time to build or develop the related network is in excess of one year.
Currently there are no legal, regulatory, competitive or other factors that limit the useful lives of our brands or spectrum licences.
| |
| k) Depreciation and amortization |
We depreciate property, plant and equipment and amortize finite-life intangible assets on a straight-line basis over their estimated useful lives. We review our estimates of useful lives on an annual basis and adjust depreciation and amortization on a prospective basis, if needed. Land and assets under construction or development are not depreciated.
| ESTIMATED USEFUL LIFE | |
Property, plant and equipment | | |
Network infrastructure and equipment | 2 to 50 years | |
Buildings | 5 to 50 years | |
Finite-life intangible assets | | |
Software | 2 to 12 years | |
Customer relationships | 6 to 30 years | |
Program and feature film rights | Up to 5 years | |
| |
| l) Investments in associates and joint arrangements |
Our financial statements incorporate our share of the results of our associates and joint ventures using the equity method of accounting, except when the investment is classified as held for sale. Equity income from investments is recorded inOther (expense) incomein the income statements.
Investments in associates and joint ventures are recognized initially at cost and adjusted thereafter to include the company’s share of income or loss and comprehensive income on an after-tax basis. Investments are reviewed for impairment at each reporting period by comparing their recoverable amount to their carrying amount.
We recognize our share of the assets, liabilities, revenues and expenses of joint operations in accordance with the related contractual agreements.
BCE Inc. 2015 ANNUAL REPORT 123 |
| NOTES TO CONSOLIDATED FINANCIAL STATEMENTS | |
| |
| m) Business combinations and goodwill |
Business combinations are accounted for using the acquisition method. The consideration transferred in a business combination is measured at fair value at the date of acquisition. Acquisition-related transaction costs are expensed as incurred and recorded in Severance, acquisition and other costsin the income statements.
Identifiable assets and liabilities, including intangible assets, of acquired businesses are recorded at their fair values at the date of acquisition. When we acquire control of a business, any previously-held equity interest also is remeasured to fair value. The excess of the purchase consideration and any previously-held equity interest over the fair value of identifiable net assets acquired is recorded asGoodwill in the statements of financial position. If the fair value of identifiable net assets acquired exceeds the purchase consideration and any previously-held equity interest, the difference is recognized in earnings immediately as a bargain purchase gain.
Changes in our ownership interest in subsidiaries that do not result in a loss of control are accounted for as equity transactions. Any difference between the change in the carrying amount of non-controlling interest (NCI) and the consideration paid or received is attributed to owner’s equity.
| |
| n) Impairment of non-financial assets |
Goodwill and indefinite-life intangible assets are tested for impairment annually or when there is an indication that the asset may be impaired. Property, plant and equipment and finite-life intangible assets are tested for impairment if events or changes in circumstances, assessed at each reporting period, indicate that their carrying amount may not be recoverable. For the purpose of impairment testing, assets other than goodwill are grouped at the lowest level for which there are separately identifiable cash inflows.
Impairment losses are recognized and measured as the excess of the carrying value of the assets over their recoverable amount. An asset’s recoverable amount is the higher of its fair value less costs of disposal and its value in use. Previously recognized impairment losses, other than those attributable to goodwill, are reviewed for possible reversal at each reporting date and, if the asset’s recoverable amount has increased, all or a portion of the impairment is reversed.
GOODWILL IMPAIRMENT TESTING
We perform an annual test for goodwill impairment in the fourth quarter for each of our cash generating units (CGUs) or groups of CGUs to which goodwill is allocated, and whenever there is an indication that goodwill might be impaired.
A CGU is the smallest identifiable group of assets that generates cash inflows that are independent of the cash inflows from other assets or groups of assets.
We identify any potential impairment by comparing the carrying value of a CGU or group of CGUs to its recoverable amount. The recoverable amount of a CGU or group of CGUs is the higher of its fair value less costs of disposal and its value in use. Fair value less costs of disposal is based on estimates of discounted future cash flows or other valuation methods. Cash flows are projected based on past experience, actual operating results and business plans. When the recoverable amount of a CGU or group of CGUs is less than its carrying value, the recoverable amount is determined for its identifiable assets and liabilities. The excess of the recoverable amount of the CGU or group of CGUs over the total of the amounts assigned to its assets and liabilities is the recoverable amount of goodwill.
An impairment charge is deducted from earnings for any excess of the carrying value of goodwill over its recoverable amount. For purposes of impairment testing of goodwill, BCE’s CGUs or groups of CGUs correspond to our reporting segments as disclosed in Note 4, Segmented information.
TRADE AND OTHER RECEIVABLES
Trade and other receivables, which include trade receivables and other short-term receivables, are measured at amortized cost using the effective interest method, net of any allowance for doubtful accounts. An allowance for doubtful accounts is established based on individually significant exposures or on historical trends. Factors considered when establishing an allowance include current economic conditions, historical information and the reason for the delay in payment. Amounts considered uncollectible are written off.
AVAILABLE FOR SALE (AFS) FINANCIAL ASSETS
Our portfolio investments in equity securities are classified as AFS and are presented in our statements of financial position as Other non-current assets. They have been designated as such based on management’s intentions or because they are not classified in any other categories. These securities are recorded at fair value on the date of acquisition, including related transaction costs, and are adjusted to fair value at each reporting date. The corresponding unrealized gains and losses are recorded in other comprehensive income and are reclassified toOther (expense) incomein the income statements when realized or when an impairment is determined.
OTHER FINANCIAL LIABILITIES
Other financial liabilities, which include trade payables and accruals, compensation payable, obligations imposed by the Canadian Radio-television and Telecommunications Commission (CRTC), interest payable and long-term debt, are recorded at amortized cost using the effective interest method.
COSTS OF ISSUING DEBT AND EQUITY
The cost of issuing debt is included as part of long-term debt and is accounted for at amortized cost using the effective interest method. The cost of issuing equity is reflected in the consolidated statements of changes in equity as a charge to the deficit.
| 124 BCE Inc. 2015 ANNUAL REPORT |
| | NOTES TO CONSOLIDATED FINANCIAL STATEMENTS |
| |
| p) Derivative financial instruments |
We use derivative financial instruments to manage interest rate risk, foreign currency risk and cash flow exposures related to share-based payment plans, capital expenditures, long-term debt instruments and purchase commitments. We do not use derivative financial instruments for speculative or trading purposes.
HEDGE ACCOUNTING
To qualify for hedge accounting, we document the relationship between the derivative and the related identified risk exposure, and our risk management objective and strategy. This includes associating each derivative to a specific asset or liability, a specific firm commitment or a specific anticipated transaction.
We assess the effectiveness of a derivative in managing an identified risk exposure when hedge accounting is initially applied, and on an ongoing basis thereafter. If a hedge becomes ineffective, we stop using hedge accounting.
FAIR VALUE HEDGES
Our fair value hedges consist of interest rate swaps used to manage the effect of changes in interest rates relating to fixed-rate long-term debt. These swaps involve exchanging interest payments without exchanging the notional amount on which the payments are based. We record the exchange of payments as an adjustment to interest expense on the hedged debt. We include the related net receivable or payable from counterparties in Other current assetsor Trade payables and other liabilitiesfor swaps due within one year and inOther non-current assets orOther non-current liabilities for swaps that have a maturity of more than one year. Changes in the fair value of these derivatives and the related long-term debt are recognized in Other (expense) incomein the income statements and offset, unless a portion of the hedging relationship is ineffective.
CASH FLOW HEDGES
Our cash flow hedges are used to mitigate foreign currency risk on certain long-term debt instruments and purchase commitments, as well as interest rate risk related to future debt issuances. We use foreign currency forward contracts to manage the exposure to anticipated transactions denominated in foreign currencies. Changes in the fair value of these derivatives are recognized in our consolidated statements of comprehensive income (statements of comprehensive income), except for any ineffective portion, which is recognized immediately in earnings. Realized gains and losses in Accumulated other comprehensive incomeare reclassified to the income statements in the same periods as the corresponding hedged items are recognized in earnings. Cash flow hedges that mature within one year are included inOther current assets orTrade payables and other liabilities, whereas hedges that have a maturity of more than one year are included in Other non-current assetsorOther non-current liabilities.
We use cross currency basis swaps to manage our U.S. dollar borrowings under our unsecured committed term credit facility. Changes in the fair value of these derivatives and the related credit facility are recognized inOther (expense) income in the income statements and offset, unless a portion of the hedging relationship is ineffective.
DERIVATIVES USED AS ECONOMIC HEDGES
We use derivatives to manage cash flow exposures related to equity-settled share-based payment plans and capital expenditures, equity price risk related to a cash-settled share-based payment plan, and interest rate risk related to preferred share dividend rate resets. As these derivatives do not qualify for hedge accounting, the changes in their fair value are recorded in the income statements inOperating costs for derivatives used to hedge cash-settled share-based payments and in Other (expense) incomefor other derivatives.
| |
| q) Post-employment benefit plans |
DEFINED BENEFIT (DB) AND OTHER POST-EMPLOYMENT BENEFIT (OPEB) PLANS
We maintain DB pension plans that provide pension benefits for certain employees. Benefits are based on the employee’s length of service and average rate of pay during the highest paid consecutive five years of service. Most employees are not required to contribute to the plans. Certain plans provide cost of living adjustments to help protect the income of retired employees against inflation.
We are responsible for adequately funding our DB pension plans. We make contributions to them based on various actuarial cost methods permitted by pension regulatory bodies. Contributions reflect actuarial assumptions about future investment returns, salary projections, future service and life expectancy.
We provide OPEBs to some of our employees, including:
- healthcare and life insurance benefits during retirement, which are being phased out over a ten-year period ending on December 31, 2016. We do not fund most of these OPEB plans.
- other benefits, including workers’ compensation and medicalbenefits to former or inactive employees, their beneficiariesand dependants, from the time their employment ends until theirretirement starts, under certain circumstances
We accrue our obligations and related costs under post-employment benefit plans, net of the fair value of the benefit plan assets. Pension and OPEB costs are determined using:
- the projected unit credit method, prorated on years of service,which takes into account future pay levels
- a discount rate based on market interest rates of high-qualitycorporate fixed income investments with maturities that matchthe timing of benefits expected to be paid under the plans
- management’s best estimate of pay increases, retirement agesof employees, expected healthcare costs and life expectancy
We value post-employment benefit plan assets at fair value using current market values.
BCE Inc. 2015 ANNUAL REPORT 125 |
| NOTES TO CONSOLIDATED FINANCIAL STATEMENTS | |
Post-employment benefit plans current service cost is included inOperating costs. Interest on our post-employment benefit obligations is recognized in net earnings and represents the accretion of interest on the net obligations under the post-employment benefit plans. The interest rate is based on market conditions that existed at the beginning of the year. Actuarial gains and losses for all post-employment benefit plans are recorded in other comprehensive income in the period in which they occur and are recognized immediately in the deficit.
December 31 is the measurement date for our significant post-employment benefit plans. Our actuaries perform a valuation at least every three years to determine the actuarial present value of the accrued DB pension plan and OPEB obligations. The most recent actuarial valuation of our significant pension plans was December 31, 2014.
DEFINED CONTRIBUTION (DC) PENSION PLANS
We maintain DC pension plans that provide certain employees with benefits. Under these plans, we are responsible for contributing a predetermined amount to an employee’s retirement savings, based on a percentage of the employee’s salary.
We recognize a post-employment benefit plans service cost for DC pension plans when the employee provides service to the company, essentially coinciding with our cash contributions.
Generally, new employees can participate only in the DC pension plans.
Provisions are recognized when all the following conditions are met:
- the company has a present legal or constructive obligation based on past events
- it is probable that an outflow of economic resources will berequired to settle the obligation
- the amount can be reasonably estimated
Provisions are measured at the present value of the estimated expenditures expected to settle the obligation, if the effect of the time value of money is material. The present value is determined using current market assessments of the discount rate and risks specific to the obligation. The obligation increases as a result of the passage of time, resulting in interest expense.
| |
| s) Estimates and key judgments |
When preparing financial statements, management makes estimates and judgments relating to:
- reported amounts of revenues and expenses
- reported amounts of assets and liabilities
- disclosure of contingent assets and liabilities
We base our estimates on a number of factors, including historical experience, current events and actions that the company may undertake in the future, and other assumptions that we believe are reasonable under the circumstances. By their nature, these estimates and judgments are subject to measurement uncertainty and actual results could differ. Our more significant estimates and judgments are described below.
ESTIMATES
USEFUL LIVES OF PROPERTY, PLANT AND EQUIPMENT AND FINITE-LIFE INTANGIBLE ASSETS
Property, plant and equipment represent a significant proportion of our total assets. Changes in technology or our intended use of these assets, as well as changes in business prospects or economic and industry factors, may cause the estimated useful lives of these assets to change.
POST-EMPLOYMENT BENEFIT PLANS
The amounts reported in the financial statements relating to DB pension plans and OPEBs are determined using actuarial calculations that are based on several assumptions.
The actuarial valuation uses management’s assumptions for, among other things, the discount rate, life expectancy, the rate of compensation increase, trends in healthcare costs and expected average remaining years of service of employees.
The most significant assumptions used to calculate the net post-employment benefit plans cost are the discount rate and life expectancy.
The discount rate is based on the yield on long-term, high-quality corporate fixed income investments, with maturities matching the estimated cash flows of the post-employment benefit plans. Life expectancy is based on publicly available Canadian mortality tables and is adjusted for the company’s specific experience.
IMPAIRMENT OF NON-FINANCIAL ASSETS
We make a number of estimates when calculating recoverable amounts using discounted future cash flows or other valuation methods to test for impairment. These estimates include the assumed growth rates for future cash flows, the number of years used in the cash flow model and the discount rate.
DEFERRED TAXES
The amount of deferred tax assets is estimated with consideration given to the timing, sources and amounts of future taxable income.
FAIR VALUE OF FINANCIAL INSTRUMENTS
Certain financial instruments, such as investments in equity securities, derivative financial instruments and certain elements of borrowings, are carried in the statements of financial position at fair value, with changes in fair value reflected in the income statements and the statements of comprehensive income. Fair values are estimated by reference to published price quotations or by using other valuation techniques that may include inputs that are not based on observable market data, such as discounted cash flows.
| 126 BCE Inc. 2015 ANNUAL REPORT |
| | NOTES TO CONSOLIDATED FINANCIAL STATEMENTS |
CONTINGENCIES
We become involved in various litigation matters as a part of our business. Pending litigations represent a potential cost to our business. We estimate the amount of a loss by analyzing potential outcomes and assuming various litigation and settlement strategies, based on information that is available at the time.
ONEROUS CONTRACTS
A provision for onerous contracts is recognized when the unavoidable costs of meeting our obligations under a contract exceed the expected benefits to be received from a contract. The provision is measured at the present value of the lower of the expected cost of terminating the contract and the expected net cost of completing the contract.
JUDGMENTS
POST-EMPLOYMENT BENEFIT PLANS
The determination of the discount rate used to value our post-employment benefit obligations requires judgment. The rate is set by reference to market yields of high-quality corporate fixed income investments at the beginning of each fiscal year. Significant judgment is required when setting the criteria for fixed income investments to be included in the population from which the yield curve is derived. The most significant criteria considered for the selection of investments include the size of the issue and credit quality, along with the identification of outliers, which are excluded.
INCOME TAXES
The calculation of income taxes requires judgment in interpreting tax rules and regulations. There are transactions and calculations for which the ultimate tax determination is uncertain. Our tax filings are also subject to audits, the outcome of which could change the amount of current and deferred tax assets and liabilities.
Management judgment is used to determine the amounts of deferred tax assets and liabilities and future tax liabilities to be recognized. In particular, judgment is required when assessing the timing of the reversal of temporary differences to which future income tax rates are applied.
MULTIPLE ELEMENT ARRANGEMENTS
Determining the amounts of revenue to be recognized for multiple element arrangements requires judgment to establish the separately identifiable components and the allocation of the total price between those components.
CASH GENERATING UNITS
The determination of CGUs or groups of CGUs for the purpose of annual impairment testing requires judgment.
CONTINGENCIES
The determination of whether a loss is probable from litigation and whether an outflow of resources is likely requires judgment.
| |
| t) Change in accounting estimate |
In 2014, as part of our ongoing annual review of property, plant and equipment and finite-life intangible assets, and to better reflect their useful lives, we increased the lives of certain information technology (IT) software assets from five to seven years and reduced the lives of certain network assets, including our code division multiple access (CDMA) network. The changes have been applied prospectively effective July 1, 2014 and did not have a significant impact on our financial statements.
| |
| u) Future changes to accounting standards |
The following new or amended standards issued by the IASB have an effective date after December 31, 2015 and have not yet been adopted by BCE.
| STANDARD | | DESCRIPTION | | IMPACT | | EFFECTIVE DATE | |
| Amendments to International Accounting Standard (IAS) 16 – Property, Plant and Equipment and IAS 38 – Intangible Assets | | Clarifies that a revenue-based approach to calculate depreciation and amortization generally is not appropriate as it does not reflect the consumption of the economic benefits embodied in the related asset. | | The amendments to IAS 16 and IAS 38 are not expected to have a significant impact on our financial statements. | | Annual periods beginning on or after January 1, 2016, applied prospectively. | |
| Amendments to IFRS 11 – Joint Arrangements | | Provides guidance on the accounting for acquisitions of interests in joint operations in which the activity constitutes a business, as defined in IFRS 3 – Business Combinations. The amended standard requires the acquirer to apply all of the principles on accounting for business combinations in IFRS 3 and other IFRSs except for any principles that conflict with IFRS 11. | | The amendments to IFRS 11 are not expected to have a significant impact on our financial statements. | | Annual periods beginning on or after January 1, 2016, applied prospectively. | |
| Amendments to IAS 7 –Statement of Cash Flows | | Requires enhanced disclosures about changes in liabilities arising from financing activities, including changes from financing cash flows, changes arising from obtaining or losing control of subsidiaries or other businesses, the effect of changes in foreign exchange rates and changes in fair values. | | We are currently evaluating the impact of the amendments to IAS 7 on our financial statements. | | Annual periods beginning on or after January 1, 2017, applied prospectively. | |
BCE Inc. 2015 ANNUAL REPORT 127 |
| NOTES TO CONSOLIDATED FINANCIAL STATEMENTS | |
| STANDARD | | DESCRIPTION | | IMPACT | | EFFECTIVE DATE | |
| IFRS 15 – Revenue from Contracts with Customers | | Establishes principles to record revenues from contracts for the sale of goods or services, unless the contracts are in the scope of IAS 17–Leases or other IFRSs. Under IFRS 15, revenue is recognized at an amount that reflects the expected consideration receivable in exchange for transferring goods or services to a customer, applying the following five steps:- Identify the contract with a customer
- Identify the performance obligations in the contract
- Determine the transaction price
- Allocate the transaction price to the performance obligations in the contract
- Recognize revenue when (or as) the entity satisfies a performance obligation
The new standard also provides guidance relating to contract costs and for the measurement and recognition of gains and losses on the sale of certain non-financial assets such as property and equipment. Additional disclosures will also be required under the new standard. | | IFRS 15 will principally affect the timing of revenue recognition and how we classify revenues between product and service, how we account for costs to obtain a contract and contract fulfilment costs. Under multiple element arrangements, although the total revenue recognized during the term of a contract will be largely unaffected, the revenue allocated to a delivered item will no longer be limited to the non-contingent amount, which may accelerate the recognition of revenue ahead of the associated cash inflows. This would result in a change in the upfront classification of revenues to an asset on the balance sheet, which would be realized over the term of the contract. Although we have made progress in our implementation of IFRS 15, it is not yet possible to make a reliable estimate of the impact of the new standard on our financial statements, as we are required to implement significant changes to our systems and processes across the organization in order to collect the new data requirements, as well as compile historical comparatives. It is expected that the changes will be most pronounced in our Bell Wireless segment. | | Annual periods beginning on or after January 1, 2018, using either a full retrospective approach for all periods presented in the period of adoption or a modified retrospective approach. | |
| IFRS 9 – Financial Instruments | | Sets out the requirements for recognizing and measuring financial assets, financial liabilities and some contracts to buy and sell non-financial items. IFRS 9 replaces IAS 39 –Financial Instruments: Recognition and Measurement. The new standard establishes a single classification and measurement approach for financial assets that reflects the business model in which they are managed and their cash flow characteristics. It also provides guidance on an entity’s own credit risk relating to financial liabilities and has modified the hedge accounting model to better link the economics of risk management with its accounting treatment. Additional disclosures will also be required under the new standard. | | We are currently evaluating the impact of IFRS 9 on our financial statements. | | Annual periods beginning on or after January 1, 2018, with early adoption permitted. | |
| IFRS 16 – Leases | | Eliminates the distinction between operating and finance leases for lessees, requiring instead that leases be capitalized by recognizing the present value of the lease payments and showing them either as lease assets (right-of-use assets) or together with property, plant and equipment. If lease payments are made over time, an entity recognizes a financial liability representing its obligation to make future lease payments. A depreciation charge for the lease asset is recorded within operating costs and an interest expense on the lease liability is recorded within finance costs. IFRS 16 does not require a lessee to recognize assets and liabilities for short-term leases and leases of low-value assets, nor does it substantially change lease accounting for lessors. | | We are currently evaluating the impact of IFRS 16 on our financial statements. | | Annual periods beginning on or after January 1, 2019, using either a full retrospective approach for all periods presented in the period of adoption or a modified retrospective approach, with early adoption permitted if an entity has adopted IFRS 15. | |
| 128 BCE Inc. 2015 ANNUAL REPORT |
| | NOTES TO CONSOLIDATED FINANCIAL STATEMENTS |
| |
| Note 3 Business acquisitions and dispositions |
Glentel
On May 20, 2015, BCE completed the acquisition of all of Glentel Inc.’s (Glentel) issued and outstanding common shares for a total consideration of $592 million, of which $296 million ($284 million, net of cash on hand) was paid in cash and the balance through the issuance of 5,548,908 BCE common shares. Immediately following the closing of the acquisition, BCE repaid Glentel’s outstanding debt in the amount of approximately $112 million and contributed $53 million in exchange for additional Glentel common shares.
Subsequently, also on May 20, 2015 and further to an agreement dated December 24, 2014, BCE divested 50% of its ownership interest in Glentel to Rogers Communications Inc. for a total cash consideration of approximately $473 million ($407 million, net of divested cash and transaction costs). The resulting gain of $94 million is recorded inOther (expense) income. Our remaining investment in Glentel is $379 million and is recorded in Investments in associates and joint ventures.
Glentel is a Canadian-based dual-carrier, multi-brand mobile products distributor. The transaction is part of our strategy to accelerate wireless and improve customer service. BCE accounts for its investment in Glentel as a joint venture using the equity method.
| |
| National expansion of HBO and The Movie Network (TMN) |
On November 19, 2015, BCE announced a transaction with Corus Entertainment Inc. (Corus) whereby Bell Media would pay Corus a total consideration of $211 million for Corus to waive its HBO content rights in Canada and wind down operations of its Movie Central and Encore Avenue pay TV services in Western and Northern Canada, thereby allowing Bell Media to become the sole operator of HBO Canada nationally across all platforms and to expand TMN into a national pay TV service. Bell Media paid a deposit of $21 million to Corus in 2015.
Subsequent to year end, Bell Media completed the final payment of $190 million, which will be recorded in our consolidated statements of cash flows in the first quarter of 2016. TMN was successfully launched nationally on March 1, 2016 and Movie Central and Encore Avenue’s operations ceased on the same day at which point the transaction was recorded in our consolidated statements of financial position. The transaction is part of our strategy to create, negotiate and deliver premium TV programming to Canadian consumers across more platforms on a national basis.
| |
| Sale of Astral radio stations and TV services |
As a result of BCE’s acquisition of Astral Media Inc. (Astral) on July 5, 2013 and consistent with the CRTC’s Common Ownership Policy for radio, BCE was required to sell ten Bell Media and Astral English-language radio stations. BCE also was required to sell eleven Astral TV services in order to comply with conditions attached to the Competition Bureau and CRTC approvals.
In 2014, we completed the sale of the radio stations and TV services for total proceeds of $720 million.
| |
| Note 4 Segmented information |
The accounting policies used in our segment reporting are the same as those we describe in Note 2, Significant accounting policies. Beginning January 1, 2015, our results are reported in three segments: Bell Wireless, Bell Wirelineand Bell Media. Due to the privatization of Bell Aliant in 2014 as outlined in Note 24, Privatization of Bell Aliant, the results of our former Bell Aliant segment are included within our Bell Wireless and Bell Wireline segments, with prior periods reclassified for comparative purposes. Goodwill and indefinite life intangible assets of our former Bell Aliant segment are now primarily included in the Bell Wireline segment. Our segments reflect how we manage our business and how we classify our operations for planning and measuring performance. Accordingly, we operate and manage our segments as strategic business units organized by products and services. Segments negotiate sales with each other as if they were unrelated parties.
We measure the performance of each segment based on segment profit, which is equal to operating revenues less operating costs for the segment. We report severance, acquisition and other costs and depreciation and amortization by segment for external reporting purposes. Substantially all of our finance costs and other (expense) income are managed on a corporate basis and, accordingly, are not reflected in segment results.
Our operations and virtually all of our assets are located in Canada. Below is a description of our segments at December 31, 2015:
Our Bell Wireless segment provides wireless voice and data communication products and services to our residential, small and medium-sized business and large enterprise customers across Canada.
BCE Inc. 2015 ANNUAL REPORT 129 |
| NOTES TO CONSOLIDATED FINANCIAL STATEMENTS | |
Our Bell Wireline segment provides data, including Internet access and IPTV, local telephone, long distance, as well as other communications services and products to our residential, small and medium-sized business and large enterprise customers primarily in Ontario, Québec and the Atlantic provinces, while Satellite TV service and connectivity to business customers are available nationally across Canada. In addition, this segment includes our wholesale business, which buys and sells local telephone, long distance, data and other services from or to resellers and other carriers.
Our Bell Media segment provides conventional, specialty and pay TV, digital media, and radio broadcasting services to customers across Canada and out-of-home advertising services.
| | | | | | | | | INTER-SEGMENT | | | |
FOR THE YEAR ENDED DECEMBER 31, 2015 | NOTE | | BELL WIRELESS | | BELL WIRELINE | | BELL MEDIA | | ELIMINATIONS | | BCE | |
Operating revenues | | | | | | | | | | | | |
External customers | | | 6,836 | | 12,043 | | 2,635 | | – | | 21,514 | |
Inter-segment | | | 40 | | 215 | | 339 | | (594 | ) | – | |
Total operating revenues | | | 6,876 | | 12,258 | | 2,974 | | (594 | ) | 21,514 | |
Operating costs | 5 | | (4,048 | ) | (7,258 | ) | (2,251 | ) | 594 | | (12,963 | ) |
Segment profit(1) | | | 2,828 | | 5,000 | | 723 | | – | | 8,551 | |
Severance, acquisition and other costs | 6 | | (16 | ) | (363 | ) | (67 | ) | – | | (446 | ) |
Depreciation and amortization | 13, 14 | | (503 | ) | (2,785 | ) | (132 | ) | – | | (3,420 | ) |
Finance costs | | | | | | | | | | | | |
Interest expense | 7 | | | | | | | | | | (909 | ) |
Interest on post-employment benefit obligations | 21 | | | | | | | | | | (110 | ) |
Other expense | 8 | | | �� | | | | | | | (12 | ) |
Income taxes | 9 | | | | | | | | | | (924 | ) |
Net earnings | | | | | | | | | | | 2,730 | |
Goodwill | 17 | | 2,303 | | 3,491 | | 2,583 | | – | | 8,377 | |
Indefinite-life intangible assets | 14 | | 3,597 | | 1,685 | | 2,652 | | – | | 7,934 | |
Capital expenditures | | | 716 | | 2,809 | | 101 | | – | | 3,626 | |
| (1) | The chief operating decision maker uses primarily one measure of profit to make decisions and assess performance, being operating revenues less operating costs. |
| | | | | | | | | INTER-SEGMENT
ELIMINATIONS | | | |
FOR THE YEAR ENDED DECEMBER 31, 2014 | NOTE | | BELL WIRELESS | | BELL WIRELINE | | BELL MEDIA | | | BCE | |
Operating revenues | | | | | | | | | | | | |
External customers | | | 6,289 | | 12,111 | | 2,642 | | – | | 21,042 | |
Inter-segment | | | 38 | | 213 | | 295 | | (546 | ) | – | |
Total operating revenues | | | 6,327 | | 12,324 | | 2,937 | | (546 | ) | 21,042 | |
Operating costs | 5 | | (3,703 | ) | (7,379 | ) | (2,203 | ) | 546 | | (12,739 | ) |
Segment profit(1) | | | 2,624 | | 4,945 | | 734 | | – | | 8,303 | |
Severance, acquisition and other costs | 6 | | (5 | ) | (165 | ) | (46 | ) | – | | (216 | ) |
Depreciation and amortization | 13, 14 | | (545 | ) | (2,781 | ) | (126 | ) | – | | (3,452 | ) |
Finance costs | | | | | | | | | | | | |
Interest expense | 7 | | | | | | | | | | (929 | ) |
Interest on post-employment benefit obligations | 21 | | | | | | | | | | (101 | ) |
Other income | 8 | | | | | | | | | | 42 | |
Income taxes | 9 | | | | | | | | | | (929 | ) |
Net earnings | | | | | | | | | | | 2,718 | |
Goodwill | 17 | | 2,302 | | 3,491 | | 2,592 | | – | | 8,385 | |
Indefinite-life intangible assets | 14 | | 3,033 | | 1,685 | | 2,680 | | – | | 7,398 | |
Capital expenditures | | | 687 | | 2,893 | | 137 | | – | | 3,717 | |
| (1) | The chief operating decision maker uses primarily one measure of profit to make decisions and assess performance, being operating revenues less operating costs. |
| 130 BCE Inc. 2015 ANNUAL REPORT |
| | NOTES TO CONSOLIDATED FINANCIAL STATEMENTS |
| FOR THE YEAR ENDED DECEMBER 31 | 2015 | | 2014 | |
| Wireless | 6,246 | | 5,806 | |
| Data | 7,163 | | 6,978 | |
| Local and access | 3,271 | | 3,420 | |
| Long distance | 831 | | 922 | |
| Media | 2,635 | | 2,642 | |
| Equipment and other(1) | 1,368 | | 1,274 | |
| Total operating revenues(2) | 21,514 | | 21,042 | |
| (1) | Includes wireless product revenues of $590 million and $483 million in 2015 and 2014, respectively. |
| (2) | Due to the privatization of Bell Aliant, as outlined in Note 24, Privatization of Bell Aliant, we have reclassified amounts for the prior year to make them consistent with the presentation for the current year. |
FOR THE YEAR ENDED DECEMBER 31 | NOTE | | 2015 | | 2014 | |
Labour costs | | | | | | |
Wages, salaries and related taxes and benefits | | | (4,224 | ) | (4,351 | ) |
Post-employment benefit plans service cost (net of capitalized amounts) | 21 | | (281 | ) | (276 | ) |
Other labour costs(1) | | | (949 | ) | (957 | ) |
Less: | | | | | | |
Capitalized labour | | | 954 | | 1,002 | |
Total labour costs | | | (4,500 | ) | (4,582 | ) |
Cost of revenues(2) | | | (6,598 | ) | (6,265 | ) |
Other operating costs(3) | | | (1,865 | ) | (1,892 | ) |
Total operating costs | | | (12,963 | ) | (12,739 | ) |
| (1) | Other labour costs include contractor and outsourcing costs. |
| (2) | Cost of revenues includes costs of wireless devices and other equipment sold, network and content costs, and payments to other carriers. |
| (3) | Other operating costs include marketing, advertising and sales commission costs, bad debt expense, taxes other than income taxes, information technology costs, professional service fees and rent. |
Research and development expenses of $134 million and $167 million are included in operating costs for 2015 and 2014, respectively.
| |
| Note 6 Severance, acquisition and other costs |
FOR THE YEAR ENDED DECEMBER 31 | 2015 | | 2014 | |
Severance | (197 | ) | (82 | ) |
Acquisition and other | (249 | ) | (134 | ) |
Total severance, acquisition and other costs | (446 | ) | (216 | ) |
Severance costs
Severance costs consist of charges related to involuntary and voluntary employee terminations. Severance in 2015 includes costs related to workforce reduction initiatives incurred in our Bell Media and Bell Wireline segments to confront changing consumer preferences, new TV unbundling rules, a soft business market as a result of the economy and declines in home phone subscribers.
BCE Inc. 2015 ANNUAL REPORT 131 |
| NOTES TO CONSOLIDATED FINANCIAL STATEMENTS | |
| |
| Acquisition and other costs |
Acquisition and other costs consist of transaction costs, such as legal and financial advisory fees, related to completed or potential acquisitions, employee severance costs related to the purchase of a business, the costs to integrate acquired companies into our operations and litigation costs, when they are significant. Acquisition costs also include severance and integration costs relating to the privatization of Bell Aliant. Refer to Note 24,Privatization of Bell Aliant.
SIGNAL PIRACY LITIGATION
On August 31, 2005, a motion to institute legal proceedings was filed in the Québec Superior Court against Bell ExpressVu Limited Partnership (Bell ExpressVu) by Vidéotron ltée, Vidéotron (Régional) ltée and CF Cable TV Inc. (a subsidiary of Vidéotron ltée). The claim was for an initial amount of $374 million in damages, plus interest and costs. In the statement of claim, the plaintiffs alleged that Bell ExpressVu had failed to adequately protect its system against satellite signal piracy, thereby depriving the plaintiffs of subscribers who, but for their alleged ability to pirate Bell ExpressVu’s signal, would have subscribed to the plaintiffs’ services. On July 23, 2012, the Superior Court issued a judgment pursuant to which it did not find Bell ExpressVu at fault in its overall efforts to fight signal piracy but concluded that the complete smart card swap it undertook should have been completed earlier. In this regard, the court granted the plaintiffs damages of $339,000, plus interest and costs. The plaintiffs appealed to the Québec Court of Appeal the quantum of damages awarded by the trial judge and sought revised damages in the amount of $164.5 million, plus costs, interest and an additional indemnity. Bell ExpressVu also filed an appeal of the lower court decision on its finding of liability.
On March 6, 2015, the Québec Court of Appeal reversed the judgment of the lower court regarding the quantum of damages, granting plaintiffs damages of $82 million, plus interest and costs. A charge of $137 million was recorded in Q1 2015 and was included in acquisition and other costs.
On October 15, 2015, the Supreme Court of Canada dismissed Bell ExpressVu’s application for leave to appeal the Québec Court of Appeal’s judgment. Accordingly, the aggregate amount of $141.6 million, including interest and costs, was paid by Bell ExpressVu on October 19, 2015 in full satisfaction of the judgment as rendered by the Québec Court of Appeal and was recorded inAcquisition and other costs paid in the statements of cash flows.
FOR THE YEAR ENDED DECEMBER 31 | 2015 | | 2014 | |
Interest expense on long-term debt | (875 | ) | (865 | ) |
Interest expense on other debt | (84 | ) | (97 | ) |
Capitalized interest | 50 | | 33 | |
Total interest expense | (909 | ) | (929 | ) |
Interest expense on long-term debt includes interest on finance leases of $161 million and $166 million for 2015 and 2014, respectively.
Capitalized interest was calculated using an average rate of 4.08% and 4.49% for 2015 and 2014, respectively, which represents the weighted average interest rate on our outstanding long-term debt.
| |
| Note 8 Other (expense) income |
FOR THE YEAR ENDED DECEMBER 31 | NOTE | | 2015 | | 2014 | |
Losses on disposal/retirement of software, plant and equipment | | | (55 | ) | (51 | ) |
Impairment of assets | 13, 14 | | (49 | ) | (105 | ) |
Equity (losses) income from investments in associates and joint ventures | 15 | | | | | |
Loss on investment | | | (54 | ) | – | |
Operations | | | 5 | | (12 | ) |
Early debt redemption costs | 20 | | (18 | ) | (29 | ) |
Gains on investments | 3 | | 72 | | 10 | |
Net mark-to-market gains on derivatives used as economic hedges | | | 54 | | 134 | |
Dividend income from assets held for sale | 3 | | – | | 42 | |
Other | | | 33 | | 53 | |
Total other (expense) income | | | (12 | ) | 42 | |
| 132 BCE Inc. 2015 ANNUAL REPORT |
| | NOTES TO CONSOLIDATED FINANCIAL STATEMENTS |
In 2015, we recorded an impairment charge of $49 million, of which $38 million was allocated to indefinite-life intangible assets, $9 million to finite-life intangible assets and $2 million to property, plant and equipment. The impairment charge related mainly to our music CGU within our Bell Media segment and resulted from revenue and profitability declines from lower viewership and higher TV content costs. The charge was determined by comparing the carrying value of the CGU to its fair value less costs of disposal. We estimated the fair value of the CGU using both discounted cash flows and market-based valuation models which include five-year cash flow projections from business plans reviewed by senior management for the period of January 1, 2016 to December 31, 2020, using a discount rate of 9.0% and a perpetuity growth rate of nil, as well as market multiple data from public companies and market transactions. The carrying value of our music CGU was $171 million at December 31, 2015.
In 2014, we recorded an impairment charge of $105 million, of which $67 million was allocated to property, plant and equipment and $38 million to indefinite-life intangible assets. The impairment charge related mainly to our conventional TV CGU within our Bell Media segment and resulted from a softness in the overall Canadian TV advertising market and higher TV content costs. The charge was determined by comparing the carrying value of the CGU to its fair value less costs of disposal, based on five-year expected future discounted cash flows from business plans reviewed by senior management for the period of January 1, 2015 to December 31, 2019 using a discount rate of 9.5% and a perpetuity growth rate of nil The carrying value of our conventional TV CGU was $327 million at December 31, 2014.
| |
| Equity (losses) income from investments in associates and joint ventures |
In 2015, we recorded a loss on investment of $54 million, representing equity losses on our share of an obligation to repurchase at fair value the minority interest in one of BCE’s joint ventures. The obligation is marked to market each reporting period and the gain or loss on investment is recorded as equity gains or losses from investments in associates and joint ventures.
In 2015, BCE recognized a gain of $94 million as a result of its divestiture of its 50% ownership in Glentel to Rogers Communications Inc. Refer to Note 3,Business acquisitions and dispositions. Additionally,BCE recognized a $22 million loss on investments, which includes a loss on the sale of a call centre subsidiary, as well as a write down of the fair value of a financial asset related to one of our equity investments.
The following table shows the significant components of income taxes deducted from net earnings.
FOR THE YEAR ENDED DECEMBER 31 | 2015 | | 2014 | |
Current taxes | | | | |
Current taxes | (687 | ) | (789 | ) |
Resolution of uncertain tax positions | 27 | | 1 | |
Change in estimate relating to prior periods | 114 | | 93 | |
Utilization of previously unrecognized tax credits | 5 | | 23 | |
Deferred taxes | | | | |
Deferred taxes relating to the origination and reversal of temporary differences | (271 | ) | (165 | ) |
Change in estimate relating to prior periods | (106 | ) | (82 | ) |
Recognition and utilization of loss carryforwards | (14 | ) | (10 | ) |
Effect of change in provincial corporate tax rate | (6 | ) | – | |
Resolution of uncertain tax positions | 14 | | – | |
Total income taxes | (924 | ) | (929 | ) |
BCE Inc. 2015 ANNUAL REPORT 133 |
| NOTES TO CONSOLIDATED FINANCIAL STATEMENTS | |
The following table reconciles the amount of reported income taxes in the income statements with income taxes calculated at a statutory income tax rate of 26.9% and 26.6% for 2015 and 2014, respectively.
FOR THE YEAR ENDED DECEMBER 31 | 2015 | | 2014 | |
Net earnings | 2,730 | | 2,718 | |
Add back income taxes | 924 | | 929 | |
Earnings before income taxes | 3,654 | | 3,647 | |
Applicable statutory tax rate | 26.9 | % | 26.6 | % |
Income taxes computed at applicable statutory rates | (983 | ) | (970 | ) |
Non-taxable portion of gains on investments | 26 | | 4 | |
Resolution of uncertain tax positions | 41 | | 1 | |
Utilization of previously unrecognized tax credits | 5 | | 23 | |
Effect of change in provincial corporate tax rate | (6 | ) | – | |
Change in estimate relating to prior periods | 8 | | 11 | |
Other | (15 | ) | 2 | |
Total income taxes | (924 | ) | (929 | ) |
Average effective tax rate | 25.3 | % | 25.5 | % |
The following table shows aggregate current and deferred taxes relating to items recognized outside the income statements.
FOR THE YEAR ENDED DECEMBER 31 | 2015 | | 2014 | |
| OTHER | | | | OTHER | | | |
| COMPREHENSIVE | | | | COMPREHENSIVE | | | |
| INCOME | | DEFICIT | | INCOME | | DEFICIT | |
Current taxes | 29 | | 19 | | 12 | | 8 | |
Deferred taxes | (192 | ) | (3 | ) | 228 | | 11 | |
Total income tax (expense) recovery | (163 | ) | 16 | | 240 | | 19 | |
The following table shows deferred taxes resulting from temporary differences between the carrying amounts of assets and liabilities recognized in the statements of financial position and their corresponding tax basis, as well as tax loss carryforwards.
| | | | | | | PROPERTY, | | | | | | | | | |
| | | | | | | PLANT AND | | | | | | | | | |
| NON- | | POST- | | | | EQUIPMENT | | | | | | | | | |
| CAPITAL | | EMPLOY- | | INDEFINITE- | | AND | | | | | | | | | |
| LOSS | | MENT | | LIFE | | FINITE-LIFE | | | | CRTC | | | | | |
| CARRY- | | BENEFIT | | INTANGIBLE | | INTANGIBLE | | INVESTMENT | | TANGIBLE | | | | | |
NET DEFERRED TAX LIABILITY | FORWARD | | PLANS | | ASSETS | | ASSETS | | TAX CREDITS | | BENEFITS | | OTHER | | TOTAL | |
January 1, 2014 | 36 | | 547 | | (1,521 | ) | (601 | ) | (21 | ) | 93 | | 314 | | (1,153 | ) |
Income statement | (10 | ) | (75 | ) | (33 | ) | (98 | ) | 14 | | (18 | ) | (37 | ) | (257 | ) |
Other comprehensive loss | – | | 242 | | – | | – | | – | | – | | (14 | ) | 228 | |
Deficit | – | | – | | – | | – | | – | | – | | 11 | | 11 | |
Other | – | | – | | – | | – | | – | | – | | 12 | | 12 | |
December 31, 2014 | 26 | | 714 | | (1,554 | ) | (699 | ) | (7 | ) | 75 | | 286 | | (1,159 | ) |
Income statement | (14 | ) | (4 | ) | (64 | ) | (268 | ) | 1 | | (14 | ) | (20 | ) | (383 | ) |
Business acquisition | – | | – | | (1 | ) | – | | – | | – | | – | | (1 | ) |
Business disposition | – | | – | | – | | (1 | ) | – | | – | | – | | (1 | ) |
Other comprehensive income | – | | (190 | ) | – | | – | | – | | – | | (2 | ) | (192 | ) |
Deficit | – | | – | | – | | – | | – | | – | | (3 | ) | (3 | ) |
Other | – | | – | | – | | – | | – | | – | | 4 | | 4 | |
December 31, 2015 | 12 | | 520 | | (1,619 | ) | (968 | ) | (6 | ) | 61 | | 265 | | (1,735 | ) |
At December 31, 2015, BCE had $197 million of non-capital loss carryforwards. We:
- recognized a deferred tax asset of $12 million, of which $4 million related to Bell Media, for $44 million of the non-capital loss carryforwards. These non-capital loss carryforwards expire in varying annual amounts from 2030 to 2035.
- did not recognize a deferred tax asset for $153 million of non-capital loss carryforwards. This balance expires in varying annual amounts from 2023 to 2034.
At December 31, 2015, BCE had $783 million of unrecognized capital loss carryforwards, which can be carried forward indefinitely.
| 134 BCE Inc. 2015 ANNUAL REPORT |
| | NOTES TO CONSOLIDATED FINANCIAL STATEMENTS |
At December 31, 2014, BCE had $212 million of non-capital loss carryforwards. We:
- recognized a deferred tax asset of $26 million, of which $14 million related to Bell Media, for $99 million of the non-capital loss carryforwards. These non-capital loss carryforwards expire in varying annual amounts from 2029 to 2034.
- did not recognize a deferred tax asset for $113 million of non-capital loss carryforwards. This balance expires in varying annual amounts from 2026 to 2032.
At December 31, 2014, BCE had $766 million of unrecognized capital loss carryforwards, which can be carried forward indefinitely.
| |
| Note 10 Earnings per share |
The following table shows the components used in the calculation of basic and diluted earnings per common share for earnings attributable to common shareholders.
FOR THE YEAR ENDED DECEMBER 31 | 2015 | | 2014 | |
Net earnings attributable to common shareholders – basic | 2,526 | | 2,363 | |
Dividends declared per common share (in dollars) | 2.60 | | 2.47 | |
Weighted average number of common shares outstanding (in millions) | | | | |
Weighted average number of common shares outstanding – basic | 847.1 | | 793.7 | |
Assumed exercise of stock options(1) | 1.2 | | 0.9 | |
Weighted average number of common shares outstanding – diluted (in millions) | 848.3 | | 794.6 | |
| (1) | The calculation of the assumed exercise of stock options includes the effect of the average unrecognized future compensation cost of dilutive options. It excludes options for which the exercise price is higher than the average market value of a BCE common share. The number of excluded options was 2,779,299 in 2015 and 2,871,730 in 2014. |
| |
| Note 11 Trade and other receivables |
FOR THE YEAR ENDED DECEMBER 31 | NOTE | | 2015 | | 2014 | |
Trade receivables(1) | | | 2,969 | | 3,068 | |
Allowance for doubtful accounts | 23 | | (64 | ) | (69 | ) |
Allowance for revenue adjustments | | | (75 | ) | (86 | ) |
Current tax receivable | | | 90 | | 87 | |
Other accounts receivable | | | 89 | | 69 | |
Total trade and other receivables | | | 3,009 | | 3,069 | |
| (1) | The details of securitized trade receivables are set out in Note 19, Debt due within one year. |
FOR THE YEAR ENDED DECEMBER 31 | 2015 | | 2014 | |
Work in progress | 66 | | 57 | |
Finished goods | 368 | | 297 | |
Provision | (18 | ) | (21 | ) |
Total inventory | 416 | | 333 | |
The total amount of inventory subsequently recognized as an expense in cost of revenues was $2,689 million and $2,421 million for 2015 and 2014, respectively.
BCE Inc. 2015 ANNUAL REPORT 135 |
| NOTES TO CONSOLIDATED FINANCIAL STATEMENTS | |
| |
| Note 13 Property, plant and equipment |
| | | NETWORK | | | | | | | |
| | | INFRASTRUCTURE | | LAND AND | | ASSETS UNDER | | | |
FOR THE YEAR ENDED DECEMBER 31, 2015 | NOTE | | AND EQUIPMENT | | BUILDINGS | | CONSTRUCTION | | TOTAL | (1) |
COST | | | | | | | | | | |
January 1, 2015 | | | 54,968 | | 5,100 | | 1,427 | | 61,495 | |
Additions | | | 2,145 | | 68 | | 1,525 | | 3,738 | |
Acquisition through business combinations | | | 1 | | – | | – | | 1 | |
Transfers | | | 1,112 | | 44 | | (1,661 | ) | (505 | ) |
Retirements and disposals | | | (991 | ) | (38 | ) | (4 | ) | (1,033 | ) |
Impairment losses recognized in earnings | 8 | | (2 | ) | – | | – | | (2 | ) |
December 31, 2015 | | | 57,233 | | 5,174 | | 1,287 | | 63,694 | |
ACCUMULATED DEPRECIATION | | | | | | | | | | |
January 1, 2015 | | | 37,461 | | 2,707 | | – | | 40,168 | |
Depreciation | | | 2,698 | | 192 | | – | | 2,890 | |
Retirements and disposals | | | (937 | ) | (24 | ) | – | | (961 | ) |
Other | | | (39 | ) | 6 | | – | | (33 | ) |
December 31, 2015 | | | 39,183 | | 2,881 | | – | | 42,064 | |
NET CARRYING AMOUNT | | | | | | | | | | |
January 1, 2015 | | | 17,507 | | 2,393 | | 1,427 | | 21,327 | |
December 31, 2015 | | | 18,050 | | 2,293 | | 1,287 | | 21,630 | |
| (1) | Includes assets under finance leases. |
| | | NETWORK | | | | | | | |
| | | INFRASTRUCTURE | | LAND AND | | ASSETS UNDER | | | |
FOR THE YEAR ENDED DECEMBER 31, 2014 | NOTE | | AND EQUIPMENT | | BUILDINGS | | CONSTRUCTION | | TOTAL | (1) |
COST | | | | | | | | | | |
January 1, 2014 | | | 54,674 | | 4,996 | | 1,276 | | 60,946 | |
Additions | | | 2,150 | | 84 | | 1,640 | | 3,874 | |
Acquisition through business combinations | | | 2 | | – | | – | | 2 | |
Transfers | | | 1,108 | | 67 | | (1,487 | ) | (312 | ) |
Retirements and disposals | | | (2,923 | ) | (23 | ) | (2 | ) | (2,948 | ) |
Impairment losses recognized in earnings | 8 | | (43 | ) | (24 | ) | – | | (67 | ) |
December 31, 2014 | | | 54,968 | | 5,100 | | 1,427 | | 61,495 | |
ACCUMULATED DEPRECIATION | | | | | | | | | | |
January 1, 2014 | | | 37,665 | | 2,538 | | – | | 40,203 | |
Depreciation | | | 2,690 | | 190 | | – | | 2,880 | |
Retirements and disposals | | | (2,868 | ) | (19 | ) | – | | (2,887 | ) |
Other | | | (26 | ) | (2 | ) | – | | (28 | ) |
December 31, 2014 | | | 37,461 | | 2,707 | | – | | 40,168 | |
NET CARRYING AMOUNT | | | | | | | | | | |
January 1, 2014 | | | 17,009 | | 2,458 | | 1,276 | | 20,743 | |
December 31, 2014 | | | 17,507 | | 2,393 | | 1,427 | | 21,327 | |
| (1) | Includes assets under finance leases. |
| 136 BCE Inc. 2015 ANNUAL REPORT |
| | NOTES TO CONSOLIDATED FINANCIAL STATEMENTS |
BCE’s significant finance leases are for satellites and office premises. The office leases have a typical lease term of 25 years. The leases for satellites, used to provide programming to our Bell TV customers, have a term of 15 years.
The following table shows additions to and the net carrying amount of assets under finance leases.
| ADDITIONS | | NET CARRYING AMOUNT | |
FOR THE YEAR ENDED DECEMBER 31 | 2015 | | 2014 | | 2015 | | 2014 | |
Network infrastructure and equipment | 418 | | 317 | | 1,677 | | 1,605 | |
Land and buildings | 8 | | 12 | | 484 | | 519 | |
Total | 426 | | 329 | | 2,161 | | 2,124 | |
The following table provides a reconciliation of our minimum future lease payments to the present value of our finance lease obligations.
| | | | | | | | | | | | | THERE- | | | |
AT DECEMBER 31, 2015 | NOTE | | 2016 | | 2017 | | 2018 | | 2019 | | 2020 | | AFTER | | TOTAL | |
Minimum future lease payments | 23 | | 544 | | 484 | | 337 | | 261 | | 240 | | 1,199 | | 3,065 | |
Less: | | | | | | | | | | | | | | | | |
Future finance costs | | | (139 | ) | (125 | ) | (111 | ) | (98 | ) | (86 | ) | (246 | ) | (805 | ) |
Present value of future lease obligations | | | 405 | | 359 | | 226 | | 163 | | 154 | | 953 | | 2,260 | |
| |
| Note 14 Intangible assets |
FOR THE YEAR
ENDED DECEMBER 31, 2015 | | | FINITE-LIFE | | | | INDEFINITE-LIFE | | | |
| | | | | CUSTOMER | | PROGRAM | | | | | | | | SPECTRUM | | | | | | TOTAL | |
| | | | | RELATION- | | AND FEATURE | | | | | | | | AND OTHER | | BROADCAST | | | | INTANGIBLE | |
| NOTE | | SOFTWARE | | SHIPS | | FILM RIGHTS | | OTHER | | TOTAL | | BRAND | | LICENCES(1) | | LICENCES | | TOTAL | | ASSETS | |
COST | | | | | | | | | | | | | | | | | | | | | | |
January 1, 2015 | | | 6,298 | | 865 | | 524 | | 287 | | 7,974 | | 2,333 | | 2,693 | | 2,372 | | 7,398 | | 15,372 | |
Additions(1) | | | 345 | | – | | 917 | | 52 | | 1,314 | | – | | 566 | | – | | 566 | | 1,880 | |
Acquired through business combination | | | – | | – | | – | | – | | – | | – | | 10 | | – | | 10 | | 10 | |
Transfers | | | 519 | | – | | – | | – | | 519 | | – | | – | | – | | – | | 519 | |
Retirements and disposals | | | (256 | ) | 1 | | – | | (5 | ) | (260 | ) | – | | (2 | ) | – | | (2 | ) | (262 | ) |
Impairment losses recognized in earnings | 8 | | – | | – | | – | | (9 | ) | (9 | ) | – | | – | | (38 | ) | (38 | ) | (47 | ) |
Amortization included in operating costs | | | – | | – | | (864 | ) | – | | (864 | ) | – | | – | | – | | – | | (864 | ) |
December 31, 2015 | | | 6,906 | | 866 | | 577 | | 325 | | 8,674 | | 2,333 | | 3,267 | | 2,334 | | 7,934 | | 16,608 | |
ACCUMULATED AMORTIZATION | | | | | | | | | | | | | | | | | | | | | | |
January 1, 2015 | | | 4,606 | | 419 | | – | | 123 | | 5,148 | | – | | – | | – | | – | | 5,148 | |
Amortization | | | 460 | | 46 | | – | | 24 | | 530 | | – | | – | | – | | – | | 530 | |
Retirements and disposals | | | (245 | ) | 1 | | – | | (5 | ) | (249 | ) | – | | – | | – | | – | | (249 | ) |
Other | | | 3 | | – | | – | | – | | 3 | | – | | – | | – | | – | | 3 | |
December 31, 2015 | | | 4,824 | | 466 | | – | | 142 | | 5,432 | | – | | – | | – | | – | | 5,432 | |
NET CARRYING AMOUNT | | | | | | | | | | | | | | | | | | | | | | |
January 1, 2015 | | | 1,692 | | 446 | | 524 | | 164 | | 2,826 | | 2,333 | | 2,693 | | 2,372 | | 7,398 | | 10,224 | |
December 31, 2015 | | | 2,082 | | 400 | | 577 | | 183 | | 3,242 | | 2,333 | | 3,267 | | 2,334 | | 7,934 | | 11,176 | |
| (1) | On April 21, 2015, Bell Mobility Inc. (Bell Mobility) acquired advanced wireless services –3 (AWS-3) wireless spectrum in key urban and rural markets comprised of 13 licences for 169 million Megahertz per Population (MHz-POP) of AWS-3 spectrum for $500 million. On May 12, 2015, Bell Mobility acquired an additional 243 million MHz-POP of 2500 Megahertz (MHz) wireless spectrum for $29 million. |
BCE Inc. 2015 ANNUAL REPORT 137 |
| NOTES TO CONSOLIDATED FINANCIAL STATEMENTS | |
FOR THE YEAR
ENDED DECEMBER 31, 2014 | | | FINITE-LIFE | | | | INDEFINITE-LIFE | | | |
| | | | | CUSTOMER | | PROGRAM | | | | | | | | SPECTRUM | | | | | | TOTAL | |
| | | | | RELATION- | | AND FEATURE | | | | | | | | AND OTHER | | BROADCAST | | | | INTANGIBLE | |
| NOTE | | SOFTWARE | | SHIPS | | FILM RIGHTS | | OTHER | | TOTAL | | BRAND | | LICENCES(1) | | LICENCES | | TOTAL | | ASSETS | |
COST | | | | | | | | | | | | | | | | | | | | | | |
January 1, 2014 | | | 6,041 | | 865 | | 389 | | 293 | | 7,588 | | 2,344 | | 2,132 | | 2,389 | | 6,865 | | 14,453 | |
Additions(1) | | | 271 | | – | | 885 | | – | | 1,156 | | – | | 578 | | – | | 578 | | 1,734 | |
Transfers | | | 322 | | – | | – | | (6 | ) | 316 | | – | | – | | – | | – | | 316 | |
Retirements and disposals | | | (336 | ) | – | | – | | – | | (336 | ) | – | | (7 | ) | – | | (7 | ) | (343 | ) |
Impairment losses recognized in earnings | 8 | | – | | – | | – | | – | | – | | (11 | ) | (10 | ) | (17 | ) | (38 | ) | (38 | ) |
Amortization included in operating costs | | | – | | – | | (750 | ) | – | | (750 | ) | – | | – | | – | | – | | (750 | ) |
December 31, 2014 | | | 6,298 | | 865 | | 524 | | 287 | | 7,974 | | 2,333 | | 2,693 | | 2,372 | | 7,398 | | 15,372 | |
ACCUMULATED AMORTIZATION | | | | | | | | | | | | | | | | | | | | | | |
January 1, 2014 | | | 4,429 | | 368 | | – | | 104 | | 4,901 | | – | | – | | – | | – | | 4,901 | |
Amortization | | | 502 | | 51 | | – | | 19 | | 572 | | – | | – | | – | | – | | 572 | |
Retirements and disposals | | | (336 | ) | – | | – | | – | | (336 | ) | – | | – | | – | | – | | (336 | ) |
Other | | | 11 | | – | | – | | – | | 11 | | – | | – | | – | | – | | 11 | |
December 31, 2014 | | | 4,606 | | 419 | | – | | 123 | | 5,148 | | – | | – | | – | | – | | 5,148 | |
NET CARRYING AMOUNT | | | | | | | | | | | | | | | | | | | | | | |
January 1, 2014 | | | 1,612 | | 497 | | 389 | | 189 | | 2,687 | | 2,344 | | 2,132 | | 2,389 | | 6,865 | | 9,552 | |
December 31, 2014 | | | 1,692 | | 446 | | 524 | | 164 | | 2,826 | | 2,333 | | 2,693 | | 2,372 | | 7,398 | | 10,224 | |
| (1) | On April 2, 2014, Bell Mobility acquired 700 MHz spectrum licences in every province and territorial market, comprised of 31 licences for $566 million. |
| |
| Note 15 Investments in associates and joint ventures |
The following table provides summarized financial information in respect to BCE’s associates and joint ventures. For a list of associates and joint ventures please see Note 28, Related party transactions.
FOR THE YEAR ENDED DECEMBER 31 | NOTE | | 2015 | | 2014 | |
Assets | | | 5,067 | | 3,910 | |
Liabilities | | | (2,699 | ) | (2,202 | ) |
Total net assets | | | 2,368 | | 1,708 | |
BCE’s share of net assets | | | 1,119 | | 776 | |
Revenues | | | 2,125 | | 871 | |
Expenses | | | (2,261 | ) | (918 | ) |
Total net losses | | | (136 | ) | (47 | ) |
BCE’s share of net losses | 8 | | (49 | ) | (12 | ) |
| |
| Note 16 Other non-current assets |
FOR THE YEAR ENDED DECEMBER 31 | NOTE | | 2015 | | 2014 | |
Net assets of post-employment benefit plans | 21 | | 158 | | 151 | |
AFS publicly-traded and privately-held investments | 23 | | 128 | | 107 | |
Long-term notes and other receivables | | | 55 | | 47 | |
Derivative assets | | | 131 | | 269 | |
Other | | | 322 | | 301 | |
Total other non-current assets | | | 794 | | 875 | |
| 138 BCE Inc. 2015 ANNUAL REPORT |
| | NOTES TO CONSOLIDATED FINANCIAL STATEMENTS |
The following table provides details about the changes in the carrying amounts of goodwill for the years ended December 31, 2015 and 2014. BCE’s groups of CGUs correspond to our reporting segments.
| BELL | | BELL | | BELL | | | |
| WIRELESS | | WIRELINE | (1) | MEDIA | | BCE | |
Balance at January 1, 2014 | 2,302 | | 3,491 | | 2,588 | | 8,381 | |
Acquisitions and other | – | | – | | 4 | | 4 | |
Balance at December 31, 2014 | 2,302 | | 3,491 | | 2,592 | | 8,385 | |
Acquisitions and other | 1 | | – | | (9 | ) | (8 | ) |
Balance at December 31, 2015 | 2,303 | | 3,491 | | 2,583 | | 8,377 | |
| (1) | Goodwill of our former Bell Aliant segment is now included in the Bell Wireline segment. Refer to Note 24,Privatization of Bell Aliant. |
As described in Note 2, Significant accounting policies, goodwill is tested annually for impairment by comparing the carrying value of a CGU or group of CGUs to the recoverable amount, where the recoverable amount is the higher of fair value less costs of disposal or value in use.
VALUE IN USE
The value in use for a CGU or group of CGUs is determined by discounting five-year cash flow projections from business plans reviewed by senior management. The projections reflect management’s expectations of revenue, segment profit, capital expenditures, working capital and operating cash flows, based on past experience and future expectations of operating performance.
Cash flows beyond the five-year period are extrapolated using perpetuity growth rates. None of the perpetuity growth rates exceed the long-term historical growth rates for the markets in which we operate.
The discount rates are applied to the cash flow projections and are derived from the weighted average cost of capital for each CGU or group of CGUs.
The following table shows the key assumptions used to estimate the recoverable amounts of the groups of CGUs.
| ASSUMPTIONS USED | |
| PERPETUITY | | | |
GROUPS OF CGUs | GROWTH RATE | | DISCOUNT RATE | |
Bell Wireless | 0.8 | % | 9.1 | % |
Bell Wireline | 0.9 | % | 7.2 | % |
Bell Media | 1.0 | % | 8.7 | % |
We believe that any reasonable possible change in the key assumptions on which the estimate of recoverable amounts of the Bell Wireless or Bell Wireline groups of CGUs is based would not cause their carrying amounts to exceed their recoverable amounts.
For the Bell Media group of CGUs, a decrease of (0.3%) in the perpetuity growth rate or an increase of 0.2% in the discount rate would have resulted in its recoverable amount being equal to its carrying value.
| |
| Note 18 Trade payables and other liabilities |
FOR THE YEAR ENDED DECEMBER 31 | NOTE | | 2015 | | 2014 | |
Trade payables and accruals | | | 2,303 | | 2,415 | |
Deferred revenues | | | 812 | | 764 | |
Compensation payable | | | 512 | | 631 | |
Taxes payable | | | 124 | | 115 | |
Severance and other costs payable | | | 107 | | 69 | |
CRTC tangible benefits obligation | 23 | | 61 | | 63 | |
CRTC deferral account obligation | 23 | | 16 | | 24 | |
Other current liabilities | | | 352 | | 317 | |
Total trade payables and other liabilities | | | 4,287 | | 4,398 | |
BCE Inc. 2015 ANNUAL REPORT 139 |
| NOTES TO CONSOLIDATED FINANCIAL STATEMENTS | |
| |
| Note 19 Debt due within one year |
| | | WEIGHTED AVERAGE | | | | | |
FOR THE YEAR ENDED DECEMBER 31 | NOTE | | INTEREST RATE | | 2015 | | 2014 | |
Notes payable(1) | 23 | | 0.66 | % | 1,666 | | 1,454 | |
Loans secured by trade receivables | 23 | | 1.49 | % | 931 | | 921 | |
Long-term debt due within one year(2) | | | 4.38 | % | 1,778 | | 1,376 | |
Unsecured committed term credit facility (Astral) | | | 1.29 | % | 526 | | – | |
Net unamortized discount | | | | | – | | (1 | ) |
Unamortized debt issuance costs | | | | | (6 | ) | (7 | ) |
Total long-term debt due within one year | 20 | | | | 2,298 | | 1,368 | |
Total debt due within one year | | | | | 4,895 | | 3,743 | |
| (1) | Includes commercial paper of $856 million in U.S. dollars ($1,185 million in Canadian dollars) and $431 million in U.S. dollars ($501 million in Canadian dollars) as at December 31, 2015 and 2014, respectively, which were drawn under our U.S. commercial paper program and have been hedged for foreign currency fluctuations through forward currency contracts. Refer to Note 23, Financial and capital management. |
| (2) | Included in long-term debt due within one year is the current portion of finance leases of $405 million at December 31, 2015 and $345 million at December 31, 2014. |
| |
| Securitized trade receivables |
Our securitized trade receivable programs are recorded as floating rate revolving loans secured by certain trade receivables, and expire on November 30, 2016 and December 31, 2017.
The following table provides further details on our securitized trade receivables.
FOR THE YEAR ENDED DECEMBER 31 | 2015 | | 2014 | |
Average interest rate throughout the year | 1.59 | % | 1.89 | % |
Secured trade receivables | 2,056 | | 2,091 | |
We continue to service these trade receivables. The buyers’ interest in the collection of these trade receivables ranks ahead of our interests, which means that we are exposed to certain risks of default on the amounts securitized.
We have provided various credit enhancements in the form of overcollateralization and subordination of our retained interests.
The buyers will reinvest the amounts collected by buying additional interests in our trade receivables until the securitized trade receivables agreements expire or are terminated. The buyers and their investors have no further claim on our other assets if customers do not pay the amounts owed.
Bell Canada may issue notes in an aggregate amount of up to $2 billion in either Canadian or U.S. dollars under its commercial paper program, supported by a committed revolving bank credit facility. The total amount of this credit facility may be drawn at any time.
The table below is a summary of our total bank credit facilities at December 31, 2015.
| | TOTAL
AVAILABLE | | DRAWN | | LETTERS OF CREDIT | | COMMERCIAL
PAPER
OUTSTANDING | | NET AVAILABLE | |
Committed credit facilities | | | | | | | | | | |
Unsecured revolving facility(1)(2) | 3,000 | | – | | – | | 1,659 | | 1,341 | |
Unsecured committed term credit facility (Astral)(3) | 526 | | 526 | | – | | – | | – | |
Other | 121 | | – | | 119 | | – | | 2 | |
Total committed credit facilities | 3,647 | | 526 | | 119 | | 1,659 | | 1,343 | |
Total non-committed credit facilities | 1,372 | | – | | 676 | | – | | 696 | |
Total committed and non-committed credit facilities | 5,019 | | 526 | | 795 | | 1,659 | | 2,039 | |
| (1) | Bell Canada’s $2.5 billion revolving facility expires in November 2020 and its $500 million expansion facility expires in November 2018. |
| (2) | As of December 31, 2015, Bell Canada’s outstanding commercial paper included $856 million in U.S. dollars ($1,185 million in Canadian dollars). All of Bell Canada’s commercial paper outstanding is included in debt due within one year. |
| (3) | The outstanding balance at December 31, 2015 was $380 million in U.S. dollars ($526 million in Canadian dollars), which is included in debt due within one year and has been hedged using cross currency basis swaps. Refer to Note 23, Financial and capital management. |
| 140 BCE Inc. 2015 ANNUAL REPORT |
| | NOTES TO CONSOLIDATED FINANCIAL STATEMENTS |
Some of our credit agreements:
- require us to meet specific financial ratios
- require us to offer to repay and cancel the credit agreement upon a change of control of BCE or Bell Canada
We are in compliance with all conditions and restrictions under such credit agreements.
| | | WEIGHTED AVERAGE
INTEREST RATE | | | | | | | |
FOR THE YEAR ENDED DECEMBER 31 | NOTE | | | MATURITY | | 2015 | | 2014 | |
Debentures | | | | | | | | | | |
1997 trust indenture | | | 4.34 | % | 2016–2045 | | 13,400 | | 12,900 | |
1976 trust indenture | | | 9.54 | % | 2021–2054 | | 1,100 | | 1,100 | |
Subordinated debentures | | | 8.21 | % | 2026–2031 | | 275 | | 275 | |
Finance leases | | | 6.77 | % | 2016–2047 | | 2,260 | | 2,221 | |
Unsecured committed term credit facility (Astral)(1) | | | 1.29 | % | 2016 | | 526 | | 1,018 | |
Other | | | | | | | 141 | | 219 | |
Total debt | | | | | | | 17,702 | | 17,733 | |
Net unamortized premium | | | | | | | 24 | | 30 | |
Unamortized debt issuance costs | | | | | | | (38 | ) | (40 | ) |
Less: | | | | | | | | | | |
Amount due within one year | 19 | | | | | | (2,298 | ) | (1,368 | ) |
Total long-term debt | | | | | | | 15,390 | | 16,355 | |
| (1) | Represents $526 million in Canadian dollars ($380 million in U.S. dollars), which was drawn under Bell Canada’s unsecured committed credit facility and has been hedged using cross currency basis swaps ($1,018 million in Canadian dollars or $877 million in U.S. dollars in 2014). Refer to Note 23, Financial and capital management. |
Bell Canada’s debentures and subordinated debentures have been issued in Canadian dollars and the majority bear a fixed rate of interest.
Interest payments on debt for a principal amount of $700 million have been swapped from fixed to floating. See Note 23, Financial and capital managementfor additional details.
Some of our debt agreements:
- require us to meet specific financial ratios
- impose covenants, maintenance tests and new issue tests
- require us to make an offer to repurchase certain series of debentures upon the occurrence of a change of control event as defined in the relevant debt agreements
We are in compliance with all conditions and restrictions under such debt agreements.
All outstanding debentures are issued under trust indentures and are unsecured. All debentures are issued in series and certain series are redeemable at Bell Canada’s option prior to maturity at the prices, times and conditions specified for each series.
2015
In 2015, Bell Canada repaid approximately $500 million ($395 million U.S. dollars) of the borrowings under its unsecured committed term credit facility that was used to partially fund the acquisition of Astral.
On November 2, 2015, Bell Canada redeemed early its 3.60% Series M-21 medium term notes (MTN) debentures, issued under its 1997 trust indenture, having an outstanding principal amount of $1 billion which were due on December 2, 2015.
On October 1, 2015, Bell Canada issued 3.00% Series M-40 MTN debentures under its 1997 trust indenture, with a principal amount of $1 billion, which mature on October 3, 2022.
On March 30, 2015, Bell Canada issued 4.35% Series M-39 MTN debentures under its 1997 trust indenture, with a principal amount of $500 million, which mature on December 18, 2045.
BCE Inc. 2015 ANNUAL REPORT 141 |
| NOTES TO CONSOLIDATED FINANCIAL STATEMENTS | |
Subsequent to year end, on January 11, 2016, Bell Canada redeemed, prior to maturity, its 4.64% Series M-19 MTN debentures, having an outstanding principal amount of $200 million which were due on February 22, 2016, as well as its 3.65% Series M-23 MTN debentures, having an outstanding principal amount of $500 million which were due on May 19, 2016.
In addition, on February 29, 2016, Bell Canada issued 3.55% Series M-41 MTN debentures under its 1997 trust indenture, with a principal amount of $750 million, which mature on March 2, 2026.
2014
On November 20, 2014, all Bell Aliant Regional Communications, Limited Partnership (Bell Aliant LP) MTNs and floating rate MTNs (collectively, Bell Aliant notes) in the aggregate principal amount of $2.3 billion were exchanged for Bell Canada debentures having the same financial terms as the Bell Aliant notes, including with respect to coupon rate, maturity date and redemption price. As a result, $25 million of deferred costs related to the Bell Aliant LP debt were expensed and recorded as early debt redemption costs in Other (expense) incomein the income statement. Refer to Note 8,Other (expense) income.
The following Bell Canada debentures were issued in exchange for the previously held Bell Aliant notes.
SERIES | COUPON RATE | | MATURITY DATE | | PRINCIPAL AMOUNT | |
M-32 | 5.41 | % | September 26, 2016 | | 500 | |
M-33 | 5.52 | % | February 26, 2019 | | 300 | |
M-34 | 6.17 | % | February 26, 2037 | | 300 | |
M-35 | 4.37 | % | September 13, 2017 | | 350 | |
M-36 | 4.88 | % | April 26, 2018 | | 300 | |
M-37 | 3.54 | % | June 12, 2020 | | 400 | |
M-38 | floating | | April 22, 2016 | | 150 | |
Total | | | | | 2,300 | |
On October 30, 2014, Bell Aliant LP redeemed early its 6.29% MTNs with a principal amount of $350 million which were due on February 17, 2015. We incurred a $4 million charge for the early debt redemption costs which was recorded inOther income (expense) in 2014 in the income statement.
On September 29, 2014, Bell Canada issued 3.15% Series M-30 MTN debentures under its 1997 trust indenture, with a principal amount of $750 million which mature on September 29, 2021. In addition, on the same date, Bell Canada issued 4.75% Series M-31 MTN debentures under its 1997 trust indenture, with a principal amount of $500 million, which mature on September 29, 2044.
On April 22, 2014, Bell Aliant LP issued floating rate MTNs, with a principal amount of $150 million, which would have matured on April 22, 2016. These MTNs were exchanged for Bell Canada debentures on November 20, 2014.
On February 18, 2014, all of the outstanding CTV Specialty Television Inc. (CTV Specialty) notes of $300 million were repaid upon maturity.
| |
| Note 21 Post-employment benefit plans |
Post-employment benefit plans cost
We provide pension and other benefits for most of our employees. These include DB pension plans, DC pension plans and OPEBs.
We operate our DB and DC pension plans under applicable Canadian and provincial pension legislation, which prescribes minimum and maximum DB funding requirements. Plan assets are held in trust, and the oversight of governance of the plans, including investment decisions, contributions to DB plans and the selection of the DC plans investment options offered to plan participants, lies with the Pension Fund Committee, a committee of our board of directors.
The interest rate risk is managed using a liability matching approach, which reduces the exposure of the DB plans to a mismatch between investment growth and obligation growth.
The longevity risk is managed using a longevity swap, which reduces the exposure of the DB plan to an increase in life expectancy.
| 142 BCE Inc. 2015 ANNUAL REPORT |
| | NOTES TO CONSOLIDATED FINANCIAL STATEMENTS |
COMPONENTS OF POST-EMPLOYMENT BENEFIT PLANS SERVICE COST
| FOR THE YEAR ENDED DECEMBER 31 | 2015 | | 2014 | |
DB pension | (232 | ) | (214 | ) |
DC pension | (96 | ) | (94 | ) |
OPEBs | (8 | ) | (9 | ) |
Less: | | | | |
Capitalized benefit plans cost | 55 | | 41 | |
Total post-employment benefit plans service cost included in operating costs | (281 | ) | (276 | ) |
Other costs recognized in severance, acquisition and other costs | (44 | ) | (29 | ) |
Total post-employment benefit plans service cost | (325 | ) | (305 | ) |
COMPONENTS OF POST-EMPLOYMENT BENEFIT PLANS FINANCING COST
| FOR THE YEAR ENDED DECEMBER 31 | 2015 | | 2014 | |
DB pension | (53 | ) | (35 | ) |
OPEBs | (57 | ) | (66 | ) |
Total interest on post-employment benefit obligations | (110 | ) | (101 | ) |
The statements of comprehensive income include the following amounts before income taxes.
| | 2015 | | 2014 | |
Cumulative losses recognized directly in equity, January 1 | (2,974 | ) | (2,036 | ) |
Actuarial gains (losses) in other comprehensive income(1) | 594 | | (933 | ) |
Increase in the effect of the asset limit(2) | (4 | ) | (5 | ) |
Cumulative losses recognized directly in equity, December 31 | (2,384 | ) | (2,974 | ) |
| (1) | The cumulative actuarial losses recognized in the statements of comprehensive income are $2,640 million in 2015. |
| (2) | The cumulative decrease in the effect of the asset limit recognized in the statements of comprehensive income is $256 million in 2015. |
COMPONENTS OF POST-EMPLOYMENT BENEFIT (OBLIGATIONS) ASSETS
The following table shows the change in post-employment benefit obligations and the fair value of plan assets.
| | DB PENSION PLANS | OPEB PLANS | TOTAL |
| | 2015 | | 2014 | | 2015 | | 2014 | | 2015 | | 2014 | |
Post-employment benefit obligations, January 1 | (20,988 | ) | (18,672 | ) | (1,707 | ) | (1,641 | ) | (22,695 | ) | (20,313 | ) |
Current service cost | (232 | ) | (214 | ) | (8 | ) | (9 | ) | (240 | ) | (223 | ) |
Interest on obligations | (825 | ) | (901 | ) | (67 | ) | (78 | ) | (892 | ) | (979 | ) |
Actuarial gains (losses)(1) | 291 | | (2,240 | ) | 5 | | (56 | ) | 296 | | (2,296 | ) |
Net curtailment losses | (39 | ) | (29 | ) | (5 | ) | – | | (44 | ) | (29 | ) |
Benefit payments | 1,122 | | 1,076 | | 77 | | 77 | | 1,199 | | 1,153 | |
Employee contributions | (5 | ) | (5 | ) | – | | – | | (5 | ) | (5 | ) |
Other | 1 | | (3 | ) | – | | – | | 1 | | (3 | ) |
Post-employment benefit obligations, December 31 | (20,675 | ) | (20,988 | ) | (1,705 | ) | (1,707 | ) | (22,380 | ) | (22,695 | ) |
Fair value of plan assets, January 1 | 19,819 | | 18,082 | | 261 | | 241 | | 20,080 | | 18,323 | |
Expected return on plan assets(2) | 772 | | 866 | | 10 | | 12 | | 782 | | 878 | |
Actuarial gains (losses) | 301 | | 1,351 | | (3 | ) | 12 | | 298 | | 1,363 | |
Benefit payments | (1,122 | ) | (1,076 | ) | (77 | ) | (77 | ) | (1,199 | ) | (1,153 | ) |
Employer contributions | 469 | | 591 | | 75 | | 73 | | 544 | | 664 | |
Employee contributions | 5 | | 5 | | – | | – | | 5 | | 5 | |
Fair value of plan assets, December 31 | 20,244 | | 19,819 | | 266 | | 261 | | 20,510 | | 20,080 | |
Plan deficit | (431 | ) | (1,169 | ) | (1,439 | ) | (1,446 | ) | (1,870 | ) | (2,615 | ) |
Effect of asset limit | (10 | ) | (6 | ) | – | | – | | (10 | ) | (6 | ) |
Post-employment benefit liability, December 31 | (441 | ) | (1,175 | ) | (1,439 | ) | (1,446 | ) | (1,880 | ) | (2,621 | ) |
Post-employment benefit assets included in other non-current assets | 158 | | 151 | | – | | – | | 158 | | 151 | |
Post-employment benefit obligations | (599 | ) | (1,326 | ) | (1,439 | ) | (1,446 | ) | (2,038 | ) | (2,772 | ) |
| (1) | Actuarial gains include experience gains of $123 million in 2015 and $1,534 million in 2014. |
| (2) | The actual return on plan assets was $1,080 million or 5.25% in 2015 and $2,241 million or 12.6% in 2014. |
BCE Inc. 2015 ANNUAL REPORT 143 |
NOTES TO CONSOLIDATED FINANCIAL STATEMENTS | |
FUNDED STATUS OF POST-EMPLOYMENT BENEFIT PLANS COST
The following table shows the funded status of our post-employment benefit obligations.
| | FUNDED | PARTIALLY FUNDED(1) | UNFUNDED(2) | TOTAL |
| FOR THE YEAR ENDED DECEMBER 31 | 2015 | | 2014 | | 2015 | | 2014 | | 2015 | | 2014 | | 2015 | | 2014 | |
Present value of post-employment benefit obligations | (20,064 | ) | (20,375 | ) | (2,061 | ) | (1,906 | ) | (255 | ) | (414 | ) | (22,380 | ) | (22,695 | ) |
Fair value of plan assets | 20,204 | | 19,783 | | 306 | | 297 | | – | | – | | 20,510 | | 20,080 | |
Plan deficit | 140 | | (592 | ) | (1,755 | ) | (1,609 | ) | (255 | ) | (414 | ) | (1,870 | ) | (2,615 | ) |
| (1) | The partially funded plans consist of supplementary executive retirement plans (SERPs) for eligible employees and OPEBs. The company partially funds the SERPs through letters of credit and a retirement compensation arrangement account with Canada Revenue Agency. Certain paid-up life insurance benefits are funded through life insurance contracts. |
| (2) | Our unfunded plans consist of OPEBs, which are pay-as-you-go. |
SIGNIFICANT ASSUMPTIONS
We used the following key assumptions to measure the post-employment benefit obligations and the net benefit plans cost for the DB pension plans and OPEB plans. These assumptions are long-term, which is consistent with the nature of post-employment benefit plans.
| | DB PENSION PLANS AND OPEB PLANS |
| | 2015 | | 2014 | |
At December 31 | | | | |
Post-employment benefit obligations | | | | |
Discount rate | 4.2 | % | 4.0 | % |
Rate of compensation increase | 2.5 | % | 2.5 | % |
Cost of living indexation rate(1) | 1.6 | % | 1.6 | % |
Life expectancy at age 65 (years) | 23.0 | | 23.0 | |
For the year ended December 31 | | | | |
Net post-employment benefit plans cost | | | | |
Discount rate | 4.0 | % | 4.9 | % |
Rate of compensation increase | 2.5 | % | 2.8 | % |
Cost of living indexation rate(1) | 1.6 | % | 1.7 | % |
Life expectancy at age 65 (years) | 23.0 | | 22.4 | |
| (1) | Cost of living indexation rate is only applicable to DB pension plans. |
The weighted average duration of the post-employment benefit obligation is 15 years.
We assumed the following trend rates in healthcare costs:
- an annual increase in the cost of medication of 8.0% for 2015decreasing to 4.5% over 20 years
- an annual increase in the cost of covered dental benefits of 4.0%
- an annual increase in the cost of covered hospital benefitsof 3.2%
- an annual increase in the cost of other covered healthcarebenefits of 3.0%
Assumed trend rates in healthcare costs have a significant effect on the amounts reported for the healthcare plans.
The following table shows the effect of a 1% change in the assumed trend rates in healthcare costs.
EFFECT ON POST-EMPLOYMENT
BENEFITS – INCREASE (DECREASE) | 1% INCREASE | | 1% DECREASE | |
Total service and interest cost | 6 | | (5 | ) |
Post-employment benefit obligations | 142 | | (112 | ) |
SENSITIVITY ANALYSIS
The following table shows a sensitivity analysis of key assumptions used to measure the net post-employment benefit obligations and the net post-employment benefit plans cost for our DB pension plans and OPEB plans.
| | | | IMPACT ON NET POST-EMPLOYMENT
BENEFIT PLANS COST FOR 2015 –
INCREASE (DECREASE) | | IMPACT ON POST-EMPLOYMENT BENEFIT
OBLIGATIONS AT DECEMBER 31, 2015 –
INCREASE (DECREASE) |
| | CHANGE IN | | INCREASE IN | | DECREASE IN | | INCREASE IN | | DECREASE IN | |
| | ASSUMPTION | | ASSUMPTION | | ASSUMPTION | | ASSUMPTION | | ASSUMPTION | |
| Discount rate | 1 | % | (148 | ) | 112 | | (2,783 | ) | 3,178 | |
| Mortality rate | 25 | % | (66 | ) | 70 | | (1,386 | ) | 1,477 | |
| 144 BCE Inc. 2015 ANNUAL REPORT |
| | NOTES TO CONSOLIDATED FINANCIAL STATEMENTS |
POST-EMPLOYMENT BENEFIT PLAN ASSETS
The investment strategy for the post-employment benefit plan assets is to maintain a diversified portfolio of assets invested in a prudent manner to maintain the security of funds.
The following table shows the target allocations for 2015 and the allocation of our post-employment benefit plan assets at December 31, 2015 and 2014.
| | WEIGHTED AVERAGE
TARGET ALLOCATION | | TOTAL PLAN ASSETS FAIR VALUE
AT DECEMBER 31 (%) |
| ASSET CATEGORY | 2015 | | 2015 | | 2014 | |
Equity securities | 20%–35 | % | 26 | % | 30 | % |
Debt securities | 55%–80 | % | 65 | % | 62 | % |
Alternative investments | 0%–25 | % | 9 | % | 8 | % |
Total | | | 100 | % | 100 | % |
The fair value of the DB pension plan assets at the end of the year for each category are tabled below.
| FOR THE YEAR ENDED DECEMBER 31 | 2015 | | 2014 | |
Observable market data | | | | |
Equity securities | | | | |
Canadian | 910 | | 1,195 | |
Foreign | 4,263 | | 4,657 | |
Debt securities | | | | |
Canadian | 12,038 | | 10,986 | |
Foreign | 718 | | 921 | |
Money market | 431 | | 463 | |
Non-observable market inputs | | | | |
Alternative investments | | | | |
Private equities | 1,124 | | 947 | |
Hedge funds | 687 | | 651 | |
Other | 73 | | (1 | ) |
Total | 20,244 | | 19,819 | |
Equity securities included approximately $12 million of BCE common shares, or 0.06% of total plan assets, at December 31, 2015 and approximately $1 million of BCE common shares, or 0.01% of total plan assets, at December 31, 2014.
Debt securities included approximately $32 million of Bell Canada debentures, or 0.16% of total plan assets at December 31, 2015 and approximately $2 million of Bell Canada debentures, or 0.01% of total plan assets, at December 31, 2014.
Alternative investments included the pension plan’s investment in MLSE of $135 million, or 0.67% of total plan assets, at December 31, 2015 and $135 million, or 0.68% of total plan assets at December 31, 2014.
On February 23, 2015, the Bell Canada pension plan entered into an investment arrangement to hedge part of its exposure to potential increases in longevity, which covers approximately $5 billion of post-employment benefit obligations. The fair value of the arrangement is included within other alternative investments. As a hedging arrangement of the pension plan, the transaction requires no cash contributions from BCE.
CASH FLOWS
We are responsible for adequately funding our DB pension plans. We make contributions to them based on various actuarial cost methods that are permitted by pension regulatory bodies. Contributions reflect actuarial assumptions about future investment returns, salary projections and future service benefits. Changes in these factors could cause actual future contributions to differ from our current estimates and could require us to increase contributions to our post-employment benefit plans in the future, which could have a negative effect on our liquidity and financial performance.
We contribute to the DC pension plans as employees provide service.
BCE Inc. 2015 ANNUAL REPORT 145 |
NOTES TO CONSOLIDATED FINANCIAL STATEMENTS | |
The following table shows the amounts we contributed to the DB and DC pension plans and the payments made to beneficiaries under OPEB plans.
| | DB PLANS(1) | DC PLANS | OPEB PLANS |
| FOR THE YEAR ENDED DECEMBER 31 | 2015 | | 2014 | | 2015 | | 2014 | | 2015 | | 2014 | |
| Contributions | (469 | ) | (591 | ) | (97 | ) | (92 | ) | (75 | ) | (73 | ) |
| (1) | Includes voluntary contributions of $250 million in 2015 and $350 million in 2014. |
We expect to contribute approximately $235 million to our DB pension plans in 2016, subject to actuarial valuations being completed. We expect to pay approximately $85 million to beneficiaries under OPEB plans and to contribute approximately $105 million to the DC pension plans in 2016.
| |
| Note 22 Other non-current liabilities |
| FOR THE YEAR ENDED DECEMBER 31 | NOTE | | 2015 | | 2014 | |
Long-term disability benefits obligation | | | 294 | | 261 | |
CRTC tangible benefits obligation | 23 | | 166 | | 222 | |
CRTC deferral account obligation | 23 | | 138 | | 150 | |
Maple Leaf Sports and Entertainment Ltd. (MLSE) financial liability(1) | 23 | | 135 | | 135 | |
Deferred revenue on long-term contracts | | | 85 | | 96 | |
Future tax liabilities | | | 54 | | 81 | |
Other | | | 548 | | 576 | |
Total other non-current liabilities | | | 1,420 | | 1,521 | |
| (1) | Represents BCE’s obligation to repurchase the BCE Master Trust Fund’s (Master Trust) 9% interest in MLSE at a price not less than an agreed minimum price should the Master Trust exercise its put option. The obligation to repurchase is marked to market each reporting period and the gain or loss is recorded in Other (expense) income. |
| |
| Note 23 Financial and capital management |
Financial management
Management’s objectives are to protect BCE and its subsidiaries on a consolidated basis against material economic exposures and variability of results from various financial risks that include credit risk, liquidity risk, foreign currency risk, interest rate risk and equity price risk.
DERIVATIVES
We use derivative instruments to manage our exposure to foreign currency risk, interest rate risk and changes in the price of BCE common shares under our share-based payment plans.
The following derivative instruments were outstanding during 2015 and/or 2014:
- foreign currency forward contracts and options that managethe foreign currency risk of certain purchase commitments
- cross currency basis swaps that hedge foreign currency riskon a portion of our long-term debt due within one year
- interest rate swaps that hedge interest rate risk on a portionof our long-term debt
- interest rate locks on future debt issuances and dividend rateresets on preferred shares
- forward contracts on BCE common shares that mitigate the cashflow exposure related to share-based payment plans
FAIR VALUE
Fair value is the price that would be received to sell an asset or paid to transfer a liability in an orderly transaction between market participants at the measurement date.
Certain fair value estimates are affected by assumptions we make about the amount and timing of future cash flows and discount rates, all of which reflect varying degrees of risk. Income taxes and other expenses that would be incurred on disposition of financial instruments are not reflected in the fair values. As a result, the fair values are not the net amounts that would be realized if these instruments were settled.
The carrying values of our cash and cash equivalents, trade and other receivables, trade payables and accruals, compensation payable, severance and other costs payable, interest payable, dividends payable, notes payable and loans secured by trade receivables approximate fair value as they are short-term.
| 146 BCE Inc. 2015 ANNUAL REPORT |
| | NOTES TO CONSOLIDATED FINANCIAL STATEMENTS |
The following table provides the fair value details of financial instruments measured at amortized cost in the statements of financial position.
| | | | | DECEMBER 31, 2015 | DECEMBER 31, 2014 |
| | | | | CARRYING | | FAIR | | CARRYING | | FAIR | |
| FAIR VALUE METHODOLOGY | NOTE | | VALUE | | VALUE | | VALUE | | VALUE | |
CRTC tangible benefits obligation | Present value of estimated future cash flows discounted using observable market interest rates | 18, 22 | | 227 | | 234 | | 285 | | 289 | |
CRTC deferral account obligation | Present value of estimated future cash flows discounted using observable market interest rates | 18, 22 | | 154 | | 163 | | 174 | | 191 | |
Debentures, finance leases and other debt | Quoted market price of debt or present value of future cash flows discounted using observable market interest rates | 19, 20 | | 17,688 | | 19,764 | | 17,723 | | 20,059 | |
The following table provides the fair value details of financial instruments measured at fair value in the statements of financial position.
| | | | | | FAIR VALUE AT DECEMBER 31 |
| | NOTE | | CARRYING VALUE OF
ASSET (LIABILITY) AT
DECEMBER 31 | | QUOTED PRICES IN
ACTIVE MARKETS FOR
IDENTICAL ASSETS
(LEVEL 1) | | OBSERVABLE MARKET
DATA
(LEVEL 2)(1) | | NON-OBSERVABLE
MARKET INPUTS
(LEVEL 3)(2) | |
| 2015 | | | | | | | | | | |
AFS publicly-traded and privately-held investments | 16 | | 128 | | 16 | | – | | 112 | |
Derivative financial instruments | | | 256 | | – | | 256 | | – | |
MLSE financial liability | 22 | | (135 | ) | – | | – | | (135 | ) |
Other | | | 30 | | – | | 56 | | (26 | ) |
| 2014 | | | | | | | | | | |
AFS publicly-traded and privately-held investments | 16 | | 107 | | 17 | | – | | 90 | |
Derivative financial instruments | | | 276 | | – | | 276 | | – | |
MLSE financial liability | 22 | | (135 | ) | – | | – | | (135 | ) |
Other | | | 12 | | – | | 22 | | (10 | ) |
| (1) | Observable market data such as equity prices, interest rates, swap rate curves and foreign currency exchange rates. |
| (2) | Non-observable market inputs such as discounted cash flows and earnings multiples. A reasonable change in our assumptions would not result in a significant increase (decrease) to our level 3 financial instruments. |
CREDIT RISK
We are exposed to credit risk from operating activities and certain financing activities, the maximum exposure of which is represented by the carrying amounts reported in the statements of financial position.
We are exposed to credit risk if counterparties to our trade receivables and derivative instruments are unable to meet their obligations. The concentration of credit risk from our customers is minimized because we have a large and diverse customer base. There was minimal credit risk relating to derivative instruments at December 31, 2015 and 2014. We deal with institutions that have investment-grade credit ratings, and as such we expect that they will be able to meet their obligations. We regularly monitor our credit risk and credit exposure.
The following table provides the change in allowance for doubtful accounts for trade receivables.
| | 2015 | | 2014 | |
Balance, January 1 | (69 | ) | (79 | ) |
Additions | (86 | ) | (49 | ) |
Use | 91 | | 59 | |
Balance, December 31 | (64 | ) | (69 | ) |
In many instances, trade receivables are written off directly to bad debt expense if the account has not been collected after a predetermined period of time.
The following table provides further details on trade receivables not impaired.
| AT DECEMBER 31 | 2015 | | 2014 | |
Trade receivables not past due | 2,205 | | 2,267 | |
Trade receivables past due and not impaired | | | | |
Under 60 days | 289 | | 317 | |
60 to 120 days | 339 | | 352 | |
Over 120 days | 72 | | 63 | |
Trade receivables, net of allowance for doubtful accounts | 2,905 | | 2,999 | |
BCE Inc. 2015 ANNUAL REPORT 147 |
NOTES TO CONSOLIDATED FINANCIAL STATEMENTS | |
LIQUIDITY RISK
Our cash and cash equivalents, cash flows from operations and possible capital markets financing, are expected to be sufficient to fund our operations and fulfill our obligations as they become due. Should our cash requirements exceed the above sources of cash, we would expect to cover such a shortfall by drawing on existing committed bank facilities and new ones, to the extent available.
The following table is a maturity analysis for recognized financial liabilities at December 31, 2015 for each of the next five years and thereafter.
| AT DECEMBER 31, 2015 | NOTE | | 2016 | | 2017 | | 2018 | | 2019 | | 2020 | | THERE-
AFTER | | TOTAL | |
Long-term debt | 20 | | 1,899 | | 1,107 | | 1,731 | | 1,309 | | 1,401 | | 7,995 | | 15,442 | |
Notes payable | 19 | | 1,666 | | – | | – | | – | | – | | – | | 1,666 | |
Minimum future lease payments under finance leases | 13 | | 544 | | 484 | | 337 | | 261 | | 240 | | 1,199 | | 3,065 | |
Loan secured by trade receivables | 19 | | 931 | | – | | – | | – | | – | | – | | 931 | |
Interest payable on long-term debt, notes payable and loan secured by trade receivables | | | 728 | | 639 | | 575 | | 506 | | 457 | | 5,077 | | 7,982 | |
MLSE financial liability | 22 | | – | | 135 | | – | | – | | – | | – | | 135 | |
Net interest receipts on derivatives | | | (25 | ) | (12 | ) | – | | – | | – | | – | | (37 | ) |
| Total | | | 5,743 | | 2,353 | | 2,643 | | 2,076 | | 2,098 | | 14,271 | | 29,184 | |
We are also exposed to liquidity risk for financial liabilities due within one year, as shown in the statements of financial position.
MARKET RISK
CURRENCY EXPOSURES
We use forward contracts, options and cross currency basis swaps to manage foreign currency risk related to anticipated transactions and certain foreign currency debt.
A 10% depreciation (appreciation) in the value of the Canadian dollar relative to the U.S. dollar would result in a gain of $29 million (loss of $33 million) recognized in net earnings at December 31, 2015 and a gain (loss) of $40 million recognized in other comprehensive income at December 31, 2015, with all other variables held constant.
The following table provides further details on our outstanding foreign currency forward contracts, options and cross currency basis swaps as at December 31, 2015.
| | BUY | | AMOUNT TO | | | | AMOUNT TO | | | | | |
TYPE OF HEDGE | CURRENCY | | RECEIVE IN USD | | SELL CURRENCY | | PAY IN CAD | | MATURITY | | HEDGED ITEM | |
| Cash flow | USD | | 347 | | CAD | | 391 | | 2016 | | Purchase commitments | |
| Cash flow | USD | | 857 | | CAD | | 1,145 | | 2016 | | Commercial paper | |
| Cash flow | USD | | 46 | | CAD | | 56 | | 2017–2018 | | Purchase commitments | |
| Cash flow | USD | | 380 | | CAD | | 508 | | 2016 | | Credit facility | |
| Economic | USD | | 216 | | CAD | | 276 | | 2016 | | Purchase commitments | |
| Economic – call options | USD | | 120 | | CAD | | 154 | | 2016 | | Purchase commitments | |
| Economic – put options | USD | | 240 | | CAD | | 309 | | 2016 | | Purchase commitments | |
INTEREST RATE EXPOSURES
We use interest rate swaps to manage the mix of fixed and floating interest rates of our debt. We also use interest rate locks to hedge the interest rates on future debt issuances and to economically hedge dividend rate resets on preferred shares.
The following table shows the interest rate locks outstanding at December 31, 2015.
| TYPE OF HEDGE | NOTIONAL AMOUNT | | MATURITY | (1) | RATE | | SETTLEMENT DATE | | HEDGED ITEM | |
| Cash flow | 500 | | 2025 | | 1.92 | % | 2016 | | Long-term debt | |
| Economic | 350 | | 2020 | | 1.04 | % | 2016 | | Preferred shares | |
| (1) | Represents maturity of the underlying Government of Canada bond. |
The following table shows the interest rate swap outstanding at December 31, 2015.
| TYPE OF HEDGE | NOTIONAL AMOUNT | | RECEIVE INTEREST RATE | | PAY INTEREST RATE | | MATURITY | | HEDGED ITEM | |
| Fair value | 700 | | 5.00 | % | 3-month CDOR(1)+ 0.42 | % | 2017 | | Long-term debt | |
| (1) | Canadian dollar offered rate. |
| 148 BCE Inc. 2015 ANNUAL REPORT |
| | NOTES TO CONSOLIDATED FINANCIAL STATEMENTS |
In 2015, we recognized a loss of $18 million (2014–$15 million) on an interest rate swap used as a fair value hedge of long-term debt and an offsetting gain of $18 million (2014–$15 million) on the corresponding long-term debt.
A 1% increase (decrease) in interest rates would result in a decrease of $14 million (increase of $12 million) in net earnings at December 31, 2015 and a gain of $31 million (loss of $35 million) recognized in other comprehensive income as at December 31, 2015.
EQUITY PRICE EXPOSURES
We use equity forward contracts on BCE’s common shares to economically hedge the cash flow exposure related to the settlement of share-based payment plans. See Note 26,Share-based paymentsfor details on our share-based payment arrangements. The fair value of our equity forward contracts at December 31, 2015 was $86 million (2014–$157 million).
A 10% increase (decrease) in the market price of BCE’s common shares at December 31, 2015 would result in a gain (loss) of $69 million recognized in net earnings for 2015, all other variables held constant.
We have various capital policies, procedures and processes which are utilized to achieve our objectives for capital management. These include optimizing our cost of capital and maximizing shareholder return while balancing the interests of our stakeholders.
Our definition of capital includes equity attributable to BCE shareholders, debt, and cash and cash equivalents.
The key ratios that we use to monitor and manage our capital structure are a net debt leverage ratio(1)and an adjusted EBITDA to net interest expense ratio(2). Our net debt leverage ratio target range is 1.75 to 2.25 times adjusted EBITDA and our adjusted EBITDA to net interest expense ratio target is greater than 7.5 times. Wemonitor our capital structure and make adjustments, including to our dividend policy, as required. At December 31, 2015, we had exceeded the limit of our internal net debt leverage ratio target range by 0.28. This excess over the limit of our internal ratio target range does not create risk to our investment-grade credit rating.
These ratios do not have any standardized meaning under IFRS. Therefore, they are unlikely to be comparable to similar measures presented by other issuers. We use, and believe that certain investors and analysts use, our net debt leverage ratio and adjusted EBITDA to net interest expense ratio as a measure of financial leverage and health of the company.
The following table provides a summary of our key ratios.
| AT DECEMBER 31 | 2015 | | 2014 | |
| Net debt leverage ratio | 2.53 | | 2.59 | |
| Adjusted EBITDA to net interest expense ratio | 8.76 | | 8.38 | |
On February 3, 2016, the board of directors of BCE approved an increase of 5.0% in the annual dividend on BCE’s common shares, from $2.60 to $2.73 per common share. In addition, the board of directors of BCE declared a quarterly dividend of $0.6825 per common share, payable on April 15, 2016 to shareholders of record at March 15, 2016.
On February 4, 2015, the board of directors of BCE approved an increase of 5.3% in the annual dividend on BCE’s common shares, from $2.47 to $2.60 per common share.
| (1) | Our net debt leverage ratio represents net debt divided by adjusted EBITDA. We define net debt as debt due within one year plus long-term debt and 50% of preferred shares less cash and cash equivalents as shown in our statements of financial position. Adjusted EBITDA is defined as operating revenues less operating costs as shown in our income statements. |
| (2) | Our adjusted EBITDA to net interest expense ratio represents adjusted EBITDA divided by net interest expense. Adjusted EBITDA is defined as operating revenues less operating costs as shown in our income statements. Net interest expense is net interest expense as shown in our statements of cash flows and 50% of declared preferred share dividends as shown in our income statements. |
BCE Inc. 2015 ANNUAL REPORT 149 |
NOTES TO CONSOLIDATED FINANCIAL STATEMENTS | |
| |
| Note 24 Privatization of Bell Aliant |
On July 23, 2014, BCE announced its offer to acquire all of the issued and outstanding common shares of Bell Aliant that it did not already own for a total consideration of approximately $3.95 billion. BCE already controlled Bell Aliant, which provided local telephone, long distance, Internet, data, TV, wireless, home security and value-added business solutions to residential and business customers in the Atlantic provinces and in rural and regional areas of Ontario and Québec. On the same day, BCE also announced its offer to exchange all of the issued and outstanding preferred shares of Bell Aliant Preferred Equity Inc. (Prefco) for newly issued First Preferred Shares of BCE, with the same financial terms as the existing Prefco preferred shares (Preferred Share Exchange).
The privatization was completed on October 31, 2014 and the Preferred Share Exchange was completed on November 1, 2014. The privatization has simplified BCE’s corporate structure and increased overall operating and capital investment efficiencies while supporting BCE’s broadband investment strategy and dividend growth objective.
As BCE already consolidated the financial results of Bell Aliant, the privatization was accounted for as an equity transaction. The following table summarizes the impacts of the privatization in our 2014 consolidated statements of financial position.
| FOR THE YEAR ENDED DECEMBER 31 | NOTE | | 2014 | |
Consideration | | | | |
Issuance of 60.9 million BCE common shares(1) | 25 | | 2,928 | |
Cash | | | 989 | |
Exchange of Prefco preferred shares for BCE First Preferred Shares(1) | 25 | | 609 | |
Total | | | 4,526 | |
Allocated to | | | | |
Carrying value of Bell Aliant non-controlling interest | | | 877 | |
Contributed surplus | | | 1,499 | |
Accumulated other comprehensive income | | | 7 | |
Deficit | | | 2,143 | |
Total | | | 4,526 | |
| (1) | The stated capital for the BCE common and First Preferred Shares was recorded at fair value on the date of issuance. |
The following table outlines the BCE First Preferred Shares for which the existing Prefco preferred shares were exchanged as part of the Preferred Share Exchange.
| | | | | | | | REDEMPTION DATE(1) | | | | | | STATED | |
| | | | | | | | | | | NUMBER OF SHARES | | CAPITAL | |
| | ANNUAL | | | | | | | | | | | | | | |
| | DIVIDEND | | CONVERTIBLE | | | | | REDEMPTION | | | | ISSUED AND | | | |
| SERIES | RATE | | INTO | | CONVERSION DATE | | | PRICE | | AUTHORIZED | | OUTSTANDING | | | |
| AM | 4.85 | % | AN | | March 31, 2016 | | March 31, 2016 | | $25.00 | | 30,000,000 | | 11,500,000 | | 263 | |
| AO | 4.55 | % | AP | | March 31, 2017 | | March 31, 2017 | | $25.00 | | 30,000,000 | | 4,600,000 | | 118 | |
| AQ | 4.25 | % | AR | | September 30, 2018 | | September 30, 2018 | | $25.00 | | 30,000,000 | | 9,200,000 | | 228 | |
| | | | | | | | | | | | | | | | 609 | |
| (1) | BCE may redeem each of these series of preferred shares on the applicable redemption date and every five years after that date. |
Additionally in 2014, $35 million was charged to the deficit to record the transaction costs incurred related to the privatization. These costs include financial advisory, filing and legal fees.
| 150 BCE Inc. 2015 ANNUAL REPORT |
| | NOTES TO CONSOLIDATED FINANCIAL STATEMENTS |
Preferred shares
BCE’s articles of amalgamation provide for an unlimited number of First Preferred Shares and Second Preferred Shares, all without par value. The terms set out in the articles authorize BCE’s directors to issue the shares in one or more series and to set the number of shares and the conditions for each series.
The following table is a summary of the principal terms of BCE’s First Preferred Shares. There were no Second Preferred Shares issued and outstanding at December 31, 2015. BCE’s articles of amalgamation, as amended, describe the terms and conditions of these shares in detail.
| | | | | | | | | | | | NUMBER OF SHARES | | STATED CAPITAL |
| | ANNUAL | | | | | | | | | | | | | | | | | |
| | DIVIDEND | | CONVERTIBLE | | | | | | REDEMP- | | | | ISSUED AND | | DEC. 31, | | DEC. 31, | |
| SERIES | RATE | | INTO | | CONVERSION DATE | | REDEMPTION DATE | | TION PRICE | | AUTHORIZED | | OUTSTANDING | | 2015 | | 2014 | |
| Q(1) | floating | | Series R | | December 1, 2025 | | | | | | 8,000,000 | | – | | – | | – | |
| R(2) | 4.13% | | Series Q | | December 1, 2020 | | December 1, 2020 | | $25.00 | | 8,000,000 | | 8,000,000 | | 200 | | 200 | |
| S | floating | | Series T | | November 1, 2016 | | At any time | | $25.50 | | 8,000,000 | | 3,606,225 | | 90 | | 90 | |
| T(2) | 3.393% | | Series S | | November 1, 2016 | | November 1, 2016 | | $25.00 | | 8,000,000 | | 4,393,775 | | 110 | | 110 | |
| Y | floating | | Series Z | | December 1, 2017 | | At any time | | $25.50 | | 10,000,000 | | 8,772,468 | | 219 | | 219 | |
| Z(2) | 3.152% | | Series Y | | December 1, 2017 | | December 1, 2017 | | $25.00 | | 10,000,000 | | 1,227,532 | | 31 | | 31 | |
| AA(2) | 3.45% | | Series AB | | September 1, 2017 | | September 1, 2017 | | $25.00 | | 20,000,000 | | 10,144,302 | | 259 | | 259 | |
| AB | floating | | Series AA | | September 1, 2017 | | At any time | | $25.50 | | 20,000,000 | | 9,855,698 | | 251 | | 251 | |
| AC(2) | 3.55% | | Series AD | | March 1, 2018 | | March 1, 2018 | | $25.00 | | 20,000,000 | | 5,069,935 | | 129 | | 129 | |
| AD | floating | | Series AC | | March 1, 2018 | | At any time | | $25.50 | | 20,000,000 | | 14,930,065 | | 381 | | 381 | |
| AE | floating | | Series AF | | February 1, 2020 | | At any time | | $25.50 | | 24,000,000 | | 9,292,133 | | 232 | | 36 | |
| AF(2) | 3.11% | | Series AE | | February 1, 2020 | | February 1, 2020 | | $25.00 | | 24,000,000 | | 6,707,867 | | 168 | | 364 | |
| AG(2) | 4.50% | | Series AH | | May 1, 2016 | | May 1, 2016 | | $25.00 | | 22,000,000 | | 10,841,056 | | 271 | | 271 | |
| AH | floating | | Series AG | | May 1, 2016 | | At any time | | $25.50 | | 22,000,000 | | 3,158,944 | | 79 | | 79 | |
| AI(2) | 4.15% | | Series AJ | | August 1, 2016 | | August 1, 2016 | | $25.00 | | 22,000,000 | | 10,754,990 | | 269 | | 269 | |
| AJ | floating | | Series AI | | August 1, 2016 | | At any time | | $25.50 | | 22,000,000 | | 3,245,010 | | 81 | | 81 | |
| AK(2) | 4.15% | | Series AL | | December 31, 2016 | | December 31, 2016 | | $25.00 | | 25,000,000 | | 25,000,000 | | 625 | | 625 | |
| AL(3) | floating | | Series AK | | December 31, 2021 | | | | | | 25,000,000 | | – | | – | | – | |
| AM(2) | 4.85% | | Series AN | | March 31, 2016 | | March 31, 2016 | | $25.00 | | 30,000,000 | | 11,500,000 | | 263 | | 263 | |
| AN(3) | floating | | Series AM | | March 31, 2021 | | | | | | 30,000,000 | | – | | – | | – | |
| AO(2) | 4.55% | | Series AP | | March 31, 2017 | | March 31, 2017 | | $25.00 | | 30,000,000 | | 4,600,000 | | 118 | | 118 | |
| AP(3) | floating | | Series AO | | March 31, 2022 | | | | | | 30,000,000 | | – | | – | | – | |
| AQ(2) | 4.25% | | Series AR | | September 30, 2018 | | September 30, 2018 | | $25.00 | | 30,000,000 | | 9,200,000 | | 228 | | 228 | |
| AR(3) | floating | | Series AQ | | September 30, 2023 | | | | | | 30,000,000 | | – | | – | | – | |
| | | | | | | | | | | | | | | | 4,004 | | 4,004 | |
| (1) | If series Q first preferred shares are issued on December 1, 2020, BCE may redeem such shares at $25.50 per share on any date after December 1, 2020. |
| (2) | BCE may redeem each of these series of First Preferred Shares on the applicable redemption date and every five years after that date. |
| (3) | If Series AL, AN, AP or AR First Preferred Shares are issued on December 31, 2016, March 31, 2016, March 31, 2017 and September 30, 2018, respectively, BCE may redeem such shares at $25.00 per share on December 31, 2021, March 31, 2021, March 31, 2022 and September 30, 2023, respectively, and every five years thereafter (collectively, a Series conversion date). Alternatively, BCE may redeem Series AL, AN, AP or AR First Preferred Shares at $25.50 per share on any date after December 31, 2016, March 31, 2016, March 31, 2017 and September 30, 2018, respectively, which is not a Series conversion date. |
VOTING RIGHTS
All of the issued and outstanding First Preferred Shares at December 31, 2015 are non-voting, except under special circumstances, when the holders are entitled to one vote per share.
PRIORITY AND ENTITLEMENT TO DIVIDENDS
The First Preferred Shares of all series rank on a parity with each other and in priority to all other shares of BCE with respect to payment of dividends and with respect to distribution of assets in the event of liquidation, dissolution or winding up of BCE.
Holders of Series R, T, Z, AA, AC, AF, AG, AI, AK, AM, AO and AQ First Preferred Shares are entitled to fixed cumulative quarterly dividends. The dividend rate on these shares is reset every five years, as set out in BCE’s articles of amalgamation, as amended.
Holders of Series S, Y, AB, AD, AE, AH and AJ First Preferred Shares are entitled to floating adjustable cumulative monthly dividends. The floating dividend rate on these shares is calculated every month, as set out in BCE’s articles of amalgamation, as amended.
Dividends on all series of First Preferred Shares are paid as and when declared by the board of directors of BCE.
BCE Inc. 2015 ANNUAL REPORT 151 |
NOTES TO CONSOLIDATED FINANCIAL STATEMENTS | |
CONVERSION FEATURES
All of the issued and outstanding First Preferred Shares at December 31, 2015 are convertible at the holder’s option into another associated series of First Preferred Shares on a one-for-one basis according to the terms set out in BCE’s articles of amalgamation, as amended.
CONVERSION OF FIRST PREFERRED SHARES
On February 1, 2015, 7,904,105 of BCE’s 14,577,100 Cumulative Redeemable First Preferred Shares, Series AF (Series AF Preferred Shares) were converted, on a one-for-one basis, into Cumulative Redeemable First Preferred Shares, Series AE (Series AE Preferred Shares). In addition, on February 1, 2015, 34,872 of BCE’s 1,422,900 Series AE Preferred Shares were converted, on a one-for-one basis, into Series AF Preferred Shares. As a result, 6,707,867 Series AF Preferred Shares and 9,292,133 Series AE Preferred Shares remain outstanding.
ISSUE OF BCE FIRST PREFERRED SHARES IN EXCHANGE FOR PREFCO PREFERRED SHARES
In 2014, BCE issued Series AM, AO and AQ First Preferred Shares in exchange for the issued and outstanding preferred shares of Prefco, as described in Note 24,Privatization of Bell Aliant.
| |
| Common shares and Class B shares |
BCE’s articles of amalgamation provide for an unlimited number of voting common shares and non-voting Class B shares, all without par value. The common shares and the Class B shares rank equally in the payment of dividends and in the distribution of assets if BCE is liquidated, dissolved or wound up, after payments due to the holders of preferred shares. No Class B shares were outstanding at December 31, 2015 and 2014.
The following table provides details about the outstanding common shares of BCE.
| | | | 2015 | 2014 |
| | NOTE | | NUMBER OF
SHARES | | STATED
CAPITAL | | NUMBER OF
SHARES | | STATED
CAPITAL | |
| Outstanding, January 1 | | | 840,330,353 | | 16,717 | | 775,892,556 | | 13,629 | |
| Shares issued under bought deal offering | | | 15,111,000 | | 863 | | – | | – | |
| Shares issued for the privatization of Bell Aliant | 24 | | – | | – | | 60,879,365 | | 2,928 | |
| Shares issued for the acquisition of Glentel | 3 | | 5,548,908 | | 296 | | – | | – | |
| Shares issued under employee stock option plan | 26 | | 2,289,677 | | 96 | | 1,372,006 | | 53 | |
| Shares issued under ESP | | | 2,334,250 | | 128 | | 2,186,426 | | 107 | |
| Outstanding, December 31 | | | 865,614,188 | | 18,100 | | 840,330,353 | | 16,717 | |
On December 11, 2015, BCE issued 15,111,000 common shares to a syndicate of underwriters at a price of $57.10 per common share, representing a discount of $0.90 or 1.6% to the November 23, 2015 announcement date closing price. We incurred $35 million ($26 million net of tax) of issuance costs which were charged to the deficit.
CONTRIBUTED SURPLUS
Contributed surplus in 2015 and 2014 include premiums in excess of par value upon the issuance of BCE common shares.
As a result of the privatization of Bell Aliant, contributed surplus decreased in 2014 by $1,499 million, which represents primarily the amount originally recorded to contributed surplus from the distribution of fund units to the holders of BCE common shares by way of return of capital when Bell Aliant converted from a corporate structure to an income fund in 2006. Refer to Note 24,Privatization of Bell Aliant.
| |
| Note 26 Share-based payments |
The following share-based payment amounts are included in the income statements as operating costs.
| FOR THE YEAR ENDED DECEMBER 31 | 2015 | | 2014 | |
ESP | (28 | ) | (30 | ) |
RSUs/PSUs | (51 | ) | (49 | ) |
Other(1) | (15 | ) | (20 | ) |
Total share-based payments | (94 | ) | (99 | ) |
| (1) | Includes DSP, DSUs and stock options. |
| 152 BCE Inc. 2015 ANNUAL REPORT |
| | NOTES TO CONSOLIDATED FINANCIAL STATEMENTS |
ESP
The ESP is designed to encourage employees of BCE and its participating subsidiaries to own shares of BCE. Each year, employees can choose to have a certain percentage of their eligible annual earnings withheld through regular payroll deductions for the purchase of BCE common shares. In some cases, the employer also will contribute a percentage of the employee’s eligible annual earnings to the plan, up to a specified maximum. Dividends are credited to the participant’s account on each dividend payment date and are equivalent in value to the dividends paid on BCE common shares.
The BCE ESP allows employees to contribute up to 12% of their annual earnings, with a maximum employer contribution of 2%.
Employer contributions to the BCE plan are subject to employees holding their shares for a two-year vesting period. Dividends related to employer contributions are also subject to the two-year vesting period.
The trustee of the ESP buys BCE common shares for the participants on the open market, by private purchase or from treasury. BCE determines the method the trustee uses to buy the shares.
At December 31, 2015, 7,829,983 common shares were authorized for issuance from treasury under the BCE ESP.
The following table summarizes the status of unvested employer contributions at December 31, 2015 and 2014.
| NUMBER OF ESP SHARES | 2015 | | 2014 | |
Unvested contributions, January 1 | 1,153,653 | | 1,230,265 | |
Contributions(1) | 645,633 | | 631,038 | |
Dividends credited | 53,283 | | 60,621 | |
Vested | (600,815 | ) | (645,141 | ) |
Forfeited | (105,708 | ) | (123,130 | ) |
Unvested contributions, December 31 | 1,146,046 | | 1,153,653 | |
| (1) | The weighted average fair value of the shares contributed was $55 and $49 in 2015 and 2014, respectively. |
RSUs/PSUs
RSUs/PSUs are granted to executives and other key employees. The value of an RSU/PSU at the grant date is equal to the value of one BCE common share. Dividends in the form of additional RSUs/PSUs are credited to the participant’s account on each dividend payment date and are equivalent in value to the dividend paid on BCE common shares. Executives and other key employees are granted a specific number of RSUs/PSUs for a given performance period based on their position and level of contribution. RSUs/PSUs vest fully after three years of continuous employment from the date of grant and, in certain cases, if performance objectives are met, as determined by the board of directors.
The following table summarizes outstanding RSUs/PSUs at December 31, 2015 and 2014.
| NUMBER OF RSUs/PSUs | 2015 | | 2014 | |
Outstanding, January 1 | 3,616,967 | | 3,733,830 | |
Granted(1) | 1,005,062 | | 1,058,031 | |
Dividends credited | 157,485 | | 184,590 | |
Settled | (1,342,514 | ) | (1,259,067 | ) |
Forfeited | (103,417 | ) | (100,417 | ) |
Outstanding, December 31 | 3,333,583 | | 3,616,967 | |
Vested, December 31(2) | 1,138,861 | | 1,307,824 | |
| (1) | The weighted average fair value of the RSUs/PSUs granted was $55 and $48 in 2015 and 2014, respectively. |
| (2) | The RSUs/PSUs vested on December 31, 2015 were fully settled in February 2016 with BCE common shares and/or DSUs. |
DSP
The value of a deferred share is equal to the value of one BCE common share. Dividends in the form of additional deferred shares are credited to the participant’s account on each dividend payment date and are equivalent in value to the dividend paid on BCE common shares. Deferred shares vest fully after three years of continuous employment from the date of grant. The liability recorded in the statements of financial position and related to the deferred share plan was $38 million and $52 million at December 31, 2015 and December 31, 2014, respectively.
STOCK OPTIONS
Under BCE’s long-term incentive plans, BCE may grant options to executives to buy BCE common shares. The subscription price of a grant is based on the higher of:
- the volume-weighted average of the trading price on the tradingday immediately prior to the effective date of the grant
- the volume-weighted average of the trading price for thelast five consecutive trading days ending on the trading dayimmediately prior to the effective date of the grant
BCE Inc. 2015 ANNUAL REPORT 153 |
NOTES TO CONSOLIDATED FINANCIAL STATEMENTS | |
At December 31, 2015, 20,202,782 common shares were authorized for issuance under these plans. Options vest fully after three years of continuous employment from the date of grant. All options become exercisable when they vest and can be exercised for a period of seven years from the date of grant. Special vesting provisions may apply if:
- there is a change in control of BCE and the option holder’semployment ends
- the option holder is employed by a designated subsidiary of BCEand BCE’s ownership interest in that subsidiary falls below thepercentage set out in the plan
The following table summarizes BCE’s outstanding stock options at December 31, 2015 and 2014.
| | | | 2015 | 2014 |
| | | | | | WEIGHTED AVERAGE | | NUMBER OF OPTIONS | | WEIGHTED AVERAGE | |
| | NOTE | | NUMBER OF OPTIONS | | EXERCISE PRICE ($) | | | EXERCISE PRICE ($) | |
Outstanding, January 1 | | | 9,278,190 | | $43 | | 7,870,231 | | $40 | |
Granted | | | 2,835,667 | | $56 | | 2,915,361 | | $48 | |
Exercised(1) | 25 | | (2,289,677 | ) | $39 | | (1,372,006 | ) | $36 | |
Forfeited | | | (157,276 | ) | $49 | | (135,396 | ) | $44 | |
Outstanding, December 31 | | | 9,666,904 | | $48 | | 9,278,190 | | $43 | |
Exercisable, December 31 | | | 1,174,191 | | $38 | | 865,600 | | $36 | |
| (1) | The weighted average share price for options exercised was $56 and $49 in 2015 and 2014, respectively. |
The following table provides additional information about BCE’s stock option plans at December 31, 2015.
| | STOCK OPTIONS OUTSTANDING |
| | NUMBER | | WEIGHTED AVERAGE
REMAINING LIFE | | WEIGHTED AVERAGE
EXERCISE PRICE ($) | |
| RANGE OF EXERCISE PRICES |
| $30–$39 | 426,880 | | 2.14 | | $36 | |
| $40–$49 | 6,460,725 | | 4.47 | | $45 | |
| $50 or more | 2,779,299 | | 6.15 | | $56 | |
| | 9,666,904 | | 4.85 | | $48 | |
ASSUMPTIONS USED IN STOCK OPTION PRICING MODEL
The fair value of options granted was determined using a variation of a binomial option pricing model that takes into account factors specific to the share incentive plans, such as the vesting period. The following table shows the principal assumptions used in the valuation.
| | 2015 | |
Weighted average fair value per option granted | $2.25 | |
Weighted average share price | $55 | |
Weighted average exercise price | $56 | |
Dividend yield | 4.6 | % |
Expected volatility | 15 | % |
Risk-free interest rate | 0.7 | % |
Expected life (years) | 4.5 | |
Expected volatilities are based on the historical volatility of BCE’s share price. The risk-free rate used is equal to the yield available on Government of Canada bonds at the date of grant with a term equal to the expected life of the options.
DSUS
Eligible bonuses and RSUs/PSUs may be paid in the form of DSUs when executives or other key employees elect to or are required to participate in the plan. The value of a DSU at the issuance date is equal to the value of one BCE common share. For non-management directors, compensation is paid in DSUs until the minimum share ownership requirement is met or as elected by the directors thereafter. There are no vesting requirements relating to DSUs. Dividends in the form of additional DSUs are credited to the participant’s account on each dividend payment date and are equivalent in value to the dividends paid on BCE common shares. DSUs are settled when the holder leaves the company.
| 154 BCE Inc. 2015 ANNUAL REPORT |
| | NOTES TO CONSOLIDATED FINANCIAL STATEMENTS |
The following table summarizes the status of outstanding DSUs at December 31, 2015 and 2014.
| NUMBER OF DSUs | 2015 | | 2014 | |
Outstanding, January 1 | 4,116,527 | | 3,625,053 | |
Issued(1) | 174,672 | | 142,231 | |
Settlement of RSUs/PSUs | 216,500 | | 415,091 | |
Dividends credited | 201,721 | | 202,885 | |
Settled | (913,369 | ) | (268,733 | ) |
Outstanding, December 31 | 3,796,051 | | 4,116,527 | |
| (1) | The weighted average fair value of the DSUs issued was $55 and $48 in 2015 and 2014, respectively. |
| |
| Note 27 Commitments and contingencies |
Commitments
The following table is a summary of our contractual obligations at December 31, 2015 that are due in each of the next five years and thereafter.
| | NOTE | | 2016 | | 2017 | | 2018 | | 2019 | | 2020 | | THERE-
AFTER | | TOTAL | |
Operating leases | | | 287 | | 257 | | 206 | | 178 | | 154 | | 814 | | 1,896 | |
Commitments for property, plant and equipment and intangible assets | | | 946 | | 650 | | 570 | | 497 | | 448 | | 1,373 | | 4,484 | |
Purchase obligations | | | 1,140 | | 578 | | 541 | | 525 | | 452 | | 1,645 | | 4,881 | |
National expansion of TMN(1) | 3 | | 190 | | – | | – | | – | | – | | – | | 190 | |
Total | | | 2,563 | | 1,485 | | 1,317 | | 1,200 | | 1,054 | | 3,832 | | 11,451 | |
| (1) | This commitment was settled in the first quarter of 2016. |
BCE’s significant operating leases are for office premises, cellular tower sites and retail outlets with lease terms ranging from one to 42 years. These leases are non-cancellable and are renewable at the end of the lease period. Rental expense relating to operating leases was $340 million in 2015 and $335 million in 2014.
Our commitments for property, plant and equipment and intangible assets include program and feature film rights and investments to expand and update our networks to meet customer demand.
Purchase obligations consist of contractual obligations under service and product contracts for operating expenditures.
We become involved in various legal proceedings as a part of our business. While we cannot predict the final outcome or timing of the legal proceedings pending at December 31, 2015, based on the information currently available and management’s assessment of the merits of such legal proceedings, management believes that the resolution of these legal proceedings will not have a material and negative effect on our financial statements. We believe that we have strong defences and we intend to vigorously defend our positions.
BCE Inc. 2015 ANNUAL REPORT 155 |
NOTES TO CONSOLIDATED FINANCIAL STATEMENTS | |
| |
| Note 28 Related party transactions |
Subsidiaries
The following table shows BCE’s significant subsidiaries at December 31, 2015. BCE has other subsidiaries which have not been included in the table as each represents less than 10% individually, and less than 20% in aggregate, of total consolidated revenues.
All of these subsidiaries are incorporated in Canada and provide services to each other in the normal course of operations. The value of these transactions is eliminated on consolidation.
| OWNERSHIP PERCENTAGE |
SUBSIDIARY | 2015 | | 2014 | |
Bell Canada | 100 | % | 100 | % |
Bell Mobility | 100 | % | 100 | % |
Bell Aliant(1) | N/A | | 100 | % |
Bell Media | 100 | % | 100 | % |
| (1) | On July 1, 2015, Bell Aliant was wound up into Bell Canada. |
| |
| Transactions with joint arrangements and associates |
During 2015 and 2014, BCE provided telecommunication services and received programming content and other services in the normal course of business on an arm’s length basis to and from its joint arrangements and associates. Our joint arrangements are comprised of MLSE, Glentel, Inukshuk, Enstream Inc., Cirque du Soleil Media Limited Partnership, Dome Productions Partnership and Argonauts Holdings Limited Partnership. Our associates are comprised of Summerhill Ventures LLP, Q9 Networks Inc., The NHL Network Inc. and Suretap Wallet Inc. From time to time, BCE may be required to make capital contributions in its investments.
BCE recognized revenues and incurred expenses with our associates and joint arrangements of $8 million (2014–$6 million) and $104 million (2014–$56 million), respectively.
Bimcor Inc. (Bimcor), a wholly-owned subsidiary of Bell Canada, is the administrator of the Master Trust. Bimcor recognized management fees of $13 million from the Master Trust for 2015 and $12 million for 2014. The details of BCE’s post-employment benefit plans are set out in Note 21,Post-employment benefit plans.
| |
| Compensation of key management personnel and board of directors |
The following table includes compensation of the key management personnel and board of directors for the years ended December 31, 2015 and 2014 included in our income statements. Key management personnel include the company’s Chief Executive Officer (CEO), Group President and the executives who report directly to them.
| FOR THE YEAR ENDED DECEMBER 31 | 2015 | | 2014 | |
Wages, salaries, fees and related taxes and benefits | (32 | ) | (24 | ) |
Post-employment benefit plans and OPEBs cost | (3 | ) | (4 | ) |
Share-based compensation | (27 | ) | (26 | ) |
Key management personnel and board of directors compensation expense | (62 | ) | (54 | ) |
| 156 BCE Inc. 2015 ANNUAL REPORT |
| | NOTES TO CONSOLIDATED FINANCIAL STATEMENTS |
| |
| Note 29 Significant partly-owned subsidiaries |
The following tables show summarized financial information for our subsidiaries with significant NCI.
| |
| Summarized statements of financial position |
| | CTV SPECIALTY(1) |
| FOR THE YEAR ENDED DECEMBER 31 | 2015 | | 2014 | |
Current assets | 272 | | 255 | |
Non-current assets | 1,030 | | 999 | |
Total assets | 1,302 | | 1,254 | |
Current liabilities | 142 | | 152 | |
Non-current liabilities | 200 | | 185 | |
Total liabilities | 342 | | 337 | |
Total equity attributable to BCE shareholders | 673 | | 643 | |
NCI | 287 | | 274 | |
| (1) | At December 31, 2015 and 2014, the ownership interest held by NCI in CTV Specialty was 29.9%. CTV Specialty was incorporated and operated in Canada as at such dates. |
| |
| Selected income and cash flow information |
| | CTV SPECIALTY(1) | BELL ALIANT(2)(3) |
| FOR THE YEAR ENDED DECEMBER 31 | 2015 | | 2014 | | 2014 | |
Operating revenues | 805 | | 807 | | 2,757 | |
Net earnings | 166 | | 174 | | 328 | |
Net earnings attributable to NCI | 52 | | 53 | | 165 | |
Total comprehensive income | 174 | | 175 | | 171 | |
Total comprehensive income attributable to NCI | 54 | | 54 | | 72 | |
Cash dividends paid to NCI | 41 | | 2 | | 143 | |
| (1) | CTV Specialty net earnings and total comprehensive income includes $3 million and $2 million, respectively, directly attributable to NCI for 2015 and 2014. |
| (2) | In 2014, BCE acquired all the issued and outstanding shares of Bell Aliant that it did not already own, therefore eliminating the 55.9% ownership interest held by NCI. Refer to Note 24, Privatization of Bell Aliant. |
| (3) | Bell Aliant net earnings and total comprehensive income include $22 million of dividends declared on preferred shares for 2014. |
BCE Inc. 2015 ANNUAL REPORT 157 |
BOARD OF DIRECTORS / EXECUTIVES | |
Board of directorsAS OF MARCH 3, 2016
Thomas C. O’Neill,
FCPA, FCA
ONTARIO, CANADA
Chair of the Board, BCE Inc. and Bell Canada
Director since January 2003Barry K. Allen
FLORIDA, UNITED STATES
Operating Partner,
Providence Equity
Partners LLC
Director since May 2009 Ronald A. Brenneman
ALBERTA, CANADA
Corporate Director
Director since November 2003 | Sophie Brochu
QUÉBEC, CANADA
President and
Chief Executive Officer,
Gaz Métro Inc.
Director since May 2010Robert E. Brown
QUÉBEC, CANADA
Corporate Director
Director since May 2009 George A. Cope
ONTARIO, CANADA
President and
Chief Executive Officer,
BCE Inc. and Bell Canada
Director since July 2008 | David F. Denison,
FCPA, FCA
ONTARIO, CANADA
Corporate Director
Director since October 2012Robert P. Dexter
NOVA SCOTIA, CANADA
Chair and Chief Executive Officer,
Maritime Travel Inc.
Director since November 2014 Ian Greenberg
QUÉBEC, CANADA
Corporate Director
Director since July 2013 | Katherine Lee
ONTARIO, CANADA
Corporate Director
Director since August 2015Gordon M. Nixon
ONTARIO, CANADA
Corporate Director
Director since November 2014 Robert C. Simmonds
ONTARIO, CANADA
Chair, Lenbrook Corporation
Director since May 2011 Paul R. Weiss,
FCPA, FCA
ONTARIO, CANADA
Corporate Director
Director since May 2009 |
AUDIT COMMITTEE P.R. Weiss(Chair),
S. Brochu, D.F. Denison,
R.P. Dexter, I. Greenberg,
K. Lee, R.C. Simmonds The audit committee assists the board in the oversight of: the integrity of BCE Inc.’sfinancial statements andrelated information BCE Inc.’s compliancewith applicable legal andregulatory requirements the independence, qualifications and appointment of theexternal auditors the performance of both theexternal and internal auditors management’s responsibilityfor assessing and reportingon the effectiveness ofinternal controls BCE Inc.’s enterprise riskmanagement processes.
| PENSION FUND COMMITTEE D.F. Denison(Chair),
R.A. Brenneman, R.P. Dexter,
K. Lee, P.R. Weiss The PFC assists the board in the oversight of: the administration, fundingand investment of BCE Inc.’spension plans and funds the unitized pooled fundssponsored by BCE Inc. forthe collective investment ofthe fund and the participantsubsidiaries’ pension funds.
| CORPORATE GOVERNANCE COMMITTEE R.E. Brown(Chair),
B.K. Allen, S. Brochu,
G.M. Nixon, R.C. Simmonds The CGC assists the board in: developing and implementingBCE Inc.’s corporategovernance guidelines identifying individualsqualified to become membersof the board determining the composition of the board andits committees determining the directors’remuneration for board andcommittee service developing and overseeinga process to assess theChair of the board, the board,committees of the board,Chairs of committees andindividual directors reviewing and recommendingfor board approval BCE Inc.’spolicies concerning businessconduct, ethics, public disclosure of material informationand other matters.
| MANAGEMENT RESOURCES AND COMPENSATION COMMITTEE R.A. Brenneman(Chair),
B.K. Allen, R.E. Brown,
I. Greenberg, G.M. Nixon The MRCC assists the board in the oversight of: the compensation, nomination,evaluation and successionof officers and othermanagement personnel the health and safety policiesand practices.
|
| 158 BCE Inc. 2015 ANNUAL REPORT |
| | BOARD OF DIRECTORS / EXECUTIVES |
Executives
AS OF MARCH 3, 2016
George A. Cope
President and Chief Executive Officer,
BCE Inc. and Bell CanadaMirko Bibic
Chief Legal & Regulatory Officer and Executive Vice-President – Corporate Development,
BCE Inc. and Bell Canada Charles W. Brown
President – The Source,
Bell Canada Michael Cole
Executive Vice-President and Chief Information Officer,
Bell Canada Stephen Howe
Executive Vice-President and Chief Technology Officer,
Bell Canada Rizwan Jamal
President – Bell Residential Services,
Bell Canada Blaik Kirby
President – Bell Mobility,
Bell Canada | Glen LeBlanc
Executive Vice-President and Chief Financial Officer,
BCE Inc. and Bell CanadaBernard le Duc
Executive Vice-President – Corporate Services,
BCE Inc. and Bell Canada Thomas Little
President – Bell Business Markets,
Bell Canada Wade Oosterman
Group President,
BCE Inc. and Bell Canada Mary Ann Turcke
President – Bell Media,
Bell Canada Martine Turcotte
Vice Chair – Québec,
BCE Inc. and Bell Canada John Watson
Executive Vice-President – Customer Experience,
Bell Canada |
BCE Inc. 2015 ANNUAL REPORT 159 |
INVESTOR INFORMATION | |
Investor information
Share facts SYMBOL
BCE LISTINGS
TSX and NYSE stock exchanges
You will find a summary of the differences between our governance practices and the NYSE corporate governance rules in the governance section of our website atBCE.ca COMMON SHARES OUTSTANDING
December 31, 2015 – 865,611,188 QUARTERLY DIVIDEND*
$0.6825 per common share 2016 DIVIDEND SCHEDULE* | | Tax aspects CAPITAL GAINS ON YOUR SHARES
Shareholders are required to pay tax on dividends as well as any capital gains they realize when they sell their shares or are deemed to have sold them. If you received Nortel Networks common shares in May 2000 and/or Bell Aliant Regional Communications Income Fund units in July 2006, you should contact the Investor Relations group to learn more about the tax implications on your cost,or visitBCE.ca DIVIDENDS
Since January 1, 2006 and unless stated otherwise, dividends paid by BCE Inc. to Canadian residents are eligible dividends as per the CanadianIncome Tax Act. Since March 24, 2006 and unless stated otherwise, dividends paid by BCE Inc. to Québec residents also qualify as eligible dividends. NON-RESIDENTS OF CANADA
Dividends paid or credited to non-residents of Canada are subject to a 25% withholding tax unless reduced by treaty. Under current tax treaties, U.S. and U.K. residents are subject to a 15% withholding tax. Beginning in 2012, the Canada Revenue Agency introduced new rules requiring residents of any country with which Canada has a tax treaty to certify that they reside in that country and are eligible to have Canadian non-resident tax withheld on the payment of their dividends at the tax treaty rate. Registered shareholders should have completed the Declaration of Eligibility for Benefits under a Tax Treaty for a Non-Resident Taxpayer and returned it to the transfer agent. U.S. RESIDENTS
In addition to the Declaration of Eligibility for Benefits under a Tax Treaty for a Non-Resident Taxpayer mentioned above, we are required to solicit taxpayer identification numbers and Internal Revenue Service (IRS) Form W-9 certifications of residency from certain U.S. residents. If these have not been received, we may be required to deduct the IRS’s specified backup withholding tax. For more information, please contact the transfer agent or the Investor Relations group. |
| Record date | Payment date |
| March 15, 2016 | April 15, 2016 |
| June 15, 2016 | July 15, 2016 |
| September 15, 2016 | October 15, 2016 |
| December 15, 2016 | January 15, 2017 |
*Subject to dividends being declared by the board of directors
** When a dividend payment date falls on a weekend, the payment is made on the following business day.2016 QUARTERLY EARNINGS
RELEASE DATES |
| First quarter | April 28, 2016 |
| Second quarter | August 4, 2016 |
| Third quarter | November 3, 2016 |
| Fourth quarter | February 2, 2017 |
Quarterly and annual reports as well as other corporate documents can be found on our website. Corporate documents can also be requested from the Investor Relations group. |
| 160 BCE Inc. 2015 ANNUAL REPORT |
Shareholder services DIVIDEND REINVESTMENT AND STOCK PURCHASE PLAN
The Plan provides a convenient method for eligible holders of common shares to reinvest their dividends and make optional cash contributions to purchase additional common shares without brokerage costs. DIVIDEND DIRECT DEPOSIT SERVICE
Avoid postal delays and trips to the bank by joining the dividend direct deposit service. DIRECT REGISTRATION (DRS)
HOLDING YOUR SHARES ELECTRONICALLY IN LIEU OF SHARE CERTIFICATES
DRS provides you with the option of holding your securities on the records of the transfer agent in electronic form. Holdings are represented by a statement that is issued when you establish or subsequently modify your DRS balance. This option removes the risks of holding a paper stock certificate, including the safekeeping of certificates; sending securities by mail and most importantly, the cost of replacing lost or stolen certificates (generally, a percentage of the value of the shares represented). E-DELIVERY SERVICE
Enrol in our e-delivery service to receive the proxy material, the annual report and/or quarterly reports by e-mail. By doing so, you will receive your documents faster and in an environmentally friendly manner while helping your company reduce printing and postage costs. DUPLICATE MAILINGS
Help us control costs and eliminate duplicate mailings by consolidating your accounts. MANAGE YOUR SHAREHOLDER ACCOUNT
Enrol with AnswerLine at www.canstockta.com and benefit from a wide variety of selfservice tools to help track and manage your shares. For more details on any of these services, registered shareholders (shares are registered under your name) must contact the transfer agent. Non-registered shareholders must contact their brokers. | | Contact information TRANSFER AGENT AND REGISTRAR For information on shareholder services or any other inquiries regarding your account (including stock transfer, address change, lost certificates and tax forms), contact: CST Trust Company
320 Bay Street, 3rd Floor
Toronto, Ontario M5H 4A6
|
| e-mail | bce@canstockta.com |
| tel | 416-682-3861 or 1-800-561-0934
(toll free in Canada and the U.S.) |
| fax | 514-985-8843 or 1-888-249-6189 (toll free in Canada and the U.S.) |
| website | www.canstockta.com |
INVESTOR RELATIONS
Building A, 8th Floor
1 Carrefour Alexander-Graham-Bell
Verdun, Québec H3E 3B3
|
| e-mail | investor.relations@bce.ca |
| tel | 1-800-339-6353 |
| fax | 514-786-3970 |
| | or visit the Investors section
of our website at BCE.ca |
Trade-marks: The following are trade-marks referred to and used as such in this annual report that BCE Inc., its subsidiaries, joint arrangements, associates or other entities in which we hold an equity interest own or use under licence. BCE is a trade-mark of BCE Inc.; Aliant, Bell, Bell Canada, Bell Centre, Bell Internet, Bell Media, Bell Mobility, Bell TV, Fibe, FibreOP, Let’s Talk, Roam Better and TV Everywhere are trade-marks of Bell Canada; Astral, Astral Media, Astral Out-of-Home, BNN, Canal D, Canal Vie, CP24, CTV, CTV GO, CTV News, CTV Two, Space, Super Écran, The Comedy Network, The Movie Network, TMN, TMN Encore and TMN GO are trade-marks of Bell Media Inc.; Cablevision is a trade-mark of Cablevision du Nord de Québec Inc.; CraveTV is a trade-mark of 7680155 Canada Inc. (a subsidiary of Bell Media Inc.); Discovery and Discovery GO are trade-marks of Discovery Communications, LLC; Dome Productions is a trade-mark of Dome Productions Partnership; E! is a trade-mark of E! Entertainment Television, LLC; ExpressVu is a trade-mark of Bell ExpressVu Limited Partnership; EZ Rock is a trade-mark of Bell Media Radio G.P.; Glentel, Tbooth wireless, Wirelesswave and Wireless etc. are trade-marks of Glentel Inc.; HBO Canada is a trade-mark of Home Box Office Inc.; iHeartRadio is a trade-mark of iHM Identity Inc.; Métromédia CMR Plus is a trade-mark of Métromédia CMR Plus Inc.; MLSE is a trade-mark of Maple Leaf Sports & Entertainment Ltd.; Toronto Maple Leafs, Toronto Marlies and Toronto Raptors are trade-marks of Maple Leaf Sports & Entertainment Partnership; Montreal Canadiens is a trade-mark of Club de Hockey Canadien, Inc.; NorthernTel is a trade-mark of Nortel Networks Limited; Northwestel and N-NorthwesTel Design are trade-marks of Northwestel Inc.; Q9 is a trade-mark of Q9 Networks Inc.; Showtime is a trade-mark of Showtime Networks Inc.; Télébec is a trade-mark of Télébec, Limited Partnership; The Source is a trade-mark of The Source (Bell) Electronics Inc.; Toronto Argonauts and Argos are trade-marks of Argonauts Holdings Limited Partnership; TSN, TSN GO, RDS and RDS GO are trade-marks of The Sports Network Inc.; Virgin Mobile and Virgin Mobile Canada are trade-marks of Virgin Enterprises Limited.
We believe that our trade-marks are very important to our success and take appropriate measures to protect, renew and defend them. Any other trade-marks used in this annual report are the property of their respective owners.
Photography credits:
Page 3. © 2016 NBA Entertainment. Photo by Jesse D. Garrabrant/NBAE/Getty Images. All Rights Reserved.
Eaton Centre’s Bell Store on page 13: © Shan Qiao Photography.; Star Wars © & TM Lucasfilm Ltd.
© BCE Inc., 2016. All rights reserved.