Exhibit 99.2

BCE INC. 2016 ANNUAL REPORT
OUR GOAL
For Bell to be recognized by
customers as Canada’s leading
communications company

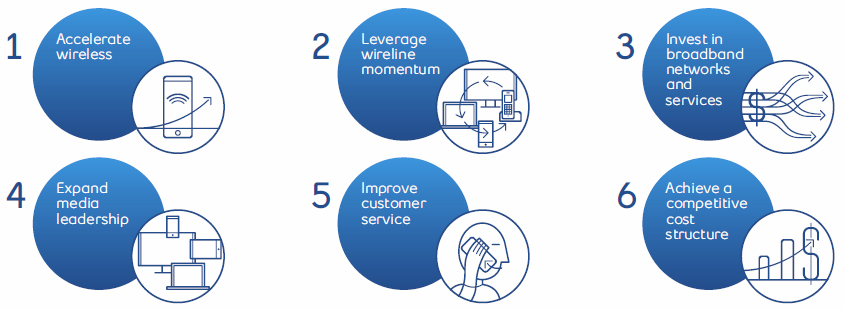
| OUR STRATEGIC IMPERATIVES | |
| Invest in broadband networks and services | 8 |
| Accelerate wireless | 10 |
| Leverage wireline momentum | 12 |
| Expand media leadership | 14 |
| Improve customer service | 16 |
| Achieve a competitive cost structure | 18 |
| TABLE OF CONTENTS | |
| Financial and operational highlights | 2 |
| Letters to shareholders | 4 |
| Strategic imperatives | 8 |
| Community investment | 20 |
| Bell archives | 22 |
| Management’s discussion and analysis (MD&A) | 26 |
| Reports on internal control | 110 |
| Consolidated financial statements | 112 |
| Notes to consolidated financial statements | 118 |

BCE INC. 2016 ANNUAL REPORT
A commitment to lead broadband network investment
and innovation in Canada, and the consistent execution
of our competitive strategy, enabled Bell to grow
the business, achieve all financial objectives,
and extend our record of exceptional value creation
for shareholders.

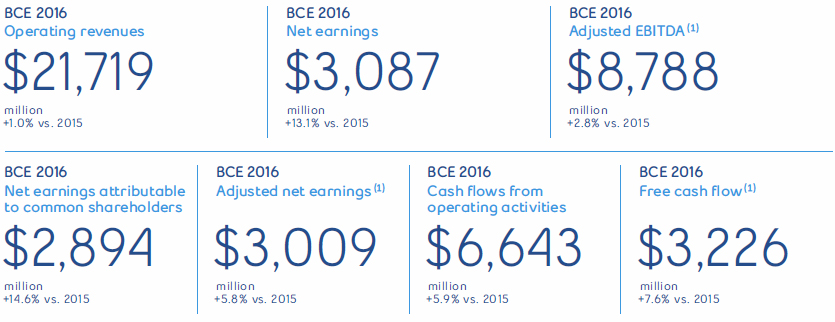
| 2016 FINANCIAL PERFORMANCE | |||
| ACTUAL | TARGET | RESULT | |
| Revenue growth | 1.0% | 1%–3% | |
| Adjusted | 2.8% | 2%–4% | |
| EBITDA(3) growth | |||
| Capital intensity | 17.4% | ~17% | |
| Adjusted EPS(3) | $3.46 | $3.45–$3.55 | |
| Free cash flow(3) growth | 7.6% | 4%–12% | |
| COMPARATIVE TOTAL RETURN(1)(2) | ||
2016 | SINCE THE END OF 2008 | |
| BCE | 13.7% | 251% |
| S&P/TSX Composite Index | 21.1% | 116% |
| S&P/TSX Telecom Index | 18.3% | 181% |
| (1) | Assumes the reinvestment of dividends. |
| (2) | Total return since the end of 2008, the year Bell implemented its transformational strategy. |
| (3) | Adjusted EBITDA, adjusted EPS and free cash flow are non-GAAP financial measures and do not have any standardized meaning under International Financial Reporting Standards (IFRS). Therefore, they are unlikely to be comparable to similar measures presented by other issuers. For a full description of these measures, see section 10.2, Non-GAAP financial measures and key performance indicators (KPIs)on pp. 106 to 109 of the MD&A. |
1
BCE INC. 2016 ANNUAL REPORT
FINANCIAL AND OPERATIONAL HIGHLIGHTS
Leading network investments
drive Bell growth services
The enduring builder of Canada’s communications infrastructure since 1880, Bell is now investing in the next generation of high-capacity broadband networks that power the growth services of today: wireless, Internet, TV and media.
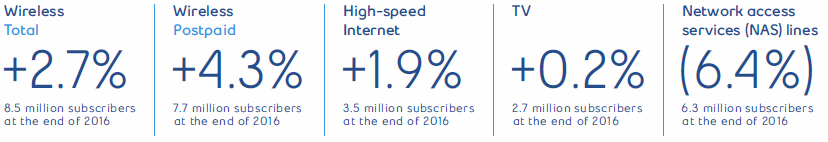
| BCE SUBSCRIBERS (MILLIONS)* | |||
| 2016 | 2015 | GROWTH | |
| Wireless | 8.5 | 8.2 | +2.7% |
| High-speed Internet | 3.5 | 3.4 | +1.9% |
| Television | 2.7 | 2.7 | +0.2% |
| Total growth services | 14.7 | 14.4 | +2.0% |
| Local telephone services | 6.3 | 6.7 | -6.4% |
| Total subscribers | 20.9 | 21.1 | -0.7% |

* Rounding in numbers may affect total figures presented.
2
| BELL’S ONGOING TRANSFORMATION: 2008–2016 Advanced networks have transformed Bell into Canada’s broadband communications leader, now setting the pace in wireless, Internet, TV and media growth. Together, these high-demand growth services accounted for 82% of Bell revenue in 2016, up from 81% a year earlier and just 64% in 2008. |
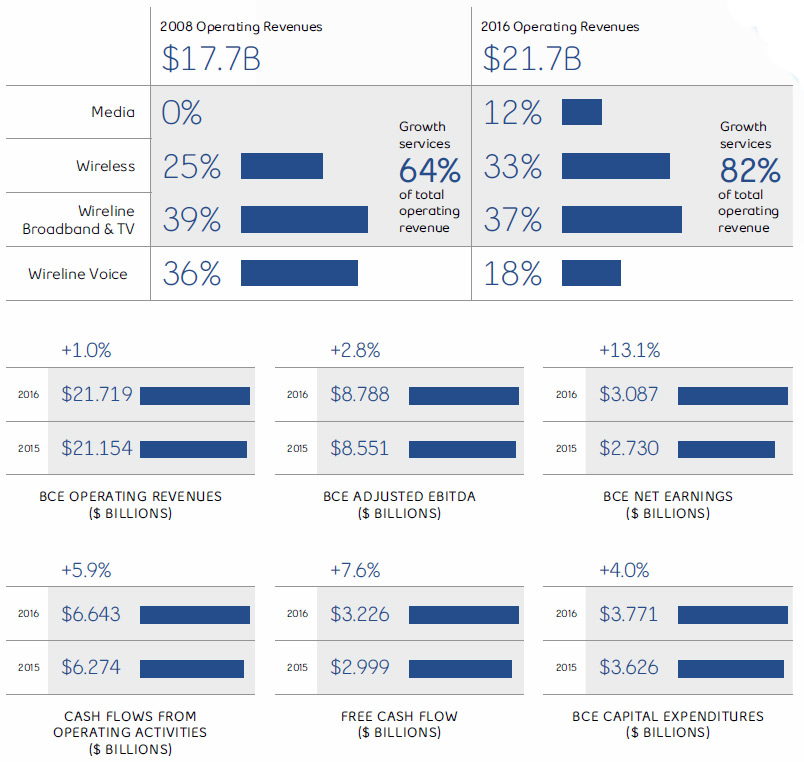
For more information, please refer to section 7 of the MD&A –Selected Annual and Quarterly information, pp. 85 to 89.
3
BCE INC. 2016 ANNUAL REPORT
MESSAGE FROM THE CHAIR OF THE BOARD
Broadband leadership
driving growth today,
and into the future
As BCE reports on a year of strong operational and financial progress in 2016, it is clear that our industry landscape has evolved in new and challenging ways since the beginning of Bell’s broadband transformation 8 years ago.

New technologies, changing consumer tastes and growing competition in wireless, TV, Internet and media services are revolutionizing the ways we communicate with each other, and how companies large and small interact with their customers, partners and supply chains.
The demand for faster Internet access continues to accelerate and wireless usage grows by leaps and bounds, as consumers and business users take full advantage of broadband video across platforms, and the power of social media in personal, public and professional realms. The growth in online commerce is driving new business models in every part of the economy, while the emerging Internet of Things (IoT) is creating a machine-to-machine world of communication.
Bell’s next-generation networks lead the way
Bell is clearly ready to lead the way with a broadband growth and innovation strategy that has re-energized both our company and industry. Bell has the scale to deliver world-class communications networks and services across our vast country, and a skilled and seasoned team fully dedicated to delivering the benefits of our leadership strategy to all stakeholders.
Building on a legacy of technological leadership and service innovation since 1880, Bell’s advanced fibre and wireless networks continued to be the foundation of our success in 2016. And as we continue to outpace our competitors in capital investment in infrastructure, R&D and exclusive new services, our award-winning networks will continue to be the driver of our competitive leadership going forward as the world of digital communication continues to evolve.
Financial strength, shareholder value
Bell achieved all its financial guidance targets in 2016, with solid revenue and adjusted EBITDA growth and strong free cash flow generation, all of which support Bell’s capital investment objectives and our ability to return value to you.
We announced a 5.1% increase in the BCE annualized common share dividend in February 2017, to $2.87 per share from the $2.73 announced the year before. This is the 13thsuch dividend increase since the end of 2008 and the 9thconsecutive year in which BCE has declared a dividend increase of at least 5%. Our objective
4

to deliver sustainable dividend growth is a core focus for our company. BCE’s total shareholder return of 251% since 2008 has outperformed competitive peers here and across North America and significantly outpaced the S&P/TSX Composite Index.
The highest levels of corporate governance and financial prudence underpin BCE’s capital markets strategy. Our healthy balance sheet is supported by investment-grade credit metrics and strong liquidity, and our defined benefit pension plans are well funded and attractively positioned should interest rates rise.
In 2016, we raised a combined total of $2.25 billion in gross proceeds from the issuance of 10-year and 5-year medium-term note (MTN) debentures, achieving the lowest-ever financing rate on any MTN issuance by Bell Canada and significantly reducing our after-tax cost of outstanding MTN debenture debt. We also made a voluntary $400 million contribution to BCE’s defined benefit pension plans, reducing our future pension obligations and enhancing our financial flexibility to invest in our broadband growth strategy.
Changes to your Board
I have been honoured to lead the BCE Board as Chair since April 2016, and am grateful for the support and insight of my predecessor, Thomas O’Neill, and my fellow Directors.
This includes Ronald Brenneman, a distinguished member of the Board who will be retiring at our Annual General Meeting. On behalf of the Board and all shareholders, I thank Ron for his wise counsel and dedication to our company as a Director since 2003, Chair of the Management Resources and Compensation Committee, and a member of the Pension Fund Committee.
I am also pleased to announce the nomination of Karen Sheriff to the Board. A highly successful leader who will add deep experience in the Canadian communications industry to our Board, Karen served as CEO of Bell Aliant and most recently Q9 Networks. Recognized numerous times as an exemplary executive and one of Canada’s most influential women leaders, Karen will be an outstanding addition to your Board.
On behalf of the Board and shareholders, I would like to thank our President and CEO George Cope and the Bell team for successfully navigating our complex and fast-changing sector with a winning strategy and unparalleled execution in the marketplace. We look forward to welcoming Manitoba Telecom Services (MTS) and implementing the Bell strategy in a province poised for growth and ready for the significant enhancement of its broadband communications infrastructure that Bell MTS will bring.
As Chair of the Board, it is my privilege to serve you as Bell moves forward as Canada’s broadband leader. We are committed to remaining at the forefront of communications innovation and growth, transforming our business to stay ahead while continuing to deliver for our shareholders, customers, employees and communities.
I am honoured to be part of the team writing the next chapters in Bell’s long and distinguished history. Thank you for your support.

Gordon M. Nixon
Chair of the Board
BCE Inc.
5
BCE INC. 2016 ANNUAL REPORT
MESSAGE FROM THE PRESIDENT & CEO
Bell in the vanguard
of Canada’s broadband
communications revolution
Bell continued to build on our position as Canada’s broadband communications leader in 2016. We are investing in the most advanced networks and service innovations to lead in the marketplace and ensure Canada’s competitiveness in a global digital economy, while delivering consistent dividend growth to you, the shareholders who have invested in Bell’s broadband strategy.

Each day and around the clock, the Bell team works to deliver world-class network performance, exclusive new products and an enhanced service experience to Canadians in every province and territory. In a highly competitive and fast changing communications sector, Bell continues to set the pace through our dedication to a clear goal – for Bell to be recognized by customers as Canada’s leading communications company.
To achieve our goal, Bell executes a strategy focused on delivering the best wireless, TV, Internet and media growth services in the most timely and efficient manner possible, an approach framed by our 6 Strategic Imperatives:
| Invest in broadband networks and services Accelerate wireless Leverage wireline momentum Expand media leadership Improve customer service Achieve a competitive cost structure |
Ours is a strategy that reflects both the challenges of our dynamic industry and the clear opportunities for innovation and growth in Canadian communications. And the Bell team is delivering.
Innovation first with Bell
A growing Gigabit Internet footprint delivering the fastest access speeds to consumers and businesses, and an LTE wireless network ranked as the fastest in Canada and significantly faster than US networks. Exclusive Fibe TV features like Restart and Trending, and innovations like the first wireless Whole Home PVR, the Fibe TV app and Apple TV connectivity. Compelling Canadian content and the most-loved TV and radio channels. A network of all-Canadian data hosting centres able to take on global heavyweights like Microsoft and Google, further strengthened in 2016 with the addition of Q9 Networks.
These are the kinds of leading innovations delivered by Bell’s broadband investment strategy. In 2016, we achieved outstanding usage growth in Internet and wireless data, driven in large part by the surging use of video across our networks on multiple consumer and business platforms. Our significant lead in IPTV technology versus our cable competitors continued to propel our revolutionary Fibe TV service in the marketplace, while the popularity of Canada’s video streaming service, CraveTV from Bell Media, further accelerated.


Behind these millions of glowing screens lie the high-speed, high-capacity Bell networks that are on par with the best in the world. With access to the latest technology available from around the globe and a commitment to be in the vanguard of broadband product development in Canada, our capital expenditures in network infrastructure and R&D reached $3.77 billion in 2016. Bell is connecting communities at speeds never experienced before, fuelling Canadian innovation, and creating jobs in the digital economy.
Backed by continuous improvement in service and support, including high levels of satisfaction with our technician teams, Bell’s network leadership enabled us to outperform in the marketplace with unprecedented broadband growth. More than 240,000 net new Fibe TV and Internet customers and over 315,000 net postpaid wireless subscribers joined Bell in 2016.
Coupled with accelerating usage across our segments and a careful eye on operating costs, especially in slower-growth traditional lines of business, this leadership in the marketplace is enabling Bell to deliver the financial performance necessary to fuel our broadband infrastructure plans, return value to shareholders and invest in the community.
We look forward to rolling out our Fibe and LTE services in Manitoba now that our acquisition of MTS is set to close in March 2017 following the receipt of final federal regulatory approvals. It’s an acquisition that gains Bell more than 700,000 broadband wireless, Internet and IPTV customers in Manitoba, and we look forward to welcoming many more as Bell MTS delivers the best in broadband to a province poised for growth.
Bell MTS plans to invest $1 billion over the next 5 years to bring Gigabit Fibe Internet, Fibe TV and our award-winning LTE wireless network to major centres like Winnipeg and Brandon, to traffic corridors and small towns throughout the province, and to remote locations such as the burgeoning eco-tourism destination of Churchill, also known as the Polar Bear Capital of the World.
The Bell Let’s Talk initiative
Bell is renowned for our corporate responsibility leadership, including our commitments to environmental sustainability, diversity and community investment. Our high-profile mental health initiative Bell Let’s Talk continues to break new ground in the fight against the stigma around mental illness while supporting better care and access, new research and leadership in workplace mental health.
Our 7thBell Let’s Talk Day in January 2017 set all-new records for engagement across communications platforms in Canada and worldwide this year. New social media options helped to increase this year’s total messages of support to almost 132 million, further stimulating the national conversation about mental health while driving unprecedented new Bell funding for Canadian mental health programs.
Thank you
I would like to extend my thanks to Bell’s talented national team for their commitment to our customers, shareholders and communities, and to our Chair Gordon Nixon and the BCE Board of Directors for their invaluable support and guidance.
Thank you to our customers and shareholders for believing in Bell and the straightforward strategy of network, service and operational leadership that has transformed your company into Canada’s fastest growing broadband communications provider.
As we celebrate Canada’s 150thanniversary, and Bell’s role in our nation’s growth and prosperity as we mark our 137th, we will continue to focus on creating value for all stakeholders. We’re building a solid foundation for ongoing progress as we bring the next generation of communications to Canadians everywhere. We greatly appreciate your support.

George A. Cope
President and Chief Executive Officer
BCE Inc. and Bell Canada
7
BCE INC. 2016 ANNUAL REPORT
STRATEGIC IMPERATIVE
Invest in
broadband networks
and services
It’s all about the networks, the essential links that connect Canadians to each other and the world. Fast broadband fibre and wireless networks are the core of Bell’s leadership in the marketplace, enabling growing customer usage and satisfaction across our services.
On any given day, Bell networks will connect 39 million wireless calls, deliver 10 million hours of CTV programming, 2 million iHeartRadio streams, 213 million visits to Google, 13 million videos on YouTube, 79 million emails, 151 million text messages, and 35 million tweets.

On that same day, 96 of the 100 largest Canadian enterprises will rely on Bell’s networks for the fast, safe and secure communications they need to compete, including access to co-location and other managed and professional services through Bell’s industry-leading roster of 27 data centres.
To meet the astounding growth in demand for bandwidth, Bell is driving broadband network innovation and investment with capital expenditures of $3.77 billion in 2016, far more than any communications company in Canada and on par with major investors in Canada’s oil and gas sector.
Growth accelerates wherever Bell lays fibre, and we are quickly expanding our broadband Fibe network, including our Gigabit Fibe Internet footprint in Ontario, Québec, Atlantic Canada and, soon, Manitoba. We are bringing our 4G LTE and LTE Advanced (LTE-A) mobile networks to more Canadians across the country, increasing capacity to meet the growing demand for data and enabling speeds up to 335 Megabits per second (Mbps) with typical speeds up to 100 Mbps.
Bell is also implementing four-carrier spectrum aggregation that will enable mobile speeds in select areas of up to 560 Mbps (typically up to 166 Mbps), and laying the groundwork for the next generation of wireless connectivity as Bell partnered with Nokia in 2016 to complete the first trial of 5G mobile technology in Canada.
Independent testing highlights benefits of Bell networks
In wireless, independent analyst PCMag ranked Bell’s 4G LTE network the fastest in Canada and significantly faster than US carriers in 2016. Our national 4G LTE network reached 97% of Canadians by the end of the year.
Two reports by the CRTC in 2016 showed Bell’s rapidly expanding broadband fibre network stood out for delivering the highest-quality Internet service in the country.
Based on data collected from more than 3,000 Canadian Internet users, the reports confirmed that
8

Bell’s direct fibre links exceeded advertised Internet download speeds by a greater margin than other Canadian providers, and that Fibre to the Home (FTTH) services like Fibe offer the best browsing and streaming experience.
Bell’s broadband Fibe service is available now to 8.3 million homes and businesses, including 2.9 million direct fibre connections. By the end of 2017, approximately one-third of homes and businesses inside Bell’s wireline footprint will be capable of accessing Gigabit Fibe service, the fastest Internet available, with download speeds of 1 Gigabit per second and more.
Accelerating our investment momentum
With the acquisition of MTS approved to move forward in 2017, Bell plans to invest $1 billion in broadband network infrastructure projects throughout Manitoba over the next 5 years.
Bell’s investments will bring major wireline and wireless expansions to Winnipeg’s Innovation Alley; to the remote but burgeoning ecotourism destination of Churchill, the Polar Bear Capital of the World; continuous broadband wireless coverage along Highway 75 in southern Manitoba; and the expansion of mobile and wireline broadband networks in northern Manitoba, including along Highway 6 to Thompson, in Flin Flon and in 5 small indigenous communities.
As part of our network innovation strategy, we announced a partnership with AT&T and Orange in 2016 to develop software-driven networks that transcend the need for specialized hardware such as switches and routers. These networks of the future will accelerate the IoT and support emerging services such as virtual reality, self-driving vehicles, connected homes and smart cities.
9
BCE INC. 2016 ANNUAL REPORT
STRATEGIC IMPERATIVE
Accelerate wireless

The fastest-ranked LTE network in the country took Bell wireless to the top of an intensely competitive mobile marketplace in 2016, leading the industry in net new postpaid customers, average revenue per customer, and growth in service revenue and adjusted EBITDA.

Top networks, product innovation and a focus on service are all critical to Bell’s leadership in the Canadian wireless marketplace. Distribution strength is also key to growth and Bell operates approximately 1,400 Bell-branded stores and The Source locations across every province and territory, significantly more than our competitors.
At Bell, Virgin Mobile and The Source stores, plus hundreds of WIRELESSWAVE, WIRELESS etc. and Tbooth wireless locations operated by Glentel, customers have their choice of the latest generation of smartphones from Apple, Samsung, HTC, ZTE, Motorola, Google, BlackBerry, Novatel, Sony, Sonim, LG and Alcatel. Our customers can also access a wide variety of tablets and other devices designed for data services, including machine-to-machine (M2M) communications for business applications.
This sales and support network is backed up by a national customer care team enabled in 2016 by significant investments in IT support systems, training, simplified billing and our increasingly popular MyBell mobile self-serve app – which recorded more than 2.7 million transactions in 2016.
As the digital world becomes increasingly interconnected, our mobile customers are depending on their devices more than ever, and wherever they may travel.
In 2015, we introduced the popular Roam Better feature, which includes unlimited talk and text plus 100 MB of data per day for just $5 a day when in the US.
In 2016, we made Roam Better available for only $10 a day in 110 of the most popular destinations across Europe, the Caribbean, Bahamas, Bermuda, Mexico, Central and South America, Asia, Oceania, South Africa and the Middle East. Bell has our customers covered in more locations than any other Canadian competitor.

10
Bell Wireless delivered very strong financial results based on significant growth in new subscribers and ever-increasing mobile data usage as Canadians turn to their smartphones to manage their social interactions, finances, work and entertainment.
In 2016, we won the leading market share of net new postpaid subscribers among the top 3 competitors. For the full year, we added 315,311 net new postpaid customers, an 18.8% increase over the previous year. At the end of 2016, we served 7,690,727 postpaid customers, up 4.3% over 2015, and 8,468,872 including prepaid services.
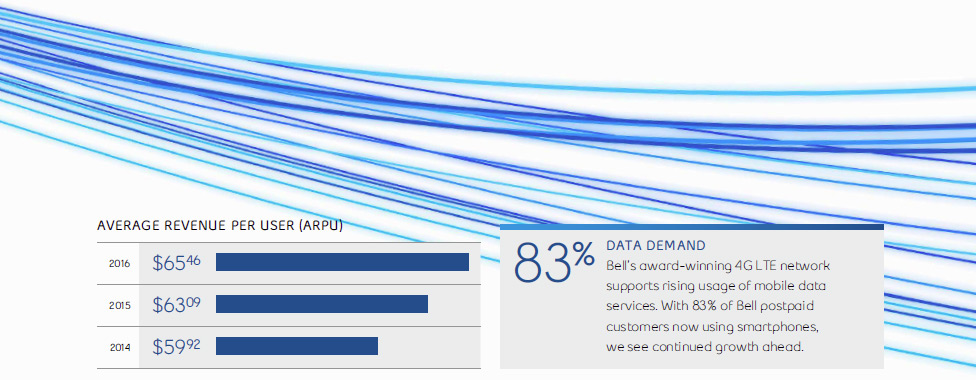
At year end, 83% of our postpaid subscribers were using smartphones, up from 78% at the start of the year. Similarly, 81% were taking advantage of the faster speeds of our expanding 4G LTE networks, up from just 68% a year earlier.
With the outstanding speeds of our 4G LTE and LTE-A networks, Bell customers can unlock the full potential of their smartphones.
This has propelled wireless data use – up 37% in 2016 – for everything from texting, gaming and Web browsing to watching live programming on more than 40 channels offered by Bell Mobile TV.
As recently as 5 years ago, Bell’s blended ARPU (combining both prepaid and postpaid customers) was approximately $5 a month lower than that of our nearest large competitor. By the end of 2016, we were generating higher usage and consequently more revenue per subscriber than either of our largest competitors.
Overall in 2016, Bell’s wireless revenue growth of 4.1% and adjusted EBITDA growth of 6.2%, even in the face of intense competitive discounting and promotional efforts, led the Canadian industry.
As wireless continues to be the primary driver of growth in communications in Canada and globally, Bell is staying well ahead with ongoing network development and innovation.
For example, we successfully tested 5G wireless technology with Nokia in 2016, a first in Canada, achieving speeds more than 6 times faster than those available today. Expected to be commercially available in 4 to 6 years, 5G provides more capacity for mobile broadcast video and IoT applications, including connected vehicles and city-wide IoT solutions.

11
BCE INC. 2016 ANNUAL REPORT
STRATEGIC IMPERATIVE
Leverage
wireline
momentum
Bell continues to provide Canadians with the newest TV and Internet innovations and the exclusive business services that make Bell #1 in broadband wireline communications in Canada.

Fibe TV remained Canada’s fastest-growing TV service in 2016 as more subscribers embraced the unmatched quality and exclusive services of the country’s best television experience, enhancing Bell’s lead as Canada’s #1 television provider.
Bell continued to unveil more of the exclusive television features that have made Fibe TV so popular, including the availability of the powerful Fibe TV app on Apple TV.
Bell continued to prove itself as an innovator on a global scale by announcing the world’s first fully wireless IPTV service with Fibe TV. The Fibe Wireless 4K personal video recorder (PVR) enables faster install times and gives customers the flexibility to place their TVs anywhere in the home without extra wires or cables.
Offering the largest recording capacity despite its small size, the Fibe Wireless 4K PVR offers up to 150 hours of 4K recording capacity, integrated 4K Netflix, and is ready for high dynamic range (HDR), the next evolution in broadcast technology. Customers also gained the opportunity to Own with Fibe, enabling them to purchase On Demand movies and enjoy them as many times as they want on Fibe.
Available to TV subscribers across the country and to any Canadian with an Internet connection, Bell Media’s unique CraveTV streaming service surpassed 1 million subscribers in 2016. Offering original Canadian content like the hit comedy series LETTERKENNY and thousands of hours of critically acclaimed programming from HBO, SHOWTIME and more of the biggest names in entertainment, CraveTV was growing as fast by the end of 2016 as it did after its launch in December 2014.
12

In 2016, the Internet outpaced TV to become the #1 connection for Canadians, with 50% of users streaming video at least once a day. To support fast-growing Internet usage and an explosion in the number of connected devices, Bell’s broadband fibre footprint expanded to reach approximately 8.3 million homes and businesses in 2016, providing the fastest broadband speeds and reliable technology necessary to support customer demands and the needs of Canada’s growing digital economy.
With 2016 Internet net additions of 85,099, Bell continues to lead the way in Internet services with 3,476,562 high-speed subscribers, the most of any provider in Canada.

Bell continued to provide unique value to Internet customers with the Home Hub 3000 residential gateway, Canada’s most powerful home Wi-Fi service with 12 antennas and exclusive tri-band technology, supporting multiple devices simultaneously and total throughput of up to 1 Gigabit. The average number of connected devices per home has more than doubled since 2013 and data usage by Bell Internet customers continues to climb – by 30% in 2016.
Virgin Mobile also introduced Home Internet in Ontario and Québec as a competitively priced high-speed option for youth and value-oriented customers, providing download speeds up to 25 Mbps and upload speeds up to 10 Mbps.
Canada’s business communications leader
2016 brought the expansion of Bell Total Connect to the small business sector, reflecting Bell’s commitment to enable the success of Canadian entrepreneurs and innovators.
Small businesses in Québec and Ontario can now benefit from the full suite of next-generation business communications services used by the largest enterprises, including seamless switching between mobile devices and desk phones, making it easy to work remotely and still maintain your business identity for outgoing calls.
Bell Business Markets closed 2016 with all 7 major Canadian banks running critical communications services on Bell’s unparalleled networks.
We also expanded Canada’s largest network of data centres by acquiring all remaining equity in Q9 Networks, further enabling Bell Business Markets’ leadership in data hosting services and cloud solutions.
Bell became the first Canadian provider to offer businesses access to Microsoft Azure ExpressRoute through Bell’s secure cloud connection, providing faster access, better reliability and unmatched security to enterprise customers.
Bell also entered an exclusive partnership with IBM as the only Canadian carrier to offer IBM MobileFirst for iOS apps, boosting the efficiency and productivity of mobile iOS devices for business users.
13

BCE INC. 2016 ANNUAL REPORT
STRATEGIC IMPERATIVE
Expand
media
leadership
Bell Media is leveraging the scale of its cross-country media assets, innovation in emerging media platforms, and the best content from Canada and around the world to break new ground in multimedia communications.
The largest media company in Canada and an important part of communities nationwide, Bell Media operates the country’s widest range of broadcasting and other media assets: Canada’s largest private TV broadcaster with 30 conventional stations including CTV, the most-watched network in the country; 34 specialty and pay TV channels; 105 radio stations in 54 markets across the nation, tuned in by 17.1 million listeners for 77 million hours a week; the leading Canadian digital media properties, including TSN.ca and CTV.ca; and Astral Out of Home, with more than 30,000 advertising faces in strategic locations across Canada.
For the 13thstraight fall season, CTV was the #1 network among total viewers and all key adult demographics with 10 of the top 20 programs, more than all other competing networks combined, and Canada’s top newscast: CTV National News with Lisa LaFlamme.
Bell Media’s specialty and pay TV properties were reaching 83% of English specialty and pay TV viewers in the average week at year end, with 12 of the top 20 programs among key adult viewers. TSN, Discovery (the top entertainment specialty channel in primetime), Space and Bravo all ranked in the top 10 English-language specialty channels. Bell Media also launched Gusto in 2016, its first food and lifestyle specialty channel featuring an exclusive portfolio of original Canadian programming.
Committed to delivering the pay TV programming Canadians want the most, Bell Media became the sole provider of HBO Canada in 2016 and expanded the reach of The Movie Network (TMN) pay TV service nationally. We also partnered with 20thCentury Fox to deliver first-run theatrical movies for TMN subscribers, and with Warner Brothers to stream many of the year’s most-popular shows on CraveTV.
With a strong Québec presence, we also remain the leader in French-language specialty and pay TV, reaching 78% of all French-language TV viewers in the average week. We operate 5 of the top 10 French specialty and pay channels among key viewers: the RDS sports network, Canal D, Super Écran, Canal Vie and Z.
Sports programming continues to outperform across Bell Media’s conventional and specialty TV, radio and digital platforms. In the last quarter of 2016, total primetime viewership for TSN was up 11% over last year as more viewers tuned in Toronto Raptors, NFL and CFL games. The Major League Soccer (MLS) playoffs featuring Toronto FC produced the 3 most-watched MLS games in Canadian TV history, with 1.3 million viewers for the final game. TSN extended its broadcast deal with MLS in 2016 for another 5 years.
The annual IIHF World Junior Championship is a traditional Canadian favourite on TSN and RDS, and 17.2 million individual Canadians – nearly 50% of the population – tuned in to watch coverage during the international hockey tournament’s 11 days.
14

As with many segments of Canada’s communications industry, the media landscape is changing dramatically as evolving technologies enable consumers to explore new viewing and listening options.
Bell Media has embraced the innovation opportunity with Canada’s fast-growing video streaming service, CraveTV, and our TV Everywhere options, including CTV GO, TSN GO, RDS GO, Discovery GO and TMN GO, providing live and on-demand television content on smartphones, tablets and computers.
CraveTV’s mix of much-loved shows from major studios and original Canadian content such as the hugely popular LETTERKENNY series is continuing to accelerate growth of the streaming service. Initially launched through multiple TV providers in 2014, CraveTV became available to all Canadians with an Internet connection in 2016, driving the subscriber base to more than one million during the year. We also made CraveTV available as an app for Apple TV viewers.
iHeartRadio Canada
In October 2016, Bell Media brought the highly successful iHeartRadio brand to Canada. Our digital iHeartRadio Canada service offers instant access to all of Bell Media’s 105 radio stations across the country.
The free iHeartRadio Canada digital app adds more than 100 exclusive streaming channels featuring every musical genre as well as news/talk, sports and comedy offerings. By year end, the iOS and Android apps had been downloaded more than 600,000 times.
Astral Out of Home expansion
Astral Out of Home continued to expand its reach in 2016, beginning with the acquisition in January of Métromédia, which specializes in outdoor and digital advertising in Montréal subway stations, on city buses and in parking lots. The Astral team also won the exclusive rights to digital advertising at Toronto Pearson Airport, giving Bell a significant presence in 6 of Canada’s largest international airports.
And in early 2017, Bell Media acquired Cieslok Media, a Canadian heavyweight in large-format outdoor advertising with 120 high-profile displays – including the country’s biggest multimedia billboards at Yonge-Dundas Square in Toronto.
Bell Media excellence recognized
Bell Media’s commitment to excellence in programming earned Bell Media and its partners 37 Canadian Screen Awards, alongside Bell Media’s role in 19 film category wins.
Our ongoing leadership in creating and developing original Canadian content was reflected in awards for CTV National News with Lisa LaFlamme (best national news), CTV Vancouver (best local news), 19-2 (best drama), The Amazing Race Canada (best reality/competition series), Degrassi (best children’s or youth series) and The Marilyn Denis Show (best talk).
TSN received more awards than any sports broadcaster, including best live sports event for the FIFA Women’s World Cup.
15
BCE INC. 2016 ANNUAL REPORT
STRATEGIC IMPERATIVE
Improve
customer
service

Bell is transforming the service experience by simplifying the way we interact with our customers across a full range of communications services.
With close to 21 million customer connections – more than any other communications company in Canada – our strategy to improve satisfaction includes investing $850 million since 2012 in better tools and training for our call centre representatives and field technicians, improving our online self-serve tools and processes, and helping to ensure customers are connected faster.
Simplifying the customer experience
We appreciate that every customer’s time is valuable. That’s why Bell developed innovative new tools like Manage Your Appointment in 2016 that not only lets customers confirm their service call, but also provides key information including the technician’s name and approximate arrival time. In addition, technicians can now access a customer’s account history directly on their mobile device, further reducing the time it takes to connect to our services.
In 2016 Bell technicians arrived right on time for 97% of appointments, helping to drive a record 95% customer satisfaction rate. Our investments in service, along with process improvements in installation, mean we can reach customers faster with most service appointments now scheduled within 2 days of placing an order.
Business customers also benefited from service enhancements. By improving dispatch processes, we were able to deliver same day service for small businesses 73% of the time by the end of 2016, a 98% improvement since 2014. Because it’s crucial for our business customers to get up and running quickly, Bell has dedicated pages on Bell.ca for small business and enterprise clients, connecting customers directly to one of Bell’s specially trained business experts.
A simpler self-serve experience
As Canadians increasingly manage their services and pay their bills over a mobile device, our enhanced self-serve options give our customers more control over their accounts than ever before.
Users of the MyBell app can access a redesigned and simplified bill any time, track their data use, pay a bill or change account features, including travel add-ons like Roam Better.
For Mobility customers, Bell revamped our entire welcome strategy from the time of sale to beyond the first bill in order to make sure customers have the easiest way to get the right information at the right time.

16

This covers everything from an in-store checklist to the Bell Mobility Interactive tour – a customized video for new wireless customers explaining their first bill, how to check usage, and how to add new features.
These innovations are generating positive results. Transactions on our MyBell app increased 34% compared to last year while the volume of calls to our service centres fell by 4 million.
This not only reduces the costs of serving a growing customer base, it also enables our representatives to spend more time with the customers who call in.
A further measure of our progress is a reduction of complaints lodged with the federal Commissioner for Complaints for Telecommunications Services (CCTS). After a steady decline in complaints in each of the last 3 years, in 2016, complaints to CCTS about Bell fell 18%.
Meeting the needs of all our customers
Bell has taken steps over the past several years to make it easier for Canadians with physical, speech, cognitive, hearing, and vision-related challenges to access our advanced communications products and services. In 2016, we upgraded our Accessibility Services Centre on Bell.ca, with improved navigation when using screen readers and keyboards. The site meets internationally recognized Web Content Accessibility Guidelines and also features a new mobile device selector, making it easier to find devices with specific accessibility features such as hearing aid compatibility and screen magnification.
There’s also the Mobile Accessibility app, a screen reader app to assist low-vision and blind users that’s complimentary for all Bell Mobility customers with an Android device. To support Canadians who are deaf or hard of hearing, Bell introduced a dedicated wireless rate plan that eliminates unnecessary voice minutes.
Bell has invested approximately $25 million in accessibility initiatives such as Text with 9-1-1 service, enabling customers with speech or hearing impairment to communicate with emergency services, and Video Relay Service (VRS), which facilitates real-time sign-language interpretation of telephone conversations.
Expanding our reach
Bell is continuing to expand and enhance our network of retail outlets which includes about 1,400 Bell-branded stores and The Source locations across the country, plus several hundred locations of Glentel, 50% owned by Bell, operating under such brands as WIRELESSWAVE and WAVE SANS FIL.
With highly trained front-line retail staff and ongoing enhancements to store design, including a recent upgrade to the accessories section at Bell’s flagship store at the Toronto Eaton Centre, our retail customer experience is unparalleled.
Improving customer service is critical to achieving Bell’s goal of being recognized by customers as Canada’s leading communications company. Our results show that customers are embracing our online self-serve and mobile apps, making fewer calls to our service centres and are more satisfied than ever before. We’re committed to building on our strong service momentum in 2017.
17
BCE INC. 2016 ANNUAL REPORT
STRATEGIC IMPERATIVE
Achieve a
competitive
cost structure
Focused on achieving best-in-class operating efficiencies, Bell puts a high priority on controlling costs in order to enhance our ability to invest in growth-generating infrastructure and innovation, and maximize value to our customers in a competitive marketplace.
With a close eye on any discretionary spending, we minimize business travel whenever possible by employing the same teleconferencing and videoconferencing productivity tools we offer to other companies. It’s a strategy that helps improve productivity as team members reduce time on the road between Bell’s many locations across the country and gain time in the office and at home.
In 2016, we continued to find savings from the integration of Bell Aliant and from adjusting our workforce as our business evolves, expanding in high-growth broadband services and reducing in declining traditional lines of business.
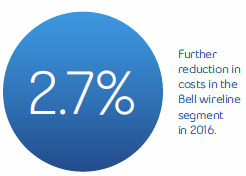
Our wireline segment reduced costs by 2.7% in 2016, supporting the second straight year of growth in adjusted EBITDA and continued improvement in Bell’s North American-leading wireline EBITDA margin.
Customer operations also delivered significant productivity savings. By investing heavily in online and mobile customer self-serve options, we have reduced higher-cost calls to our service centres significantly, by 4 million in 2016.
We have also invested in productivity technology for our installation and service technicians, enabling significant gains in their ability to get the job done right on the first visit – cutting truck rolls by 100,000 in 2016 while achieving record customer satisfaction scores. The new Appointment Manager tool has reduced the number of times our technicians find no one home at the appointed time by 27%.
In 2016 we significantly reduced our cost of borrowing, obtaining the lowest-ever financing rate on MTN debentures that will be used to repay debt and fund investments.
Everyone at Bell is involved in driving a more competitive cost structure at our company, reducing waste and expenses while maximizing productivity and strategic investment. It’s a critical imperative as Bell leads the way in investing in Canada’s broadband communications future.

18

CORPORATE RESPONSIBILITY
Bell’s corporate responsibility focus considers the community, environmental and broad economic impact of all our business operations. We work to safeguard privacy, foster a diverse workplace and ensure environmental sustainability, participating in respected Canadian and international bodies that benchmark our performance against peer companies here and around the world.
This includes community investment leadership with Bell Let’s Talk and other initiatives such as United Way Centraide and the Canadian Centre for Child Protection. Our employees and retirees also contributed $2.2 million in charitable gifts through the Bell Employee Giving Program and more than 336,000 hours of personal volunteer time.
Bell was again recognized as Canada’s top communications company in corporate sustainability and environmental performance in Newsweek’s 2016 international ranking of the world’s Top Green Companies.
Bell was named one of the Top 50 Socially Responsible Corporations by Maclean’s and L’Actualité, and one of the Best 50 Corporate Citizens in Canada by Corporate Knights. Workforce diversity was a key factor in Bell being recognized as one of Canada’s Top 100 Employers in 2016.
To learn more about these initiatives, please see the Bell Corporate Responsibility Report at BCE.ca.


19

BCE INC. 2016 ANNUAL REPORT
COMMUNITY INVESTMENT
Bell Let’s Talk:
Record engagement in
Canada’s mental health cause
Bell Let’s Talk fights the stigma around mental illness while funding mental healthcare, research and workplace initiatives across Canada.
Bell’s initiative is having a direct and positive impact on perceptions of mental illness, reflected in recent data from Nielsen outlining that most Canadians are more aware of mental health issues than 6 years ago and think that progress is being made.
Significantly, 82% of Canadians (and 88% of young people) believe attitudes towards mental illness have changed for the better, up from 70% last year. At the same time, 72% (76% of young people) believe stigma has been reduced, up from just 57% the year before.
Canadians everywhere join the fight against the stigma
Reducing the stigma around mental illness is critical to making progress in mental health, because too many who struggle won’t seek the help they need because of fear or embarrassment. Bell Let’s Talk Day has played a key role in growing both awareness and action by sparking a renewed cross-Canada mental health conversation each year.
Bell Let’s Talk Day 2017 on January 25 achieved all-new records for engagement in the national mental health discussion – 131,705,010 social media interactions and texts, mobile calls and long distance calls by Bell customers.
Because Bell donates 5 cents for each interaction on Bell Let’s Talk Day at no extra charge to participants, our funding for Canadian mental health grew by $6,585,250.50. Added to the results of the previous 6 Bell Let’s Talk Days plus Bell’s original $50-million anchor donation, Bell’s total funding commitment is now $86,504,429.05 – well on the way to our target of at least $100 million in 2020.
Social media interaction on Bell Let’s Talk Day almost tripled in 2017 thanks to the addition of Snapchat and Instagram support, on top of Twitter and Facebook. #BellLetsTalk was once again the top Twitter trend in Canada and worldwide, and the new Bell Let’s Talk Snapchat geofilter was the social media platform’s most-used filter ever in Canada for one day.
Again on Bell Let’s Talk Day, political leaders, royalty, sports heroes, corporations and competitors, entertainers and other celebrities embraced the cause, driving unprecedented social media engagement from millions of fans in Canada and around the world.
More than 20,000 student-athletes at 54 universities helped lead the Bell Let’s Talk Day conversation on campuses, and more than 100 university sports games across the country were part of the campaign.
Student-athletes also led the charge on Canada’s largest-ever Thunderclap, the social media crowdspeaking platform that allows a single message to be shared en masse. With 5,479 people registered and a social reach of 6,003,469, the Bell Let’s Talk Day Thunderclap was the biggest ever for mental health worldwide.

20

The Bell Let’s Talk team thanks the hundreds of Canadian corporations, hospitals and universities, governments, the Canadian Armed Forces, professional sports teams and associations, community and mental health partners, chambers of commerce, and schools, colleges and universities that joined the conversation on Bell Let’s Talk Day through events, promotions and advertising, social media, newsletters and websites.
Bell Let’s Talk funding at work
While Bell Let’s Talk Day is the highest-profile part of the initiative, Bell’s funding helps move Canada’s mental health forward every day of the year.
Bell Let’s Talk has supported hundreds of organizations in every region of the country since 2010, which have in turn provided direct mental health assistance to at least 1.5 million Canadians.
This includes front-line organizations supporting mental health at the community level. The Bell Let’s Talk Community Fund announced grants of $5,000 to $25,000 for 72 more community groups all around Canada in 2016, bringing the total number of groups supported by the Fund since it was launched in 2011 to 345.
Bell extended its $1 million partnership with the True Patriot Love Foundation in 2016 for another 4 years, supporting mental health services for Canadian Armed Forces members, their families and veterans.
Bell Let’s Talk supports research projects and improved access to care at major healthcare institutions and universities. In 2016, Bell donated $1 million to renew the Bell Canada Mental Health and Anti-Stigma Research Chair at Queen’s University, including the re-appointment of Dr. Heather Stuart, inaugural holder of the world’s first anti-stigma research chair, for another 5 years.
A new $250,000 donation to McGill University’s Montréal Neurological Institute and Hospital is funding the development of online resources focused on the mental health needs of multicultural communities.
Funding from Bell Let’s Talk is accelerating government support for mental health initiatives. A $1 million gift to Strongest Families Institute is being matched by all 4 Atlantic provinces to improve mental health services for about 2,000 children.
A $300,000 Bell Let’s Talk donation to improve access to care at 2 health foundations in Québec’s Lanaudière region is being matched by the government of Québec.
As part of its multi-year, $1 million fund for Canada’s Northern territories, Bell Let’s Talk has also committed $250,000 for a counter-suicide safeTALK program to be delivered by Nunavut’s Embrace Life Council.
Bell Let’s Talk is supporting the integration of mental health training in standard and emergency first aid courses with a $150,000 donation to St. John Ambulance. Available nationally next year, the courses will be offered in workplaces, hospitals, schools and communities and teach participants what to do in an emergency, including how to recognize high-risk situations and when to escalate a mental health situation to professionals.
21
BCE INC. 2016 ANNUAL REPORT
BELL ARCHIVES
Celebrating Canada 150
and Bell’s role in our
nation’s development
Canada was barely a teenager, just 13 years old, when Bell Canada was founded in 1880 in Montréal. Ever since, the growth of the country and our company has been entwined as Bell’s networks, communications services and media properties have woven Canadians and their stories together.

As Canada marks 150 years of Confederation, and Montréal celebrates its own 375thanniversary, we took a look through Bell’s archives for some interesting history…
First coast-to-coast radio broadcast
To mark the 1927 Diamond Jubilee of Confederation, Bell led the engineering for the first-ever coast-to-coast radio broadcast, from Halifax to Vancouver. This involved connecting 23 radio stations nationally as well as the installation of loudspeakers in stadiums, parks and other public places so that people without radios could listen in to the broadcast by Prime Minister William Lyon Mackenzie King and hear the inaugural ringing of the Peace Tower Carillion on Parliament Hill.
The radio stations involved included 2 that are part of Bell Media’s network of 105 news, sports and music radio properties nationwide: CFRB, now Bell Media’s Newstalk 1010 in Toronto, and CKOC in Hamilton, Ontario, Canada’s oldest continuously operating radio station and now TSN Hamilton 1150.
Bell helps Expo 67 welcome the world
Canada marked its Centennial 40 years later, and Bell was the lead player in the creation of one of the most popular attractions at Expo 67: the Telephone Association of Canada pavilion. Crowds waited in long lines to see the ground breaking Circle-Vision 360° film called Canada 67, and try “picturephones” to see who they were talking to.
Canada 150
Bell is sponsoring celebrations in the nation’s capital as our broadband networks and media properties provide unprecedented access to Canada 150 festivities across multiple platforms and screens.
Bell is powering the Ottawa 2017 travelling kiosk and experiential mobile app, and creating a special multimedia experience in the capital city’s underground LRT system. Bell Media’s national reach ensures Canadians everywhere can join in the nation’s big birthday party.
Bell’s Annual General Meeting of Shareholders will also take place on April 26 at Ottawa’s National Gallery of Canada to mark Canada 150.
22

Bell Media will also employ its television, radio, outdoor and digital properties to promote the country’s anniversary throughout the year – which includes Canada In A Day, a CTV special this summer that was created entirely from videos made by people nationwide in a single day.
Showcasing Bell history
To highlight Bell’s important role in Montréal as the city celebrates its 375thanniversary in 2017, we’re mounting a year-long exhibition of our history at the Pointe-à-Callière Montréal Archaeology and History Complex.
Detailing the impact of Alexander Graham Bell’s invention on our country’s growth and cultural development,Hello Montréal!features 250 artifacts from the Bell archives presented in a fun and compelling way for people of all ages.


23

| Table of contents |
| Management’s discussion and analysis | 26 | ||
| 1 | Overview | 27 | |
| 1.1 | Introduction | 27 | |
| 1.2 | About BCE | 29 | |
| 1.3 | Key corporate developments | 33 | |
| 1.4 | Capital markets strategy | 34 | |
| 1.5 | Corporate governance and risk management | 36 | |
| 2 | Strategic imperatives | 39 | |
| 2.1 | Accelerate wireless | 39 | |
| 2.2 | Leverage wireline momentum | 39 | |
| 2.3 | Invest in broadband networks and services | 40 | |
| 2.4 | Expand media leadership | 41 | |
| 2.5 | Improve customer service | 42 | |
| 2.6 | Achieve a competitive cost structure | 42 | |
| 3 | Performance targets, outlook, assumptions and risks | 43 | |
| 3.1 | 2016 performance vs. guidance targets | 43 | |
| 3.2 | Business outlook and assumptions | 43 | |
| 3.3 | Principal business risks | 44 | |
| 4 | Consolidated financial analysis | 46 | |
| 4.1 | Introduction | 46 | |
| 4.2 | Customer connections | 47 | |
| 4.3 | Operating revenues | 48 | |
| 4.4 | Operating costs | 49 | |
| 4.5 | Net earnings | 50 | |
| 4.6 | Adjusted EBITDA | 50 | |
| 4.7 | Severance, acquisition and other costs | 51 | |
| 4.8 | Depreciation and amortization | 51 | |
| 4.9 | Finance costs | 52 | |
| 4.10 | Other income (expense) | 52 | |
| 4.11 | Income taxes | 53 | |
| 4.12 | Net earnings attributable to common shareholders and EPS | 53 | |
| 4.13 | Capital expenditures | 54 | |
| 4.14 | Cash flows | 54 | |
| 5 | Business segment analysis | 55 | |
| 5.1 | Bell Wireless | 55 | |
| 5.2 | Bell Wireline | 62 | |
| 5.3 | Bell Media | 70 | |
| 6 | Financial and capital management | 76 | |
| 6.1 | Net debt | 76 | |
| 6.2 | Outstanding share data | 76 | |
| 6.3 | Cash flows | 77 | |
| 6.4 | Post-employment benefit plans | 79 | |
| 6.5 | Financial risk management | 79 | |
| 6.6 | Credit ratings | 82 | |
| 6.7 | Liquidity | 82 | |
| 7 | Selected annual and quarterly information | 85 | |
| 7.1 | Annual financial information | 85 | |
| 7.2 | Quarterly financial information | 87 | |
| 8 | Regulatory environment | 90 | |
| 9 | Business risks | 95 | |
| 10 | Financial measures, accounting policies and controls | 102 | |
| 10.1 | Our accounting policies | 102 | |
| 10.2 | Non-GAAP financial measures and key performance indicators (KPIs) | 106 | |
| 10.3 | Effectiveness of internal controls | 109 | |
| Reports on internal control | 110 | |
| Management’s report on internal control over financial reporting | 110 | |
| Report of independent registered public accounting firm | 111 | |
| Consolidated financial statements | 112 | |
| Management’s responsibility for financial reporting | 112 | |
| Report of independent registered public accounting firm | 113 | |
| Consolidated income statements | 114 | |
| Consolidated statements of comprehensive income | 114 | |
| Consolidated statements of financial position | 115 | |
| Consolidated statements of changes in equity | 116 | |
| Consolidated statements of cash flows | 117 | |
| Notes to consolidated financial statements | 118 | |
| Note 1 | Corporate information | 118 |
| Note 2 | Significant accounting policies | 118 |
| Note 3 | Business acquisitions and dispositions | 127 |
| Note 4 | Segmented information | 129 |
| Note 5 | Operating costs | 131 |
| Note 6 | Severance, acquisition and other costs | 131 |
| Note 7 | Interest expense | 132 |
| Note 8 | Other income (expense) | 132 |
| Note 9 | Income taxes | 133 |
| Note 10 | Earnings per share | 134 |
| Note 11 | Trade and other receivables | 135 |
| Note 12 | Inventory | 135 |
| Note 13 | Property, plant and equipment | 135 |
| Note 14 | Intangible assets | 137 |
| Note 15 | Investments in associates and joint ventures | 138 |
| Note 16 | Other non-current assets | 138 |
| Note 17 | Goodwill | 138 |
| Note 18 | Trade payables and other liabilities | 139 |
| Note 19 | Debt due within one year | 139 |
| Note 20 | Long-term debt | 140 |
| Note 21 | Provisions | 141 |
| Note 22 | Post-employment benefit plans | 142 |
| Note 23 | Other non-current liabilities | 146 |
| Note 24 | Financial and capital management | 146 |
| Note 25 | Share capital | 150 |
| Note 26 | Share-based payments | 151 |
| Note 27 | Commitments and contingencies | 154 |
| Note 28 | Related party transactions | 154 |
| Note 29 | Significant partly-owned subsidiaries | 155 |
| Board of directors | 156 | |
| Executives | 157 | |
| Investor information | 158 | |
BCE Inc. 2016 ANNUAL REPORT 25 | |||
MD&A | |||
| Management’s discussion and analysis |
In this management’s discussion and analysis of financial condition and results of operations (MD&A),we,us,our,BCE andthe companymean, as the context may require, either BCE Inc. or, collectively, BCE Inc., Bell Canada, their subsidiaries, joint arrangements and associates.Bellmeans, as the context may require, either Bell Canada or, collectively, Bell Canada, its subsidiaries, joint arrangements and associates.
All amounts in this MD&A are in millions of Canadian dollars, except where noted. Please refer to section 10.2,Non-GAAP financial measures and key performance indicators (KPIs)on pages 106 to 109 for a list of defined non-GAAP financial measures and key performance indicators.
Please refer to BCE’s audited consolidated financial statements for the year ended December 31, 2016 when reading this MD&A.
In preparing this MD&A, we have taken into account information available to us up to March 2, 2017, the date of this MD&A, unless otherwise stated.
You will find additional information relating to BCE, including BCE’s audited consolidated financial statements for the year ended December 31, 2016, BCE’s annual information form for the year ended December 31, 2016, dated March 2, 2017 (BCE 2016 AIF) and recent financial reports, on BCE’s website atBCE.ca, on SEDAR atsedar.comand on EDGAR atsec.gov.
This MD&A comments on our business operations, performance, financial position and other matters for the two years ended December 31, 2016 and 2015.
| CAUTION REGARDING FORWARD-LOOKING STATEMENTS |
BCE’s 2016 annual report, including this MD&A and, in particular, but without limitation, section 1.3,Key corporate developments, section 1.4, Capital markets strategy, section 2,Strategic imperatives, section 3.2,Business outlook and assumptions, section 5,Business segment analysisand section 6.7,Liquidityof this MD&A, contains forward-looking statements. These forward-looking statements include, but are not limited to, statements relating to BCE’s 2017 annualized common share dividend and common share dividend payout policy, the expected improvement of BCE’s net debt leverage ratio and return thereof within BCE’s target range, the sources of liquidity we expect to use to meet our anticipated 2017 cash requirements, our expected 2017 post-employment benefit plans funding, our network deployment and capital investment plans, the expected timing and completion of the proposed acquisition of Manitoba Telecom Services Inc. (MTS) and of the proposed divestitures to TELUS Corporation through one or more of its subsidiaries (collectively, the TELUS Group) and Xplornet Communications Inc. (Xplornet) of certain assets, certain synergies and other benefits expected to result from the proposed acquisition of MTS, and BCE’s business outlook, objectives, plans and strategic priorities. Forward-looking statements also include any other statements that do not refer to historical facts. A statement we make is forward-looking when it uses what we know and expect today to make a statement about the future. Forward-looking statements are typically identified by the wordsassumption,goal,guidance,objective,outlook,project,strategy,targetand other similar expressions or future or conditional verbs such asaim,anticipate,believe,could,expect,intend,may,plan,seek,should,striveandwill. All such forward-looking statements are made pursuant to the safe harbour provisions of applicable Canadian securities laws and of the United StatesPrivate Securities Litigation Reform Act of 1995.
Unless otherwise indicated by us, forward-looking statements in BCE’s 2016 annual report, including in this MD&A, describe our expectations as at March 2, 2017 and, accordingly, are subject to change after that date. Except as may be required by Canadian securities laws, we do not undertake any obligation to update or revise any forward-looking statements, whether as a result of new information, future events or otherwise.
Forward-looking statements, by their very nature, are subject to inherent risks and uncertainties and are based on several assumptions, both general and specific, which give rise to the possibility that actual results or events could differ materially from our expectations expressed in, or implied by, such forward-looking statements and that our business outlook, objectives, plans and strategic priorities may not be achieved. As a result, we cannot guarantee that any forward-looking statement will materialize and we caution you against relying on any of these forward-looking statements. Forward-looking statements are presented in BCE’s 2016 annual report, including in this MD&A, for the purpose of assisting investors and others in understanding our objectives, strategic priorities and business outlook as well as our anticipated operating environment. Readers are cautioned, however, that such information may not be appropriate for other purposes.
We have made certain economic, market and operational assumptions in preparing the forward-looking statements contained in BCE’s 2016 annual report and, in particular, but without limitation, the forward-looking statements contained in the previously-mentioned sections of this MD&A. These assumptions include, without limitation, the assumptions described in the various sections of this MD&A entitledBusiness outlook and assumptions, which sections are incorporated by reference in this cautionary statement. We believe that our assumptions were reasonable at March 2, 2017. If our assumptions turn out to be inaccurate, our actual results could be materially different from what we expect.
Important risk factors including, without limitation, regulatory, competitive, economic, financial, operational, technological and other risks that could cause actual results or events to differ materially from those expressed in, or implied by, the previously-mentioned forward-looking statements and other forward-looking statements contained in BCE’s 2016 annual report, and in particular in this MD&A, include, but are not limited to, the risks described or referred to in section 9,Business risks, which section is incorporated by reference in this cautionary statement.
We caution readers that the risks described in the previously-mentioned section and in other sections of this MD&A are not the only ones that could affect us. Additional risks and uncertainties not currently known to us or that we currently deem to be immaterial may also have a material adverse effect on our financial position, financial performance, cash flows, business or reputation. Except as otherwise indicated by us, forward-looking statements do not reflect the potential impact of any special items or of any dispositions, monetizations, mergers, acquisitions, other business combinations or other transactions that may be announced or that may occur after March 2, 2017. The financial impact of these transactions and special items can be complex and depends on facts particular to each of them. We therefore cannot describe the expected impact in a meaningful way, or in the same way we present known risks affecting our business.
| 26 BCE Inc. 2016 ANNUAL REPORT | |||
| 1 | Overview | MD&A | |
| 1 Overview |
| 1.1 Introduction |
At a glance
BCE is Canada’s largest communications company, providing residential, business and wholesale customers with a wide range of solutions for all their communications needs. BCE’s shares are publicly traded on the Toronto Stock Exchange and on the New York Stock Exchange (TSX, NYSE: BCE).
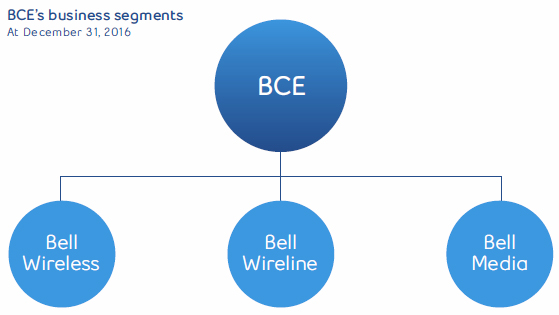
Our results are reported in three segments: Bell Wireless, Bell Wireline and Bell Media.
Bell Wireless provides wireless voice and data communications products and services to our residential, small and medium-sized business and large enterprise customers across Canada.
Bell Wireline provides data, including Internet access and Internet protocol television (IPTV), local telephone, long distance, as well as other communications services and products to our residential, small and medium-sized business and large enterprise customers, primarily in Ontario, Québec and the Atlantic provinces, while satellite television (TV) service and connectivity to business customers are available nationally across Canada. In addition, this segment includes our wholesale business, which buys and sells local telephone, long distance, data and other services from or to resellers and other carriers.
Bell Media provides conventional, specialty and pay TV, digital media, radio broadcasting services and out-of-home (OOH) advertising services to customers nationally across Canada.
BCE is Canada’s
largest communications company
We also hold investments in a number of other assets, including:
- a 28% indirect equity interest in Maple Leaf Sports & Entertainment Ltd. (MLSE)
- a 50% indirect equity interest in Glentel Inc. (Glentel)
- an 18.4% indirect equity interest in entities that operate the Montréal Canadiens Hockey Club and the Bell Centre in Montréal
- a 50% indirect equity interest in the Toronto Argonauts Football Club (Argos)
BCE Inc. 2016 ANNUAL REPORT 27 | |||
| 1 | Overview | MD&A | |
| BCE consolidated results |
| BCE customer connections |
| Our goal |
Our goal is to be recognized by customers as Canada’s leading communications company. Our primary business objectives are to grow our subscribers profitably and to maximize revenues, operating profit, free cash flow and return on invested capital by further enhancing our position as the foremost provider in Canada of comprehensive communications services to residential, business and wholesale customers and as Canada’s premier content creation company. We seek to take advantage of opportunities to leverage our networks, infrastructure, sales channels, and brand and marketing resources across our various lines of business to create value for both our customers and other stakeholders.
Our strategy is centred on our disciplined focus and execution of six strategic imperatives. The six strategic imperatives that underlie BCE’s business plan are:
| (1) | Adjusted EBITDA, adjusted net earnings and free cash flow are non-GAAP financial measures and do not have any standardized meaning under International Financial Reporting Standards (IFRS). Therefore, they are unlikely to be comparable to similar measures presented by other issuers. See section 10.2,Non-GAAP financial measures and key performance indicators (KPIs) – Adjusted EBITDA and adjusted EBITDA margin, Adjusted net earnings and adjusted EPSandFree cash flow and dividend payout ratiofor more details, including reconciliations to the most comparable IFRS financial measure. |
| 28 BCE Inc. 2016 ANNUAL REPORT | |||
| 1 | Overview | MD&A | |
| 1.2 About BCE |
We report the results of our operations in three segments: Bell Wireless, Bell Wireline and Bell Media. We describe our product lines by segment below, to provide further insight into our operations.
| Our products and services |
Bell Wireless
SEGMENT DESCRIPTION
- Provides integrated digital wireless voice and data communications products and services to residential and business customers across Canada
- Includes the results of operations of Bell Mobility Inc. (Bell Mobility) and wireless-related product sales from our wholly-owned subsidiary, national consumer electronics retailer, The Source (Bell) Electronics Inc. (The Source)
 |
OUR NETWORKS AND REACH
We hold licensed national wireless spectrum, with holdings across various spectrum bands, totalling more than 4,500 million Megahertz (Mhz) per Population (MHz-pop), corresponding to a weighted-average of approximately 135 MHz-pop of spectrum across Canada.
The vast majority of our cell towers are connected by fibre, the latest in network infrastructure technology, for a more reliable connection.
We have deployed and operate a number of leading nationwide wireless broadband networks compatible with global standards that deliver high-quality and reliable voice and high-speed data services to virtually all of the Canadian population.
- Fourth Generation (4G) Long-term Evolution (LTE) network launched in September 2011:
- Provides mobile Internet data access speeds as fast as150 megabits per second (Mbps) (typical speeds of 12 to 40 Mbps)
- Covered 97% of the Canadian population coast to coast atDecember 31, 2016
- Expansion of our LTE services supported by continued re-purposingof wireless spectrum to increase capacity and coverage
- In-building coverage improvements to deliver a strongerLTE signal
- Reverts to the High-speed packet access plus (HSPA+) networkoutside LTE coverage area, ensuring continuity of service
- Supports international roaming in more than 100 destinations
- LTE Advanced (LTE-A) network service launched in February 2015:
- Dual-band LTE-A provides mobile Internet data access speedsas fast as 260 Mbps (expected average download speeds of18 to 74 Mbps)
- Tri-band LTE-A delivers speeds of up to 335 Mbps when usingcompatible devices (expected average download speeds of 25 to100 Mbps)
- Covered 73% of the Canadian population at December 31, 2016
- HSPA+ network launched in November 2009:
- Provides high-speed mobile access of up to 21 Mbps in mostareas (typical speeds of 3.5 to 8 Mbps), and as high as 42 Mbpsin areas with dual cell capability when using compatibledevices (typical speeds of 7 to 14 Mbps)
- Covered over 98% of the Canadian population coast to coast atDecember 31, 2016
- Supports international roaming in more than 230 destinations
- National third generation (3G) code division multiple access(CDMA) network, which we began decommissioning in 2014.The decommissioning is expected to be substantially completedin 2018.
- Largest wireless fidelity (Wi-Fi) network across Canada:
- Approximately 4,000 public Wi-Fi hotspots at participating McDonald’s, Tim Hortons and Chapters/Indigo retail outlets across Canada, in addition to thousands of Wi-Fi networks managed through our business markets team at enterprise customer locations.
- Approximately 2,500 retail points of distribution across Canada, including approximately 1,400 Bell-branded stores and The Source locations, Glentel-operated stores (WIRELESSWAVE, Tbooth wireless and WIRELESS etc.) as well as other third-party dealer and retail locations.
OUR PRODUCTS AND SERVICES
- Voice and data plans: available on either postpaid or prepaidoptions, providing fast web access, social networking, messaging(text, picture and video), the latest mobile applications and a hostof call features
- Extensive selection of devices: including leading 4G LTE andLTE-A smartphones and tablets
- Mobile Internet: Turbo Stick, Turbo Hub and mobile Wifi (MiFi) devices
- Mobile TV: over 40 live and on-demand channels on smartphonesand tablets
- Travel: roaming services with other wireless service providers inmore than 230 destinations worldwide, LTE roaming in over100 destinations, Travel Passes and Roam Better Internationalfeature
- Voice and Video over LTE (VoLTE): next generation of voice andvideo calling with faster call set up times, high-definition (HD) voicequality and ability to switch seamlessly between voice and videoduring calls
- Internet of Things (IoT) solutions: fleet management, assetmanagement, digital signage, wireless point-of-sale, remotemonitoring, telematics
- Mobile business solutions: push-to-talk, workforce management,worker safety, dispatch solutions, mobile device management
BCE Inc. 2016 ANNUAL REPORT 29 | |||
| 1 | Overview | MD&A | |
Bell Wireline
SEGMENT DESCRIPTION
- Provides data, including Internet access and IPTV, local telephone, long distance,as well as other communications services and products to residential, smalland medium-sized business and large enterprise customers, primarily in Ontario,Québec and the Atlantic provinces, while satellite TV service and connectivityto business customers are available nationally across Canada. We also offercompetitive local exchange carrier (CLEC) services in Alberta and British Columbia
- Includes the results of our wholesale business, which buys and sells localtelephone, long distance, data and other services from or to resellers and othercarriers, and the wireline operations of Northwestel Inc. (Northwestel),which provides telecommunications services in Canada’s Northern Territories
- Includes wireline-related product sales from The Source
 |
OUR NETWORKS AND REACH
- Extensive local access network in Ontario, Québec and theAtlantic provinces, as well as in Canada’s Northern Territories
- Largest fibre network in Canada, spanning over196,000 Kilometres (km)
- Broadband fibre network, consisting of fibre-to-the-node (FTTN)and fibre-to-the-premise (FTTP) locations, covering 8.3 millionhomes and businesses in Ontario, Québec and the Atlantic provinces
- Largest Internet protocol (IP) multi-protocol label switchingfootprint of any Canadian provider, enabling us to offer businesscustomers a virtual private network (VPN) service for IP traffic andto optimize bandwidth for real-time voice and TV
- Largest data centre footprint in Canada with 27 locations inseven provinces, enabling us to offer data centre co-locationand hosted services to business customers across Canada
- Approximately 1,400 Bell-branded stores and The Sourcelocations across Canada
OUR PRODUCTS AND SERVICES
RESIDENTIAL
- TV: Bell Fibe TV (our IPTV service) and direct-to-home (DTH)satellite TV provide extensive content options with HD and 4KResolution (4K) Whole Home personal video recorder (PVR), 4KUltra HD programming and on-demand content. Our IPTV servicealso offers consumers innovative features, including the Fibe TVapp, Fibe TV on Apple TV, Restart, Trending, access to CraveTV andNetflix and complete wireless set-up
- Internet: high-speed Internet access through fibre opticbroadband technology or digital subscriber line (DSL) witha wide range of options, including Home Hub all-in-one modemand Wi-Fi router, unlimited usage, a comprehensive suite ofsecurity solutions and mobile Internet. Our fibre optic Internetservice, marketed as Fibe Internet, offers speeds up to 50 Mbpswith FTTN or 1 Gigabit per second (Gbps) with FTTP.
- Home Phone: local telephone service, long distance and advancedcalling features
- NextGen Home Security: a digital Internet-based service availablein select locations in Atlantic Canada, providing home securityand monitoring with next-generation automation capabilities,including remote management via web portal and mobile devices,appliance controls, and secure video monitoring
- Bundles: multi-product bundles of TV, Internet and voice serviceswith monthly discounts
BUSINESS
- IP-based services: business Internet, IP VPN, point-to-point datanetworks and global network solutions
- Business service solutions: hosting and cloud services, managedservices, professional services and infrastructure services thatsupport and complement our data connectivity services
- Voice and unified communications: IP telephony, local and longdistance, web and audio conferencing and e-mail solutions
| 30 BCE Inc. 2016 ANNUAL REPORT | |||
| 1 | Overview | MD&A | |
Bell Media
SEGMENT DESCRIPTION
- Canada’s premier content creation company with leadingassets in TV, radio, OOH advertising and digital media
- Revenues are derived primarily from advertising andsubscriber fees
- Conventional TV revenue is derived from advertising
- Specialty TV revenue is generated from subscription feesand advertising
- Pay TV revenue is received from subscription fees
- Radio revenue is generated from advertising aired overour stations
- OOH revenues are generated from advertising
- Digital media revenues are generated from advertising
 |
OUR ASSETS AND REACH
TV
- 30 conventional TV stations, including CTV, Canada’s highest-rated TV network based on viewership
- 30 specialty TV channels, including TSN, RDS, Canada’s leadingFrench-language specialty channel based on viewers aged 25-54,and Discovery, Canada’s leading entertainment specialty channelbased on viewers aged 25-54
- Four national pay TV services, including The Movie Network (TMN)and Super Écran
RADIO
- 105 licensed radio stations in 54 markets across Canada
OOH ADVERTISING
- Network of more than 30,000 advertising faces in British Columbia, Alberta, Ontario, Québec and Nova Scotia
DIGITAL MEDIA
- More than 200 websites and over 30 apps
BROADCAST RIGHTS
- Sports: Bell Media has secured long-term media rights to many ofthe key sports properties that are most important to Canadians,and is the official Canadian broadcaster of the Super Bowl, GreyCup and International Ice Hockey Federation (IIHF) World JuniorChampionship. Bell Media’s slate of live sports coverage alsoincludes the Toronto Maple Leafs, Montréal Canadiens, WinnipegJets and Ottawa Senators, Canadian Football League (CFL),National Football League (NFL), National Basketball League (NBA),Major League Soccer (MLS), Fédération Internationale de FootballAssociation (FIFA) World Cup events through to 2026, Season ofChampions Curling, Major League Baseball (MLB), Premier League,Union of European Football Associations (UEFA) Champions League,UEFA Europa League, golf’s major championships, Monster EnergyNASCAR Cup Series, Formula 1, Formula E, Grand Slam Tennis,Ultimate Fighting Championship (UFC), National Collegiate AthleticAssociation (NCAA) March Madness and more.
- HBO: long-term agreement to deliver all current-season, past-season and library HBO programming in Canada exclusively onour linear, on-demand and over-the-top (OTT) platforms
- SHOWTIME: long-term content licensing and trademarkagreement for past, present and future SHOWTIME-ownedprogramming
- iHeartRadio: exclusive partnership for digital and streaming musicservices in Canada
OTHER ASSETS
- 50% interest in Dome Productions Partnership, one of North America’s leading providers of sports and other event production and broadcast facilities
OUR PRODUCTS AND SERVICES
- Varied and extensive array of TV programming to broadcastdistributors across Canada
- Advertising on our TV, radio, OOH, and digital media propertiesto both local and national advertisers across a wide range ofindustry sectors
- CraveTV subscription on-demand TV streaming service offeringa large collection of premium content in one place, including HBOand SHOWTIME programming, on set-top boxes (STBs), mobiledevices and online. CraveTV is offered through a number ofCanadian TV providers and is available directly to all CanadianInternet subscribers as an OTT service.
- TV Everywhere services, including CTV GO, Discovery GO, TMN GO,TSN GO, and RDS GO which provide live and on-demand contentdelivered over mobile and Wi-Fi networks to smartphones, tabletsand computers
- Mobile TV service with live and on-demand access to content fromour conventional TV networks, CTV and CTV Two, BNN, TSN, RDS,Comedy and other brands in news, sports and entertainment. Thismobile content is offered on commercial terms to all Canadianwireless providers.
BCE Inc. 2016 ANNUAL REPORT 31 | |||
| 1 | Overview | MD&A | |
Other BCE investments
BCE also holds investments in a number of other assets, including:
- a 28% indirect equity interest in MLSE, a sports and entertainment companythat owns several sports teams as well as real estate and entertainmentassets in Toronto
- a 50% indirect equity interest in Glentel, a Canadian-based dual-carrier,multi-brand mobile products distributor
- an 18.4% indirect equity interest in entities that operate the MontréalCanadiens Hockey Club and the Bell Centre in Montréal
- a 50% indirect equity interest in the Argos
 |
| Our people |
EMPLOYEES
At the end of 2016, our team included 48,090 employees dedicated to driving shareholder return and improving customer service.
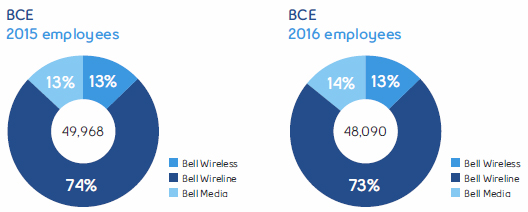
The total number of BCE employees at the end of 2016 decreased by 1,878 employees compared to the end of 2015, due primarily to workforce reductions across our Bell Wireline and Bell Wireless segments attributable to normal attrition, retirements and productivity improvements.
Approximately 44% of total BCE employees are represented by labour unions.
BELL CODE OF BUSINESS CONDUCT
The ethical business conduct of our people is core to the integrity with which we operate our business. The Bell Code of Business Conduct sets out specific expectations and accountabilities, providing employees with practical guidelines to conduct business in an ethical manner. Our commitment to the Code of Business Conduct is renewed by employees each year in an ongoing effort to ensure that all employees are aware of, and adhere to, Bell’s standards of conduct.
| 32 BCE Inc. 2016 ANNUAL REPORT | |||
| 1 | Overview | MD&A | |
| 1.3 Key corporate developments |
MTS acquisition expected to close on March 17
On February 15, 2017, Innovation, Science and Economic Development Canada (ISED) and the Competition Bureau approved BCE’s $3.9 billion acquisition of MTS originally announced on May 2, 2016. The combined companies’ Manitoba operations will be known as Bell MTS. These approvals, together with the Canadian Radio-television and Telecommunications Commission’s (CRTC) approval on December 20, 2016, under theBroadcasting Act, of the transfer of the broadcasting distribution undertaking (BDU) licence held by MTS to BCE, completed all regulatory approvals required to close the transaction. MTS shareholders approved BCE’s acquisition of MTS at a special shareholders meeting held on June 23, 2016 and the Manitoba Court of Queen’s Bench issued a final order approving the acquisition on June 29, 2016. Subject to certain closing conditions and termination rights, this transaction is expected to close on March 17, 2017.
The transaction will be completed through a plan of arrangement under which BCE will acquire all of the issued and outstanding common shares of MTS for $40 per share, which will be paid 55% through the issuance of BCE common shares and 45% in cash. The cash component will be funded through debt financing (Refer to section 6.7,Liquidity, for more details) and BCE will issue approximately 28 million common shares for the equity portion of the transaction. If the transaction does not close under certain circumstances BCE may be liable to pay a break fee of $200 million to MTS.
The acquisition of MTS, which is expected to be accretive to BCE’s revenue, adjusted EBITDA and free cash flow, will allow us to reach more Canadians through the expansion of our wireless and wireline broadband networks while supporting our goal of being recognized by customers as Canada’s leading communications company.
As part of a consent agreement with the Competition Bureau, BCE has agreed to divest approximately one-quarter of MTS’ postpaid wireless subscribers and 13 retail locations to the TELUS Group for total proceeds of approximately $300 million, subject to final adjustments. Subject to certain closing conditions and termination rights, this transaction is expected to close on April 1, 2017. The $75 million break fee that was payable by BCE to the TELUS Group if the transaction with the TELUS Group did not close under certain circumstances is no longer applicable given the receipt of all regulatory approvals.
As part of the previously mentioned consent agreement, BCE has also agreed to transfer to Xplornet a total of 40 MHz of 700 MHz, Advanced Wireless Services-1 (AWS-1) and 2500 MHz wireless spectrum currently held by MTS, which has also been approved by ISED; 24,700 wireless customers once Xplornet launches its mobile wireless service; and five retail outlets in Winnipeg and one in Brandon. Xplornet will receive transitional remedy network access from Bell MTS in urban areas of Manitoba for three years and other operational benefits as Xplornet builds out its own wireless network in Manitoba. Subject to certain closing conditions and termination rights, this transaction is expected to close on March 17, 2017.
| Acquisition of Q9 Networks Inc. (Q9) |
On October 3, 2016, BCE acquired all equity it did not already own in Q9, a Toronto-based data centre operator providing outsourced hosting and other data solutions to Canadian business and government customers. Q9 had previously been acquired in October 2012 by an investor group comprised of BCE, Ontario Teachers’ Pension Plan Board, Providence Equity Partners LLC and funds managed by Madison Dearborn Partners LLC. BCE held a 35.4% stake in Q9 and has acquired the remaining 64.6% equity interest from its fellow investors. The transaction was valued at approximately $680 million, including Q9 net debt but excluding BCE’s prior ownership interest. The acquisition supports BCE’s ability to compete against domestic and international providers in the growing outsourced data services sector.
| Recognition of Bell’s environmental leadership |
United States magazine Newsweek once again recognized Bell’s environmental leadership by naming it on its annual list of the top green companies in the world. Bell placed 110th on the newsmagazine’s 2016 list of 500 publicly traded international companies and is the only Canadian communications provider on the list. Bell ranked sixth out of the 16 Canadian companies recognized for 2016. The first telecommunications company in Canada to achieve the highest level certification for its environmental management system (ISO 14001), Bell continuously seeks to reduce the environmental impact of its operations across its networks, Information Technology (IT) infrastructure, buildings and service fleet. In 2016, we made progress in a number of areas, reducing electricity by about 26 gigawatt hours and generating about 450,000 kilowatt hours (kWh) of renewable energy from solar and wind power sources. We also reduced fuel consumption by about 3 million litres due in part to our investment in more than 1,000 new fuel-efficient replacement vehicles and the continuous efforts of team members to reduce idling.
BCE Inc. 2016 ANNUAL REPORT 33 | |||
| 1 | Overview | MD&A | |
| 1.4 Capital markets strategy |
We seek to deliver sustainable shareholder returns through consistent dividend growth. That objective is underpinned by continued growth in free cash flow, a healthy level of ongoing capital investment in the business, a strong balance sheet and an investment-grade credit profile.
| Dividend growth and payout policy |
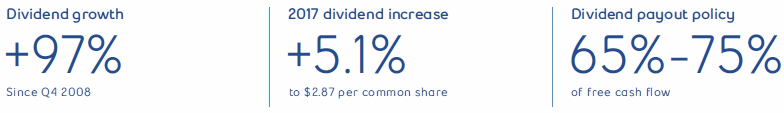
On February 2, 2017, we announced a 5.1%, or 14 cent, increase in the annualized dividend payable on BCE’s common shares for 2017 to $2.87 per share from $2.73 per share in 2016, starting with the quarterly dividend payable on April 15, 2017. This represents BCE’s 13th increase to its annual common share dividend, representing a 97% increase, since the fourth quarter of 2008.
The dividend increase for 2017 is consistent with BCE’s common share dividend policy of a target payout between 65% and 75% of free cash flow. Our objective is to seek to achieve dividend growth while maintaining our dividend payout ratio(1) within the target range and balancing our strategic business priorities. BCE’s dividend payout policy and the declaration of dividends are subject to the discretion of the BCE board of directors (BCE Board or Board) and, consequently, there can be no guarantee that BCE’s dividend policy will be maintained or that dividends will be increased or declared.
We have a strong alignment of interest between shareholders and our management’s equity-based long-term incentive compensation plan. The vesting of performance share units depends on the realization of our dividend growth policy, while stock options reflect our objective to increase the share price for our shareholders.

- Stringent share ownership requirements
- Emphasis on pay-at-risk for executive compensation
- Double trigger change-in-control policy
- Anti-hedging policy on share ownership and incentive compensation
- Clawbacks for the President and CEO and all Executive Vice-Presidentsas well as all option holders
- Caps on all supplemental executive retirement plans (SERPs) and annualbonus payouts, in addition to mid-term and long-term incentive grants
- Vesting criteria fully aligned to shareholder interests
| Use of excess cash(2) |
Our dividend payout policy allows BCE to retain a high level of excess cash. Consistent with our capital markets objective to deliver sustainable shareholder returns through dividend growth while maintaining appropriate levels of capital investment, investment-grade credit ratings and considerable overall financial flexibility, we deploy excess cash in a balanced manner.
Uses of excess cash include, but are not limited to:
- Voluntary contributions to BCE’s defined benefit (DB) pension plans to improve the funded position of the plans and help minimize volatility of future funding requirements
- Financing of strategic acquisitions and investments (includingwireless spectrum purchases) that support the growth ofour business
- Debt reduction
- Share buybacks through normal course issuer bid(NCIB) programs
In 2016, BCE’s excess cash of $921 million, up 11.0% from $830 million in 2015, was directed towards a voluntary contribution to BCE’s DB pension plans, the national expansion of TMN at Bell Media, and various acquisitions that support our strategic imperatives, including Q9.
| (1) | Dividend payout ratio is a non-GAAP financial measure and does not have any standardized meaning under IFRS. Therefore, it is unlikely to be comparable to similar measures presented by other issuers. See section 10.2,Non-GAAP financial measures and key performance indicators (KPIs) – Free cash flow and dividend payout ratiofor more details. |
| (2) | Free cash flow less dividends paid on common shares. |
| 34 BCE Inc. 2016 ANNUAL REPORT | |||
| 1 | Overview | MD&A | |
| Total shareholder return performance |
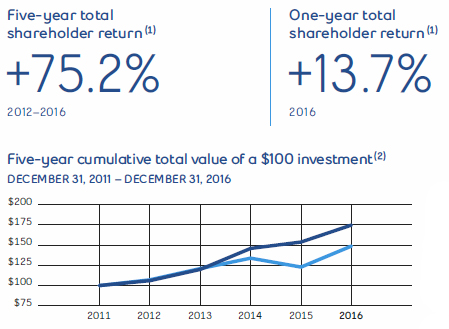
![]()
This graph compares the yearly change in the cumulative annual total shareholder return of BCE common shares against the cumulative annual total return of the S&P/TSX Composite Index(3), for the five-year period ending December 31, 2016, assuming an initial investment of $100 on December 31, 2011 and the quarterly reinvestment of all dividends.
| (1) | The change in BCE’s common share price for a specified period plus BCE common share dividends reinvested, divided by BCE’s common share price at the beginning of the period. |
| (2) | Based on BCE’s common share price on the TSX and assumes the reinvestment of dividends. |
| (3) | As the headline index for the Canadian equity market, the S&P/TSX Composite Index is the primary gauge against which to measure total shareholder return for Canadian-based, TSX-listed companies. |
| Strong capital structure |
BCE’s balance sheet is underpinned by considerable liquidity and an investment-grade credit profile, providing the company with a solid financial foundation and a high level of overall financial flexibility. BCE is well-positioned with an attractive long-term debt maturity profile and minimal near-term requirements to repay medium-term note (MTN) debentures. We continue to monitor the capital markets for opportunities where we can further reduce our cost of debt and our cost of capital. We seek to proactively manage financial risk in terms of currency exposure of our U.S. dollar-denominated purchases, as well as equity risk exposure under BCE’s long-term equity-based incentive plans and interest rate and foreign currency exposure under our various debt instruments. We also seek to maintain investment-grade credit ratings with stable outlooks.
ATTRACTIVE LONG-TERM DEBT MATURITY PROFILE
| STRONG LIQUIDITY POSITION
| FAVOURABLE CREDIT PROFILE
|
The committed amount under Bell Canada’s unsecured committed credit facilities was increased from $3.0 billion to $3.5 billion in December 2016, providing us with additional financing flexibility.
Bell Canada successfully accessed the capital markets in February 2016 and August 2016, raising a combined total of $2.25 billion in gross proceeds from the issuance 10-year and five-year MTN debentures. The August 2016 issuance of 10-year and five-year MTN debentures, which carry annual interest rates of 2.9% and 2.0%, respectively, represented the lowest coupon rates ever achieved by Bell Canada on any MTN issuance, reducing our after-tax cost of outstanding public debenture debt to 3.33% (4.56% on a pre-tax basis). The net proceeds of the 2016 offerings were used for the repayment of MTN debentures, to fund the acquisition of Q9 and for general corporate purposes.
In September 2016, Bell Canada renewed its MTN program, enabling it to offer up to $4 billion of MTN debentures from time to time until October 20, 2018. The MTN debentures will be fully and unconditionally guaranteed by BCE. Consistent with past practice, the MTN program was renewed to continue to provide Bell Canada with financial flexibility and efficient access to the Canadian and United States (U.S.) capital markets.
BCE Inc. 2016 ANNUAL REPORT 35 | |||
| 1 | Overview | MD&A | |
As a result of financing a number of strategic acquisitions made since 2010, including CTV Inc., Astral Media Inc. (Astral), MLSE, Bell Aliant Inc. and Q9, Bell Media’s move to expand TMN into a national pay TV service and become the sole operator of HBO Canada, voluntary pension plan funding contributions to reduce our pension solvency deficit, wireless spectrum purchases, and the incremental debt that was assumed as a result of the privatization of Bell Aliant Inc., our net debt(1) leverage ratio(1) has, as shown in the table below, increased above the limit of our internal target range of 1.75 to 2.25 times adjusted EBITDA. That ratio is expected to improve over time and return within the net debt leverage ratio target range through growth in free cash flow and applying a portion of excess cash to the reduction of BCE’s indebtedness.
As a result of a low after-tax cost of debt, owing to the consistent decline in interest rates over the past several years, our adjusted EBITDA to net interest expense ratio(1) has risen to its best level since 2010 at 9.31 times adjusted EBITDA. This is significantly above our internal target range of greater than 7.5 times adjusted EBITDA, providing good predictability in our debt service costs and protection from interest rate volatility for the foreseeable future.
BCE CREDIT RATIOS | INTERNAL TARGET | DECEMBER 31, 2016 |
Net debt leverage ratio | 1.75–2.25 | 2.57 |
Adjusted EBITDA to net interest expense ratio | >7.5 | 9.31 |
| (1) | Net debt, net debt leverage ratio and adjusted EBITDA to net interest expense ratio are non-GAAP financial measures and do not have any standardized meaning under IFRS. Therefore, they are unlikely to be comparable to similar measures presented by other issuers. See section 10.2,Non-GAAP financial measures and key performance indicators (KPIs)–Net debt, Net debt leverage ratioandAdjusted EBITDA to net interest expense ratiofor more details. |
| 1.5 Corporate governance and risk management |
Corporate governance philosophy
The BCE Board and management believe that strong corporate governance practices contribute to superior results in creating and maintaining shareholder value. That is why we continually seek to strengthen our leadership in corporate governance and ethical business conduct by adopting best practices, and providing full transparency and accountability to our shareholders.
Key governance strengths and actions in support of our governance philosophy include:
- Separation of the Board Chair and Chief Executive Officer(CEO) roles
- Director independence standards
- Audit Committee, Management Resources and CompensationCommittee (Compensation Committee) and CorporateGovernance Committee (Governance Committee) of the Boardcomposed of independent directors
- Annual director effectiveness and performance assessments
- Ongoing reporting to Board committees regarding ethicsprograms and the oversight of corporate policies across BCE
- Share ownership guidelines for directors and executives
- Executive compensation programs tied to BCE’s ability to growits common share dividend
For more information, please refer to BCE’s most recent notice of annual general shareholder meeting and management proxy circular (the Proxy Circular) filed with the Canadian provincial securities regulatory authorities (available atsedar.com) and with the United States Securities and Exchange Commission (available atsec.gov), and available on BCE’s website atBCE.ca.
| Risk governance framework |
BOARD OVERSIGHT
BCE’s full Board is entrusted with the responsibility for identifying and overseeing the principal risks to which our business is exposed and seeking to ensure there are processes in place to effectively identify, monitor and manage them. These processes seek to mitigate rather than eliminate risk. A risk is the possibility that an event might happen in the future that could have a negative effect on our financial position, financial performance, cash flows, business or reputation. While the Board has overall responsibility for risk, the responsibility for certain elements of the risk oversight program is delegated to Board committees in order to ensure that they are treated with appropriate expertise, attention and diligence, with reporting to the Board in the ordinary course.
Risk information is reviewed by the Board or the relevant committee throughout the year, and business leaders present regular updates on the execution of business strategies, risks and mitigation activities.
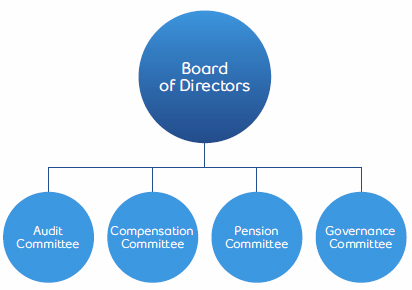
| 36 BCE Inc. 2016 ANNUAL REPORT | |||
| 1 | Overview | MD&A | |
- The Audit Committee is responsible for overseeing financialreporting and disclosure as well as overseeing that appropriaterisk management processes are in place across the organization.As part of its risk management activities, the Audit Committeereviews the organization’s risk reports and ensures thatresponsibility for each principal risk is formally assigned to aspecific committee or the full Board, as appropriate. The AuditCommittee also regularly considers risks relating to financialreporting, legal proceedings, the performance of criticalinfrastructure, information, cyber and physical security,journalistic independence, privacy and records management,business continuity and the environment.
- The Compensation Committee oversees risks relating tocompensation, succession planning, and health and safetypractices.
- The Governance Committee assists the Board in developing andimplementing BCE’s corporate governance guidelines anddetermining the composition of the Board and its committees. Inaddition, the Governance Committee oversees matters such asthe organization’s policies concerning business conduct, ethicsand public disclosure of material information.
- The Pension Fund Committee (Pension Committee) has oversightresponsibility for risks associated with the pension fund.
RISK MANAGEMENT CULTURE
There is a strong culture of risk management at BCE that is actively promoted by the Board and the company’s President and CEO at all levels within the organization. It has become a part of how the company operates on a day-to-day basis and is woven into its structure and operating principles, guiding the implementation of the organization’s strategic imperatives.
The President and CEO, selected by the Board, has set his strategic focus through the establishment of six strategic imperatives, and focuses risk management around the factors that could impact the achievement of those strategic imperatives. While the constant state of change in the economic environment and the industry creates challenges to be managed, the clarity around strategic objectives, performance expectations, risk management and integrity in execution ensures discipline and balance in all aspects of our business.
RISK MANAGEMENT FRAMEWORK
While the Board is responsible for BCE’s risk oversight program, operational business units are central to the proactive identification and management of risk. They are supported by a range of corporate support functions that provide independent expertise to reinforce implementation of risk management approaches in collaboration with the operational business units. The Internal Audit function provides a further element of expertise and assurance, working to provide insight and support to the operational business units and corporate support functions, while also providing the Audit Committee with an independent perspective on the state of risk and control within the organization. Collectively, these elements can be thought of as a “Three Lines of Defence” approach to risk management, that is aligned with industry best practices and is endorsed by the Institute of Internal Auditors.

FIRST LINE OF DEFENCE – OPERATIONAL MANAGEMENT
The first line refers to management within our operational business segments (Bell Wireless, Bell Wireline and Bell Media), who are expected to understand their operations in great detail and the financial results that underpin them. There are regular reviews of operating performance involving the organization’s executive and senior management. The discipline and precision associated with this process, coupled with the alignment and focus around performance goals, create a high degree of accountability and transparency in support of our risk management practices.
As risks emerge in the business environment, they are discussed in a number of regular forums to share details and explore their relevance across the organization. Executive and senior management are integral to these activities in driving the identification, assessment, mitigation and reporting of risks at all levels. Formal risk reporting occurs through strategic planning sessions, management presentations to the Board and formal enterprise risk reporting, which is shared with the Board and the Audit Committee during the year.
Management is also responsible for maintaining effective internal controls and for executing risk and control procedures on a day-today basis. Each operational business unit develops its own operating controls and procedures that fit the needs of its unique environment.
BCE Inc. 2016 ANNUAL REPORT 37 | |||
| 1 | Overview | MD&A | |
SECOND LINE OF DEFENCE – CORPORATE SUPPORT FUNCTIONS
BCE is a very large enterprise with approximately 48,000 employees, multiple business units and a diverse portfolio of risks that is constantly evolving based on internal and external factors. In a large organization, it is common to manage certain functions centrally for efficiency, scale and consistency. While the first line of defence is often central to identification and management of business risks, in many instances operational management works both collaboratively with, and also relies on, the corporate functions that make up the second line of defence for support in these areas. These corporate functions include Finance, Corporate Security and Corporate Risk Management, as well as others such as Legal and Regulatory, Corporate Responsibility, Human Resources, Real Estate and Procurement.
Finance function: BCE’s Finance function plays a pivotal role in seeking to identify, assess and manage risks through a number of different activities, which include financial performance management, external reporting, pension management, capital management, and oversight and execution practices related to the United StatesSarbanes-Oxley Act of 2002and equivalent Canadian securities legislation, including the establishment and maintenance of appropriate internal control over financial reporting. BCE has established and maintains disclosure controls and procedures to ensure that the information it publicly discloses, including its business risks, is accurately recorded, processed, summarized and reported on a timely basis. For more details concerning BCE’s internal control over financial reporting and disclosure controls and procedures, refer to the Proxy Circular and section 10.3,Effectiveness of internal controlsof this MD&A.
Corporate Security function: This function is responsible for all aspects of security, which requires a deep understanding of the business, the risk environment and the external stakeholder environment. Based on this understanding, Corporate Security sets the standards of performance required across the organization through security policy definitions and monitors the organization’s performance against these policies. In high and emerging risk areas such as cybersecurity, Corporate Security leverages its experience and competence and, through collaboration with the operational business units, develops strategies intended to mitigate the organization’s risks.
Corporate Risk Management function: This function works across the company to gather information and report on the organization’s assessment of its principal risks and the related exposures. Annually, senior management participates in a risk survey that provides an important reference point in the overall risk assessment process.
In addition to the activities described above, the second line of defence is also critical in building and operating the oversight mechanisms that bring focus to relevant areas of risk and reinforce the bridges between the first and second lines of defence, thereby seeking to ensure that there is a clear understanding of emerging risks, their relevance to the organization and the proposed mitigation plans. To further coordinate efforts between the first and second lines of defence, BCE has established a Security, Environment and Health & Safety (SEHS) Oversight Committee. A significant number of BCE’s most senior leaders are members of this committee, whose purpose is to oversee BCE’s strategic security (including cybersecurity), environmental, health and safety risks and opportunities. This cross-functional committee seeks to ensure that relevant risks are adequately recognized and mitigation activities are well-integrated and aligned across the organization and are supported with sufficient resources.
THIRD LINE OF DEFENCE – INTERNAL AUDIT FUNCTION
Internal Audit is a part of the overall management information and control system and has the responsibility to act as an independent appraisal function. Its purpose is to provide the Audit Committee and management with objective evaluations of the company’s risk and control environment, to support management in delivering against BCE’s strategic imperatives and to maintain an audit presence throughout BCE and its subsidiaries.
| 38 BCE Inc. 2016 ANNUAL REPORT | |||
| 2 | Strategic imperatives | MD&A | |
| 2 Strategic imperatives |
Our success is built on the BCE team’s dedicated execution of the six strategic imperatives that support our goal to be recognized by customers as Canada’s leading communications company.
| 2.1 Accelerate wireless |

Our objective is to grow our Bell Wireless business profitably by focusing on postpaid subscriber acquisition and retention, maximizing average revenue per user (ARPU) by targeting premium smartphone subscribers in all geographic markets we operate in, leveraging our wireless networks, and maintaining device and mobile content leadership to drive greater wireless data penetration and usage.
2016 PROGRESS
- Acquired 35% and 37% of total new postpaid gross and netactivations, respectively, among the three national wirelesscarriers, while achieving leading service revenue, ARPU andadjusted EBITDA growth of 5.7%, 3.8% and 6.2%, respectively
- Expanded the number of smartphone users at the end of 2016to 83% of our total postpaid subscribers, up from 78% at theend of 2015
- Increased the number of postpaid subscribers on our LTE networkto 81% of our total postpaid subscribers, up from 68% at the endof 2015
- Expanded our smartphone and tablet lineup with 30 new devices,including the iPhone 7 and 7 Plus from Apple, the Samsung GalaxyS7 and S7 edge, Google’s Pixel and Pixel XL and the LG G5, addingto our extensive selection of 4G LTE and LTE-A capable devices
- Launched VoLTE technology in Ontario, Atlantic Canada, parts ofQuébec and British Columbia, Yellowknife and Whitehorse for Bellcustomers with compatible smartphones. VoLTE enables fastercall set up times, HD voice quality and the ability to switchseamlessly between voice and video during calls
- Launched Roam Better International roaming feature that givescustomers access to specialized rates while traveling, providingunlimited voice and text messages and an additional dedicated100 megabytes (MB) of data usage for $10 a day in over110 destinations across Europe, the Americas, Asia and theMiddle East, Australia and South Africa
- Launched a new portfolio of products and support services to make mobile communications more accessible for customers with speech, cognitive, physical, hearing and vision related disabilities, including the Doro 824 and 824C smartphones for customers with moderate visual needs, the Mobile Accessibility screen reader app to assist blind and low vision users, and Tecla by Komodo, a portable and hands free device that enables customers with physical upper body limitations to easily use smartphones and tablets without touching the screen
2017 FOCUS
- Profitably grow our wireless postpaid subscriber base, whilemaintaining market share momentum of incumbent postpaidsubscriber activations
- Continue to increase ARPU
- Offer the latest handsets and devices in a timely mannerto enable customers to benefit from ongoing technologicalimprovements by manufacturers and from faster data speedsto optimize the use of our services
- Continue to increase the number of postpaid smartphonesubscribers using our 4G LTE and LTE-A networks
- Expand VoLTE technology coverage areas and broaden rolloutto more supported devices
- Accelerate new revenue streams by continuing to drivethe commercialization of IoT services and applications
| 2.2 Leverage wireline momentum |

We focus on leveraging our fibre-based TV and Internet services to develop attractive residential offers that drive higher multi-product bundle sales and improve customer satisfaction and retention. These new services contribute to the ongoing shift of our operating mix away from legacy wireline voice services.
In our business markets, we remain focused on expanding our broadband network and strengthening our delivery of integrated solutions to Canadian businesses, while continuing to manage the transformation of our business from legacy network services to a fully-integrated data hosting, cloud computing and managed services provider.
2016 PROGRESS
- Maintained our position as Canada’s largest TV provider with2,744,909 subscribers, and increased our total number of IPTVsubscribers by 13.1% to 1,337,944
- Built on our position as the leading Internet service provider (ISP)in Canada with a high-speed Internet subscriber base of 3,476,562,up 1.9% over 2015
- Increased the number of multi-product households – those thatbuy TV, Internet and Home Phone – by 4% over 2015, fuelled byour IPTV service, which drove higher pull-through attach rates forHome Phone and Internet services, with 74% of all new IPTVcustomers taking three products
Maintained our leadership position in Canadian broadbandcommunications with the most advanced products in the homeand continuous IPTV and Internet service innovation
|
BCE Inc. 2016 ANNUAL REPORT 39 | |||
| 2 | Strategic imperatives | MD&A | |
most powerful home Wi-Fi service with 12 antennas, totalthroughput capability of up to 1 Gigabit (Gb), automatic channelswitching for reduced interference, tri-band technologysupporting multiple connected devices and battery back-up thatenables customers to use Fibe Internet during a power outagefor up to four hours
|
Bell Fibe TV was ranked as the most advanced TV servicein Canada(1)
- Bell’s fibre-to-the-home (FTTH) Fibe Internet service ledCanadian Internet providers, exceeding advertised downloadspeeds by a greater margin than the competition(2)
- Launched Virgin Home Internet service in Ontario and Québec
- Acquired Q9 Networks, a Toronto-based data centre operatorproviding outsourced hosting and other data solutions toCanadian business and government customers, supporting our ability to compete against domestic and international providers in the growing outsourced data services sector
- Launched Bell Total Connect for small business customers acrossOntario and Québec, delivering a suite of advanced messagingand unified communications services on both broadband fibreand mobile LTE networks
- Formed a partnership with IBM Canada Limited (IBM) to expandthe cloud computing services available through our Bell BusinessCloud service, giving businesses across Canada access to theIBM Cloud via a secure, high-speed private connection from Bell,simplifying the way customers adopt and build out theirhybrid clouds
2017 FOCUS
- Continue to enhance our IPTV service with more advanced features
- Make Bell Fibe TV available as a standalone TV service
- Expand our total base and market share of TV and Internet subscribers profitably
- Reduce total wireline residential net losses
- Increase residential household ARPU through greater multi-product household penetration
- Increase share of wallet of large enterprise customers through greater focus on business service solutions and connectivity growth
- Increase the number of net new customer relationships in both large and mid-sized businesses and reduce small business customer losses
| 2.3 Invest in broadband networks and services |

We invest in wireline and wireless broadband platforms to deliver the most advanced wireless, TV, Internet and other IP-based services available, to support continued subscriber and data growth across all our residential product lines as well as the needs of our business market customers.
2016 PROGRESS
- Expanded our 4G LTE wireless network to reach 97% of theCanadian population coast to coast
- Continued the rollout of our Dual-band LTE-A wireless network,providing service to 73% of the Canadian population at dataspeeds of up to 260 Mbps (expected average download speeds of18 to 74 Mbps). In addition, Tri-band LTE-A wireless service,enabled by aggregating Personal Communications Services (PCS),AWS-1 and 700 MHz spectrum, that delivers mobile data speeds ofup to 335 Mbps (expected average download speeds of 25 to100 Mbps), was launched in a number of cities and areas, includingin Halifax, Fredericton, Moncton, Saint John, Sydney, St. John’s,Toronto, Hamilton, Oakville, London, Kitchener-Waterloo, NiagaraFalls, Muskoka Lakes, Sudbury, Sarnia, Trois-Rivières andChicoutimi
- Bell’s 4G LTE wireless network was ranked as the fastest mobileLTE network in Canada by PCMag
- According to Nielsen Consumer Insights, more Canadians choseBell as having the best mobile network in Canada
- Conducted the first Canadian trials of fifth generation (5G) mobiletechnology in collaboration with Nokia Corporation, leveragingspectrum in the 73 Gigahertz (GHz) range to achieve sustaineddata speeds more than 6 times faster than top 4G mobile speedsnow available in Canada
- Continued to expand our FTTP broadband fibre footprint incommunities across Ontario, Québec and Atlantic Canada, reachingapproximately 2.9 million homes and businesses. FTTP enablesInternet speeds of up to 1 Gbps.
2017 FOCUS
- Expand FTTP broadband fibre footprint to approximately3.5 million locations passed
- Complete our 4G LTE wireless network build to 99% of theCanadian population and manage wireless network capacity
- Expand LTE-A coverage to reach approximately 83% of theCanadian population
- Increase LTE-A speeds up to 560 Mbps in select areas throughfour-carrier aggregation (expected average download speedsof 41 to 166 Mbps)
- Increase small cell deployment and in-building coverage toincrease urban densification
| (1) | Nielsen Consumer Insights (June 2016) |
| (2) | CRTC Internet Performance Report (September 2016) |
| 40 BCE Inc. 2016 ANNUAL REPORT | |||
| 2 | Strategic imperatives | MD&A | |
| 2.4 Expand media leadership |

We strive to deliver leading sports, news, entertainment and business content across all screens and platforms to grow audiences. We are also creating more of our own content, ensuring that Canadian attitudes, opinions, values and artistic creativity are reflected in our programming and in our coverage of events in Canada and around the world, and to introduce new services in support of new revenue streams.
2016 PROGRESS
- Maintained CTV’s #1 ranking as the most-watched networkin Canada for the 15th year in a row, and continued to leadwith a majority of the top 20 programs nationally in allkey demographics
- Launched TMN as a national pay TV service and became the soleoperator of HBO Canada
- Launched CraveTV direct to consumers as a standalone productavailable to all Canadians with an Internet subscription. Wecontinued to grow the viewership and scale of our streamingvideo service, surpassing one million subscribers in 2016
- As of October 24, 2016, both new and returning SHOWTIMEprograms debut on CraveTV at the same time as their U.S.broadcast premieres, bolstering the amount of exclusive,first-run programming on CraveTV
- Streamed CraveTV’s first ever original series, LETTERKENNY,which had the biggest debut of any series on CraveTV since theservice launched in 2014 and has eclipsed its own Season 1record with the launch of Season 2 on Christmas Day
- Concluded a deal with MGM to license the iconic James BondCatalogue, spanning more than 50 years and every 007 actor
- Made CraveTV available for in-app purchase on Apple TV,enabling customers to subscribe directly from their iTunesaccount
- Launched iHeartRadio, North America’s fastest growing digitalaudio service, to the public, providing Canadians with instantaccess to all of Bell Media’s 105 radio stations across the countryplus more than 100 additional exclusive, digital streamingchannels featuring every musical genre as well as news/talk,sports and comedy
- Accelerated 4K ultra-high definition (Ultra HD) production andbroadcasting with a growing number of live event and sportsbroadcasts in 4K
- TSN became the first broadcaster to produce a live 4K Ultra HDbroadcast in North America with the Toronto Raptors vs. BostonCeltics basketball game on January 20, 2016
- CTV’s broadcast of the 2016 Juno Awards was the first liveawards show in North America to be produced in 4K
- TSN’s five national feeds featured several Toronto Raptors,Toronto Maple Leafs and Ottawa Senators games in 4K, as wellas The Masters and the UEFA Champions League Final
- The iHeartRadio MuchMusic Video Awards was filmed andbroadcast in 4K
- Discovery Canada’s premium video streaming service DiscoveryGO offered a growing inventory of titles available in 4K
- All new TV series commissioned for Bell Media’s networks areproduced in 4K
- Extended a broadcast agreement with the IIHF to 2023. TSN and RDS hold exclusive multimedia rights for the IIHF Ice Hockey World Championship
- Concluded a multi-title, multi-year exclusive streaming deal withWarner Bros. International Television for the Canadian marketthat delivers some of the most-watched shows to CraveTV
- Expanded a licensing agreement with Viacom International MediaNetworks to make Comedy Central original programming andlibrary of scripted and unscripted series and specials availableacross multiple platforms in Canada, including CraveTV
- Concluded a licensing agreement with CBS Studios Internationalto be the exclusive home for the new STAR TREK series in Canada.The series will premiere on CTV and then move to Space for theduration of its run, and will also become available on CraveTV.
- Launched a food and lifestyle specialty channel featuring theestablished Gusto brand and its exclusive portfolio of originalCanadian programming, all in 4K. Gusto features cooking, homedesign, fashion, travel and lifestyle programming.
- Acquired Métromédia CMR Plus Inc. (Métromédia), Cogeco Inc.’sOOH advertising subsidiary, allowing Astral OOH to expand itsadvertising assets in the public transit market
- Astral OOH secured advertising rights for both in-terminal andnon-terminal concessions across Toronto Pearson InternationalAirport, becoming Canada’s airport advertising leader with apresence in six Canadian international airports, including HalifaxStanfield, Montréal-Pierre Elliott Trudeau, Québec City JeanLesage, Ottawa Macdonald-Cartier and Vancouver International
2017 FOCUS
- Maintain strong audience levels and ratings across all TV andradio properties
- Reinforce industry leadership in conventional TV, pay TV, sportsmedia and radio
- In January 2017, we concluded a multi-year media rights extension with MLS, making Bell Media Canada’s exclusive English-language broadcaster of MLS
- Grow viewership and scale of CraveTV on-demand TV streamingservice
- Develop in-house production and content creation for distributionand use across all platforms and screens
- Expand live and on-demand content through TV Everywhereservices
- Build on our OOH leadership position in Canada
- In January 2017, we acquired Cieslok Media Ltd. (Cieslok Media), which specializes in large-format outdoor advertising in key urban areas, allowing Astral OOH to expand its digital presence with 120 high-profile displays in Vancouver, Edmonton, Calgary, Montréal and Toronto, including Canada’s largest multimedia billboards at Yonge-Dundas Square
- Grow French media properties
- Leverage cross-platform and integrated sales and sponsorship
BCE Inc. 2016 ANNUAL REPORT 41 | |||
| 2 | Strategic imperatives | MD&A | |
| 2.5 Improve customer service |

Our objective is to enhance customers’ overall experience by delivering call centre efficiency, meeting commitments for the installation and timely repair of services, increasing network quality, and implementing process improvements to simplify customer transactions and interactions with our front-line employees and self-serve tools. All of these will help differentiate us from our competitors and gain long-term customer loyalty. We intend to achieve this by making the investments we need to improve our front-line service capabilities, our networks, our products and our distribution channels to win and keep customers.
2016 PROGRESS
- The Commissioner of Complaints for TelecommunicationsServices (CCTS) received 18% fewer complaints about Bell andVirgin Mobile Canada (Virgin Mobile) between August 1, 2015 andJuly 31, 2016 than during the equivalent period of the previousyear, continuing the steady decline in Bell and Virgin Mobilecomplaints since July 2013
- Launched Manage Your Appointment feature, offering residentialcustomers an easy way to confirm and check the status of theirservice appointments online
- Reduced customer calls to our service centres by 4 millionin 2016 due to more self-serve online transactions by customersand overall operational improvements. Online self-servevisits, infoviews and transactions totalled more than 190 million,an increase of 30 million over 2015.
- Reduced Fibe TV installation time for FTTP customers by 9%in 2016 and 43% since the beginning of 2012
- Achieved Same Day Next Day service completion rate of 88% forrepairing service issues with Home Phone, TV and Internet
- Improved customer satisfaction with technicians to 95% forinstallations and repairs
- Offered installation appointments within two days of placing anorder to 76% of residential customers, an increase of almost twotimes since 2014
- Offered Same Day repair to 73% of small business customers,who are now able to schedule appointments until 4:00 p.m. forSame Day repair
- Improved skill set of customer service agents to allow themto resolve more technical issues, eliminating 30% of transfers tosecond-level support
2017 FOCUS
- Continue to invest in customer service initiatives to simplifycomplexity for all customers, including billing
- Further reduce the total volume of wireline and wireless customercalls to our residential and wireless services call centres
- Further improve customer satisfaction scores
- Achieve better consistency in customer experience
- Continue to improve customer personalization
- Reduce FTTP installation times and improve service quality
- Deploy new diagnostic technology enabling enhancedtroubleshooting and service monitoring for our customers
| 2.6 Achieve a competitive cost structure |

Cost containment is a core element of our financial performance. It remains a key factor in our objective to preserve steady margins as we continue to experience revenue declines in our legacy wireline voice and data services and further shift our product mix towards growth services. We aim to accomplish this through operating our business in the most cost-effective way possible to extract maximum operational efficiency and productivity gains.
2016 PROGRESS
- Improved BCE consolidated adjusted EBITDA margin(1) by 0.8 ptsover 2015
- Reduced wireline operating costs by 2.7%, contributing toBell Wireline adjusted EBITDA margin improvement of 0.9 ptsover 2015
- Executed on labour savings from workforce reductionsundertaken in 2015 at Bell Media and Bell Wireline
- Delivered cost savings from ongoing service improvements andsavings related to the deployment of FTTP
- Lowered Bell Canada’s average after-tax cost of MTN debenturedebt to 3.33%
2017 FOCUS
- Capture operating cost and capital expenditure synergies fromthe integration of MTS following the completion of the acquisitionby BCE
- Deliver cost savings from workforce reductions, ongoing serviceimprovements, and savings related to the deployment of FTTP tosupport a stable consolidated adjusted EBITDA margin
| (1) | Adjusted EBITDA margin is a non-GAAP financial measure and does not have any standardized meaning under IFRS. Therefore, it is unlikely to be comparable to similar measures presented by other issuers. See section 10.2,Non-GAAP financial measures and key performance indicators (KPIs) – Adjusted EBITDA and adjusted EBITDA marginfor more details. |
| 42 BCE Inc. 2016 ANNUAL REPORT | |||
| 3 | Performance targets, outlook, assumptions and risks | MD&A | |
| 3 Performance targets, outlook, assumptions and risks |
This section provides information pertaining to our performance against 2016 targets, our consolidated business outlook and operating assumptions for 2017 and our principal business risks.
| 3.1 2016 performance vs. guidance targets |
BCE | FINANCIAL GUIDANCE | 2016 TARGET | 2016 PERFORMANCE AND RESULTS | ACHIEVED | |
| Revenue growth | 1%–3% | 1.0% | Led by solid revenue growth from our Bell Wireless and Bell Media segments of 4.1% and 3.6%, respectively, moderated by a decline in Bell Wireline revenue of 1.3%. | ||
| Adjusted EBITDA growth | 2%–4% | 2.8% | Reflected adjusted EBITDA growth across all three of our segments driven by strong wireless service revenue flow-through of 49.2%, and growth from Internet, IPTV and media revenues, which more than offset the continued revenue erosion in wireline voice and legacy data services. This, combined with ongoing effective cost management, drove an expansion in adjusted EBITDA margin to 40.5% from 39.7% experienced in 2015. | ||
| Capital intensity | Approx. 17% | 17.4% | BCE continued its strategic investment in broadband wireline and wireless infrastructure with capital expenditures of $3,771 million in 2016, up 4.0% over last year. This drove an increase in the capital intensity ratio to 17.4% in 2016 from 16.9% in 2015. Capital spending in 2016 was focused on the continued deployment of our broadband fibre directly to more homes and businesses, including the build-out of Gigabit Fibe infrastructure, the ongoing rollout of our 4G LTE and LTE-A wireless networks, as well as the expansion of wireless and Internet network capacity to support greater speeds, subscriber growth, and higher data consumption. | ||
| Adjusted net earnings per share (adjusted EPS) (1) | $3.45–$3.55 | $3.46 | Adjusted net earnings in 2016 increased by $164 million, or $0.10 per common share, driven by higher operating revenues and lower operating costs, which resulted in higher adjusted EBITDA, lower finance costs and higher other income, partly offset by higher amortization expense and higher income taxes. The average number of BCE common shares outstanding increased, mostly as a result of shares issued under a bought deal offering in December 2015, which moderated the increase in adjusted EPS. | ||
| Free cash flow growth | Approx. 4%–12% | 7.6% | Increase in free cash flow of $227 million in 2016 was driven by an increase in cash flows from operating activities, partly offset by higher capital expenditures. Cash flows from operating activities increased due to higher adjusted EBITDA, lower acquisition and other costs paid and lower income taxes paid, partly offset by a higher voluntary DB pension plan contribution made in 2016. | ||
| Annualized common dividend per share | $2.73 | $2.73 | Annualized BCE common dividend per share for 2016 increased by 13 cents, or 5.0%, to $2.73 compared to $2.60 per share in 2015. | ||
| Dividend payout ratio | 65%–75% of free cash flow | 71.5% | Dividend payout ratio in 2016 decreased by 0.8% to 71.5% from 72.3%. | ||
| 3.2 Business outlook and assumptions |
Outlook
Our 2017 outlook builds on the positive financial results and operating momentum we delivered in 2016 that reflected strong wireless profitability and postpaid subscriber activations, increasing broadband Internet and TV scale, improved media financial performance, as well as effective operating cost control and price discipline across all our operating segments and products. Our projected financial performance for 2017 is underpinned by continued progress in the execution of our six strategic imperatives and a favourable financial profile for all three Bell operating segments, which is expected to be further enhanced following the completion of the acquisition of MTS by BCE, with higher free cash flow generation providing a strong and stable foundation for a higher BCE common share dividend for 2017, as well as continued significant capital investment in wireline and wireless network infrastructures to support future growth. Our outlook also reflects the confidence we have in continuing to successfully manage our wireless, wireline and media businesses within the context of a highly competitive and dynamic market.
| (1) | Adjusted EPS is a non-GAAP financial measure and does not have any standardized meaning under IFRS. Therefore, it is unlikely to be comparable to similar measures presented by other issuers. See section 10.2,Non-GAAP financial measures and key performance indicators (KPIs) – Adjusted net earnings and adjusted EPSfor more details, including a reconciliation to the most comparable IFRS financial measure. |
BCE Inc. 2016 ANNUAL REPORT 43 | |||
| 3 | Performance targets, outlook, assumptions and risks | MD&A | |
The key 2017 operational priorities for BCE are to:
- Maintain market share of incumbent wireless postpaid subscriberactivations
- Drive continued adoption of mobile smartphone handsets,tablets and data applications, as well as the introduction of more4G LTE devices and new data services
- Achieve higher wireless adjusted EBITDA through wirelesspostpaid subscriber base expansion and higher blended ARPU,driven by a higher postpaid smartphone mix, increased dataconsumption on 4G LTE and LTE-A networks, and higher accessrates from price increases
- Complete our 4G LTE network build and further expand ourLTE-A network coverage
- Continue broadband fibre deployment with a focus on expandingour FTTP footprint
- Further grow our residential IPTV and Internet subscriber bases
- Increase residential services household ARPU from increasedpenetration of multi-product households and price increases
- Limit downsizing of current TV packages by our customers asa result of TV channel unbundling
- Continue scaling Bell Media’s CraveTV on-demand streamingservice
- Realize operating cost savings from workforce attrition andretirements, lower contracted rates from our suppliers, reductionin traffic that is not on our wireline network, broader deploymentof FTTP, customer service improvements, and operating costsynergies from the planned integration of MTS into our BellWireline and Bell Wireless operating segments following thecompletion of the acquisition by BCE
Our projected financial performance for 2017 enabled us to increase the annualized BCE common share dividend for 2017 by 14 cents, or 5.1%, to $2.87 per share, maintaining our dividend payout ratio within our target policy range of 65% to 75% of free cash flow.
| Assumptions |
ASSUMPTIONS ABOUT THE CANADIAN ECONOMY
- Gradual improvement in economic growth, given the Bank ofCanada’s most recent estimated growth in Canadian grossdomestic product of 2.1% in 2017
- Modest employment growth, as the overall level of businessinvestment is expected to remain soft
- Canadian dollar expected to remain at or around near currentlevels. Further movements may be impacted by the degree ofstrength of the U.S. dollar, interest rates and changes incommodity prices.
MARKET ASSUMPTIONS
- A higher level of wireline and wireless competition in consumer,business and wholesale markets
- Higher, but slowing, wireless industry penetration and smartphoneadoption
- Wireless industry pricing discipline maintained
- Soft media advertising market expected, due to variable demand,and escalating costs to secure TV programming
| 3.3 Principal business risks |
Provided below is a summary description of certain of our principal business risks that could have a material adverse effect on all of our segments. Certain additional business segment-specific risks are reported in section 5,Business segment analysis. For a detailed description of the principal risks relating to our regulatory environment and a description of the other principal business risks that could have a material adverse effect on our financial position, financial performance, cash flows, business or reputation, refer to section 8,Regulatory environment, and section 9,Business risks, respectively.
| Regulatory environment |
Although most of our retail services are not price-regulated, government agencies and departments such as the CRTC, ISED, Canadian Heritage and the Competition Bureau continue to play a significant role in regulatory matters such as mandatory access to networks, net neutrality, spectrum auctions, approval of acquisitions, broadcast licensing and foreign ownership requirements. As with all regulated organizations, planned strategies are contingent upon regulatory decisions. Adverse decisions by regulatory agencies or increased regulation could have negative financial, operational, reputational or competitive consequences for our business. For a discussion of our regulatory environment and the principal risks related thereto, refer to section 8,Regulatory environment.
| Competitive environment |
As the scope of our businesses increases and evolving technologies drive new services, new delivery models and creative strategic partnerships, our competitive landscape expands to include new and emerging competitors, certain of which were historically our partners or suppliers, as well as other global scale competitors, including, in particular, OTT TV service and voice over Internet protocol (VoIP) providers and other web-based and OTT players that are penetrating the telecommunications space. Pricing and investment decisions of market participants are based on many factors, such as strategy, market position, technology evolution, customer confidence and economic climate, and collectively these could adversely affect our market shares, service volumes and pricing strategies and, consequently, our financial results. Technology substitution, IP networks and recent regulatory decisions, in particular, continue to reduce barriers to entry in our industry. This has allowed competitors to launch new products and services and gain market share with far less
| 44 BCE Inc. 2016 ANNUAL REPORT | |||
| 3 | Performance targets, outlook, assumptions and risks | MD&A | |
investment in financial, marketing, human, technological and network resources than has historically been required. In particular, some competitors sell their services through the use of our networks, without the need to invest to build their own networks. Such lower necessary investment has enabled some competitors to be very disruptive in their pricing. We expect these trends to continue in the future, which could negatively impact our business including, without limitation, in the following ways:
- Competitors’ aggressive market offers could result in pricingpressures and increased costs of customer acquisitionand retention
- Higher Canadian wireless penetration could slow opportunitiesfor new customer acquisition
- Product substitutions and spending rationalization by businesscustomers could result in an acceleration of NAS erosion beyondour current expectations
- The continued OTT-based substitution and market expansion ofVoIP service providers and traditional software players deliveringlow-cost voice line alternatives, which is changing our approachto service offers and pricing, could have an adverse effect onour business
- A fundamental separation of content and connectivity hasemerged, allowing the expansion and market penetration oflow-cost OTT TV providers and other alternative service providers,some of which may offer content as loss leaders to support theircore business, which is changing our TV and media ecosystemsand could affect our business negatively
- Competition with global competitors such as Netflix and Amazon,in addition to traditional Canadian competitors, for programmingcontent could drive significant increases in content acquisitioncosts as these competitors, along with other global-scale entitiessuch as Google, disrupt local market dynamics as a result ofinnovative and flexible global market strategies
- Adverse economic conditions, such as economic downturns orrecessions, adverse conditions in the financial markets, or adeclining level of retail and commercial activity, could have anegative impact on the demand for, and prices of, our wireline,wireless and media products and services, as well as drive anincrease in bad debts as the creditworthiness of some customersdeclines
- Regulatory decisions regarding wholesale access to our wirelessand fibre networks could bring new competitors, or strengthenthe market position of current competitors; in addition, suchdecisions may enable foreign entrants to deliver broadbandservices as loss leaders, thus disrupting the local market dynamics
- Increasing number of off-contract customers could increasecustomer acquisition activity and churn in the Canadian wirelessmarket
- Foreign competitors could enter the Canadian market andleverage their global scale advantage
For a further discussion of our competitive environment and competition risk, as well as a list of our main competitors, on a segmented basis, refer toCompetitive landscape and industry trendsandPrincipal business risksin section 5,Business segment analysis.
| Security management |
Our operations, service performance and reputation depend on how well we protect our assets, including networks, IT systems, offices and sensitive information, from events and attacks such as those referred to in section 9,Business risks – Operational performance – Our operations and business continuity depend on how well we protect, test, maintain and replace our networks, IT systems, equipment and other facilities. The protection and effective organization of our systems, applications and information repositories are central to the secure and continuous operation of our networks and business as electronic and physical records of proprietary business and personal data, such as confidential customer and employee information, are all sensitive from a market and privacy perspective. In particular, cyber threats, which include cyber attacks such as, but not limited to, hacking, computer viruses, denial of service attacks, industrial espionage, unauthorized access to confidential, proprietary or sensitive information, or other breaches of network or IT security, are constantly evolving and our IT defences need to be constantly monitored and adapted. We are also exposed to cyber threats as a result of actions that may be taken by our customers, our suppliers, our employees or independent third parties, whether malicious or not, including as a result of the use of social media, cloud-based solutions and IT consumerization. Vulnerabilities could harm our brand and reputation as well as our customer relationships, and could adversely affect our financial results, given that they may lead to:
- Network operating failures and service disruptions, which coulddirectly impact our customers’ ability to maintain normal businessoperations and deliver critical services and/or the ability ofthird-party suppliers to deliver critical services to us
- The theft, loss or leakage of confidential information, includingcustomer or employee information, that could result in financialloss, exposure to claims for damages by customers andemployees, and difficulty in accessing materials to defendlegal cases
- Physical damage to network assets impacting service continuityas well as destruction or corruption of data
- Litigation, fines and liability for failure to comply with privacy andinformation security laws
- Fines and sanctions from credit card providers for failing tocomply with payment card industry data security standards forprotection of cardholder data
- Regulatory investigations and increased audit and regulatoryscrutiny that could divert resources from project delivery
- Increased fraud as criminals leverage stolen information againstus, our employees or our customers
- The potential for loss of subscribers or impairment of our abilityto attract new ones
- Lost revenues due to service disruptions and the incurrenceof remediation costs
BCE Inc. 2016 ANNUAL REPORT 45 | |||
| 4 | Consolidated financial analysis | MD&A | |
| 4 Consolidated financial analysis |
This section provides detailed information and analysis about BCE’s performance in 2016 compared with 2015. It focuses on BCE’s consolidated operating results and provides financial information for our Bell Wireless, Bell Wireline and Bell Media business segments. For further discussion and analysis of our business segments, refer to section 5,Business segment analysis.
| 4.1 Introduction |
BCE consolidated income statements
| 2016 | 2015 | $ CHANGE | % CHANGE | ||||
Operating revenues | 21,719 | 21,514 | 205 | 1.0 | % | |||
Operating costs | (12,931 | ) | (12,963 | ) | 32 | 0.2 | % | |
Adjusted EBITDA | 8,788 | 8,551 | 237 | 2.8 | % | |||
Adjusted EBITDA margin | 40.5 | % | 39.7 | % | 0.8 | % | ||
Severance, acquisition and other costs | (135 | ) | (446 | ) | 311 | 69.7 | % | |
Depreciation | (2,877 | ) | (2,890 | ) | 13 | 0.4 | % | |
Amortization | (631 | ) | (530 | ) | (101 | ) | (19.1 | %) |
Finance costs | ||||||||
Interest expense | (888 | ) | (909 | ) | 21 | 2.3 | % | |
Interest on post-employment benefit obligations | (81 | ) | (110 | ) | 29 | 26.4 | % | |
Other income (expense) | 21 | (12 | ) | 33 | n.m. | |||
Income taxes | (1,110 | ) | (924 | ) | (186 | ) | (20.1 | %) |
Net earnings | 3,087 | 2,730 | 357 | 13.1 | % | |||
Net earnings attributable to: | ||||||||
Common shareholders | 2,894 | 2,526 | 368 | 14.6 | % | |||
Preferred shareholders | 137 | 152 | (15 | ) | (9.9 | %) | ||
Non-controlling interest | 56 | 52 | 4 | 7.7 | % | |||
Net earnings | 3,087 | 2,730 | 357 | 13.1 | % | |||
Adjusted net earnings | 3,009 | 2,845 | 164 | 5.8 | % | |||
Net earnings per common share (EPS) | 3.33 | 2.98 | 0.35 | 11.7 | % | |||
Adjusted EPS | 3.46 | 3.36 | 0.10 | 3.0 | % |
n.m.: not meaningful
BCE delivered solid financial results in 2016 with revenue growth of 1.0%, compared to last year, driven by higher service revenues of 1.7%, resulting from ongoing growth in our Bell Wireless and Bell Media segments, moderated by a decline in our Bell Wireline segment. Net earnings in 2016 increased 13.1% compared to 2015, reflecting higher operating revenues and lower operating costs, which resulted in higher adjusted EBITDA, lower severance, acquisition and other costs, lower finance costs and higher other income, partly offset by higher amortization expense and higher income taxes. Adjusted EBITDA grew by 2.8%, in 2016, resulting from year-over-year increases across all three of our segments. This led to an expansion in BCE adjusted EBITDA margin to 40.5%, up 0.8% compared to 2015.
The year-over-year increase in BCE net earnings and adjusted EBITDA in 2016 reflected strong wireless service revenue flow-through and continued revenue growth from Internet, IPTV and media services, together with ongoing effective cost containment. This was moderated by the ongoing erosion of voice and legacy data revenues, in part reflecting the impact of continued slow economic growth in our business markets resulting in reduced customer spending on core connectivity services and data products, as well as lower contribution from our wholesale market. The higher customer acquisition and subscriber retention spending at Bell Wireless and escalating content costs at Bell Media also moderated the year-over-year growth in BCE adjusted EBITDA.
| 46 BCE Inc. 2016 ANNUAL REPORT | |||
| 4 | Consolidated financial analysis | MD&A | |
| BCE statements of cash flows – selected information |
| 2016 | 2015 | $ CHANGE | % CHANGE | ||||
Cash flows from operating activities | 6,643 | 6,274 | 369 | 5.9 | % | |||
Capital expenditures | (3,771 | ) | (3,626 | ) | (145 | ) | (4.0 | %) |
Free cash flow | 3,226 | 2,999 | 227 | 7.6 | % |
In 2016, BCE’s cash flows from operating activities increased $369 million, compared to 2015, due mainly to higher adjusted EBITDA, lower acquisition and other costs paid and lower income taxes paid, partly offset by a higher voluntary DB pension plan contribution made in 2016.
Free cash flow increased $227 million in 2016, compared to 2015, due to higher cash flows from operating activities, partly offset by higher capital expenditures.
| 4.2 Customer connections |
TOTAL BCE CONNECTIONS
| 2016 | 2015 | % CHANGE | |||
Wireless subscribers | 8,468,872 | 8,245,831 | 2.7 | % | ||
Postpaid | 7,690,727 | 7,375,416 | 4.3 | % | ||
High-speed Internet subscribers(1) | 3,476,562 | 3,413,147 | 1.9 | % | ||
TV (Satellite and IPTV subscribers) | 2,744,909 | 2,738,496 | 0.2 | % | ||
IPTV | 1,337,944 | 1,182,791 | 13.1 | % | ||
Total growth services | 14,690,343 | 14,397,474 | 2.0 | % | ||
Wireline NAS lines(1) | 6,257,732 | 6,688,666 | (6.4 | %) | ||
Total services | 20,948,075 | 21,086,140 | (0.7 | %) |
| (1) | Our 2016 business Internet and business NAS subscriber bases reflect a beginning of period adjustment to reduce the number of subscribers by 21,684 and 15,526, respectively, in order to align practices as a result of the integration of our former Bell Aliant segment (Bell Aliant). |
BCE NET ACTIVATIONS
| 2016 | 2015 | % CHANGE | |||
Wireless subscribers | 223,041 | 127,203 | 75.3 | % | ||
Postpaid | 315,311 | 265,369 | 18.8 | % | ||
High-speed Internet subscribers | 85,099 | 155,052 | (45.1 | %) | ||
TV (Satellite and IPTV subscribers) | 6,413 | 107,380 | (94.0 | %) | ||
IPTV | 155,153 | 253,329 | (38.8 | %) | ||
Total growth services | 314,553 | 389,635 | (19.3 | %) | ||
Wireline NAS lines | (415,408 | ) | (438,434 | ) | 5.3 | % |
Total services | (100,855 | ) | (48,799 | ) | (106.7 | %) |
BCE added 314,553 net new customer connections to its growth services in 2016, down 19.3% compared to last year. This was comprised of:
- 315,311 postpaid wireless customers, partly offset by the loss of92,270 prepaid wireless customers
- 85,099 high-speed Internet customers
- 155,153 IPTV customers, partly offset by the loss of 148,740 satelliteTV customers
NAS net losses of 415,408 in 2016 improved by 5.3% compared to 2015.
Total BCE customer connections across all services declined by 0.7% in 2016, compared to last year, as the continued erosion in traditional wireline NAS lines was moderated by the increase in subscribers from growth services.
At the end of 2016, BCE customer connections totalled 20,948,075 and were comprised of the following:
- 8,468,872 wireless subscribers, up 2.7% compared to 2015, whichincluded 7,690,727 postpaid wireless subscribers, an increaseof 4.3% since the end of last year
- 3,476,562 high-speed Internet subscribers, 1.9% higher yearover year
- 2,744,909 total TV subscribers, up 0.2%, compared to 2015, whichincluded 1,337,944 IPTV customers, up 13.1% year over year
- 6,257,732 total NAS lines, a decline of 6.4% compared to last year
BCE Inc. 2016 ANNUAL REPORT 47 | |||
| 4 | Consolidated financial analysis | MD&A | |
| 4.3 Operating revenues |

| 2016 | 2015 | $ CHANGE | % CHANGE | ||||
Bell Wireless | 7,159 | 6,876 | 283 | 4.1 | % | |||
Bell Wireline | 12,104 | 12,258 | (154 | ) | (1.3 | %) | ||
Bell Media | 3,081 | 2,974 | 107 | 3.6 | % | |||
Inter-segment eliminations | (625 | ) | (594 | ) | (31 | ) | (5.2 | %) |
Total BCE operating revenues | 21,719 | 21,514 | 205 | 1.0 | % |
BCE
Total operating revenues for BCE grew by 1.0% in 2016, compared to last year, as a result of solid growth from both our Bell Wireless and Bell Media segments, offset in part by a decline in our Bell Wireline segment. This was comprised of service revenues of $20,090 million, an increase of 1.7% compared to 2015, and product revenues of $1,629 million, a decline of 7.2% year over year.
BELL WIRELESS
Bell Wireless operating revenues were up 4.1% in 2016, compared to 2015, primarily due to service revenue growth of 5.7%, driven by a larger postpaid customer base coupled with the growth in blended ARPU. The year-over-year increase in blended ARPU was driven by the adoption of higher rate plans as customers continued to shift from three-year to two-year contracts, increased data usage from greater smartphone penetration and a growing base of postpaid LTE and LTE-A customers, which was moderated in part by the continued decline in voice revenues. Product revenues decreased by 12.7% in 2016, mainly as a result of greater promotional offers in a highly competitive marketplace, as well as a fewer number of device upgrades, moderated by a higher number of postpaid gross activations and a greater proportion of premium smartphone devices in our activation and upgrade mix.
BELL WIRELINE
Bell Wireline operating revenues decreased by 1.3% in 2016, compared to last year, attributable to the ongoing erosion in our traditional voice and legacy data revenues in part reflecting the impact of continued slow economic growth in our business markets, the sale of a call centre subsidiary in September 2015, as well as lower revenues in our wholesale market, driven by significantly lower revised interim rates set by the CRTC for aggregated wholesale high-speed Internet access services. Higher acquisition and retention discounts in our residential market resulting from intense competitive pressures from cable operators, along with subscriber base declines in satellite TV, also contributed to the decrease in operating revenues. This was mitigated in part by the continued growth of Internet and IPTV subscribers, along with higher retail household ARPU, as well as the acquisition of Q9 in the fourth quarter of 2016.
BELL MEDIA
Bell Media operating revenues increased by 3.6% in 2016, compared to last year, due to higher subscriber revenues driven by Bell Media’s expansion of TMN into a national pay TV service in March 2016, combined with increased revenues from CraveTV, our streaming service, and our TV Everywhere Go products. The growth in operating revenues was moderated by lower advertising revenues due to market softness in TV and radio, the non-recurrence of revenues generated in the second half of last year from the 2015 federal election, and the shift in advertising dollars to the principal broadcaster of the Rio 2016 Summer Olympic Games. The year-over-year decrease in advertising revenues was moderated by higher OOH advertising revenues primarily due to the Métromédia acquisition in January 2016 and new contract wins in 2016.
| 48 BCE Inc. 2016 ANNUAL REPORT | |||
| 4 | Consolidated financial analysis | MD&A | |
| 4.4 Operating costs |
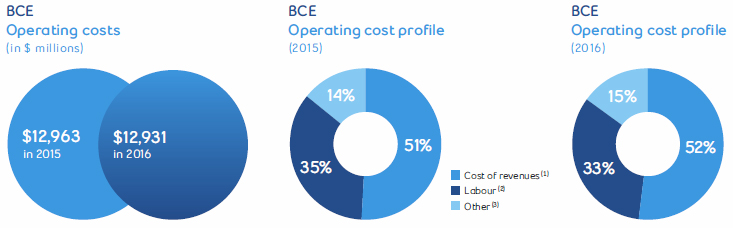
| 2016 | 2015 | $ CHANGE | % CHANGE | ||||
Bell Wireless | (4,156 | ) | (4,048 | ) | (108 | ) | (2.7 | %) |
Bell Wireline | (7,062 | ) | (7,258 | ) | 196 | 2.7 | % | |
Bell Media | (2,338 | ) | (2,251 | ) | (87 | ) | (3.9 | %) |
Inter-segment eliminations | 625 | 594 | 31 | 5.2 | % | |||
Total BCE operating costs | (12,931 | ) | (12,963 | ) | 32 | 0.2 | % |
| (1) | Cost of revenues includes costs of wireless devices and other equipment sold, network and content costs, and payments to other carriers. |
| (2) | Labour costs (net of capitalized costs) include wages, salaries, and related taxes and benefits, post-employment benefit plans service cost, and other labour costs, including contractor and outsourcing costs. |
| (3) | Other operating costs include marketing, advertising and sales commission costs, bad debt expense, taxes other than income taxes, IT costs, professional service fees and rent. |
BCE
Total BCE operating costs decreased by 0.2% in 2016, compared to 2015, as cost savings realized in our Bell Wireline segment more than offset increases in Bell Wireless and Bell Media.
BELL WIRELESS
Bell Wireless operating costs increased by 2.7% in 2016 compared to last year. The year-over-year increase in operating costs reflected:
- Higher customer retention spending mainly attributable togreater promotional pricing in a very competitive market coupledwith a greater proportion of premium smartphone devices inour upgrade mix. This increase was partially offset by loweryear-over-year subsidized upgrade volumes as a result of theconvergence of three-year and two-year contract expiries(referred to as “double cohort” in the wireless industry) followingthe final application of the mandatory code of conduct onJune 3, 2015 for providers of retail mobile wireless voice anddata services in Canada (Wireless Code), which drove greateractivity in the marketplace in 2015.
- Increased subscriber acquisition costs driven by higher year-over-year gross activations, higher sales of more expensivesmartphones, greater promotional pricing due to a competitivemarketplace and a larger proportion of postpaid gross activationsin our activation mix
- Higher bad debt expense generated by increased revenues
- Higher network operating costs driven by LTE and LTE-A networkexpansion and increased usage
- Increased payments to other carriers resulting from higher datausage volume
These factors were offset partly by lower labour costs driven by reduced call volumes to customer service centres.
BELL WIRELINE
Bell Wireline’s operating costs declined by 2.7% in 2016, compared to last year, as a result of:
- Lower labour costs attributable to workforce reductions, declining callvolumes to customer service centres and vendor contract savings
- Reduced post-employment benefit expense resulting from ahigher year-over-year discount rate. Additionally, a gainrecorded on an alignment of certain Bell Aliant DB pension planswith those of Bell Canada in the first quarter of 2016 alsocontributed to the year-over-year reduction.
- Lower cost of goods sold consistent with lower product sales
- Decreased payments to other carriers driven by reduced volumes
The decline in operating costs was offset in part by increased programming costs for TV services attributable to a greater number of total TV subscribers and programming rate increases, combined with higher costs associated with the acquisition of Q9 in the fourth quarter of 2016.
BELL MEDIA
Operating costs increased by 3.9% in 2016, compared to last year, due to higher content costs related to sports broadcast rights, the TMN national expansion and continued ramp-up in CraveTV content, as well as an increase in expenses associated with the Métromédia acquisition and outdoor advertising contract wins. This was mitigated in part by lower labour costs as a result of a 2015 workforce reduction initiative.
BCE Inc. 2016 ANNUAL REPORT 49 | |||
| 4 | Consolidated financial analysis | MD&A | |
| 4.5 Net earnings |
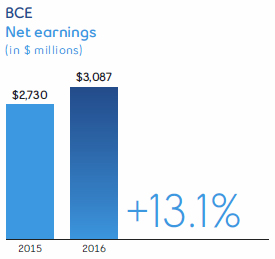
In 2016, net earnings increased by 13.1%, compared to 2015, due mainly to higher operating revenues and lower operating costs, which resulted in higher adjusted EBITDA, lower severance, acquisition and other costs, lower finance costs and higher other income, partly offset by higher amortization expense and higher income taxes.
| 4.6 Adjusted EBITDA |
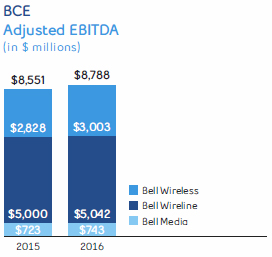
| 2016 | 2015 | $ CHANGE | % CHANGE | ||||
Bell Wireless | 3,003 | 2,828 | 175 | 6.2 | % | |||
Bell Wireline | 5,042 | 5,000 | 42 | 0.8 | % | |||
Bell Media | 743 | 723 | 20 | 2.8 | % | |||
Total BCE adjusted EBITDA | 8,788 | 8,551 | 237 | 2.8 | % |
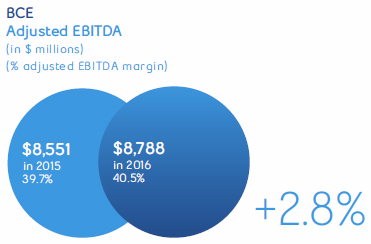
BCE
BCE’s adjusted EBITDA was 2.8% higher in 2016, compared to prior year, driven by favourable year-over-year contributions from all three of our segments.
BCE’s adjusted EBITDA margin increased by 0.8% to 40.5% in 2016, compared to 2015, resulting from growth in wireless, Internet, TV and media services revenue, disciplined cost containment at Bell Wireline, and savings from workforce reductions at Bell Media. This was moderated by the ongoing erosion in our traditional voice and legacy data services, greater wireless subscriber acquisition and customer retention spending and higher content and programming costs in our Bell Media and Bell Wireline segments.
BELL WIRELESS
Bell Wireless adjusted EBITDA grew by 6.2% in 2016, compared to 2015, reflecting growth in service revenues driven by a larger postpaid customer base and higher blended ARPU, partly offset by increased operating costs. This resulted in slightly higher year-over-year adjusted EBITDA margin, based on service revenues, of 45.5% in 2016 compared to 45.3% achieved in 2015.
BELL WIRELINE
Bell Wireline adjusted EBITDA increased by 0.8% in 2016, compared to last year, led by revenue growth from our Internet and TV businesses, disciplined cost containment, and lower post-employment benefit expense, tempered by the ongoing loss of higher-margin voice and legacy data service revenues, and the continued, but moderating, pressure in our business markets revenues.
BELL MEDIA
Bell Media adjusted EBITDA increased by 2.8% in 2016, compared to last year, as higher revenues along with labour reduction initiatives more than offset the increase in content and programming costs.
| 50 BCE Inc. 2016 ANNUAL REPORT | |||
| 4 | Consolidated financial analysis | MD&A | |
| 4.7 Severance, acquisition and other costs |
This category includes various income and expenses that are not related directly to the operating revenues generated during the year.
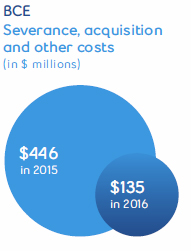
2016
Severance, acquisition and other costs included:
- Severance costs related to voluntary and involuntary workforce reduction initiativesof $87 million
- Acquisition and other costs of $48 million, which included transaction costs, such as legaland financial advisory fees, related to completed or potential acquisitions, as well asseverance and integration costs relating to the privatization of Bell Aliant Inc.
2015
Severance, acquisition and other costs included:
- Severance costs related to involuntary and voluntary workforce reduction initiativesof $197 million incurred mainly in our Bell Media and Bell Wireline segments to addressincreasing competition, media industry regulation, a soft business market and declinesin home phone subscribers
- Acquisition and other costs of $249 million related mainly to a charge of $142 millionincurred for the payment in full satisfaction of the judgment rendered in a litigation claimfor Satellite TV signal piracy, severance and integration costs relating to the privatizationof Bell Aliant Inc., as well as transaction costs, such as legal and financial advisory fees,related to completed or potential acquisitions.
| 4.8 Depreciation and amortization |
The amount of our depreciation and amortization in any year is affected by:
- How much we invested in new property,plant and equipment and intangibleassets in previous years
- How many assets we retired duringthe year
- Estimates of the useful lives of assets
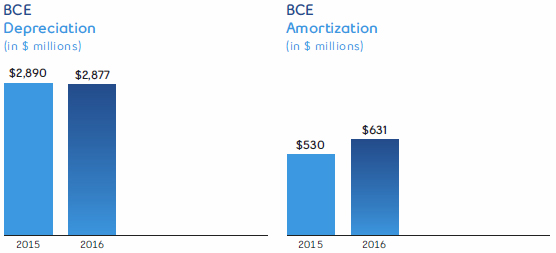
DEPRECIATION
Depreciation in 2016 decreased by $13 million, compared to 2015, due to an increase in the estimate of useful lives of certain assets as a result of our ongoing annual review process, partly offset by a higher depreciable asset base as we continued to invest in our broadband and wireless networks as well as our IPTV service. The changes to useful lives have been applied prospectively, effective January 1, 2016, as described in section 10.1,Our accounting policies – Critical accounting estimates and key judgments.
AMORTIZATION
Amortization in 2016 increased by $101 million compared to 2015 due mainly to a higher asset base.
BCE Inc. 2016 ANNUAL REPORT 51 | |||
| 4 | Consolidated financial analysis | MD&A | |
| 4.9 Finance costs |
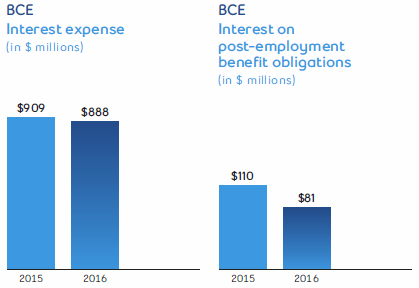
INTEREST EXPENSE
Interest expense in 2016 decreased by $21 million, compared to 2015, as a result of lower average interest rates, partly offset by higher average debt levels.
INTEREST ON POST-EMPLOYMENT BENEFIT OBLIGATIONS
Interest on our post-employment benefit obligations is based on market conditions that existed at the beginning of the year. On January 1, 2016, the discount rate was 4.2% compared to 4.0% on January 1, 2015.
In 2016, interest expense decreased by $29 million, compared to last year, due to a lower post-employment benefit obligation.
The impacts of changes in market conditions during the year are recognized in other comprehensive (loss) income (OCI).
| 4.10 Other income (expense) |
Other income (expense) includes income and expense items, such as:
- Net mark-to-market gains or losses on derivatives used as economic hedges
- Net gains or losses on investments, including gains or losses when we dispose of,write down or reduce our ownership in investments
- Equity (loss) income from investments in associates and joint ventures
- Losses on disposal and retirement of software, plant and equipment
- Early debt redemption costs
- Impairment of assets
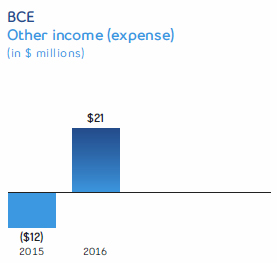
2016
Other income of $21 million included net mark-to-market gains of $67 million on derivatives used as economic hedges of share-based compensation and U.S. dollar purchases and gains on investments of $58 million which included a gain related to one of our equity investments of $34 million, as well as a gain of $12 million due to the remeasurement of BCE’s previously held equity interest in Q9 to its fair value. These were partly offset by losses of $89 million on equity investments which included BCE’s share of the loss recorded by one of our equity investments on the sale of a portion of their operations of $46 million and $11 million equity losses on our share of an obligation to repurchase at fair value the minority interest in one of BCE’s joint ventures. Additionally, BCE recorded losses of $28 million on disposal of software, plant and equipment.
2015
Other expense included losses on disposal of software, plant and equipment of $55 million, a net impairment charge of $49 million mainly related to Bell Media’s music properties resulting from revenue and profitability declines from lower viewership and higher TV content costs, and losses totalling $49 million from our equity investments which included a loss on investments of $54 million representing our share of an obligation to repurchase at fair value the minority interest in one of BCE’s joint ventures. These factors were partly offset by a gain on investments of $72 million mainly due to a $94 million gain on the sale of our 50% ownership interest in Glentel to Rogers Communications Inc. (Rogers), and net mark-to-market gains of $54 million on derivatives used as economic hedges of share-based compensation and U.S. dollar purchases.
| 52 BCE Inc. 2016 ANNUAL REPORT | |||
| 4 | Consolidated financial analysis | MD&A | |
| 4.11 Income taxes |

The following table provides information and reconciles the amount of reported income taxes in the income statements with income taxes calculated at a statutory income tax rate of 27.1% and 26.9% for 2016 and 2015, respectively.
FOR THE YEAR ENDED DECEMBER 31 | 2016 | 2015 | ||
Net earnings | 3,087 | 2,730 | ||
Add back income taxes | 1,110 | 924 | ||
Earnings before income taxes | 4,197 | 3,654 | ||
Applicable statutory tax rate | 27.1 | % | 26.9 | % |
Income taxes computed at applicable statutory rates | (1,137 | ) | (983 | ) |
Non-taxable portion of gains on investments | 11 | 26 | ||
Uncertain tax positions | (9 | ) | 41 | |
Utilization of previously unrecognized tax credits | – | 5 | ||
Effect of change in provincial corporate tax rate | 4 | (6 | ) | |
Change in estimate relating to prior periods | 46 | 8 | ||
Non-taxable portion of equity losses | (23 | ) | (14 | ) |
Other | (2 | ) | (1 | ) |
Total income taxes | (1,110 | ) | (924 | ) |
Average effective tax rate | 26.4 | % | 25.3 | % |
| 4.12 Net earnings attributable to common shareholders and EPS |
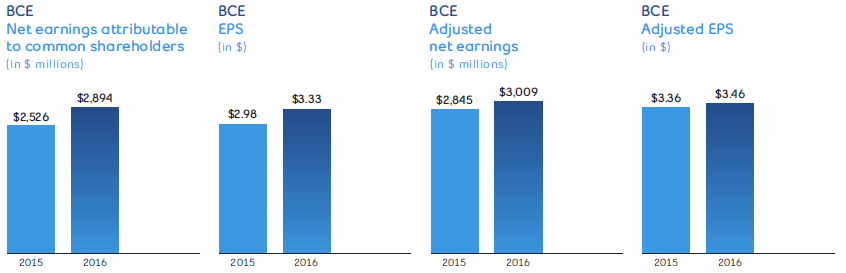
Net earnings attributable to common shareholders in 2016 increased by $368 million, compared to 2015, due mainly to higher operating revenues and lower operating costs, which resulted in higher adjusted EBITDA, lower severance, acquisition and other costs, lower finance costs and higher other income, partly offset by higher amortization expense and higher income taxes.
BCE’s EPS of $3.33 in 2016 increased by $0.35 compared to 2015. The increase in EPS was partly offset by an increase in the average number of BCE common shares outstanding, mostly as a result of shares issued under a bought deal offering in December 2015.
Excluding the impact of severance, acquisition and other costs, net gains (losses) on investments and early debt redemption costs, adjusted net earnings in 2016 was $3,009 million, or $3.46 per common share, compared to $2,845 million, or $3.36 per common share in 2015.
BCE Inc. 2016 ANNUAL REPORT 53 | |||
| 4 | Consolidated financial analysis | MD&A | |
| 4.13 Capital expenditures |
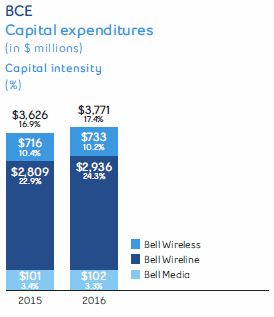
BCE capital expenditures were up $145 million, or 4.0%, in 2016, compared to 2015, driven by greater spending in our Bell Wireline and Bell Wireless segments. As a percentage of revenue, capital expenditures for BCE were 17.4% in 2016 compared to 16.9% last year. Our capital investments supported the continued rollout of broadband fibre, including the build-out of Gigabit Fibe in the city of Toronto and other urban locations, the ongoing deployment of our 4G LTE and LTE-A mobile networks, and expansion of wireless and internet network capacity to support subscriber growth and accelerating data consumption.
| 4.14 Cash flows |
In 2016, BCE’s cash flows from operating activities increased by $369 million, compared to 2015, due mainly to higher adjusted EBITDA, lower acquisition and other costs paid and lower income taxes paid, partly offset by a higher voluntary DB pension plan contribution made in 2016.
Free cash flow increased by $227 million in 2016, compared to 2015, due to higher cash flows from operating activities, partly offset by higher capital expenditures.
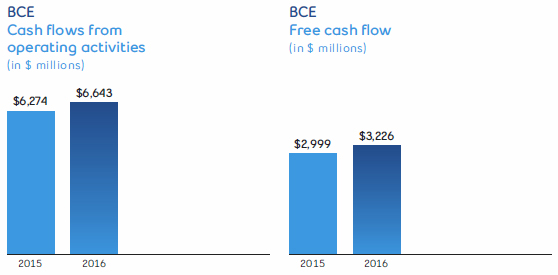
| 54 BCE Inc. 2016 ANNUAL REPORT | |||
| 5 | Business segment analysis Bell Wireless | MD&A | |
| 5 Business segment analysis |
| 5.1 Bell Wireless |
In 2016, we delivered industry-leading financial performance through disciplined postpaid customer acquisition and retention, while achieving higher ARPU through increased smartphone adoption that drove accelerated mobile data usage.
| Key elements of relevant strategic imperatives |

2016 PROGRESS
- Acquired 35% and 37% of total new postpaid gross and netactivations, respectively, among the three national wireless carriers,while achieving leading service revenue, ARPU and adjusted EBITDAgrowth of 5.7%, 3.8% and 6.2%, respectively
- Expanded the number of smartphone users at the end of 2016to 83% of our total postpaid subscribers, up from 78% at the endof 2015
- Increased the number of postpaid subscribers on our LTE networkto 81% of our total postpaid subscribers, up from 68% at the endof 2015
- Expanded our smartphone and tablet lineup with 30 new devices,including the iPhone 7 and 7 Plus from Apple, the Samsung GalaxyS7 and S7 edge, Google’s Pixel and Pixel XL and the LG G5, addingto our extensive selection of 4G LTE and LTE-A capable devices
- Launched VoLTE technology in Ontario, Atlantic Canada, parts ofQuébec and British Columbia, Yellowknife and Whitehorse for Bellcustomers with compatible smartphones. VoLTE enables faster callset up times, HD voice quality and the ability to switch seamlesslybetween voice and video during calls
- Launched Roam Better International roaming feature that givescustomers access to specialized rates while traveling, providingunlimited voice and text messages and an additional dedicated100 MB of data usage for $10 a day in over 110 destinations acrossEurope, the Americas, Asia and the Middle East, Australia andSouth Africa
- Launched a new portfolio of products and support services tomake mobile communications more accessible for customers withspeech, cognitive, physical, hearing and vision related disabilities,including the Doro 824 and 824C smartphones for customers withmoderate visual needs, the Mobile Accessibility screen readerapp to assist blind and low vision users, and Tecla by Komodo,a portable and hands free device that enables customers withphysical upper body limitations to easily use smartphonesand tablets without touching the screen
2017 FOCUS
- Profitably grow our wireless postpaid subscriber base, whilemaintaining market share momentum of incumbent postpaidsubscriber activations
- Continue to increase ARPU
- Offer the latest handsets and devices in a timely manner to enablecustomers to benefit from ongoing technological improvementsby manufacturers and from faster data speeds to optimize the useof our services
- Continue to increase the number of postpaid smartphonesubscribers using our 4G LTE and LTE-A networks
- Expand VoLTE technology coverage areas and broaden rolloutto more supported devices
- Accelerate new revenue streams by continuing to drive thecommercialization of IoT services and applications

2016 PROGRESS
- Expanded our 4G LTE wireless network to reach 97% of theCanadian population coast to coast
- Continued the rollout of our Dual-band LTE-A wireless network,providing service to 73% of the Canadian population at data speedsof up to 260 Mbps (expected average download speeds of 18 to74 Mbps). In addition, Tri-band LTE-A wireless service, enabled byaggregating PCS, AWS-1 and 700 MHz spectrum, that deliversmobile data speeds of up to 335 Mbps (expected average downloadspeeds of 25 to 100 Mbps), was launched in a number of cities andareas, including in Halifax, Fredericton, Moncton, Saint John,Sydney, St. John’s, Toronto, Hamilton, Oakville, London, Kitchener-Waterloo, Niagara Falls, Muskoka Lakes, Sudbury, Sarnia,Trois-Rivières and Chicoutimi
- Bell’s 4G LTE wireless network was ranked as the fastest mobileLTE network in Canada by PCMag
- According to Nielsen Consumer Insights, more Canadians choseBell as having the best mobile network in Canada
- Conducted the first Canadian trials of 5G mobile technology incollaboration with Nokia Corporation, leveraging spectrum in the73 GHz range to achieve sustained data speeds more than sixtimes faster than top 4G mobile speeds now available in Canada
2017 FOCUS
- Complete our 4G LTE wireless network build to 99% of theCanadian population and manage wireless network capacity
- Expand LTE-A coverage to reach approximately 83% of theCanadian population
- Increase LTE-A speeds up to 560 Mbps in select areas throughfour-carrier aggregation (expected average download speedsof 41 to 166 Mbps)
- Increase small cell deployment and in-building coverageto increase urban densification
BCE Inc. 2016 ANNUAL REPORT 55 | |||
| 5 | Business segment analysis Bell Wireless | MD&A | |

2016 PROGRESS
- The CCTS received 18% fewer complaints about Bell and VirginMobile between August 1, 2015 and July 31, 2016 than during theequivalent period of the previous year, continuing the steadydecline in Bell and Virgin Mobile complaints since July 2013
- Reduced customer calls to our service centres by 4 millionin 2016 due to more self-serve online transactions by customersand overall operational improvements. Online self-servevisits, infoviews and transactions totalled more than 190 million,an increase of 30 million over 2015.
2017 FOCUS
- Continue to invest in customer service initiatives to simplifycomplexity for all customers, including billing
- Further reduce the total volume of customer calls to ourcall centres
- Further improve customer satisfaction scores
- Achieve better consistency in customer experience
- Continue to improve customer personalization

2016 PROGRESS
- Delivered cost savings from ongoing service improvements
2017 FOCUS
- Capture operating cost and capital expenditure synergiesfrom the integration of MTS following the completion of theacquisition by BCE
- Deliver cost savings from ongoing service improvements
| Financial performance analysis |
2016 PERFORMANCE HIGHLIGHTS
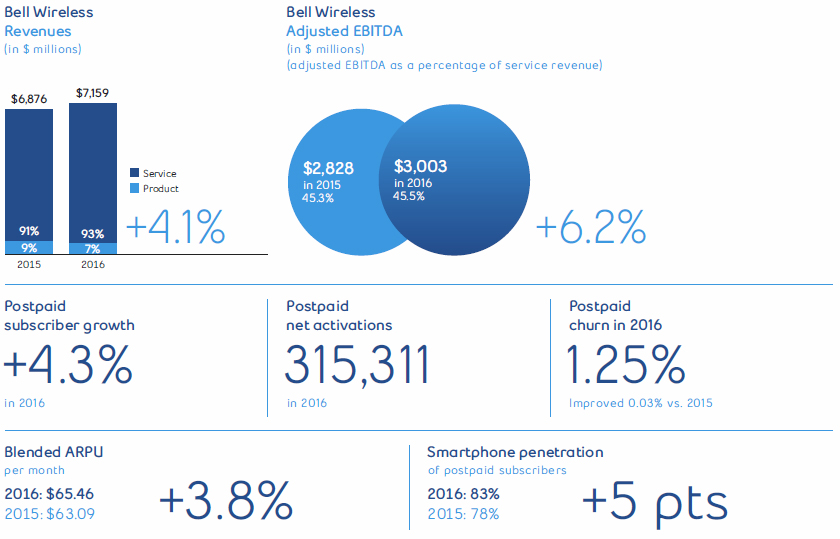
| 56 BCE Inc. 2016 ANNUAL REPORT | |||
| 5 | Business segment analysis Bell Wireless | MD&A | |
BELL WIRELESS RESULTS
REVENUES
| 2016 | 2015 | $ CHANGE | % CHANGE | ||||
Service | 6,602 | 6,246 | 356 | 5.7 | % | |||
Product | 515 | 590 | (75 | ) | (12.7 | %) | ||
Total external revenues | 7,117 | 6,836 | 281 | 4.1 | % | |||
Inter-segment revenues | 42 | 40 | 2 | 5.0 | % | |||
Total Bell Wireless revenues | 7,159 | 6,876 | 283 | 4.1 | % |
Bell Wireless operating revenues grew by 4.1% in 2016, compared to last year, as a result of higher service revenues, partly offset by lower product revenues.
- Service revenues grew by 5.7% in 2016, compared to last year,driven by a larger postpaid subscriber base along with blendedARPU growth. The increase in blended ARPU reflected higheraverage monthly access rates due to the continued shift bycustomers from three-year plans to two-year plans, as well asgreater smartphone penetration and a growing base of postpaidLTE and LTE-A customers in our subscriber mix which continued to drive growth in data consumption. The year-over-year growth in service revenues was moderated by lower wireless voice revenues, due mainly to increased adoption of all-inclusive rate plans, and the ongoing substitution for data applications.
- Product revenues decreased by 12.7% in 2016, compared to lastyear, primarily due to greater promotional offers as a result ofa very competitive marketplace, as well as a fewer numberof device upgrades, moderated in part by higher gross activationsand a greater proportion of more expensive smartphone devicesin our sales mix
OPERATING COSTS AND ADJUSTED EBITDA
| 2016 | 2015 | $ CHANGE | % CHANGE | ||||
Operating costs | (4,156 | ) | (4,048 | ) | (108 | ) | (2.7 | %) |
Adjusted EBITDA | 3,003 | 2,828 | 175 | 6.2 | % | |||
Total adjusted EBITDA margin | 41.9 | % | 41.1 | % | 0.8 | % | ||
Adjusted EBITDA margin (service revenues) | 45.5 | % | 45.3 | % | 0.2 | % |
Bell Wireless operating costs increased 2.7% in 2016, compared to last year, as a result of:
- Higher customer retention spending mainly attributable togreater promotional pricing in a very competitive marketplacecoupled with a greater proportion of more expensive premiumsmartphone devices in our upgrade mix. This increase waspartially offset by lower year-over-year subsidized upgradevolumes as 2015 was impacted by the double cohort whichdrove greater activity in the marketplace.
- Increased subscriber acquisition costs driven by higher year-over-year gross activations, higher sales of more expensivesmartphones, greater promotional pricing due to a verycompetitive marketplace and a larger proportion of postpaidgross activations in our activation mix
- Higher bad debt expense generated by increased revenues
- Higher network operating costs driven by LTE and LTE-A networkexpansion and increased usage
- Increased payments to other carriers resulting from higher datausage volume
These factors were offset partly by labour savings driven by lower call volumes to customer service centres.
Bell Wireless adjusted EBITDA was up 6.2% in 2016, compared to last year, as the growth in operating revenues more than offset the greater investment in customer retention and higher subscriber acquisition costs. This resulted in a modest increase to adjusted EBITDA margin, based on wireless service revenues, of 45.5% in 2016 compared to 45.3% achieved last year.
BCE Inc. 2016 ANNUAL REPORT 57 | |||
| 5 | Business segment analysis Bell Wireless | MD&A | |
BELL WIRELESS OPERATING METRICS
| 2016 | 2015 | CHANGE | % CHANGE | ||||
Blended ARPU ($/month) | 65.46 | 63.09 | 2.37 | 3.8 | % | |||
Gross activations | 1,654,882 | 1,600,147 | 54,735 | 3.4 | % | |||
Postpaid | 1,408,030 | 1,338,141 | 69,889 | 5.2 | % | |||
Prepaid | 246,852 | 262,006 | (15,154 | ) | (5.8 | %) | ||
Net activations | 223,041 | 127,203 | 95,838 | 75.3 | % | |||
Postpaid | 315,311 | 265,369 | 49,942 | 18.8 | % | |||
Prepaid | (92,270 | ) | (138,166 | ) | 45,896 | 33.2 | % | |
Blended churn % (average per month) | 1.44 | % | 1.51 | % | 0.07 | % | ||
Postpaid | 1.25 | % | 1.28 | % | 0.03 | % | ||
Prepaid | 3.13 | % | 3.32 | % | 0.19 | % | ||
Subscribers | 8,468,872 | 8,245,831 | 223,041 | 2.7 | % | |||
Postpaid | 7,690,727 | 7,375,416 | 315,311 | 4.3 | % | |||
Prepaid | 778,145 | 870,415 | (92,270 | ) | (10.6 | %) | ||
Cost of acquisition (COA) ($/subscriber) | 494 | 467 | (27 | ) | (5.8 | %) |
Blended ARPU of $65.46 increased by 3.8% in 2016 compared to last year. The increase was driven by growth in postpaid ARPU as a result of a greater percentage of customers on higher-rate two year plans, along with a greater mix of postpaid customers with smartphones and other data devices in our total subscriber base, resulting in greater data consumption from e-mail, web browsing, social networking, text messaging, mobile TV, picture and video messaging, as well as entertainment services such as video streaming, music downloads and gaming. The higher speeds enabled by the continued expansion of our 4G LTE and LTE-A networks also drove greater data consumption which further contributed to the growth in blended ARPU. This was moderated by the impact of richer plans with higher data usage thresholds, unlimited local and long distance calling and a greater mix of shared plans.
Total gross wireless activations increased by 3.4% in 2016, compared to last year, reflecting a higher number of postpaid gross activations, while prepaid gross activations declined year over year.
- Postpaid gross activations increased by 5.2% in 2016, comparedto last year, reflecting the continued effectiveness of ourpromotional activities despite ongoing competitive pressuresand a maturing wireless market
- Prepaid gross activations decreased by 5.8% in 2016, comparedto last year, due to our continued focus on postpaid customeracquisitions
Smartphones as a percentage of postpaid subscribers was 83% at December 31, 2016 compared to 78% at the end of the same period last year.
Blended wireless churn improved by 0.07% in 2016, compared to the prior year, driven by both lower postpaid and prepaid churn. The improvement was mainly attributable to a greater percentage of postpaid subscribers in our total subscriber base compared to last year, as postpaid customers typically have a lower churn rate than prepaid customers, and also reflected the favourable impact of our ongoing investment in customer retention.
- Postpaid churn improved by 0.03% in 2016 to 1.25%, compared to2015, due to greater activity in the marketplace last year as aresult of the double cohort that began in June 2015. Our ongoinginvestment in customer retention and improved customer servicealso contributed to the improvement in churn.
- Prepaid churn improved by 0.19% in 2016, compared to last year, to3.13%, as a result of fewer customer deactivations compared to 2015
Postpaid net activations increased by 18.8% in 2016, compared to last year, due to higher gross activations offset partly by higher customer deactivations.
Prepaid net customer losses improved by 33.2% in 2016, compared to last year, driven by fewer customer deactivations, partially offset by lower gross activations.
Wireless subscribers totalled 8,468,872 at December 31, 2016, representing an increase of 2.7% since the end of 2015. The proportion of Bell Wireless customers subscribing to postpaid service increased to 91% in 2016 from 89% in 2015.
COA per gross activation increased year over year by $27 to $494 in 2016, reflecting the impact of a higher proportion of postpaid customers in our activation mix, combined with higher handset prices due to the sale of more expensive premium smartphones and a weak Canadian dollar, as well as greater promotional offers driven by a highly competitive market.
Retention costs as a percentage of service revenue increased to 13.2% in 2016 compared to 12.6% in 2015. The increase in retention costs in 2016 was mainly attributable to the ongoing shift to more expensive smartphone models in our upgrade mix and greater promotional pricing driven by a very competitive market, offset in part by a lower number of subsidized upgrades in 2016 given that 2015 was impacted by the double cohort which drove greater activity in the marketplace.
| 58 BCE Inc. 2016 ANNUAL REPORT | |||
| 5 | Business segment analysis Bell Wireless | MD&A | |
| Competitive landscape and industry trends |
COMPETITIVE LANDSCAPE
The wireless market is the largest sector of the Canadian telecommunications industry, representing 49% of total revenues, and is currently growing at a mid-single digit rate annually.
There are over 30 million wireless subscribers in Canada. The market is highly competitive among three well-established national competitors as well as a number of regional competitors. Rogers holds the largest share by virtue of its legacy global system for mobile communications (GSM) network. However, Bell has had significant success winning subscribers as well as the largest proportion of industry revenue and adjusted EBITDA growth since 2009, helped by the launch of our HSPA+, 4G LTE and LTE-A networks, expanded retail distribution, the purchase of Virgin Mobile, a refreshed brand and improved customer service.
In March 2016, the Western Canada-based cable TV company, Shaw Communications Inc. (Shaw), completed its previously announced acquisition of WIND Mobile, effectively making Shaw the fourth wireless carrier in British Columbia, Alberta and Ontario. Shaw rebranded WIND Mobile as Freedom Mobile in November 2016. Vidéotron Ltée (Vidéotron) continues to operate as a regional facilities-based wireless service provider in Québec, and Eastlink in Atlantic Canada. These cable TV-based wireless providers, in addition to provincial carriers in Manitoba and Saskatchewan, represent fourth carriers in their respective markets.
Canada’s wireless penetration was approximately 83% at the end of 2016, compared to 116% for the U.S. and as high as 180% in certain countries in Europe. Canada’s wireless sector is expected to continue growing at a steady pace for the foreseeable future, driven by the increasing usage of data services, the ongoing adoption of more capable smartphones and tablets and the further expansion of LTE-A network service enabled by the aggregation of multiple channels of wireless spectrum.
| Competitors |
- Large facilities-based national wireless service providers Rogersand TELUS Corporation (TELUS)
- Smaller facilities-based wireless service provider FreedomMobile(1), which currently provides service in Toronto, Calgary,Vancouver, Edmonton and Ottawa, as well as in severalcommunities in southwestern Ontario
- Regional facilities-based wireless service providers Vidéotron,which provides service in Montréal and other parts of Québec;Saskatchewan Telecommunications Holding Corporation (SaskTel),which provides service in Saskatchewan; MTS Mobility(2), whichprovides service in Manitoba; and Eastlink, which launched servicein Nova Scotia and Prince Edward Island in February 2013
- Mobile virtual network operators (MVNOs), who resell competitors’wireless networks, such as PC Mobile
Canadian wireless market share
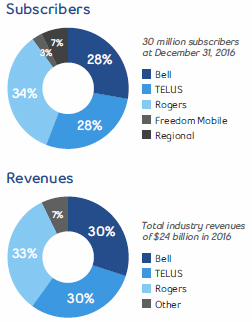
KEY WIRELESS METRICS – SHARE FOR NATIONAL CARRIERS(3)

| (1) | Shaw completed its acquisition of WIND Mobile on March 1, 2016 and rebranded the service as Freedom Mobile in November 2016. |
| (2) | BCE expects to complete the acquisition of MTS on March 17, 2017. See section 1.3,Key corporate developments, for more details. |
| (3) | Percentages may not add to 100 due to rounding. |
| (4) | Bell metrics shown include Bell Aliant Inc. as of 2015. |
| (5) | TELUS metrics shown include Public Mobile Inc. as of 2015. |
BCE Inc. 2016 ANNUAL REPORT 59 | |||
| 5 | Business segment analysis Bell Wireless | MD&A | |
INDUSTRY TRENDS
ACCELERATING DATA CONSUMPTION
Wireless data growth continues to be driven by the ongoing adoption of smartphones and tablets, and associated data plans. The demand for wireless data services is expected to continue to grow, due to ongoing investment in faster network technologies, such as 4G LTE and LTE-A, that provide a richer user experience, a larger appetite for mobile connectivity and social networking, greater selection of smartphones and tablets, as well as increasing adoption of shared plans with multiple devices by families. Greater customer adoption of data services, including mobile TV, data roaming for travel, mobile commerce, mobile banking, and other IoT applications in the areas of retail and transportation (connected car, asset tracking, and remote monitoring) should also contribute to the growth. In the consumer market, IoT is projected to be a future growth area for the industry as wireless connectivity on everyday devices, from home automation to cameras, becomes ubiquitous.
NEED FOR MORE WIRELESS SPECTRUM AND CARRIER AGGREGATION
Fast growth in mobile data traffic is increasingly putting a strain on wireless carriers’ networks and their ability to manage and service this traffic. Industry Canada’s 700 MHz, Advanced Wireless Services-3 (AWS-3), and 2500 MHz spectrum auctions that concluded in 2014 and 2015 provided wireless carriers with prime spectrum to roll out faster next-generation wireless networks and build greater capacity. Furthermore, carrier aggregation is a technology currently being employed by Canadian wireless carriers (and which is expected to be used more extensively in the future) that allows for multiple spectrum channels to be used together, thereby significantly increasing capacity and data transfer rates.
GREATER SPENDING ON CUSTOMER RETENTION
As wireless penetration in Canada increases further, together with a growing number of off-contract subscribers and a continued high level of competitive intensity, even greater focus will be required to improve customer service, enhance existing service offerings and spend on upgrading more customers to new devices. In particular, as a result of the Wireless Code, which has limited wireless contract terms to two years from three years previously, a higher level of transactional market activity is expected as a result of a growing number of customers who will be eligible to renew their plans or change carriers. However, as the number of customer contract migrations from three-year to two-year contracts slows down, ARPU growth is expected to moderate.
| Business outlook and assumptions |
2017 OUTLOOK
We expect continued revenue growth driven by a greater number of postpaid subscribers and higher ARPU. We expect ARPU to continue to increase, but at a slower pace, as the market continues to mature, driven by the flow-through of access rate increases implemented in January 2016, higher-rate plan pricing for bring-your-own-device (BYOD) plans, a larger proportion of higher-rate plans in the revenue mix reflecting increased customer adoption of larger data buckets, accelerated data usage, and further growth in the proportion of postpaid subscribers in our overall customer base as we focus on maintaining our incumbent net additions market share in a disciplined and cost-conscious manner.
We will seek to achieve higher revenues from data growth, through the use of our HSPA+, 4G LTE and LTE-A networks, higher demand for services such as web browsing, music and video streaming and community portals such as Facebook and YouTube, as well as nascent services including mobile commerce and other IoT applications. Our intention is to introduce these new services to the market in a way that balances innovation with profitability.
We plan to deliver adjusted EBITDA growth in 2017 from continued solid revenue growth, which should be partly offset by higher subscriber acquisition and retention spending consistent with a sustained high level of competitive market activity.
ASSUMPTIONS
- Maintain our market share of incumbent wireless postpaidsubscriber activations
- Continued adoption of smartphone devices, tablets and dataapplications, as well as the introduction of more 4G LTE devicesand new data services
- Higher subscriber acquisition and retention spending, drivenby higher handset costs and more customer device upgrades,reflecting a higher number of off-contract subscribers dueto earlier expiries under two-year contracts
- Higher blended ARPU, driven by a higher postpaid smartphonemix, increased data consumption on 4G LTE and LTE-A networks,and higher access rates from price increases
- Completion of the LTE network buildout to 99% of the Canadianpopulation and expansion of the LTE-A network coverage toapproximately 83% of the Canadian population
- Ability to monetize increasing data usage and customersubscriptions to new data services
- Ongoing technological improvements by handset manufacturersand from faster data network speeds that allow customers tooptimize the use of our services
- No material financial, operational or competitive consequencesof changes in regulations affecting our wireless business
| 60 BCE Inc. 2016 ANNUAL REPORT | |||
| 5 | Business segment analysis Bell Wireless | MD&A | |
| Key growth drivers |
- Increasing Canadian wireless industry penetration
- Increasing customer adoption of smartphones, tablets and other4G LTE devices to increase mobile data usage
- Greater number of postpaid customers on our 4G LTE andLTE-A networks
- Customer usage of new data applications and services
| Principal business risks |
This section discusses certain principal business risks specifically related to the Bell Wireless segment. For a detailed description of the principal risks that could have a material adverse effect on our business, refer to section 9,Business risks.
REGULATORY ENVIRONMENT RISK
POTENTIAL IMPACT
| AGGRESSIVE COMPETITION RISK
POTENTIAL IMPACT
| MARKET MATURITY RISK
POTENTIAL IMPACT
|
BCE Inc. 2016 ANNUAL REPORT 61 | |||
| 5 | Business segment analysis Bell Wireline | MD&A | |
| 5.2 Bell Wireline |
Our Bell Wireline segment achieved positive adjusted EBITDA growth for a second consecutive year in 2016, supported by continued Internet and IPTV subscriber growth, higher household ARPU and lower operating costs, which drove a 0.9 percentage-point improvement in our North American industry-leading margin of 41.7%.
| Key elements of relevant strategic imperatives |

2016 PROGRESS
- Maintained our position as Canada’s largest TV provider with2,744,909 subscribers, and increased our total number of IPTVsubscribers by 13.1% to 1,337,944
- Built on our position as the leading ISP in Canada with a high-speed Internet subscriber base of 3,476,562, up 1.9% over 2015
- Increased the number of multi-product households – those thatbuy TV, Internet and Home Phone – by 4% over 2015, fuelledby our IPTV service, which drove higher pull-through attach ratesfor Home Phone and Internet services, with 74% of all new IPTVcustomers taking three products
- Maintained our leadership position in Canadian broadbandcommunications with the most advanced products in the homeand continuous IPTV and Internet service innovation
- Launched Home Hub 3000 residential gateway, offering themost powerful home Wi-Fi service with 12 antennas, totalthroughput capability of up to 1 Gb, automatic channelswitching for reduced interference, tri-band technologysupporting multiple connected devices and battery back-upthat enables customers to use Fibe Internet during a poweroutage for up to four hours
- Launched Wireless 4K Whole Home PVR, enabling the world’sfirst fully wireless IPTV service with the flexibility to easily locateFibe TV anywhere in the home, and featuring 4K quality withfour times the detail of Full HD, up to 150 hours of 4K recordingcapacity and Bluetooth remote that enables out-of-sightpositioning of the PVR
- Became the first TV provider in Canada to integrate accessto Netflix in 4K Whole Home PVR
- Became the first Canadian TV service provider to offer TVservice on Apple TV, providing access to up to 450 channels liveor on demand and unique Fibe TV features like top trendingshows, with recordings and pause and rewind live TV cominglater in 2017
- Bell Fibe TV was ranked as the most advanced TV servicein Canada
- Bell’s FTTH Fibe Internet service led Canadian Internet providers,exceeding advertised download speeds by a greater margin thanthe competition
- Launched Virgin Home Internet service in Ontario and Québec
- Acquired Q9, a Toronto-based data centre operator providingoutsourced hosting and other data solutions to Canadian businessand government customers, supporting our ability to competeagainst domestic and international providers in the growingoutsourced data services sector
- Launched Bell Total Connect for small business customers acrossOntario and Québec, delivering a suite of advanced messagingand unified communications services on both broadband fibreand mobile LTE networks
- Formed a partnership with IBM to expand the cloud computingservices available through our Bell Business Cloud service, givingbusinesses across Canada access to the IBM Cloud via a secure,high-speed private connection from Bell, simplifying the waycustomers adopt and build out their hybrid clouds
2017 FOCUS
- Continue to enhance our IPTV service with more advanced features
- Make Bell Fibe TV available as a standalone TV service
- Expand our total base and market share of TV and Internetsubscribers profitably
- Reduce total wireline residential net losses
- Increase residential household ARPU through greatermulti-product household penetration
- Increase share of wallet of large enterprise customers throughgreater focus on business service solutions and connectivitygrowth
- Increase the number of net new customer relationships in bothlarge and mid-sized businesses and reduce small businesscustomer losses
| 62 BCE Inc. 2016 ANNUAL REPORT | |||
| 5 | Business segment analysis Bell Wireline | MD&A | |

2016 PROGRESS
- Continued to expand our FTTP broadband fibre footprint in communities across Ontario, Québec and Atlantic Canada, reaching approximately 2.9 million homes and businesses. FTTP enables Internet speeds of up to 1 Gbps.
2017 FOCUS
- Expand FTTP broadband fibre footprint to approximately 3.5 million locations passed

2016 PROGRESS
- The CCTS received 18% fewer complaints about Bell and VirginMobile between August 1, 2015 and July 31, 2016 than during theequivalent period of the previous year, continuing the steadydecline in Bell and Virgin Mobile complaints since July 2013
- Launched Manage Your Appointment feature, offering residentialcustomers an easy way to confirm and check the status of theirservice appointments online
- Reduced customer calls to our service centres by 4 million in 2016due to more self-serve online transactions by customersand overall operational improvements. Online self-serve visits,infoviews and transactions totalled more than 190 million,an increase of 30 million over 2015.
- Reduced Fibe TV installation time for FTTP customers by 9%in 2016 and 43% since the beginning of 2012
- Achieved Same Day Next Day service completion rate of 88%for repairing service issues with Home Phone, TV and Internet
- Improved customer satisfaction with technicians to 95%for installations and repairs
- Offered installation appointments within two days of placingan order to 76% of residential customers, an increase of almosttwo times since 2014
- Offered Same Day repair to 73% of small business customers,who are now able to schedule appointments until 4:00 p.m. forSame Day repair
- Improved skill set of customer service agents to allow themto resolve more technical issues, eliminating 30% of transfers tosecond-level support
2017 FOCUS
- Continue to invest in customer service initiatives to simplifycomplexity for all customers, including billing
- Further reduce the total volume of customer calls to ourcall centres
- Further improve customer satisfaction scores
- Achieve better consistency in customer experience
- Continue to improve customer personalization
- Reduce FTTP installation times and improve service quality
- Deploy new diagnostic technology enabling enhancedtroubleshooting and service monitoring for our customers

2016 PROGRESS
- Reduced wireline operating costs by 2.7%, contributing toBell Wireline adjusted EBITDA margin improvement of 0.9 ptsover 2015
- Executed on labour savings from workforce reductionsundertaken in 2015 at Bell Wireline
- Delivered cost savings from ongoing service improvements andsavings related to the deployment of FTTP
2017 FOCUS
- Capture operating cost and capital expenditure synergiesfrom the integration of MTS following the completion of theacquisition by BCE
- Deliver cost savings from workforce reductions, ongoing serviceimprovements, and savings related to the deployment of FTTP tosupport a stable consolidated adjusted EBITDA margin
BCE Inc. 2016 ANNUAL REPORT 63 | |||
| 5 | Business segment analysis Bell Wireline | MD&A | |
| Financial performance analysis |
2016 PERFORMANCE HIGHLIGHTS
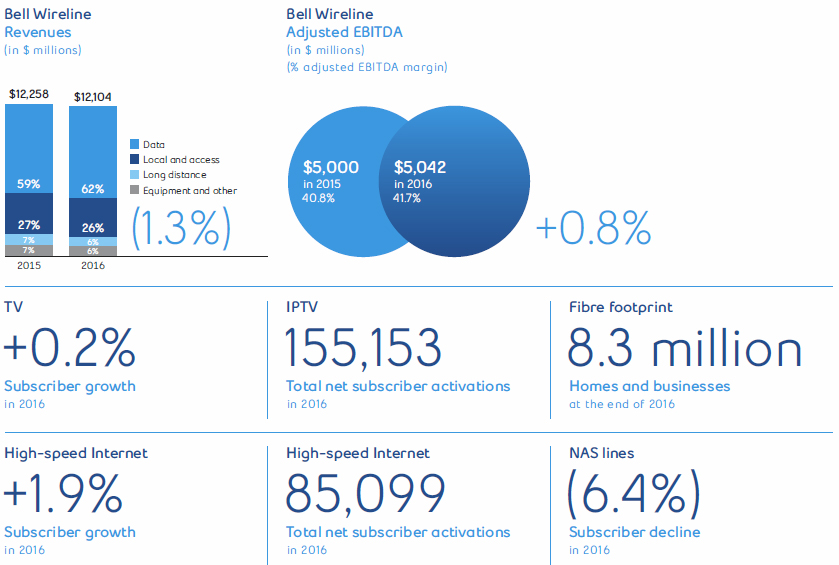
BELL WIRELINE RESULTS
REVENUES
| 2016 | 2015 | $ CHANGE | % CHANGE | ||||
Data | 6,791 | 6,590 | 201 | 3.1 | % | |||
Local and access | 3,089 | 3,271 | (182 | ) | (5.6 | %) | ||
Long distance | 741 | 831 | (90 | ) | (10.8 | %) | ||
Other services | 182 | 186 | (4 | ) | (2.2 | %) | ||
Total external service revenues | 10,803 | 10,878 | (75 | ) | (0.7 | %) | ||
Inter-segment service revenues | 177 | 204 | (27 | ) | (13.2 | %) | ||
Total operating service revenues | 10,980 | 11,082 | (102 | ) | (0.9 | %) | ||
Data | 559 | 573 | (14 | ) | (2.4 | %) | ||
Equipment and other | 555 | 592 | (37 | ) | (6.3 | %) | ||
Total external product revenues | 1,114 | 1,165 | (51 | ) | (4.4 | %) | ||
Inter-segment product revenues | 10 | 11 | (1 | ) | (9.1 | %) | ||
Total operating product revenues | 1,124 | 1,176 | (52 | ) | (4.4 | %) | ||
Total Bell Wireline revenues | 12,104 | 12,258 | (154 | ) | (1.3 | %) |
Bell Wireline operating revenues decreased by 1.3% in 2016, compared to last year, due to declines in local and access, long distance and product revenues. Bell Wireline year-over-year revenues were also unfavourably impacted by the sale of a call centre subsidiary in September 2015. The decrease in operating revenues was partly mitigated by the growth in data service revenue.
Bell Wireline delivered growth from residential services revenue in 2016, despite the unfavourable impact of the sale of a call centre subsidiary, mainly attributable to higher Internet and IPTV subscriber bases along with growth in household ARPU, partially offset by higher customer acquisition and retention discounts resulting from aggressive cable competition, the impact of service optimization by customers
| 64 BCE Inc. 2016 ANNUAL REPORT | |||
| 5 | Business segment analysis Bell Wireline | MD&A | |
and ongoing NAS and satellite TV subscriber base erosion. Slow economic growth and competitive pricing pressures continued to unfavourably impact our business markets revenues although the rate of erosion improved compared to last year. Bell Wireline operating revenues were further negatively impacted by a decrease in our wholesale market, driven by an unfavourable CRTC rate revision for aggregated wholesale high-speed Internet access services.
- Data service revenues increased by 3.1% in 2016, compared to2015, driven by higher Internet and IPTV revenues, due to growthin the subscriber bases and rate increases, as well as higherbusiness solutions services revenue mainly reflecting theacquisition of Q9 in the fourth quarter of 2016. This was partlyoffset by lower satellite TV revenues primarily driven by a lowersubscriber base, the continued erosion in legacy data revenues,as well as significantly lower revised interim rates set by the CRTC,effective October 2016, for aggregated wholesale high-speedInternet access services.
- Local and access revenues decreased by 5.6% in 2016, comparedto last year, as a result of the continued loss of NAS lines due toaggressive offers from cable TV providers, technologicalsubstitution to wireless and Internet-based services and largebusiness customer conversions to IP-based data services,moderated in part by rate increases on our residential services
- Long distance revenues declined by 10.8% in 2016, compared to2015, reflecting fewer minutes of use by residential and businesscustomers, resulting from NAS line losses, technology substitutionto wireless and OTT Internet-based services, continued ratepressures in our residential market from customer adoption ofpremium rate plans, and lower sales of international long distanceminutes in our wholesale market
- Product revenues declined by 4.4% in 2016, compared to 2015,driven by ongoing slow economic growth in our business marketresulting in lower demand for equipment
OPERATING COSTS AND ADJUSTED EBITDA
| 2016 | 2015 | $ CHANGE | % CHANGE | ||||
Operating costs | (7,062 | ) | (7,258 | ) | 196 | 2.7 | % | |
Adjusted EBITDA | 5,042 | 5,000 | 42 | 0.8 | % | |||
Adjusted EBITDA margin | 41.7 | % | 40.8 | % | 0.9 | % |
Bell Wireline operating costs decreased by 2.7% in 2016, compared to last year, as a result of:
- Labour cost savings attributable to workforce reductions,a decline in call volumes to customer service centres and vendorcontract savings
- Decreased post-employment benefit expense resulting froma higher discount rate year over year and a gain recorded on analignment of certain Bell Aliant DB pension plans with those ofBell Canada in the first quarter of 2016
- Lower cost of goods sold associated with lower product sales
- Reduced payments to other carriers driven by reduced volumes
The decline in operating expenses was partly offset by increased programming costs for TV services resulting from a higher number of total TV subscribers and programming rate increases, as well as higher costs associated with the acquisition of Q9 in the fourth quarter of 2016.
Bell Wireline adjusted EBITDA increased by 0.8% in 2016, compared to 2015, with a corresponding adjusted EBITDA margin expansion to 41.7% from 40.8% in 2015. The year-over-year growth in adjusted EBITDA was driven by higher revenues from our Internet and TV businesses, ongoing effective cost management and lower post-employment benefit expense which more than offset the continued loss of higher-margin voice and legacy data service revenues and the continued, but moderating, pressure in our business markets revenues.
BELL WIRELINE OPERATING METRICS
Data
High-speed Internet
| 2016 | 2015 | CHANGE | % CHANGE | ||||
High-speed Internet net activations | 85,099 | 155,052 | (69,953 | ) | (45.1 | %) | ||
High-speed Internet subscribers(1) | 3,476,562 | 3,413,147 | 63,415 | 1.9 | % |
| (1) | Our 2016 business Internet subscriber base reflects a beginning of period adjustment to reduce the number of subscribers by 21,684 in order to align practices as a result of the integration of Bell Aliant. |
High-speed Internet subscriber net activations decreased by 45.1% in 2016, compared to 2015, as a result of lower retail and wholesale residential net activations, driven by increasingly aggressive offers from cable competitors, a greater number of retail customers coming off promotional offers which increased deactivations and lower pull-through due to the reduction in IPTV activations. This was partly mitigated by increased activations from the launch of Home Internet service in the second half of 2016 by Virgin Mobile, higher retail activations in our FTTH footprint, as well as modest growth in our business market.
High-speed Internet subscribers at December 31, 2016 totalled 3,476,562, up 1.9% from the end of 2015.
TV
| 2016 | 2015 | CHANGE | % CHANGE | ||||
Net subscriber activations | 6,413 | 107,380 | (100,967 | ) | (94.0 | %) | ||
IPTV | 155,153 | 253,329 | (98,176 | ) | (38.8 | %) | ||
Total subscribers | 2,744,909 | 2,738,496 | 6,413 | 0.2 | % | |||
IPTV | 1,337,944 | 1,182,791 | 155,153 | 13.1 | % |
BCE Inc. 2016 ANNUAL REPORT 65 | |||
| 5 | Business segment analysis Bell Wireline | MD&A | |
IPTV net subscriber activations decreased by 38.8% in 2016, compared to last year, driven by a higher number of retail customers coming off promotional offers, aggressive offers from the cable competitors for service bundles, the impact of maturing Fibe TV markets, slower IPTV footprint expansion in 2016, and fewer customer migrations from satellite TV.
Satellite TV net customer losses increased by 1.9% in 2016, compared to 2015, attributable to lower activations, driven by increased promotional offers from cable competitors, which was moderated by fewer customer deactivations and lower retail migrations to IPTV.
Total TV net subscriber activations (IPTV and satellite TV combined) declined by 100,967 in 2016, compared to last year, due to lower IPTV net activations and higher satellite TV net losses, as described above.
IPTV subscribers at December 31, 2016 totalled 1,337,944, up 13.1% from 1,182,791 subscribers reported at the end of 2015.
Satellite TV subscribers at December 31, 2016 totalled 1,406,965, down 9.6% from 1,555,705 subscribers at the end of last year.
Total TV subscribers (IPTV and satellite TV combined) at December 31, 2016 were 2,744,909, representing a 0.2% increase since the end of 2015.
Local and access
| 2016 | 2015 | CHANGE | % CHANGE | ||||
NAS LINES | ||||||||
Residential | 3,249,739 | 3,533,732 | (283,993 | ) | (8.0 | %) | ||
Business(1) | 3,007,993 | 3,154,934 | (146,941 | ) | (4.7 | %) | ||
Total | 6,257,732 | 6,688,666 | (430,934 | ) | (6.4 | %) | ||
NAS NET LOSSES | ||||||||
Residential | (283,993 | ) | (278,124 | ) | (5,869 | ) | (2.1 | %) |
Business(1) | (131,415 | ) | (160,310 | ) | 28,895 | 18.0 | % | |
Total | (415,408 | ) | (438,434 | ) | 23,026 | 5.3 | % |
| (1) | Our 2016 business NAS subscriber base reflects a beginning of period adjustment to reduce the number of subscribers by 15,526 in order to align practices as a result of the integration of Bell Aliant. |
NAS net losses decreased by 5.3% in 2016, compared to last year, resulting from lower business net losses, partially offset by higher residential net losses.
Residential NAS net losses grew by 2.1% in 2016, compared to 2015, as a result of aggressive competitive offers from cable TV providers, reduced pull-through due to fewer year-over-year IPTV activations and ongoing wireless and Internet-based technology substitution, partially offset by greater customer retention through the acquisition of three-product households.
Business NAS net losses improved by 18.0% in 2016, compared to last year, driven by fewer competitive losses in our large business market and lower customer deactivations in our small business market. This was offset in part by greater customer migrations to IP-based services, and reduced demand for new access lines in our large business market resulting from slow economic growth.
The annualized rate of NAS erosion in our customer base increased modestly from 6.2% in 2015 to 6.4% in 2016. At December 31, 2016, we had 6,257,732 NAS lines, compared to 6,688,666 NAS lines at the end of last year.
| Competitive landscape and industry trends |
COMPETITIVE LANDSCAPE
The financial performance of the overall Canadian wireline telecommunications market continues to be impacted by the ongoing declines in legacy voice service revenues resulting from technological substitution to wireless and OTT services, as well as by ongoing conversion to IP-based data services and networks by large business customers. Sustained aggressive competition from cable companies also continues to erode traditional telephone providers’ market share of residential local telephony. Canada’s four largest cable companies had over 4 million telephony subscribers at the end of 2016, representing a national residential market share of 43%. Other non-facilities-based competitors also offer local and long distance VoIP services and resell high-speed Internet services.
Competition for residential local and long distance services comes primarily from substitution to wireless services, including our own Bell Mobility and Virgin Mobile offerings. Approximately 33% of households in Ontario and Québec are estimated to be wireless only.
In 2016, cable companies continued to increase the speeds of their Internet offerings, while promoting aggressive customer acquisition offers. At the end of 2016, the four largest cable companies had approximately 6.5 million Internet subscribers, representing 54% of the total Internet market based on publicly reported data(1), while incumbent local exchange carriers (ILECs) held the remaining 46% or 5.6 million subscribers. Although the residential Internet market is maturing, with over 88% penetration across Canada, subscriber growth is expected to continue over the next several years. In addition, Bell continues to make market share gains due to the expansion of our fibre-optic network, as well as the pull-through of subscribers from our IP-based Fibe TV service.
ILECs offering IPTV service grew their subscriber base by 10% in 2016 to reach 2.5 million customers, driven by enhanced service offerings, expanded network coverage and marketing and promotions focused on IPTV. This growth came at the expense of cable TV and DTH satellite TV subscriber losses. At the end of the year, Canada’s four largest cable companies had approximately 6 million TV subscribers, or a 55% market share, down two percentage points from 2015.
| (1) | Internet services provided by resellers are included as wholesale Internet subscribers for cable companies and ILECs. |
| 66 BCE Inc. 2016 ANNUAL REPORT | |||
| 5 | Business segment analysis Bell Wireline | MD&A | |
Competitors
- Cable TV providers offering cable TV, Internet and cable telephony services, including:
- Rogers in Ontario, New Brunswick, Newfoundland and Labrador
- Vidéotron in Québec
- Cogeco Cable Inc. (a subsidiary of Cogeco Inc.) (Cogeco) in Ontario and Québec
- Shaw in British Columbia, Alberta, Saskatchewan, Manitoba and Ontario
- Shaw Direct, providing DTH satellite TV service nationwide
- Eastlink in every province except Saskatchewan, where it does not provide cable TVand Internet service
- ILECs TELUS and MTS(1) provide local, long distance and IPTV services in various regions
- TELUS and Allstream Inc. provide wholesale products and services across Canada
- Various others (such as TekSavvy Solutions, Distributel, VMedia, and Vonage Canada(a division of Vonage Holdings Corp.) (Vonage)) offer resale or VoIP-based local, longdistance and Internet services
- OTT voice and video services such as Skype, Netflix and Amazon Prime Video
- Digital media streaming devices such as Apple TV, Roku and Google Chromecast
- Other Canadian ILECs and cable TV operators
- Substitution to wireless services, including those offered by Bell
- Business service solutions:
- Systems integrators such as CGI Group Inc., EDS (a division of HP Enterprise Services)and IBM
- Outsourcers and professional service firms
- Wholesale competitors include cable operators, domestic CLECs, U.S. or other international carriers for certain services, and electrical utility-based telecommunications providers
| Canadian market share
|
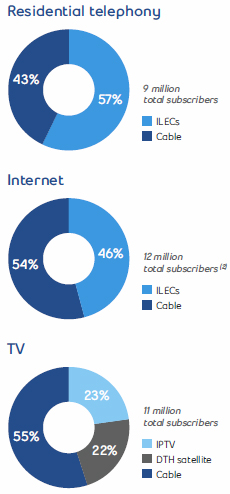
INDUSTRY TRENDS
INVESTMENT IN BROADBAND FIBRE DEPLOYMENT
The Canadian ILECs have made substantial investments in deploying broadband fibre within their territories. These investments have enabled the delivery of IPTV and high-speed Internet service in order to better compete with cable TV offerings in urban areas. IPTV is considered a superior video product to traditional cable TV, given innovative features that Bell has introduced, such as: a completely wireless installation in the home; wireless PVRs and receivers; Restart, which enables customers to rewind and watch TV shows already in progress from the beginning; Trending, which highlights in real time the five most-watched shows in the country and lets the user switch to watch them live or Restart from the beginning; as well as the integration of OTT services such as CraveTV and Netflix as apps directly on the PVR. FTTN enables speeds of up to 50 Mbps, while FTTP delivers broadband speeds of up to 1 Gbps (higher than any other technology) or faster in 2017 as equipment evolves to support these speeds. Going forward, ILECs are expected to maintain high levels of capital spending, primarily for the ongoing expansion of their broadband fibre networks, with an increasing emphasis on upgrading current FTTN networks to FTTP.
ALTERNATIVE TV AND OTT SERVICES
The growing popularity of watching TV anywhere is expected to continue as customers adopt services that enable them to view content on multiple screens, including computers, smartphones and tablets, as well as on their TVs. OTT content providers are competing for share of viewership and spending although, to date, these OTT services have not generally replaced existing TV services. However, to mitigate the threat of video substitution, TV and ISPs have launched customer-authenticated on-demand streaming services that provide programming content over mobile and Wi-Fi networks to smartphones, tablets and computers. Additionally, sports and live event programming are important differentiators for traditional TV providers as they face increasing competition from OTT content providers. As OTT offers become more compelling and consumers demand greater flexibility in choosing the content most relevant to them, the disconnection of and reduction in spending for traditional TV continues to rise. While this trend is increasing, it is anticipated that growth in Internet subscriptions and Internet-only households, as well as the introduction of direct-to-consumer on-demand streaming services by the incumbent wireline telecommunications and cable companies, will help to offset the decline in TV as OTT video increases the value of broadband Internet.
WIRELESS SUBSTITUTION
Wireless substitution is the most significant driver of residential NAS losses and wireline voice revenue declines for telecommunications companies. Wireless-only households were estimated to represent approximately 33% of households in Ontario and Québec at the end of 2016, compared to approximately 29% at the end of 2015. To mitigate the impact of wireless substitution, wireline service providers have been packaging voice services with Internet and TV and offering discounted triple-play bundles. Wireless substitution is expected to continue to steadily increase in 2017.
| (1) | BCE expects to complete the acquisition of MTS on March 17, 2017. See section 1.3,Key corporate developments, for more details. |
| (2) | Internet services provided by resellers are included as wholesale Internet subscribers for cable companies and ILECs. |
BCE Inc. 2016 ANNUAL REPORT 67 | |||
| 5 | Business segment analysis Bell Wireline | MD&A | |
ADOPTION OF IP-BASED SERVICES
The convergence of IT and telecommunications, facilitated by the ubiquity of IP, continues to shape competitive investments for business customers. Telecommunications companies are providing professional and managed services, as well as other IT services and support, while IT service providers are bundling network connectivity with their software as service offerings. In addition, manufacturers continue to bring all-IP and converged (IP plus legacy) equipment to market, enabling ongoing migration to IP-based solutions. The development of IP-based platforms, which provide combined IP voice, data and video solutions, creates potential cost efficiencies that compensate, in part, for reduced margins resulting from the continuing shift from legacy to IP-based services. The evolution of IT has created significant opportunities for our business markets services, such as cloud services and data hosting, that can have a greater business impact than traditional telecommunications services.
| Business outlook and assumptions |
2017 OUTLOOK
We expect a third consecutive year of positive wireline adjusted EBITDA growth in 2017, despite the negative financial impact of regulatory rulings from 2016 regarding Internet tariffs for aggregated wholesale high-speed access services and customer refunds for cancelled services. This is being enabled by a stronger projected revenue performance trajectory that reflects continued broadband Internet and IPTV subscriber growth as we continue to expand our FTTH service footprint, annual residential price increases, improvement in our overall business markets performance supported by the acquisition of Q9, cost reductions to counter competitive re-pricing pressures, the ongoing decline in voice revenues and reduced telecom spending by large enterprise customers in a slow economy, as well as the incremental financial contribution from the completion of the acquisition of MTS by BCE.
TV subscriber growth within our wireline footprint is expected to be driven by continued strong customer adoption of Fibe TV as we increase penetration of existing IPTV-enabled neighbourhoods and drive ongoing innovation in IPTV services. We also intend to seek greater penetration within the multiple-dwelling units (MDU) market, capitalize on our extensive retail distribution network, and leverage our market leadership position in HD and 4K programming and on-demand streaming services to drive incremental subscriber growth and higher revenue per household. However, we expect satellite TV net customer losses to continue in 2017, due to cable competitors’ targeted acquisition offers in areas where Fibe TV service is not available and lower wholesale net activations driven by the roll-out of IPTV services by other competing providers in Western Canada.
Planned Internet subscriber growth in 2017 is expected to be driven by IPTV product superiority and resulting Internet pull-through, increased FTTP coverage as we leverage the speed and reliability of our broadband Internet network and Internet product innovation. This is expected to have an associated positive impact on ARPU growth and customer churn.
In wireline business, the ongoing economy-related and competitive market challenges, together with continued customer migration to IP-based systems, will likely continue to negatively impact our overall business markets results in 2017. We intend on seeking to minimize the overall revenue decline from legacy services by leveraging our market position to develop unique services and value enhancements. We intend to use marketing initiatives seeking to slow NAS erosion, while investing in new solutions in key portfolios such as Internet and private networks, data centre and cloud services, unified communications, and security services. We will continue to deliver network-centric managed and professional services solutions to large and mid-sized businesses that increase the value of connectivity services. Moreover, our acquisition of Q9 in October 2016 strengthens our national leadership in data hosting, managed services and cloud computing solutions, allowing us to capture full financial benefits, while enhancing our ability to achieve a higher pull-through of connectivity revenues.
We also expect to experience sustained competitive intensity in our mass and mid-sized business markets as cable operators and other telecom competitors maintain their focus on these customer segments. We also intend to introduce service offerings that help drive innovative solutions and value for our mass and mid-sized customers by leveraging Bell’s network assets, broadband fibre expansion and service capabilities to expand our relationships with them. We will maintain a focus on overall profitability by seeking to increase revenue per customer and customer retention, as well as through improving our processes to achieve further operating efficiencies and productivity gains.
Operating cost reduction will continue to be a key focus for our Bell Wireline segment, helping to offset costs related to the growth and retention of IPTV, Internet, IP broadband and hosted IP voice subscribers, the ongoing erosion of high-margin wireline voice and other legacy revenues, competitive repricing pressures in our business and wholesale markets, as well as the negative financial impact of regulatory rulings from 2016. This, combined with further service-level improvements and operating synergies from the integration of MTS following the completion of the acquisition by BCE, is expected to support our objective of maintaining our consolidated adjusted EBITDA margin relatively stable year over year.
We also plan to maintain significant capital investment in broadband infrastructure, fibre expansion and upgrades to support our IPTV and residential Internet services, as well as new business solutions in key portfolios such as Internet and private networks, data centre and cloud services, unified communications and security services. We intend to pursue pricing methods that will assist us in covering the capital costs of upgrading our networks, providing new services and expanding capacity to meet growing data consumption.
ASSUMPTIONS
- Positive full-year adjusted EBITDA growth
- Continued growth in residential IPTV and Internet subscribers
- Increasing wireless and Internet-based technological substitution
- Residential services household ARPU growth from increasedpenetration of multi-product households and price increases
- Aggressive residential service bundle offers from cable TVcompetitors in our local wireline areas
- Continued large business customer migration to IP-based systems
- Ongoing competitive repricing pressures in our business andwholesale markets
- Continued competitive intensity in our small and mid-sizedbusiness markets as cable operators and other telecomcompetitors continue to intensify their focus on businesscustomers
| 68 BCE Inc. 2016 ANNUAL REPORT | |||
| 5 | Business segment analysis Bell Wireline | MD&A | |
- Growing consumption of OTT TV services and on-demandstreaming video, as well as the proliferation of devices, such astablets, that consume vast quantities of bandwidth, will requireconsiderable ongoing capital investment
- TV unbundling will not materially accelerate the downsizing of TVpackages by customers
- Realization of cost savings related to management workforceattrition and retirements, lower contracted rates from oursuppliers, reduction of traffic that is not on our network andoperating synergies from the planned integration of MTSfollowing the completion of the acquisition by BCE
- Softer wholesale financial performance due to a CRTC decision inOctober 2016 that significantly lowered capacity-based billingrates for aggregated wholesale high-speed Internet accessservices
- No other changes in regulations affecting our wireline businesshaving material financial, operational or competitiveconsequences
| Key growth drivers |
- Expanding FTTP footprint
- Increasing IPTV penetration of households
- Higher market share of industry TV and Internet subscribers
- Greater penetration of multi-product households
- Improved residential customer retention
- Increased business customer spending on connectivity servicesand managed and professional services solutions, as well asgreater new business formation as the economy strengthens andemployment rates improve
- Expansion of our business customer relationships to drive higherrevenue per customer
- Ongoing service innovation and product value enhancements
| Principal business risks |
This section discusses certain principal business risks which specifically affect the Bell Wireline segment. For a detailed description of the principal risks that could have a material adverse effect on our business, refer to section 9,Business risks.
AGGRESSIVE COMPETITION RISK
POTENTIAL IMPACT
| REGULATORY ENVIRONMENT RISK
POTENTIAL IMPACT
| CHANGING CUSTOMER BEHAVIOUR RISK
POTENTIAL IMPACT
|
BCE Inc. 2016 ANNUAL REPORT 69 | |||
| 5 | Business segment analysis Bell Media | MD&A | |
| 5.3 Bell Media |
Bell Media generated revenue and adjusted EBITDA growth in 2016, driven by the national expansion of TMN, continued growth in CraveTV and growth in outdoor advertising, even as operating costs grew due to increased costs for sports broadcast rights and content investments that support TV and on-demand programming.
| Key elements of relevant strategic imperatives |

2016 PROGRESS
- Maintained CTV’s #1 ranking as the most-watched networkin Canada for the 15th year in a row, and continued to lead witha majority of the top 20 programs nationally in all keydemographics
- Launched TMN as a national pay TV service and became the soleoperator of HBO Canada
- Launched CraveTV direct to consumers as a standalone productavailable to all Canadians with an Internet subscription. Wecontinued to grow the viewership and scale of our streamingvideo service, surpassing one million subscribers in 2016
- As of October 24, 2016, both new and returning SHOWTIMEprograms debut on CraveTV at the same time as their U.S.broadcast premieres, bolstering the amount of exclusive,first-run programming on CraveTV
- Streamed CraveTV’s first ever original series, LETTERKENNY,which had the biggest debut of any series on CraveTV since theservice launched in 2014 and has eclipsed its own Season 1record with the launch of Season 2 on Christmas Day
- Concluded a deal with MGM to license the iconic James BondCatalogue, spanning more than 50 years and every 007 actor
- Made CraveTV available for in-app purchase on Apple TV,enabling customers to subscribe directly from their iTunesaccount
- Launched iHeartRadio, North America’s fastest growing digitalaudio service, to the public, providing Canadians with instantaccess to all of Bell Media’s 105 radio stations across the countryplus more than 100 additional exclusive, digital streamingchannels featuring every musical genre as well as news/talk,sports and comedy
- Accelerated 4K Ultra HD production and broadcasting with agrowing number of live event and sports broadcasts in 4K
- TSN became the first broadcaster to produce a live 4K Ultra HDbroadcast in North America with the Toronto Raptors vs. BostonCeltics basketball game on January 20, 2016.
- CTV’s broadcast of the 2016 Juno Awards was the first liveawards show in North America to be produced in 4K
- TSN’s five national feeds featured several Toronto Raptors,Toronto Maple Leafs and Ottawa Senators games in 4K, as wellas The Masters and the UEFA Champions League Final
- The iHeartRadio MuchMusic Video Awards was filmed andbroadcast in 4K
- Discovery Canada’s premium video streaming service DiscoveryGO offered a growing inventory of titles available in 4K
- All new TV series commissioned for Bell Media’s networks areproduced in 4K
- Extended a broadcast agreement with the IIHF to 2023. TSN andRDS hold exclusive multimedia rights for the IIHF Ice Hockey WorldChampionship.
- Concluded a multi-title, multi-year exclusive streaming deal withWarner Bros. International Television for the Canadian marketthat delivers some of the most-watched shows to CraveTV
- Expanded a licensing agreement with Viacom International MediaNetworks to make Comedy Central original programming andlibrary of scripted and unscripted series and specials availableacross multiple platforms in Canada, including CraveTV
- Concluded a licensing agreement with CBS Studios Internationalto be the exclusive home for the new STAR TREK series in Canada.The series will premiere on CTV and then move to Space for theduration of its run, and will also become available on CraveTV
- Launched a food and lifestyle specialty channel featuring theestablished Gusto brand and its exclusive portfolio of originalCanadian programming, all in 4K. Gusto features cooking, homedesign, fashion, travel and lifestyle programming
- Acquired Métromédia, allowing Astral OOH to expand itsadvertising assets in the public transit market
- Astral OOH secured advertising rights for both in-terminal andnon-terminal concessions across Toronto Pearson InternationalAirport, becoming Canada’s airport advertising leader with apresence in six Canadian international airports, including HalifaxStanfield, Montréal-Pierre Elliott Trudeau, Québec City JeanLesage, Ottawa Macdonald-Cartier and Vancouver International.
2017 FOCUS
- Maintain strong audience levels and ratings across all TV andradio properties
- Reinforce industry leadership in conventional TV, pay TV, sportsmedia and radio
- In January 2017, we concluded a multi-year media rights extension with Major League Soccer, making Bell Media Canada’s exclusive English-language broadcaster of MLS
- Grow viewership and scale of CraveTV on-demand TV streamingservice
- Develop in-house production and content creation for distributionand use across all platforms and screens
- Expand live and on-demand content through TV Everywhereservices
| 70 BCE Inc. 2016 ANNUAL REPORT | |||
| 5 | Business segment analysis Bell Media | MD&A | |
- Build on our OOH leadership position in Canada
- In January 2017, we acquired Cieslok Media, which specializes in large-format outdoor advertising in key urban areas, allowing Astral OOH to expand its digital presence with 120 high-profile displays in Vancouver, Edmonton, Calgary, Montréal and Toronto, including Canada’s largest multimedia billboards at Yonge-Dundas Square
- Grow French media properties
- Leverage cross-platform and integrated sales and sponsorship

2016 PROGRESS
- Executed on labour savings from workforce reductions undertaken in 2015
2017 FOCUS
- Continue to execute on labour savings from workforce reductions
| Financial performance analysis |
2016 PERFORMANCE HIGHLIGHTS
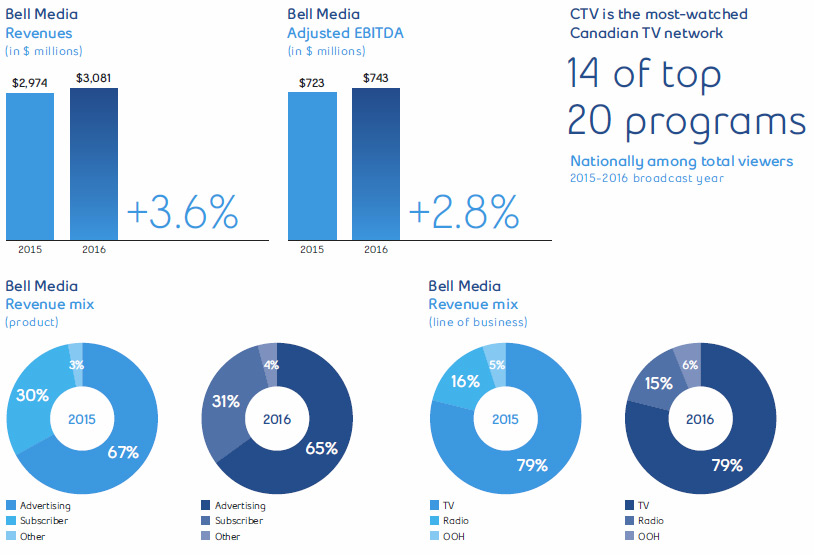
BELL MEDIA RESULTS
REVENUES
| 2016 | 2015 | $ CHANGE | % CHANGE | ||||
Total external revenues | 2,685 | 2,635 | 50 | 1.9 | % | |||
Inter-segment revenues | 396 | 339 | 57 | 16.8 | % | |||
Total Bell Media revenues | 3,081 | 2,974 | 107 | 3.6 | % |
Bell Media operating revenues increased by 3.6% in 2016, compared to the previous year, driven by higher subscriber revenues, offset in part by lower advertising revenues.
Subscriber revenues were up in 2016, compared to last year, mainly due to Bell Media’s expansion of TMN into a national pay TV service in March 2016, higher revenues from CraveTV driven by rate increases combined with the favourable impact of our direct-to-consumer launch in January 2016 and the growth from our TV Everywhere GO products.
BCE Inc. 2016 ANNUAL REPORT 71 | |||
| 5 | Business segment analysis Bell Media | MD&A | |
Advertising revenues decreased in 2016, compared to 2015, reflecting:
- Lower conventional TV advertising revenues due to a softadvertising market, the non-recurrence of revenues generated inthe second half of last year from the 2015 Federal Election and theshift in advertising dollars to the principal broadcaster of theRio 2016 Summer Olympic Games
- A decline in radio advertising revenues driven by market softness
This was partly offset by:
- An increase in OOH advertising revenues as a result of the Métromédia acquisition in January 2016 and the favourable impact of new contract wins in 2016
OPERATING COSTS AND ADJUSTED EBITDA
| 2016 | 2015 | $ CHANGE | % CHANGE | ||||
Operating costs | (2,338 | ) | (2,251 | ) | (87 | ) | (3.9 | %) |
Adjusted EBITDA | 743 | 723 | 20 | 2.8 | % | |||
Adjusted EBITDA margin | 24.1 | % | 24.3 | % | (0.2 | %) |
Bell Media operating costs increased by 3.9% in 2016, compared to last year, driven by higher content costs related to sports broadcast rights, the TMN national expansion and continued ramp-up in CraveTV content, as well as by an increase in expenses associated with the Métromédia acquisition and newly awarded contracts in OOH. This was mitigated in part by lower labour costs as a result of the 2015 workforce reduction initiative.
Bell Media adjusted EBITDA increased by 2.8% in 2016, compared to the previous year, as a result of higher revenues and lower labour costs, partially offset by higher content and programming costs.
BELL MEDIA OPERATING METRICS
- CTV maintained its #1 ranking as the most-watched networkin Canada for the 15th year in a row, and continued to lead witha majority of the top 20 programs nationally in all keydemographics
- Bell Media’s English specialty and pay TV properties reached83% of all Canadian English specialty and pay TV viewers on anaverage weekly basis in 2016. Discovery channel continued tohave the top entertainment specialty position in full day audiencelevels, among the key viewers aged 25 to 54.
- In Québec, Bell Media maintained its leadership position in theFrench specialty market, reaching 78% of French-language TVviewers in the average week. Three of the top five specialtychannels among the key viewers aged 25 to 54 were Bell Mediaproperties (RDS, Super Écran and Canal D).
- Bell Media continued to rank first in digital media among Canadianbroadcast and video network competitors, with 18.2 million uniquevisitors per month, reaching 60% of the digital audience
- Bell Media remained Canada’s top radio broadcaster, reaching17.1 million listeners who spent 77 million hours tuned in each weekduring 2016
- Astral AOOH is a key player in the market with an offering offive innovative product lines and more than 30,000 advertisingfaces located coast to coast, from Halifax to Vancouver, andstrategic sites in Montréal, Ottawa, Toronto, Vancouver, Calgaryand Edmonton
| Competitive landscape and industry trends |
COMPETITIVE LANDSCAPE
The Canadian media industry is highly competitive, with competitors having significant scale and financial resources. In recent years, there has been increased consolidation of traditional media assets across the Canadian media landscape. The majority of players have become more vertically integrated to better enable the acquisition and monetization of premium content. Global aggregators have also emerged and are competing for both content and viewers.
Bell Media competes in the TV, radio and OOH advertising markets:
- TV: The TV market has become increasingly fragmented and thistrend is expected to continue as new services and technologiesincrease the diversity of information and entertainment outletsavailable to consumers
- Radio: Competition within the radio broadcasting industry occursprimarily in discrete local market areas among individual stations
- OOH: The Canadian OOH advertising industry is fragmented,consisting of a few large companies as well as numerous smallerand local companies operating in a few local markets
Consumers continue to shift their media consumption towards digital and online media, mobile devices and on-demand content. This has caused new business models to emerge and advertisers to shift more of their spending to digital and online rather than traditional media. In addition, the number of competitors has increased as more digital and online media companies, as well as large global companies, enter the market.
Access to live sports and other premium content has become even more important for acquiring and retaining audiences that in turn attract advertisers and subscribers. Ownership of content and/or long-term agreements with content owners has, therefore, also become increasingly important to media companies.
| 72 BCE Inc. 2016 ANNUAL REPORT | |||
| 5 | Business segment analysis Bell Media | MD&A | |
Competitors
TV
- Conventional Canadian TV stations (local and distant signals) and specialty and paychannels, such as those owned by Corus Entertainment Inc. (Corus), Rogers, QuébecorMedia Inc. (Québecor), Canadian Broadcasting Corporation (CBC)/Société Radio-Canada (SRC) and Groupe V
- U.S. conventional TV stations and specialty channels
- OTT streaming providers such as Netflix and Amazon Prime Video
- Video-sharing websites such as YouTube
RADIO
- Large radio operators, such as Rogers, Corus, Cogeco and Newcap Inc. (Newcap)that also own and operate radio station clusters in various local markets
- Radio stations in specific local markets
- Satellite radio provider SiriusXM
- Music streaming services such as Spotify, Apple Music and Google Play Music
- Music downloading services such as Apple’s iTunes Store
- Other media such as newspapers, local weeklies, TV, magazines, outdoor advertisingand the Internet
OOH ADVERTISING
- Large outdoor advertisers, such as Jim Pattison Broadcast Group (Pattison),Outfront Media, Québecor, Dynamic and Clear Channel Outdoor
- Numerous smaller and local companies operating a limited number of display facesin a few local markets
- Other media such as TV, radio, print media and the Internet
| Canadian market share
(1) Broadcast year-end at August 31, 2016, 2+ age category, Fall 2016 for radio |
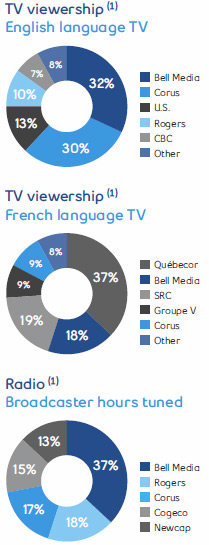
INDUSTRY TRENDS
TECHNOLOGY AND CONSUMER HABITS TRANSFORMING THE WAY TV IS DELIVERED
Technology used in the media industry continues to evolve rapidly, which has led to alternative methods for the distribution, storage and consumption of content. These technological developments have driven and reinforced changes in consumer behaviour as consumers seek more control over when, where and how they consume content. For example, consumer electronics innovations have enabled consumers to view content on TVs, computers, tablets, smartphones and other mobile electronic devices. The number of Canadian users who are connected to the Internet through their TVs is growing as connection becomes easier and more affordable. Changes in technology and consumer behaviour have resulted in a number of challenges for content aggregators and distributors. These technological developments may disrupt traditional distribution platforms by enabling content owners to provide content directly to distributors and consumers, thus bypassing traditional content aggregators.
GROWTH OF ALTERNATIVES TO TRADITIONAL LINEAR TV
Consumers have improved access to online entertainment and information alternatives that did not exist a few years ago. While traditional linear TV was the only way to access entertainment programming in the past, many consumers now watch TV in non-traditional ways for at least a portion of their viewing. In particular, today’s viewers are consuming more content online, watching less scheduled programming live, time-shifting original broadcasts through PVRs, viewing more TV on mobile devices, and catching up on past programming on-demand. In addition, many consumers are spending considerable time viewing online alternatives to traditional TV. This is evident in the growing number and popularity of OTT video services like Netflix and Amazon Prime. To date, these OTT services have largely complemented existing TV services. Media companies are evolving their content and launching their own solutions to better compete with these non-traditional offerings through services such as Bell Media’s CraveTV on-demand TV streaming service and authenticated TV Everywhere services such as CTV GO, TSN GO, RDS GO, Discovery GO and TMN GO.
ESCALATING CONTENT COSTS AND SHIFTS IN ADVERTISING
Viewership and usage trends suggest that online and mobile Internet video consumption is increasing rapidly. Changing content consumption patterns and growth of alternative content providers could exert downward pressure on advertising revenues for traditional media broadcasters. However, premier content, live sports and special events should continue to draw audiences and advertisers, which is expected to result in pricing pressure on future broadcasting rights. Growing interest in 4K content could also drive additional programming acquisition and production costs. Additionally, while access to premium content has become increasingly important to media companies in attracting viewers and advertisers, there is now increased competition for these rights from global competitors, including Netflix and Amazon Prime Video. This has resulted in higher TV program rights costs, which is a trend that is expected to continue into the future.
BCE Inc. 2016 ANNUAL REPORT 73 | |||
| 5 | Business segment analysis Bell Media | MD&A | |
| Business outlook and assumptions |
2017 OUTLOOK
Bell Media’s financial results in 2017 are expected to be positively impacted by the incremental contribution from the national expansion of our English-language pay TV service (TMN) in the first quarter of 2016, further growth in CraveTV and higher outdoor advertising revenue at Astral OOH from contract wins and the acquisition of Cieslok Media in January 2017. These factors are anticipated to offset higher content costs to secure TV programming, continued CraveTV investment and the financial impact of TV cord shaving and cord cutting. We also intend to continue carefully managing costs by leveraging assets, achieving productivity gains and pursuing operational efficiencies across all of our media properties, while continuing to invest in premium content across all screens and platforms.
While the advertising market is expected to remain soft in 2017, we anticipate that the strength of our programming, strong outdoor advertising growth supported by numerous contract wins in 2016 and the acquisition of Cieslok Media, as well as the recapture of advertising revenue following a shift in Q3 2016 to the main broadcaster of the Rio 2016 Summer Olympic Games, will offset some advertising pressure including the impact of the CRTC’s decision to eliminate simultaneous substitution for the NFL Super Bowl. Subscriber fee revenues are projected to increase, driven by CraveTV subscriber growth and a full-year contribution from the national expansion of TMN, which should help moderate potential declines in specialty TV due to the industry-wide introduction of TV unbundling in 2016.
In conventional TV, we intend to leverage the strength of our market position to continue offering advertisers, both nationally and locally, premium opportunities to reach their target audiences. Success in this area requires that we focus on a number of factors, including: successfully acquiring highly-rated programming and differentiated content; building and maintaining strategic supply arrangements for content across all screens and platforms; and producing and commissioning high-quality Canadian content, including market-leading news.
Our sports specialty TV offerings are expected to continue to deliver premium content and exceptional viewing experiences to our viewers. Investment in 4K content, combined with the integration of our digital platforms, are integral parts of our strategy to enhance viewership and engagement. Contractual price increases for strategic sports properties, along with planned new investments, are the principal factors driving continued increases in sports rights costs. We will also continue to focus on creating innovative high-quality productions in the areas of sports news and editorial coverage.
In non-sports specialty TV, audiences and advertising revenues are expected to be driven by investment in quality programming and production, including the recent launch of our new food and lifestyle channel, Gusto. As part of our objective to drive revenue growth, we intend to capitalize on our leading position in key specialty services to improve both channel strength and channel selection.
In pay TV, we will continue to leverage our investments in premium content (including HBO and SHOWTIME) in order to attract subscribers.
In our French-language pay and specialty services, we will continue to optimize our programming to increase our appeal to audiences.
In radio, we intend to leverage the strength of our market position to continue offering advertisers, both nationally and locally, premium opportunities to reach their target audiences. We also plan to leverage our recently-launched iHeartRadio digital service in Canada to showcase content from our 105 licensed radio stations and more than 100 curated music streams. Additionally, in conjunction with our local TV properties, we will continue to pursue opportunities that leverage our promotional capabilities, provide an expanded platform for content sharing, and offer synergistic co-location and efficiencies.
In our OOH operations, we plan to leverage the strength of our products and recent contract wins to provide advertisers with premium opportunities in key Canadian markets. We will also continue to seek new opportunities in digital markets, including integrating and leveraging our recent Cieslok Media acquisition.
ASSUMPTIONS
- Higher year-over-year revenue, reflecting further CraveTVsubscriber growth, TMN’s national expansion that began inMarch 2016, and growth in outdoor advertising supported byacquisitions and new contract wins
- Operating cost growth driven by higher TV programming andsports broadcast rights costs, as well as continued investmentin CraveTV content
- Continued scaling of CraveTV
- Ability to successfully acquire and produce highly ratedprogramming and differentiated content
- Building and maintaining strategic supply arrangements forcontent across all screens and platforms
- Increased revenue generation from monetization of content rightsand Bell Media properties across all platforms
- TV unbundling and growth in OTT viewing expected to resultin moderately lower subscriber levels for many Bell MediaTV properties
- No material financial, operational or competitive consequencesof changes in regulations affecting our media business
| 74 BCE Inc. 2016 ANNUAL REPORT | |||
| 5 | Business segment analysis Bell Media | MD&A | |
| Key growth drivers |
- Stronger economic growth that drives increased advertiser demand and spending, particularly in the key automotive, entertainment equipment, telecommunications and consumer goods sectors
- Higher audience levels from strong ratings being maintainedacross all TV and radio properties, as well as from securingmulti-platform rights
- Investing in the best content, including more in-house productions
| Principal business risks |
This section discusses certain principal business risks specifically related to the Bell Media segment. For a detailed description of the principal risks that could have a material adverse effect on our business, refer to section 9,Business risks.
AGGRESSIVE COMPETITION AND REGULATORY CHANGES RISK
POTENTIAL IMPACT
| ADVERTISING REVENUE UNCERTAINTY RISK
POTENTIAL IMPACT
| RISING CONTENT COSTS AND ABILITY TO SECURE KEY CONTENT RISK
POTENTIAL IMPACT
|
BCE Inc. 2016 ANNUAL REPORT 75 | |||
| 6 | Financial and capital management | MD&A | |
| 6 Financial and capital management |
This section tells you how we manage our cash and capital resources to carry out our strategy and deliver financial results. It provides an analysis of our financial condition, cash flows and liquidity on a consolidated basis.
| 6.1 Net debt |
| DECEMBER 31, 2016 | DECEMBER 31, 2015 | $ CHANGE | % CHANGE | ||||
Debt due within one year | 4,887 | 4,895 | (8 | ) | (0.2 | %) | ||
Long-term debt | 16,572 | 15,390 | 1,182 | 7.7 | % | |||
Preferred shares(1) | 2,002 | 2,002 | – | – | ||||
Cash and cash equivalents | (853 | ) | (613 | ) | (240 | ) | (39.2 | %) |
Net debt | 22,608 | 21,674 | 934 | 4.3 | % |
| (1) | 50% of outstanding preferred shares of $4,004 million in 2016 and 2015 are classified as debt consistent with the treatment by some credit rating agencies. |
The increase of $1,174 million in debt due within one year and long-term debt was due to:
- the issuances of Series M-41 MTN, M-42 MTN and M-43 MTNdebentures at Bell Canada with total principal amountsof $750 million, $850 million and $650 million, respectively
- an increase in our notes payable (net of repayments)of $991 million
Partly offset by:
- the early debt redemption of Series M-18 MTN, M-19 MTN,M-23 MTN and M-32 debentures in the principal amounts of$700 million, $200 million, $500 million and $500 million,respectively
- the repayment of Series M-38 debentures in the principalamount of $150 million at Bell Canada
- a net decrease of $17 million in our finance lease obligationsand other debt
The increase in cash and cash equivalents of $240 million was due mainly to:
- $3,226 million of free cash flow
- $719 million of debt issuances (net of repayments)
- $107 million decrease in investments which includes proceedsreceived from one of our equity investments from the saleof a portion of its operations
Partly offset by:
- $2,305 million of dividends paid on BCE common shares
- $517 million loan to Q9, a related party
- $404 million paid for business acquisitions mainly related to thenational expansion of HBO Canada and TMN ($197 million, netof $21 million paid in 2015) and $170 million ($158 million, net of cashon hand) consideration paid for the acquisition of Q9 Networks Inc.
- $400 million voluntary DB pension plan contribution
- $126 million acquisition and other costs paid
- $106 million for the purchase on the open market of sharesfor the settlement of share-based payments
| 6.2 Outstanding share data |
COMMON SHARES OUTSTANDING | NUMBER OF SHARES | |
Outstanding, January 1, 2016 | 865,614,188 | |
Shares issued under employee stock option plan | 2,236,891 | |
Shares issued under dividend reinvestment plan | 688,839 | |
Shares issued under employee savings plan (ESP) | 2,166,414 | |
Outstanding, December 31, 2016 | 870,706,332 |
STOCK OPTIONS OUTSTANDING | NUMBER OF OPTIONS | WEIGHTED AVERAGE EXERCISE PRICE ($) | ||
Outstanding, January 1, 2016 | 9,666,904 | $48 | ||
Granted | 2,968,062 | $58 | ||
Exercised(1) | (2,236,891 | ) | $44 | |
Forfeited | (155,913 | ) | $52 | |
Outstanding, December 31, 2016 | 10,242,162 | $52 | ||
Exercisable, December 31, 2016 | 1,786,251 | $42 |
| (1) | The weighted average share price for options exercised in 2016 was $59. |
At March 2, 2017, 871,068,816 common shares and 12,887,915 stock options were outstanding.
| 76 BCE Inc. 2016 ANNUAL REPORT | |||
| 6 | Financial and capital management | MD&A | |
| 6.3 Cash flows |
| 2016 | 2015 | $ CHANGE | % CHANGE | ||||
Cash flows from operating activities | 6,643 | 6,274 | 369 | 5.9 | % | |||
Capital expenditures | (3,771 | ) | (3,626 | ) | (145 | ) | (4.0 | %) |
Cash dividends paid on preferred shares | (126 | ) | (150 | ) | 24 | 16.0 | % | |
Cash dividends paid by subsidiaries to non-controlling interest | (46 | ) | (41 | ) | (5 | ) | (12.2 | %) |
Acquisition and other costs paid | 126 | 292 | (166 | ) | (56.8 | %) | ||
Voluntary DB pension plan contribution | 400 | 250 | 150 | 60.0 | % | |||
Free cash flow | 3,226 | 2,999 | 227 | 7.6 | % | |||
Business acquisitions | (404 | ) | (311 | ) | (93 | ) | (29.9 | %) |
Acquisition and other costs paid | (126 | ) | (292 | ) | 166 | 56.8 | % | |
Voluntary DB pension plan contribution | (400 | ) | (250 | ) | (150 | ) | (60.0 | %) |
Business dispositions | 18 | 409 | (391 | ) | (95.6 | %) | ||
Decrease in investments | 107 | 11 | 96 | n.m. | ||||
Acquisition of spectrum licences | (1 | ) | (535 | ) | 534 | 99.8 | % | |
Loan to related party | (517 | ) | – | (517 | ) | – | ||
Other investing activities | (16 | ) | (62 | ) | 46 | 74.2 | % | |
Net issuance (repayment) of debt instruments | 719 | (510 | ) | 1,229 | n.m. | |||
Issue of common shares | 99 | 952 | (853 | ) | (89.6 | %) | ||
Common shares issuance cost | – | (35 | ) | 35 | 100.0 | % | ||
Repurchase of shares for settlement of share-based payments | (106 | ) | (138 | ) | 32 | 23.2 | % | |
Cash dividends paid on common shares | (2,305 | ) | (2,169 | ) | (136 | ) | (6.3 | %) |
Other financing activities | (54 | ) | (22 | ) | (32 | ) | n.m. | |
Net increase in cash and cash equivalents | 240 | 47 | 193 | n.m. |
n.m.: not meaningful
| Cash flows from operating activities and free cash flow |
In 2016, BCE’s cash flows from operating activities increased $369 million, compared to 2015, due mainly to higher adjusted EBITDA, lower acquisition and other costs paid and lower income taxes paid, partly offset by a higher voluntary DB pension plan contribution made in 2016.
Free cash flow available to BCE’s common shareholders increased $227 million in 2016 due to higher cash flows from operating activities, partly offset by higher capital expenditures.
| Capital expenditures |
| 2016 | 2015 | $ CHANGE | % CHANGE | ||||
Bell Wireless | 733 | 716 | (17 | ) | (2.4 | %) | ||
Capital intensity ratio | 10.2 | % | 10.4 | % | 0.2 | % | ||
Bell Wireline | 2,936 | 2,809 | (127 | ) | (4.5 | %) | ||
Capital intensity ratio | 24.3 | % | 22.9 | % | (1.4 | %) | ||
Bell Media | 102 | 101 | (1 | ) | (1.0 | %) | ||
Capital intensity ratio | 3.3 | % | 3.4 | % | 0.1 | % | ||
BCE | 3,771 | 3,626 | (145 | ) | (4.0 | %) | ||
Capital intensity ratio | 17.4 | % | 16.9 | % | (0.5 | %) |
BCE capital expenditures totalled $3,771 million for 2016 representing an increase of 4.0%, compared to last year, driven by greater spending in our Bell Wireline and Bell Wireless segments. Capital expenditures as a percentage of revenue (capital intensity ratio) was 17.4% in 2016, compared to 16.9% in 2015. The year-over-year increase in capital expenditures reflected:
- Higher wireline capital investment of $127 million compared to last year, due to our ongoing rollout of broadband fibre directly to more homes and businesses, including the build-out of Gigabit Fibe infrastructure in the city of Toronto and other urban areas. This was moderated by the slower pace of expansion of our IPTV service footprint in Québec and Ontario.
BCE Inc. 2016 ANNUAL REPORT 77 | |||
| 6 | Financial and capital management | MD&A | |
- Higher wireless capital spending of $17 million compared to 2015, reflecting our continued investment in the expansion of our 4G LTE mobile network as well as our LTE-A network which reached 73% of the Canadian population at December 31, 2016. The ongoing investment to increase network capacity to support our growing customer base and accommodate higher speeds and greater data consumption also contributed to the increased spending.
| Voluntary DB pension plan contribution |
In 2016, we made a voluntary contribution of $400 million, compared to a voluntary contribution of $250 million in 2015, to fund our post-employment benefit obligation. The voluntary contributions were funded from cash on hand at the end of 2016 and 2015 and will reduce the amount of BCE’s future pension funding obligations.
| Business acquisitions |
On October 3, 2016, BCE acquired the remaining 64.6% of the issued and outstanding shares of Q9 that it did not already own for a total cash consideration of approximately $170 million ($158 million, net of cash on hand).
In Q1 2016, BCE completed a transaction with Corus under which Corus waived its HBO content rights in Canada and ceased operations of its Movie Central and Encore Avenue pay TV services in Western and Northern Canada, thereby allowing Bell Media to become the sole operator of HBO Canada nationally across all platforms and to expand TMN into a national pay TV service. TMN was successfully launched nationally on March 1, 2016. BCE paid to Corus a total consideration of $218 million, of which $21 million was paid in 2015.
Subsequent to year end, on January 3, 2017, BCE acquired all of the issued and outstanding common shares of Cieslok Media for a total cash consideration of $161 million.
On May 20, 2015, BCE completed the acquisition of all of Glentel’s issued and outstanding common shares for a total consideration of $592 million, of which $296 million ($284 million net of cash on hand) was paid in cash and the balance through the issuance of 5,548,908 BCE common shares.
| Acquisition and other costs paid |
Acquisition and other costs of $292 million in 2015 related mainly to a charge of $142 million incurred for the payment in full satisfaction of the judgment rendered in a litigation claim for Satellite TV signal piracy.
| Business dispositions |
Business dispositions of $409 million in 2015 reflected BCE’s divestiture of 50% of its ownership interest in Glentel to Rogers for a total cash consideration of approximately $473 million ($407 million net of divested cash and transaction costs).
| Decrease in investments |
Decrease in investments of $107 million in 2016 included proceeds received from one of our equity investments from the sale of a portion of its operations.
| Acquisition of spectrum licences |
On April 21, 2015, Bell Mobility acquired AWS-3 wireless spectrum in key urban and rural markets as part of ISED’s AWS-3 spectrum auction. Bell Mobility acquired 13 licences for 169 million MHz-pop of AWS-3 spectrum for $500 million.
On May 12, 2015, Bell Mobility acquired an additional 243 million MHz-pop of 2500 MHz wireless spectrum for $29 million. This acquisition increased Bell Mobility’s 2500 MHz spectrum holdings in a number of urban and rural markets.
| Loan to a related party |
In 2016, prior to closing the acquisition of Q9 on October 3, 2016, Bell Canada provided a loan of $517 million to Q9 for the repayment of certain of its debt.
| 78 BCE Inc. 2016 ANNUAL REPORT | |||
| 6 | Financial and capital management | MD&A | |
| Debt instruments |
We use a combination of short-term and long-term debt to finance our operations. Our short-term debt consists mostly of notes payable under commercial paper programs, loans securitized by trade receivables and bank facilities. We usually pay fixed rates of interest on our long-term debt and floating rates on our short-term debt. As at December 31, 2016, all of our debt was denominated in Canadian dollars with the exception of one of our credit facilities and our commercial paper, which are denominated in U.S. dollars, all of which have been hedged for foreign currency fluctuations through forward currency contracts.
2016
We issued $719 million of debt, net of repayments. This included the issuance of Series M-41 MTN, M-42 MTN and M-43 MTN debentures at Bell Canada with principal amounts of $750 million, $850 million and $650 million, respectively, and the issuance (net of repayments) of $991 million of notes payable. These issuances were partly offset by the early debt redemption of Series M-18 MTN, M-19 MTN, M-23 MTN and M-32 debentures, with principal amounts of $700 million, $200 million, $500 million and $500 million, respectively, the repayment of Series M-38 debentures of $150 million and payments of finance leases and other debt of $472 million.
2015
We repaid $510 million of debt, net of issuances. This included the repayment of approximately $500 million of our unsecured committed term credit facility, redemption of Series M-21 MTN debentures at Bell Canada with a principal amount of $1 billion, a $474 million repayment of finance leases and other debt, and a $112 million repayment of Glentel’s outstanding debt. These repayments were partly offset by the issuance of Series M-39 and M-40 MTN debentures at Bell Canada with principal amounts of $500 million and $1 billion, respectively, and the issuance, net of repayments, of $76 million of notes payable.
| Issue of common shares |
In 2015, we issued 15,111,000 BCE common shares for $863 million under a public bought deal offering.
| Cash dividends paid on common shares |
In 2016, cash dividends paid on common shares increased by $136 million compared to 2015, due to a higher dividend paid in 2016 of $2.6975 per common share compared to $2.5675 per common share in 2015 and a higher number of outstanding common shares, partly offset by lower cash dividend payments as a result of common shares issued in Q1 2016 under BCE’s dividend reinvestment plan.
| 6.4 Post-employment benefit plans |
For the year ended December 31, 2016, we recorded an increase in our post-employment benefit obligations and a loss, before taxes and non-controlling interest (NCI), in OCI of $262 million. This was due to a lower actual discount rate of 4.0% at December 31, 2016, compared to 4.2% at December 31, 2015. The loss was partly offset by a higher-than-expected return on plan assets.
For the year ended December 31, 2015, we recorded a decrease in our post-employment benefit obligations and a gain, before taxes and NCI, in OCI of $590 million. This was due to a higher actual discount rate of 4.2% at December 31, 2015, compared to 4.0% at December 31, 2014, and a higher-than-expected return on plan assets.
| 6.5 Financial risk management |
Management’s objectives are to protect BCE and its subsidiaries on a consolidated basis against material economic exposures and variability of results from various financial risks that include credit risk, liquidity risk, foreign currency risk, interest rate risk, equity price risk and longevity risk. These risks are further described in Note 2,Significant accounting policies, Note 8,Other income (expense), Note 22,Post-employment benefit plansand Note 24,Financial and capital managementin BCE’s 2016 consolidated financial statements.
The following table outlines our financial risks, how we manage these risks and their financial statement classification.
FINANCIAL RISK | DESCRIPTION OF RISK | MANAGEMENT OF RISK AND FINANCIAL STATEMENT CLASSIFICATION |
Credit risk | We are exposed to credit risk from operating activities and certain financing activities, the maximum exposure of which is represented by the carrying amounts reported in the statements of financial position. We are exposed to credit risk if counterparties to our trade receivables and derivative instruments are unable to meet their obligations. |
|
BCE Inc. 2016 ANNUAL REPORT 79 | |||
| 6 | Financial and capital management | MD&A | |
FINANCIAL RISK | DESCRIPTION OF RISK | MANAGEMENT OF RISK AND FINANCIAL STATEMENT CLASSIFICATION |
Liquidity risk | We are exposed to liquidity risk for financial liabilities. |
|
Foreign currency risk | We are exposed to foreign currency risk related to anticipated transactions and certain foreign currency debt. A 10% depreciation (appreciation) in the value of the Canadian dollar relative to the U.S. dollar would result in a gain (loss) of $30 million recognized in net earnings at December 31, 2016 and a gain (loss) of $84 million recognized in OCI at December 31, 2016, with all other variables held constant. Refer to the followingFair valuesection for details on our derivative financial instruments. |
|
Interest rate risk | We are exposed to risk on the interest rates of our debt, our post-employment benefit plans and on dividend rate resets on our preferred shares. A 1% increase (decrease) in interest rates would result in a decrease of $25 million (increase of $20 million) in net earnings at December 31, 2016. Refer to the followingFair valuesection for details on our derivative financial instruments. |
|
Equity price risk | We are exposed to risk on our cash flow related to share-based payment plans. A 5% increase (decrease) in the market price of BCE’s common shares at December 31, 2016 would result in a gain (loss) of $36 million recognized in net earnings for 2016, all other variables held constant. Refer to the followingFair valuesection for details on our derivative financial instruments. |
|
Longevity risk | We are exposed to life expectancy risk on our post-employment benefit plans. |
|
| 80 BCE Inc. 2016 ANNUAL REPORT | |||
| 6 | Financial and capital management | MD&A | |
| Fair value |
Fair value is the price that would be received to sell an asset or paid to transfer a liability in an orderly transaction between market participants at the measurement date.
Certain fair value estimates are affected by assumptions we make about the amount and timing of future cash flows and discount rates, all of which reflect varying degrees of risk. Income taxes and other expenses that would be incurred on disposition of financial instruments are not reflected in the fair values. As a result, the fair values are not the net amounts that would be realized if these instruments were settled.
The carrying values of our cash and cash equivalents, trade and other receivables, dividends payable, trade payables and accruals, compensation payable, severance and other costs payable, interest payable, notes payable and loans secured by trade receivables approximate fair value as they are short-term.
The following table provides the fair value details of financial instruments measured at amortized cost in the statements of financial position.
| CLASSIFICATION | FAIR VALUE METHODOLOGY | DECEMBER 31, 2016 | DECEMBER 31, 2015 | ||||||
| CARRYING VALUE | FAIR VALUE | CARRYING VALUE | FAIR VALUE | |||||||
CRTC tangible benefits obligation | Trade payables and other liabilities and non-current liabilities | Present value of estimated future cash flows discounted using observable market interest rates | 166 | 169 | 227 | 234 | ||||
CRTC deferral account obligation | Trade payables and other liabilities and non-current liabilities | Present value of estimated future cash flows discounted using observable market interest rates | 136 | 145 | 154 | 163 | ||||
Debentures, finance leases and other debt | Debt due within one year and long-term debt | Quoted market price of debt or present value of future cash flows discounted using observable market interest rates | 17,879 | 20,093 | 17,688 | 19,764 | ||||
The following table provides the fair value details of financial instruments measured at fair value in the statements of financial position.
CLASSIFICATION | FAIR VALUE AT DECEMBER 31 | ||||||||
| CARRYING VALUE OF ASSET (LIABILITY) AT DECEMBER 31 | QUOTED PRICES IN ACTIVE MARKETS FOR IDENTICAL ASSETS (LEVEL 1) | OBSERVABLE MARKET DATA (LEVEL 2)(1) | NON-OBSERVABLE MARKET INPUTS (LEVEL 3)(2) | ||||||
2016 |
|
|
|
|
|
|
|
|
|
Available-for-sale (AFS) publicly-traded and privately-held investments(3) | Other non-current assets | 103 |
| 1 |
| – |
| 102 |
|
Derivative financial instruments | Other current assets, trade payables and other liabilities, other non-current assets and liabilities | 166 |
| – |
| 166 |
| – |
|
MLSE financial liability(4) | Trade payables and other liabilities | (135 | ) | – |
| – |
| (135 | ) |
Other | Other non-current assets and liabilities | 35 |
| – |
| 88 |
| (53 | ) |
2015 |
|
|
|
|
|
|
|
|
|
AFS publicly-traded and privately-held investments(3) | Other non-current assets | 128 |
| 16 |
| – |
| 112 |
|
Derivative financial instruments | Other current assets, trade payables and other liabilities, other non-current assets and liabilities | 256 |
| – |
| 256 |
| – |
|
MLSE financial liability(4) | Other non-current liabilities | (135 | ) | – |
| – |
| (135 | ) |
Other | Other non-current assets and liabilities | 30 | – | 56 | (26 | ) | |||
| (1) | Observable market data such as equity prices, interest rates, swap rate curves and foreign currency exchange rates. |
| (2) | Non-observable market inputs such as discounted cash flows and earnings multiples. A reasonable change in our assumptions would not result in a significant increase (decrease) to our level 3 financial instruments. |
| (3) | Unrealized gains and losses on AFS financial assets are recorded in OCI and are reclassified toOther income (expense)in the income statements when realized or when an impairment is determined. |
| (4) | Represents BCE’s obligation to repurchase the BCE Master Trust Fund’s (Master Trust) 9% interest in MLSE at a price not less than an agreed minimum price should the Master Trust exercise its put option. The obligation to repurchase is marked to market each reporting period and the gain or loss is recorded inOther income (expense)in the income statements. The option is exercisable in 2017 and thereafter. |
BCE Inc. 2016 ANNUAL REPORT 81 | |||
| 6 | Financial and capital management | MD&A | |
| 6.6 Credit ratings |
Credit ratings generally address the ability of a company to repay principal and pay interest on debt or dividends on issued and outstanding preferred shares.
Our ability to raise financing depends on our ability to access the public equity and debt capital markets as well as the bank credit market. Our ability to access such markets and the cost and amount of funding available partly depends on the quality of our credit ratings at the time capital is raised. Investment-grade credit ratings usually mean that when we borrow money, we qualify for lower interest rates than companies that have ratings lower than investment-grade. A ratings downgrade could result in adverse consequences for our funding capacity or ability to access the capital markets.
The following table provides BCE’s and Bell Canada’s credit ratings, which are considered investment grade, as at March 2, 2017 from DBRS, Moody’s and S&P.
| Key credit ratings |
| BELL CANADA(1) | |||||
MARCH 2, 2017 | DBRS | MOODY'S | S&P | |||
Commercial paper | R-2 (high) | P-2 | A-1 (Low) (Canadian scale) | |||
| A-2 (Global scale) | |||||
Long-term debt | BBB (high) | Baa1 | BBB+ | |||
Subordinated long-term debt | BBB (low) | Baa2 | BBB | |||
| BCE(1) | |||||
| DBRS | MOODY'S | S&P | |||
Preferred shares | Pfd-3 | – | P-2(Low) (Canadian scale) | |||
| BBB-(Global scale) | |||||
| (1) | These credit ratings are not recommendations to buy, sell or hold any of the securities referred to above, and they may be revised or withdrawn at any time by the assigning rating organization. Each credit rating should be evaluated independently of any other credit rating. |
Following the announcement of the proposed acquisition of Q9, on August 8, 2016, DBRS downgraded Bell Canada’s debentures and MTN debentures rating to BBB (high) from A (low), subordinated debentures rating to BBB (low) from BBB and commercial paper rating to R-2 (high) from R-1 (low). DBRS also downgraded BCE Inc.’s preferred shares rating to Pfd-3 from Pfd-3 (high).
As of March 2, 2017, BCE and Bell Canada’s credit ratings have stable outlooks from DBRS, Moody’s and S&P.
| 6.7 Liquidity |
Sources of liquidity
Our cash and cash equivalents balance at the end of 2016 was $853 million. We expect that this balance, our 2017 estimated cash flows from operations, and capital markets financing, including commercial paper, will permit us to meet our cash requirements in 2017 for capital expenditures, post-employment benefit plans funding, dividend payments, the payment of contractual obligations, maturing debt, ongoing operations, and other cash requirements.
Should our 2017 cash requirements exceed our cash and cash equivalents balance, cash generated from our operations, and capital markets financing, we would expect to cover such a shortfall by drawing under committed credit facilities that are currently in place or through new facilities to the extent available.
Our cash flows from operations, cash and cash equivalents balance, capital markets financing and credit facilities should give us flexibility in carrying out our plans for future growth, including business acquisitions and contingencies.
The approximate $3.1 billion consideration (excluding the assumption of $0.8 billion of outstanding MTS debt) for the proposed acquisition of MTS will be paid 45% in cash and 55% through the issuance of approximately 28 million BCE common shares. BCE will fund the cash component of the transaction through the debt financing referred to below. The approximate $300 million proceeds, subject to final adjustments, to be received from the proposed divestiture to the TELUS Group of approximately one-quarter of MTS’ postpaid wireless subscribers and of 13 retail locations in Manitoba will reduce the aggregate amount of debt financing required for the acquisition of MTS.
Subsequent to year end, on February 27, 2017, Bell Canada completed a public offering of $1.5 billion of MTN debentures in two series pursuant to its MTN program. The $1 billion Series M-44 MTN debentures will mature on February 27, 2024 and carry an annual interest rate of 2.70%. The $500 million Series M-45 MTN debentures will mature on February 27, 2047 and carry an annual interest rate of 4.45%. The MTN debentures are fully and unconditionally guaranteed by BCE. The net proceeds of the offering are intended to be used principally to fund the cash component of the proposed acquisition of MTS, and to repay short-term debt.
| 82 BCE Inc. 2016 ANNUAL REPORT | |||
| 6 | Financial and capital management | MD&A | |
The table below is a summary of our total bank credit facilities at December 31, 2016.
DECEMBER 31, 2016 | TOTAL AVAILABLE | DRAWN | LETTERS OF CREDIT | COMMERCIAL PAPER OUTSTANDING | NET AVAILABLE | |||||
Committed credit facilities | ||||||||||
Unsecured revolving and expansion credit facilities(1)(2) | 3,500 | – | – | 2,612 | 888 | |||||
Unsecured committed term credit facility(3) | 479 | 479 | – | – | – | |||||
Other | 134 | – | 130 | – | 4 | |||||
Total committed credit facilities | 4,113 | 479 | 130 | 2,612 | 892 | |||||
Total non-committed credit facilities | 1,472 | – | 741 | – | 731 | |||||
Total committed and non-committed credit facilities | 5,585 | 479 | 871 | 2,612 | 1,623 |
| (1) | Bell Canada’s $2.5 billion revolving credit facility expires in November 2021 and its $1 billion expansion credit facility expires in November 2019. |
| (2) | As of December 31, 2016, Bell Canada’s outstanding commercial paper consisted of $1,945 million in U.S. dollars ($2,612 million in Canadian dollars). All of Bell Canada’s commercial paper outstanding is included in debt due within one year and has been hedged using forward currency contracts. |
| (3) | The outstanding balance at December 31, 2016 was $357 million in U.S. dollars ($479 million in Canadian dollars) which is included in debt due within one year and has been hedged using cross currency basis swaps. |
Bell Canada may issue notes under its Canadian and U.S. commercial paper programs up to the maximum aggregate principal amount of $2.5 billion in either Canadian or U.S. currency provided that at no time shall such maximum amount of notes exceed $3.5 billion in Canadian currency which equals the aggregate amount available under Bell Canada’s supporting committed revolving and expansion credit facilities as at December 31, 2016. The maximum amounts of the commercial paper programs and the committed expansion credit facility both reflect an increase of $500 million effective on December 20, 2016 as compared to December 31, 2015. The total amount of the committed revolving and expansion credit facilities may be drawn at any time. Some of our credit agreements require us to meet specific financial ratios and to offer to repay and cancel the credit agreement upon a change of control of BCE or Bell Canada. We are in compliance with all conditions and restrictions under such agreements.
| Cash requirements |
CAPITAL EXPENDITURES
In 2017, our planned capital spending will be focused on our strategic imperatives, reflecting an appropriate level of investment in our networks and services.
POST-EMPLOYMENT BENEFIT PLANS FUNDING
Our post-employment benefit plans include DB pension and defined contribution (DC) pension plans, as well as other post-employment benefits (OPEBs) plans. The funding requirements of our post-employment benefit plans, resulting from valuations of our plan assets and liabilities, depend on a number of factors, including actual returns on post-employment benefit plan assets, long-term interest rates, plan demographics, and applicable regulations and actuarial standards. Our expected funding for 2017 is detailed in the following table and is subject to actuarial valuations that will be completed in mid-2017. Actuarial valuations were last performed for our significant post-employment benefit plans as at December 31, 2015.
2017 EXPECTED FUNDING | TOTAL | |
DB pension plans – service cost | 210 | |
DB pension plans – deficit | 15 | |
DB pension plans | 225 | |
OPEBs | 80 | |
DC pension plans | 105 | |
Total net post-employment benefit plans | 410 |
BCE closed the membership of its DB pension plans to new employees in January 2005 to reduce the impact of pension volatility on earnings over time. Generally, new employees now enrol in the DC pension plans. In 2006, we announced the phase-out, over a 10-year period, of OPEBs for new retirees, which will result in OPEBs funding being phased out gradually after 2016.
DIVIDEND PAYMENTS
In 2017, the cash dividends to be paid on BCE’s common shares are expected to be higher than in 2016 as BCE’s annual common share dividend increased by 5.1% to $2.87 per common share from $2.73 per common share effective with the dividend payable on April 15, 2017. This increase is consistent with BCE’s common share dividend payout policy of a target payout between 65% and 75% of free cash flow. BCE’s dividend policy and the declaration of dividends are subject to the discretion of the BCE Board.
BCE Inc. 2016 ANNUAL REPORT 83 | |||
| 6 | Financial and capital management | MD&A | |
CONTRACTUAL OBLIGATIONS
The following table is a summary of our contractual obligations at December 31, 2016 that are due in each of the next five years and thereafter.
| THERE- | |||||||||||||
| 2017 | 2018 | 2019 | 2020 | 2021 | AFTER | TOTAL | |||||||
Recognized financial liabilities | ||||||||||||||
Long-term debt | 880 | 1,753 | 1,326 | 1,411 | 2,235 | 8,037 | 15,642 | |||||||
Notes payable | 2,649 | – | – | – | – | – | 2,649 | |||||||
Minimum future lease payments under finance leases | 568 | 514 | 328 | 265 | 253 | 1,050 | 2,978 | |||||||
Loans secured by trade receivables | 931 | – | – | – | – | – | 931 | |||||||
Interest payable on long-term debt, notes payable and loan secured by trade receivables | 720 | 638 | 568 | 520 | 477 | 4,875 | 7,798 | |||||||
MLSE financial liability | 135 | – | – | – | – | – | 135 | |||||||
Commitments (off-balance sheet) | ||||||||||||||
Operating leases | 297 | 242 | 195 | 157 | 123 | 363 | 1,377 | |||||||
Commitments for property, plant and equipment and intangible assets | 994 | 745 | 608 | 460 | 385 | 1,122 | 4,314 | |||||||
Purchase obligations | 828 | 585 | 551 | 460 | 444 | 1,129 | 3,997 | |||||||
Proposed acquisition of MTS(1) | 3,068 | – | – | – | – | – | 3,068 | |||||||
Acquisition of Cieslok Media(2) | 161 | – | – | – | – | – | 161 | |||||||
Total | 11,231 | 4,477 | 3,576 | 3,273 | 3,917 | 16,576 | 43,050 |
| (1) | Subject to certain closing conditions and termination rights, the proposed acquisition of MTS is expected to close on March 17, 2017. If the transaction does not close under certain circumstances, BCE may be liable to pay a break fee of $200 million to MTS. |
| (2) | This commitment was settled on January 3, 2017 upon completion of the acquisition of Cieslok Media. |
BCE’s significant finance leases are for satellites and office premises. The office leases have a typical lease term of 23 years. The leases for satellites, used to provide programming to our Bell TV customers, have a term of 15 years. These satellite leases are non-cancellable. Minimum future lease payments under finance leases include future finance costs of $718 million.
BCE’s significant operating leases are for office premises, cellular tower sites, retail outlets, and out-of-home advertising spaces with lease terms ranging from 1 to 50 years. These leases are non-cancellable. Rental expense relating to operating leases was $353 million in 2016 and $340 million in 2015.
Our commitments for property, plant and equipment and intangible assets include program and feature film rights and investments to expand and update our networks to meet customer demand.
Purchase obligations consist of contractual obligations under service and product contracts for operating expenditures and other purchase obligations.
INDEMNIFICATIONS AND GUARANTEES (OFF-BALANCE SHEET)
As a regular part of our business, we enter into agreements that provide for indemnifications and guarantees to counterparties in transactions involving business dispositions, sales of assets, sales of services, purchases and development of assets, securitization agreements and operating leases. While some of the agreements specify a maximum potential exposure, many do not specify a maximum amount or termination date.
We cannot reasonably estimate the maximum potential amount we could be required to pay counterparties because of the nature of almost all of these indemnifications and guarantees. As a result, we cannot determine how they could affect our future liquidity, capital resources or credit risk profile. We have not made any significant payments under indemnifications or guarantees in the past.
| Litigation |
In the ordinary course of our business, we become involved in various claims and legal proceedings seeking monetary damages and other relief. In particular, because of the nature of our consumer-facing business, we are exposed to class actions pursuant to which substantial monetary damages may be claimed. Due to the inherent risks and uncertainties of the litigation process, we cannot predict the final outcome or timing of claims and legal proceedings. Subject to the foregoing, and based on information currently available and management’s assessment of the merits of the claims and legal proceedings pending at March 2, 2017, management believes that the ultimate resolution of these claims and legal proceedings is unlikely to have a material and negative effect on our financial statements or operations. We believe that we have strong defences and we intend to vigorously defend our positions.
You will find a description of the principal legal proceedings pending at March 2, 2017 in the BCE 2016 AIF.
| 84 BCE Inc. 2016 ANNUAL REPORT | |||
| 7 | Selected annual and quarterly information | MD&A | |
| 7 Selected annual and quarterly information |
| 7.1 Annual financial information |
The following table shows selected consolidated financial data of BCE for 2016, 2015 and 2014, prepared in accordance with IFRS as issued by the International Accounting Standards Board (IASB). We discuss the factors that caused our results to vary over the past two years throughout this MD&A.
| 2016 | 2015 | 2014(1) | |||
CONSOLIDATED INCOME STATEMENTS | ||||||
Operating revenues | 21,719 | 21,514 | 21,042 | |||
Operating costs | (12,931 | ) | (12,963 | ) | (12,739 | ) |
Adjusted EBITDA | 8,788 | 8,551 | 8,303 | |||
Severance, acquisition and other costs | (135 | ) | (446 | ) | (216 | ) |
Depreciation | (2,877 | ) | (2,890 | ) | (2,880 | ) |
Amortization | (631 | ) | (530 | ) | (572 | ) |
Finance costs | ||||||
Interest expense | (888 | ) | (909 | ) | (929 | ) |
Interest on post-employment benefit obligations | (81 | ) | (110 | ) | (101 | ) |
Other income (expense) | 21 | (12 | ) | 42 | ||
Income taxes | (1,110 | ) | (924 | ) | (929 | ) |
Net earnings | 3,087 | 2,730 | 2,718 | |||
Net earnings attributable to: | ||||||
Common shareholders | 2,894 | 2,526 | 2,363 | |||
Preferred shareholders | 137 | 152 | 137 | |||
Non-controlling interest | 56 | 52 | 218 | |||
Net earnings | 3,087 | 2,730 | 2,718 | |||
Net earnings per common share | ||||||
Basic | 3.33 | 2.98 | 2.98 | |||
Diluted | 3.33 | 2.98 | 2.97 | |||
Included in net earnings attributable to common shareholders: | ||||||
Severance, acquisition and other costs | (104 | ) | (327 | ) | (148 | ) |
Net (losses) gains on investments | (3 | ) | 21 | 8 | ||
Early debt redemption costs | (8 | ) | (13 | ) | (21 | ) |
Adjusted net earnings | 3,009 | 2,845 | 2,524 | |||
Adjusted EPS | 3.46 | 3.36 | 3.18 | |||
RATIOS | ||||||
Adjusted EBITDA margin (%) | 40.5 | % | 39.7 | % | 39.5 | % |
Return on equity (%)(2) | 21.8 | % | 21.1 | % | 21.0 | % |
| (1) | On October 31, 2014, BCE completed its acquisition of all the issued and outstanding common shares of Bell Aliant Inc. that it did not already own. |
| (2) | Net earnings attributable to common shareholders divided by total average equity attributable to BCE shareholders excluding preferred shares. |
BCE Inc. 2016 ANNUAL REPORT 85 | |||
| 7 | Selected annual and quarterly information | MD&A | |
| 2016 | 2015 | 2014 | |||
CONSOLIDATED STATEMENTS OF FINANCIAL POSITION | ||||||
Total assets | 50,108 | 47,993 | 46,297 | |||
Cash and cash equivalents | 853 | 613 | 566 | |||
Debt due within one year (including notes payable and loans secured by trade receivables) | 4,887 | 4,895 | 3,743 | |||
Long-term debt | 16,572 | 15,390 | 16,355 | |||
Total non-current liabilities | 22,146 | 20,672 | 21,969 | |||
Equity attributable to BCE shareholders | 17,540 | 17,023 | 14,946 | |||
Total equity | 17,854 | 17,329 | 15,239 | |||
CONSOLIDATED STATEMENTS OF CASH FLOWS | ||||||
Cash flows from operating activities | 6,643 | 6,274 | 6,241 | |||
Cash flows used in investing activities | (4,584 | ) | (4,114 | ) | (3,570 | ) |
Capital expenditures | (3,771 | ) | (3,626 | ) | (3,717 | ) |
Business acquisitions | (404 | ) | (311 | ) | (18 | ) |
Business dispositions | 18 | 409 | 720 | |||
Acquisition of spectrum licences | (1 | ) | (535 | ) | (566 | ) |
Loan to related party | (517 | ) | – | – | ||
Cash flows used in financing activities | (1,819 | ) | (2,113 | ) | (2,440 | ) |
Issue of common shares | 99 | 952 | 49 | |||
Net issuance (repayment) of debt instruments | 719 | (510 | ) | 784 | ||
Common shares issuance cost | – | (35 | ) | – | ||
Cash dividends paid on common shares | (2,305 | ) | (2,169 | ) | (1,893 | ) |
Privatization of Bell Aliant | – | – | (989 | ) | ||
Cash dividends paid on preferred shares | (126 | ) | (150 | ) | (134 | ) |
Cash dividends paid by subsidiaries to non-controlling interest | (46 | ) | (41 | ) | (145 | ) |
Free cash flow | 3,226 | 2,999 | 2,744 | |||
SHARE INFORMATION | ||||||
Average number of common shares (millions) | 869.1 | 847.1 | 793.7 | |||
Common shares outstanding at end of year (millions) | 870.7 | 865.6 | 840.3 | |||
Market capitalization(1) | 50,527 | 46,275 | 44,771 | |||
Dividends declared per common share (dollars) | 2.73 | 2.60 | 2.47 | |||
Dividends declared on common shares | (2,374 | ) | (2,213 | ) | (1,960 | ) |
Dividends declared on preferred shares | (137 | ) | (152 | ) | (138 | ) |
Closing market price per common share (dollars) | 58.03 | 53.46 | 53.28 | |||
Total shareholder return | 13.7 | % | 5.3 | % | 21.7 | % |
RATIOS | ||||||
Capital intensity (%) | 17.4 | % | 16.9 | % | 17.7 | % |
Price to earnings ratio (times)(2) | 17.43 | 17.94 | 17.88 | |||
OTHER DATA | ||||||
Number of employees (thousands) | 48 | 50 | 57 |
| (1) | BCE’s common share price at the end of the year multiplied by the number of common shares outstanding at the end of the year. |
| (2) | BCE’s common share price at the end of the year divided by EPS. |
| 86 BCE Inc. 2016 ANNUAL REPORT | |||
| 7 | Selected annual and quarterly information | MD&A | |
| 7.2 Quarterly financial information |
The following table shows selected BCE consolidated financial data by quarter for 2016 and 2015. This quarterly information is unaudited but has been prepared on the same basis as the annual consolidated financial statements. We discuss the factors that caused our results to vary over the past eight quarters throughout this MD&A.
| 2016 | 2015 | ||||||||||||||
| Q4 | Q3 | Q2 | Q1 | Q4 | Q3 | Q2 | Q1 | ||||||||
Operating revenues | 5,702 | 5,407 | 5,340 | 5,270 | 5,603 | 5,345 | 5,326 | 5,240 | ||||||||
Adjusted EBITDA | 2,121 | 2,236 | 2,268 | 2,163 | 2,073 | 2,187 | 2,197 | 2,094 | ||||||||
Severance, acquisition and other costs | (11 | ) | (25 | ) | (57 | ) | (42 | ) | (152 | ) | (46 | ) | (24 | ) | (224 | ) |
Depreciation | (719 | ) | (706 | ) | (713 | ) | (739 | ) | (731 | ) | (727 | ) | (720 | ) | (712 | ) |
Amortization | (165 | ) | (161 | ) | (156 | ) | (149 | ) | (136 | ) | (133 | ) | (134 | ) | (127 | ) |
Net earnings | 699 | 800 | 830 | 758 | 542 | 791 | 814 | 583 | ||||||||
Net earnings attributable to common shareholders | 657 | 752 | 778 | 707 | 496 | 739 | 759 | 532 | ||||||||
Net earnings per common share | ||||||||||||||||
Basic | 0.75 | 0.87 | 0.89 | 0.82 | 0.58 | 0.87 | 0.90 | 0.63 | ||||||||
Diluted | 0.75 | 0.87 | 0.89 | 0.82 | 0.58 | 0.87 | 0.90 | 0.63 | ||||||||
Included in net earnings attributable to common shareholders: | ||||||||||||||||
Severance, acquisition and other costs | (9 | ) | (20 | ) | (44 | ) | (31 | ) | (112 | ) | (35 | ) | (16 | ) | (164 | ) |
Net (losses) gains on investments | (1 | ) | (12 | ) | (2 | ) | 12 | (1 | ) | (16 | ) | 40 | (2 | ) | ||
Early debt redemption costs | – | – | – | (8 | ) | (6 | ) | – | – | (7 | ) | |||||
Adjusted net earnings | 667 | 784 | 824 | 734 | 615 | 790 | 735 | 705 | ||||||||
Adjusted EPS | 0.76 | 0.91 | 0.94 | 0.85 | 0.72 | 0.93 | 0.87 | 0.84 | ||||||||
Average number of common shares outstanding – basic (millions) | 870.5 | 869.9 | 869.1 | 867.1 | 853.5 | 848.9 | 844.9 | 841.0 | ||||||||
OTHER INFORMATION | ||||||||||||||||
Cash flows from operating activities | 1,520 | 1,943 | 1,890 | 1,290 | 1,510 | 1,878 | 1,841 | 1,045 | ||||||||
Free cash flow | 923 | 951 | 934 | 418 | 916 | 921 | 931 | 231 | ||||||||
Capital expenditures | (993 | ) | (976 | ) | (950 | ) | (852 | ) | (958 | ) | (927 | ) | (914 | ) | (827 | ) |
| Fourth quarter highlights |
| OPERATING REVENUES | Q4 2016 | Q4 2015 | $ CHANGE | % CHANGE | ||||
Bell Wireless | 1,883 | 1,770 | 113 | 6.4 | % | |||
Bell Wireline | 3,137 | 3,161 | (24 | ) | (0.8 | %) | ||
Bell Media | 845 | 816 | 29 | 3.6 | % | |||
Inter-segment eliminations | (163 | ) | (144 | ) | (19 | ) | (13.2 | %) |
Total BCE operating revenues | 5,702 | 5,603 | 99 | 1.8 | % |
| ADJUSTED EBITDA | Q4 2016 | Q4 2015 | $ CHANGE | % CHANGE | ||||
Bell Wireless | 674 | 641 | 33 | 5.1 | % | |||
Bell Wireline | 1,259 | 1,248 | 11 | 0.9 | % | |||
Bell Media | 188 | 184 | 4 | 2.2 | % | |||
Total BCE adjusted EBITDA | 2,121 | 2,073 | 48 | 2.3 | % |
BCE Inc. 2016 ANNUAL REPORT 87 | |||
| 7 | Selected annual and quarterly information | MD&A | |
BCE operating revenues were up by 1.8% in Q4 2016, compared to Q4 2015, as a result of solid revenue growth from both our Bell Wireless and Bell Media segments, moderated by a decline in our Bell Wireline segment.
BCE adjusted EBITDA grew by 2.3% in Q4 2016, compared to last year, reflecting year-over-year growth across all three of our segments. BCE adjusted EBITDA margin increased to 37.2% compared to 37.0% in Q4 2015.
Bell Wireless operating revenues were 6.4% higher in Q4 2016, compared to last year, reflecting service revenue growth of 7.2% driven by a larger postpaid subscriber base together with blended ARPU growth of 4.7%, resulting from increased postpaid ARPU due to higher average monthly rates driven by rate increases and the ongoing migration by customers from three-year to two-year rate plans, as well as reflecting the favourable impact from higher smartphone penetration and a growing base of 4G LTE and LTE-A customers in our subscriber mix, which drove greater data consumption. Wireless product sales were essentially stable year over year as greater promotional pricing in a highly competitive market was mitigated by a higher number of postpaid gross additions in Q4 2016 compared to last year.
Bell Wireless adjusted EBITDA was up 5.1%, year over year, with adjusted EBITDA margin based on service revenues of 39.6%, a 0.8% decline over last year. The year-over-year growth in adjusted EBITDA reflected higher postpaid service revenues, from an increased mix of higher-value postpaid subscribers in our overall customer base and price discipline. This growth was mitigated by higher customer retention spending and subscriber acquisition costs, attributable to greater promotional pricing driven by a highly competitive market during the holiday season, along with more expensive smartphones in our upgrade and activation mix and greater postpaid gross additions.
Bell Wireline operating revenues in Q4 2016 declined by 0.8%, year over year, attributable to lower wholesale revenues as a result of downward revisions to wholesale internet tariffs by the CRTC and lower sales of international minutes, as well as slow economic growth in our business markets, which drove lower customer spending on connectivity services and equipment, combined with competitive pricing pressures. Additionally, the ongoing erosion in residential voice and satellite TV further reduced operating revenues. This decline was moderated by growth in Internet and IPTV subscriber bases coupled with higher residential household ARPU, and growth in business solutions services revenue driven primarily by the acquisition of Q9.
Bell Wireline adjusted EBITDA in Q4 2016 increased by 0.9%, year over year, with a corresponding adjusted EBITDA margin improvement to 40.1% from 39.5% in Q4 2015, resulting from the growth in our Internet and IPTV businesses, the favourable impact from the acquisition of Q9, lower post-employment benefit expense driven by a higher discount rate and ongoing effective cost containment, which more than offset the continued erosion in our voice and legacy data services and the unfavourable impact from the CRTC’s revision of interim rates for aggregated wholesale high-speed Internet access services.
Bell Media operating revenues grew by 3.6% in Q4 2016, compared to the same period last year, due to higher subscriber revenues driven by Bell Media’s expansion of TMN into a national pay TV service in March 2016 coupled with the continued growth from CraveTV and TV Everywhere GO products. Advertising revenue was essentially unchanged compared to last year as declines in conventional TV, mainly due to the non-recurrence of revenues generated last year from the 2015 federal election and a soft radio advertising market, were offset by OOH advertising revenue growth from the Métromédia acquisition and new contract wins in 2016, as well as higher year-over-year revenues from specialty entertainment and news channel services.
Bell Media adjusted EBITDA increased by 2.2% in Q4 2016, compared to the same period last year, driven by the growth in revenues, partially offset by higher content costs related to the TMN expansion and CraveTV combined with additional costs associated with the Métromédia acquisition and new contract wins in OOH.
BCE capital expenditures increased by $35 million year over year in Q4 2016 to $993 million, corresponding to a capital intensity ratio of 17.4%, which increased 0.3% compared to the same period last year. The higher year-over-year capital investment was driven by our Bell Wireline segment with increased spending of $37 million, compared to Q4 2015, attributable to our continued deployment of broadband fibre directly to more homes and businesses, including the build-out of Gigabit Fibe infrastructure in the city of Toronto and other urban locations. Greater spending to support the execution of business customer contracts also contributed to the year-over-year growth in capital expenditures.
BCE severance, acquisition and other costs of $11 million in Q4 2016 decreased by $141 million, compared to Q4 2015, mainly due to higher workforce reduction initiatives in our Bell Wireline and Bell Media segments in Q4 2015 to address increasing competition, media industry regulation, a soft business market and declines in home phone subscribers.
BCE depreciation of $719 million in Q4 2016 decreased by $12 million, year over year, due to an increase in the estimate of useful lives of certain assets as a result of our ongoing annual review process, partly offset by a higher depreciable asset base as we continued to invest in our broadband and wireless networks as well as our IPTV service. The changes to useful lives have been applied prospectively, effective January 1, 2016, as described in section 10.1,Our accounting policies – Critical accounting estimates and key judgments.
BCE amortization was $165 million in Q4 2016, up from $136 million in Q4 2015, due mainly to a higher asset base.
BCE net earnings attributable to common shareholders of $657 million in Q4 2016, or $0.75 per share, were higher than the $496 million, or $0.58 per share, reported in Q4 2015. The year-over-year increase was due mainly to growth in operating revenues that drove a higher adjusted EBITDA, lower severance, acquisition and other costs and lower other expense, partly offset by higher income taxes and increased amortization expense. Adjusted net earnings increased to $667 million, from $615 million in Q4 2015, and adjusted EPS increased to $0.76 from $0.72 in Q4 2015.
BCE cash flows from operating activities was $1,520 million in Q4 2016 compared to $1,510 million in Q4 2015. The increase is mainly attributable to higher adjusted EBITDA, lower acquisition and other costs paid and lower income taxes paid, partly offset by a higher voluntary DB pension plan contribution made in Q4 2016 and reduced working capital.
BCE free cash flow generated in Q4 2016 was $923 million, or 0.8% higher than in Q4 2015. This was due to an increase in cash flows from operating activities and lower cash dividends paid on preferred shares as a result of timing of payments, partly offset by higher capital expenditures.
| 88 BCE Inc. 2016 ANNUAL REPORT | |||
| 7 | Selected annual and quarterly information | MD&A | |
| Seasonality considerations |
Some of our segments’ revenues and expenses vary slightly by season, which may impact quarter-to-quarter operating results.
Bell Wireless operating results are influenced by the timing of our marketing and promotional expenditures and higher levels of subscriber additions and handset discounts, resulting in higher subscriber acquisition and activation-related expenses in certain quarters. In particular, subscriber activations are typically lowest in the first quarter, while adjusted EBITDA tends to be lower in the third and fourth quarters, due to higher subscriber acquisition and retention costs associated with a higher number of new subscriber activations and upgrades during the back-to-school, Black Friday and Christmas holiday periods. Additionally, wireless ARPU historically has experienced a seasonal sequential increase in the third quarter, reflecting higher levels of usage and roaming in the summer.
Bell Wireline revenues tend to be higher in the fourth quarter because of higher data and equipment product sales to business customers and higher consumer electronics equipment sales during the Q4 Christmas holiday period. However, this may vary from year to year depending on the strength of the economy and the presence of targeted sales initiatives, which can influence customer spending. Home Phone, TV and Internet subscriber activity is subject to modest seasonal fluctuations, attributable largely to residential moves during the summer months and the back-to-school period in the third quarter. Targeted marketing efforts conducted during various times of the year to coincide with special events or broad-based marketing campaigns also may have an impact on overall wireline operating results.
Bell Media revenues and related expenses from TV and radio broadcasting are largely derived from the sale of advertising, the demand for which is affected by prevailing economic conditions, as well as cyclical and seasonal variations. Seasonal variations are driven by the strength of TV ratings, particularly during the fall programming season, major sports league seasons and other special sporting events such as the Olympic Games, NHL playoffs and World Cup soccer, as well as fluctuations in consumer retail activity during the year.
BCE Inc. 2016 ANNUAL REPORT 89 | |||
| 8 | Regulatory environment | MD&A | |
| 8 Regulatory environment |
| 8.1 Introduction |
This section describes certain legislation that governs our business and provides highlights of recent regulatory initiatives and proceedings, government consultations and government positions that affect us, influence our business and may continue to affect our flexibility to compete in the marketplace. Bell Canada and several of its direct and indirect subsidiaries, including Bell Mobility, Bell ExpressVu Limited Partnership (Bell ExpressVu), Bell Media, NorthernTel, Limited Partnership (NorthernTel), Télébec, Limited Partnership (Télébec) and Northwestel, are governed by theTelecommunications Act, theBroadcasting Act, theRadiocommunication Actand/or theBell Canada Act. They are also subject to regulations and policies enforced by the CRTC. Our business is affected by decisions made by various regulatory agencies, including the CRTC, a quasi-judicial agency of the Government of Canada responsible for regulating Canada’s telecommunications and broadcasting industries. Other aspects of the business of these entities are regulated in various ways by federal government departments, in particular ISED.
The CRTC regulates the prices we can charge for telecommunications services in areas where it determines there is not enough competition to protect the interests of consumers. The CRTC has determined that competition was sufficient to grant forbearance from retail price regulation under theTelecommunications Actfor the vast majority of our residential and business telephone services, as well as for our wireless (except our domestic wholesale wireless roaming service) and Internet services (except in certain parts of Northwestel’s territory, where the CRTC re-regulated Internet services in 2013). Our TV distribution and our TV and radio broadcasting businesses are subject to theBroadcasting Actand are, for the most part, not subject to retail price regulation.
Although most of our retail services are not price-regulated, government agencies and departments such as the CRTC, ISED, Canadian Heritage and the Competition Bureau continue to play a significant role in regulatory matters such as mandatory access to networks, net neutrality, spectrum auctions, approval of acquisitions, broadcast licensing and foreign ownership requirements. Adverse decisions by regulatory agencies or increasing regulation could have negative financial, operational, reputational or competitive consequences for our business.
| 8.2 Telecommunications Act |
TheTelecommunications Actgoverns telecommunications in Canada. It defines the broad objectives of Canada’s telecommunications policy and provides the Government of Canada with the power to give general direction to the CRTC on any of its policy objectives. It applies to several of the BCE group of companies and partnerships, including Bell Canada, Bell Mobility, NorthernTel, Télébec and Northwestel.
Under theTelecommunications Act, all facilities-based telecommunications service providers in Canada, known as telecommunications common carriers (TCCs), must seek regulatory approval for all proposed tariffs for telecommunications services, unless the services are exempt from regulation or forborne from regulation. The CRTC may exempt an entire class of carriers from regulation under theTelecommunications Actif the exemption meets the objectives of Canada’s telecommunications policy. In addition, a few large TCCs, including the BCE group TCCs, must also meet certain Canadian ownership requirements. BCE monitors and periodically reports on the level of non-Canadian ownership of its common shares.
| Review of basic telecommunications services |
On December 21, 2016, the CRTC issued Telecom Regulatory Policy CRTC 2016-496,Modern telecommunications services – The path forward for Canada’s digital economy. In this decision, the CRTC determined broadband Internet to be a basic service and created a new fund designed to complement government investments in expanding access to broadband Internet across Canada. The new fund will collect and distribute $750 million over a five-year period to support an aspirational goal of bringing broadband Internet with speeds of 50 Mbps to 90% of Canadian households by the end of 2021. The contributions to the new fund will be collected from telecommunications service providers, like those of the BCE group, and distributed through a competitive bidding process to support broadband deployment initiatives. The details of the competitive bidding process are to be determined through a follow-up proceeding. The fund is to start at $100 million in its first year and grow by $25 million each year until it caps out at $200 million in the fifth year.
While the timing of the new fund’s implementation is unclear at this time, it will not be implemented in 2017. While we will be required to contribute to the new broadband fund based on our percentage of industry revenues for voice, data and Internet services, the extent of the impact of this new fund on our business is not yet known, as funds contributed may be offset by any funds received should we seek and be awarded funds to deploy broadband services as part of the CRTC’s program.
In this same decision, the CRTC also indicated its intention to reduce the size of its existing fund used to support the delivery of voice services in certain rural and remote areas (currently approximately $100 million per year). Through an additional follow-up proceeding, the CRTC will consider the extent to which support for rural and remote voice services will be phased out. There are no changes to the CRTC’s fund to support video relay services (maximum $30 million per year), to which we also contribute.
| 90 BCE Inc. 2016 ANNUAL REPORT | |||
| 8 | Regulatory environment | MD&A | |
| Complaint regarding pricing of broadcasting content accessed via mobile devices |
On January 29, 2015, the CRTC issued a decision (Mobile TV decision) concerning a complaint against Bell Mobility about the pricing of our Bell Mobile TV service compared with the rates applicable when consumers access programming content received via mobile devices over the Internet. The CRTC found that we were conferring an “undue preference” on our Mobile TV service by not subjecting it to the standard data charges. In accordance with the CRTC’s Mobile TV decision, we have ceased exempting our Mobile TV service from data charges as of April 29, 2015.
On February 20, 2015, Bell Canada filed a motion seeking leave to appeal the CRTC’s Mobile TV decision in the Federal Court of Appeal, which was granted on April 2, 2015. On June 20, 2016, the Federal Court of Appeal dismissed our appeal of the CRTC’s Mobile TV decision. Consistent with this decision, our Mobile TV service will continue to be subject to standard data charges, as it has been since April 29, 2015.
| Proceedings regarding wholesale domestic wireless services |
On May 5, 2015, the CRTC released Telecom Regulatory Policy CRTC 2015-177 (TRP 2015-177), which concluded its investigation into the competitiveness of wholesale wireless markets in Canada. TRP 2015-177 requires Bell Mobility, Rogers Communications Partnership (now Rogers Communications Canada Inc.) (Rogers Canada) and Telus Communications Company to issue tariffs for domestic wholesale roaming services based on the GSM standard, which are provided to all other Canadian wireless carriers but not to each other. As a condition of offering GSM-based wholesale roaming services, Bell Mobility, Rogers Canada and Telus Communications Company must provide domestic roaming service to all subscribers served by their wholesale roaming customers, including the subscribers of any mobile virtual network operators (MVNOs) operating on their roaming customers’ networks. On March 1, 2017, the CRTC issued Telecom Decision CRTC 2017-56, in which it generally approved the terms of our tariff, with minor modifications. Final approval of Bell Mobility’s, Rogers Canada’s and Telus Communications Company’s proposed wholesale roaming rates remains pending.
| Mandated wholesale access to FTTP networks |
On July 22, 2015, the CRTC mandated the introduction of a new disaggregated wholesale high-speed access service, including over FTTP facilities, which had so far been exempt from mandated wholesale high-speed access. While this new service is mandated for all major incumbent telephone companies and cable carriers, the first stage of its implementation is to take place only in Ontario and Québec, our two largest markets. This adverse regulatory decision may impact the specific nature, magnitude, location and timing of our future FTTP investment decisions. In particular, the introduction by the CRTC of mandated wholesale services over FTTP will undermine the incentives for facilities-based digital infrastructure providers to invest in next-generation wireline networks, particularly in smaller communities and rural areas.
On September 20, 2016, the CRTC issued Telecom Decision CRTC 2016-379, in which it largely adopted our proposals concerning the technical design of our future disaggregated wholesale high-speed access service. The rates and roll-out schedule of our new service remain to be determined by the CRTC. The mandating of rates for the new disaggregated wholesale high-speed access service that are materially different from the rates we proposed could improve the business position of our competitors and further impact our investment strategy.
| Review of wholesale FTTN high-speed access service rates |
As part of its ongoing review of wholesale Internet rates, on October 6, 2016 the CRTC significantly reduced, on an interim basis, some of the wholesale rates that Bell Canada and other major providers charge for access by ISPs to FTTN or cable networks, as applicable. Should such substantially lowered wholesale rates remain in place in the long-term and, in addition, should the interim rates be made retroactive, the business position of some of our competitors could improve, adversely affecting our financial performance, and our investment strategy could change, especially in relation to investment in next-generation wireline networks, particularly in smaller communities and rural areas.
| National wireless services consumer code |
On June 3, 2013, the CRTC issued Telecom Regulatory Policy CRTC 2013-271, which established the Wireless Code. The Wireless Code applies to all wireless services provided to individual and small business consumers (i.e. businesses that on average spend less than $2,500 per month on telecom services) in all provinces and territories.
The Wireless Code establishes regulations related to unlocking mobile phones, limiting the amount of early cancellation fees, price changes for different categories of services, and setting default caps for data roaming charges and data overage charges, among other measures.
The Wireless Code also stipulates that wireless service providers may not charge an early cancellation fee after a customer has been under contract for 24 months and that handset subsidies must be recovered in two years or less. These requirements reduce the incentive for wireless service providers to offer contracts with terms greater than two years.
The CRTC began a scheduled review of the provisions of the Wireless Code on September 26, 2016. A public hearing was held in February 2017 and a decision is expected later this year.
BCE Inc. 2016 ANNUAL REPORT 91 | |||
| 8 | Regulatory environment | MD&A | |
| Canada’s telecommunications foreign ownership rules |
Under theTelecommunications Act, there are no foreign investment restrictions applicable to TCCs that have less than a 10% share of the total Canadian telecommunications market as measured by annual revenues. However, foreign investment in telecommunications companies can still be refused by the government under theInvestment Canada Act. The absence of foreign ownership restrictions on such small or new entrant TCCs could result in more foreign companies entering the Canadian market, including by acquiring spectrum licences or Canadian TCCs. Under theBroadcasting Act, foreign ownership restrictions continue to apply to BDUs, such as licensed cable and satellite TV service providers, and programming undertaking licensees such as Bell Media.
| 8.3 Broadcasting Act |
TheBroadcasting Actoutlines the broad objectives of Canada’s broadcasting policy and assigns the regulation and supervision of the broadcasting system to the CRTC. Key policy objectives of theBroadcasting Actare to protect and strengthen the cultural, political, social and economic fabric of Canada and to encourage the development of Canadian expression.
Most broadcasting activities require a programming or broadcasting distribution licence from the CRTC. The CRTC may exempt broadcasting undertakings from complying with certain licensing and regulatory requirements if it is satisfied that non-compliance will not materially affect the implementation of Canadian broadcasting policy.
A corporation must also meet certain Canadian ownership and control requirements to obtain a broadcasting or broadcasting distribution licence, and corporations must have the CRTC’s approval before they can transfer effective control of a broadcasting licensee.
Our TV distribution operations and our TV and radio broadcasting operations are subject to the requirements of theBroadcasting Act, the policies and decisions of the CRTC and their respective broadcasting licences. Any changes to theBroadcasting Act, amendments to regulations or the adoption of new ones, or amendments to licences could negatively affect our competitive position or the cost of providing services.
| Changes to simultaneous substitution |
On January 29, 2015, the CRTC announced in Broadcasting Regulatory Policy 2015-25 that it would eliminate simultaneous substitution for the Super Bowl starting in 2017. On August 19, 2016, the CRTC issued Broadcasting Order CRTC 2016-335 (the Order) implementing its decision with respect to simultaneous substitution for the Super Bowl.
On September 19, 2016, Bell Canada and Bell Media filed a motion with the Federal Court of Appeal seeking leave to appeal the Order, a stay of the Order, and expedited proceedings. Bell Canada and Bell Media are challenging the legal validity of the Order on the basis that the CRTC does not have jurisdiction under section 9(1)(h) of theBroadcasting Actto make an order banning simultaneous substitution for the Super Bowl, and that doing so constitutes unauthorized retrospective regulation and interference with Bell Media’s vested economic rights.
On October 31, 2016, leave to appeal the Order was granted by the Federal Court of Appeal but a stay of the Order pending the appeal was denied. Bell Canada and Bell Media filed a Notice of Appeal on December 28, 2016. The NFL was separately granted leave to appeal the Order on October 31, 2016 and filed a Notice of Appeal on January 3, 2017. A decision on the appeals remains pending.
The CRTC’s decision to eliminate simultaneous substitution for the Super Bowl has had an adverse impact on Bell Media’s conventional TV business and financial results, as a result of a reduction in viewership and advertising revenues and that impact will continue through the contract term unless the appeal of Bell Canada, Bell Media and the NFL is successful.
| Unbundling of TV services |
On March 19, 2015, the CRTC released Broadcasting Regulatory Policy 2015-96, which deals primarily with issues related to the distribution of TV services. In it, the CRTC mandates that all TV providers offer a “small entry-level” package consisting of only Canadian conventional TV services, certain public-interest services and, if the TV provider chooses to include them, one set of American over-the-air (OTA) stations. The price of this package cannot exceed $25 per month exclusive of equipment. The small entry-level offer had to be introduced by March 1, 2016. The decision also requires all TV providers to offer every channel not included in a small entry-level package on both a standalone (à la carte) basis and in either build-your-own packages (e.g. “pick 10”) or small theme packs of no more than 10 channels. The CRTC did not regulate the price at which such packages can be sold.
Either a standalone, build-your-own package, or small theme pack option was required to be offered by March 1, 2016, and both standalone and one of build-your-own package or small theme pack options was required to be offered by December 1, 2016. TV providers could continue to offer TV services in other packages, including their existing package options, as long as they also offer the mandated alternatives. The CRTC also decided that, with the exception of mainstream national news services, TV channels that previously had “access rights”, in that TV providers were required to carry them, will lose those rights when they renew their licences beginning in September 2017. A TV provider will, therefore, be able to cease to offer any of these services that it does not wish to carry. While the impact of the decision on Bell Media is potentially negative, the extent of the impact on Bell Media’s business and financial results is unclear at this time.
| 92 BCE Inc. 2016 ANNUAL REPORT | |||
| �� | |||
| 8 | Regulatory environment | MD&A | |
| Wholesale code |
On September 24, 2015, the CRTC released Broadcasting Regulatory Policy 2015-438, announcing a new Wholesale Code. The Wholesale Code governs the commercial arrangements between BDUs, programming services and digital media services, including imposing additional restrictions on the sale of TV channels at wholesale and the carriage of TV channels by BDUs. On October 23, 2015, Bell Canada and Bell Media filed with the Federal Court of Appeal an application for leave to appeal the CRTC’s decision to implement the Wholesale Code, which application was granted on December 22, 2015. We allege that the CRTC’s implementation of the Wholesale Code conflicts with theCopyright Actand is outside the CRTC’s jurisdiction under theBroadcasting Act. A decision on the appeal remains pending.
| Licence renewals |
On February 8, 2016, the CRTC released Broadcasting Notice of Consultation CRTC 2016-44, in which it initiated the renewal process for TV broadcasting licences owned by Bell Media and its subsidiaries Learning and Skills Television of Alberta Limited, The Sports Network Inc., Le Réseau des sports (RDS) inc., Discovery Science Canada Company, 2953285 Canada Inc., and Animal Planet Canada Company, which are part of our licensed ownership group as described in the Notice of Consultation. The existing licences were last renewed in 2011 and 2012, in Broadcasting Decision CRTC 2011-444 and Broadcasting Decision CRTC 2012-241, and are set to expire on August 31, 2017. In accordance with the CRTC’s group-based licensing policy, effectively all of the licences of all of the large ownership groups, including BCE, are renewed and expire at the same time. Should the CRTC impose adverse conditions of licence as a result of the renewal process, this could have a negative effect on our business and financial performance. A decision on the licence renewal is expected in 2017 prior to the expiry of the existing licences.
| 8.4 Radiocommunication Act |
ISED regulates the use of radio spectrum under theRadiocommunication Act. Under theRadiocommunication Act, ISED ensures that radiocommunication in Canada is developed and operated efficiently. Under theRadiocommunication Regulations, companies that are eligible for radio licences, such as Bell Canada and Bell Mobility, must meet the same ownership requirements that apply to companies under theTelecommunications Act.
Companies must have a spectrum licence to operate a wireless system in Canada. While we anticipate that the licences under which we provide wireless services will be renewed upon expiry, there is no assurance that this will happen, or of the terms under which renewal will be granted. ISED can revoke a company’s licence at any time if the licensee does not comply with the licence’s conditions. While we believe that we comply with the conditions of our licences, there is no assurance that ISED will agree. Should there be a disagreement, this could have a negative effect on our business and financial performance.
| 600 MHz spectrum consultation |
ISED held a consultation in December 2014 seeking comments on various questions related to repurposing the 600 MHz broadcasting band for mobile use. This spectrum is currently used primarily by OTA TV broadcasters for local TV transmissions. This was the first step of a multistep process on the matter. The two key questions related to whether ISED should repurpose the band to include commercial mobile broadband and whether to participate in a joint spectrum repacking process with the United States (U.S.). In addition, ISED also sought comments regarding the anticipated future spectrum requirements for OTA TV broadcasting, taking into consideration the overall changes in the broadcasting industry.
On August 14, 2015, ISED announced its decision on the results of the consultation. ISED determined it would proceed with the repacking initiative for the 600 MHz band to include commercial mobile use and that it would jointly establish a new digital TV (DTV) allotment plan in collaboration with the U.S. ISED has indicated that it is waiting for the results of the U.S. auction, which began on March 29, 2016, before proceeding with further consultation concerning the final 600 MHz band plan to be adopted and its auction process, as ISED’s auction parameters will be coordinated with the band plan that results from the auction in the U.S. The repurposing of 600 MHz spectrum will have an impact on existing Bell Media TV broadcasting stations, which will need to transition to alternative spectrum. The extent of such impact is not yet known.
BCE Inc. 2016 ANNUAL REPORT 93 | |||
| 8 | Regulatory environment | MD&A | |
| 8.5 Bell Canada Act |
Under theBell Canada Act, the CRTC must approve any sale or other disposal of Bell Canada voting shares that are held by BCE, unless the sale or disposal would result in BCE retaining at least 80% of all of the issued and outstanding voting shares of Bell Canada. Exceptin the ordinary course of business, the sale or other disposal of facilities integral to Bell Canada’s telecommunications activities must also receive CRTC approval.
| 8.6 Other key legislation |
Personal Information Protection and Electronic Documents Act
TheDigital Privacy Actamending thePersonal Information Protection and Electronic Documents Act(PIPEDA) received Royal Assent on June 18, 2015. The amendments introduce mandatory notification requirements that must be followed in relation to the loss or unauthorized disclosure of personal information held by an organization resulting from a breach of the organization’s security safeguards. Failure to comply with these notification requirements, or to log security breaches, may result in a fine of up to $100,000 per occurrence. These provisions dealing with notification requirements will come into force when related regulations are brought into force.
On June 30, 2016, the Office of the Privacy Commissioner of Canada invited comments from interested parties with respect to its consultation on consent and privacy. Issue areas to be addressed in the consultation include enhancements to the consent process, alternatives to express consent, evolving information governance and changes to enforcement processes and powers. The outcome of this consultation could have a significant impact on the ability of companies like Bell Canada to use personal information.
| Canada’s anti-spam legislation |
Federal legislation referred to as Canada’s anti-spam legislation (CASL) came into force on July 1, 2014. Pursuant to CASL, commercial electronic messages (CEMs) can be sent only if the recipient has provided prior consent and the message complies with certain formalities, including the ability to unsubscribe easily from subsequent messages. As of January 15, 2015, CASL also requires that an organization have prior informed consent before downloading software to an end-user’s computer. Penalties for non-compliance include administrative monetary penalties of up to $10 million and a private right of action is scheduled to come into force on July 1, 2017. CASL limits the ability of the various BCE group companies to contact prospective customers, and imposes additional costs and processes with respect to communicating with existing and prospective customers.
| 94 BCE Inc. 2016 ANNUAL REPORT | |||
| 9 | Business risks | MD&A | |
| 9 Business risks |
A risk is the possibility that an event might happen in the future that could have a negative effect on our financial position, financial performance, cash flows, business or reputation. The actual effect of any event could be materially different from what we currently anticipate. The risks described in this MD&A are not the only ones that could affect us. Additional risks and uncertainties not currently known to us or that we currently deem to be immaterial may also materially and adversely affect our financial position, financial performance, cash flows, business or reputation.
This section describes the principal business risks that could have a material adverse effect on our financial position, financial performance, cash flows, business or reputation, and cause actual results or events to differ materially from our expectations expressed in, or implied by, our forward-looking statements. As indicated in the table below, certain of these principal business risks have already been discussed in other sections of this MD&A, and we refer the reader to those sections for a discussion of such risks. All of the risk discussions set out in the sections referred to in the table below are incorporated by reference in this section 9.
RISKS DISCUSSED IN OTHER | SECTION REFERENCES |
Regulatory environment | Section 3.3,Principal business risks |
Competitive environment | Section 3.3,Principal business risks |
Security management | Section 3.3,Principal business risks |
Risks specifically relating to our Bell Wireless, | Section 5,Business segment analysis(Principal business riskssection for each segment) |
The other principal business risks that could also have a material adverse effect on our financial position, financial performance, cash flows, business or reputation are discussed below.
| Technology/infrastructure transformation |
The failure to optimize network and IT deployment and upgrading timelines, accurately assess the potential of new technologies, and invest and evolve in the appropriate direction, could have an adverse impact on our business and financial results
Globalization, increased competition and ongoing technological advances are driving customer expectations of faster market responses, enhanced user experiences and cost-effective delivery. Meeting these expectations requires the deployment of new service and product technologies that are network-neutral and based on a more collaborative and integrated development environment. Change can be difficult and may present unforeseen obstacles that might impact successful execution, and this transition is made more challenging by the complexity of our multi-product environment, combined with the complexity of our network and IT structures. In addition, new technologies may quickly become obsolete or their launch may be delayed. The failure to optimize network and IT deployment and upgrading timelines, in light of customer demand and competitor activities, to accurately assess the potential of new technologies, and to invest and evolve in the appropriate direction in an environment of changing business models could have an adverse impact on our business and financial results.
In particular, our network and IT evolution activities seek to leverage new as well as evolving and developing technologies, including network functions virtualization, software-defined networks and cloud technologies, and transform our network and systems to achieve our objectives of becoming more agile in our service delivery and operations as well as providing self-serve and instant-on capabilities for our customers, ensuring best quality and customer experience, and developing a new network infrastructure that enables a competitive cost structure with rapidly growing capacity needs. These evolution activities require an operational and cultural shift. Alignment across technology, product development and operations is increasingly critical to ensure appropriate trade-offs and optimization of capital allocation.
If this cannot be achieved in accordance with our deployment schedules while maintaining network availability and performance through the migration process, we may lose customers as a result of poor service performance, which could adversely affect our ability to achieve our operational and financial objectives. Failure to leverage IP across all facets of our network and product and service portfolio could inhibit a fully customer-centric approach, limiting or preventing comprehensive self-serve convenience, real-time provisioning, cost savings and flexibility in delivery and consumption, leading to negative business and financial outcomes.
Parallel to our focus on next-generation investment, adverse regulatory decisions may impact the specific nature, magnitude, location and timing of investment decisions. In particular, the introduction by the CRTC of mandated wholesale services over FTTP or wireless networks will undermine the incentives for facilities-based digital infrastructure providers to invest in next-generation wireline and wireless networks, particularly in smaller communities and rural areas. Failure to continue investment in a disciplined and strategic manner in next-generation capabilities, including real-time information-based customer service strategies, could limit our ability to compete effectively and achieve desired business and financial results.
BCE Inc. 2016 ANNUAL REPORT 95 | |||
| 9 | Business risks | MD&A | |
Other examples of risks to achieving our desired technology/ infrastructure transformation include:
- Network construction and deployment on municipal or privateproperty requires the issuance of municipal or property ownerconsents, respectively, for the installation of network equipment,which could cause delays in FTTP rollout
- The increasing dependence on apps for content delivery, sales,customer engagement and service experience drives the need fornew and scarce capabilities (sourced internally or externally),which may not be available, as well as the need for associatedoperating processes integrated into ongoing operations
- New products, services or apps could reduce demand for ourexisting more profitable service offerings or cause prices forthose services to decline, and could result in shorter estimateduseful lives for existing technologies, which could increasedepreciation and amortization expense
- As consumption habits evolve and TV viewing alternatives expand,our ability to develop alternative delivery vehicles, which mayrequire significant software development and network investment,in order to compete in new markets is essential to maintainingcustomer engagement and revenue streams
- Our ability to leverage new opportunities, such as thoseintroduced by Big Data, which is subject to many challenges,including evolving customer perceptions as well as legal andregulatory developments. If we cannot build market-leadingcompetencies in this field across sales, service and operationalplatforms that respect societal values and legal and regulatoryrequirements, we may miss important opportunities to grow ourbusiness through enhanced market intelligence and a moreproactive customer service model.
| Customer experience |
Driving a positive customer experience in all aspects of our engagement with customers by embracing new approaches and challenging operational limitations is important to avoid adverse impacts on our business and financial performance
As the bar continues to be raised based on customers’ evolving expectations of service and value, failure to get ahead of such expectations and build a more robust service experience could hinder product and service differentiation and customer loyalty. With the proliferation of connectivity services, apps and devices, customers are accustomed to doing things when, how and where they want through websites, self-serve options, web chat, call centres, Facebook, Twitter and other social media forums. Failure to embrace these new media in a positive way, incorporate them into multiple elements of our service delivery and ensure that we understand their potential impact on customer perceptions could adversely affect our reputation and brand value. As the foundation of effective customer service stems from our ability to deliver simple solutions to customers in an expeditious manner, on mutually agreeable terms, complexity in our operations resulting from multiple technology platforms, billing systems, marketing databases and a myriad of rate plans, promotions and product offerings may limit our ability to respond quickly to market changes and reduce costs, and may lead to customer confusion or billing errors, which could adversely affect customer satisfaction, acquisition and retention. While speed of service evolution is critical to competitive differentiation, it must not be achieved at the expense of the quality of our service offerings or of our brand.
| Operational performance |
Our networks, IT systems and data centre assets are the foundation of high-quality consistent services which are critical to meeting service expectations
Our ability to provide consistent wireless, wireline, media broadcasting, satellite and data centre services to customers in a complex and constantly changing operating environment is crucial for sustained success. In particular, network capacity demands for TV and other bandwidth-intensive applications on our Internet and wireless networks have been growing at unprecedented rates. Unexpected capacity pressures on our networks may negatively affect our network performance and our ability to provide services. Issues relating to network availability, speed, consistency and traffic management on our more current as well as aging networks could have an adverse impact on our business and financial performance.
In addition, we currently use a very large number of interconnected operational and business support systems including for provisioning, networking, distribution, broadcast management, billing and accounting, which may restrain our operational efficiency. If we fail to implement or maintain highly effective customer-facing IT systems supported by an effective governance and operating framework, this may lead to inconsistent performance and dissatisfied customers, which over time could result in higher churn.
Further examples of risks to operational performance that could impact our reputation, business operations and financial performance include the following:
- We may need to incur significant capital expenditures beyondthose already anticipated by our capital intensity target inorder to provide additional capacity and reduce networkcongestion on our wireline and wireless networks, and we maynot be able to generate sufficient cash flows or raise the capitalwe need to fund such capital expenditures, which may resultin service degradation
- Corporate restructurings, system replacements and upgrades,process redesigns and the integration of business acquisitionsmay not deliver the benefits contemplated and could adverselyimpact our ongoing operations
- If we fail to streamline our significant IT legacy system portfolioand proactively improve operating performance, this couldadversely affect our business and financial outcomes
- There may be a lack of competent and cost-effective resourcesto perform the life-cycle management and upgrades necessaryto maintain the operational status of legacy networks
| 96 BCE Inc. 2016 ANNUAL REPORT | |||
| 9 | Business risks | MD&A | |
Our operations and business continuity depend on how well we protect, test, maintain and replace our networks, IT systems, equipment and other facilities
Our operations depend on how well we and our contracted service providers protect our networks and IT systems, as well as other infrastructure and facilities, against damage from fire, natural disaster (including, without limitation, seismic and severe weather-related events such as ice, snow and wind storms, flooding, hurricanes, tornadoes and tsunamis), power loss, building cooling loss, unauthorized access or entry, cyber threats, disabling devices, acts of war or terrorism, sabotage, vandalism, actions of neighbours and other events. Establishing response strategies and business continuity protocols to maintain service consistency if any disruptive event materializes is critical to the achievement of effective customer service. Any of the above-mentioned events, as well as the failure to complete the planned testing, maintenance or replacement of our networks, equipment and other facilities due to factors beyond our control, could disrupt our operations (including through disruptions such as network failures, billing errors or delays in customer service), require significant resources and result in significant remediation costs, which in turn could have an adverse effect on our business and financial performance, or impair our ability to keep existing subscribers or attract new ones.
Satellites used to provide our satellite TV services are subject to significant operational risks that could have an adverse effect on our business and financial performance
Pursuant to a set of commercial arrangements between Bell ExpressVu and Telesat Canada (Telesat), we currently have two satellites under contract with Telesat. Telesat operates or directs the operation of these satellites, which utilize highly complex technology and operate in the harsh environment of space and are therefore subject to significant operational risks while in orbit. These risks include in-orbit equipment failures, malfunctions and other problems, commonly referred to as anomalies, that could reduce the commercial usefulness of a satellite used to provide our satellite TV services. Acts of war or terrorism, magnetic, electrostatic or solar storms, and space debris or meteoroids could also damage such satellites. Any loss, failure, manufacturing defect, damage or destruction of these satellites, of our terrestrial broadcasting infrastructure or of Telesat’s tracking, telemetry and control facilities to operate the satellites could have an adverse effect on our business and financial performance and could result in customers terminating their subscriptions to our DTH satellite TV service.
| People |
Our employees and contractors are key resources, and there is a broad and complex range of risks that must be managed effectively to drive a winning corporate culture and outstanding performance
Our business depends on the efforts, engagement and expertise of our management and non-management employees and contractors, who must be able to operate safely and securely based on the tasks they are completing and the environment in which they are functioning. If we fail to achieve this basic expectation, this could adversely affect our organizational culture, reputation and financial results as well as our ability to attract high-performing team members. Competition for highly skilled team members is intense, which makes the development of approaches to identify and secure high-performing candidates for a broad range of job functions, roles and responsibilities essential. Failure to appropriately train, motivate, remunerate or deploy employees on initiatives that further our strategic imperatives, or to efficiently replace retiring employees, could have an adverse impact on our ability to attract and retain talent and drive performance across the organization. The positive engagement of members of our team represented by unions is contingent on negotiating collective agreements that deliver competitive labour conditions and uninterrupted service, both of which are critical to achieving our business objectives. In addition, if the skill sets, diversity and size of the workforce do not match the operational requirements of the business and foster a winning culture, we will likely not be able to sustain our performance.
Other examples of people-related risks include the following:
- The increasing technical and operational complexity of ourbusinesses creates a challenging environment for hiring, retainingand developing skilled technical resources
- Failure to establish a complete and effective succession plan,including preparation of internal talent and identification ofpotential external candidates where relevant for key roles, couldimpair our business until qualified replacements are found
- Approximately 45% of our employees are represented by unionsand are covered by collective bargaining agreements.
Renegotiating collective bargaining agreements could result inhigher labour costs, project delays and work disruptions, includingwork stoppages or work slowdowns, which could adversely affectservice to our customers and, in turn, our customer relationshipsand financial performance. - Ensuring the safety and security of our workforce operating indifferent environments, including manholes, telephone poles, celltowers, vehicles, foreign news bureaus and war zones, requiresfocus, effective processes and flexibility to avoid injury, serviceinterruption, fines and reputational impact
BCE Inc. 2016 ANNUAL REPORT �� 97 | |||
| 9 | Business risks | MD&A | |
| Financial management |
If we are unable to raise the capital we need or generate sufficient cash flows from operations, we may need to limit our capital expenditures or our investments in new businesses, or try to raise capital by disposing of assets
Our ability to meet our cash requirements, fund capital expenditures and provide for planned growth depends on having access to adequate sources of capital and on our ability to generate cash flows from operations, which is subject to various risks, including those described in this MD&A.
Our ability to raise financing depends on our ability to access the public equity, debt capital and money markets, as well as the bank credit market. Our ability to access such markets and the cost and amount of funding available depend largely on prevailing market conditions and the outlook for our business and credit ratings at the time capital is raised. Risk factors such as capital market disruptions, Brexit, political, economic and financial market instability in the European Union, policies of the new U.S. administration, central bank monetary policies, changes to bank capitalization or other regulations, reduced bank lending in general or fewer banks as a result of reduced activity or consolidation could reduce capital available or increase the cost of such capital. In addition, an increased level of debt borrowings could result in lower credit ratings, increased borrowing costs and a reduction in the amount of funding available to us, including through equity offerings. Business acquisitions could also adversely affect our outlook and credit ratings and have similar adverse consequences. In addition, participants in the public capital and bank credit markets have internal policies limiting their ability to invest in, or extend credit to, any single entity or entity group or a particular industry.
Our bank credit facilities, including credit facilities supporting our commercial paper program, are provided by various financial institutions. While it is our intention to renew certain of such credit facilities from time to time, there are no assurances that these facilities will be renewed on favourable terms or in similar amounts.
Differences between BCE’s actual or anticipated financial results and the published expectations of financial analysts, as well as events affecting our business or operating environment, may contribute to volatility in BCE’s securities. A major decline in the capital markets in general, or an adjustment in the market price or trading volumes of BCE’s securities, may negatively affect our ability to raise debt or equity capital, retain senior executives and other key employees, make strategic acquisitions or enter into joint arrangements.
If we cannot access the capital we need or generate cash flows to implement our business plan or meet our financial obligations on acceptable terms, we may have to limit our ongoing capital expenditures and our investment in new businesses or try to raise additional capital by selling or otherwise disposing of assets. Any of these could have an adverse effect on our cash flows from operations and on our growth prospects.
We cannot guarantee that BCE’s dividend policy will be maintained or that dividends will be declared
The BCE Board reviews from time to time the adequacy of BCE’s dividend policy with the objective of allowing sufficient financial flexibility to continue investing in our business while growing returns to shareholders. Under the current dividend policy, increases in the common share dividend are directly linked to growth in BCE’s free cash flow. BCE’s dividend policy and the declaration of dividends on any of its outstanding shares are subject to the discretion of the BCE Board and, consequently, there can be no guarantee that BCE’s dividend policy will be maintained or that dividends will be declared. The declaration of dividends by the BCE Board is ultimately dependent on BCE’s operations and financial results, which are, in turn, subject to various assumptions and risks, including those set out in this MD&A.
We are exposed to various credit, liquidity and market risks
Our exposure to credit, liquidity and market risks, including equity price, interest rate and currency fluctuations, is discussed in section 6.5,Financial risk managementin this MD&A and in Note 24 in BCE’s 2016 consolidated financial statements.
Our failure to identify and manage our exposure to changes in interest rates, foreign exchange rates (especially a weakening Canadian dollar), BCE’s share price and other market conditions could lead to missed opportunities, reduced profit margins, cash flow shortages, inability to complete planned capital expenditures, reputational damage, stock and debenture devaluations and challenges in raising capital on market-competitive terms.
The economic environment, pension rules or ineffective governance could have an adverse effect on our pension obligations, liquidity and financial performance, and we may be required to increase contributions to our post-employment benefit plans in the future
With a large pension plan membership and DB pension plans that are subject to the pressures of the global economic environment and changing regulatory and reporting requirements, our pension obligations are exposed to potential volatility. Failure to recognize and manage economic exposure and pension rule changes, or to ensure that effective governance is in place for management and funding of pension plan assets and obligations, could have an adverse impact on our liquidity and financial performance.
The funding requirements of our post-employment benefit plans, based on valuations of plan assets and obligations, depend on a number of factors, including actual returns on post-employment benefit plan assets, long-term interest rates, plan demographics, and applicable regulations and actuarial standards. Changes in these factors could cause future contributions to significantly differ from our current estimates and could require us to increase contributions to our post-employment benefit plans in the future and, therefore, could have a negative effect on our liquidity and financial performance.
There is no assurance that the assets of our post-employment benefit plans will earn their assumed rate of return. A substantial portion of our post-employment benefit plans’ assets is invested in public equity and debt securities. As a result, the ability of our post-employment benefit plans’ assets to earn the rate of return that we have assumed significantly depends on the performance of capital markets. Market conditions also impact the discount rate used to calculate our solvency obligations and could therefore also significantly affect our cash funding requirements.
Our expected funding for 2017 is in accordance with the latest post-employment benefit plan valuations as of December 31, 2015, filed in June 2016, and takes into account voluntary contributions of $400 million in 2016.
| 98 BCE Inc. 2016 ANNUAL REPORT | |||
| 9 | Business risks | MD&A | |
Income and commodity tax amounts may materially differ from the expected amounts
Our complex business operations are subject to various tax laws, and the adoption of new tax laws, or regulations or rules thereunder, or changes thereto or in the interpretation thereof, could result in higher tax rates, new taxes or other adverse tax implications. In addition, while we believe that we have adequately provided for all income and commodity taxes based on all of the information that is currently available, the calculation of income taxes and the applicability of commodity taxes in many cases require significant judgment in interpreting tax rules and regulations. Our tax filings are subject to government audits that could result in material changes to the amount of current and deferred income tax assets and liabilities and other liabilities and could, in certain circumstances, result in an assessment of interest and penalties.
The failure to reduce costs as well as unexpected increases in costs could adversely affect our ability to achieve our strategic imperatives and our financial results
Our objectives for targeted cost reductions continue to be aggressive but there is no assurance that we will be successful in reducing costs, especially since incremental cost savings are more difficult to achieve on an ongoing basis. Our cost reduction objectives require aggressive negotiations with our suppliers and there can be no assurance that such negotiations will be successful or that replacement products or services provided will not lead to operational issues.
Examples of risks to our ability to reduce costs or of potential cost increases include:
- Achieving timely cost reductions while moving to an IP-based network is dependent on disciplined network decommissioning, which can be delayed by customer contractual commitments, regulatory considerations and other unforeseen obstacles
- Fluctuations in energy prices are partly influenced by governmentpolicies to address climate change which, combined with growingdata demand that increases our energy requirements, couldincrease our energy costs beyond our current expectations
- Failure to successfully deliver on our contractual commitments,whether due to security events, operational challenges or otherreasons, may result in financial penalties and loss of revenues
The failure to evolve practices to effectively monitor and control fraudulent activities could result in financial loss and brand degradation
As a public company with a range of desirable and valuable products and services and approximately 48,000 employees, the risk of fraud requires a disciplined program covering governance, exposure identification and assessment, prevention, detection and reporting that considers corruption, misappropriation of assets and intentional manipulation of financial statements by employees and/or external parties. Fraud events can result in financial loss and brand degradation.
Specific examples relevant to us include:
- Subscription fraud on accounts established with a false identityor paid with a stolen credit card
- Network usage fraud such as call/sell operations using ourwireline or wireless networks
- Copyright theft and other forms of unauthorized use thatundermine the exclusivity of Bell Media’s content offeringsand could potentially divert users to unlicensed or otherwiseillegitimate platforms, thus impacting our ability to derivedistribution and advertising revenues
- TV distributors including Bell Canada and Bell ExpressVuare subject to ongoing efforts to steal their services throughcompromise or circumvention of signal security systems,causing revenue loss
| Vendor oversight |
We depend on third-party suppliers and outsourcers, some of which are critical, to provide an uninterrupted supply of the products and services we need to operate our business
We depend on key third-party suppliers and outsourcers, over which we have no operational or financial control, for products and services, some of which are critical to our operations. If there are gaps in our supplier governance and oversight models established to ensure full risk transparency at point of purchase and throughout the relationship, including any contract renegotiations, there is the potential for a breakdown in supply, which could impact our ability to make sales, service customers and achieve our business and financial objectives. The outsourcing of services generally involves transfer of risk, and we must take appropriate steps to ensure that the outsourcers’ approach to risk management is aligned with our own standards in order to maintain continuity of supply and brand strength. Further, as cloud-based supplier models continue to evolve, our procurement and vendor management practices must also continue to evolve to fully address associated risk exposures.
Other examples of risks associated with vendor oversight include the following:
- Demand for products and services available from only a limitednumber of suppliers, some of which dominate their global market,may lead to decreased availability, increased costs or delays inthe delivery of such products and services, since suppliers maychoose to favour global competitors that are larger than we areand, accordingly, purchase a larger volume of products andservices. In addition, production issues affecting any suchsuppliers, or other suppliers, could result in decreased quantities,or a total lack of supply of products or services. Any of theseevents could adversely impact our ability to meet customercommitments and demand.
- Cloud-based solutions may increase the risk of security anddata leakage exposure if security control protocols affecting oursuppliers are bypassed
- Failure to maintain strong discipline around vendor administration(especially around initial account setup) may mask potential financialor operational risks and complicate future problem resolution
BCE Inc. 2016 ANNUAL REPORT 99 | |||
| 9 | Business risks | MD&A | |
- If products and services important to our operations have manufacturing defects or do not comply with applicable government regulations and standards (including product safety practices), our ability to sell products and provide services on a timely basis may be negatively impacted. We work with our suppliers to identify serious product defects (including safety incidents) and develop appropriate remedial strategies. Remedial strategies may include a recall of products. To the extent that a supplier does not actively participate in, and/or bear primary financial responsibility for, a recall of its products, our ability to perform such recall program at a reasonable cost and/or in a timely fashion may be negatively impacted. Any of the events referred to above could have an adverse effect on our operations and financial results.
- Products supplied to us may contain latent security issues, includingbut not limited to software security issues, that would not beapparent upon a diligent inspection of the products prior to their saleto our customers. To the extent that any such latent security issue isdiscovered, we work with our suppliers to identify and developremedial strategies. Should a supplier not actively (or be unable to)correct such latent security issue in a timely fashion, there could bean adverse effect on our operations and financial performance.
- Temporary or permanent operational failures or serviceinterruptions of the networks of other telecommunicationscarriers and suppliers on which we rely to deliver services couldadversely affect our ability to provide services using such carriers’and suppliers’ networks and could, consequently, have an adverseeffect on our business and financial performance
| Litigation and legal obligations |
Legal proceedings, changes in applicable laws and the failure to proactively address our legal and regulatory obligations could have an adverse effect on our business and financial performance
We become involved in various claims and legal proceedings as part of our business. Plaintiffs within Canada are able to launch and obtain certification of class actions on behalf of a large group of people with increasing ease, and Canadian provincial securities laws facilitate the introduction in Canada of class action lawsuits by secondary market investors against public companies for alleged misrepresentations in public disclosure documents and oral statements. Changes in laws or regulations, or in how they are interpreted, and the adoption of new laws or regulations, as well as pending or future litigation, including an increase in certified class actions which, by their nature, could result in sizeable damage awards and costs relating to litigation, could have an adverse effect on our business and financial performance.
Examples of legal and regulatory obligations that we must comply with include those resulting from:
- As discussed in more detail in section 8,Regulatory environment,decisions, policies and other initiatives of the CRTC, ISED, theCompetition Bureau and other governmental agencies, as well aslaws of a regulatory nature
- Consumer protection and privacy legislation
- Tax legislation
- Corporate and securities legislation
- IFRS requirements
- Environmental protection and health and safety laws
- Payment card industry standards for the protection againstcustomer credit card infractions
For a description of the principal legal proceedings involving us, please see the section entitledLegal proceedingscontained in the BCE 2016 AIF.
| Health and environmental concerns |
Health concerns about radiofrequency emissions from wireless communication devices, as well as epidemics and other health risks, could have an adverse effect on our business
Many studies have been performed or are ongoing to assess whether wireless phones, networks and towers pose a potential health risk. While some studies suggest links to certain conditions, others conclude there is no established causation between mobile phone usage and adverse health effects. In 2011, the International Agency for Research on Cancer (IARC) of the World Health Organization (WHO) classified radiofrequency electromagnetic fields from wireless phones as possibly carcinogenic to humans, but also indicated that chance, bias or confounding could not be ruled out with reasonable confidence. The IARC also called for additional research into long-term heavy use of mobile phones.
ISED is responsible for approving radiofrequency equipment and performing compliance assessments and has chosen Health Canada’s Safety Code 6, which sets the limits for safe exposure to radiofrequency emissions at home or at work, as its exposure standard. This code also outlines safety requirements for the installation and operation of devices that emit radiofrequency fields such as mobile phones, Wi-Fi technologies and base station antennas. ISED has made compliance to Safety Code 6 mandatory for all proponents and operators of radio installations.
| 100 BCE Inc. 2016 ANNUAL REPORT | |||
| 9 | Business risks | MD&A | |
Our business is heavily dependent on radiofrequency technologies, which could present significant challenges to our business and financial performance, such as the following:
- We face current and potential lawsuits relating to alleged adversehealth effects on customers, as well as to our marketing anddisclosure practices in connection therewith, and the likelyoutcome of such lawsuits is unpredictable and may changeover time
- Changes in scientific evidence and/or public perceptions couldlead to additional government regulations and costs forretrofitting infrastructure and handsets to achieve compliance
- Public concerns could result in a slower deployment of, or in ourinability to deploy, infrastructure necessary to maintain and/orexpand our wireless network as required by market evolution
In addition, epidemics, pandemics and other health risks could occur, which could adversely affect our ability to maintain operational networks and provide services to our customers. Any of these events could have an adverse effect on our business and financial performance.
Climate change and other environmental concerns could have an adverse effect on our business
Global climate change could exacerbate certain of the threats facing our business, including the frequency and severity of weather-related events referred to inOperational performance – Our operations and business continuity depend on how well we protect, test, maintain and replace our networks, IT systems, equipment and other facilitiesin this section 9. Several areas of our operations further raise environmental considerations, such as fuel storage, greenhouse gas emissions, disposal of hazardous residual materials, and recovery and recycling of end-of-life electronic products we sell or lease. Failure to recognize and adequately respond to changing governmental and public expectations on environmental matters could result in fines, missed opportunities, additional regulatory scrutiny or harm our brand and reputation.
| Proposed MTS acquisition |
The expected timing and completion of the proposed acquisition of MTS and of the proposed divestitures to the TELUS Group and Xplornet of certain assets are subject to certain closing conditions, termination rights and other risks and uncertainties
The expected timing and completion of the proposed acquisition by BCE of all of the issued and outstanding shares of MTS (the MTS Transaction), the proposed divestiture to the TELUS Group of a portion of MTS’ postpaid wireless subscribers and retail locations (the TELUS Transaction), and the proposed divestiture to Xplornet of certain wireless spectrum, wireless subscribers and retail locations and the receipt by Xplornet of certain operational benefits (the Xplornet Transaction and, together with the TELUS Transaction and the MTS Transaction, the Proposed Transactions) are each subject to certain closing conditions, termination rights and other risks and uncertainties. There can be no assurance that the Proposed Transactions will occur, or that they will occur on the timetable or on the terms and conditions currently contemplated. The Proposed Transactions could be modified, restructured or terminated. There can also be no assurance that the synergies or other benefits expected to result from the MTS Transaction, as well as our network deployment and capital investment plans in Manitoba, will be fully realized. The nature and value of capital investments planned to be made in Manitoba assume completion of the MTS Transaction as well as our ability to access or generate the necessary sources of capital. However, there can be no assurance that the MTS Transaction will be completed or that the required sources of capital will be available with the result that actual capital investments made by us in Manitoba could materially differ from current expectations.
BCE Inc. 2016 ANNUAL REPORT 101 | |||
| 10 | Financial measures, accounting policies and controls | MD&A | |
| 10 Financial measures, accounting policies and controls |
| 10.1 Our accounting policies |
This section discusses key estimates and assumptions that management has made and how they affect the amounts reported in the financial statements and notes. It also describes key changes in accounting standards and our accounting policies, and how they affect our financial statements.
We have prepared our consolidated financial statements using IFRS. Other significant accounting policies, not involving the same level of measurement uncertainty as those discussed in this section, are nevertheless important to an understanding of our financial statements. See Note 2,Significant accounting policies, in BCE’s 2016 consolidated financial statements for more information about the accounting principles we used to prepare our consolidated financial statements.
| Critical accounting estimates and key judgments |
When preparing financial statements, management makes estimates and judgments relating to:
- reported amounts of revenues and expenses
- reported amounts of assets and liabilities
- disclosure of contingent assets and liabilities
We base our estimates on a number of factors, including historical experience, current events and actions that the company may undertake in the future, and other assumptions that we believe are reasonable under the circumstances. By their nature, these estimates and judgments are subject to measurement uncertainty and actual results could differ.
We consider the estimates and judgments described in this section to be an important part of understanding our financial statements because they require management to make assumptions about matters that were highly uncertain at the time the estimates and judgments were made, and changes to these estimates and judgments could have a material impact on our financial statements and our segments.
Our senior management has reviewed the development and selection of the critical accounting estimates and judgments described in this section with the Audit Committee of the BCE Board.
Any sensitivity analysis included in this section should be used with caution as the changes are hypothetical and the impact of changes in each key assumption may not be linear.
Our more significant estimates and judgments are described below.
ESTIMATES
USEFUL LIVES OF PROPERTY, PLANT AND EQUIPMENT AND FINITE-LIFE INTANGIBLE ASSETS
We review our estimates of the useful lives of property, plant and equipment and finite-life intangible assets on an annual basis and adjust depreciation or amortization on a prospective basis, if needed.
Property, plant and equipment represent a significant proportion of our total assets. Changes in technology or our intended use of these assets, as well as changes in business prospects or economic and industry factors, may cause the estimated useful lives of these assets to change.
The estimated useful lives of property, plant and equipment and finite-life intangible assets are determined by internal asset life studies, which take into account actual and expected future usage, physical wear and tear, replacement history and assumptions about technology evolution. When factors indicate that assets’ useful lives are different from the prior assessment, we depreciate or amortize the remaining carrying value prospectively over the adjusted estimated useful lives.
Change in accounting estimate
In 2016, as part of our ongoing annual review of property, plant and equipment and finite-life intangible assets, and to better reflect their useful lives, we increased the estimate of useful lives of certain assets. The changes have been applied prospectively effective January 1, 2016 and did not have a significant impact on our financial statements.
POST-EMPLOYMENT BENEFIT PLANS
The amounts reported in the financial statements relating to DB pension plans and OPEBs are determined using actuarial calculations that are based on several assumptions.
Our actuaries perform a valuation at least every three years to determine the actuarial present value of the accrued DB pension plan and OPEB obligations. The actuarial valuation uses management’s assumptions for, among other things, the discount rate, life expectancy, the rate of compensation increase, trends in healthcare costs and expected average remaining years of service of employees.
While we believe that these assumptions are reasonable, differences in actual results or changes in assumptions could materially affect post-employment benefit obligations and future net post-employment benefit plans cost.
We account for differences between actual and expected results in benefit obligations and plan performance in OCI, which are then recognized immediately in the deficit.
The most significant assumptions used to calculate the net post-employment benefit plans cost are the discount rate and life expectancy.
A discount rate is used to determine the present value of the future cash flows that we expect will be needed to settle post-employment benefit obligations.
The discount rate is based on the yield on long-term, high-quality corporate fixed income investments, with maturities matching the estimated cash flows of the post-employment benefit plans. Life expectancy is based on publicly available Canadian mortality tables and is adjusted for the company’s specific experience.
A lower discount rate and a higher life expectancy result in a higher net post-employment benefit obligation and a higher current service cost.
| 102 BCE Inc. 2016 ANNUAL REPORT | |||
| 10 | Financial measures, accounting policies and controls | MD&A | |
Sensitivity analysis
The following table shows a sensitivity analysis of key assumptions used to measure the net post-employment benefit obligations and the net post-employment benefit plans cost for our DB pension plans and OPEB plans.
| IMPACT ON NET POST-EMPLOYMENT BENEFIT PLANS COST FOR 2016 – INCREASE (DECREASE) | IMPACT ON POST-EMPLOYMENT BENEFIT OBLIGATIONS AT DECEMBER 31, 2016 – INCREASE (DECREASE) | |||||||||
| CHANGE IN ASSUMPTION | INCREASE IN ASSUMPTION | DECREASE IN ASSUMPTION | INCREASE IN ASSUMPTION | DECREASE IN ASSUMPTION | |||||
Discount rate | 0.5 | % | (77 | ) | 66 | (1,435 | ) | 1,533 | ||
Life expectancy at age 65 | 1 year | 34 | (33 | ) | 699 | (678 | ) | |||
IMPAIRMENT OF NON-FINANCIAL ASSETS
Goodwill and indefinite-life intangible assets are tested for impairment annually or when there is an indication that the asset may be impaired. Property, plant and equipment and finite-life intangible assets are tested for impairment if events or changes in circumstances, assessed at each reporting period, indicate that their carrying amount may not be recoverable. For the purpose of impairment testing, assets other than goodwill are grouped at the lowest level for which there are separately identifiable cash inflows.
Impairment losses are recognized and measured as the excess of the carrying value of the assets over their recoverable amount. An asset’s recoverable amount is the higher of its fair value less costs of disposal and its value in use. Previously recognized impairment losses, other than those attributable to goodwill, are reviewed for possible reversal at each reporting date and, if the asset’s recoverable amount has increased, all or a portion of the impairment is reversed.
We make a number of estimates when calculating recoverable amounts using discounted future cash flows or other valuation methods to test for impairment. These estimates include the assumed growth rates for future cash flows, the number of years used in the cash flow model, and the discount rate. When impairment charges occur they are recorded inOther income (expense).
In 2015, we recorded an impairment charge of $49 million, of which $38 million was allocated to indefinite-life intangible assets, $9 million to finite-life intangible assets and $2 million to property, plant and equipment. The impairment charge related mainly to our music cash generating unit (CGU) within our Bell Media segment and resulted from revenue and profitability declines from lower viewership and higher TV content costs. The charge was determined by comparing the carrying value of the CGU to its fair value less costs of disposal. We estimated the fair value of the CGU using both discounted cash flows and market-based valuation models which include five-year cash flow projections derived from business plans reviewed by senior management for the period of January 1, 2016 to December 31, 2020, using a discount rate of 9.0% and a perpetuity growth rate of nil, as well as market multiple data from public companies and market transactions. The carrying value of our music CGU was $171 million at December 31, 2015.
Goodwill impairment testing
We perform an annual test for goodwill impairment in the fourth quarter for each of our CGUs or groups of CGUs to which goodwill is allocated and whenever there is an indication that goodwill might be impaired.
A CGU is the smallest identifiable group of assets that generates cash inflows that are independent of the cash inflows from other assets or groups of assets.
We identify any potential impairment by comparing the carrying value of a CGU or group of CGUs to its recoverable amount. The recoverable amount of a CGU or group of CGUs is the higher of its fair value less costs of disposal and its value in use. Both fair value less costs of disposal and value in use are based on estimates of discounted future cash flows or other valuation methods. Cash flows are projected based on past experience, actual operating results and business plans. When the recoverable amount of a CGU or group of CGUs is less than its carrying value, the recoverable amount is determined for its identifiable assets and liabilities. The excess of the recoverable amount of the CGU or group of CGUs over the total of the amounts assigned to its assets and liabilities is the recoverable amount of goodwill.
An impairment charge is recognized inOther income (expense)in the income statements for any excess of the carrying value of goodwill over its recoverable amount. For purposes of impairment testing of goodwill, BCE’s CGUs or groups of CGUs correspond to our reporting segments as disclosed in Note 4,Segmented information, in BCE’s 2016 consolidated financial statements.
Any significant change in each of the estimates used could have a material impact on the calculation of the recoverable amount and resulting impairment charge. As a result, we are unable to reasonably quantify the changes in our overall financial performance if we had used different assumptions.
We cannot predict whether an event that triggers impairment will occur, when it will occur or how it will affect the asset values we have reported.
For the Bell Media group of CGUs, a decrease of (0.4%) in the perpetuity growth rate or an increase of 0.3% in the discount rate, would have resulted in its recoverable amount being equal to its carrying value. There were no goodwill impairment charges in 2016 or 2015.
DEFERRED TAXES
Deferred tax assets and liabilities are calculated at the tax rates that are expected to apply when the asset or liability is recovered or settled. Both our current and deferred tax assets and liabilities are calculated using tax rates that have been enacted or substantively enacted at the reporting date.
Deferred taxes are provided on temporary differences arising from investments in subsidiaries, joint arrangements and associates, except where we control the timing of the reversal of the temporary difference and it is probable that the temporary difference will not reverse in the foreseeable future.
The amount of deferred tax assets is estimated with consideration given to the timing, sources and amounts of future taxable income.
BCE Inc. 2016 ANNUAL REPORT 103 | |||
| 10 | Financial measures, accounting policies and controls | MD&A | |
FAIR VALUE OF FINANCIAL INSTRUMENTS
Certain financial instruments, such as investments in equity securities, derivative financial instruments and certain elements of borrowings, are carried in the statements of financial position at fair value, with changes in fair value reflected in the income statements and the statements of comprehensive income. Fair values are estimated by reference to published price quotations or by using other valuation techniques that may include inputs that are not based on observable market data, such as discounted cash flows and earnings multiples.
CONTINGENCIES
In the ordinary course of business, we become involved in various claims and legal proceedings seeking monetary damages and other relief. Pending claims and legal proceedings represent a potential cost to our business. We estimate the amount of a loss by analyzing potential outcomes and assuming various litigation and settlement strategies, based on information that is available at the time.
If the final resolution of a legal or regulatory matter results in a judgment against us or requires us to pay a large settlement, it could have a material adverse effect on our consolidated financial statements in the period in which the judgment or settlement occurs.
ONEROUS CONTRACTS
A provision for onerous contracts is recognized when the unavoidable costs of meeting our obligations under a contract exceed the expected benefits to be received under the contract. The provision is measured at the present value of the lower of the expected cost of terminating the contract and the expected net cost of completing the contract.
JUDGMENTS
POST-EMPLOYMENT BENEFIT PLANS
The determination of the discount rate used to value our post-employment benefit obligations requires judgment. The rate is set by reference to market yields of high-quality corporate fixed income investments at the beginning of each fiscal year. Significant judgment is required when setting the criteria for fixed income investments to be included in the population from which the yield curve is derived. The most significant criteria considered for the selection of investments include the size of the issue and credit quality, along with the identification of outliers, which are excluded.
INCOME TAXES
The calculation of income taxes requires judgment in interpreting tax rules and regulations. There are transactions and calculations for which the ultimate tax determination is uncertain. Our tax filings are also subject to audits, the outcome of which could change the amount of current and deferred tax assets and liabilities. Management believes that it has sufficient amounts accrued for outstanding tax matters based on information that currently is available.
Management judgment is used to determine the amounts of deferred tax assets and liabilities and future tax liabilities to be recognized. In particular, judgment is required when assessing the timing of the reversal of temporary differences to which future income tax rates are applied.
MULTIPLE ELEMENT ARRANGEMENTS
Determining the amounts of revenue to be recognized for multiple element arrangements requires judgment to establish the separately identifiable components and the allocation of the total price between those components.
CGUs
The determination of CGUs or groups of CGUs for the purpose of annual impairment testing requires judgment.
CONTINGENCIES
We accrue a potential loss if we believe a loss is probable and an outflow of resources is likely and can be reasonably estimated, based on information that is available at the time. Any accrual would be charged to earnings and included inTrade payables and other liabilitiesorOther non-current liabilities. Any payment as a result of a judgment or cash settlement would be deducted from cash from operating activities. We estimate the amount of a loss by analyzing potential outcomes and assuming various litigation and settlement strategies.
The determination of whether a loss is probable from claims and legal proceedings and whether an outflow of resources is likely requires judgment.
| Adoption of amended accounting standards |
As required, effective January 1, 2016, we adopted the following amended accounting standards on a prospective basis, none of which had a significant impact on our consolidated financial statements.
STANDARD | DESCRIPTION | IMPACT |
Amendments to International Accounting Standard (IAS) 16 – Property, Plant and Equipment and IAS 38 – Intangible Assets | Clarifies that a revenue-based approach to calculate depreciation and amortization generally is not appropriate as it does not reflect the consumption of the economic benefits embodied in the related asset. | This amendment did not have a significant impact on our financial statements. |
Amendments to IFRS 11 – Joint Arrangements | Provides guidance on the accounting for acquisitions of interests in joint operations in which the activity constitutes a business, as defined in IFRS 3 – Business Combinations. The amended standard requires the acquirer to apply all of the principles on accounting for business combinations in IFRS 3 and other IFRSs except for any principles that conflict with IFRS 11. | This amendment did not have a significant impact on our financial statements. |
| 104 BCE Inc. 2016 ANNUAL REPORT | |||
| 10 | Financial measures, accounting policies and controls | MD&A | |
Future changes to accounting standards
The following new or amended standards issued by the IASB have an effective date after December 31, 2016 and have not yet been adopted by BCE.
STANDARD | DESCRIPTION | IMPACT | EFFECTIVE DATE |
Amendments to IAS 7 – Statement of Cash Flows | Requires enhanced disclosures about changes in liabilities arising from financing activities, including changes from financing cash flows, changes arising from obtaining or losing control of subsidiaries or other businesses, the effect of changes in foreign exchange rates and changes in fair values. | Additional disclosures will be provided in the notes to our financial statements if required. | Annual periods beginning on or after January 1, 2017, applied prospectively. |
IFRS 15 – Revenue from Contracts with Customers | Establishes principles to record revenues from contracts for the sale of goods or services, unless the contracts are in the scope of IAS 17 – Leases or other IFRSs. Under IFRS 15, revenue is recognized at an amount that reflects the expected consideration receivable in exchange for transferring goods or services to a customer, applying the following five steps: 1. Identify the contract with a customer 2. Identify the performance obligations in the contract 3. Determine the transaction price 4. Allocate the transaction price to the performance obligations in the contract 5. Recognize revenue when (or as) the entity satisfies a performance obligation The new standard also provides guidance relating to principal versus agent relationships, licences of intellectual property, contract costs and the measurement and recognition of gains and losses on the sale of certain non-financial assets such as property and equipment. Additional disclosures will also be required under the new standard. | IFRS 15 will principally affect the timing of revenue recognition, how we classify revenues between product and service and how we account for costs to obtain and fulfill a contract. Under multiple-element arrangements, although the total revenue recognized during the term of a contract will be largely unaffected, the revenue allocated to a delivered item will no longer be limited to the non-contingent amount. This may accelerate the recognition of revenue ahead of the associated cash inflows and result in a corresponding contract asset recorded on the balance sheet, to be realized over the term of the customer contract. We continue to make progress towards adoption of IFRS 15 according to our detailed implementation plan. Changes and enhancements to our existing IT systems, business processes, and systems of internal control are being designed, tested and implemented. A dedicated project team that leverages key resources throughout the company is also in place to effect the necessary changes. Throughout 2017, systems and processes will be put in place to collect and compile the new data required to reflect the impact of IFRS 15 on our 2018 financial statements and key operating metrics and determine the impact to our historical comparative information. Accordingly, it is not yet possible to make a reliable estimate of the impact of the new standard on our financial statements. We expect that the impact of the new standard will be most pronounced in our Bell Wireless segment. While total revenue recognized over the term of a customer contract is not expected to change significantly, revenue recognition will be accelerated for certain customer contracts and a greater proportion of revenue will be classified to product revenue. | Annual periods beginning on or after January 1, 2018, using either a full retrospective approach for all periods presented in the period of adoption or a modified retrospective approach. |
Amendments to IFRS 2 – Share-based Payment | Clarifies the classification and measurement of cash-settled share-based payment transactions that include a performance condition, share-based payment transactions with a net settlement feature for withholding tax obligations, and modifications of a share-based payment transaction from cash-settled to equity-settled. | The amendments to IFRS 2 are not expected to have a significant impact on our financial statements. | Annual periods beginning on or after January 1, 2018. |
BCE Inc. 2016 ANNUAL REPORT 105 | |||
| 10 | Financial measures, accounting policies and controls | MD&A | |
STANDARD | DESCRIPTION | IMPACT | EFFECTIVE DATE |
IFRS 9 – Financial Instruments
| Sets out the requirements for recognizing and measuring financial assets, financial liabilities and some contracts to buy and sell non-financial items. IFRS 9 replaces IAS 39 – Financial Instruments: Recognition and Measurement. The new standard establishes a single classification and measurement approach for financial assets that reflects the business model in which they are managed and their cash flow characteristics. It also provides guidance on an entity’s own credit risk relating to financial liabilities and has modified the hedge accounting model to better link the economics of risk management with its accounting treatment. Additional disclosures will also be required under the new standard. | We are currently evaluating the impact of IFRS 9 on our financial statements. | Annual periods beginning on or after January 1, 2018. |
IFRS 16 – Leases
| Eliminates the distinction between operating and finance leases for lessees, requiring instead that leases be capitalized by recognizing the present value of the lease payments and showing them either as lease assets (right-of-use assets) or together with property, plant and equipment. If lease payments are made over time, an entity recognizes a financial liability representing its obligation to make future lease payments. A depreciation charge for the lease asset is recorded within operating costs and an interest expense on the lease liability is recorded within finance costs. IFRS 16 does not require a lessee to recognize assets and liabilities for short-term leases and leases of low-value assets, nor does it substantially change lease accounting for lessors. | We are currently evaluating the impact of IFRS 16 on our financial statements. | Annual periods beginning on or after January 1, 2019, using either a full retrospective approach for all periods presented in the period of adoption or a modified retrospective approach, with early adoption permitted if an entity has adopted IFRS 15. |
| 10.2 Non-GAAP financial measures and key performance indicators (KPIs) |
This section describes the non-GAAP financial measures and KPIs we use in this MD&A to explain our financial results. It also provides reconciliations of the non-GAAP financial measures to the most comparable IFRS financial measures.
| Adjusted EBITDA and adjusted EBITDA margin |
The terms adjusted EBITDA and adjusted EBITDA margin do not have any standardized meaning under IFRS. Therefore, they are unlikely to be comparable to similar measures presented by other issuers.
We define adjusted EBITDA as operating revenues less operating costs, as shown in BCE’s consolidated income statements. Adjusted EBITDA for BCE’s segments is the same as segment profit as reported in Note 4,Segmented information, in BCE’s 2016 consolidated financial statements. We define adjusted EBITDA margin as adjusted EBITDA divided by operating revenues.
We use adjusted EBITDA and adjusted EBITDA margin to evaluate the performance of our businesses as they reflect their ongoing profitability. We believe that certain investors and analysts use adjusted EBITDA to measure a company’s ability to service debt and to meet other payment obligations or as a common measurement to value companies in the telecommunications industry. We believe that certain investors and analysts also use adjusted EBITDA and adjusted EBITDA margin to evaluate the performance of our businesses. Adjusted EBITDA is also one component in the determination of short-term incentive compensation for all management employees.
| 106 BCE Inc. 2016 ANNUAL REPORT | |||
| 10 | Financial measures, accounting policies and controls | MD&A | |
Adjusted EBITDA and adjusted EBITDA margin have no directly comparable IFRS financial measure. Alternatively, the following table provides a reconciliation of net earnings to adjusted EBITDA.
| 2016 | 2015 | ||
Net earnings | 3,087 | 2,730 | ||
Severance, acquisition and other costs | 135 | 446 | ||
Depreciation | 2,877 | 2,890 | ||
Amortization | 631 | 530 | ||
Finance costs | ||||
Interest expense | 888 | 909 | ||
Interest on post-employment benefit obligations | 81 | 110 | ||
Other (income) expense | (21 | ) | 12 | |
Income taxes | 1,110 | 924 | ||
Adjusted EBITDA | 8,788 | 8,551 | ||
BCE operating revenues | 21,719 | 21,514 | ||
Adjusted EBITDA margin | 40.5 | % | 39.7 | % |
| Adjusted net earnings and adjusted EPS |
The terms adjusted net earnings and adjusted EPS do not have any standardized meaning under IFRS. Therefore, they are unlikely to be comparable to similar measures presented by other issuers.
We define adjusted net earnings as net earnings attributable to common shareholders before severance, acquisition and other costs, net losses (gains) on investments, and early debt redemption costs. We define adjusted EPS as adjusted net earnings per BCE common share.
We use adjusted net earnings and adjusted EPS, and we believe that certain investors and analysts use these measures, among other ones, to assess the performance of our businesses without the effects of severance, acquisition and other costs, net losses (gains) on investments, and early debt redemption costs, net of tax and NCI. We exclude these items because they affect the comparability of our financial results and could potentially distort the analysis of trends in business performance. Excluding these items does not imply they are non-recurring.
The most comparable IFRS financial measures are net earnings attributable to common shareholders and EPS. The following table is a reconciliation of net earnings attributable to common shareholders and EPS to adjusted net earnings on a consolidated basis and per BCE common share (adjusted EPS), respectively.
| 2016 | 2015 | |||||||
| TOTAL | PER SHARE | TOTAL | PER SHARE | ||||
Net earnings attributable to common shareholders | 2,894 | 3.33 | 2,526 | 2.98 | ||||
Severance, acquisition and other costs | 104 | 0.12 | 327 | 0.38 | ||||
Net losses (gains) on investments | 3 | – | (21 | ) | (0.02 | ) | ||
Early debt redemption costs | 8 | 0.01 | 13 | 0.02 | ||||
Adjusted net earnings | 3,009 | 3.46 | 2,845 | 3.36 | ||||
| Free cash flow and dividend payout ratio |
The terms free cash flow and dividend payout ratio do not have any standardized meaning under IFRS. Therefore, they are unlikely to be comparable to similar measures presented by other issuers.
We define free cash flow as cash flows from operating activities, excluding acquisition and other costs paid (which include significant litigation costs) and voluntary pension funding, less capital expenditures, preferred share dividends and dividends paid by subsidiaries to NCI. We exclude acquisition and other costs paid and voluntary pension funding because they affect the comparability of our financial results and could potentially distort the analysis of trends in business performance. Excluding these items does not imply they are non-recurring.
We consider free cash flow to be an important indicator of the financial strength and performance of our businesses because it shows how much cash is available to pay dividends, repay debt and reinvest in our company. We believe that certain investors and analysts use free cash flow to value a business and its underlying assets and to evaluate the financial strength and performance of our businesses. The most comparable IFRS financial measure is cash flows from operating activities.
We define dividend payout ratio as dividends paid on common shares divided by free cash flow. We consider dividend payout ratio to be an important indicator of the financial strength and performance of our businesses because it shows the sustainability of the company’s dividend payments.
BCE Inc. 2016 ANNUAL REPORT 107 | |||
| 10 | Financial measures, accounting policies and controls | MD&A | |
The following table is a reconciliation of cash flows from operating activities to free cash flow on a consolidated basis.
| 2016 | 2015 | |||
Cash flows from operating activities | 6,643 | 6,274 | ||
Capital expenditures | (3,771 | ) | (3,626 | ) |
Cash dividends paid on preferred shares | (126 | ) | (150 | ) |
Cash dividends paid by subsidiaries to NCI | (46 | ) | (41 | ) |
Acquisition and other costs paid | 126 | 292 | ||
Voluntary defined benefit pension plan contribution | 400 | 250 | ||
Free cash flow | 3,226 | 2,999 |
| Net debt |
The term net debt does not have any standardized meaning under IFRS. Therefore, it is unlikely to be comparable to similar measures presented by other issuers.
We define net debt as debt due within one year plus long-term debt and 50% of preferred shares, less cash and cash equivalents, as shown in BCE’s consolidated statements of financial position. We include 50% of outstanding preferred shares in our net debt as it is consistent with the treatment by certain credit rating agencies.
We consider net debt to be an important indicator of the company’s financial leverage because it represents the amount of debt that is not covered by available cash and cash equivalents. We believe that certain investors and analysts use net debt to determine a company’s financial leverage.
Net debt has no directly comparable IFRS financial measure, but rather is calculated using several asset and liability categories from the statements of financial position, as shown in the following table.
| 2016 | 2015 | |||
Debt due within one year | 4,887 | 4,895 | ||
Long-term debt | 16,572 | 15,390 | ||
50% of outstanding preferred shares | 2,002 | 2,002 | ||
Cash and cash equivalents | (853 | ) | (613 | ) |
Net debt | 22,608 | 21,674 |
| Net debt leverage ratio |
The net debt leverage ratio does not have any standardized meaning under IFRS. Therefore, it is unlikely to be comparable to similar measures presented by other issuers. We use, and believe that certain investors and analysts use, the net debt leverage ratio as a measure of financial leverage.
The net debt leverage ratio represents net debt divided by adjusted EBITDA. For the purposes of calculating our net debt leverage ratio, adjusted EBITDA is twelve-month trailing adjusted EBITDA.
| Adjusted EBITDA to net interest expense ratio |
The ratio of adjusted EBITDA to net interest expense does not have any standardized meaning under IFRS. Therefore, it is unlikely to be comparable to similar measures presented by other issuers. We use, and believe that certain investors and analysts use, the adjusted EBITDA to net interest expense ratio as a measure of financial health of the company.
The adjusted EBITDA to net interest expense ratio represents adjusted EBITDA divided by net interest expense. For the purposes of calculating our adjusted EBITDA to net interest expense ratio, adjusted EBITDA is twelve-month trailing adjusted EBITDA. Net interest expense is twelve-month trailing net interest expense as shown in our statements of cash flows, plus 50% of declared preferred share dividends as shown in our income statements.
| 108 BCE Inc. 2016 ANNUAL REPORT | |||
| 10 | Financial measures, accounting policies and controls | MD&A | |
| KPIs |
In addition to the non-GAAP financial measures described previously, we use a number of KPIs to measure the success of our strategic imperatives. These KPIs are not accounting measures and may not be comparable to similar measures presented by other issuers.
KPI | DEFINITION |
ARPU | Average revenue per user (ARPU) or subscriber is a measure used to track our recurring revenue streams. Wireless blended ARPU is calculated by dividing certain service revenue by the average subscriber base for the specified period and is expressed as a dollar unit per month. |
Capital intensity | Capital expenditures divided by operating revenues. |
Churn | Churn is the rate at which existing subscribers cancel their services. It is a measure of our ability to retain our customers. Wireless churn is calculated by dividing the number of deactivations during a given period by the average number of subscribers in the base for the specified period and is expressed as a percentage per month. |
COA | COA is also referred to as subscriber acquisition costs. COA represents the total cost associated with acquiring a customer and includes costs such as hardware discounts, marketing and distribution costs. This measure is expressed per gross activation during the period. |
Subscriber unit | Wireless subscriber unit is comprised of an active revenue-generating unit (e.g. mobile device, tablet or wireless Internet products), with a unique identifier (typically International Mobile Equipment Identity (IMEI) number), that has access to our wireless networks. We report wireless subscriber units in two categories: postpaid and prepaid. Prepaid subscriber units are considered active for a period of 120 days following the expiry of the subscriber’s prepaid balance. Wireline subscriber unit consists of an active revenue-generating unit with access to our services, including Internet, satellite TV, IPTV, and/or NAS. A subscriber is included in our subscriber base when the service has been installed and is operational at the customer premise and a billing relationship has been established.
|
| 10.3 Effectiveness of internal controls |
Disclosure controls and procedures
Our disclosure controls and procedures are designed to provide reasonable assurance that information required to be disclosed by us in reports filed or submitted under Canadian and U.S. securities laws is recorded, processed, summarized and reported within the time periods specified under those laws, and include controls and procedures that are designed to ensure that the information is accumulated and communicated to management, including BCE’s President and CEO and Executive Vice-President and Chief Financial Officer (CFO), to allow timely decisions regarding required disclosure.
As at December 31, 2016, management evaluated, under the supervision of and with the participation of the CEO and the CFO, the effectiveness of our disclosure controls and procedures, as defined in Rule 13a-15(e) under the U.S.Securities Exchange Act of 1934, as amended, and under National Instrument 52-109 –Certification of Disclosure in Issuers’ Annual and Interim Filings.
Based on that evaluation, the CEO and CFO concluded that our disclosure controls and procedures were effective as at December 31, 2016.
| Internal control over financial reporting |
Management is responsible for establishing and maintaining adequate internal control over financial reporting, as defined in Rule 13(a)-15(f) under the U.S.Securities Exchange Act of 1934, as amended, and under National Instrument 52-109. Our internal control over financial reporting is a process designed under the supervision of the CEO and CFO, and effected by the Board, management and other personnel of BCE, to provide reasonable assurance regarding the reliability of financial reporting and the preparation of financial statements for external purposes in accordance with IFRS. However, because of its inherent limitations, internal control over financial reporting may not prevent or detect misstatements on a timely basis.
Management evaluated, under the supervision of and with the participation of the CEO and the CFO, the effectiveness of our internal control over financial reporting as at December 31, 2016, based on the criteria established inInternal Control – Integrated Framework (2013)issued by the Committee of Sponsoring Organizations of the Treadway Commission (COSO).
Based on that evaluation, the CEO and CFO concluded that our internal control over financial reporting was effective as at December 31, 2016.
There have been no changes during the year ended December 31, 2016 in our internal control over financial reporting that have materially affected, or are reasonably likely to materially affect, our internal control over financial reporting.
BCE Inc. 2016 ANNUAL REPORT 109 | |||
| Reports on internal control | |||
| Reports on internal control |
Management’s report on internal control over financial reporting
The management of BCE Inc. (BCE) is responsible for establishing and maintaining adequate internal control over financial reporting. Our internal control over financial reporting is a process designed under the supervision of the President and Chief Executive Officer and the Executive Vice-President and Chief Financial Officer and effected by the Board of Directors, management and other personnel of BCE, to provide reasonable assurance regarding the reliability of financial reporting and the preparation of financial statements for external purposes in accordance with International Financial Reporting Standards (IFRS) as issued by the International Accounting Standards Board (IASB).
Due to its inherent limitations, internal control over financial reporting may not prevent or detect misstatements on a timely basis. Also, projections of any evaluation of the effectiveness of internal control over financial reporting to future periods are subject to the risk that the controls may become inadequate because of changes in conditions, or that the degree of compliance with the policies or procedures may deteriorate.
Management evaluated, under the supervision of and with the participation of the President and Chief Executive Officer and the Executive Vice-President and Chief Financial Officer, the effectiveness of our internal control over financial reporting as at December 31, 2016, based on the criteria established inInternal Control – Integrated Framework (2013)issued by the Committee of Sponsoring Organizations of the Treadway Commission (COSO).
Based on that evaluation, the President and Chief Executive Officer and the Executive Vice-President and Chief Financial Officer concluded that our internal control over financial reporting was effective as at December 31, 2016. There were no material weaknesses that have been identified by BCE’s management in internal control over financial reporting as at December 31, 2016.
Our internal control over financial reporting as at December 31, 2016 has been audited by Deloitte LLP, Independent Registered Public Accounting Firm, who also audited our consolidated financial statements for the year ended December 31, 2016. Deloitte LLP issued an unqualified opinion on the effectiveness of our internal control over financial reporting as at December 31, 2016.
(signed) George A. Cope
President and Chief Executive Officer
(signed) Glen LeBlanc
Executive Vice-President and Chief Financial Officer
(signed) Thierry Chaumont
Senior Vice-President and Controller
March 2, 2017
| 110 BCE Inc. 2016 ANNUAL REPORT | |||
| Reports on internal control | |||
Report of independent registered public accounting firm
To the Board of Directors and Shareholders of BCE Inc.
We have audited the internal control over financial reporting of BCE Inc. and subsidiaries (the “Company”) as of December 31, 2016, based on the criteria established in Internal Control – Integrated Framework (2013) issued by the Committee of Sponsoring Organizations of the Treadway Commission. The Company’s management is responsible for maintaining effective internal control over financial reporting and for its assessment of the effectiveness of internal control over financial reporting, included in the accompanying Management’s Report on Internal Control over Financial Reporting. Our responsibility is to express an opinion on the Company’s internal control over financial reporting based on our audit.
We conducted our audit in accordance with the standards of the Public Company Accounting Oversight Board (United States). Those standards require that we plan and perform the audit to obtain reasonable assurance about whether effective internal control over financial reporting was maintained in all material respects. Our audit included obtaining an understanding of internal control over financial reporting, assessing the risk that a material weakness exists, testing and evaluating the design and operating effectiveness of internal control based on the assessed risk, and performing such other procedures as we considered necessary in the circumstances. We believe that our audit provides a reasonable basis for our opinion.
A company’s internal control over financial reporting is a process designed by, or under the supervision of, the company’s principal executive and principal financial officers, or persons performing similar functions, and effected by the company’s board of directors, management, and other personnel to provide reasonable assurance regarding the reliability of financial reporting and the preparation of financial statements for external purposes in accordance with International Financial Reporting Standards as issued by the International Accounting Standards Board. A company’s internal control over financial reporting includes those policies and procedures that (1) pertain to the maintenance of records that, in reasonable detail, accurately and fairly reflect the transactions and dispositions of the assets of the company; (2) provide reasonable assurance that transactions are recorded as necessary to permit preparation of financial statements in accordance with International Financial Reporting Standards as issued by the International Accounting Standards Board, and that receipts and expenditures of the company are being made only in accordance with authorizations of management and directors of the company; and (3) provide reasonable assurance regarding prevention or timely detection of unauthorized acquisition, use, or disposition of the company’s assets that could have a material effect on the financial statements.
Because of the inherent limitations of internal control over financial reporting, including the possibility of collusion or improper management override of controls, material misstatements due to error or fraud may not be prevented or detected on a timely basis. Also, projections of any evaluation of the effectiveness of the internal control over financial reporting to future periods are subject to the risk that the controls may become inadequate because of changes in conditions, or that the degree of compliance with the policies or procedures may deteriorate.
In our opinion, the Company maintained, in all material respects, effective internal control over financial reporting as of December 31, 2016, based on the criteria established inInternal Control – Integrated Framework (2013)issued by the Committee of Sponsoring Organizations of the Treadway Commission.
We have also audited, in accordance with Canadian generally accepted auditing standards and the standards of the Public Company Accounting Oversight Board (United States), the consolidated financial statements as of and for the year ended December 31, 2016 of the Company and our report dated March 2, 2017 expressed an unmodified/unqualified opinion on those financial statements.
/s/ Deloitte LLP(1)
Montréal, Canada
March 2, 2017
(1)CPA auditor, CA, public accountancy permit No. A104630
BCE Inc. 2016 ANNUAL REPORT 111 | |||
| Consolidated financial statements | |||
| Consolidated financial statements |
Management’s responsibility for financial reporting
These financial statements form the basis for all of the financial information that appears in this annual report.
The financial statements and all of the information in this annual report are the responsibility of the management of BCE Inc. (BCE) and have been reviewed and approved by the board of directors. The board of directors is responsible for ensuring that management fulfills its financial reporting responsibilities. Deloitte LLP, Independent Registered Public Accounting Firm, have audited the financial statements.
Management has prepared the financial statements according to International Financial Reporting Standards (IFRS) as issued by the International Accounting Standards Board. Under these principles, management has made certain estimates and assumptions that are reflected in the financial statements and notes. Management believes that these financial statements fairly present BCE’s consolidated financial position, results of operations and cash flows.
Management has a system of internal controls designed to provide reasonable assurance that the financial statements are accurate and complete in all material respects. This is supported by an internal audit group that reports to the Audit Committee, and includes communication with employees about policies for ethical business conduct. Management believes that the internal controls provide reasonable assurance that our financial records are reliable and form a proper basis for preparing the financial statements, and that our assets are properly accounted for and safeguarded.
The board of directors has appointed an Audit Committee, which is made up of unrelated and independent directors. The Audit Committee’s responsibilities include reviewing the financial statements and other information in this annual report, and recommending them to the board of directors for approval. You will find a description of the Audit Committee’s other responsibilities on page 156 of this annual report. The internal auditors and the shareholders’ auditors have free and independent access to the Audit Committee.
(signed) George A. Cope
President and Chief Executive Officer
(signed) Glen LeBlanc
Executive Vice-President and Chief Financial Officer
(signed) Thierry Chaumont
Senior Vice-President and Controller
March 2, 2017
| 112 BCE Inc. 2016 ANNUAL REPORT | |||
| Consolidated financial statements | |||
Report of independent registered public accounting firm
To the Board of Directors and Shareholders of BCE Inc.
We have audited the accompanying consolidated financial statements of BCE Inc. and subsidiaries (the “Company”), which comprise the consolidated statements of financial position as at December 31, 2016 and December 31, 2015, and the consolidated income statements, consolidated statements of comprehensive income, consolidated statements of changes in equity, and consolidated statements of cash flows for the years then ended, and a summary of significant accounting policies and other explanatory information.
MANAGEMENT’S RESPONSIBILITY FOR THE CONSOLIDATED FINANCIAL STATEMENTS
Management is responsible for the preparation and fair presentation of these consolidated financial statements in accordance with International Financial Reporting Standards as issued by the International Accounting Standards Board, and for such internal control as management determines is necessary to enable the preparation of consolidated financial statements that are free from material misstatement, whether due to fraud or error.
AUDITOR’S RESPONSIBILITY
Our responsibility is to express an opinion on these consolidated financial statements based on our audits. We conducted our audits in accordance with Canadian generally accepted auditing standards and the standards of the Public Company Accounting Oversight Board (United States). Those standards require that we comply with ethical requirements and plan and perform the audit to obtain reasonable assurance about whether the consolidated financial statements are free from material misstatement.
An audit involves performing procedures to obtain audit evidence about the amounts and disclosures in the consolidated financial statements. The procedures selected depend on the auditor’s judgment, including the assessment of the risks of material misstatement of the consolidated financial statements, whether due to fraud or error. In making those risk assessments, the auditor considers internal control relevant to the entity’s preparation and fair presentation of the consolidated financial statements in order to design audit procedures that are appropriate in the circumstances. An audit also includes evaluating the appropriateness of accounting policies used and the reasonableness of accounting estimates made by management, as well as evaluating the overall presentation of the consolidated financial statements.
We believe that the audit evidence we have obtained in our audits is sufficient and appropriate to provide a basis for our audit opinion.
OPINION
In our opinion, the consolidated financial statements present fairly, in all material respects, the financial position of BCE Inc. and subsidiaries as at December 31, 2016 and December 31, 2015, and their financial performance and their cash flows for the years then ended in accordance with International Financial Reporting Standards as issued by the International Accounting Standards Board.
OTHER MATTER
We have also audited, in accordance with the standards of the Public Company Accounting Oversight Board (United States), the Company’s internal control over financial reporting as of December 31, 2016, based on the criteria established inInternal Control – Integrated Framework (2013)issued by the Committee of Sponsoring Organizations of the Treadway Commission and our report dated March 2, 2017 expressed an unqualified opinion on the Company’s internal control over financial reporting.
/s/ Deloitte LLP(1)
Montréal, Canada
March 2, 2017
(1)CPA auditor, CA, public accountancy permit No. A104630
BCE Inc. 2016 ANNUAL REPORT 113 | |||
| Consolidated financial statements | |||
| Consolidated income statements |
| FOR THE YEAR ENDED DECEMBER 31 (IN MILLIONS OF CANADIAN DOLLARS, EXCEPT SHARE AMOUNTS) | NOTE | 2016 | 2015 | |||
Operating revenues | 4 | 21,719 | 21,514 | |||
Operating costs | 4, 5 | (12,931 | ) | (12,963 | ) | |
Severance, acquisition and other costs | 4, 6 | (135 | ) | (446 | ) | |
Depreciation | 4, 13 | (2,877 | ) | (2,890 | ) | |
Amortization | 4, 14 | (631 | ) | (530 | ) | |
Finance costs | ||||||
Interest expense | 7 | (888 | ) | (909 | ) | |
Interest on post-employment benefit obligations | 22 | (81 | ) | (110 | ) | |
Other income (expense) | 8 | 21 | (12 | ) | ||
Income taxes | 9 | (1,110 | ) | (924 | ) | |
Net earnings | 3,087 | 2,730 | ||||
Net earnings attributable to: | ||||||
Common shareholders | 2,894 | 2,526 | ||||
Preferred shareholders | 137 | 152 | ||||
Non-controlling interest | 29 | 56 | 52 | |||
Net earnings | 3,087 | 2,730 | ||||
Net earnings per common share – basic and diluted | 10 | 3.33 | 2.98 | |||
Average number of common shares outstanding – basic (millions) | 869.1 | 847.1 |
| Consolidated statements of comprehensive income |
| FOR THE YEAR ENDED DECEMBER 31 (IN MILLIONS OF CANADIAN DOLLARS) | NOTE | 2016 | 2015 | |||
Net earnings | 3,087 | 2,730 | ||||
Other comprehensive (loss) income, net of income taxes | ||||||
Items that will be subsequently reclassified to net earnings | ||||||
Net change in value of available-for-sale (AFS) financial assets, net of income taxes of nil for 2016 and 2015 | (7 | ) | 23 | |||
Net change in value of derivatives designated as cash flow hedges, net of income taxes of $24 million and ($2) million for 2016 and 2015, respectively | (68 | ) | 1 | |||
Items that will not be reclassified to net earnings | ||||||
Actuarial (losses) gains on post-employment benefit plans, net of income taxes of $71 million and ($161) million for 2016 and 2015, respectively | 22 | (191 | ) | 429 | ||
Other comprehensive (loss) income | (266 | ) | 453 | |||
Total comprehensive income | 2,821 | 3,183 | ||||
Total comprehensive income attributable to: | ||||||
Common shareholders | 2,630 | 2,977 | ||||
Preferred shareholders | 137 | 152 | ||||
Non-controlling interest | 29 | 54 | 54 | |||
Total comprehensive income | 2,821 | 3,183 |
| 114 BCE Inc. 2016 ANNUAL REPORT | |||
| Consolidated financial statements | |||
| Consolidated statements of financial position |
| (IN MILLIONS OF CANADIAN DOLLARS) | NOTE | DECEMBER 31, 2016 | DECEMBER 31, 2015 | |||
ASSETS | ||||||
Current assets | ||||||
Cash | 603 | 100 | ||||
Cash equivalents | 250 | 513 | ||||
Trade and other receivables | 11 | 2,979 | 3,009 | |||
Inventory | 12 | 403 | 416 | |||
Prepaid expenses | 420 | 393 | ||||
Other current assets | 200 | 377 | ||||
Total current assets | 4,855 | 4,808 | ||||
Non-current assets | ||||||
Property, plant and equipment | 13 | 22,346 | 21,630 | |||
Intangible assets | 14 | 11,998 | 11,176 | |||
Deferred tax assets | 9 | 89 | 89 | |||
Investments in associates and joint ventures | 3, 15 | 852 | 1,119 | |||
Other non-current assets | 16 | 1,010 | 794 | |||
Goodwill | 17 | 8,958 | 8,377 | |||
Total non-current assets | 45,253 | 43,185 | ||||
Total assets | 50,108 | 47,993 | ||||
LIABILITIES |
|
|
|
|
|
|
Current liabilities | ||||||
Trade payables and other liabilities | 18 | 4,326 | 4,287 | |||
Interest payable | 156 | 148 | ||||
Dividends payable | 617 | 576 | ||||
Current tax liabilities | 122 | 86 | ||||
Debt due within one year | 19 | 4,887 | 4,895 | |||
Total current liabilities | 10,108 | 9,992 | ||||
Non-current liabilities | ||||||
Long-term debt | 20 | 16,572 | 15,390 | |||
Deferred tax liabilities | 9 | 2,192 | 1,824 | |||
Post-employment benefit obligations | 22 | 2,105 | 2,038 | |||
Other non-current liabilities | 23 | 1,277 | 1,420 | |||
Total non-current liabilities | 22,146 | 20,672 | ||||
Total liabilities | 32,254 | 30,664 | ||||
Commitments and contingencies | 27 | |||||
EQUITY | ||||||
Equity attributable to BCE shareholders | ||||||
Preferred shares | 25 | 4,004 | 4,004 | |||
Common shares | 25 | 18,370 | 18,100 | |||
Contributed surplus | 25 | 1,160 | 1,150 | |||
Accumulated other comprehensive income | 46 | 119 | ||||
Deficit | (6,040 | ) | (6,350 | ) | ||
Total equity attributable to BCE shareholders | 17,540 | 17,023 | ||||
Non-controlling interest | 29 | 314 | 306 | |||
Total equity | 17,854 | 17,329 | ||||
Total liabilities and equity | 50,108 | 47,993 |
BCE Inc. 2016 ANNUAL REPORT 115 | |||
| Consolidated financial statements | |||
| Consolidated statements of changes in equity |
ATTRIBUTABLE TO BCE SHAREHOLDERS | ||||||||||||||||||
| FOR THE YEAR ENDED DECEMBER 31, 2016 (IN MILLIONS OF CANADIAN DOLLARS) | NOTE | PREFERRED SHARES | COMMON SHARES | CONTRI- BUTED SURPLUS | ACCUMU- LATED OTHER COMPRE- HENSIVE (LOSS) INCOME | DEFICIT | TOTAL | NON- CONTROL- LING INTEREST | TOTAL EQUITY | |||||||||
Balance at January 1, 2016 | 4,004 | 18,100 | 1,150 | 119 | (6,350 | ) | 17,023 | 306 | 17,329 | |||||||||
Net earnings | – | – | – | – | 3,031 | 3,031 | 56 | 3,087 | ||||||||||
Other comprehensive loss | – | – | – | (73 | ) | (191 | ) | (264 | ) | (2 | ) | (266 | ) | |||||
Total comprehensive (loss) income | – | – | – | (73 | ) | 2,840 | 2,767 | 54 | 2,821 | |||||||||
Common shares issued under employee stock option plan | 25 | – | 104 | (6 | ) | – | – | 98 | – | 98 | ||||||||
Common shares issued under dividend reinvestment plan | 25 | – | 38 | – | – | – | 38 | – | 38 | |||||||||
Common shares issued under employee savings plan | 25 | – | 128 | – | – | – | 128 | – | 128 | |||||||||
Other share-based compensation | – | – | 16 | – | (19 | ) | (3 | ) | – | (3 | ) | |||||||
Dividends declared on BCE common and preferred shares | – | – | – | – | (2,511 | ) | (2,511 | ) | – | (2,511 | ) | |||||||
Dividends declared by subsidiaries to non-controlling interest | – | – | – | – | – | – | (46 | ) | (46 | ) | ||||||||
Balance at December 31, 2016 | 4,004 | 18,370 | 1,160 | 46 | (6,040 | ) | 17,540 | 314 | 17,854 | |||||||||
ATTRIBUTABLE TO BCE SHAREHOLDERS | ||||||||||||||||||
| FOR THE YEAR ENDED DECEMBER 31, 2015 (IN MILLIONS OF CANADIAN DOLLARS) | NOTE | PREFERRED SHARES | COMMON SHARES | CONTRI- BUTED SURPLUS | ACCUMU- LATED OTHER COMPRE- HENSIVE INCOME | DEFICIT | TOTAL | NON- CONTROL- LING INTEREST | TOTAL EQUITY | |||||||||
Balance at January 1, 2015 | 4,004 | 16,717 | 1,141 | 97 | (7,013 | ) | 14,946 | 293 | 15,239 | |||||||||
Net earnings | – | – | – | – | 2,678 | 2,678 | 52 | 2,730 | ||||||||||
Other comprehensive income | – | – | – | 22 | 429 | 451 | 2 | 453 | ||||||||||
Total comprehensive income | – | – | – | 22 | 3,107 | 3,129 | 54 | 3,183 | ||||||||||
Common shares issued under employee stock option plan | 25 | – | 96 | (7 | ) | – | – | 89 | – | 89 | ||||||||
Common shares issued under employee savings plan | 25 | – | 128 | – | – | – | 128 | – | 128 | |||||||||
Other share-based compensation | – | – | 16 | – | (53 | ) | (37 | ) | – | (37 | ) | |||||||
Dividends declared on BCE common and preferred shares | – | – | – | – | (2,365 | ) | (2,365 | ) | – | (2,365 | ) | |||||||
Dividends declared by subsidiaries to non-controlling interest | – | – | – | – | – | – | (41 | ) | (41 | ) | ||||||||
Common shares issued under bought deal offering | 25 | – | 863 | – | – | (26 | ) | 837 | – | 837 | ||||||||
Common shares issued for the acquisition of Glentel Inc. | 3, 25 | – | 296 | – | – | – | 296 | – | 296 | |||||||||
Balance at December 31, 2015 | 4,004 | 18,100 | 1,150 | 119 | (6,350 | ) | 17,023 | 306 | 17,329 | |||||||||
| 116 BCE Inc. 2016 ANNUAL REPORT | |||
| Consolidated financial statements | |||
| Consolidated statements of cash flows |
| FOR THE YEAR ENDED DECEMBER 31 (IN MILLIONS OF CANADIAN DOLLARS) | NOTE | 2016 | 2015 | |||
Cash flows from operating activities | ||||||
Net earnings | 3,087 | 2,730 | ||||
Adjustments to reconcile net earnings to cash flows from operating activities | ||||||
Severance, acquisition and other costs | 6 | 135 | 446 | |||
Depreciation and amortization | 13, 14 | 3,508 | 3,420 | |||
Post-employment benefit plans cost | 22 | 305 | 391 | |||
Net interest expense | 875 | 900 | ||||
Gains on investments | 8 | (58 | ) | (72 | ) | |
Income taxes | 9 | 1,110 | 924 | |||
Contributions to post-employment benefit plans | 22 | (725 | ) | (566 | ) | |
Payments under other post-employment benefit plans | 22 | (76 | ) | (75 | ) | |
Severance and other costs paid | (231 | ) | (190 | ) | ||
Interest paid | (882 | ) | (911 | ) | ||
Income taxes paid (net of refunds) | (565 | ) | (672 | ) | ||
Acquisition and other costs paid | (126 | ) | (292 | ) | ||
Net change in operating assets and liabilities | 286 | 241 | ||||
Cash flows from operating activities | 6,643 | 6,274 | ||||
Cash flows used in investing activities | ||||||
Capital expenditures | 4 | (3,771 | ) | (3,626 | ) | |
Business acquisitions | 3 | (404 | ) | (311 | ) | |
Business dispositions | 3 | 18 | 409 | |||
Decrease in investments | 107 | 11 | ||||
Acquisition of spectrum licences | 14 | (1 | ) | (535 | ) | |
Loan to related party | 3 | (517 | ) | – | ||
Other investing activities | (16 | ) | (62 | ) | ||
Cash flows used in investing activities | (4,584 | ) | (4,114 | ) | ||
Cash flows used in financing activities | ||||||
Increase in notes payable | 991 | 76 | ||||
Issue of long-term debt | 20 | 2,244 | 1,498 | |||
Repayment of long-term debt | 20 | (2,516 | ) | (2,084 | ) | |
Issue of common shares | 25 | 99 | 952 | |||
Common shares issuance cost | 25 | – | (35 | ) | ||
Repurchase of shares for settlement of share-based payments | 26 | (106 | ) | (138 | ) | |
Cash dividends paid on common shares | (2,305 | ) | (2,169 | ) | ||
Cash dividends paid on preferred shares | (126 | ) | (150 | ) | ||
Cash dividends paid by subsidiaries to non-controlling interest | (46 | ) | (41 | ) | ||
Other financing activities | (54 | ) | (22 | ) | ||
Cash flows used in financing activities | (1,819 | ) | (2,113 | ) | ||
Net increase (decrease) in cash | 503 | (42 | ) | |||
Cash at beginning of year | 100 | 142 | ||||
Cash at end of year | 603 | 100 | ||||
Net (decrease) increase in cash equivalents | (263 | ) | 89 | |||
Cash equivalents at beginning of year | 513 | 424 | ||||
Cash equivalents at end of year | 250 | 513 |
BCE Inc. 2016 ANNUAL REPORT 117 | |||
| Notes to consolidated financial statements | |||
| Notes to consolidated financial statements |
We,us,our,BCE andthe companymean, as the context may require, either BCE Inc. or, collectively, BCE Inc., Bell Canada, their subsidiaries, joint arrangements and associates.
| Note 1 Corporate information |
BCE is incorporated and domiciled in Canada. BCE’s head office is located at 1, Carrefour Alexander-Graham-Bell, Verdun, Québec, Canada. BCE is a telecommunications and media company providing wireless, wireline, Internet and television (TV) services to residential, business and wholesale customers in Canada. Our Bell Media segment provides conventional, specialty and pay TV, digital media, radio broadcasting services and out-of-home (OOH) advertising services to customers nationally across Canada. The consolidated financial statements (financial statements) were approved by BCE’s board of directors on March 2, 2017.
| Note 2 Significant accounting policies |
a) Basis of presentation
The financial statements were prepared in accordance with International Financial Reporting Standards (IFRS), as issued by the International Accounting Standards Board (IASB). The financial statements have been prepared on a historical cost basis, except for certain financial instruments that are measured at fair value as described in our accounting policies.
All amounts are in millions of Canadian dollars, except where noted.
FUNCTIONAL CURRENCY
The financial statements are presented in Canadian dollars, the company’s functional currency.
| b) Basis of consolidation |
We consolidate the financial statements of all of our subsidiaries. Subsidiaries are entities we control, where control is achieved when the company is exposed or has the right to variable returns from its involvement with the investee and has the current ability to direct the activities of the investee that significantly affect the investee’s returns.
The results of subsidiaries acquired during the year are consolidated from the date of acquisition and the results of subsidiaries sold during the year are deconsolidated from the date of disposal. Where necessary, adjustments are made to the financial statements of acquired subsidiaries to conform their accounting policies to ours. All intercompany transactions, balances, income and expenses are eliminated on consolidation.
Changes in BCE’s ownership interest in a subsidiary that do not result in a change of control are accounted for as equity transactions, with no effect on net earnings or on other comprehensive (loss) income.
| c) Revenue recognition |
We recognize revenues from the sale of products or the rendering of services when they are earned; specifically when all the following conditions are met:
- the significant risks and rewards of ownership are transferred tocustomers and we retain neither continuing managerialinvolvement nor effective control
- there is clear evidence that an arrangement exists
- the amount of revenues and related costs can bemeasured reliably
- it is probable that the economic benefits associated with thetransaction will flow to the company
In particular, we recognize:
- fees for local, long distance and wireless services when weprovide the services
- other fees, such as network access fees, licence fees, hosting fees,maintenance fees and standby fees over the term of the contract
- subscriber revenues when customers receive the service
- revenues from the sale of equipment when the equipment isdelivered and accepted by customers
- revenues on long-term contracts as services are provided,equipment is delivered and accepted, and contract milestonesare met
- advertising revenue, net of agency commissions, whenadvertisements are aired on radio or TV, posted on our website orappear on the company’s advertising panels and street furniture
We measure revenues at the fair value of the arrangement consideration. We record payments we receive in advance, including upfront non-refundable payments, as deferred revenues until we provide the service or deliver the product to customers. Deferred revenues are presented inTrade payables and other liabilitiesor inOther non-current liabilitiesin the consolidated statements of financial position (statements of financial position).
Revenues are reduced for customer rebates and allowances and exclude sales and other taxes we collect from our customers.
We expense subscriber acquisition costs when the related services are activated.
| 118 BCE Inc. 2016 ANNUAL REPORT | |||
| Notes to consolidated financial statements | |||
MULTIPLE-ELEMENT ARRANGEMENTS
We enter into arrangements that may include the sale of a number of products and services together, primarily to our wireless and business customers. When two or more products or services have value to our customers on a stand-alone basis, we separately account for each product or service according to the methods previously described. The total price to the customer is allocated to each product or service based on its relative fair value. When an amount allocated to a delivered item is contingent upon the delivery of additional items or meeting specified performance conditions, the amount allocated to that delivered item is limited to the non-contingent amount.
If the conditions to account for each product or service separately are not met, we recognize revenues proportionately over the term of the sale agreement.
SUBCONTRACTED SERVICES
We may enter into arrangements with subcontractors and others who provide services to our customers. When we act as the principal in these arrangements, we recognize revenues based on the amounts billed to our customers. Otherwise, we recognize the net amount that we retain as revenues.
| d) Share-based payments |
Our share-based payment arrangements include stock options, restricted share units and performance share units (RSUs/PSUs), deferred share units (DSUs), an employee savings plan (ESP) and a deferred share plan (DSP).
STOCK OPTIONS
We use a fair value-based method to measure the cost of our employee stock options, based on the number of stock options that are expected to vest. We recognize compensation expense inOperating costsin the consolidated income statements (income statements). Compensation expense is adjusted for subsequent changes in management’s estimate of the number of stock options that are expected to vest.
We credit contributed surplus for stock option expense recognized over the vesting period. When stock options are exercised, we credit share capital for the amount received and the amounts previously credited to contributed surplus.
RSUs/PSUs
For each RSU/PSU granted, we recognize compensation expense inOperating costsin the income statements, equal to the market value of a BCE common share at the date of grant and based on the number of RSUs/PSUs expected to vest, recognized over the term of the vesting period, with a corresponding credit to contributed surplus. Additional RSUs/PSUs are issued to reflect dividends declared on the common shares.
Compensation expense is adjusted for subsequent changes in management’s estimate of the number of RSUs/PSUs that are expected to vest. The effect of these changes is recognized in the period of the change. Upon settlement of the RSUs/PSUs, any difference between the cost of shares purchased on the open market and the amount credited to contributed surplus is reflected in the deficit. Vested RSUs/PSUs are settled in BCE common shares, DSUs, or a combination thereof.
DSUs
If compensation is elected to be taken in DSUs, we issue DSUs equal to the fair value of the services received. Additional DSUs are issued to reflect dividends declared on the common shares. DSUs are settled in BCE common shares purchased on the open market following the cessation of employment or when a director leaves the board. We credit contributed surplus for the fair value of DSUs at the issue date. Upon settlement of the DSUs, any difference between the cost of shares purchased on the open market and the amount credited to contributed surplus is reflected in the deficit.
ESP
We recognize our contributions to our ESP as compensation expense inOperating costsin the income statements. Employer ESP contributions accrue over a two-year vesting period. We credit contributed surplus for the ESP expense recognized over the vesting period, based on management’s estimate of the accrued contributions that are expected to vest. Upon settlement of shares under the ESP, any difference between the cost of shares purchased on the open market and the amount credited to contributed surplus is reflected in the deficit.
DSP
For each deferred share granted under the DSP, we recognize compensation expense inOperating costsin the income statements equal to the market value of a BCE common share and based on the number of deferred shares expected to vest, recognized over the term of the vesting period. Additional deferred shares are issued to reflect dividends declared on the common shares.
Compensation expense is adjusted for subsequent changes in the market value of BCE common shares and any change in management’s estimate of the number of deferred shares that are expected to vest. The cumulative effect of any change in value is recognized in the period of the change. Participants have the option to receive either BCE common shares or a cash equivalent for each vested deferred share upon qualifying for payout under the terms of the grant.
| e) Income and other taxes |
Current and deferred income tax expense is recognized in the income statements, except to the extent that the expense relates to items recognized in other comprehensive (loss) income or directly in equity.
A current or non-current tax asset (liability) is the estimated tax receivable (payable) on taxable earnings for the current or past periods. We also record future tax liabilities, which are included inOther non-current liabilitiesin the statements of financial position.
We use the liability method to account for deferred tax assets and liabilities, which arise from:
- temporary differences between the carrying amount of assetsand liabilities recognized in the statements of financial positionand their corresponding tax bases
- the carryforward of unused tax losses and credits, to the extentthey can be used in the future
BCE Inc. 2016 ANNUAL REPORT 119 | |||
| Notes to consolidated financial statements | |||
Deferred tax assets and liabilities are calculated at the tax rates that are expected to apply when the asset or liability is recovered or settled. Both our current and deferred tax assets and liabilities are calculated using tax rates that have been enacted or substantively enacted at the reporting date.
Deferred taxes are provided on temporary differences arising from investments in subsidiaries, joint arrangements and associates, except where we control the timing of the reversal of the temporary difference and it is probable that the temporary difference will not reverse in the foreseeable future.
Tax liabilities are, where permitted, offset against tax assets within the same taxable entity and tax jurisdiction.
INVESTMENT TAX CREDITS (ITCs), OTHER TAX CREDITS AND GOVERNMENT GRANTS
We recognize ITCs, other tax credits and government grants given on eligible expenditures when it is reasonably assured that they will be realized. They are presented as part ofTrade and other receivableswhen they are expected to be utilized in the next year. We use the cost reduction method to account for ITCs and government grants, under which the credits are applied against the expense or asset to which the ITC or government grant relates.
| f) Cash equivalents |
Cash equivalents are comprised of highly liquid investments with original maturities of three months or less from the date of purchase.
| g) Securitization of trade receivables |
Proceeds on the securitization of trade receivables are recognized as a collateralized borrowing as we do not transfer control and substantially all the risks and rewards of ownership to another entity.
| h) Inventory |
We measure inventory at the lower of cost and net realizable value. Inventory includes all costs to purchase, convert and bring the inventories to their present location and condition. We determine cost using specific identification for major equipment held for resale and the weighted average cost formula for all other inventory. We maintain inventory valuation reserves for inventory that is slow-moving or potentially obsolete, calculated using an inventory aging analysis.
| i) Property, plant and equipment |
We record property, plant and equipment at historical cost. Historical cost includes expenditures that are attributable directly to the acquisition or construction of the asset, including the purchase cost, and labour.
Borrowing costs are capitalized for qualifying assets if the time to build or develop is in excess of one year at a rate that is based on our weighted average interest rate on our outstanding long-term debt. Gains or losses on the sale or retirement of property, plant and equipment are recorded inOther income (expense)in the income statements.
LEASES
Leases of property, plant and equipment are recognized as finance leases when we obtain substantially all the risks and rewards of ownership of the underlying assets. At the inception of the lease, we record an asset together with a corresponding long-term lease liability, at the lower of the fair value of the leased asset or the present value of the minimum future lease payments. If there is reasonable certainty that the lease transfers ownership of the asset to us by the end of the lease term, the asset is amortized over its useful life. Otherwise, the asset is amortized over the shorter of its useful life and the lease term. The long-term lease liability is measured at amortized cost using the effective interest method.
All other leases are classified as operating leases. We recognize operating lease expense inOperating costsin the income statements on a straight-line basis over the term of the lease.
ASSET RETIREMENT OBLIGATIONS (AROs)
We initially measure and record AROs at management’s best estimate using a present value methodology, adjusted subsequently for any changes in the timing or amount of the cash flows and changes in discount rates. We capitalize asset retirement costs as part of the related assets and amortize them into earnings over time. We also increase the ARO and record a corresponding amount in interest expense to reflect the passage of time.
| 120 BCE Inc. 2016 ANNUAL REPORT | |||
| Notes to consolidated financial statements | |||
| j) Intangible assets |
FINITE-LIFE INTANGIBLE ASSETS
Finite-life intangible assets are recorded at cost less accumulated amortization, and accumulated impairment losses if any.
SOFTWARE
We record internal-use software at historical cost. Cost includes expenditures that are attributable directly to the acquisition or development of the software, including the purchase cost and labour.
Software development costs are capitalized when all the following conditions are met:
- technical feasibility can be demonstrated
- management has the intent and the ability to complete the assetfor use or sale
- it is probable that economic benefits will be generated
- costs attributable to the asset can be measured reliably
CUSTOMER RELATIONSHIPS
Customer relationship assets are acquired through business combinations and are recorded at fair value at the date of acquisition.
PROGRAM AND FEATURE FILM RIGHTS
We account for program and feature film rights as intangible assets when these assets are acquired for the purpose of broadcasting. Program and feature film rights, which include producer advances and licence fees paid in advance of receipt of the program or film, are stated at acquisition cost less accumulated amortization, and accumulated impairment losses if any. Programs and feature films under licence agreements are recorded as assets for rights acquired and Iiabilities for obligations incurred when:
- the company receives a broadcast master and the cost is knownor reasonably determinable for new program and featurefilm licences
- the licence term commences for licence period extensions orsyndicated programs
Programs and feature films are classified as non-current assets with related liabilities classified as current or non-current, based on the payment terms. Amortization of program and feature film rights is recorded inOperating costsin the income statements.
INDEFINITE-LIFE INTANGIBLE ASSETS
Brand assets, mainly comprised of the Bell and Bell Media brands, and broadcast licences are acquired through business combinations and are recorded at fair value at the date of acquisition, less accumulated impairment losses, if any. Wireless spectrum licences are recorded at acquisition cost, including borrowing costs when the time to build or develop the related network is in excess of one year. Borrowing costs are calculated at a rate that is based on our weighted average interest rate on our outstanding long-term debt.
Currently there are no legal, regulatory, competitive or other factors that limit the useful lives of our brands or spectrum licences.
| k) Depreciation and amortization |
We depreciate property, plant and equipment and amortize finite-life intangible assets on a straight-line basis over their estimated useful lives. We review our estimates of useful lives on an annual basis and adjust depreciation and amortization on a prospective basis, as required. Land and assets under construction or development are not depreciated.
| ESTIMATED USEFUL LIFE | ||
Property, plant and equipment | ||
Network infrastructure and equipment | 2 to 40 years | |
Buildings | 3 to 50 years | |
Finite-life intangible assets | ||
Software | 2 to 12 years | |
Customer relationships | 3 to 26 years | |
Program and feature film rights | Up to 5 years |
| l) Investments in associates and joint arrangements |
Our financial statements incorporate our share of the results of our associates and joint ventures using the equity method of accounting, except when the investment is classified as held for sale. Equity income from investments is recorded inOther income (expense)in the income statements.
Investments in associates and joint ventures are recognized initially at cost and adjusted thereafter to include the company’s share of income or loss and comprehensive income on an after-tax basis.
Investments are reviewed for impairment at each reporting period and we compare their recoverable amount to their carrying amount when there is an indication of impairment.
We recognize our share of the assets, liabilities, revenues and expenses of joint operations in accordance with the related contractual agreements.
BCE Inc. 2016 ANNUAL REPORT 121 | |||
| Notes to consolidated financial statements | |||
| m) Business combinations and goodwill |
Business combinations are accounted for using the acquisition method. The consideration transferred in a business combination is measured at fair value at the date of acquisition. Acquisition-related transaction costs are expensed as incurred and recorded inSeverance, acquisition and other costsin the income statements.
Identifiable assets and liabilities, including intangible assets, of acquired businesses are recorded at their fair values at the date of acquisition. When we acquire control of a business, any previously-held equity interest is remeasured to fair value and any gain or loss on remeasurement is recognized inOther income (expense)in the income statements. The excess of the purchase consideration and any previously-held equity interest over the fair value of identifiable net assets acquired is recorded asGoodwillin the statements of financial position. If the fair value of identifiable net assets acquired exceeds the purchase consideration and any previously-held equity interest, the difference is recognized inOther income (expense)in the income statements immediately as a bargain purchase gain.
Changes in our ownership interest in subsidiaries that do not result in a loss of control are accounted for as equity transactions. Any difference between the change in the carrying amount of non-controlling interest (NCI) and the consideration paid or received is attributed to owner’s equity.
| n) Impairment of non-financial assets |
Goodwill and indefinite-life intangible assets are tested for impairment annually or when there is an indication that the asset may be impaired. Property, plant and equipment and finite-life intangible assets are tested for impairment if events or changes in circumstances, assessed at each reporting period, indicate that their carrying amount may not be recoverable. For the purpose of impairment testing, assets other than goodwill are grouped at the lowest level for which there are separately identifiable cash inflows.
Impairment losses are recognized and measured as the excess of the carrying value of the assets over their recoverable amount. An asset’s recoverable amount is the higher of its fair value less costs of disposal and its value in use. Previously recognized impairment losses, other than those attributable to goodwill, are reviewed for possible reversal at each reporting date and, if the asset’s recoverable amount has increased, all or a portion of the impairment is reversed.
GOODWILL IMPAIRMENT TESTING
We perform an annual test for goodwill impairment in the fourth quarter for each of our cash generating units (CGUs) or groups of CGUs to which goodwill is allocated, and whenever there is an indication that goodwill might be impaired.
A CGU is the smallest identifiable group of assets that generates cash inflows that are independent of the cash inflows from other assets or groups of assets.
We identify any potential impairment by comparing the carrying value of a CGU or group of CGUs to its recoverable amount. The recoverable amount of a CGU or group of CGUs is the higher of its fair value less costs of disposal and its value in use. Both fair value less costs of disposal and value in use are based on estimates of discounted future cash flows or other valuation methods. Cash flows are projected based on past experience, actual operating results and business plans. When the recoverable amount of a CGU or group of CGUs is less than its carrying value, the recoverable amount is determined for its identifiable assets and liabilities. The excess of the recoverable amount of the CGU or group of CGUs over the total of the amounts assigned to its assets and liabilities is the recoverable amount of goodwill.
An impairment charge is recognized inOther income (expense)in the income statements for any excess of the carrying value of goodwill over its recoverable amount. For purposes of impairment testing of goodwill, BCE’s CGUs or groups of CGUs correspond to our reporting segments as disclosed in Note 4,Segmented information.
| o) Financial instruments |
TRADE AND OTHER RECEIVABLES
Trade and other receivables, which include trade receivables and other short-term receivables, are measured at amortized cost using the effective interest method, net of any allowance for doubtful accounts. An allowance for doubtful accounts is established based on individually significant exposures or on historical trends. Factors considered when establishing an allowance include current economic conditions, historical information and the reason for the delay in payment. Amounts considered uncollectible are written off and recognized inOperating costsin the income statements.
AVAILABLE-FOR-SALE (AFS) FINANCIAL ASSETS
Our portfolio investments in equity securities are classified as AFS and are presented in our statements of financial position asOther non-current assets. They have been designated as such based on management’s intentions or because they are not classified in any other categories. These securities are recorded at fair value on the date of acquisition, including related transaction costs, and are adjusted to fair value at each reporting date. The corresponding unrealized gains and losses are recorded in other comprehensive (loss) income and are reclassified toOther income (expense)in the income statements when realized or when an impairment is determined.
OTHER FINANCIAL LIABILITIES
Other financial liabilities, which include trade payables and accruals, compensation payable, obligations imposed by the Canadian Radio-television and Telecommunications Commission (CRTC), interest payable and long-term debt, are recorded at amortized cost using the effective interest method.
COSTS OF ISSUING DEBT AND EQUITY
The cost of issuing debt is included as part of long-term debt and is accounted for at amortized cost using the effective interest method. The cost of issuing equity is reflected in the consolidated statements of changes in equity as a charge to the deficit.
| 122 BCE Inc. 2016 ANNUAL REPORT | |||
| Notes to consolidated financial statements | |||
| p) Derivative financial instruments |
We use derivative financial instruments to manage interest rate risk, foreign currency risk and cash flow exposures related to share-based payment plans, capital expenditures, long-term debt instruments and purchase commitments. We do not use derivative financial instruments for speculative or trading purposes.
HEDGE ACCOUNTING
To qualify for hedge accounting, we document the relationship between the derivative and the related identified risk exposure, and our risk management objective and strategy. This includes associating each derivative to a specific asset or liability, a specific firm commitment or a specific anticipated transaction.
We assess the effectiveness of a derivative in managing an identified risk exposure when hedge accounting is initially applied, and on an ongoing basis thereafter. If a hedge becomes ineffective, we stop using hedge accounting.
FAIR VALUE HEDGES
We enter into interest rate swaps to manage the effect of changes in interest rates relating to fixed-rate long-term debt. These swaps involve exchanging interest payments without exchanging the notional amount on which the payments are based. We record the exchange of payments as an adjustment to interest expense on the hedged debt. We include the related net receivable or payable from counterparties inOther current assetsorTrade payables and other liabilitiesfor swaps due within one year and inOther non-current assetsorOther non-current liabilitiesfor swaps that have a maturity of more than one year. Changes in the fair value of these derivatives and the related long-term debt are recognized inOther income (expense)in the income statements and offset, unless a portion of the hedging relationship is ineffective.
CASH FLOW HEDGES
We enter into cash flow hedges to mitigate foreign currency risk on certain debt instruments and purchase commitments, as well as interest rate risk related to future debt issuances. We use foreign currency forward contracts to manage the exposure to anticipated transactions denominated in foreign currencies.
Changes in the fair value of foreign currency forward contracts on purchase commitments are recognized in our consolidated statements of comprehensive income (statements of comprehensive income), except for any ineffective portion, which is recognized immediately inOther income (expense)in the income statements. Realized gains and losses inAccumulated other comprehensive incomeare reclassified to the income statements in the same periods as the corresponding hedged items are recognized in earnings. Cash flow hedges that mature within one year are included inOther current assetsorTrade payables and other liabilities, whereas hedges that have a maturity of more than one year are included inOther non-current assetsorOther non-current liabilities.
We use cross currency basis swaps and foreign currency forward contracts to manage our U.S. dollar borrowings under our unsecured committed term credit facility and U.S. commercial paper program. Changes in the fair value of these derivatives and the related borrowings are recognized inOther income (expense)in the income statements and offset, unless a portion of the hedging relationship is ineffective.
DERIVATIVES USED AS ECONOMIC HEDGES
We use derivatives to manage cash flow exposures related to equity-settled share-based payment plans and capital expenditures, equity price risk related to a cash-settled share-based payment plan, and interest rate risk related to preferred share dividend rate resets. As these derivatives do not qualify for hedge accounting, the changes in their fair value are recorded in the income statements inOperating costsfor derivatives used to hedge cash-settled share-based payments and inOther income (expense)for other derivatives.
| q) Post-employment benefit plans |
DEFINED BENEFIT (DB) AND OTHER POST-EMPLOYMENT BENEFIT (OPEB) PLANS
We maintain DB pension plans that provide pension benefits for certain employees. Benefits are based on the employee’s length of service and average rate of pay during the highest paid consecutive five years of service. Most employees are not required to contribute to the plans. Certain plans provide cost of living adjustments to help protect the income of retired employees against inflation.
We are responsible for adequately funding our DB pension plans. We make contributions to them based on various actuarial cost methods permitted by pension regulatory bodies. Contributions reflect actuarial assumptions about future investment returns, salary projections, future service and life expectancy.
We provide OPEBs to some of our employees, including:
- healthcare and life insurance benefits during retirement, whichwere phased out for new retirees over a ten-year period endingon December 31, 2016. We do not fund most of these OPEB plans.
- other benefits, including workers’ compensation and medicalbenefits to former or inactive employees, their beneficiaries anddependants, from the time their employment ends until theirretirement starts, under certain circumstances
We accrue our obligations and related costs under post-employment benefit plans, net of the fair value of the benefit plan assets. Pension and OPEB costs are determined using:
- the projected unit credit method, prorated on years of service,which takes into account future pay levels
- a discount rate based on market interest rates of high-qualitycorporate fixed income investments with maturities that matchthe timing of benefits expected to be paid under the plans
- management’s best estimate of pay increases, retirement ages ofemployees, expected healthcare costs and life expectancy
BCE Inc. 2016 ANNUAL REPORT 123 | |||
| Notes to consolidated financial statements | |||
We value post-employment benefit plan assets at fair value using current market values.
Post-employment benefit plans current service cost is included inOperating costsin the income statements. Interest on our post-employment benefit assets and obligations is recognized inFinance costsin the income statements and represents the accretion of interest on the assets and obligations under our post-employment benefit plans. The interest rate is based on market conditions that existed at the beginning of the year. Actuarial gains and losses for all post-employment benefit plans are recorded in other comprehensive (loss) income in the period in which they occur and are recognized immediately in the deficit.
December 31 is the measurement date for our significant post-employment benefit plans. Our actuaries perform a valuation at least every three years to determine the actuarial present value of the accrued DB pension plan and OPEB obligations. The most recent actuarial valuation of our significant pension plans was as at December 31, 2015.
DEFINED CONTRIBUTION (DC) PENSION PLANS
We maintain DC pension plans that provide certain employees with benefits. Under these plans, we are responsible for contributing a predetermined amount to an employee’s retirement savings, based on a percentage of the employee’s salary.
We recognize a post-employment benefit plans service cost for DC pension plans when the employee provides service to the company, essentially coinciding with our cash contributions.
Generally, new employees can participate only in the DC pension plans.
| r) Provisions |
Provisions are recognized when all the following conditions are met:
- the company has a present legal or constructive obligationbased on past events
- it is probable that an outflow of economic resources will berequired to settle the obligation
- the amount can be reasonably estimated
Provisions are measured at the present value of the estimated expenditures expected to settle the obligation, if the effect of the time value of money is material. The present value is determined using current market assessments of the discount rate and risks specific to the obligation. The obligation increases as a result of the passage of time, resulting in interest expense which is recognized inFinance costsin the income statements.
| s) Estimates and key judgments |
When preparing the financial statements, management makes estimates and judgments relating to:
- reported amounts of revenues and expenses
- reported amounts of assets and liabilities
- disclosure of contingent assets and liabilities
We base our estimates on a number of factors, including historical experience, current events and actions that the company may undertake in the future, and other assumptions that we believe are reasonable under the circumstances. By their nature, these estimates and judgments are subject to measurement uncertainty and actual results could differ. Our more significant estimates and judgments are described below.
ESTIMATES
USEFUL LIVES OF PROPERTY, PLANT AND EQUIPMENT AND FINITE-LIFE INTANGIBLE ASSETS
Property, plant and equipment represent a significant proportion of our total assets. Changes in technology or our intended use of these assets, as well as changes in business prospects or economic and industry factors, may cause the estimated useful lives of these assets to change.
POST-EMPLOYMENT BENEFIT PLANS
The amounts reported in the financial statements relating to DB pension plans and OPEBs are determined using actuarial calculations that are based on several assumptions.
The actuarial valuation uses management’s assumptions for, among other things, the discount rate, life expectancy, the rate of compensation increase, trends in healthcare costs and expected average remaining years of service of employees.
The most significant assumptions used to calculate the net post-employment benefit plans cost are the discount rate and life expectancy.
The discount rate is based on the yield on long-term, high-quality corporate fixed income investments, with maturities matching the estimated cash flows of the post-employment benefit plans. Life expectancy is based on publicly available Canadian mortality tables and is adjusted for the company’s specific experience.
IMPAIRMENT OF NON-FINANCIAL ASSETS
We make a number of estimates when calculating recoverable amounts using discounted future cash flows or other valuation methods to test for impairment. These estimates include the assumed growth rates for future cash flows, the number of years used in the cash flow model and the discount rate.
DEFERRED TAXES
The amount of deferred tax assets is estimated with consideration given to the timing, sources and amounts of future taxable income.
FAIR VALUE OF FINANCIAL INSTRUMENTS
Certain financial instruments, such as investments in equity securities, derivative financial instruments and certain elements of borrowings, are carried in the statements of financial position at fair value, with changes in fair value reflected in the income statements and the statements of comprehensive income. Fair values are estimated by reference to published price quotations or by using other valuation techniques that may include inputs that are not based on observable market data, such as discounted cash flows and earnings multiples.
| 124 BCE Inc. 2016 ANNUAL REPORT | |||
| Notes to consolidated financial statements | |||
CONTINGENCIES
In the ordinary course of business, we become involved in various claims and legal proceedings seeking monetary damages and other relief. Pending claims and legal proceedings represent a potential cost to our business. We estimate the amount of a loss by analyzing potential outcomes and assuming various litigation and settlement strategies, based on information that is available at the time.
ONEROUS CONTRACTS
A provision for onerous contracts is recognized when the unavoidable costs of meeting our obligations under a contract exceed the expected benefits to be received under the contract. The provision is measured at the present value of the lower of the expected cost of terminating the contract and the expected net cost of completing the contract.
JUDGMENTS
POST-EMPLOYMENT BENEFIT PLANS
The determination of the discount rate used to value our post-employment benefit obligations requires judgment. The rate is set by reference to market yields of high-quality corporate fixed income investments at the beginning of each fiscal year. Significant judgment is required when setting the criteria for fixed income investments to be included in the population from which the yield curve is derived. The most significant criteria considered for the selection of investments include the size of the issue and credit quality, along with the identification of outliers, which are excluded.
INCOME TAXES
The calculation of income taxes requires judgment in interpreting tax rules and regulations. There are transactions and calculations for which the ultimate tax determination is uncertain. Our tax filings are also subject to audits, the outcome of which could change the amount of current and deferred tax assets and liabilities.
Management judgment is used to determine the amounts of deferred tax assets and liabilities and future tax liabilities to be recognized. In particular, judgment is required when assessing the timing of the reversal of temporary differences to which future income tax rates are applied.
MULTIPLE ELEMENT ARRANGEMENTS
Determining the amounts of revenue to be recognized for multiple element arrangements requires judgment to establish the separately identifiable components and the allocation of the total price between those components.
CGUs
The determination of CGUs or groups of CGUs for the purpose of annual impairment testing requires judgment.
CONTINGENCIES
The determination of whether a loss is probable from claims and legal proceedings and whether an outflow of resources is likely requires judgment.
| t) Change in accounting estimate |
In 2016, as part of our ongoing annual review of property, plant and equipment and finite-life intangible assets, and to better reflect their useful lives, we increased the estimate of useful lives of certain assets. The changes have been applied prospectively effective January 1, 2016 and did not have a significant impact on our financial statements.
| u) Adoption of amended accounting standards |
As required, effective January 1, 2016, we adopted the following amended accounting standards on a prospective basis, none of which had a significant impact on our financial statements.
STANDARD | DESCRIPTION | IMPACT |
Amendments to International Accounting Standard (IAS) 16 – Property, Plant and Equipment and IAS 38 – Intangible Assets | Clarifies that a revenue-based approach to calculate depreciation and amortization generally is not appropriate as it does not reflect the consumption of the economic benefits embodied in the related asset. | This amendment did not have a significant impact on our financial statements. |
Amendments to IFRS 11 – Joint Arrangements | Provides guidance on the accounting for acquisitions of interests in joint operations in which the activity constitutes a business, as defined in IFRS 3 – Business Combinations. The amended standard requires the acquirer to apply all of the principles on accounting for business combinations in IFRS 3 and other IFRSs except for any principles that conflict with IFRS 11. | This amendment did not have a significant impact on our financial statements. |
BCE Inc. 2016 ANNUAL REPORT 125 | |||
| Notes to consolidated financial statements | |||
| v) Future changes to accounting standards |
The following new or amended standards issued by the IASB have an effective date after December 31, 2016 and have not yet been adopted by BCE.
STANDARD | DESCRIPTION | IMPACT | EFFECTIVE DATE |
Amendments to IAS 7 – Statement of Cash Flows | Requires enhanced disclosures about changes in liabilities arising from financing activities, including changes from financing cash flows, changes arising from obtaining or losing control of subsidiaries or other businesses, the effect of changes in foreign exchange rates and changes in fair values. | Additional disclosures will be provided in the notes to our financial statements if required. | Annual periods beginning on or after January 1, 2017, applied prospectively. |
IFRS 15 – Revenue from Contracts with Customers
| Establishes principles to record revenues from contracts for the sale of goods or services, unless the contracts are in the scope of IAS 17 – Leases or other IFRSs. Under IFRS 15, revenue is recognized at an amount that reflects the expected consideration receivable in exchange for transferring goods or services to a customer, applying the following five steps: 1. Identify the contract with a customer The new standard also provides guidance relating to principal versus agent relationships, licences of intellectual property, contract costs and the measurement and recognition of gains and losses on the sale of certain non-financial assets such as property and equipment. Additional disclosures will also be required under the new standard. | IFRS 15 will principally affect the timing of revenue recognition, how we classify revenues between product and service and how we account for costs to obtain and fulfill a contract. Under multiple-element arrangements, although the total revenue recognized during the term of a contract will be largely unaffected, the revenue allocated to a delivered item will no longer be limited to the non-contingent amount. This may accelerate the recognition of revenue ahead of the associated cash inflows and result in a corresponding contract asset recorded on the balance sheet, to be realized over the term of the customer contract. We continue to make progress towards adoption of IFRS 15 according to our detailed implementation plan. Changes and enhancements to our existing information technology systems, business processes, and systems of internal control are being designed, tested and implemented. A dedicated project team that leverages key resources throughout the company is also in place to effect the necessary changes. Throughout 2017, systems and processes will be put in place to collect and compile the new data required to reflect the impact of IFRS 15 on our 2018 financial statements and key operating metrics and determine the impact to our historical comparative information. Accordingly, it is not yet possible to make a reliable estimate of the impact of the new standard on our financial statements. We expect that the impact of the new standard will be most pronounced in our Bell Wireless segment. While total revenue recognized over the term of a customer contract is not expected to change significantly, revenue recognition will be accelerated for certain customer contracts and a greater proportion of revenue will be classified to product revenue. | Annual periods beginning on or after January 1, 2018, using either a full retrospective approach for all periods presented in the period of adoption or a modified retrospective approach. |
Amendments to IFRS 2 – Share-based Payment | Clarifies the classification and measurement of cash-settled share-based payment transactions that include a performance condition, share-based payment transactions with a net settlement feature for withholding tax obligations, and modifications of a share-based payment transaction from cash-settled to equity-settled. | The amendments to IFRS 2 are not expected to have a significant impact on our financial statements. | Annual periods beginning on or after January 1, 2018. |
IFRS 9 – Financial Instruments | Sets out the requirements for recognizing and measuring financial assets, financial liabilities and some contracts to buy and sell non-financial items. IFRS 9 replaces IAS 39 – Financial Instruments: Recognition and Measurement. The new standard establishes a single classification and measurement approach for financial assets that reflects the business model in which they are managed and their cash flow characteristics. It also provides guidance on an entity’s own credit risk relating to financial liabilities and has modified the hedge accounting model to better link the economics of risk management with its accounting treatment. Additional disclosures will also be required under the new standard. | We are currently evaluating the impact of IFRS 9 on our financial statements. | Annual periods beginning on or after January 1, 2018. |
| 126 BCE Inc. 2016 ANNUAL REPORT | |||
| Notes to consolidated financial statements | |||
STANDARD | DESCRIPTION | IMPACT | EFFECTIVE DATE |
IFRS 16 – Leases | Eliminates the distinction between operating and finance leases for lessees, requiring instead that leases be capitalized by recognizing the present value of the lease payments and showing them either as lease assets (right-of-use assets) or together with property, plant and equipment. If lease payments are made over time, an entity recognizes a financial liability representing its obligation to make future lease payments. A depreciation charge for the lease asset is recorded within operating costs and an interest expense on the lease liability is recorded within finance costs. IFRS 16 does not require a lessee to recognize assets and liabilities for short-term leases and leases of low-value assets, nor does it substantially change lease accounting for lessors. | We are currently evaluating the impact of IFRS 16 on our financial statements. | Annual periods beginning on or after January 1, 2019, using either a full retrospective approach for all periods presented in the period of adoption or a modified retrospective approach, with early adoption permitted if an entity has adopted IFRS 15. |
| Note 3 Business acquisitions and dispositions |
2016
Acquisition of Q9 Networks Inc. (Q9)
On October 3, 2016, BCE acquired the remaining 64.6% of the issued and outstanding shares of Q9 that it did not already own for a total cash consideration of approximately $170 million.
Q9 is a Toronto-based data centre operator providing outsourced hosting and other data solutions to Canadian business and government customers. The acquisition supports BCE’s ability to compete against domestic and international providers in the growing outsourced data services sector. Q9 is included in our Bell Wireline segment in our financial statements.
The purchase price allocation includes certain provisional estimates, in particular for property, plant and equipment and finite-life intangible assets. The following table summarizes the fair value of the consideration paid and the fair value assigned to each major class of assets and liabilities.
| TOTAL | ||
Cash consideration | 170 | |
Fair value of previously held interest in Q9 and favourable purchase option | 131 | |
Note receivable from Q9 | 517 | |
Total cost to be allocated | 818 | |
Trade and other receivables | 19 | |
Other non-cash working capital | (39 | ) |
Property, plant and equipment | 311 | |
Finite-life intangible assets | 267 | |
Long-term debt | (7 | ) |
Deferred tax liabilities | (69 | ) |
Other non-current liabilities | (16 | ) |
| 466 | |
Cash and cash equivalents | 12 | |
Fair value of net assets acquired | 478 | |
Goodwill(1) | 340 |
| (1) | Goodwill arises principally from the assembled workforce, expected synergies and future growth. Goodwill is not deductible for tax purposes. The goodwill arising from the transaction was allocated to our Bell Wireline group of CGUs. |
In 2016, prior to the acquisition of Q9, BCE provided a loan of $517 million to Q9 mainly for the repayment of certain of its debt.
A gain on investment of $12 million was recognized inOther income (expense)in the income statements from remeasuring BCE’s previously held equity interest in Q9 to its fair value.
Revenues of $29 million and net earnings of $2 million are included in the income statements from the date of acquisition.
BCE’s consolidated operating revenues and net earnings for the year ended December 31, 2016 would have been $21,801 million and $3,038 million, respectively, had the Q9 acquisition occurred on January 1, 2016. These proforma amounts reflect the elimination of intercompany transactions and earnings related to our previously held interest, the amortization of certain elements of the purchase price allocation and related tax adjustments.
BCE Inc. 2016 ANNUAL REPORT 127 | |||
| Notes to consolidated financial statements | |||
| National expansion of HBO and The Movie Network (TMN) |
In Q1 2016, BCE completed a transaction with Corus Entertainment Inc. (Corus) under which Corus waived its HBO content rights in Canada and ceased operations of its Movie Central and Encore Avenue pay TV services in Western and Northern Canada, thereby allowing Bell Media to become the sole operator of HBO Canada nationally across all platforms and to expand TMN into a national pay TV service. TMN was successfully launched nationally on March 1, 2016. BCE paid to Corus a total cash consideration of $218 million, of which $21 million was paid in 2015.
The following table summarizes the fair value of the consideration paid and the fair value assigned to each major class of assets and liabilities.
| TOTAL | ||
Cash consideration | 218 | |
Finite-life intangible assets | 8 | |
Non-current assets | 1 | |
Current liabilities | (3 | ) |
Non-current liabilities | (8 | ) |
Fair value of net assets acquired | (2 | ) |
Goodwill(1) | 220 |
| (1) | Goodwill arises principally from the ability to leverage media content and expected future growth. The amount of goodwill deductible for tax purposes is $163 million at a 7% annual rate declining balance. The goodwill arising from the transaction was allocated to our Bell Media group of CGUs. |
The transaction is part of our strategy to create, negotiate and deliver premium TV programming to Canadian consumers across more platforms on a national basis.
This transaction did not have a significant impact on our consolidated operating revenues and net earnings for the year ended December 31, 2016.
| Acquisition of Cieslok Media Ltd. (Cieslok Media) |
Subsequent to year end, on January 3, 2017, BCE acquired all of the issued and outstanding common shares of Cieslok Media for a total cash consideration of $161 million.
Cieslok Media specializes in large-format outdoor advertising in key urban areas across Canada. This acquisition will contribute to growing and strengthening our digital presence in OOH advertising.
Cieslok Media will be included in our Bell Media segment in our financial statements.
The fair values of Cieslok Media’s assets and liabilities have not yet been determined.
| Proposed acquisition of Manitoba Telecom Services Inc. (MTS) |
On May 2, 2016, BCE announced that it intends to acquire all of the issued and outstanding common shares of MTS for a total consideration of $3.1 billion, of which 45% will be paid in cash and the remaining 55% through the issuance of approximately 28 million BCE common shares. The transaction is valued at approximately $3.9 billion, including net debt of approximately $0.8 billion. BCE will fund the cash component of the transaction through debt financing. MTS shareholder approval was obtained at a special meeting of shareholders held on June 23, 2016, and final court approval was obtained on June 29, 2016. On December 20, 2016, the CRTC approved under the Broadcasting Act the transfer of the broadcasting distribution undertaking licence held by MTS to BCE. On February 15, 2017, Innovation, Science and Economic Development Canada (ISED) and the Competition Bureau approved the proposed acquisition of MTS with the result that BCE has now obtained all necessary regulatory approvals to complete the transaction. Subject to certain closing conditions and termination rights, the transaction is expected to close on March 17, 2017. If the transaction does not close under certain circumstances, BCE may be liable to pay a break fee of $200 million to MTS.
MTS is an information and communications technology provider offering wireless, Internet, TV, phone services, security systems and information solutions including unified cloud and managed services to residential and business customers in Manitoba.
The acquisition of MTS will allow us to reach more Canadians through the expansion of our wireless and wireline broadband network while supporting our goal of being recognized by customers as Canada’s leading communications company.
BCE has agreed to divest approximately one-quarter of MTS’ post-paid subscribers and 13 retail locations to TELUS Corporation through one or more of its subsidiaries (TELUS) following the completion of the acquisition of MTS for total proceeds of approximately $300 million, subject to final adjustments. Subject to certain closing conditions and termination rights, this transaction is expected to close on April 1, 2017. The $75 million break fee that was payable by BCE to TELUS if the transaction with TELUS did not close under certain circumstances is no longer applicable given the receipt of all regulatory approvals.
BCE has also agreed to transfer to Xplornet Communications Inc. (Xplornet) a total of 40 Megahertz (MHz) of 700 MHz, advanced wireless services-1 and 2500 MHz wireless spectrum currently held by MTS, which has also been approved by ISED, 24,700 wireless customers once Xplornet launches its mobile wireless service, and 6 retail outlets. Xplornet will receive transitional remedy network access from BCE and MTS in urban areas of Manitoba for three years and other operational benefits as Xplornet builds out its own network in Manitoba. Subject to certain closing conditions and termination rights, this transaction is expected to close on March 17, 2017.
| 128 BCE Inc. 2016 ANNUAL REPORT | |||
| Notes to consolidated financial statements | |||
2015
Glentel
On May 20, 2015, BCE completed the acquisition of all of Glentel Inc.’s (Glentel) issued and outstanding common shares for a total consideration of $592 million, of which $296 million ($284 million, net of cash on hand) was paid in cash and the balance through the issuance of 5,548,908 BCE common shares. Immediately following the closing of the acquisition, BCE repaid Glentel’s outstanding debt in the amount of approximately $112 million and contributed $53 million in exchange for additional Glentel common shares.
Subsequently, also on May 20, 2015 and further to an agreement dated December 24, 2014, BCE divested 50% of its ownership interest in Glentel to Rogers Communications Inc. for a total cash consideration of approximately $473 million ($407 million, net of divested cash and transaction costs). The resulting gain of $94 million was recorded inOther income (expense)in 2015, at which time our remaining investment in Glentel was $379 million and was recorded inInvestments in associates and joint ventures.
Glentel is a Canadian-based dual-carrier, multi-brand mobile products distributor. The transaction is part of our strategy to accelerate wireless and improve customer service. BCE accounts for its investment in Glentel as a joint venture using the equity method.
| Note 4 Segmented information |
The accounting policies used in our segment reporting are the same as those we describe in Note 2,Significant accounting policies. Our results are reported in three segments: Bell Wireless, Bell Wireline and Bell Media. Our segments reflect how we manage our business and how we classify our operations for planning and measuring performance. Accordingly, we operate and manage our segments as strategic business units organized by products and services. Segments negotiate sales with each other as if they were unrelated parties.
We measure the performance of each segment based on segment profit, which is equal to operating revenues less operating costs for the segment. We report severance, acquisition and other costs and depreciation and amortization by segment for external reporting purposes. Substantially all of our finance costs and other income (expense) are managed on a corporate basis and, accordingly, are not reflected in segment results.
Our operations and virtually all of our assets are located in Canada.
Our Bell Wireless segment provides wireless voice and data communication products and services to our residential, small and medium-sized business and large enterprise customers across Canada.
Our Bell Wireline segment provides data, including Internet access and Internet protocol television, local telephone, long distance, as well as other communications services and products to our residential, small and medium-sized business and large enterprise customers primarily in Ontario, Québec and the Atlantic provinces, while Satellite TV service and connectivity to business customers are available nationally across Canada. In addition, this segment includes our wholesale business, which buys and sells local telephone, long distance, data and other services from or to resellers and other carriers.
Our Bell Media segment provides conventional, specialty and pay TV, digital media, radio broadcasting services and OOH advertising services to customers nationally across Canada.
| Segmented information |
| FOR THE YEAR ENDED DECEMBER 31, 2016 | NOTE | BELL WIRELESS | BELL WIRELINE | BELL MEDIA | INTER–SEGMENT ELIMINATIONS | BCE | ||||||
Operating revenues | ||||||||||||
External customers | 7,117 | 11,917 | 2,685 | – | 21,719 | |||||||
Inter-segment | 42 | 187 | 396 | (625 | ) | – | ||||||
Total operating revenues | 7,159 | 12,104 | 3,081 | (625 | ) | 21,719 | ||||||
Operating costs | 5 | (4,156 | ) | (7,062 | ) | (2,338 | ) | 625 | (12,931 | ) | ||
Segment profit(1) | 3,003 | 5,042 | 743 | – | 8,788 | |||||||
Severance, acquisition and other costs | 6 | (6 | ) | (130 | ) | 1 | – | (135 | ) | |||
Depreciation and amortization | 13, 14 | (555 | ) | (2,816 | ) | (137 | ) | – | (3,508 | ) | ||
Finance costs | ||||||||||||
Interest expense | 7 | (888 | ) | |||||||||
Interest on post-employment benefit obligations | 22 | (81 | ) | |||||||||
Other income | 8 | 21 | ||||||||||
Income taxes | 9 | (1,110 | ) | |||||||||
Net earnings | 3,087 | |||||||||||
Goodwill | 17 | 2,304 | 3,831 | 2,823 | – | 8,958 | ||||||
Indefinite-life intangible assets | 14 | 3,663 | 1,640 | 2,640 | – | 7,943 | ||||||
Capital expenditures | 733 | 2,936 | 102 | – | 3,771 |
| (1) | The chief operating decision maker uses primarily one measure of profit to make decisions and assess performance, being operating revenues less operating costs. |
BCE Inc. 2016 ANNUAL REPORT 129 | |||
| Notes to consolidated financial statements | |||
| FOR THE YEAR ENDED DECEMBER 31, 2015 | NOTE | BELL WIRELESS | BELL WIRELINE | BELL MEDIA | INTER–SEGMENT ELIMINATIONS | BCE | ||||||
Operating revenues | ||||||||||||
External customers | 6,836 | 12,043 | 2,635 | – | 21,514 | |||||||
Inter-segment | 40 | 215 | 339 | (594 | ) | – | ||||||
Total operating revenues | 6,876 | 12,258 | 2,974 | (594 | ) | 21,514 | ||||||
Operating costs | 5 | (4,048 | ) | (7,258 | ) | (2,251 | ) | 594 | (12,963 | ) | ||
Segment profit(1) | 2,828 | 5,000 | 723 | – | 8,551 | |||||||
Severance, acquisition and other costs | 6 | (16 | ) | (363 | ) | (67 | ) | – | (446 | ) | ||
Depreciation and amortization | 13, 14 | (503 | ) | (2,785 | ) | (132 | ) | – | (3,420 | ) | ||
Finance costs | ||||||||||||
Interest expense | 7 | (909 | ) | |||||||||
Interest on post-employment benefit obligations | 22 | (110 | ) | |||||||||
Other expense | 8 | (12 | ) | |||||||||
Income taxes | 9 | (924 | ) | |||||||||
Net earnings | 2,730 | |||||||||||
Goodwill | 17 | 2,303 | 3,491 | 2,583 | – | 8,377 | ||||||
Indefinite-life intangible assets | 14 | 3,597 | 1,685 | 2,652 | – | 7,934 | ||||||
Capital expenditures | 716 | 2,809 | 101 | – | 3,626 |
| (1) | The chief operating decision maker uses primarily one measure of profit to make decisions and assess performance, being operating revenues less operating costs. |
| Revenues by services and products |
| FOR THE YEAR ENDED DECEMBER 31 | 2016 | 2015 | ||
Services | ||||
Wireless | 6,602 | 6,246 | ||
Data | 6,791 | 6,590 | ||
Local and access | 3,089 | 3,271 | ||
Long distance | 741 | 831 | ||
Media | 2,685 | 2,635 | ||
Other services | 182 | 186 | ||
Total Services | 20,090 | 19,759 | ||
Products | ||||
Wireless | 515 | 590 | ||
Data | 559 | 573 | ||
Equipment and other | 555 | 592 | ||
Total Products | 1,629 | 1,755 | ||
Total operating revenues | 21,719 | 21,514 |
| 130 BCE Inc. 2016 ANNUAL REPORT | |||
| Notes to consolidated financial statements | |||
| Note 5 Operating costs |
| FOR THE YEAR ENDED DECEMBER 31 | NOTE | 2016 | 2015 | |||
Labour costs | ||||||
Wages, salaries and related taxes and benefits | (4,016 | ) | (4,224 | ) | ||
Post-employment benefit plans service cost (net of capitalized amounts) | 22 | (224 | ) | (281 | ) | |
Other labour costs(1) | (1,036 | ) | (949 | ) | ||
Less: | ||||||
Capitalized labour | 967 | 954 | ||||
Total labour costs | (4,309 | ) | (4,500 | ) | ||
Cost of revenues(2) | (6,705 | ) | (6,598 | ) | ||
Other operating costs(3) | (1,917 | ) | (1,865 | ) | ||
Total operating costs | (12,931 | ) | (12,963 | ) |
| (1) | Other labour costs include contractor and outsourcing costs. |
| (2) | Cost of revenues includes costs of wireless devices and other equipment sold, network and content costs, and payments to other carriers. |
| (3) | Other operating costs include marketing, advertising and sales commission costs, bad debt expense, taxes other than income taxes, information technology costs, professional service fees and rent. |
Research and development expenses of $147 million and $134 million are included in operating costs for 2016 and 2015, respectively.
| Note 6 Severance, acquisition and other costs |
| FOR THE YEAR ENDED DECEMBER 31 | 2016 | 2015 | ||
| Severance | (87 | ) | (197 | ) |
| Acquisition and other | (48 | ) | (249 | ) |
| Total severance, acquisition and other costs | (135 | ) | (446 | ) |
| Severance costs |
Severance costs consist of charges related to involuntary and voluntary employee terminations. Severance in 2015 includes incremental costs related to workforce reduction initiatives incurred in our Bell Media and Bell Wireline segments to confront changing consumer preferences, new TV unbundling rules, a soft business market as a result of the economy and declines in home phone subscribers.
| Acquisition and other costs |
Acquisition and other costs consist of transaction costs, such as legal and financial advisory fees, related to completed or potential acquisitions, employee severance costs related to the purchase of a business, the costs to integrate acquired companies into our operations and litigation costs, when they are significant. Acquisition costs also include severance and integration costs relating to the privatization of Bell Aliant Inc.
2015
Signal piracy litigation
On August 31, 2005, a motion to institute legal proceedings was filed in the Québec Superior Court against Bell ExpressVu Limited Partnership (Bell ExpressVu) by Vidéotron ltée, Vidéotron (Régional) ltée and CF Cable TV Inc. In the statement of claim, the plaintiffs alleged that Bell ExpressVu had failed to adequately protect its system against satellite signal piracy, thereby depriving the plaintiffs of subscribers who, but for their alleged ability to pirate Bell ExpressVu’s signal, would have subscribed to the plaintiffs’ services. On March 6, 2015, the Québec Court of Appeal reversed the judgment of the lower court regarding the quantum of damages awarded by such court, granting plaintiffs damages of $82 million, plus interest and costs. A charge of $137 million was recorded in Q1 2015 and was included inAcquisition and other costs.
On October 15, 2015, the Supreme Court of Canada dismissed Bell ExpressVu’s application for leave to appeal the Québec Court of Appeal’s judgment. Accordingly, the aggregate amount of $141.6 million, including interest and costs, was paid by Bell ExpressVu on October 19, 2015 in full satisfaction of the judgment as rendered by the Québec Court of Appeal and was recorded inAcquisition and other costs paidin the statements of cash flows.
BCE Inc. 2016 ANNUAL REPORT 131 | |||
| Notes to consolidated financial statements | |||
| Note 7 Interest expense |
| FOR THE YEAR ENDED DECEMBER 31 | 2016 | 2015 | ||
Interest expense on long-term debt | (852 | ) | (875 | ) |
Interest expense on other debt | (86 | ) | (84 | ) |
Capitalized interest | 50 | 50 | ||
Total interest expense | (888 | ) | (909 | ) |
Interest expense on long-term debt includes interest on finance leases of $153 million and $161 million for 2016 and 2015, respectively.
Capitalized interest was calculated using an average rate of 3.95% and 4.08% for 2016 and 2015, respectively, which represents the weighted average interest rate on our outstanding long-term debt.
| Note 8 Other income (expense) |
| FOR THE YEAR ENDED DECEMBER 31 | NOTE | 2016 | 2015 | |||
Net mark-to-market gains on derivatives used as economic hedges | 67 | 54 | ||||
Gains on investments | 3 | 58 | 72 | |||
Equity (losses) income from investments in associates and joint ventures | 15 | |||||
Loss on investment | (57 | ) | (54 | ) | ||
Operations | (32 | ) | 5 | |||
Losses on disposal/retirement of software, plant and equipment | (28 | ) | (55 | ) | ||
Early debt redemption costs | 20 | (11 | ) | (18 | ) | |
Impairment of assets | 13, 14 | (9 | ) | (49 | ) | |
Other | 33 | 33 | ||||
Total other income (expense) | 21 | (12 | ) |
Equity (losses) income from investments in associates and joint ventures |
In 2016, we recorded a loss on investment of $46 million representing BCE’s share of the loss recorded by one of our equity investments on the sale of a portion of its operations. Additionally, we recorded a loss on investment of $11 million, representing equity losses on our share of an obligation to repurchase at fair value the minority interest in one of BCE’s joint ventures. The obligation is marked to market each reporting period and the gain or loss on investment is recorded as equity gains or losses from investments in associates and joint ventures.
In 2015, we recorded a loss on investment of $54 million, representing equity losses on our share of an obligation to repurchase at fair value the minority interest in one of BCE’s joint ventures.
| Gains on investments |
In 2016, BCE recorded gains on investments of $58 million which included a gain related to one of our equity investments of $34 million, as well as a gain on investment of $12 million due to the remeasurement of BCE’s previously held equity interest in Q9 to its fair value. See Note 3,Business acquisitions and dispositionsfor additional details.
In 2015, BCE recognized a gain of $94 million as a result of its divestiture of its 50% ownership in Glentel to Rogers Communications Inc. Refer to Note 3,Business acquisitions and dispositions. Additionally, BCE recognized a $22 million loss on investments, which includes a loss on the sale of a call centre subsidiary, as well as a write down of the fair value of a financial asset related to one of our equity investments.
| Impairment of assets |
In 2015, we recorded an impairment charge of $49 million, of which $38 million was allocated to indefinite-life intangible assets, $9 million to finite-life intangible assets and $2 million to property, plant and equipment. The impairment charge related mainly to our music CGU within our Bell Media segment and resulted from revenue and profitability declines from lower viewership and higher TV content costs. The charge was determined by comparing the carrying value of the CGU to its fair value less costs of disposal. We estimated the fair value of the CGU using both discounted cash flows and market-based valuation models which include five-year cash flow projections derived from business plans reviewed by senior management for the period of January 1, 2016 to December 31, 2020, using a discount rate of 9.0% and a perpetuity growth rate of nil, as well as market multiple data from public companies and market transactions. The carrying value of our music CGU was $171 million at December 31, 2015.
| 132 BCE Inc. 2016 ANNUAL REPORT | |||
| Notes to consolidated financial statements | |||
| Note 9 Income taxes |
The following table shows the significant components of income taxes deducted from net earnings.
| FOR THE YEAR ENDED DECEMBER 31 | 2016 | 2015 | ||
Current taxes | ||||
Current taxes | (850 | ) | (687 | ) |
Uncertain tax positions | (14 | ) | 27 | |
Change in estimate relating to prior periods | 14 | 114 | ||
Utilization of previously unrecognized tax credits | – | 5 | ||
Other | (1 | ) | – | |
Deferred taxes | ||||
Deferred taxes relating to the origination and reversal of temporary differences | (299 | ) | (271 | ) |
Change in estimate relating to prior periods | 32 | (106 | ) | |
Recognition and utilization of loss carryforwards | (1 | ) | (14 | ) |
Effect of change in provincial corporate tax rate | 4 | (6 | ) | |
Resolution of uncertain tax positions | 5 | 14 | ||
Total income taxes | (1,110 | ) | (924 | ) |
The following table reconciles the amount of reported income taxes in the income statements with income taxes calculated at a statutory income tax rate of 27.1.% and 26.9% for 2016 and 2015, respectively.
| FOR THE YEAR ENDED DECEMBER 31 | 2016 | 2015 | ||
Net earnings | 3,087 | 2,730 | ||
Add back income taxes | 1,110 | 924 | ||
Earnings before income taxes | 4,197 | 3,654 | ||
Applicable statutory tax rate | 27.1 | % | 26.9 | % |
Income taxes computed at applicable statutory rates | (1,137 | ) | (983 | ) |
Non-taxable portion of gains on investments | 11 | 26 | ||
Uncertain tax positions | (9 | ) | 41 | |
Utilization of previously unrecognized tax credits | – | 5 | ||
Effect of change in provincial corporate tax rate | 4 | (6 | ) | |
Change in estimate relating to prior periods | 46 | 8 | ||
Non-taxable portion of equity losses | (23 | ) | (14 | ) |
Other | (2 | ) | (1 | ) |
Total income taxes | (1,110 | ) | (924 | ) |
Average effective tax rate | 26.4 | % | 25.3 | % |
The following table shows aggregate current and deferred taxes relating to items recognized outside the income statements.
| FOR THE YEAR ENDED DECEMBER 31 | 2016 | 2015 | ||||||
| OTHER COMPREHENSIVE LOSS | DEFICIT | OTHER COMPREHENSIVE INCOME | DEFICIT | |||||
Current taxes | 127 | 11 | 29 | 19 | ||||
Deferred taxes | (32 | ) | 6 | (192 | ) | (3 | ) | |
Total income tax recovery (expense) | 95 | 17 | (163 | ) | 16 | |||
BCE Inc. 2016 ANNUAL REPORT 133 | |||
| Notes to consolidated financial statements | |||
The following table shows deferred taxes resulting from temporary differences between the carrying amounts of assets and liabilities recognized in the statements of financial position and their corresponding tax basis, as well as tax loss carryforwards.
| NET DEFERRED TAX LIABILITY | NON– CAPITAL LOSS CARRY– FORWARD | POST EMPLOY– MENT BENEFIT PLANS | INDEFINITE–LIFE INTANGIBLE ASSETS | PROPERTY, PLANT AND EQUIPMENT AND FINITE-LIFE INTANGIBLE ASSETS | INVESTMENT TAX CREDITS | CRTC TANGIBLE BENEFITS | OTHER | TOTAL | ||||||||
January 1, 2015 | 26 | 714 | (1,554 | ) | (699 | ) | (7 | ) | 75 | 286 | (1,159 | ) | ||||
Income statement | (14 | ) | (4 | ) | (64 | ) | (268 | ) | 1 | (14 | ) | (20 | ) | (383 | ) | |
Business acquisition | – | – | (1 | ) | – | – | – | – | (1 | ) | ||||||
Business disposition | – | – | – | (1 | ) | – | – | – | (1 | ) | ||||||
Other comprehensive income | – | (190 | ) | – | – | – | – | (2 | ) | (192 | ) | |||||
Deficit | – | – | – | – | – | – | (3 | ) | (3 | ) | ||||||
Other | – | – | – | – | – | – | 4 | 4 | ||||||||
December 31, 2015 | 12 | 520 | (1,619 | ) | (968 | ) | (6 | ) | 61 | 265 | (1,735 | ) | ||||
Income statement | (1 | ) | (28 | ) | (61 | ) | (152 | ) | (3 | ) | (17 | ) | 3 | (259 | ) | |
Business acquisition | 10 | – | – | (79 | ) | – | – | (6 | ) | (75 | ) | |||||
Other comprehensive income | – | (38 | ) | – | – | – | – | 6 | (32 | ) | ||||||
Deficit | – | – | – | – | – | – | 6 | 6 | ||||||||
Other | – | – | – | – | – | – | (8 | ) | (8 | ) | ||||||
December 31, 2016 | 21 | 454 | (1,680 | ) | (1,199 | ) | (9 | ) | 44 | 266 | (2,103 | ) |
At December 31, 2016, BCE had $221 million of non-capital loss carryforwards. We:
- recognized a deferred tax asset of $21 million, of which $11 millionrelated to Q9, for $77 million of the non-capital loss carryforwards.These non-capital loss carryforwards expire in varying annualamounts from 2029 to 2036.
- did not recognize a deferred tax asset for $144 million of non-capital loss carryforwards. This balance expires in varying annualamounts from 2023 to 2035.
At December 31, 2016, BCE had $765 million of unrecognized capital loss carryforwards which can be carried forward indefinitely.
At December 31, 2015, BCE had $197 million of non-capital loss carryforwards. We:
- recognized a deferred tax asset of $12 million, of which $4 millionrelated to Bell Media, for $44 million of the non-capital losscarryforwards. These non-capital loss carryforwards expire invarying annual amounts from 2030 to 2035.
- did not recognize a deferred tax asset for $153 million ofnon-capital loss carryforwards. This balance expires in varyingannual amounts from 2023 to 2034.
At December 31, 2015, BCE had $783 million of unrecognized capital loss carryforwards which can be carried forward indefinitely.
| Note 10 Earnings per share |
The following table shows the components used in the calculation of basic and diluted earnings per common share for earnings attributable to common shareholders.
| FOR THE YEAR ENDED DECEMBER 31 | 2016 | 2015 | ||
Net earnings attributable to common shareholders – basic | 2,894 | 2,526 | ||
Dividends declared per common share (in dollars) | 2.73 | 2.60 | ||
Weighted average number of common shares outstanding (in millions) | ||||
Weighted average number of common shares outstanding – basic | 869.1 | 847.1 | ||
Assumed exercise of stock options(1) | 1.2 | 1.2 | ||
Weighted average number of common shares outstanding – diluted (in millions) | 870.3 | 848.3 |
| (1) | The calculation of the assumed exercise of stock options includes the effect of the average unrecognized future compensation cost of dilutive options. It excludes options for which the exercise price is higher than the average market value of a BCE common share. The number of excluded options was 2,936,091 in 2016 and 2,779,299 in 2015. |
| 134 BCE Inc. 2016 ANNUAL REPORT | |||
| Notes to consolidated financial statements | |||
| Note 11 Trade and other receivables |
| FOR THE YEAR ENDED DECEMBER 31 | NOTE | 2016 | 2015 | |||
Trade receivables(1) | 2,967 | 2,969 | ||||
Allowance for doubtful accounts | 24 | (60 | ) | (64 | ) | |
Allowance for revenue adjustments | (85 | ) | (75 | ) | ||
Current tax receivable | 35 | 90 | ||||
Other accounts receivable | 122 | 89 | ||||
Total trade and other receivables | 2,979 | 3,009 |
| (1) | The details of securitized trade receivables are set out in Note 19,Debt due within one year. |
| Note 12 Inventory |
| FOR THE YEAR ENDED DECEMBER 31 | 2016 | 2015 | ||
Finished goods | 333 | 368 | ||
Work in progress | 85 | 66 | ||
Provision | (15 | ) | (18 | ) |
Total inventory | 403 | 416 |
The total amount of inventory subsequently recognized as an expense in cost of revenues was $2,689 million for 2016 and 2015.
| Note 13 Property, plant and equipment |
| FOR THE YEAR ENDED DECEMBER 31, 2016 | NOTE | NETWORK INFRASTRUCTURE AND EQUIPMENT | LAND AND BUILDINGS | ASSETS UNDER CONSTRUCTION | TOTAL(1) | |||||
COST | ||||||||||
January 1, 2016 | 57,233 | 5,174 | 1,287 | 63,694 | ||||||
Additions | 2,361 | 120 | 1,415 | 3,896 | ||||||
Acquisition through business combinations | 32 | 282 | 1 | 315 | ||||||
Transfers | 692 | 35 | (1,325 | ) | (598 | ) | ||||
Retirements and disposals | (1,637 | ) | (39 | ) | (4 | ) | (1,680 | ) | ||
Impairment losses recognized in earnings | 8 | (1 | ) | – | – | (1 | ) | |||
December 31, 2016 | 58,680 | 5,572 | 1,374 | 65,626 | ||||||
ACCUMULATED DEPRECIATION | ||||||||||
January 1, 2016 | 39,183 | 2,881 | – | 42,064 | ||||||
Depreciation | 2,672 | 205 | – | 2,877 | ||||||
Retirements and disposals | (1,591 | ) | (35 | ) | – | (1,626 | ) | |||
Other | (31 | ) | (4 | ) | – | (35 | ) | |||
December 31, 2016 | 40,233 | 3,047 | – | 43,280 | ||||||
NET CARRYING AMOUNT | ||||||||||
January 1, 2016 | 18,050 | 2,293 | 1,287 | 21,630 | ||||||
December 31, 2016 | 18,447 | 2,525 | 1,374 | 22,346 |
| (1) | Includes assets under finance leases. |
BCE Inc. 2016 ANNUAL REPORT 135 | |||
| Notes to consolidated financial statements | |||
| FOR THE YEAR ENDED DECEMBER 31, 2015 | NOTE | NETWORK INFRASTRUCTURE AND EQUIPMENT | LAND AND BUILDINGS | ASSETS UNDER CONSTRUCTION | TOTAL(1) | |||||
COST | ||||||||||
January 1, 2015 | 54,968 | 5,100 | 1,427 | 61,495 | ||||||
Additions | 2,145 | 68 | 1,525 | 3,738 | ||||||
Acquisition through business combinations | 1 | – | – | 1 | ||||||
Transfers | 1,112 | 44 | (1,661 | ) | (505 | ) | ||||
Retirements and disposals | (991 | ) | (38 | ) | (4 | ) | (1,033 | ) | ||
Impairment losses recognized in earnings | 8 | (2 | ) | – | – | (2 | ) | |||
December 31, 2015 | 57,233 | 5,174 | 1,287 | 63,694 | ||||||
ACCUMULATED DEPRECIATION | ||||||||||
January 1, 2015 | 37,461 | 2,707 | – | 40,168 | ||||||
Depreciation | 2,698 | 192 | – | 2,890 | ||||||
Retirements and disposals | (937 | ) | (24 | ) | – | (961 | ) | |||
Other | (39 | ) | 6 | – | (33 | ) | ||||
December 31, 2015 | 39,183 | 2,881 | – | 42,064 | ||||||
NET CARRYING AMOUNT | ||||||||||
January 1, 2015 | 17,507 | 2,393 | 1,427 | 21,327 | ||||||
December 31, 2015 | 18,050 | 2,293 | 1,287 | 21,630 |
| (1) | Includes assets under finance leases. |
| Finance leases |
BCE’s significant finance leases are for satellites and office premises. The office leases have a typical lease term of 23 years. The leases for satellites, used to provide programming to our Bell TV customers, have a term of 15 years.
The following table shows additions to and the net carrying amount of assets under finance leases.
| ADDITIONS | NET CARRYING AMOUNT | |||||||
| FOR THE YEAR ENDED DECEMBER 31 | 2016 | 2015 | 2016 | 2015 | ||||
Network infrastructure and equipment | 375 | 418 | 1,580 | 1,677 | ||||
Land and buildings | 72 | 8 | 506 | 484 | ||||
Total | 447 | 426 | 2,086 | 2,161 | ||||
The following table provides a reconciliation of our minimum future lease payments to the present value of our finance lease obligations.
| AT DECEMBER 31, 2016 | NOTE | 2017 | 2018 | 2019 | 2020 | 2021 | THERE- AFTER | TOTAL | ||||||||
Minimum future lease payments | 24 | 568 | 514 | 328 | 265 | 253 | 1,050 | 2,978 | ||||||||
Less: | ||||||||||||||||
Future finance costs | (133 | ) | (117 | ) | (104 | ) | (90 | ) | (76 | ) | (198 | ) | (718 | ) | ||
Present value of future lease obligations | 435 | 397 | 224 | 175 | 177 | 852 | 2,260 |
| 136 BCE Inc. 2016 ANNUAL REPORT | |||
| Notes to consolidated financial statements | |||
| Note 14 Intangible assets |
| FINITE-LIFE | INDEFINITE-LIFE | |||||||||||||||||||||
| FOR THE YEAR ENDED DECEMBER 31, 2016 | NOTE | SOFTWARE | CUSTOMER RELATIONSHIPS | PROGRAM AND FEATURE FILM RIGHTS | OTHER | TOTAL | BRAND | SPECTRUM AND OTHER LICENCES | BROADCAST LICENCES | TOTAL | TOTAL INTANGIBLE ASSETS | |||||||||||
COST | ||||||||||||||||||||||
January 1, 2016 | 6,906 | 866 | 577 | 325 | 8,674 | 2,333 | 3,267 | 2,334 | 7,934 | 16,608 | ||||||||||||
Additions | 412 | – | 973 | 17 | 1,402 | – | 21 | – | 21 | 1,423 | ||||||||||||
Acquired through business combinations | – | 293 | – | 8 | 301 | – | – | – | – | 301 | ||||||||||||
Transfers | 615 | – | – | – | 615 | – | – | – | – | 615 | ||||||||||||
Retirements and disposals | (72 | ) | – | – | – | (72 | ) | – | – | – | – | (72 | ) | |||||||||
Business dispositions | – | – | – | – | – | – | – | (4 | ) | (4 | ) | (4 | ) | |||||||||
Impairment losses recognized in earnings | 8 | – | – | – | – | – | – | – | (8 | ) | (8 | ) | (8 | ) | ||||||||
Amortization included in operating costs | – | – | (868 | ) | – | (868 | ) | – | – | – | – | (868 | ) | |||||||||
December 31, 2016 | 7,861 | 1,159 | 682 | 350 | 10,052 | 2,333 | 3,288 | 2,322 | 7,943 | 17,995 | ||||||||||||
ACCUMULATED AMORTIZATION | ||||||||||||||||||||||
January 1, 2016 | 4,824 | 466 | – | 142 | 5,432 | – | – | – | – | 5,432 | ||||||||||||
Amortization | 558 | 47 | – | 26 | 631 | – | – | – | – | 631 | ||||||||||||
Retirements and disposals | (69 | ) | – | – | – | (69 | ) | – | – | – | – | (69 | ) | |||||||||
Other | 3 | – | – | – | 3 | – | – | – | – | 3 | ||||||||||||
December 31, 2016 | 5,316 | 513 | – | 168 | 5,997 | – | – | – | – | 5,997 | ||||||||||||
NET CARRYING AMOUNT | ||||||||||||||||||||||
January 1, 2016 | 2,082 | 400 | 577 | 183 | 3,242 | 2,333 | 3,267 | 2,334 | 7,934 | 11,176 | ||||||||||||
December 31, 2016 | 2,545 | 646 | 682 | 182 | 4,055 | 2,333 | 3,288 | 2,322 | 7,943 | 11,998 | ||||||||||||
| FINITE-LIFE | INDEFINITE-LIFE | |||||||||||||||||||||
| FOR THE YEAR ENDED DECEMBER 31, 2015 | NOTE | SOFTWARE | CUSTOMER RELATIONSHIPS | PROGRAM AND FEATURE FILM RIGHTS | OTHER | TOTAL | BRAND | SPECTRUM AND OTHER LICENCES(1) | BROADCAST LICENCES | TOTAL | TOTAL INTANGIBLE ASSETS | |||||||||||
COST | ||||||||||||||||||||||
January 1, 2015 | 6,298 | 865 | 524 | 287 | 7,974 | 2,333 | 2,693 | 2,372 | 7,398 | 15,372 | ||||||||||||
Additions(1) | 345 | – | 917 | 52 | 1,314 | – | 566 | – | 566 | 1,880 | ||||||||||||
Acquired through business combinations | – | – | – | – | – | – | 10 | – | 10 | 10 | ||||||||||||
Transfers | 519 | – | – | – | 519 | – | – | – | – | 519 | ||||||||||||
Retirements and disposals | (256 | ) | 1 | – | (5 | ) | (260 | ) | – | (2 | ) | – | (2 | ) | (262 | ) | ||||||
Impairment losses recognized in earnings | 8 | – | – | – | (9 | ) | (9 | ) | – | – | (38 | ) | (38 | ) | (47 | ) | ||||||
Amortization included in operating costs | – | – | (864 | ) | – | (864 | ) | – | – | – | – | (864 | ) | |||||||||
December 31, 2015 | 6,906 | 866 | 577 | 325 | 8,674 | 2,333 | 3,267 | 2,334 | 7,934 | 16,608 | ||||||||||||
ACCUMULATED AMORTIZATION | ||||||||||||||||||||||
January 1, 2015 | 4,606 | 419 | – | 123 | 5,148 | – | – | – | – | 5,148 | ||||||||||||
Amortization | 460 | 46 | – | 24 | 530 | – | – | – | – | 530 | ||||||||||||
Retirements and disposals | (245 | ) | 1 | – | (5 | ) | (249 | ) | – | – | – | – | (249 | ) | ||||||||
Other | 3 | – | – | – | 3 | – | – | – | – | 3 | ||||||||||||
December 31, 2015 | 4,824 | 466 | – | 142 | 5,432 | – | – | – | – | 5,432 | ||||||||||||
NET CARRYING AMOUNT | ||||||||||||||||||||||
January 1, 2015 | 1,692 | 446 | 524 | 164 | 2,826 | 2,333 | 2,693 | 2,372 | 7,398 | 10,224 | ||||||||||||
December 31, 2015 | 2,082 | 400 | 577 | 183 | 3,242 | 2,333 | 3,267 | 2,334 | 7,934 | 11,176 | ||||||||||||
| (1) | On April 21, 2015, Bell Mobility Inc. (Bell Mobility) acquired advanced wireless services – 3 (AWS-3) wireless spectrum in key urban and rural markets comprised of 13 licences for 169 million Megahertz per Population (MHz-POP) of AWS-3 spectrum for $500 million. On May 12, 2015, Bell Mobility acquired an additional 243 million MHz-POP of 2500 MHz wireless spectrum for $29 million. |
BCE Inc. 2016 ANNUAL REPORT 137 | |||
| Notes to consolidated financial statements | |||
| Note 15 Investments in associates and joint ventures |
The following table provides summarized financial information in respect to BCE’s associates and joint ventures. For a list of associates and joint ventures please see Note 28,Related party transactions.
| FOR THE YEAR ENDED DECEMBER 31 | NOTE | 2016 | 2015 | |||
Assets | 3,856 | 5,067 | ||||
Liabilities | (2,119 | ) | (2,699 | ) | ||
Total net assets | 1,737 | 2,368 | ||||
BCE’s share of net assets | 852 | 1,119 | ||||
Revenues | 2,511 | 2,125 | ||||
Expenses | (2,720 | ) | (2,261 | ) | ||
Total net losses | (209 | ) | (136 | ) | ||
BCE’s share of net losses | 8 | (89 | ) | (49 | ) |
| Note 16 Other non-current assets |
| FOR THE YEAR ENDED DECEMBER 31 | NOTE | 2016 | 2015 | |||
Net assets of post-employment benefit plans | 22 | 403 | 158 | |||
Derivative assets | 126 | 131 | ||||
AFS publicly-traded and privately-held investments | 24 | 103 | 128 | |||
Long-term notes and other receivables | 63 | 55 | ||||
Other | 315 | 322 | ||||
Total other non-current assets | 1,010 | 794 |
| Note 17 Goodwill |
The following table provides details about the changes in the carrying amounts of goodwill for the years ended December 31, 2016 and 2015. BCE’s groups of CGUs correspond to our reporting segments.
| BELL WIRELESS | BELL WIRELINE | BELL MEDIA | BCE | |||||
Balance at January 1, 2015 | 2,302 | 3,491 | 2,592 | 8,385 | ||||
Acquisitions and other | 1 | – | (9 | ) | (8 | ) | ||
Balance at December 31, 2015 | 2,303 | 3,491 | 2,583 | 8,377 | ||||
Acquisitions and other | 1 | 340 | 240 | 581 | ||||
Balance at December 31, 2016 | 2,304 | 3,831 | 2,823 | 8,958 |
| Impairment testing |
As described in Note 2,Significant accounting policies, goodwill is tested annually for impairment by comparing the carrying value of a CGU or group of CGUs to the recoverable amount, where the recoverable amount is the higher of fair value less costs of disposal or value in use.
VALUE IN USE
The value in use for a CGU or group of CGUs is determined by discounting five-year cash flow projections derived from business plans reviewed by senior management. The projections reflect management’s expectations of revenue, segment profit, capital expenditures, working capital and operating cash flows, based on past experience and future expectations of operating performance.
Cash flows beyond the five-year period are extrapolated using perpetuity growth rates. None of the perpetuity growth rates exceed the long-term historical growth rates for the markets in which we operate.
The discount rates are applied to the cash flow projections and are derived from the weighted average cost of capital for each CGU or group of CGUs.
The following table shows the key assumptions used to estimate the recoverable amounts of the groups of CGUs.
ASSUMPTIONS USED | ||||
| GROUPS OF CGUs | PERPETUITY GROWTH RATE | DISCOUNT RATE | ||
Bell Wireless | 0.8 | % | 9.1 | % |
Bell Wireline | 1.0 | % | 6.0 | % |
Bell Media | 1.0 | % | 8.5 | % |
| 138 BCE Inc. 2016 ANNUAL REPORT | |||
| Notes to consolidated financial statements | |||
We believe that any reasonable possible change in the key assumptions on which the estimate of recoverable amounts of the Bell Wireless or Bell Wireline groups of CGUs is based would not cause their carrying amounts to exceed their recoverable amounts.
For the Bell Media group of CGUs, a decrease of (0.4%) in the perpetuity growth rate or an increase of 0.3% in the discount rate, would have resulted in its recoverable amount being equal to its carrying value.
| Note 18 Trade payables and other liabilities |
| FOR THE YEAR ENDED DECEMBER 31 | NOTE | 2016 | 2015(1) | |||
Trade payables and accruals | 2,319 | 2,246 | ||||
Deferred revenues | 819 | 812 | ||||
Compensation payable | 531 | 512 | ||||
Taxes payable | 137 | 123 | ||||
Maple Leaf Sports and Entertainment Ltd. (MLSE) financial liability(2) | 23, 24 | 135 | – | |||
CRTC tangible benefits obligation | 24 | 51 | 61 | |||
Provisions | 21 | 39 | 119 | |||
Severance and other costs payable | 30 | 93 | ||||
CRTC deferral account obligation | 24 | 32 | 16 | |||
Other current liabilities | 233 | 305 | ||||
Total trade payables and other liabilities | 4,326 | 4,287 |
| (1) | We have reclassified amounts for the prior year to make them consistent with the presentation for the current year. |
| (2) | Represents BCE’s obligation to repurchase the BCE Master Trust Fund’s (Master Trust) 9% interest in MLSE at a price not less than an agreed minimum price should the Master Trust exercise its put option. The obligation to repurchase is marked to market each reporting period and the gain or loss is recorded inOther income (expense). In 2016, the obligation was reclassified fromOther non-current liabilitiesas the option is exercisable in 2017 and thereafter. |
| Note 19 Debt due within one year |
| FOR THE YEAR ENDED DECEMBER 31 | NOTE | WEIGHTED AVERAGE INTEREST RATE | 2016 | 2015 | ||||
Notes payable(1) | 24 | 0.70 | % | 2,649 | 1,666 | |||
Loans secured by trade receivables | 24 | 1.68 | % | 931 | 931 | |||
Long-term debt due within one year(2) | 4.71 | % | 835 | 1,778 | ||||
Unsecured committed term credit facility(3) | 1.49 | % | 479 | 526 | ||||
Net unamortized discount | (1 | ) | – | |||||
Unamortized debt issuance costs | (6 | ) | (6 | ) | ||||
Total long-term debt due within one year | 20 | 1,307 | 2,298 | |||||
Total debt due within one year | 4,887 | 4,895 |
| (1) | Includes commercial paper of $1,945 million in U.S. dollars ($2,612 million in Canadian dollars) and $856 million in U.S. dollars ($1,185 million in Canadian dollars) as at December 31, 2016 and 2015, respectively, which were issued under our U.S. commercial paper program and have been hedged for foreign currency fluctuations through forward currency contracts. See Note 24,Financial and capital managementfor additional details. |
| (2) | Included in long-term debt due within one year is the current portion of finance leases of $435 million and $405 million as at December 31, 2016 and 2015, respectively. |
| (3) | The outstanding balance at December 31, 2016 was $357 million in U.S. dollars ($479 million in Canadian dollars), which is included in debt due within one year and has been hedged using cross currency basis swaps. See Note 24,Financial and capital managementfor additional details. |
| Securitized trade receivables |
Our securitized trade receivable programs are recorded as floating rate revolving loans secured by certain trade receivables and expire on July 1, 2018 and December 31, 2018.
The following table provides further details on our securitized trade receivables programs.
| FOR THE YEAR ENDED DECEMBER 31 | 2016 | 2015 | ||
Average interest rate throughout the year | 1.51 | % | 1.59 | % |
| Securitized trade receivables | 1,904 | 2,056 |
We continue to service these trade receivables. The buyers’ interest in the collection of these trade receivables ranks ahead of our interests, which means that we are exposed to certain risks of default on the amounts securitized.
We have provided various credit enhancements in the form of overcollateralization and subordination of our retained interests.
The buyers will reinvest the amounts collected by buying additional interests in our trade receivables until the securitized trade receivables agreements expire or are terminated. The buyers and their investors have no further claim on our other assets if customers do not pay the amounts owed.
BCE Inc. 2016 ANNUAL REPORT 139 | |||
| Notes to consolidated financial statements | |||
| Credit facilities |
Bell Canada may issue notes under its Canadian and U.S. commercial paper programs up to the maximum aggregate principal amount of $2.5 billion in either Canadian or U.S. currency provided that at no time shall such maximum amount of notes exceed $3.5 billion in Canadian currency which equals the aggregate amount available under Bell Canada’s supporting revolving and expansion credit facilities as at December 31, 2016. The maximum amounts of the commercial paper programs and the committed expansion credit facility both reflect an increase of $500 million effective on December 20, 2016 as compared to December 31, 2015. The total amount of the committed revolving and expansion credit facilities may be drawn at any time.
The table below is a summary of our total bank credit facilities at December 31, 2016.
| TOTAL AVAILABLE | DRAWN | LETTERS OF CREDIT | COMMERCIAL PAPER OUTSTANDING | NET AVAILABLE | ||||||
Committed credit facilities | ||||||||||
Unsecured revolving and expansion credit facilities(1) (2) | 3,500 | – | – | 2,612 | 888 | |||||
Unsecured committed term credit facility(3) | 479 | 479 | – | – | – | |||||
Other | 134 | – | 130 | – | 4 | |||||
Total committed credit facilities | 4,113 | 479 | 130 | 2,612 | 892 | |||||
Total non-committed credit facilities | 1,472 | – | 741 | – | 731 | |||||
Total committed and non-committed credit facilities | 5,585 | 479 | 871 | 2,612 | 1,623 |
| (1) | Bell Canada’s $2.5 billion revolving credit facility expires in November 2021 and its $1 billion expansion credit facility expires in November 2019. |
| (2) | As of December 31, 2016, Bell Canada’s outstanding commercial paper consisted of $1,945 million in U.S. dollars ($2,612 million in Canadian dollars). All of Bell Canada’s commercial paper outstanding is included in debt due within one year. |
| (3) | The outstanding balance at December 31, 2016 was $357 million in U.S. dollars ($479 million in Canadian dollars), which is included in debt due within one year and has been hedged using cross currency basis swaps. See Note 24,Financial and capital managementfor additional details. |
| Restrictions |
Some of our credit agreements:
- require us to meet specific financial ratios
- require us to offer to repay and cancel the credit agreement upon a change of control of BCE or Bell Canada
We are in compliance with all conditions and restrictions under such credit agreements.
| Note 20 Long-term debt |
| FOR THE YEAR ENDED DECEMBER 31 | NOTE | WEIGHTED AVERAGE INTEREST RATE | MATURITY | 2016 | 2015 | |||||
Debentures | ||||||||||
1997 trust indenture | 4.06% | 2017 – 2045 | 13,600 | 13,400 | ||||||
1976 trust indenture | 9.54% | 2021 – 2054 | 1,100 | 1,100 | ||||||
Subordinated debentures | 8.21% | 2026 – 2031 | 275 | 275 | ||||||
Finance leases | 6.63% | 2017 – 2047 | 2,260 | 2,260 | ||||||
Unsecured committed term credit facility(1) | 1.49% | 2017 | 479 | 526 | ||||||
Other | 188 | 141 | ||||||||
Total debt | 17,902 | 17,702 | ||||||||
Net unamortized premium | 18 | 24 | ||||||||
Unamortized debt issuance costs | (41 | ) | (38 | ) | ||||||
Less: | ||||||||||
Amount due within one year | 19 | (1,307 | ) | (2,298 | ) | |||||
Total long-term debt | 16,572 | 15,390 |
| (1) | Represents $479 million in Canadian dollars ($357 million in U.S. dollars) which was drawn under Bell Canada’s unsecured committed credit facility and has been hedged using cross currency basis swaps ($526 million in Canadian dollars or $380 million in U.S. dollars in 2015). Refer to Note 24,Financial and capital managementfor additional details. |
Bell Canada’s debentures and subordinated debentures have been issued in Canadian dollars and the majority bear a fixed rate of interest.
Interest payments on debt for a principal amount of $700 million were swapped from fixed to floating. The debt and swap were settled in 2016. See Note 24,Financial and capital managementfor additional details.
| 140 BCE Inc. 2016 ANNUAL REPORT | |||
| Notes to consolidated financial statements | |||
| Restrictions |
Some of our debt agreements:
- require us to meet specific financial ratios
- impose covenants, maintenance tests and new issue tests
- require us to make an offer to repurchase certain series of debentures upon the occurrence of a change of control event as defined inthe relevant debt agreements
We are in compliance with all conditions and restrictions under such debt agreements.
All outstanding debentures are issued under trust indentures and are unsecured. All debentures are issued in series and certain series are redeemable at Bell Canada’s option prior to maturity at the prices, times and conditions specified for each series.
2016
On September 16, 2016, Bell Canada redeemed, prior to maturity, its 5.00% Series M-18 medium-term notes (MTN) debentures, having an outstanding principal amount of $700 million which were due on February 15, 2017. The interest rate swap which was used to hedge the interest rate exposure was also settled in 2016. See Note 24, Financial and capital managementfor additional details.
On August 12, 2016, Bell Canada issued 2.00% Series M-42 MTN debentures under its 1997 trust indenture, with a principal amount of $850 million, which mature on October 1, 2021. In addition, on the same date, Bell Canada issued 2.90% Series M-43 MTN debentures under its 1997 trust indenture, with a principal amount of $650 million, which mature on August 12, 2026.
On March 31, 2016, Bell Canada redeemed, prior to maturity, its 5.41% Series M-32 debentures, having an outstanding principal amount of $500 million which were due on September 26, 2016. We incurred an $11 million charge for the early debt redemption costs which was recorded inOther income (expense)in Q1 2016 in the income statement.
On February 29, 2016, Bell Canada issued 3.55% Series M-41 MTN debentures under its 1997 trust indenture, with a principal amount of $750 million, which mature on March 2, 2026.
On January 11, 2016, Bell Canada redeemed, prior to maturity, its 4.64% Series M-19 MTN debentures, having an outstanding principal amount of $200 million which were due on February 22, 2016, as well as its 3.65% Series M-23 MTN debentures, having an outstanding principal amount of $500 million which were due on May 19, 2016.
Subsequent to year end, on February 27, 2017, Bell Canada issued 2.70% Series M-44 MTN debentures under its 1997 trust indenture, with a principal amount of $1 billion, which mature on February 27, 2024. In addition, on the same date, Bell Canada issued 4.45% Series M-45 MTN debentures under its 1997 trust indenture, with a principal amount of $500 million, which mature on February 27, 2047.
2015
In 2015, Bell Canada repaid approximately $500 million ($395 million U.S. dollars) of the borrowings under its unsecured committed term credit facility that was used to fund part of the acquisition of Astral Media Inc.
On November 2, 2015, Bell Canada redeemed, prior to maturity, its 3.60% Series M-21 MTN debentures, issued under its 1997 trust indenture, having an outstanding principal amount of $1 billion which were due on December 2, 2015.
On October 1, 2015, Bell Canada issued 3.00% Series M-40 MTN debentures under its 1997 trust indenture, with a principal amount of $1 billion, which mature on October 3, 2022.
On March 30, 2015, Bell Canada issued 4.35% Series M-39 MTN debentures under its 1997 trust indenture, with a principal amount of $500 million, which mature on December 18, 2045.
| Note 21 Provisions |
| FOR THE YEAR ENDED DECEMBER 31 | NOTE | ASSET RETIREMENT OBLIGATIONS (AROs) | OTHER(1) | TOTAL | ||||
January 1, 2016 | 157 | 161 | 318 | |||||
Additions | 31 | 31 | 62 | |||||
Usage | (19 | ) | (36 | ) | (55 | ) | ||
Reversals | (6 | ) | (19 | ) | (25 | ) | ||
Acquired through business combination | 12 | – | 12 | |||||
December 31, 2016 | 175 | 137 | 312 | |||||
Current | 18 | 5 | 34 | 39 | ||||
Non-current | 23 | 170 | 103 | 273 | ||||
December 31, 2016 | 175 | 137 | 312 |
| (1) | Other includes environmental, legal, regulatory and vacant space provisions. |
BCE Inc. 2016 ANNUAL REPORT 141 | |||
| Notes to consolidated financial statements | |||
AROs reflect management’s best estimates of expected future costs to restore current leased premises to their original condition prior to lease inception. Cash outflows associated with our ARO liabilities are generally expected to occur at the restoration dates of the assets to which they relate, which are long-term in nature. The timing and extent of restoration work that will be ultimately required for these sites is uncertain.
| Note 22 Post-employment benefit plans |
Post-employment benefit plans cost
We provide pension and other benefits for most of our employees. These include DB pension plans, DC pension plans and OPEB plans.
We operate our DB and DC pension plans under applicable Canadian and provincial pension legislation, which prescribes minimum and maximum DB funding requirements. Plan assets are held in trust, and the oversight of governance of the plans, including investment decisions, contributions to DB plans and the selection of the DC plans investment options offered to plan participants, lies with the Pension Fund Committee, a committee of our board of directors.
The interest rate risk is managed using a liability matching approach, which reduces the exposure of the DB plans to a mismatch between investment growth and obligation growth.
The longevity risk is managed using a longevity swap, which reduces the exposure of the DB plan to an increase in life expectancy.
COMPONENTS OF POST-EMPLOYMENT BENEFIT PLANS SERVICE COST
| FOR THE YEAR ENDED DECEMBER 31 | 2016 | 2015 | ||
DB pension | (203 | ) | (232 | ) |
DC pension | (100 | ) | (96 | ) |
OPEBs | (7 | ) | (8 | ) |
Plan amendment gain on DB pension and OPEBs | 27 | – | ||
Less: | ||||
Capitalized benefit plans cost | 59 | 55 | ||
Total post-employment benefit plans service cost included in operating costs | (224 | ) | (281 | ) |
Other costs recognized in severance, acquisition and other costs | 5 | (44 | ) | |
Total post-employment benefit plans service cost | (219 | ) | (325 | ) |
COMPONENTS OF POST-EMPLOYMENT BENEFIT PLANS FINANCING COST
| FOR THE YEAR ENDED DECEMBER 31 | 2016 | 2015 | ||
DB pension | (24 | ) | (53 | ) |
OPEBs | (57 | ) | (57 | ) |
Total interest on post-employment benefit obligations | (81 | ) | (110 | ) |
The statements of comprehensive income include the following amounts before income taxes.
| 2016 | 2015 | |||
Cumulative losses recognized directly in equity, January 1 | (2,384 | ) | (2,974 | ) |
Actuarial (losses) gains in other comprehensive income(1) | (264 | ) | 594 | |
Increase in the effect of the asset limit(2) | 2 | (4 | ) | |
Cumulative losses recognized directly in equity, December 31 | (2,646 | ) | (2,384 | ) |
| (1) | The cumulative actuarial losses recognized in the statements of comprehensive income are $2,904 million in 2016. |
| (2) | The cumulative decrease in the effect of the asset limit recognized in the statements of comprehensive income is $258 million in 2016. |
| 142 BCE Inc. 2016 ANNUAL REPORT | |||
| Notes to consolidated financial statements | |||
COMPONENTS OF POST-EMPLOYMENT BENEFIT (OBLIGATIONS) ASSETS
The following table shows the change in post-employment benefit obligations and the fair value of plan assets.
| DB PENSION PLANS | OPEB PLANS | TOTAL | ||||||||||
| 2016 | 2015 | 2016 | 2015 | 2016 | 2015 | |||||||
Post-employment benefit obligations, January 1 | (20,675 | ) | (20,988 | ) | (1,705 | ) | (1,707 | ) | (22,380 | ) | (22,695 | ) |
Current service cost | (203 | ) | (232 | ) | (7 | ) | (8 | ) | (210 | ) | (240 | ) |
Interest on obligations | (852 | ) | (825 | ) | (68 | ) | (67 | ) | (920 | ) | (892 | ) |
Actuarial (losses) gains(1) | (311 | ) | 291 | 12 | 5 | (299 | ) | 296 | ||||
Net curtailment gains (losses) | 27 | (39 | ) | 5 | (5 | ) | 32 | (44 | ) | |||
Benefit payments | 1,169 | 1,122 | 79 | 77 | 1,248 | 1,199 | ||||||
Employee contributions | (5 | ) | (5 | ) | – | – | (5 | ) | (5 | ) | ||
Other | (3 | ) | 1 | – | – | (3 | ) | 1 | ||||
Post-employment benefit obligations, December 31 | (20,853 | ) | (20,675 | ) | (1,684 | ) | (1,705 | ) | (22,537 | ) | (22,380 | ) |
Fair value of plan assets, January 1 | 20,244 | 19,819 | 266 | 261 | 20,510 | 20,080 | ||||||
Expected return on plan assets(2) | 828 | 772 | 11 | 10 | 839 | 782 | ||||||
Actuarial gains (losses) | 29 | 301 | 6 | (3 | ) | 35 | 298 | |||||
Benefit payments | (1,169 | ) | (1,122 | ) | (79 | ) | (77 | ) | (1,248 | ) | (1,199 | ) |
Employer contributions | 626 | 469 | 76 | 75 | 702 | 544 | ||||||
Employee contributions | 5 | 5 | – | – | 5 | 5 | ||||||
Fair value of plan assets, December 31 | 20,563 | 20,244 | 280 | 266 | 20,843 | 20,510 | ||||||
Plan deficit | (290 | ) | (431 | ) | (1,404 | ) | (1,439 | ) | (1,694 | ) | (1,870 | ) |
Effect of asset limit | (8 | ) | (10 | ) | – | – | (8 | ) | (10 | ) | ||
Post-employment benefit liability, December 31 | (298 | ) | (441 | ) | (1,404 | ) | (1,439 | ) | (1,702 | ) | (1,880 | ) |
Post-employment benefit assets included in other non-current assets | 403 | 158 | – | – | 403 | 158 | ||||||
Post-employment benefit obligations | (701 | ) | (599 | ) | (1,404 | ) | (1,439 | ) | (2,105 | ) | (2,038 | ) |
| (1) | Actuarial gains include experience gains of $157 million in 2016 and $123 million in 2015. |
| (2) | The actual return on plan assets was $874 million, or 4.7%, in 2016 and $1,080 million, or 5.25%, in 2015. |
FUNDED STATUS OF POST-EMPLOYMENT BENEFIT PLANS COST
The following table shows the funded status of our post-employment benefit obligations.
| FUNDED | PARTIALLY FUNDED(1) | UNFUNDED(2) | TOTAL | |||||||||||||
| FOR THE YEAR ENDED DECEMBER 31 | 2016 | 2015 | 2016 | 2015 | 2016 | 2015 | 2016 | 2015 | ||||||||
Present value of post-employment benefit obligations | (20,249 | ) | (20,064 | ) | (1,995 | ) | (2,061 | ) | (293 | ) | (255 | ) | (22,537 | ) | (22,380 | ) |
Fair value of plan assets | 20,520 | 20,204 | 323 | 306 | – | – | 20,843 | 20,510 | ||||||||
Plan surplus (deficit) | 271 | 140 | (1,672 | ) | (1,755 | ) | (293 | ) | (255 | ) | (1,694 | ) | (1,870 | ) | ||
| (1) | The partially funded plans consist of supplementary executive retirement plans (SERPs) for eligible employees and OPEBs. The company partially funds the SERPs through letters of credit and a retirement compensation arrangement account with Canada Revenue Agency. Certain paid-up life insurance benefits are funded through life insurance contracts. |
| (2) | Our unfunded plans consist of OPEBs, which are pay-as-you-go. |
BCE Inc. 2016 ANNUAL REPORT 143 | |||
| Notes to consolidated financial statements | |||
SIGNIFICANT ASSUMPTIONS
We used the following key assumptions to measure the post-employment benefit obligations and the net benefit plans cost for the DB pension plans and OPEB plans. These assumptions are long-term, which is consistent with the nature of post-employment benefit plans.
DB PENSION PLANS AND OPEB PLANS | ||||
| 2016 | 2015 | |||
At December 31 | ||||
Post-employment benefit obligations | ||||
Discount rate | 4.0 | % | 4.2 | % |
Rate of compensation increase | 2.25 | % | 2.5 | % |
Cost of living indexation rate(1) | 1.6 | % | 1.6 | % |
Life expectancy at age 65 (years) | 23.1 | 23.0 | ||
For the year ended December 31 | ||||
Net post-employment benefit plans cost | ||||
Discount rate | 4.3 | % | 4.0 | % |
Rate of compensation increase | 2.5 | % | 2.5 | % |
Cost of living indexation rate(1) | 1.6 | % | 1.6 | % |
Life expectancy at age 65 (years) | 23.0 | 23.0 | ||
| (1) | Cost of living indexation rate is only applicable to DB pension plans. |
The weighted average duration of the post-employment benefit obligation is 15 years.
We assumed the following trend rates in healthcare costs:
- an annual increase in the cost of medication of 8.0% for 2016decreasing to 4.5% over 20 years
- an annual increase in the cost of covered dental benefits of 4.0%
- an annual increase in the cost of covered hospital benefits of 3.2%
- an annual increase in the cost of other covered healthcarebenefits of 3.0%
Assumed trend rates in healthcare costs have a significant effect on the amounts reported for the healthcare plans.
The following table shows the effect of a 1% change in the assumed trend rates in healthcare costs.
| EFFECT ON POST-EMPLOYMENT BENEFITS – INCREASE/(DECREASE) | 1% INCREASE | 1% DECREASE | ||
Total service and interest cost | 7 | (6 | ) | |
Post-employment benefit obligations | 142 | (120 | ) |
SENSITIVITY ANALYSIS
The following table shows a sensitivity analysis of key assumptions used to measure the net post-employment benefit obligations and the net post-employment benefit plans cost for our DB pension plans and OPEB plans.
| IMPACT ON NET POST-EMPLOYMENT BENEFIT PLANS COST FOR 2016 – INCREASE/(DECREASE) | IMPACT ON POST-EMPLOYMENT BENEFIT OBLIGATIONS AT DECEMBER 31, 2016 – INCREASE/(DECREASE) | |||||||||
| CHANGE IN ASSUMPTION | INCREASE IN ASSUMPTION | DECREASE IN ASSUMPTION | INCREASE IN ASSUMPTION | DECREASE IN ASSUMPTION | ||||||
Discount rate | 0.5 | % | (77 | ) | 66 | (1,435 | ) | 1,533 | ||
Life expectancy at age 65 | 1 year | 34 | (33 | ) | 699 | (678 | ) | |||
POST-EMPLOYMENT BENEFIT PLAN ASSETS
The investment strategy for the post-employment benefit plan assets is to maintain a diversified portfolio of assets invested in a prudent manner to maintain the security of funds.
The following table shows the target allocations for 2016 and the allocation of our post-employment benefit plan assets at December 31, 2016 and 2015.
| WEIGHTED AVERAGE TARGET ALLOCATION | TOTAL PLAN ASSETS FAIR VALUE AT DECEMBER 31 (%) | |||||
| ASSET CATEGORY | 2016 | 2016 | 2015 | |||
Equity securities | 20% – 35% | 22 | % | 26 | % | |
Debt securities | 55% – 80% | 68 | % | 65 | % | |
Alternative investments | 0% – 25% | 10 | % | 9 | % | |
Total | 100 | % | 100 | % | ||
| 144 BCE Inc. 2016 ANNUAL REPORT | |||
| Notes to consolidated financial statements | |||
The following table shows the fair value of the DB pension plan assets at the end of the year for each category.
| FOR THE YEAR ENDED DECEMBER 31 | 2016 | 2015 | ||
Observable market data | ||||
Equity securities | ||||
Canadian | 901 | 910 | ||
Foreign | 3,682 | 4,263 | ||
Debt securities | ||||
Canadian | 12,469 | 12,038 | ||
Foreign | 1,068 | 718 | ||
Money market | 387 | 431 | ||
Non-observable market inputs | ||||
Alternative investments | ||||
Private equities | 1,219 | 1,124 | ||
Hedge funds | 726 | 687 | ||
Other | 111 | 73 | ||
Total | 20,563 | 20,244 |
Equity securities included approximately $17 million of BCE common shares, or 0.08% of total plan assets, at December 31, 2016 and approximately $12 million of BCE common shares, or 0.06% of total plan assets, at December 31, 2015.
Debt securities included approximately $15 million of Bell Canada debentures, or 0.07% of total plan assets, at December 31, 2016 and approximately $32 million of Bell Canada debentures, or 0.16% of total plan assets, at December 31, 2015.
Alternative investments included the pension plan’s investment in MLSE of $135 million, or 0.66% of total plan assets, at December 31, 2016 and $135 million, or 0.67% of total plan assets at December 31, 2015.
On February 23, 2015, the Bell Canada pension plan entered into an investment arrangement to hedge part of its exposure to potential increases in longevity, which covers approximately $5 billion of post-employment benefit obligations. The fair value of the arrangement is included within other alternative investments. As a hedging arrangement of the pension plan, the transaction requires no cash contributions from BCE.
CASH FLOWS
We are responsible for adequately funding our DB pension plans. We make contributions to them based on various actuarial cost methods that are permitted by pension regulatory bodies. Contributions reflect actuarial assumptions about future investment returns, salary projections and future service benefits. Changes in these factors could cause actual future contributions to differ from our current estimates and could require us to increase contributions to our post-employment benefit plans in the future, which could have a negative effect on our liquidity and financial performance.
We contribute to the DC pension plans as employees provide service.
The following table shows the amounts we contributed to the DB and DC pension plans and the payments made to beneficiaries under OPEB plans.
| DB PLANS(1) | DC PLANS | OPEB PLANS | ||||||||||
| FOR THE YEAR ENDED DECEMBER 31 | 2016 | 2015 | 2016 | 2015 | 2016 | 2015 | ||||||
Contributions | (626 | ) | (469 | ) | (99 | ) | (97 | ) | (76 | ) | (75 | ) |
| (1) | Includes voluntary contributions of $400 million in 2016 and $250 million in 2015. |
We expect to contribute approximately $225 million to our DB pension plans in 2017, subject to actuarial valuations being completed. We expect to pay approximately $80 million to beneficiaries under OPEB plans and to contribute approximately $105 million to the DC pension plans in 2017.
BCE Inc. 2016 ANNUAL REPORT 145 | |||
| Notes to consolidated financial statements | |||
| Note 23 Other non-current liabilities |
| FOR THE YEAR ENDED DECEMBER 31 | NOTE | 2016 | 2015(1) | |||
Long-term disability benefits obligation | 302 | 294 | ||||
Provisions | 21 | 273 | 199 | |||
CRTC tangible benefits obligation | 24 | 115 | 166 | |||
Deferred revenue on long-term contracts | 105 | 85 | ||||
CRTC deferral account obligation | 24 | 104 | 138 | |||
Future tax liabilities | 73 | 47 | ||||
MLSE financial liability(2) | 18, 24 | – | 135 | |||
Other | 305 | 356 | ||||
Total other non-current liabilities | 1,277 | 1,420 |
| (1) | We have reclassified amounts for the prior year to make them consistent with the presentation for the current year. |
| (2) | Represents BCE’s obligation to repurchase the Master Trust’s 9% interest in MLSE at a price not less than an agreed minimum price should the Master Trust exercise its put option. The obligation to repurchase is marked to market each reporting period and the gain or loss is recorded inOther income (expense). In 2016, the obligation was reclassified toTrade payables and other liabilitiesas the option is exercisable in 2017 and thereafter. |
| Note 24 Financial and capital management |
Financial management
Management’s objectives are to protect BCE and its subsidiaries on a consolidated basis against material economic exposures and variability of results from various financial risks that include credit risk, liquidity risk, foreign currency risk, interest rate risk and equity price risk.
DERIVATIVES
We use derivative instruments to manage our exposure to foreign currency risk, interest rate risk and changes in the price of BCE common shares under our share-based payment plans.
The following derivative instruments were outstanding during 2016 and/or 2015:
- foreign currency forward contracts and options that manage theforeign currency risk of certain purchase commitments
- cross currency basis swaps that hedge foreign currency risk on aportion of our long-term debt and debt due within one year
- interest rate swaps that hedge interest rate risk on a portion ofour long-term debt
- interest rate locks on future debt issuances and dividend rateresets on preferred shares
- forward contracts on BCE common shares that mitigate the cashflow exposure related to share-based payment plans
FAIR VALUE
Fair value is the price that would be received to sell an asset or paid to transfer a liability in an orderly transaction between market participants at the measurement date.
Certain fair value estimates are affected by assumptions we make about the amount and timing of future cash flows and discount rates, all of which reflect varying degrees of risk. Income taxes and other expenses that would be incurred on disposition of financial instruments are not reflected in the fair values. As a result, the fair values are not the net amounts that would be realized if these instruments were settled.
The carrying values of our cash and cash equivalents, trade and other receivables, dividends payable, trade payables and accruals, compensation payable, severance and other costs payable, interest payable, notes payable and loans secured by trade receivables approximate fair value as they are short-term.
| 146 BCE Inc. 2016 ANNUAL REPORT | |||
| Notes to consolidated financial statements | |||
The following table provides the fair value details of financial instruments measured at amortized cost in the statements of financial position.
| DECEMBER 31, 2016 | DECEMBER 31, 2015 | |||||||||||
| CLASSIFICATION | FAIR VALUE METHODOLOGY | NOTE | CARRYING VALUE | FAIR VALUE | CARRYING VALUE | FAIR VALUE | ||||||
CRTC tangible benefits obligation | Trade payables and other liabilities and non-current liabilities | Present value of estimated future cash flows discounted using observable market interest rates | 18, 23 |
| 166 |
| 169 |
| 227 |
| 234 | |
CRTC deferral account obligation | Trade payables and other liabilities and non-current liabilities | Present value of estimated future cash flows discounted using observable market interest rates | 18, 23 |
| 136 |
| 145 |
| 154 |
| 163 | |
| Debentures, finance leases and other debt | Debt due within one year and long-term debt | Quoted market price of debt or present value of future cash flows discounted using observable market interest rates | 19, 20 | 17,879 | 20,093 | 17,688 | 19,764 | |||||
The following table provides the fair value details of financial instruments measured at fair value in the statements of financial position.
FAIR VALUE AT DECEMBER 31 | |||||||||||
| CLASSIFICATION | NOTE | CARRYING VALUE OF ASSET (LIABILITY) AT DECEMBER 31 | QUOTED PRICES IN ACTIVE MARKETS FOR IDENTICAL ASSETS (LEVEL 1) | OBSERVABLE MARKET DATA (LEVEL 2)(1) | NON-OBSERVABLE MARKET INPUTS (LEVEL 3) (2) | ||||||
| 2016 | |||||||||||
AFS publicly-traded and privately-held investments | Other non-current assets | 16 |
| 103 |
| 1 |
| – |
| 102 |
|
Derivative financial instruments | Other current assets, trade payables and other liabilities, other non-current assets and liabilities |
|
| 166 |
| – |
| 166 |
| – |
|
MLSE financial liability(3) | Trade payables and other liabilities | 18 |
| (135 | ) | – |
| – |
| (135 | ) |
Other | Other non-current assets and liabilities | 35 | – | 88 | (53 | ) | |||||
2015 | |||||||||||
AFS publicly-traded and privately-held investments | Other non-current assets | 16 |
| 128 |
| 16 |
| – |
| 112 |
|
Derivative financial instruments | Other current assets, trade payables and other liabilities, other non-current assets and liabilities |
|
| 256 |
| – |
| 256 |
| – |
|
MLSE financial liability(3) | Other non-current liabilities | 23 |
| (135 | ) | – |
| – |
| (135 | ) |
Other | Other non-current assets and liabilities | 30 | – | 56 | (26 | ) | |||||
| (1) | Observable market data such as equity prices, interest rates, swap rate curves and foreign currency exchange rates. |
| (2) | Non-observable market inputs such as discounted cash flows and earnings multiples. A reasonable change in our assumptions would not result in a significant increase (decrease) to our level 3 financial instruments. |
| (3) | Represents BCE’s obligation to repurchase the Master Trust’s 9% interest in MLSE at a price not less than an agreed minimum price should the Master Trust exercise its put option. The obligation to repurchase is marked to market each reporting period and the gain or loss is recorded inOther income (expense)in the income statements. |
BCE Inc. 2016 ANNUAL REPORT 147 | |||
| Notes to consolidated financial statements | |||
CREDIT RISK
We are exposed to credit risk from operating activities and certain financing activities, the maximum exposure of which is represented by the carrying amounts reported in the statements of financial position.
We are exposed to credit risk if counterparties to our trade receivables and derivative instruments are unable to meet their obligations. The concentration of credit risk from our customers is minimized because we have a large and diverse customer base. There was minimal credit risk relating to derivative instruments at December 31, 2016 and 2015. We deal with institutions that have investment-grade credit ratings, and as such we expect that they will be able to meet their obligations. We regularly monitor our credit risk and credit exposure.
The following table provides the change in allowance for doubtful accounts for trade receivables.
| 2016 | 2015 | |||
Balance, January 1 | (64 | ) | (69 | ) |
Additions | (102 | ) | (86 | ) |
Use | 106 | 91 | ||
Balance, December 31 | (60 | ) | (64 | ) |
In many instances, trade receivables are written off directly to bad debt expense if the account has not been collected after a predetermined period of time.
The following table provides further details on trade receivables not impaired.
| AT DECEMBER 31 | 2016 | 2015 | ||
Trade receivables not past due | 2,187 | 2,205 | ||
Trade receivables past due and not impaired | ||||
Under 60 days | 286 | 289 | ||
60 to 120 days | 359 | 339 | ||
Over 120 days | 75 | 72 | ||
Trade receivables, net of allowance for doubtful accounts | 2,907 | 2,905 |
LIQUIDITY RISK
Our cash and cash equivalents, cash flows from operations and possible capital markets financing are expected to be sufficient to fund our operations and fulfill our obligations as they become due. Should our cash requirements exceed the above sources of cash, we would expect to cover such a shortfall by drawing on existing committed bank facilities and new ones, to the extent available.
The following table is a maturity analysis for recognized financial liabilities at December 31, 2016 for each of the next five years and thereafter.
| AT DECEMBER 31, 2016 | NOTE | 2017 | 2018 | 2019 | 2020 | 2021 | THERE– AFTER | TOTAL | ||||||||
Long-term debt | 20 | 880 | 1,753 | 1,326 | 1,411 | 2,235 | 8,037 | 15,642 | ||||||||
Notes payable | 19 | 2,649 | – | – | – | – | – | 2,649 | ||||||||
Minimum future lease payments under finance leases | 13 | 568 | 514 | 328 | 265 | 253 | 1,050 | 2,978 | ||||||||
Loan secured by trade receivables | 19 | 931 | – | – | – | – | – | 931 | ||||||||
Interest payable on long-term debt, notes payable and loan secured by trade receivables | 720 | 638 | 568 | 520 | 477 | 4,875 | 7,798 | |||||||||
MLSE financial liability | 18 | 135 | – | – | – | – | – | 135 | ||||||||
Total | 5,883 | 2,905 | 2,222 | 2,196 | 2,965 | 13,962 | 30,133 |
We are also exposed to liquidity risk for financial liabilities due within one year as shown in the statements of financial position.
MARKET RISK
CURRENCY EXPOSURES
We use forward contracts, options and cross currency basis swaps to manage foreign currency risk related to anticipated transactions and certain foreign currency debt.
A 10% depreciation (appreciation) in the value of the Canadian dollar relative to the U.S. dollar would result in a gain (loss) of $30 million recognized in net earnings at December 31, 2016 and a gain (loss) of $84 million recognized in other comprehensive (loss) income at December 31, 2016, with all other variables held constant.
The following table provides further details on our outstanding foreign currency forward contracts, options and cross currency basis swaps as at December 31, 2016.
| TYPE OF HEDGE | BUY CURRENCY | AMOUNT TO RECEIVE | SELL CURRENCY | AMOUNT TO PAY | MATURITY | HEDGED ITEM | ||||||
Cash flow | USD | 1,949 | CAD | 2,591 | 2017 | Commercial paper | ||||||
Cash flow | USD | 357 | CAD | 474 | 2017 | Credit facility | ||||||
Cash flow | USD | 447 | CAD | 585 | 2017 | Purchase commitments | ||||||
Cash flow | USD | 422 | CAD | 551 | 2018 | Purchase commitments | ||||||
Economic | USD | 359 | CAD | 486 | 2017 | Purchase commitments |
| 148 BCE Inc. 2016 ANNUAL REPORT | |||
| Notes to consolidated financial statements | |||
INTEREST RATE EXPOSURES
We use interest rate swaps to manage the mix of fixed and floating interest rates of our debt. We also use interest rate locks to hedge the interest rates on future debt issuances and to economically hedge dividend rate resets on preferred shares.
In 2016, we settled interest rate locks which hedged long-term debt and dividend rate resets on preferred shares with a notional amount of $500 million and $350 million respectively. In 2016, we redeemed, prior to maturity, long-term debt maturing on February 15, 2017 and settled the interest rate swap used to hedge the interest rate exposure on the redeemed debt, having a notional amount of $700 million. In 2016, we recognized a loss of $15 million (2015 – $18 million) on an interest rate swap used as a fair value hedge of long-term debt and an offsetting gain of $16 million (2015 – $18 million) on the corresponding long-term debt inOther income (expense)in the income statements.
A 1% increase (decrease) in interest rates would result in a decrease of $25 million (increase of $20 million) in net earnings at December 31, 2016.
EQUITY PRICE EXPOSURES
We use equity forward contracts on BCE’s common shares to economically hedge the cash flow exposure related to the settlement of share-based payment plans. See Note 26,Share-based paymentsfor details on our share-based payment arrangements. The fair value of our equity forward contracts at December 31, 2016 was $111 million (2015 – $86 million).
A 5% increase (decrease) in the market price of BCE’s common shares at December 31, 2016 would result in a gain (loss) of $36 million recognized in net earnings for 2016, all other variables held constant.
| Capital management |
We have various capital policies, procedures and processes which are utilized to achieve our objectives for capital management. These include optimizing our cost of capital and maximizing shareholder return while balancing the interests of our stakeholders.
Our definition of capital includes equity attributable to BCE shareholders, debt, and cash and cash equivalents.
The key ratios that we use to monitor and manage our capital structure are a net debt leverage ratio(1) and an adjusted EBITDA to net interest expense ratio(2). Our net debt leverage ratio target range is 1.75 to 2.25 times adjusted EBITDA and our adjusted EBITDA to net interest expense ratio target is greater than 7.5 times. We monitor our capital structure and make adjustments, including to our dividend policy, as required. At December 31, 2016, we had exceeded the limit of our internal net debt leverage ratio target range by 0.32. This excess over the limit of our internal ratio target range does not create risk to our investment-grade credit rating.
These ratios do not have any standardized meaning under IFRS. Therefore, they are unlikely to be comparable to similar measures presented by other issuers. We use, and believe that certain investors and analysts use, our net debt leverage ratio and adjusted EBITDA to net interest expense ratio as measures of financial leverage and health of the company.
The following table provides a summary of our key ratios.
| AT DECEMBER 31 | 2016 | 2015 | ||
Net debt leverage ratio | 2.57 | 2.53 | ||
Adjusted EBITDA to net interest expense ratio | 9.31 | 8.76 |
On February 1, 2017, the board of directors of BCE approved an increase of 5.1% in the annual dividend on BCE’s common shares, from $2.73 to $2.87 per common share. In addition, the board of directors of BCE declared a quarterly dividend of $0.7175 per common share, payable on April 15, 2017 to shareholders of record at March 15, 2017.
On February 3, 2016, the board of directors of BCE approved an increase of 5.0% in the annual dividend on BCE’s common shares, from $2.60 to $2.73 per common share.
| (1) | Our net debt leverage ratio represents net debt divided by adjusted EBITDA. We define net debt as debt due within one year plus long-term debt and 50% of preferred shares less cash and cash equivalents as shown in our statements of financial position. Adjusted EBITDA is defined as operating revenues less operating costs as shown in our income statements. |
| (2) | Our adjusted EBITDA to net interest expense ratio represents adjusted EBITDA divided by net interest expense. Adjusted EBITDA is defined as operating revenues less operating costs as shown in our income statements. Net interest expense is net interest expense as shown in our statements of cash flows and 50% of declared preferred share dividends as shown in our income statements. |
BCE Inc. 2016 ANNUAL REPORT 149 | |||
| Notes to consolidated financial statements | |||
| Note 25 Share capital |
Preferred shares
BCE’s articles of amalgamation provide for an unlimited number of First Preferred Shares and Second Preferred Shares, all without par value. The terms set out in the articles authorize BCE’s directors to issue the shares in one or more series and to set the number of shares and the conditions for each series.
The following table is a summary of the principal terms of BCE’s First Preferred Shares. There were no Second Preferred Shares issued and outstanding at December 31, 2016. BCE’s articles of amalgamation, as amended, describe the terms and conditions of these shares in detail.
| NUMBER OF SHARES | STATED CAPITAL | |||||||||||||||||
| SERIES | ANNUAL DIVIDEND RATE | CONVERTIBLE INTO | CONVERSION DATE | REDEMPTION DATE | REDEMPTION PRICE | AUTHORIZED | ISSUED AND OUTSTANDING | DEC. 31, 2016 | DEC. 31, 2015 | |||||||||
| Q(1) | floating | Series R | December 1, 2025 | 8,000,000 | – | – | – | |||||||||||
| R(2) | 4.13% | Series Q | December 1, 2020 | December 1, 2020 | $25.00 | 8,000,000 | 8,000,000 | 200 | 200 | |||||||||
| S | floating | Series T | November 1, 2021 | At any time | $25.50 | 8,000,000 | 3,513,448 | 88 | 90 | |||||||||
| T(2) | 3.019% | Series S | November 1, 2021 | November 1, 2021 | $25.00 | 8,000,000 | 4,486,552 | 112 | 110 | |||||||||
| Y | floating | Series Z | December 1, 2017 | At any time | $25.50 | 10,000,000 | 8,772,468 | 219 | 219 | |||||||||
| Z(2) | 3.152% | Series Y | December 1, 2017 | December 1, 2017 | $25.00 | 10,000,000 | 1,227,532 | 31 | 31 | |||||||||
| AA(2) | 3.45% | Series AB | September 1, 2017 | September 1, 2017 | $25.00 | 20,000,000 | 10,144,302 | 259 | 259 | |||||||||
| AB | floating | Series AA | September 1, 2017 | At any time | $25.50 | 20,000,000 | 9,855,698 | 251 | 251 | |||||||||
| AC(2) | 3.55% | Series AD | March 1, 2018 | March 1, 2018 | $25.00 | 20,000,000 | 5,069,935 | 129 | 129 | |||||||||
| AD | floating | Series AC | March 1, 2018 | At any time | $25.50 | 20,000,000 | 14,930,065 | 381 | 381 | |||||||||
| AE | floating | Series AF | February 1, 2020 | At any time | $25.50 | 24,000,000 | 9,292,133 | 232 | 232 | |||||||||
| AF(2) | 3.11% | Series AE | February 1, 2020 | February 1, 2020 | $25.00 | 24,000,000 | 6,707,867 | 168 | 168 | |||||||||
| AG(2) | 2.80% | Series AH | May 1, 2021 | May 1, 2021 | $25.00 | 22,000,000 | 4,985,351 | 125 | 271 | |||||||||
| AH | floating | Series AG | May 1, 2021 | At any time | $25.50 | 22,000,000 | 9,014,649 | 225 | 79 | |||||||||
| AI(2) | 2.75% | Series AJ | August 1, 2021 | August 1, 2021 | $25.00 | 22,000,000 | 5,949,884 | 149 | 269 | |||||||||
| AJ | floating | Series AI | August 1, 2021 | At any time | $25.50 | 22,000,000 | 8,050,116 | 201 | 81 | |||||||||
| AK(2) | 2.954% | Series AL | December 31, 2021 | December 31, 2021 | $25.00 | 25,000,000 | 22,745,921 | 569 | 625 | |||||||||
| AL(3) | floating | Series AK | December 31, 2021 | At any time | 25,000,000 | 2,254,079 | 56 | – | ||||||||||
| AM(2) | 2.764% | Series AN | March 31, 2021 | March 31, 2021 | $25.00 | 30,000,000 | 9,546,615 | 218 | 263 | |||||||||
| AN(3) | floating | Series AM | March 31, 2021 | At any time | 30,000,000 | 1,953,385 | 45 | – | ||||||||||
| AO(2) | 4.55% | Series AP | March 31, 2017 | March 31, 2017 | $25.00 | 30,000,000 | 4,600,000 | 118 | 118 | |||||||||
| AP(4) | floating | Series AO | March 31, 2022 | 30,000,000 | – | – | – | |||||||||||
| AQ(2) | 4.25% | Series AR | September 30, 2018 | September 30, 2018 | $25.00 | 30,000,000 | 9,200,000 | 228 | 228 | |||||||||
| AR(4) | floating | Series AQ | September 30, 2023 | 30,000,000 | – | – | – | |||||||||||
| 4,004 | 4,004 | |||||||||||||||||
| (1) | If Series Q First Preferred Shares are issued on December 1, 2020, BCE may redeem such shares at $25.50 per share on any date after December 1, 2020 which is not a Series conversion date. |
| (2) | BCE may redeem each of these series of First Preferred Shares on the applicable redemption date and every five years after that date. |
| (3) | BCE may redeem Series AL and AN First Preferred Shares at $25.00 per share on December 31, 2021 and March 31, 2021, respectively, and every five years thereafter (each, a Series conversion date). Alternatively, BCE may redeem Series AL or AN First Preferred Shares at $25.50 per share on any date which is not a Series conversion date for such series of First Preferred Shares. |
| (4) | If Series AP or AR First Preferred Shares are issued on March 31, 2017 and September 30, 2018, respectively, BCE may redeem such shares at $25.00 per share on March 31, 2022 and September 30, 2023, respectively, and every five years thereafter (each, a Series conversion date). Alternatively, BCE may redeem Series AP or AR First Preferred Shares at $25.50 per share on any date after March 31, 2017 and September 30, 2018, respectively, which is not a Series conversion date for such series of First Preferred Shares. |
VOTING RIGHTS
All of the issued and outstanding First Preferred Shares at December 31, 2016 are non-voting, except under special circumstances, when the holders are entitled to one vote per share.
PRIORITY AND ENTITLEMENT TO DIVIDENDS
The First Preferred Shares of all series rank on a parity with each other and in priority to all other shares of BCE with respect to payment of dividends and with respect to distribution of assets in the event of liquidation, dissolution or winding up of BCE.
Holders of Series R, T, Z, AA, AC, AF, AG, AI, AK, AM, AO and AQ First Preferred Shares are entitled to fixed cumulative quarterly dividends. The dividend rate on these shares is reset every five years, as set out in BCE’s articles of amalgamation, as amended.
Holders of Series S, Y, AB, AD, AE, AH and AJ First Preferred Shares are entitled to floating adjustable cumulative monthly dividends. The floating dividend rate on these shares is calculated every month, as set out in BCE’s articles of amalgamation, as amended.
| 150 BCE Inc. 2016 ANNUAL REPORT | |||
| Notes to consolidated financial statements | |||
Holders of Series AL and AN First Preferred Shares are entitled to floating cumulative quarterly dividends. The floating dividend rate on these shares is calculated every quarter, as set out in BCE’s articles of amalgamation, as amended.
Dividends on all series of First Preferred Shares are paid as and when declared by the board of directors of BCE.
CONVERSION FEATURES
All of the issued and outstanding First Preferred Shares at December 31, 2016 are convertible at the holder’s option into another associated series of First Preferred Shares on a one-for-one basis according to the terms set out in BCE’s articles of amalgamation, as amended.
CONVERSION OF FIRST PREFERRED SHARES
On December 31, 2016, 2,254,079 of BCE’s 25,000,000 fixed-rate Cumulative Redeemable First Preferred Shares, Series AK (Series AK Preferred Shares) were converted, on a one-for-one basis, into floating-rate Cumulative Redeemable First Preferred Shares, Series AL (Series AL Preferred Shares).
On November 1, 2016, 455,302 of BCE’s 4,393,775 fixed-rate Cumulative Redeemable First Preferred Shares, Series T (Series T Preferred Shares) were converted, on a one-for-one basis, into floating-rate Cumulative Redeemable First Preferred Shares, Series S (Series S Preferred Shares). In addition, on November 1, 2016, 548,079 of BCE’s 3,606,225 Series S Preferred Shares were converted, on a one-for-one basis, into Series T Preferred Shares.
On August 1, 2016, 5,081,951 of BCE’s 10,754,990 fixed-rate Cumulative Redeemable First Preferred Shares, Series AI (Series AI Preferred Shares) were converted, on a one-for-one basis, into floating-rate Cumulative Redeemable First Preferred Shares, Series AJ (Series AJ Preferred Shares). In addition, on August 1, 2016, 276,845 of BCE’s 3,245,010 Series AJ Preferred Shares were converted, on a one-for-one basis, into Series AI Preferred Shares.
On May 1, 2016, 5,884,470 of BCE’s 10,841,056 fixed-rate Cumulative Redeemable First Preferred Shares, Series AG (Series AG Preferred Shares) were converted, on a one-for-one basis, into floating-rate Cumulative Redeemable First Preferred Shares, Series AH (Series AH Preferred Shares). In addition, on May 1, 2016, 28,765 of BCE’s 3,158,944 Series AH Preferred Shares were converted, on a one-for-one basis, into Series AG Preferred Shares.
On March 31, 2016, 1,953,385 of BCE’s 11,500,000 fixed-rate Cumulative Redeemable First Preferred Shares, Series AM (Series AM Preferred Shares) were converted, on a one-for-one basis, into floating-rate Cumulative Redeemable First Preferred Shares, Series AN (Series AN Preferred Shares).
| Common shares and Class B shares |
BCE’s articles of amalgamation provide for an unlimited number of voting common shares and non-voting Class B shares, all without par value. The common shares and the Class B shares rank equally in the payment of dividends and in the distribution of assets if BCE is liquidated, dissolved or wound up, after payments due to the holders of preferred shares. No Class B shares were outstanding at December 31, 2016 and 2015.
The following table provides details about the outstanding common shares of BCE.
| 2016 | 2015 | ||||||||
| NUMBER OF | STATED | NUMBER OF | STATED | ||||||
| NOTE | SHARES | CAPITAL | SHARES | CAPITAL | |||||
Outstanding, January 1 | 865,614,188 | 18,100 | 840,330,353 | 16,717 | ||||||
Shares issued under bought deal offering | – | – | 15,111,000 | 863 | ||||||
Shares issued for the acquisition of Glentel | 3 | – | – | 5,548,908 | 296 | |||||
Shares issued under employee stock option plan | 26 | 2,236,891 | 104 | 2,289,677 | 96 | |||||
Shares issued under dividend reinvestment plan | 688,839 | 38 | – | – | ||||||
Shares issued under ESP | 2,166,414 | 128 | 2,334,250 | 128 | ||||||
Outstanding, December 31 | 870,706,332 | 18,370 | 865,614,188 | 18,100 | ||||||
On December 11, 2015, BCE issued 15,111,000 common shares to a syndicate of underwriters at a price of $57.10 per common share, representing a discount of $0.90 or 1.6% to the November 23, 2015 announcement date closing price. We incurred $35 million ($26 million net of tax) of issuance costs which were charged to the deficit.
CONTRIBUTED SURPLUS
Contributed surplus in 2016 and 2015 include premiums in excess of par value upon the issuance of BCE common shares and share-based compensation expense net of settlements.
| Note 26 Share-based payments |
The following share-based payment amounts are included in the income statements as operating costs.
FOR THE YEAR ENDED DECEMBER 31 | 2016 | 2015 | ||
ESP | (29 | ) | (28 | ) |
RSUs/PSUs | (49 | ) | (51 | ) |
Other(1) | (12 | ) | (15 | ) |
Total share-based payments | (90 | ) | (94 | ) |
| (1) | Includes DSP, DSUs and stock options. |
BCE Inc. 2016 ANNUAL REPORT 151 | |||
| Notes to consolidated financial statements | |||
| Description of the plans |
ESP
The ESP is designed to encourage employees of BCE and its participating subsidiaries to own shares of BCE. Each year, employees can choose to have a certain percentage of their eligible annual earnings withheld through regular payroll deductions for the purchase of BCE common shares. In some cases, the employer also will contribute a percentage of the employee’s eligible annual earnings to the plan, up to a specified maximum. Dividends are credited to the participant’s account on each dividend payment date and are equivalent in value to the dividends paid on BCE common shares.
The BCE ESP allows employees to contribute up to 12% of their annual earnings with a maximum employer contribution of 2%.
Employer contributions to the BCE ESP plan are subject to employees holding their shares for a two-year vesting period. Dividends related to employer contributions are also subject to the two-year vesting period.
The trustee of the ESP buys BCE common shares for the participants on the open market, by private purchase or from treasury. BCE determines the method the trustee uses to buy the shares.
At December 31, 2016, 5,673,948 common shares were authorized for issuance from treasury under the BCE ESP.
The following table summarizes the status of unvested employer contributions at December 31, 2016 and 2015.
NUMBER OF ESP SHARES | 2016 | 2015 | ||
Unvested contributions, January 1 | 1,146,046 | 1,153,653 | ||
Contributions(1) | 600,808 | 645,633 | ||
Dividends credited | 49,988 | 53,283 | ||
Vested | (586,309 | ) | (600,815 | ) |
Forfeited | (137,321 | ) | (105,708 | ) |
Unvested contributions, December 31 | 1,073,212 | 1,146,046 |
| (1) | The weighted average fair value of the shares contributed was $59 and $55 in 2016 and 2015, respectively. |
RSUs/PSUs
RSUs/PSUs are granted to executives and other eligible employees. The value of an RSU/PSU at the grant date is equal to the value of one BCE common share. Dividends in the form of additional RSUs/PSUs are credited to the participant’s account on each dividend payment date and are equivalent in value to the dividend paid on BCE common shares. Executives and other eligible employees are granted a specific number of RSUs/PSUs for a given performance period based on their position and level of contribution. RSUs/PSUs vest fully after three years of continuous employment from the date of grant and, in certain cases, if performance objectives are met, as determined by the board of directors.
The following table summarizes outstanding RSUs/PSUs at December 31, 2016 and 2015.
NUMBER OF RSUs/PSUs | 2016 | 2015 | ||
Oustanding, January 1 | 3,333,583 | 3,616,967 | ||
Granted(1) | 874,888 | 1,005,062 | ||
Dividends credited | 137,583 | 157,485 | ||
Settled | (1,321,846 | ) | (1,342,514 | ) |
Forfeited | (95,510 | ) | (103,417 | ) |
Outstanding, December 31 | 2,928,698 | 3,333,583 | ||
Vested, December 31(2) | 1,058,200 | 1,138,861 |
| (1) | The weighted average fair value of the RSUs/PSUs granted was $58 and $55 in 2016 and 2015, respectively. |
| (2) | The RSUs/PSUs vested on December 31, 2016 were fully settled in February 2017 with BCE common shares and/or DSUs. |
DSP
The value of a deferred share is equal to the value of one BCE common share. Dividends in the form of additional deferred shares are credited to the participant’s account on each dividend payment date and are equivalent in value to the dividend paid on BCE common shares. Deferred shares vest fully after three years of continuous employment from the date of grant. The liability recorded inTrade payables and other liabilitiesandOther non-current liabilitiesin the statements of financial position and related to the deferred share plan was $37 million and $38 million at December 31, 2016 and December 31, 2015, respectively.
STOCK OPTIONS
Under BCE’s long-term incentive plans, BCE may grant options to executives to buy BCE common shares. The subscription price of a grant is based on the higher of:
- the volume-weighted average of the trading price on the tradingday immediately prior to the effective date of the grant
- the volume-weighted average of the trading price for the last fiveconsecutive trading days ending on the trading day immediatelyprior to the effective date of the grant
At December 31, 2016, 17,390,633 common shares were authorized for issuance under these plans. Options vest fully after three years of continuous employment from the date of grant. All options become exercisable when they vest and can be exercised for a period of seven years from the date of grant. Special vesting provisions may apply if:
- there is a change in control of BCE and the option holder’semployment ends
- the option holder is employed by a designated subsidiary of BCEand BCE’s ownership interest in that subsidiary falls below thepercentage set out in the plan
| 152 BCE Inc. 2016 ANNUAL REPORT | |||
| Notes to consolidated financial statements | |||
The following table summarizes BCE’s outstanding stock options at December 31, 2016 and 2015.
| NOTE | 2016 | 2015 | |||||||
| NUMBER OF OPTIONS | WEIGHTED AVERAGE EXERCISE PRICE ($) | NUMBER OF OPTIONS | WEIGHTED AVERAGE EXERCISE PRICE ($) | |||||||
Outstanding, January 1 | 9,666,904 | $48 | 9,278,190 | $43 | ||||||
Granted | 2,968,062 | $58 | 2,835,667 | $56 | ||||||
Exercised(1) | 25 | (2,236,891 | ) | $44 | (2,289,677 | ) | $39 | |||
Forfeited | (155,913 | ) | $52 | (157,276 | ) | $49 | ||||
Outstanding, December 31 | 10,242,162 | $52 | 9,666,904 | $48 | ||||||
Exercisable, December 31 | 1,786,251 | $42 | 1,174,191 | $38 | ||||||
| (1) | The weighted average share price for options exercised was $59 and $56 in 2016 and 2015, respectively. |
The following table provides additional information about BCE’s stock option plans at December 31, 2016.
RANGE OF EXERCISE PRICES | STOCK OPTIONS OUTSTANDING | |||||
| NUMBER | WEIGHTED AVERAGE REMAINING LIFE | WEIGHTED AVERAGE EXERCISE PRICE ($) | ||||
$30 – $39 | 353,374 | 1.14 | $36 | |||
$40-$49 | 4,216,472 | 3.70 | $46 | |||
$50 or more | 5,672,316 | 5.67 | $57 | |||
| 10,242,162 | 4.70 | $52 | |||
ASSUMPTIONS USED IN STOCK OPTION PRICING MODEL
The fair value of options granted was determined using a variation of a binomial option pricing model that takes into account factors specific to the share incentive plans, such as the vesting period. The following table shows the principal assumptions used in the valuation.
| 2016 | |
Weighted average fair value per option granted | $2.57 | |
Weighted average share price | $58 | |
Weighted average exercise price | $58 | |
Dividend yield | 4.7 | % |
Expected volatility | 15 | % |
Risk-free interest rate | 0.6 | % |
Expected life (years) | 4.5 |
Expected volatilities are based on the historical volatility of BCE’s share price. The risk-free rate used is equal to the yield available on Government of Canada bonds at the date of grant with a term equal to the expected life of the options.
DSUs
Eligible bonuses and RSUs/PSUs may be paid in the form of DSUs when executives or other eligible employees elect to or are required to participate in the plan. The value of a DSU at the issuance date is equal to the value of one BCE common share. For non-management directors, compensation is paid in DSUs until the minimum share ownership requirement is met; thereafter, at least 50% of their compensation is paid in DSUs. There are no vesting requirements relating to DSUs. Dividends in the form of additional DSUs are credited to the participant’s account on each dividend payment date and are equivalent in value to the dividends paid on BCE common shares. DSUs are settled when the holder leaves the company.
The following table summarizes the status of outstanding DSUs at December 31, 2016 and 2015.
NUMBER OF DSUs | 2016 | 2015 | ||
Outstanding, January 1 | 3,796,051 | 4,116,527 | ||
Issued(1) | 87,665 | 174,672 | ||
Settlement of RSUs/PSUs | 323,428 | 216,500 | ||
Dividends credited | 183,852 | 201,721 | ||
Settled | (259,767 | ) | (913,369 | ) |
Outstanding, December 31 | 4,131,229 | 3,796,051 |
| (1) | The weighted average fair value of the DSUs issued was $59 and $55 in 2016 and 2015, respectively. |
BCE Inc. 2016 ANNUAL REPORT 153 | |||
| Notes to consolidated financial statements | |||
| Note 27 Commitments and contingencies |
Commitments
The following table is a summary of our contractual obligations at December 31, 2016 that are due in each of the next five years and thereafter.
| THERE- | |||||||||||||||
| NOTE | 2017 | 2018 | 2019 | 2020 | 2021 | AFTER | TOTAL | ||||||||
Operating leases | 297 | 242 | 195 | 157 | 123 | 363 | 1,377 | |||||||||
Commitments for property, plant and equipment and intangible assets | 994 | 745 | 608 | 460 | 385 | 1,122 | 4,314 | |||||||||
Purchase obligations | 828 | 585 | 551 | 460 | 444 | 1,129 | 3,997 | |||||||||
Proposed acquisition of MTS(1) | 3 | 3,068 | – | – | – | – | – | 3,068 | ||||||||
Acquisition of Cieslok Media(2) | 3 | 161 | – | – | – | – | – | 161 | ||||||||
Total | 5,348 | 1,572 | 1,354 | 1,077 | 952 | 2,614 | 12,917 |
| (1) | Subject to certain closing conditions and termination rights, the proposed acquisition of MTS is expected to close on March 17, 2017. If the transaction does not close under certain circumstances, BCE may be liable to pay a break fee of $200 million to MTS. |
| (2) | This commitment was settled on January 3, 2017 upon completion of the acquisition of Cieslok Media. See Note 3,Business acquisitions and dispositionsfor additional details. |
BCE’s significant operating leases are for office premises, cellular tower sites, retail outlets, and OOH advertising spaces with lease terms ranging from 1 to 50 years. These leases are non-cancellable. Rental expense relating to operating leases was $353 million in 2016 and $340 million in 2015.
Our commitments for property, plant and equipment and intangible assets include program and feature film rights and investments to expand and update our networks to meet customer demand.
Purchase obligations consist of contractual obligations under service and product contracts for operating expenditures and other purchase obligations.
| Contingencies |
In the ordinary course of business, we become involved in various claims and legal proceedings seeking monetary damages and other relief. In particular, because of the nature of our consumer-facing business, we are exposed to class actions pursuant to which substantial monetary damages may be claimed. Due to the inherent risks and uncertainties of the litigation process, we cannot predict the final outcome or timing of claims and legal proceedings. Subject to the foregoing, and based on information currently available and management’s assessment of the merits of the claims and legal proceedings pending at March 2, 2017, management believes that the ultimate resolution of these claims and legal proceedings is unlikely to have a material and negative effect on our financial statements. We believe that we have strong defences and we intend to vigorously defend our positions.
| Note 28 Related party transactions |
Subsidiaries
The following table shows BCE’s significant subsidiaries at December 31, 2016. BCE has other subsidiaries which have not been included in the table as each represents less than 10% individually and less than 20% in aggregate of total consolidated revenues.
All of these significant subsidiaries are incorporated in Canada and provide services to each other in the normal course of operations. The value of these transactions is eliminated on consolidation.
| OWNERSHIP PERCENTAGE | |||
SUBSIDIARY | 2016 | 2015 | ||
Bell Canada | 100 | % | 100 | % |
Bell Mobility | 100 | % | 100 | % |
Bell Media | 100 | % | 100 | % |
| Transactions with joint arrangements and associates |
During 2016 and 2015, BCE provided communication services and received programming content and other services in the normal course of business on an arm’s length basis to and from its joint arrangements and associates. Our joint arrangements and associates include MLSE, Glentel, and Dome Productions Partnership. From time to time, BCE may be required to make capital contributions in its investments.
In 2016, BCE recognized revenues and incurred expenses with our joint arrangements and associates of $16 million (2015 – $8 million) and $180 million (2015 – $104 million), respectively.
| 154 BCE Inc. 2016 ANNUAL REPORT | |||
| Notes to consolidated financial statements | |||
| BCE Master Trust Fund |
Bimcor Inc. (Bimcor), a wholly-owned subsidiary of Bell Canada, is the administrator of the Master Trust. Bimcor recognized management fees of $10 million from the Master Trust for 2016 and $13 million for 2015. The details of BCE’s post-employment benefit plans are set out in Note 22,Post-employment benefit plans.
| Compensation of key management personnel and board of directors |
The following table includes compensation of the key management personnel and board of directors for the years ended December 31, 2016 and 2015 included in our income statements. Key management personnel include the company’s Chief Executive Officer (CEO), Group President and the executives who report directly to them.
FOR THE YEAR ENDED DECEMBER 31 | 2016 | 2015 | ||
Wages, salaries, fees and related taxes and benefits | (24 | ) | (32 | ) |
Post-employment benefit plans and OPEBs cost | (4 | ) | (3 | ) |
Share-based compensation | (27 | ) | (27 | ) |
Key management personnel and board of directors compensation expense | (55 | ) | (62 | ) |
| Note 29 Significant partly-owned subsidiaries |
The following tables show summarized financial information for our subsidiaries with significant non-controlling interest (NCI).
| Summarized statements of financial position |
| CTV SPECIALTY(1) | |||
FOR THE YEAR ENDED DECEMBER 31 | 2016 | 2015 | ||
Current assets | 293 | 272 | ||
Non-current assets | 1,013 | 1,030 | ||
Total assets | 1,306 | 1,302 | ||
Current liabilities | 130 | 142 | ||
Non-current liabilities | 195 | 200 | ||
Total liabilities | 325 | 342 | ||
Total equity attributable to BCE shareholders | 687 | 673 | ||
NCI | 294 | 287 | ||
| (1) | At December 31, 2016 and 2015, the ownership interest held by NCI in CTV Specialty was 29.9%. CTV Specialty was incorporated and operated in Canada as at such dates. |
| Selected income and cash flow information |
| CTV SPECIALTY(1) | |||
FOR THE YEAR ENDED DECEMBER 31 | 2016 | 2015 | ||
Operating revenues | 824 | 805 | ||
Net earnings | 182 | 166 | ||
Net earnings attributable to NCI | 56 | 52 | ||
Total comprehensive income | 173 | 174 | ||
Total comprehensive income attributable to NCI | 54 | 54 | ||
Cash dividends paid to NCI | 46 | 41 | ||
| (1) | CTV Specialty net earnings and total comprehensive income includes $3 million directly attributable to NCI for 2016 and 2015. |
BCE Inc. 2016 ANNUAL REPORT 155 | |||
| Board of directors / Executives | |||
| Board of directors as of March 2, 2017 |
| Gordon M. Nixon ONTARIO, CANADA Corporate Director Chair of the Board, BCE Inc. and Bell Canada Director since November 2014 Barry K. Allen Ronald A. Brenneman Sophie Brochu | Robert E. Brown QUÉBEC, CANADA Corporate Director Director since May 2009 George A. Cope David F. Denison, Robert P. Dexter | Ian Greenberg QUÉBEC, CANADA Corporate Director Director since July 2013 Katherine Lee Monique F. Leroux, | Calin Rovinescu QUÉBEC, CANADA President and Chief Executive Officer, Air Canada Director since April 2016 Robert C. Simmonds Paul R. Weiss, |
| Committees of the board |
AUDIT COMMITTEE P.R. Weiss(Chair), The audit committee assists the board in the oversight of:
| PENSION FUND COMMITTEE D.F. Denison(Chair), The PFC assists the board in the oversight of:
| CORPORATE GOVERNANCE COMMITTEE R.E. Brown(Chair), The CGC assists the board in:
| MANAGEMENT RESOURCES AND COMPENSATION COMMITTEE R.A. Brenneman(Chair), The MRCC assists the board in the oversight of:
|
| 156 BCE Inc. 2016 ANNUAL REPORT | |||
| Board of directors / Executives | |||
| Executives as of March 2, 2017 |
| George A. Cope President and Chief Executive Officer, BCE Inc. and Bell Canada Mirko Bibic Charles Brown Michael Cole Stephen Howe Rizwan Jamal Blaik Kirby | Glen LeBlanc Executive Vice-President and Chief Financial Officer, BCE Inc. and Bell Canada Bernard le Duc Randy Lennox Thomas Little Wade Oosterman Martine Turcotte John Watson |
BCE Inc. 2016 ANNUAL REPORT 157 | |||
| Investor information | |||
| Investor information |
Share facts SYMBOL LISTINGS COMMON SHARES OUTSTANDING QUARTERLY DIVIDEND* 2017 DIVIDEND SCHEDULE* | Tax aspects CAPITAL GAINS ON YOUR SHARES If you received Nortel Networks common shares in May 2000 and/or Bell Aliant Regional Communications Income Fund units in July 2006, you should contact the Investor Relations group to learn more about the tax implications on your cost, or visit BCE.ca. DIVIDENDS NON-RESIDENTS OF CANADA Beginning in 2012, the Canada Revenue Agency introduced new rules requiring residents of any country with which Canada has a tax treaty to certify that they reside in that country and are eligible to have Canadian non-resident tax withheld on the payment of their dividends at the tax treaty rate. Registered shareholders should have completed the Declaration of Eligibility for Benefits under a Tax Treaty for a Non-Resident Taxpayer and returned it to the transfer agent. U.S. RESIDENTS | ||
Record date March 15, 2017 June 15, 2017 September 15, 2017 December 15, 2017 | Payment date** April 15, 2017 July 15, 2017 October 15, 2017 January 15, 2018 | ||
| * Subject to dividends being declared by the board of directors ** When a dividend payment date falls on a weekend, the payment is made on the following business day 2017 QUARTERLY EARNINGS | |||
First quarter Second quarter Third quarter Fourth quarter | April 26, 2017 August 3, 2017 November 2, 2017 February 8, 2018 | ||
| Quarterly and annual reports as well as other corporate documents can be found on our website. Copies can be requested from the Investor Relations group. | |||
| 158 BCE Inc. 2016 ANNUAL REPORT | |||
Shareholder services DIVIDEND REINVESTMENT AND STOCK PURCHASE PLAN DIVIDEND DIRECT DEPOSIT SERVICE DIRECT REGISTRATION (DRS) E-DELIVERY SERVICE DUPLICATE MAILINGS MANAGE YOUR SHAREHOLDER ACCOUNT For more details on any of these services, registered shareholders (shares are registered under your name) must contact the transfer agent. Non-registered shareholders must contact their brokers. | Contact information TRANSFER AGENT AND REGISTRAR CST Trust Company | ||
| bce@canstockta.com | |||
| tel | 416 682-3861 or 1 800 561-0934 (toll free in Canada and the U.S.) | ||
| fax | 514 985-8843 or 1 888 249-6189 (toll free in Canada and the U.S.) | ||
| website | www.canstockta.com | ||
INVESTOR RELATIONS For financial inquiries: Building A, 8th Floor 1 Carrefour Alexander-Graham-Bell Verdun, Québec H3E 3B3 | |||
| investor.relations@bce.ca | |||
| tel | 1 800 339-6353 | ||
| fax | 514 786-3970 or visit the Investors section of our website atBCE.ca
| ||
Trade-marks: The following are trade-marks referred to and used as such in this annual report that BCE Inc., its subsidiaries, joint arrangements, associates or other entities in which we hold an equity interest own or use under licence. BCE is a trade-mark of BCE Inc.; Aliant, Bell, Bell Canada, Bell Centre, Bell Internet, Bell Media, Bell Mobility, Bell TV, Fibe, FibreOP, Let’s Talk, Q9, Q9 Networks, Roam Better and TV Everywhere are trade-marks of Bell Canada; Astral, Astral Media, Astral Out-of-Home, BNN, Canal D, Canal Vie, CP24, CraveTV, CTV, CTV GO, CTV News, CTV Two, Gusto, Daily Planet, eTalk, Learning and Skills Television of Alberta, Space, Super Écran, The Comedy Network, The Movie Network, TMN, TMN Encore, TMN GO and Z are trade-marks of Bell Media Inc.; Bravo is a trade-mark of Bravo Media LLC; Cablevision is a trade-mark of Cablevision du Nord de Québec Inc.; Animal Planet, Discovery, Discovery Science and Discovery GO are trade-marks of Discovery Communications, LLC; Dome Productions is a trade-mark of Dome Productions Partnership; ExpressVu is a trade-mark of Bell ExpressVu Limited Partnership; EZ Rock is a trade-mark of Bell Media Radio G.P.; Glentel, Tbooth wireless, Wirelesswave, Wave sans fil and Wireless etc. are trade-marks of Glentel Inc.; HBO Canada is a trade-mark of Home Box Office Inc.; iHeartRadio is a trade-mark of iHM Identity, Inc.; Métromédia CMR Plus is a trade-mark of Métromédia CMR Plus Inc.; MLSE is a trade-mark of Maple Leaf Sports & Entertainment Ltd.; Toronto Maple Leafs, Toronto Marlies and Toronto Raptors are trade-marks of Maple Leaf Sports & Entertainment Partnership; Montreal Canadiens is a trade-mark of Club de Hockey Canadien, Inc.; NorthernTel is a trade-mark of Nortel Networks Limited; Northwestel and N-NorthwesTel Design are trade-marks of Northwestel Inc.; Showtime is a trade-mark of Showtime Networks Inc.; Télébec is a trade-mark of Télébec, Limited Partnership; The Source is a trade-mark of The Source (Bell) Electronics Inc.; Toronto Argonauts and Argos are trade-marks of Argonauts Holdings Limited Partnership; Toronto FC is a trade-mark of MLS Canada LP; TSN, TSN GO, RDS and RDS GO are trade-marks of The Sports Network Inc.; Virgin Mobile and Virgin Mobile Canada are trade-marks of Virgin Enterprises Limited.
We believe that our trade-marks are very important to our success and take appropriate measures to protect, renew and defend them. Any other trade-marks used in this annual report are the property of their respective owners.
Photography credit:
Page 23 Hello, Montréal, photo by Mikaël Theimer
© BCE Inc., 2017. All rights reserved.
![]()