Exhibit 99.2
| Management’s discussion and analysis |
In this management’s discussion and analysis of financial condition and results of operations (MD&A),we,us,our,BCEandthe companymean, as the context may require, either BCE Inc. or, collectively, BCE Inc., Bell Canada, their subsidiaries, joint arrangements and associates.Bellmeans, as the context may require, either Bell Canada or, collectively, Bell Canada, its subsidiaries, joint arrangements and associates.MTSmeans, as the context may require, until March 17, 2017, either Manitoba Telecom Services Inc. or, collectively, Manitoba Telecom Services Inc. and its subsidiaries; andBell MTSmeans, from March 17, 2017, the combined operations of MTS and Bell Canada in Manitoba.
All amounts in this MD&A are in millions of Canadian dollars, except where noted. Please refer to section 10.2,Non-GAAP financial measures and key performance indicators (KPIs)on pages 108 to 110 for a list of defined non-GAAP financial measures and key performance indicators.
Please refer to BCE’s audited consolidated financial statements for the year ended December 31, 2017 when reading this MD&A.
In preparing this MD&A, we have taken into account information available to us up to March 8, 2018, the date of this MD&A, unless otherwise stated.
You will find additional information relating to BCE, including BCE’s audited consolidated financial statements for the year ended December 31, 2017, BCE’s annual information form for the year ended December 31, 2017, dated March 8, 2018 (BCE 2017 AIF) and recent financial reports, on BCE’s website atBCE.ca, on SEDAR atsedar.comand on EDGAR atsec.gov.
This MD&A comments on our business operations, performance, financial position and other matters for the two years ended December 31, 2017 and 2016.
| CAUTION REGARDING FORWARD-LOOKING STATEMENTS |
BCE’s 2017 annual report, including this MD&A and, in particular, but without limitation, section 1.3,Key corporate developments, section 1.4, Capital markets strategy, section 2,Strategic imperatives, section 3.2,Business outlook and assumptions, section 5,Business segment analysisand section 6.7,Liquidityof this MD&A, contains forward-looking statements. These forward-looking statements include, without limitation, statements relating to our projected financial performance for 2018, BCE’s dividend growth objective, common share dividend payout policy and 2018 annualized common share dividend, the expected improvement of BCE’s net debt leverage ratio and return thereof within BCE’s target range, the sources of liquidity we expect to use to meet our anticipated 2018 cash requirements, our expected 2018 post-employment benefit plans funding, our network deployment and capital investment plans, BCE’s business outlook, objectives, plans and strategic priorities, and other statements that do not refer to historical facts. A statement we make is forward-looking when it uses what we know and expect today to make a statement about the future. Forward-looking statements are typically identified by the wordsassumption,goal,guidance,objective,outlook,project,strategy,targetand other similar expressions or future or conditional verbs such asaim,anticipate,believe,could,expect,intend,may,plan,seek,should,striveandwill. All such forward-looking statements are made pursuant to the safe harbour provisions of applicable Canadian securities laws and of the United States (U.S.)Private Securities Litigation Reform Act of 1995.
Unless otherwise indicated by us, forward-looking statements in BCE’s 2017 annual report, including in this MD&A, describe our expectations as at March 8, 2018 and, accordingly, are subject to change after that date. Except as may be required by Canadian securities laws, we do not undertake any obligation to update or revise any forward-looking statements, whether as a result of new information, future events or otherwise.
Forward-looking statements, by their very nature, are subject to inherent risks and uncertainties and are based on several assumptions, both general and specific, which give rise to the possibility that actual results or events could differ materially from our expectations expressed in, or implied by, such forward-looking statements and that our business outlook, objectives, plans and strategic priorities may not be achieved. As a result, we cannot guarantee that any forward-looking statement will materialize and we caution you against relying on any of these forward-looking statements. Forward-looking statements are presented in BCE’s 2017 annual report, including in this MD&A, for the purpose of assisting investors and others in understanding our objectives, strategic priorities and business outlook as well as our anticipated operating environment. Readers are cautioned, however, that such information may not be appropriate for other purposes.
We have made certain economic, market and operational assumptions in preparing the forward-looking statements contained in BCE’s 2017 annual report and, in particular, but without limitation, the forward-looking statements contained in the previously mentioned sections of this MD&A. These assumptions include, without limitation, the assumptions described in the various sections of this MD&A entitledBusiness outlook and assumptions, which sections are incorporated by reference in this cautionary statement. We believe that our assumptions were reasonable at March 8, 2018. If our assumptions turn out to be inaccurate, our actual results could be materially different from what we expect.
Important risk factors including, without limitation, competitive, regulatory, economic, financial, operational, technological and other risks that could cause actual results or events to differ materially from those expressed in, or implied by, the previously-mentioned forward-looking statements and other forward-looking statements contained in BCE’s 2017 annual report, and in particular in this MD&A, include, but are not limited to, the risks described or referred to in section 9,Business risks, which section is incorporated by reference in this cautionary statement.
We caution readers that the risks described in the previously mentioned section and in other sections of this MD&A are not the only ones that could affect us. Additional risks and uncertainties not currently known to us or that we currently deem to be immaterial may also have a material adverse effect on our financial position, financial performance, cash flows, business or reputation. Except as otherwise indicated by us, forward-looking statements do not reflect the potential impact of any special items or of any dispositions, monetizations, mergers, acquisitions, other business combinations or other transactions that may be announced or that may occur after March 8, 2018. The financial impact of these transactions and special items can be complex and depends on facts particular to each of them. We therefore cannot describe the expected impact in a meaningful way, or in the same way we present known risks affecting our business.
| 28 BCE Inc. 2017 ANNUAL REPORT |
|
| | | | |
| | 1 | MD&A | Overview |
AT A GLANCE
BCE is Canada’s largest communications company, providing residential, business and wholesale customers with a wide range of solutions for all their communications needs. BCE’s shares are publicly traded on the Toronto Stock Exchange and on the New York Stock Exchange (TSX, NYSE: BCE).
Our results are reported in three segments: Bell Wireless, Bell Wireline and Bell Media.
Bell Wireless provides wireless voice and data communications products and services to our residential, small and medium-sized business and large enterprise customers across Canada.
Bell Wireline provides data, including Internet access and Internet protocol television (IPTV), local telephone, long distance, as well as other communications services and products to our residential, small and medium-sized business and large enterprise customers, primarily in Ontario, Québec, the Atlantic provinces and Manitoba, while satellite television (TV) service and connectivity to business customers are available nationally across Canada. In addition, this segment includes our wholesale business, which buys and sells local telephone, long distance, data and other services from or to resellers and other carriers.
Bell Media provides conventional, specialty and pay TV, digital media, radio broadcasting services and out-of-home (OOH) advertising services to customers nationally across Canada.

We also hold investments in a number of other assets, including:
- a 28% indirect equity interest in Maple Leaf Sports & Entertainment Ltd. (MLSE)
- a 50% indirect equity interest in Glentel Inc. (Glentel)
- an 18.4% indirect equity interest in entities that operate the Montreal Canadiens Hockey Club and the Bell Centre in Montréal
BCE Inc. 2017 ANNUAL REPORT 29 |
|
| | | | |
1 | MD&A | Overview | |


Our goal is to be recognized by customers as Canada’s leading communications company. Our primary business objectives are to grow our subscribers profitably and to maximize revenues, operating profit, free cash flow and return on invested capital by further enhancing our position as the foremost provider in Canada of comprehensive communications services to residential, business and wholesale customers and as Canada’s premier content creation company. We seek to take advantage of opportunities to leverage our networks, infrastructure, sales channels, and brand and marketing resources across our various lines of business to create value for both our customers and other stakeholders. Our strategy is centred on our disciplined focus and execution of six strategic imperatives. The six strategic imperatives that underlie BCE’s business plan are:

| (1) | Adjusted EBITDA, adjusted net earnings and free cash flow are non-GAAP financial measures and do not have any standardized meaning under International Financial Reporting Standards (IFRS). Therefore, they are unlikely to be comparable to similar measures presented by other issuers. See section 10.2, Non-GAAP financial measures and key performance indicators (KPIs) – Adjusted EBITDA and adjusted EBITDA margin, Adjusted net earnings and adjusted EPS and Free cash flow and dividend payout ratio in this MD&A for more details, including reconciliations to the most comparable IFRS financial measure. |
| (2) | As a result of the acquisition of MTS on March 17, 2017, our wireless, high-speed Internet, TV and NAS subscriber bases increased by 476,932 (418,427 postpaid), 229,470, 108,107 (104,661 IPTV) and 419,816 (223,663 residential and 196,153 business) subscribers, respectively. Subsequently, in Q2 2017, Bell’s wireless subscriber base reflected the divestiture of 104,833 postpaid subscribers to TELUS Communications Inc. (TELUS) related to BCE’s acquisition of MTS. Bell’s wireless subscriber base in Q2 2017 also reflected the removal of 7,268 subscribers (2,450 postpaid and 4,818 prepaid) due to the decommissioning of the code division multiple access (CDMA) network in western Canada. |
| (3) | Following a review of customer accounts by a wholesale reseller, we adjusted our high-speed Internet subscriber base at the beginning of Q1 2017 to remove 3,751 non-revenue generating units. |
| 30 BCE Inc. 2017 ANNUAL REPORT |
|
| | | | |
| | 1 | MD&A | Overview |
We report the results of our operations in three segments: Bell Wireless, Bell Wireline and Bell Media. We describe our product lines by segment below, to provide further insight into our operations.
| OUR PRODUCTS AND SERVICES |
Bell Wireless
SEGMENT DESCRIPTION
- Provides integrated digital wireless voice and data communicationsproducts and services to residential and business customers acrossCanada
- Includes the results of operations of Bell Mobility Inc. (Bell Mobility)and wireless-related product sales from our wholly-owned subsidiary,national consumer electronics retailer, The Source (Bell) Electronics Inc.(The Source)
OUR NETWORKS AND REACH
We hold licensed national wireless spectrum, with holdings across various spectrum bands, totalling more than 4,600 million Megahertz (Mhz) per Population (MHz-pop), corresponding to a weighted-average of approximately 138 MHz-pop of spectrum across Canada.
The vast majority of our cell towers are connected by fibre, the latest in network infrastructure technology, for a more reliable connection.
Our Fourth Generation (4G) Long-term Evolution (LTE) and LTE Advanced (LTE-A) nationwide wireless broadband networks are compatible with global standards and deliver high-quality and reliable voice and high-speed data services to virtually all of the Canadian population.
- LTE covered 99% of the Canadian population coast to coast, whileLTE-A covered approximately 87% of the Canadian population atDecember 31, 2017
- Expansion of our LTE and LTE-A services is supported by continuedrepurposing of wireless spectrum to increase capacity and coverage
- In-building coverage improvements to deliver a stronger signal
- LTE-A provides mobile Internet data access speeds as fast as750 Megabits per second (Mbps) (expected average download speedsof 25 to 230 Mbps), while LTE offers speeds up to 150 Mbps (typicalspeeds of 12 to 40 Mbps)(1)
- Reverts to the High-speed packet access plus (HSPA+) network outsideLTE coverage areas, with speeds up to 42 Mbps (typical speeds of 7 to14 Mbps)
- International voice and roaming capabilities in more than230 destinations
We manage 6,500 wireless fidelity (Wi-Fi) access points at enterprise customer locations.
More than 2,400 retail points of distribution across Canada, including approximately 1,400 Bell-branded stores and The Source locations, Glentel-operated stores (WIRELESSWAVE, Tbooth wireless and WIRELESS etc.) as well as other third-party dealer and retail locations.
OUR PRODUCTS AND SERVICES
- Voice and data plans:available on either postpaid or prepaid options,providing fast Internet access for video, social networking, messagingand mobile applications, as well as a host of call features
- Specialized plans:for tablets, mobile Internet, smartwatches,Connected Car
- Extensive selection of devices:leading 4G LTE and LTE-A smartphonesand tablets, mobile Internet hubs and sticks, mobile Wi-Fi devices,connected things (smartwatches, Bell Connected Car, trackers, smarthome, lifestyle products, virtual reality)
- Mobile content:over 40 live and on-demand channels on smartphonesand tablets, access to over 7,000 newspapers and magazines fromaround the world with PressReader
- Travel:roaming services with other wireless service providers inmore than 230 destinations worldwide with LTE roaming in over145 destinations, Roam Better feature and Travel Passes
- Internet of Things (IoT) solutions:fleet management, assetmanagement, digital signage, wireless backup connectivity, remotemonitoring, telematics, energy management
- Mobile business solutions:workforce management, worker safety,dispatch solutions, mobile device management, two-way radio, mobilesolutions for public safety
| (1) | Network speeds vary with location, signal and customer device. Compatible device required. |
BCE Inc. 2017 ANNUAL REPORT 31 |
|
| | | | |
1 | MD&A | Overview | |
Bell Wireline
SEGMENT DESCRIPTION
- Provides data, including Internet access and IPTV, local telephone, longdistance, as well as other communications services and products toresidential, small and medium-sized business and large enterprisecustomers, primarily in Ontario, Québec, the Atlantic provinces andManitoba, while satellite TV service and connectivity to businesscustomers are available nationally across Canada. We also offercompetitive local exchange carrier (CLEC) services in Alberta andBritish Columbia.
- Includes the results of our wholesale business, which buys andsells local telephone, long distance, data and other services fromor to resellers and other carriers, and the wireline operations ofNorthwestel Inc. (Northwestel), which provides telecommunicationsservices in Canada’s Northern Territories
- Includes wireline-related product sales from The Source
OUR NETWORKS AND REACH
- Extensive local access network in Ontario, Québec, the Atlanticprovinces and Manitoba, as well as in Canada’s Northern Territories
- Largest fibre network in Canada, spanning over 240,000 kilometres (km)
- Broadband fibre network, consisting of fibre-to-the-node (FTTN) andfibre-to-the-premise (FTTP) locations, covering 9.2 million homes andbusinesses in Ontario, Québec, the Atlantic provinces and Manitoba.Our FTTP direct fibre footprint encompassed more than 3.7 millionhomes and commercial locations at the end of 2017, representingthe largest FTTP footprint in Canada.
- Largest Internet protocol (IP) multi-protocol label switching footprintof any Canadian provider, enabling us to offer business customersa virtual private network (VPN) service for IP traffic and to optimizebandwidth for real-time voice and TV
- Largest data centre footprint in Canada with 28 locations in eightprovinces, enabling us to offer data centre co-location and hostedservices to business customers across Canada
- Approximately 1,400 Bell-branded stores and The Source locationsacross Canada
OUR PRODUCTS AND SERVICES
RESIDENTIAL
- TV: Bell Fibe TV (our IPTV service) and direct-to-home (DTH) satellite TV provide extensive content options with Full high-definition (HD) and 4K Resolution (4K) Whole Home personal video recorder (PVR), 4K Ultra HD programming and on-demand content. Our IPTV service also offers consumers innovative features, including wireless receivers, the Fibe TV app, Restart and access to CraveTV, Netflix and YouTube. We also offer Fibe Alt TV, an app-based live TV streaming service offering up to 500 live and on-demand channels on laptops, smartphones, tablets and Apple TV with no traditional TV set-top box (STB) required.
- Internet: high-speed Internet access through fibre optic broadband technology or digital subscriber line (DSL) with a wide range of options, including Whole Home Wi-Fi, unlimited usage, security services and mobile Internet. Our fibre optic Internet service, marketed as Fibe Internet, offers speeds up to 100 Mbps with FTTN or 1 Gigabit per second (Gbps) with FTTP.
- Home Phone: local telephone service, long distance and advanced calling features
- Home Security: home security and monitoring services from AlarmForce Industries Inc. (AlarmForce) in Ontario and Québec, from Bell Aliant NextGen Home Security in Atlantic Canada and from AAA Security, a Bell MTS company, in Manitoba
- Bundles: multi-product bundles of TV, Internet and home phone services with monthly discounts
BUSINESS
- IP-based services:business Internet, IP VPN, point-to-point datanetworks and global network solutions
- Business service solutions:hosting and cloud services, managedservices, professional services and infrastructure services that supportand complement our data connectivity services
- Voice and unified communications:IP telephony, local and longdistance, web and audio conferencing and e-mail solutions
| 32 BCE Inc. 2017 ANNUAL REPORT |
|
| | | | |
| | 1 | MD&A | Overview |
Bell Media
SEGMENT DESCRIPTION
- Canada’s leading content creation company with premier assets inTV, radio, OOH advertising and digital media
- Revenues are derived primarily from advertising and subscriber fees
- Conventional TV revenue is derived from advertising
- Specialty TV revenue is generated from subscription fees andadvertising
- Pay TV revenue is received from subscription fees
- Radio revenue is generated from advertising aired over our stations
- OOH revenues are generated from advertising
- Digital media revenues are generated from advertising
OUR ASSETS AND REACH
TV
- 30 conventional TV stations, including CTV, Canada’s highest-ratedTV network based on viewership
- 30 specialty TV channels, including TSN, Space, Discovery and RDS,Canada’s leading French-language specialty channel among viewersaged 25 to 54
- Four national pay TV services, including The Movie Network (TMN)and Super Écran
RADIO
- 105 licensed radio stations in 54 markets across Canada
OOH ADVERTISING
- Network of more than 31,000 advertising faces in British Columbia,Alberta, Manitoba, Ontario, Québec and Nova Scotia
DIGITAL MEDIA
- More than 200 websites and over 30 apps
BROADCAST RIGHTS
- Sports:Bell Media has secured long-term media rights to many ofthe key sports properties that are popular among Canadians, and isthe official Canadian broadcaster of the Super Bowl, Grey Cup andInternational Ice Hockey Federation (IIHF) World Junior Championship.Bell Media’s slate of live sports coverage also includes the TorontoMaple Leafs, Montreal Canadiens, Winnipeg Jets and Ottawa Senators,Canadian Football League (CFL), National Football League (NFL), NationalBasketball League (NBA), Major League Soccer (MLS), FédérationInternationale de Football Association (FIFA) World Cup events throughto 2026, Season of Champions Curling, Major League Baseball (MLB),Premier League, Union of European Football Associations (UEFA)Champions League, UEFA Europa League, golf’s major championships,Monster Energy NASCAR Cup Series, Formula 1, Formula E, Grand SlamTennis, Ultimate Fighting Championship (UFC), National CollegiateAthletic Association (NCAA) March Madness and more.
- HBO:long-term agreement to deliver all current-season, past-seasonand library HBO programming in Canada exclusively on our linear,on-demand and over-the-top (OTT) platforms
- SHOWTIME:long-term content licensing and trademark agreementfor past, present and future SHOWTIME-owned programming
- Starz:long-term agreement with Lionsgate to bring U.S. premium payTV service Starz to Canada
- iHeartRadio:exclusive partnership for digital and streaming musicservices in Canada
OTHER ASSETS
- 50% interest in Dome Productions Partnership, one of North America’sleading providers of sports and other event production and broadcastfacilities
OUR PRODUCTS AND SERVICES
- Varied and extensive array of TV programming to broadcastdistributors across Canada
- Advertisingon our TV, radio, OOH, and digital media properties to bothlocal and national advertisers across a wide range of industry sectors
- CraveTV subscription on-demand TV streaming serviceoffering alarge collection of premium content in one place, including HBO andSHOWTIME programming, on STBs, mobile devices and online. CraveTVis offered through a number of Canadian TV providers and is availabledirectly to all Canadian Internet subscribers as an OTT service.
- TV Everywhere services, including CTV GO, Discovery GO, TMN GO,TSN GO and RDS GO, which provide live and on-demand contentdelivered over mobile and Wi-Fi networks to smartphones, tabletsand computers
- Mobile TV servicewith live and on-demand access to content fromour conventional TV networks, CTV and CTV Two, BNN, TSN, RDS,Comedy and other brands in news, sports and entertainment. Thismobile content is offered on commercial terms to all Canadianwireless providers.
BCE Inc. 2017 ANNUAL REPORT 33 |
|
| | | | |
1 | MD&A | Overview | |
Other BCE investments
BCE also holds investments in a number of other assets, including:
- a 28% indirect equity interest in MLSE, a sports and entertainmentcompany that owns several sports teams as well as real estate andentertainment assets in Toronto
- a 50% indirect equity interest in Glentel, a Canadian-based dual-carrier,multi-brand mobile products distributor
- an 18.4% indirect equity interest in entities that operate the MontrealCanadiens Hockey Club and the Bell Centre in Montréal
EMPLOYEES
At the end of 2017, our team included 51,679 employees dedicated to driving shareholder return and improving customer service.
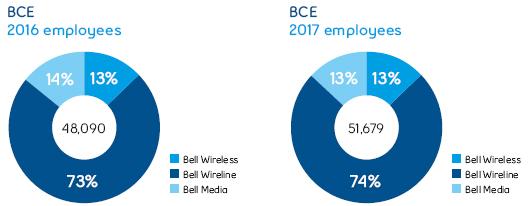
The total number of BCE employees at the end of 2017 increased by 3,589 employees compared to the end of 2016, due primarily to the integration of MTS employees.
Approximately 45% of total BCE employees are represented by labour unions.
BELL CODE OF BUSINESS CONDUCT
The ethical business conduct of our people is core to the integrity with which we operate our business. The Bell Code of Business Conduct sets out specific expectations and accountabilities, providing employees with practical guidelines to conduct business in an ethical manner. Our commitment to the Code of Business Conduct is renewed by employees each year in an ongoing effort to ensure that all employees are aware of, and adhere to, Bell’s standards of conduct.
| 1.3 Key corporate developments |
MTS ACQUISITION COMPLETED
On March 17, 2017, BCE completed the acquisition of MTS originally announced on May 2, 2016, purchasing all of the issued and outstanding common shares of MTS for a total consideration of $2,933 million and assumed outstanding net debt of $972 million. BCE acquired all of the issued and outstanding common shares of MTS for $40 per share, which was paid 55% through the issuance of BCE common shares and 45% in cash. The cash component of $1,339 million was funded through debt financing and BCE issued approximately 27.6 million common shares for the equity portion of the transaction. The combined companies’ Manitoba operations are now known as Bell MTS. On April 1, 2017, BCE completed the divestiture of approximately one-quarter of postpaid wireless subscribers and 15 retail locations previously held by MTS, as well as certain Manitoba network assets, to TELUS for total proceeds of $323 million.
| 34 BCE Inc. 2017 ANNUAL REPORT |
|
| | | | |
| | 1 | MD&A | Overview |
| ACQUISITION OF ALARMFORCE |
BCE completed its $182 million acquisition of AlarmForce, one of Canada’s largest home and business security companies, on January 5, 2018. Combining Bell’s residential services brand, broadband network connectivity, distribution, installation and customer service capabilities with AlarmForce’s innovative technology and customer base accelerates our competitiveness in the fast-growing Connected Home marketplace.
Bell also offers monitoring and other Connected Home services with Bell Aliant NextGen Home Security in Atlantic Canada and AAA Security, a Bell MTS company, in Manitoba. Also on January 5, 2018, BCE sold AlarmForce’s approximate 39,000 customer accounts in British Columbia, Alberta and Saskatchewan to TELUS for total proceeds of approximately $67 million, subject to customary closing adjustments.
| RECOGNITION OF BELL’S ENVIRONMENTAL LEADERSHIP |
As part of Canada’s Top 100 Employers program, Bell was named one of Canada’s Greenest Employers for 2017. The award recognizes Bell’s ongoing commitment to minimize the environmental impact of our operations and our success in reducing waste and saving energy across our network infrastructure, information technology (IT) systems, buildings and vehicle fleet. Key factors that contributed to Bell’s win include:
- Our ISO 14001 certified environmental management system. Bellwas the first Canadian communications company to achieve thisinternational standard.
- The Bell Blue Box mobile recycling program, which has recoveredmore than 1.4 million phones since 2010 and donates proceeds tothe Canadian Mental Health Association
- 46 Bell buildings have received BOMA BEST certifications forenvironmental performance, including our Montréal campus, whichis the largest Leadership in Energy and Environmental Design (LEED)certified building in Québec
- Telematics systems in 85% of Bell vehicles provide vital engineinformation that supports more fuel efficient driving practices
| NOMINATION TO BCE’S BOARD OF DIRECTORS |
On March 8, 2017, BCE announced the nomination of Karen Sheriff for election to the BCE board of directors (BCE Board or Board) and the retirement of Ronald Brenneman from the BCE Board at BCE’s annual general shareholder meeting, held on April 26, 2017. One of Canada’s most successful telecommunications executives, Ms. Sheriff was most recently President and Chief Executive Officer (CEO) of Q9 Networks Inc. (Q9), from January 2015 to October 2016. Prior to her role at Q9, she was President and CEO of Bell Aliant from 2008 to 2014, following more than nine years in senior leadership positions at BCE.
| 1.4 Capital markets strategy |
We seek to deliver sustainable shareholder returns through consistent dividend growth. This objective is underpinned by continued growth in free cash flow and a strong balance sheet, supporting a healthy level of ongoing capital investment on advanced broadband network and services that are essential to driving the long-term growth of our business.
| DIVIDEND GROWTH AND PAYOUT POLICY |

On February 8, 2018, we announced a 5.2%, or 15 cents, increase in the annualized dividend payable on BCE’s common shares for 2018 to $3.02 per share from $2.87 per share in 2017, starting with the quarterly dividend payable on April 15, 2018. This represents BCE’s 14th increase to its annual common share dividend, representing a 107% increase, since the fourth quarter of 2008. This is BCE’s 10th consecutive year of 5% or better dividend growth, while maintaining the dividend payout ratio(1) within the target policy range of 65% to 75% of free cash flow.
Our objective is to seek to achieve dividend growth while maintaining our dividend payout ratio within the target range and balancing our strategic business priorities. BCE’s dividend payout policy and the declaration of dividends are subject to the discretion of the BCE Board and, consequently, there can be no guarantee that BCE’s dividend policy will be maintained or that dividends will be increased or declared.
| (1) | Dividend payout ratio is a non-GAAP financial measure and does not have any standardized meaning under IFRS. Therefore, it is unlikely to be comparable to similar measures presented by other issuers. See section 10.2, Non-GAAP financial measures and key performance indicators (KPIs) – Free cash flow and dividend payout ratio for more details. |
BCE Inc. 2017 ANNUAL REPORT 35 |
|
| | | | |
1 | MD&A | Overview | |
We have a strong alignment of interest between shareholders and our management’s equity-based long-term incentive compensation plan. The vesting of performance share units depends on the realization of our dividend growth policy, while stock options reflect our objective to increase the share price for our shareholders.
 | Stringent share ownership requirements Emphasis on pay-at-risk for executive compensation Double trigger change-in-control policy Anti-hedging policy on share ownership and incentive compensation Clawbacks for the President and CEO and all Executive Vice-Presidents as well as all options holders Caps on all supplemental executive retirement plans (SERPs) and annual bonus payouts, in addition to mid-term and long-term incentive grants Vesting criteria fully aligned to shareholder interests
|
Our dividend payout policy allows BCE to retain a high level of excess cash. Consistent with our capital markets objective to deliver sustainable shareholder returns through dividend growth while maintaining appropriate levels of capital investment, investment-grade credit ratings and considerable overall financial flexibility, we deploy excess cash in a balanced manner.
Uses of excess cash include, but are not limited to:
- Financing of strategic acquisitions and investments (including wirelessspectrum purchases) that support the growth of our business
- Debt reduction
- Voluntary contributions to BCE’s defined benefit (DB) pension plans toimprove the funded position of the plans and help minimize volatilityof future funding requirements
- Share buybacks through normal course issuer bid (NCIB) programs
In 2017, BCE’s excess cash of $906 million, down from $921 million in 2016, was directed towards a $100 million voluntary contribution to fund certain of BCE’s DB pension plans and various acquisitions that support our strategic imperatives, including MTS.
On February 8, 2018, we announced a NCIB program totaling $175 million, under which BCE may purchase for cancellation up to 3,500,000 common shares (subject to a maximum aggregate purchase price of $175 million) over the twelve-month period starting February 13, 2018 and ending no later than February 12, 2019. The repurchase of common shares represents an appropriate use of funds for offsetting share dilution resulting from the exercise of stock options, and will be funded from cash on hand.
| TOTAL SHAREHOLDER RETURN PERFORMANCE |

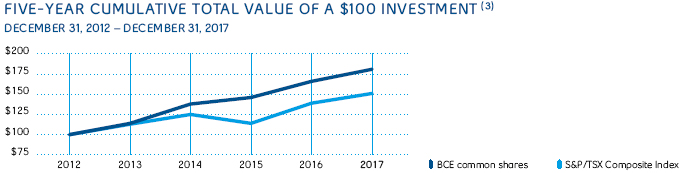
This graph compares the yearly change in the cumulative annual total shareholder return of BCE common shares against the cumulative annual total return of the S&P/TSX Composite Index(4), for the five-year period ending December 31, 2017, assuming an initial investment of $100 on December 31, 2012 and the quarterly reinvestment of all dividends.
| (1) | Free cash flow less dividends paid on common shares. |
| (2) | The change in BCE’s common share price for a specified period plus BCE common share dividends reinvested, divided by BCE’s common share price at the beginning of the period. |
| (3) | Based on BCE’s common share price on the TSX and assumes the reinvestment of dividends. |
| (4) | As the headline index for the Canadian equity market, the S&P/TSX Composite Index is the primary gauge against which to measure total shareholder return for Canadian-based, TSX-listed companies. |
| 36 BCE Inc. 2017 ANNUAL REPORT |
|
| | | | |
| | 1 | MD&A | Overview |
BCE’s balance sheet is underpinned by considerable liquidity and an investment-grade credit profile, providing the company with a solid financial foundation and a high level of overall financial flexibility. BCE is well-positioned with an attractive long-term debt maturity profile and minimal near-term requirements to repay publicly issued debt securities. We continue to monitor the capital markets for opportunities where we can further reduce our cost of debt and our cost of capital. We seek to proactively manage financial risk in terms of currency exposure of our U.S. dollar-denominated purchases, as well as equity risk exposure under BCE’s long-term equity-based incentive plans and interest rate and foreign currency exposure under our various debt instruments. We also seek to maintain investment-grade credit ratings with stable outlooks.
We monitor capital by utilizing a number of measures, including net debt(1) to adjusted EBITDA, adjusted EBITDA to net interest expense(1), and dividend payout ratio.
| | | |
ATTRACTIVE LONG-TERM DEBT MATURITY PROFILE - Average term of Bell Canada’s publiclyissued debt securities: 9.1 years
- Average after-tax cost of publicly issueddebt securities: 3.2%
- $600 million of publicly issued debtsecurities maturing in 2018
| STRONG LIQUIDITY POSITION - $0.4 billion available under our $3.5 billionmulti-year committed credit facilities
- $500 million accounts receivablesecuritization available capacity
- $625 million cash and cash equivalentson hand at the end of 2017
| FAVOURABLE CREDIT PROFILE - Long-term debt credit rating of BBB (high)by DBRS Limited (DBRS), Baa 1 by Moody’sInvestors Services Inc. (Moody’s) and BBB+by Standard & Poor’s Ratings Services(Canada) (S&P), all with stable outlooks
|
As a result of financing a number of strategic acquisitions made since 2010, including CTV Inc., Astral Media Inc., MLSE, Bell Aliant Inc. (Bell Aliant), Q9 and MTS; voluntary pension plan funding contributions to reduce our pension solvency deficit; wireless spectrum purchases; as well as the incremental debt that was assumed as a result of the privatization of Bell Aliant and the acquisition of MTS, our net debt leverage ratio(1) has increased above the limit of our internal target range of 1.75 to 2.25 times adjusted EBITDA. That ratio is expected to improve over time and return within the net debt leverage ratio target range through growth in free cash flow and applying a portion of excess cash to the reduction of BCE’s indebtedness.
BCE’s adjusted EBITDA to net interest expense ratio remains significantly above our internal target range of greater than 7.5 times adjusted EBITDA, providing good predictability in our debt service costs and protection from interest rate volatility for the foreseeable future.
| BCE CREDIT RATIOS | INTERNAL TARGET | | DECEMBER 31, 2017 | |
Net debt leverage ratio | 1.75–2.25 | | 2.70 | |
Adjusted EBITDA to net interest expense ratio | > 7.5 | | 9.12 | |
Bell Canada successfully accessed the capital markets in February 2017 and September 2017, raising a combined total of $3.0 billion in gross proceeds from the issuance of five-year, seven-year, 10-year and 30-year medium-term note (MTN) debentures. These issuances lowered our after-tax cost of outstanding publicly issued debt securities to 3.2% (4.3% on a pre-tax basis) and maintained an average term to maturity of more than nine years. The net proceeds of the 2017 offerings were used to partially fund the acquisition of MTS, repay short-term debt, fund the early redemption of $1.3 billion of Bell Canada debentures maturing in 2018, and for general corporate purposes.
| (1) | Net debt, net debt leverage ratio and adjusted EBITDA to net interest expense ratio are non-GAAP financial measures and do not have any standardized meaning under IFRS. Therefore, they are unlikely to be comparable to similar measures presented by other issuers. See section 10.2, Non-GAAP financial measures and key performance indicators (KPIs) – Net debt, Net debt leverage ratio and Adjusted EBITDA to net interest expense ratio in this MD&A for more details. |
| 1.5 Corporate governance and risk management |
CORPORATE GOVERNANCE PHILOSOPHY
The BCE Board and management believe that strong corporate governance practices contribute to superior results in creating and maintaining shareholder value. That is why we continually seek to strengthen our leadership in corporate governance and ethical business conduct by adopting best practices, and providing full transparency and accountability to our shareholders.
Key governance strengths and actions in support of our governance philosophy include:
- Separation of the Board Chair and CEO roles
- Director independence standards
- Audit Committee, Management Resources and CompensationCommittee (Compensation Committee) and Corporate GovernanceCommittee (Governance Committee) of the Board composed ofindependent directors
- Annual director effectiveness and performance assessments
- Ongoing reporting to Board committees regarding ethics programsand the oversight of corporate policies across BCE
- Share ownership guidelines for directors and executives
- Executive compensation programs tied to BCE’s ability to grow itscommon share dividend
For more information, please refer to BCE’s most recent notice of annual general shareholder meeting and management proxy circular (the Proxy Circular) filed with the Canadian provincial securities regulatory authorities (available atsedar.com) and with the U.S. Securities and Exchange Commission (available atsec.gov), and available on BCE’s website atBCE.ca.
BCE Inc. 2017 ANNUAL REPORT 37 |
|
| | | | |
1 | MD&A | Overview | |
| RISK GOVERNANCE FRAMEWORK |
BOARD OVERSIGHT
BCE’s full Board is entrusted with the responsibility for identifying and overseeing the principal risks to which our business is exposed and seeking to ensure there are processes in place to effectively identify, monitor and manage them. These processes seek to mitigate rather than eliminate risk. A risk is the possibility that an event might happen in the future that could have a negative effect on our financial position, financial performance, cash flows, business or reputation. While the Board has overall responsibility for risk, the responsibility for certain elements of the risk oversight program is delegated to Board committees in order to ensure that they are treated with appropriate expertise, attention and diligence. The committees report to the Board in the ordinary course of business.
Risk information is reviewed by the Board or the relevant committee throughout the year, and business leaders present regular updates on the execution of business strategies, risks and mitigation activities.

- The Audit Committee is responsible for overseeing financial reportingand disclosure as well as overseeing that appropriate risk managementprocesses are in place across the organization. As part of its riskmanagement activities, the Audit Committee reviews the organization’srisk reports and ensures that responsibility for each principal riskis formally assigned to a specific committee or the full Board, asappropriate. The Audit Committee also regularly considers risks relatingto financial reporting, legal proceedings, the performance of criticalinfrastructure, information, cyber and physical security, journalisticindependence, privacy and records management, business continuityand the environment.
- The Compensation Committee oversees risks relating to compensation,succession planning, and health and safety practices
- The Governance Committee assists the Board in developing andimplementing BCE’s corporate governance guidelines and determiningthe composition of the Board and its committees. The GovernanceCommittee also oversees matters such as the organization’s policiesconcerning business conduct, ethics and public disclosure of materialinformation.
- The Pension Fund Committee (Pension Committee) has oversightresponsibility for risks associated with the pension fund.
RISK MANAGEMENT CULTURE
There is a strong culture of risk management at BCE that is actively promoted by the Board and the company’s President and CEO at all levels within the organization. It has become a part of how the company operates on a day-to-day basis and is woven into its structure and operating principles, guiding the implementation of the organization’s strategic imperatives.
The President and CEO, selected by the Board, has set his strategic focus through the establishment of six strategic imperatives and focuses risk management around the factors that could impact the achievement of those strategic imperatives. While the constant state of change in the economic environment and the industry creates challenges that need to be managed, the clarity around strategic objectives, performance expectations, risk management and integrity in execution ensures discipline and balance in all aspects of our business.
RISK MANAGEMENT FRAMEWORK
While the Board is responsible for BCE’s risk oversight program, operational business units are central to the proactive identification and management of risk. They are supported by a range of corporate support functions that provide independent expertise to reinforce implementation of risk management approaches in collaboration with the operational business units. The Internal Audit function provides a further element of expertise and assurance, working to provide insight and support to the operational business units and corporate support functions, while also providing the Audit Committee with an independent perspective on the state of risk and control within the organization. Collectively, these elements can be thought of as a “three lines of defence” approach to risk management. Although the risk management framework described in this section 1.5 is aligned with industry best practices and is endorsed by the Institute of Internal Auditors, there can be no assurance that it will be sufficient to prevent the occurrence of events that could have a material adverse effect on our financial position, financial performance, cash flows, business or reputation.

| 38 BCE Inc. 2017 ANNUAL REPORT |
|
| | | | |
| | 1 | MD&A | Overview |
FIRST LINE OF DEFENCE – OPERATIONAL BUSINESS UNITS
The first line refers to management within our operational business segments (Bell Wireless, Bell Wireline and Bell Media), who are expected to understand their operations in great detail and the financial results that underpin them. There are regular reviews of operating performance involving the organization’s executive and senior management. The discipline and precision associated with this process, coupled with the alignment and focus around performance goals, create a high degree of accountability and transparency in support of our risk management practices.
As risks emerge in the business environment, they are discussed in a number of regular forums to share details and explore their relevance across the organization. Executive and senior management are integral to these activities in driving the identification, assessment, mitigation and reporting of risks at all levels. Formal risk reporting occurs through strategic planning sessions, management presentations to the Board and formal enterprise risk reporting, which is shared with the Board and the Audit Committee during the year.
Management is also responsible for maintaining effective internal controls and for executing risk and control procedures on a day-to-day basis. Each operational business unit develops its own operating controls and procedures that fit the needs of its unique environment.
SECOND LINE OF DEFENCE – CORPORATE SUPPORT FUNCTIONS
BCE is a very large enterprise with 51,679 employees, as at December 31, 2017, multiple business units and a diverse portfolio of risks that is constantly evolving based on internal and external factors. In a large organization, it is common to manage certain functions centrally for efficiency, scale and consistency. While the first line of defence is often central to identification and management of business risks, in many instances operational management works collaboratively with, and also relies on, the corporate functions that make up the second line of defence for support in these areas. These corporate functions include Finance, Corporate Security and Corporate Risk Management, as well as Legal and Regulatory, Corporate Responsibility, Human Resources, Real Estate and Procurement.
Finance function:BCE’s Finance function plays a pivotal role in seeking to identify, assess and manage risks through a number of activities, which include financial performance management, external reporting, pension management, capital management, and oversight and execution practices related to the U.S.Sarbanes-Oxley Act of 2002and equivalent Canadian securities legislation, including the establishment and maintenance of appropriate internal control over financial reporting. BCE has established and maintains disclosure controls and procedures to seek to ensure that the information it publicly discloses, including its business risks, is accurately recorded, processed, summarized and reported on a timely basis. For more details concerning BCE’s internal control over financial reporting and disclosure controls and procedures, refer to the Proxy Circular and section 10.3,Effectiveness of internal controlsof this MD&A.
Corporate Security function:This function is responsible for all aspects of security, which requires a deep understanding of the business, the risk environment and the external stakeholder environment. Based on this understanding, Corporate Security sets the standards of performance required across the organization through security policy definitions and monitors the organization’s performance against these policies. In high and emerging risk areas such as cybersecurity, Corporate Security leverages its experience and competence and, through collaboration with the operational business units, develops strategies intended to seek to mitigate the organization’s risks. For instance, we have implemented security awareness training and policies and procedures that seek to mitigate cybersecurity threats. We further rely on security assessments to identify risks, projects and implementation controls with the objective of ensuring that systems are deployed with the appropriate level of control based on risk and technical capabilities, including access management, vulnerability management, security monitoring and testing, to help identify and respond to attempts to gain unauthorized access to our information systems and networks. However, there is no assurance that our implemented safeguards will prevent the occurrence of material cybersecurity breaches, intrusions or attacks, or that any insurance we may have will cover the costs, damages, liabilities or losses that could result therefrom.
Corporate Risk Management function:This function works across the company to gather information and report on the organization’s assessment of its principal risks and the related exposures. Annually, senior management participate in a risk survey that provides an important reference point in the overall risk assessment process.
In addition to the activities described above, the second line of defence is also critical in building and operating the oversight mechanisms that bring focus to relevant areas of risk and reinforce the bridges between the first and second lines of defence, thereby seeking to ensure that there is a clear understanding of emerging risks, their relevance to the organization and the proposed mitigation plans. To further coordinate efforts between the first and second lines of defence, BCE has established a Health and Safety, Security, Environment and Compliance Oversight Committee. A significant number of BCE’s most senior leaders are members of this committee, the purpose of which is to oversee BCE’s strategic security (including cybersecurity), compliance and, environmental, health and safety risks and opportunities. This cross-functional committee seeks to ensure that relevant risks are adequately recognized and mitigation activities are well integrated and aligned across the organization and are supported with sufficient resources.
THIRD LINE OF DEFENCE – INTERNAL AUDIT FUNCTION
Internal Audit is a part of the overall management information and control system and has the responsibility to act as an independent appraisal function. Its purpose is to provide the Audit Committee and management with objective evaluations of the company’s risk and control environment, to support management in fulfilling BCE’s strategic imperatives and to maintain an audit presence throughout BCE and its subsidiaries.
BCE Inc. 2017 ANNUAL REPORT 39 |
|
| | | | |
2 | MD&A | Strategic imperatives | |
Our success is built on the BCE team’s dedicated execution of the six strategic imperatives that support our goal to be recognized by customers as Canada’s leading communications company.
| 2.1 Invest in broadband networks and services |

We invest in wireline and wireless broadband platforms to deliver the most advanced wireless, TV, Internet and other IP-based services available, to support continued subscriber and data growth across all our residential product lines as well as the needs of our business market customers.
2017 PROGRESS
- Expanded our 4G LTE wireless network to reach 99% of the Canadianpopulation coast to coast with download speeds ranging from 75 Mbpsto 150 Mbps (expected average download speeds of 12 to 40 Mbps)
- Continued the rollout of our LTE-A wireless network, providing serviceto approximately 87% of the Canadian population at data speeds up to260 Mbps (expected average download speeds of 18 to 74 Mbps). Inaddition, our Tri-band LTE-A footprint covered 34% of the populationwith download speeds of up to 335 Mbps (expected average downloadspeeds of 25 to 100 Mbps).
- Launched North America’s first Quad-band LTE-A network deploymentcapable of delivering theoretical speeds of up to 750 Mbps (expectedaverage download speeds of 25 to 230 Mbps in select areas). Bell’sQuad Band service expanded to 23% of Canadians, encompassing91 cities.
- Continued to expand our FTTP direct fibre footprint, reaching morethan 3.7 million homes and businesses in seven provinces, includingapproximately 60% of homes and businesses in the city of Toronto.Forty percent of our long-term broadband fibre program wascompleted at the end of 2017. FTTP enables symmetrical Internetdownload and upload speeds of up to 1 Gbps and will enable thedelivery of even faster speeds in the future.
- Began the build-out of broadband fibre directly to 1.1 million residencesand business locations throughout Montréal, representing thelargest-ever communications infrastructure project in Québec witha planned capital investment of $854 million. Montréal joins a growingnumber of centres across Québec that are fully wired with Bell fibre,including Québec City where fibre deployment was launched in 2012.By the end of 2017, Bell fibre reached approximately 40% of homesand businesses throughout the province of Québec, including 14% ofall locations in Montréal.
2018 FOCUS
- Expand FTTP broadband fibre footprint to approximately 4.5 milliontotal combined homes and commercial locations
- In February 2018, we announced the expansion of FTTP direct fibreconnections throughout the Greater Toronto and 905 geographicregion. Bell’s fibre plan will deliver Gigabit Internet speeds and otherbroadband Fibe service innovations to more than 1.3 million homesand businesses in the region.
- Expand LTE-A network footprint to approximately 92% of the Canadianpopulation
- Deploy Quad-band LTE-A to approximately 60% of the Canadianpopulation enabling theoretical speeds up to 750 Mbps (averageexpected speeds of 25 to 230 Mbps)
- Increase LTE-A peak theoretical speeds to 950 Mbps with 4×4 MIMO(Multiple Input Multiple Output) technology in select urban areascovering approximately 40% of the Canadian population
- Increase small cell deployment and in-building coverage to increaseurban densification and support evolution to our Fifth Generation(5G) services
- Launch an LTE-category M1 (LTE-M) wireless network to support therapidly increasing use of IoT devices on low-power, wide-area networks(LPWANs) in Canada. LTE-M improves the operating efficiency of IoTdevices by enabling very low power consumption and better coveragein underground and other hard to reach locations.

Our objective is to grow our Bell Wireless business profitably by focusing on postpaid subscriber acquisition and retention, maximizing average revenue per user (ARPU) by targeting premium smartphone subscribers in all geographic markets we operate in, leveraging our wireless networks, and maintaining device and mobile content leadership to drive greater wireless data penetration and usage.
2017 PROGRESS
- Acquired 36% of total new postpaid gross and net activations amongthe three national wireless carriers, while achieving leading servicerevenue, ARPU and adjusted EBITDA growth of 10.7%, 3.5% and 9.1%,respectively
- Increased the number of postpaid subscribers on our LTE network to88% of our total postpaid subscribers, up from 81% at the end of 2016
- Expanded our smartphone and tablet lineup with 40 new devices,including Apple’s iPhone X, 8 and 8 Plus and Apple Watch Series 3 withbuilt-in cellular, the Samsung Galaxy S8 and S8+, the Samsung GalaxyNote8, Google’s Pixel 2 and Pixel 2 XL and the LG G6, adding to ourextensive selection of 4G LTE and LTE-A devices
| 40 BCE Inc. 2017 ANNUAL REPORT |
|
| | | | |
| | 2 | MD&A | Strategic imperatives |
- Launched Lucky Mobile, an easy and low-cost prepaid wirelessservice for budget-conscious Canadians with monthly plans startingat just $20 for unlimited local calling. Initially available to consumersin Ontario, Alberta and British Columbia, Lucky Mobile offers servicein 17 zones covering most major cities across the country, includingdata access at 3G-equivalent access speeds.
- Became the Government of Canada’s primary wireless supplier for thenext six years, with options to renew. Bell will supply voice, text, anddata services and approximately 230,000 mobile devices to federalemployees in more than 100 departments and agencies.
- First Canadian wireless provider to support the LTE network capabilitiesof the Apple Watch Series 3. In addition to providing Voice over LTE(VoLTE) technology, Bell launched NumberShare, a service that enablescustomers to pair their Apple Watch Series 3 with their iPhone usingthe same phone number.
- Launched the first integrated Advanced Messaging service on Samsungdevices, offering a suite of mobile messaging features previouslyavailable through specialized third-party applications
- Took a leadership position in the fast-growing IoT sector, which enablesthe interconnection of a range of devices and applications that sendand receive data
- Bell MTS launched the Innovations in Agriculture program at theUniversity of Manitoba, providing students with opportunities todevelop innovative IoT technologies for application in agricultureand food science
- Concluded an agreement with Hyundai AutoEver Telematics America(HATA), a subsidiary of Hyundai Motor Group, to deliver a range ofconnected telematics services including security, safety, diagnosticsand infotainment to select Hyundai and Kia vehicles over Bell’snational mobile network
- Partnered with BeWhere Technologies and Huawei to implement anautomated IoT solution for the Henry of Pelham Family Estate Wineryto help improve planning and sustainability programs
- First Canadian carrier to offer global connectivity for our leading-edgeIoT platforms and applications. Bell’s Global IoT connectivity solutionsoffer our customers uninterrupted worldwide network access andthe ability to manage all of their international devices remotely froma single web-based platform by embedding Bell’s Global subscriberidentification module (SIM) cards into their products.
2018 FOCUS
- Profitably grow our wireless postpaid subscriber base, whilemaintaining market share momentum of incumbent postpaid subscriberactivations
- Continue to increase ARPU
- Offer the latest handsets and devices in a timely manner to enablecustomers to benefit from ongoing technological improvements bymanufacturers and from faster data speeds to optimize the use ofour services
- Continue to increase the number of postpaid smartphone subscribersusing our 4G LTE and LTE-A networks
- Leverage Lucky Mobile to grow prepaid subscriber market share,while providing Canadians with affordable wireless service options
- Expand VoLTE technology coverage areas and broaden rollout tomore supported devices
- Accelerate new revenue streams by continuing to drive thecommercialization of IoT services and applications
- In February 2018, we partnered with the city of Kingston to employBell’s Smart City platform to provide a series of connected IoTapplications which will enable Kingston to digitize its operations andcollect data to make better informed decisions and investments incity operations and infrastructure, benefiting constituents, internaldepartments and employees while improving citizen engagement
| 2.3 Leverage wireline momentum |

We focus on leveraging our fibre-based TV and Internet services to develop attractive residential offers that drive higher multi-product bundle sales and improve customer satisfaction and retention. These broadband services contribute to the ongoing shift of our operating mix away from legacy wireline voice services.
In our business markets, we remain focused on expanding our broadband network and strengthening our delivery of integrated solutions to Canadian businesses, while continuing to manage the transformation of our business from legacy network services to a fully-integrated data hosting, cloud computing and managed services provider.
2017 PROGRESS
- Maintained our position as Canada’s largest TV provider with2,832,300 subscribers, and increased our total number of IPTVsubscribers by 15.9% to 1,550,317
- Built on our position as the leading Internet service provider (ISP) inCanada with a high-speed Internet subscriber base of 3,790,141, up9.0% over 2016, including one million FTTP customers
- Launched Fibe Alt TV, Canada’s first widely available app-basedlive TV service, providing a completely new way to watch live andon-demand television. With no traditional TV STB required, Alt TVis accessed through the Fibe TV app and offers up to 500 live andon-demand channels on laptops, smartphones, tablets and Apple TV4th Generation.
- Continued to lead television innovation in Canada with ongoingenhancements to our IPTV service
- Fibe TV customers in Ontario and Québec can watch their PVRrecordings on the go on their tablets, smartphones and laptopswith the Fibe TV app
- Customers with 4K Whole Home PVR can access YouTube, in additionto CraveTV and Netflix
- Acquired AlarmForce (transaction completed on January 5, 2018), aCanadian leader in home security and monitoring services, as partof Bell’s strategic expansion in the fast-growing Connected Homemarketplace. Combining the assets and experience of AlarmForcewith Bell’s strength in networks, customer service and distribution willenable Bell to deliver the latest Connected Home services to customersin Ontario, Québec, Atlantic Canada and Manitoba.
- Partnered with Akamai Technologies Inc. (Akamai), a global leaderin content delivery and cloud services, to expand our portfolioof integrated web security solutions for business customers.Complementing Bell solutions to help businesses increase productivity,minimize risk, and maximize service differentiation, Akamai’s leadingcloud security, web performance, and media delivery productsstrengthen our ability to identify security threats, proactively preventattacks, and support customers in optimizing their online presence.
BCE Inc. 2017 ANNUAL REPORT 41 |
|
| | | | |
2 | MD&A | Strategic imperatives | |
- Recognized by International Data Corporation (IDC) Canada as a leaderin delivering security services for business customers. Bell was theonly telecom company in IDC’s Leaders Category, which included largemultinationals such as CGI Group Inc. (CGI), International BusinessMachines Corporation (IBM) and Deloitte Touche Tohmatsu Limited(Deloitte). Evaluators noted that Bell’s extensive network enables usto quickly leverage cyber threat intelligence to provide a completerange of advanced threat detection, mitigation and prevention services.
2018 FOCUS
- Continue to enhance our Fibe TV and Alt TV services with moreadvanced features
- In January 2018, we concluded a multi-year agreement with Ericssonto leverage its next generation, cloud-based MediaFirst TV platformto deliver an even more personalized and seamless multiscreen TVexperience for Fibe TV and Alt TV customers
- Maintain our leadership position in Canadian broadbandcommunications with the most advanced products in the home
- In January 2018, we launched Whole Home Wi-Fi, Canada’s first Wi-Fiservice that brings smart and fast Wi-Fi to every room in the homewhile adapting to changing user requirements. Bell partnered withPlume Design Inc. (Plume) to deliver new access points, called pods,that work with the cloud-based networking intelligence of Bell’sHome Hub 3000 modem to deliver a fully adaptive Wi-Fi service.
- Expand our total base and market share of TV and Internet subscribersprofitably
- Reduce total wireline residential net losses
- Increase residential household ARPU through greater multi-producthousehold penetration
- Increase share of wallet of large enterprise customers through greaterfocus on business service solutions and connectivity growth
- Increase the number of net new customer relationships in both largeand mid-sized businesses and reduce small business customer losses
| 2.4 Expand media leadership |

We strive to deliver leading sports, news, entertainment and business content across all screens and platforms to grow audiences. We are also creating more of our own content, ensuring that Canadian attitudes, opinions, values and artistic creativity are reflected in our programming and in our coverage of events in Canada and around the world, and to introduce new services in support of new revenue streams.
2017 PROGRESS
- Maintained CTV’s #1 ranking as the most-watched television networkin Canada for the 16th year in a row, and continued to lead with amajority of the top 20 programs nationally in all key demographics
- Entered into an agreement with Corus Entertainment Inc. (Corus) toacquire French-language specialty channels Séries+ and Historia,further enhancing our competitiveness in the Québec media landscape.Séries+ is a fiction channel, offering locally produced dramas as well asforeign series. Historia broadcasts a suite of locally produced originalcontent including documentaries, reality series and drama series. Thetransaction is subject to approval by the Canadian Radio-television andTelecommunications Commission (CRTC) and the Competition Bureau.
- Grew CraveTV viewership to approximately 1.3 million subscribersat the end of 2017
- Signed an agreement to acquire four FM radio stations in Ontariofrom Larche Communications Inc. (Larche). Pending completion of thetransaction, which already received CRTC approval, the addition ofthese stations to Bell Media’s existing 105 iHeartRadio Canada propertieswill broaden the network’s industry-leading reach across the country.
- TMN, HBO Canada and TMN Encore launched an offline viewing featureon the TMN GO video-streaming platform, allowing subscribers todownload movies and series on their iOS and Android tablets andsmartphones for playback without an Internet connection
- Launched an enhanced iHeartRadio Canada app featuring more than1,000 live radio stations of every genre from across North America,with availability on additional platforms including Apple Watch, AppleCarPlay, Android Wear, Android Auto and Sonos
- Concluded a comprehensive multi-year regional broadcast rightsagreement with the Montreal Canadiens making TSN the officialEnglish-language regional broadcaster of the team beginning withthe 2017-2018 season. The agreement sees TSN air a slate of gamesin the Montreal Canadiens’ designated broadcast region, which spansEastern and Northern Ontario, Québec, and Atlantic Canada. RDScontinues to be the French-language home for regional MontrealCanadiens games.
- Concluded a multi-year rights agreement extension with the NFL thatmakes Bell Media the exclusive TV broadcast partner of the NFL inCanada. The partnership also features expanded digital opportunitieswhich include syndication rights for NFL highlights in Canada, as wellas expanded footage and programming rights to further bolster BellMedia’s non-game NFL-focused content.
- Reached a multi-year media rights extension with NASCAR, with TSNand RDS retaining exclusive Canadian media rights to all MonsterEnergy NASCAR Cup Series and NASCAR Xfinity Series races acrossall platforms. The multi-platform agreement features expanded digitalrights, with TSN and RDS delivering comprehensive coverage of theseNASCAR series across the networks’ digital and social media platforms.
- Announced a strategic partnership with Wow Unlimited Media Inc.(Wow) to produce kids and youth entertainment
- Astral, in partnership with Toronto Pearson International Airport,introduced two new large-format digital superboards in close proximityto the country’s largest airport. The new structures provide informationabout the airport while offering an advertising opportunity reachingmillions of commuters and passengers annually. The four faces ofthe new advertising structures deliver a daily circulation of closeto 800,000.
- Astral launched a new and unique programmatic solution for largeformat digital inventory using an exclusive self-serve platform, enablingclients to use audience targeting previously only available online
2018 FOCUS
- Maintain strong audience levels and ratings across all TV and radioproperties
- Reinforce industry leadership in conventional TV, pay TV, sportsmedia and radio
- In January 2018, we concluded a long-term agreement with Lionsgateto bring premium U.S. pay TV platform Starz to Canada and distributethe first pay window of Lionsgate’s future theatrical releases in theterritory. Starz and Bell Media will also rebrand pay TV channel TMNEncore in early 2019.
| 42 BCE Inc. 2017 ANNUAL REPORT |
|
| | | | |
| | 2 | MD&A | Strategic imperatives |
- Grow viewership and scale of CraveTV on-demand TV streamingservice
- In January 2018, we announced that CraveTV’s HBO offering wouldexpand throughout 2018 with the addition of Game of Thrones, Girls,The Leftovers, Silicon Valley, Vice Principals, Ballers, Insecure andThe Young Pope
- Develop in-house production and content creation for distributionand use across all screens and platforms
- Expand live and on-demand content through TV Everywhere services
- Build on our OOH leadership position in Canada
- Grow French media properties
- Leverage cross-platform and integrated sales and sponsorship
- Grow revenues through unique partnerships and strategic contentinvestments
- In January 2018, we partnered with Bloomberg Media to create BNNBloomberg, Canada’s leading multi-platform business news brand.
Expected to launch in Spring 2018, BNN Bloomberg will provideaudiences and advertisers with an unparalleled suite of productsacross digital, television and radio, targeting Canada’s businessdecision makers. - In February 2018, we launched Snackable TV, a mobile-first, short-formvideo app delivering premium and shareable entertainment targetedat viewers looking to consume snack-size pieces of content, featuringexclusive content from HBO, Comedy Central, Etalk and more
| 2.5 Improve customer service |

Our objective is to enhance customers’ overall experience by delivering call centre efficiency, meeting commitments for the installation and timely repair of services, increasing network quality, and implementing process improvements to simplify customer transactions and interactions with our front-line employees and self-serve tools. All of these will help differentiate us from our competitors and gain long-term customer loyalty. We intend to achieve this by making the investments we need to improve our front-line service capabilities, our networks, our products and our distribution channels to win and keep customers.
2017 PROGRESS
- Virgin Mobile Canada (Virgin Mobile) was ranked highest in overallCustomer Care Satisfaction in the J.D. Power 2017 Canadian WirelessCustomer Care Study released in May, with top scores in the store,call centre and online service categories
- Improved wireless postpaid churn by 0.06 pts in 2017, driven by ourinvestments in customer retention
- Introduced the Same Day/Next Day smartphone repairs pilot programin Ontario, resolving many common smartphone issues within a fewhours with the help of certified technicians using manufacturer-approved parts
- Improved the MyBell app, achieving a four-star rating on the AppleApp Store, and increased mobile transactions by 38% in 2017
- Reduced fibre-to-the-home (FTTH) Residential Fibe TV installationtime by 9% in 2017
- Reduced FTTH Residential Fibe TV repair truck rolls per customer by16% in 2017
- Launched a simplified wireless bill
- Offered Same Day repair appointments to 68% of small businesscustomers, an improvement of 94% since 2014
- Increased the number of self-serve transactions by 15% in 2017
2018 FOCUS
- Continue to invest in customer service initiatives to simplify complexityfor all customers, including billing
- Further reduce the total volume of customer calls to our call centres
- Further improve customer satisfaction scores
- Achieve better consistency in customer experience
- Continue to improve customer personalization
- Reduce FTTP installation times and improve service quality
- Deploy new diagnostic technology enabling enhanced troubleshootingand proactive service monitoring for our customers
- Simplify the technician in-field experience through simplification andinnovation of technician tools
- Improve troubleshooting and diagnostic processes to manageincreasing customer and device complexity
| 2.6 Achieve a competitive cost structure |

Cost containment is a core element of our financial performance. It remains a key factor in our objective to preserve steady margins as we continue to experience revenue declines in our legacy wireline voice and data services and further shift our product mix towards growth services. We aim to accomplish this through operating our business in the most cost-effective way possible to extract maximum operational efficiency and productivity gains.
2017 PROGRESS
- Maintained relatively stable BCE consolidated adjusted EBITDA margin(1)compared to 2016
- Improved Bell Wireline adjusted EBITDA margin by 0.1 pts over 2016
- Realized approximately $33 million of operating cost synergies fromthe integration of MTS into our Bell Wireline and Bell Wireless segments
- Delivered cost savings from ongoing service improvements andsavings related to the deployment of FTTP
- Lowered Bell Canada’s average after-tax cost of publicly issued debtsecurities to 3.2%
2018 FOCUS
- Capture additional operating cost and capital expenditure synergiesfrom the integration of Bell MTS
- Deliver cost savings from workforce reductions, ongoing serviceimprovements, and savings related to the deployment of FTTP tosupport a stable consolidated adjusted EBITDA margin
- Optimize Bell Media’s operating cost structure to align with revenueresults
| (1) | Adjusted EBITDA margin is a non-GAAP financial measure and does not have any standardized meaning under IFRS. Therefore, it is unlikely to be comparable to similar measures presented by other issuers. See section 10.2, Non-GAAP financial measures and key performance indicators (KPIs) – Adjusted EBITDA and adjusted EBITDA margin in this MD&A for more details. |
BCE Inc. 2017 ANNUAL REPORT 43 |
|
| | | | |
3 | MD&A | Performance targets, outlook, assumptions and risks | |
| 3 Performance targets, outlook, assumptions and risks |
This section provides information pertaining to our performance against 2017 targets, our consolidated business outlook and operating assumptions for 2018 and our principal business risks.
| 3.1 BCE 2017 performance vs. guidance targets |
FINANCIAL
GUIDANCE | 2017
TARGET | 2017
PERFORMANCE AND RESULTS |
| Revenue growth | 4%–6% | 4.6% | BCE revenues were up 4.6% in 2017 driven by growth in Bell Wireless of 10.1%, Bell Wireline of 2.6% and Bell Media of 0.7%. This included the contribution from the acquisitions of MTS and Q9, moderated by regulatory pressures impacting all three of our segments. |
| Adjusted EBITDA growth | 4%–6% | 4.4% | BCE adjusted EBITDA grew 4.4% in 2017 with a corresponding adjusted EBITDA margin of 40.4%, which remained relatively stable year over year. The growth was driven by higher wireless, Internet, IPTV and media revenues, the impact of the acquisitions of MTS and Q9, along with continued effective cost management. This more than offset the ongoing revenue declines in wireline voice, satellite TV and legacy data services, increased investment in wireless subscriber retention and acquisition, and regulatory pressures, as well as higher Bell Media programming and content costs. |
| Capital intensity | Approx. 17% | 17.8% | BCE continued to focus its strategic investment in advanced broadband wireline and wireless infrastructure with capital expenditures totaling $4,034 million in 2017, up 7.0% over last year. This corresponded to an increased capital intensity ratio of 17.8% in 2017 compared to 17.4% last year and exceeded target due to the accelerated deployment of broadband fibre. Capital spending in 2017 was focused on the continued deployment of our broadband fibre directly to more homes and businesses, the ongoing rollout of our 4G LTE and LTE-A mobile networks, as well as the enhancement and expansion of our wireless network to increase network speeds and to support the growth in our subscriber base and data consumption. |
| Adjusted net earnings per share (adjusted EPS)(1) | $3.30–$3.40 | $3.39 | Adjusted net earnings in 2017 decreased by $24 million, or $0.07 per common share, due to higher depreciation and amortization expense, higher other expense which included impairment charges relating to our Bell Media segment, an increase in finance costs and higher severance, acquisition and other costs, partly offset by higher operating revenues, which resulted in higher adjusted EBITDA and lower income taxes. The average number of BCE common shares outstanding increased principally as a result of shares issued for the acquisition of MTS. |
| Free cash flow growth | Approx. 5%–10% | 6.0% | Increase in free cash flow of $192 million in 2017 was driven by higher cash flows from operating activities excluding voluntary DB pension plan contributions, partly offset by higher capital expenditures. |
| Annualized common dividend per share | $2.87 | $2.87 | Annualized BCE common dividend per share for 2017 increased by 14 cents, or 5.1%, to $2.87 compared to $2.73 per share in 2016. |
| Dividend payout ratio | 65%–75%
of free cash flow | 73.5% | Dividend payout ratio in 2017 increased by 2% from 71.5% to 73.5%. |
| 3.2 Business outlook and assumptions |
OUTLOOK
BCE’s 2018 outlook builds on the solid financial results achieved in 2017 that reflected higher wireless postpaid subscriber net additions and profitability; positive wireline adjusted EBITDA growth; an expanded direct fibre footprint offering more competitive Internet speeds; operating cost reductions at Bell Media to help offset content cost growth; and further integration synergies from the MTS acquisition.
Our projected financial performance for 2018 is underpinned by continued execution of our six strategic imperatives in a highly competitive and dynamic market. Growth in adjusted EBITDA, including the incremental financial contribution of Bell MTS in the first quarter of 2018, is expected to drive higher free cash flow generation, providing a strong and stable foundation for a higher BCE common share dividend for 2018, as well as continued significant capital investment in broadband fibre and wireless network infrastructure to support future growth.
| (1) | Adjusted EPS is a non-GAAP financial measure and does not have any standardized meaning under IFRS. Therefore, it is unlikely to be comparable to similar measures presented by other issuers. See section 10.2, Non-GAAP financial measures and key performance indicators (KPIs) – Adjusted net earnings and adjusted EPS in this MD&A for more details, including a reconciliation to the most comparable IFRS financial measure. |
| 44 BCE Inc. 2017 ANNUAL REPORT |
|
| | | | |
| | 3 | MD&A | Performance targets, outlook, assumptions and risks |
The key 2018 operational priorities for BCE are to:
- Maintain market share of incumbent wireless postpaid net additions
- Drive continued adoption of mobile smartphone handsets, tabletsand data applications, as well as the introduction of more 4G LTE andLTE-A devices and new data services
- Optimize wireless operating profitability through wireless subscriberbase expansion and higher blended ARPU, driven by a higher postpaidsmartphone mix, increased data consumption on 4G LTE and LTE-Anetworks, and higher access rates
- Further expand our LTE-A mobile network coverage to approximately92% of the Canadian population
- Increase our FTTP footprint by approximately 800,000 homes andbusinesses to 4.5 million locations
- Achieve positive full-year wireline adjusted EBITDA growth throughfurther growth of our residential IPTV and Internet subscriber bases, higher household ARPU from increased penetration of multi-producthouseholds and price increases, and realization of further Bell MTSoperating cost synergies
- Increase revenue generation from monetization of content rightsand Bell Media properties across all platforms, while controlling TVprogramming and premium content cost escalation
- Continue scaling Bell Media’s CraveTV on-demand streaming service
- Realize operating cost savings from workforce attrition and retirements,lower contracted rates from our suppliers, reduction in traffic thatis not on our wireline network, broader deployment of FTTP, andcustomer service improvements
Our projected financial performance for 2018 enabled us to increase the annualized BCE common share dividend for 2018 by 15 cents, or 5.2%, to $3.02 per share, maintaining our dividend payout ratio within our target policy range of 65% to 75% of free cash flow.
ASSUMPTIONS ABOUT THE CANADIAN ECONOMY
- Gradual slowdown in economic growth, given the Bank of Canada’s most recent estimated growth in Canadian gross domestic product of 2.2% in 2018
- Employment gains expected to slow in 2018, as the overall level of business investment is expected to remain soft
- Interest rates expected to increase in 2018
- Canadian dollar expected to remain at or around near current levels. Further movements may be impacted by the degree of strength of the U.S. dollar, interest rates and changes in commodity prices
MARKET ASSUMPTIONS
- A higher level of wireline and wireless competition in consumer,business and wholesale markets
- Higher, but slowing, wireless industry penetration and smartphoneadoption
- A soft media advertising market expected, due to variable demand,and escalating costs to secure TV programming
- Ongoing linear TV subscriber erosion expected, due to growingcord-cutter and cord-never customer segments
| 3.3 Principal business risks |
Provided below is a summary description of certain of our principal business risks that could have a material adverse effect on all of our segments. Certain additional business segment-specific risks are reported in section 5,Business segment analysis. For a detailed description of the principal risks relating to our regulatory environment and a description of the other principal business risks that could have a material adverse effect on our financial position, financial performance, cash flows, business or reputation, refer to section 8,Regulatory environment, and section 9,Business risks, respectively.
As the scope of our businesses increases and evolving technologies drive new services, delivery models and strategic partnerships, our competitive landscape expands to include new and emerging competitors, certain of which were historically our partners or suppliers, as well as other global scale competitors including, in particular, OTT TV service and voice over Internet protocol (VoIP) providers and other web-based and OTT players which are penetrating the telecommunications space. Pricing and investment decisions of market participants are based on many factors, such as strategy, market position, technology evolution, customer confidence and economic climate, and collectively these factors could adversely affect our market shares, service volumes and pricing strategies and, consequently, our financial results. Technology substitution, IP networks and recent regulatory decisions, in particular, continue to reduce barriers to entry in our industry. This has allowed competitors to launch new products and services and gain market share with far less investment in financial, marketing, human, technological and network resources than has historically been required. In particular, some competitors sell their services through the use of our networks as a result of regulatory requirements applicable to us, without the need to invest to build their own networks. Such lower necessary investment has enabled some competitors to be very disruptive in their pricing. Moreover, foreign OTT players such as Netflix are currently not subject to the same taxation obligations as those imposed on Canadian domestic digital suppliers, which provides them with a competitive advantage over us. We expect these trends to continue in the future and the increased competition we face as a result could negatively impact our business including, without limitation, in the following ways:
- Competitors’ aggressive market offers could result in pricing pressures,lower margins and increased costs of customer acquisition andretention, and our market shares and sales volumes could decreaseif we do not match competitors’ pricing levels or increase customeracquisition and retention costs
- Higher Canadian wireless penetration could slow opportunities fornew customer acquisition
- Product substitutions and spending rationalization by businesscustomers could result in an acceleration of NAS erosion beyondour current expectations
BCE Inc. 2017 ANNUAL REPORT 45 |
|
| | | | |
3 | MD&A | Performance targets, outlook, assumptions and risks | |
- The continued OTT-based substitution and market expansion of VoIPservice providers and traditional software players delivering low-costvoice line alternatives, which is changing our approach to service offersand pricing, could have an adverse effect on our business
- A fundamental separation of content and connectivity has emerged,allowing the expansion and market penetration of low-cost OTT TVproviders and other alternative service providers, some of which mayoffer content as loss leaders to support their core business, whichis changing our TV and media ecosystems, could lower our revenuestreams and could affect our business negatively
- Competition with global competitors such as Netflix and Amazon,in addition to traditional Canadian competitors, for programmingcontent could drive significant increases in content acquisition costsas these competitors, along with other global scale entities such asGoogle, disrupt local market dynamics as a result of innovative andflexible global market strategies
- Adverse economic conditions, such as economic downturns orrecessions, adverse conditions in the financial markets, or a declininglevel of retail and commercial activity could have a negative impacton the demand for, and prices of, our wireline, wireless and mediaproducts and services, as well as drive an increase in bad debts asthe creditworthiness of some customers declines
- Regulatory decisions regarding wholesale access to our wireless andfibre networks could bring new competitors or strengthen the marketposition of current competitors
- An increasing number of off-contract customers could increasecustomer acquisition activity and churn in the Canadian wireless market
- Foreign competitors could enter the Canadian market and leveragetheir global scale advantage
For a further discussion of our competitive environment and competition risk, as well as a list of our main competitors, on a segmented basis, refer toCompetitive landscape and industry trendsandPrincipal business risksin section 5,Business segment analysis.
Although most of our retail services are not price-regulated, government agencies and departments such as the CRTC, Innovation, Science and Economic Development Canada (ISED), Canadian Heritage and the Competition Bureau continue to play a significant role in regulatory matters such as mandatory access to networks, spectrum auctions, approval of acquisitions, broadcast licensing and foreign ownership requirements. As with all regulated organizations, planned strategies are contingent upon regulatory decisions. Adverse decisions by regulatory agencies or increased regulation could have negative financial, operational, reputational or competitive consequences for our business. For a discussion of our regulatory environment and the principal risks related thereto, refer to section 8,Regulatory environment.
Our operations, service performance and reputation depend on how well we protect our physical and non-physical assets, including networks, IT systems, offices, corporate stores and sensitive information, from events and attacks such as those referred to in section 9,Business risks – Operational performance – Our operations and business continuity depend on how well we protect, test, maintain and replace our networks, IT systems, equipment and other facilities. The protection and effective organization of our systems, applications and information repositories are central to the secure and continuous operation of our networks and business as electronic and physical records of proprietary business and personal data, such as confidential customer and employee information, are all sensitive from a market and privacy perspective. In particular, cyber attacks are constantly evolving and becoming more frequent and our IT defences need to be constantly monitored and adapted to respond to them. Cyber attacks include, but are not limited to, hacking, computer viruses, denial of service attacks, industrial espionage, unauthorized access to confidential, proprietary or sensitive information, phishing or other attacks on network or IT security. We are also exposed to cyber threats as a result of actions that may be taken by our customers, suppliers, employees or independent third parties, whether malicious or not, including as a result of the use of social media, cloud-based solutions and IT consumerization. Vulnerabilities could harm our brand and reputation and adversely affect customer and investor confidence as well as our financial results given that they may lead to:
- Network operating failures and service disruptions, which could directlyimpact our customers’ ability to maintain normal business operationsand deliver critical services and/or the ability of third-party suppliersto deliver critical services to us
- Unauthorized access to proprietary or sensitive information aboutour business
- Theft, loss, leakage, destruction or corruption of data and confidentialinformation, including personal information about our customersor employees, that could result in financial loss, exposure to claimsfor damages by customers, employees and others, and difficulty inaccessing materials to defend legal cases
- Physical damage to network assets impacting service continuity
- Litigation, fines and liability for failure to comply with privacy andinformation security laws
- Fines and sanctions from credit card providers for failing to complywith payment card industry data security standards for protectionof cardholder data
- Regulatory investigations and increased audit and regulatory scrutinythat could divert resources from project delivery
- Increased fraud as criminals leverage stolen information against us,our employees or our customers
- The potential for loss of subscribers or impairment of our ability toattract new ones
- Lost revenues due to service disruptions and the incurrence ofremediation costs
- Higher insurance premiums
In addition, cyber attacks and other security breaches affecting our suppliers or other business partners could also adversely affect our operations and financial results.
Although we evaluate and seek to adapt our security policies, procedures and controls that are designed to protect our assets, there is no assurance that these will prevent the occurrence of material cybersecurity breaches, intrusions or attacks, or that any insurance we may have will cover the costs, damages, liabilities or losses that could result therefrom.
| 46 BCE Inc. 2017 ANNUAL REPORT |
|
| | | | |
| | 4 | MD&A | Consolidated financial analysis |
| 4 Consolidated financial analysis |
This section provides detailed information and analysis about BCE’s performance in 2017 compared with 2016. It focuses on BCE’s consolidated operating results and provides financial information for our Bell Wireless, Bell Wireline and Bell Media business segments. For further discussion and analysis of our business segments, refer to section 5,Business segment analysis.
BCE CONSOLIDATED INCOME STATEMENTS
| | 2017 | | 2016 | | $ CHANGE | | % CHANGE | |
Operating revenues | | | | | | | | |
Service | 21,143 | | 20,090 | | 1,053 | | 5.2 | % |
Product | 1,576 | | 1,629 | | (53 | ) | (3.3 | %) |
Total operating revenues | 22,719 | | 21,719 | | 1,000 | | 4.6 | % |
Operating costs | (13,541 | ) | (12,931 | ) | (610 | ) | (4.7 | %) |
Adjusted EBITDA | 9,178 | | 8,788 | | 390 | | 4.4 | % |
Adjusted EBITDA margin | 40.4 | % | 40.5 | % | | | (0.1 | ) pts |
Severance, acquisition and other costs | (190 | ) | (135 | ) | (55 | ) | (40.7 | %) |
Depreciation | (3,037 | ) | (2,877 | ) | (160 | ) | (5.6 | %) |
Amortization | (813 | ) | (631 | ) | (182 | ) | (28.8 | %) |
Finance costs | | | | | | | | |
Interest expense | (955 | ) | (888 | ) | (67 | ) | (7.5 | %) |
Interest on post-employment benefit obligations | (72 | ) | (81 | ) | 9 | | 11.1 | % |
Other (expense) income | (102 | ) | 21 | | (123 | ) | n.m. | |
Income taxes | (1,039 | ) | (1,110 | ) | 71 | | 6.4 | % |
Net earnings | 2,970 | | 3,087 | | (117 | ) | (3.8 | %) |
Net earnings attributable to: | | | | | | | | |
Common shareholders | 2,786 | | 2,894 | | (108 | ) | (3.7 | %) |
Preferred shareholders | 128 | | 137 | | (9 | ) | (6.6 | %) |
Non-controlling interest | 56 | | 56 | | – | | – | |
Net earnings | 2,970 | | 3,087 | | (117 | ) | (3.8 | %) |
Adjusted net earnings | 3,033 | | 3,009 | | 24 | | 0.8 | % |
Net earnings per common share (EPS) | 3.12 | | 3.33 | | (0.21 | ) | (6.3 | %) |
Adjusted EPS | 3.39 | | 3.46 | | (0.07 | ) | (2.0 | %) |
Total operating revenues at BCE increased by 4.6%, compared to last year, reflecting higher service revenues of 5.2%, moderated by a decline in product revenues of 3.3%. The year-over-year increase in service revenues was driven by growth across all three of our segments, led by continued strength from Bell Wireless and higher Internet, IPTV and media subscription revenues, as well as reflecting the contributions from the acquisitions of MTS on March 17, 2017 and Q9 in Q4 2016. The growth in service revenues was moderated by the continued erosion in voice, satellite TV and legacy data revenues, including reduced customer spending and competitive pricing pressures in our business market, regulatory pressures impacting all three of our segments, and lower advertising revenues at Bell Media due to ongoing market softness.
Net earnings in 2017 decreased 3.8%, compared to 2016, due to higher depreciation and amortization expense, higher other expense which included impairment charges of $82 million relating to our Bell Media segment, an increase in finance costs and higher severance, acquisition and other costs which included costs related to the acquisition of MTS. This was partly offset by higher adjusted EBITDA, as growing revenues more than offset an increase in operating costs, and by lower income taxes.
2017 adjusted EBITDA grew by 4.4% with a corresponding adjusted EBITDA margin of 40.4% as a result of year-over-year increases in our Bell Wireless and Bell Wireline segments, offset by a decline in our Bell Media segment. The year-over-year increase in adjusted EBITDA was driven by the flow-through of the service revenue growth, the contribution from our acquisitions and continued effective cost management. This was moderated by higher investment in customer retention and acquisition at Bell Wireless and escalating content and programming costs at Bell Media.
BCE Inc. 2017 ANNUAL REPORT 47 |
|
| | | | |
4 | MD&A | Consolidated financial analysis | |
| BCE STATEMENTS OF CASH FLOWS – SELECTED INFORMATION |
| | 2017 | | 2016 | | $ CHANGE | | % CHANGE | |
Cash flows from operating activities | 7,358 | | 6,643 | | 715 | | 10.8 | % |
Capital expenditures | (4,034 | ) | (3,771 | ) | (263 | ) | (7.0 | %) |
Free cash flow | 3,418 | | 3,226 | | 192 | | 6.0 | % |
In 2017, BCE’s cash flows from operating activities, which included the contributions from the MTS acquisition, increased $715 million, compared to 2016, due mainly to higher adjusted EBITDA, a lower voluntary DB pension plan contribution made in 2017, improved working capital and lower severance and other costs paid, partly offset by higher income taxes paid and higher interest payments.
Free cash flow increased $192 million in 2017, compared to 2016, due to higher cash flows from operating activities excluding voluntary DB pension plan contributions, partly offset by higher capital expenditures.
TOTAL BCE CONNECTIONS
| | 2017 | | 2016 | | % CHANGE | |
Wireless subscribers(1) | 9,166,787 | | 8,468,872 | | 8.2 | % |
Postpaid(1) | 8,418,650 | | 7,690,727 | | 9.5 | % |
High-speed Internet subscribers(1) (2) | 3,790,141 | | 3,476,562 | | 9.0 | % |
TV (satellite and IPTV subscribers)(1) | 2,832,300 | | 2,744,909 | | 3.2 | % |
IPTV(1) | 1,550,317 | | 1,337,944 | | 15.9 | % |
Total growth services | 15,789,228 | | 14,690,343 | | 7.5 | % |
Wireline NAS lines(1) | 6,320,483 | | 6,257,732 | | 1.0 | % |
Total services | 22,109,711 | | 20,948,075 | | 5.5 | % |
| (1) | As a result of the acquisition of MTS on March 17, 2017, our wireless, high-speed Internet, TV and NAS subscriber bases increased by 476,932(418,427 postpaid), 229,470, 108,107 (104,661 IPTV) and 419,816 (223,663 residential and 196,153 business) subscribers, respectively. Subsequently, in Q2 2017, Bell’s wireless subscriber base reflected the divestiture of 104,833 postpaid subscribers to TELUS related to BCE’s acquisition of MTS. Bell’s wireless subscriber base in Q2 2017 also reflected the removal of 7,268 subscribers (2,450 postpaid and 4,818 prepaid) due to the decommissioning of the CDMA network in western Canada. |
| (2) | Following a review of customer accounts by a wholesale reseller, we adjusted our high-speed Internet subscriber base at the beginning of Q1 2017 to remove 3,751 non-revenue generating units. |
BCE NET ACTIVATIONS
| | 2017 | | 2016 | | % CHANGE | |
Wireless subscribers | 333,084 | | 223,041 | | 49.3 | % |
Postpaid | 416,779 | | 315,311 | | 32.2 | % |
High-speed Internet subscribers | 87,860 | | 85,099 | | 3.2 | % |
TV (satellite and IPTV subscribers) | (20,716 | ) | 6,413 | | (423.0 | %) |
IPTV | 107,712 | | 155,153 | | (30.6 | %) |
Total growth services | 400,228 | | 314,553 | | 27.2 | % |
Wireline NAS lines | (357,065 | ) | (415,408 | ) | 14.0 | % |
Total services | 43,163 | | (100,855 | ) | 142.8 | % |
BCE added 400,228 net new customer connections to its growth services in 2017, representing a 27.2% improvement over 2016. This consisted of:
- 416,779 postpaid wireless customers, and the net loss of 83,695 prepaidwireless customers
- 87,860 high-speed Internet customers
- 107,712 IPTV customers and 128,428 satellite TV net customer losses
NAS net losses were 357,065 in 2017, an improvement of 14.0% over 2016.
Total BCE customer connections across all services increased by 5.5% in 2017 compared to last year, driven by the subscribers acquired as part of the acquisition of MTS, as well as increases in our growth services customer base, offset in part by the continued but moderating erosion in traditional NAS lines.
At the end of 2017, BCE customer connections totaled 22,109,711 and were comprised of the following:
- 9,166,787 wireless subscribers, up 8.2% compared to 2016, andincluded 8,418,650 postpaid wireless subscribers, an increase of 9.5%compared to the prior year
- 3,790,141 high-speed Internet subscribers, 9.0% higher year over year
- 2,832,300 total TV subscribers, up 3.2% compared to 2016, and included1,550,317 IPTV customers, up 15.9% year over year
- 6,320,483 total NAS lines, an increase of 1.0% compared to 2016
| 48 BCE Inc. 2017 ANNUAL REPORT |
|
| | | | |
| | 4 | MD&A | Consolidated financial analysis |
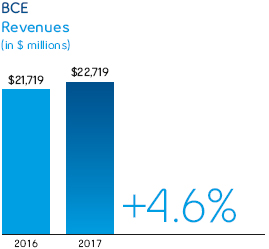
| | 2017 | | 2016 | | $ CHANGE | | % CHANGE | |
| Bell Wireless | 7,883 | | 7,159 | | 724 | | 10.1 | % |
| Bell Wireline | 12,415 | | 12,104 | | 311 | | 2.6 | % |
| Bell Media | 3,104 | | 3,081 | | 23 | | 0.7 | % |
| Inter-segment eliminations | (683 | ) | (625 | ) | (58 | ) | (9.3 | %) |
| Total BCE operating revenues | 22,719 | | 21,719 | | 1,000 | | 4.6 | % |
BCE
Total operating revenues at BCE increased by 4.6% in 2017, compared to 2016, reflecting growth across all three of our segments. This was comprised of service revenues of $21,143 million in 2017, which grew by 5.2% compared to 2016, and product revenues of $1,576 million, which declined by 3.3% year over year.
BELL WIRELESS
Bell Wireless operating revenues increased by 10.1% in 2017, compared to last year, driven by both higher service and product revenues. Service revenues grew by 10.7%, reflecting a larger postpaid subscriber base, higher blended ARPU and the contribution from the acquisition of MTS. The growth in blended ARPU was driven by the greater proportion of postpaid customers in our total subscriber base, higher average monthly rates due to the flow-through of 2016 pricing changes, and higher smartphone penetration along with a growing base of postpaid LTE and LTE-A customers in our subscriber mix, driving up data consumption and demand for larger data plans. This was partially offset by the unfavourable impact of Telecom Decision CRTC 2016-171 (Telecom Decision CRTC 2016-171), issued by the CRTC on May 5, 2016, related to 30-day cancellation policies, which clarified that service providers must provide pro-rated refunds, based on the number of days left in the last monthly billing cycle after cancellation, certain aspects of which are currently the subject matter of an application for clarification by TELUS Communications Company pursuant to the Telecommunications Act and Part 1 of the CRTC Rules of Practice. The year-over-year growth in service revenues was also moderated by the increased adoption of all-inclusive voice and text rate plans resulting in lower out of bundle usage. Product revenues increased by 3.1%, mainly due to the greater proportion of premium devices in our sales mix, higher customer upgrades and gross activations, and the contribution from the acquisition of MTS, partially offset by greater promotional offers due to a highly competitive marketplace.
BELL WIRELINE
Bell Wireline operating revenues increased by 2.6% in 2017, compared to last year, driven by service revenue growth of 3.4%, offset in part by a decrease in product revenues of 5.9%. The growth in service revenues was attributable to the acquisitions of MTS and Q9, Internet and IPTV subscriber growth combined with higher household ARPU. The growth in revenues was moderated by the continued erosion in our voice, satellite TV and legacy data services, increased acquisition, retention and bundle discounts to match aggressive offers from cable competitors and regulatory pressures due to unfavourable CRTC rulings in 2016 relating to Internet tariffs for aggregated wholesale high-speed access services and Telecom Decision CRTC 2016-171. The decline in product revenues was driven by lower demand for equipment by large business customers, attributable to market softness and competitive pricing pressures, as well as lower sales of consumer electronics at The Source, partly offset by the favourable contribution from the MTS acquisition.
BELL MEDIA
Bell Media operating revenues increased by 0.7% in 2017, compared to 2016, due to higher subscriber revenues driven by growth in our subscriber base from our TV Everywhere GO Products and CraveTV, rate increases on contract renewals and the benefit from the expansion of TMN into a national pay TV service in March 2016. This was partially offset by lower advertising revenues mainly due to continued market softness and declines in audience levels across both conventional and specialty TV and radio media platforms, as well as reflecting the negative impact on conventional TV advertising revenues from the CRTC’s decision to eliminate simultaneous substitution for the NFL Super Bowl. The decline in advertising revenues was moderated by growth in OOH advertising revenues as a result of the contribution from the Cieslok Media Ltd. (Cieslok Media) acquisition in January 2017 and from newly awarded contracts.
BCE Inc. 2017 ANNUAL REPORT 49 |
|
| | | | |
4 | MD&A | Consolidated financial analysis | |

| | 2017 | | 2016 | | $ CHANGE | | % CHANGE | |
Bell Wireless | (4,607 | ) | (4,156 | ) | (451 | ) | (10.9 | %) |
Bell Wireline | (7,229 | ) | (7,062 | ) | (167 | ) | (2.4 | %) |
Bell Media | (2,388 | ) | (2,338 | ) | (50 | ) | (2.1 | %) |
Inter-segment eliminations | 683 | | 625 | | 58 | | 9.3 | % |
Total BCE operating costs | (13,541 | ) | (12,931 | ) | (610 | ) | (4.7 | %) |
| (1) | Cost of revenues includes costs of wireless devices and other equipment sold, network and content costs, and payments to other carriers. |
| (2) | Labour costs (net of capitalized costs) include wages, salaries and related taxes and benefits, post-employment benefit plans service cost, and other labour costs, including contractor and outsourcing costs |
| (3) | Other operating costs include marketing, advertising and sales commission costs, bad debt expense, taxes other than income taxes, IT costs, professional service fees and rent. |
BCE
Total BCE operating costs increased by 4.7% in 2017, compared to 2016, resulting from higher costs in all three of our segments.
BELL WIRELESS
Bell Wireless operating costs increased by 10.9% in 2017, compared to last year, as a result of:
- Increased customer retention spending primarily from greaterpromotional pricing driven by a competitive market, a higher proportionof premium smartphone devices in our upgrade mix, increased handsetcosts and an increase in the volume of subsidized upgrades reflectinga greater number of contract expiries
- Higher subscriber acquisition costs due to greater promotionalpricing driven by a highly competitive market, a larger proportionof high-end smartphones in our sales mix, increased handset costs,a larger proportion of postpaid gross activations in our mix andincreased gross activations
- The acquisition of MTS
- Increased network operating costs driven by higher LTE and LTE-Anetwork usage
- Increased labour costs to support the growth of the business
BELL WIRELINE
Bell Wireline operating costs increased by 2.4% in 2017, compared to 2016, as a result of:
- The acquisitions of MTS and Q9
- Greater programming costs in our TV business due to the growth inour subscriber base and contractual rate increases
- Increased fleet expenses from higher fuel and refurbishment costs
- Greater marketing and sales expense in our retail market to supportsubscriber acquisitions
These factors were partially offset by:
- Lower labour costs attributable to workforce reductions, vendorcontract savings, as well as fewer call volumes to our customerservice centres
- Reduced cost of goods sold resulting from lower product sales
- Lower payments to other carriers driven by fewer sales of internationallong distance minutes
- Reduced bad debt expense
BELL MEDIA
Bell Media operating costs increased by 2.1% in 2017, compared to last year, mainly due to higher programming and content costs from the ongoing ramp up of content for CraveTV and pay TV services, deal renewals for specialty TV programming, content costs associated with TMN national expansion, escalating costs for sports rights as well as higher OOH expenses resulting from the Cieslok Media acquisition and the execution of newly awarded contracts. This increase in operating costs was partially mitigated by reduced labour costs driven mainly by workforce reductions.
| 50 BCE Inc. 2017 ANNUAL REPORT |
|
| | | | |
| | 4 | MD&A | Consolidated financial analysis |

In 2017, net earnings decreased by 3.8%, compared to 2016, due to higher depreciation and amortization expense, higher other expense which included impairment charges of $82 million relating to our Bell Media segment, an increase in finance costs and higher severance, acquisition and other costs which included costs related to the acquisition of MTS. This was partly offset by higher adjusted EBITDA, as growing revenues more than offset an increase in operating costs, and by lower income taxes.
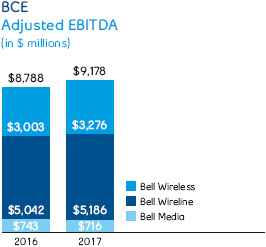
| | 2017 | | 2016 | | $ CHANGE | | % CHANGE | |
Bell Wireless | 3,276 | | 3,003 | | 273 | | 9.1 | % |
Bell Wireline | 5,186 | | 5,042 | | 144 | | 2.9 | % |
Bell Media | 716 | | 743 | | (27 | ) | (3.6 | %) |
Total BCE adjusted EBITDA | 9,178 | | 8,788 | | 390 | | 4.4 | % |

BCE
BCE’s adjusted EBITDA increased by 4.4% in 2017, compared to 2016, driven by growth in our Bell Wireless and Bell Wireline segments, offset in part by a decline in our Bell Media segment. This resulted in a relatively stable adjusted EBITDA margin of 40.4% compared to 40.5% experienced last year.
The growth in adjusted EBITDA reflected higher wireless, Internet, IPTV and media revenues, the contribution from the acquisitions of MTS and Q9 and effective cost management. This was offset in part by the ongoing erosion in our voice, satellite TV and legacy data revenues, greater investment in wireless subscriber retention and acquisition, regulatory pressures impacting all three of our segments, as well as higher programming and content costs in our Bell Media segment.
BELL WIRELESS
Bell Wireless adjusted EBITDA increased by 9.1% in 2017, compared to last year, reflecting the flow-through of higher operating revenues from the continued growth in our subscriber base and in blended ARPU along with the contribution from the acquisition of MTS, moderated by higher year-over-year operating expenses primarily driven by our increased investment in customer retention and acquisition together with the incremental expense contribution from Bell MTS. Adjusted EBITDA margin, based on wireless operating service revenues, declined by 0.6 pts to 44.6%, in 2017, compared to 45.2% in the prior year.
BELL WIRELINE
Bell Wireline adjusted EBITDA increased by 2.9% in 2017, compared to 2016, resulting from the acquisitions of MTS and Q9, growth in our Internet and IPTV businesses, as well as reflecting disciplined cost containment. This was partly offset by the continued decline of voice, satellite TV and legacy data revenues, including the effect of reduced customer spending and competitive pressures in our business market and the impact of regulatory pressures.
BCE Inc. 2017 ANNUAL REPORT 51 |
|
| | | | |
4 | MD&A | Consolidated financial analysis | |
BELL MEDIA
Bell Media adjusted EBITDA decreased by 3.6% in 2017, compared to the previous year, due to higher programming and content costs and flow-through of the advertising revenue decline which included the unfavourable impact of the CRTC’s decision to eliminate simultaneous substitution for the NFL Super Bowl. This was moderated by continued growth in subscriber revenues and lower labour costs.
| 4.7 Severance, acquisition and other costs |
This category includes various income and expenses that are not related directly to the operating revenues generated during the year.

2017
Severance, acquisition and other costs included:
- Severance costs related to workforce reduction initiatives of $79 million
- Acquisition and other costs of $111 million, which included transaction costs, such as legal andfinancial advisory fees, related to completed or potential acquisitions, severance and integrationcosts as well as a loss on transfer of spectrum licences to Xplornet Communications Inc.related to the MTS acquisition
2016
Severance, acquisition and other costs included:
- Severance costs related to workforce reduction initiatives of $87 million
- Acquisition and other costs of $48 million, which included transaction costs, such as legal andfinancial advisory fees, related to completed or potential acquisitions, as well as severanceand integration costs relating to the privatization of Bell Aliant
| 4.8 Depreciation and amortization |
The amount of our depreciation and amortization in any year is affected by:
- How much we invested in new property,plant and equipment and intangible assetsin previous years
- How many assets we retired during the year
- Estimates of the useful lives of assets

DEPRECIATION
Depreciation in 2017 increased by $160 million, compared to 2016, mainly due to the acquisition of MTS and a higher asset base as we continued to invest in our broadband and wireless networks as well as our IPTV service. The increase was partly offset by lower depreciation due to an increase in the estimate of useful lives of certain assets as a result of our ongoing annual review process. The changes in useful lives have been applied prospectively, effective January 1, 2017, and did not have a significant impact on our financial statements.
AMORTIZATION
Amortization in 2017 increased by $182 million, compared to 2016, due mainly to the acquisition of MTS and a higher asset base.
| 52 BCE Inc. 2017 ANNUAL REPORT |
|
| | | | |
| | 4 | MD&A | Consolidated financial analysis |

INTEREST EXPENSE
Interest expense in 2017 increased by $67 million, compared to 2016, mainly as a result of higher average debt levels due in part to the acquisition of MTS, partly offset by lower average interest rates.
INTEREST ON POST-EMPLOYMENT BENEFIT OBLIGATIONS
Interest on our post-employment benefit obligations is based on market conditions that existed at the beginning of the year. On January 1, 2017, the discount rate was 4.0% compared to 4.2% on January 1, 2016.
In 2017, interest expense decreased by $9 million, compared to last year, due to a lower post-employment benefit obligation at the beginning of the year.
The impacts of changes in market conditions during the year are recognized in other comprehensive income (loss) (OCI).
| 4.10 Other (expense) income |
Other (expense) income includes income and expense items, such as:
- Net mark-to-market gains or losses on derivatives used as economichedges
- Impairment of assets
- Losses on disposal and retirement of software, plant and equipment
- Equity (loss) income from investments in associates and joint ventures
- Early debt redemption costs
- Net gains (losses) on investments, including gains (losses) when wedispose of, write down or reduce our ownership in investments

2017
Other expense of $102 million included impairment charges of $82 million related to our music TV channels and two small market radio station cash-generating units (CGUs) within our Bell Media segment, losses on retirements and disposals of property, plant and equipment and intangible assets of $47 million, losses from our equity investments of $31 million which included BCE’s share of an obligation to repurchase at fair value the minority interest in one of BCE’s joint ventures, early debt redemption costs of $20 million, partly offset by net mark-to-market gains on derivatives used as economic hedges of share-based compensation and U.S. dollar purchases of $88 million.
2016
Other income of $21 million included net mark-to-market gains of $67 million on derivatives used as economic hedges of share-based compensation and U.S. dollar purchases and gains on investments of $58 million which included a gain related to one of our equity investments of $34 million, as well as a gain of $12 million due to the remeasurement of BCE’s previously held equity interest in Q9 to its fair value. These were partly offset by losses of $89 million on equity investments which included BCE’s share of the loss recorded by one of our equity investments on the sale of a portion of their operations of $46 million and $11 million equity losses on our share of an obligation to repurchase at fair value the minority interest in one of BCE’s joint ventures. Additionally, BCE recorded losses of $28 million on disposal of property, plant and equipment and intangible assets.
BCE Inc. 2017 ANNUAL REPORT 53 |
|
| | | | |
4 | MD&A | Consolidated financial analysis | |
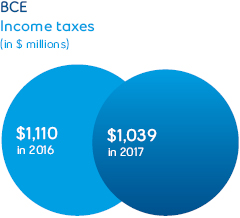
The following table provides information and reconciles the amount of reported income taxes in the income statements with income taxes calculated at a statutory income tax rate of 27.1% for 2017 and 2016.
| FOR THE YEAR ENDED DECEMBER 31 | 2017 | | 2016 | |
Net earnings | 2,970 | | 3,087 | |
Add back income taxes | 1,039 | | 1,110 | |
Earnings before income taxes | 4,009 | | 4,197 | |
Applicable statutory tax rate | 27.1 | % | 27.1 | % |
Income taxes computed at applicable statutory rates | (1,086 | ) | (1,137 | ) |
Non-taxable portion of (losses) gains on investments | (1 | ) | 11 | |
Uncertain tax positions | 16 | | (9 | ) |
Effect of change in provincial corporate tax rate | (3 | ) | 4 | |
Change in estimate relating to prior periods | 51 | | 46 | |
Non-taxable portion of equity losses | (10 | ) | (23 | ) |
Other | (6 | ) | (2 | ) |
Total income taxes | (1,039 | ) | (1,110 | ) |
Average effective tax rate | 25.9 | % | 26.4 | % |
| 4.12 Net earnings attributable to common shareholders and EPS |

Net earnings attributable to common shareholders in 2017 decreased by $108 million, compared to 2016, due to higher depreciation and amortization expense, higher other expense which included impairment charges of $82 million relating to our Bell Media segment, an increase in finance costs and higher severance, acquisition and other costs which included costs related to the acquisition of MTS. This was partly offset by higher adjusted EBITDA, as growing revenues more than offset an increase in operating costs, and by lower income taxes.
BCE’s EPS of $3.12 in 2017 decreased by $6.3% compared to 2016. The average number of BCE common shares outstanding increased principally as a result of shares issued for the acquisition of MTS which further diluted EPS as compared to 2016.
Excluding the impact of severance, acquisition and other costs, net (losses) gains on investments, early debt redemption costs and impairment charges, adjusted net earnings in 2017 was $3,033 million, or $3.39 per common share, compared to $3,009 million, or $3.46 per common share in 2016.
| 54 BCE Inc. 2017 ANNUAL REPORT |
|
| | | | |
| | 4 | MD&A | Consolidated financial analysis |
| 4.13 Capital expenditures |

BCE capital expenditures were up $263 million, or 7.0%, in 2017, compared to 2016, driven by greater spending at Bell Wireline and Bell Media, while spending at Bell Wireless remained relatively stable. As a percentage of revenue, capital expenditures for BCE were 17.8% in 2017 compared to 17.4% last year. Our capital spending supported the continued deployment of our broadband fibre directly to more homes and businesses, including the rollout of Gigabit Fibe infrastructure in the city of Toronto and other urban areas along with the commencement of the FTTP build-out in the city of Montréal that was announced on March 27, 2017. Our capital investments also included the continued rollout of our 4G LTE and LTE-A mobile networks, as well as the enhancement and expansion of our wireless network to increase network speeds and to support the growth in our subscriber base and data consumption.
In 2017, BCE’s cash flows from operating activities, which included the contributions from the MTS acquisition, increased $715 million, compared to 2016, due mainly to higher adjusted EBITDA, a lower voluntary DB pension plan contribution made in 2017, improved working capital and lower severance and other costs paid, partly offset by higher income taxes paid and higher interest payments.
Free cash flow increased $192 million in 2017, compared to 2016, due to higher cash flows from operating activities excluding voluntary DB pension plan contributions, partly offset by higher capital expenditures.
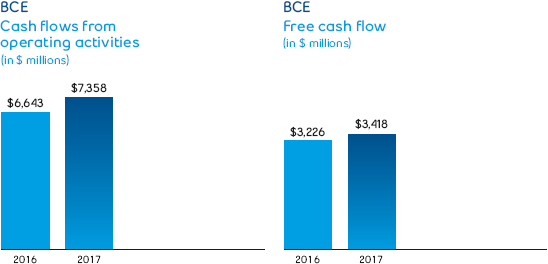
BCE Inc. 2017 ANNUAL REPORT 55 |
|
| | | | |
5 | MD&A | Bell Wireless | |
| 5 Business segment analysis |
In 2017, we achieved the highest market share of postpaid subscriber net additions in the Canadian wireless industry and delivered a fifth consecutive year of industry-leading wireless service revenue and adjusted EBITDA growth among incumbent national carriers.
| KEY ELEMENTS OF RELEVANT STRATEGIC IMPERATIVES |

Invest in broadband
networks and services
2017 PROGRESS
- Expanded our 4G LTE wireless network to reach 99% of the Canadianpopulation coast to coast with download speeds ranging from 75 Mbpsto 150 Mbps (expected average download speeds of 12 to 40 Mbps)
- Continued the rollout of our LTE-A wireless network, providing serviceto approximately 87% of the Canadian population at data speeds upto 260 Mbps (expected average download speeds of 18 to 74 Mbps).In addition, our Tri-band LTE-A footprint covered 34% of the populationwith download speeds of up to 335 Mbps (expected average downloadspeeds of 25 to 100 Mbps).
- Launched North America’s first Quad-band LTE-A network deploymentcapable of delivering theoretical speeds of up to 750 Mbps (expectedaverage download speeds of 25 to 230 Mbps in select areas). Bell’sQuad Band service expanded to 23% of Canadians, encompassing91 cities.
2018 FOCUS
- Expand LTE-A network footprint to approximately 92% of the Canadianpopulation
- Deploy Quad-band LTE-A to approximately 60% of the Canadianpopulation enabling theoretical speeds up to 750 Mbps (averageexpected speeds of 25 to 230 Mbps)
- Increase LTE-A peak theoretical speeds to 950 Mbps with 4×4 MIMO(Multiple Input Multiple Output) technology in select urban areascovering approximately 40% of the Canadian population
- Increase small cell deployment and in-building coverage to increaseurban densification and support evolution to 5G services
- Launch an LTE-M wireless network to support the rapidly increasinguse of IoT devices on LPWANs in Canada. LTE-M improves the operatingefficiency of IoT devices by enabling very low power consumption andbetter coverage in underground and other hard to reach locations.

Accelerate
wireless
2017 PROGRESS
- Acquired 36% of total new postpaid gross and net activations amongthe three national wireless carriers, while achieving leading servicerevenue, ARPU and adjusted EBITDA growth of 10.7%, 3.5% and 9.1%,respectively
- Increased the number of postpaid subscribers on our LTE network to88% of our total postpaid subscribers, up from 81% at the end of 2016
- Expanded our smartphone and tablet lineup with 40 new devices,including Apple’s iPhone X, 8 and 8 Plus and Apple Watch Series 3 withbuilt-in cellular, the Samsung Galaxy S8 and S8+, the Samsung GalaxyNote8, Google’s Pixel 2 and Pixel 2 XL and the LG G6, adding to ourextensive selection of 4G LTE and LTE-A devices
- Launched Lucky Mobile, an easy and low-cost prepaid wirelessservice for budget-conscious Canadians with monthly plans startingat just $20 for unlimited local calling. Initially available to consumersin Ontario, Alberta and British Columbia, Lucky Mobile offers servicein 17 zones covering most major cities across the country, includingdata access at 3G-equivalent access speeds.
- Became the Government of Canada’s primary wireless supplier for thenext six years, with options to renew. Bell will supply voice, text, anddata services and approximately 230,000 mobile devices to federalemployees in more than 100 departments and agencies.
- First Canadian wireless provider to support the LTE network capabilitiesof the Apple Watch Series 3. In addition to providing VoLTE technology,Bell launched NumberShare, a service that enables customersto pair their Apple Watch Series 3 with their iPhone using the samephone number.
- Launched the first integrated Advanced Messaging service on Samsungdevices, offering a suite of mobile messaging features previouslyavailable through specialized third-party applications
| 56 BCE Inc. 2017 ANNUAL REPORT |
|
| | | | |
| | 5 | MD&A | Bell Wireless |
- Took a leadership position in the fast-growing IoT sector, which enablesthe interconnection of a range of devices and applications that sendand receive data
- Bell MTS launched the Innovations in Agriculture program at theUniversity of Manitoba, providing students with opportunities todevelop innovative IoT technologies for application in agricultureand food science
- Concluded an agreement with Hyundai AutoEver Telematics America(HATA), a subsidiary of Hyundai Motor Group, to deliver a range ofconnected telematics services including security, safety, diagnosticsand infotainment to select Hyundai and Kia vehicles over Bell’snational mobile network
- Partnered with BeWhere Technologies and Huawei to implement anautomated IoT solution for the Henry of Pelham Family Estate Wineryto help improve planning and sustainability programs
- First Canadian carrier to offer global connectivity for our leading-edgeIoT platforms and applications. Bell’s Global IoT connectivity solutionsoffer our customers uninterrupted worldwide network access andthe ability to manage all of their international devices remotely froma single web-based platform by embedding Bell’s Global SIM cardsinto their products.
2018 FOCUS
- Profitably grow our wireless postpaid subscriber base, whilemaintaining market share momentum of incumbent postpaid subscriberactivations
- Continue to increase ARPU
- Offer the latest handsets and devices in a timely manner to enablecustomers to benefit from ongoing technological improvements bymanufacturers and from faster data speeds to optimize the use ofour services
- Continue to increase the number of postpaid smartphone subscribersusing our 4G LTE and LTE-A networks
- Leverage Lucky Mobile to grow prepaid subscriber market share,while providing Canadians with affordable wireless service options
- Expand VoLTE technology coverage areas and broaden rollout tomore supported devices
- Accelerate new revenue streams by continuing to drive thecommercialization of IoT services and applications
- In February 2018, we partnered with the city of Kingston to employBell’s Smart City platform to provide a series of connected IoTapplications which will enable Kingston to digitize its operations andcollect data to make better informed decisions and investments incity operations and infrastructure, benefiting constituents, internaldepartments and employees while improving citizen engagement

Improve
customer service
2017 PROGRESS
- Virgin Mobile was ranked highest in overall Customer Care Satisfactionin the J.D. Power 2017 Canadian Wireless Customer Care Studyreleased in May, with top scores in the store, call centre and onlineservice categories
- Improved wireless postpaid churn by 0.06 pts in 2017, driven by ourinvestments in customer retention
- Introduced the Same Day/Next Day smartphone repairs pilot programin Ontario, resolving many common smartphone issues within a fewhours with the help of certified technicians using manufacturer-approved parts
- Improved the MyBell app, achieving a four-star rating on the AppleApp Store, and increased mobile transactions by 38% in 2017
- Launched a simplified wireless bill
- Increased the number of self-serve transactions by 15% in 2017
2018 FOCUS
- Continue to invest in customer service initiatives to simplify complexityfor all customers, including billing
- Further reduce the total volume of customer calls to our call centres
- Further improve customer satisfaction scores
- Achieve better consistency in customer experience
- Continue to improve customer personalization

Achieve a competitive
cost structure
2017 PROGRESS
- Realized operating cost synergies from the integration of MTS
- Delivered cost savings from ongoing service improvements
2018 FOCUS
- Capture additional operating cost and capital expenditure synergiesfrom the integration of Bell MTS
- Deliver cost savings from ongoing service improvements
BCE Inc. 2017 ANNUAL REPORT 57 |
|
| | | | |
5 | MD&A | Bell Wireless | |
| FINANCIAL PERFORMANCE ANALYSIS |
2017 PERFORMANCE HIGHLIGHTS
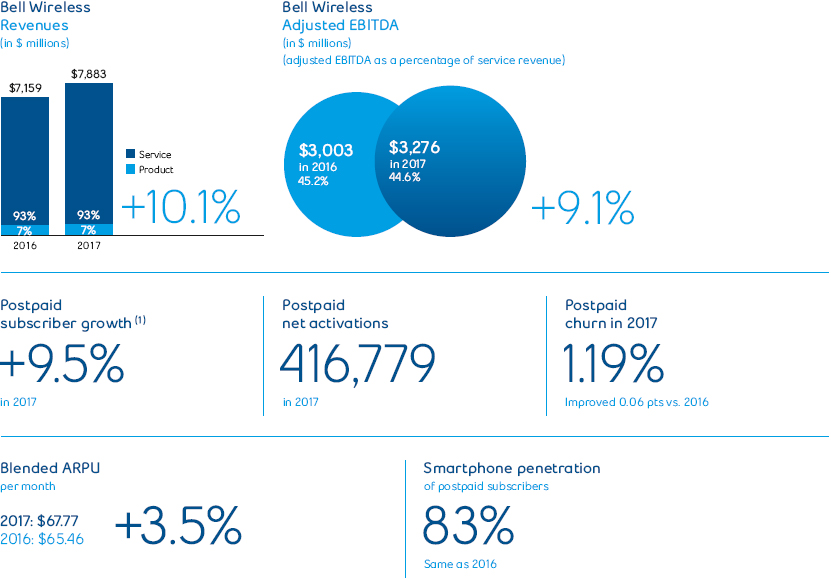
| (1) | As a result of the acquisition of MTS on March 17, 2017, our wireless subscriber base in Q1 2017 increased by 476,932 subscribers (418,427 postpaid). Subsequently, in Q2 2017, Bell’s wireless subscriber base reflected the divestiture of 104,833 postpaid subscribers to TELUS related to BCE’s acquisition of MTS. Bell’s wireless subscriber base in Q2 2017 also reflected the removal of 7,268 subscribers (2,450 postpaid and 4,818 prepaid) due to the decommissioning of the CDMA network in western Canada. |
BELL WIRELESS RESULTS
REVENUES
| | 2017 | | 2016 | | $ CHANGE | | % CHANGE | |
External service revenues | 7,308 | | 6,602 | | 706 | | 10.7 | % |
Inter-segment service revenues | 42 | | 40 | | 2 | | 5.0 | % |
Total operating service revenues | 7,350 | | 6,642 | | 708 | | 10.7 | % |
External product revenues | 530 | | 515 | | 15 | | 2.9 | % |
Inter-segment product revenues | 3 | | 2 | | 1 | | 50.0 | % |
Total operating product revenues | 533 | | 517 | | 16 | | 3.1 | % |
Total Bell Wireless revenues | 7,883 | | 7,159 | | 724 | | 10.1 | % |
Bell Wireless operating revenuesincreased by 10.1% in 2017, compared to last year, driven by growth in both service and product revenues.
- Service revenuesgrew by 10.7% in 2017, compared to 2016, reflectinga larger postpaid subscriber base and higher blended ARPU, whichincluded the contribution from the acquisition of MTS. Blended ARPUincreased due to the greater proportion of postpaid customers in ourtotal subscriber base, higher average monthly rates mainly driven bythe flow-through of 2016 pricing changes and greater smartphonepenetration along with a growing base of postpaid LTE and LTE-Acustomers in our subscriber mix, driving up data consumption and demand for larger data plans. The growth in service revenues wasmoderated by the unfavourable impact of Telecom Decision CRTC2016-171 and the increased adoption of all-inclusive voice and textrate plans resulting in lower out of bundle usage.
- Product revenuesincreased by 3.1% in 2017, compared to last year,mainly due to the greater proportion of premium devices in oursales mix, higher customer upgrades and gross activations, and thecontribution from the acquisition of MTS, partially offset by greaterpromotional offers due to a highly competitive marketplace.
| 58 BCE Inc. 2017 ANNUAL REPORT |
|
| | | | |
| | 5 | MD&A | Bell Wireless |
OPERATING COSTS AND ADJUSTED EBITDA
| | 2017 | | 2016 | | $ CHANGE | | % CHANGE | |
Operating costs | (4,607 | ) | (4,156 | ) | (451 | ) | (10.9 | %) |
Adjusted EBITDA | 3,276 | | 3,003 | | 273 | | 9.1 | % |
Total adjusted EBITDA margin | 41.6 | % | 41.9 | % | | | (0.3 | ) pts |
Adjusted EBITDA margin (service revenues) | 44.6 | % | 45.2 | % | | | (0.6 | ) pts |
Bell Wireless operating costsincreased by 10.9% in 2017, compared to last year, as a result of:
- Increased customer retention spending primarily from greaterpromotional pricing driven by a competitive market, a higher proportionof premium smartphone devices in our upgrade mix, increased handsetcosts and an increase in the volume of subsidized upgrades reflectinga greater number of contract expiries
- Higher subscriber acquisition costs due to greater promotionalpricing driven by a highly competitive market, a larger proportion ofhigh-end smartphones in our sales mix, increased handset costs, alarger proportion of postpaid gross activations in our mix and a highernumber of gross activations
- The acquisition of MTS
- Increased network operating costs driven by higher LTE and LTE-Anetwork usage
- Higher labour costs to support the growth of the business
Bell Wireless adjusted EBITDAincreased by 9.1% in 2017, compared to last year, reflecting the flow-through of higher year-over-year operating revenues from the continued growth in our subscriber base and blended ARPU along with the contribution from the acquisition of MTS, offset in part by higher year-over-year operating expenses primarily driven by our increased investment in customer retention and acquisition, together with the incremental expense contribution from Bell MTS. Adjusted EBITDA margin, based on wireless operating service revenues, declined by 0.6 pts to 44.6%, in 2017, compared to 45.2% in the prior year.
BELL WIRELESS OPERATING METRICS
| | 2017 | | 2016 | | CHANGE | | % CHANGE | |
Blended ARPU ($/month) | 67.77 | | 65.46 | | 2.31 | | 3.5 | % |
Gross activations | 1,780,478 | | 1,654,882 | | 125,596 | | 7.6 | % |
Postpaid | 1,532,425 | | 1,408,030 | | 124,395 | | 8.8 | % |
Prepaid | 248,053 | | 246,852 | | 1,201 | | 0.5 | % |
Net activations | 333,084 | | 223,041 | | 110,043 | | 49.3 | % |
Postpaid | 416,779 | | 315,311 | | 101,468 | | 32.2 | % |
Prepaid | (83,695 | ) | (92,270 | ) | 8,575 | | 9.3 | % |
Blended churn % (average per month) | 1.36 | % | 1.44 | % | | | 0.08 | pts |
Postpaid | 1.19 | % | 1.25 | % | | | 0.06 | pts |
Prepaid | 3.17 | % | 3.13 | % | | | (0.04 | ) pts |
Subscribers(1) | 9,166,787 | | 8,468,872 | | 697,915 | | 8.2 | % |
Postpaid(1) | 8,418,650 | | 7,690,727 | | 727,923 | | 9.5 | % |
Prepaid(1) | 748,137 | | 778,145 | | (30,008 | ) | (3.9 | %) |
| (1) | As a result of the acquisition of MTS on March 17, 2017, our wireless subscriber base in Q1 2017 increased by 476,932 subscribers (418,427 postpaid). Subsequently, in Q2 2017, Bell’s wireless subscriber base reflected the divestiture of 104,833 postpaid subscribers to TELUS related to BCE’s acquisition of MTS. Bell’s wireless subscriber base in Q2 2017 also reflected the removal of 7,268 subscribers (2,450 postpaid and 4,818 prepaid) due to the decommissioning of the CDMA network in western Canada. |
Blended ARPUof $67.77 increased by 3.5% in 2017, compared to last year, driven by the greater proportion of postpaid customers in our total subscriber base, growth in postpaid ARPU reflecting the flow-through of 2016 pricing changes and a greater mix of customers with smartphones and other data devices in our total subscriber base increasing the demand for larger data plans due to greater data consumption from e-mail, web browsing, social networking, mobile banking, messaging, mobile TV, and entertainment services such as video streaming, music downloads and gaming. The growth in ARPU was also favourably impacted by greater data consumption driven by the higher speeds enabled by the continued expansion of our LTE and LTE-A networks. The year-over-year increase in blended ARPU was moderated by the negative impact of Telecom Decision CRTC 2016-171 along with the unfavourable impact of larger plans with higher data usage thresholds, unlimited local and long distance calling, and a greater mix of shared plans.
Total gross wireless activationsincreased by 7.6% in 2017, compared to last year, due to both higher postpaid and prepaid gross activations.
- Postpaid gross activationsincreased by 8.8% in 2017, reflecting ourleadership in technology and network speed, successful executionof targeted promotions across all our retail channels, greater marketactivity, the contribution from the acquisition of Bell MTS and theon-boarding of customers from a long-term mobile services contractwin with Shared Services Canada
- Prepaid gross activationsincreased by 0.5% in 2017, driven by thecontribution from the acquisition of Bell MTS and the launch of LuckyMobile in December 2017, our new low-cost prepaid mobile service
Blended wireless churnof 1.36% improved by 0.08 pts in 2017, compared to last year, due to lower postpaid churn, offset in part by higher prepaid churn.
- Postpaid churnof 1.19% improved by 0.06 pts in 2017, compared tolast year, due to the favourable impact of our ongoing investments innetwork speeds, customer retention and improved client experience
BCE Inc. 2017 ANNUAL REPORT 59 |
|
| | | | |
5 | MD&A | Bell Wireless | |
- Prepaid churnof 3.17% increased by 0.04 pts in 2017, due to thelower subscriber base outpacing the year-over-year favourabilityin the deactivations
Postpaid net activationsincreased by 32.2% in 2017, compared to 2016, driven by greater gross activations and the contribution from the acquisition of Bell MTS, offset in part by higher customer deactivations.
Prepaid net customer lossesimproved by 9.3% in 2017, compared to last year, driven by lower customer deactivations and higher gross activations.
Wireless subscribersat December 31, 2017 totaled 9,166,787, including the subscribers acquired through the acquisition of MTS, net of those divested to TELUS. The proportion of Bell Wireless customers subscribing to postpaid service increased to 92% in 2017 from 91% in 2016.
| COMPETITIVE LANDSCAPE AND INDUSTRY TRENDS |
COMPETITIVE LANDSCAPE
The wireless market is the largest sector of the Canadian telecommunications industry, representing over 50% of total revenues, and is currently growing at a mid-single digit rate annually.
There are more than 31 million wireless subscribers in Canada. The market is highly competitive among three well-established national competitors as well as a number of regional competitors. Rogers Communications Inc. (Rogers) holds the largest share by virtue of its legacy global system for mobile communications (GSM) network. However, Bell has had significant success winning subscribers as well as the largest proportion of industry revenue and adjusted EBITDA growth since 2009, supported by the launch of our HSPA+, 4G LTE and LTE-A networks, industry-leading mobile network speeds, expanded retail distribution, the purchase of Virgin Mobile, a strong brand and improved customer service.
In June 2017, the Western Canada-based cable TV company, Shaw Communications Inc. (Shaw), acquired 700 MHz and 2500 MHz spectrum licences from Québecor Media Inc. (Québecor) to support the build-out of an urban LTE network in major cities in Alberta, British Columbia and Ontario. Shaw reached an agreement with Apple Inc. enabling Shaw’s Freedom Mobile brand to offer iPhone products beginning in December 2017. Shaw’s re-farming of advanced wireless services-1 (AWS-1) spectrum and deployment of 2500 MHz spectrum is expected to be completed in 2018, and will make older smartphone versions (iPhones and Samsung Galaxy) compatible with Freedom Mobile’s LTE network. Québecor Media’s Vidéotron Ltée (Vidéotron) continues to operate as a regional facilities-based wireless service provider in Québec, and Eastlink in Atlantic Canada. These cable TV-based wireless providers, in addition to the provincial carrier in Saskatchewan, represent fourth carriers in their respective markets.
Canada’s wireless penetration was approximately 85% at the end of 2017, compared to well over 100% in the U.S. and even higher in Europe and Asia. Canada’s wireless sector is expected to continue growing at a steady pace for the foreseeable future, driven by immigration and population growth, the trend toward multiple devices, the increasing usage of data services, and mobile adoption by both younger and older generations.
- Large facilities-based national wireless service providers Rogers andTELUS Corporation
- Smaller facilities-based wireless service provider Freedom Mobile,which currently provides service in Toronto, Calgary, Vancouver,Edmonton and Ottawa, as well as in several communities insouthwestern Ontario
- Regional facilities-based wireless service providers Vidéotron, whichprovides service in Montréal and other parts of Québec; SaskatchewanTelecommunications Holding Corporation (SaskTel), which providesservice in Saskatchewan; and Eastlink, which launched service in NovaScotia and Prince Edward Island in February 2013
- Mobile virtual network operators (MVNOs), who resell competitors’wireless networks, such as PC Mobile
| Canadian wireless market share(1) |

| 60 BCE Inc. 2017 ANNUAL REPORT |
|
| | | | |
| | 5 | MD&A | Bell Wireless |
KEY WIRELESS METRICS – SHARE FOR NATIONAL CARRIERS(1)
POSTPAID NET ADDITIONS (%)

REPORTED EBITDA GROWTH (%)

SERVICE REVENUE GROWTH (%)

| (1) | Percentages may not add to 100 due to rounding. |
| (2) | Bell metrics shown include Bell Aliant as of 2015. |
| (3) | TELUS metrics shown include Public Mobile Inc. as of 2015. |
INDUSTRY TRENDS
ACCELERATING DATA CONSUMPTION
Wireless data growth continues to be driven by the ongoing adoption of higher-value smartphones and tablets, and associated data plans. The demand for wireless data services is expected to continue to grow, due to ongoing investment in faster network technologies, such as LTE and LTE-A, that provide a richer user experience, a larger appetite for mobile connectivity and social networking, greater selection of smartphones, tablets and other connected devices, as well as increasing adoption of shared plans with multiple devices by families. Greater customer adoption of data services, including mobile TV, data roaming for travel, mobile commerce, mobile banking, and other IoT applications in the areas of retail and transportation (connected car, asset tracking, and remote monitoring) should also contribute to growth. In the consumer market, IoT represents a growth area for the industry as wireless connectivity on everyday devices, from home automation to cameras, becomes ubiquitous.
SIGNIFICANT INVESTMENTS IN WIRELESS NETWORKS
Fast growth in mobile data traffic is increasingly putting a strain on wireless carriers’ networks and their ability to manage and service this traffic. Industry Canada’s 700 MHz, advanced wireless services-3 (AWS-3), and 2500 MHz spectrum auctions that concluded in 2014 and 2015 provided wireless carriers with prime spectrum to roll out faster next-generation wireless networks and build greater capacity. Carrier aggregation is a technology currently being employed by Canadian wireless carriers that allows for multiple channels of spectrum to be used together, thereby significantly increasing network capacity and data transfer rates. Investments in fibre backhaul to cell sites and the deployment of small-cell technology further increase the efficient utilization of carriers’ spectrum holdings.
CUSTOMERS BRINGING THEIR OWN DEVICES
With the CRTC’s Wireless Code limiting wireless contract terms to two years from three years, the number of customers on expired contracts has increased. As a result, subscribers are increasingly bringing their own devices or keeping their existing devices for longer periods of time and therefore may not enter into new contracts for wireless services. This may negatively impact carriers’ subscriber churn, but may also create gross addition opportunities as a result of increased churn from other carriers. Additionally, this trend may negatively impact the monthly service fees charged to subscribers; however, the service revenue generated by these customers helps improve margins due to lower spending on device subsidies.
| BUSINESS OUTLOOK AND ASSUMPTIONS |
2018 OUTLOOK
We expect continued revenue growth driven primarily by a greater number of postpaid subscribers and higher ARPU. We expect ARPU to continue to increase, but at a slower pace compared to 2017, as the market continues to mature and as more customers subscribe to rate plans with larger data thresholds. We will seek to achieve higher revenues from data growth, through increased use of our 4G LTE and LTE-A networks, higher demand for services such as social media, music and streaming of content, as well as nascent services including mobile commerce and other IoT applications. Our intention is to introduce new services to the market in a way that balances innovation with profitability.
We also remain focused on sustaining our market share of incumbent postpaid net additions in a disciplined and cost-conscious manner, while also growing our share of new industry prepaid net additions. We anticipate higher year-over-year net additions, driven by continued strong postpaid market momentum, reflecting Bell’s network speed and technology leadership; the onboarding of customers from our recently won Shared Services Canada wireless services contract; a renewed focus on prepaid with the launch of Lucky Mobile; and incremental growth opportunities in Manitoba with the full integration of Bell MTS.
We plan to deliver adjusted EBITDA growth in 2018 from continued healthy revenue growth, which should be partly offset by higher subscriber acquisition and retention spending consistent with a sustained high level of competitive market activity.
BCE Inc. 2017 ANNUAL REPORT 61 |
|
| | | | |
5 | MD&A | Bell Wireless | |
ASSUMPTIONS
- Maintain our market share of incumbent wireless postpaid net additions
- Continued adoption of smartphone devices, tablets and dataapplications, as well as the introduction of more 4G LTE and LTE-Adevices and new data services
- Higher subscriber acquisition and retention spending, driven byhigher handset costs and more customer device upgrades, reflectinga higher number of off-contract subscribers due to earlier expiriesunder two-year contracts
- Higher blended ARPU, driven by a higher postpaid smartphone mix,increased data consumption on 4G LTE and LTE-A networks, andhigher access rates
- Expansion of the LTE-A network coverage to approximately 92% ofthe Canadian population
- Ability to monetize increasing data usage and customer subscriptionsto new data services
- Ongoing technological improvements by handset manufacturers andfrom faster data network speeds that allow customers to optimizethe use of our services
- No material financial, operational or competitive consequences ofchanges in regulations affecting our wireless business
- Increasing Canadian wireless industry penetration
- Increasing customer adoption of smartphones, tablets and other 4GLTE devices to increase mobile data usage
- Greater number of postpaid customers on our 4G LTE and LTE-Anetworks
- Customer usage of new data applications and services
This section discusses certain principal business risks specifically related to the Bell Wireless segment. For a detailed description of the principal risks that could have a material adverse effect on our business, refer to section 9,Business risks.
| AGGRESSIVE COMPETITION RISK - The intensity of competitive activity fromincumbent wireless operators, newerwireless entrants, non-traditional playersand resellers
POTENTIAL IMPACT - Pressure on our adjusted EBITDA, ARPU,churn and cost of acquisition andretention would likely result if competitorsaggressively increase discounts forhandsets and price plans, offer sharedplans based on sophisticated pricingrequirements or offer other incentives,such as new data plans or unlimited dataplans, instalment plans for smartphonesor multi-product bundles, to attract newcustomers
| REGULATORY ENVIRONMENT RISK - Greater regulation of wireless servicesand pricing (e.g. the mandating ofwholesale roaming rates by the CRTCthat are materially different than thosewe have proposed, additional mandatedaccess to wireless networks andlimitations placed on future spectrumbidding)
POTENTIAL IMPACT - Greater regulation could limit ourflexibility, influence the market structure,improve the business positions ofour competitors and negatively impactthe financial performance of ourwireless business
| MARKET MATURITY AND INCREASED DEVICE COSTS RISK - Slower subscriber growth due to highCanadian smartphone penetration andincreased device costs
POTENTIAL IMPACT - A maturing wireless market andhigher device costs could challengesubscriber growth and the cost ofacquisition and retention, puttingpressure on the financial performanceof our wireless business
|
| 62 BCE Inc. 2017 ANNUAL REPORT |
|
| | | | |
| | 5 | MD&A | Bell Wireline |
Bell Wireline achieved positive adjusted EBITDA growth for a third consecutive year in 2017, driven by strong Internet and IPTV subscriber base growth, higher household ARPU, the financial contribution of Bell MTS and related integrated synergies, as well as operating cost savings that drove an improvement in our North American industry-leading margin to 41.8%.
| KEY ELEMENTS OF RELEVANT STRATEGIC IMPERATIVES |

Invest in broadband
networks and services
2017 PROGRESS
- Continued to expand our FTTP direct fibre footprint, reaching morethan 3.7 million homes and businesses in seven provinces, includingapproximately 60% of homes and businesses in the City of Toronto.
Forty percent of our long-term broadband fibre program wascompleted at the end of 2017. FTTP enables symmetrical Internetdownload and upload speeds of up to 1 Gbps and will enable thedelivery of even faster speeds in the future. - Began the build-out of broadband fibre directly to 1.1 million residencesand business locations throughout Montréal, representing thelargest-ever communications infrastructure project in Québec witha planned capital investment of $854 million. Montréal joins a growingnumber of centres across Québec that are fully wired with Bell fibre,including Québec City where fibre deployment was launched in 2012.By the end of 2017, Bell fibre reached approximately 40% of homesand businesses throughout the province of Québec, including 14% ofall locations in Montréal.
2018 FOCUS
- Expand FTTP broadband fibre footprint to approximately 4.5 milliontotal combined homes and commercial locations
- In February 2018, we announced the expansion of FTTP direct fibreconnections throughout the Greater Toronto and 905 geographicregion. Bell’s fibre plan will deliver Gigabit Internet speeds and otherbroadband Fibe service innovations to more than 1.3 million homesand businesses in the region.

Leverage
wireline momentum
2017 PROGRESS
- Maintained our position as Canada’s largest TV provider with2,832,300 subscribers, and increased our total number of IPTVsubscribers by 15.9% to 1,550,317
- Built on our position as the leading ISP in Canada with a high-speedInternet subscriber base of 3,790,141, up 9.0% over 2016, includingone million FTTP customers
- Launched Fibe Alt TV, Canada’s first widely available app-basedlive TV service, providing a completely new way to watch live andon-demand television. With no traditional TV STB required, Alt TVis accessed through the Fibe TV app and offers up to 500 live andon-demand channels on laptops, smartphones, tablets and Apple TV4th Generation.
- Continued to lead television innovation in Canada with ongoingenhancements to our IPTV service
- Fibe TV customers in Ontario and Québec can watch their PVRrecordings on the go on their tablets, smartphones and laptopswith the Fibe TV app
- Customers with 4K Whole Home PVR can access YouTube, in additionto CraveTV and Netflix
- Acquired AlarmForce (transaction completed on January 5, 2018), aCanadian leader in home security and monitoring services, as partof Bell’s strategic expansion in the fast-growing Connected Homemarketplace. Combining the assets and experience of AlarmForcewith Bell’s strength in networks, customer service and distribution willenable Bell to deliver the latest Connected Home services to customersin Ontario, Québec, Atlantic Canada and Manitoba.
BCE Inc. 2017 ANNUAL REPORT 63 |
|
| | | | |
5 | MD&A | Bell Wireline | |
- Partnered with Akamai Technologies Inc. (Akamai), a global leaderin content delivery and cloud services, to expand our portfolioof integrated web security solutions for business customers.Complementing Bell solutions to help businesses increase productivity,minimize risk, and maximize service differentiation, Akamai’s leadingcloud security, web performance, and media delivery productsstrengthen our ability to identify security threats, proactively preventattacks, and support customers in optimizing their online presence.
- Recognized by IDC Canada as a leader in delivering security servicesfor business customers. Bell was the only telecom company in IDC’sLeaders Category, which included large multinationals such as CGI,IBM and Deloitte. Evaluators noted that Bell’s extensive network enablesus to quickly leverage cyber threat intelligence to provide a completerange of advanced threat detection, mitigation and prevention services.
2018 FOCUS
- Continue to enhance our Fibe TV and Alt TV services with moreadvanced features
- In January 2018, we concluded a multi-year agreement with Ericssonto leverage its next generation, cloud-based MediaFirst TV platformto deliver an even more personalized and seamless multiscreen TVexperience for Fibe TV and Alt TV customers
- Maintain our leadership position in Canadian broadbandcommunications with the most advanced products in the home
- In January 2018, we launched Whole Home Wi-Fi, Canada’s firstWi-Fi service that brings smart and fast Wi-Fi to every room in thehome while adapting to changing user requirements. Bell partneredwith Plume to deliver new access points, called pods, that work withthe cloud-based networking intelligence of Bell’s Home Hub 3000modem to deliver a fully adaptive Wi-Fi service.
- Expand our total base and market share of TV and Internet subscribersprofitably
- Reduce total wireline residential net losses
- Increase residential household ARPU through greater multi-producthousehold penetration
- Increase share of wallet of large enterprise customers through greaterfocus on business service solutions and connectivity growth
- Increase the number of net new customer relationships in both largeand mid-sized businesses and reduce small business customer losses

Improve
customer service
2017 PROGRESS
- Improved the MyBell app, achieving a four-star rating on the AppleApp Store, and increased mobile transactions by 38% in 2017
- Reduced FTTH Residential Fibe TV installation time by 9% in 2017
- Reduced FTTH Residential Fibe TV repair truck rolls per customer by16% in 2017
- Offered Same Day repair appointments to 68% of small businesscustomers, an improvement of 94% since 2014
- Increased the number of self-serve transactions by 15% in 2017
2018 FOCUS
- Continue to invest in customer service initiatives to simplify complexityfor all customers, including billing
- Further reduce the total volume of customer calls to our call centres
- Further improve customer satisfaction scores
- Achieve better consistency in customer experience
- Continue to improve customer personalization
- Reduce FTTP installation times and improve service quality
- Deploy new diagnostic technology enabling enhanced troubleshootingand proactive service monitoring for our customers
- Simplify the technician in-field experience through simplification andinnovation of technician tools
- Improve troubleshooting and diagnostic processes to manageincreasing customer and device complexity

Achieve a competitive
cost structure
2017 PROGRESS
- Improved Bell Wireline adjusted EBITDA margin by 0.1 pts over 2016
- Realized operating cost synergies from the integration of MTS
- Delivered cost savings from ongoing service improvements andsavings related to the deployment of FTTP
2018 FOCUS
- Capture additional operating cost and capital expenditure synergiesfrom the integration of Bell MTS
- Deliver cost savings from workforce reductions, ongoing serviceimprovements, and savings related to the deployment of FTTP tosupport a stable consolidated adjusted EBITDA margin
| 64 BCE Inc. 2017 ANNUAL REPORT |
|
| | | | |
| | 5 | MD&A | Bell Wireline |
| FINANCIAL PERFORMANCE ANALYSIS |
2017 PERFORMANCE HIGHLIGHTS

| (1) | As a result of the acquisition of MTS on March 17, 2017, our high-speed Internet, TV and NAS subscriber bases increased by 229,470, 108,107 (104,661 IPTV) and 419,816 (223,663 residential and 196,153 business) subscribers, respectively. |
| (2) | Following a review of customer accounts by a wholesale reseller, we have adjusted our high-speed Internet subscriber base at the beginning of Q1 2017 to remove 3,751 non-revenue generating units. |
BELL WIRELINE RESULTS
REVENUES
| | 2017 | | 2016 | | $ CHANGE | | % CHANGE | |
Data | 7,146 | | 6,791 | | 355 | | 5.2 | % |
Local and access | 3,161 | | 3,089 | | 72 | | 2.3 | % |
Long distance | 639 | | 741 | | (102 | ) | (13.8 | %) |
Other services | 213 | | 182 | | 31 | | 17.0 | % |
Total external service revenues | 11,159 | | 10,803 | | 356 | | 3.3 | % |
Inter-segment service revenues | 198 | | 177 | | 21 | | 11.9 | % |
Total operating service revenues | 11,357 | | 10,980 | | 377 | | 3.4 | % |
Data | 519 | | 559 | | (40 | ) | (7.2 | %) |
Equipment and other | 527 | | 555 | | (28 | ) | (5.0 | %) |
Total external product revenues | 1,046 | | 1,114 | | (68 | ) | (6.1 | %) |
Inter-segment product revenues | 12 | | 10 | | 2 | | 20.0 | % |
Total operating product revenues | 1,058 | | 1,124 | | (66 | ) | (5.9 | %) |
Total Bell Wireline revenues | 12,415 | | 12,104 | | 311 | | 2.6 | % |
BCE Inc. 2017 ANNUAL REPORT 65 |
|
| | | | |
5 | MD&A | Bell Wireline | |
Bell Wireline operating revenuesgrew by 2.6% in 2017, compared to last year, driven by increases in data, local and access and other services revenue, offset in part by declines in long distance and product revenues.
Bell Wireline service revenuesincreased by 3.4% in 2017, compared to 2016, driven by the acquisitions of MTS and Q9, Internet and IPTV subscriber growth, coupled with higher household ARPU. This was offset in part by the ongoing erosion in our voice, satellite TV and legacy data services, together with greater customer acquisition, retention and bundle discounts to match aggressive offers from cable competitors. Regulatory pressures due to unfavourable CRTC rulings in 2016 relating to Internet tariffs for aggregated wholesale high-speed access services and Telecom Decision CRTC 2016-171 also unfavourably impacted service revenue growth.
- Data revenuesincreased by 5.2% in 2017, compared to 2016, dueto the acquisition of MTS, Internet and IPTV subscriber growth, andhigher ARPU driven by residential rate increases and larger data usageInternet rate plans, greater business solutions services driven by theacquisition of Q9 and IP-based services growth. This was moderatedby the continued decline in our satellite TV subscriber base, ongoinglegacy data erosion due in part to migrations to IP-based servicesand competitive pricing pressures within our business and wholesalemarkets, as well as greater acquisition, retention and bundle discountson residential Internet and TV services due to aggressive offers fromcable competitors. Unfavourable CRTC regulatory impacts relatingto lower revised interim rates for aggregated wholesale high-speed Internet access services and Telecom Decision CRTC 2016-171 furtherpressed data revenues.
- Local and access revenuesincreased by 2.3% in 2017, comparedto prior year, attributable to the acquisition of MTS and residentialrate increases, partially offset by continued NAS line erosion fromtechnological substitution to wireless and Internet-based services,large business customer conversions to IP-based data services,competitive pricing pressures and the negative impact from TelecomDecision CRTC 2016-171.
- Long distance revenuesdecreased by 13.8% in 2017, compared tolast year, reflecting fewer minutes of use by residential and businesscustomers as a result of NAS line erosion, technology substitution towireless and OTT Internet-based services, continued rate pressuresin our residential market from customer adoption of premium rateplans and reduced sales of international long distance minutes inour wholesale market, offset in part by the contribution from theacquisition of MTS
- Other services revenuesincreased by 17.0% in 2017, compared to2016, primarily driven by the contribution from the acquisition of MTS
Bell Wireline product revenuesdeclined by 5.9% in 2017, compared to prior year, driven by lower demand for equipment by large business customers, attributable to market softness and competitive pricing pressures, as well as lower sales of consumer electronics at The Source, partly offset by the favourable contribution from the MTS acquisition.
OPERATING COSTS AND ADJUSTED EBITDA
| | 2017 | | 2016 | | $ CHANGE | | % CHANGE | |
Operating costs | (7,229 | ) | (7,062 | ) | (167 | ) | (2.4 | %) |
Adjusted EBITDA | 5,186 | | 5,042 | | 144 | | 2.9 | % |
Adjusted EBITDA margin | 41.8 | % | 41.7 | % | | | 0.1 | pts |
Bell Wireline operating costsincreased by 2.4% in 2017, compared to 2016, attributable to:
- The acquisitions of MTS and Q9
- Higher programming costs in our TV business due to the growth inour subscriber base and contractual rate increases
- Increased fleet expenses from higher fuel and refurbishment costs
- Greater marketing and sales expense in our residential market tosupport subscriber acquisitions
These factors were partially offset by:
- Lower labour costs attributable to workforce reductions and vendorcontract savings, as well as fewer call volumes to our customerservice centres
- Reduced cost of goods sold resulting from lower product sales
- Lower payments to other carriers driven by fewer sales of internationallong distance minutes
- Reduced bad debt expense
Bell Wireline adjusted EBITDAincreased by 2.9% in 2017, compared to 2016, and the adjusted EBITDA margin increased to 41.8% in 2017 compared to the 41.7% achieved last year. The year-over-year growth in adjusted EBITDA was driven by:
- The contribution from the MTS and Q9 acquisitions
- Ongoing growth from our Internet and IPTV businesses in a highlycompetitive environment
- Effective cost management
These factors were partially offset by:
- The continued erosion of voice, satellite TV and legacy data revenues,reflecting ongoing competitive repricing and reduced customerspending in our business market
- Unfavourable CRTC regulatory rulings from 2016 relating to Internettariffs for aggregated wholesale high-speed access services andTelecom Decision CRTC 2016-171
BELL WIRELINE OPERATING METRICS
DATA
High-speed Internet
| | 2017 | | 2016 | | CHANGE | | % CHANGE | |
High-speed Internet net activations | 87,860 | | 85,099 | | 2,761 | | 3.2 | % |
High-speed Internet subscribers(1) (2) | 3,790,141 | | 3,476,562 | | 313,579 | | 9.0 | % |
| (1) | As a result of the acquisition of MTS on March 17, 2017, our high-speed Internet subscriber base increased by 229,470. |
| (2) | Following a review of customer accounts by a wholesale reseller, we adjusted our high-speed Internet subscriber base at the beginning of Q1 2017 to remove 3,751 non-revenue generating units. |
| 66 BCE Inc. 2017 ANNUAL REPORT |
|
| | | | |
| | 5 | MD&A | Bell Wireline |
High-speed Internet subscriber net activationsincreased by 3.2% in 2017, compared to 2016, driven by higher retail gross activations particularly in our FTTH footprint, ramp up in activations from Home Internet service by Virgin Mobile which launched in July 2016, richer promotional offers, a reduced number of retail customers coming off promotional offers and growth from our small business market. Thiswas partly offset by increased residential churn driven by aggressive offers from cable competitors and competitive pressures in our wholesale market.
High-speed Internet subscribersat December 31, 2017 totaled 3,790,141, up 9.0% from the end of last year, including the subscribers acquired from MTS.
TV
| | 2017 | | 2016 | | CHANGE | | % CHANGE | |
Net subscriber (losses) activations | (20,716 | ) | 6,413 | | (27,129 | ) | (423.0 | %) |
IPTV | 107,712 | | 155,153 | | (47,441 | ) | (30.6 | %) |
Total subscribers(1) | 2,832,300 | | 2,744,909 | | 87,391 | | 3.2 | % |
IPTV(1) | 1,550,317 | | 1,337,944 | | 212,373 | | 15.9 | % |
| (1) | As a result of the acquisition of MTS on March 17, 2017, our TV subscriber base increased by 108,107 (104,661 IPTV). |
IPTV net subscriber activationsdecreased by 30.6% in 2017, compared to last year, driven by higher deactivations due to aggressive residential offers for service bundles from cable competitors, a greater number of retail customers coming off promotional offers, the impact of maturing Fibe TV markets, reduced footprint expansion in 2017, increased substitution of traditional TV services with OTT services, along with fewer customer migrations from satellite TV. This was mitigated in part by higher activations due to the launch of Fibe Alt TV on May 15, 2017, our application based live TV streaming service, and greater gross activations, particularly in our FTTH footprint.
Satellite TV net customer lossesimproved by 13.7% in 2017, compared to 2016, driven by lower residential deactivations attributable to a more mature subscriber base, a reduced number of customers coming off promotional offers and fewer migrations to IPTV, offset in part by aggressive residential promotional offers from cable competitors.
Total TV net subscriber activations(IPTV and satellite TV combined) declined by 27,129, compared to 2016, due to lower IPTV net activations, partly offset by fewer satellite TV net losses.
IPTV subscribersat December 31, 2017 totaled 1,550,317, up 15.9% from 1,337,944 subscribers reported at the end of 2016, including the subscribers acquired from MTS.
Satellite TV subscribersat December 31, 2017 totaled 1,281,983, down 8.9% from 1,406,965 subscribers at the end of last year, including the subscribers acquired from MTS.
Total TV subscribers(IPTV and satellite TV combined) at December 31, 2017 were 2,832,300, representing a 3.2% increase since the end of 2016, including the subscribers acquired from MTS.
LOCAL AND ACCESS
| | 2017 | | 2016 | | CHANGE | | % CHANGE | |
NAS LINES | | | | | | | | |
Residential(1) | 3,231,308 | | 3,249,739 | | (18,431 | ) | (0.6 | %) |
Business(1) | 3,089,175 | | 3,007,993 | | 81,182 | | 2.7 | % |
Total | 6,320,483 | | 6,257,732 | | 62,751 | | 1.0 | % |
NAS NET LOSSES | | | | | | | | |
Residential | (242,094 | ) | (283,993 | ) | 41,899 | | 14.8 | % |
Business | (114,971 | ) | (131,415 | ) | 16,444 | | 12.5 | % |
Total | (357,065 | ) | (415,408 | ) | 58,343 | | 14.0 | % |
| (1) | As a result of the acquisition of MTS on March 17, 2017, our NAS subscriber base increased by 419,816 (223,663 residential and 196,153 business) subscribers. |
NAS net lossesimproved by 14.0% in 2017, compared to 2016, due to both lower residential and business net losses.
Residential NAS net lossesimproved by 14.8% in 2017, compared to last year, driven by greater acquisition of three-product households, increased pull-through from our IPTV service bundle offers, as well as lower customer deactivations, reflecting a reduced number of retail customers coming off of promotional offers. This was offset in part by aggressive competitive offers from cable TV providers, ongoing wireless and Internet-based technology substitution and the inclusion of Bell MTS net losses.
Business NAS net lossesdecreased by 12.5% in 2017, compared to prior year, as a result of fewer net losses in our small business market, together with lower competitive losses in our wholesale market. This was offset in part by higher net losses in our large business market, driven by greater customer wins in 2016, reduced demand for new access lines and increased migrations to IP-based services, mitigated in part by fewer competitive losses.
NAS subscribersat December 31, 2017 totaled 6,320,483, representing a 1.0% increase compared to the 6,257,732 subscribers reported at the end of 2016, including the subscribers acquired from MTS. This was a significant improvement over the 6.4% subscriber base decrease experienced in 2016.
BCE Inc. 2017 ANNUAL REPORT 67 |
|
| | | | |
5 | MD&A | Bell Wireline | |
| COMPETITIVE LANDSCAPE AND INDUSTRY TRENDS |
COMPETITIVE LANDSCAPE
The financial performance of the overall Canadian wireline telecommunications market continues to be impacted by the ongoing declines in legacy voice service revenues resulting from technological substitution to wireless and OTT services, as well as by ongoing conversion to IP-based data services and networks by large business customers. Sustained competition from cable companies also continues to erode traditional telephone providers’ market share of residential local telephony. Canada’s four largest cable companies had approximately four million telephony subscribers at the end of 2017, representing a national residential market share of approximately 45%. Other non-facilities-based competitors also offer local and long distance VoIP services and resell high-speed Internet services.
Although the residential Internet market is maturing, with over 88% penetration across Canada, subscriber growth is expected to continue over the next several years. At the end of 2017, the four largest cable companies had approximately 6.7 million Internet subscribers, representing 54% of the total Internet market based on publicly reported data(1), while incumbent local exchange carriers (ILECs) held the remaining 46% or 5.8 million subscribers. Bell continues to make market share gains due to the expansion of our fibre optic network and the pull-through of subscribers from our IP-based Fibe TV and Alt TV services.
While Canadians still watch traditional TV, digital platforms are playing an increasingly important role in the broadcasting industry. Popular online video services are providing Canadians with more choice about where, when and how to access their video content. In 2017, ILECs offering IPTV service grew their subscriber bases by 6% to reach 2.7 million customers, driven by expanded network coverage, enhanced service offerings, and marketing and promotions focused on IPTV. This growth came at the expense of cable TV and DTH satellite TV subscriber losses. At the end of the year, Canada’s four largest cable companies had approximately 5.8 million TV subscribers, or a 55% market share, consistent with 55% at the end of 2016.
In 2017, our primary cable TV competitors, Rogers and Vidéotron, announced agreements with global media and technology company Comcast to adopt Comcast’s XFINITY X1 video platform for future commercial deployment. Our IP-based Fibe TV platform continues to have numerous service leadership advantages over this cable platform, including: flexible pricing, plans and packaging available to all customers; picture clarity and quality; content depth and breadth, including 4K content, as well as more HD, video on demand, sports, multicultural and OTT content, such as 4K Netflix and YouTube; and the number of ways customers can access content, including wireless STBs, Restart TV, higher capacity PVR and the Fibe TV app.
- Cable TV providers offering cable TV, Internet and cable telephony services, including:
- Rogers in Ontario, New Brunswick, Newfoundland and Labrador
- Vidéotron in Québec
- Cogeco Cable Inc. (a subsidiary of Cogeco Inc.) (Cogeco) in Ontario and Québec
- Shaw in British Columbia, Alberta, Saskatchewan, Manitoba and Ontario
- Shaw Direct, providing DTH satellite TV service nationwide
- Eastlink in every province except Saskatchewan, where it does not provide cable TV andInternet service
- TELUS provides residential voice, Internet and IPTV services in British Columbia, Alberta andEastern Québec
- TELUS and Allstream Inc. provide wholesale products and business services across Canada
- Various others (such as TekSavvy Solutions, Distributel, VMedia, and Vonage Canada (adivision of Vonage Holdings Corp.) (Vonage)) offer resale or VoIP-based local, long distanceand Internet services
- OTT voice and video services such as Skype, Netflix, Amazon Prime Video and YouTube
- Digital media streaming devices such as Apple TV, Roku and Google Chromecast
- Other Canadian ILECs and cable TV operators
- Substitution to wireless services, including those offered by Bell
- Customized managed outsourcing solutions competitors, such as systems integrators CGI,EDS (a division of HP Enterprise Services) and IBM
- Wholesale competitors include cable operators, domestic CLECs, U.S. or other internationalcarriers for certain services, and electrical utility-based telecommunications providers
- Competitors for home security range from local to national companies, such as ADT, ChubbSecurity, Stanley Security, Fluent and MONI Smart Security

| (1) | Internet services provided by resellers are included as wholesale Internet subscribers for cable companies and ILECs. |
| 68 BCE Inc. 2017 ANNUAL REPORT |
|
| | | | |
| | 5 | MD&A | Bell Wireline |
INDUSTRY TRENDS
INVESTMENT IN BROADBAND FIBRE DEPLOYMENT
The Canadian ILECs continue to make substantial investments in deploying broadband fibre within their territories, with a focus on direct FTTP access to maintain and enhance their ability to support enhanced IP-based services and higher broadband speeds. Cable TV companies continue to evolve their cable networks with the gradual roll-out of the DOCSIS 3.1 platform. Although this platform increases speeds in the near term and is cost-efficient, it does not offer the same advanced capabilities as FTTP over the longer term. FTTP delivers broadband speeds of up to 1 Gbps currently, with faster speeds expected in the future as equipment evolves to support these higher speeds. Going forward, ILECs are expected to maintain high levels of capital spending for the ongoing expansion of their broadband fibre networks, with an increasing emphasis on upgrading current FTTN networks to FTTP.
ALTERNATIVE TV AND OTT SERVICES
The growing popularity of watching TV and on-demand content anywhere, particularly on handheld devices, is expected to continue as customers adopt services that enable them to view content on multiple screens. Streaming media providers, such as Netflix and Amazon Prime Video, continue to enhance OTT streaming services in order to compete for share of viewership in response to evolving viewing habits and consumer demand. TV providers are monitoring OTT developments and evolving their content and market strategy to compete with these non-traditional offerings. We view OTT as an opportunity to add increased capabilities to our linear and on-demand assets, provide customers with flexible options to choose the content they want and drive greater usage of Bell’s high-speed Internet and wireless networks. We continue to enhance our Fibe TV service with additional content and capabilities, including 4K Ultra HD content, the ability to watch recorded content on the go and access to Netflix and YouTube on STBs. Bell also launched Canada’s first widely available app-based live TV service called Fibe Alt TV to address the growing cord-cutting and cord-shaving markets with the ability to consume live and on-demand content on laptops, smartphones, tablets and Apple TV without the need for a traditional TV STB.
TECHNOLOGY SUBSTITUTION
Technology substitution, enabled by the broad deployment of higher speed Internet; the pervasive use of e-mail, messaging and social media as alternatives to voice services; and the growth of wireless and VoIP services, continues to drive legacy voice revenue declines for telecommunications companies. Wireless-only households were estimated to represent approximately 43% of households in Ontario, Québec and Atlantic Canada at the end of 2017, compared to approximately 38% at the end of 2016, while the disconnection of and reduction in spending for traditional TV (cord-cutting and cord-shaving) continues to rise. Although Bell is a key provider of these substitution services, the decline in this legacy business continues as anticipated.
ADOPTION OF IP-BASED SERVICES
The convergence of IT and telecommunications, facilitated by the ubiquity of IP, continues to shape competitive investments for business customers. Telecommunications companies are providing professional and managed services, as well as other IT services and support, while IT service providers are bundling network connectivity with their software as service offerings. In addition, manufacturers continue to bring all-IP and converged (IP plus legacy) equipment to market, enabling ongoing migration to IP-based solutions. The development of IP-based platforms, which provide combined IP voice, data and video solutions, creates potential cost efficiencies that compensate, in part, for reduced margins resulting from the continuing shift from legacy to IP-based services. The evolution of IT has created significant opportunities for our business markets services, such as cloud services and data hosting, that can have a greater business impact than traditional telecommunications services.
| BUSINESS OUTLOOK AND ASSUMPTIONS |
2018 OUTLOOK
We expect positive revenue and adjusted EBITDA growth in 2018. This reflects a full year of Bell MTS financial contribution compared to approximately nine months in 2017; a stronger broadband Internet and TV subscriber trajectory supported by a fast-growing direct fibre service footprint, mass-market Fibe advertising launch in Toronto, scaling of Alt TV and new innovative features enabled by the new MediaFirst IPTV platform; annual residential price increases; improving year-over-year organic business markets performance; as well as cost reductions to counter competitive repricing pressures and the ongoing decline in voice revenues. With respect to the acquisition of AlarmForce, while helpful in advancing Bell’s expansion in the fast-growing Connected Home marketplace, it is too small financially to have any material impact on overall wireline financial results and growth rates in 2018.
TV subscriber growth within our wireline footprint is expected to be driven by continued strong customer adoption of Fibe TV as we increase penetration of existing IPTV-enabled neighbourhoods and drive ongoing innovation in IPTV services. We also intend to seek greater penetration within the multiple-dwelling units (MDU) market, capitalize on our extensive retail distribution network, and leverage our market leadership position in HD and 4K programming and on-demand streaming services to drive incremental subscriber growth and higher revenue per household. Although satellite TV net customer losses will continue in 2018, as a result of aggressive residential promotional offers from cable competitors, they are expected to moderate, due to fewer residential deactivations reflecting a more mature and geographically better suited subscriber base for satellite TV service and reduced customer migrations to IPTV.
BCE Inc. 2017 ANNUAL REPORT 69 |
|
| | | | |
5 | MD&A | Bell Wireline | |
Planned Internet subscriber base growth in 2018 is expected to be driven by a growing FTTP service footprint that enables faster Internet speeds and broadband innovation such as smart Whole Home Wi-Fi that ensures stronger signals, as well as by the pull-through of IPTV customer activations, including from Bell’s new app-based live TV streaming service Alt TV. This is expected to have an associated positive impact on household ARPU growth and residential customer churn.
In wireline business, although the economy is slowly rebounding, customers continue to look for opportunities to lower costs. As a result, telecom spending by large enterprise customers is expected to be variable and improve at a modest pace. This, combined with ongoing customer migration to IP-based systems and demand for cheaper bandwidth alternatives with faster speeds, will likely continue to negatively impact overall business markets results in 2018. We intend on seeking to minimize the overall revenue decline from legacy services by leveraging our market position to develop unique services and value enhancements, which further improve client experience by providing more features with improved flexibility to support client needs on demand. We intend to use marketing initiatives to slow NAS erosion, while investing in direct fibre expansion and new solutions in key portfolios such as Internet and private networks, data centre and cloud services, unified communications, and security services. We will continue to deliver network-centric managed and professional services solutions to large and mid-sized businesses that increase the value of connectivity services. Moreover, our acquisition of Q9 in October 2016 has strengthened our service offerings in data hosting, managed services and cloud computing solutions, allowing us to capture improved financial benefits, while enhancing our ability to achieve a higher pull-through of connectivity revenue.
We also expect to experience sustained competitive intensity in our mass and mid-sized business markets as cable operators and other telecom competitors maintain their focus on these customer segments. We also intend to introduce service offerings that help drive innovative solutions and value for our mass and mid-sized customers by leveraging Bell’s network assets, broadband fibre expansion and service capabilities to expand our relationships with them. We will maintain a focus on overall profitability by seeking to increase revenue per customer and customer retention, as well as through improving our processes to achieve further operating efficiencies and productivity gains.
Operating cost reduction will continue to be a key focus for our Bell Wireline segment, helping to offset costs related to the growth and retention of IPTV, Internet, IP broadband and hosted IP voice subscribers, the ongoing erosion of high-margin wireline voice and other legacy revenues, as well as competitive repricing pressures in our residential, business and wholesale markets. This, combined with further service-level improvements and operating synergies from the integration of Bell MTS, is expected to support our objective of maintaining our consolidated adjusted EBITDA margin relatively stable year over year.
We also plan to increase capital investment in broadband fibre expansion to more homes and commercial locations, upgrades to support our IPTV and residential Internet services, as well as new business solutions in key portfolios such as Internet and private networks, data centre and cloud services, unified communications and security services. We intend to pursue pricing methods that will assist us in covering the capital costs of upgrading our networks, providing new services and expanding capacity to meet growing data consumption.
ASSUMPTIONS
- Positive full-year adjusted EBITDA growth
- Continued growth in residential IPTV and Internet subscribers
- Increasing wireless and Internet-based technological substitution
- Residential services household ARPU growth from increasedpenetration of multi-product households and price increases
- Aggressive residential service bundle offers from cable TV competitorsin our local wireline areas
- Continued large business customer migration to IP-based systems
- Ongoing competitive repricing pressures in our business and wholesalemarkets
- Continued competitive intensity in our small and mid-sized businessmarkets as cable operators and other telecom competitors continueto intensify their focus on business customers
- Traditional high-margin product categories challenged by largeglobal cloud and OTT providers of business voice and data solutionsexpanding into Canada with on-demand services
- Ongoing deployment of direct fibre and growing consumption of OTTTV services and on-demand streaming video, as well as the proliferationof devices, such as tablets, that consume vast quantities of bandwidth,will require considerable ongoing capital investment
- Accelerating customer adoption of OTT services resulting in downsizingof TV packages
- Realization of cost savings related to management workforce attritionand retirements, lower contracted rates from our suppliers, reductionof traffic that is not on our network and operating synergies from theintegration of MTS
- No material financial, operational or competitive consequences ofchanges in regulations affecting our wireline business
| 70 BCE Inc. 2017 ANNUAL REPORT |
|
| | | | |
| | 5 | MD&A | Bell Wireline |
- Expanding FTTP footprint
- Increasing IPTV penetration of households
- Higher market share of industry TV and Internet subscribers
- Greater penetration of multi-product households
- Improved residential customer retention
- Increased business customer spending on connectivity services andmanaged and professional services solutions, as well as greater newbusiness formation as the economy strengthens and employmentrates improve
- Expansion of our business customer relationships to drive higherrevenue per customer
- Ongoing service innovation and product value enhancements
This section discusses certain principal business risks which specifically affect the Bell Wireline segment. For a detailed description of the principal risks that could have a material adverse effect on our business, refer to section 9,Business risks.
| AGGRESSIVE COMPETITION RISK - The intensity of competitive activitycoupled with new product launches(e.g. IoT, connected home systems anddevices, newer TV platforms, etc.) fromincumbent operators, cable companies,non-traditional players and wholesalers
POTENTIAL IMPACT - An increase in the intensity level ofcompetitive activity could result inhigher churn, increased acquisitionand retention expenses, and increaseduse of promotional competitive offersto acquire and keep customers, allof which would put pressure on BellWireline’s adjusted EBITDA
| REGULATORY ENVIRONMENT RISK - The CRTC mandates rates for the newdisaggregated wholesale high-speedaccess service available on FTTP facilitiesthat are materially different from therates we proposed, and which do notsufficiently account for the investmentrequired in these facilities
POTENTIAL IMPACT - The mandating of rates for the newdisaggregated wholesale high-speedaccess service available on FTTP facilitiesthat are materially different from therates we proposed could improve thebusiness position of our competitorsand change our investment strategy,especially in relation to investment innext-generation wireline networks insmaller communities and rural areas
| CHANGING CUSTOMER BEHAVIOUR RISK - The traditional TV viewing model(i.e. the subscription for bundledchannels) is challenged by an increasingnumber of legal and illegal viewingoptions available in the market offeredby traditional, non-traditional andglobal players, as well as developingcord-cutting and cord-shaving trends
- Changing customer habits furthercontribute to the erosion of NAS lines
POTENTIAL IMPACT - Our market penetration and number ofTV subscribers could decline as a resultof broadcasting distribution undertaking(BDU) offerings and an increasing numberof domestic and global unregulated OTTproviders. The proliferation of IP-basedproducts, including OTT content offeringsdirectly to consumers, may acceleratethe disconnection of TV services or thereduction of TV spending
- The ongoing loss of NAS lines fromtechnological substitution to wirelessand Internet-based services and largebusiness customer conversions toIP-based data services challenge ourtraditional voice revenues and compelus to develop other service offerings
|
BCE Inc. 2017 ANNUAL REPORT 71 |
|
| | | | |
5 | MD&A | Bell Media | |
Bell Media maintained industry leadership in TV and radio even as overall financial performance in 2017 was impacted by general softness in the TV advertising market, viewership decline for traditional linear TV, an ongoing shift in customer spending to online services, as well as escalating programming and content costs.
| KEY ELEMENTS OF RELEVANT STRATEGIC IMPERATIVES |

Expand
media leadership
2017 PROGRESS
- Maintained CTV’s #1 ranking as the most-watched television networkin Canada for the 16th year in a row, and continued to lead with amajority of the top 20 programs nationally in all key demographics
- Entered into an agreement with Corus to acquire French-languagespecialty channels Séries+ and Historia, further enhancing ourcompetitiveness in the Québec media landscape. Séries+ is a fictionchannel, offering locally produced dramas as well as foreign series.Historia broadcasts a suite of locally produced original content includingdocumentaries, reality series and drama series. The transaction issubject to approval by the CRTC and the Competition Bureau.
- Grew CraveTV viewership to approximately 1.3 million subscribersat the end of 2017
- Signed an agreement to acquire four FM radio stations in Ontariofrom Larche. Pending completion of the transaction, which alreadyreceived CRTC approval, the addition of these stations to Bell Media’sexisting 105 iHeartRadio Canada properties will broaden the network’sindustry-leading reach across the country
- TMN, HBO Canada and TMN Encore launched an offline viewing featureon the TMN GO video-streaming platform, allowing subscribers todownload movies and series on their iOS and Android tablets andsmartphones for playback without an Internet connection
- Launched an enhanced iHeartRadio Canada app featuring more than1,000 live radio stations of every genre from across North America,with availability on additional platforms including Apple Watch, AppleCarPlay, Android Wear, Android Auto and Sonos
- Concluded a comprehensive multi-year regional broadcast rightsagreement with the Montreal Canadiens making TSN the officialEnglish-language regional broadcaster of the team beginning withthe 2017-18 season. The agreement sees TSN air a slate of games inthe Montreal Canadiens’ designated broadcast region, which spansEastern and Northern Ontario, Québec, and Atlantic Canada. RDScontinues to be the French-language home for regional MontrealCanadiens games
- Concluded a multi-year rights agreement extension with the NFL thatmakes Bell Media the exclusive TV broadcast partner of the NFL inCanada. The partnership also features expanded digital opportunitieswhich include syndication rights for NFL highlights in Canada, aswell as expanded footage and programming rights to further bolsterBell Media’s non-game NFL-focused content.
- Reached a multi-year media rights extension with NASCAR, with TSNand RDS retaining exclusive Canadian media rights to all MonsterEnergy NASCAR Cup Series and NASCAR Xfinity Series races acrossall platforms. The multi-platform agreement features expanded digitalrights, with TSN and RDS delivering comprehensive coverage of theseNASCAR series across the networks’ digital and social media platforms.
- Announced a strategic partnership with Wow to produce kids andyouth entertainment
- Astral, in partnership with Toronto Pearson International Airport,introduced two new large-format digital superboards in close proximityto the country’s largest airport. The new structures provide informationabout the airport while offering an advertising opportunity reachingmillions of commuters and passengers annually. The four faces ofthe new advertising structures deliver a daily circulation of closeto 800,000.
- Astral launched a new and unique programmatic solution for largeformat digital inventory using an exclusive self-serve platform, enablingclients to use audience targeting previously only available online
2018 FOCUS
- Maintain strong audience levels and ratings across all TV and radioproperties
- Reinforce industry leadership in conventional TV, pay TV, sportsmedia and radio
- In January 2018, we concluded a long-term agreement with Lionsgateto bring premium U.S. pay TV platform Starz to Canada and distributethe first pay window of Lionsgate’s future theatrical releases in theterritory. Starz and Bell Media will also rebrand pay TV channel TMNEncore in early 2019.
- Grow viewership and scale of CraveTV on-demand TV streamingservice
- In January 2018, we announced that CraveTV’s HBO offering wouldexpand throughout 2018 with the addition of Game of Thrones, Girls,The Leftovers, Silicon Valley, Vice Principals, Ballers, Insecure andThe Young Pope
| 72 BCE Inc. 2017 ANNUAL REPORT |
|
| | | | |
| | 5 | MD&A | Bell Media |
- Develop in-house production and content creation for distributionand use across all screens and platforms
- Expand live and on-demand content through TV Everywhere services
- Build on our OOH leadership position in Canada
- Grow French media properties
- Leverage cross-platform and integrated sales and sponsorship
- Grow revenues through unique partnerships and strategic contentinvestments
- In January 2018, we partnered with Bloomberg Media to create BNNBloomberg, Canada’s leading multi-platform business news brand.
Expected to launch in Spring 2018, BNN Bloomberg will provideaudiences and advertisers with an unparalleled suite of productsacross digital, television and radio, targeting Canada’s businessdecision makers
- In February 2018, we launched Snackable TV, a mobile-first, short-formvideo app delivering premium and shareable entertainment targetedat viewers looking to consume snack-size pieces of content, featuringexclusive content from HBO, Comedy Central, Etalk and more

Achieve a competitive
cost structure
2018 FOCUS
- Optimize operating cost structure to align with revenue results
| FINANCIAL PERFORMANCE ANALYSIS |
2017 PERFORMANCE HIGHLIGHTS

BELL MEDIA RESULTS
REVENUES
| | 2017 | | 2016 | | $ CHANGE | | % CHANGE | |
Total external revenues | 2,676 | | 2,685 | | (9 | ) | (0.3 | %) |
Inter-segment revenues | 428 | | 396 | | 32 | | 8.1 | % |
Total Bell Media revenues | 3,104 | | 3,081 | | 23 | | 0.7 | % |
BCE Inc. 2017 ANNUAL REPORT 73 |
|
| | | | |
5 | MD&A | Bell Media | |
Bell Media operating revenuesincreased by 0.7% in 2017, compared to 2016, driven by higher subscriber revenues, offset in part by lower advertising revenues.
Subscriber revenuesgrew in 2017, compared to last year, mainly due to the growth in our subscriber base from our TV Everywhere GO Products and CraveTV, rate increases on contract renewals with TV distributors and the benefit from the expansion of TMN into a national pay TV service in March 2016.
Advertising revenuesdecreased in 2017, compared to 2016, reflecting continued market softness and declines in audience levels, which unfavourably impacted advertising revenues across both conventional and specialty TV and radio media platforms. The CRTC’s decision to eliminate simultaneous substitution for the NFL Super Bowl also contributed to the year-over-year decline in advertising revenues. These pressures were moderated by growth in OOH advertising revenues as a result of the contribution from newly awarded contracts and the Cieslok Media acquisition in January 2017, as well as by higher year-over-year revenues from digital properties.
OPERATING COSTS AND ADJUSTED EBITDA
| | 2017 | | 2016 | | $ CHANGE | | % CHANGE | |
Operating costs | (2,388 | ) | (2,338 | ) | (50 | ) | (2.1 | %) |
Adjusted EBITDA | 716 | | 743 | | (27 | ) | (3.6 | %) |
Adjusted EBITDA margin | 23.1 | % | 24.1 | % | | | (1.0 | ) pts |
Bell Media operating costsincreased by 2.1% in 2017, compared to last year, mainly due to higher programming and content costs primarily related to the ongoing ramp up of content for CraveTV and pay TV services, deal renewals for specialty TV programming, content costs associated with TMN national expansion, escalating sports rights costs, greater expenses resulting from the Cieslok Media acquisition and the execution of newly awarded contracts in OOH. This was partially mitigated by reduced labour costs driven mainly by workforce reductions.
Bell Media adjusted EBITDAdecreased by 3.6% in 2017, compared to the previous year, due to escalating programming and content costs and flow-through of the advertising revenue decline which included the unfavourable impact of the CRTC’s decision to eliminate simultaneous substitution for the NFL Super Bowl. This was moderated by continued growth in subscriber revenues and lower labour costs.
BELL MEDIA OPERATING METRICS
- CTV maintained its #1 ranking as the most-watched network in Canadafor the 16th year in a row, and continued to lead with a majority of thetop 20 programs nationally in all key demographics
- Bell Media’s English specialty and pay TV properties reached 82% of allCanadian English specialty and pay TV viewers on an average weeklybasis in 2017. Four of the top 10 Canadian English commercial specialtychannels among viewers aged 25 to 54 are Bell Media properties (TSN,Space, Discovery and CP24).
- In Québec, Bell Media maintained its leadership position in the Frenchspecialty and pay TV market, reaching 72% of French-language TVviewers in the average week. Half of the Top 10 French specialty andpay channels among the key viewers aged 25 to 54 were Bell Mediaproperties (RDS, Super Écran, Canal D, Canal Vie and Z).
- Bell Media continued to rank first in digital media among Canadianbroadcast and video network competitors, and sixth among onlineproperties in the country, with 18.9 million unique visitors per month,reaching 60% of the digital audience
- Bell Media remained Canada’s top radio broadcaster, reaching17.4 million listeners who spent 73.6 million hours tuned in each weekduring 2017
- Astral is one of Canada’s leading OOH advertising companies withan offering of five innovative product lines and more than 31,000 atthe end of 2017 advertising faces strategically located in the BritishColumbia, Alberta, Manitoba, Ontario, Québec and Nova Scotia markets
| COMPETITIVE LANDSCAPE AND INDUSTRY TRENDS |
COMPETITIVE LANDSCAPE
Competition in the Canadian media industry has changed in recent years as traditional media assets are increasingly being controlled by a small number of competitors with significant scale and financial resources. Technology has allowed new entrants to become media players in their own right. Some players have become more vertically integrated across both traditional and emerging platforms to better enable the acquisition and monetization of premium content. Global aggregators have also emerged and are competing for both content and viewers.
Bell Media competes in the TV, radio and OOH advertising markets:
- TV:The TV market has become increasingly fragmented and this trendis expected to continue as new services and technologies increasethe diversity of information and entertainment outlets available toconsumers
- Radio:Competition within the radio broadcasting industry occursprimarily in discrete local market areas among individual stations
- OOH:The Canadian OOH advertising industry is fragmented, consistingof a few large companies as well as numerous smaller and localcompanies operating in a few local markets
Consumers continue to shift their media consumption towards digital and online media, mobile devices and on-demand content, requiring industry players to increase their efforts in digital content and capabilities in order to compete. This trend is also causing advertisers to direct more of their spending to digital and online rather than traditional media. In addition, the number of competitors has increased as more digital and online media companies, including large global companies, enter the market.
| 74 BCE Inc. 2017 ANNUAL REPORT |
|
| | | | |
| | 5 | MD&A | Bell Media |
Competitors
TV
- Conventional Canadian TV stations (local and distant signals) and specialty and pay channels,such as those owned by Corus, Rogers, Québecor, Canadian Broadcasting Corporation (CBC)/Société Radio-Canada (SRC) and Groupe V
- U.S. conventional TV stations and specialty channels
- OTT streaming providers such as Netflix, Amazon Prime Video and DAZN
- Video-sharing websites such as YouTube
RADIO
- Large radio operators, such as Rogers, Corus, Cogeco and Newcap Inc. (Newcap) that alsoown and operate radio station clusters in various local markets
- Radio stations in specific local markets
- Satellite radio provider SiriusXM
- Music streaming services such as Spotify, Apple Music and Google Play Music
- Music downloading services such as Apple’s iTunes Store
- Other media such as newspapers, local weeklies, TV, magazines, outdoor advertising andthe Internet
OOH ADVERTISING
- Large outdoor advertisers, such as Jim Pattison Broadcast Group, Outfront Media, Québecor,Dynamic and Clear Channel Outdoor
- Numerous smaller and local companies operating a limited number of display faces in afew local markets
- Other media such as TV, radio, print media and the Internet
Canadian market share

INDUSTRY TRENDS
TECHNOLOGY AND CONSUMER HABITS TRANSFORMING THE WAY TV IS DELIVERED
Technology used in the media industry continues to evolve rapidly, which has led to alternative methods for the distribution, storage and consumption of content. These technological developments have driven and reinforced changes in consumer behaviour as consumers seek more control over when, where and how they consume content. Consumers now have the ability to watch content from a variety of media services on the screen of their choice, including TVs, computers, and mobile devices. The number of Canadian users who are connected to the Internet through their TVs is growing as connection becomes easier and more affordable. Changes in technology and consumer behaviour have resulted in a number of challenges for content aggregators and distributors. Ubiquitous access to content enabled by connected devices introduces risk to traditional distribution platforms by enabling content owners to provide content directly to distributors and consumers, thus bypassing traditional content aggregators.
GROWTH OF ALTERNATIVES TO TRADITIONAL LINEAR TV
Consumers have improved access to online entertainment and information alternatives that did not previously exist. While traditional linear TV was the only way to access entertainment programming in the past, the increase in alternative entertainment options has led to a fragmentation in consumption habits. Traditional linear TV still remains the most common form of video consumption and people are increasingly consuming content on their own terms. In particular, today’s viewers are consuming more content online, watching less scheduled programming live, time-shifting original broadcasts through PVRs, viewing more TV on mobile devices, and catching up on past programming on-demand. In addition, a growing number of consumers are spending considerable time viewing online alternatives to traditional TV. This is evident in the growing number and popularity of OTT video services like Netflix and Amazon Prime Video. To date, these OTT services have largely complemented existing TV services, with the majority of subscribers adding an OTT service subscription to complement their traditional linear package. In recognition of changing consumer behaviour, media companies are evolving their content and launching their own solutions to better compete with these non-traditional offerings through services such as Bell Media’s CraveTV on-demand TV streaming service and authenticated TV Everywhere services such as CTV GO, TSN GO, RDS GO, Discovery GO and TMN GO.
BCE Inc. 2017 ANNUAL REPORT 75 |
|
| | | | |
5 | MD&A | Bell Media | |
ESCALATING CONTENT COSTS AND SHIFTS IN ADVERTISING
Viewership and usage trends suggest that online and mobile Internet video consumption is increasing rapidly. Changing content consumption patterns and growth of alternative content providers could exert downward pressure on advertising revenues for traditional media broadcasters. However, premier content, live sports and special events should continue to draw audiences and advertisers, which is expected to result in pricing pressure on future broadcasting rights. Additionally, while access to premium content has become increasingly important to media companies in attracting viewers and advertisers, there is now increased competition for these rights from global competitors, including Netflix, Amazon, and DAZN. This has resulted in higher TV program rights costs, which is a trend that is expected to continue into the future.
ALTERNATIVE DELIVERY OF LIVE SPORTS CONTENT
Access to live sports and other premium content has become even more important for acquiring and retaining audiences that in turn attract advertisers and subscribers. Ownership of content and/or long-term agreements with content owners has, therefore, also become increasingly important to media companies. Leagues, teams, and networks are also experimenting with the delivery of live sports content through online, social, and virtual platforms, while non-traditional sports are also growing in mindshare.
| BUSINESS OUTLOOK AND ASSUMPTIONS |
2018 OUTLOOK
Revenue performance is expected to reflect Bell Media’s broadcast of the 2018 FIFA World Cup, further growth in CraveTV, higher outdoor advertising revenue at Astral and the financial contribution from the pending acquisition of radio stations from Larche. However, the effects of shifting media consumption towards OTT and digital platforms, further TV cord-shaving and cord-cutting, as well as the financial impact of higher content costs for sports broadcast rights and premium programming content will continue to weigh on adjusted EBITDA in 2018. We also intend to continue controlling costs by leveraging assets, achieving productivity gains and pursuing operational efficiencies across all of our media properties, while continuing to invest in premium content across all screens and platforms.
While the advertising market is expected to remain soft in 2018, we anticipate that the strength of our programming including the 2018 FIFA World Cup, and continued strong outdoor advertising growth, will offset some advertising pressure resulting from increased competition and declining audiences. Subscriber fee revenues are projected to remain stable, as growth in CraveTV and TV Everywhere is expected to offset subscriber erosion.
In conventional TV, we intend to leverage the strength of our market position combined with enhanced audience targeting to continue offering advertisers, both nationally and locally, premium opportunities to reach their target audiences. Success in this area requires that we focus on a number of factors, including: successfully acquiring highly rated programming and differentiated content; building and maintaining strategic supply arrangements for content across all screens and platforms, producing and commissioning high-quality Canadian content, including market-leading news; and bringing our data-enhanced TV planning tool to market.
Our sports specialty TV offerings are expected to continue to deliver premium content and exceptional viewing experiences to our viewers. Expanded NFL and NHL offerings, combined with the integration of our digital platforms, are integral parts of our strategy to enhance viewership and engagement. Contractual price increases for strategic sports properties are the principal factors driving continued increases in sports rights costs. We will also continue to focus on creating innovative high-quality productions in the areas of sports news and editorial coverage.
In non-sports specialty TV, audiences and advertising revenues are expected to be driven by investment in quality programming and production. As part of our objective to drive revenue growth, we intend to capitalize on our competitive position in key specialty services to improve both channel strength and channel selection.
In pay TV, we will continue to leverage our investments in premium content (including HBO and SHOWTIME) in order to attract subscribers.
In our French-language pay and specialty services, we will continue to optimize our programming to increase our appeal to audiences, including the pending acquisition of French-language specialty channels Séries+ and Historia, which are subject to closing conditions, including approval by the CRTC and the Competition Bureau.
In radio, we intend to leverage the strength of our market position and pending radio station acquisitions from Larche to continue offering advertisers, both nationally and locally, premium opportunities to reach their target audiences. We also plan to leverage our recently enhanced iHeartRadio digital service in Canada that provides access to more than 1,000 live radio stations and some of the most popular podcasts. Additionally, in conjunction with our local TV properties, we will continue to pursue opportunities that leverage our promotional capabilities, provide an expanded platform for content sharing, and offer synergistic co-location and efficiencies.
In our OOH operations, we plan to leverage the strength of our products to provide advertisers with premium opportunities in key Canadian markets. We will also continue to seek new opportunities in digital markets, including converting our premium outdoor structures to digital.
| 76 BCE Inc. 2017 ANNUAL REPORT |
|
| | | | |
| | 5 | MD&A | Bell Media |
ASSUMPTIONS
- Revenue performance is expected to reflect an improving TV advertisingsales trajectory supported by our broadcast of the 2018 FIFA WorldCup, further CraveTV subscriber growth and continued growth inoutdoor advertising
- Operating cost growth driven by higher TV programming and sportsbroadcast rights costs, as well as continued investment in CraveTVcontent
- Continued scaling of CraveTV
- Ability to successfully acquire and produce highly rated programmingand differentiated content
- Building and maintaining strategic supply arrangements for contentacross all screens and platforms
- Increased revenue generation from monetization of content rightsand Bell Media properties across all platforms
- TV unbundling and growth in OTT viewing expected to result in lowersubscriber levels for many Bell Media TV properties
- No material financial, operational or competitive consequences ofchanges in regulations affecting our media business
- Leveraging data to better inform media planning, insights, andexecution, leading to an enhanced advertiser experience
- Investing in the best content
- Converting premium OOH structures to digital
- Establishing unique partnerships and strategic content investments
This section discusses certain principal business risks specifically related to the Bell Media segment. For a detailed description of the principal risks that could have a material adverse effect on our business, refer to section 9,Business risks.
| AGGRESSIVE COMPETITION AND REGULATORY CHANGES RISK - The intensity of competitive activityfrom traditional TV services, as well asfrom new technologies and alternativedistribution platforms such asunregulated OTT content offerings, videoon demand, personal video platformsand video services over mobile devicesand the Internet, in combination withregulations that require all BDUs to makeTV services available à la carte
- Acceleration among non-traditionalglobal players developing moreaggressive product and sales strategiesin creating and distributing video
POTENTIAL IMPACT - Adverse impact on the level ofsubscriptions and/or viewershipfor Bell Media’s TV services andon Bell Media’s revenue streams
| ADVERTISING AND SUBSCRIPTION REVENUE UNCERTAINTY RISK - Advertising is heavily dependent oneconomic conditions and viewership, aswell as on our ability to grow alternativeadvertising media such as digital andOOH platforms, in the context of achanging and fragmented advertisingmarket. Conventional media is underincreasing competitive pressure foradvertising spend from non-traditional/global technology companies
- Bell Media has contracts with a variety ofBDUs, under which monthly subscriptionfees for specialty and pay TV servicesare earned. Agreements with several ofthese BDUs are expiring in 2018
POTENTIAL IMPACT - Economic uncertainty could reduceadvertisers’ spending. Our failure toincrease or maintain viewership orcapture our share of the changing andfragmented advertising market couldresult in the loss of advertising revenue
- If we are not successful in renegotiatingexpiring BDU agreements on favourableterms, it could result in the loss ofsubscription revenue
| RISING CONTENT COSTS AND ABILITY TO SECURE KEY CONTENT RISK - Rising content costs, as an increasingnumber of domestic and globalcompetitors seek to acquire the samecontent, and the ability to securekey content to drive revenues andsubscriber growth
POTENTIAL IMPACT - Rising programming costs could requireus to incur unplanned expenses whichcould result in negative pressure onadjusted EBITDA
- Our inability to acquire popularprogramming content could adverselyaffect Bell Media’s viewership andsubscription levels and, consequently,advertising and subscription revenues
|
BCE Inc. 2017 ANNUAL REPORT 77 |
|
| | | | |
6 | MD&A | Financial and capital management | |
| 6 Financial and capital management |
This section tells you how we manage our cash and capital resources to carry out our strategy and deliver financial results. It provides an analysis of our financial condition, cash flows and liquidity on a consolidated basis.
| | DECEMBER 31, 2017 | | DECEMBER 31, 2016 | | $ CHANGE | | % CHANGE | |
Debt due within one year | 5,178 | | 4,887 | | 291 | | 6.0 | % |
Long-term debt | 18,215 | | 16,572 | | 1,643 | | 9.9 | % |
Preferred shares(1) | 2,002 | | 2,002 | | – | | – | |
Cash and cash equivalents | (625 | ) | (853 | ) | 228 | | 26.7 | % |
Net debt | 24,770 | | 22,608 | | 2,162 | | 9.6 | % |
| (1) | 50% of outstanding preferred shares of $4,004 million in 2017 and 2016 are classified as debt consistent with the treatment by some credit rating agencies. |
The increase of $1,934 million in total debt, comprised of debt due within one year and long-term debt, was due to:
- the issuance of Series M-40 MTN, M-44 MTN, M-45 MTN and M-46 MTNdebentures at Bell Canada with total principal amounts of $700 million,$1 billion, $500 million and $800 million, respectively
- an increase in our debt of $972 million due to the acquisition of MTS
- an increase in our notes payable (net of repayments) of $333 million
Partly offset by:
- the repayment of borrowings under our unsecured committed termcredit facility of $480 million
- the early redemption of Series M-22 MTN, M-35 and M-36 debenturesin the principal amounts of $1 billion, $350 million and $300 million,respectively
- a net decrease of $241 million in our finance lease obligations andother debt
The decrease in cash and cash equivalents of $228 million was due mainly to:
- $2,639 million of dividends paid on BCE common and preferred shares
- $4,034 million of capital expenditures
- $1,649 million paid for business acquisitions mainly related to theacquisitions of MTS and Cieslok Media
- $224 million for the purchase on the open market of shares for thesettlement of share-based payments
Partly offset by:
- $7,358 of cash from operating activities
- $691 million of debt issuances (net of repayments)
- $323 million from the divestiture of approximately one-quarter ofpostpaid wireless subscribers and 15 retail locations previously heldby MTS, as well as certain Manitoba network assets, to TELUS.
| 6.2 Outstanding share data |
| COMMON SHARES OUTSTANDING | NUMBER
OF SHARES | |
Outstanding, January 1, 2017 | 870,706,332 | |
Shares issued for the acquisition of MTS | 27,642,714 | |
Shares issued under employee stock option plan | 2,555,863 | |
Shares issued under employee savings plan (ESP) | 91,731 | |
Outstanding, December 31, 2017 | 900,996,640 | |
Subsequent to year end, on February 8, 2018, BCE announced its plan to repurchase and cancel up to 3.5 million common shares, subject to a maximum aggregate purchase price of $175 million over the twelvemonth period starting February 13, 2018 and ending no later than February 12, 2019 through a NCIB.
| STOCK OPTIONS OUTSTANDING | NUMBER
OF OPTIONS | | WEIGHTED AVERAGE
EXERCISE PRICE ($) | |
Outstanding, January 1, 2017 | 10,242,162 | | 52 | |
Granted | 3,043,448 | | 59 | |
Exercised(1) | (2,555,863 | ) | 45 | |
Forfeited | (239,498 | ) | 58 | |
Outstanding, December 31, 2017 | 10,490,249 | | 55 | |
Exercisable, December 31, 2017 | 2,013,983 | | 45 | |
| (1) | The weighted average share price for options exercised in 2017 was $60. |
At March 8, 2018, 899,000,579 common shares and 14,092,467 stock options were outstanding.
| 78 BCE Inc. 2017 ANNUAL REPORT |
|
| | | | |
| | 6 | MD&A | Financial and capital management |
| | 2017 | | 2016 | | $ CHANGE | | % CHANGE | |
Cash flows from operating activities | 7,358 | | 6,643 | | 715 | | 10.8 | % |
Capital expenditures | (4,034 | ) | (3,771 | ) | (263 | ) | (7.0 | %) |
Cash dividends paid on preferred shares | (127 | ) | (126 | ) | (1 | ) | (0.8 | %) |
Cash dividends paid by subsidiaries to non-controlling interest | (34 | ) | (46 | ) | 12 | | 26.1 | % |
Acquisition and other costs paid | 155 | | 126 | | 29 | | 23.0 | % |
Voluntary DB pension plan contribution | 100 | | 400 | | (300 | ) | (75.0 | %) |
Free cash flow | 3,418 | | 3,226 | | 192 | | 6.0 | % |
Business acquisitions | (1,649 | ) | (404 | ) | (1,245 | ) | n.m. | |
Acquisition and other costs paid | (155 | ) | (126 | ) | (29 | ) | (23.0 | %) |
Voluntary DB pension plan contribution | (100 | ) | (400 | ) | 300 | | 75.0 | % |
Decrease in investments | 6 | | 107 | | (101 | ) | (94.4 | %) |
Loan to related party | – | | (517 | ) | 517 | | 100.0 | % |
Disposition of intangibles and other assets | 323 | | – | | 323 | | n.m. | |
Other investing activities | (83 | ) | 1 | | (84 | ) | n.m. | |
Net issuance of debt instruments | 691 | | 719 | | (28 | ) | (3.9 | %) |
Issue of common shares | 117 | | 99 | | 18 | | 18.2 | % |
Repurchase of shares for settlement of share-based payments | (224 | ) | (106 | ) | (118 | ) | n.m. | |
Cash dividends paid on common shares | (2,512 | ) | (2,305 | ) | (207 | ) | (9.0 | %) |
Other financing activities | (60 | ) | (54 | ) | (6 | ) | (11.1 | %) |
Net (decrease) increase in cash and cash equivalents | (228 | ) | 240 | | (468 | ) | n.m. | |
| CASH FLOWS FROM OPERATING ACTIVITIES AND FREE CASH FLOW |
In 2017, BCE’s cash flows from operating activities, which included the contributions from the MTS acquisition, increased $715 million, compared to 2016, due mainly to higher adjusted EBITDA, a lower voluntary DB pension plan contribution made in 2017, improved working capital and lower severance and other costs paid, partly offset by higher income taxes paid and higher interest payments.
Free cash flow increased $192 million in 2017, compared to 2016, due to higher cash flows from operating activities excluding voluntary DB pension plan contributions, partly offset by higher capital expenditures.
| | 2017 | | 2016 | | $ CHANGE | | % CHANGE | |
Bell Wireless | 731 | | 733 | | 2 | | 0.3 | % |
Capital intensity ratio | 9.3 | % | 10.2 | % | | | 0.9 | pts |
Bell Wireline | 3,174 | | 2,936 | | (238 | ) | (8.1 | %) |
Capital intensity ratio | 25.6 | % | 24.3 | % | | | (1.3 | ) pts |
Bell Media | 129 | | 102 | | (27 | ) | (26.5 | %) |
Capital intensity ratio | 4.2 | % | 3.3 | % | | | (0.9 | ) pts |
BCE | 4,034 | | 3,771 | | (263 | ) | (7.0 | %) |
Capital intensity ratio | 17.8 | % | 17.4 | % | | | (0.4 | ) pts |
BCE capital expenditurestotaled $4,034 million in 2017, representing a 7% or $263 million increase over last year. Capital expenditures as a percentage of revenue (capital intensity ratio) increased to 17.8% in 2017, compared to 17.4% in 2016. The growth in capital spending was driven by increases in our Bell Wireline and Bell Media segments, while spending in our Bell Wireless segment remained relatively stable year over year. The growth in capital expenditures also included the impact from the acquisition and integration of Bell MTS. The higher year-over-year capital spending reflected:
- Greater spending in our wireline segment of $238 million in 2017driven by the ongoing deployment of broadband fibre directly tomore homes and businesses, including the rollout of Gigabit Fibeinfrastructure in the city of Toronto and other urban areas along withthe commencement of the FTTP build-out in the city of Montréal thatwas announced on March 27, 2017. The increase over last year alsoincluded the impact of the MTS acquisition and integration.
BCE Inc. 2017 ANNUAL REPORT 79 |
|
| | | | |
6 | MD&A | Financial and capital management | |
- Higher capital spending at Bell Media of $27 million in 2017, mainlydue to the Cieslok Media acquisition, the execution of contract winsin Astral and upgrades to Bell Media broadcast studios and TVproduction equipment
- Relatively stable spending at Bell Wireless, which declined $2 millionyear over year, primarily due to the slower pace of spending comparedto 2016, offset in part by the acquisition and integration of MTS. Ourcapital investments in Wireless included the continued deploymentof the LTE-A mobile network and the substantial completion of our 4G LTE network which reached 87% and 99% of the Canadian population, respectively, at December 31, 2017. Additionally, spending was focused on delivering faster speeds through carrier aggregation, the deployment of small-cell technology to optimize mobile coverage, signal quality and data back-haul, as well as the enhancement of customer experience and the expansion of wireless network capacity to support the growth in subscribers and data consumption.
| VOLUNTARY DB PENSION PLAN CONTRIBUTION |
In 2017, we made a voluntary contribution of $100 million, compared to a voluntary contribution of $400 million in 2016, to fund our post-employment benefit obligation. The voluntary contributions were funded from cash on hand at the end of 2017 and 2016 and will reduce the amount of BCE’s future pension funding obligations.
On March 17, 2017, BCE acquired all of the issued and outstanding common shares of MTS for a total consideration of $2,933 million, of which $1,339 million was paid in cash and the remaining $1,594 million through the issuance of approximately 27.6 million BCE common shares.
On January 3, 2017, BCE acquired all of the issued and outstanding common shares of Cieslok Media, for a total cash consideration of $161 million.
On October 3, 2016, BCE acquired the remaining 64.6% of the issued and outstanding shares of Q9 that it did not already own for a total cash consideration of approximately $158 million, net of cash on hand.
In Q1 2016, BCE completed a transaction with Corus under which Corus waived its HBO content rights in Canada and ceased operations of its Movie Central and Encore Avenue pay TV services in Western and Northern Canada, thereby allowing Bell Media to become the sole operator of HBO Canada nationally across all platforms and to expand TMN into a national pay TV service. TMN was successfully launched nationally on March 1, 2016. BCE paid to Corus a total consideration of $218 million, of which $21 million was paid in 2015.
Subsequent to year end, on January 5, 2018, BCE acquired all of the issued and outstanding shares of AlarmForce for a total consideration of $182 million, of which $181 million was paid in cash and the remaining $1 million through the issuance of 22,531 BCE common shares.
Subsequent to the acquisition of AlarmForce, on January 5, 2018, BCE sold AlarmForce’s approximate 39,000 customer accounts in British Columbia, Alberta, and Saskatchewan to TELUS for total proceeds of approximately $67 million subject to customary closing adjustments.
Decrease in investments of $107 million in 2016 included proceeds received from one of our equity investments from the sale of a portion of its operations.
In 2016, prior to closing the acquisition of Q9, Bell Canada provided a loan of $517 million to Q9 for the repayment of its debt.
| DISPOSITION OF INTANGIBLE AND OTHER ASSETS |
During Q2 2017, BCE completed the previously announced divestiture of approximately one-quarter of postpaid wireless subscribers and 15 retail locations previously held by MTS, as well as certain Manitoba network assets, to TELUS for total proceeds of $323 million.
We use a combination of short-term and long-term debt to finance our operations. Our short-term debt consists mostly of notes payable under commercial paper programs, loans securitized by trade receivables and bank facilities. We usually pay fixed rates of interest on our long-term debt and floating rates on our short-term debt. As at December 31, 2017, all of our debt was denominated in Canadian dollars with the exception of our commercial paper which is denominated in U.S. dollars, all of which has been hedged for foreign currency fluctuations through forward currency contracts.
2017
We issued $691 million of debt, net of repayments. This included the issuances of Series M-40 MTN, M-44 MTN, M-45 MTN and M-46 MTN debentures at Bell Canada with total principal amounts of $700 million, $1 billion, $500 million and $800 million, respectively and the issuance (net of repayments) of $333 million of notes payable. These issuances were partly offset by the early redemption of Series M-22 MTN, M-35 and M-36 debentures in the principal amounts of $1 billion, $350 million and $300 million, respectively, payments of finance leases and other debt of $512 million and the repayment of borrowings under our unsecured committed term credit facility of $480 million.
| 80 BCE Inc. 2017 ANNUAL REPORT |
|
| | | | |
| | 6 | MD&A | Financial and capital management |
2016
We issued $719 million of debt, net of repayments. This included the issuance of Series M-41 MTN, M-42 MTN and M-43 MTN debentures at Bell Canada with principal amounts of $750 million, $850 million and $650 million, respectively, and the issuance (net of repayments) of $991 million of notes payable. These issuances were partly offset by the early debt redemption of Series M-18 MTN, M-19 MTN, M-23 MTN and M-32 debentures, with principal amounts of $700 million, $200 million, $500 million and $500 million, respectively, the repayment of Series M-38 debentures of $150 million and payments of finance leases and other debt of $472 million.
| CASH DIVIDENDS PAID ON COMMON SHARES |
In 2017, cash dividends paid on common shares of $2,512 million increased by $207 million compared to 2016, due to a higher dividend paid in 2017 of $2.835 per common share compared to $2.6975 per common share in 2016 and a higher number of outstanding common shares principally as a result of shares issued for the acquisition of MTS.
| 6.4 Post-employment benefit plans |
For the year ended December 31, 2017, we recorded an increase in our post-employment benefit obligations and a loss, before taxes, in OCI of $338 million. This was due to a lower actual discount rate of 3.6% at December 31, 2017, compared to 4.0% at December 31, 2016. The loss was partly offset by a higher-than-expected return on plan assets.
For the year ended December 31, 2016, we recorded an increase in our post-employment benefit obligations and a loss, before taxes, in OCI of $262 million. This was due to a lower actual discount rate of 4.0% at December 31, 2016, compared to 4.2% at December 31, 2015. The loss was partly offset by a higher-than-expected return on plan assets.
| 6.5 Financial risk management |
Management’s objectives are to protect BCE and its subsidiaries on a consolidated basis against material economic exposures and variability of results from various financial risks that include credit risk, liquidity risk, foreign currency risk, interest rate risk, equity price risk and longevity risk. These risks are further described in Note 2,Significant accounting policies, Note 8,Other (expense) income, Note 22,Post-employment benefit plansand Note 24,Financial and capital managementin BCE’s 2017 consolidated financial statements.
The following table outlines our financial risks, how we manage these risks and their financial statement classification.
FINANCIAL
RISK | DESCRIPTION
OF RISK | MANAGEMENT OF RISK AND
FINANCIAL STATEMENT CLASSIFICATION |
Credit risk | We are exposed to credit risk from operating activities and certain financing activities, the maximum exposure of which is represented by the carrying amounts reported in the statements of financial position. We are exposed to credit risk if counterparties to our trade receivables and derivative instruments are unable to meet their obligations. | Large and diverse customer base Deal with institutions with investment-grade credit ratings Regularly monitor our credit risk and exposure Our trade receivables and allowance for doubtful accounts balancesat December 31, 2017 were $3,138 million and $55 million, respectively
|
Liquidity risk | We are exposed to liquidity risk for financial liabilities. | Sufficient cash from operating activities, possible capital markets financingand committed bank facilities to fund our operations and fulfill our obligationsas they become due Refer to section 6.7,Liquidity – Contractual obligations, for a maturity analysisof our recognized financial liabilities
|
Foreign currency risk | We are exposed to foreign currency risk related to anticipated transactions and certain foreign currency debt. A 10% depreciation (appreciation) in the value of the Canadian dollar relative to the U.S. dollar would result in a gain (loss) of $2 million recognized in net earnings at December 31, 2017 and a gain (loss) of $133 million recognized in OCI at December 31, 2017, with all other variables held constant. Refer to the followingFair valuesection for details on our derivative financial instruments. | Foreign currency forward contracts on our anticipated transactions and commercialpaper maturing in 2018 to 2021 of $4.0 billion in U.S. dollars ($5.1 billion in Canadiandollars) at December 31, 2017, to manage foreign currency risk related to anticipatedtransactions and foreign currency debt For cash flow hedges, changes in the fair value are recognized in OCI, except for anyineffective portion, which is recognized immediately in earnings inOther (expense)income. Realized gains and losses in Accumulated OCI are reclassified to the incomestatements or as an adjustment to the cost basis of the hedged item in the sameperiods as the corresponding hedged transactions are recognized. For economic hedges, changes in the fair value are recognized inOther(expense) income
In 2017, we settled a cross currency basis swap with a notional amount of $357 millionin U.S. dollars ($480 million in Canadian dollars) used to hedge borrowings under acredit facility For cross currency basis swaps, changes in the fair value of these derivatives and therelated credit facility were recognized inOther (expense) incomein the incomestatements and offset, unless a portion of the hedging relationship was ineffective
|
BCE Inc. 2017 ANNUAL REPORT 81 |
|
| | | | |
6 | MD&A | Financial and capital management | |
FINANCIAL
RISK | DESCRIPTION
OF RISK | MANAGEMENT OF RISK AND
FINANCIAL STATEMENT CLASSIFICATION |
Interest rate risk | We are exposed to risk on the interest rates of our debt, our post-employment benefit plans and on dividend rate resets on our preferred shares. A 1% increase (decrease) in interest rates would result in a decrease (increase) of $29 million in net earnings at December 31, 2017. Refer to the followingFair valuesection for details on our derivative financial instruments. | We use interest rate swaps to manage the mix of fixed and floating interest rates of ourdebt. We also use interest rate locks to hedge the interest rates on future debt issuancesand to economically hedge dividend rate resets on preferred shares. There were no interest rate swaps and locks outstanding as of December 31, 2017 For our post-employment benefit plans, the interest rate risk is managed using a liabilitymatching approach which reduces the exposure of the DB pension plans to a mismatchbetween investment growth and obligation growth
|
Equity price risk | We are exposed to risk on our cash flow related to share-based payment plans. A 5% increase (decrease) in the market price of BCE’s common shares at December 31, 2017 would result in a gain (loss) of $38 million recognized in net earnings for 2017, with all other variables held constant. Refer to the followingFair valuesection for details on our derivative financial instruments. | |
Longevity risk | We are exposed to life expectancy risk on our post-employment benefit plans. | |
Fair value is the price that would be received to sell an asset or paid to transfer a liability in an orderly transaction between market participants at the measurement date.
Certain fair value estimates are affected by assumptions we make about the amount and timing of future cash flows and discount rates, all of which reflect varying degrees of risk. Income taxes and other expenses that would be incurred on disposition of financial instruments are not reflected in the fair values. As a result, the fair values are not the net amounts that would be realized if these instruments were settled.
The carrying values of our cash and cash equivalents, trade and other receivables, dividends payable, trade payables and accruals, compensation payable, severance and other costs payable, interest payable, notes payable and loans secured by trade receivables approximate fair value as they are short-term.
The following table provides the fair value details of financial instruments measured at amortized cost in the statements of financial position.
| | | | DECEMBER 31, 2017 | DECEMBER 31, 2016 |
| | CLASSIFICATION | FAIR VALUE METHODOLOGY | CARRYING
VALUE | | FAIR
VALUE | | CARRYING
VALUE | | FAIR
VALUE | |
CRTC tangible benefits obligation | Trade payables and other liabilities and non-current liabilities | Present value of estimated future cash flows discounted using observable market interest rates | 111 | | 110 | | 166 | | 169 | |
CRTC deferral account obligation | Trade payables and other liabilities and non-current liabilities | Present value of estimated future cash flows discounted using observable market interest rates | 124 | | 128 | | 136 | | 145 | |
Debt securities, finance leases and other debt | Debt due within one year and long-term debt | Quoted market price of debt or present value of future cash flows discounted using observable market interest rates | 19,321 | | 21,298 | | 17,879 | | 20,093 | |
| 82 BCE Inc. 2017 ANNUAL REPORT |
|
| | | | |
| | 6 | MD&A | Financial and capital management |
The following table provides the fair value details of financial instruments measured at fair value in the statements of financial position.
| | | | | FAIR VALUE AT DECEMBER 31 |
| | CLASSIFICATION | CARRYING VALUE OF
ASSET (LIABILITY) AT
DECEMBER 31 | | QUOTED PRICES IN
ACTIVE
MARKETS FOR
IDENTICAL ASSETS
(LEVEL 1) | | OBSERVABLE
MARKET DATA
(LEVEL 2)(1) | | NON-OBSERVABLE
MARKET INPUTS
(LEVEL 3)(2) | |
| 2017 | | | | | | | | | |
Available-for-sale (AFS) publicly-traded and privately-held investments(3) | Other non-current assets | 103 | | 1 | | – | | 102 | |
Derivative financial instruments | Other current assets, trade payables and other liabilities, other non-current assets and liabilities | (48 | ) | – | | (48 | ) | – | |
MLSE financial liability(4) | Trade payables and other liabilities | (135 | ) | – | | – | | (135 | ) |
Other | Other non-current assets and liabilities | 60 | | – | | 106 | | (46 | ) |
| 2016 | | | | | | | | | |
AFS publicly-traded and privately-held investments(3) | Other non-current assets | 103 | | 1 | | – | | 102 | |
Derivative financial instruments | Other current assets, trade payables and other liabilities, other non-current assets and liabilities | 166 | | – | | 166 | | – | |
MLSE financial liability(4) | Trade payables and other liabilities | (135 | ) | – | | – | | (135 | ) |
Other | Other non-current assets and liabilities | 35 | | – | | 88 | | (53 | ) |
| (1) | Observable market data such as equity prices, interest rates, swap rate curves and foreign currency exchange rates. |
| (2) | Non-observable market inputs such as discounted cash flows and earnings multiples. A reasonable change in our assumptions would not result in a significant increase (decrease) to our level 3 financial instruments. |
| (3) | Unrealized gains and losses on AFS financial assets are recorded in OCI and are reclassified to Other (expense) income in the income statements when realized or when an impairment is determined. |
| (4) | Represents BCE’s obligation to repurchase the BCE Master Trust Fund’s (Master Trust) 9% interest in MLSE at a price not less than an agreed minimum price should the Master Trust exercise its put option. The obligation to repurchase is marked to market each reporting period and the gain or loss is recorded in Other (expense) income in the income statements. The option is exercisable in 2017 and thereafter. |
Credit ratings generally address the ability of a company to repay principal and pay interest on debt or dividends on issued and outstanding preferred shares.
Our ability to raise financing depends on our ability to access the public equity and debt capital markets as well as the bank credit market. Our ability to access such markets and the cost and amount of funding available partly depends on the quality of our credit ratings at the time capital is raised. Investment-grade credit ratings usually mean that when we borrow money, we qualify for lower interest rates than companies that have ratings lower than investment grade. A ratings downgrade could result in adverse consequences for our funding capacity or ability to access the capital markets.
The following table provides BCE’s and Bell Canada’s credit ratings, which are considered investment grade, as at March 8, 2018 from DBRS, Moody’s and S&P.
| | BELL CANADA(1) |
| MARCH 8, 2018 | DBRS | | MOODY’S | | S&P | |
| Commercial paper | R-2 (high) | | P-2 | | A-1 (Low) (Canadian scale) | |
| | | | | | A-2 (Global scale) | |
| Long-term debt | BBB (high) | | Baa1 | | BBB+ | |
| Subordinated long-term debt | BBB (low) | | Baa2 | | BBB | |
| | BCE(1) |
| | DBRS | | MOODY’S | | S&P | |
| Preferred shares | Pfd-3 | | – | | P-2 (Low) (Canadian scale) | |
| | | | | | BBB- (Global scale) | |
| (1) | These credit ratings are not recommendations to buy, sell or hold any of the securities referred to above, and they may be revised or withdrawn at any time by the assigning rating organization. Each credit rating should be evaluated independently of any other credit rating. |
As of March 8, 2018, BCE and Bell Canada’s credit ratings have stable outlooks from DBRS, Moody’s and S&P.
BCE Inc. 2017 ANNUAL REPORT 83 |
|
| | | | |
6 | MD&A | Financial and capital management | |
SOURCES OF LIQUIDITY
Our cash and cash equivalents balance at the end of 2017 was $625 million. We expect that this balance, our 2018 estimated cash flows from operations, and capital markets financing, including commercial paper, will permit us to meet our cash requirements in 2018 for capital expenditures, post-employment benefit plans funding, dividend payments, the payment of contractual obligations, maturing debt, ongoing operations, and other cash requirements.
Should our 2018 cash requirements exceed our cash and cash equivalents balance, cash generated from our operations, and capital markets financing, we would expect to cover such a shortfall by drawing under committed credit facilities that are currently in place or through new facilities to the extent available.
Our cash flows from operations, cash and cash equivalents balance, capital markets financing and credit facilities should give us flexibility in carrying out our plans for future growth, including business acquisitions and contingencies.
Subsequent to year end, on March 7, 2018, we announced the issuance of 3.35% Series M-47 MTN debentures under Bell Canada’s 1997 trust indenture, with a principal amount of $500 million, which mature on March 12, 2025. The net proceeds of the offering are intended to be used to redeem, prior to maturity, Bell Canada’s 5.52% Series M-33 debentures having an outstanding principal amount of $300 million, which are due on February 26, 2019, and for the repayment of other short-term debt.
The table below is a summary of our total bank credit facilities at December 31, 2017.
| DECEMBER 31, 2017 | TOTAL
AVAILABLE | | DRAWN | | LETTERS
OF CREDIT | | COMMERCIAL
PAPER
OUTSTANDING | | NET
AVAILABLE | |
Committed credit facilities | | | | | | | | | | |
Unsecured revolving credit and expansion facilities (1)(2) | 3,500 | | – | | – | | 3,116 | | 384 | |
Other | 134 | | – | | 106 | | – | | 28 | |
Total committed credit facilities | 3,634 | | – | | 106 | | 3,116 | | 412 | |
Total non-committed credit facilities | 1,829 | | – | | 1,148 | | – | | 681 | |
Total committed and non-committed credit facilities | 5,463 | | – | | 1,254 | | 3,116 | | 1,093 | |
| (1) | Bell Canada’s $2.5 billion revolving credit facility expires in November 2022 and its $1 billion expansion credit facility expires in November 2020. |
| (2) | As of December 31, 2017, Bell Canada’s outstanding commercial paper included $2,484 million in U.S. dollars ($3,116 in Canadian dollars). All of Bell Canada’s commercial paper outstanding is included in debt due within one year. |
Bell Canada may issue notes under its Canadian and U.S. commercial paper programs up to the maximum aggregate principal amount of $2.5 billion in either Canadian or U.S. currency provided that at no time shall such maximum amount of notes exceed $3.5 billion in Canadian currency which equals the aggregate amount available under Bell Canada’s supporting committed revolving and expansion credit facilities as at December 31, 2017. The total amount of the committed revolving and expansion credit facilities may be drawn at any time. Some of our credit agreements require us to meet specific financial ratios and to offer to repay and cancel the credit agreement upon a change of control of BCE or Bell Canada. We are in compliance with all conditions and restrictions under such agreements.
CAPITAL EXPENDITURES
In 2018, our planned capital spending will be focused on our strategic imperatives, reflecting an appropriate level of investment in our networks and services.
POST-EMPLOYMENT BENEFIT PLANS FUNDING
Our post-employment benefit plans include DB pension and defined contribution (DC) pension plans, as well as other post-employment benefits (OPEBs) plans. The funding requirements of our post-employment benefit plans, resulting from valuations of our plan assets and liabilities, depend on a number of factors, including actual returns on post-employment benefit plan assets, long-term interest rates, plan demographics, and applicable regulations and actuarial standards. Our expected funding for 2018 is detailed in the following table and is subject to actuarial valuations that will be completed in mid-2018. Actuarial valuations were last performed for our significant post-employment benefit plans as at December 31, 2016.
| 2018 EXPECTED FUNDING | TOTAL | |
DB pension plans – service cost | 203 | |
DB pension plans – deficit | 7 | |
DB pension plans | 210 | |
OPEBs | 80 | |
DC pension plans | 110 | |
Total net post-employment benefit plans | 400 | |
DIVIDEND PAYMENTS
In 2018, the cash dividends to be paid on BCE’s common shares are expected to be higher than in 2017 as BCE’s annual common share dividend increased by 5.2% to $3.02 per common share from $2.87 per common share effective with the dividend payable on April 15, 2018. This increase is consistent with BCE’s common share dividend payout policy of a target payout between 65% and 75% of free cash flow. BCE’s dividend policy and the declaration of dividends are subject to the discretion of the BCE Board.
| 84 BCE Inc. 2017 ANNUAL REPORT |
|
| | | | |
| | 6 | MD&A | Financial and capital management |
CONTRACTUAL OBLIGATIONS
The following table is a summary of our contractual obligations at December 31, 2017 that are due in each of the next five years and thereafter.
| | 2018 | | 2019 | | 2020 | | 2021 | | 2022 | | THERE-
AFTER | | TOTAL | |
Recognized financial liabilities | | | | | | | | | | | | | | |
Long-term debt | 661 | | 1,541 | | 1,424 | | 2,247 | | 1,714 | | 9,558 | | 17,145 | |
Notes payable | 3,151 | | – | | – | | – | | – | | – | | 3,151 | |
Minimum future lease payments under finance leases | 572 | | 501 | | 326 | | 278 | | 248 | | 883 | | 2,808 | |
Loans secured by trade receivables | 921 | | – | | – | | – | | – | | – | | 921 | |
Interest payable on long-term debt, notes payable and loan secured by trade receivables | 792 | | 688 | | 628 | | 586 | | 525 | | 5,197 | | 8,416 | |
MLSE financial liability | 135 | | – | | – | | – | | – | | – | | 135 | |
Commitments (off-balance sheet) | | | | | | | | | | | | | | |
Operating leases | 312 | | 264 | | 225 | | 175 | | 119 | | 341 | | 1,436 | |
Commitments for property, plant and equipment and intangible assets | 1,039 | | 808 | | 614 | | 516 | | 372 | | 808 | | 4,157 | |
Purchase obligations | 865 | | 664 | | 550 | | 498 | | 429 | | 903 | | 3,909 | |
Proposed acquisition of Séries+ and Historia specialty channels | 200 | | – | | – | | – | | – | | – | | 200 | |
Acquisition of AlarmForce(1) | 182 | | – | | – | | – | | – | | – | | 182 | |
Total | 8,830 | | 4,466 | | 3,767 | | 4,300 | | 3,407 | | 17,690 | | 42,460 | |
| (1) | This commitment was settled on January 5, 2018, upon completion of the acquisition of AlarmForce. |
BCE’s significant finance leases are for satellites and office premises. The office leases have a typical lease term of 22 years. The leases for satellites, used to provide programming to our Bell TV customers, have a term of 15 years. These satellite leases are non-cancellable. Minimum future lease payments under finance leases include future finance costs of $636 million.
BCE’s significant operating leases are for office premises, cellular tower sites, retail outlets, and OOH advertising spaces with lease terms ranging from 1 to 50 years. These leases are non-cancellable. Rental expense relating to operating leases was $399 million in 2017 and $353 million in 2016.
Our commitments for property, plant and equipment and intangible assets include program and feature film rights and investments to expand and update our networks to meet customer demand.
Purchase obligations consist of contractual obligations under service and product contracts for operating expenditures and other purchase obligations.
INDEMNIFICATIONS AND GUARANTEES (OFF-BALANCE SHEET)
As a regular part of our business, we enter into agreements that provide for indemnifications and guarantees to counterparties in transactions involving business dispositions, sales of assets, sales of services, purchases and development of assets, securitization agreements and operating leases. While some of the agreements specify a maximum potential exposure, many do not specify a maximum amount or termination date.
We cannot reasonably estimate the maximum potential amount we could be required to pay counterparties because of the nature of almost all of these indemnifications and guarantees. As a result, we cannot determine how they could affect our future liquidity, capital resources or credit risk profile. We have not made any significant payments under indemnifications or guarantees in the past.
In the ordinary course of our business, we become involved in various claims and legal proceedings seeking monetary damages and other relief. In particular, because of the nature of our consumer-facing business, we are exposed to class actions pursuant to which substantial monetary damages may be claimed. Due to the inherent risks and uncertainties of the litigation process, we cannot predict the final outcome or timing of claims and legal proceedings. Subject to the foregoing, and based on information currently available and management’s assessment of the merits of the claims and legal proceedings pending at March 8, 2018, management believes that the ultimate resolution of these claims and legal proceedings is unlikely to have a material and negative effect on our financial statements or operations. We believe that we have strong defences and we intend to vigorously defend our positions.
You will find a description of the principal legal proceedings pending at March 8, 2018 in the BCE 2017 AIF.
BCE Inc. 2017 ANNUAL REPORT 85 |
|
| | | | |
7 | MD&A | Selected annual and quarterly information | |
| 7 Selected annual and quarterly information |
| 7.1 Annual financial information |
The following table shows selected consolidated financial data of BCE for 2017, 2016 and 2015, based on the annual consolidated financial statements, which are prepared in accordance with IFRS as issued by the International Accounting Standards Board (IASB). We discuss the factors that caused our results to vary over the past two years throughout this MD&A.
| | 2017 | | 2016 | | 2015 | |
CONSOLIDATED INCOME STATEMENTS | | | | | | |
Operating revenues | | | | | | |
Service | 21,143 | | 20,090 | | 19,759 | |
Product | 1,576 | | 1,629 | | 1,755 | |
Total operating revenues | 22,719 | | 21,719 | | 21,514 | |
Operating costs | (13,541 | ) | (12,931 | ) | (12,963 | ) |
Adjusted EBITDA | 9,178 | | 8,788 | | 8,551 | |
Severance, acquisition and other costs | (190 | ) | (135 | ) | (446 | ) |
Depreciation | (3,037 | ) | (2,877 | ) | (2,890 | ) |
Amortization | (813 | ) | (631 | ) | (530 | ) |
Finance costs | | | | | | |
Interest expense | (955 | ) | (888 | ) | (909 | ) |
Interest on post-employment benefit obligations | (72 | ) | (81 | ) | (110 | ) |
Other (expense) income | (102 | ) | 21 | | (12 | ) |
Income taxes | (1,039 | ) | (1,110 | ) | (924 | ) |
Net earnings | 2,970 | | 3,087 | | 2,730 | |
Net earnings attributable to: | | | | | | |
Common shareholders | 2,786 | | 2,894 | | 2,526 | |
Preferred shareholders | 128 | | 137 | | 152 | |
Non-controlling interest | 56 | | 56 | | 52 | |
Net earnings | 2,970 | | 3,087 | | 2,730 | |
Net earnings per common share | | | | | | |
Basic | 3.12 | | 3.33 | | 2.98 | |
Diluted | 3.11 | | 3.33 | | 2.98 | |
RATIOS | | | | | | |
Adjusted EBITDA margin (%) | 40.4 | % | 40.5 | % | 39.7 | % |
Return on equity (%)(1) | 19.4 | % | 21.8 | % | 21.1 | % |
| (1) | Net earnings attributable to common shareholders divided by total average equity attributable to BCE shareholders excluding preferred shares. |
| 86 BCE Inc. 2017 ANNUAL REPORT |
|
| | | | |
| | 7 | MD&A | Selected annual and quarterly information |
| | 2017 | | 2016 | | 2015 | |
CONSOLIDATED STATEMENTS OF FINANCIAL POSITION | | | | | | |
Total assets | 54,263 | | 50,108 | | 47,993 | |
Cash and cash equivalents | 625 | | 853 | | 613 | |
Debt due within one year (including notes payable and loans secured by trade receivables) | 5,178 | | 4,887 | | 4,895 | |
Long-term debt | 18,215 | | 16,572 | | 15,390 | |
Total non-current liabilities | 23,993 | | 22,146 | | 20,672 | |
Equity attributable to BCE shareholders | 19,160 | | 17,540 | | 17,023 | |
Total equity | 19,483 | | 17,854 | | 17,329 | |
CONSOLIDATED STATEMENTS OF CASH FLOWS | | | | | | |
Cash flows from operating activities | 7,358 | | 6,643 | | 6,274 | |
Cash flows used in investing activities | (5,437 | ) | (4,584 | ) | (4,114 | ) |
Capital expenditures | (4,034 | ) | (3,771 | ) | (3,626 | ) |
Business acquisitions | (1,649 | ) | (404 | ) | (311 | ) |
Business dispositions | – | | 18 | | 409 | |
Acquisition of spectrum licences | – | | (1 | ) | (535 | ) |
Disposition of intangibles and other assets | 323 | | – | | – | |
Loan to related party | – | | (517 | ) | – | |
Cash flows used in financing activities | (2,149 | ) | (1,819 | ) | (2,113 | ) |
Issue of common shares | 117 | | 99 | | 952 | |
Net issuance (repayment) of debt instruments | 691 | | 719 | | (510 | ) |
Common shares issuance cost | – | | – | | (35 | ) |
Cash dividends paid on common shares | (2,512 | ) | (2,305 | ) | (2,169 | ) |
Cash dividends paid on preferred shares | (127 | ) | (126 | ) | (150 | ) |
Cash dividends paid by subsidiaries to non-controlling interest | (34 | ) | (46 | ) | (41 | ) |
Free cash flow | 3,418 | | 3,226 | | 2,999 | |
SHARE INFORMATION | | | | | | |
Average number of common shares (millions) | 894.3 | | 869.1 | | 847.1 | |
Common shares outstanding at end of year (millions) | 901.0 | | 870.7 | | 865.6 | |
Market capitalization(1) | 54,402 | | 50,527 | | 46,275 | |
Dividends declared per common share (dollars) | 2.87 | | 2.73 | | 2.60 | |
Dividends declared on common shares | (2,564 | ) | (2,374 | ) | (2,213 | ) |
Dividends declared on preferred shares | (128 | ) | (137 | ) | (152 | ) |
Closing market price per common share (dollars) | 60.38 | | 58.03 | | 53.46 | |
Total shareholder return | 8.9 | % | 13.7 | % | 5.3 | % |
RATIOS | | | | | | |
Capital intensity (%) | 17.8 | % | 17.4 | % | 16.9 | % |
Price to earnings ratio (times)(2) | 19.35 | | 17.43 | | 17.94 | |
OTHER DATA | | | | | | |
Number of employees (thousands) | 52 | | 48 | | 50 | |
| (1) | BCE’s common share price at the end of the year multiplied by the number of common shares outstanding at the end of the year. |
| (2) | BCE’s common share price at the end of the year divided by EPS. |
BCE Inc. 2017 ANNUAL REPORT 87 |
|
| | | | |
7 | MD&A | Selected annual and quarterly information | |
| 7.2 Quarterly financial information |
The following table shows selected BCE consolidated financial data by quarter for 2017 and 2016. This quarterly information is unaudited but has been prepared on the same basis as the annual consolidated financial statements. We discuss the factors that caused our results to vary over the past eight quarters throughout this MD&A.
| 2017 | 2016 |
| Q4 | | Q3 | | Q2 | | Q1 | | Q4 | | Q3 | | Q2 | | Q1 | |
Operating revenues | | | | | | | | | | | | | | | | |
Service | 5,435 | | 5,322 | | 5,335 | | 5,051 | | 5,169 | | 5,025 | | 4,988 | | 4,908 | |
Product | 523 | | 356 | | 364 | | 333 | | 533 | | 382 | | 352 | | 362 | |
Total operating revenues | 5,958 | | 5,678 | | 5,699 | | 5,384 | | 5,702 | | 5,407 | | 5,340 | | 5,270 | |
Adjusted EBITDA | 2,217 | | 2,366 | | 2,381 | | 2,214 | | 2,121 | | 2,236 | | 2,268 | | 2,163 | |
Severance, acquisition and other costs | (47 | ) | (23 | ) | (36 | ) | (84 | ) | (11 | ) | (25 | ) | (57 | ) | (42 | ) |
Depreciation | (781 | ) | (765 | ) | (769 | ) | (722 | ) | (719 | ) | (706 | ) | (713 | ) | (739 | ) |
Amortization | (209 | ) | (208 | ) | (211 | ) | (185 | ) | (165 | ) | (161 | ) | (156 | ) | (149 | ) |
Net earnings | 617 | | 817 | | 811 | | 725 | | 699 | | 800 | | 830 | | 758 | |
Net earnings attributable to common shareholders | 575 | | 770 | | 762 | | 679 | | 657 | | 752 | | 778 | | 707 | |
Net earnings per common share | | | | | | | | | | | | | | | | |
Basic | 0.64 | | 0.86 | | 0.84 | | 0.78 | | 0.75 | | 0.87 | | 0.89 | | 0.82 | |
Diluted | 0.63 | | 0.86 | | 0.84 | | 0.78 | | 0.75 | | 0.87 | | 0.89 | | 0.82 | |
Average number of common shares outstanding – basic (millions) | 900.6 | | 900.4 | | 900.1 | | 875.7 | | 870.5 | | 869.9 | | 869.1 | | 867.1 | |
OTHER INFORMATION | | | | | | | | | | | | | | | | |
Cash flows from operating activities | 1,658 | | 2,233 | | 2,154 | | 1,313 | | 1,520 | | 1,943 | | 1,890 | | 1,290 | |
Free cash flow | 652 | | 1,183 | | 1,094 | | 489 | | 923 | | 951 | | 934 | | 418 | |
Capital expenditures | (1,100 | ) | (1,040 | ) | (1,042 | ) | (852 | ) | (993 | ) | (976 | ) | (950 | ) | (852 | ) |
| FOURTH QUARTER HIGHLIGHTS |
| OPERATING REVENUES | Q4 2017 | | Q4 2016 | | $ CHANGE | | % CHANGE | |
Bell Wireless | 2,070 | | 1,883 | | 187 | | 9.9 | % |
Bell Wireline | 3,222 | | 3,137 | | 85 | | 2.7 | % |
Bell Media | 834 | | 845 | | (11 | ) | (1.3 | %) |
Inter-segment eliminations | (168 | ) | (163 | ) | (5 | ) | (3.1 | %) |
Total BCE operating revenues | 5,958 | | 5,702 | | 256 | | 4.5 | % |
| ADJUSTED EBITDA | Q4 2017 | | Q4 2016 | | $ CHANGE | | % CHANGE | |
Bell Wireless | 736 | | 674 | | 62 | | 9.2 | % |
Bell Wireline | 1,310 | | 1,259 | | 51 | | 4.1 | % |
Bell Media | 171 | | 188 | | (17 | ) | (9.0 | %) |
Total BCE adjusted EBITDA | 2,217 | | 2,121 | | 96 | | 4.5 | % |
| 88 BCE Inc. 2017 ANNUAL REPORT |
|
| | | | |
| | 7 | MD&A | Selected annual and quarterly information |
BCE operating revenuesincreased by 4.5% in Q4 2017, compared to the prior year, driven by growth in both our Bell Wireless and Bell Wireline segments, offset in part by a modest decline in our Bell Media segment.
BCE adjusted EBITDAgrew by 4.5% in Q4 2017, compared to Q4 2016, due to year-over-year increases in our Bell Wireless and Bell Wireline segments, moderated by the decline in our Bell Media segment. BCE adjusted EBITDA margin remained unchanged at 37.2% compared to prior year.
Bell Wireless operating revenuesincreased by 9.9% in Q4 2017, compared to the same period last year, driven by growth in both service revenues of 10.6% and product revenues of 3.5%. The year-over-year increase in service revenue was mainly attributable to a greater postpaid subscriber base combined with higher blended ARPU of 2.4% and the contribution from Bell MTS. The increase in blended ARPU was driven by postpaid ARPU growth reflecting a higher postpaid subscriber mix, the flow-through of 2016 pricing changes, as well as a greater mix of postpaid LTE and LTE-A customers in our subscriber base resulting in greater data consumption and higher demand for larger data plans, offset in part by the unfavourable impact of Telecom Decision CRTC 2016-171 and the increased adoption of all-inclusive rate plans resulting in lower out of bundle usage. Wireless product revenues grew by 3.5%, year over year, mainly from a larger proportion of high end devices in our sales mix, higher gross activations and customer upgrades, along with the contribution from the MTS acquisition, moderated by increased promotional offers in a highly competitive marketplace and lower radio sales.
Bell Wireless adjusted EBITDAgrew 9.2% in Q4 2017, compared to the prior year, driven by the flow-through of higher operating revenues, moderated by higher operating expenses primarily from our continued investment in customer retention and acquisition, expense contribution from Bell MTS, higher labour expense to support the growth in the business, greater network operating costs to support expanding capacity and higher advertising costs mainly driven by the recent launch of Lucky Mobile. Adjusted EBITDA margin, based on wireless operating service revenues of 38.9%, decreased 0.4 pts over last year.
Bell Wireline operating revenuesin Q4 2017 increased by 2.7%, year over year, driven by higher service revenues of 3.6%, moderated by a decline in product revenues of 4.4%. The growth in service revenues was driven by the contribution from the acquisition of MTS, growth in our Internet and IPTV subscriber bases, higher household ARPU and growth in IP broadband connectivity services. This was offset in part by ongoing erosion in our voice, satellite TV, and legacy data revenues, lower business solution services revenue, increased residential customer acquisition, retention and bundle discounts due to aggressive offers from cable competitors, as well as the unfavourable CRTC regulatory impact from Telecom Decision CRTC 2016-171. The decline in product revenues reflected competitive pricing pressures in our business and wholesale markets and lower consumer electronic sales at The Source, mitigated in part by the contribution from the acquisition of MTS.
Bell Wireline adjusted EBITDAin Q4 2017 increased by 4.1%, year over year, with a corresponding adjusted EBITDA margin increase to 40.7% over the 40.1% experienced in Q4 2016, driven by the contribution from Bell MTS, growth in our Internet and IPTV businesses and continued effective cost containment, offset in part by the decline in our voice, satellite TV, and legacy data, including reduced customer spending and ongoing competitive pricing pressures in our business market.
Bell Media operating revenuesdecreased by 1.3% in Q4 2017, compared to the same period last year, due to lower advertising revenues driven by continued market softness and lower audience levels, which unfavourably impacted conventional and specialty TV and radio platforms, partially mitigated by higher OOH advertising revenues as a result of the contribution from the Cieslok Media acquisition and newly awarded contracts, as well as higher year-over-year revenue from digital properties. The decline in operating revenues was moderated by higher subscriber revenues driven by the growth in our subscriber base from our TV Everywhere GO Products, Crave TV and pay TV services, and the flow-through of rate increases on contract renewals that occurred earlier in the year.
Bell Media adjusted EBITDAdecreased by 9.0% in Q4 2017, compared to the same period last year, due to lower operating revenues coupled with higher programming and content costs primarily related to sports broadcast rights and higher expenses in OOH resulting from the Cieslok Media acquisition and the execution of newly awarded contracts. This was partially mitigated by reduced labour costs driven mainly by workforce reductions.
BCE capital expendituresof $1,100 million in Q4 2017 increased by $107 million compared to last year, corresponding to an increased capital intensity ratio of 18.5% compared to 17.4% last year. The higher year-over-year capital investment was driven by increased spending across all three of our segments and included the impact from the acquisition and integration of Bell MTS in our wireless and wireline segments. The higher spending in our wireline segment of $67 million also reflected the continued deployment of broadband fibre directly to more homes and businesses, including the build-out of Gigabit Fibe infrastructure in the city of Toronto and other urban locations and the commencement of the FTTP build-out in the city of Montréal. The increased capital expenditures in our wireless segment of $25 million was mainly impacted by timing of spend. At Bell Media, spending increased by $15 million mainly due to the Cieslok Media acquisition, the execution of contract wins in Astral and upgrades to Bell Media broadcast studios, TV production equipment and digital platforms.
BCE severance, acquisition and other costsof $47 million in Q4 2017 increased by $36 million, compared to Q4 2016, due in part to higher workforce reduction initiatives and higher other costs.
BCE depreciationof $781 million in Q4 2017 increased by $62 million, year over year, mainly due to the acquisition of MTS and a higher asset base as we continued to invest in our broadband and wireless networks as well as our IPTV service. The increase was partly offset by lower depreciation due to an increase in the estimate of useful lives of certain assets as a result of our ongoing annual review process. The changes to useful lives have been applied prospectively, effective January 1, 2017, as described in section 10.1,Our accounting policies – Critical accounting estimates and key judgments.
BCE amortizationwas $209 million in Q4 2017, up from $165 million in Q4 2016, due mainly to the acquisition of MTS and a higher asset base.
BCE net earnings attributable to common shareholdersof $575 million in Q4 2017, or $0.64 per share, were lower than the $657 million, or $0.75 per share, reported in Q4 2016. The year-over-year decrease was due mainly to higher depreciation and amortization expense, higher severance, acquisition and other costs and higher other expense which included impairment charges of $82 million relating to our Bell Media segment, partly offset by higher adjusted EBITDA. Adjusted net earnings increased to $684 million, from $667 million in Q4 2016, and adjusted EPS remained flat to prior year.
BCE Inc. 2017 ANNUAL REPORT 89 |
|
| | | | |
7 | MD&A | Selected annual and quarterly information | |
BCE cash flows from operating activitieswas $1,658 million in Q4 2017 compared to $1,520 million in Q4 2016. The increase is mainly attributable to higher adjusted EBITDA and a lower voluntary DB pension plan contribution made in 2017, partly offset by reduced working capital, higher income taxes paid and higher interest payments, all of which included the contributions from MTS.
BCE free cash flowgenerated in Q4 2017 was $652 million, a decrease of $271 million compared to Q4 2016. This was due to lower cash flows from operating activities excluding a voluntary DB pension plan contribution and higher capital expenditures.
| SEASONALITY CONSIDERATIONS |
Some of our segments’ revenues and expenses vary slightly by season, which may impact quarter-to-quarter operating results.
Bell Wirelessoperating results are influenced by the timing and richness of promotional activities, the level of overall competitive intensity, and the seasonal effect of higher levels of subscriber additions and handset discounts that may result in higher subscriber acquisition and activation-related expenses in certain quarters. In particular, subscriber activations are typically lowest in the first quarter, while adjusted EBITDA tends to be lower in the third and fourth quarters, due to higher subscriber acquisition and retention costs associated with a greater number of new subscriber activations and upgrades during the back-to-school and Black Friday to Christmas holiday periods. Additionally, wireless ARPU historically has experienced seasonal sequential increases in the second and third quarters, due to higher levels of usage and roaming in the spring and summer months, followed by historical seasonal sequential declines in the fourth and first quarters. However, this seasonal effect on ARPU has moderated, as unlimited voice options and larger usage data plans with higher recurring monthly fees have become more prevalent, resulting in less variability in chargeable data usage.
Bell Wirelinerevenues tend to be higher in the fourth quarter because of higher data and equipment product sales to business customers and higher consumer electronics equipment sales during the Q4 Christmas holiday period. However, this may vary from year to year depending on the strength of the economy and the presence of targeted sales initiatives, which can influence customer spending. Home Phone, TV and Internet subscriber activity is subject to modest seasonal fluctuations, attributable largely to residential moves during the summer months and the back-to-school period in the third quarter. Targeted marketing efforts conducted during various times of the year to coincide with special events or broad-based marketing campaigns also may have an impact on overall wireline operating results.
Bell Mediarevenues and related expenses from TV and radio broadcasting are largely derived from the sale of advertising, the demand for which is affected by prevailing economic conditions, as well as cyclical and seasonal variations. Seasonal variations are driven by the strength of TV ratings, particularly during the fall programming season, major sports league seasons and other special sporting events such as the Olympic Games, NHL playoffs and World Cup soccer, as well as fluctuations in consumer retail activity during the year.
| 90 BCE Inc. 2017 ANNUAL REPORT |
|
| | | | |
| | 8 | MD&A | Regulatory environment |
This section describes certain legislation that governs our business and provides highlights of recent regulatory initiatives and proceedings, government consultations and government positions that affect us, influence our business and may continue to affect our ability to compete in the marketplace. Bell Canada and several of its direct and indirect subsidiaries, including Bell Mobility, Bell ExpressVu Limited Partnership (Bell ExpressVu), Bell Media, NorthernTel, Limited Partnership (NorthernTel), Télébec, Limited Partnership (Télébec) and Northwestel, are governed by theTelecommunications Act, theBroadcasting Act, theRadiocommunication Actand/or theBell Canada Act. Our business is affected by regulations, policies and decisions made by various regulatory agencies, including the CRTC, a quasi-judicial agency of the Government of Canada responsible for regulating Canada’s telecommunications and broadcasting industries, and other federal government departments, in particular ISED.
The CRTC regulates the prices we can charge for telecommunications services in areas where it determines there is not enough competition to protect the interests of consumers. The CRTC has determined that competition was sufficient to grant forbearance from retail price regulation under theTelecommunications Actfor the vast majority of our wireline residential and business telephone services, as well as for our wireless services (except our domestic wholesale wireless roaming service and certain restrictions for retail wireless services set out in the Wireless Code of Conduct (the Wireless Code)) and Internet services (except in certain parts of Northwestel’s territory, where the CRTC re-regulated Internet services in 2013). Our TV distribution and our TV and radio broadcasting businesses are subject to theBroadcasting Actand are, for the most part, not subject to retail price regulation.
Although most of our retail services are not price-regulated, government agencies and departments such as the CRTC, ISED, Canadian Heritage and the Competition Bureau continue to play a significant role in regulatory matters such as mandatory access to networks, spectrum auctions, approval of acquisitions, broadcast licensing and foreign ownership requirements. Adverse decisions by regulatory agencies or increasing regulation could have negative financial, operational, reputational or competitive consequences for our business.
| 8.2 Telecommunications Act |
TheTelecommunications Actgoverns telecommunications in Canada. It defines the broad objectives of Canada’s telecommunications policy and provides the Government of Canada with the power to give general direction to the CRTC on any of its policy objectives. It applies to several of the BCE group of companies and partnerships, including Bell Canada, Bell Mobility, NorthernTel, Télébec and Northwestel.
Under theTelecommunications Act, all facilities-based telecommunications service providers in Canada, known as telecommunications common carriers (TCCs), must seek regulatory approval for all telecommunications services, unless the services are exempt from regulation or forborne from regulation. The CRTC may exempt an entire class of carriers from regulation under theTelecommunications Actif the exemption meets the objectives of Canada’s telecommunications policy. In addition, a few large TCCs, including the BCE group TCCs, must also meet certain Canadian ownership requirements. BCE monitors and periodically reports on the level of non-Canadian ownership of its common shares.
| REVIEW OF BASIC TELECOMMUNICATIONS SERVICES |
On December 21, 2016, the CRTC issued Telecom Regulatory Policy CRTC 2016-496, in which it determined broadband Internet to be a basic service and created a new fund designed to complement government investments in expanding access to broadband Internet across Canada. The new fund will collect and distribute $750 million over a five-year period to support an aspirational goal of bringing broadband Internet with speeds of 50 Mbps to 90% of Canadian households by the end of 2021. The contributions to the new fund will be collected from telecommunications service providers, like those of the BCE group, and distributed through a competitive bidding process to support broadband deployment initiatives. The fund is to start at $100 million in its first year and grow by $25 million each year until it caps out at $200 million in the fifth year. While we will be required to contribute to the new broadband fund based on our percentage of industry revenues for voice, data and Internet services, the extent of the impact of this new fund on our business is not yet known, as funds contributed may be offset by any funds received should we seek and be awarded funds to deploy broadband services as part of the CRTC’s program. The CRTC has launched a proceeding to determine the details of the competitive bidding process and we anticipate that the fund will likely be operational in 2019.
BCE Inc. 2017 ANNUAL REPORT 91 |
|
| | | | |
8 | MD&A | Regulatory environment | |
| NATIONAL WIRELESS SERVICES CONSUMER CODE |
On June 3, 2013, the CRTC issued Telecom Regulatory Policy CRTC 2013-271, which established the Wireless Code. The Wireless Code applies to all wireless services provided to individual and small business consumers (i.e. businesses that on average spend less than $2,500 per month on telecom services) in all provinces and territories.
The Wireless Code regulates certain aspects of the provision of wireless services. Most notably, the Wireless Code prevents wireless service providers from charging an early cancellation fee after a customer has been under contract for 24 months and requires providers to recover any handset subsidies in two years or less. These requirements have effectively removed contracts with terms greater than two years from the marketplace.
On June 15, 2017, the CRTC issued Telecom Regulatory Policy CRTC 2017-200, making targeted changes to the Wireless Code, effective December 1, 2017, and clarifying existing rules. The revisions to the Wireless Code prevent service providers from selling locked devices, increase voice, text and data usage allowances for customers to try out their services during the mandatory 15-day buyer’s trial period for purchased devices, and establish additional controls related to data overage and data roaming charges, among other things. These changes have had an adverse effect on our wireless business.
| PROCEEDINGS REGARDING WHOLESALE DOMESTIC WIRELESS SERVICES |
In Telecom Regulatory Policy CRTC 2015-177, the CRTC mandated Bell Mobility, Rogers Communications Partnership (now Rogers Communications Canada Inc.) and TELUS to issue tariffs to introduce new domestic wholesale roaming services for purchase by non-national wireless service providers (NNWPs). The terms of our tariff were approved by the CRTC in Telecom Decision CRTC 2017-56 (Decision 2017-56). Approval for the rates that we have proposed remains pending. If the CRTC mandates rates that are materially different from the rates we have proposed, this could improve the business position of our competitors and have a negative impact on our wireless business.
On June 1, 2017, the Federal Cabinet issued an Order to the CRTC directing it to reconsider certain determinations made in Decision 2017-56. In Decision 2017-56, the CRTC determined that Bell Mobility, Rogers Communications Canada Inc. and TELUS were required to provide “incidental” access to their networks and not “permanent” access as part of the mandated roaming service. The CRTC also determined that the use of generally available public Wi-Fi does not form part of a NNWP’s home network for the purpose of establishing what constitutes incidental roaming access, since public Wi-Fi facilities represent infrastructure that is not necessarily owned, operated or controlled by a NNWP. As a result, NNWPs may not rely on the use of public Wi-Fi facilities to be eligible to purchase incidental roaming services. Among other things, the Federal Cabinet has asked the CRTC to consider whether allowing an end-user’s connectivity to public Wi-Fi to count as connectivity to a NNWP’s home network would make Canadian wireless services more affordable, and whether any affordability gains associated with such a changed rule would outweigh any disincentives for the national carriers to continue to invest in their networks. The Federal Cabinet’s Order requires the CRTC to report back to the Cabinet by March 31, 2018. It is unclear what, if any, new rules the CRTC may adopt in reconsidering Decision 2017-56. Moreover, it is unclear what, if any, impact such new rules may have on Bell’s wireless business.
| MANDATED WHOLESALE ACCESS TO FTTP NETWORKS |
On July 22, 2015, in Telecom Regulatory Policy CRTC 2015-326, the CRTC mandated the introduction of a new disaggregated wholesale high-speed access service, including over FTTP facilities, which had previously been exempt from mandated wholesale high-speed access. While this new service is mandated for all major incumbent telephone companies and cable carriers, the first stage of its implementation is to take place only in Ontario and Québec, our two largest markets. This adverse regulatory decision may impact the specific nature, magnitude, location and timing of our future FTTP investment decisions. In particular, the introduction by the CRTC of mandated wholesale services over FTTP will undermine the incentives for facilities-based digital infrastructure providers to invest in next-generation wireline networks, particularly in smaller communities and rural areas.
On September 20, 2016, the CRTC issued Telecom Decision CRTC 2016-379, in which it largely adopted our proposals concerning the technical design of our future disaggregated wholesale high-speed access service. On August 29, 2017, in Telecom Order CRTC 2017-312, the CRTC set interim rates for these services. The interim rates determined by the CRTC are essentially similar to those we proposed; however, the final rates remain to be determined. The mandating of final rates that are materially different from the rates we proposed could improve the business position of our competitors and further impact our investment strategy.
| 92 BCE Inc. 2017 ANNUAL REPORT |
|
| | | | |
| | 8 | MD&A | Regulatory environment |
| PROPOSED EXPANSION OF AGGREGATED WHOLESALE ACCESS REGIME TO FTTP NETWORKS |
On March 30, 2017, the Canadian Network Operators Consortium Inc. (CNOC) applied to the CRTC for an expansion of the aggregated wholesale high-speed access regime, which mandates aggregated access to FTTN facilities, to also include aggregated access to FTTP facilities. CNOC argued that aggregated access to FTTP facilities was necessary in order for competitors to offer high-speed services in areas where aggregated FTTN service is not available and only FTTP facilities are present to support the delivery of high-speed services. On February 2, 2018, the CRTC issued Telecom Decision CRTC 2018-44, in which it rejected CNOC’s application. The CRTC found that the exemption of FTTP facilities from aggregated access has limited impacts on competitors’ ability to compete in the retail market, and that the adoption of CNOC’s proposal would undermine the CRTC’s desired transition to a disaggregated access regime.
| REVIEW OF WHOLESALE FTTN HIGH-SPEED ACCESS SERVICE RATES |
As part of its ongoing review of wholesale Internet rates, on October 6, 2016 the CRTC significantly reduced, on an interim basis, some of the wholesale rates that Bell Canada and other major providers charge for access by ISPs to FTTN or cable networks, as applicable. Should such substantially lowered wholesale rates remain in place in the long-term and, in addition, should the interim rates be made retroactive, the business position of some of our competitors could improve, adversely affecting our financial performance, and our investment strategy could change, especially in relation to investment in next-generation wireline networks, particularly in smaller communities and rural areas.
| CANADA’S TELECOMMUNICATIONS FOREIGN OWNERSHIP RULES |
Under theTelecommunications Act, there are no foreign investment restrictions applicable to TCCs that have less than a 10% share of the total Canadian telecommunications market as measured by annual revenues. However, foreign investment in telecommunications companies can still be refused by the government under theInvestment Canada Act. The absence of foreign ownership restrictions on such small or new entrant TCCs could result in more foreign companies entering the Canadian market, including by acquiring spectrum licences or Canadian TCCs.
TheBroadcasting Actoutlines the broad objectives of Canada’s broadcasting policy and assigns the regulation and supervision of the broadcasting system to the CRTC. Key policy objectives of theBroadcasting Actare to protect and strengthen the cultural, political, social and economic fabric of Canada and to encourage the development of Canadian expression.
Most broadcasting activities require a programming or broadcasting distribution licence from the CRTC. The CRTC may exempt broadcasting undertakings from complying with certain licensing and regulatory requirements if it is satisfied that non-compliance will not materially affect the implementation of Canadian broadcasting policy. A corporation must also meet certain Canadian ownership and control requirements to obtain a broadcasting or broadcasting distribution licence, and corporations must have the CRTC’s approval before they can transfer effective control of a broadcasting licensee.
Our TV distribution operations and our TV and radio broadcasting operations are subject to the requirements of theBroadcasting Act, the policies and decisions of the CRTC and their respective broadcasting licences. Any changes in theBroadcasting Act, amendments to regulations or the adoption of new ones, or amendments to licences, could negatively affect our competitive position or the cost of providing services.
| THE TELEVISION SERVICE PROVIDER CODE |
On January 7, 2016, the CRTC issued Broadcasting Regulatory Policy CRTC 2016-1, which established the Television Service Provider Code (the TV Code). The TV Code came into force on September 1, 2017 and requires all regulated television service providers, as well as exempt television service providers that are affiliated with a regulated service provider, to observe certain rules concerning their consumer agreements for television services. The TV Code does not apply to other exempt providers, such as OTT providers not affiliated with a regulated service provider.
The TV Code specifically imposes requirements relating to the clarity of offers, the content of contracts, trial periods for persons with disabilities, how consumers can change their programming options, and when services may be disconnected, among other things.
As part of Broadcasting Regulatory Policy CRTC 2016-1, the CRTC also expanded the mandate of the Commissioner for Complaints for Telecommunications Services, now the Commission for Complaints for Telecom-Television Services (CCTS), to include the administration of the TV Code and to enable the CCTS to accept consumer complaints about television services.
BCE Inc. 2017 ANNUAL REPORT 93 |
|
| | | | |
8 | MD&A | Regulatory environment | |
| CHANGES TO SIMULTANEOUS SUBSTITUTION |
In Broadcasting Regulatory Policy CRTC 2015-25, the CRTC announced that it would eliminate simultaneous substitution for the Super Bowl starting in 2017. This decision was implemented in Broadcasting Order CRTC 2016-335 (the Order).
Bell Canada and Bell Media appealed the application of the Order to the Federal Court of Appeal, as did the NFL. Bell Canada and Bell Media argued that the CRTC does not have jurisdiction under theBroadcasting Actto ban simultaneous substitution for the Super Bowl and that doing so constitutes unauthorized retrospective regulation and interference with Bell Media’s vested economic rights. In a decision rendered on December 18, 2017, the Federal Court of Appeal denied the applications of Bell Media and Bell Canada, and that of the NFL, deferring to the CRTC’s discretion as to how competing broadcasting policy objectives should be balanced. On January 3, 2018, Bell Canada and Bell Media filed for leave to appeal the Federal Court of Appeal’s decision to the Supreme Court of Canada on an expedited basis. Bell Canada and Bell Media additionally sought a stay of the Order. On January 24, 2018, theSupreme Court of Canada denied the request for a stay of the Order, but agreed to hear our application for leave, and our appeal should leave be granted, on an expedited basis. We expect a decision on our leave application in the coming months.
On August 1, 2017, BCE filed an application with the CRTC requesting that it rescind the Order, arguing that there have been significant negative economic and cultural impacts resulting from the Order. The application is supported by the NFL along with national union Unifor, the Alliance of Canadian Cinema, Television and Radio Artists, the Association of Canadian Advertisers and the Canadian Media Directors’ Council.
The CRTC’s decision to eliminate simultaneous substitution for the Super Bowl has had an adverse impact on Bell Media’s conventional TV business and financial results, as a result of a reduction in viewership and advertising revenues. Such impacts will continue throughout the duration of our contract term with the NFL unless the CRTC’s Order is rescinded.
In Broadcasting Regulatory Policy CRTC 2015-438, the CRTC announced it would implement a new Wholesale Code to govern the commercial arrangements between BDUs, programming services and digital media services, including imposing additional restrictions on the sale of TV channels at wholesale and the carriage of TV channels by BDUs. Bell Canada and Bell Media have appealed the decision to the Federal Court of Appeal, arguing that the CRTC’s implementation of the Wholesale Code conflicts with theCopyright Actand is outside the CRTC’s jurisdiction under theBroadcasting Act. The appeal was heard on November 14, 2017, and a decision is expected in 2018.
On May 15, 2017, the CRTC issued decisions in which it renewed the TV licences held by the large English-language and French-language ownership groups, including those owned by Bell Media. The CRTC’s decisions were generally positive for Bell Media as no adverse conditions of licence were imposed that could have negatively affected our business and financial performance.
In its renewals for the large English-language ownership groups (Broadcasting Decisions CRTC 2017-148 to 2017-151), the CRTC set symmetrical spending requirements across each licensing group for both Canadian programming (minimum 30% of revenues) and certain categories of programs of national interest (minimum 5% of revenues). Given that the new symmetrical requirements for spending on programs of national interest were lower than the pre-existing requirements for certain ownership groups (including Bell Media), several of the associations that represent creative groups are concerned about what they perceive will be a reduction in spending on this category of programming. Consequently, they filed petitions pursuant to section 28(1) of theBroadcasting Act, requesting that the Federal Cabinet set aside the decisions or refer them back to the CRTC for reconsideration.
In its renewals for the large French-language ownership groups (Broadcasting Decisions CRTC 2017-143 to 2017-147), the CRTC set minimum spending requirements for each group on a case-by-case basis, in accordance with recent historical levels. However, the Government of Québec and several of the associations that represent creative groups are concerned that the CRTC did not also set a specific minimum spending requirement relating to original French-language production. Consequently, they also filed petitions pursuant to section 28(1) of theBroadcasting Act, requesting that the Federal Cabinet refer the decisions back to the CRTC for reconsideration.
On August 14, 2017, the Federal Cabinet referred the English-language and French-language renewal decisions back to the CRTC for reconsideration to ensure that appropriate contributions are made to the creation and presentation of programs of national interest, original French-language programming and music programming, as well as short films and documentaries. The decisions remain in effect while the CRTC conducts its reconsideration process. Should the CRTC alter the current conditions of licence in an adverse manner, it could have a negative effect on Bell Media’s business and financial performance going forward.
| 94 BCE Inc. 2017 ANNUAL REPORT |
|
| | | | |
| | 8 | MD&A | Regulatory environment |
| CRTC REPORT ON FUTURE PROGRAMMING DISTRIBUTION MODELS |
On September 27, 2017, the Governor in Council, at the recommendation of the Minister of Canadian Heritage, issued a direction to the CRTC asking it to examine the distribution model or models of programming that are likely to exist in the future, how Canadians would access that programming, and the extent to which those models will ensure a vibrant domestic market that is capable of supporting the continued creation, production and distribution of Canadian programming, including original entertainment and information programming. The CRTC launched its public consultation on October 12, 2017, and is required to provide its report no later than June 1, 2018. The Minister of Canadian Heritage indicated that the CRTC’s report will be used to inform a future review of theBroadcasting Actand theTelecommunications Act. At this time, it is unclear how the CRTC’s report, or future legislative reviews, may impact our business.
| 8.4 Radiocommunication Act |
ISED regulates the use of radio spectrum under theRadiocommunication Actto ensure that radiocommunication in Canada is developed and operated efficiently. All companies wishing to operate a wireless system in Canada must hold a spectrum licence to do so. Under theRadiocommunication Regulations, companies that are eligible for radio licences, such as Bell Canada and Bell Mobility, must meet the same ownership requirements that apply to companies under theTelecommunications Act.
| 600 MHZ SPECTRUM CONSULTATION |
ISED is currently in the process of repurposing the 600 MHz band, which is currently being used primarily by over-the-air TV broadcasters for TV transmission, for mobile use. As part of the transition, TV broadcasters must be moved off the 600 MHz spectrum. In April 2017, ISED released its new digital television allotment plan, developed jointly with the U.S. regulatory authorities. The transition of broadcasters off 600 MHz spectrum will have an impact on Bell Media TV broadcasting stations; however, the extent of such impact is not yet known.
On August 4, 2017, ISED released a consultation paper seeking input regarding a technical, policy and licensing framework to govern the auction of spectrum licences in the 600 MHz band for mobile use. The consultation paper indicates that ISED is proposing to auction 70 MHz of spectrum (30 MHz of which would be set aside for set-aside-eligible entities) using an auction format similar to that used in the 700 MHz and 2500 MHz spectrum auctions. The set-aside spectrum can only be transferred to set-aside-eligible entities for the first five years. ISED proposes that the auctioned licences will have a 20-year term and be subject to certain deployment requirements requiring licensees to provide network coverage to a certain percentage of the population in each licence area at five, 10 and 20 years following licence issuance. ISED has not yet indicated when the auction will take place.
While the potential overall impact of the proposed auction framework is not known at the present time, the adoption of the set-aside provisions outlined in the consultation paper would limit the amount of spectrum that Bell Mobility can bid on. A decision on the consultation remains pending.
| CONSULTATION ON RELEASING MILLIMETRE WAVE SPECTRUM TO SUPPORT 5G |
On June 5, 2017, ISED launched a consultation entitled “Consultation on Releasing Millimetre Wave Spectrum to Support 5G”. The consultation addresses the use of three key frequency bands, namely 28 GHz, 37-40 GHz and 64-71 GHz for possible 5G deployment. ISED has sought comments on a number of key technical and licensing policy considerations for the use of the above noted spectrum. As 5G is expected to be the next major advancement in mobile telecommunications standards, access to the millimetre spectrum will be important in order to facilitate the development and adoption of 5G technology. A decision on the consultation remains pending.
| RENEWAL OF AWS-1 AND PCS G BLOCK AND I BLOCK SPECTRUM LICENCES |
On February 15, 2018, ISED released its spectrum licence renewal process for the AWS-1 and the personal communications services (PCS) G Block and I Block spectrum. These spectrum licences were auctioned in 2008 with a ten-year term and begin to expire in December 2018. In its decision, ISED indicated that, where all conditions of licence have been met, licensees will be eligible for new spectrum licences. Compliant AWS-1 and G Block licensees will be eligible for new licences with a 20-year term and compliant I Block licensees will be eligible for new licences with a 10-year term. As part of the renewal process, ISED set population coverage targets that apply within the first eight years of the new licence term and a second set of population coverage targets that apply by the end of the 20-year licence term. As indicated in the consultation, the population targets are based on smaller geographic licensing areas.
BCE Inc. 2017 ANNUAL REPORT 95 |
|
| | | | |
8 | MD&A | Regulatory environment | |
| AUCTION OF RESIDUAL SPECTRUM LICENCES |
On December 19, 2017, ISED released a decision entitled “Licensing Framework for Residual Spectrum Licences in the 700 MHz, 2500 MHz, 2300 MHz and PCS G Bands”. For residual licences in the 700 MHz and 2500 Mhz bands, ISED will impose the same aggregation limits that were in place for the primary auctions of these bands in 2014 and 2015, respectively. The licensing framework has set a sealed-bid auction with bids due on May 15, 2018.
| CONSULTATION ON THE SPECTRUM OUTLOOK 2018 TO 2022 |
On October 6, 2017, ISED initiated a consultation entitled “Consultation on the Spectrum Outlook 2018 to 2022”. The outcome of this consultation is intended to provide a roadmap for ISED to follow in making spectrum available over the next five years. As part of this consultation, ISED is seeking views on how it should change its licensing regime, how much spectrum will be required in the future, and how technology is evolving, among other things. It is unclear what, if any, impacts the results of this consultation could have on our business.
Among other things, theBell Canada Actlimits how Bell Canada voting shares and Bell Canada facilities may be sold or transferred. Specifically, under theBell Canada Act, the CRTC must approve any sale or other disposal of Bell Canada voting shares that are held by BCE, unless the sale or disposal would result in BCE retaining at least80% of all of the issued and outstanding voting shares of Bell Canada. Except in the ordinary course of business, the sale or other disposal of facilities integral to Bell Canada’s telecommunications activities must also receive CRTC approval.
| 8.6 Other key legislation |
PERSONAL INFORMATION PROTECTION AND ELECTRONIC DOCUMENTS ACT
On June 18, 2015, thePersonal Information Protection and Electronic Documents Actwas amended to include mandatory notification requirements that must be followed in relation to the loss or unauthorized disclosure of personal information held by an organization resulting from a breach of the organization’s security safeguards. Failure to comply with these notification requirements, or to log security breaches, may result in a fine of up to $100,000 per occurrence. These provisions dealing with notification requirements will come into force when related regulations are brought into force.
On September 28, 2017, the Office of the Privacy Commissioner of Canada (OPC) issued its Notice of Consultation and Call for Comments on Draft Consent Guidance Documents. The specific guidance documents at issue in this consultation are entitled “Draft Guidelines: Obtaining Meaningful Online Consent” and “Draft Guidelines: Inappropriate Data Practices – Interpretation and Application of Subsection 5(3)”. The OPC is expected to issue final guidelines later this year. The OPC’s guidelines could have significant impacts concerning how personal information may be collected, used and disclosed for analytics and marketing purposes.
| CANADA’S ANTI-SPAM LEGISLATION |
Federal legislation referred to as Canada’s anti-spam legislation (CASL) came into force on July 1, 2014. Pursuant to CASL, commercial electronic messages can be sent only if the recipient has provided prior consent and the message complies with certain formalities, including the ability to unsubscribe easily from subsequent messages. As of January 15, 2015, CASL also requires that an organization have prior informed consent before downloading software to an end-user’s computer. Penalties for non-compliance include administrative monetary penalties of up to $10 million.
While CASL is also intended to provide individual Canadians with a private right of action to commence proceedings for statutory damages in relation to instances of non-compliance, these provisions were deferred indefinitely from coming into force by the Federal Cabinet on June 2, 2017.
On December 13, 2017, the Federal Government passed a motion in Parliament to formally launch a review of theCopyright Act. This review is mandated by theCopyright Actitself, which requires that the legislation be examined every five years. The Standing Committee on Industry,Science and Technology, working in collaboration with the Standing Committee on Canadian Heritage, will lead the process, beginning in early 2018. At this time, the impact of any potential amendments on our business is unknown.
| 96 BCE Inc. 2017 ANNUAL REPORT |
|
| | | | |
| | 9 | MD&A | Business risks |
A risk is the possibility that an event might happen in the future that could have a negative effect on our financial position, financial performance, cash flows, business or reputation. The actual effect of any event could be materially different from what we currently anticipate. The risks described in this MD&A are not the only ones that could affect us. Additional risks and uncertainties not currently known to us or that we currently deem to be immaterial may also materially and adversely affect our financial position, financial performance, cash flows, business or reputation.
This section describes the principal business risks that could have a material adverse effect on our financial position, financial performance, cash flows, business or reputation, and cause actual results or events to differ materially from our expectations expressed in, or implied by, our forward-looking statements. As indicated in the table below, certain of these principal business risks have already been discussed in other sections of this MD&A, and we refer the reader to those sections for a discussion of such risks. All of the risk discussions set out in the sections referred to in the table below are incorporated by reference in this section 9.
RISKS DISCUSSED IN OTHER
SECTIONS OF THIS MD&A | SECTION REFERENCES |
Competitive environment | Section 3.3,Principal business risks
Section 5,Business segment analysis(Competitive landscape and industry trendssectionfor each segment) |
Regulatory environment | Section 3.3,Principal business risks
Section 8,Regulatory environment |
Security management | Section 3.3,Principal business risks |
Risks specifically relating to our Bell Wireless,
Bell Wireline and Bell Media segments | Section 5,Business segment analysis(Principal business riskssection for each segment) |
The other principal business risks that could also have a material adverse effect on our financial position, financial performance, cash flows, business or reputation are discussed below.
| TECHNOLOGY/INFRASTRUCTURE TRANSFORMATION |
The failure to optimize network and IT deployment and upgrade timelines, accurately assess the potential of new technologies, or invest and evolve in the appropriate direction could have an adverse impact on our business and financial results
Globalization, increased competition and ongoing technological advances are driving customer expectations of faster market responses, enhanced user experiences and cost-effective delivery. Meeting these expectations requires the deployment of new service and product technologies that are network-neutral and based on a more collaborative and integrated development environment. Change can be difficult and may present unforeseen obstacles that might impact successful execution, and this transition is made more challenging by the complexity of our multi-product environment, combined with the complexity of our network and IT structures. In addition, new technologies may quickly become obsolete or their launch may be delayed. The failure to optimize network and IT deployment and upgrade timelines, in light of customer demand and competitor activities, to accurately assess the potential of new technologies, or to invest and evolve in the appropriate direction in an environment of changing business models could have an adverse impact on our business and financial results.
In particular, our network and IT evolution activities seek to leverage new as well as evolving and developing technologies, including network functions virtualization, software-defined networks and cloud technologies, and to transform our network and systems to achieve our objectives of becoming more agile in our service delivery and operations as well as providing self-serve and instant-on capabilities for our customers, ensuring best quality and customer experience, and developing a new network infrastructure that enables a competitive cost structure and rapidly growing capacity. These evolution activities require an operational and cultural shift. Alignment across technology, product development and operations is increasingly critical to ensure appropriate trade-offs and optimization of capital allocation.
If this cannot be achieved in accordance with our deployment schedules while maintaining network availability and performance through the migration process, we may lose customers as a result of poor service performance, which could adversely affect our ability to achieve our operational and financial objectives. Failure to leverage IP across all facets of our network and product and service portfolio could inhibit a fully customer-centric approach, limiting or preventing comprehensive self-serve convenience, real-time provisioning, cost savings and flexibility in delivery and consumption, leading to negative business and financial outcomes.
Parallel to our focus on next-generation investment, adverse regulatory decisions may impact the specific nature, magnitude, location and timing of investment decisions. In particular, the introduction by the CRTC of mandated wholesale services over FTTP or wireless networks will undermine the incentives for facilities-based digital infrastructure providers to invest in next-generation wireline and wireless networks, particularly in smaller communities and rural areas. Failure to continue investment in next-generation capabilities in a disciplined and strategic manner, including real-time information-based customer service strategies, could limit our ability to compete effectively and achieve desired business and financial results.
Other examples of risks affecting achievement of our desired technology/ infrastructure transformation include:
- Network construction and deployment on municipal or private propertyrequires the issuance of municipal or property owner consents,respectively, for the installation of network equipment, which couldcause delays in FTTP rollout
BCE Inc. 2017 ANNUAL REPORT 97 |
|
| | | | |
9 | MD&A | Business risks | |
- The increasing dependence on apps for content delivery, sales,customer engagement and service experience drives the need fornew and scarce capabilities (sourced internally or externally), whichmay not be available, as well as the need for associated operatingprocesses integrated into ongoing operations
- New products, services or apps could reduce demand for our existing,more profitable service offerings or cause prices for those services todecline, and could result in shorter estimated useful lives for existingtechnologies, which could increase depreciation and amortizationexpense
- As consumption habits evolve and TV viewing alternatives expand,our ability to develop alternative delivery vehicles, which may require significant software development and network investment, in orderto compete in new markets is essential to maintaining customerengagement and revenue streams
- We must be able to leverage new opportunities, such as thoseintroduced by “big data”, which is subject to many challenges, includingevolving customer perceptions as well as legal and regulatorydevelopments in order to meet our business objectives. If we cannotbuild market-leading competencies in this field across sales, serviceand operational platforms that respect societal values and legal andregulatory requirements, we may miss important opportunities togrow our business through enhanced market intelligence and a moreproactive customer service model.
Driving a positive customer experience in all aspects of our engagement with customers by embracing new approaches and challenging operational limitations is important to avoid adverse impacts on our business and financial performance
As the bar continues to be raised based on customers’ evolving expectations of service and value, failure to get ahead of such expectations and build a more robust service experience could hinder products and services differentiation and customer loyalty. With the proliferation of connectivity services, apps and devices, customers are accustomed to doing things when, how and where they want through websites, self-serve options, web chat, call centres, Facebook, Twitter and other social media forums. Failure to embrace these new media in a positive way, incorporate them into multiple elements of our service delivery and ensure that we understand their potential impact on customer perceptions could adversely affect our reputation and brand value. As the foundation of effective customer service stems from our ability to deliver simple solutions to customers in an expeditious manner, on mutually agreeable terms, complexity in our operations resulting from multiple technology platforms, billing systems, marketing databases and a myriad of rate plans, promotions and product offerings may limit our ability to respond quickly to market changes and reduce costs, and may lead to customer confusion or billing errors, which could adversely affect customer satisfaction, acquisition and retention. While speed of service evolution is critical to a competitive differentiation, it must not be achieved at the expense of the quality of our service offerings or of our brand.
Our networks, IT systems and data centre assets are the foundation of high-quality consistent services which are critical to meeting service expectations
Our ability to provide consistent wireless, wireline, media broadcasting, satellite and data centre services to customers in a complex and constantly changing operating environment is crucial for sustained success. In particular, network capacity demands for TV and other bandwidth-intensive applications on our Internet and wireless networks have been growing at unprecedented rates. Unexpected capacity pressures on our networks may negatively affect our network performance and our ability to provide services. Issues relating to network availability, speed, consistency and traffic management on our more current as well as our aging networks could have an adverse impact on our business and financial performance.
In addition, we currently use a very large number of interconnected operational and business support systems including for provisioning, networking, distribution, broadcast management, billing and accounting, which may restrain our operational efficiency. If we fail to implement or maintain highly effective customer-facing IT systems supported by an effective governance and operating framework, this may lead to inconsistent performance and dissatisfied customers, which over time could result in higher churn.
Further examples of risks to operational performance that could impact our reputation, business operations and financial performance include the following:
- We may need to incur significant capital expenditures beyond thosealready anticipated by our capital intensity target in order to provideadditional capacity and reduce network congestion on our wireline and wireless networks, and we may not be able to generate sufficient cashflows or raise the capital we need to fund such capital expenditures,which may result in service degradation
- Corporate restructurings, system replacements and upgrades, processredesigns and the integration of business acquisitions may not deliverthe benefits contemplated and could adversely impact our ongoingoperations
- If we fail to streamline our significant IT legacy system portfolio andproactively improve operating performance, this could adverselyaffect our business and financial outcomes
- There may be a lack of competent and cost-effective resources toperform the life-cycle management and upgrades necessary tomaintain the operational status of legacy networks
Our operations and business continuity depend on how well we protect, test, maintain and replace our networks, IT systems, equipment and other facilities
Our operations depend on how well we and our contracted service providers protect our networks and IT systems, as well as other infrastructure and facilities, against damage from fire, natural disaster (including, without limitation, seismic and severe weather-related events such as ice, snow and wind storms, flooding, hurricanes, tornadoes and tsunamis), power loss, building cooling loss, unauthorized access or entry, cyber threats, disabling devices, acts of war or terrorism, sabotage, vandalism, actions of neighbours and other events. Establishing response strategies and business continuity protocols to maintain service consistency if any disruptive event materializes is critical to the achievement of effective customer service. Any of the above-mentioned events, as well as the failure to complete planned and sufficient testing,
| 98 BCE Inc. 2017 ANNUAL REPORT |
|
| | | | |
| | 9 | MD&A | Business risks |
maintenance or replacement of our networks, equipment and other facilities, could disrupt our operations (including through disruptions such as network failures, billing errors or delays in customer service), require significant resources and result in significant remediation costs, which in turn could have an adverse effect on our business and financial performance, or impair our ability to keep existing subscribers or attract new ones.
Satellites used to provide our satellite TV services are subject to significant operational risks that could have an adverse effect on our business and financial performance
Pursuant to a set of commercial arrangements between Bell ExpressVu and Telesat Canada (Telesat), we currently have two satellites under contract with Telesat. Telesat operates or directs the operation of these satellites, which utilize highly complex technology and operate in the harsh environment of space and are therefore subject to significant operational risks while in orbit. These risks include in-orbit equipment failures, malfunctions and other problems, commonly referred to as anomalies, that could reduce the commercial usefulness of a satellite used to provide our satellite TV services. Acts of war or terrorism, magnetic, electrostatic or solar storms, and space debris or meteoroids could also damage such satellites. Any loss, failure, manufacturing defect, damage or destruction of these satellites, of our terrestrial broadcasting infrastructure or of Telesat’s tracking, telemetry and control facilities to operate the satellites could have an adverse effect on our business and financial performance and could result in customers terminating their subscriptions to our DTH satellite TV service.
Our employees and contractors are key resources, and there is a broad and complex range of risks that must be managed effectively to drive a winning corporate culture and outstanding performance
Our business depends on the efforts, engagement and expertise of our management and non-management employees and contractors, who must be able to operate safely and securely based on the tasks they are completing and the environment in which they are functioning. If we fail to achieve this basic expectation, this could adversely affect our organizational culture, reputation and financial results as well as our ability to attract high-performing team members. Competition for highly skilled team members is intense, which makes the development of approaches to identify and secure high-performing candidates for a broad range of job functions, roles and responsibilities essential. Failure to appropriately train, motivate, remunerate or deploy employees on initiatives that further our strategic imperatives, or to efficiently replace retiring employees, could have an adverse impact on our ability to attract and retain talent and drive performance across the organization. The positive engagement of members of our team represented by unions is contingent on negotiating collective agreements that deliver competitive labour conditions and uninterrupted service, both of which are critical to achieving our business objectives. In addition, if the skill sets, diversity and size of the workforce do not match the operational requirements of the business and foster a winning culture, we will likely not be able to sustain our performance.
Other examples of people-related risks include the following:
- The increasing technical and operational complexity of our businessesand the high demand in the market for skilled technical resourcescreate a challenging environment for hiring, retaining and developingsuch skilled technical resources
- Failure to establish a complete and effective succession plan, includingpreparation of internal talent and identification of potential externalcandidates where relevant for key roles, could impair our businessuntil qualified replacements are found
- Approximately 45% of our employees are represented by unionsand are covered by collective bargaining agreements. Renegotiatingcollective bargaining agreements could result in higher labour costs,project delays and work disruptions, including work stoppages or workslowdowns, which could adversely affect service to our customersand, in turn, our customer relationships and financial performance.
- Ensuring the safety and security of our workforce operating indifferent environments, including manholes, telephone poles, celltowers, vehicles, foreign news bureaus and war zones, requires focus,effective processes and flexibility to avoid injury, service interruption,fines and reputational impact
- Deterioration in employee morale and engagement resulting fromstaff reductions, ongoing cost reductions or reorganizations couldadversely affect our business and financial results
If we are unable to raise the capital we need or generate sufficient cash flows from operations, we may need to limit our capital expenditures or our investments in new businesses, or try to raise capital by disposing of assets
Our ability to meet our cash requirements, fund capital expenditures and provide for planned growth depends on having access to adequate sources of capital and on our ability to generate cash flows from operations, which is subject to various risks, including those described in this MD&A.
Our ability to raise financing depends on our ability to access the public equity, debt capital and money markets, as well as the bank credit market. Our ability to access such markets and the cost and amount of funding available depend largely on prevailing market conditions and the outlook for our business and credit ratings at the time capital is raised.
Risk factors such as capital market disruptions, political, economic and financial market instability in Canada or abroad, government policies, central bank monetary policies, changes to bank capitalization or other regulations, reduced bank lending in general or fewer banks as a result of reduced activity or consolidation, could reduce capital available or increase the cost of such capital. In addition, an increased level of debt borrowings could result in lower credit ratings, increased borrowing costs and a reduction in the amount of funding available to us, including through equity offerings. Business acquisitions could also adversely affect our outlook and credit ratings and have similar adverse consequences. In addition, participants in the public capital and bank credit markets have internal policies limiting their ability to invest in, or extend credit to, any single entity or entity group or a particular industry.
BCE Inc. 2017 ANNUAL REPORT 99 |
|
| | | | |
9 | MD&A | Business risks | |
Our bank credit facilities, including credit facilities supporting our commercial paper program, are provided by various financial institutions. While it is our intention to renew certain of such credit facilities from time to time, there are no assurances that these facilities will be renewed on favourable terms or in similar amounts.
Differences between BCE’s actual or anticipated financial results and the published expectations of financial analysts, as well as events affecting our business or operating environment, may contribute to volatility in BCE’s securities. A major decline in the capital markets in general, or an adjustment in the market price or trading volumes of BCE’s securities, may negatively affect our ability to raise debt or equity capital, retain senior executives and other key employees, make strategic acquisitions or enter into joint arrangements.
If we cannot access the capital we need or generate cash flows to implement our business plan or meet our financial obligations on acceptable terms, we may have to limit our ongoing capital expenditures and our investment in new businesses or try to raise additional capital by selling or otherwise disposing of assets. Any of these could have an adverse effect on our cash flows from operations and on our growth prospects.
We cannot guarantee that BCE’s dividend policy will be maintained or that dividends will be declared
From time to time, the BCE Board reviews the adequacy of BCE’s dividend policy with the objective of allowing sufficient financial flexibility to continue investing in our business while growing returns to shareholders. Under the current dividend policy, increases in the common share dividend are directly linked to growth in BCE’s free cash flow. BCE’s dividend policy and the declaration of dividends on any of its outstanding shares are subject to the discretion of the BCE Board and, consequently, there can be no guarantee that BCE’s dividend policy will be maintained or that dividends will be declared. The declaration of dividends by the BCE Board is ultimately dependent on BCE’s operations and financial results which are, in turn, subject to various assumptions and risks, including those set out in this MD&A.
We are exposed to various credit, liquidity and market risks
Our exposure to credit, liquidity and market risks, including equity price, interest rate and currency fluctuations, is discussed in section 6.5,Financial risk managementof this MD&A and in Note 24 of BCE’s 2017 consolidated financial statements.
Our failure to identify and manage our exposure to changes in interest rates, foreign exchange rates (especially the weakening of the Canadian dollar), BCE’s share price and other market conditions could lead to missed opportunities, reduced profit margins, cash flow shortages, inability to complete planned capital expenditures, reputational damage, equity and debt securities devaluations and challenges in raising capital on market-competitive terms.
The economic environment, pension rules or ineffective governance could have an adverse effect on our pension obligations, liquidity and financial performance, and we may be required to increase contributions to our post-employment benefit plans in the future
With a large pension plan membership and DB pension plans that are subject to the pressures of the global economic environment and changing regulatory and reporting requirements, our pension obligations are exposed to potential volatility. Failure to recognize and manage economic exposure and pension rule changes or to ensure that effective governance is in place for management and funding of pension plan assets and obligations could have an adverse impact on our liquidity and financial performance.
The funding requirements of our post-employment benefit plans, based on valuations of plan assets and obligations, depend on a number of factors, including actual returns on post-employment benefit plan assets, long-term interest rates, plan demographics, and applicable regulations and actuarial standards. Changes in these factors could cause future contributions to significantly differ from our current estimates and could require us to increase contributions to our post-employment benefit plans in the future and, therefore, could have a negative effect on our liquidity and financial performance.
There is no assurance that the assets of our post-employment benefit plans will earn their assumed rate of return. A substantial portion of our post-employment benefit plans’ assets is invested in public equity and debt securities. As a result, the ability of our post-employment benefit plans’ assets to earn the rate of return that we have assumed depends significantly on the performance of capital markets. Market conditions also impact the discount rate used to calculate our solvency obligations and could therefore also significantly affect our cash funding requirements.
Our expected funding for 2018 is in accordance with the latest post-employment benefit plan valuations as of December 31, 2016, filed in June 2017, and takes into account voluntary contributions of $100 million in 2017.
Income and commodity tax amounts may materially differ from the expected amounts
Our complex business operations are subject to various tax laws, and the adoption of new tax laws, or regulations or rules thereunder, or changes thereto or in the interpretation thereof, could result in higher tax rates, new taxes or other adverse tax implications. In addition, while we believe that we have adequately provided for all income and commodity taxes based on all of the information that is currently available, the calculation of income taxes and the applicability of commodity taxes in many cases require significant judgment in interpreting tax rules and regulations. Our tax filings are subject to government audits that could result in material changes to the amount of current and deferred income tax assets and liabilities and other liabilities and could, in certain circumstances, result in an assessment of interest and penalties.
The failure to reduce costs as well as unexpected increases in costs could adversely affect our ability to achieve our strategic imperatives and our financial results
Our objectives for targeted cost reductions continue to be aggressive but there is no assurance that we will be successful in reducing costs, especially since incremental cost savings are more difficult to achieve on an ongoing basis. Our cost reduction objectives require aggressive negotiations with our suppliers and there can be no assurance that such negotiations will be successful or that replacement products or services provided will not lead to operational issues.
Examples of risks to our ability to reduce costs or of potential cost increases include:
- Achieving timely cost reductions while moving to an IP-based networkis dependent on disciplined network decommissioning, which canbe delayed by customer contractual commitments, regulatoryconsiderations and other unforeseen obstacles
- Fluctuations in energy prices are partly influenced by governmentpolicies to address climate change which, combined with growingdata demand that increases our energy requirements, could increaseour energy costs beyond our current expectations
- Failure to successfully deliver on our contractual commitments, whetherdue to security events, operational challenges or other reasons, mayresult in financial penalties and loss of revenues
| 100 BCE Inc. 2017 ANNUAL REPORT |
|
| | | | |
| | 9 | MD&A | Business risks |
The failure to evolve practices to effectively monitor and control fraudulent activities could result in financial loss and brand degradation
As a public company with a range of desirable and valuable products and services and 51,679 employees at the end of 2017, fraud requires a disciplined program covering governance, exposure identification and assessment, prevention, detection and reporting that considers corruption, misappropriation of assets and intentional manipulation of financial statements by employees and/or external parties. Fraud events can result in financial loss and brand degradation.
Specific examples relevant to us include:
- Subscription fraud on accounts established with a false identity orpaid with a stolen credit card
- Network usage fraud such as call/sell operations using our wirelineor wireless networks
- Copyright theft and other forms of unauthorized use that underminethe exclusivity of Bell Media’s content offerings, which could potentiallydivert users to unlicensed or otherwise illegitimate platforms, thusimpacting our ability to derive distribution and advertising revenues
- TV distributors including Bell Canada and Bell ExpressVu are subjectto ongoing efforts to steal their services through compromise orcircumvention of signal security systems, causing revenue loss
| DEPENDENCE ON THIRD-PARTY SUPPLIERS |
We depend on third-party suppliers, outsourcers and consultants, some of which are critical, to provide an uninterrupted supply of the products and services we need to operate our business and to comply with various obligations
We depend on key third-party suppliers and outsourcers, over which we have no operational or financial control, for products and services, some of which are critical to our operations. If there are gaps in our supplier governance and oversight models established to ensure full risk transparency at point of purchase and throughout the relationship, including any contract renegotiations, there is the potential for a breakdown in supply, which could impact our ability to make sales, service customers and achieve our business and financial objectives. Some of our third-party suppliers and outsourcers are located in foreign countries, which increases the potential for a breakdown in supply due to the risks of operating in foreign jurisdictions with different laws, geo-political environments, cultures and the potential for localized natural disasters. The outsourcing of services generally involves transfer of risk, and we must take appropriate steps to ensure that the outsourcers’ approach to risk management is aligned with our own standards in order to maintain continuity of supply and brand strength. Further, as cloud-based supplier models continue to evolve, our procurement and vendor management practices must also continue to evolve to fully address associated risk exposures.
In addition, certain company initiatives rely heavily upon professional consulting services provided by third parties, and a failure of such third parties may not be reasonably evident until their work is delivered or delayed. Depending on the size, complexity and level of third-party dependence, remedial strategies may be difficult to implement in respect of any professional consulting services provided by third-parties that are not performed in a proper or timely fashion. Any such difficulty when implementing remedial strategies could result in an adverse effect on our ability to comply with various obligations, including applicable legal and accounting requirements.
Other examples of risks associated with our dependence on third-party suppliers include the following:
- Demand for products and services available from only a limited numberof suppliers, some of which dominate their global market, may lead todecreased availability, increased costs or delays in the delivery of suchproducts and services, since suppliers may choose to favour globalcompetitors that are larger than we are and, accordingly, purchasea larger volume of products and services. In addition, productionissues affecting any such suppliers, or other suppliers, could result indecreased quantities, or a total lack, of supply of products or services.
Any of these events could adversely impact our ability to meet customer commitments and demand.
- Cloud-based solutions may increase the risk of security and dataleakage exposure if security control protocols affecting our suppliersare bypassed
- Failure to maintain strong discipline around vendor administration(especially around initial account setup) may mask potential financialor operational risks and complicate future problem resolutions
- If products and services important to our operations havemanufacturing defects or do not comply with applicable governmentregulations and standards (including product safety practices), ourability to sell products and provide services on a timely basis may benegatively impacted. We work with our suppliers to identify seriousproduct defects (including safety incidents) and develop appropriateremedial strategies. Remedial strategies may include a recall ofproducts. To the extent that a supplier does not actively participate in,and/or bear primary financial responsibility for, a recall of its products,our ability to perform such recall programs at a reasonable cost and/or in a timely fashion may be negatively impacted. Any of the eventsreferred to above could have an adverse effect on our operationsand financial results.
- Products, services, software and other elements of our businesssupplied to us or used in our business operations may contain securityissues including, but not limited to, latent security issues that wouldnot be apparent upon an inspection. When any such security issueis discovered, we seek to identify and develop remedial strategiesboth internally and with our suppliers. Should we or a supplier fail tocorrect a security issue in a timely fashion, there could be an adverseeffect on our business and financial performance.
- Temporary or permanent operational failures or service interruptionsof the networks of other telecommunications carriers and supplierson which we rely to deliver services could adversely affect our abilityto provide services using such carriers’ and suppliers’ networks andcould, consequently, have an adverse effect on our business andfinancial performance
- BCE depends on call centre and technical support services providedby a number of external suppliers and outsourcers, some of which arelocated in foreign countries. These vendors have access to customerand internal BCE information necessary for the support services thatthey provide. Information access and service delivery issues thatare not managed appropriately may have an adverse impact on ourreputation, the quality and speed of services provided to customers,and our ability to address technical issues.
BCE Inc. 2017 ANNUAL REPORT 101 |
|
| | | | |
9 | MD&A | Business risks | |
| LITIGATION AND LEGAL OBLIGATIONS |
Legal proceedings, changes in applicable laws and the failure to proactively address our legal and regulatory obligations could have an adverse effect on our business and financial performance
We become involved in various claims and legal proceedings as part of our business. Plaintiffs are able to launch and obtain certification of class actions on behalf of a large group of people with increasing ease, and securities laws facilitate the introduction of class action lawsuits by secondary market investors against public companies for alleged misrepresentations in public disclosure documents and oral statements. Changes in laws or regulations, or in how they are interpreted, and the adoption of new laws or regulations, as well as pending or future litigation, including an increase in certified class actions which, by their nature, could result in sizeable damage awards and costs relating to litigation, could have an adverse effect on our business and financial performance.
Examples of legal and regulatory obligations that we must comply with include those resulting from:
- As discussed in more detail in section 8,Regulatory environment,decisions, policies and other initiatives of the CRTC, ISED, theCompetition Bureau and other governmental agencies, as well aslaws of a regulatory nature
- Consumer protection and privacy legislation
- Tax legislation
- Corporate and securities legislation
- IFRS requirements
- Environmental protection and health and safety laws
- Payment card industry standards for protection against customercredit card infractions
The failure to comply with any of the above or other legal or regulatory obligations could expose us to litigation, including pursuant to class actions, and significant fines and penalties, as well as result in reputational harm.
For a description of the principal legal proceedings involving us, please see the section entitledLegal proceedingscontained in the BCE 2017 AIF.
| HEALTH AND ENVIRONMENTAL CONCERNS |
Health concerns about radiofrequency emissions from wireless communication devices, as well as epidemics and other health risks, could have an adverse effect on our business
Many studies have been performed or are ongoing to assess whether wireless phones, networks and towers pose a potential health risk. While some studies suggest links to certain conditions, others conclude there is no established causation between mobile phone usage and adverse health effects. In 2011, the International Agency for Research on Cancer (IARC) of the World Health Organization classified radiofrequency electromagnetic fields from wireless phones as possibly carcinogenic to humans, but also indicated that chance, bias or confounding could not be ruled out with reasonable confidence. The IARC also called for additional research into long-term heavy use of mobile phones.
ISED is responsible for approving radiofrequency equipment and performing compliance assessments and has chosen Health Canada’s Safety Code 6, which sets the limits for safe exposure to radiofrequency emissions at home or at work, as its exposure standard. This code also outlines safety requirements for the installation and operation of devices that emit radiofrequency fields such as mobile phones, Wi-Fi technologies and base station antennas. ISED has made compliance to Safety Code 6 mandatory for all proponents and operators of radio installations.
Our business is heavily dependent on radiofrequency technologies, which could present significant challenges to our business and financial performance, such as the following:
- We face current and potential lawsuits relating to alleged adversehealth effects on customers, as well as to our marketing and disclosurepractices in connection therewith, and the likely outcome of suchlawsuits is unpredictable and may change over time
- Changes in scientific evidence and/or public perceptions couldlead to additional government regulations and costs for retrofittinginfrastructure and handsets to achieve compliance
- Public concerns could result in a slower deployment of, or in our inabilityto deploy, infrastructure necessary to maintain and/or expand ourwireless network as required by market evolution
In addition, epidemics, pandemics and other health risks could occur, which could adversely affect our ability to maintain operational networks and provide services to our customers. Any of these events could have an adverse effect on our business and financial performance.
Climate change and other environmental concerns could have an adverse effect on our business
Global climate change could exacerbate certain of the threats facing our business, including the frequency and severity of weather-related events referred to inOperational performance – Our operations and business continuity depend on how well we protect, test, maintain and replace our networks, IT systems, equipment and other facilitiesin this section 9. Several areas of our operations further raise environmental considerations such as fuel storage, greenhouse gas emissions, disposal of hazardous residual materials, and recovery and recycling of end-of-life electronic products we sell or lease. Failure to recognize and adequately respond to changing governmental and public expectations on environmental matters could result in fines, missed opportunities, additional regulatory scrutiny or harm our brand and reputation.
| 102 BCE Inc. 2017 ANNUAL REPORT |
|
| | | | |
| | 10 | MD&A | Financial measures, accounting policies and controls |
| 10 Financial measures, accounting policies and controls |
| 10.1 Our accounting policies |
This section discusses key estimates and assumptions that management has made and how they affect the amounts reported in the financial statements and notes. It also describes key changes in accounting standards and our accounting policies, and how they affect our financial statements.
We have prepared our consolidated financial statements using IFRS. Other significant accounting policies, not involving the same level of measurement uncertainty as those discussed in this section, are nevertheless important to an understanding of our financial statements. See Note 2,Significant accounting policies, in BCE’s 2017 consolidated financial statements for more information about the accounting principles we used to prepare our consolidated financial statements.
| CRITICAL ACCOUNTING ESTIMATES AND KEY JUDGMENTS |
When preparing financial statements, management makes estimates and judgments relating to:
- reported amounts of revenues and expenses
- reported amounts of assets and liabilities
- disclosure of contingent assets and liabilities
We base our estimates on a number of factors, including historical experience, current events and actions that the company may undertake in the future, and other assumptions that we believe are reasonable under the circumstances. By their nature, these estimates and judgments are subject to measurement uncertainty and actual results could differ.
We consider the estimates and judgments described in this section to be an important part of understanding our financial statements because they require management to make assumptions about matters that were highly uncertain at the time the estimates and judgments were made, and changes to these estimates and judgments could have a material impact on our financial statements and our segments.
Our senior management has reviewed the development and selection of the critical accounting estimates and judgments described in this section with the Audit Committee of the BCE Board.
Any sensitivity analysis included in this section should be used with caution as the changes are hypothetical and the impact of changes in each key assumption may not be linear.
Our more significant estimates and judgments are described below.
ESTIMATES
USEFUL LIVES OF PROPERTY, PLANT AND EQUIPMENT AND FINITE-LIFE INTANGIBLE ASSETS
We review our estimates of the useful lives of property, plant and equipment and finite-life intangible assets on an annual basis and adjust depreciation or amortization on a prospective basis, if needed.
Property, plant and equipment represent a significant proportion of our total assets. Changes in technology or our intended use of these assets, as well as changes in business prospects or economic and industry factors, may cause the estimated useful lives of these assets to change.
The estimated useful lives of property, plant and equipment and finite-life intangible assets are determined by internal asset life studies, which take into account actual and expected future usage, physical wear and tear, replacement history and assumptions about technology evolution. When factors indicate that assets’ useful lives are different from the prior assessment, we depreciate or amortize the remaining carrying value prospectively over the adjusted estimated useful lives.
CHANGE IN ACCOUNTING ESTIMATE
In 2017 and 2016, as part of our ongoing annual review of property, plant and equipment and finite-life intangible assets, and to better reflect their useful lives, we increased the estimate of useful lives of certain assets. The changes have been applied prospectively effective January 1, 2017 and January 1, 2016, and did not have a significant impact on our financial statements.
POST-EMPLOYMENT BENEFIT PLANS
The amounts reported in the financial statements relating to DB pension plans and OPEBs are determined using actuarial calculations that are based on several assumptions.
Our actuaries perform a valuation at least every three years to determine the actuarial present value of the accrued DB pension plan and OPEB obligations. The actuarial valuation uses management’s assumptions for, among other things, the discount rate, life expectancy, the rate of compensation increase, trends in healthcare costs and expected average remaining years of service of employees.
While we believe that these assumptions are reasonable, differences in actual results or changes in assumptions could materially affect post-employment benefit obligations and future net post-employment benefit plans cost.
We account for differences between actual and expected results in benefit obligations and plan performance in OCI, which are then recognized immediately in the deficit.
The most significant assumptions used to calculate the net post-employment benefit plans cost are the discount rate and life expectancy.
A discount rate is used to determine the present value of the future cash flows that we expect will be needed to settle post-employment benefit obligations.
The discount rate is based on the yield on long-term, high-quality corporate fixed income investments, with maturities matching the estimated cash flows of the post-employment benefit plans. Life expectancy is based on publicly available Canadian mortality tables and is adjusted for the company’s specific experience.
A lower discount rate and a higher life expectancy result in a higher net post-employment benefit obligation and a higher current service cost.
BCE Inc. 2017 ANNUAL REPORT 103 |
|
| | | | |
10 | MD&A | Financial measures, accounting policies and controls | |
SENSITIVITY ANALYSIS
The following table shows a sensitivity analysis of key assumptions used to measure the net post-employment benefit obligations and the net post-employment benefit plans cost for our DB pension plans and OPEB plans.
| | IMPACT ON NET POST-EMPLOYMENT
BENEFIT PLANS COST FOR 2017 –
INCREASE (DECREASE) | IMPACT ON POST-EMPLOYMENT BENEFIT
OBLIGATIONS AT DECEMBER 31, 2017 –
INCREASE (DECREASE) |
| | CHANGE IN
ASSUMPTION | | INCREASE IN
ASSUMPTION | | DECREASE IN
ASSUMPTION | | INCREASE IN
ASSUMPTION | | | DECREASE IN
ASSUMPTION | |
Discount rate | 0.5 | % | (70 | ) | 62 | | (1,636 | ) | | 1,746 | |
Life expectancy at age 65 | 1 year | | 33 | | (31 | ) | 834 | | | (808 | ) |
IMPAIRMENT OF NON-FINANCIAL ASSETS
Goodwill and indefinite-life intangible assets are tested for impairment annually or when there is an indication that the asset may be impaired. Property, plant and equipment and finite-life intangible assets are tested for impairment if events or changes in circumstances, assessed at each reporting period, indicate that their carrying amount may not be recoverable. For the purpose of impairment testing, assets other than goodwill are grouped at the lowest level for which there are separately identifiable cash inflows.
Impairment losses are recognized and measured as the excess of the carrying value of the assets over their recoverable amount. An asset’s recoverable amount is the higher of its fair value less costs of disposal and its value in use. Previously recognized impairment losses, other than those attributable to goodwill, are reviewed for possible reversal at each reporting date and, if the asset’s recoverable amount has increased, all or a portion of the impairment is reversed.
We make a number of estimates when calculating recoverable amounts using discounted future cash flows or other valuation methods to test for impairment. These estimates include the assumed growth rates for future cash flows, the number of years used in the cash flow model, and the discount rate. When impairment charges occur they are recorded inOther (expense) income.
In 2017, we recorded impairment charges of $82 million, of which $70 million was allocated to indefinite-life intangible assets, and $12 million to finite-life intangible assets. The impairment charges relate to our music TV channels and two small market radio station CGUs within our Bell Media segment. These impairments were the result of revenue and profitability declines from lower audience levels. The charges were determined by comparing the carrying value of the CGUs to their fair value less costs of disposal. We estimated the fair value of the CGUs using both discounted cash flows and market-based valuation models, which include five-year cash flow projections derived from business plans reviewed by senior management for the period of January 1, 2018 to December 31, 2022, using a discount rate of 8.5% and a perpetuity growth rate of nil, as well as market multiple data from public companies and market transactions. The carrying value of these CGUs was $67 million at December 31, 2017.
GOODWILL IMPAIRMENT TESTING
We perform an annual test for goodwill impairment in the fourth quarter for each of our CGUs or groups of CGUs to which goodwill is allocated, and whenever there is an indication that goodwill might be impaired.
A CGU is the smallest identifiable group of assets that generates cash inflows that are independent of the cash inflows from other assets or groups of assets.
We identify any potential impairment by comparing the carrying value of a CGU or group of CGUs to its recoverable amount. The recoverable amount of a CGU or group of CGUs is the higher of its fair value less costs of disposal and its value in use. Both fair value less costs of disposal and value in use are based on estimates of discounted future cash flows or other valuation methods. Cash flows are projected based on past experience, actual operating results and business plans. When the recoverable amount of a CGU or group of CGUs is less than its carrying value, the recoverable amount is determined for its identifiable assets and liabilities. The excess of the recoverable amount of the CGU or group of CGUs over the total of the amounts assigned to its assets and liabilities is the recoverable amount of goodwill.
An impairment charge is recognized inOther (expense) incomein the income statements for any excess of the carrying value of goodwill over its recoverable amount. For purposes of impairment testing of goodwill, BCE’s CGUs or groups of CGUs correspond to our reporting segments as disclosed in Note 4,Segmented information, in BCE’s 2017 consolidated financial statements.
Any significant change in each of the estimates used could have a material impact on the calculation of the recoverable amount and resulting impairment charge. As a result, we are unable to reasonably quantify the changes in our overall financial performance if we had used different assumptions.
We cannot predict whether an event that triggers impairment will occur, when it will occur or how it will affect the asset values we have reported.
We believe that any reasonable possible change in the key assumptions on which the estimate of recoverable amounts of the Bell Wireless or Bell Wireline groups of CGUs is based would not cause their carrying amounts to exceed their recoverable amounts.
For the Bell Media group of CGUs, a decrease of (0.3%) in the perpetuity growth rate or an increase of 0.2% in the discount rate, would have resulted in its recoverable amount being equal to its carrying value.
There were no goodwill impairment charges in 2016 or 2017.
DEFERRED TAXES
Deferred tax assets and liabilities are calculated at the tax rates that are expected to apply when the asset or liability is recovered or settled. Both our current and deferred tax assets and liabilities are calculated using tax rates that have been enacted or substantively enacted at the reporting date.
Deferred taxes are provided on temporary differences arising from investments in subsidiaries, joint arrangements and associates, except where we control the timing of the reversal of the temporary difference and it is probable that the temporary difference will not reverse in the foreseeable future.
The amount of deferred tax assets and liabilities are estimated with consideration given to the timing, sources and amounts of future taxable income.
| 104 BCE Inc. 2017 ANNUAL REPORT |
|
| | | | |
| | 10 | MD&A | Financial measures, accounting policies and controls |
FAIR VALUE OF FINANCIAL INSTRUMENTS
Certain financial instruments, such as investments in equity securities, derivative financial instruments and certain elements of borrowings, are carried in the statements of financial position at fair value, with changes in fair value reflected in the income statements and the statements of comprehensive income. Fair values are estimated by reference to published price quotations or by using other valuation techniques that may include inputs that are not based on observable market data, such as discounted cash flows and earnings multiples.
CONTINGENCIES
In the ordinary course of business, we become involved in various claims and legal proceedings seeking monetary damages and other relief. Pending claims and legal proceedings represent a potential cost to our business. We estimate the amount of a loss by analyzing potential outcomes and assuming various litigation and settlement strategies, based on information that is available at the time.
If the final resolution of a legal or regulatory matter results in a judgment against us or requires us to pay a large settlement, it could have a material adverse effect on our consolidated financial statements in the period in which the judgment or settlement occurs.
ONEROUS CONTRACTS
A provision for onerous contracts is recognized when the unavoidable costs of meeting our obligations under a contract exceed the expected benefits to be received under the contract. The provision is measured at the present value of the lower of the expected cost of terminating the contract and the expected net cost of completing the contract.
JUDGMENTS
POST-EMPLOYMENT BENEFIT PLANS
The determination of the discount rate used to value our post-employment benefit obligations requires judgment. The rate is set by reference to market yields of high-quality corporate fixed income investments at the beginning of each fiscal year. Significant judgment is required when setting the criteria for fixed income investments to be included in the population from which the yield curve is derived. The most significant criteria considered for the selection of investments include the size of the issue and credit quality, along with the identification of outliers, which are excluded.
INCOME TAXES
The calculation of income taxes requires judgment in interpreting tax rules and regulations. There are transactions and calculations for which the ultimate tax determination is uncertain. Our tax filings are also subject to audits, the outcome of which could change the amount of current and deferred tax assets and liabilities. Management believes that it has sufficient amounts accrued for outstanding tax matters based on information that currently is available.
Management judgment is used to determine the amounts of deferred tax assets and liabilities and future tax liabilities to be recognized. In particular, judgment is required when assessing the timing of the reversal of temporary differences to which future income tax rates are applied.
MULTIPLE-ELEMENT ARRANGEMENTS
Determining the amounts of revenue to be recognized for multiple-element arrangements requires judgment to establish the separately identifiable components and the allocation of the total price between those components.
CGUs
The determination of CGUs or groups of CGUs for the purpose of impairment testing requires judgment.
CONTINGENCIES
We accrue a potential loss if we believe a loss is probable and an outflow of resources is likely and can be reasonably estimated, based on information that is available at the time. Any accrual would be charged to earnings and included inTrade payables and other liabilitiesorOther non-current liabilities. Any payment as a result of a judgment or cash settlement would be deducted from cash from operating activities. We estimate the amount of a loss by analyzing potential outcomes and assuming various litigation and settlement strategies.
The determination of whether a loss is probable from claims and legal proceedings and whether an outflow of resources is likely requires judgment.
| ADOPTION OF AMENDED ACCOUNTING STANDARDS |
As required, effective January 1, 2017, we adopted the following amended accounting standard.
STANDARD | DESCRIPTION | IMPACT |
Amendments to IAS 7 –Statement of Cash Flows | Requires enhanced disclosures about changes in liabilities arising from financing activities, including changes from financing cash flows, changes arising from obtaining or losing control of subsidiaries or other businesses, the effect of changes in foreign exchange rates and changes in fair values. | The required enhanced disclosures have been provided in Note 27,Additional cash flow information. |
BCE Inc. 2017 ANNUAL REPORT 105 |
|
| | | | |
10 | MD&A | Financial measures, accounting policies and controls | |
| FUTURE CHANGES TO ACCOUNTING STANDARDS |
The following new or amended standards and interpretation issued by the IASB have an effective date after December 31, 2017 and have not yet been adopted by BCE.
STANDARD | DESCRIPTION | IMPACT | EFFECTIVE DATE |
IFRS 15 – Revenue from Contracts with Customers | Establishes principles to record revenues from contracts for the sale of goods or services, unless the contracts are in the scope of IAS 17 – Leases or other IFRSs. Under IFRS 15, revenue is recognized at an amount that reflects the expected consideration receivable in exchange for transferring goods or services to a customer, applying the following five steps: 1. Identify the contract with a customer
2. Identify the performance obligations in the contract
3. Determine the transaction price
4. Allocate the transaction price to the performance obligations in the contract
5. Recognize revenue when (or as) the entity satisfies a performance obligation The new standard also provides guidance relating to principal versus agent relationships, licences of intellectual property, contract costs and the measurement and recognition of gains and losses on the sale of certain non-financial assets such as property and equipment. Additional disclosures will also be required under the new standard. | IFRS 15 will principally affect the timing of revenue recognition and how we classify revenues between product and service in our Bell Wireless segment. IFRS 15 will also affect how we account for costs to obtain a contract. Under multiple-element arrangements, revenue allocated to asatisfied performance obligation will no longer be limited to theamount that is not contingent upon the satisfaction of additionalperformance obligations. Although the total revenue recognizedduring the term of a contract will be largely unaffected, revenuerecognition may be accelerated and reflected ahead of theassociated cash inflows. This will result in the recognition of acontract asset on the balance sheet, corresponding to theamount of revenue recognized and not yet billed to a customer.
The contract asset will be realized over the term of thecustomer contract. As revenues allocated to a satisfied performance obligation areno longer limited to the non-contingent amount, a greaterproportion of the total revenue recognized during the term ofcertain customer contracts will be attributed to a deliveredproduct, resulting in a corresponding decrease inservice revenue. Sales commissions and any other incremental costs of obtaininga contract with a customer will be recognized on the balancesheet and amortized on a systematic basis that is consistentwith the period and pattern of transfer to the customer of therelated products or services, except as noted below.
Under IFRS 15, certain practical expedients are permitted both on transition and on an ongoing basis. On transition, completed contracts that begin and end within thesame annual reporting period and those completed beforeJanuary 1, 2017 are not restated. Similarly, contracts modifiedprior to January 1, 2017 are not restated. When our right to consideration from a customer correspondsdirectly with the value to the customer of the products andservices transferred to date, we will recognize revenue in theamount to which we have a right to invoice. Costs of obtaining a contract that would be amortized withinone year or less will be immediately expensed.
We continue to make progress towards adoption of IFRS 15 according to our detailed implementation plan. Changes and enhancements to our existing IT systems, business processes, and systems of internal control are being completed. A dedicated project team that leverages key resources throughout the company is in place to effect the necessary changes. While our testing and data validation process is ongoing, we expect that the impact of the new standard will be most pronounced in our Bell Wireless segment. Although total revenue recognized over the term of a customer contract is not expected to change significantly, our preliminary estimate of the impact of adopting IFRS 15 is a decrease in 2017 service revenues within the range of $1.2 billion to $1.4 billion, with a corresponding increase in product revenue. Total operating revenues less operating costs in 2017 is estimated to increase by approximately $0.1 billion. Total assets on our January 1, 2017 statement of financial position will increase as we record contract assets and costs to obtain a contract. We currently estimate the value of the gross contract assets to be in the range of $1.1 billion to $1.3 billion and an increase in costs to obtain a contract of approximately $0.3 billion to $0.4 billion, both of which would be recognized through an adjustment to opening retained earnings. Total liabilities will increase mainly to reflect a resulting $0.4 billion deferred tax liability, also recognized through an adjustment to opening retained earnings. We do not expect that IFRS 15 will impact our cash flows from operating activities.
| Annual periods beginning on or after January 1, 2018, using a full retrospective approach for all periods presented in the period of adoption. |
| 106 BCE Inc. 2017 ANNUAL REPORT |
|
| | | | |
| | 10 | MD&A | Financial measures, accounting policies and controls |
STANDARD | DESCRIPTION | IMPACT | EFFECTIVE DATE |
Amendments to IFRS 2 –Share-based Payment | Clarifies the classification and measurement of cash-settled share-based payment transactions that include a performance condition, share-based payment transactions with a net settlement feature for withholding tax obligations, and modifications of a share-based payment transaction from cash-settled to equity-settled. | The amendments to IFRS 2 will not have a significant impact on our financial statements. | Annual periods beginning on or after January 1, 2018. |
IFRS 9 – Financial Instruments | Sets out the requirements for recognizing and measuring financial assets, financial liabilities and some contracts to buy and sell non-financial items. IFRS 9 replaces IAS 39 – Financial Instruments: Recognition and Measurement. The new standard establishes a single classification and measurement approach for financial assets that reflects the business model in which they are managed and their cash flow characteristics. It also provides guidance on an entity’s own credit risk relating to financial liabilities and modifies the hedge accounting model to better link the economics of risk management with its accounting treatment. Additional disclosures will also be required under the new standard. | The amendments to IFRS 9 will not have a significant impact on our financial statements. | Annual periods beginning on or after January 1, 2018. |
IFRS 16 – Leases | Eliminates the distinction between operating and finance leases for lessees, requiring instead that leases be capitalized by recognizing the present value of the lease payments and showing them either as lease assets (right-of-use assets) or together with property, plant and equipment. If lease payments are made over time, an entity recognizes a financial liability representing its obligation to make future lease payments. A depreciation charge for the lease asset is recorded within operating costs and an interest expense on the lease liability is recorded within finance costs. IFRS 16 does not require a lessee to recognize assets and liabilities for short-term leases and leases of low-value assets, nor does it substantially change lease accounting for lessors. | We continue to make progress towards adoption of IFRS 16 according to our detailed implementation plan. Changes and enhancements to our existing IT systems, business processes and systems of internal control are being designed and tested. It is not yet possible to make a reliable estimate of the impact of the new standard on our financial statements. | Annual periods beginning on or after January 1, 2019, using either a full retrospective approach for all periods presented in the period of adoption or a modified retrospective approach. |
International Financial Reporting Interpretations Committee (IFRIC) 23 –Uncertainty over Income Tax Treatments | IFRIC 23 clarifies the application of recognition and measurement requirements in IAS 12 – Income Taxes when there is uncertainty over income tax treatments. It specifically addresses whether an entity considers uncertain tax treatments separately or as a group, the assumptions an entity makes about the examination of tax treatments by taxation authorities, how an entity determines taxable profit (tax loss), tax bases, unused tax losses, unused tax credits and tax rates and how an entity considers changes in facts and circumstances. | We are currently evaluating the impact of IFRIC 23 on our financial statements. | Annual periods beginning on or after January 1, 2019, using either a full retrospective or a modified retrospective approach. |
BCE Inc. 2017 ANNUAL REPORT 107 |
|
| | | | |
10 | MD&A | Financial measures, accounting policies and controls | |
| 10.2 Non-GAAP financial measures and key performance indicators (KPIs) |
This section describes the non-GAAP financial measures and KPIs we use in this MD&A to explain our financial results. It also provides reconciliations of the non-GAAP financial measures to the most comparable IFRS financial measures.
In Q1 2017, we updated our definition of adjusted net earnings and adjusted EPS to also exclude impairment charges as they may affect the comparability of our financial results and could potentially distort the analysis of trends in business performance. There was no impact to previously reported results as a result of this change.
| ADJUSTED EBITDA AND ADJUSTED EBITDA MARGIN |
The terms adjusted EBITDA and adjusted EBITDA margin do not have any standardized meaning under IFRS. Therefore, they are unlikely to be comparable to similar measures presented by other issuers.
We define adjusted EBITDA as operating revenues less operating costs, as shown in BCE’s consolidated income statements. Adjusted EBITDA for BCE’s segments is the same as segment profit as reported in Note 4,Segmented information, in BCE’s 2017 consolidated financial statements. We define adjusted EBITDA margin as adjusted EBITDA divided by operating revenues.
We use adjusted EBITDA and adjusted EBITDA margin to evaluate the performance of our businesses as they reflect their ongoing profitability. We believe that certain investors and analysts use adjusted EBITDA to measure a company’s ability to service debt and to meet other payment obligations or as a common measurement to value companies in the telecommunications industry. We believe that certain investors and analysts also use adjusted EBITDA and adjusted EBITDA margin to evaluate the performance of our businesses. Adjusted EBITDA is also one component in the determination of short-term incentive compensation for all management employees.
Adjusted EBITDA and adjusted EBITDA margin have no directly comparable IFRS financial measure. Alternatively, the following table provides a reconciliation of net earnings to adjusted EBITDA.
| | 2017 | | 2016 | |
Net earnings | 2,970 | | 3,087 | |
Severance, acquisition and other costs | 190 | | 135 | |
Depreciation | 3,037 | | 2,877 | |
Amortization | 813 | | 631 | |
Finance costs | | | | |
Interest expense | 955 | | 888 | |
Interest on post-employment benefit obligations | 72 | | 81 | |
Other expense (income) | 102 | | (21 | ) |
Income taxes | 1,039 | | 1,110 | |
Adjusted EBITDA | 9,178 | | 8,788 | |
BCE operating revenues | 22,719 | | 21,719 | |
Adjusted EBITDA margin | 40.4 | % | 40.5 | % |
| ADJUSTED NET EARNINGS AND ADJUSTED EPS |
The terms adjusted net earnings and adjusted EPS do not have any standardized meaning under IFRS. Therefore, they are unlikely to be comparable to similar measures presented by other issuers.
We define adjusted net earnings as net earnings attributable to common shareholders before severance, acquisition and other costs, net losses (gains) on investments, impairment charges and early debt redemption costs. We define adjusted EPS as adjusted net earnings per BCE common share.
We use adjusted net earnings and adjusted EPS, and we believe that certain investors and analysts use these measures, among other ones, to assess the performance of our businesses without the effects of severance, acquisition and other costs, net losses (gains) on investments, impairment charges and early debt redemption costs, net of tax and non-controlling interest (NCI). We exclude these items because they affect the comparability of our financial results and could potentially distort the analysis of trends in business performance. Excluding these items does not imply they are non-recurring.
| 108 BCE Inc. 2017 ANNUAL REPORT |
|
| | | | |
| | 10 | MD&A | Financial measures, accounting policies and controls |
The most comparable IFRS financial measures are net earnings attributable to common shareholders and EPS. The following table is a reconciliation of net earnings attributable to common shareholders and EPS to adjusted net earnings on a consolidated basis and per BCE common share (adjusted EPS), respectively.
| | 2017 | 2016 |
| TOTAL | | PER SHARE | | TOTAL | | PER SHARE | |
Net earnings attributable to common shareholders | 2,786 | | 3.12 | | 2,894 | | 3.33 | |
Severance, acquisition and other costs | 143 | | 0.16 | | 104 | | 0.12 | |
Net losses on investments | 29 | | 0.03 | | 3 | | – | |
Early debt redemption costs | 15 | | 0.02 | | 8 | | 0.01 | |
Impairment charges | 60 | | 0.06 | | – | | – | |
Adjusted net earnings | 3,033 | | 3.39 | | 3,009 | | 3.46 | |
| FREE CASH FLOW AND DIVIDEND PAYOUT RATIO |
The terms free cash flow and dividend payout ratio do not have any standardized meaning under IFRS. Therefore, they are unlikely to be comparable to similar measures presented by other issuers.
We define free cash flow as cash flows from operating activities, excluding acquisition and other costs paid (which include significant litigation costs) and voluntary pension funding, less capital expenditures, preferred share dividends and dividends paid by subsidiaries to NCI. We exclude acquisition and other costs paid and voluntary pension funding because they affect the comparability of our financial results and could potentially distort the analysis of trends in business performance. Excluding these items does not imply they are non-recurring.
We consider free cash flow to be an important indicator of the financial strength and performance of our businesses because it shows how much cash is available to pay dividends, repay debt and reinvest in our company. We believe that certain investors and analysts use free cash flow to value a business and its underlying assets and to evaluate the financial strength and performance of our businesses. The most comparable IFRS financial measure is cash flows from operating activities.
We define dividend payout ratio as dividends paid on common shares divided by free cash flow. We consider dividend payout ratio to be an important indicator of the financial strength and performance of our businesses because it shows the sustainability of the company’s dividend payments.
The following table is a reconciliation of cash flows from operating activities to free cash flow on a consolidated basis.
| | 2017 | | 2016 | |
Cash flows from operating activities | 7,358 | | 6,643 | |
Capital expenditures | (4,034 | ) | (3,771 | ) |
Cash dividends paid on preferred shares | (127 | ) | (126 | ) |
Cash dividends paid by subsidiaries to NCI | (34 | ) | (46 | ) |
Acquisition and other costs paid | 155 | | 126 | |
Voluntary defined benefit pension plan contribution | 100 | | 400 | |
Free cash flow | 3,418 | | 3,226 | |
The term net debt does not have any standardized meaning under IFRS. Therefore, it is unlikely to be comparable to similar measures presented by other issuers.
We define net debt as debt due within one year plus long-term debt and 50% of preferred shares, less cash and cash equivalents, as shown in BCE’s consolidated statements of financial position. We include 50% of outstanding preferred shares in our net debt as it is consistent with the treatment by certain credit rating agencies.
We consider net debt to be an important indicator of the company’s financial leverage because it represents the amount of debt that is not covered by available cash and cash equivalents. We believe that certain investors and analysts use net debt to determine a company’s financial leverage.
Net debt has no directly comparable IFRS financial measure, but rather is calculated using several asset and liability categories from the statements of financial position, as shown in the following table.
| | 2017 | | 2016 | |
Debt due within one year | 5,178 | | 4,887 | |
Long-term debt | 18,215 | | 16,572 | |
50% of outstanding preferred shares | 2,002 | | 2,002 | |
Cash and cash equivalents | (625 | ) | (853 | ) |
Net debt | 24,770 | | 22,608 | |
BCE Inc. 2017 ANNUAL REPORT 109 |
|
| | | | |
10 | MD&A | Financial measures, accounting policies and controls | |
The net debt leverage ratio does not have any standardized meaning under IFRS. Therefore, it is unlikely to be comparable to similar measures presented by other issuers. We use, and believe that certain investors and analysts use, the net debt leverage ratio as a measure of financial leverage.
The net debt leverage ratio represents net debt divided by adjusted EBITDA. For the purposes of calculating our net debt leverage ratio, adjusted EBITDA is twelve-month trailing adjusted EBITDA.
| ADJUSTED EBITDA TO NET INTEREST EXPENSE RATIO |
The ratio of adjusted EBITDA to net interest expense does not have any standardized meaning under IFRS. Therefore, it is unlikely to be comparable to similar measures presented by other issuers. We use, and believe that certain investors and analysts use, the adjusted EBITDA to net interest expense ratio as a measure of financial health of the company.
The adjusted EBITDA to net interest expense ratio represents adjusted EBITDA divided by net interest expense. For the purposes of calculating our adjusted EBITDA to net interest expense ratio, adjusted EBITDA is twelve-month trailing adjusted EBITDA. Net interest expense is twelvemonth trailing net interest expense as shown in our statements of cash flows, plus 50% of declared preferred share dividends as shown in our income statements.
In addition to the non-GAAP financial measures described previously, we use a number of KPIs to measure the success of our strategic imperatives.
These KPIs are not accounting measures and may not be comparable to similar measures presented by other issuers.
KPI | DEFINITION |
ARPU | Average revenue per user (ARPU) or subscriber is a measure used to track our recurring revenue streams. Wireless blended ARPU is calculated by dividing certain service revenues by the average subscriber base for the specified period and is expressed as a dollar unit per month. |
Capital intensity | Capital expenditures divided by operating revenues. |
Churn | Churn is the rate at which existing subscribers cancel their services. It is a measure of our ability to retain our customers. Wireless churn is calculated by dividing the number of deactivations during a given period by the average number of subscribers in the base for the specified period and is expressed as a percentage per month. |
Subscriber unit | Wireless subscriber unit is comprised of an active revenue-generating unit (e.g. mobile device, tablet or wireless Internet products), with a unique identifier (typically International Mobile Equipment Identity (IMEI) number), that has access to our wireless networks. We report wireless subscriber units in two categories: postpaid and prepaid. Prepaid subscriber units are considered active for a period of 120 days following the expiry of the subscriber’s prepaid balance. Wireline subscriber unit consists of an active revenue-generating unit with access to our services, including Internet, satellite TV, IPTV, and/or NAS. A subscriber is included in our subscriber base when the service has been installed and is operational at the customer premise and a billing relationship has been established. Internet, IPTV and satellite TV subscribers have access to stand-alone services, and are primarily represented by a dwelling unit NAS subscribers are based on a line count and are represented by a unique telephone number
|
| 110 BCE Inc. 2017 ANNUAL REPORT |
|
| | | | |
| | 10 | MD&A | Financial measures, accounting policies and controls |
| 10.3 Effectiveness of internal controls |
DISCLOSURE CONTROLS AND PROCEDURES
Our disclosure controls and procedures are designed to provide reasonable assurance that information required to be disclosed by us in reports filed or submitted under Canadian and U.S. securities laws is recorded, processed, summarized and reported within the time periods specified under those laws, and include controls and procedures that are designed to ensure that the information is accumulated and communicated to management, including BCE’s President and CEO and Executive Vice-President and Chief Financial Officer (CFO), to allow timely decisions regarding required disclosure.
As at December 31, 2017, management evaluated, under the supervision of and with the participation of the CEO and the CFO, the effectiveness of our disclosure controls and procedures, as defined in Rule 13a-15(e) under the U.S.Securities Exchange Act of 1934, as amended, and under National Instrument 52-109 –Certification of Disclosure in Issuers’ Annual and Interim Filings.
The CEO and CFO have limited the scope of their design and evaluation of our disclosure controls and procedures to exclude the disclosure controls and procedures of MTS, which we acquired on March 17, 2017. The contribution of the acquired MTS operations to our consolidated financial statements for the year ended December 31, 2017 was approximately 3% of consolidated revenues and 3% of consolidated net earnings. Additionally, at December 31, 2017, the current assets and current liabilities of the acquired MTS operations represented approximately 2% and 4% of our consolidated current assets and current liabilities, respectively, and their non-current assets and non-current liabilities represented approximately 7% and 2% of our consolidated non-current assets and non-current liabilities, respectively. The design and evaluation of the disclosure controls and procedures of MTS will be completed for the first quarter of 2018. Further details related to the acquisition of MTS is disclosed in Note 3,Business acquisitions and dispositions, in BCE’s 2017 consolidated financial statements.
Based on that evaluation, which excluded the disclosure controls and procedures of MTS, the CEO and CFO concluded that our disclosure controls and procedures were effective as at December 31, 2017.
| INTERNAL CONTROL OVER FINANCIAL REPORTING |
Management is responsible for establishing and maintaining adequate internal control over financial reporting, as defined in Rule 13(a)-15(f) under the U.S.Securities Exchange Act of 1934, as amended, and under National Instrument 52-109. Our internal control over financial reporting is a process designed under the supervision of the CEO and CFO, and effected by the Board, management and other personnel of BCE, to provide reasonable assurance regarding the reliability of financial reporting and the preparation of financial statements for external purposes in accordance with IFRS. However, because of its inherent limitations, internal control over financial reporting may not prevent or detect misstatements on a timely basis.
Management evaluated, under the supervision of and with the participation of the CEO and the CFO, the effectiveness of our internal control over financial reporting as at December 31, 2017, based on the criteria established inInternal Control – Integrated Framework (2013)issued by the Committee of Sponsoring Organizations of the Treadway Commission (COSO). The CEO and CFO have limited the scope of their design and evaluation of our internal control over financial reporting to exclude the internal control over financial reporting of MTS.
Based on that evaluation, which excluded the internal control over financial reporting of MTS, the CEO and CFO concluded that our internal control over financial reporting was effective as at December 31, 2017.
| CHANGES IN INTERNAL CONTROL OVER FINANCIAL REPORTING |
There have been no changes during the year ended December 31, 2017 in our internal control over financial reporting that have materially affected, or are reasonably likely to materially affect, our internal control over financial reporting. The adoption of IFRS 15–Revenue from Contracts with Customers, required the implementation of newaccounting processes, which changed the Company’s internal controls over revenue recognition, contract acquisition costs and financial reporting. We are in the process of completing the design of these controls. We do not expect significant changes to our internal control over financial reporting due to the adoption of this new standard in 2018.
BCE Inc. 2017 ANNUAL REPORT 111 |
|
| Consolidated financial statements |
MANAGEMENT’S RESPONSIBILITY FOR FINANCIAL REPORTING
These financial statements form the basis for all of the financial information that appears in this annual report.
The financial statements and all of the information in this annual report are the responsibility of the management of BCE Inc. (BCE) and have been reviewed and approved by the board of directors. The board of directors is responsible for ensuring that management fulfills its financial reporting responsibilities. Deloitte LLP, Independent Registered Public Accounting Firm, have audited the financial statements.
Management has prepared the financial statements in accordance with International Financial Reporting Standards (IFRS) as issued by the International Accounting Standards Board. Under these principles, management has made certain estimates and assumptions that are reflected in the financial statements and notes. Management believes that these financial statements fairly present BCE’s consolidated financial position, results of operations and cash flows.
Management has a system of internal controls designed to provide reasonable assurance that the financial statements are accurate and complete in all material respects. This is supported by an internal audit group that reports to the Audit Committee, and includes communication with employees about policies for ethical business conduct. Management believes that the internal controls provide reasonable assurance that our financial records are reliable and form a proper basis for preparing the financial statements, and that our assets are properly accounted for and safeguarded.
The board of directors has appointed an Audit Committee, which is made up of unrelated and independent directors. The Audit Committee’s responsibilities include reviewing the financial statements and other information in this annual report, and recommending them to the board of directors for approval. You will find a description of the Audit Committee’s other responsibilities on page 164 of this annual report. The internal auditors and the shareholders’ auditors have free and independent access to the Audit Committee.
(signed) George A. Cope
President and Chief Executive Officer
(signed) Glen LeBlanc
Executive Vice-President and Chief Financial Officer
(signed) Thierry Chaumont
Senior Vice-President and Controller
March 8, 2018
| 114 BCE Inc. 2017 ANNUAL REPORT |
|
| | |
| | Consolidated financial statements |
REPORT OF INDEPENDENT REGISTERED PUBLIC ACCOUNTING FIRM
To the Shareholders and the Board of Directors of BCE Inc.
OPINION ON THE CONSOLIDATED FINANCIAL STATEMENTS
We have audited the accompanying consolidated financial statements of BCE Inc. and subsidiaries (the “Company”), which comprise the consolidated statements of financial position as at December 31, 2017 and December 31, 2016, the consolidated income statements, consolidated statements of comprehensive income, consolidated statements of changes in equity and consolidated statements of cash flows for the years then ended, and the related notes, including a summary of significant accounting policies and other explanatory information (collectively referred to as the “financial statements”).
In our opinion, the financial statements present fairly, in all material respects, the financial position of the Company as at December 31, 2017 and December 31, 2016, and its financial performance and its cash flows for the years then ended in accordance with International Financial Reporting Standards as issued by the International Accounting Standards Board.
REPORT ON INTERNAL CONTROL OVER FINANCIAL REPORTING
We have also audited, in accordance with the standards of the Public Company Accounting Oversight Board (United States) (PCAOB), the Company’s internal control over financial reporting as of December 31, 2017, based on criteria established inInternal Control – Integrated Framework (2013)issued by the Committee of Sponsoring Organizations of the Treadway Commission and our report dated March 8, 2018 expressed an unqualified opinion on the Company’s internal control over financial reporting.
BASIS FOR OPINION
MANAGEMENT’S RESPONSIBILITY FOR THE FINANCIAL STATEMENTS
Management is responsible for the preparation and fair presentation of these financial statements in accordance with International Financial Reporting Standards as issued by the International Accounting Standards Board, and for such internal control as management determines is necessary to enable the preparation of financial statements that are free from material misstatement, whether due to fraud or error.
AUDITOR’S RESPONSIBILITY
Our responsibility is to express an opinion on these financial statements based on our audits. We conducted our audits in accordance with Canadian generally accepted auditing standards and the standards of the PCAOB. Those standards require that we plan and perform the audit to obtain reasonable assurance about whether the financial statements are free from material misstatement, whether due to fraud or error. Those standards also require that we comply with ethical requirements. We are a public accounting firm registered with the PCAOB and are required to be independent with respect to the Company in accordance with the U.S. federal securities laws and the applicable rules and regulations of the Securities and Exchange Commission and the PCAOB. Further, we are required to be independent of the Company in accordance with the ethical requirements that are relevant to our audit of the financial statements in Canada and to fulfill our other ethical responsibilities in accordance with these requirements.
An audit includes performing procedures to assess the risks of material misstatement of the financial statements, whether due to fraud or error, and performing procedures that respond to those risks. Such procedures include examining, on a test basis, evidence regarding the amounts and disclosures in the financial statements. The procedures selected depend on our judgment, including the assessment of the risks of material misstatement of the financial statements, whether due to fraud or error. In making those risk assessments, we consider internal control relevant to the Company’s preparation and fair presentation of the financial statements in order to design audit procedures that are appropriate in the circumstances. An audit also includes evaluating the appropriateness of accounting policies and principles used and the reasonableness of accounting estimates made by management, as well as evaluating the overall presentation of the financial statements.
We believe that the audit evidence we have obtained in our audits is sufficient and appropriate to provide a reasonable basis for our audit opinion.
/s/ Deloitte LLP1
Chartered Professional Accountants
Montréal, Canada
March 8, 2018
We have served as the Company’s auditor since 1880.
1CPA auditor, CA, public accountancy permit No. A124391
BCE Inc. 2017 ANNUAL REPORT 115 |
|
| | |
| Consolidated financial statements | |
| CONSOLIDATED INCOME STATEMENTS |
FOR THE YEAR ENDED DECEMBER 31
(IN MILLIONS OF CANADIAN DOLLARS, EXCEPT SHARE AMOUNTS) | NOTE | | 2017 | | 2016 | |
Operating revenues | 4 | | 22,719 | | 21,719 | |
Operating costs | 4, 5 | | (13,541 | ) | (12,931 | ) |
Severance, acquisition and other costs | 4, 6 | | (190 | ) | (135 | ) |
Depreciation | 4, 13 | | (3,037 | ) | (2,877 | ) |
Amortization | 4, 14 | | (813 | ) | (631 | ) |
Finance costs | | | | | | |
Interest expense | 7 | | (955 | ) | (888 | ) |
Interest on post-employment benefit obligations | 22 | | (72 | ) | (81 | ) |
Other (expense) income | 8 | | (102 | ) | 21 | |
Income taxes | 9 | | (1,039 | ) | (1,110 | ) |
Net earnings | | | 2,970 | | 3,087 | |
Net earnings attributable to: | | | | | | |
Common shareholders | | | 2,786 | | 2,894 | |
Preferred shareholders | | | 128 | | 137 | |
Non-controlling interest | 30 | | 56 | | 56 | |
Net earnings | | | 2,970 | | 3,087 | |
Net earnings per common share | 10 | | | | | |
Basic | | | 3.12 | | 3.33 | |
Diluted | | | 3.11 | | 3.33 | |
Average number of common shares outstanding – basic (millions) | | | 894.3 | | 869.1 | |
| CONSOLIDATED STATEMENTS OF COMPREHENSIVE INCOME |
FOR THE YEAR ENDED DECEMBER 31
(IN MILLIONS OF CANADIAN DOLLARS) | NOTE | | 2017 | | 2016 | |
Net earnings | | | 2,970 | | 3,087 | |
Other comprehensive loss, net of income taxes | | | | | | |
Items that will be subsequently reclassified to net earnings | | | | | | |
Net change in value of available-for-sale financial assets, net of income taxes of nil for 2017 and 2016 | | | – | | (7 | ) |
Net change in value of derivatives designated as cash flow hedges, net of income taxes of $21 millionand $24 million for 2017 and 2016, respectively | | | (65 | ) | (68 | ) |
Items that will not be reclassified to net earnings | | | | | | |
Actuarial losses on post-employment benefit plans, net of income taxes of $92 million and $71 million for 2017 and 2016, respectively | 22 | | (246 | ) | (191 | ) |
Other comprehensive loss | | | (311 | ) | (266 | ) |
Total comprehensive income | | | 2,659 | | 2,821 | |
Total comprehensive income attributable to: | | | | | | |
Common shareholders | | | 2,477 | | 2,630 | |
Preferred shareholders | | | 128 | | 137 | |
Non-controlling interest | 30 | | 54 | | 54 | |
Total comprehensive income | | | 2,659 | | 2,821 | |
| 116 BCE Inc. 2017 ANNUAL REPORT |
|
| | |
| | Consolidated financial statements |
| CONSOLIDATED STATEMENTS OF FINANCIAL POSITION |
| (IN MILLIONS OF CANADIAN DOLLARS) | NOTE | | DECEMBER 31, 2017 | | DECEMBER 31, 2016 | |
ASSETS | | | | | | |
Current assets | | | | | | |
Cash | | | 442 | | 603 | |
Cash equivalents | | | 183 | | 250 | |
Trade and other receivables | 11 | | 3,135 | | 2,979 | |
Inventory | 12 | | 380 | | 403 | |
Prepaid expenses | | | 375 | | 420 | |
Other current assets | | | 124 | | 200 | |
Total current assets | | | 4,639 | | 4,855 | |
Non-current assets | | | | | | |
Property, plant and equipment | 13 | | 24,033 | | 22,346 | |
Intangible assets | 14 | | 13,305 | | 11,998 | |
Deferred tax assets | 9 | | 144 | | 89 | |
Investments in associates and joint ventures | 3, 15 | | 814 | | 852 | |
Other non-current assets | 16 | | 900 | | 1,010 | |
Goodwill | 17 | | 10,428 | | 8,958 | |
Total non-current assets | | | 49,624 | | 45,253 | |
Total assets | | | 54,263 | | 50,108 | |
LIABILITIES | | | | | | |
Current liabilities | | | | | | |
Trade payables and other liabilities | 18 | | 4,623 | | 4,326 | |
Interest payable | | | 168 | | 156 | |
Dividends payable | | | 678 | | 617 | |
Current tax liabilities | | | 140 | | 122 | |
Debt due within one year | 19 | | 5,178 | | 4,887 | |
Total current liabilities | | | 10,787 | | 10,108 | |
Non-current liabilities | | | | | | |
Long-term debt | 20 | | 18,215 | | 16,572 | |
Deferred tax liabilities | 9 | | 2,447 | | 2,192 | |
Post-employment benefit obligations | 22 | | 2,108 | | 2,105 | |
Other non-current liabilities | 23 | | 1,223 | | 1,277 | |
Total non-current liabilities | | | 23,993 | | 22,146 | |
Total liabilities | | | 34,780 | | 32,254 | |
Commitments and contingencies | 28 | | | | | |
EQUITY | | | | | | |
Equity attributable to BCE shareholders | | | | | | |
Preferred shares | 25 | | 4,004 | | 4,004 | |
Common shares | 25 | | 20,091 | | 18,370 | |
Contributed surplus | 25 | | 1,162 | | 1,160 | |
Accumulated other comprehensive (loss) income | | | (17 | ) | 46 | |
Deficit | | | (6,080 | ) | (6,040 | ) |
Total equity attributable to BCE shareholders | | | 19,160 | | 17,540 | |
Non-controlling interest | 30 | | 323 | | 314 | |
Total equity | | | 19,483 | | 17,854 | |
Total liabilities and equity | | | 54,263 | | 50,108 | |
BCE Inc. 2017 ANNUAL REPORT 117 |
|
| | |
| Consolidated financial statements | |
| CONSOLIDATED STATEMENTS OF CHANGES IN EQUITY |
FOR THE YEAR ENDED DECEMBER 31, 2017
(IN MILLIONS OF CANADIAN DOLLARS) | NOTE | | ATTRIBUTABLE TO BCE SHAREHOLDERS | NON-
CONTROL-
LING
INTEREST | | TOTAL
EQUITY | |
PREFERRED
SHARES | | COMMON
SHARES | | CONTRI-
BUTED
SURPLUS | | ACCUMU-
LATED
OTHER
COMPRE-
HENSIVE
INCOME
(LOSS) | | DEFICIT | | TOTAL | |
Balance at January 1, 2017 | | | 4,004 | | 18,370 | | 1,160 | | 46 | | (6,040 | ) | 17,540 | | 314 | | 17,854 | |
Net earnings | | | – | | – | | – | | – | | 2,914 | | 2,914 | | 56 | | 2,970 | |
Other comprehensive loss | | | – | | – | | – | | (63 | ) | (246 | ) | (309 | ) | (2 | ) | (311 | ) |
Total comprehensive (loss) income | | | – | | – | | – | | (63 | ) | 2,668 | | 2,605 | | 54 | | 2,659 | |
Common shares issued under employee stock option plan | 25 | | – | | 122 | | (6 | ) | – | | – | | 116 | | – | | 116 | |
Common shares issued under employee savings plan | 25 | | – | | 5 | | – | | – | | – | | 5 | | – | | 5 | |
Other share-based compensation | | | – | | – | | 8 | | – | | (16 | ) | (8 | ) | – | | (8 | ) |
Common shares issued for theacquisition of Manitoba TelecomServices Inc. | 3, 25 | | – | | 1,594 | | – | | – | | – | | 1,594 | | – | | 1,594 | |
Dividends declared on BCE commonand preferred shares | | | – | | – | | – | | – | | (2,692 | ) | (2,692 | ) | – | | (2,692 | ) |
Dividends declared by subsidiariesto non-controlling interest | | | – | | – | | – | | – | | – | | – | | (45 | ) | (45 | ) |
Balance at December 31, 2017 | | | 4,004 | | 20,091 | | 1,162 | | (17 | ) | (6,080 | ) | 19,160 | | 323 | | 19,483 | |
FOR THE YEAR ENDED DECEMBER 31, 2016
(IN MILLIONS OF CANADIAN DOLLARS) | NOTE | | ATTRIBUTABLE TO BCE SHAREHOLDERS | NON-
CONTROL-
LING
INTEREST | | TOTAL
EQUITY | |
PREFERRED
SHARES | | COMMON
SHARES | | CONTRI-
BUTED
SURPLUS | | ACCUMU-
LATED
OTHER
COMPRE-
HENSIVE
INCOME
(LOSS) | | DEFICIT | | TOTAL | |
Balance at January 1, 2016 | | | 4,004 | | 18,100 | | 1,150 | | 119 | | (6,350 | ) | 17,023 | | 306 | | 17,329 | |
Net earnings | | | – | | – | | – | | – | | 3,031 | | 3,031 | | 56 | | 3,087 | |
Other comprehensive loss | | | – | | – | | – | | (73 | ) | (191 | ) | (264 | ) | (2 | ) | (266 | ) |
Total comprehensive (loss) income | | | – | | – | | – | | (73 | ) | 2,840 | | 2,767 | | 54 | | 2,821 | |
Common shares issued under employee stock option plan | 25 | | – | | 104 | | (6 | ) | – | | – | | 98 | | – | | 98 | |
Common shares issued under dividend reinvestment plan | 25 | | – | | 38 | | – | | – | | – | | 38 | | – | | 38 | |
Common shares issued under employee savings plan | 25 | | – | | 128 | | – | | – | | – | | 128 | | – | | 128 | |
Other share-based compensation | | | – | | – | | 16 | | – | | (19 | ) | (3 | ) | – | | (3 | ) |
Dividends declared on BCE common and preferred shares | | | – | | – | | – | | – | | (2,511 | ) | (2,511 | ) | – | | (2,511 | ) |
Dividends declared by subsidiaries to non-controlling interest | | | – | | – | | – | | – | | – | | – | | (46 | ) | (46 | ) |
Balance at December 31, 2016 | | | 4,004 | | 18,370 | | 1,160 | | 46 | | (6,040 | ) | 17,540 | | 314 | | 17,854 | |
| 118 BCE Inc. 2017 ANNUAL REPORT |
|
| | |
| | Consolidated financial statements |
| CONSOLIDATED STATEMENTS OF CASH FLOWS |
FOR THE YEAR ENDED DECEMBER 31
(IN MILLIONS OF CANADIAN DOLLARS) | NOTE | | 2017 | | 2016 | |
Cash flows from operating activities | | | | | | |
Net earnings | | | 2,970 | | 3,087 | |
Adjustments to reconcile net earnings to cash flows from operating activities | | | | | | |
Severance, acquisition and other costs | 6 | | 190 | | 135 | |
Depreciation and amortization | 13, 14 | | 3,850 | | 3,508 | |
Post-employment benefit plans cost | 22 | | 314 | | 305 | |
Net interest expense | | | 942 | | 875 | |
Losses (gains) on investments | 8 | | 5 | | (58 | ) |
Income taxes | 9 | | 1,039 | | 1,110 | |
Contributions to post-employment benefit plans | 22 | | (413 | ) | (725 | ) |
Payments under other post-employment benefit plans | 22 | | (77 | ) | (76 | ) |
Severance and other costs paid | | | (147 | ) | (231 | ) |
Interest paid | | | (965 | ) | (882 | ) |
Income taxes paid (net of refunds) | | | (675 | ) | (565 | ) |
Acquisition and other costs paid | | | (155 | ) | (126 | ) |
Net change in operating assets and liabilities | | | 480 | | 286 | |
Cash flows from operating activities | | | 7,358 | | 6,643 | |
Cash flows used in investing activities | | | | | | |
Capital expenditures | 4 | | (4,034 | ) | (3,771 | ) |
Business acquisitions | 3 | | (1,649 | ) | (404 | ) |
Disposition of intangibles and other assets | 3 | | 323 | | – | |
Decrease in investments | | | 6 | | 107 | |
Loan to related party | 3 | | – | | (517 | ) |
Other investing activities | | | (83 | ) | 1 | |
Cash flows used in investing activities | | | (5,437 | ) | (4,584 | ) |
Cash flows used in financing activities | | | | | | |
Increase in notes payable | | | 333 | | 991 | |
Issue of long-term debt | 20 | | 3,011 | | 2,244 | |
Repayment of long-term debt | 20 | | (2,653 | ) | (2,516 | ) |
Issue of common shares | 25 | | 117 | | 99 | |
Repurchase of shares for settlement of share-based payments | 26 | | (224 | ) | (106 | ) |
Cash dividends paid on common shares | | | (2,512 | ) | (2,305 | ) |
Cash dividends paid on preferred shares | | | (127 | ) | (126 | ) |
Cash dividends paid by subsidiaries to non-controlling interest | | | (34 | ) | (46 | ) |
Other financing activities | | | (60 | ) | (54 | ) |
Cash flows used in financing activities | | | (2,149 | ) | (1,819 | ) |
Net (decrease) increase in cash | | | (161 | ) | 503 | |
Cash at beginning of year | | | 603 | | 100 | |
Cash at end of year | | | 442 | | 603 | |
Net decrease in cash equivalents | | | (67 | ) | (263 | ) |
Cash equivalents at beginning of year | | | 250 | | 513 | |
Cash equivalents at end of year | | | 183 | | 250 | |
BCE Inc. 2017 ANNUAL REPORT 119 |
|
| | |
| Notes to consolidated financial statements | |
| Notes to consolidated financial statements |
We,us,our,BCEandthe companymean, as the context may require, either BCE Inc. or, collectively, BCE Inc., Bell Canada, their subsidiaries, joint arrangements and associates.MTSmeans, as the context may require, until March 17, 2017, either Manitoba Telecom Services Inc. or, collectively, Manitoba Telecom Services Inc. and its subsidiaries; andBell MTSmeans, from March 17, 2017, the combined operations of MTS and Bell Canada in Manitoba.
| Note 1Corporate information |
BCE is incorporated and domiciled in Canada. BCE’s head office is located at 1, Carrefour Alexander-Graham-Bell, Verdun, Québec, Canada. BCE is a telecommunications and media company providing wireless, wireline, Internet and television (TV) services to residential, business and wholesale customers nationally across Canada. Our Bell Media segment provides conventional, specialty and pay TV, digital media, radio broadcasting services and out-of-home (OOH) advertising services to customers nationally across Canada. The consolidated financial statements (financial statements) were approved by BCE’s board of directors on March 8, 2018.
| Note 2Significant accounting policies |
A) BASIS OF PRESENTATION
The financial statements were prepared in accordance with International Financial Reporting Standards (IFRS), as issued by the International Accounting Standards Board (IASB). The financial statements have been prepared on a historical cost basis, except for certain financial instruments that are measured at fair value as described in our accounting policies.
All amounts are in millions of Canadian dollars, except where noted.
FUNCTIONAL CURRENCY
The financial statements are presented in Canadian dollars, the company’s functional currency.
| B) BASIS OF CONSOLIDATION |
We consolidate the financial statements of all of our subsidiaries. Subsidiaries are entities we control, where control is achieved when the company is exposed or has the right to variable returns from its involvement with the investee and has the current ability to direct the activities of the investee that significantly affect the investee’s returns.
The results of subsidiaries acquired during the year are consolidated from the date of acquisition and the results of subsidiaries sold during the year are deconsolidated from the date of disposal. Where necessary, adjustments are made to the financial statements of acquired subsidiaries to conform their accounting policies to ours. All intercompany transactions, balances, income and expenses are eliminated on consolidation.
Changes in BCE’s ownership interest in a subsidiary that do not result in a change of control are accounted for as equity transactions, with no effect on net earnings or on other comprehensive (loss) income.
We recognize revenues from the sale of products or the rendering of services when they are earned; specifically when all the following conditions are met:
- the significant risks and rewards of ownership are transferred tocustomers and we retain neither continuing managerial involvementnor effective control
- there is clear evidence that an arrangement exists
- the amount of revenues and related costs can be measured reliably
- it is probable that the economic benefits associated with the transactionwill flow to the company
In particular, we recognize:
- fees for local, long distance and wireless services when we providethe services
- other fees, such as network access fees, licence fees, hosting fees,maintenance fees and standby fees over the term of the contract
- subscriber revenues when customers receive the service
- revenues from the sale of equipment when the equipment is deliveredand accepted by customers
- revenues on long-term contracts as services are provided, equipmentis delivered and accepted, and contract milestones are met
- advertising revenue, net of agency commissions, when advertisementsare aired on radio or TV, posted on our website or appear on thecompany’s advertising panels and street furniture
We measure revenues at the fair value of the arrangement consideration. We record payments we receive in advance, including upfront non-refundable payments, as deferred revenues until we provide the service or deliver the product to customers. Deferred revenues are presented inTrade payables and other liabilitiesor inOther non-current liabilitiesin the consolidated statements of financial position (statements of financial position).
Revenues are reduced for customer rebates and allowances and exclude sales and other taxes we collect from our customers.
We expense subscriber acquisition costs when the related services are activated.
| 120 BCE Inc. 2017 ANNUAL REPORT |
|
| | |
| | Notes to consolidated financial statements |
MULTIPLE-ELEMENT ARRANGEMENTS
We enter into arrangements that may include the sale of a number of products and services together, primarily to our wireless and business customers. When two or more products or services have value to our customers on a stand-alone basis, we separately account for each product or service according to the methods previously described. The total price to the customer is allocated to each product or service based on its relative fair value. When an amount allocated to a delivered item is contingent upon the delivery of additional items or meeting specified performance conditions, the amount allocated to that delivered item is limited to the non-contingent amount.
If the conditions to account for each product or service separately are not met, we recognize revenues proportionately over the term of the sale agreement.
SUBCONTRACTED SERVICES
We may enter into arrangements with subcontractors and others who provide services to our customers. When we act as the principal in these arrangements, we recognize revenues based on the amounts billed to our customers. Otherwise, we recognize the net amount that we retain as revenues.
Our share-based payment arrangements include stock options, restricted share units and performance share units (RSUs/PSUs), deferred share units (DSUs), an employee savings plan (ESP) and a deferred share plan (DSP).
STOCK OPTIONS
We use a fair value-based method to measure the cost of our employee stock options, based on the number of stock options that are expected to vest. We recognize compensation expense inOperating costsin the consolidated income statements (income statements). Compensation expense is adjusted for subsequent changes in management’s estimate of the number of stock options that are expected to vest.
We credit contributed surplus for stock option expense recognized over the vesting period. When stock options are exercised, we credit share capital for the amount received and the amounts previously credited to contributed surplus.
RSUs/PSUs
For each RSU/PSU granted, we recognize compensation expense inOperating costsin the income statements, equal to the market value of a BCE common share at the date of grant and based on the number of RSUs/PSUs expected to vest, recognized over the term of the vesting period, with a corresponding credit to contributed surplus. Additional RSUs/PSUs are issued to reflect dividends declared on the common shares.
Compensation expense is adjusted for subsequent changes in management’s estimate of the number of RSUs/PSUs that are expected to vest. The effect of these changes is recognized in the period of the change. Upon settlement of the RSUs/PSUs, any difference between the cost of shares purchased on the open market and the amount credited to contributed surplus is reflected in the deficit. Vested RSUs/PSUs are settled in BCE common shares, DSUs, or a combination thereof.
DSUs
If compensation is elected to be taken in DSUs, we issue DSUs equal to the fair value of the services received. Additional DSUs are issued to reflect dividends declared on the common shares. DSUs are settled in BCE common shares purchased on the open market following the cessation of employment or when a director leaves the board. We credit contributed surplus for the fair value of DSUs at the issue date. Upon settlement of the DSUs, any difference between the cost of shares purchased on the open market and the amount credited to contributed surplus is reflected in the deficit.
ESP
We recognize our ESP contributions as compensation expense inOperating costsin the income statements. We credit contributed surplus for the ESP expense recognized over the two-year vesting period, based on management’s estimate of the accrued contributions that are expected to vest. Upon settlement of shares under the ESP, any difference between the cost of shares purchased on the open market and the amount credited to contributed surplus is reflected in the deficit.
DSP
For each deferred share granted under the DSP, we recognize compensation expense inOperating costsin the income statements equal to the market value of a BCE common share and based on the number of deferred shares expected to vest, recognized over the vesting period. Additional deferred shares are issued to reflect dividends declared on the common shares.
Compensation expense is adjusted for subsequent changes in the market value of BCE common shares and any change in management’s estimate of the number of deferred shares that are expected to vest. The cumulative effect of any change in value is recognized in the period of the change. Participants have the option to receive either BCE common shares or a cash equivalent for each vested deferred share upon qualifying for payout under the terms of the grant.
| E) INCOME AND OTHER TAXES |
Current and deferred income tax expense is recognized in the income statements, except to the extent that the expense relates to items recognized in other comprehensive (loss) income or directly in equity.
A current or non-current tax asset (liability) is the estimated tax receivable (payable) on taxable earnings (loss) for the current or past periods. We also record future tax liabilities, which are included inOther non-current liabilitiesin the statements of financial position.
We use the liability method to account for deferred tax assets and liabilities, which arise from:
- temporary differences between the carrying amount of assets andliabilities recognized in the statements of financial position and theircorresponding tax bases
- the carryforward of unused tax losses and credits, to the extent theycan be used in the future
BCE Inc. 2017 ANNUAL REPORT 121 |
|
| | |
| Notes to consolidated financial statements | |
Deferred tax assets and liabilities are calculated at the tax rates that are expected to apply when the asset or liability is recovered or settled. Both our current and deferred tax assets and liabilities are calculated using tax rates that have been enacted or substantively enacted at the reporting date.
Deferred taxes are provided on temporary differences arising from investments in subsidiaries, joint arrangements and associates, except where we control the timing of the reversal of the temporary difference and it is probable that the temporary difference will not reverse in the foreseeable future.
Tax liabilities are, where permitted, offset against tax assets within the same taxable entity and tax jurisdiction.
INVESTMENT TAX CREDITS (ITCs), OTHER TAX CREDITS AND GOVERNMENT GRANTS
We recognize ITCs, other tax credits and government grants given on eligible expenditures when it is reasonably assured that they will be realized. They are presented as part ofTrade and other receivablesin the statements of financial position when they are expected to be utilized in the next year. We use the cost reduction method to account for ITCs and government grants, under which the credits are applied against the expense or asset to which the ITC or government grant relates.
Cash equivalents are comprised of highly liquid investments with original maturities of three months or less from the date of purchase.
| G) SECURITIZATION OF TRADE RECEIVABLES |
Proceeds on the securitization of trade receivables are recognized as a collateralized borrowing as we do not transfer control and substantially all the risks and rewards of ownership to another entity.
We measure inventory at the lower of cost and net realizable value. Inventory includes all costs to purchase, convert and bring the inventories to their present location and condition. We determine cost using specific identification for major equipment held for resale and the weighted average cost formula for all other inventory. We maintain inventory valuation reserves for inventory that is slow-moving or potentially obsolete, calculated using an inventory aging analysis.
| I) PROPERTY, PLANT AND EQUIPMENT |
We record property, plant and equipment at historical cost. Historical cost includes expenditures that are attributable directly to the acquisition or construction of the asset, including the purchase cost, and labour.
Borrowing costs are capitalized for qualifying assets, if the time to build or develop is in excess of one year, at a rate that is based on our weighted average interest rate on our outstanding long-term debt. Gains or losses on the sale or retirement of property, plant and equipment are recorded inOther (expense) incomein the income statements.
LEASES
Leases of property, plant and equipment are recognized as finance leases when we obtain substantially all the risks and rewards of ownership of the underlying assets. At the inception of the lease, we record an asset together with a corresponding long-term lease liability, at the lower of the fair value of the leased asset or the present value of the minimum future lease payments. If there is reasonable certainty that the lease transfers ownership of the asset to us by the end of the lease term, the asset is amortized over its useful life. Otherwise, the asset is amortized over the shorter of its useful life and the lease term. The long-term lease liability is measured at amortized cost using the effective interest method.
All other leases are classified as operating leases. We recognize operating lease expense inOperating costsin the income statements on a straight-line basis over the term of the lease.
ASSET RETIREMENT OBLIGATIONS (AROs)
We initially measure and record AROs at management’s best estimate using a present value methodology, adjusted subsequently for any changes in the timing or amount of cash flows and changes in discount rates. We capitalize asset retirement costs as part of the related assets and amortize them into earnings over time. We also increase the ARO and record a corresponding amount in interest expense to reflect the passage of time.
FINITE-LIFE INTANGIBLE ASSETS
Finite-life intangible assets are recorded at cost less accumulated amortization, and accumulated impairment losses, if any.
SOFTWARE
We record internal-use software at historical cost. Cost includes expenditures that are attributable directly to the acquisition or development of the software, including the purchase cost and labour.
Software development costs are capitalized when all the following conditions are met:
- technical feasibility can be demonstrated
- management has the intent and the ability to complete the asset foruse or sale
- it is probable that economic benefits will be generated
- costs attributable to the asset can be measured reliably
| 122 BCE Inc. 2017 ANNUAL REPORT |
|
| | |
| | Notes to consolidated financial statements |
CUSTOMER RELATIONSHIPS
Customer relationship assets are acquired through business combinations and are recorded at fair value at the date of acquisition.
PROGRAM AND FEATURE FILM RIGHTS
We account for program and feature film rights as intangible assets when these assets are acquired for the purpose of broadcasting. Program and feature film rights, which include producer advances and licence fees paid in advance of receipt of the program or film, are stated at acquisition cost less accumulated amortization, and accumulated impairment losses, if any. Programs and feature films under licence agreements are recorded as assets for rights acquired and Iiabilities for obligations incurred when:
- we receive a broadcast master and the cost is known or reasonablydeterminable for new program and feature film licences
- the licence term commences for licence period extensions orsyndicated programs
Programs and feature films are classified as non-current assets with related liabilities classified as current or non-current, based on the payment terms. Amortization of program and feature film rights is recorded inOperating costsin the income statements.
INDEFINITE-LIFE INTANGIBLE ASSETS
Brand assets, mainly comprised of the Bell, Bell Media and Bell MTS brands, and broadcast licences are acquired through business combinations and are recorded at fair value at the date of acquisition, less accumulated impairment losses, if any. Wireless spectrum licences are recorded at acquisition cost, including borrowing costs when the time to build or develop the related network is in excess of one year. Borrowing costs are calculated at a rate that is based on our weighted average interest rate on our outstanding long-term debt.
Currently there are no legal, regulatory, competitive or other factors that limit the useful lives of our brands or spectrum licences.
| K) DEPRECIATION AND AMORTIZATION |
We depreciate property, plant and equipment and amortize finite-life intangible assets on a straight-line basis over their estimated useful lives. We review our estimates of useful lives on an annual basis and adjust depreciation and amortization on a prospective basis, as required. Land and assets under construction or development are not depreciated.
| ESTIMATED USEFUL LIFE | |
Property, plant and equipment | | |
Network infrastructure and equipment | 2 to 40 years | |
Buildings | 5 to 50 years | |
Finite-life intangible assets | | |
Software | 2 to 12 years | |
Customer relationships | 3 to 26 years | |
Program and feature film rights | Up to 5 years | |
| L) INVESTMENTS IN ASSOCIATES AND JOINT ARRANGEMENTS |
Our financial statements incorporate our share of the results of our associates and joint ventures using the equity method of accounting, except when the investment is classified as held for sale. Equity income from investments is recorded inOther (expense) incomein the income statements.
Investments in associates and joint ventures are recognized initially at cost and adjusted thereafter to include the company’s share of income or loss and comprehensive income on an after-tax basis.
Investments are reviewed for impairment at each reporting period and we compare their recoverable amount to their carrying amount when there is an indication of impairment.
We recognize our share of the assets, liabilities, revenues and expenses of joint operations in accordance with the related contractual agreements.
| M) BUSINESS COMBINATIONS AND GOODWILL |
Business combinations are accounted for using the acquisition method. The consideration transferred in a business combination is measured at fair value at the date of acquisition. Acquisition-related transaction costs are expensed as incurred and recorded inSeverance, acquisition and other costsin the income statements.
Identifiable assets and liabilities, including intangible assets, of acquired businesses are recorded at their fair values at the date of acquisition. When we acquire control of a business, any previously-held equity interest is remeasured to fair value and any gain or loss on remeasurement is recognized inOther (expense) incomein the income statements. The excess of the purchase consideration and any previously-held equity interest over the fair value of identifiable net assets acquired is recorded asGoodwillin the statements of financial position. If the fair value of identifiable net assets acquired exceeds the purchase consideration and any previously-held equity interest, the difference is recognized inOther (expense) incomein the income statements immediately as a bargain purchase gain.
Changes in our ownership interest in subsidiaries that do not result in a loss of control are accounted for as equity transactions. Any difference between the change in the carrying amount of non-controlling interest (NCI) and the consideration paid or received is attributed to owner’s equity.
BCE Inc. 2017 ANNUAL REPORT 123 |
|
| | |
| Notes to consolidated financial statements | |
| N) IMPAIRMENT OF NON-FINANCIAL ASSETS |
Goodwill and indefinite-life intangible assets are tested for impairment annually or when there is an indication that the asset may be impaired. Property, plant and equipment and finite-life intangible assets are tested for impairment if events or changes in circumstances, assessed at each reporting period, indicate that their carrying amount may not be recoverable. For the purpose of impairment testing, assets other than goodwill are grouped at the lowest level for which there are separately identifiable cash inflows.
Impairment losses are recognized and measured as the excess of the carrying value of the assets over their recoverable amount. An asset’s recoverable amount is the higher of its fair value less costs of disposal and its value in use. Previously recognized impairment losses, other than those attributable to goodwill, are reviewed for possible reversal at each reporting date and, if the asset’s recoverable amount has increased, all or a portion of the impairment is reversed.
GOODWILL IMPAIRMENT TESTING
We perform an annual test for goodwill impairment in the fourth quarter for each of our cash generating units (CGUs) or groups of CGUs to which goodwill is allocated, and whenever there is an indication that goodwill might be impaired.
A CGU is the smallest identifiable group of assets that generates cash inflows that are independent of the cash inflows from other assets or groups of assets.
We identify any potential impairment by comparing the carrying value of a CGU or group of CGUs to its recoverable amount. The recoverable amount of a CGU or group of CGUs is the higher of its fair value less costs of disposal and its value in use. Both fair value less costs of disposal and value in use are based on estimates of discounted future cash flows or other valuation methods. Cash flows are projected based on past experience, actual operating results and business plans. When the recoverable amount of a CGU or group of CGUs is less than its carrying value, the recoverable amount is determined for its identifiable assets and liabilities. The excess of the recoverable amount of the CGU or group of CGUs over the total of the amounts assigned to its assets and liabilities is the recoverable amount of goodwill.
An impairment charge is recognized inOther (expense) incomein the income statements for any excess of the carrying value of goodwill over its recoverable amount. For purposes of impairment testing of goodwill, our CGUs or groups of CGUs correspond to our reporting segments as disclosed in Note 4,Segmented information.
TRADE AND OTHER RECEIVABLES
Trade and other receivables, which include trade receivables and other short-term receivables, are measured at amortized cost using the effective interest method, net of any allowance for doubtful accounts. An allowance for doubtful accounts is established based on individually significant exposures or on historical trends. Factors considered when establishing an allowance include current economic conditions, historical information and the reason for the delay in payment. Amounts considered uncollectible are written off and recognized inOperating costsin the income statements.
AVAILABLE-FOR-SALE (AFS) FINANCIAL ASSETS
Our portfolio investments in equity securities are classified as AFS and are presented in our statements of financial position asOther non-current assets. They have been designated as such based on management’s intentions or because they are not classified in any other categories. These securities are recorded at fair value on the date of acquisition, including related transaction costs, and are adjusted to fair value at each reporting date. The corresponding unrealized gains and losses are recorded inOther comprehensive (loss) incomein the consolidated statements of comprehensive income (statements of comprehensive income) and are reclassified toOther (expense) incomein the income statements when realized or when an impairment is determined.
OTHER FINANCIAL LIABILITIES
Other financial liabilities, which include trade payables and accruals, compensation payable, obligations imposed by the Canadian Radio-television and Telecommunications Commission (CRTC), interest payable and long-term debt, are recorded at amortized cost using the effective interest method.
COSTS OF ISSUING DEBT AND EQUITY
The cost of issuing debt is included as part of long-term debt and is accounted for at amortized cost using the effective interest method. The cost of issuing equity is reflected in the consolidated statements of changes in equity as a charge to the deficit.
| P) DERIVATIVE FINANCIAL INSTRUMENTS |
We use derivative financial instruments to manage interest rate risk, foreign currency risk and cash flow exposures related to share-based payment plans, capital expenditures, long-term debt instruments and operating revenues and expenses. We do not use derivative financial instruments for speculative or trading purposes.
HEDGE ACCOUNTING
To qualify for hedge accounting, we document the relationship between the derivative and the related identified risk exposure, and our risk management objective and strategy. This includes associating each derivative to a specific asset or liability, a specific firm commitment, anticipated purchases or sales.
We assess the effectiveness of a derivative in managing an identified risk exposure when hedge accounting is initially applied, and on an ongoing basis thereafter. If a hedge becomes ineffective, we stop using hedge accounting.
FAIR VALUE HEDGES
We enter into interest rate swaps to manage the effect of changes in interest rates relating to fixed-rate long-term debt. These swaps involve exchanging interest payments without exchanging the notional amount on which the payments are based. We record the exchange of payments as an adjustment to interest expense on the hedged debt. We include the related net receivable or payable from counterparties inOther current assetsorTrade payables and other liabilitiesin the
| 124 BCE Inc. 2017 ANNUAL REPORT |
|
| | |
| | Notes to consolidated financial statements |
statements of financial position for swaps due within one year and in Other non-current assetsorOther non-current liabilitiesfor swaps that have a maturity of more than one year. Changes in the fair value of these derivatives and the related long-term debt are recognized inOther (expense) incomein the income statements and offset, unless a portion of the hedging relationship is ineffective.
CASH FLOW HEDGES
We enter into cash flow hedges to mitigate foreign currency risk on certain debt instruments and anticipated purchases and sales, as well as interest rate risk related to future debt issuances. We use foreign currency forward contracts to manage the exposure to anticipated purchases and sales denominated in foreign currencies.
Changes in the fair value of foreign currency forward contracts related to anticipated purchases and sales are recognized in our statements of comprehensive income, except for any ineffective portion, which is recognized immediately inOther (expense) incomein the income statements. Realized gains and losses inAccumulated other comprehensive incomeare reclassified to the income statements or as an adjustment to the cost basis of the hedged item in the same periods as the corresponding hedged transactions are recognized. Cash flow hedges that mature within one year are included inOther current assetsorTrade payables and other liabilitiesin the statements of financial position, whereas hedges that have a maturity of more than one year are included inOther non-current assetsorOther non-current liabilities.
We use cross currency basis swaps and foreign currency forward contracts to manage our U.S. dollar borrowings under our unsecured committed term credit facility and U.S. commercial paper program. Changes in the fair value of these derivatives and the related borrowings are recognized inOther (expense) incomein the income statements and offset, unless a portion of the hedging relationship is ineffective.
DERIVATIVES USED AS ECONOMIC HEDGES
We use derivatives to manage cash flow exposures related to equity-settled share-based payment plans and anticipated purchases, equity price risk related to a cash-settled share-based payment plan, and interest rate risk related to preferred share dividend rate resets. As these derivatives do not qualify for hedge accounting, the changes in their fair value are recorded in the income statements inOperating costsfor derivatives used to hedge cash-settled share-based payments and inOther (expense) incomefor other derivatives.
| Q) POST-EMPLOYMENT BENEFIT PLANS |
DEFINED BENEFIT (DB) AND OTHER POST-EMPLOYMENT BENEFIT (OPEB) PLANS
We maintain DB pension plans that provide pension benefits for certain employees. Benefits are based on the employee’s length of service and average rate of pay during the highest paid consecutive five years of service. Most employees are not required to contribute to the plans. Certain plans provide cost of living adjustments to help protect the income of retired employees against inflation.
We are responsible for adequately funding our DB pension plans. We make contributions to them based on various actuarial cost methods permitted by pension regulatory bodies. Contributions reflect actuarial assumptions about future investment returns, salary projections, future service and life expectancy.
We provide OPEBs to some of our employees, including:
- healthcare and life insurance benefits during retirement, whichwere phased out for new retirees over a ten-year period ending onDecember 31, 2016. We do not fund most of these OPEB plans.
- other benefits, including workers’ compensation and medical benefitsto former or inactive employees, their beneficiaries and dependants,from the time their employment ends until their retirement starts,under certain circumstances
We accrue our obligations and related costs under post-employment benefit plans, net of the fair value of the benefit plan assets. Pension and OPEB costs are determined using:
- the projected unit credit method, prorated on years of service, whichtakes into account future pay levels
- a discount rate based on market interest rates of high-quality corporatefixed income investments with maturities that match the timing ofbenefits expected to be paid under the plans
- management’s best estimate of pay increases, retirement agesof employees, expected healthcare costs and life expectancy
We value post-employment benefit plan assets at fair value using current market values.
Post-employment benefit plans current service cost is included inOperating costsin the income statements. Interest on our post-employment benefit assets and obligations is recognized inFinance costsin the income statements and represents the accretion of interest on the assets and obligations under our post-employment benefit plans. The interest rate is based on market conditions that existed at the beginning of the year. Actuarial gains and losses for all post-employment benefit plans are recorded inOther comprehensive (loss) incomein the statements of comprehensive income in the period in which they occur and are recognized immediately in the deficit.
December 31 is the measurement date for our significant post-employment benefit plans. Our actuaries perform a valuation based on management’s assumptions at least every three years to determine the actuarial present value of the accrued DB pension plan and OPEB obligations. The most recent actuarial valuation of our significant pension plans was as at December 31, 2016.
DEFINED CONTRIBUTION (DC) PENSION PLANS
We maintain DC pension plans that provide certain employees with benefits. Under these plans, we are responsible for contributing a predetermined amount to an employee’s retirement savings, based on a percentage of the employee’s salary.
We recognize a post-employment benefit plans service cost for DC pension plans when the employee provides service to the company, essentially coinciding with our cash contributions.
Generally, new employees can participate only in the DC pension plans.
BCE Inc. 2017 ANNUAL REPORT 125 |
|
| | |
| Notes to consolidated financial statements | |
Provisions are recognized when all the following conditions are met:
- the company has a present legal or constructive obligation basedon past events
- it is probable that an outflow of economic resources will be requiredto settle the obligation
- the amount can be reasonably estimated
Provisions are measured at the present value of the estimated expenditures expected to settle the obligation, if the effect of the time value of money is material. The present value is determined using current market assessments of the discount rate and risks specific to the obligation. The obligation increases as a result of the passage of time, resulting in interest expense which is recognized inFinance costsin the income statements.
| S) ESTIMATES AND KEY JUDGMENTS |
When preparing the financial statements, management makes estimates and judgments relating to:
- reported amounts of revenues and expenses
- reported amounts of assets and liabilities
- disclosure of contingent assets and liabilities
We base our estimates on a number of factors, including historical experience, current events and actions that the company may undertake in the future, and other assumptions that we believe are reasonable under the circumstances. By their nature, these estimates and judgments are subject to measurement uncertainty and actual results could differ. Our more significant estimates and judgments are described below.
ESTIMATES
USEFUL LIVES OF PROPERTY, PLANT AND EQUIPMENT AND FINITE-LIFE INTANGIBLE ASSETS
Property, plant and equipment represent a significant proportion of our total assets. Changes in technology or our intended use of these assets, as well as changes in business prospects or economic and industry factors, may cause the estimated useful lives of these assets to change.
POST-EMPLOYMENT BENEFIT PLANS
The amounts reported in the financial statements relating to DB pension plans and OPEBs are determined using actuarial calculations that are based on several assumptions.
The actuarial valuation uses management’s assumptions for, among other things, the discount rate, life expectancy, the rate of compensation increase, trends in healthcare costs and expected average remaining years of service of employees.
The most significant assumptions used to calculate the net post-employment benefit plans cost are the discount rate and life expectancy.
The discount rate is based on the yield on long-term, high-quality corporate fixed income investments, with maturities matching the estimated cash flows of the post-employment benefit plans. Life expectancy is based on publicly available Canadian mortality tables and is adjusted for the company’s specific experience.
IMPAIRMENT OF NON-FINANCIAL ASSETS
We make a number of estimates when calculating recoverable amounts using discounted future cash flows or other valuation methods to test for impairment. These estimates include the assumed growth rates for future cash flows, the number of years used in the cash flow model and the discount rate.
DEFERRED TAXES
The amount of deferred tax assets and liabilities are estimated with consideration given to the timing, sources and amounts of future taxable income.
FAIR VALUE OF FINANCIAL INSTRUMENTS
Certain financial instruments, such as investments in equity securities, derivative financial instruments and certain elements of borrowings, are carried in the statements of financial position at fair value, with changes in fair value reflected in the income statements and the statements of comprehensive income. Fair values are estimated by reference to published price quotations or by using other valuation techniques that may include inputs that are not based on observable market data, such as discounted cash flows and earnings multiples.
CONTINGENCIES
In the ordinary course of business, we become involved in various claims and legal proceedings seeking monetary damages and other relief. Pending claims and legal proceedings represent a potential cost to our business. We estimate the amount of a loss by analyzing potential outcomes and assuming various litigation and settlement strategies, based on information that is available at the time.
ONEROUS CONTRACTS
A provision for onerous contracts is recognized when the unavoidable costs of meeting our obligations under a contract exceed the expected benefits to be received under the contract. The provision is measured at the present value of the lower of the expected cost of terminating the contract and the expected net cost of completing the contract.
| 126 BCE Inc. 2017 ANNUAL REPORT |
|
| | |
| | Notes to consolidated financial statements |
JUDGMENTS
POST-EMPLOYMENT BENEFIT PLANS
The determination of the discount rate used to value our post-employment benefit obligations requires judgment. The rate is set by reference to market yields of high-quality corporate fixed income investments at the beginning of each fiscal year. Significant judgment is required when setting the criteria for fixed income investments to be included in the population from which the yield curve is derived. The most significant criteria considered for the selection of investments include the size of the issue and credit quality, along with the identification of outliers, which are excluded.
INCOME TAXES
The calculation of income taxes requires judgment in interpreting tax rules and regulations. There are transactions and calculations for which the ultimate tax determination is uncertain. Our tax filings are also subject to audits, the outcome of which could change the amount of current and deferred tax assets and liabilities.
Management judgment is used to determine the amounts of deferred tax assets and liabilities and future tax liabilities to be recognized. In particular, judgment is required when assessing the timing of the reversal of temporary differences to which future income tax rates are applied.
MULTIPLE-ELEMENT ARRANGEMENTS
Determining the amounts of revenue to be recognized for multiple-element arrangements requires judgment to establish the separately identifiable components and the allocation of the total price between those components.
CGUs
The determination of CGUs or groups of CGUs for the purpose of impairment testing requires judgment.
CONTINGENCIES
The determination of whether a loss is probable from claims and legal proceedings and whether an outflow of resources is likely requires judgment.
| T) CHANGE IN ACCOUNTING ESTIMATE |
In 2017 and 2016, as part of our ongoing annual review of property, plant and equipment and finite-life intangible assets, and to better reflect their useful lives, we increased the estimate of useful lives of certain assets. The changes have been applied prospectively effective January 1, 2017 and January 1, 2016, and did not have a significant impact on our financial statements.
| U) ADOPTION OF AMENDED ACCOUNTING STANDARDS |
As required, effective January 1, 2017, we adopted the following amended accounting standard.
| STANDARD | DESCRIPTION | IMPACT |
Amendments to IAS 7 – Statement of Cash Flows | Requires enhanced disclosures about changes in liabilities arising from financing activities, including changes from financing cash flows, changes arising from obtaining or losing control of subsidiaries or other businesses, the effect of changes in foreign exchange rates and changes in fair values. | The required enhanced disclosures have been provided in Note 27, Additional cash flow information. |
BCE Inc. 2017 ANNUAL REPORT 127 |
|
| | |
| Notes to consolidated financial statements | |
| V) FUTURE CHANGES TO ACCOUNTING STANDARDS |
The following new or amended standards and interpretation issued by the IASB have an effective date after December 31, 2017 and have not yet been adopted by BCE.
STANDARD | DESCRIPTION | IMPACT | EFFECTIVE DATE |
IFRS 15 – Revenue from Contracts with Customers | Establishes principles to record revenues from contracts for the sale of goods or services, unless the contracts are in the scope of IAS 17 – Leases or other IFRSs. Under IFRS 15, revenue is recognized at an amount that reflects the expected consideration receivable in exchange for transferring goods or services to a customer, applying the following five steps: 1. Identify the contract with a customer
2. Identify the performance obligations in the contract
3. Determine the transaction price
4. Allocate the transaction price to the performance obligations in the contract
5. Recognize revenue when (or as) the entity satisfies a performance obligation The new standard also provides guidance relating to principal versus agent relationships, licences of intellectual property, contract costs and the measurement and recognition of gains and losses on the sale of certain non-financial assets such as property and equipment. Additional disclosures will also be required under the new standard. | IFRS 15 will principally affect the timing of revenue recognition and how we classify revenues between product and service in our Bell Wireless segment. IFRS 15 will also affect how we account for costs to obtain a contract. Under multiple-element arrangements, revenue allocated to a satisfiedperformance obligation will no longer be limited to the amount that isnot contingent upon the satisfaction of additional performanceobligations. Although the total revenue recognized during the term of acontract will be largely unaffected, revenue recognition may beaccelerated and reflected ahead of the associated cash inflows. Thiswill result in the recognition of a contract asset on the balance sheet,corresponding to the amount of revenue recognized and not yet billedto a customer. The contract asset will be realized over the term of thecustomer contract. As revenues allocated to a satisfied performance obligation are nolonger limited to the non-contingent amount, a greater proportion ofthe total revenue recognized during the term of certain customercontracts will be attributed to a delivered product, resulting in acorresponding decrease in service revenue. Sales commissions and any other incremental costs of obtaining acontract with a customer will be recognized on the balance sheet andamortized on a systematic basis that is consistent with the period andpattern of transfer to the customer of the related products or services,except as noted below.
Under IFRS 15, certain practical expedients are permitted both on transition and on an ongoing basis. On transition, completed contracts that begin and end within the sameannual reporting period and those completed before January 1, 2017are not restated. Similarly, contracts modified prior to January 1, 2017are not restated. When our right to consideration from a customer corresponds directlywith the value to the customer of the products and servicestransferred to date, we will recognize revenue in the amount to whichwe have a right to invoice. Costs of obtaining a contract that would be amortized within one yearor less will be immediately expensed.
We continue to make progress towards adoption of IFRS 15 according to our detailed implementation plan. Changes and enhancements to our existing information technology (IT) systems, business processes, and systems of internal control are being completed. A dedicated project team that leverages key resources throughout the company is in place to effect the necessary changes. While our testing and data validation process is ongoing, we expect that the impact of the new standard will be most pronounced in our Bell Wireless segment. Although total revenue recognized over the term of a customercontract is not expected to change significantly, our preliminaryestimate of the impact of adopting IFRS 15 is a decrease in 2017 servicerevenues within the range of $1.2 billion to $1.4 billion, with acorresponding increase in product revenue. Total operating revenues less operating costs in 2017 is estimated toincrease by approximately $0.1 billion. Total assets on our January 1, 2017 statement of financial position willincrease as we record contract assets and costs to obtain a contract. We currently estimate the value of the gross contract assets to be inthe range of $1.1 billion to $1.3 billion and an increase in costs to obtaina contract of approximately $0.3 billion to $0.4 billion, both of whichwould be recognized through an adjustment to opening retainedearnings. Total liabilities will increase mainly to reflect a resulting $0.4 billiondeferred tax liability, also recognized through an adjustment toopening retained earnings. We do not expect that IFRS 15 will impact our cash flows fromoperating activities.
| Annual periods beginning on or after January 1, 2018, using a full retrospective approach for all periods presented in the period of adoption. |
| 128 BCE Inc. 2017 ANNUAL REPORT |
|
| | |
| | Notes to consolidated financial statements |
STANDARD | DESCRIPTION | IMPACT | EFFECTIVE DATE |
Amendments to IFRS 2 – Share-based Payment | Clarifies the classification and measurement of cash-settled share-based payment transactions that include a performance condition, share-based payment transactions with a net settlement feature for withholding tax obligations, and modifications of a share-based payment transaction from cash-settled to equity-settled. | The amendments to IFRS 2 will not have a significant impact on our financial statements. | Annual periods beginning on or after January 1, 2018. |
IFRS 9 – Financial Instruments | Sets out the requirements for recognizing and measuring financial assets, financial liabilities and some contracts to buy and sell non-financial items. IFRS 9 replaces IAS 39 – Financial Instruments: Recognition and Measurement. The new standard establishes a single classification and measurement approach for financial assets that reflects the business model in which they are managed and their cash flow characteristics. It also provides guidance on an entity’s own credit risk relating to financial liabilities and modifies the hedge accounting model to better link the economics of risk management with its accounting treatment. Additional disclosures will also be required under the new standard. | The amendments to IFRS 9 will not have a significant impact on our financial statements. | Annual periods beginning on or after January 1, 2018. |
IFRS 16 – Leases | Eliminates the distinction between operating and finance leases for lessees, requiring instead that leases be capitalized by recognizing the present value of the lease payments and showing them either as lease assets (right-of-use assets) or together with property, plant and equipment. If lease payments are made over time, an entity recognizes a financial liability representing its obligation to make future lease payments. A depreciation charge for the lease asset is recorded within operating costs and an interest expense on the lease liability is recorded within finance costs. IFRS 16 does not require a lessee to recognize assets and liabilities for short-term leases and leases of low-value assets, nor does it substantially change lease accounting for lessors. | We continue to make progress towards adoption of IFRS 16 according to our detailed implementation plan. Changes and enhancements to our existing IT systems, business processes, and systems of internal control are being designed and tested. It is not yet possible to make a reliable estimate of the impact of the new standard on our financial statements. | Annual periods beginning on or after January 1, 2019, using either a full retrospective approach for all periods presented in the period of adoption or a modified retrospective approach. |
International Financial Reporting Interpretations Committee (IFRIC) 23 – Uncertainty over Income Tax Treatments | IFRIC 23 clarifies the application of recognition and measurement requirements in IAS 12 – Income Taxes when there is uncertainty over income tax treatments. It specifically addresses whether an entity considers uncertain tax treatments separately or as a group, the assumptions an entity makes about the examination of tax treatments by taxation authorities, how an entity determines taxable profit (tax loss), tax bases, unused tax losses, unused tax credits and tax rates and how an entity considers changes in facts and circumstances. | We are currently evaluating the impact of IFRIC 23 on our financial statements. | Annual periods beginning on or after January 1, 2019, using either a full retrospective or a modified retrospective approach. |
BCE Inc. 2017 ANNUAL REPORT 129 |
|
| | |
| Notes to consolidated financial statements | |
| Note 3Business acquisitions and dispositions |
2017
On March 17, 2017, BCE acquired all of the issued and outstanding common shares of MTS for a total consideration of $2,933 million, of which $1,339 million was paid in cash and the remaining $1,594 million through the issuance of approximately 27.6 million BCE common shares. BCE funded the cash component of the transaction through debt financing.
Bell MTS is an information and communications technology provider offering wireless, Internet, TV, phone services, security systems and information solutions including unified cloud and managed services to residential and business customers in Manitoba.
The acquisition of MTS allows us to reach more Canadians through the expansion of our wireless and wireline broadband networks while supporting our goal of being recognized by customers as Canada’s leading communications company.
The results from the acquired MTS operations are included in our Bell Wireline and Bell Wireless segments from the date of acquisition.
The following table summarizes the fair value of the consideration paid and the fair value assigned to each major class of assets and liabilities.
| TOTAL | |
Cash consideration | 1,339 | |
Issuance of 27.6 million BCE common shares (1) | 1,594 | |
Total cost to be allocated | 2,933 | |
Trade and other receivables | 91 | |
Other non-cash working capital | (164 | ) |
Assets held for sale (2) | 302 | |
Property, plant and equipment | 978 | |
Finite-life intangible assets (3) | 979 | |
Indefinite-life intangible assets (4) | 280 | |
Deferred tax assets | 32 | |
Other non-current assets | 129 | |
Debt due within one year | (251 | ) |
Long-term debt | (721 | ) |
Other non-current liabilities | (49 | ) |
| 1,606 | |
Cash and cash equivalents | (16 | ) |
Fair value of net assets acquired | 1,590 | |
Goodwill (5) | 1,343 | |
| (1) | Recorded at fair value based on the market price of BCE common shares on the acquisition date. |
| (2) | Consists of finite-life and indefinite-life intangible assets recorded at fair value less costs to sell. |
| (3) | Consists mainly of customer relationships. |
| (4) | Indefinite-life intangible assets of $228 million and $52 million were allocated to our Bell Wireless and Bell Wireline groups of cash generating units (CGUs), respectively. |
| (5) | Goodwill arises principally from the assembled workforce, expected synergies and future growth. Goodwill is not deductible for tax purposes. Goodwill arising from the transaction of $677 million and $666 million was allocated to our Bell Wireless and Bell Wireline groups of CGUs, respectively. |
As a result of the acquisition of MTS, we acquired non-capital tax loss carryforwards of approximately $1.5 billion and recognized a deferred tax asset of approximately $300 million which was realized in 2017.
Revenues of $728 million and net earnings of $87 million from the acquired MTS operations are included in the consolidated income statements from the date of acquisition. BCE’s consolidated operating revenues and net earnings for the year ended December 31, 2017 would have been $22,913 million and $2,978 million, respectively, had the acquisition of MTS occurred on January 1, 2017. These proforma amounts reflect the elimination of intercompany transactions, financing costs and the amortization of certain elements of the purchase price allocation and related tax adjustments.
During Q2 2017, BCE completed the previously announced divestiture of approximately one-quarter of postpaid wireless subscribers and 15 retail locations previously held by MTS, as well as certain Manitoba network assets, to TELUS Communications Inc. (TELUS) for total proceeds of $323 million.
Subsequent to the acquisition of MTS, on March 17, 2017, BCE transferred to Xplornet Communications Inc. (Xplornet) a total of 40 Megahertz (MHz) of 700 MHz, advanced wireless services-1 and 2500 MHz wireless spectrum which was previously held by MTS. BCE has also agreed to transfer to Xplornet wireless customers once Xplornet launches its mobile wireless service.
| 130 BCE Inc. 2017 ANNUAL REPORT |
|
| | |
| | Notes to consolidated financial statements |
| ACQUISITION OF CIESLOK MEDIA LTD. (CIESLOK MEDIA) |
On January 3, 2017, BCE acquired all of the issued and outstanding common shares of Cieslok Media for a total cash consideration of $161 million.
Cieslok Media specializes in large-format outdoor advertising in key urban areas across Canada. This acquisition will contribute to growing and strengthening our digital presence in out-of-home advertising. Cieslok Media is included in our Bell Media segment in our consolidated financial statements.
The following table summarizes the fair value of the consideration paid and the fair value assigned to each major class of assets and liabilities.
| TOTAL | |
Cash consideration | 161 | |
Total cost to be allocated | 161 | |
Trade and other receivables | 11 | |
Other non-cash working capital | (4 | ) |
Property, plant and equipment | 13 | |
Finite-life intangible assets | 6 | |
Indefinite-life intangible assets | 76 | |
Deferred tax liabilities | (20 | ) |
Other non-current liabilities | (1 | ) |
| 81 | |
Cash and cash equivalents | 1 | |
Fair value of net assets acquired | 82 | |
Goodwill (1) | 79 | |
| (1) | Goodwill arises principally from the assembled workforce, expected synergies and future growth. Goodwill is not deductible for tax purposes. The goodwill arising from the transaction was allocated to our Bell Media group of CGUs. |
The transaction did not have a significant impact on our consolidated operating revenues and net earnings for the year ended December 31, 2017.
| ACQUISITION OF ALARMFORCE INDUSTRIES INC. (ALARMFORCE) |
Subsequent to year end, on January 5, 2018, BCE acquired all of the issued and outstanding shares of AlarmForce for a total consideration of $182 million, of which $181 million was paid in cash and the remaining $1 million through the issuance of 22,531 BCE common shares.
Subsequent to the acquisition of AlarmForce, on January 5, 2018, BCE sold AlarmForce’s approximate 39,000 customer accounts in British Columbia, Alberta and Saskatchewan to TELUS for total proceeds of approximately $67 million subject to customary closing adjustments.
AlarmForce provides security alarm monitoring, personal emergency response monitoring, video surveillance and related services to residential and commercial subscribers. The acquisition of AlarmForce supports our strategic expansion in the Connected Home marketplace.
AlarmForce will be included in our Bell Wireline segment in our consolidated financial statements.
The fair values of AlarmForce’s assets and liabilities have not yet been determined.
| PROPOSED ACQUISITION OF SÉRIES+ AND HISTORIA SPECIALTY CHANNELS |
On October 17, 2017, BCE entered into an agreement with Corus Entertainment Inc. (Corus) to acquire French-language specialty channels Séries+ and Historia. The transaction is valued at approximately $200 million. Subject to closing conditions, including approval by the CRTC and the Competition Bureau, the transaction is expected to close in mid-2018.
Séries+ is a fiction channel, offering locally produced dramas as well as foreign series. Historia broadcasts a suite of locally produced original content including documentaries, reality series and drama series.
The acquisition of Séries+ and Historia is expected to further enhance our competitiveness in the Québec media landscape.
2016
| ACQUISITION OF Q9 NETWORKS INC. (Q9) |
On October 3, 2016, BCE acquired the remaining 64.6% of the issued and outstanding shares of Q9 that it did not already own for a total cash consideration of approximately $170 million.
Q9 is a Toronto-based data centre operator providing outsourced hosting and other data solutions to Canadian business and government customers. The acquisition supports BCE’s ability to compete against domestic and international providers in the growing outsourced data services sector. Q9 is included in our Bell Wireline segment in our financial statements.
BCE Inc. 2017 ANNUAL REPORT 131 |
|
| | |
| Notes to consolidated financial statements | |
The following table summarizes the fair value of the consideration paid and the fair value assigned to each major class of assets and liabilities.
| TOTAL | |
Cash consideration | 170 | |
Fair value of previously held interest in Q9 and favourable purchase option | 131 | |
Note receivable from Q9 | 517 | |
Total cost to be allocated | 818 | |
Trade and other receivables | 19 | |
Other non-cash working capital | (39 | ) |
Property, plant and equipment | 311 | |
Finite-life intangible assets | 267 | |
Long-term debt | (7 | ) |
Deferred tax liabilities | (69 | ) |
Other non-current liabilities | (16 | ) |
| 466 | |
Cash and cash equivalents | 12 | |
Fair value of net assets acquired | 478 | |
Goodwill (1) | 340 | |
| (1) | Goodwill arises principally from the assembled workforce, expected synergies and future growth. Goodwill is not deductible for tax purposes. The goodwill arising from the transaction was allocated to our Bell Wireline group of CGUs. |
In 2016, prior to the acquisition of Q9, BCE provided a loan of $517 million to Q9 mainly for the repayment of certain of its debt.
A gain on investment of $12 million was recognized inOther (expense) incomein the income statements in 2016 from remeasuring BCE’s previously held equity interest in Q9 to its fair value.
Revenues of $29 million and net earnings of $2 million were included in the income statements in 2016 from the date of acquisition. BCE’s consolidated operating revenues and net earnings for the year ended December 31, 2016 would have been $21,801 million and $3,038 million, respectively, had the Q9 acquisition occurred on January 1, 2016. These proforma amounts reflect the elimination of intercompany transactions and earnings related to our previously held interest, the amortization of certain elements of the purchase price allocation and related tax adjustments.
| NATIONAL EXPANSION OF HBO AND THE MOVIE NETWORK (TMN) |
In Q1 2016, BCE completed a transaction with Corus under which Corus waived its HBO content rights in Canada and ceased operations of its Movie Central and Encore Avenue pay TV services in Western and Northern Canada, thereby allowing Bell Media to become the sole operator of HBO Canada nationally across all platforms and to expand TMN into a national pay TV service. TMN was successfully launched nationally on March 1, 2016. BCE paid to Corus a total cash consideration of $218 million, of which $21 million was paid in 2015.
The following table summarizes the fair value of the consideration paid and the fair value assigned to each major class of assets and liabilities.
| TOTAL | |
Cash consideration | 218 | |
Finite-life intangible assets | 8 | |
Non-current assets | 1 | |
Current liabilities | (3 | ) |
Non-current liabilities | (8 | ) |
Fair value of net assets acquired | (2 | ) |
Goodwill (1) | 220 | |
| (1) | Goodwill arises principally from the ability to leverage media content and expected future growth. The amount of goodwill deductible for tax purposes is $163 million at a 7% annual rate declining balance. The goodwill arising from the transaction was allocated to our Bell Media group of CGUs. |
The transaction is part of our strategy to create, negotiate and deliver premium TV programming to Canadian consumers across more platforms on a national basis.
This transaction did not have a significant impact on our consolidated operating revenues and net earnings for the year ended December 31, 2016.
| 132 BCE Inc. 2017 ANNUAL REPORT |
|
| | |
| | Notes to consolidated financial statements |
| Note 4Segmented information |
The accounting policies used in our segment reporting are the same as those we describe in Note 2,Significant accounting policies. Our results are reported in three segments: Bell Wireless, Bell Wireline and Bell Media. Our segments reflect how we manage our business and how we classify our operations for planning and measuring performance. Accordingly, we operate and manage our segments as strategic business units organized by products and services. Segments negotiate sales with each other as if they were unrelated parties.
We measure the performance of each segment based on segment profit, which is equal to operating revenues less operating costs for the segment. We report severance, acquisition and other costs and depreciation and amortization by segment for external reporting purposes. Substantially all of our finance costs and other (expense) income are managed on a corporate basis and, accordingly, are not reflected in segment results.
Substantially all of our operations and assets are located in Canada.
On March 17, 2017, BCE acquired all of the issued and outstanding common shares of MTS. The results from the acquired MTS operations are included in our Bell Wireless and Bell Wireline segments from the date of acquisition.
Our Bell Wireless segment provides wireless voice and data communication products and services to our residential, small and medium-sized business and large enterprise customers across Canada.
Our Bell Wireline segment provides data, including Internet access and Internet protocol television, local telephone, long distance, as well as other communications services and products to our residential, small and medium-sized business and large enterprise customers primarily in Ontario, Québec, the Atlantic provinces and Manitoba, while satellite TV service and connectivity to business customers are available nationally across Canada. In addition, this segment includes our wholesale business, which buys and sells local telephone, long distance, data and other services from or to resellers and other carriers.
Our Bell Media segment provides conventional, specialty and pay TV, digital media, radio broadcasting services and out-of-home advertising services to customers nationally across Canada.
| FOR THE YEAR ENDED DECEMBER 31, 2017 | NOTE | | BELL
WIRELESS | | BELL
WIRELINE | | BELL
MEDIA | | INTER-SEGMENT
ELIMINATIONS | | BCE | |
Operating revenues | | | | | | | | | | | | |
External customers | | | 7,838 | | 12,205 | | 2,676 | | – | | 22,719 | |
Inter-segment | | | 45 | | 210 | | 428 | | (683 | ) | – | |
Total operating revenues | | | 7,883 | | 12,415 | | 3,104 | | (683 | ) | 22,719 | |
Operating costs | 5 | | (4,607 | ) | (7,229 | ) | (2,388 | ) | 683 | | (13,541 | ) |
Segment profit (1) | | | 3,276 | | 5,186 | | 716 | | – | | 9,178 | |
Severance, acquisition and other costs | 6 | | (18 | ) | (150 | ) | (22 | ) | – | | (190 | ) |
Depreciation and amortization | 13, 14 | | (603 | ) | (3,102 | ) | (145 | ) | – | | (3,850 | ) |
Finance costs | | | | | | | | | | | | |
Interest expense | 7 | | | | | | | | | | (955 | ) |
Interest on post-employment benefit obligations | 22 | | | | | | | | | | (72 | ) |
Other expense | 8 | | | | | | | | | | (102 | ) |
Income taxes | 9 | | | | | | | | | | (1,039 | ) |
Net earnings | | | | | | | | | | | 2,970 | |
Goodwill | 17 | | 3,032 | | 4,497 | | 2,899 | | – | | 10,428 | |
Indefinite-life intangible assets | 14 | | 3,891 | | 1,692 | | 2,645 | | – | | 8,228 | |
Capital expenditures | | | 731 | | 3,174 | | 129 | | – | | 4,034 | |
| (1) | The chief operating decision maker uses primarily one measure of profit to make decisions and assess performance, being operating revenues less operating costs. |
BCE Inc. 2017 ANNUAL REPORT 133 |
|
| | |
| Notes to consolidated financial statements | |
| FOR THE YEAR ENDED DECEMBER 31, 2016 | NOTE | | BELL
WIRELESS | | BELL
WIRELINE | | BELL
MEDIA | | INTER-SEGMENT
ELIMINATIONS | | BCE | |
Operating revenues | | | | | | | | | | | | |
External customers | | | 7,117 | | 11,917 | | 2,685 | | – | | 21,719 | |
Inter-segment | | | 42 | | 187 | | 396 | | (625 | ) | – | |
Total operating revenues | | | 7,159 | | 12,104 | | 3,081 | | (625 | ) | 21,719 | |
Operating costs | 5 | | (4,156 | ) | (7,062 | ) | (2,338 | ) | 625 | | (12,931 | ) |
Segment profit (1) | | | 3,003 | | 5,042 | | 743 | | – | | 8,788 | |
Severance, acquisition and other costs | 6 | | (6 | ) | (130 | ) | 1 | | – | | (135 | ) |
Depreciation and amortization | 13, 14 | | (555 | ) | (2,816 | ) | (137 | ) | – | | (3,508 | ) |
Finance costs | | | | | | | | | | | | |
Interest expense | 7 | | | | | | | | | | (888 | ) |
Interest on post-employment benefit obligations | 22 | | | | | | | | | | (81 | ) |
Other income | 8 | | | | | | | | | | 21 | |
Income taxes | 9 | | | | | | | | | | (1,110 | ) |
Net earnings | | | | | | | | | | | 3,087 | |
Goodwill | 17 | | 2,304 | | 3,831 | | 2,823 | | – | | 8,958 | |
Indefinite-life intangible assets | 14 | | 3,663 | | 1,640 | | 2,640 | | – | | 7,943 | |
Capital expenditures | | | 733 | | 2,936 | | 102 | | – | | 3,771 | |
| (1) | The chief operating decision maker uses primarily one measure of profit to make decisions and assess performance, being operating revenues less operating costs. |
| REVENUES BY SERVICES AND PRODUCTS |
| FOR THE YEAR ENDED DECEMBER 31 | 2017 | | 2016 | |
Services | | | | |
Wireless | 7,308 | | 6,602 | |
Data | 7,146 | | 6,791 | |
Local and access | 3,161 | | 3,089 | |
Long distance | 639 | | 741 | |
Media | 2,676 | | 2,685 | |
Other services | 213 | | 182 | |
Total services | 21,143 | | 20,090 | |
Products | | | | |
Wireless | 530 | | 515 | |
Data | 519 | | 559 | |
Equipment and other | 527 | | 555 | |
Total products | 1,576 | | 1,629 | |
Total operating revenues | 22,719 | | 21,719 | |
| 134 BCE Inc. 2017 ANNUAL REPORT |
|
| | |
| | Notes to consolidated financial statements |
| FOR THE YEAR ENDED DECEMBER 31 | NOTE | | 2017 | | 2016 | |
Labour costs | | | | | | |
Wages, salaries and related taxes and benefits | | | (4,158 | ) | (4,016 | ) |
Post-employment benefit plans service cost (net of capitalized amounts) | 22 | | (242 | ) | (224 | ) |
Other labour costs (1) | | | (1,056 | ) | (1,036 | ) |
Less: | | | | | | |
Capitalized labour | | | 1,043 | | 967 | |
Total labour costs | | | (4,413 | ) | (4,309 | ) |
Cost of revenues (2) | | | (7,056 | ) | (6,705 | ) |
Other operating costs (3) | | | (2,072 | ) | (1,917 | ) |
Total operating costs | | | (13,541 | ) | (12,931 | ) |
| (1) | Other labour costs include contractor and outsourcing costs. |
| (2) | Cost of revenues includes costs of wireless devices and other equipment sold, network and content costs, and payments to other carriers. |
| (3) | Other operating costs include marketing, advertising and sales commission costs, bad debt expense, taxes other than income taxes, IT costs, professional service fees and rent. |
Research and development expenses of $119 million and $147 million are included in operating costs for 2017 and 2016, respectively.
| Note 6Severance, acquisition and other costs |
| FOR THE YEAR ENDED DECEMBER 31 | 2017 | | 2016 | |
Severance | (79 | ) | (87 | ) |
Acquisition and other | (111 | ) | (48 | ) |
Total severance, acquisition and other costs | (190 | ) | (135 | ) |
Severance costs consist of charges related to involuntary and voluntary employee terminations.
| ACQUISITION AND OTHER COSTS |
Acquisition and other costs consist of transaction costs, such as legal and financial advisory fees, related to completed or potential acquisitions, employee severance costs related to the purchase of a business, the costs to integrate acquired companies into our operations and litigation costs, when they are significant. Acquisition costs also include a loss on transfer of spectrum licences relating to the MTS acquisition in 2017 and severance and integration costs relating to the privatization of Bell Aliant Inc.
| FOR THE YEAR ENDED DECEMBER 31 | 2017 | | 2016 | |
Interest expense on long-term debt | (898 | ) | (852 | ) |
Interest expense on other debt | (101 | ) | (86 | ) |
Capitalized interest | 44 | | 50 | |
Total interest expense | (955 | ) | (888 | ) |
Interest expense on long-term debt includes interest on finance leases of $145 million and $153 million for 2017 and 2016, respectively.
Capitalized interest was calculated using an average rate of 3.81% and 3.95% for 2017 and 2016, respectively, which represents the weighted average interest rate on our outstanding long-term debt.
BCE Inc. 2017 ANNUAL REPORT 135 |
|
| | |
| Notes to consolidated financial statements | |
| Note 8Other (expense) income |
| FOR THE YEAR ENDED DECEMBER 31 | NOTE | | 2017 | | 2016 | |
Net mark-to-market gains on derivatives used as economic hedges | | | 88 | | 67 | |
Impairment of assets | 13, 14 | | (82 | ) | (9 | ) |
Losses on retirements and disposals of property, plant and equipment and intangible assets | | | (47 | ) | (28 | ) |
Equity losses from investments in associates and joint ventures | 15 | | | | | |
Loss on investment | | | (22 | ) | (57 | ) |
Operations | | | (9 | ) | (32 | ) |
Early debt redemption costs | 20 | | (20 | ) | (11 | ) |
(Losses) gains on investments | | | (5 | ) | 58 | |
Other | | | (5 | ) | 33 | |
Total other (expense) income | | | (102 | ) | 21 | |
In 2017, we recorded impairment charges of $82 million, of which $70 million was allocated to indefinite-life intangible assets, and $12 million to finite-life intangible assets. The impairment charges relate to our music TV channels and two small market radio station CGUs within our Bell Media segment. These impairments were the result of revenue and profitability declines from lower audience levels. The charges were determined by comparing the carrying value of the CGUs to their fair value less costs of disposal. We estimated the fair value of the CGUs using both discounted cash flows and market-based valuation models, which include five-year cash flow projections derived from business plans reviewed by senior management for the period of January 1, 2018 to December 31, 2022, using a discount rate of 8.5% and a perpetuity growth rate of nil, as well as market multiple data from public companies and market transactions. The carrying value of these CGUs was $67 million at December 31, 2017.
| EQUITY LOSSES FROM INVESTMENTS IN ASSOCIATES AND JOINT VENTURES |
In 2017 and 2016, we recorded a loss on investment of $20 million and $11 million, respectively, related to equity losses on our share of an obligation to repurchase at fair value the minority interest in one of BCE’s joint ventures. The obligation is marked to market each reporting period and the gain or loss on investment is recorded as equity gains or losses from investments in associates and joint ventures.
In 2016, we also recorded a loss on investment of $46 million related to BCE’s share of the loss recorded by one of our equity investments on the sale of a portion of its operations.
| (LOSSES) GAINS ON INVESTMENTS |
In 2016, BCE recorded gains on investments of $58 million which included a gain related to one of our equity investments of $34 million, as well as a gain on investment of $12 million due to the remeasurement of BCE’s previously held equity interest in Q9 to its fair value. See Note 3, Business acquisitions and dispositionsfor additional details.
| 136 BCE Inc. 2017 ANNUAL REPORT |
|
| | |
| | Notes to consolidated financial statements |
The following table shows the significant components of income taxes deducted from net earnings.
| FOR THE YEAR ENDED DECEMBER 31 | 2017 | | 2016 | |
Current taxes | | | | |
Current taxes | (758 | ) | (850 | ) |
Uncertain tax positions | (9 | ) | (14 | ) |
Change in estimate relating to prior periods | 40 | | 14 | |
Other | – | | (1 | ) |
Deferred taxes | | | | |
Deferred taxes relating to the origination and reversal of temporary differences | (41 | ) | (299 | ) |
Change in estimate relating to prior periods | 11 | | 32 | |
Recognition and utilization of loss carryforwards | (304 | ) | (1 | ) |
Effect of change in provincial corporate tax rate | (3 | ) | 4 | |
Resolution of uncertain tax positions | 25 | | 5 | |
Total income taxes | (1,039 | ) | (1,110 | ) |
The following table reconciles the amount of reported income taxes in the income statements with income taxes calculated at a statutory income tax rate of 27.1% for 2017 and 2016.
| FOR THE YEAR ENDED DECEMBER 31 | 2017 | | 2016 | |
Net earnings | 2,970 | | 3,087 | |
Add back income taxes | 1,039 | | 1,110 | |
Earnings before income taxes | 4,009 | | 4,197 | |
Applicable statutory tax rate | 27.1 | % | 27.1 | % |
Income taxes computed at applicable statutory rates | (1,086 | ) | (1,137 | ) |
Non-taxable portion of (losses) gains on investments | (1 | ) | 11 | |
Uncertain tax positions | 16 | | (9 | ) |
Effect of change in provincial corporate tax rate | (3 | ) | 4 | |
Change in estimate relating to prior periods | 51 | | 46 | |
Non-taxable portion of equity losses | (10 | ) | (23 | ) |
Other | (6 | ) | (2 | ) |
Total income taxes | (1,039 | ) | (1,110 | ) |
Average effective tax rate | 25.9 | % | 26.4 | % |
The following table shows aggregate current and deferred taxes relating to items recognized outside the income statements.
| FOR THE YEAR ENDED DECEMBER 31 | 2017 | 2016 |
| OTHER
COMPREHENSIVE
LOSS | | DEFICIT | | OTHER
COMPREHENSIVE
LOSS | | DEFICIT | |
Current taxes | 10 | | 9 | | 127 | | 11 | |
Deferred taxes | 103 | | 2 | | (32 | ) | 6 | |
Total income tax recovery | 113 | | 11 | | 95 | | 17 | |
BCE Inc. 2017 ANNUAL REPORT 137 |
|
| | |
| Notes to consolidated financial statements | |
The following table shows deferred taxes resulting from temporary differences between the carrying amounts of assets and liabilities recognized in the statements of financial position and their corresponding tax basis, as well as tax loss carryforwards.
NET DEFERRED TAX LIABILITY | NOTE | | NON-
CAPITAL
LOSS
CARRY-
FORWARDS | | POST-
EMPLOY-
MENT
BENEFIT
PLANS | | INDEFINITE-
LIFE
INTANGIBLE
ASSETS | | PROPERTY,
PLANT AND
EQUIPMENT
AND
FINITE-LIFE
INTANGIBLE
ASSETS | | INVESTMENT
TAX CREDITS | | CRTC
TANGIBLE
BENEFITS | | OTHER | | TOTAL | |
January 1, 2016 | | | 12 | | 520 | | (1,619 | ) | (968 | ) | (6 | ) | 61 | | 265 | | (1,735 | ) |
Income statement | | | (1 | ) | (28 | ) | (61 | ) | (152 | ) | (3 | ) | (17 | ) | 3 | | (259 | ) |
Business acquisitions | | | 10 | | – | | – | | (79 | ) | – | | – | | (6 | ) | (75 | ) |
Other comprehensive income | | | – | | (38 | ) | – | | – | | – | | – | | 6 | | (32 | ) |
Deficit | | | – | | – | | – | | – | | – | | – | | 6 | | 6 | |
Other | | | – | | – | | – | | – | | – | | – | | (8 | ) | (8 | ) |
December 31, 2016 | | | 21 | | 454 | | (1,680 | ) | (1,199 | ) | (9 | ) | 44 | | 266 | | (2,103 | ) |
Income statement | | | (304 | ) | (31 | ) | (8 | ) | 12 | | 7 | | (14 | ) | 26 | | (312 | ) |
Business acquisitions | 3 | | 300 | | (11 | ) | (73 | ) | (223 | ) | (5 | ) | – | | 24 | | 12 | |
Other comprehensive income | | | – | | 82 | | – | | – | | – | | – | | 21 | | 103 | |
Deficit | | | – | | – | | – | | – | | – | | – | | 2 | | 2 | |
Other | | | – | | – | | – | | (3 | ) | – | | – | | (2 | ) | (5 | ) |
December 31, 2017 | | | 17 | | 494 | | (1,761 | ) | (1,413 | ) | (7 | ) | 30 | | 337 | | (2,303 | ) |
At December 31, 2017, BCE had $208 million of non-capital loss carryforwards. We:
- recognized a deferred tax asset of $17 million for $64 million of thenon-capital loss carryforwards. These non-capital loss carryforwardsexpire in varying annual amounts from 2029 to 2037.
- did not recognize a deferred tax asset for $144 million of non-capitalloss carryforwards. This balance expires in varying annual amountsfrom 2023 to 2037.
At December 31, 2017, BCE had $827 million of unrecognized capital loss carryforwards which can be carried forward indefinitely.
At December 31, 2016, BCE had $221 million of non-capital loss carryforwards. We:
- recognized a deferred tax asset of $21 million, of which $11 millionrelated to Q9, for $77 million of the non-capital loss carryforwards.These non-capital loss carryforwards expire in varying annual amountsfrom 2029 to 2036.
- did not recognize a deferred tax asset for $144 million of non-capitalloss carryforwards. This balance expires in varying annual amountsfrom 2023 to 2035.
At December 31, 2016, BCE had $765 million of unrecognized capital loss carryforwards which can be carried forward indefinitely.
| Note 10Earnings per share |
The following table shows the components used in the calculation of basic and diluted earnings per common share for earnings attributable to common shareholders.
| FOR THE YEAR ENDED DECEMBER 31 | 2017 | | 2016 | |
Net earnings attributable to common shareholders – basic | 2,786 | | 2,894 | |
Dividends declared per common share (in dollars) | 2.87 | | 2.73 | |
Weighted average number of common shares outstanding (in millions) | | | | |
Weighted average number of common shares outstanding – basic | 894.3 | | 869.1 | |
Assumed exercise of stock options (1) | 0.6 | | 1.2 | |
Weighted average number of common shares outstanding – diluted (in millions) | 894.9 | | 870.3 | |
| (1) | The calculation of the assumed exercise of stock options includes the effect of the average unrecognized future compensation cost of dilutive options. It excludes options for which the exercise price is higher than the average market value of a BCE common share. The number of excluded options was 3,031,125 in 2017 and 2,936,091 in 2016. |
| 138 BCE Inc. 2017 ANNUAL REPORT |
|
| | |
| | Notes to consolidated financial statements |
| Note 11Trade and other receivables |
| FOR THE YEAR ENDED DECEMBER 31 | NOTE | | 2017 | | 2016 | |
Trade receivables (1) | | | 3,138 | | 2,967 | |
Allowance for doubtful accounts | 24 | | (55 | ) | (60 | ) |
Allowance for revenue adjustments | | | (80 | ) | (85 | ) |
Current tax receivable | | | 31 | | 35 | |
Other accounts receivable | | | 101 | | 122 | |
Total trade and other receivables | | | 3,135 | | 2,979 | |
��
| (1) | The details of securitized trade receivables are set out in Note 19,Debt due within one year. |
| FOR THE YEAR ENDED DECEMBER 31 | 2017 | | 2016 | |
Finished goods | 322 | | 333 | |
Work in progress | 76 | | 85 | |
Provision | (18 | ) | (15 | ) |
Total inventory | 380 | | 403 | |
The total amount of inventory subsequently recognized as an expense in cost of revenues was $2,910 million and $2,689 million for 2017 and 2016, respectively.
| Note 13Property, plant and equipment |
| FOR THE YEAR ENDED DECEMBER 31, 2017 | NETWORK
INFRASTRUCTURE
AND EQUIPMENT | | LAND AND
BUILDINGS | | ASSETS UNDER
CONSTRUCTION | | TOTAL(1) | |
COST | | | | | | | | |
January 1, 2017 | 58,680 | | 5,572 | | 1,374 | | 65,626 | |
Additions | 2,492 | | 70 | | 1,587 | | 4,149 | |
Acquisition through business combinations | 653 | | 264 | | 76 | | 993 | |
Transfers | 775 | | 77 | | (1,263 | ) | (411 | ) |
Retirements and disposals | (1,105 | ) | (22 | ) | – | | (1,127 | ) |
December 31, 2017 | 61,495 | | 5,961 | | 1,774 | | 69,230 | |
ACCUMULATED DEPRECIATION | | | | | | | | |
January 1, 2017 | 40,233 | | 3,047 | | – | | 43,280 | |
Depreciation | 2,816 | | 221 | | – | | 3,037 | |
Retirements and disposals | (1,054 | ) | (19 | ) | – | | (1,073 | ) |
Other | (39 | ) | (8 | ) | – | | (47 | ) |
December 31, 2017 | 41,956 | | 3,241 | | – | | 45,197 | |
NET CARRYING AMOUNT | | | | | | | | |
January 1, 2017 | 18,447 | | 2,525 | | 1,374 | | 22,346 | |
December 31, 2017 | 19,539 | | 2,720 | | 1,774 | | 24,033 | |
| (1) | Includes assets under finance leases. |
BCE Inc. 2017 ANNUAL REPORT 139 |
|
| | |
| Notes to consolidated financial statements | |
| FOR THE YEAR ENDED DECEMBER 31, 2016 | NOTE | | NETWORK
INFRASTRUCTURE
AND EQUIPMENT | | LAND AND
BUILDINGS | | ASSETS UNDER
CONSTRUCTION | | TOTAL(1) | |
COST | | | | | | | | | | |
January 1, 2016 | | | 57,233 | | 5,174 | | 1,287 | | 63,694 | |
Additions | | | 2,361 | | 120 | | 1,415 | | 3,896 | |
Acquisition through business combinations | | | 32 | | 282 | | 1 | | 315 | |
Transfers | | | 692 | | 35 | | (1,325 | ) | (598 | ) |
Retirements and disposals | | | (1,637 | ) | (39 | ) | (4 | ) | (1,680 | ) |
Impairment losses recognized in earnings | 8 | | (1 | ) | – | | – | | (1 | ) |
December 31, 2016 | | | 58,680 | | 5,572 | | 1,374 | | 65,626 | |
ACCUMULATED DEPRECIATION | | | | | | | | | | |
January 1, 2016 | | | 39,183 | | 2,881 | | – | | 42,064 | |
Depreciation | | | 2,672 | | 205 | | – | | 2,877 | |
Retirements and disposals | | | (1,591 | ) | (35 | ) | – | | (1,626 | ) |
Other | | | (31 | ) | (4 | ) | – | | (35 | ) |
December 31, 2016 | | | 40,233 | | 3,047 | | – | | 43,280 | |
NET CARRYING AMOUNT | | | | | | | | | | |
January 1, 2016 | | | 18,050 | | 2,293 | | 1,287 | | 21,630 | |
December 31, 2016 | | | 18,447 | | 2,525 | | 1,374 | | 22,346 | |
| (1) | Includes assets under finance leases. |
BCE’s significant finance leases are for satellites and office premises. The office leases have a typical lease term of 22 years. The leases for satellites, used to provide programming to our Bell TV customers, have a term of 15 years.
The following table shows additions to and the net carrying amount of assets under finance leases.
| | ADDITIONS | NET CARRYING AMOUNT |
| FOR THE YEAR ENDED DECEMBER 31 | 2017 | | 2016 | | 2017 | | 2016 | |
Network infrastructure and equipment | 334 | | 375 | | 1,435 | | 1,580 | |
Land and buildings | 2 | | 72 | | 467 | | 506 | |
Total | 336 | | 447 | | 1,902 | | 2,086 | |
The following table provides a reconciliation of our minimum future lease payments to the present value of our finance lease obligations.
AT DECEMBER 31, 2017 | NOTE | | 2018 | | 2019 | | 2020 | | 2021 | | 2022 | | THERE-
AFTER | | TOTAL | |
Minimum future lease payments | 24 | | 572 | | 501 | | 326 | | 278 | | 248 | | 883 | | 2,808 | |
Less: | | | | | | | | | | | | | | | | |
Future finance costs | | | (127 | ) | (111 | ) | (96 | ) | (80 | ) | (65 | ) | (157 | ) | (636 | ) |
Present value of future lease obligations | | | 445 | | 390 | | 230 | | 198 | | 183 | | 726 | | 2,172 | |
| 140 BCE Inc. 2017 ANNUAL REPORT |
|
| | |
| | Notes to consolidated financial statements |
FOR THE YEAR
ENDED DECEMBER 31, 2017 | NOTE | | FINITE-LIFE | INDEFINITE-LIFE | | |
| SOFTWARE | | CUSTOMER
RELATION-
SHIPS | | PROGRAM
AND FEATURE
FILM RIGHTS | | OTHER | | TOTAL | | BRANDS | | SPECTRUM
AND OTHER
LICENCES | | BROADCAST
LICENCES | | TOTAL | | TOTAL
INTANGIBLE
ASSETS | |
COST | | | | | | | | | | | | | | | | | | | | | | |
January 1, 2017 | | | 7,861 | | 1,159 | | 682 | | 350 | | 10,052 | | 2,333 | | 3,288 | | 2,322 | | 7,943 | | 17,995 | |
Additions | | | 344 | | 31 | | 1,009 | | 7 | | 1,391 | | – | | – | | – | | – | | 1,391 | |
Acquired through business combinations | | | 98 | | 830 | | – | | 103 | | 1,031 | | 110 | | 246 | | – | | 356 | | 1,387 | |
Transfers | | | 407 | | – | | – | | – | | 407 | | – | | – | | (1 | ) | (1 | ) | 406 | |
Retirements and disposals | | | (21 | ) | (20 | ) | – | | (55 | ) | (96 | ) | – | | – | | – | | – | | (96 | ) |
Impairment losses recognized in earnings | 8 | | – | | – | | – | | (12 | ) | (12 | ) | – | | – | | (70 | ) | (70 | ) | (82 | ) |
Amortization included in operating costs | | | – | | – | | (950 | ) | – | | (950 | ) | – | | – | | – | | – | | (950 | ) |
December 31, 2017 | | | 8,689 | | 2,000 | | 741 | | 393 | | 11,823 | | 2,443 | | 3,534 | | 2,251 | | 8,228 | | 20,051 | |
ACCUMULATED AMORTIZATION | | | | | | | | | | | | | | | | | | | | | | |
January 1, 2017 | | | 5,316 | | 513 | | – | | 168 | | 5,997 | | – | | – | | – | | – | | 5,997 | |
Amortization | | | 672 | | 102 | | – | | 39 | | 813 | | – | | – | | – | | – | | 813 | |
Retirements and disposals | | | (21 | ) | – | | – | | (52 | ) | (73 | ) | – | | – | | – | | – | | (73 | ) |
Other | | | 9 | | – | | – | | – | | 9 | | – | | – | | – | | – | | 9 | |
December 31, 2017 | | | 5,976 | | 615 | | – | | 155 | | 6,746 | | – | | – | | – | | – | | 6,746 | |
NET CARRYING AMOUNT | | | | | | | | | | | | | | | | | | | | | | |
January 1, 2017 | | | 2,545 | | 646 | | 682 | | 182 | | 4,055 | | 2,333 | | 3,288 | | 2,322 | | 7,943 | | 11,998 | |
December 31, 2017 | | | 2,713 | | 1,385 | | 741 | | 238 | | 5,077 | | 2,443 | | 3,534 | | 2,251 | | 8,228 | | 13,305 | |
FOR THE YEAR
ENDED DECEMBER 31, 2016 | NOTE | | FINITE-LIFE | INDEFINITE-LIFE | | |
| SOFTWARE | | CUSTOMER
RELATION-
SHIPS | | PROGRAM
AND FEATURE
FILM RIGHTS | | OTHER | | TOTAL | | BRANDS | | SPECTRUM
AND OTHER
LICENCES | | BROADCAST
LICENCES | | TOTAL | | TOTAL
INTANGIBLE
ASSETS | |
COST | | | | | | | | | | | | | | | | | | | | | | |
January 1, 2016 | | | 6,906 | | 866 | | 577 | | 325 | | 8,674 | | 2,333 | | 3,267 | | 2,334 | | 7,934 | | 16,608 | |
Additions | | | 412 | | – | | 973 | | 17 | | 1,402 | | – | | 21 | | – | | 21 | | 1,423 | |
Acquired through business combinations | | | – | | 293 | | – | | 8 | | 301 | | – | | – | | – | | – | | 301 | |
Transfers | | | 615 | | – | | – | | – | | 615 | | – | | – | | – | | – | | 615 | |
Retirements and disposals | | | (72 | ) | – | | – | | – | | (72 | ) | – | | – | | – | | – | | (72 | ) |
Business dispositions | | | – | | – | | – | | – | | – | | – | | – | | (4 | ) | (4 | ) | (4 | ) |
Impairment losses recognized in earnings | 8 | | – | | – | | – | | – | | – | | – | | – | | (8 | ) | (8 | ) | (8 | ) |
Amortization included in operating costs | | | – | | – | | (868 | ) | – | | (868 | ) | – | | – | | – | | – | | (868 | ) |
December 31, 2016 | | | 7,861 | | 1,159 | | 682 | | 350 | | 10,052 | | 2,333 | | 3,288 | | 2,322 | | 7,943 | | 17,995 | |
ACCUMULATED AMORTIZATION | | | | | | | | | | | | | | | | | | | | | | |
January 1, 2016 | | | 4,824 | | 466 | | – | | 142 | | 5,432 | | – | | – | | – | | – | | 5,432 | |
Amortization | | | 558 | | 47 | | – | | 26 | | 631 | | – | | – | | – | | – | | 631 | |
Retirements and disposals | | | (69 | ) | – | | – | | – | | (69 | ) | – | | – | | – | | – | | (69 | ) |
Other | | | 3 | | – | | – | | – | | 3 | | – | | – | | – | | – | | 3 | |
December 31, 2016 | | | 5,316 | | 513 | | – | | 168 | | 5,997 | | – | | – | | – | | – | | 5,997 | |
NET CARRYING AMOUNT | | | | | | | | | | | | | | | | | | | | | | |
January 1, 2016 | | | 2,082 | | 400 | | 577 | | 183 | | 3,242 | | 2,333 | | 3,267 | | 2,334 | | 7,934 | | 11,176 | |
December 31, 2016 | | | 2,545 | | 646 | | 682 | | 182 | | 4,055 | | 2,333 | | 3,288 | | 2,322 | | 7,943 | | 11,998 | |
BCE Inc. 2017 ANNUAL REPORT 141 |
|
| | |
| Notes to consolidated financial statements | |
| Note 15Investments in associates and joint ventures |
The following table provides summarized financial information in respect to BCE’s associates and joint ventures. For a list of our associates and joint ventures please see Note 29,Related party transactions.
| FOR THE YEAR ENDED DECEMBER 31 | NOTE | | 2017 | | 2016 | |
Assets | | | 3,796 | | 3,856 | |
Liabilities | | | (2,155 | ) | (2,119 | ) |
Total net assets | | | 1,641 | | 1,737 | |
BCE’s share of net assets | | | 814 | | 852 | |
Revenues | | | 1,863 | | 2,511 | |
Expenses | | | (1,924 | ) | (2,720 | ) |
Total net losses | | | (61 | ) | (209 | ) |
BCE’s share of net losses | 8 | | (31 | ) | (89 | ) |
| Note 16Other non-current assets |
| FOR THE YEAR ENDED DECEMBER 31 | NOTE | | 2017 | | 2016 | |
Net assets of post-employment benefit plans | 22 | | 262 | | 403 | |
Investments (1) | | | 106 | | 88 | |
AFS publicly-traded and privately-held investments | 24 | | 103 | | 103 | |
Long-term notes and other receivables | | | 101 | | 63 | |
Derivative assets | 24 | | 51 | | 126 | |
Other | | | 277 | | 227 | |
Total other non-current assets | | | 900 | | 1,010 | |
| (1) | These amounts have been pledged as security related to obligations for certain employee benefits and are not available for general use. |
The following table provides details about the changes in the carrying amounts of goodwill for the years ended December 31, 2017 and 2016. BCE’s groups of CGUs correspond to our reporting segments.
| | BELL
WIRELESS | | BELL
WIRELINE | | BELL
MEDIA | | BCE | |
Balance at January 1, 2016 | 2,303 | | 3,491 | | 2,583 | | 8,377 | |
Acquisitions and other | 1 | | 340 | | 240 | | 581 | |
Balance at December 31, 2016 | 2,304 | | 3,831 | | 2,823 | | 8,958 | |
Acquisitions and other | 728 | | 666 | | 76 | | 1,470 | |
Balance at December 31, 2017 | 3,032 | | 4,497 | | 2,899 | | 10,428 | |
| 142 BCE Inc. 2017 ANNUAL REPORT |
|
| | |
| | Notes to consolidated financial statements |
As described in Note 2,Significant accounting policies, goodwill is tested annually for impairment by comparing the carrying value of a CGU or group of CGUs to the recoverable amount, where the recoverable amount is the higher of fair value less costs of disposal or value in use.
VALUE IN USE
The value in use for a CGU or group of CGUs is determined by discounting five-year cash flow projections derived from business plans reviewed by senior management. The projections reflect management’s expectations of revenue, segment profit, capital expenditures, working capital and operating cash flows, based on past experience and future expectations of operating performance.
Cash flows beyond the five-year period are extrapolated using perpetuity growth rates. None of the perpetuity growth rates exceed the long-term historical growth rates for the markets in which we operate.
The discount rates are applied to the cash flow projections and are derived from the weighted average cost of capital for each CGU or group of CGUs.
The following table shows the key assumptions used to estimate the recoverable amounts of the groups of CGUs.
| GROUPS OF CGUs | ASSUMPTIONS USED |
PERPETUITY
GROWTH RATE | | DISCOUNT
RATE | |
Bell Wireless | 0.8% | | 9.1% | |
Bell Wireline | 1.0% | | 6.0% | |
Bell Media | 1.0% | | 8.5% | |
We believe that any reasonable possible change in the key assumptions on which the estimate of recoverable amounts of the Bell Wireless or Bell Wireline groups of CGUs is based would not cause their carrying amounts to exceed their recoverable amounts.
For the Bell Media group of CGUs, a decrease of (0.3%) in the perpetuity growth rate or an increase of 0.2% in the discount rate, would have resulted in its recoverable amount being equal to its carrying value.
| Note 18Trade payables and other liabilities |
| FOR THE YEAR ENDED DECEMBER 31 | NOTE | | 2017 | | 2016 | |
Trade payables and accruals | | | 2,441 | | 2,319 | |
Deferred revenues | | | 884 | | 819 | |
Compensation payable | | | 560 | | 531 | |
Taxes payable | | | 150 | | 137 | |
Maple Leaf Sports and Entertainment Ltd. (MLSE) financial liability (1) | 24 | | 135 | | 135 | |
Derivative liabilities | 24 | | 96 | | 18 | |
CRTC tangible benefits obligation | 24 | | 38 | | 51 | |
Provisions | 21 | | 55 | | 39 | |
Severance and other costs payable | | | 29 | | 30 | |
CRTC deferral account obligation | 24 | | 28 | | 32 | |
Other current liabilities | | | 207 | | 215 | |
Total trade payables and other liabilities | | | 4,623 | | 4,326 | |
| (1) | Represents BCE’s obligation to repurchase the BCE Master Trust Fund’s (Master Trust) 9% interest in MLSE at a price not less than an agreed minimum price should the Master Trust exercise its put option. The obligation to repurchase is marked to market each reporting period and the gain or loss is recorded inOther (expense) incomein the income statements. |
BCE Inc. 2017 ANNUAL REPORT 143 |
|
| | |
| Notes to consolidated financial statements | |
| Note 19Debt due within one year |
FOR THE YEAR ENDED DECEMBER 31 | NOTE | | WEIGHTED AVERAGE
INTEREST RATE | | 2017 | | 2016 | |
Notes payable (1) | 24 | | 1.16% | | 3,151 | | 2,649 | |
Loans secured by trade receivables | 24 | | 2.11% | | 921 | | 931 | |
Long-term debt due within one year (2) | | | 4.38% | | 1,106 | | 835 | |
Unsecured committed term credit facility (3) | | | | | – | | 479 | |
Net unamortized discount | | | | | – | | (1 | ) |
Unamortized debt issuance costs | | | | | – | | (6 | ) |
Total long-term debt due within one year | 20 | | | | 1,106 | | 1,307 | |
Total debt due within one year | | | | | 5,178 | | 4,887 | |
| (1) | Includes commercial paper of $2,484 million in U.S. dollars ($3,116 million in Canadian dollars) and $1,945 million in U.S. dollars ($2,612 million in Canadian dollars) as at December 31, 2017 and 2016, respectively, which were issued under our U.S. commercial paper program and have been hedged for foreign currency fluctuations through forward currency contracts. See Note 24,Financial and capital managementfor additional details. |
| (2) | Included in long-term debt due within one year is the current portion of finance leases of $445 million and $435 million as at December 31, 2017 and December 31, 2016, respectively. |
| (3) | In 2017, Bell Canada repaid $357 million in U.S. dollars ($480 million in Canadian dollars) representing all of the borrowings outstanding under its unsecured committed term credit facility. Accordingly, this credit facility was closed and the cross currency basis swap which was used to hedge the U.S. currency exposure under such credit facility was settled. See Note 24, Financial and capital managementfor additional details. |
| SECURITIZED TRADE RECEIVABLES |
Our securitized trade receivables programs are recorded as floating rate revolving loans secured by certain trade receivables and expire on July 1, 2018 and November 1, 2020.
The following table provides further details on our securitized trade receivables programs.
| FOR THE YEAR ENDED DECEMBER 31 | 2017 | | 2016 | |
Average interest rate throughout the year | 1.74 | % | 1.51 | % |
Securitized trade receivables | 1,867 | | 1,904 | |
We continue to service these trade receivables. The buyers’ interest in the collection of these trade receivables ranks ahead of our interests, which means that we are exposed to certain risks of default on the amounts securitized.
We have provided various credit enhancements in the form of overcollateralization and subordination of our retained interests.
The buyers will reinvest the amounts collected by buying additional interests in our trade receivables until the securitized trade receivables agreements expire or are terminated. The buyers and their investors have no further claim on our other assets if customers do not pay the amounts owed.
Bell Canada may issue notes under its Canadian and U.S. commercial paper programs up to the maximum aggregate principal amount of $2.5 billion in either Canadian or U.S. currency provided that at no time shall such maximum amount of notes exceed $3.5 billion in Canadian currency which equals the aggregate amount available under Bell Canada’s supporting revolving and expansion credit facilities as at December 31, 2017. The total amount of the committed revolving and expansion credit facilities may be drawn at any time.
The table below is a summary of our total bank credit facilities at December 31, 2017.
| | TOTAL
AVAILABLE | | DRAWN | | LETTERS
OF CREDIT | | COMMERCIAL
PAPER
OUTSTANDING | | NET AVAILABLE | |
Committed credit facilities | | | | | | | | | | |
Unsecured revolving credit and expansion facilities (1)(2) | 3,500 | | – | | – | | 3,116 | | 384 | |
Other | 134 | | – | | 106 | | – | | 28 | |
Total committed credit facilities | 3,634 | | – | | 106 | | 3,116 | | 412 | |
Total non-committed credit facilities | 1,829 | | – | | 1,148 | | – | | 681 | |
Total committed and non-committed credit facilities | 5,463 | | – | | 1,254 | | 3,116 | | 1,093 | |
| (1) | Bell Canada’s $2.5 billion revolving credit facility expires in November 2022 and its $1 billion expansion credit facility expires in November 2020. |
| (2) | As of December 31, 2017, Bell Canada’s outstanding commercial paper included $2,484 million in U.S. dollars ($3,116 million in Canadian dollars). All of Bell Canada’s commercial paper outstanding is included in debt due within one year. |
| 144 BCE Inc. 2017 ANNUAL REPORT |
|
| | |
| | Notes to consolidated financial statements |
Some of our credit agreements:
- require us to meet specific financial ratios
- require us to offer to repay and cancel the credit agreement upon a change of control of BCE or Bell Canada
We are in compliance with all conditions and restrictions under such credit agreements.
| FOR THE YEAR ENDED DECEMBER 31 | NOTE | | WEIGHTED AVERAGE
INTEREST RATE | | MATURITY | | 2017 | | 2016 | |
Debt securities | | | | | | | | | | |
1997 trust indenture | | | 3.86% | | 2018–2047 | | 14,950 | | 13,600 | |
1976 trust indenture | | | 9.54% | | 2021–2054 | | 1,100 | | 1,100 | |
2011 trust indenture (1) | | | 4.28% | | 2018–2024 | | 425 | | – | |
2001 trust indenture (1) | | | 5.63% | | 2019 | | 200 | | – | |
Subordinated debentures | | | 8.21% | | 2026–2031 | | 275 | | 275 | |
Finance leases | 13 | | 6.64% | | 2018–2047 | | 2,172 | | 2,260 | |
Unsecured committed term credit facility (2) | 19 | | | | | | – | | 479 | |
Other | | | | | | | 195 | | 188 | |
Total debt | | | | | | | 19,317 | | 17,902 | |
Net unamortized premium | | | | | | | 50 | | 18 | |
Unamortized debt issuance costs | | | | | | | (46 | ) | (41 | ) |
Less: | | | | | | | | | | |
Amount due within one year | 19 | | | | | | (1,106 | ) | (1,307 | ) |
Total long-term debt | | | | | | | 18,215 | | 16,572 | |
| (1) | As part of the acquisition of MTS, on March 17, 2017, Bell Canada assumed all of MTS’ debt issued under its 2001 and 2011 trust indentures. |
| (2) | In 2017, Bell Canada repaid $357 million in U.S. dollars ($480 million in Canadian dollars) representing all of the borrowings outstanding under its unsecured committed term credit facility. Accordingly, this credit facility was closed and the cross currency basis swap which was used to hedge the U.S. currency exposure under such credit facility was settled. See Note 24, Financial and capital managementfor additional details. |
Bell Canada’s debt securities have been issued in Canadian dollars and bear a fixed interest rate.
Some of our debt agreements:
- impose covenants and new issue tests
- require us to make an offer to repurchase certain series of debt securities upon the occurrence of a change of control event as defined in therelevant debt agreements
We are in compliance with all conditions and restrictions under such debt agreements.
| All outstanding debt securities are issued under trust indentures and are unsecured. All debt securities are issued in series and certain series are redeemable at Bell Canada’s option prior to maturity at the prices, times and conditions specified for each series. |
BCE Inc. 2017 ANNUAL REPORT 145 |
|
| | |
| Notes to consolidated financial statements | |
2017
On October 30, 2017, Bell Canada redeemed, prior to maturity, its 4.40% Series M-22 medium-term note (MTN) debentures, having an outstanding principal amount of $1 billion, which were due on March 16, 2018. We incurred an $11 million charge for early debt redemption costs which was recorded inOther (expense) incomein the income statement.
On October 9, 2017, Bell Canada redeemed, prior to maturity, its 4.88% Series M-36 debentures, having an outstanding principal amount of $300 million, which were due on April 26, 2018. We incurred a $5 million charge for early debt redemption costs which was recorded inOther (expense) incomein the income statement.
On September 29, 2017, Bell Canada issued 3.00% Series M-40 MTN debentures (Series M-40 debentures) under its 1997 trust indenture, with a principal amount of $700 million, which mature on October 3, 2022. The Series M-40 debentures were issued as part of an existing series of MTN debentures. In addition, on the same date, Bell Canada issued 3.60% Series M-46 MTN debentures under its 1997 trust indenture, with a principal amount of $800 million, which mature on September 29, 2027.
On May 12, 2017, Bell Canada redeemed, prior to maturity, its 4.37% Series M-35 debentures, having an outstanding principal amount of $350 million which were due on September 13, 2017. We incurred a $4 million charge for early debt redemption costs which was recorded inOther (expense) incomein the income statement.
On February 27, 2017, Bell Canada issued 2.70% Series M-44 MTN debentures under its 1997 trust indenture, with a principal amount of $1 billion, which mature on February 27, 2024. In addition, on the same date, Bell Canada issued 4.45% Series M-45 MTN debentures under its 1997 trust indenture, with a principal amount of $500 million, which mature on February 27, 2047.
Subsequent to year end, on March 7, 2018, we announced the issuance of 3.35% Series M-47 MTN debentures under Bell Canada’s 1997 trust indenture, with a principal amount of $500 million, which mature on March 12, 2025. The net proceeds of the offering are intended to be used to redeem, prior to maturity, Bell Canada’s 5.52% Series M-33 debentures having an outstanding principal amount of $300 million, which are due on February 26, 2019, and for the repayment of other short-term debt.
2016
On September 16, 2016, Bell Canada redeemed, prior to maturity, its 5.00% Series M-18 MTN debentures, having an outstanding principal amount of $700 million which were due on February 15, 2017. The interest rate swap which was used to hedge the interest rate exposure was also settled in 2016. See Note 24,Financial and capital managementfor additional details.
On August 12, 2016, Bell Canada issued 2.00% Series M-42 MTN debentures under its 1997 trust indenture, with a principal amount of $850 million, which mature on October 1, 2021. In addition, on the same date, Bell Canada issued 2.90% Series M-43 MTN debentures under its 1997 trust indenture, with a principal amount of $650 million, which mature on August 12, 2026.
On March 31, 2016, Bell Canada redeemed, prior to maturity, its 5.41% Series M-32 debentures, having an outstanding principal amount of $500 million which were due on September 26, 2016. We incurred an $11 million charge for the early debt redemption costs which was recorded inOther (expense) incomein the income statement.
On February 29, 2016, Bell Canada issued 3.55% Series M-41 MTN debentures under its 1997 trust indenture, with a principal amount of $750 million, which mature on March 2, 2026.
On January 11, 2016, Bell Canada redeemed, prior to maturity, its 4.64% Series M-19 MTN debentures, having an outstanding principal amount of $200 million which were due on February 22, 2016, as well as its 3.65% Series M-23 MTN debentures, having an outstanding principal amount of $500 million which were due on May 19, 2016.
| FOR THE YEAR ENDED DECEMBER 31 | NOTE | | ASSET RETIREMENT
OBLIGATIONS (AROs) | | OTHER(1) | | TOTAL | |
January 1, 2017 | | | 175 | | 137 | | 312 | |
Additions | | | 14 | | 46 | | 60 | |
Usage | | | (2 | ) | (30 | ) | (32 | ) |
Reversals | | | (18 | ) | (12 | ) | (30 | ) |
Acquired through business combinations | | | 1 | | 17 | | 18 | |
December 31, 2017 | | | 170 | | 158 | | 328 | |
Current | 18 | | 11 | | 44 | | 55 | |
Non-current | 23 | | 159 | | 114 | | 273 | |
December 31, 2017 | | | 170 | | 158 | | 328 | |
| (1) | Other includes environmental, legal, regulatory and vacant space provisions. |
AROs reflect management’s best estimates of expected future costs to restore current leased premises to their original condition prior to lease inception. Cash outflows associated with our ARO liabilities are generally expected to occur at the restoration dates of the assets to which they relate, which are long-term in nature. The timing and extent of restoration work that will be ultimately required for these sites is uncertain.
| 146 BCE Inc. 2017 ANNUAL REPORT |
|
| | |
| | Notes to consolidated financial statements |
| Note 22Post-employment benefit plans |
POST-EMPLOYMENT BENEFIT PLANS COST
We provide pension and other benefits for most of our employees. These include DB pension plans, DC pension plans and OPEBs.
We operate our DB and DC pension plans under applicable Canadian and provincial pension legislation, which prescribes minimum and maximum DB funding requirements. Plan assets are held in trust, and the oversight of governance of the plans, including investment decisions, contributions to DB plans and the selection of the DC plans investment options offered to plan participants, lies with the Pension Fund Committee, a committee of our board of directors.
The interest rate risk is managed using a liability matching approach, which reduces the exposure of the DB plans to a mismatch between investment growth and obligation growth.
The longevity risk is managed using a longevity swap, which reduces the exposure of the DB plans to an increase in life expectancy.
COMPONENTS OF POST-EMPLOYMENT BENEFIT PLANS SERVICE COST
FOR THE YEAR ENDED DECEMBER 31 | 2017 | | 2016 | |
DB pension | (208 | ) | (203 | ) |
DC pension | (102 | ) | (100 | ) |
OPEBs | (6 | ) | (7 | ) |
Plan amendment gain on OPEBs and DB pension | 16 | | 27 | |
Less: | | | | |
Capitalized benefit plans cost | 58 | | 59 | |
Total post-employment benefit plans service cost included in operating costs | (242 | ) | (224 | ) |
Other costs recognized in severance, acquisition and other costs | (10 | ) | 5 | |
Total post-employment benefit plans service cost | (252 | ) | (219 | ) |
COMPONENTS OF POST-EMPLOYMENT BENEFIT PLANS FINANCING COST
FOR THE YEAR ENDED DECEMBER 31 | 2017 | | 2016 | |
DB pension | (18 | ) | (24 | ) |
OPEBs | (54 | ) | (57 | ) |
Total interest on post-employment benefit obligations | (72 | ) | (81 | ) |
The statements of comprehensive income include the following amounts before income taxes.
| 2017 | | 2016 | |
Cumulative losses recognized directly in equity, January 1 | (2,646 | ) | (2,384 | ) |
Actuarial losses in other comprehensive income (1) | (313 | ) | (264 | ) |
(Increase) decrease in the effect of the asset limit (2) | (25 | ) | 2 | |
Cumulative losses recognized directly in equity, December 31 | (2,984 | ) | (2,646 | ) |
| (1) | The cumulative actuarial losses recognized in the statements of comprehensive income are $3,217 million in 2017. |
| (2) | The cumulative decrease in the effect of the asset limit recognized in the statements of comprehensive income is $233 million in 2017. |
BCE Inc. 2017 ANNUAL REPORT 147 |
|
| | |
| Notes to consolidated financial statements | |
COMPONENTS OF POST-EMPLOYMENT BENEFIT (OBLIGATIONS) ASSETS
The following table shows the change in post-employment benefit obligations and the fair value of plan assets.
| DB PENSION PLANS | OPEB PLANS | TOTAL |
| 2017 | | 2016 | | 2017 | | 2016 | | 2017 | | 2016 | |
Post-employment benefit obligations, January 1 | (20,853 | ) | (20,675 | ) | (1,684 | ) | (1,705 | ) | (22,537 | ) | (22,380 | ) |
Current service cost | (208 | ) | (203 | ) | (6 | ) | (7 | ) | (214 | ) | (210 | ) |
Interest on obligations | (896 | ) | (852 | ) | (65 | ) | (68 | ) | (961 | ) | (920 | ) |
Actuarial (losses) gains (1) | (1,193 | ) | (311 | ) | (28 | ) | 12 | | (1,221 | ) | (299 | ) |
Net curtailment (losses) gains | (4 | ) | 27 | | 16 | | 5 | | 12 | | 32 | |
Loss on plan transfer | (6 | ) | – | | – | | – | | (6 | ) | – | |
Benefit payments | 1,320 | | 1,169 | | 81 | | 79 | | 1,401 | | 1,248 | |
Employee contributions | (10 | ) | (5 | ) | – | | – | | (10 | ) | (5 | ) |
Acquisition of MTS | (2,677 | ) | – | | (5 | ) | – | | (2,682 | ) | – | |
Plan transfer | 122 | | – | | – | | – | | 122 | | – | |
Other | 1 | | (3 | ) | 38 | | – | | 39 | | (3 | ) |
Post-employment benefit obligations, December 31 | (24,404 | ) | (20,853 | ) | (1,653 | ) | (1,684 | ) | (26,057 | ) | (22,537 | ) |
Fair value of plan assets, January 1 | 20,563 | | 20,244 | | 280 | | 266 | | 20,843 | | 20,510 | |
Expected return on plan assets (2) | 878 | | 828 | | 11 | | 11 | | 889 | | 839 | |
Actuarial gains (1) | 896 | | 29 | | 12 | | 6 | | 908 | | 35 | |
Benefit payments | (1,320 | ) | (1,169 | ) | (81 | ) | (79 | ) | (1,401 | ) | (1,248 | ) |
Employer contributions | 305 | | 626 | | 77 | | 76 | | 382 | | 702 | |
Employee contributions | 10 | | 5 | | – | | – | | 10 | | 5 | |
Acquisition of MTS | 2,735 | | – | | – | | – | | 2,735 | | – | |
Plan transfer | (122 | ) | – | | – | | – | | (122 | ) | – | |
Fair value of plan assets, December 31 | 23,945 | | 20,563 | | 299 | | 280 | | 24,244 | | 20,843 | |
Plan deficit | (459 | ) | (290 | ) | (1,354 | ) | (1,404 | ) | (1,813 | ) | (1,694 | ) |
Effect of asset limit | (33 | ) | (8 | ) | – | | – | | (33 | ) | (8 | ) |
Post-employment benefit liability, December 31 | (492 | ) | (298 | ) | (1,354 | ) | (1,404 | ) | (1,846 | ) | (1,702 | ) |
Post-employment benefit assets included in other non-current assets | 262 | | 403 | | – | | – | | 262 | | 403 | |
Post-employment benefit obligations | (754 | ) | (701 | ) | (1,354 | ) | (1,404 | ) | (2,108 | ) | (2,105 | ) |
| (1) | Actuarial (losses) gains include experience gains of $911 million in 2017 and $157 million in 2016. |
| (2) | The actual return on plan assets was $1,797 million or 8.2% in 2017 and $874 million or 4.7% in 2016. |
On January 15, 2016, MTS completed the sale of its wholly-owned subsidiaries Allstream Inc., Allstream Fibre U.S., and Delphi Solutions Corp. (collectively, Allstream), to Zayo Group Holdings Inc. As part of the sale agreement, MTS retained Allstream’s two existing DB pension plans including the benefit obligations for retirees and other former employees. On October 31, 2017, we completed the transfer of assets and liabilities related to pre-closing service obligations for Allstream’s active employees from the existing Allstream DB pension plans to two new Zayo Canada Inc. pension plans.
FUNDED STATUS OF POST-EMPLOYMENT BENEFIT PLANS COST
The following table shows the funded status of our post-employment benefit obligations.
| FOR THE YEAR ENDED DECEMBER 31 | FUNDED | PARTIALLY FUNDED(1) | UNFUNDED(2) | TOTAL |
| 2017 | | 2016 | | 2017 | | 2016 | | 2017 | | 2016 | | 2017 | | 2016 | |
Present value of post-employment benefit obligations | (23,746 | ) | (20,249 | ) | (1,976 | ) | (1,995 | ) | (335 | ) | (293 | ) | (26,057 | ) | (22,537 | ) |
Fair value of plan assets | 23,894 | | 20,520 | | 350 | | 323 | | – | | – | | 24,244 | | 20,843 | |
Plan surplus (deficit) | 148 | | 271 | | (1,626 | ) | (1,672 | ) | (335 | ) | (293 | ) | (1,813 | ) | (1,694 | ) |
| (1) | The partially funded plans consist of supplementary executive retirement plans (SERPs) for eligible employees and OPEBs. The company partially funds the SERPs through letters of credit and a retirement compensation arrangement account with Canada Revenue Agency. Certain paid-up life insurance benefits are funded through life insurance contracts. |
| (2) | Our unfunded plans consist of OPEBs, which are pay-as-you-go. |
| 148 BCE Inc. 2017 ANNUAL REPORT |
|
| | |
| | Notes to consolidated financial statements |
SIGNIFICANT ASSUMPTIONS
We used the following key assumptions to measure the post-employment benefit obligations and the net benefit plans cost for the DB pension plans and OPEB plans. These assumptions are long-term, which is consistent with the nature of post-employment benefit plans.
| | DB PENSION PLANS AND OPEB PLANS | |
| 2017 | | 2016 | |
At December 31 | | | | |
Post-employment benefit obligations | | | | |
Discount rate | 3.6 | % | 4.0 | % |
Rate of compensation increase | 2.25 | % | 2.25 | % |
Cost of living indexation rate (1) | 1.6 | % | 1.6 | % |
Life expectancy at age 65 (years) | 23.2 | | 23.1 | |
For the year ended December 31 | | | | |
Net post-employment benefit plans cost | | | | |
Discount rate | 4.2 | % | 4.3 | % |
Rate of compensation increase | 2.25 | % | 2.5 | % |
Cost of living indexation rate (1) | 1.6 | % | 1.6 | % |
Life expectancy at age 65 (years) | 23.1 | | 23.0 | |
| (1) | Cost of living indexation rate is only applicable to DB pension plans. |
The weighted average duration of the post-employment benefit obligation is 15 years.
We assumed the following trend rates in healthcare costs:
- an annual increase in the cost of medication of 8.0% for 2017 decreasingto 4.5% over 20 years
- an annual increase in the cost of covered dental benefits of 4.0%
- an annual increase in the cost of covered hospital benefits of 3.3%
- an annual increase in the cost of other covered healthcare benefitsof 3.0%
Assumed trend rates in healthcare costs have a significant effect on the amounts reported for the healthcare plans.
The following table shows the effect of a 1% change in the assumed trend rates in healthcare costs.
| EFFECT ON POST-EMPLOYMENT BENEFITS – INCREASE/(DECREASE) | 1% INCREASE | | 1% DECREASE | |
Total service and interest cost | 7 | | (5 | ) |
Post-employment benefit obligations | 133 | | (115 | ) |
SENSITIVITY ANALYSIS
The following table shows a sensitivity analysis of key assumptions used to measure the net post-employment benefit obligations and the net post-employment benefit plans cost for our DB pension plans and OPEB plans.
| | | | IMPACT ON NET POST-EMPLOYMENT
BENEFIT PLANS COST FOR 2017 –
INCREASE/(DECREASE) | IMPACT ON POST-EMPLOYMENT BENEFIT
OBLIGATIONS AT DECEMBER 31, 2017 –
INCREASE/(DECREASE) |
CHANGE IN
ASSUMPTION | | INCREASE IN
ASSUMPTION | | DECREASE IN
ASSUMPTION | | INCREASE IN
ASSUMPTION | | DECREASE IN
ASSUMPTION | |
| Discount rate | 0.5 | % | (70 | ) | 62 | | (1,636 | ) | 1,746 | |
| Life expectancy at age 65 | 1 year | | 33 | | (31 | ) | 834 | | (808 | ) |
POST-EMPLOYMENT BENEFIT PLAN ASSETS
The investment strategy for the post-employment benefit plan assets is to maintain a diversified portfolio of assets invested in a prudent manner to maintain the security of funds.
The following table shows the target allocations for 2017 and the allocation of our post-employment benefit plan assets at December 31, 2017 and 2016.
| ASSET CATEGORY | WEIGHTED AVERAGE
TARGET ALLOCATION | | TOTAL PLAN ASSETS FAIR VALUE
AT DECEMBER 31 (%) |
| 2017 | | 2017 | | 2016 | |
Equity securities | 20%–35% | | 22% | | 22% | |
Debt securities | 55%–80% | | 65% | | 68% | |
Alternative investments | 0%–25% | | 13% | | 10% | |
Total | | | 100% | | 100% | |
BCE Inc. 2017 ANNUAL REPORT 149 |
|
| | |
| Notes to consolidated financial statements | |
The following table shows the fair value of the DB pension plan assets at the end of the year for each category.
| FOR THE YEAR ENDED DECEMBER 31 | 2017 | | 2016 | |
Observable markets data | | | | |
Equity securities | | | | |
Canadian | 1,045 | | 901 | |
Foreign | 4,349 | | 3,682 | |
Debt securities | | | | |
Canadian | 13,126 | | 12,469 | |
Foreign | 1,890 | | 1,068 | |
Money market | 491 | | 387 | |
Non-observable markets inputs | | | | |
Alternative investments | | | | |
Private equities | 1,484 | | 1,164 | |
Hedge funds | 965 | | 726 | |
Real estate | 484 | | 55 | |
Other | 111 | | 111 | |
Total | 23,945 | | 20,563 | |
Equity securities included approximately $13 million of BCE common shares, or 0.05% of total plan assets, at December 31, 2017 and approximately $17 million of BCE common shares, or 0.08% of total plan assets, at December 31, 2016.
Debt securities included approximately $11 million of Bell Canada debentures, or 0.05% of total plan assets, at December 31, 2017 and approximately $15 million of Bell Canada debentures, or 0.07% of total plan assets, at December 31, 2016.
Alternative investments included the pension plan’s investment in MLSE of $135 million, or 0.56% of total plan assets, at December 31, 2017 and $135 million, or 0.66% of total plan assets at December 31, 2016.
The Bell Canada pension plan has an investment arrangement which hedges part of its exposure to potential increases in longevity, which covers approximately $5 billion of post-employment benefit obligations.
The fair value of the arrangement is included within other alternative investments. As a hedging arrangement of the pension plan, the transaction requires no cash contributions from BCE.
CASH FLOWS
We are responsible for adequately funding our DB pension plans. We make contributions to them based on various actuarial cost methods that are permitted by pension regulatory bodies. Contributions reflect actuarial assumptions about future investment returns, salary projections and future service benefits. Changes in these factors could cause actual future contributions to differ from our current estimates and could require us to increase contributions to our post-employment benefit plans in the future, which could have a negative effect on our liquidity and financial performance.
We contribute to the DC pension plans as employees provide service.
The following table shows the amounts we contributed to the DB and DC pension plans and the payments made to beneficiaries under OPEB plans.
| FOR THE YEAR ENDED DECEMBER 31 | DB PLANS(1) | DC PLANS | OPEB PLANS |
| 2017 | | 2016 | | 2017 | | 2016 | | 2017 | | 2016 | |
Contributions | (305 | ) | (626 | ) | (108 | ) | (99 | ) | (77 | ) | (76 | ) |
| (1) | Includes voluntary contributions of $100 million in 2017 and $400 million in 2016. |
We expect to contribute approximately $210 million to our DB pension plans in 2018, subject to actuarial valuations being completed. We expect to pay approximately $80 million to beneficiaries under OPEB plans and to contribute approximately $110 million to the DC pension plans in 2018.
| 150 BCE Inc. 2017 ANNUAL REPORT |
|
| | |
| | Notes to consolidated financial statements |
| Note 23Other non-current liabilities |
FOR THE YEAR ENDED DECEMBER 31 | NOTE | | 2017 | | 2016 | |
Long-term disability benefits obligation | | | 322 | | 302 | |
Provisions | 21 | | 273 | | 273 | |
Deferred revenue on long-term contracts | | | 174 | | 105 | |
CRTC deferral account obligation | 24 | | 96 | | 104 | |
Future tax liabilities | | | 81 | | 73 | |
CRTC tangible benefits obligation | 24 | | 73 | | 115 | |
Other | | | 204 | | 305 | |
Total other non-current liabilities | | | 1,223 | | 1,277 | |
| Note 24Financial and capital management |
FINANCIAL MANAGEMENT
Management’s objectives are to protect BCE and its subsidiaries on a consolidated basis against material economic exposures and variability of results from various financial risks that include credit risk, liquidity risk, foreign currency risk, interest rate risk and equity price risk.
DERIVATIVES
We use derivative instruments to manage our exposure to foreign currency risk, interest rate risk and changes in the price of BCE common shares under our share-based payment plans.
The following derivative instruments were outstanding during 2017 and/or 2016:
- foreign currency forward contracts and options that manage theforeign currency risk of certain anticipated purchases and sales
- cross currency basis swaps that hedge foreign currency risk on aportion of our debt due within one year
- interest rate swaps that hedge interest rate risk on a portion of ourlong-term debt
- interest rate locks on future debt issuances and dividend rate resetson preferred shares
- forward contracts on BCE common shares that mitigate the cash flowexposure related to share-based payment plans
FAIR VALUE
Fair value is the price that would be received to sell an asset or paid to transfer a liability in an orderly transaction between market participants at the measurement date.
Certain fair value estimates are affected by assumptions we make about the amount and timing of future cash flows and discount rates, all of which reflect varying degrees of risk. Income taxes and other expenses that would be incurred on disposition of financial instruments are not reflected in the fair values. As a result, the fair values are not the net amounts that would be realized if these instruments were settled.
The carrying values of our cash and cash equivalents, trade and other receivables, dividends payable, trade payables and accruals, compensation payable, severance and other costs payable, interest payable, notes payable and loans secured by trade receivables approximate fair value as they are short-term.
The following table provides the fair value details of financial instruments measured at amortized cost in the statements of financial position.
| | CLASSIFICATION | FAIR VALUE METHODOLOGY | NOTE | | DECEMBER 31, 2017 | DECEMBER 31, 2016 |
CARRYING
VALUE | | FAIR
VALUE | | CARRYING
VALUE | | FAIR
VALUE | |
CRTC tangible benefits obligation | Trade payables and other liabilities and non-current liabilities | Present value of estimated future cash flows discounted using observable market interest rates | 18, 23 | | 111 | | 110 | | 166 | | 169 | |
CRTC deferral account obligation | Trade payables and other liabilities and non-current liabilities | Present value of estimated future cash flows discounted using observable market interest rates | 18, 23 | | 124 | | 128 | | 136 | | 145 | |
Debt securities, finance leases and other debt | Debt due within one year and long-term debt | Quoted market price of debt or present value of future cash flows discounted using observable market interest rates | 19, 20 | | 19,321 | | 21,298 | | 17,879 | | 20,093 | |
BCE Inc. 2017 ANNUAL REPORT 151 |
|
| | |
| Notes to consolidated financial statements | |
The following table provides the fair value details of financial instruments measured at fair value in the statements of financial position.
| | CLASSIFICATION | NOTE | | CARRYING VALUE OF
ASSET (LIABILITY) AT
DECEMBER 31 | | FAIR VALUE AT DECEMBER 31 |
QUOTED PRICES IN
ACTIVE MARKETS FOR
IDENTICAL ASSETS
(LEVEL 1) | | OBSERVABLE MARKET
DATA (LEVEL 2)(1) | | NON-OBSERVABLE
MARKET INPUTS
(LEVEL 3)(2) | |
2017 | | | | | | | | | | | |
AFS publicly-traded and privately-held investments | Other non-current assets | 16 | | 103 | | 1 | | – | | 102 | |
Derivative financial instruments | Other current assets, trade payables and other liabilities, other non-current assets and liabilities | | | (48 | ) | – | | (48 | ) | – | |
MLSE financial liability (3) | Trade payables and other liabilities | 18 | | (135 | ) | – | | – | | (135 | ) |
Other | Other non-current assets and liabilities | | | 60 | | – | | 106 | | (46 | ) |
2016 | | | | | | | | | | | |
AFS publicly-traded and privately-held investments | Other non-current assets | 16 | | 103 | | 1 | | – | | 102 | |
Derivative financial instruments | Other current assets, trade payables and other liabilities, other non-current assets and liabilities | | | 166 | | – | | 166 | | – | |
MLSE financial liability (3) | Trade payables and other liabilities | 18 | | (135 | ) | – | | – | | (135 | ) |
Other | Other non-current assets and liabilities | | | 35 | | – | | 88 | | (53 | ) |
| (1) | Observable market data such as equity prices, interest rates, swap rate curves and foreign currency exchange rates. |
| (2) | Non-observable market inputs such as discounted cash flows and earnings multiples. A reasonable change in our assumptions would not result in a significant increase (decrease) to our level 3 financial instruments. |
| (3) | Represents BCE’s obligation to repurchase the Master Trust’s 9% interest in MLSE at a price not less than an agreed minimum price should the Master Trust exercise its put option. The obligation to repurchase is marked to market each reporting period and the gain or loss is recorded inOther (expense) incomein the income statements. The option is exercisable in 2017 and thereafter. |
CREDIT RISK
We are exposed to credit risk from operating activities and certain financing activities, the maximum exposure of which is represented by the carrying amounts reported in the statements of financial position.
We are exposed to credit risk if counterparties to our trade receivables and derivative instruments are unable to meet their obligations. The concentration of credit risk from our customers is minimized because we have a large and diverse customer base. There was minimal credit risk relating to derivative instruments at December 31, 2017 and 2016. We deal with institutions that have investment-grade credit ratings, and as such we expect that they will be able to meet their obligations. We regularly monitor our credit risk and credit exposure.
The following table provides the change in allowance for doubtful accounts for trade receivables.
| NOTE | | 2017 | | 2016 | |
Balance, January 1 | | | (60 | ) | (64 | ) |
Additions | | | (99 | ) | (102 | ) |
Usage | | | 104 | | 106 | |
Balance, December 31 | 11 | | (55 | ) | (60 | ) |
In many instances, trade receivables are written off directly to bad debt expense if the account has not been collected after a predetermined period of time.
The following table provides further details on trade receivables not impaired.
| AT DECEMBER 31 | 2017 | | 2016 | |
Trade receivables not past due | 2,257 | | 2,187 | |
Trade receivables past due and not impaired | | | | |
Under 60 days | 491 | | 286 | |
60 to 120 days | 279 | | 359 | |
Over 120 days | 56 | | 75 | |
Trade receivables, net of allowance for doubtful accounts | 3,083 | | 2,907 | |
| 152 BCE Inc. 2017 ANNUAL REPORT |
|
| | |
| | Notes to consolidated financial statements |
LIQUIDITY RISK
Our cash and cash equivalents, cash flows from operations and possible capital markets financing are expected to be sufficient to fund our operations and fulfill our obligations as they become due. Should our cash requirements exceed the above sources of cash, we would expect to cover such a shortfall by drawing on existing committed bank facilities and new ones, to the extent available.
The following table is a maturity analysis for recognized financial liabilities at December 31, 2017 for each of the next five years and thereafter.
AT DECEMBER 31, 2017 | NOTE | | 2018 | | 2019 | | 2020 | | 2021 | | 2022 | | THERE-
AFTER | | TOTAL | |
Long-term debt | 20 | | 661 | | 1,541 | | 1,424 | | 2,247 | | 1,714 | | 9,558 | | 17,145 | |
Notes payable | 19 | | 3,151 | | – | | – | | – | | – | | – | | 3,151 | |
Minimum future lease payments under finance leases | 13 | | 572 | | 501 | | 326 | | 278 | | 248 | | 883 | | 2,808 | |
Loan secured by trade receivables | 19 | | 921 | | – | | – | | – | | – | | – | | 921 | |
Interest payable on long-term debt, notes payable and loan secured by trade receivables | | | 792 | | 688 | | 628 | | 586 | | 525 | | 5,197 | | 8,416 | |
MLSE financial liability | 18 | | 135 | | – | | – | | – | | – | | – | | 135 | |
Total | | | 6,232 | | 2,730 | | 2,378 | | 3,111 | | 2,487 | | 15,638 | | 32,576 | |
We are also exposed to liquidity risk for financial liabilities due within one year as shown in the statements of financial position.
MARKET RISK
CURRENCY EXPOSURES
We use forward contracts, options and cross currency basis swaps to manage foreign currency risk related to anticipated purchases and sales and certain foreign currency debt. In 2017, we settled a cross currency basis swap with a notional amount of $357 million in U.S. dollars ($480 million in Canadian dollars) used to hedge borrowings under a credit facility. Refer to Note 19,Debt due within one yearfor additional details.
A 10% depreciation (appreciation) in the value of the Canadian dollar relative to the U.S. dollar would result in a gain (loss) of $2 million recognized in net earnings at December 31, 2017 and a gain (loss) of $133 million recognized inOther comprehensive lossat December 31, 2017, with all other variables held constant.
The following table provides further details on our outstanding foreign currency forward contracts and cross currency basis swaps as at December 31, 2017.
| TYPE OF HEDGE | BUY
CURRENCY | | AMOUNT
TO RECEIVE | | SELL
CURRENCY | | AMOUNT
TO PAY | | MATURITY | | HEDGED ITEM | |
| Cash flow | USD | | 2,492 | | CAD | | 3,180 | | 2018 | | Commercial paper | |
| Cash flow | USD | | 872 | | CAD | | 1,134 | | 2018 | | Anticipated transactions | |
| Cash flow | CAD | | 97 | | USD | | 75 | | 2018–2019 | | Anticipated transactions | |
| Cash flow | USD | | 576 | | CAD | | 721 | | 2019 | | Anticipated transactions | |
| Cash flow | USD | | 76 | | CAD | | 96 | | 2020–2021 | | Anticipated transactions | |
| Economic | USD | | 36 | | CAD | | 46 | | 2018 | | Anticipated transactions | |
BCE Inc. 2017 ANNUAL REPORT 153 |
|
| | |
| Notes to consolidated financial statements | |
INTEREST RATE EXPOSURES
We use interest rate swaps to manage the mix of fixed and floating interest rates on our debt. We also use interest rate locks to hedge the interest rates on future debt issuances and to economically hedge dividend rate resets on preferred shares.
In 2016, we settled interest rate locks which hedged long-term debt and dividend rate resets on preferred shares with a notional amount of $500 million and $350 million, respectively.
In 2016, we redeemed long-term debt prior to maturity, and settled an interest rate swap with a notional amount of $700 million used to hedge the interest rate exposure on the redeemed debt. In 2016, we also recognized a loss of $15 million on an interest rate swap used as a fair value hedge of long-term debt and an offsetting gain of $16 million on the corresponding long-term debt inOther (expense) incomein the income statements.
A 1% increase (decrease) in interest rates would result in a decrease (increase) of $29 million in net earnings at December 31, 2017.
EQUITY PRICE EXPOSURES
We use equity forward contracts on BCE’s common shares to economically hedge the cash flow exposure related to the settlement of share-based payment plans. See Note 26,Share-based paymentsfor details on our share-based payment arrangements. The fair value of our equity forward contracts at December 31, 2017 was $45 million (2016 – $111 million).
A 5% increase (decrease) in the market price of BCE’s common shares at December 31, 2017 would result in a gain (loss) of $38 million recognized in net earnings for 2017, with all other variables held constant.
We have various capital policies, procedures and processes which are utilized to achieve our objectives for capital management. These include optimizing our cost of capital and maximizing shareholder return while balancing the interests of our stakeholders.
Our definition of capital includes equity attributable to BCE shareholders, debt, and cash and cash equivalents.
The key ratios that we use to monitor and manage our capital structure are a net debt leverage ratio(1) and an adjusted EBITDA to net interest expense ratio(2). Our net debt leverage ratio target range is 1.75 to 2.25 times adjusted EBITDA and our adjusted EBITDA to net interest expense ratio target is greater than 7.5 times. We monitor our capital structure and make adjustments, including to our dividend policy, as required. At December 31, 2017, we had exceeded the limit of our internal net debt leverage ratio target range by 0.45. This excess over the limit of our internal ratio target range does not create risk to our investment-grade credit rating.
These ratios do not have any standardized meaning under IFRS. Therefore, they are unlikely to be comparable to similar measures presented by other issuers. We use, and believe that certain investors and analysts use, our net debt leverage ratio and adjusted EBITDA to net interest expense ratio as measures of financial leverage and health of the company.
The following table provides a summary of our key ratios.
| AT DECEMBER 31 | 2017 | | 2016 | |
| Net debt leverage ratio | 2.70 | | 2.57 | |
| Adjusted EBITDA to net interest expense ratio | 9.12 | | 9.31 | |
On February 7, 2018, the board of directors of BCE approved an increase of 5.2% in the annual dividend on BCE’s common shares, from $2.87 to $3.02 per common share. In addition, the board of directors of BCE declared a quarterly dividend of $0.7550 per common share, payable on April 15, 2018 to shareholders of record at March 15, 2018.
On February 8, 2018, BCE announced a normal course issuer bid (NCIB). See Note 25,Share capitalfor additional details.
On February 1, 2017, the board of directors of BCE approved an increase of 5.1% in the annual dividend on BCE’s common shares, from $2.73 to $2.87 per common share.
| (1) | Our net debt leverage ratio represents net debt divided by adjusted EBITDA. We define net debt as debt due within one year plus long-term debt and 50% of preferred shares less cash and cash equivalents as shown in our statements of financial position. Adjusted EBITDA is defined as operating revenues less operating costs as shown in our income statements. |
| (2) | Our adjusted EBITDA to net interest expense ratio represents adjusted EBITDA divided by net interest expense. Adjusted EBITDA is defined as operating revenues less operating costs as shown in our income statements. Net interest expense is net interest expense as shown in our statements of cash flows and 50% of declared preferred share dividends as shown in our income statements. |
| 154 BCE Inc. 2017 ANNUAL REPORT |
|
| | |
| | Notes to consolidated financial statements |
PREFERRED SHARES
BCE’s articles of amalgamation, as amended, provide for an unlimited number of First Preferred Shares and Second Preferred Shares, all without par value. The terms set out in the articles authorize BCE’s directors to issue the shares in one or more series and to set the number of shares and the conditions for each series.
The following table provides a summary of the principal terms of BCE’s First Preferred Shares as at December 31, 2017. There were no Second Preferred Shares issued and outstanding at December 31, 2017. BCE’s articles of amalgamation, as amended, describe the terms and conditions of these shares in detail.
| SERIES | ANNUAL
DIVIDEND
RATE | | CONVERTIBLE
INTO | | CONVERSION DATE | | REDEMPTION DATE | | REDEMPTION
PRICE | | NUMBER OF SHARES | STATED CAPITAL |
| AUTHORIZED | | ISSUED AND
OUTSTANDING | | DEC. 31,
2017 | | DEC. 31,
2016 | |
| Q | floating | | Series R | | December 1, 2025 | | | | $25.50 | | 8,000,000 | | – | | – | | – | |
| R (1) | 4.13% | | Series Q | | December 1, 2020 | | December 1, 2020 | | $25.00 | | 8,000,000 | | 8,000,000 | | 200 | | 200 | |
| S | floating | | Series T | | November 1, 2021 | | At any time | | $25.50 | | 8,000,000 | | 3,513,448 | | 88 | | 88 | |
| T (1) | 3.019% | | Series S | | November 1, 2021 | | November 1, 2021 | | $25.00 | | 8,000,000 | | 4,486,552 | | 112 | | 112 | |
| Y | floating | | Series Z | | December 1, 2022 | | At any time | | $25.50 | | 10,000,000 | | 8,081,491 | | 202 | | 219 | |
| Z (1) | 3.904% | | Series Y | | December 1, 2022 | | December 1, 2022 | | $25.00 | | 10,000,000 | | 1,918,509 | | 48 | | 31 | |
| AA (1) | 3.61% | | Series AB | | September 1, 2022 | | September 1, 2022 | | $25.00 | | 20,000,000 | | 11,398,396 | | 291 | | 259 | |
| AB | floating | | Series AA | | September 1, 2022 | | At any time | | $25.50 | | 20,000,000 | | 8,601,604 | | 219 | | 251 | |
| AC (1) | 3.55% | | Series AD | | March 1, 2018 | | March 1, 2018 | | $25.00 | | 20,000,000 | | 5,069,935 | | 129 | | 129 | |
| AD | floating | | Series AC | | March 1, 2018 | | At any time | | $25.50 | | 20,000,000 | | 14,930,065 | | 381 | | 381 | |
| AE | floating | | Series AF | | February 1, 2020 | | At any time | | $25.50 | | 24,000,000 | | 9,292,133 | | 232 | | 232 | |
| AF (1) | 3.11% | | Series AE | | February 1, 2020 | | February 1, 2020 | | $25.00 | | 24,000,000 | | 6,707,867 | | 168 | | 168 | |
| AG (1) | 2.80% | | Series AH | | May 1, 2021 | | May 1, 2021 | | $25.00 | | 22,000,000 | | 4,985,351 | | 125 | | 125 | |
| AH | floating | | Series AG | | May 1, 2021 | | At any time | | $25.50 | | 22,000,000 | | 9,014,649 | | 225 | | 225 | |
| AI (1) | 2.75% | | Series AJ | | August 1, 2021 | | August 1, 2021 | | $25.00 | | 22,000,000 | | 5,949,884 | | 149 | | 149 | |
| AJ | floating | | Series AI | | August 1, 2021 | | At any time | | $25.50 | | 22,000,000 | | 8,050,116 | | 201 | | 201 | |
| AK (1) | 2.954% | | Series AL | | December 31, 2021 | | December 31, 2021 | | $25.00 | | 25,000,000 | | 22,745,921 | | 569 | | 569 | |
| AL (2) | floating | | Series AK | | December 31, 2021 | | At any time | | | | 25,000,000 | | 2,254,079 | | 56 | | 56 | |
| AM (1) | 2.764% | | Series AN | | March 31, 2021 | | March 31, 2021 | | $25.00 | | 30,000,000 | | 9,546,615 | | 218 | | 218 | |
| AN (2) | floating | | Series AM | | March 31, 2021 | | At any time | | | | 30,000,000 | | 1,953,385 | | 45 | | 45 | |
| AO (1) | 4.26% | | Series AP | | March 31, 2022 | | March 31, 2022 | | $25.00 | | 30,000,000 | | 4,600,000 | | 118 | | 118 | |
| AP (3) | floating | | Series AO | | March 31, 2027 | | | | | | 30,000,000 | | – | | – | | – | |
| AQ (1) | 4.25% | | Series AR | | September 30, 2018 | | September 30, 2018 | | $25.00 | | 30,000,000 | | 9,200,000 | | 228 | | 228 | |
| AR (3) | floating | | Series AQ | | September 30, 2023 | | | | | | 30,000,000 | | – | | – | | – | |
| | | | | | | | | | | | | | | | 4,004 | | 4,004 | |
| (1) | BCE may redeem each of these series of First Preferred Shares on the applicable redemption date and every five years after that date. |
| (2) | BCE may redeem Series AL and AN First Preferred Shares at $25.00 per share on December 31, 2021 and March 31, 2021, respectively, and every five years thereafter (each, a Series conversion date). Alternatively, BCE may redeem Series AL or AN First Preferred Shares at $25.50 per share on any date which is not a Series conversion date for such series of First Preferred Shares. |
| (3) | If Series AP or AR First Preferred Shares are issued on March 31, 2022 and September 30, 2018, respectively, BCE may redeem such shares at $25.00 per share on March 31, 2027 and September 30, 2023, respectively, and every five years thereafter (each, a Series conversion date). Alternatively, BCE may redeem Series AP or AR First Preferred Shares at $25.50 per share on any date, in the case of Series AP First Preferred Shares, and on any date after September 30, 2018, in the case of Series AR First Preferred Shares, which is not a Series conversion date for each relevant series. |
BCE Inc. 2017 ANNUAL REPORT 155 |
|
| | |
| Notes to consolidated financial statements | |
VOTING RIGHTS
All of the issued and outstanding First Preferred Shares at December 31, 2017 are non-voting, except under special circumstances, when the holders are entitled to one vote per share.
PRIORITY AND ENTITLEMENT TO DIVIDENDS
The First Preferred Shares of all series rank at parity with each other and in priority to all other shares of BCE with respect to payment of dividends and with respect to distribution of assets in the event of liquidation, dissolution or winding up of BCE.
Holders of Series R, T, Z, AA, AC, AF, AG, AI, AK, AM, AO and AQ First Preferred Shares are entitled to fixed cumulative quarterly dividends. The dividend rate on these shares is reset every five years, as set out in BCE’s articles of amalgamation, as amended.
Holders of Series S, Y, AB, AD, AE, AH and AJ First Preferred Shares are entitled to floating adjustable cumulative monthly dividends. The floating dividend rate on these shares is calculated every month, as set out in BCE’s articles of amalgamation, as amended.
Holders of Series AL and AN First Preferred Shares are entitled to floating cumulative quarterly dividends. The floating dividend rate on these shares is calculated every quarter, as set out in BCE’s articles of amalgamation, as amended.
Dividends on all series of First Preferred Shares are paid as and when declared by the board of directors of BCE.
CONVERSION FEATURES
All of the issued and outstanding First Preferred Shares at December 31, 2017 are convertible at the holder’s option into another associated series of First Preferred Shares on a one-for-one basis according to the terms set out in BCE’s articles of amalgamation, as amended.
CONVERSION AND DIVIDEND RATE RESET OF FIRST PREFERRED SHARES
On December 1, 2017, 585,184 of BCE’s 1,227,532 fixed-rate Cumulative Redeemable First Preferred Shares, Series Z (Series Z Preferred Shares) were converted, on a one-for-one basis, into floating-rate cumulative Redeemable First Preferred Shares, Series Y (Series Y Preferred Shares). In addition, on December 1, 2017, 1,276,161 of BCE’s 8,772,468 Series Y Preferred Shares were converted, on a one-for-one basis, into Series Z Preferred Shares.
On September 1, 2017, 965,769 of BCE’s 10,144,302 fixed-rate Cumulative Redeemable First Preferred Shares, Series AA (Series AA Preferred Shares) were converted, on a one-for-one basis, into floating rate Cumulative Redeemable First Preferred Shares, Series AB (Series AB Preferred Shares). In addition, on September 1, 2017, 2,219,863 of BCE’s 9,855,698 Series AB Preferred Shares were converted, on a one-for-one basis, into Series AA Preferred Shares.
Subsequent to year end, on March 1, 2018, 397,181 of BCE’s 5,069,935 fixed-rate Cumulative Redeemable First Preferred Shares, Series AC (Series AC Preferred Shares) were converted, on a one-for-one basis, into floating rate Cumulative Redeemable First Preferred Shares, Series AD (Series AD Preferred Shares). In addition, on March 1, 2018, 5,356,937 of BCE’s 14,930,065 Series AD Preferred Shares were converted, on a one-for-one basis, into Series AC Preferred Shares.
The annual fixed dividend rate on BCE’s Series AC Preferred Shares was reset for the next five years, effective March 1, 2018, at 4.38% from 3.55%. The Series AD Preferred Shares continue to pay a monthly floating cash dividend.
| COMMON SHARES AND CLASS B SHARES |
BCE’s articles of amalgamation provide for an unlimited number of voting common shares and non-voting Class B shares, all without par value. The common shares and the Class B shares rank equally in the payment of dividends and in the distribution of assets if BCE is liquidated, dissolved or wound up, after payments due to the holders of preferred shares. No Class B shares were outstanding at December 31, 2017 and 2016.
The following table provides details about the outstanding common shares of BCE.
| | NOTE | | 2017 | 2016 |
NUMBER OF
SHARES | | STATED
CAPITAL | | NUMBER OF
SHARES | | STATED
CAPITAL | |
Outstanding, January 1 | | | 870,706,332 | | 18,370 | | 865,614,188 | | 18,100 | |
Shares issued for the acquisition of MTS | 3 | | 27,642,714 | | 1,594 | | – | | – | |
Shares issued under employee stock option plan | 26 | | 2,555,863 | | 122 | | 2,236,891 | | 104 | |
Shares issued under dividend reinvestment plan | | | – | | – | | 688,839 | | 38 | |
Shares issued under ESP | | | 91,731 | | 5 | | 2,166,414 | | 128 | |
Outstanding, December 31 | | | 900,996,640 | | 20,091 | | 870,706,332 | | 18,370 | |
Subsequent to year end, on February 8, 2018, BCE announced its plan to repurchase and cancel up to 3.5 million common shares, subject to a maximum aggregate purchase price of $175 million over the twelvemonth period starting February 13, 2018 and ending no later than February 12, 2019 through a NCIB.
CONTRIBUTED SURPLUS
Contributed surplus in 2017 and 2016 includes premiums in excess of par value upon the issuance of BCE common shares and share-based compensation expense net of settlements.
| 156 BCE Inc. 2017 ANNUAL REPORT |
|
| | |
| | Notes to consolidated financial statements |
| Note 26Share-based payments |
The following share-based payment amounts are included in the income statements as operating costs.
| FOR THE YEAR ENDED DECEMBER 31 | 2017 | | 2016 | |
| ESP | (28 | ) | (29 | ) |
| RSUs/PSUs | (44 | ) | (49 | ) |
| Other (1) | (9 | ) | (12 | ) |
| Total share-based payments | (81 | ) | (90 | ) |
| (1) | Includes DSP, DSUs and stock options. |
ESP
The ESP is designed to encourage employees of BCE and its participating subsidiaries to own shares of BCE. Each year, employees can choose to have a certain percentage of their eligible annual earnings withheld through regular payroll deductions for the purchase of BCE common shares. In some cases, the employer also will contribute a percentage of the employee’s eligible annual earnings to the plan, up to a specified maximum. Dividends are credited to the participant’s account on each dividend payment date and are equivalent in value to the dividends paid on BCE common shares.
The BCE ESP allows employees to contribute up to 12% of their annual earnings with a maximum employer contribution of 2%.
Employer contributions to the BCE ESP plan and related dividends are subject to employees holding their shares for a two-year vesting period.
The trustee of the ESP buys BCE common shares for the participants on the open market, by private purchase or from treasury. BCE determines the method the trustee uses to buy the shares.
At December 31, 2017, 5,591,566 common shares were authorized for issuance from treasury under the BCE ESP.
The following table summarizes the status of unvested employer contributions at December 31, 2017 and 2016.
| NUMBER OF ESP SHARES | 2017 | | 2016 | |
Unvested contributions, January 1 | 1,073,212 | | 1,146,046 | |
Contributions (1) | 610,657 | | 600,808 | |
Dividends credited | 49,299 | | 49,988 | |
Vested | (553,837 | ) | (586,309 | ) |
Forfeited | (140,301 | ) | (137,321 | ) |
Unvested contributions, December 31 | 1,039,030 | | 1,073,212 | |
| (1) | The weighted average fair value of the shares contributed was $60 and $59 in 2017 and 2016, respectively. |
RSUs/PSUs
RSUs/PSUs are granted to executives and other eligible employees. The value of an RSU/PSU at the grant date is equal to the value of one BCE common share. Dividends in the form of additional RSUs/PSUs are credited to the participant’s account on each dividend payment date and are equivalent in value to the dividend paid on BCE common shares.
Executives and other eligible employees are granted a specific number of RSUs/PSUs for a given performance period based on their position and level of contribution. RSUs/PSUs vest fully after three years of continuous employment from the date of grant and, in certain cases, if performance objectives are met, as determined by the board of directors.
BCE Inc. 2017 ANNUAL REPORT 157 |
|
| | |
| Notes to consolidated financial statements | |
The following table summarizes outstanding RSUs/PSUs at December 31, 2017 and 2016.
| NUMBER OF RSUs /PSUs | 2017 | | 2016 | |
Outstanding, January 1 | 2,928,698 | | 3,333,583 | |
Granted (1) | 879,626 | | 874,888 | |
Dividends credited | 132,402 | | 137,583 | |
Settled | (1,096,403 | ) | (1,321,846 | ) |
Forfeited | (103,931 | ) | (95,510 | ) |
Outstanding, December 31 | 2,740,392 | | 2,928,698 | |
Vested, December 31 (2) | 985,382 | | 1,058,200 | |
| (1) | The weighted average fair value of the RSUs/PSUs granted was $58 in 2017 and 2016. |
| (2) | The RSUs/PSUs vested on December 31, 2017 were fully settled in February 2018 with BCE common shares and/or DSUs. |
DSP
The value of a deferred share is equal to the value of one BCE common share. Dividends in the form of additional deferred shares are credited to the participant’s account on each dividend payment date and are equivalent in value to the dividend paid on BCE common shares. Deferred shares vest fully after three years of continuous employment from the date of grant. The liability related to the DSP is recorded inTrade payables and other liabilitiesin the statements of financial position and was $30 million and $37 million at December 31, 2017 and 2016, respectively.
DSUs
Eligible bonuses and RSUs/PSUs may be paid in the form of DSUs when executives or other eligible employees elect to or are required to participate in the plan. The value of a DSU at the issuance date is equal to the value of one BCE common share. For non-management directors, compensation is paid in DSUs until the minimum share ownership requirement is met; thereafter, at least 50% of their compensation is paid in DSUs. There are no vesting requirements relating to DSUs. Dividends in the form of additional DSUs are credited to the participant’s account on each dividend payment date and are equivalent in value to the dividends paid on BCE common shares. DSUs are settled when the holder leaves the company.
The following table summarizes the status of outstanding DSUs at December 31, 2017 and 2016.
| NUMBER OF DSUs | 2017 | | 2016 | |
Outstanding, January 1 | 4,131,229 | | 3,796,051 | |
Issued (1) | 69,742 | | 87,665 | |
Settlement of RSUs/PSUs | 101,066 | | 323,428 | |
Dividends credited | 203,442 | | 183,852 | |
Settled | (195,951 | ) | (259,767 | ) |
Outstanding, December 31 | 4,309,528 | | 4,131,229 | |
| (1) | The weighted average fair value of the DSUs issued was $59 in 2017 and 2016. |
STOCK OPTIONS
Under BCE’s long-term incentive plans, BCE may grant options to executives to buy BCE common shares. The subscription price of a grant is based on the higher of:
- the volume-weighted average of the trading price on the trading dayimmediately prior to the effective date of the grant
- the volume-weighted average of the trading price for the last fiveconsecutive trading days ending on the trading day immediatelyprior to the effective date of the grant
At December 31, 2017, 14,586,683 common shares were authorized for issuance under these plans. Options vest fully after three years of continuous employment from the date of grant. All options become exercisable when they vest and can be exercised for a period of seven years from the date of grant.
| 158 BCE Inc. 2017 ANNUAL REPORT |
|
| | |
| | Notes to consolidated financial statements |
The following table summarizes BCE’s outstanding stock options at December 31, 2017 and 2016.
| | NOTE | | 2017 | 2016 |
NUMBER OF
OPTIONS | | WEIGHTED AVERAGE
EXERCISE PRICE ($) | | NUMBER OF
OPTIONS | | WEIGHTED AVERAGE
EXERCISE PRICE ($) | |
Outstanding, January 1 | | | 10,242,162 | | 52 | | 9,666,904 | | 48 | |
Granted | | | 3,043,448 | | 59 | | 2,968,062 | | 58 | |
Exercised (1) | 25 | | (2,555,863 | ) | 45 | | (2,236,891 | ) | 44 | |
Forfeited | | | (239,498 | ) | 58 | | (155,913 | ) | 52 | |
Outstanding, December 31 | | | 10,490,249 | | 55 | | 10,242,162 | | 52 | |
Exercisable, December 31 | | | 2,013,983 | | 45 | | 1,786,251 | | 42 | |
| (1) | The weighted average share price for options exercised was $60 and $59 in 2017 and 2016, respectively. |
The following table provides additional information about BCE’s stock option plans at December 31, 2017.
| | STOCK OPTIONS OUTSTANDING |
| RANGE OF EXERCISE PRICES | NUMBER | | WEIGHTED AVERAGE
REMAINING LIFE
(YEARS) | | WEIGHTED AVERAGE
EXERCISE PRICE ($) | |
| $30–$39 | 35,408 | | 0.14 | | 36 | |
| $40–$49 | 1,978,575 | | 2.54 | | 46 | |
| $50–$59 | 8,377,818 | | 5.19 | | 58 | |
| $60 & above | 98,448 | | 5.84 | | 61 | |
| | 10,490,249 | | 4.68 | | 55 | |
ASSUMPTIONS USED IN STOCK OPTION PRICING MODEL
The fair value of options granted was determined using a variation of a binomial option pricing model that takes into account factors specific to the share incentive plans, such as the vesting period. The following table shows the principal assumptions used in the valuation.
| | 2017 | |
Weighted average fair value per option granted | $ 1.97 | |
Weighted average share price | $ 58 | |
Weighted average exercise price | $ 59 | |
Dividend yield | 5 | % |
Expected volatility | 13 | % |
Risk-free interest rate | 1 | % |
Expected life (years) | 4 | |
Expected volatilities are based on the historical volatility of BCE’s share price. The risk-free rate used is equal to the yield available on Government of Canada bonds at the date of grant with a term equal to the expected life of the options.
BCE Inc. 2017 ANNUAL REPORT 159 |
|
| | |
| Notes to consolidated financial statements | |
| Note 27 Additional cash flow information |
The following table provides a reconciliation of changes in liabilities arising from financing activities.
| NOTE | | DEBT DUE WITHIN
ONE YEAR AND
LONG-TERM DEBT | | DERIVATIVE TO
HEDGE FOREIGN
CURRENCY
ON DEBT(1) | | DIVIDENDS
PAYABLE | | OTHER
LIABILITIES | | TOTAL | |
January 1, 2017 | | | 21,459 | | (31 | ) | 617 | | – | | 22,045 | |
Cash flows from (used in) financing activities | | | | | | | | | | | | |
Increase in notes payable | | | 452 | | (119 | ) | – | | – | | 333 | |
Issue of long-term debt | | | 3,011 | | – | | – | | – | | 3,011 | |
Repayments of long-term debt | | | (2,653 | ) | – | | – | | – | | (2,653 | ) |
Cash dividends paid on common and preferred shares | | | – | | – | | (2,639 | ) | – | | (2,639 | ) |
Cash dividends paid by subsidiaries to non-controlling interests | 30 | | – | | – | | (34 | ) | – | | (34 | ) |
Other financing activities | | | (44 | ) | 6 | | – | | (22 | ) | (60 | ) |
Total cash flows from (used in) financing activities excluding equity | | | 766 | | (113 | ) | (2,673 | ) | (22 | ) | (2,042 | ) |
Non-cash changes arising from | | | | | | | | | | | | |
Finance lease additions | | | 339 | | – | | – | | – | | 339 | |
Dividends declared on common and preferred shares | | | – | | – | | 2,692 | | – | | 2,692 | |
Dividends declared by subsidiaries to non-controlling interests | | | – | | – | | 45 | | – | | 45 | |
Effect of changes in foreign exchange rates | | | (198 | ) | 198 | | – | | – | | – | |
Business acquisitions | 3 | | 972 | | – | | – | | – | | 972 | |
Other | | | 55 | | – | | (3 | ) | 22 | | 74 | |
Total non-cash changes | | | 1,168 | | 198 | | 2,734 | | 22 | | 4,122 | |
December 31, 2017 | | | 23,393 | | 54 | | 678 | | – | | 24,125 | |
| (1) | Included in Other current assets, Trade payables and other liabilities, Other non-current assets and Other non-current liabilities in the statements of financial position. |
| 160 BCE Inc. 2017 ANNUAL REPORT |
|
| | |
| | Notes to consolidated financial statements |
| Note 28 Commitments and contingencies |
COMMITMENTS
The following table is a summary of our contractual obligations at December 31, 2017 that are due in each of the next five years and thereafter.
| | NOTE | | 2018 | | 2019 | | 2020 | | 2021 | | 2022 | | THERE-
AFTER | | TOTAL | |
Operating leases | | | 312 | | 264 | | 225 | | 175 | | 119 | | 341 | | 1,436 | |
Commitments for property, plant and equipment and intangible assets | | | 1,039 | | 808 | | 614 | | 516 | | 372 | | 808 | | 4,157 | |
Purchase obligations | | | 865 | | 664 | | 550 | | 498 | | 429 | | 903 | | 3,909 | |
Proposed acquisition of Séries+ and Historia specialty channels | 3 | | 200 | | – | | – | | – | | – | | – | | 200 | |
Acquisition of AlarmForce(1) | 3 | | 182 | | – | | – | | – | | – | | – | | 182 | |
Total | | | 2,598 | | 1,736 | | 1,389 | | 1,189 | | 920 | | 2,052 | | 9,884 | |
| (1) | This commitment was settled on January 5, 2018, upon completion of the acquisition of AlarmForce. See Note 3, Business acquisitions and dispositions for additional details. |
BCE’s significant operating leases are for office premises, cellular tower sites, retail outlets and OOH advertising spaces with lease terms ranging from 1 to 50 years. These leases are non-cancellable. Rental expense relating to operating leases was $399 million in 2017 and $353 million in 2016.
Our commitments for property, plant and equipment and intangible assets include program and feature film rights and investments to expand and update our networks to meet customer demand.
Purchase obligations consist of contractual obligations under service and product contracts for operating expenditures and other purchase obligations.
In the ordinary course of business, we become involved in various claims and legal proceedings seeking monetary damages and other relief. In particular, because of the nature of our consumer-facing business, we are exposed to class actions pursuant to which substantial monetary damages may be claimed. Due to the inherent risks and uncertainties of the litigation process, we cannot predict the final outcome or timing of claims and legal proceedings. Subject to the foregoing, and based on information currently available and management’s assessment of the merits of the claims and legal proceedings pending at March 8, 2018, management believes that the ultimate resolution of these claims and legal proceedings is unlikely to have a material and negative effect on our financial statements. We believe that we have strong defences and we intend to vigorously defend our positions.
BCE Inc. 2017 ANNUAL REPORT 161 |
|
| | |
| Notes to consolidated financial statements | |
| Note 29 Related party transactions |
SUBSIDIARIES
The following table shows BCE’s significant subsidiaries at December 31, 2017. BCE has other subsidiaries which have not been included in the table as each represents less than 10% individually and less than 20% in aggregate of total consolidated revenues.
All of these significant subsidiaries are incorporated in Canada and provide services to each other in the normal course of operations. The value of these transactions is eliminated on consolidation.
| | OWNERSHIP PERCENTAGE |
| SUBSIDIARY | 2017 | | 2016 | |
Bell Canada | 100% | | 100% | |
Bell Mobility | 100% | | 100% | |
Bell Media | 100% | | 100% | |
| TRANSACTIONS WITH JOINT ARRANGEMENTS AND ASSOCIATES |
During 2017 and 2016, BCE provided communication services and received programming content and other services in the normal course of business on an arm’s length basis to and from its joint arrangements and associates. Our joint arrangements and associates include MLSE, Glentel Inc., and Dome Productions Partnership. From time to time, BCE may be required to make capital contributions in its investments.
In 2017, BCE recognized revenues and incurred expenses with our joint arrangements and associates of $11 million (2016 – $16 million) and $177 million (2016 – $180 million), respectively.
Bimcor Inc. (Bimcor), a wholly-owned subsidiary of Bell Canada, is the administrator of the Master Trust. Bimcor recognized management fees of $10 million from the Master Trust for 2017 and 2016. The details of BCE’s post-employment benefit plans are set out in Note 22,Post-employment benefit plans.
| COMPENSATION OF KEY MANAGEMENT PERSONNEL AND BOARD OF DIRECTORS |
The following table includes compensation of key management personnel and the board of directors for the years ended December 31, 2017 and 2016 included in our income statements. Key management personnel include the company’s Chief Executive Officer (CEO), Group President and the executives who report directly to them.
| FOR THE YEAR ENDED DECEMBER 31 | 2017 | | 2016 | |
Wages, salaries, fees and related taxes and benefits | (23 | ) | (24 | ) |
Post-employment benefit plans and OPEBs cost | (3 | ) | (4 | ) |
Share-based compensation | (23 | ) | (27 | ) |
Key management personnel and board of directors compensation expense | (49 | ) | (55 | ) |
| 162 BCE Inc. 2017 ANNUAL REPORT |
|
| | |
| | Notes to consolidated financial statements |
| Note 30 Significant partly-owned subsidiaries |
The following tables show summarized financial information for our subsidiaries with significant non-controlling interest (NCI).
| SUMMARIZED STATEMENTS OF FINANCIAL POSITION |
| | CTV SPECIALTY(1)(2) |
| FOR THE YEAR ENDED DECEMBER 31 | 2017 | | 2016 | |
Current assets | 328 | | 293 | |
Non-current assets | 1,013 | | 1,013 | |
Total assets | 1,341 | | 1,306 | |
Current liabilities | 153 | | 130 | |
Non-current liabilities | 184 | | 195 | |
Total liabilities | 337 | | 325 | |
Total equity attributable to BCE shareholders | 700 | | 687 | |
NCI | 304 | | 294 | |
| (1) | At December 31, 2017 and 2016, the ownership interest held by NCI in CTV Specialty Television Inc. (CTV Specialty) was 29.9%. CTV Specialty was incorporated and operated in Canada as at such dates. |
| (2) | CTV Specialty’s net assets at December 31, 2017 and 2016, include $6 million and $2 million, respectively, directly attributable to NCI. |
| SELECTED INCOME AND CASH FLOW INFORMATION |
| | CTV SPECIALTY(1) |
| FOR THE YEAR ENDED DECEMBER 31 | 2017 | | 2016 | |
Operating revenues | 832 | | 824 | |
Net earnings | 179 | | 182 | |
Net earnings attributable to NCI | 56 | | 56 | |
Total comprehensive income | 172 | | 173 | |
Total comprehensive income attributable to NCI | 54 | | 54 | |
Cash dividends paid to NCI | 34 | | 46 | |
| (1) | CTV Specialty’s net earnings and total comprehensive income include $3 million directly attributable to NCI for 2017 and 2016, respectively. |
BCE Inc. 2017 ANNUAL REPORT 163 |
|