Exhibit 99.1

| Management’s discussion and analysis | 1 |
| 1 | Overview | 2 |
| | 1.1 | Financial highlights | 2 |
| | 1.2 | Key corporate and business developments | 3 |
| | 1.3 | Assumptions | 4 |
| 2 | Consolidated financial analysis | 5 |
| | 2.1 | BCE consolidated income statements | 5 |
| | 2.2 | Customer connections | 5 |
| | 2.3 | Operating revenues | 6 |
| | 2.4 | Operating costs | 7 |
| | 2.5 | Net earnings | 8 |
| | 2.6 | Adjusted EBITDA | 9 |
| | 2.7 | Severance, acquisition and other costs | 9 |
| | 2.8 | Depreciation and amortization | 10 |
| | 2.9 | Finance costs | 10 |
| | 2.10 | Other expense | 10 |
| | 2.11 | Income taxes | 10 |
| | 2.12 | Net earnings attributable to common shareholders and EPS | 11 |
| 3 | Business segment analysis | 12 |
| | 3.1 | Bell Wireless | 12 |
| | 3.2 | Bell Wireline | 16 |
| | 3.3 | Bell Media | 20 |
| 4 | Financial and capital management | 22 |
| | 4.1 | Net debt | 22 |
| | 4.2 | Outstanding share data | 22 |
| | 4.3 | Cash flows | 23 |
| | 4.4 | Post-employment benefit plans | 25 |
| | 4.5 | Financial risk management | 25 |
| | 4.6 | Credit ratings | 27 |
| | 4.7 | Liquidity | 27 |
| 5 | Quarterly financial information | 28 |
| 6 | Regulatory environment | 29 |
| 7 | Business risks | 30 |
| 8 | Accounting policies, financial measures and controls | 32 |
| | 8.1 | Our accounting policies | 32 |
| | 8.2 | Non-GAAP financial measures and key performance indicators (KPIs) | 34 |
| | 8.3 | Controls and procedures | 37 |
Consolidated financial statements | 38 |
| | Consolidated income statements | 38 |
| | Consolidated statements of comprehensive income | 39 |
| | Consolidated statements of financial position | 40 |
| | Consolidated statements of changes in equity | 41 |
| | Consolidated statements of cash flows | 42 |
Notes to consolidated financial statements | 43 |
| | Note 1 | Corporate information | 43 |
| | Note 2 | Basis of presentation and significant accounting policies | 43 |
| | Note 3 | Business acquisitions and dispositions | 44 |
| | Note 4 | Segmented information | 46 |
| | Note 5 | Operating costs | 48 |
| | Note 6 | Severance, acquisition and other costs | 48 |
| | Note 7 | Other expense | 49 |
| | Note 8 | Earnings per share | 49 |
| | Note 9 | Income taxes | 50 |
| | Note 10 | Debt | 50 |
| | Note 11 | Post-employment benefit plans | 50 |
| | Note 12 | Financial assets and liabilities | 51 |
| | Note 13 | Share capital | 52 |
| | Note 14 | Share-based payments | 53 |
| | Note 15 | Adoption of IFRS 15 | 54 |
| BCE Inc. 2018 THIRD QUARTER SHAREHOLDER REPORT |
|
| | | | |
| | MD&A | |
| Management’s discussion and analysis |
In this management’s discussion and analysis of financial condition and results of operations (MD&A),we,us,our,BCE andthe companymean, as the context may require, either BCE Inc. or, collectively, BCE Inc., Bell Canada, their subsidiaries, joint arrangements and associates.Bell means, as the context may require, either Bell Canada or, collectively, Bell Canada, its subsidiaries, joint arrangements and associates.MTSmeans, as the context may require, until March 17, 2017, either Manitoba Telecom Services Inc. or, collectively, Manitoba Telecom Services Inc. and its subsidiaries; andBell MTSmeans, from March 17, 2017, the combined operations of MTS and Bell Canada in Manitoba.
All amounts in this MD&A are in millions of Canadian dollars, except where noted. Please refer to section 8.2,Non-GAAP financial measures and key performance indicators(KPIs) on pages 34 to 36 for a list of defined non-GAAP financial measures and KPIs.
Please refer to BCE’s unaudited consolidated financial statements for the third quarter of 2018 (Q3 2018 Financial Statements) when reading this MD&A. We also encourage you to read BCE’s MD&A for the year ended December 31, 2017 dated March 8, 2018 (BCE 2017 Annual MD&A) as updated in BCE’s MD&A for the first quarter of 2018 dated May 2, 2018 (BCE 2018 First Quarter MD&A) and BCE’s MD&A for the second quarter of 2018 dated August 1, 2018 (BCE 2018 Second Quarter MD&A). In preparing this MD&A, we have taken into account information available to us up to October 31, 2018, the date of this MD&A, unless otherwise stated.
As required by International Financial Reporting Standards (IFRS), effective January 1, 2018, we have adopted IFRS 15, Revenue from Contracts with Customers, as described in section 8.1,Our accounting policies, retrospectively to each period in 2017 previously reported. We have also reclassified some amounts from previous periods to make them consistent with the presentation for the current period. As a result of the adoption of IFRS 15, we have also updated certain of our assumptions set out in the BCE 2017 Annual MD&A.
You will find more information about us, including BCE’s annual information form for the year ended December 31, 2017 dated March 8, 2018 (BCE 2017 AIF) and recent financial reports, including the BCE 2017 Annual MD&A, the BCE 2018 First Quarter MD&A and the BCE 2018 Second Quarter MD&A, on BCE’s website at BCE.ca, on SEDAR at sedar.comand on EDGAR at sec.gov.
This MD&A comments on our business operations, performance, financial position and other matters for the three months (Q3) and nine months (YTD) ended September 30, 2018 and 2017.
| CAUTION REGARDING FORWARD-LOOKING STATEMENTS |
This MD&A, and in particular, but without limitation, the section and sub-sections entitledAssumptions, section 3.1,Bell Wireless – Key business developments, section 3.2,Bell Wireline – Key business developments, section 3.3,Bell Media – Key business developments, and section 6, Regulatory environment, contain forward-looking statements. These forward-looking statements include, without limitation, statements relating to our network deployment plans and related capital investments, BCE’s business outlook, objectives, plans and strategic priorities, and other statements that do not refer to historical facts. A statement we make is forward-looking when it uses what we know and expect today to make a statement about the future. Forward-looking statements are typically identified by the wordsassumption,goal,guidance,objective,outlook,project,strategy,target, and other similar expressions or future or conditional verbs such asaim,anticipate,believe,could,expect,intend,may,plan,seek,should,striveandwill. All such forward-looking statements are made pursuant to the safe harbour provisions of applicable Canadian securities laws and of the United States (U.S.) Private Securities Litigation Reform Act of 1995.
Unless otherwise indicated by us, forward-looking statements in this MD&A describe our expectations as at October 31, 2018 and, accordingly, are subject to change after that date. Except as may be required by applicable securities laws, we do not undertake any obligation to update or revise any forward-looking statements, whether as a result of new information, future events or otherwise.
Forward-looking statements, by their very nature, are subject to inherent risks and uncertainties and are based on several assumptions, both general and specific, which give rise to the possibility that actual results or events could differ materially from our expectations expressed in, or implied by, such forward-looking statements and that our business outlook, objectives, plans and strategic priorities may not be achieved. As a result, we cannot guarantee that any forward-looking statement will materialize and we caution you against relying on any of these forward-looking statements. Forward-looking statements are presented in this MD&A for the purpose of assisting investors and others in understanding our objectives, strategic priorities and business outlook as well as our anticipated operating environment. Readers are cautioned, however, that such information may not be appropriate for other purposes.
We have made certain economic, market and operational assumptions in preparing the forward-looking statements contained in this MD&A and, in particular, but without limitation, the forward-looking statements contained in the previously mentioned sections of this MD&A. These assumptions include, without limitation, the assumptions described in the various sections and sub-sections of this MD&A entitledAssumptions, which section and sub-sections are incorporated by reference in this cautionary statement. We believe that our assumptions were reasonable at October 31, 2018. If our assumptions turn out to be inaccurate, our actual results could be materially different from what we expect. Unless otherwise indicated in this MD&A, in the BCE 2018 First Quarter MD&A or in the BCE 2018 Second Quarter MD&A, the strategic priorities, business outlook and assumptions described in the BCE 2017 Annual MD&A remain substantially unchanged.
Important risk factors including, without limitation, competitive, regulatory, economic, financial, operational, technological and other risks that could cause actual results or events to differ materially from those expressed in, or implied by, the previously-mentioned forward looking statements and other forward-looking statements contained in this MD&A, include, but are not limited to, the risks described or referred to in section 6,Regulatory environment, and section 7,Business risks, which sections are incorporated by reference in this cautionary statement.
We caution readers that the risks described in the previously mentioned sections and in other sections of this MD&A are not the only ones that could affect us. Additional risks and uncertainties not currently known to us or that we currently deem to be immaterial may also have a material adverse effect on our financial position, financial performance, cash flows, business or reputation. Except as otherwise indicated by us, forward-looking statements do not reflect the potential impact of any special items or of any dispositions, monetizations, mergers, acquisitions, other business combinations or other transactions that may be announced or that may occur after October 31, 2018. The financial impact of these transactions and special items can be complex and depends on facts particular to each of them. We therefore cannot describe the expected impact in a meaningful way, or in the same way we present known risks affecting our business.
BCE Inc. 2018 THIRD QUARTER SHAREHOLDER REPORT 1 |
|
| | | | |
1 | MD&A | Overview | |
As required by IFRS, effective January 1, 2018, we have adopted IFRS 15, Revenue from Contracts with Customers, as described in section 8.1,Our accounting policies, retrospectively to each period in 2017 previously reported. We have also reclassified some amounts from previous periods to make them consistent with the presentation for the current period.
BCE Q3 2018 SELECTED QUARTERLY INFORMATION

| BCE INCOME STATEMENTS – SELECTED INFORMATION |
| | Q3 2018 | | Q3 2017 | | $ CHANGE | | % CHANGE | | YTD 2018 | | YTD 2017 | | $ CHANGE | | % CHANGE | |
Operating revenues | | | | | | | | | | | | | | | | |
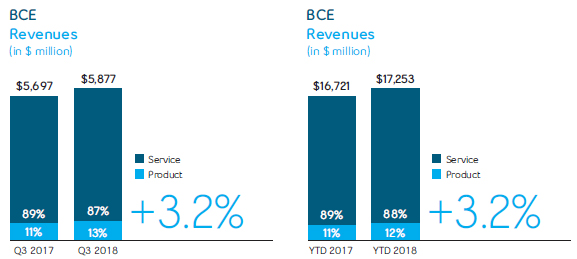
Service | 5,117 | | 5,054 | | 63 | | 1.2 | % | 15,210 | | 14,943 | | 267 | | 1.8 | % |
Product | 760 | | 643 | | 117 | | 18.2 | % | 2,043 | | 1,778 | | 265 | | 14.9 | % |
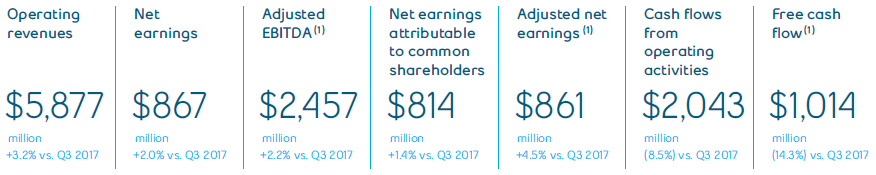
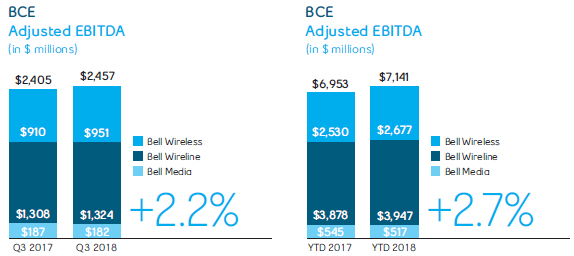
Total operating revenues | 5,877 | | 5,697 | | 180 | | 3.2 | % | 17,253 | | 16,721 | | 532 | | 3.2 | % |
Operating costs | (3,420 | ) | (3,292 | ) | (128 | ) | (3.9 | %) | (10,112 | ) | (9,768 | ) | (344 | ) | (3.5 | %) |
Adjusted EBITDA | 2,457 | | 2,405 | | 52 | | 2.2 | % | 7,141 | | 6,953 | | 188 | | 2.7 | % |
Adjusted EBITDA margin(1) | 41.8 | % | 42.2 | % | | | (0.4 | ) pts | 41.4 | % | 41.6 | % | | | (0.2 | ) pts |
Net earnings attributable to: | | | | | | | | | | | | | | | | |
Common shareholders | 814 | | 803 | | 11 | | 1.4 | % | 2,179 | | 2,210 | | (31 | ) | (1.4 | %) |
Preferred shareholders | 36 | | 31 | | 5 | | 16.1 | % | 107 | | 94 | | 13 | | 13.8 | % |
Non-controlling interest | 17 | | 16 | | 1 | | 6.3 | % | 45 | | 48 | | (3 | ) | (6.3 | %) |
Net earnings | 867 | | 850 | | 17 | | 2.0 | % | 2,331 | | 2,352 | | (21 | ) | (0.9 | %) |
Adjusted net earnings | 861 | | 824 | | 37 | | 4.5 | % | 2,357 | | 2,322 | | 35 | | 1.5 | % |
Net earnings per common share (EPS) | 0.90 | | 0.90 | | — | | — | % | 2.42 | | 2.48 | | (0.06 | ) | (2.4 | %) |
Adjusted EPS(1) | 0.96 | | 0.91 | | 0.05 | | 5.5 | % | 2.62 | | 2.60 | | 0.02 | | 0.8 | % |
| (1) | Adjusted EBITDA, adjusted EBITDA margin, adjusted net earnings, adjusted EPS and free cash flow are non-GAAP financial measures and do not have any standardized meaning under IFRS. Therefore, they are unlikely to be comparable to similar measures presented by other issuers. See section 8.2,Non-GAAP financial measures and key performance indicators (KPIs) – Adjusted EBITDA and adjusted EBITDA margin, Adjusted net earnings and adjusted EPSandFree cash flow and dividend payout ratioin this MD&A for more details, including reconciliations to the most comparable IFRS financial measure. |
| (2) | At the beginning of Q1 2018, we adjusted our postpaid wireless subscriber base to remove 16,116 subscribers with a corresponding increase to our high-speed Internet subscribers to reflect the transfer of fixed wireless Internet subscribers. |
| (3) | At the beginning of Q1 2018, our high-speed Internet subscriber base was increased by 19,835, our Internet protocol television (IPTV) by 14,599 and our residential NAS by 23,441, mainly as a result of a small acquisition made in Q1 2018. |
| (4) | As of January 1, 2018, business NAS was removed from our NAS subscriber base due to its declining relevance as a KPI given migrations from voice to Internet protocol (IP) result in NAS losses without a corresponding decline in revenues. Previously reported periods were retroactively adjusted. |
| 2 BCE Inc. 2018 THIRD QUARTER SHAREHOLDER REPORT |
|
| | | | |
| | 1 | MD&A | Overview |
| BCE STATEMENTS OF CASH FLOWS – SELECTED INFORMATION |
| Q3 2018 | | Q3 2017 | | $ CHANGE | | % CHANGE | | YTD 2018 | | YTD 2017 | | $ CHANGE | | % CHANGE | |
Cash flows from operating activities | 2,043 | | 2,233 | | (190 | ) | (8.5 | %) | 5,596 | | 5,700 | | (104 | ) | (1.8 | %) |
Capital expenditures | (1,010 | ) | (1,040 | ) | 30 | | 2.9 | % | (2,997 | ) | (2,934 | ) | (63 | ) | (2.1 | %) |
Free cash flow | 1,014 | | 1,183 | | (169 | ) | (14.3 | %) | 2,545 | | 2,766 | | (221 | ) | (8.0 | %) |
| Q3 2018 FINANCIAL HIGHLIGHTS |
BCE delivered revenue growth of 3.2% in Q3 2018, compared to last year, driven by higher service revenues of 1.2% reflecting a favourable contribution from all three of our segments. Product revenues grew by 18.2%, compared to last year, due to greater sales of premium wireless devices and higher equipment sales to large business customers. Wireless service revenues benefited from a continued subscriber base expansion, which was moderated by lower average revenue per user (ARPU). The growth in our wireline service revenues was driven by higher Internet and IPTV revenues, and reflected improved business markets performance from greater IP-based and business solutions services revenue, which more than offset the ongoing erosion in our legacy voice and data services. Bell Media grew both advertising and subscriber revenues in the quarter.
Net earnings increased by 2.0% in the third quarter of 2018, compared to the same period last year, due to higher adjusted EBITDA, as growing revenues more than offset an increase in operating costs, lower income taxes and lower other expense, partly offset by higher severance, acquisition and other costs, higher depreciation and amortization expense and higher finance costs.
Q3 2018 adjusted EBITDA grew by 2.2%, compared to last year, mainly driven by the service revenue flow-through, along with continued disciplined cost containment, offset in part by escalating content and programming costs.
BCE’s EPS of $0.90 in Q3 2018 remained stable compared to the same period last year.
Excluding the impact of severance, acquisition and other costs, net mark-to-market (losses) gains on derivatives used to economically hedge equity settled share-based compensation plans, net (losses) gains on investments, early debt redemption costs and impairment charges, adjusted net earnings in the third quarter of 2018 was $861 million, or $0.96 per common share, compared to $824 million, or $0.91 per common share, for the same period last year.
Cash flows from operating activities in the third quarter of 2018 decreased by $190 million, compared to Q3 2017, due mainly to a decrease in cash from working capital and higher income taxes paid, partly offset by higher adjusted EBITDA.
Free cash flow in Q3 2018 decreased by $169 million, compared to the same period last year, mainly due to lower cash flows from operating activities excluding acquisition and other costs paid, partly offset by lower capital expenditures.
| 1.2 Key corporate and business developments |
MIRKO BIBIC APPOINTED AS CHIEF OPERATING OFFICER
On October 4, 2018, BCE appointed Mirko Bibic as Chief Operating Officer (COO) for BCE and Bell Canada. As Chief Operating Officer, Mr. Bibic will leverage his deep knowledge of Bell’s business and his experience in executing major corporate initiatives to lead the company’s largest customer-facing business units. Rizwan Jamal, President of Bell Residential and Small Business; Blaik Kirby, President of Bell Mobility; and Tom Little, President of Bell Business Markets report to Mr. Bibic in his role as COO. Mr. Bibic also continues to lead legal and regulatory strategy for BCE and the Bell group of companies. Mr. Bibic has been a key driver in the success of Bell’s broadband investment and innovation strategy as Executive Vice President of Corporate Development. This includes his oversight of strategic mergers and acquisitions transactions such as the acquisitions of Astral Media Inc. and MTS, Bell’s participation in multiple wireless spectrum auctions, and a wide range of other investment and partnership initiatives.
Bell also appointed Wade Oosterman as Vice Chair of BCE and Bell Canada. A highly respected leader in the Canadian communications industry, including 12 years at Bell in increasingly expansive executive roles, Mr. Oosterman assumes a senior advisory and oversight role on the Bell executive team, in addition to his existing leadership of Bell Media as Group President and his role as Bell’s Chief Brand Officer. Bell Media President Randy Lennox continues to report to Mr. Oosterman.
| ACQUISITION OF AXIA NETMEDIA COMPLETED |
On August 31, 2018, Bell completed its acquisition of Axia NetMedia Corporation (Axia), the Calgary-based operator of SuperNet, the Alberta broadband network connecting thousands of provincial and municipal offices, Indigenous communities, schools, libraries, healthcare institutions, businesses and Internet service providers throughout the province, which will add approximately 10,000 kilometres of fibre capacity to our footprint.
BCE Inc. 2018 THIRD QUARTER SHAREHOLDER REPORT 3 |
|
| | | | |
1 | MD&A | Overview | |
| PUBLIC DEBT OFFERINGS AND REDEMPTIONS |
On August 21, 2018, Bell Canada completed a public offering of $1 billion of medium term notes (MTN) debentures pursuant to its MTN program. The $1 billion Series M-48 MTN debentures will mature on August 21, 2028 and carry an annual interest rate of 3.80%. The MTN debentures are fully and unconditionally guaranteed by BCE Inc. The net proceeds of the offering were used to fund the early redemption in September 2018 of Bell Canada’s $1 billion principal amount of 3.35% Series M-25 debentures due June 18, 2019.
On September 14, 2018, Bell Canada completed a public offering of US $400 million of Series US-1 Notes (Notes). The Notes represent a re-opening of, and form a single series with, Bell Canada’s outstanding 4.464% Series US-1 Notes due 2048 in the principal amount of US $750 million that were issued on March 29, 2018. The Notes will mature on April 1, 2048 and carry an annual interest rate of 4.464%. The Notes are fully and unconditionally guaranteed by BCE Inc. The net proceeds of the offering were used to fund the early redemption in October 2018 of Bell Canada’s $200 million principal amount of 5.625% Series 8 notes due December 16, 2019, for the repayment of short-term debt and for general corporate purposes.
As at the date of this MD&A, our forward-looking statements set out in the BCE 2017 Annual MD&A, as updated or supplemented in the BCE 2018 First Quarter MD&A, in the BCE 2018 Second Quarter MD&A and in this MD&A, are based on certain assumptions including, without limitation, the following economic and market assumptions as well as the various assumptions referred to under the sub-sections entitledAssumptionsset out in section 3, Business segment analysis of this MD&A.
ASSUMPTIONS ABOUT THE CANADIAN ECONOMY
- A gradual improvement in economic growth, given the Bank of Canada’s most recent estimated growth in Canadian gross domestic product of 2.1% in 2018, representing a slight increase from the earlier estimate of 2.0%
- Employment gains expected to slow in 2018, as the overall level of business investment is expected to remain soft
- Interest rates expected to increase modestly in 2018
- Canadian dollar expected to remain at near current levels. Further movements may be impacted by the degree of strength of the U.S. dollar, interest rates and changes in commodity prices
MARKET ASSUMPTIONS
- A higher level of wireline and wireless competition in consumer, business and wholesale markets
- Higher, but slowing, wireless industry penetration and smartphone adoption
- A soft media advertising market, due to variable demand, and continued escalation of costs to secure TV programming
- Ongoing linear TV subscriber erosion, due to growing cord-cutter and cord-never customer segments
| 4 BCE Inc. 2018 THIRD QUARTER SHAREHOLDER REPORT |
|
| | | | |
| | 2 | MD&A | Consolidated financial analysis |
| 2 Consolidated financial analysis |
This section provides detailed information and analysis about BCE’s performance in Q3 and YTD 2018 compared with Q3 and YTD 2017. It focuses on BCE’s consolidated operating results and provides financial information for our Bell Wireless, Bell Wireline and Bell Media business segments. For further discussion and analysis of our business segments, refer to section 3,Business segment analysis.
As required by IFRS, effective January 1, 2018, we have adopted IFRS 15, Revenue from Contracts with Customers, as described in section 8.1,Our accounting policies, retrospectively to each period in 2017 previously reported. We have also reclassified some amounts from previous periods to make them consistent with the presentation for the current period.
| 2.1 BCE consolidated income statements |
| Q3 2018 | | Q3 2017 | | $ CHANGE | | % CHANGE | | YTD 2018 | | YTD 2017 | | $ CHANGE | | % CHANGE | |
Operating revenues | | | | | | | | | | | | | | | | |
Service | 5,117 | | 5,054 | | 63 | | 1.2 | % | 15,210 | | 14,943 | | 267 | | 1.8 | % |
Product | 760 | | 643 | | 117 | | 18.2 | % | 2,043 | | 1,778 | | 265 | | 14.9 | % |
Total operating revenues | 5,877 | | 5,697 | | 180 | | 3.2 | % | 17,253 | | 16,721 | | 532 | | 3.2 | % |
Operating costs | (3,420 | ) | (3,292 | ) | (128 | ) | (3.9 | %) | (10,112 | ) | (9,768 | ) | (344 | ) | (3.5 | %) |
Adjusted EBITDA | 2,457 | | 2,405 | | 52 | | 2.2 | % | 7,141 | | 6,953 | | 188 | | 2.7 | % |
Adjusted EBITDA margin | 41.8 | % | 42.2 | % | | | (0.4 | ) pts | 41.4 | % | 41.6 | % | | | (0.2 | ) pts |
Severance, acquisition and other costs | (54 | ) | (23 | ) | (31 | ) | n.m. | | (78 | ) | (143 | ) | 65 | | 45.5 | % |
Depreciation | (779 | ) | (760 | ) | (19 | ) | (2.5 | %) | (2,346 | ) | (2,251 | ) | (95 | ) | (4.2 | %) |
Amortization | (220 | ) | (207 | ) | (13 | ) | (6.3 | %) | (653 | ) | (602 | ) | (51 | ) | (8.5 | %) |
Finance costs | | | | | | | | | | | | | | | | |
Interest expense | (255 | ) | (242 | ) | (13 | ) | (5.4 | %) | (741 | ) | (714 | ) | (27 | ) | (3.8 | %) |
Interest on post-employment benefit obligations | (17 | ) | (18 | ) | 1 | | 5.6 | % | (51 | ) | (54 | ) | 3 | | 5.6 | % |
Other expense | (41 | ) | (56 | ) | 15 | | 26.8 | % | (190 | ) | (40 | ) | (150 | ) | n.m. | |
Income taxes | (224 | ) | (249 | ) | 25 | | 10.0 | % | (751 | ) | (797 | ) | 46 | | 5.8 | % |
Net earnings | 867 | | 850 | | 17 | | 2.0 | % | 2,331 | | 2,352 | | (21 | ) | (0.9 | %) |
Net earnings attributable to: | | | | | | | | | | | | | | | | |
Common shareholders | 814 | | 803 | | 11 | | 1.4 | % | 2,179 | | 2,210 | | (31 | ) | (1.4 | %) |
Preferred shareholders | 36 | | 31 | | 5 | | 16.1 | % | 107 | | 94 | | 13 | | 13.8 | % |
Non-controlling interest | 17 | | 16 | | 1 | | 6.3 | % | 45 | | 48 | | (3 | ) | (6.3 | %) |
Net earnings | 867 | | 850 | | 17 | | 2.0 | % | 2,331 | | 2,352 | | (21 | ) | (0.9 | %) |
Adjusted net earnings | 861 | | 824 | | 37 | | 4.5 | % | 2,357 | | 2,322 | | 35 | | 1.5 | % |
EPS | 0.90 | | 0.90 | | — | | — | | 2.42 | | 2.48 | | (0.06 | ) | (2.4 | %) |
Adjusted EPS | 0.96 | | 0.91 | | 0.05 | | 5.5 | % | 2.62 | | 2.60 | | 0.02 | | 0.8 | % |
n.m.: not meaningful
TOTAL BCE CONNECTIONS
| Q3 2018 | | Q3 2017 | | % CHANGE | |
Wireless subscribers(1) | 9,487,368 | | 9,008,273 | | 5.3 | % |
Postpaid(1) | 8,728,436 | | 8,243,446 | | 5.9 | % |
Prepaid | 758,932 | | 764,827 | | (0.8 | %) |
High-speed Internet subscribers(1)(2) | 3,904,304 | | 3,763,101 | | 3.8 | % |
TV (Satellite and IPTV subscribers)(2) | 2,843,828 | | 2,825,754 | | 0.6 | % |
IPTV(2) | 1,639,233 | | 1,517,833 | | 8.0 | % |
Total growth services | 16,235,500 | | 15,597,128 | | 4.1 | % |
Wireline residential NAS lines(2) | 3,051,630 | | 3,275,589 | | (6.8 | %) |
Total services(3) | 19,287,130 | | 18,872,717 | | 2.2 | % |
| (1) | At the beginning of Q1 2018, we adjusted our postpaid wireless subscriber base to remove 16,116 subscribers with a corresponding increase to our high-speed Internet subscribers to reflect the transfer of fixed wireless Internet subscribers. |
| (2) | At the beginning of Q1 2018, our high-speed Internet subscriber base was increased by 19,835, our IPTV by 14,599 and our residential NAS by 23,441, mainly as a result of a small acquisition made in Q1 2018. |
| (3) | As of January 1, 2018, business NAS was removed from our NAS subscriber base due to its declining relevance as a KPI given migrations from voice to IP result in NAS losses without a corresponding decline in revenues. Previously reported periods were retroactively adjusted. |
BCE Inc. 2018 THIRD QUARTER SHAREHOLDER REPORT 5 |
|
| | | | |
2 | MD&A | Consolidated financial analysis | |
BCE NET ACTIVATIONS (LOSSES)
| Q3 2018 | | Q3 2017 | | % CHANGE | | YTD 2018 | | YTD 2017 | | % CHANGE | |
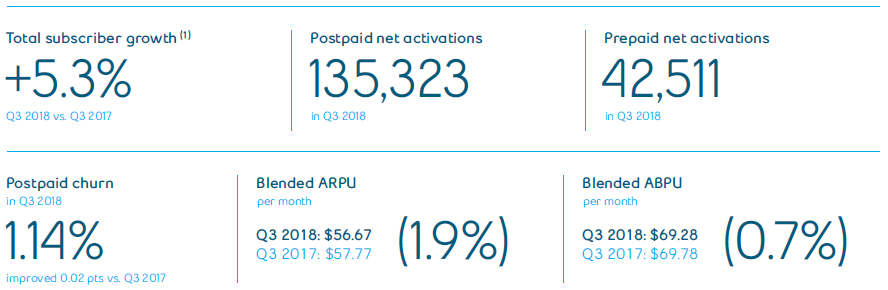
Wireless subscribers | 177,834 | | 106,982 | | 66.2 | % | 336,697 | | 174,570 | | 92.9 | % |
Postpaid | 135,323 | | 117,182 | | 15.5 | % | 325,902 | | 241,575 | | 34.9 | % |
Prepaid | 42,511 | | (10,200 | ) | 516.8 | % | 10,795 | | (67,005 | ) | 116.1 | % |
High-speed Internet subscribers | 47,749 | | 44,424 | | 7.5 | % | 78,212 | | 60,820 | | 28.6 | % |
TV (Satellite and IPTV subscribers) | 8,601 | | 1,738 | | 394.9 | % | (3,071 | ) | (27,262 | ) | 88.7 | % |
IPTV | 40,091 | | 36,399 | | 10.1 | % | 74,317 | | 75,228 | | (1.2 | %) |
Total growth services | 234,184 | | 153,144 | | 52.9 | % | 411,838 | | 208,128 | | 97.9 | % |
Wireline residential NAS lines | (74,921 | ) | (57,387 | ) | (30.6 | %) | (203,119 | ) | (197,813 | ) | (2.7 | %) |
Total services | 159,263 | | 95,757 | | 66.3 | % | 208,719 | | 10,315 | | n.m. | |
n.m.: not meaningful
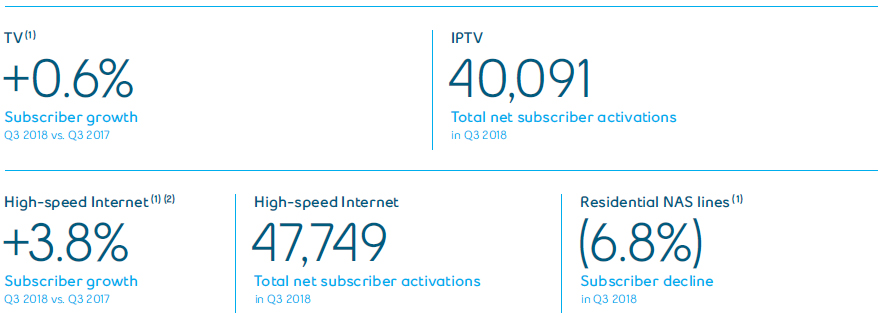
BCE added 234,184 net new customer connections to its growth services in Q3 2018, a 52.9% increase over the 153,144 net new customer connections achieved in Q3 2017. This was comprised of:
- 135,323 postpaid wireless customers and 42,511 prepaid wireless customers
- 47,749 high-speed Internet customers
- 40,091 IPTV customers and 31,490 satellite TV net customer losses
In the first nine months of the year, BCE added 411,838 net new customer connections to its growth services, a 97.9% increase over the 208,128 net new customer connections achieved last year. This consisted of:
- 325,902 postpaid wireless customers and 10,795 prepaid wireless customers
- 78,212 high-speed Internet customers
- 74,317 IPTV customers and 77,388 satellite TV net customer losses
Residential NAS net losses were 74,921 in Q3 2018, and 203,119 in the first nine months of the year, increasing by 30.6% and 2.7%, respectively, over the same periods in 2017.
Total BCE customer connections across all services increased by 2.2% in Q3 2018 compared to last year, driven by an increase in our growth services customer base, moderated by ongoing erosion in residential NAS lines.
At September 30, 2018, BCE customer connections totaled 19,287,130 and consisted of the following:
- 9,487,368 wireless subscribers, up 5.3% compared to Q3 2017, and included 8,728,436 postpaid wireless subscribers, an increase of 5.9% compared to the prior year
- 3,904,304 high-speed Internet subscribers, 3.8% higher year over year
- 2,843,828 total TV subscribers, up 0.6% compared to Q3 2017, and included 1,639,233 IPTV customers, representing an increase of 8.0% year over year
- 3,051,630 residential NAS lines, a decline of 6.8% compared to Q3 2017
| Q3 2018 | | Q3 2017 | | $ CHANGE | | % CHANGE | | YTD 2018 | | YTD 2017 | | $ CHANGE | | % CHANGE | |
Bell Wireless | 2,182 | | 2,061 | | 121 | | 5.9 | % | 6,174 | | 5,777 | | 397 | | 6.9 | % |
Bell Wireline | 3,147 | | 3,088 | | 59 | | 1.9 | % | 9,366 | | 9,182 | | 184 | | 2.0 | % |
Bell Media | 731 | | 723 | | 8 | | 1.1 | % | 2,271 | | 2,270 | | 1 | | — | |
Inter-segment eliminations | (183 | ) | (175 | ) | (8 | ) | (4.6 | %) | (558 | ) | (508 | ) | (50 | ) | (9.8 | %) |
Total BCE operating revenues | 5,877 | | 5,697 | | 180 | | 3.2 | % | 17,253 | | 16,721 | | 532 | | 3.2 | % |
| 6 BCE Inc. 2018 THIRD QUARTER SHAREHOLDER REPORT |
|
| | | | |
| | 2 | MD&A | Consolidated financial analysis |
BCE
Total operating revenues at BCE increased by 3.2% in both Q3 2018 and in the first nine months of the year, compared to the same periods in 2017. Q3 2018 growth resulted from increases across all three of our segments. The first nine months of the year were favourably impacted by growth in both our Bell Wireless and Bell Wireline segments, while our Bell Media segment remained stable year-over-year. Service revenues of $5,117 million in Q3 2018 and $15,210 million in the first nine months of the year, grew by 1.2% and 1.8%, respectively, over the same periods last year. Product revenues of $760 million in Q3 2018 and $2,043 million in the first nine months of 2018, increased by 18.2% and 14.9%, respectively, over the same periods last year.
BELL WIRELESS
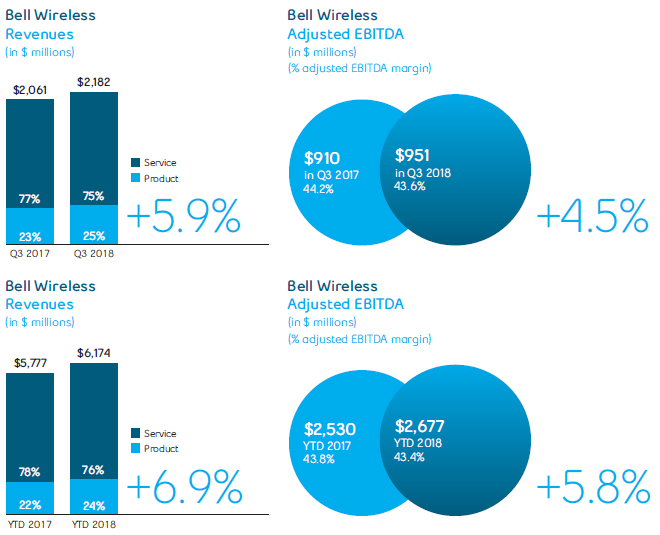
Bell Wireless operating revenues increased by 5.9% in Q3 2018 and by 6.9% for the first nine months of the year, compared to the same periods in 2017, driven by growth in both service and product revenues. Service revenues grew by 2.5% in the current quarter and by 4.0% year to date, compared to the same periods last year, due to the continued expansion of our postpaid subscriber base moderated by lower blended ARPU. The decrease in blended ARPU was driven by a decline in voice and data overages due to greater customer adoption of plans with higher usage thresholds, lower ARPU generated from the long-term mobile services contract with Shared Services Canada and the dilutive impact on blended ARPU from the continued ramp-up in prepaid customers from Lucky Mobile. The growth in year-to-date service revenues also benefited from the acquisition of MTS in March 2017, offset in part by the unfavourable retroactive impact of the Canadian Radio-television and Telecommunications Commission (CRTC) decision on wholesale wireless domestic roaming rates of $14 million. Product revenues increased by 17.2% in this quarter and by 17.3% for the first nine months of the year, compared to the same periods last year, due to increased sales of premium devices with higher retail handset prices, combined with higher sales volumes due to greater gross activations and upgrades.
BELL WIRELINE
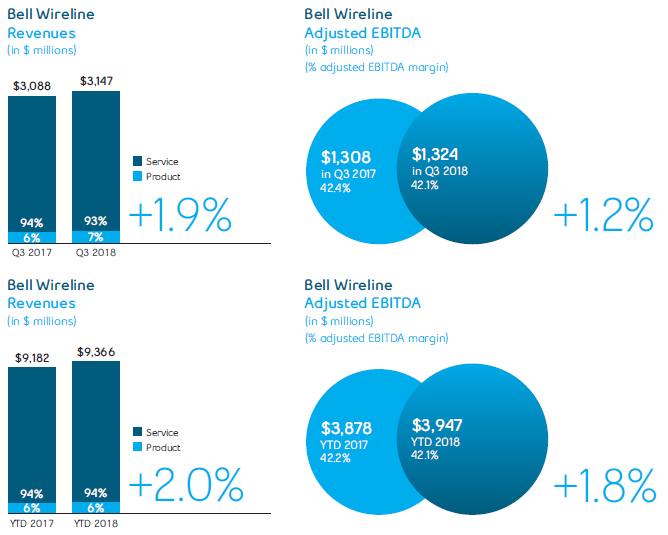
Bell Wireline operating revenues increased by 1.9% in the third quarter of 2018 and by 2.0% in the first nine months of the year, compared to the same periods last year, attributable to service revenue growth of 0.8% and 1.6%, respectively, as well as product revenue growth of 20.1% and 9.3%, respectively. The increase in service revenues was driven by the ongoing growth in Internet and IPTV revenues, as well as greater IP-based and business solutions services revenues. This was moderated by continued erosion in our voice, satellite TV and legacy data services, combined with higher residential customer acquisition, retention and bundle discounts to match aggressive offers from cable competitors. The increase in product revenues was driven by greater demand by large business customers for telecommunications equipment, which resulted in overall revenue growth for our business markets. Year-to-date revenues were also favourably impacted by the acquisition of MTS.
BELL MEDIA
Bell Media operating revenues increased by 1.1%, in Q3 2018 and remained essentially unchanged in the first nine months of the year, compared to the same periods in 2017. This reflected higher year-over-year advertising revenues in Q3 2018, mainly from specialty TV led by the broadcast of the 2018 Fédération Internationale de Football Association (FIFA) World Cup. This more than offset the impact of overall viewership declines and the ongoing shift in customer spending to over-the-top (OTT) and digital platforms, which unfavourably impacted conventional TV and radio. The increase in subscriber revenues also favourably impacted operating revenues, mainly due to continued growth in our CraveTV and TV Everywhere GO products as well as the contribution from TSN and RDS Direct, our direct-to-consumer sports streaming services that launched in June 2018, along with rate increases to certain broadcasting distribution undertakings (BDUs), offset in part by lower subscriber levels. In the first nine months of the year, advertising revenues declined, as compared to the same period in 2017, reflecting the shift in advertising dollars in Q1 2018 to the main broadcaster of the PyeongChang 2018 Winter Olympics, moderated by higher out-of-home (OOH) advertising revenues from increased demand on digital faces.
| Q3 2018 | | Q3 2017 | | $ CHANGE | | % CHANGE | | YTD 2018 | | YTD 2017 | | $ CHANGE | | % CHANGE | |
Bell Wireless | (1,231 | ) | (1,151 | ) | (80 | ) | (7.0 | %) | (3,497 | ) | (3,247 | ) | (250 | ) | (7.7 | %) |
Bell Wireline | (1,823 | ) | (1,780 | ) | (43 | ) | (2.4 | %) | (5,419 | ) | (5,304 | ) | (115 | ) | (2.2 | %) |
Bell Media | (549 | ) | (536 | ) | (13 | ) | (2.4 | %) | (1,754 | ) | (1,725 | ) | (29 | ) | (1.7 | %) |
Inter-segment eliminations | 183 | | 175 | | 8 | | 4.6 | % | 558 | | 508 | | 50 | | 9.8 | % |
Total BCE operating costs | (3,420 | ) | (3,292 | ) | (128 | ) | (3.9 | %) | (10,112 | ) | (9,768 | ) | (344 | ) | (3.5 | %) |
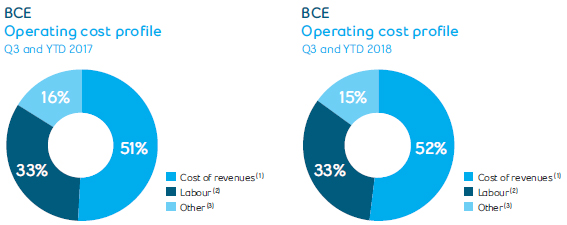
| (1) | Cost of revenues includes costs of wireless devices and other equipment sold, network and content costs, and payments to other carriers. |
| (2) | Labour costs (net of capitalized costs) include wages, salaries and related taxes and benefits, post-employment benefit plans service cost, and other labour costs, including contractor and outsourcing costs. |
| (3) | Other operating costs include marketing, advertising and sales commission costs, bad debt expense, taxes other than income taxes, information technology (IT) costs, professional service fees and rent. |
BCE Inc. 2018 THIRD QUARTER SHAREHOLDER REPORT 7 |
|
| | | | |
2 | MD&A | Consolidated financial analysis | |
BCE
Total BCE operating costs increased by 3.9% in Q3 2018 and by 3.5% in the first nine months of the year, compared to the same periods in 2017, attributable to higher costs across all three of our segments.
BELL WIRELESS
Bell Wireless operating costs increased by 7.0% in Q3 2018 and by 7.7% year to date, compared to the same periods in 2017, as a result of:
Higher product cost of goods sold from increased sales volumes and handset costs
Increased network operating costs driven by the expansion of network capacity to support subscriber growth and higher data consumption
Greater labour costs to support key initiatives and growth of the business
These factors were partially offset by lower advertising spend.
Year-to-date operating costs also reflected higher costs related to the acquisition of MTS.
BELL WIRELINE
Bell Wireline operating costs increased by 2.4% in Q3 2018 and by 2.2% in the first nine months of the year, compared to the same periods in 2017, mainly driven by higher cost of goods sold resulting from increased product sales and greater payments to other carriers in the quarter, driven by higher sales of international long distance minutes. In the first nine months of the year, operating costs were further pressured by the acquisition of MTS, higher pension expense due to a gain in Q1 2017 on post-employment benefit expense related to an alignment of certain Bell Aliant defined benefit (DB) pension plans with those of Bell Canada, contractual programming rate increases in our TV business and increased advertising spend in Q1 2018 during the PyeongChang 2018 Winter Olympics.
BELL MEDIA
Bell Media operating costs increased by 2.4% in Q3 2018 and by 1.7% in the first nine months of the year, compared to the corresponding periods last year, due to the continued escalation of programming and content costs for sports broadcast rights, primarily relating to the 2018 FIFA World Cup, ongoing content expansion for CraveTV, as well as deal renewals for specialty TV programming.
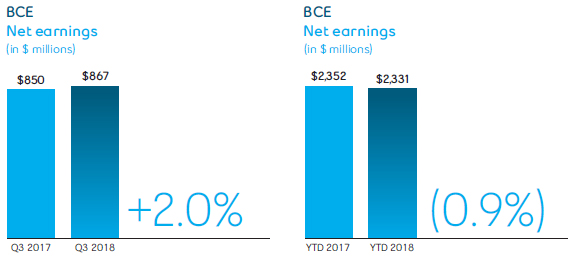
Net earnings increased by 2.0% in the third quarter of 2018, compared to the same period last year, due to higher adjusted EBITDA, as growing revenues more than offset an increase in operating costs, lower income taxes and lower other expense, partly offset by higher severance, acquisition and other costs, higher depreciation and amortization expense and higher finance costs.
Year to date, net earnings of $2,331 million decreased by 0.9%, compared to the same period last year, due to higher other expense, higher depreciation and amortization expense and higher finance costs, partly offset by higher adjusted EBITDA, as growing revenues more than offset an increase in operating costs, lower severance, acquisition and other costs and lower income taxes.
| 8 BCE Inc. 2018 THIRD QUARTER SHAREHOLDER REPORT |
|
| | | | |
| | 2 | MD&A | Consolidated financial analysis |
| Q3 2018 | | Q3 2017 | | $ CHANGE | | % CHANGE | | YTD 2018 | | YTD 2017 | | $ CHANGE | | % CHANGE | |
Bell Wireless | 951 | | 910 | | 41 | | 4.5 | % | 2,677 | | 2,530 | | 147 | | 5.8 | % |
Bell Wireline | 1,324 | | 1,308 | | 16 | | 1.2 | % | 3,947 | | 3,878 | | 69 | | 1.8 | % |
Bell Media | 182 | | 187 | | (5 | ) | (2.7 | %) | 517 | | 545 | | (28 | ) | (5.1 | %) |
Total BCE adjusted EBITDA | 2,457 | | 2,405 | | 52 | | 2.2 | % | 7,141 | | 6,953 | | 188 | | 2.7 | % |
BCE
BCE’s adjusted EBITDA grew by 2.2% in Q3 2018 and by 2.7% in the first nine months of the year, compared to the same periods last year, driven by growth in both our Bell Wireless and Bell Wireline segments, offset in part by a decline in our Bell Media segment. Adjusted EBITDA margin declined by 0.4 pts to 41.8% in Q3 2018 and by 0.2 pts to 41.4% in the first nine months of the year, over the same periods last year, driven by a higher proportion of low-margin product sales in our total revenue base.
The year-over-year increase in adjusted EBITDA was driven by growth across wireless, Internet, IPTV, IP-based and business solutions services and media revenues, coupled with ongoing disciplined cost management. This was moderated by the continued erosion in our voice, satellite TV and legacy data revenues, increased cost of goods sold and escalating programming and content costs. Additionally, the first nine months of the year were favourably impacted by the contribution from the acquisition of MTS, offset in part by higher pension expense due to a gain realized in Q1 2017 and lower Bell Media advertising revenues.
BELL WIRELESS
Bell Wireless adjusted EBITDA increased by 4.5% in Q3 2018 and by 5.8% year to date, compared to the same periods in 2017, due to the flow-through of the revenue growth, offset in part by higher operating expenses. The first nine months of the year also benefited from the acquisition of MTS, moderated by the unfavourable retroactive impact of the CRTC decision on wholesale wireless domestic roaming rates of $14 million.
BELL WIRELINE
Bell Wireline adjusted EBITDA grew by 1.2% in Q3 2018 and by 1.8% during the first nine months of the year, compared to the same periods last year, driven by increased revenues, moderated by higher operating expenses. Additionally, the first nine months of the year were favourably impacted by the acquisition of MTS, offset in part by higher pension expense as a result of a gain realized in Q1 2017.
BELL MEDIA
Bell Media adjusted EBITDA decreased by 2.7% in Q3 2018 and by 5.1% in the first nine months of the year, compared to the same periods in 2017, as the increase in operating revenues was more than offset by higher operating expenses.
| 2.7 Severance, acquisition and other costs |
2018
Severance, acquisition and other costs of $54 million in the third quarter of 2018 and $78 million on a year-to-date basis included:
- Severance costs of $52 million in Q3 2018 and $76 million on a year-to-date basis, for workforce reduction initiatives including a 4% reduction in management workforce across BCE
- Acquisition and other costs of $2 million in Q3 2018 and on a year-to-date basis, including transaction costs, such as legal and financial advisory fees, related to completed or potential acquisitions
2017
Severance, acquisition and other costs of $23 million in the third quarter of 2017 and $143 million on a year-to-date basis included:
- Severance costs related to workforce reduction initiatives of $14 million in Q3 2017 and $61 million on a year-to-date basis
- Acquisition and other costs of $9 million in Q3 2017 and $82 million on a year-to-date basis, including transaction costs, such as legal and financial advisory fees, related to completed or potential acquisitions, severance and integration costs relating to the MTS acquisition as well as a loss on sale of spectrum licences to Xplornet Communications Inc. incurred in Q1 2017
BCE Inc. 2018 THIRD QUARTER SHAREHOLDER REPORT 9 |
|
| | | | |
2 | MD&A | Consolidated financial analysis | |
| 2.8 Depreciation and amortization |
DEPRECIATION
Depreciation in the third quarter and on a year-to-date basis in 2018 increased by $19 million and $95 million, respectively, compared to the same periods in 2017, mainly due to a higher asset base as we continued to invest in our broadband and wireless networks as well as our IPTV service. The year-to-date increase in depreciation also reflects the acquisition of MTS.
AMORTIZATION
Amortization in the third quarter and on a year-to-date basis in 2018 increased by $13 million and $51 million, respectively, compared to the same periods in 2017, mainly due to a higher asset base. The year-to-date increase in amortization also reflects the acquisition of MTS.
INTEREST EXPENSE
Interest expense in the third quarter of 2018 and on a year-to-date basis in 2018 increased by $13 million and $27 million, respectively, compared to the same periods last year, mainly as a result of higher average debt levels and higher interest rates. The year-to-date increase in interest expense also reflects the acquisition of MTS.
INTEREST ON POST-EMPLOYMENT BENEFIT OBLIGATIONS
Interest on our post-employment benefit obligations is based on market conditions that existed at the beginning of the year. On January 1, 2018, the discount rate was 3.6% compared to 4.0% on January 1, 2017.
In the third quarter of 2018 and on a year-to-date basis in 2018, interest expense on post-employment benefit obligations decreased by $1 million and $3 million, respectively, compared to the same periods last year, due to a lower discount rate, partly offset by a higher post-employment benefit obligation at the beginning of the year.
The impacts of changes in market conditions during the year are recognized in other comprehensive income (loss) (OCI).
2018
Other expense of $41 million in the third quarter of 2018 included losses from our equity investments and net mark-to-market losses on derivatives used to economically hedge equity settled share-based compensation plans.
Other expense of $190 million on a year-to-date basis in 2018 included net mark-to-market losses on derivatives used to economically hedge equity settled share-based compensation plans, losses from our equity investments, which included BCE’s share of an obligation to repurchase at fair value the minority interest in one of BCE’s joint ventures, and early debt redemption costs.
2017
Other expense of $56 million in the third quarter of 2017 included losses from our equity investments and early debt redemption costs.
Other expense of $40 million on a year-to-date basis in 2017 included losses on retirements and disposals of property, plant and equipment and intangible assets, early debt redemption costs, losses on investments and losses from our equity investments, partly offset by net mark-to-market gains on derivatives used to economically hedge equity settled share-based compensation plans.
Income taxes in the third quarter and on a year-to-date basis in 2018 decreased by $25 million and $46 million, respectively, compared to the same periods last year, due to lower taxable income and a higher value of uncertain tax positions favourably resolved in 2018 compared to 2017.
| 10 BCE Inc. 2018 THIRD QUARTER SHAREHOLDER REPORT |
|
| | | | |
| | 2 | MD&A | Consolidated financial analysis |
| 2.12 Net earnings attributable to common shareholders and EPS |
Net earnings attributable to common shareholders of $814 million in the third quarter of 2018 increased by $11 million, compared to the same period last year, due to higher adjusted EBITDA, as growing revenues more than offset an increase in operating costs, lower income taxes and lower other expense, partly offset by higher severance, acquisition and other costs, higher depreciation and amortization expense and higher finance costs.
Year to date, net earnings attributable to common shareholders of $2,179 million decreased by $31 million, compared to the same period last year, due to higher other expense, higher depreciation and amortization expense and higher finance costs, partly offset by higher adjusted EBITDA, as growing revenues more than offset an increase in operating costs, lower severance, acquisition and other costs and lower income taxes.
BCE’s EPS of $0.90 in Q3 2018 remained stable compared to the same period last year and decreased by $0.06 on a year-to-date basis in 2018 to $2.42.
Excluding the impact of severance, acquisition and other costs, net mark-to-market (losses) gains on derivatives used to economically hedge equity settled share-based compensation plans, net (losses) gains on investments, early debt redemption costs and impairment charges, adjusted net earnings in the third quarter of 2018 was $861 million, or $0.96 per common share, compared to $824 million, or $0.91 per common share, for the same period last year. Adjusted net earnings in the first nine months of 2018 was $2,357 million, or $2.62 per common share, compared to $2,322 million, or $2.60 per common share, for the first nine months of 2017.
BCE Inc. 2018 THIRD QUARTER SHAREHOLDER REPORT 11 |
|
| | | | |
3 | MD&A | Business segment analysis
Bell Wireless | |
| 3 Business segment analysis |
KEY BUSINESS DEVELOPMENTS
LTE ADVANCED WIRELESS COVERAGE EXTENDED IN SOUTHEASTERN MANITOBA
Bell MTS announced the latest expansion of its leading long-term evolution (LTE) Advanced (LTE-A) wireless coverage in Manitoba, extending wireless service to the Southeastern communities of Stuartburn, Woodridge and Zhoda. Part of the $1 billion Bell MTS infrastructure investment plan for the province, this service expansion offers residents and businesses in Southeastern Manitoba access to the latest evolution of broadband wireless technology. LTE-A wireless service became available in Woodridge in September 2018, and will launch in Stuartburn and Zhoda in 2019.
MOBILE DEVICE LINEUP EXPANDED
Bell Mobility’s extensive device lineup continued to expand in Q3 2018 with the addition of a number of new Fourth Generation (4G) LTE and LTE-A devices from leading handset manufacturers, including the Samsung Galaxy Note 9 smartphone, the LG Q Stylo+ smartphone, Apple’s iPhone Xs and Xs Max and the Apple Watch Series 4. Additionally, Apple’s iPhone XR was available to pre-order on October 19.
PARTNERSHIP WITH FORD IN NEW CONNECTED CAR INITIATIVE
Bell is the first Canadian wireless service provider to enable built-in wireless fidelity (Wi-Fi) hotspots in supported Ford and Lincoln vehicles with Bell’s Connected Car – Built In service. Available vehicle diagnostics services will also be supported on Bell’s national LTE network. Ideal for mobile workers, commuters and long family trips, Connected Car enables passengers to browse, stream and share on Bell’s broadband LTE wireless network when they are on the road or nearby the vehicle when it is parked. The Wi-Fi hotspot features a dedicated external antenna, supports up to 10 devices at a time, and is powered by the vehicle’s electrical system rather than the device battery. Connected Car is the next evolution in the smart vehicle experience and part of Bell’s Internet of Things leadership to enable the connected vehicles, homes, businesses and smart cities of the future.
| FINANCIAL PERFORMANCE ANALYSIS |
Q3 2018 PERFORMANCE HIGHLIGHTS
| 12 BCE Inc. 2018 THIRD QUARTER SHAREHOLDER REPORT |
|
| | | | |
| | 3 | MD&A | Business segment analysis
Bell Wireless |
| (1) | At the beginning of Q1 2018, we adjusted our postpaid wireless subscriber base to remove 16,116 subscribers with a corresponding increase to our high-speed Internet subscribers to reflect the transfer of fixed wireless Internet subscribers. |
BELL WIRELESS RESULTS
REVENUES
| Q3 2018 | | Q3 2017 | | $ CHANGE | | % CHANGE | | YTD 2018 | | YTD 2017 | | $ CHANGE | | % CHANGE | |
External service revenues | 1,618 | | 1,580 | | 38 | | 2.4 | % | 4,680 | | 4,503 | | 177 | | 3.9 | % |
Inter-segment service revenues | 12 | | 10 | | 2 | | 20.0 | % | 36 | | 31 | | 5 | | 16.1 | % |
Total operating service revenues | 1,630 | | 1,590 | | 40 | | 2.5 | % | 4,716 | | 4,534 | | 182 | | 4.0 | % |
External product revenues | 552 | | 469 | | 83 | | 17.7 | % | 1,456 | | 1,240 | | 216 | | 17.4 | % |
Inter-segment product revenues | — | | 2 | | (2 | ) | (100.0 | %) | 2 | | 3 | | (1 | ) | (33.3 | %) |
Total operating product revenues | 552 | | 471 | | 81 | | 17.2 | % | 1,458 | | 1,243 | | 215 | | 17.3 | % |
Total Bell Wireless revenues | 2,182 | | 2,061 | | 121 | | 5.9 | % | 6,174 | | 5,777 | | 397 | | 6.9 | % |
Bell Wireless operating revenuesgrew by 5.9% in Q3 2018 and 6.9% in the first nine months of the year, compared to the same periods in 2017, driven by both higher service and product revenues.
- Service revenuesincreased by 2.5% in the current quarter and by 4.0% year to date, compared to the same periods in 2017, due to the continued expansion of our postpaid subscriber base moderated by lower blended ARPU. The growth in year-to-date service revenues also benefited from the acquisition of MTS, offset in part by the unfavourable retroactive impact of the CRTC decision on wholesale wireless domestic roaming rates of $14 million.
- Product revenuesincreased by 17.2% in this quarter and by 17.3% for the first nine months of the year, compared to the same periods in 2017, due to increased sales of premium devices with higher retail handset prices, combined with higher sales volumes due to greater gross activations and upgrades.
OPERATING COSTS AND ADJUSTED EBITDA
| Q3 2018 | | Q3 2017 | | $ CHANGE | | % CHANGE | | YTD 2018 | | YTD 2017 | | $ CHANGE | | % CHANGE | |
Operating costs | (1,231 | ) | (1,151 | ) | (80 | ) | (7.0 | %) | (3,497 | ) | (3,247 | ) | (250 | ) | (7.7 | %) |
Adjusted EBITDA | 951 | | 910 | | 41 | | 4.5 | % | 2,677 | | 2,530 | | 147 | | 5.8 | % |
Total adjusted EBITDA margin | 43.6 | % | 44.2 | % | | | (0.6 | ) pts | 43.4 | % | 43.8 | % | | | (0.4 | ) pts |
Bell Wireless operatingcosts increased by 7.0% in Q3 2018 and by 7.7% year to date, compared to the same periods in 2017, as a result of:
- Higher product cost of goods sold from increased sales volumes and handset costs
- Increased network operating costs driven by the expansion of network capacity to support subscriber growth and higher data consumption
- Greater labour costs to support key initiatives and growth of the business
These factors were partially offset by lower advertising spend.
Year-to-date operating costs also reflected higher costs related to the acquisition of MTS.
Bell Wireless adjusted EBITDAincreased by 4.5% in Q3 2018 and by 5.8% year to date, compared to the same periods in 2017, due to the flow-through of the revenue growth, offset in part by higher operating expenses. The first nine months of the year also benefited from the acquisition of MTS, moderated by the unfavourable retroactive impact of the CRTC decision on wholesale wireless domestic roaming rates of $14 million. Adjusted EBITDA margin, based on wireless operating revenues, declined by 0.6 pts in Q3 2018 and by 0.4 pts year-to-date, compared to the same periods in 2017, driven by the greater proportion of low-margin product sales in our total revenue base.
BCE Inc. 2018 THIRD QUARTER SHAREHOLDER REPORT 13 |
|
| | | | |
3 | MD&A | Business segment analysis
Bell Wireless | |
BELL WIRELESS OPERATING METRICS
| Q3 2018 | | Q3 2017 | | CHANGE | | % CHANGE | | YTD 2018 | | YTD 2017 | | CHANGE | | % CHANGE | |
Blended ARPU ($/month) | 56.67 | | 57.77 | | (1.10 | ) | (1.9 | %) | 55.50 | | 55.92 | | (0.42 | ) | (0.8 | %) |
Blended average billing per user (ABPU) ($/month) | 69.28 | | 69.78 | | (0.50 | ) | (0.7 | %) | 67.86 | | 67.60 | | 0.26 | | 0.4 | % |
Gross activations | 535,647 | | 460,053 | | 75,594 | | 16.4 | % | 1,408,589 | | 1,211,923 | | 196,666 | | 16.2 | % |
Postpaid | 426,719 | | 390,985 | | 35,734 | | 9.1 | % | 1,168,174 | | 1,026,993 | | 141,181 | | 13.7 | % |
Prepaid | 108,928 | | 69,068 | | 39,860 | | 57.7 | % | 240,415 | | 184,930 | | 55,485 | | 30.0 | % |
Net activations (losses) | 177,834 | | 106,982 | | 70,852 | | 66.2 | % | 336,697 | | 174,570 | | 162,127 | | 92.9 | % |
Postpaid | 135,323 | | 117,182 | | 18,141 | | 15.5 | % | 325,902 | | 241,575 | | 84,327 | | 34.9 | % |
Prepaid | 42,511 | | (10,200 | ) | 52,711 | | 516.8 | % | 10,795 | | (67,005 | ) | 77,800 | | 116.1 | % |
Blended churn % (average per month) | 1.27 | % | 1.32 | % | | | 0.05 | pts | 1.29 | % | 1.31 | % | | | 0.02 | pts |
Postpaid | 1.14 | % | 1.16 | % | | | 0.02 | pts | 1.13 | % | 1.14 | % | | | 0.01 | pts |
Prepaid | 2.76 | % | 2.95 | % | | | 0.19 | pts | 3.17 | % | 3.15 | % | | | (0.02 | ) pts |
Subscribers(1) | 9,487,368 | | 9,008,273 | | 479,095 | | 5.3 | % | 9,487,368 | | 9,008,273 | | 479,095 | | 5.3 | % |
Postpaid(1) | 8,728,436 | | 8,243,446 | | 484,990 | | 5.9 | % | 8,728,436 | | 8,243,446 | | 484,990 | | 5.9 | % |
Prepaid | 758,932 | | 764,827 | | (5,895 | ) | (0.8 | %) | 758,932 | | 764,827 | | (5,895 | ) | (0.8 | %) |
| (1) | At the beginning of Q1 2018, we adjusted our postpaid wireless subscriber base to remove 16,116 subscribers with a corresponding increase to our high-speed Internet subscribers to reflect the transfer of fixed wireless Internet subscribers. |
Blended ARPUof $56.67 decreased by 1.9 % in Q3 2018 and by 0.8% year to date, compared to the same periods in 2017, driven by a decline in voice and data overages due to greater customer adoption of plans with higher usage thresholds, lower ARPU generated from the contract with Shared Services Canada and the dilutive impact on blended ARPU from the continued ramp-up in prepaid customers from Lucky Mobile. A larger proportion of premium smartphone devices in our sales mix combined with higher retail handset prices resulted in a greater allocation of revenues to product revenues, thereby unfavourably impacting blended ARPU. This decline was moderated by a higher postpaid subscriber mix, the flow-through of 2017 and 2018 pricing changes, and more customers moving to higher-value monthly plans with greater data allotments.
Blended ABPUapproximates the average amount billed to customers on a monthly basis and is the same as blended ARPU prior to the adoption of IFRS 15. Blended ABPU of $69.28 decreased by 0.7% in Q3 2018, compared to the same period last year and was similarly impacted by the items affecting ARPU. However, since ABPU is based on average billing, it is not impacted by the greater allocation to product revenues. Year to date blended ABPU of $67.86 increased by 0.4%, compared to the same period last year, as the higher postpaid subscriber mix, the flow-through of 2017 and 2018 pricing changes and more customers moving to higher-value monthly plans with larger data allotments more than offset the pressures described above.
Total gross wireless activationsincreased by 16.4% in the third quarter of 2018 and by 16.2% year to date, compared to the same periods in 2017, due to both higher postpaid and prepaid gross activations.
- Postpaid gross activationsincreased by 9.1% in Q3 2018 and by 13.7% for the first nine months of the year, driven by the continued on-boarding of customers from the contract with Shared Services Canada, our mobile network speed and technology leadership and the effective sales execution across our retail channels
- Prepaid gross activationsincreased by 57.7% in the current quarter and by 30.0% year to date, driven by the continued ramp-up from Lucky Mobile
Blended wireless churnof 1.27% improved by 0.05 pts in Q3 2018 reflecting both lower postpaid and prepaid churn. In the first nine months of the year, blended churn improved by 0.02 pts to 1.29%, driven by lower postpaid churn.
- Postpaid churnimproved by 0.02 pts to 1.14% in the current quarter and by 0.01 pts to 1.13%, year to date, driven by our ongoing investment in network speeds and customer retention
- Prepaid churnof 2.76% improved by 0.19 pts in this quarter, due to the favourable impact on the subscriber base from the ramp-up of Lucky Mobile. Conversely, for the first nine months of the year, prepaid churn of 3.17% increased by 0.02 pts reflecting a declining subscriber base, offset in part by lower deactivations.
Postpaid net activationsincreased by 15.5% in the third quarter of 2018 and by 34.9% year to date, compared to the same periods in 2017, due to an increase in gross activations, partially offset by higher customer deactivations.
Prepaid net activationsimproved significantly in Q3 2018 and year to date, compared to the same periods in 2017, due to higher gross activations and less customer deactivations.
Wireless subscribers at September 30, 2018 totaled 9,487,368, up 5.3% from 9,008,273 subscribers reported at the end of Q3 2017. The proportion of Bell Wireless customers subscribing to postpaid services increased by 0.5 pts to 92.0% in Q3 2018, compared to 91.5% in the prior year.
| 14 BCE Inc. 2018 THIRD QUARTER SHAREHOLDER REPORT |
|
| | | | |
| | 3 | MD&A | Business segment analysis
Bell Wireless |
As at the date of this MD&A, our forward-looking statements set out in the BCE 2017 Annual MD&A, as updated or supplemented in the BCE 2018 First Quarter MD&A, in the BCE 2018 Second Quarter MD&A and in this MD&A, are based on certain assumptions including, without limitation, the following assumptions and the assumptions referred to in each of the other business segment discussions set out in this section 3,Business segment analysis, as well as the economic and market assumptions referred to in section 1.3,Assumptions, of this MD&A.
- Maintain our market share of incumbent wireless postpaid net additions
- Continued adoption of smartphone devices, tablets and data applications, as well as the introduction of more 4G LTE and LTE-A devices and new data services
- Higher handset cost, driven by a higher sales mix of premium devices, increased new customer activations and more customer device upgrades attributable to a higher number of off-contract subscribers due to earlier expiries under two-year contracts
- Wireless revenue growth driven by postpaid subscriber base expansion and a higher volume of handset sales
- Expansion of the LTE-A network coverage to approximately 92% of the Canadian population
- Ability to monetize increasing data usage and customer subscriptions to new data services
- Ongoing technological improvements by handset manufacturers and from faster data network speeds that allow customers to optimize the use of our services
- No material financial, operational or competitive consequences of changes in regulations affecting our wireless business
BCE Inc. 2018 THIRD QUARTER SHAREHOLDER REPORT 15 |
|
| | | | |
3 | MD&A | Business segment analysis
Bell Wireline | |
KEY BUSINESS DEVELOPMENTS
FIBE INTERNET TOP SPEED INCREASED TO INDUSTRY-LEADING 1.5 GIGABITS PER SECOND
Bell increased Fibe Internet access speeds to 1.5 Gigabits per second (Gbps), the fastest access speed to the home available in Canada. Unlimited Gigabit Fibe 1.5 service is now available in Ontario and Québec and is expected to be launched in the Atlantic provinces in November. Delivered over Bell’s fibre-to-the-premises (FTTP) network and leveraging the powerful Home Hub 3000 modem/router already used by most Bell FTTP customers, the enhanced Internet service offers total download speeds of up to 1.5 Gbps and uploads of up to 940 Megabits per second (Mbps).
Bell’s rapidly expanding broadband fibre network is Canada’s most extensive, covering a total of more than 9.5 million homes and businesses in 7 provinces, including approximately 4.4 million locations served by direct FTTP connections at the end of Q3 2018, up from approximately 3.7 million at the end of 2017.
ROLL OUT OF HIGH-SPEED BROADBAND INTERNET SERVICE IN RURAL COMMUNITIES
Following successful wireless-to-the-home (WTTH) trials in the 3.5 Gigahertz (GHz) and 28 GHz spectrum bands utilizing Fifth Generation (5G)-oriented Massive Multiple Input Multiple Output and 8T8R technology earlier this year, Bell began the buildout of WTTH to rural locations in the second quarter of 2018 with plans to rollout service to 30 rural communities by the end of 2018. Bell’s WTTH solution is expected to deliver broadband speeds of 25 to 50 Mbps, or up to 10 times faster than average speeds currently available in these areas. At the end of the third quarter of 2018, Bell’s WTTH footprint encompassed 16 communities covering approximately 12,000 homes. Innovation in WTTH complements Bell’s extensive broadband fibre build in urban markets, and our deployment of WTTH in rural locations underscores our focus on full utilization of Bell’s assigned wireless spectrum resources.
BELL LAUNCHES CANADA’S FIRST CLOUD-BASED VIRTUAL NETWORK SERVICES PLATFORM
On October 18, 2018, Bell launched its new Virtual Network Services (VNS) platform, which offers enterprise business customers a catalogue of on-demand network functions that reside securely in Bell’s private cloud. The first of its kind in Canada, Bell VNS responds to customers’ on-demand needs by transforming and centralizing hardware-based networks in virtualized, software-driven networks. Bell also announced it will be the first Canadian service provider to offer a managed software-defined wide area network (SD-WAN) solution powered by Cisco Viptela, the first Virtual Network Function offered on the Bell VNS platform. Bell VNS is an end-to-end managed solution for enterprise customers across Canada.
| FINANCIAL PERFORMANCE ANALYSIS |
Q3 2018 PERFORMANCE HIGHLIGHTS
| 16 BCE Inc. 2018 THIRD QUARTER SHAREHOLDER REPORT |
|
| | | | |
| | 3 | MD&A | Business segment analysis
Bell Wireline |
| (1) | At the beginning of Q1 2018, our high-speed Internet subscriber base was increased by 19,835, our IPTV by 14,599 and our residential NAS by 23,441, mainly as a result of a small acquisition made in Q1 2018. |
| (2) | At the beginning of Q1 2018, we adjusted our high-speed Internet subscriber base to add 16,116 subscribers with a corresponding decrease to our postpaid wireless subscribers to reflect the transfer of fixed wireless Internet subscribers. |
BELL WIRELINE RESULTS
REVENUES
| Q3 2018 | | Q3 2017 | | $ CHANGE | | % CHANGE | | YTD 2018 | | YTD 2017 | | $ CHANGE | | % CHANGE | |
Data | 1,867 | | 1,817 | | 50 | | 2.8 | % | 5,556 | | 5,348 | | 208 | | 3.9 | % |
Voice | 950 | | 994 | | (44 | ) | (4.4 | %) | 2,857 | | 2,995 | | (138 | ) | (4.6 | %) |
Other services | 60 | | 52 | | 8 | | 15.4 | % | 187 | | 151 | | 36 | | 23.8 | % |
Total external service revenues | 2,877 | | 2,863 | | 14 | | 0.5 | % | 8,600 | | 8,494 | | 106 | | 1.2 | % |
Inter-segment service revenues | 61 | | 51 | | 10 | | 19.6 | % | 177 | | 149 | | 28 | | 18.8 | % |
Total operating service revenues | 2,938 | | 2,914 | | 24 | | 0.8 | % | 8,777 | | 8,643 | | 134 | | 1.6 | % |
Data | 111 | | 79 | | 32 | | 40.5 | % | 313 | | 273 | | 40 | | 14.7 | % |
Equipment and other | 97 | | 95 | | 2 | | 2.1 | % | 274 | | 265 | | 9 | | 3.4 | % |
Total external product revenues | 208 | | 174 | | 34 | | 19.5 | % | 587 | | 538 | | 49 | | 9.1 | % |
Inter-segment product revenues | 1 | | — | | 1 | | n.m. | | 2 | | 1 | | 1 | | 100.0 | % |
Total operating product revenues | 209 | | 174 | | 35 | | 20.1 | % | 589 | | 539 | | 50 | | 9.3 | % |
Total Bell Wireline revenues | 3,147 | | 3,088 | | 59 | | 1.9 | % | 9,366 | | 9,182 | | 184 | | 2.0 | % |
n.m.: not meaningful
Bell Wireline operating revenuesincreased by 1.9% in Q3 2018 and by 2.0% in the first nine months of 2018, compared to the same periods last year, attributable to growth in data, other services and product revenues, offset in part by the continued erosion of voice revenues.
Bell Wireline operating service revenuesgrew by 0.8% and by 1.6% in Q3 2018 and the first nine months of the year, respectively, compared to the same periods last year.
- Data revenuesincreased by 2.8% in Q3 2018 and by 3.9% during the first nine months of the year, compared to the same periods last year, resulting from growth in Internet and IPTV subscribers, the flow-through of 2017 and 2018 pricing changes, as well as greater IP-based and business solutions services revenues. This was partly offset by increased acquisition, retention and bundle discounts on residential services due to aggressive offers from cable competitors, the ongoing decline in our satellite TV subscriber base, as well as continued legacy data erosion due in part to migrations to IP-based services along with competitive pricing pressures in our business markets. Additionally, year-to-date revenues were favourably impacted by the acquisition of MTS.
- Voice revenuesdeclined by 4.4% in Q3 2018 and by 4.6% in the first nine months of the year, compared to the same periods in 2017, reflecting ongoing NAS line erosion due to technological substitution to wireless and Internet-based services, large business customer conversions to IP-based data services combined with competitive pricing pressures, and long distance rate pressure in our residential market from customer adoption of premium rate plans, as well as lower usage of traditional long distance services by residential and business customers. This was mitigated by the flow-through of 2017 and 2018 pricing changes on our voice services, along with higher sales of international long distance minutes in our wholesale market in Q3 2018. The contribution from the acquisition of MTS favourably impacted voice revenues in the first nine months of the year.
- Other services revenuesincreased by 15.4% in Q3 2018 and by 23.8% in the first nine months of the year, compared to the same periods last year, driven by the acquisition of AlarmForce Industries Inc. (AlarmForce).
Bell Wireline product revenuesincreased by 20.1% and by 9.3%, in Q3 2018 and year to date, respectively, compared to the same periods in 2017, due to increased demand in the large business market for telecommunication equipment. Year-to-date revenues were also favourably impacted by the acquisition of MTS.
BCE Inc. 2018 THIRD QUARTER SHAREHOLDER REPORT 17 |
|
| | | | |
3 | MD&A | Business segment analysis
Bell Wireline | |
OPERATING COSTS AND ADJUSTED EBITDA
| Q3 2018 | | Q3 2017 | | $ CHANGE | | % CHANGE | | YTD 2018 | | YTD 2017 | | $ CHANGE | | % CHANGE | |
Operating costs | (1,823 | ) | (1,780 | ) | (43 | ) | (2.4 | %) | (5,419 | ) | (5,304 | ) | (115 | ) | (2.2 | %) |
Adjusted EBITDA | 1,324 | | 1,308 | | 16 | | 1.2 | % | 3,947 | | 3,878 | | 69 | | 1.8 | % |
Adjusted EBITDA margin | 42.1 | % | 42.4 | % | | | (0.3 | ) pts | 42.1 | % | 42.2 | % | | | (0.1 | ) pts |
Bell Wireline operating costsgrew by 2.4% in Q3 2018 and by 2.2% in the first nine months of the year, compared to the same periods in 2017, mainly driven by higher cost of goods sold resulting from increased product sales and greater payments to other carriers in the quarter, driven by higher sales of international long distance minutes. In the first nine months of the year, operating costs were further pressured by the acquisition of MTS, higher pension expense due to a gain in Q1 2017 on post-employment benefit expense related to an alignment of certain Bell Aliant DB pension plans with those of Bell Canada, contractual programming rate increases in our TV business and increased advertising spend in Q1 2018 during the PyeongChang 2018 Winter Olympics.
Bell Wireline adjusted EBITDAincreased by 1.2% in Q3 2018 and by 1.8% during the first nine months of the year, compared to the same periods last year, due to higher revenues, moderated by increased operating expenses. The first nine months of the year were also favourably impacted by the acquisition of MTS, offset in part by increased pension expense as a result of a gain realized in Q1 2017. Adjusted EBITDA margin of 42.1% in Q3 2018 decreased by 0.3 pts and year-to-date adjusted EBITDA margin of 42.1% decreased by 0.1pts, compared to the same periods last year, driven by greater low-margin product sales in our total revenue base.
BELL WIRELINE OPERATING METRICS
DATA
High-speed Internet
| Q3 2018 | | Q3 2017 | | CHANGE | | % CHANGE | | YTD 2018 | | YTD 2017 | | CHANGE | | % CHANGE | |
High-speed Internet net activations | 47,749 | | 44,424 | | 3,325 | | 7.5 | % | 78,212 | | 60,820 | | 17,392 | | 28.6 | % |
High-speed Internet subscribers(1)(2) | 3,904,304 | | 3,763,101 | | 141,203 | | 3.8 | % | 3,904,304 | | 3,763,101 | | 141,203 | | 3.8 | % |
| (1) | At the beginning of Q1 2018, our high-speed Internet subscriber base was increased by 19,835, mainly as a result of a small acquisition made in Q1 2018. |
| (2) | At the beginning of Q1 2018, we adjusted our high-speed Internet subscriber base to add 16,116 subscribers with a corresponding decrease to our postpaid wireless subscribers to reflect the transfer of fixed wireless Internet subscribers. |
High-speed Internet subscriber net activationsincreased by 7.5% in Q3 2018 and by 28.6% in the first nine months of the year, compared to the same periods in 2017, attributable to greater net activations from Home Internet service by Virgin Mobile Canada, higher retail activations in our fibre-to-the-home (FTTH) footprint, greater back to school activations, increased pull-through from our application-based live TV services Alt TV and higher activations in our small business market. The growth was offset in part by aggressive offers from cable competitors in both our retail and wholesale markets, along with a greater number of residential customers coming off promotional offers.
High-speed Internet subscribersat September 30, 2018 totaled 3,904,304 up 3.8% from the end of Q3 of last year.
TV
| Q3 2018 | | Q3 2017 | | CHANGE | | % CHANGE | | YTD 2018 | | YTD 2017 | | CHANGE | | % CHANGE | |
Net subscriber activations (losses) | 8,601 | | 1,738 | | 6,863 | | 394.9 | % | (3,071 | ) | (27,262 | ) | 24,191 | | 88.7 | % |
IPTV | 40,091 | | 36,399 | | 3,692 | | 10.1 | % | 74,317 | | 75,228 | | (911 | ) | (1.2 | %) |
Total subscribers(1) | 2,843,828 | | 2,825,754 | | 18,074 | | 0.6 | % | 2,843,828 | | 2,825,754 | | 18,074 | | 0.6 | % |
IPTV(1) | 1,639,233 | | 1,517,833 | | 121,400 | | 8.0 | % | 1,639,233 | | 1,517,833 | | 121,400 | | 8.0 | % |
| (1) | At the beginning of Q1 2018, our IPTV subscriber base was increased by 14,599 as a result of a small acquisition made in Q1 2018. |
IPTV net subscriber activationsincreased by 10.1% in Q3 2018, compared to the same period last year, driven by the continued growth in activations from Alt TV, higher gross activations in our FTTH footprint and greater footprint expansion in 2018. This was moderated by increased deactivations driven by aggressive service bundle offers from cable competitors, a greater number of customers coming off promotional offers, higher substitution of traditional TV services with OTT services, the impact of maturing Fibe TV markets, as well as lower customer migrations from satellite TV. Year-to-date IPTV net additions decreased by 1.2% as higher deactivations, driven by the factors described above, were only partially offset by greater activations.
Satellite TV net subscriber lossesimproved by 9.1% in Q3 2018 and by 24.5% in the first nine months of the year, compared to the same periods last year, attributable to fewer retail deactivations and lower migrations to IPTV reflecting a more mature subscriber base geographically better-suited for satellite TV service, coupled with reduced promotional offers from cable competitors in rural markets. Year-to-date results were also favourably impacted by a lower number of customers coming off of promotional offers.
Total TV net subscriber activations(IPTV and satellite TV combined) improved by 6,863 in Q3 2018, compared to last year, resulting from higher IPTV net activations, along with reduced satellite TV net losses. Net subscriber losses improved by 24,191 in the first nine months of the year, compared to last year, due to fewer satellite TV net losses, offset in part by lower IPTV net activations.
IPTV subscribersat September 30, 2018 totaled 1,639,233, up 8.0% from 1,517,833 subscribers reported at the end of Q3 2017.
Satellite TV subscribersat September 30, 2018 totaled 1,204,595, down 7.9% from 1,307,921 subscribers at the end of Q3 2017.
Total TV subscribers(IPTV and satellite TV combined) at September 30, 2018 were 2,843,828, representing a 0.6% increase since the end of Q3 2017.
| 18 BCE Inc. 2018 THIRD QUARTER SHAREHOLDER REPORT |
|
| | | | |
| | 3 | MD&A | Business segment analysis
Bell Wireline |
VOICE
| Q3 2018 | | Q3 2017 | | CHANGE | | % CHANGE | | YTD 2018 | | YTD 2017 | | CHANGE | | % CHANGE | |
Residential NAS lines(1) | 3,051,630 | | 3,275,589 | | (223,959 | ) | (6.8 | %) | 3,051,630 | | 3,275,589 | | (223,959 | ) | (6.8 | %) |
Residential NAS net losses | (74,921 | ) | (57,387 | ) | (17,534 | ) | (30.6 | %) | (203,119 | ) | (197,813 | ) | (5,306 | ) | (2.7 | %) |
| (1) | At the beginning of Q1 2018, our residential NAS subscriber base was increased by 23,441 as a result of a small acquisition made in Q1 2018. |
Residential NAS net lossesincreased by 30.6% in Q3 2018 and by 2.7% during the first nine months of the year, compared to the same periods last year, driven by fewer activations resulting from aggressive competitive offers from cable TV providers, ongoing wireless and Internet-based technology substitution, reduced pull-through from our IPTV service bundle offers and lower acquisition of three-product households.
Residential NAS subscribersat September 30, 2018 totaled 3,051,630, down 6.8% from 3,275,589 subscribers reported at the end of Q3 2017. This represented an increase in the rate of erosion compared to the 1.3% decline experienced in the third quarter of 2017, driven by the year-over-year increase in subscribers from the acquisition of MTS which benefited Q3 2017.
As at the date of this MD&A, our forward-looking statements set out in the BCE 2017 Annual MD&A, as updated or supplemented in the BCE 2018 First Quarter MD&A, in the BCE 2018 Second Quarter MD&A and in this MD&A, are based on certain assumptions including, without limitation, the following assumptions and the assumptions referred to in each of the other business segment discussions set out in this section 3,Business segment analysis, as well as the economic and market assumptions referred to in section 1.3,Assumptions, of this MD&A.
- Positive full-year adjusted EBITDA growth
- Continued growth in residential IPTV and Internet subscribers
- Increasing wireless and Internet-based technological substitution
- Residential services household ARPU growth from increased penetration of multi-product households and price increases
- Aggressive residential service bundle offers from cable TV competitors in our local wireline areas
- Continued large business customer migration to IP-based systems
- Ongoing competitive repricing pressures in our business and wholesale markets
- Continued competitive intensity in our small and mid-sized business markets as cable operators and other telecom competitors continue to intensify their focus on business customers
- Traditional high-margin product categories challenged by large global cloud and OTT providers of business voice and data solutions expanding into Canada with on-demand services
- Accelerating customer adoption of OTT services resulting in downsizing of TV packages
- Ongoing deployment of direct fibre and growing consumption of OTT TV services and on-demand streaming video, as well as the proliferation of devices, such as tablets, that consume vast quantities of bandwidth, will require considerable ongoing capital investment
- Realization of cost savings related to management workforce reductions including attrition and retirements, lower contracted rates from our suppliers, reduction of traffic that is not on our network and operating synergies from the integration of MTS
- No material financial, operational or competitive consequences of changes in regulations affecting our wireline business
BCE Inc. 2018 THIRD QUARTER SHAREHOLDER REPORT 19 |
|
| | | | |
3 | MD&A | Business segment analysis
Bell Media | |
KEY BUSINESS DEVELOPMENTS
INNOVATIVE NEW PARTNERSHIP WITH VICE MEDIA
On August 16, 2018, Bell Media entered into a long-term agreement with VICE Media (VICE) that will see Bell Media become the exclusive Canadian broadcaster of new original programming from VICE’s U.S. linear network, VICELAND, along with hundreds of hours of library VICE programming, all debuting on multiple Bell Media platforms, including CraveTV, in the fall of 2018. Both companies will also explore co-production opportunities for Bell Media platforms in Canada and VICE platforms around the world. In addition, the two companies will utilize their respective expertise by forming an advertising sales relationship that will see VICE and Bell Media combine their capabilities to bring innovative, multi-platform solutions to clients.
IHEARTRADIO CANADA PODCAST NETWORK EXPANDS DISTRIBUTION
Bell Media’s iHeartRadio Canada Podcast Network is now available to listeners on Spotify, expanding the reach of Bell Media’s original podcasts in sports, entertainment, lifestyle, and news categories originating from TSN, Much Studios, RDS, CTV News, iHeartRadio Canada, and Bell Media Studios across every major audio platform in the country. The iHeartRadio Canada Podcast Network offers a robust and popular library boasting more than 11,000 unique programs, with hundreds of thousands of hours of new content produced every month. In addition to Spotify, the iHeartRadio Canada Podcast Network reaches podcast listeners through distribution partners including Apple, Audible, Stitcher and Google Play Music.
OUT-OF-HOME PARTNERSHIP WITH CAMPSITE
On September 10, 2018, Bell Media’s OOH advertising division, Astral, entered into a new partnership with Campsite, a Montréal based leader in programmatic OOH campaigns. This agreement is set to add 240 Astral Digital large format and street furniture faces across Canada through Campsite’s programmatic platform. Launched in 2016, Campsite is a leader in innovative solutions for advertisers who want to expand their digital reach, optimize their strategies with data, and maximize their time by reaching several suppliers through only one platform.
| FINANCIAL PERFORMANCE ANALYSIS |
Q3 2018 PERFORMANCE HIGHLIGHTS
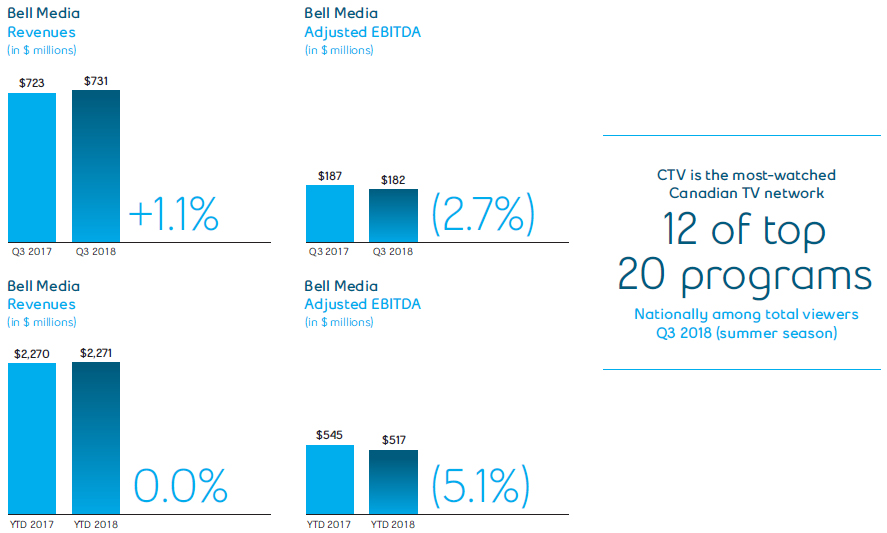
BELL MEDIA RESULTS
REVENUES
| Q3 2018 | | Q3 2017 | | $ CHANGE | | % CHANGE | | YTD 2018 | | YTD 2017 | | $ CHANGE | | % CHANGE | |
Total external revenues | 622 | | 611 | | 11 | | 1.8 | % | 1,930 | | 1,946 | | (16 | ) | (0.8 | %) |
Inter-segment revenues | 109 | | 112 | | (3 | ) | (2.7 | %) | 341 | | 324 | | 17 | | 5.2 | % |
Total Bell Media revenues | 731 | | 723 | | 8 | | 1.1 | % | 2,271 | | 2,270 | | 1 | | — | |
| 20 BCE Inc. 2018 THIRD QUARTER SHAREHOLDER REPORT |
|
| | | | |
| | 3 | MD&A | Business segment analysis
Bell Media |
Bell Media operating revenuesincreased by 1.1%, in Q3 2018 and remained essentially unchanged in the first nine months of the year, compared to the same periods in 2017.
- Advertising revenuesincreased in Q3 2018 but declined in the first nine months of 2018, compared to the same periods last year. The year-over-year growth in Q3 2018 was mainly due to increased advertising revenues from specialty TV led by the broadcast of the 2018 FIFA World Cup. This more than offset the impact of overall viewership declines and the ongoing shift in customer spending to OTT and digital platforms, which unfavourably impacted conventional TV and radio. These factors combined with the shift in advertising dollars in Q1 2018 to the main broadcaster of the PyeongChang 2018 Winter Olympics drove the year-to-date decline in advertising revenues, moderated by higher OOH advertising revenues from increased demand on digital faces.
- Subscriber revenuesgrew in both the third quarter and first nine months of 2018, compared to the same periods last year, mainly due to continued growth in our CraveTV and TV Everywhere GO products as well as the contribution from TSN and RDS Direct, along with rate increases to certain BDUs, offset in part by lower subscriber levels.
OPERATING COSTS AND ADJUSTED EBITDA
| Q3 2018 | | Q3 2017 | | $ CHANGE | | % CHANGE | | YTD 2018 | | YTD 2017 | | $ CHANGE | | % CHANGE | |
Operating costs | (549 | ) | (536 | ) | (13 | ) | (2.4 | %) | (1,754 | ) | (1,725 | ) | (29 | ) | (1.7 | %) |
Adjusted EBITDA | 182 | | 187 | | (5 | ) | (2.7 | %) | 517 | | 545 | | (28 | ) | (5.1 | %) |
Adjusted EBITDA margin | 24.9 | % | 25.9 | % | | | (1.0 | ) pts | 22.8 | % | 24.0 | % | | | (1.2 | ) pts |
Bell Media operating costsincreased by 2.4% in Q3 2018 and by 1.7% in the first nine months of the year, compared to the corresponding periods last year, mainly due to the continued escalation of programming and content costs for sports broadcast rights, primarily relating to the 2018 FIFA World Cup, ongoing content expansion for CraveTV, as well as deal renewals for specialty TV programming.
Bell Media adjusted EBITDAdecreased by 2.7% in Q3 2018 and by 5.1% in the first nine months of the year, compared to the same periods in 2017, as the growth in operating revenues was more than offset by higher operating expenses.
BELL MEDIA OPERATING METRICS
- CTV was the top ranked network in Canada for the 14th consecutive summer season among all key adult demographics in primetime, with twelve of the top 20 programs among total viewers. CTV had more shows in the summer top 20 than any other network among all key demographics.
- Bell Media continued to lead the Canadian TV media digital landscape in unique visitors, total page views, and total page minutes, with monthly averages of nearly 21 million unique visitors, 406 million page views, and 944 million total minutes spent. Bell Media was sixth in the top 100 across all online properties in Canada, reaching 68% of the digital audience.
- Bell Media remained Canada’s top radio broadcaster, reaching 17 million listeners who spent 72 million hours tuned in each week
- Astral is one of Canada’s leading OOH advertising companies, reaching 14 million consumers weekly, with an offering of five innovative product lines and owning more than 31,000 advertising faces strategically located in key urban cities across the country
As at the date of this MD&A, our forward-looking statements set out in the BCE 2017 Annual MD&A, as updated or supplemented in the BCE 2018 First Quarter MD&A, in the BCE 2018 Second Quarter MD&A and in this MD&A, are based on certain assumptions including, without limitation, the following assumptions and the assumptions referred to in each of the other business segment discussions set out in this section 3,Business segment analysis, as well as the economic and market assumptions referred to in section 1.3,Assumptions, of this MD&A.
- Revenue performance is expected to reflect an improving TV advertising sales trajectory supported by our broadcast of the 2018 FIFA World Cup, further CraveTV subscriber growth and continued growth in outdoor advertising
- Operating cost growth driven by higher TV programming and sports broadcast rights costs, as well as continued investment in CraveTV content
- Continued scaling of CraveTV
- Ability to successfully acquire and produce highly rated programming and differentiated content
- Building and maintaining strategic supply arrangements for content across all screens and platforms
- Increased revenue generation from monetization of content rights and Bell Media properties across all platforms
- TV unbundling and growth in OTT viewing expected to result in lower subscriber levels for many Bell Media TV properties
- No material financial, operational or competitive consequences of changes in regulations affecting our media business
BCE Inc. 2018 THIRD QUARTER SHAREHOLDER REPORT 21 |
|
| | | | |
4 | MD&A | Financial and capital management | |
| 4 Financial and capital management |
This section tells you how we manage our cash and capital resources to carry out our strategy and deliver financial results. It provides an analysis of our financial condition, cash flows and liquidity on a consolidated basis.
| SEPTEMBER 30, 2018 | | DECEMBER 31, 2017 | | $ CHANGE | | % CHANGE | |
Debt due within one year | 4,877 | | 5,178 | | (301 | ) | (5.8 | %) |
Long-term debt | 19,584 | | 18,215 | | 1,369 | | 7.5 | % |
Preferred shares(2) | 2,002 | | 2,002 | | — | | — | |
Cash and cash equivalents | (826 | ) | (625 | ) | (201 | ) | (32.2 | %) |
Net debt | 25,637 | | 24,770 | | 867 | | 3.5 | % |
| (1) | Net debt is a non-GAAP financial measure and does not have a standardized meaning under IFRS. Therefore, it is unlikely to be comparable to similar measures presented by other issuers. See section 8.2,Non-GAAP financial measures and key performance indicators (KPIs) – Net debtin this MD&A for more details including a reconciliation to the most comparable IFRS financial measure. |
| (2) | 50% of outstanding preferred shares of $4,004 million in 2018 and 2017 are classified as debt consistent with the treatment by some credit rating agencies. |
The increase of $1,068 million in total debt comprised of debt due within one year and long-term debt was due to:
- the issuance by Bell Canada of Series M-47 and M-48 MTN debentures with total principal amounts of $500 million and $1 billion, respectively
- the issuance of Series US-1 Notes with total principal amounts of US $750 million (CAD $967 million) and US $400 million (CAD $526 million)
- an increase in our notes payable (net of repayments) of $10 million
Partly offset by:
- the early redemption of Series M-25 MTN debentures in the principal amount of $1 billion
- the early redemption of Series M-28 MTN debentures in the principal amount of $400 million
- the early redemption of Series M-33 debentures in the principal amount of $300 million
- the early redemption of Series 9 notes in the principal amount of $200 million
- a net decrease of $35 million in our other debt and finance lease obligations
The increase in cash and cash equivalents of $201 million was due mainly to:
- $2,545 million of free cash flow
- $629 million of debt issuances (net of repayments)
- $68 million of disposition of intangibles and other assets for the sale of AlarmForce’s approximate 39,000 customer accounts to TELUS Communications Inc. (Telus)
Partly offset by:
- $2,002 million of dividends paid on BCE common shares
- $395 million paid for business acquisitions mainly related to the acquisition of AlarmForce and Axia
- $176 million paid for the purchase on the open market of shares for the settlement of share-based payments
- $175 million paid for the repurchase of common shares through a normal course issuer bid (NCIB)
- $65 million acquisition and other costs paid
- $55 million acquisition of spectrum licences
- $51 million return of capital to non-controlling interest
| 4.2 Outstanding share data |
COMMON SHARES OUTSTANDING | NUMBER OF SHARES | |
Outstanding, January 1, 2018 | 900,996,640 | |
Shares issued for the acquisition of AlarmForce | 22,531 | |
Shares issued under employee stock option plan | 90,222 | |
Repurchase of common shares | (3,085,697 | ) |
Outstanding, September 30, 2018 | 898,023,696 | |
| 22 BCE Inc. 2018 THIRD QUARTER SHAREHOLDER REPORT |
|
| | | | |
| | 4 | MD&A | Financial and capital management |
| STOCK OPTIONS OUTSTANDING | NUMBER OF
OPTIONS | | WEIGHTED AVERAGE
EXERCISE PRICE ($) | |
Outstanding, January 1, 2018 | 10,490,249 | | 55 | |
Granted | 3,656,169 | | 57 | |
Exercised(1) | (90,222 | ) | 42 | |
Forfeited | (39,669 | ) | 58 | |
Outstanding, September 30, 2018 | 14,016,527 | | 56 | |
Exercisable, September 30, 2018 | 4,576,307 | | 52 | |
| (1) | The weighted average share price for options exercised during the nine months ended September 30, 2018 was $55. |
| | Q3 2018 | | Q3 2017 | | $ CHANGE | | % CHANGE | | YTD 2018 | | YTD 2017 | | $ CHANGE | | % CHANGE | |
Cash flows from operating activities | 2,043 | | 2,233 | | (190 | ) | (8.5 | %) | 5,596 | | 5,700 | | (104 | ) | (1.8 | %) |
Capital expenditures | (1,010 | ) | (1,040 | ) | 30 | | 2.9 | % | (2,997 | ) | (2,934 | ) | (63 | ) | (2.1 | %) |
Cash dividends paid on preferred shares | (35 | ) | (21 | ) | (14 | ) | (66.7 | %) | (103 | ) | (94 | ) | (9 | ) | (9.6 | %) |
Cash dividends paid by subsidiaries to non-controlling interest | (3 | ) | (13 | ) | 10 | | 76.9 | % | (16 | ) | (34 | ) | 18 | | 52.9 | % |
Acquisition and other costs paid | 19 | | 24 | | (5 | ) | (20.8 | %) | 65 | | 128 | | (63 | ) | (49.2 | %) |
Free cash flow | 1,014 | | 1,183 | | (169 | ) | (14.3 | %) | 2,545 | | 2,766 | | (221 | ) | (8.0 | %) |
Business acquisitions | (151 | ) | — | | (151 | ) | n.m. | | (395 | ) | (1,635 | ) | 1,240 | | 75.8 | % |
Acquisition and other costs paid | (19 | ) | (24 | ) | 5 | | 20.8 | % | (65 | ) | (128 | ) | 63 | | 49.2 | % |
Acquisition of spectrum licences | (19 | ) | — | | (19 | ) | n.m. | | (55 | ) | — | | (55 | ) | n.m. | |
Disposition of intangibles and other assets | — | | — | | — | | — | | 68 | | 323 | | (255 | ) | (78.9 | %) |
Other investing activities | (9 | ) | (37 | ) | 28 | | 75.7 | % | (64 | ) | (51 | ) | (13 | ) | (25.5 | %) |
Net issuance of debt instruments | 366 | | 994 | | (628 | ) | (63.2 | %) | 629 | | 1,839 | | (1,210 | ) | (65.8 | %) |
Issue of common shares | 1 | | 4 | | (3 | ) | (75.0 | %) | 3 | | 93 | | (90 | ) | (96.8 | %) |
Repurchase of common shares | — | | — | | — | | — | | (175 | ) | — | | (175 | ) | n.m. | |
Repurchase of shares for settlement of share-based payments | (39 | ) | (38 | ) | (1 | ) | (2.6 | %) | (176 | ) | (179 | ) | 3 | | 1.7 | % |
Cash dividends paid on common shares | (678 | ) | (646 | ) | (32 | ) | (5.0 | %) | (2,002 | ) | (1,866 | ) | (136 | ) | (7.3 | %) |
Return of capital to non-controlling interest | (10 | ) | — | | (10 | ) | n.m. | | (51 | ) | — | | (51 | ) | n.m. | |
Other financing activities | (20 | ) | (14 | ) | (6 | ) | (42.9 | %) | (61 | ) | (36 | ) | (25 | ) | (69.4 | %) |
Net increase in cash and cash equivalents | 436 | | 1,422 | | (986 | ) | (69.3 | %) | 201 | | 1,126 | | (925 | ) | (82.1 | %) |
n.m.: not meaningful
| CASH FLOWS FROM OPERATING ACTIVITIES AND FREE CASH FLOW |
Cash flows from operating activities in the third quarter of 2018 decreased by $190 million, compared to Q3 2017, due mainly to a decrease in cash from working capital and higher income taxes paid, partly offset by higher adjusted EBITDA.
Cash flows from operating activities for the first nine months of 2018 decreased by $104 million, compared to the same period last year, due mainly to a decrease in cash from working capital and higher income taxes paid, partly offset by higher adjusted EBITDA and lower acquisition and other costs paid.
Free cash flow in the third quarter of 2018 decreased by $169 million compared to the same period last year, mainly due to lower cash flows from operating activities excluding acquisition and other costs paid, partly offset by lower capital expenditures.
Free cash flow on a year-to-year basis in 2018 decreased by $221 million compared to the same period last year, mainly due to lower cash flows from operating activities excluding acquisition and other costs paid and higher capital expenditures.
BCE Inc. 2018 THIRD QUARTER SHAREHOLDER REPORT 23 |
|
| | | | |
4 | MD&A | Financial and capital management | |
| Q3 2018 | | Q3 2017 | | $ CHANGE | | % CHANGE | | YTD 2018 | | YTD 2017 | | $ CHANGE | | % CHANGE | |
Bell Wireless | 181 | | 186 | | 5 | | 2.7 | % | 524 | | 513 | | (11 | ) | (2.1 | %) |
Capital intensity ratio | 8.3 | % | 9.0 | % | | | 0.7 | pts | 8.5 | % | 8.9 | % | | | 0.4 | pts |
Bell Wireline | 799 | | 820 | | 21 | | 2.6 | % | 2,391 | | 2,329 | | (62 | ) | (2.7 | %) |
Capital intensity ratio | 25.4 | % | 26.6 | % | | | 1.2 | pts | 25.5 | % | 25.4 | % | | | (0.1 | ) pts |
Bell Media | 30 | | 34 | | 4 | | 11.8 | % | 82 | | 92 | | 10 | | 10.9 | % |
Capital intensity ratio | 4.1 | % | 4.7 | % | | | 0.6 | pts | 3.6 | % | 4.1 | % | | | 0.5 | pts |
BCE | 1,010 | | 1,040 | | 30 | | 2.9 | % | 2,997 | | 2,934 | | (63 | ) | (2.1 | %) |
Capital intensity ratio | 17.2 | % | 18.3 | % | | | 1.1 | pts | 17.4 | % | 17.5 | % | | | 0.1 | pts |
BCE capital expendituresof $1,010 million in Q3 2018 declined by $30 million compared to last year, whereas year-to-date capital spend of $2,997 million increased by $63 million, compared to last year. Capital expenditures as a percentage of revenue (capital intensity ratio) of 17.2% in Q3 2018 and 17.4% year to date, decreased by 1.1 pts and 0.1 pts, respectively, compared to the same periods last year. The year-over-year variances reflected:
- Lower capital spending in our wireline segment of $21 million in Q3 2018, while year-to-date spending increased by $62 million, as timing of capital spending was more weighted to the first half of the year. We continued to focus on the expansion of broadband fibre directly to more homes and businesses, along with the integration of MTS and the impact of the acquisition of MTS in the first nine months of the year.
- Reduced wireless capital investment in Q3 2018 of $5 million, while spending in the first nine months of the year grew by $11 million. Although spending over the last two quarters is at a slower pace than last year, we continued to expand our LTE-A network including the deployment of wireless small- cells to optimize mobile coverage, signal quality and data backhaul, along with the expansion of network capacity to support the growth in subscribers and data consumption. The costs associated with the integration of MTS and the impact of the acquisition of MTS in the first nine months of the year, also contributed to the year-over-year increase in capital expenditures.
- Lower capital spending at Bell Media of $4 million and $10 million in Q3 2018 and year to date, respectively, due to greater investments in 2017 relating to the execution of OOH contract wins and upgrades to Bell Media broadcast studios and TV production equipment
On August 31, 2018, BCE completed the acquisition of all of the issued and outstanding common shares of Axia for a total cash consideration of $155 million.
On January 5, 2018, BCE acquired all of the issued and outstanding shares of AlarmForce for a total consideration of $182 million, of which $181 million was paid in cash and the remaining $1 million through the issuance of 22,531 BCE common shares.
On March 17, 2017, BCE acquired all of the issued and outstanding common shares of MTS for a total consideration of $2,933 million, of which $1,339 million was paid in cash and the remaining $1,594 million through the issuance of approximately 27.6 million BCE common shares.
On January 3, 2017, BCE acquired all of the issued and outstanding common shares of Cieslok Media Ltd. for a total cash consideration of $161 million.
| DISPOSITION OF INTANGIBLE AND OTHER ASSETS |
During Q1 2018, BCE sold AlarmForce’s approximate 39,000 customer accounts in British Columbia, Alberta and Saskatchewan to Telus for total proceeds of approximately $68 million.
During Q2 2017, BCE completed the divestiture of approximately one-quarter of postpaid wireless subscribers and 15 retail locations previously held by MTS, as well as certain Manitoba network assets, to Telus for total proceeds of $323 million.
2018
In the third quarter of 2018, we issued $366 million of debt, net of repayments. This included the issuances of Series M-48 MTN debentures and Series US-1 Notes at Bell Canada with total principal amounts of $1 billion and US $400 million (CAD $526 million), respectively. These issuances were partly offset by the early redemption of Series M-25 MTN debentures in the principal amount of $1 billion, payments of finance leases and other debt of $130 million and the repayments (net of issuances) of $30 million of notes payable.
In the first nine months of 2018, we issued $629 million of debt, net of repayments. This included the issuances at Bell Canada of Series M-47 and M-48 MTN debentures with total principal amounts of $500 million and $1 billion, respectively, the issuances of Series US-1 Notes with total principal amounts of US $750 million (CAD $967 million) and US $400 million (CAD $526 million), respectively, and the issuances (net of repayments) of $10 million of notes payable. These issuances were partly offset by the early redemption of Series M-25 and M-28 MTN debentures, Series M-33 debentures and Series 9 notes in the principal amounts of $1 billion, $400 million, $300 million and $200 million, respectively, and payments of finance leases and other debt of $474 million.
| 24 BCE Inc. 2018 THIRD QUARTER SHAREHOLDER REPORT |
|
| | | | |
| | 4 | MD&A | Financial and capital management |
2017
In the third quarter of 2017, we issued $994 million of debt, net of repayments. This included the issuances of Series M-40 and M-46 MTN debentures at Bell Canada with principal amounts of $700 million and $800 million, respectively, partly offset by the repayment (net of issuances) of $379 million of notes payable and payments of finance leases and other debt of $127 million.
In the first nine months of 2017, we issued $1,839 million of debt, net of repayments. This included the issuances of Series M-40, M-44, M-45 and M-46 MTN debentures at Bell Canada with principal amounts of $700 million, $1 billion, $500 million and $800 million, respectively, and the issuance (net of repayments) of $56 million of notes payable. These issuances were partly offset by the repayment of borrowings under our unsecured committed term credit facility of $480 million, payments of finance leases and other debt of $387 million and the early redemption of Series M-35 debentures with a principal amount of $350 million.
| REPURCHASE OF COMMON SHARES |
In Q1 2018, BCE repurchased and cancelled 3,085,697 common shares for a total cost of $175 million. Of the total cost, $69 million represents stated capital and $3 million represents the reduction of the contributed surplus attributable to these common shares. The remaining $103 million was charged to the deficit.
| CASH DIVIDENDS PAID ON COMMON SHARES |
In the third quarter of 2018, cash dividends paid on common shares increased by $32 million compared to Q3 2017 due to a higher dividend paid in Q3 2018 of $0.7550 per common share compared to $0.7175 per common share in Q3 2017.
In the first nine months of 2018, cash dividends paid on common shares increased by $136 million compared to 2017, due to a higher dividend paid in the first nine months of 2018 of $2.2275 per common share compared to $2.1175 per common share for the same period last year, and a higher average number of outstanding common shares in Q1 2018 principally as a result of shares issued for the acquisition of MTS.
| 4.4 Post-employment benefit plans |
For the three and nine months ended September 30, 2018, we recorded a decrease in our post-employment benefit obligations and a gain, before taxes, in OCI of $409 million and $757 million, respectively. This was due to a higher actual discount rate of 3.9% at September 30, 2018, as compared to 3.7% at June 30, 2018 and 3.6% at December 31, 2017, partly offset by a lower-than-expected return on plan assets in 2018.
For the three months ended September 30, 2017, we recorded a decrease in our post-employment benefit obligations and a gain, before taxes, in OCI of $643 million. This was due to a higher actual discount rate of 3.9% at September 30, 2017, as compared to 3.6% at June 30, 2017. The gain was partly offset by a lower-than-expected return on plan assets.
For the nine months ended September 30, 2017, we recorded an increase in our post-employment benefit obligations and a loss, before taxes, in OCI of $150 million. This was due to a lower actual discount rate of 3.9% at September 30, 2017, as compared to 4.0% at December 31, 2016. The loss was partly offset by a higher-than-expected return on plan assets.
| 4.5 Financial risk management |
FAIR VALUE
The following table provides the fair value details of financial instruments measured at amortized cost in the statements of financial position.
| | | SEPTEMBER 30, 2018 | DECEMBER 31, 2017 |
| | | | CARRYING | | FAIR | | CARRYING | | FAIR | |
| | CLASSIFICATION | FAIR VALUE METHODOLOGY | VALUE | | VALUE | | VALUE | | VALUE | |
CRTC tangible benefits obligation | Trade payables and other liabilities and non-current liabilities | Present value of estimated future cash flows discounted using observable market interest rates | 68 | | 68 | | 111 | | 110 | |
CRTC deferral account obligation | Trade payables and other liabilities and non-current liabilities | Present value of estimated future cash flows discounted using observable market interest rates | 113 | | 116 | | 124 | | 128 | |
Debt securities, finance leases and other debt | Debt due within one year and long-term debt | Quoted market price of debt or present value of future cash flows discounted using observable market interest rates | 20,338 | | 21,687 | | 19,321 | | 21,298 | |
BCE Inc. 2018 THIRD QUARTER SHAREHOLDER REPORT 25 |
|
| | | | |
4 | MD&A | Financial and capital management | |
The following table provides the fair value details of financial instruments measured at fair value in the statements of financial position.
| | CLASSIFICATION | CARRYING VALUE OF
ASSET (LIABILITY) | | FAIR VALUE |
QUOTED PRICES IN
ACTIVE MARKETS
FOR IDENTICAL
ASSETS (LEVEL 1) | | OBSERVABLE
MARKET DATA
(LEVEL 2)(1) | | NON-OBSERVABLE
MARKET INPUTS
(LEVEL 3)(2) | |
| September 30, 2018 | | | | | | | | | |
Publicly-traded and privately-held investments(3) | Other non-current assets | 104 | | 1 | | — | | 103 | |
Derivative financial instruments | Other current assets, trade payables and other liabilities, other non-current assets and liabilities | (162 | ) | — | | (162 | ) | — | |
Maple Leaf Sports & Entertainment Ltd. (MLSE) financial liability(4) | Trade payables and other liabilities | (135 | ) | — | | — | | (135 | ) |
Other | Other non-current assets and liabilities | 69 | | — | | 115 | | (46 | ) |
December 31, 2017 | | | | | | | | | |
Publicly-traded and privately-held investments(3) | Other non-current assets | 103 | | 1 | | — | | 102 | |
Derivative financial instruments | Other current assets, trade payables and other liabilities, other non-current assets and liabilities | (48 | ) | — | | (48 | ) | — | |
MLSE financial liability(4) | Trade payables and other liabilities | (135 | ) | — | | — | | (135 | ) |
Other | Other non-current assets and liabilities | 60 | | — | | 106 | | (46 | ) |
| (1) | Observable market data such as equity prices, interest rates, swap rate curves and foreign currency exchange rates. |
| (2) | Non-observable market inputs such as discounted cash flows and earnings multiples. A reasonable change in our assumptions would not result in a significant increase (decrease) to our level 3 financial instruments. |
| (3) | Unrealized gains and losses are recorded in OCI and impairment charges are recorded inOther expense in the income statements. |
| (4) | Represents BCE’s obligation to repurchase the BCE Master Trust Fund’s (Master Trust) 9% interest in MLSE at a price not less than an agreed minimum price should the Master Trust exercise its put option. The obligation to repurchase is marked to market each reporting period and the gain or loss is recorded in Other expense in the income statements. |
We use forward contracts, options and cross currency interest rate swaps to manage foreign currency risk related to anticipated purchases and sales and certain foreign currency denominated debt.
A 10% depreciation (appreciation) in the value of the Canadian dollar relative to the U.S. dollar would result in a gain (loss) of $1 million ($4 million) recognized in net earnings at September 30, 2018 and a gain (loss) of $125 million ($133 million) recognized inOther comprehensive income (loss) at September 30, 2018, with all other variables held constant.
In Q3 2018, we entered into additional cross currency interest rate swaps with a notional amount of $400 million in U.S. dollars ($526 million in Canadian dollars). In Q1 2018, we entered into cross currency interest rate swaps with a notional amount of $750 million in U.S. dollars ($967 million in Canadian dollars). These cross currency interest rate swaps are used to hedge the U.S. currency exposure of our Series US-1 Notes maturing in 2048. See Note 10,Debt, in BCE’s Q3 2018 Financial Statements.
The following table provides further details on our outstanding foreign currency forward contracts and options as at September 30, 2018.
TYPE OF HEDGE | BUY CURRENCY | AMOUNT TO RECEIVE | SELL CURRENCY | AMOUNT TO PAY | MATURITY | HEDGED ITEM |
Cash flow | USD | 2,458 | CAD | 3,214 | 2018-2019 | Commercial paper |
Cash flow | USD | 226 | CAD | 292 | 2018 | Anticipated transactions |
Cash flow | PHP | 343 | CAD | 8 | 2018 | Anticipated transactions |
Cash flow | CAD | 31 | USD | 24 | 2018-2019 | Anticipated transactions |
Cash flow | USD | 775 | CAD | 968 | 2019 | Anticipated transactions |
Cash flow | USD | 76 | CAD | 96 | 2020-2021 | Anticipated transactions |
Economic | USD | 8 | CAD | 11 | 2018 | Anticipated transactions |
Economic – call options | USD | 17 | CAD | 20 | 2018 | Anticipated transactions |
Economic – put options | USD | 83 | CAD | 100 | 2018 | Anticipated transactions |
| 26 BCE Inc. 2018 THIRD QUARTER SHAREHOLDER REPORT |
|
| | | | |
| | 4 | MD&A | Financial and capital management |
A 1% increase (decrease) in interest rates would result in a decrease (increase) of $30 million in net earnings at September 30, 2018.
We use equity forward contracts on BCE’s common shares to economically hedge the cash flow exposure related to the settlement of equity settled share-based compensation plans and the equity price risk related to a cash-settled share-based payment plan. The fair value of our equity forward contracts at September 30, 2018 was a liability of $101 million.
A 5% increase (decrease) in the market price of BCE’s common shares at September 30, 2018 would result in a gain (loss) of $33 million recognized in net earnings, with all other variables held constant.
BCE’s and Bell Canada’s key credit ratings remain unchanged from those described in the BCE 2017 Annual MD&A.
On October 17, 2018, subsequent to quarter end, Bell Canada increased the total amount of its committed revolving and expansion credit facilities from $3.5 billion to $4.0 billion by adding a new $500 million revolving facility expiring in November 2019. Bell Canada has the option, subject to certain conditions, to convert advances outstanding under the new $500 million revolving facility into a one-year term loan. In addition, Bell Canada extended the term of its existing $2.5 billion committed revolving credit facility by one year to November 2023 and the term of its existing $1.0 billion committed expansion credit facility by one year to November 2021.
Our cash requirements remain substantially unchanged from those described in the BCE 2017 Annual MD&A.
BCE Inc. 2018 THIRD QUARTER SHAREHOLDER REPORT 27 |
|
| | | | |
5 | MD&A | Quarterly financial information | |
| 5 Quarterly financial information |
BCE’s Q3 2018 Financial Statements were prepared in accordance with IFRS, as issued by the International Accounting Standards Board (IASB), under International Accounting Standard (IAS) 34, Interim Financial Reporting and were approved by BCE’s board of directors on October 31, 2018.
The following table, which was also prepared in accordance with IFRS, shows selected consolidated financial data of BCE for the eight most recent completed quarters.
| 2018 | 2017 | 2016 PRIOR TO THE ADOPTION OF IFRS 15 | |
| Q3 | | Q2 | | Q1 | | Q4 | | Q3 | | Q2 | | Q1 | | Q4 | |
Operating revenues | | | | | | | | | | | | | | | | |
Service | 5,117 | | 5,129 | | 4,964 | | 5,152 | | 5,054 | | 5,078 | | 4,811 | | 5,169 | |
Product | 760 | | 657 | | 626 | | 884 | | 643 | | 610 | | 525 | | 533 | |
Total operating revenues | 5,877 | | 5,786 | | 5,590 | | 6,036 | | 5,697 | | 5,688 | | 5,336 | | 5,702 | |
Adjusted EBITDA | 2,457 | | 2,430 | | 2,254 | | 2,329 | | 2,405 | | 2,382 | | 2,166 | | 2,121 | |
Severance, acquisition and other costs | (54 | ) | (24 | ) | — | | (47 | ) | (23 | ) | (36 | ) | (84 | ) | (11 | ) |
Depreciation | (779 | ) | (787 | ) | (780 | ) | (783 | ) | (760 | ) | (767 | ) | (724 | ) | (719 | ) |
Amortization | (220 | ) | (221 | ) | (212 | ) | (208 | ) | (207 | ) | (210 | ) | (185 | ) | (165 | ) |
Net earnings | 867 | | 755 | | 709 | | 698 | | 850 | | 814 | | 688 | | 699 | |
Net earnings attributable to common shareholders | 814 | | 704 | | 661 | | 656 | | 803 | | 765 | | 642 | | 657 | |
Net earnings per common share | | | | | | | | | | | | | | | | |
Basic | 0.90 | | 0.79 | | 0.73 | | 0.72 | | 0.90 | | 0.85 | | 0.73 | | 0.75 | |
Diluted | 0.90 | | 0.79 | | 0.73 | | 0.72 | | 0.90 | | 0.85 | | 0.73 | | 0.75 | |
Average number of common shares outstanding – basic (millions) | 898.0 | | 898.0 | | 900.2 | | 900.6 | | 900.4 | | 900.1 | | 875.7 | | 870.5 | |
| 28 BCE Inc. 2018 THIRD QUARTER SHAREHOLDER REPORT |
|
| | | | |
| | 6 | MD&A | Regulatory environment |
The following is an update to the regulatory initiatives and proceedings described in the BCE 2017 Annual MD&A under section 3.3,Principal business risksand section 8,Regulatory environment, as subsequently updated in the BCE 2018 First Quarter MD&A and the BCE 2018 Second Quarter MD&A.
REVIEW OF BASIC TELECOMMUNICATIONS SERVICES
On September 27, 2018, the CRTC issued Telecom Regulatory Policy CRTC 2018-377 in which it clarified matters related to the new fund created to complement government investments in expanding access to broadband Internet across Canada (Broadband Fund). Specifically, the CRTC determined that the Broadband Fund would cover four areas: (i) network transport; (ii) fixed broadband Internet access; (iii) mobile wireless and (iv) broadband in satellite-served communities. The CRTC stated that it would prefer network transport projects with the potential to benefit several communities over individual access projects, and would prefer fixed access projects over mobile wireless projects. Up to 10% of the Broadband Fund will be reserved for satellite-served communities as had been previously determined. The CRTC did not provide any guidance on when it would start collecting funds for the Broadband Fund or when it could start issuing requests for bids.
CHANGES TO SIMULTANEOUS SUBSTITUTION
Pursuant to the recently negotiated United States-Mexico-Canada Agreement (USMCA), the government of Canada is required to rescind Broadcasting Regulatory Policy CRTC 2016-334 and Broadcasting Order CRTC 2016-335 pursuant to which the CRTC eliminated simultaneous substitution for the Super Bowl. This would allow Bell Media to implement simultaneous substitution for the Super Bowl. It is uncertain when Broadcasting Regulatory Policy CRTC 2016-334 and Broadcasting Order CRTC 2016-335 will be rescinded.
WHOLESALE CODE
In Broadcasting Regulatory Policy CRTC 2015-438, the CRTC announced it would implement a new Wholesale Code to govern the commercial arrangements between BDUs, programming services and digital media services, including imposing additional restrictions on the sale of TV channels at wholesale and the carriage of TV channels by BDUs pursuant to Broadcasting Order CRTC 2015-439. Bell Canada and Bell Media appealed Broadcasting Order CRTC 2015-439 to the Federal Court of Appeal, arguing that the CRTC’s implementation of the Wholesale Code conflicts with the Copyright Act and is outside the CRTC’s jurisdiction under the Broadcasting Act. On October 1, 2018, the Federal Court of Appeal allowed the appeal and set aside Broadcasting Order 2015-439. While the court ruling is positive for Bell Media and Bell Canada, the extent of its impact on our business is not known at this time. Other parties have until November 30, 2018 to seek leave to appeal the court ruling to the Supreme Court of Canada.
LICENCE RENEWALS
On August 30, 2018, the CRTC released Broadcasting Decision CRTC 2018-334 and Broadcasting Decision CRTC 2018-335 relating to the reconsideration of TV licence renewals it issued for the major broadcast French-language and English-language ownership groups. The Federal Cabinet had directed the CRTC to reconsider certain elements of these licence renewal decisions related to support for English-language programs of national interest, as well as for original French-language programming, music programming, short films and documentaries.
In its decisions, the CRTC altered the spending requirement for English-language groups related to programs of national interest, increasing the baseline requirements for most ownership groups, including for Bell Media. With respect to French-language programming, the CRTC will now require all French-language services to devote 75% of their spending on Canadian programming to the production of original French-language programming. Finally, while the CRTC did not prescribe specific requirements relating to short form or music video programming, a new requirement was imposed for all French and English language services to devote 0.17% of revenues to Musicaction (French) or Factor (English) to support musicians. These decisions took effect on September 1, 2018, and run until August 31, 2022. The CRTC’s determinations do not have a material impact on Bell Media.
BCE Inc. 2018 THIRD QUARTER SHAREHOLDER REPORT 29 |
|
| | | | |
7 | MD&A | Business risks | |
A risk is the possibility that an event might happen in the future that could have a negative effect on our financial position, financial performance, cash flows, business or reputation. Part of managing our business is to understand what these potential risks could be and to mitigate them where we can.
The actual effect of any event could be materially different from what we currently anticipate. The risks described in this MD&A are not the only ones that could affect us. Additional risks and uncertainties not currently known to us or that we currently deem to be immaterial may also materially and adversely affect our financial position, financial performance, cash flows, business or reputation.
In the BCE 2017 Annual MD&A, we provided a detailed review of risks that could affect our financial position, financial performance, cash flows, business or reputation and that could cause actual results or events to differ materially from our expectations expressed in or implied by our forward-looking statements. This detailed description of risks is updated in the BCE 2018 First Quarter MD&A, in the BCE 2018 Second Quarter MD&A and in this MD&A. The risks described in the BCE 2017 Annual MD&A, as updated in the BCE 2018 First Quarter MD&A, in the BCE 2018 Second Quarter MD&A and in this MD&A, include, without limitation, risks associated with:
- the intensity of competitive activity, including from new and emerging competitors, and the resulting impact on the cost of retaining existing customers and attracting new ones, as well as on our market shares, service volumes and pricing strategies
- the level of technological substitution and the presence of alternative service providers contributing to reduced utilization of our traditional wireline services
- regulatory initiatives, proceedings and decisions, government consultations and government positions that affect us and influence our business, including, in particular, those relating to mandatory access to networks, spectrum auctions, approval of acquisitions, broadcast licensing and foreign ownership requirements
- the inability to protect our physical and non-physical assets, including networks, IT systems, offices, corporate stores and sensitive information, from events and attacks such as cyber threats, and damage from fire and natural disasters
- security and data leakage exposure if security control protocols applicable to our cloud-based solutions are bypassed
- the adverse effect of the fundamental separation of content and connectivity, which is changing our TV and media ecosystems and may accelerate the disconnection of TV services and the reduction of TV spending, as well as the fragmentation of, and changes in, the advertising market
- competition with global competitors, in addition to traditional Canadian competitors, for programming content could drive significant increases in content acquisition costs and challenge our ability to secure key content
- adverse economic and financial market conditions, a declining level of retail and commercial activity, and the resulting negative impact on the demand for, and prices of, our products and services and the level of bad debts
- the failure to optimize network and IT deployment and upgrade timelines, accurately assess the potential of new technologies, and invest and evolve in the appropriate direction
- the failure to continue investment in a disciplined and strategic manner in next-generation capabilities, including real-time information-based customer service strategies
- the inability to drive a positive customer experience resulting, in particular, from the failure to embrace new approaches and challenge operational limitations
- the complexity in our operations resulting from multiple technology platforms, billing systems, marketing databases and a myriad of rate plans, promotions and product offerings
- the failure to maintain optimal network operating performance in the context of significant increases in capacity demands on our Internet and wireless networks
- the failure to implement or maintain highly effective IT systems supported by an effective governance and operating framework
- the risk that we may need to incur significant capital expenditures beyond our capital intensity target in order to provide additional capacity and reduce network congestion
- the failure to generate anticipated benefits from our corporate restructurings, system replacements and upgrades, process redesigns and the integration of business acquisitions
- events affecting the functionality of, and our ability to protect, test, maintain and replace, our networks, IT systems, equipment and other facilities
- in-orbit and other operational risks to which the satellites used to provide our satellite TV services are subject
- the failure to attract and retain employees with the appropriate skill sets and to drive their performance in a safe and secure environment
- labour disruptions
- the inability to access adequate sources of capital and generate sufficient cash flows from operations to meet our cash requirements, fund capital expenditures and provide for planned growth
- uncertainty as to whether dividends will be declared by BCE’s board of directors or whether BCE’s dividend payout policy will be maintained
- the inability to manage various credit, liquidity and market risks
- pension obligation volatility and increased contributions to post-employment benefit plans
- higher taxes due to new tax laws or changes thereto or in the interpretation thereof, and the inability to predict the outcome of government audits
- the failure to reduce costs as well as unexpected increases in costs
- the failure to evolve practices to effectively monitor and control fraudulent activities
- online content theft and piracy and the absence of effective legal recourses to combat them
- events affecting the continuity of supply of products and services that we need to operate our business and to comply with various obligations from our third-party suppliers, outsourcers and consultants
- the failure of our procurement and vendor management practices to address risk exposures associated with existing and new supplier models
| 30 BCE Inc. 2018 THIRD QUARTER SHAREHOLDER REPORT |
|
| | | | |
| | 7 | MD&A | Business risks |
- the quality of our products and services and the extent to which they may be subject to manufacturing defects or fail to comply with applicable government regulations and standards
- unfavourable resolution of legal proceedings and, in particular, class actions
- unfavourable changes in applicable laws and the failure to proactively address our legal and regulatory obligations
- health concerns about radiofrequency emissions from wireless communications devices
- the inability to maintain customer service and our networks operational in the event of the occurrence of epidemics, pandemics and other health risks
- the failure to recognize and adequately respond to climate change concerns or public and governmental expectations on environmental matters
We caution that the foregoing list of risk factors is not exhaustive and other factors could also adversely affect our results.
Please see section 9,Business risks, of the BCE 2017 Annual MD&A for a more complete description of the above-mentioned and other risks, which section, and the other sections of the BCE 2017 Annual MD&A referred to therein, are incorporated by reference in this section 7.
In addition, please also see section 4.7,Liquidity – Litigationin the BCE 2018 Second Quarter MD&A for an update to the legal proceedings described in the BCE 2017 AIF, which section 4.7 is incorporated by reference in this section 7. Please also see section 6,Regulatory environmentin the BCE 2018 First Quarter MD&A, in the BCE 2018 Second Quarter MD&A and in this MD&A for an update to the regulatory initiatives and proceedings described in the BCE 2017 Annual MD&A, which sections 6 are incorporated by reference in this section 7.
Except for the updates set out in section 6,Regulatory environmentin the BCE 2018 First Quarter MD&A; in section 4.7, Liquidity – Litigation, in section 6,Regulatory environmentand in section 7,Business risksin the BCE 2018 Second Quarter MD&A; as well as in section 6,Regulatory environmentin this MD&A, the risks described in the BCE 2017 Annual MD&A remain substantially unchanged.
BCE Inc. 2018 THIRD QUARTER SHAREHOLDER REPORT 31 |
|
| | | | |
8 | MD&A | Accounting policies, financial measures and controls | |
| 8 Accounting policies, financial measures and controls |
| 8.1 Our accounting policies |
BCE’s Q3 2018 Financial Statements were prepared in accordance with IFRS, as issued by the IASB, under IAS 34 – Interim Financial Reporting and were approved by BCE’s board of directors on October 31, 2018. These financial statements were prepared using the same basis of presentation, accounting policies and methods of computations as outlined in Note 2,Significant accounting policies in BCE’s consolidated financial statements for the year ended December 31, 2017, except as noted below. BCE’s Q3 2018 Financial Statements do not include all of the notes required in the annual financial statements.
| ADOPTION OF NEW ACCOUNTING STANDARDS |
As required, effective January 1, 2018, we adopted the following new accounting standards.
IFRS 15
We applied IFRS 15, Revenue from Contracts with Customers, retrospectively to each prior reporting period presented. IFRS 15 establishes principles to record revenues from contracts for the sale of products or services, unless the contracts are in the scope of other IFRSs.
IFRS 15 principally affects the timing of revenue recognition and how we classify revenues between product and service in our Bell Wireless segment. IFRS 15 also affects how we account for costs to obtain a contract.
- Under multiple-element arrangements, revenue allocated to a satisfied performance obligation is no longer limited to the amount that is not contingent upon the satisfaction of additional performance obligations. Although the total revenue recognized during the term of a contract is largely unaffected, revenue recognition may be accelerated and reflected ahead of the associated cash inflows. This results in the recognition of a contract asset on the balance sheet, corresponding to the amount of revenue recognized and not yet billed to a customer. The contract asset is realized over the term of the customer contract.
- As revenues allocated to a satisfied performance obligation are no longer limited to the non-contingent amount, a greater proportion of the total revenue recognized during the term of certain customer contracts may be attributed to a delivered product, resulting in a corresponding decrease in service revenue
- Sales commissions and any other incremental costs of obtaining a contract with a customer are recognized on the statement of financial position and amortized on a systematic basis that is consistent with the period and pattern of transfer to the customer of the related products or services, except as noted below
Under IFRS 15, we apply the following practical expedients:
- Completed contracts that begin and end within the same annual reporting period and those completed before January 1, 2017 are not restated
- Contracts modified prior to January 1, 2017 are not restated. The aggregate effect of these modifications is reflected when identifying the satisfied and unsatisfied performance obligations, determining the transaction price and allocating the transaction price to the satisfied and unsatisfied performance obligations.
- When our right to consideration from a customer corresponds directly with the value to the customer of the products and services transferred to date, we recognize revenue in the amount to which we have a right to invoice. For such contracts and for performance obligations that are part of a contract that has an original expected duration of one year or less, the transaction price amount allocated to the remaining performance obligations and an explanation of when we expect to recognise that amount as revenue are not disclosed.
- Costs of obtaining a contract that would be amortized within one year or less are immediately expensed
IFRS 9
We applied IFRS 9, Financial Instruments (as revised in July 2014) and the related consequential amendments to other IFRSs retrospectively, except for the changes to hedge accounting described below which are applied prospectively. In accordance with the transition requirements, comparative periods have not been restated. The adoption of IFRS 9 did not have a significant impact on the carrying amounts of our financial instruments as at January 1, 2018. As a result of the adoption of IFRS 9, our January 1, 2018 deficit increased by $4 million.
IFRS 9 replaces the classification and measurement models in IAS 39, Financial Instruments: Recognition and Measurement, with a single model under which financial assets are classified and measured at amortized cost, fair value through other comprehensive income (FVOCI) or fair value through profit or loss (FVTPL). This classification is based on the business model in which a financial asset is managed and its contractual cash flow characteristics and eliminates the IAS 39 categories of held-to-maturity, loans and receivables and available-for-sale. The adoption of IFRS 9 did not, however, change the measurement bases of our financial assets.
- Cash and cash equivalents and derivative instruments measured at FVTPL under IAS 39 continue to be measured as such under IFRS 9
- Portfolio investments in equity securities and certain derivative instruments that qualify for cash flow hedge accounting measured at FVOCI under IAS 39 continue to be measured as such under IFRS 9
- Trade and other receivables continue to be measured at amortized cost under IFRS 9
The impairment of financial assets under IFRS 9 is based on an expected credit loss (ECL) model, as opposed to the incurred loss model in IAS 39. IFRS 9 applies to financial assets measured at amortized cost and contract assets and requires that we consider factors that include historical, current and forward-looking information when measuring the ECL. We use the simplified approach for measuring losses based on the lifetime ECL for trade receivables and contract assets. Amounts considered uncollectible are written off and recognized inOperating costsin the income statement.
| 32 BCE Inc. 2018 THIRD QUARTER SHAREHOLDER REPORT |
|
| | | | |
| | 8 | MD&A | Accounting policies, financial measures and controls |
We have adopted the general hedge accounting model in IFRS 9 which requires that we ensure hedge accounting relationships are consistent with our risk management objectives and strategies. We also apply a more qualitative and forward-looking approach in assessing hedge effectiveness as a retrospective assessment is no longer required.
- Under IFRS 9, amounts related to cash flow hedges of anticipated purchases of non-financial assets settled during the period are reclassified from Accumulated other comprehensive income to the initial cost of the non-financial asset when it is recognized. Under IAS 39, such amounts were reclassified from Other comprehensive income. Amounts related to cash flow hedges of other anticipated purchases continue to be reclassified from Other comprehensive income to net earnings under IFRS 9.
| FUTURE CHANGES TO ACCOUNTING STANDARDS |
As outlined in Note 2,Significant accounting policiesin our consolidated financial statements for the year ended December 31, 2017, the IASB issued IFRS 16 – Leases with an effective date of January 1, 2019.
We continue to make progress towards adoption of IFRS 16 according to our detailed implementation plan. We expect to continue our testing and data validation process through the end of 2018 and to be in a position to disclose the preliminary estimate of the impact of IFRS 16 in our 2018 annual MD&A. Accordingly, it is not yet possible to make a reliable estimate of the impact of the new standard on our financial statements. We will adopt IFRS 16 on January 1, 2019, using a modified retrospective approach.
As a result of adopting IFRS 15, we have changed the comparative figures for the three and nine months ended September 30, 2017 and the year ended December 31, 2017. The impacts of adopting IFRS 15 on our previously reported results for the three and nine months ended September 30, 2017 are provided below. The impacts of adopting IFRS 15 on our statement of financial position as at January 1, 2017 and December 31, 2017, our consolidated income statement and consolidated statement of cash flows for the year ended December 31, 2017, along with updated 2017 annual disclosures are included in Note 3,Adoption of IFRS 15, of our unaudited consolidated financial statements for the period ended March 31, 2018.
CONSOLIDATED INCOME STATEMENTS
The table below shows the impacts of adopting IFRS 15 on our previously reported consolidated income statements for the three and nine months ended September 30, 2017.
| | THREE MONTHS ENDED SEPTEMBER 30, 2017 | NINE MONTHS ENDED SEPTEMBER 30, 2017 |
| (IN MILLIONS OF CANADIAN DOLLARS, EXCEPT SHARE AMOUNTS) | 2017 AS
PREVIOUSLY
REPORTED | | IFRS 15 IMPACTS | | 2017 UPON
ADOPTION
OF IFRS 15 | | 2017 AS
PREVIOUSLY
REPORTED | | IFRS 15 IMPACTS | | 2017 UPON
ADOPTION
OF IFRS 15 | |
Operating revenues | 5,678 | | 19 | | 5,697 | | 16,761 | | (40 | ) | 16,721 | |
Operating costs | (3,312 | ) | 20 | | (3,292 | ) | (9,800 | ) | 32 | | (9,768 | ) |
Severance, acquisition and other costs | (23 | ) | — | | (23 | ) | (143 | ) | — | | (143 | ) |
Depreciation | (765 | ) | 5 | | (760 | ) | (2,256 | ) | 5 | | (2,251 | ) |
Amortization | (208 | ) | 1 | | (207 | ) | (604 | ) | 2 | | (602 | ) |
Finance costs | | | | | | | | | | | | |
Interest expense | (242 | ) | — | | (242 | ) | (714 | ) | — | | (714 | ) |
Interest on post-employment benefit obligations | (18 | ) | — | | (18 | ) | (54 | ) | — | | (54 | ) |
Other expense | (56 | ) | — | | (56 | ) | (40 | ) | — | | (40 | ) |
Income taxes | (237 | ) | (12 | ) | (249 | ) | (797 | ) | — | | (797 | ) |
Net earnings | 817 | | 33 | | 850 | | 2,353 | | (1 | ) | 2,352 | |
Net earnings attributable to: | | | | | | | | | | | | |
Common shareholders | 770 | | 33 | | 803 | | 2,211 | | (1 | ) | 2,210 | |
Preferred shareholders | 31 | | — | | 31 | | 94 | | — | | 94 | |
Non-controlling interest | 16 | | — | | 16 | | 48 | | — | | 48 | |
Net earnings | 817 | | 33 | | 850 | | 2,353 | | (1 | ) | 2,352 | |
Net earnings per common share – basic and diluted | 0.86 | | 0.04 | | 0.90 | | 2.48 | | — | | 2.48 | |
Average number of common shares outstanding – basic (millions) | 900.4 | | — | | 900.4 | | 892.2 | | — | | 892.2 | |
BCE Inc. 2018 THIRD QUARTER SHAREHOLDER REPORT 33 |
|
| | | | |
8 | MD&A | Accounting policies, financial measures and controls | |
CONSOLIDATED STATEMENT OF CASH FLOWS
The table below shows the impacts of adopting IFRS 15 on select line items of our previously reported 2017 statement of cash flows for the three and nine months ended September 30, 2017.
| THREE MONTHS ENDED SEPTEMBER 30, 2017 | NINE MONTHS ENDED SEPTEMBER 30, 2017 |
| 2017 AS
PREVIOUSLY
REPORTED | | IFRS 15 IMPACTS | | 2017 UPON
ADOPTION
OF IFRS 15 | | 2017 AS
PREVIOUSLY
REPORTED | | IFRS 15 IMPACTS | | 2017 UPON
ADOPTION
OF IFRS 15 | |
Cash flows from operating activities | | | | | | | | | | | | |
Net earnings | 817 | | 33 | | 850 | | 2,353 | | (1 | ) | 2,352 | |
Depreciation and amortization | 973 | | (6 | ) | 967 | | 2,860 | | (7 | ) | 2,853 | |
Income taxes | 237 | | 12 | | 249 | | 797 | | — | | 797 | |
Net change in operating assets and liabilities | 308 | | (39 | ) | 269 | | 316 | | 8 | | 324 | |
Cash flows from operating activities | 2,233 | | — | | 2,233 | | 5,700 | | — | | 5,700 | |
| 8.2 Non-GAAP financial measures and key performance indicators (KPIs) |
This section describes the non-GAAP financial measures and KPIs we use in this MD&A to explain our financial results. It also provides reconciliations of the non-GAAP financial measures to the most comparable IFRS financial measures.
In Q1 2018, we updated our definition of adjusted net earnings and adjusted EPS to exclude net mark-to-market losses (gains) on derivatives used to economically hedge equity settled share-based compensation plans as they may affect the comparability of our financial results and could potentially distort the analysis of trends in business performance. Adjusted net earnings and adjusted EPS for 2017 have also been updated for comparability purposes.
| ADJUSTED EBITDA AND ADJUSTED EBITDA MARGIN |
The terms adjusted EBITDA and adjusted EBITDA margin do not have any standardized meaning under IFRS. Therefore, they are unlikely to be comparable to similar measures presented by other issuers.
We define adjusted EBITDA as operating revenues less operating costs, as shown in BCE’s consolidated income statements. Adjusted EBITDA for BCE’s segments is the same as segment profit as reported in Note 4, Segmented information, in BCE’s Q3 2018 Financial Statements. We define adjusted EBITDA margin as adjusted EBITDA divided by operating revenues.
We use adjusted EBITDA and adjusted EBITDA margin to evaluate the performance of our businesses as they reflect their ongoing profitability. We believe that certain investors and analysts use adjusted EBITDA to measure a company’s ability to service debt and to meet other payment obligations or as a common measurement to value companies in the telecommunications industry. We believe that certain investors and analysts also use adjusted EBITDA and adjusted EBITDA margin to evaluate the performance of our businesses. Adjusted EBITDA is also one component in the determination of short-term incentive compensation for all management employees.
Adjusted EBITDA and adjusted EBITDA margin have no directly comparable IFRS financial measure. Alternatively, the following table provides a reconciliation of net earnings to adjusted EBITDA.
| | Q3 2018 | | Q3 2017 | | YTD 2018 | | YTD 2017 | |
Net earnings | 867 | | 850 | | 2,331 | | 2,352 | |
Severance, acquisition and other costs | 54 | | 23 | | 78 | | 143 | |
Depreciation | 779 | | 760 | | 2,346 | | 2,251 | |
Amortization | 220 | | 207 | | 653 | | 602 | |
Finance costs | | | | | | | | |
Interest expense | 255 | | 242 | | 741 | | 714 | |
Interest on post-employment benefit obligations | 17 | | 18 | | 51 | | 54 | |
Other expense | 41 | | 56 | | 190 | | 40 | |
Income taxes | 224 | | 249 | | 751 | | 797 | |
Adjusted EBITDA | 2,457 | | 2,405 | | 7,141 | | 6,953 | |
BCE operating revenues | 5,877 | | 5,697 | | 17,253 | | 16,721 | |
Adjusted EBITDA margin | 41.8 | % | 42.2 | % | 41.4 | % | 41.6 | % |
| 34 BCE Inc. 2018 THIRD QUARTER SHAREHOLDER REPORT |
|
| | | | |
| | 8 | MD&A | Accounting policies, financial measures and controls |
| ADJUSTED NET EARNINGS AND ADJUSTED EPS |
The terms adjusted net earnings and adjusted EPS do not have any standardized meaning under IFRS. Therefore, they are unlikely to be comparable to similar measures presented by other issuers.
We define adjusted net earnings as net earnings attributable to common shareholders before severance, acquisition and other costs, net mark-to-market losses (gains) on derivatives used to economically hedge equity settled share-based compensation plans, net losses (gains) on investments, early debt redemption costs and impairment charges. We define adjusted EPS as adjusted net earnings per BCE common share.
We use adjusted net earnings and adjusted EPS, and we believe that certain investors and analysts use these measures, among other ones, to assess the performance of our businesses without the effects of severance, acquisition and other costs, net mark-to-market losses (gains) on derivatives used to economically hedge equity settled share-based compensation plans, net losses (gains) on investments, early debt redemption costs and impairment charges, net of tax and non-controlling (NCI). We exclude these items because they affect the comparability of our financial results and could potentially distort the analysis of trends in business performance. Excluding these items does not imply they are non-recurring.
The most comparable IFRS financial measures are net earnings attributable to common shareholders and EPS. The following table is a reconciliation of net earnings attributable to common shareholders and EPS to adjusted net earnings on a consolidated basis and per BCE common share (adjusted EPS), respectively.
| Q3 2018 | Q3 2017 | YTD 2018 | YTD 2017 |
| TOTAL | | PER SHARE | | TOTAL | | PER SHARE | | TOTAL | | PER SHARE | | TOTAL | | PER SHARE | |
Net earnings attributable to common shareholders | 814 | | 0.90 | | 803 | | 0.90 | | 2,179 | | 2.42 | | 2,210 | | 2.48 | |
Severance, acquisition and other costs | 39 | | 0.04 | | 17 | | 0.01 | | 56 | | 0.06 | | 109 | | 0.12 | |
Net mark-to-market losses (gains) on derivatives used to economically hedge equity settled share-based compensation plans | 5 | | 0.01 | | (8 | ) | (0.01 | ) | 83 | | 0.10 | | (26 | ) | (0.03 | ) |
Net losses on investments | — | | — | | — | | — | | 20 | | 0.02 | | 14 | | 0.01 | |
Early debt redemption costs | 2 | | 0.01 | | 12 | | 0.01 | | 15 | | 0.02 | | 15 | | 0.02 | |
Impairment charges | 1 | | — | | — | | — | | 4 | | — | | — | | — | |
Adjusted net earnings | 861 | | 0.96 | | 824 | | 0.91 | | 2,357 | | 2.62 | | 2,322 | | 2.60 | |
| FREE CASH FLOW AND DIVIDEND PAYOUT RATIO |
The terms free cash flow and dividend payout ratio do not have any standardized meaning under IFRS. Therefore, they are unlikely to be comparable to similar measures presented by other issuers.
We define free cash flow as cash flows from operating activities, excluding acquisition and other costs paid (which include significant litigation costs) and voluntary pension funding, less capital expenditures, preferred share dividends and dividends paid by subsidiaries to NCI. We exclude acquisition and other costs paid and voluntary pension funding because they affect the comparability of our financial results and could potentially distort the analysis of trends in business performance. Excluding these items does not imply they are non-recurring.
We consider free cash flow to be an important indicator of the financial strength and performance of our businesses because it shows how much cash is available to pay dividends, repay debt and reinvest in our company. We believe that certain investors and analysts use free cash flow to value a business and its underlying assets and to evaluate the financial strength and performance of our businesses. The most comparable IFRS financial measure is cash flows from operating activities.
We define dividend payout ratio as dividends paid on common shares divided by free cash flow. We consider dividend payout ratio to be an important indicator of the financial strength and performance of our businesses because it shows the sustainability of the company’s dividend payments.
The following table is a reconciliation of cash flows from operating activities to free cash flow on a consolidated basis.
| Q3 2018 | | Q3 2017 | | YTD 2018 | | YTD 2017 | |
Cash flows from operating activities | 2,043 | | 2,233 | | 5,596 | | 5,700 | |
Capital expenditures | (1,010 | ) | (1,040 | ) | (2,997 | ) | (2,934 | ) |
Cash dividends paid on preferred shares | (35 | ) | (21 | ) | (103 | ) | (94 | ) |
Cash dividends paid by subsidiaries to NCI | (3 | ) | (13 | ) | (16 | ) | (34 | ) |
Acquisition and other costs paid | 19 | | 24 | | 65 | | 128 | |
Free cash flow | 1,014 | | 1,183 | | 2,545 | | 2,766 | |
BCE Inc. 2018 THIRD QUARTER SHAREHOLDER REPORT 35 |
|
| | | | |
8 | MD&A | Accounting policies, financial measures and controls | |
The term net debt does not have any standardized meaning under IFRS. Therefore, it is unlikely to be comparable to similar measures presented by other issuers.
We define net debt as debt due within one year plus long-term debt and 50% of preferred shares, less cash and cash equivalents, as shown in BCE’s consolidated statements of financial position. We include 50% of outstanding preferred shares in our net debt as it is consistent with the treatment by certain credit rating agencies.
We consider net debt to be an important indicator of the company’s financial leverage because it represents the amount of debt that is not covered by available cash and cash equivalents. We believe that certain investors and analysts use net debt to determine a company’s financial leverage.
Net debt has no directly comparable IFRS financial measure, but rather is calculated using several asset and liability categories from the statements of financial position, as shown in the following table.
| SEPTEMBER 30, 2018 | | DECEMBER 31, 2017 | |
Debt due within one year | 4,877 | | 5,178 | |
Long-term debt | 19,584 | | 18,215 | |
50% of outstanding preferred shares | 2,002 | | 2,002 | |
Cash and cash equivalents | (826 | ) | (625 | ) |
Net debt | 25,637 | | 24,770 | |
The net debt leverage ratio does not have any standardized meaning under IFRS. Therefore, it is unlikely to be comparable to similar measures presented by other issuers. We use, and believe that certain investors and analysts use, the net debt leverage ratio as a measure of financial leverage.
The net debt leverage ratio represents net debt divided by adjusted EBITDA. For the purposes of calculating our net debt leverage ratio, adjusted EBITDA is twelve-month trailing adjusted EBITDA.
| ADJUSTED EBITDA TO NET INTEREST EXPENSE RATIO |
The ratio of adjusted EBITDA to net interest expense does not have any standardized meaning under IFRS. Therefore, it is unlikely to be comparable to similar measures presented by other issuers. We use, and believe that certain investors and analysts use, the adjusted EBITDA to net interest expense ratio as a measure of financial health of the company.
The adjusted EBITDA to net interest expense ratio represents adjusted EBITDA divided by net interest expense. For the purposes of calculating our adjusted EBITDA to net interest expense ratio, adjusted EBITDA is twelve-month trailing adjusted EBITDA. Net interest expense is twelve-month trailing net interest expense as shown in our statements of cash flows, plus 50% of declared preferred share dividends as shown in our income statements.
In addition to the non-GAAP financial measures described previously, we use a number of KPIs to measure the success of our strategic imperatives. These KPIs are not accounting measures and may not be comparable to similar measures presented by other issuers.
| KPI | DEFINITION |
| ARPU | Average revenue per user (ARPU) or subscriber is a measure used to track our recurring revenue streams, which has been updated to reflect the adoption of IFRS 15. Wireless blended ARPU is calculated by dividing certain service revenues by the average subscriber base for the specified period and is expressed as a dollar unit per month. |
| ABPU | Average billing per user (ABPU) or subscriber approximates the average amount billed to customers on a monthly basis, which is used to track our recurring billing streams. This measure is the same as blended ARPU prior to the adoption of IFRS 15. Wireless blended ABPU is calculated by dividing certain customer billings by the average subscriber base for the specified period and is expressed as a dollar unit per month. |
| Capital intensity | Capital expenditures divided by operating revenues. |
| Churn | Churn is the rate at which existing subscribers cancel their services. It is a measure of our ability to retain our customers. Wireless churn is calculated by dividing the number of deactivations during a given period by the average number of subscribers in the base for the specified period and is expressed as a percentage per month. |
| Subscriber unit | Wireless subscriber unit is comprised of an active revenue-generating unit (e.g. mobile device, tablet or wireless Internet products), with a unique identifier (typically International Mobile Equipment Identity (IMEI) number), that has access to our wireless networks. We report wireless subscriber units in two categories: postpaid and prepaid. Prepaid subscriber units are considered active for a period of 120 days following the expiry of the subscriber’s prepaid balance. Wireline subscriber unit consists of an active revenue-generating unit with access to our services, including Internet, satellite TV, IPTV, and/or NAS. A subscriber is included in our subscriber base when the service has been installed and is operational at the customer premise and a billing relationship has been established. - Internet, IPTV and satellite TV subscribers have access to stand-alone services, and are primarily represented by a dwelling unit
- NAS subscribers are based on a line count and are represented by a unique telephone number
|
| 36 BCE Inc. 2018 THIRD QUARTER SHAREHOLDER REPORT |
|
| | | | |
| | 8 | MD&A | Accounting policies, financial measures and controls |
| 8.3 Controls and procedures |
CHANGES IN INTERNAL CONTROL OVER FINANCIAL REPORTING
No changes were made in our internal control over financial reporting during the quarter ended September 30, 2018 that have materially affected, or are reasonably likely to materially affect, our internal control over financial reporting.
BCE Inc. 2018 THIRD QUARTER SHAREHOLDER REPORT 37 |
|
| | |
| Consolidated financial statements | |
| Consolidated financial statements |
| Consolidated income statements |
FOR THE PERIOD ENDED SEPTEMBER 30
(IN MILLIONS OF CANADIAN DOLLARS, EXCEPT SHARE AMOUNTS) (UNAUDITED) | | | THREE MONTHS | NINE MONTHS |
| NOTE | | 2018 | | 2017 | | 2018 | | 2017 | |
Operating revenues | 4 | | 5,877 | | 5,697 | | 17,253 | | 16,721 | |
Operating costs | 4, 5 | | (3,420 | ) | (3,292 | ) | (10,112 | ) | (9,768 | ) |
Severance, acquisition and other costs | 4, 6 | | (54 | ) | (23 | ) | (78 | ) | (143 | ) |
Depreciation | 4 | | (779 | ) | (760 | ) | (2,346 | ) | (2,251 | ) |
Amortization | 4 | | (220 | ) | (207 | ) | (653 | ) | (602 | ) |
Finance costs | | | | | | | | | | |
Interest expense | | | (255 | ) | (242 | ) | (741 | ) | (714 | ) |
Interest on post-employment benefit obligations | 11 | | (17 | ) | (18 | ) | (51 | ) | (54 | ) |
Other expense | 7 | | (41 | ) | (56 | ) | (190 | ) | (40 | ) |
Income taxes | 9 | | (224 | ) | (249 | ) | (751 | ) | (797 | ) |
Net earnings | | | 867 | | 850 | | 2,331 | | 2,352 | |
Net earnings attributable to: | | | | | | | | | | |
Common shareholders | | | 814 | | 803 | | 2,179 | | 2,210 | |
Preferred shareholders | | | 36 | | 31 | | 107 | | 94 | |
Non-controlling interest | | | 17 | | 16 | | 45 | | 48 | |
Net earnings | | | 867 | | 850 | | 2,331 | | 2,352 | |
Net earnings per common share – basic and diluted | 8 | | 0.90 | | 0.90 | | 2.42 | | 2.48 | |
Average number of common shares outstanding – basic (millions) | | | 898.0 | | 900.4 | | 898.7 | | 892.2 | |
| 38 BCE Inc. 2018 THIRD QUARTER SHAREHOLDER REPORT |
|
| | |
| | Consolidated financial statements |
| Consolidated statements of comprehensive income |
FOR THE PERIOD ENDED SEPTEMBER 30
(IN MILLIONS OF CANADIAN DOLLARS) (UNAUDITED) | THREE MONTHS | NINE MONTHS |
| 2018 | | 2017 | | 2018 | | 2017 | |
Net earnings | 867 | | 850 | | 2,331 | | 2,352 | |
Other comprehensive income (loss), net of income taxes | | | | | | | | |
Items that will be subsequently reclassified to net earnings | | | | | | | | |
Net change in value of derivatives designated as cash flow hedges, net of income taxes of $7 million and $15 million for the three months ended September 30, 2018 and 2017, respectively, and $2 million and $27 million for the nine months ended September 30, 2018 and 2017, respectively(1) | (20 | ) | (44 | ) | (6 | ) | (83 | ) |
Items that will not be reclassified to net earnings | | | | | | | | |
Actuarial gains (losses) on post-employment benefit plans, net of income taxes of ($111) million and ($173) million for the three months ended September 30, 2018 and 2017, respectively, and ($205) million and $41 million for the nine months ended September 30, 2018 and 2017, respectively(2) | 298 | | 470 | | 552 | | (109 | ) |
Net change in value of derivatives designated as cash flow hedges, net of income taxes of $4 million and nil for the three months ended September 30, 2018 and 2017, respectively, and ($9) million and nil for the nine months ended September 30, 2018 and 2017, respectively(1) | (10 | ) | — | | 25 | | — | |
Other comprehensive income (loss) | 268 | | 426 | | 571 | | (192 | ) |
Total comprehensive income | 1,135 | | 1,276 | | 2,902 | | 2,160 | |
Total comprehensive income attributable to: | | | | | | | | |
Common shareholders | 1,083 | | 1,231 | | 2,748 | | 2,020 | |
Preferred shareholders | 36 | | 31 | | 107 | | 94 | |
Non-controlling interest | 16 | | 14 | | 47 | | 46 | |
Total comprehensive income | 1,135 | | 1,276 | | 2,902 | | 2,160 | |
| (1) | Amounts relating to the net change in value of derivatives for the three and nine month periods ended September 30, 2017 have not been restated, in accordance with the transition requirements upon adoption of IFRS 9 – Financial Instruments on January 1, 2018. See Note 2, Basis of presentation and significant accounting policies for further details. |
| (2) | The discount rate used to value our post-employment benefit obligations at September 30, 2018 was 3.9% compared to 3.7% at June 30, 2018 and 3.6% at December 31, 2017. The discount rate used to value our post-employment benefit obligations at September 30, 2017 was 3.9% compared to 3.6% at June 30, 2017 and 4.0% at December 31, 2016. |
BCE Inc. 2018 THIRD QUARTER SHAREHOLDER REPORT 39 |
|
| | |
| Consolidated financial statements | |
| Consolidated statements of financial position |
| (IN MILLIONS OF CANADIAN DOLLARS) (UNAUDITED) | NOTE | | SEPTEMBER 30, 2018 | | DECEMBER 31, 2017 | |
ASSETS | | | | | | |
Current assets | | | | | | |
Cash | | | 496 | | 442 | |
Cash equivalents | | | 330 | | 183 | |
Trade and other receivables | | | 2,948 | | 3,129 | |
Inventory | | | 491 | | 380 | |
Contract assets | | | 906 | | 832 | |
Contract costs | | | 355 | | 350 | |
Prepaid expenses | | | 312 | | 217 | |
Other current assets | | | 164 | | 122 | |
Total current assets | | | 6,002 | | 5,655 | |
Non-current assets | | | | | | |
Contract assets | | | 440 | | 431 | |
Contract costs | | | 318 | | 286 | |
Property, plant and equipment | | | 24,726 | | 24,029 | |
Intangible assets | | | 13,357 | | 13,258 | |
Deferred tax assets | | | 122 | | 144 | |
Investments in associates and joint ventures | | | 770 | | 814 | |
Other non-current assets | | | 1,262 | | 757 | |
Goodwill | 3 | | 10,657 | | 10,428 | |
Total non-current assets | | | 51,652 | | 50,147 | |
Total assets | | | 57,654 | | 55,802 | |
LIABILITIES | | | | | | |
Current liabilities | | | | | | |
Trade payables and other liabilities | | | 3,778 | | 3,875 | |
Contract liabilities | | | 701 | | 693 | |
Interest payable | | | 230 | | 168 | |
Dividends payable | | | 701 | | 678 | |
Current tax liabilities | | | 159 | | 140 | |
Debt due within one year | 10 | | 4,877 | | 5,178 | |
Total current liabilities | | | 10,446 | | 10,732 | |
Non-current liabilities | | | | | | |
Contract liabilities | | | 201 | | 201 | |
Long-term debt | 10 | | 19,584 | | 18,215 | |
Deferred tax liabilities | | | 3,230 | | 2,870 | |
Post-employment benefit obligations | 11 | | 1,890 | | 2,108 | |
Other non-current liabilities | | | 1,160 | | 1,051 | |
Total non-current liabilities | | | 26,065 | | 24,445 | |
Total liabilities | | | 36,511 | | 35,177 | |
EQUITY | | | | | | |
Equity attributable to BCE shareholders | | | | | | |
Preferred shares | 13 | | 4,004 | | 4,004 | |
Common shares | 13 | | 20,028 | | 20,091 | |
Contributed surplus | | | 1,161 | | 1,162 | |
Accumulated other comprehensive income (loss) | | | 4 | | (17 | ) |
Deficit | | | (4,378 | ) | (4,938 | ) |
Total equity attributable to BCE shareholders | | | 20,819 | | 20,302 | |
Non-controlling interest | | | 324 | | 323 | |
Total equity | | | 21,143 | | 20,625 | |
Total liabilities and equity | | | 57,654 | | 55,802 | |
| 40 BCE Inc. 2018 THIRD QUARTER SHAREHOLDER REPORT |
|
| | |
| | Consolidated financial statements |
| Consolidated statements of changes in equity |
| | | | ATTRIBUTABLE TO BCE SHAREHOLDERS | | | | |
FOR THE PERIOD ENDED SEPTEMBER 30, 2018
(IN MILLIONS OF CANADIAN DOLLARS) (UNAUDITED) | NOTE | | PREFERRED
SHARES | | COMMON
SHARES | | CONTRI-
BUTED
SURPLUS | | ACCUMU-
LATED
OTHER
COMPRE-
HENSIVE
(LOSS)
INCOME | | DEFICIT | | TOTAL | | NON-
CONTROL-
LING
INTEREST | | TOTAL
EQUITY | |
Balance at December 31, 2017 | | | 4,004 | | 20,091 | | 1,162 | | (17 | ) | (4,938 | ) | 20,302 | | 323 | | 20,625 | |
Adoption of IFRS 9 | 2 | | — | | — | | — | | — | | (4 | ) | (4 | ) | — | | (4 | ) |
Balance at January 1, 2018 | | | 4,004 | | 20,091 | | 1,162 | | (17 | ) | (4,942 | ) | 20,298 | | 323 | | 20,621 | |
Net earnings | | | — | | — | | — | | — | | 2,286 | | 2,286 | | 45 | | 2,331 | |
Other comprehensive income | | | — | | — | | — | | 17 | | 552 | | 569 | | 2 | | 571 | |
Total comprehensive income | | | — | | — | | — | | 17 | | 2,838 | | 2,855 | | 47 | | 2,902 | |
Common shares issued under employee stock option plan | | | — | | 5 | | — | | — | | — | | 5 | | — | | 5 | |
Other share-based compensation | | | — | | — | | 2 | | — | | (23 | ) | (21 | ) | — | | (21 | ) |
Repurchase of common shares | 13 | | — | | (69 | ) | (3 | ) | — | | (103 | ) | (175 | ) | — | | (175 | ) |
Common shares issued for the acquisition of AlarmForce Industries Inc. (AlarmForce) | 3 | | — | | 1 | | — | | — | | — | | 1 | | — | | 1 | |
Dividends declared on BCE common and preferred shares | | | — | | — | | — | | — | | (2,141 | ) | (2,141 | ) | — | | (2,141 | ) |
Dividends declared by subsidiaries to non-controlling interest | | | — | | — | | — | | — | | — | | — | | (5 | ) | (5 | ) |
Settlement of cash flow hedges transferred to the cost basis of hedged items | | | — | | — | | — | | 4 | | — | | 4 | | — | | 4 | |
Return of capital to non-controlling interest | | | — | | — | | — | | — | | (7 | ) | (7 | ) | (44 | ) | (51 | ) |
Other | | | — | | — | | — | | — | | — | | — | | 3 | | 3 | |
Balance at September 30, 2018 | | | 4,004 | | 20,028 | | 1,161 | | 4 | | (4,378 | ) | 20,819 | | 324 | | 21,143 | |
| | | | ATTRIBUTABLE TO BCE SHAREHOLDERS | | | | |
FOR THE PERIOD ENDED SEPTEMBER 30, 2017
(IN MILLIONS OF CANADIAN DOLLARS) (UNAUDITED) | NOTE | | PREFERRED
SHARES | | COMMON
SHARES | | CONTRI-
BUTED
SURPLUS | | ACCUMU-
LATED
OTHER
COMPRE-
HENSIVE
INCOME
(LOSS) | | DEFICIT | | TOTAL | | NON-
CONTROL-
LING
INTEREST | | TOTAL
EQUITY | |
Balance at January 1, 2017 | | | 4,004 | | 18,370 | | 1,160 | | 46 | | (4,978 | ) | 18,602 | | 314 | | 18,916 | |
Net earnings | | | — | | — | | — | | — | | 2,304 | | 2,304 | | 48 | | 2,352 | |
Other comprehensive loss | | | — | | — | | — | | (81 | ) | (109 | ) | (190 | ) | (2 | ) | (192 | ) |
Total comprehensive (loss) income | | | — | | — | | — | | (81 | ) | 2,195 | | 2,114 | | 46 | | 2,160 | |
Common shares issued under employee stock option plan | | | — | | 97 | | (5 | ) | — | | — | | 92 | | — | | 92 | |
Common shares issued under employee savings plan | | | — | | 5 | | — | | — | | — | | 5 | | — | | 5 | |
Other share-based compensation | | | — | | — | | 1 | | — | | (18 | ) | (17 | ) | — | | (17 | ) |
Common shares issued for the acquisition of Manitoba Telecom Services Inc. (MTS) | 3 | | — | | 1,594 | | — | | — | | — | | 1,594 | | — | | 1,594 | |
Dividends declared on BCE common and preferred shares | | | — | | — | | — | | — | | (2,011 | ) | (2,011 | ) | — | | (2,011 | ) |
Dividends declared by subsidiaries to non-controlling interest | | | — | | — | | — | | — | | — | | — | | (35 | ) | (35 | ) |
Balance at September 30, 2017 | | | 4,004 | | 20,066 | | 1,156 | | (35 | ) | (4,812 | ) | 20,379 | | 325 | | 20,704 | |
BCE Inc. 2018 THIRD QUARTER SHAREHOLDER REPORT 41 |
|
| | |
| Consolidated financial statements | |
| Consolidated statements of cash flows |
FOR THE PERIOD ENDED SEPTEMBER 30
(IN MILLIONS OF CANADIAN DOLLARS) (UNAUDITED) | | | THREE MONTHS | NINE MONTHS |
| NOTE | | 2018 | | 2017 | | 2018 | | 2017 | |
Cash flows from operating activities | | | | | | | | | | |
Net earnings | | | 867 | | 850 | | 2,331 | | 2,352 | |
Adjustments to reconcile net earnings to cash flows from operating activities | | | | | | | | | | |
Severance, acquisition and other costs | 6 | | 54 | | 23 | | 78 | | 143 | |
Depreciation and amortization | | | 999 | | 967 | | 2,999 | | 2,853 | |
Post-employment benefit plans cost | 11 | | 82 | | 82 | | 252 | | 232 | |
Net interest expense | | | 251 | | 239 | | 732 | | 704 | |
Losses on investments | 7 | | — | | — | | — | | 12 | |
Income taxes | | | 224 | | 249 | | 751 | | 797 | |
Contributions to post-employment benefit plans | | | (69 | ) | (64 | ) | (230 | ) | (238 | ) |
Payments under other post-employment benefit plans | | | (20 | ) | (20 | ) | (58 | ) | (58 | ) |
Severance and other costs paid | | | (27 | ) | (30 | ) | (95 | ) | (111 | ) |
Interest paid | | | (207 | ) | (242 | ) | (695 | ) | (714 | ) |
Income taxes paid (net of refunds) | | | (161 | ) | (66 | ) | (558 | ) | (468 | ) |
Acquisition and other costs paid | | | (19 | ) | (24 | ) | (65 | ) | (128 | ) |
Net change in operating assets and liabilities | | | 69 | | 269 | | 154 | | 324 | |
Cash flows from operating activities | | | 2,043 | | 2,233 | | 5,596 | | 5,700 | |
Cash flows used in investing activities | | | | | | | | | | |
Capital expenditures | | | (1,010 | ) | (1,040 | ) | (2,997 | ) | (2,934 | ) |
Business acquisitions | 3 | | (151 | ) | — | | (395 | ) | (1,635 | ) |
Disposition of intangibles and other assets | 3 | | — | | — | | 68 | | 323 | |
Acquisition of spectrum licences | | | (19 | ) | — | | (55 | ) | — | |
Other investing activities | | | (9 | ) | (37 | ) | (64 | ) | (51 | ) |
Cash flows used in investing activities | | | (1,189 | ) | (1,077 | ) | (3,443 | ) | (4,297 | ) |
Cash flows used in financing activities | | | | | | | | | | |
(Decrease) increase in notes payable | | | (30 | ) | (379 | ) | 10 | | 56 | |
Decrease in securitized trade receivables | | | — | | — | | (2 | ) | (10 | ) |
Issue of long-term debt | 10 | | 1,530 | | 1,515 | | 2,996 | | 3,011 | |
Repayment of long-term debt | 10 | | (1,134 | ) | (142 | ) | (2,375 | ) | (1,218 | ) |
Issue of common shares | | | 1 | | 4 | | 3 | | 93 | |
Repurchase of shares for settlement of share-based payments | | | (39 | ) | (38 | ) | (176 | ) | (179 | ) |
Repurchase of common shares | 13 | | — | | — | | (175 | ) | — | |
Cash dividends paid on common shares | | | (678 | ) | (646 | ) | (2,002 | ) | (1,866 | ) |
Cash dividends paid on preferred shares | | | (35 | ) | (21 | ) | (103 | ) | (94 | ) |
Cash dividends paid by subsidiaries to non-controlling interest | | | (3 | ) | (13 | ) | (16 | ) | (34 | ) |
Return of capital to non-controlling interest | | | (10 | ) | — | | (51 | ) | — | |
Other financing activities | | | (20 | ) | (14 | ) | (61 | ) | (36 | ) |
Cash flows (used in) from financing activities | | | (418 | ) | 266 | | (1,952 | ) | (277 | ) |
Net increase in cash | | | 242 | | 1,040 | | 54 | | 857 | |
Cash at beginning of period | | | 254 | | 420 | | 442 | | 603 | |
Cash at end of period | | | 496 | | 1,460 | | 496 | | 1,460 | |
Net increase in cash equivalents | | | 194 | | 382 | | 147 | | 269 | |
Cash equivalents at beginning of period | | | 136 | | 137 | | 183 | | 250 | |
Cash equivalents at end of period | | | 330 | | 519 | | 330 | | 519 | |
| 42 BCE Inc. 2018 THIRD QUARTER SHAREHOLDER REPORT |
|
| | |
| | Notes to consolidated financial statements |
| Notes to consolidated financial statements |
These consolidated interim financial statements (financial statements) should be read in conjunction with BCE’s 2017 annual consolidated financial statements, approved by BCE’s board of directors on March 8, 2018.
These notes are unaudited.
We,us,our,BCE andthe companymean, as the context may require, either BCE Inc. or, collectively, BCE Inc., Bell Canada, their subsidiaries, joint arrangements and associates.MTSmeans, as the context may require, until March 17, 2017, either Manitoba Telecom Services Inc. or, collectively, Manitoba Telecom Services Inc. and its subsidiaries; andBell MTS means, from March 17, 2017, the combined operations of MTS and Bell Canada in Manitoba.
| Note 1 Corporate information |
BCE is incorporated and domiciled in Canada. BCE’s head office is located at 1, Carrefour Alexander-Graham-Bell, Verdun, Québec, Canada. BCE is a telecommunications and media company providing wireless, wireline, Internet and television (TV) services to residential, business and wholesale customers nationally across Canada. Our Bell Media segment provides conventional, specialty and pay TV, digital media, radio broadcasting services and out-of-home (OOH) advertising services to customers nationally across Canada.
| Note 2 Basis of presentation and significant accounting policies |
These financial statements were prepared in accordance with International Financial Reporting Standards (IFRS), as issued by the International Accounting Standards Board (IASB), under International Accounting Standard (IAS) 34 – Interim Financial Reporting and were approved by BCE’s board of directors on October 31, 2018. These financial statements were prepared using the same basis of presentation, accounting policies and methods of computation as outlined in Note 2,Significant accounting policiesin our consolidated financial statements for the year ended December 31, 2017, except as noted below. The impacts of adopting IFRS 15 on our previously reported results for the three and nine months ended September 30, 2017 are provided in Note 15,Adoption of IFRS 15. The impacts of adopting IFRS 15 on our statement of financial position as at January 1, 2017 and December 31, 2017, our consolidated income statement and consolidated statement of cash flows for the year ended December 31, 2017, along with updated 2017 annual disclosures are included in Note 3,Adoption of IFRS 15, of our unaudited consolidated financial statements for the period ended March 31, 2018.
These financial statements do not include all of the notes required in annual financial statements.
All amounts are in millions of Canadian dollars, except where noted.
| ADOPTION OF NEW ACCOUNTING STANDARDS |
As required, effective January 1, 2018, we adopted the following new accounting standards.
IFRS 15
We applied IFRS 15, Revenue from Contracts with Customers, retrospectively to each prior reporting period presented. IFRS 15 establishes principles to record revenues from contracts for the sale of products or services, unless the contracts are in the scope of other IFRSs.
IFRS 15 principally affects the timing of revenue recognition and how we classify revenues between product and service in our Bell Wireless segment. IFRS 15 also affects how we account for costs to obtain a contract.
- Under multiple-element arrangements, revenue allocated to a satisfied performance obligation is no longer limited to the amount that is not contingent upon the satisfaction of additional performance obligations. Although the total revenue recognized during the term of a contract is largely unaffected, revenue recognition may be accelerated and reflected ahead of the associated cash inflows. This results in the recognition of a contract asset on the balance sheet, corresponding to the amount of revenue recognized and not yet billed to a customer. The contract asset is realized over the term of the customer contract.
- As revenues allocated to a satisfied performance obligation are no longer limited to the non-contingent amount, a greater proportion of the total revenue recognized during the term of certain customer contracts may be attributed to a delivered product, resulting in a corresponding decrease in service revenue
- Sales commissions and any other incremental costs of obtaining a contract with a customer are recognized on the statement of financial position and amortized on a systematic basis that is consistent with the period and pattern of transfer to the customer of the related products or services, except as noted below
BCE Inc. 2018 THIRD QUARTER SHAREHOLDER REPORT 43 |
|
| | |
| Notes to consolidated financial statements | |
Under IFRS 15, we apply the following practical expedients:
- Completed contracts that begin and end within the same annual reporting period and those completed before January 1, 2017 are not restated
- Contracts modified prior to January 1, 2017 are not restated. The aggregate effect of these modifications is reflected when identifying the satisfied and unsatisfied performance obligations, determining the transaction price and allocating the transaction price to the satisfied and unsatisfied performance obligations.
- When our right to consideration from a customer corresponds directly with the value to the customer of the products and services transferred to date, we recognize revenue in the amount to which we have a right to invoice. For such contracts and for performance obligations that are part of a contract that has an original expected duration of one year or less, the transaction price amount allocated to the remaining performance obligations and an explanation of when we expect to recognise that amount as revenue are not disclosed.
- Costs of obtaining a contract that would be amortized within one year or less are immediately expensed
IFRS 9
We applied IFRS 9, Financial Instruments (as revised in July 2014) and the related consequential amendments to other IFRSs retrospectively, except for the changes to hedge accounting described below which are applied prospectively. In accordance with the transition requirements, comparative periods have not been restated. The adoption of IFRS 9 did not have a significant impact on the carrying amounts of our financial instruments as at January 1, 2018. As a result of the adoption of IFRS 9, our January 1, 2018 deficit increased by $4 million.
IFRS 9 replaces the classification and measurement models in IAS 39, Financial Instruments: Recognition and Measurement, with a single model under which financial assets are classified and measured at amortized cost, fair value through other comprehensive income (FVOCI) or fair value through profit or loss (FVTPL). This classification is based on the business model in which a financial asset is managed and its contractual cash flow characteristics and eliminates the IAS 39 categories of held-to-maturity, loans and receivables and available-for-sale. The adoption of IFRS 9 did not, however, change the measurement bases of our financial assets.
- Cash and cash equivalents and derivative instruments measured at FVTPL under IAS 39 continue to be measured as such under IFRS 9
- Portfolio investments in equity securities and certain derivative instruments that qualify for cash flow hedge accounting measured at FVOCI under IAS 39 continue to be measured as such under IFRS 9
- Trade and other receivables continue to be measured at amortized cost under IFRS 9
The impairment of financial assets under IFRS 9 is based on an expected credit loss (ECL) model, as opposed to the incurred loss model in IAS 39. IFRS 9 applies to financial assets measured at amortized cost and contract assets and requires that we consider factors that include historical, current and forward-looking information when measuring the ECL. We use the simplified approach for measuring losses based on the lifetime ECL for trade receivables and contract assets. Amounts considered uncollectible are written off and recognized inOperating costsin the income statement.
We have adopted the general hedge accounting model in IFRS 9 which requires that we ensure hedge accounting relationships are consistent with our risk management objectives and strategies. We also apply a more qualitative and forward-looking approach in assessing hedge effectiveness as a retrospective assessment is no longer required.
- Under IFRS 9, amounts related to cash flow hedges of anticipated purchases of non-financial assets settled during the period are reclassified from Accumulated other comprehensive income to the initial cost of the non-financial asset when it is recognized. Under IAS 39, such amounts were reclassified from Other comprehensive income. Amounts related to cash flow hedges of other anticipated purchases continue to be reclassified from Other comprehensive income to net earnings under IFRS 9.
| FUTURE CHANGES TO ACCOUNTING STANDARDS |
As outlined in Note 2, Significant accounting policies in our consolidated financial statements for the year ended December 31, 2017, the IASB issued IFRS 16 – Leases with an effective date of January 1, 2019.
We continue to make progress towards adoption of IFRS 16 according to our detailed implementation plan. We expect to continue our testing and data validation process through the end of 2018 and to be in a position to disclose the preliminary estimate of the impact of IFRS 16 in our 2018 annual consolidated financial statements. Accordingly, it is not yet possible to make a reliable estimate of the impact of the new standard on our financial statements. We will adopt IFRS 16 on January 1, 2019, using a modified retrospective approach.
| Note 3 Business acquisitions and dispositions |
2018
ACQUISITION OF AXIA NETMEDIA CORPORATION
On August 31, 2018, BCE completed the acquisition of all of the issued and outstanding common shares of Axia NetMedia Corporation (Axia) for a total cash consideration of $155 million.
Axia provides broadband network services to commercial and government accounts throughout the province of Alberta. The acquisition of Axia expands BCE’s broadband operations in Alberta and will add approximately 10,000 kilometres of fibre capacity to our footprint.
Axia is included in our Bell Wireline segment in our consolidated financial statements.
| 44 BCE Inc. 2018 THIRD QUARTER SHAREHOLDER REPORT |
|
| | |
| | Notes to consolidated financial statements |
The purchase price allocation includes certain provisional estimates, in particular for property, plant and equipment and finite-life intangible assets. The following table summarizes the fair value of the consideration paid and the fair value assigned to each major class of assets and liabilities.
| TOTAL | |
Cash consideration | 155 | |
Total cost to be allocated | 155 | |
Trade and other receivables | 6 | |
Other non-cash working capital | (9 | ) |
Property, plant and equipment | 64 | |
Finite-life intangible assets | 19 | |
Other non-current liabilities | (8 | ) |
| 72 | |
Cash and cash equivalents | 3 | |
Fair value of net assets acquired | 75 | |
Goodwill(1) | 80 | |
| (1) | Goodwill arises principally from expected synergies and future growth and is not deductible for tax purposes. Goodwill arising from the transaction was allocated to our Bell Wireline group of cash generating units (CGUs). |
The transaction did not have a significant impact on our consolidated operating revenues and net earnings for the nine months ended September 30, 2018.
| ACQUISITION OF ALARMFORCE |
On January 5, 2018, BCE acquired all of the issued and outstanding shares of AlarmForce for a total consideration of $182 million, of which $181 million was paid in cash and the remaining $1 million through the issuance of 22,531 BCE common shares.
Subsequent to the acquisition of AlarmForce, on January 5, 2018, BCE sold AlarmForce’s approximate 39,000 customer accounts in British Columbia, Alberta and Saskatchewan to TELUS Communications Inc. (Telus) for total proceeds of approximately $68 million.
AlarmForce provides security alarm monitoring, personal emergency response monitoring, video surveillance and related services to residential and commercial subscribers. The acquisition of AlarmForce supports our strategic expansion in the Connected Home marketplace.
AlarmForce is included in our Bell Wireline segment in our consolidated financial statements.
The purchase price allocation includes provisional estimates, in particular for finite-life intangible assets. The following table summarizes the fair value of the consideration paid and the fair value assigned to each major class of assets and liabilities.
| TOTAL | |
Cash consideration | 181 | |
Issuance of 22,531 BCE common shares(1) | 1 | |
Total cost to be allocated | 182 | |
Assets held for sale(2) | 68 | |
Property, plant and equipment | 8 | |
Finite-life intangible assets(3) | 34 | |
Indefinite-life intangible assets | 1 | |
Deferred tax liabilities | (7 | ) |
Other non-current liabilities | (1 | ) |
| 103 | |
Cash and cash equivalents | 4 | |
Fair value of net assets acquired | 107 | |
Goodwill(4) | 75 | |
| (1) | Recorded at fair value based on the market price of BCE common shares on the acquisition date. |
| (2) | Consists mainly of customer relationships recorded at fair value less costs to sell. |
| (3) | Consists mainly of customer relationships. |
| (4) | Goodwill arises principally from expected synergies and future growth and is not deductible for tax purposes. Goodwill arising from the transaction was allocated to our Bell Wireline group of CGUs. |
Operating revenues of $35 million and net earnings of $3 million from AlarmForce are included in the consolidated income statements from the date of acquisition. These amounts reflect the amortization of certain elements of the purchase price allocation and related tax adjustments.
BCE Inc. 2018 THIRD QUARTER SHAREHOLDER REPORT 45 |
|
| | |
| Notes to consolidated financial statements | |
| TERMINATION OF AGREEMENT TO ACQUIRE SÉRIES+ AND HISTORIA SPECIALTY CHANNELS |
On October 17, 2017, BCE entered into an agreement with Corus Entertainment Inc. (Corus) to acquire French-language specialty channels Séries+ and Historia. On May 28, 2018, the Competition Bureau announced that it did not approve the sale of the channels to BCE. As a result, BCE and Corus terminated their agreement.
2017
ACQUISITION OF MTS
On March 17, 2017, BCE acquired all of the issued and outstanding common shares of MTS for a total consideration of $2,933 million, of which $1,339 million was paid in cash and the remaining $1,594 million through the issuance of approximately 27.6 million BCE common shares. BCE funded the cash component of the transaction through debt financing.
Operating revenues of $500 million and net earnings of $72 million from the acquired MTS operations are included in the consolidated income statements from the date of acquisition. BCE’s consolidated operating revenues and net earnings for the nine months ended September 30, 2017 would have been $16,915 million and $2,363 million, respectively, had the acquisition of MTS occurred on January 1, 2017. These amounts reflect the elimination of intercompany transactions, financing costs and the amortization of certain elements of the purchase price allocation and related tax adjustments.
During Q2 2017, BCE completed the divestiture of approximately one-quarter of postpaid wireless subscribers and 15 retail locations previously held by MTS, as well as certain Manitoba network assets, to Telus for total proceeds of $323 million.
| ACQUISITION OF CIESLOK MEDIA LTD. (CIESLOK MEDIA) |
On January 3, 2017, BCE acquired all of the issued and outstanding common shares of Cieslok Media for a total cash consideration of $161 million.
The transaction did not have a significant impact on our consolidated operating revenues and net earnings for the nine months ended September 30, 2017.
| Note 4 Segmented information |
Our results are reported in three segments: Bell Wireless, Bell Wireline and Bell Media. Our segments reflect how we manage our business and how we classify our operations for planning and measuring performance.
On March 17, 2017, BCE acquired all of the issued and outstanding common shares of MTS. The results from the acquired MTS operations are included in our Bell Wireless and Bell Wireline segments from the date of acquisition.
The following tables present financial information by segment for the three month periods ended September 30, 2018 and 2017.
| FOR THE THREE MONTH PERIOD ENDED SEPTEMBER 30, 2018 | NOTE | | BELL
WIRELESS | | BELL
WIRELINE | | BELL
MEDIA | | INTERSEGMENT
ELIMINATIONS | | BCE | |
Operating revenues | | | | | | | | | | | | |
External customers | | | 2,170 | | 3,085 | | 622 | | — | | 5,877 | |
Inter-segment | | | 12 | | 62 | | 109 | | (183 | ) | — | |
Total operating revenues | | | 2,182 | | 3,147 | | 731 | | (183 | ) | 5,877 | |
Operating costs | 5 | | (1,231 | ) | (1,823 | ) | (549 | ) | 183 | | (3,420 | ) |
Segment profit(1) | | | 951 | | 1,324 | | 182 | | — | | 2,457 | |
Severance, acquisition and other costs | 6 | | (5 | ) | (42 | ) | (7 | ) | — | | (54 | ) |
Depreciation and amortization | | | (167 | ) | (797 | ) | (35 | ) | — | | (999 | ) |
Finance costs | | | | | | | | | | | | |
Interest expense | | | | | | | | | | | (255 | ) |
Interest on post-employment benefit obligations | 11 | | | | | | | | | | (17 | ) |
Other expense | 7 | | | | | | | | | | (41 | ) |
Income taxes | | | | | | | | | | | (224 | ) |
Net earnings | | | | | | | | | | | 867 | |
| (1) | The chief operating decision maker uses primarily one measure of profit to make decisions and assess performance, being operating revenues less operating costs. |
| 46 BCE Inc. 2018 THIRD QUARTER SHAREHOLDER REPORT |
|
| | |
| | Notes to consolidated financial statements |
| FOR THE THREE MONTH PERIOD ENDED SEPTEMBER 30, 2017 | NOTE | | BELL
WIRELESS | | BELL
WIRELINE | | BELL
MEDIA | | INTERSEGMENT
ELIMINATIONS | | BCE | |
Operating revenues | | | | | | | | | | | | |
External customers | | | 2,049 | | 3,037 | | 611 | | — | | 5,697 | |
Inter-segment | | | 12 | | 51 | | 112 | | (175 | ) | — | |
Total operating revenues | | | 2,061 | | 3,088 | | 723 | | (175 | ) | 5,697 | |
Operating costs | 5 | | (1,151 | ) | (1,780 | ) | (536 | ) | 175 | | (3,292 | ) |
Segment profit(1) | | | 910 | | 1,308 | | 187 | | — | | 2,405 | |
Severance, acquisition and other costs | 6 | | (3 | ) | (19 | ) | (1 | ) | — | | (23 | ) |
Depreciation and amortization | | | (166 | ) | (764 | ) | (37 | ) | — | | (967 | ) |
Finance costs | | | | | | | | | | | | |
Interest expense | | | | | | | | | | | (242 | ) |
Interest on post-employment benefit obligations | 11 | | | | | | | | | | (18 | ) |
Other expense | 7 | | | | | | | | | | (56 | ) |
Income taxes | | | | | | | | | | | (249 | ) |
Net earnings | | | | | | | | | | | 850 | |
| (1) | The chief operating decision maker uses primarily one measure of profit to make decisions and assess performance, being operating revenues less operating costs. |
The following tables present financial information by segment for the nine month periods ended September 30, 2018 and 2017.
| FOR THE NINE MONTH PERIOD ENDED SEPTEMBER 30, 2018 | NOTE | | BELL
WIRELESS | | BELL
WIRELINE | | BELL
MEDIA | | INTERSEGMENT
ELIMINATIONS | | BCE | |
Operating revenues | | | | | | | | | | | | |
External customers | | | 6,136 | | 9,187 | | 1,930 | | — | | 17,253 | |
Inter-segment | | | 38 | | 179 | | 341 | | (558 | ) | — | |
Total operating revenues | | | 6,174 | | 9,366 | | 2,271 | | (558 | ) | 17,253 | |
Operating costs | 5 | | (3,497 | ) | (5,419 | ) | (1,754 | ) | 558 | | (10,112 | ) |
Segment profit(1) | | | 2,677 | | 3,947 | | 517 | | — | | 7,141 | |
Severance, acquisition and other costs | 6 | | (11 | ) | (50 | ) | (17 | ) | — | | (78 | ) |
Depreciation and amortization | | | (492 | ) | (2,395 | ) | (112 | ) | — | | (2,999 | ) |
Finance costs | | | | | | | | | | | | |
Interest expense | | | | | | | | | | | (741 | ) |
Interest on post-employment benefit obligations | 11 | | | | | | | | | | (51 | ) |
Other expense | 7 | | | | | | | | | | (190 | ) |
Income taxes | | | | | | | | | | | (751 | ) |
Net earnings | | | | | | | | | | | 2,331 | |
| (1) | The chief operating decision maker uses primarily one measure of profit to make decisions and assess performance, being operating revenues less operating costs. |
| FOR THE NINE MONTH PERIOD ENDED SEPTEMBER 30, 2017 | NOTE | | BELL
WIRELESS | | BELL
WIRELINE | | BELL
MEDIA | | INTERSEGMENT
ELIMINATIONS | | BCE | |
Operating revenues | | | | | | | | | | | | |
External customers | | | 5,743 | | 9,032 | | 1,946 | | — | | 16,721 | |
Inter-segment | | | 34 | | 150 | | 324 | | (508 | ) | — | |
Total operating revenues | | | 5,777 | | 9,182 | | 2,270 | | (508 | ) | 16,721 | |
Operating costs | 5 | | (3,247 | ) | (5,304 | ) | (1,725 | ) | 508 | | (9,768 | ) |
| Segment profit(1) | | | 2,530 | | 3,878 | | 545 | | — | | 6,953 | |
Severance, acquisition and other costs | 6 | | (8 | ) | (121 | ) | (14 | ) | — | | (143 | ) |
Depreciation and amortization | | | (447 | ) | (2,296 | ) | (110 | ) | — | | (2,853 | ) |
Finance costs | | | | | | | | | | | | |
Interest expense | | | | | | | | | | | (714 | ) |
Interest on post-employment benefit obligations | 11 | | | | | | | | | | (54 | ) |
Other expense | 7 | | | | | | | | | | (40 | ) |
Income taxes | | | | | | | | | | | (797 | ) |
Net earnings | | | | | | | | | | | 2,352 | |
| (1) | The chief operating decision maker uses primarily one measure of profit to make decisions and assess performance, being operating revenues less operating costs. |
BCE Inc. 2018 THIRD QUARTER SHAREHOLDER REPORT 47 |
|
| | |
| Notes to consolidated financial statements | |
| REVENUES BY SERVICES AND PRODUCTS |
| | THREE MONTHS | NINE MONTHS |
| FOR THE PERIOD ENDED SEPTEMBER 30 | 2018 | | 2017 | | 2018 | | 2017 | |
Services(1) | | | | | | | | |
Wireless | 1,618 | | 1,580 | | 4,680 | | 4,503 | |
Data | 1,867 | | 1,817 | | 5,556 | | 5,348 | |
Voice | 950 | | 994 | | 2,857 | | 2,995 | |
Media | 622 | | 611 | | 1,930 | | 1,946 | |
Other services | 60 | | 52 | | 187 | | 151 | |
Total services | 5,117 | | 5,054 | | 15,210 | | 14,943 | |
Products(2) | | | | | | | | |
Wireless | 552 | | 469 | | 1,456 | | 1,240 | |
Data | 111 | | 79 | | 313 | | 273 | |
Equipment and other | 97 | | 95 | | 274 | | 265 | |
Total products | 760 | | 643 | | 2,043 | | 1,778 | |
Total operating revenues | 5,877 | | 5,697 | | 17,253 | | 16,721 | |
| (1) | Our service revenues are generally recognized over time. |
| (2) | Our product revenues are generally recognized at a point in time. |
| | | | THREE MONTHS | NINE MONTHS |
| FOR THE PERIOD ENDED SEPTEMBER 30 | NOTE | | 2018 | | 2017 | | 2018 | | 2017 | |
Labour costs | | | | | | | | | | |
Wages, salaries and related taxes and benefits | | | (1,065 | ) | (1,045 | ) | (3,213 | ) | (3,120 | ) |
Post-employment benefit plans service cost (net of capitalized amounts) | 11 | | (65 | ) | (64 | ) | (201 | ) | (178 | ) |
Other labour costs(1) | | | (262 | ) | (259 | ) | (772 | ) | (776 | ) |
Less: | | | | | | | | | | |
Capitalized labour | | | 280 | | 270 | | 823 | | 783 | |
Total labour costs | | | (1,112 | ) | (1,098 | ) | (3,363 | ) | (3,291 | ) |
Cost of revenues(2) | | | (1,785 | ) | (1,678 | ) | (5,215 | ) | (4,983 | ) |
Other operating costs(3) | | | (523 | ) | (516 | ) | (1,534 | ) | (1,494 | ) |
Total operating costs | | | (3,420 | ) | (3,292 | ) | (10,112 | ) | (9,768 | ) |
| (1) | Other labour costs include contractor and outsourcing costs. |
| (2) | Cost of revenues includes costs of wireless devices and other equipment sold, network and content costs, and payments to other carriers. |
| (3) | Other operating costs include marketing, advertising and sales commission costs, bad debt expense, taxes other than income taxes, information technology (IT) costs, professional service fees and rent. |
| Note 6 Severance, acquisition and other costs |
| | THREE MONTHS | NINE MONTHS |
| FOR THE PERIOD ENDED SEPTEMBER 30 | 2018 | | 2017 | | 2018 | | 2017 | |
Severance | (52 | ) | (14 | ) | (76 | ) | (61 | ) |
Acquisition and other | (2 | ) | (9 | ) | (2 | ) | (82 | ) |
Total severance, acquisition and other costs | (54 | ) | (23 | ) | (78 | ) | (143 | ) |
| 48 BCE Inc. 2018 THIRD QUARTER SHAREHOLDER REPORT |
|
| | |
| | Notes to consolidated financial statements |
Severance costs consist of charges related to workforce reduction initiatives and include a 4% reduction in management workforce across BCE in 2018.
| ACQUISITION AND OTHER COSTS |
Acquisition and other costs consist of transaction costs, such as legal and financial advisory fees, related to completed or potential acquisitions, employee severance costs related to the purchase of a business, the costs to integrate acquired companies into our operations and litigation costs, when they are significant. Acquisition costs also include a loss on transfer of spectrum licences relating to the MTS acquisition in 2017.
| | | | THREE MONTHS | NINE MONTHS |
| FOR THE PERIOD ENDED SEPTEMBER 30 | NOTE | | 2018 | | 2017 | | 2018 | | 2017 | |
Net mark-to-market (losses) gains on derivatives used to economically hedge equity settled share-based compensation plans(1) | | | (7 | ) | 10 | | (114 | ) | 35 | |
Equity losses from investments in associates and joint ventures | | | | | | | | | | |
Operations | | | (26 | ) | (39 | ) | (29 | ) | (8 | ) |
Losses on investments(2) | | | — | | — | | (20 | ) | (2 | ) |
Early debt redemption costs | 10 | | (2 | ) | (16 | ) | (20 | ) | (20 | ) |
Impairment of assets | | | (1 | ) | — | | (5 | ) | — | |
Losses on retirements and disposals of property, plant and equipment and intangible assets | | | (4 | ) | (8 | ) | (5 | ) | (34 | ) |
Losses on investments | | | — | | — | | — | | (12 | ) |
Other(1) | | | (1 | ) | (3 | ) | 3 | | 1 | |
Total other expense | | | (41 | ) | (56 | ) | (190 | ) | (40 | ) |
| (1) | We have reclassified amounts from the previous period to make them consistent with the presentation for the current period. |
| (2) | The $20 million loss in 2018 represents BCE’s share of an obligation to repurchase at fair value the minority interest in one of BCE’s joint ventures. The obligation is marked to market each reporting period and the gain or loss on investment is recorded as equity gains or losses from investments in associates and joint ventures. |
| Note 8 Earnings per share |
The following table shows the components used in the calculation of basic and diluted earnings per common share for earnings attributable to common shareholders.
| | THREE MONTHS | NINE MONTHS |
| FOR THE PERIOD ENDED SEPTEMBER 30 | 2018 | | 2017 | | 2018 | | 2017 | |
Net earnings attributable to common shareholders – basic | 814 | | 803 | | 2,179 | | 2,210 | |
Dividends declared per common share (in dollars) | 0.7550 | | 0.7175 | | 2.2650 | | 2.1525 | |
Weighted average number of common shares outstanding (in millions) | | | | | | | | |
Weighted average number of common shares outstanding – basic | 898.0 | | 900.4 | | 898.7 | | 892.2 | |
Assumed exercise of stock options(1) | 0.3 | | 0.7 | | 0.3 | | 0.7 | |
Weighted average number of common shares outstanding – diluted (in millions) | 898.3 | | 901.1 | | 899.0 | | 892.9 | |
| (1) | The calculation of the assumed exercise of stock options includes the effect of the average unrecognized future compensation cost of dilutive options. It excludes options for which the exercise price is higher than the average market value of a BCE common share. The number of excluded options was 12,020,070 for both the third quarter and first nine months of 2018, compared to 5,808,258 for both the third quarter and the first nine months of 2017. |
BCE Inc. 2018 THIRD QUARTER SHAREHOLDER REPORT 49 |
|
| | |
| Notes to consolidated financial statements | |
During Q3 2018 and 2017, various uncertain tax positions were settled, which resulted in the reversal of deferred tax liabilities.
2018
On September 21, 2018, Bell Canada redeemed, prior to maturity, its 3.35% Series M-25 medium term notes (MTN) debentures, having an outstanding principal amount of $1 billion, which were due on June 18, 2019.
On September 14, 2018, Bell Canada issued 4.464% Series US-1 Notes under its 2016 trust indenture, with a principal amount of US $400 million (CAD $526 million), which mature on April 1, 2048. These Series US-1 Notes represent a re-opening of, and form a single series with, Bell Canada’s outstanding 4.464% Series US-1 Notes that were issued on March 29, 2018.
On August 21, 2018, Bell Canada issued 3.80% Series M-48 MTN debentures under its 1997 trust indenture, with a principal amount of $1 billion, which mature on August 21, 2028.
On May 4, 2018, Bell Canada redeemed, prior to maturity, its 3.50% Series M-28 MTN debentures, having an outstanding principal amount of $400 million, which were due on September 10, 2018.
On April 16, 2018, Bell Canada redeemed, prior to maturity, its 4.59% Series 9 notes, having an outstanding principal amount of $200 million, which were due on October 1, 2018. In addition, on the same date, Bell Canada redeemed, prior to maturity, its 5.52% Series M-33 debentures, having an outstanding principal amount of $300 million, which were due on February 26, 2019.
On March 29, 2018, Bell Canada issued 4.464% Series US-1 notes under its 2016 trust indenture, with a principal amount of US $750 million (CAD $967 million), which mature on April 1, 2048.
On March 12, 2018, Bell Canada issued 3.35% Series M-47 MTN debentures under its 1997 trust indenture, with a principal amount of $500 million, which mature on March 12, 2025.
The Series US-1 Notes have been hedged for foreign currency fluctuations through cross currency interest rate swaps. See Note 12,Financial assets and liabilities, for additional details.
For the three and nine months ended September 30, 2018, we incurred early debt redemption charges of $2 million and $20 million, respectively, which were recorded in Other expense in the income statement.
Subsequent to quarter end, on October 15, 2018, Bell Canada redeemed, prior to maturity, its 5.625% Series 8 notes, having an outstanding principal amount of $200 million, which were due on December 16, 2019.
Also subsequent to quarter end, on October 17, 2018, Bell Canada increased the total amount of its committed revolving and expansion credit facilities from $3.5 billion to $4.0 billion by adding a new $500 million revolving facility expiring in November 2019. Bell Canada has the option, subject to certain conditions, to convert advances outstanding under the new $500 million revolving facility into a one-year term loan. In addition, Bell Canada extended the term of its existing $2.5 billion committed revolving credit facility by one year to November 2023 and the term of its existing $1.0 billion committed expansion credit facility by one year to November 2021.
| Note 11 Post-employment benefit plans |
POST-EMPLOYMENT BENEFIT PLANS COST
We provide pension and other benefits for most of our employees. These include defined benefit (DB) pension plans, defined contribution (DC) pension plans and other post-employment benefits (OPEBs).
COMPONENTS OF POST-EMPLOYMENT BENEFIT PLANS SERVICE COST
| | THREE MONTHS | NINE MONTHS |
| FOR THE PERIOD ENDED SEPTEMBER 30 | 2018 | | 2017 | | 2018 | | 2017 | |
DB pension | (53 | ) | (54 | ) | (159 | ) | (155 | ) |
DC pension | (25 | ) | (23 | ) | (82 | ) | (78 | ) |
OPEBs | (1 | ) | (1 | ) | (3 | ) | (4 | ) |
Plan amendment gain on OPEBs | — | | — | | — | | 16 | |
Less: | | | | | | | | |
Capitalized benefit plans cost | 14 | | 14 | | 43 | | 43 | |
Total post-employment benefit plans service cost included in operating costs | (65 | ) | (64 | ) | (201 | ) | (178 | ) |
Other costs recognized in severance, acquisition and other costs | — | | — | | (4 | ) | (4 | ) |
Total post-employment benefit plans service cost | (65 | ) | (64 | ) | (205 | ) | (182 | ) |
| 50 BCE Inc. 2018 THIRD QUARTER SHAREHOLDER REPORT |
|
| | |
| | Notes to consolidated financial statements |
COMPONENTS OF POST-EMPLOYMENT BENEFIT PLANS FINANCING COST
| | THREE MONTHS | NINE MONTHS |
| FOR THE PERIOD ENDED SEPTEMBER 30 | 2018 | | 2017 | | 2018 | | 2017 | |
DB pension | (6 | ) | (5 | ) | (17 | ) | (14 | ) |
OPEBs | (11 | ) | (13 | ) | (34 | ) | (40 | ) |
Total interest on post-employment benefit obligations | (17 | ) | (18 | ) | (51 | ) | (54 | ) |
| Note 12 Financial assets and liabilities |
FAIR VALUE
The following table provides the fair value details of financial instruments measured at amortized cost in the statements of financial position.
| | | SEPTEMBER 30, 2018 | DECEMBER 31, 2017 |
| CLASSIFICATION | FAIR VALUE METHODOLOGY | CARRYING
VALUE | | FAIR
VALUE | | CARRYING
VALUE | | FAIR
VALUE | |
CRTC tangible benefits obligation | Trade payables and other liabilities and non-current liabilities | Present value of estimated future cash flows discounted using observable market interest rates | 68 | | 68 | | 111 | | 110 | |
CRTC deferral account obligation | Trade payables and other liabilities and non-current liabilities | Present value of estimated future cash flows discounted using observable market interest rates | 113 | | 116 | | 124 | | 128 | |
Debt securities, finance leases and other debt | Debt due within one year and long-term debt | Quoted market price of debt or present value of future cash flows discounted using observable market interest rates | 20,338 | | 21,687 | | 19,321 | | 21,298 | |
The following table provides the fair value details of financial instruments measured at fair value in the statements of financial position.
| | | | FAIR VALUE |
| CLASSIFICATION | CARRYING VALUE
OF ASSET
(LIABILITY) | | QUOTED PRICES IN
ACTIVE MARKETS
FOR IDENTICAL
ASSETS (LEVEL 1) | | OBSERVABLE
MARKET DATA
(LEVEL 2) (1) | | NON-OBSERVABLE
MARKET INPUTS
(LEVEL 3) (2) | |
September 30, 2018 | | | | | | | | | |
Publicly-traded and privately-held investments | Other non-current assets | 104 | | 1 | | — | | 103 | |
Derivative financial instruments | Other current assets, trade payables and other liabilities, other non-current assets and liabilities | (162 | ) | — | | (162 | ) | — | |
Maple Leaf Sports & Entertainment Ltd. (MLSE) financial liability(3) | Trade payables and other liabilities | (135 | ) | — | | — | | (135 | ) |
Other | Other non-current assets and liabilities | 69 | | — | | 115 | | (46 | ) |
December 31, 2017 | | | | | | | | | |
Publicly-traded and privately-held investments | Other non-current assets | 103 | | 1 | | — | | 102 | |
Derivative financial instruments | Other current assets, trade payables and other liabilities, other non-current assets and liabilities | (48 | ) | — | | (48 | ) | — | |
MLSE financial liability(3) | Trade payables and other liabilities | (135 | ) | — | | — | | (135 | ) |
Other | Other non-current assets and liabilities | 60 | | — | | 106 | | (46 | ) |
| (1) | Observable market data such as equity prices, interest rates, swap rate curves and foreign currency exchange rates. |
| (2) | Non-observable market inputs such as discounted cash flows and earnings multiples. A reasonable change in our assumptions would not result in a significant increase (decrease) to our level 3 financial instruments. |
| (3) | Represents BCE’s obligation to repurchase the BCE Master Trust Fund’s (Master Trust) 9% interest in MLSE at a price not less than an agreed minimum price should the Master Trust exercise its put option. The obligation to repurchase is marked to market each reporting period and the gain or loss is recorded in Other expense in the income statements. |
BCE Inc. 2018 THIRD QUARTER SHAREHOLDER REPORT 51 |
|
| | |
| Notes to consolidated financial statements | |
We use forward contracts, options and cross currency interest rate swaps to manage foreign currency risk related to anticipated purchases and sales and certain foreign currency denominated debt.
A 10% depreciation (appreciation) in the value of the Canadian dollar relative to the U.S. dollar would result in a gain (loss) of $1 million ($4 million) recognized in net earnings at September 30, 2018 and a gain (loss) of $125 million ($133 million) recognized inOther comprehensive income (loss)at September 30, 2018, with all other variables held constant.
In Q3 2018, we entered into additional cross currency interest rate swaps with a notional amount of $400 million in U.S. dollars ($526 million in Canadian dollars). In Q1 2018, we entered into cross currency interest rate swaps with a notional amount of $750 million in U.S. dollars ($967 million in Canadian dollars). These cross currency interest rate swaps are used to hedge the U.S. currency exposure of our Series US-1 Notes maturing in 2048. See Note 10,Debt, for additional details.
The following table provides further details on our outstanding foreign currency forward contracts and options as at September 30, 2018.
| TYPE OF HEDGE | BUY CURRENCY | | AMOUNT TO RECEIVE | | SELL CURRENCY | | AMOUNT TO PAY | | MATURITY | | HEDGED ITEM | |
Cash flow | USD | | 2,458 | | CAD | | 3,214 | | 2018-2019 | | Commercial paper | |
Cash flow | USD | | 226 | | CAD | | 292 | | 2018 | | Anticipated transactions | |
Cash flow | PHP | | 343 | | CAD | | 8 | | 2018 | | Anticipated transactions | |
Cash flow | CAD | | 31 | | USD | | 24 | | 2018-2019 | | Anticipated transactions | |
Cash flow | USD | | 775 | | CAD | | 968 | | 2019 | | Anticipated transactions | |
Cash flow | USD | | 76 | | CAD | | 96 | | 2020-2021 | | Anticipated transactions | |
Economic | USD | | 8 | | CAD | | 11 | | 2018 | | Anticipated transactions | |
Economic – call options | USD | | 17 | | CAD | | 20 | | 2018 | | Anticipated transactions | |
Economic – put options | USD | | 83 | | CAD | | 100 | | 2018 | | Anticipated transactions | |
A 1% increase (decrease) in interest rates would result in a decrease (increase) of $30 million in net earnings at September 30, 2018.
We use equity forward contracts on BCE’s common shares to economically hedge the cash flow exposure related to the settlement of equity settled share-based compensation plans and the equity price risk related to a cash-settled share-based payment plan. The fair value of our equity forward contracts at September 30, 2018 was a liability of $101 million.
A 5% increase (decrease) in the market price of BCE’s common shares at September 30, 2018 would result in a gain (loss) of $33 million recognized in net earnings, with all other variables held constant.
NORMAL COURSE ISSUER BID PROGRAM (NCIB)
In Q1 2018, BCE repurchased and canceled 3,085,697 common shares for a total cost of $175 million. Of the total cost, $69 million represents stated capital and $3 million represents the reduction of the contributed surplus attributable to these common shares. The remaining $103 million was charged to the deficit.
| CONVERSION AND DIVIDEND RATE RESET OF FIRST PREFERRED SHARES |
The annual fixed dividend rate on BCE’s Cumulative Redeemable First Preferred Shares, Series AQ, was reset for the next five years, effective September 30, 2018, at 4.812% from 4.25%.
On March 1, 2018, 397,181 of BCE’s 5,069,935 fixed-rate Cumulative Redeemable First Preferred Shares, Series AC (Series AC Preferred Shares) were converted, on a one-for-one basis, into floating rate Cumulative Redeemable First Preferred Shares, Series AD (Series AD Preferred Shares). In addition, on March 1, 2018, 5,356,937 of BCE’s 14,930,065 Series AD Preferred Shares were converted, on a one-for-one basis, into Series AC Preferred Shares.
The annual fixed dividend rate on BCE’s Series AC Preferred Shares was reset for the next five years, effective March 1, 2018, at 4.38% from 3.55%. The Series AD Preferred Shares continue to pay a monthly floating cash dividend.
| 52 BCE Inc. 2018 THIRD QUARTER SHAREHOLDER REPORT |
|
| | |
| | Notes to consolidated financial statements |
| Note 14 Share-based payments |
The following share-based payment amounts are included in the income statements as operating costs.
| | THREE MONTHS | NINE MONTHS |
| FOR THE PERIOD ENDED SEPTEMBER 30 | 2018 | | 2017 | | 2018 | | 2017 | |
Employee savings plan (ESP) | (7 | ) | (7 | ) | (21 | ) | (21 | ) |
Restricted share units (RSUs) and performance share units (PSUs) | (10 | ) | (10 | ) | (40 | ) | (37 | ) |
Other(1) | (2 | ) | (2 | ) | (8 | ) | (7 | ) |
Total share-based payments | (19 | ) | (19 | ) | (69 | ) | (65 | ) |
| (1) | Includes deferred share plan (DSP), deferred share units (DSUs) and stock options. |
The following tables summarize the change in outstanding ESP shares, RSUs/PSUs, DSUs and stock options for the period ended September 30, 2018.
ESP
| NUMBER OF
ESP SHARES | |
Unvested contributions, January 1, 2018 | 1,039,030 | |
Contributions(1) | 516,075 | |
Dividends credited | 41,160 | |
Vested | (388,647 | ) |
Forfeited | (110,089 | ) |
Unvested contributions, September 30, 2018 | 1,097,529 | |
| (1) | The weighted average fair value of the shares contributed during the nine months ended September 30, 2018 was $55. |
RSUs/PSUs
| NUMBER OF
RSUs/PSUs | |
Outstanding, January 1, 2018 | 2,740,392 | |
Granted(1) | 961,966 | |
Dividends credited | 108,824 | |
Settled | (1,014,567 | ) |
Forfeited | (42,292 | ) |
Outstanding, September 30, 2018 | 2,754,323 | |
| (1) | The weighted average fair value of the RSUs/PSUs granted during the nine months ended September 30, 2018 was $57. |
DSUs
| NUMBER OF DSUs | |
Outstanding, January 1, 2018 | 4,309,528 | |
Issued(1) | 82,307 | |
Settlement of RSUs/PSUs | 112,675 | |
Dividends credited | 175,790 | |
Settled | (233,854 | ) |
Outstanding, September 30, 2018 | 4,446,446 | |
| (1) | The weighted average fair value of the DSUs issued during the nine months ended September 30, 2018 was $55. |
BCE Inc. 2018 THIRD QUARTER SHAREHOLDER REPORT 53 |
|
| | |
| Notes to consolidated financial statements | |
STOCK OPTIONS
| NUMBER OF
OPTIONS | | WEIGHTED AVERAGE
EXERCISE PRICE ($) | |
Outstanding, January 1, 2018 | 10,490,249 | | 55 | |
Granted | 3,656,169 | | 57 | |
Exercised(1) | (90,222 | ) | 42 | |
Forfeited | (39,669 | ) | 58 | |
Outstanding, September 30, 2018 | 14,016,527 | | 56 | |
Exercisable, September 30, 2018 | 4,576,307 | | 52 | |
| (1) | The weighted average share price for options exercised during the nine months ended September 30, 2018 was $55. |
ASSUMPTIONS USED IN STOCK OPTION PRICING MODEL
The fair value of options granted was determined using a variation of a binomial option pricing model that takes into account factors specific to the share incentive plans, such as the vesting period. The following table shows the principal assumptions used in the valuation.
| 2018 | |
Weighted average fair value per option granted | $ 2.13 | |
Weighted average share price | $ 57 | |
Weighted average exercise price | $ 57 | |
Dividend yield | 5 | % |
Expected volatility | 12 | % |
Risk-free interest rate | 2 | % |
Expected life (years) | 4 | |
Expected volatilities are based on the historical volatility of BCE’s share price. The risk-free rate used is equal to the yield available on Government of Canada bonds at the date of grant with a term equal to the expected life of the options.
| Note 15 Adoption of IFRS 15 |
As a result of adopting IFRS 15, we have changed the comparative figures for the three and nine months ended September 30, 2017 and the year ended December 31, 2017. The impacts of adopting IFRS 15 on our previously reported results for the three and nine months ended September 30, 2017 are provided below. The impacts of adopting IFRS 15 on our statement of financial position as at January 1, 2017 and December 31, 2017, our consolidated income statement and consolidated statement of cash flows for the year ended December 31, 2017, along with updated 2017 annual disclosures are included in Note 3,Adoption of IFRS 15, of our unaudited consolidated financial statements for the period ended March 31, 2018.
| 54 BCE Inc. 2018 THIRD QUARTER SHAREHOLDER REPORT |
|
| | |
| | Notes to consolidated financial statements |
| CONSOLIDATED INCOME STATEMENTS |
The table below shows the impacts of adopting IFRS 15 on our previously reported consolidated income statements for the three and nine months ended September 30, 2017.
| | THREE MONTHS ENDED SEPTEMBER 30, 2017 | NINE MONTHS ENDED SEPTEMBER 30, 2017 |
| (IN MILLIONS OF CANADIAN DOLLARS, EXCEPT SHARE AMOUNTS) | 2017 AS
PREVIOUSLY
REPORTED | | IFRS 15
IMPACTS | | 2017 UPON
ADOPTION
OF IFRS 15 | | 2017 AS
PREVIOUSLY
REPORTED | | IFRS 15
IMPACTS | | 2017 UPON
ADOPTION
OF IFRS 15 | |
Operating revenues | 5,678 | | 19 | | 5,697 | | 16,761 | | (40 | ) | 16,721 | |
Operating costs | (3,312 | ) | 20 | | (3,292 | ) | (9,800 | ) | 32 | | (9,768 | ) |
Severance, acquisition and other costs | (23 | ) | — | | (23 | ) | (143 | ) | — | | (143 | ) |
Depreciation | (765 | ) | 5 | | (760 | ) | (2,256 | ) | 5 | | (2,251 | ) |
Amortization | (208 | ) | 1 | | (207 | ) | (604 | ) | 2 | | (602 | ) |
Finance costs | | | | | | | | | | | | |
Interest expense | (242 | ) | — | | (242 | ) | (714 | ) | — | | (714 | ) |
Interest on post-employment benefit obligations | (18 | ) | — | | (18 | ) | (54 | ) | — | | (54 | ) |
Other expense | (56 | ) | — | | (56 | ) | (40 | ) | — | | (40 | ) |
Income taxes | (237 | ) | (12 | ) | (249 | ) | (797 | ) | — | | (797 | ) |
Net earnings | 817 | | 33 | | 850 | | 2,353 | | (1 | ) | 2,352 | |
Net earnings attributable to: | | | | | | | | | | | | |
Common shareholders | 770 | | 33 | | 803 | | 2,211 | | (1 | ) | 2,210 | |
Preferred shareholders | 31 | | — | | 31 | | 94 | | — | | 94 | |
Non-controlling interest | 16 | | — | | 16 | | 48 | | — | | 48 | |
Net earnings | 817 | | 33 | | 850 | | 2,353 | | (1 | ) | 2,352 | |
Net earnings per common share – basic and diluted | 0.86 | | 0.04 | | 0.90 | | 2.48 | | — | | 2.48 | |
Average number of common shares outstanding – basic (millions) | 900.4 | | — | | 900.4 | | 892.2 | | — | | 892.2 | |
The table below provides a reconciliation of our deficit at September 30, 2017 from amounts previously reported in 2017 to the amounts reported under IFRS 15. All amounts are after tax.
| AT SEPTEMBER 30, 2017 | |
Total deficit as previously reported | (5,873 | ) |
Timing of revenue recognition | 804 | |
Cost to obtain a contract | 257 | |
Total deficit upon adoption of IFRS 15 | (4,812 | ) |
BCE Inc. 2018 THIRD QUARTER SHAREHOLDER REPORT 55 |
|
| | |
| Notes to consolidated financial statements | |
| CONSOLIDATED STATEMENT OF CASH FLOWS |
The table below shows the impacts of adopting IFRS 15 on select line items of our previously reported 2017 statement of cash flows for the three and nine months ended September 30, 2017.
| THREE MONTHS ENDED SEPTEMBER 30, 2017 | NINE MONTHS ENDED SEPTEMBER 30, 2017 |
| 2017 AS
PREVIOUSLY
REPORTED | | IFRS 15 IMPACTS | | 2017 UPON
ADOPTION
OF IFRS 15 | | 2017 AS
PREVIOUSLY
REPORTED | | IFRS 15 IMPACTS | | 2017 UPON
ADOPTION
OF IFRS 15 | |
Cash flows from operating activities | | | | | | | | | | | | |
Net earnings | 817 | | 33 | | 850 | | 2,353 | | (1 | ) | 2,352 | |
Depreciation and amortization | 973 | | (6 | ) | 967 | | 2,860 | | (7 | ) | 2,853 | |
Income taxes | 237 | | 12 | | 249 | | 797 | | — | | 797 | |
Net change in operating assets and liabilities | 308 | | (39 | ) | 269 | | 316 | | 8 | | 324 | |
Cash flows from operating activities | 2,233 | | — | | 2,233 | | 5,700 | | — | | 5,700 | |
| 56 BCE Inc. 2018 THIRD QUARTER SHAREHOLDER REPORT |
|
| This document has been filed by BCE Inc. with the Canadian provincial securities regulatory authorities and the U.S. Securities and Exchange Commission. It can be found on BCE Inc.’s website at BCE.ca, on SEDAR at www.sedar.comand on EDGAR at www.sec.govor is available upon request from: INVESTOR RELATIONS Building A, 8th floor
1 Carrefour Alexander-Graham-Bell
Verdun, Québec H3E 3B3 e-mail: investor.relations@bce.ca
tel: 1-800-339-6353
fax: 514-786-3970 BCE.ca For additional copies of this document, please contact investor relations. | For further information concerning BCE Inc.’s Dividend Reinvestment and Stock Purchase Plan (DRP), direct deposit of dividend payments, the elimination of multiple mailings or the receipt of quarterly reports, please contact: AST TRUST COMPANY (CANADA) 1 Toronto Street, Suite 1200
Toronto, Ontario M5C 2V6 tel: 416 682-3861 or 1 800 561-0934
fax: 514 985-8843 or 1 888 249-6189
e-mail: bce@astfinancial.com |
Pour obtenir un exemplaire de la version française de ce document, contactez les Relations avec les investisseurs.