Management's discussion and analysis
Table of contents
Management’s discussion and analysis In this management’s discussion and analysis (MD&A), we, us, our, BCE and the company mean, as the context may require, either BCE Inc. or, collectively, BCE Inc., Bell Canada, their subsidiaries, joint arrangements and associates. Bell means, as the context may require, either Bell Canada or, collectively, Bell Canada, its subsidiaries, joint arrangements and associates.
All amounts in this MD&A are in millions of Canadian dollars, except where noted. Please refer to section 8, Non-GAAP financial measures, other financial measures and key performance indicators (KPIs) for a list of defined non-GAAP financial measures, other financial measures and KPIs.
Please refer to BCE’s unaudited consolidated financial statements for the second quarter of 2024 (Q2 2024 Financial Statements) when reading this MD&A. We also encourage you to read BCE’s MD&A for the year ended December 31, 2023 dated March 7, 2024 (BCE 2023 Annual MD&A) as updated in BCE's MD&A for the first quarter of 2024 dated May 1, 2024 (BCE 2024 First Quarter MD&A). In preparing this MD&A, we have taken into account information available to us up to July 31, 2024, the date of this MD&A, unless otherwise stated.
You will find additional information relating to BCE, including BCE’s annual information form for the year ended December 31, 2023 dated March 7, 2024 and recent financial reports, including the BCE 2023 Annual MD&A and the BCE 2024 First Quarter MD&A, on BCE’s website at BCE.ca, on SEDAR+ at sedarplus.ca and on EDGAR at sec.gov.
Documents and other information contained in BCE’s website or in any other site referred to in BCE’s website or in this MD&A are not part of this MD&A and are not incorporated by reference herein.
This MD&A comments on our business operations, performance, financial position and other matters for the three months (Q2) and six months (YTD) ended June 30, 2024 and 2023.
Caution regarding forward-looking statements This MD&A and, in particular, but without limitation, section 1.2, Key corporate and business developments, section 3.1, Bell CTS, the section and sub-sections entitled Assumptions and section 4.7, Liquidity, contain forward-looking statements. These forward-looking statements include, without limitation, statements relating to the proposed disposition of Northwestel Inc. (Northwestel), the intended use by Bell Canada of the proceeds from the proposed disposition and the planned continuation of a Bell Canada partnership with Northwestel beyond transaction close, the intended use of the net proceeds of Bell Canada’s May 2024 public offering, the expected timing of the opening of 167 Best Buy Express retail stores across Canada, BCE’s network deployment plans and related planned capital expenditures, the sources of liquidity we expect to use to meet our 2024 cash requirements, BCE’s business outlook, objectives, plans and strategic priorities, and other statements that do not refer to historical facts. A statement we make is forward-looking when it uses what we know and expect today to make a statement about the future. Forward-looking statements are typically identified by the words assumption, goal, guidance, objective, outlook, project, strategy, target, commitment and other similar expressions or future or conditional verbs such as aim, anticipate, believe, could, expect, intend, may, plan, seek, should, strive and will. All such forward-looking statements are made pursuant to the safe harbour provisions of applicable Canadian securities laws and of the United States (U.S.) Private Securities Litigation Reform Act of 1995.
Unless otherwise indicated by us, forward-looking statements in this MD&A describe our expectations as at July 31, 2024 and, accordingly, are subject to change after that date. Except as may be required by applicable securities laws, we do not undertake any obligation to update or revise any forward-looking statements, whether as a result of new information, future events or otherwise.
Forward-looking statements, by their very nature, are subject to inherent risks and uncertainties and are based on several assumptions, both general and specific, which give rise to the possibility that actual results or events could differ materially from our expectations expressed in, or implied by, such forward-looking statements and that our business outlook, objectives, plans and strategic priorities may not be achieved. These statements are not guarantees of future performance or events, and we caution you against relying on any of these forward-looking statements. Forward-looking statements are presented in this MD&A for the purpose of assisting investors and others in understanding our objectives, strategic priorities and business outlook as well as our anticipated operating environment. Readers are cautioned, however, that such information may not be appropriate for other purposes.
We have made certain economic, market, operational and other assumptions in preparing the forward-looking statements contained in this MD&A and, in particular, but without limitation, the forward-looking statements contained in the previously mentioned sections of this MD&A. These assumptions include, without limitation, the assumptions described in the section and sub-sections of this MD&A entitled Assumptions, which section and sub-sections are incorporated by reference in this cautionary statement. Subject to various factors, we believe that our assumptions were reasonable at July 31, 2024. If our assumptions turn out to be inaccurate, our actual results could be materially different from what we expect.
4 BCE Inc. 2024 SECOND QUARTER SHAREHOLDER REPORT
Important risk factors that could cause actual results or events to differ materially from those expressed in, or implied by, the previously-mentioned forward-looking statements and other forward-looking statements contained in this MD&A, include, but are not limited to: the negative effect of adverse economic conditions, including a potential recession, elevated inflation, high interest rates and financial and capital market volatility, and the resulting negative impact on business and customer spending and the demand for our products and services; the negative effect of adverse conditions associated with geopolitical events; regulatory initiatives, proceedings and decisions, government consultations and government positions that negatively affect us and influence our business including, without limitation, concerning mandatory access to networks, spectrum auctions, the imposition of consumer-related codes of conduct, approval of acquisitions, broadcast and spectrum licensing, foreign ownership requirements, privacy and cybersecurity obligations and control of copyright piracy; the inability to implement enhanced compliance frameworks and to comply with legal and regulatory obligations; unfavourable resolution of legal proceedings; the intensity of competitive activity and the failure to effectively respond to evolving competitive dynamics; the level of technological substitution and the presence of alternative service providers contributing to disruptions and disintermediation in each of our business segments; changing customer behaviour and the expansion of cloud-based, over-the-top (OTT) and other alternative solutions; advertising market pressures from economic conditions, fragmentation and non-traditional/global digital services; rising content costs and challenges in our ability to acquire or develop key content; high Canadian Internet and smartphone penetration; the failure to evolve and transform our networks, systems and operations using next-generation technologies while lowering our cost structure, including the failure to transition from a traditional telecommunications company to a tech services and digital media company and meet customer expectations of product and service experience; the inability to drive a positive customer experience; the inability to protect our physical and non-physical assets from events such as information security attacks, unauthorized access or entry, fire and natural disasters; the failure to implement an effective data governance framework; the failure to attract, develop and retain a diverse and talented team capable of furthering our strategic imperatives and high-tech transformation; the potential deterioration in employee morale and engagement resulting from staff reductions, cost reductions or reorganizations and the de-prioritization of transformation initiatives due to staff reductions, cost reductions or reorganizations; the failure to adequately manage health and safety concerns; labour disruptions and shortages; the risk that we may need to incur significant capital expenditures to provide additional capacity and reduce network congestion; service interruptions or outages due to network failures or slowdowns; events affecting the functionality of, and our ability to protect, test, maintain, replace and upgrade, our networks, information technology (IT) systems, equipment and other facilities; the failure by other telecommunications carriers on which we rely to provide services to complete planned and sufficient testing, maintenance, replacement or upgrade of their networks, equipment and other facilities, which could disrupt our operations including through network or other infrastructure failures; the complexity of our operations and IT systems and the failure to implement or maintain highly effective processes and IT systems; in-orbit and other operational risks to which the satellites used to provide our satellite television (TV) services are subject; the inability to access adequate sources of capital and generate sufficient cash flows from operating activities to meet our cash requirements, fund capital expenditures and provide for planned growth; uncertainty as to whether dividends will be declared or the dividend on common shares will be increased by BCE’s board of directors; the failure to reduce costs and adequately assess investment priorities, as well as unexpected increases in costs; the inability to manage various credit, liquidity and market risks; the failure to evolve practices to effectively monitor and control fraudulent activities; new or higher taxes due to new tax laws or changes thereto or in the interpretation thereof, and the inability to predict the outcome of government audits; the impact on our financial statements and estimates from a number of factors; pension obligation volatility and increased contributions to post-employment benefit plans; our dependence on third-party suppliers, outsourcers and consultants to provide an uninterrupted supply of the products and services we need; the failure of our vendor selection, governance and oversight processes, including our management of supplier risk in the areas of security, data governance and responsible procurement; the quality of our products and services and the extent to which they may be subject to defects or fail to comply with applicable government regulations and standards; reputational risks and the inability to meaningfully integrate environmental, social and governance (ESG) considerations into our business strategy and operations; the failure to take appropriate actions to adapt to current and emerging environmental impacts, including climate change; pandemics, epidemics and other health risks, including health concerns about radio frequency emissions from wireless communications devices and equipment; the inability to adequately manage social issues; the failure to develop and implement sufficient corporate governance practices; the adverse impact of various internal and external factors on our ability to achieve our ESG targets including, without limitation, those related to greenhouse gas emissions reduction and diversity, equity, inclusion and belonging; and the completion of the proposed disposition of Northwestel is subject to closing conditions, including the purchaser securing financing, the completion of confirmatory due diligence, and the receipt of the Competition Bureau’s approval and, as such, there can be no assurances that the proposed disposition will ultimately be consummated or that it will be consummated on the terms and conditions currently contemplated.
We caution that the foregoing list of risk factors is not exhaustive and other factors could also materially adversely affect us. Please see section 9, Business risks of the BCE 2023 Annual MD&A for a more complete description of the above-mentioned and other risks, which section, and the other sections of the BCE 2023 Annual MD&A referred to therein, are incorporated by reference in this cautionary statement. Please also see section 6, Regulatory environment in the BCE 2024 First Quarter MD&A and in this MD&A for an update to the regulatory initiatives and proceedings described in the BCE 2023 Annual MD&A, which sections 6 are incorporated by reference in this cautionary statement. Any of those risks could cause actual results or events to differ materially from our expectations expressed in, or implied by, the forward-looking statements set out in this MD&A. Except for the updates set out in section 6, Regulatory environment of the BCE 2024 First Quarter MD&A and in this MD&A, the risks described in the BCE 2023 Annual MD&A remain substantially unchanged.
Additional risks and uncertainties not currently known to us or that we currently deem to be immaterial may also have a material adverse effect on our business, financial condition, liquidity, financial results or reputation. We regularly consider potential acquisitions, dispositions, mergers, business combinations, investments, monetizations, joint ventures and other transactions, some of which may be significant. Except as otherwise indicated by us, forward-looking statements do not reflect the potential impact of any such transactions or of special items that may be announced or that may occur after July 31, 2024. The financial impact of these transactions and special items can be complex and depends on facts particular to each of them. We therefore cannot describe the expected impact in a meaningful way, or in the same way we present known risks affecting our business.
6 BCE Inc. 2024 SECOND QUARTER SHAREHOLDER REPORT
1 Overview
BCE Q2 2024 selected quarterly information
| | | | | | | | | | | | | | | | | | |
| Operating revenues | Net earnings | Adjusted EBITDA(1) | |
| $6,005 | $604 | $2,697 | |
| million | million | million | |
| (1.0%) vs. Q2 2023 | 52.1% vs. Q2 2023 | 2.0% vs. Q2 2023 | |
| | | | | | |
| | | | | | |
| Net earnings attributable to common shareholders | Adjusted net earnings(1) | Cash flows from operating activities | Free cash flow(1) | |
| $537 | $712 | $2,137 | $1,097 | |
| million | million | million | million | |
| 63.2% vs. Q2 2023 | (1.4%) vs. Q2 2023 | (9.6%) vs. Q2 2023 | 8.0% vs. Q2 2023 | |
| | |
BCE customer connections(7) |
| | | | | | | | | | | |
Total mobile phones(3) | Retail high-speed Internet(4)(5)(6) | Retail internet protocol television (IPTV)(2)(6) | Retail residential network access services (NAS) lines(6) |
| +3.1% | +4.2% | +5.6% | (8.4%) |
10.3 million subscribers at June 30, 2024 | 4.5 million subscribers at June 30, 2024 | 2.1 million subscribers at June 30, 2024 | 1.9 million subscribers at June 30, 2024 |
(1)Adjusted EBITDA is a total of segments measure, and adjusted net earnings and free cash flow are non-GAAP financial measures. See section 8.3, Total of segments measures and section 8.1, Non-GAAP financial measures in this MD&A for more information on these measures.
(2)In Q2 2024, we increased our retail IPTV subscriber base by 40,997 to align the deactivation policy for our Fibe TV streaming services to our traditional Fibe TV service.
(3)In Q1 2024, we adjusted our mobile phone postpaid subscriber base to remove very low to non-revenue generating business market subscribers of 105,802.
(4)In Q1 2024, we removed 11,645 turbo hubs subscribers from our retail high-speed Internet subscriber base as we are no longer actively marketing this product in our wireless-to-the-home footprint.
(5)In Q1 2024, our retail high-speed Internet subscriber base increased by 3,850 business subscribers as a result of a small acquisition.
(6)In Q2 2023, our retail high-speed Internet, retail IPTV and retail residential NAS lines subscriber bases increased by 35,080, 243 and 7,458 subscribers, respectively, as a result of small acquisitions.
(7)As of Q1 2024, we are no longer reporting retail satellite TV subscribers as this no longer represents a significant proportion of our revenues. As a result, satellite TV subscribers have been removed from our retail TV subscriber base, and we now report exclusively retail IPTV subscribers.
BCE income statements - selected information
| | | | | | | | | | | | | | | | | | | | | | | | | | |
| | Q2 2024 | Q2 2023 | $ change | % change | YTD 2024 | YTD 2023 | $ change | % change |
| Operating revenues | | | | | | | | |
| Service | 5,308 | 5,303 | 5 | | 0.1 | % | 10,500 | 10,525 | (25) | | (0.2 | %) |
| Product | 697 | 763 | (66) | | (8.7 | %) | 1,516 | 1,595 | (79) | | (5.0 | %) |
| Total operating revenues | 6,005 | 6,066 | (61) | | (1.0 | %) | 12,016 | 12,120 | (104) | | (0.9 | %) |
| Operating costs | (3,308) | (3,421) | 113 | | 3.3 | % | (6,754) | (6,937) | 183 | | 2.6 | % |
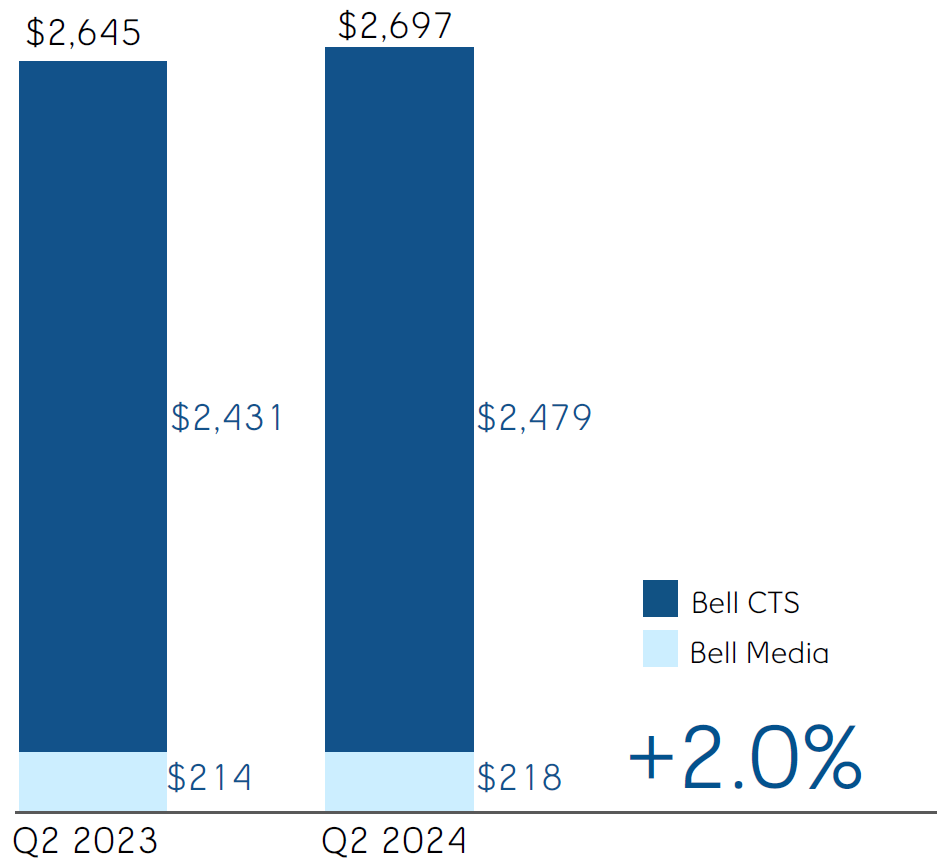
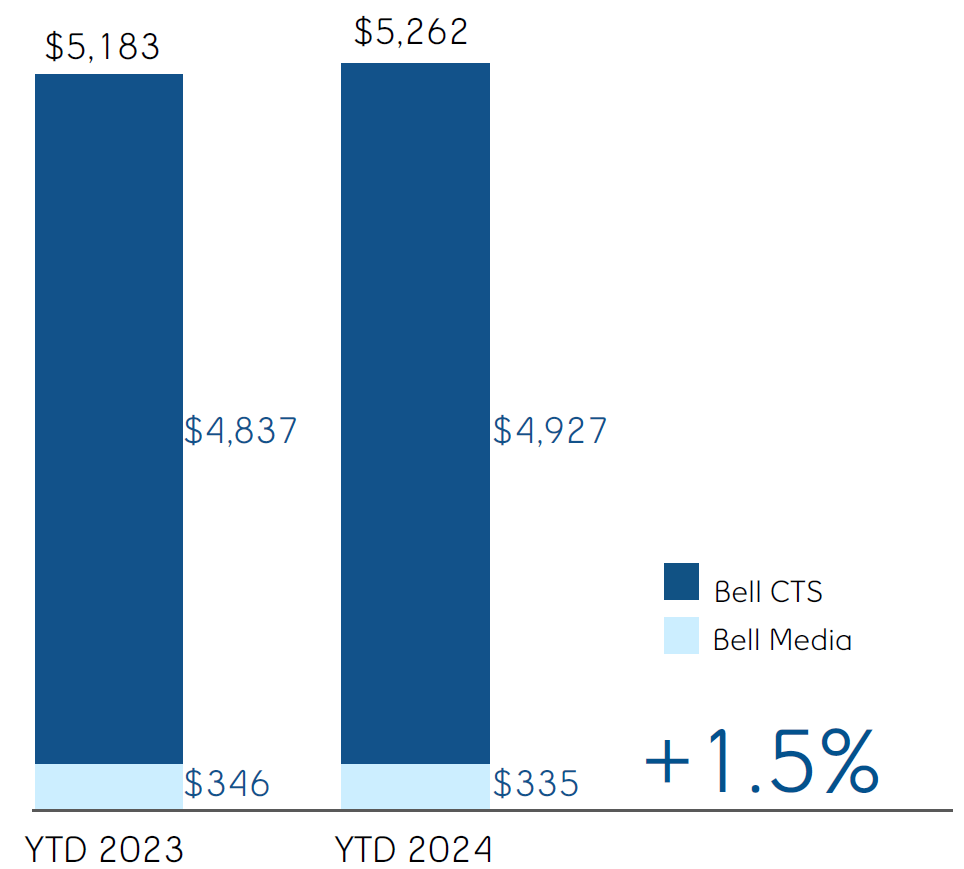
| Adjusted EBITDA | 2,697 | 2,645 | 52 | | 2.0 | % | 5,262 | 5,183 | 79 | | 1.5 | % |
Adjusted EBITDA margin(1) | 44.9 | % | 43.6 | % | | 1.3 pts | 43.8 | % | 42.8 | % | | 1.0 pts |
| | | | | | | | |
| | | | | | | | |
| | | | | | | | |
| | | | | | | | |
| | | | | | | | |
| | | | | | | | |
| | | | | | | | |
| | | | | | | | |
| | | | | | | | |
| | | | | | | | |
| | | | | | | | |
| | | | | | | | |
| | | | | | | | |
| | | | | | | | |
| | | | | | | | |
| | | | | | | | |
| Net earnings attributable to: | | | | | | | | |
| Common shareholders | 537 | 329 | 208 | | 63.2 | % | 939 | 1,054 | (115) | | (10.9 | %) |
| Preferred shareholders | 46 | 46 | — | | — | | 93 | 92 | 1 | | 1.1 | % |
| Non-controlling interest | 21 | 22 | (1) | | (4.5 | %) | 29 | 39 | (10) | | (25.6 | %) |
| Net earnings | 604 | 397 | 207 | | 52.1 | % | 1,061 | 1,185 | (124) | | (10.5 | %) |
| Adjusted net earnings | 712 | 722 | (10) | | (1.4 | %) | 1,366 | 1,494 | (128) | | (8.6 | %) |
| | | | | | | | |
| | | | | | | | |
| Net earnings per common share (EPS) | 0.59 | 0.37 | 0.22 | 59.5 | % | 1.03 | 1.16 | (0.13) | | (11.2 | %) |
Adjusted EPS(2) | 0.78 | 0.79 | (0.01) | | (1.3 | %) | 1.50 | 1.64 | (0.14) | | (8.5 | %) |
(1)Adjusted EBITDA margin is defined as adjusted EBITDA divided by operating revenues. Refer to section 8.6, KPIs in this MD&A for more information on this measure.
(2)Adjusted EPS is a non-GAAP ratio. Refer to section 8.2, Non-GAAP ratios in this MD&A for more information on this measure.
BCE statements of cash flows – selected information
| | | | | | | | | | | | | | | | | | | | | | | | | | |
| | Q2 2024 | Q2 2023 | $ change | % change | YTD 2024 | YTD 2023 | $ change | % change |
| Cash flows from operating activities | 2,137 | | 2,365 | | (228) | | (9.6 | %) | 3,269 | | 3,612 | | (343) | | (9.5 | %) |
| Capital expenditures | (978) | | (1,307) | | 329 | | 25.2 | % | (1,980) | | (2,393) | | 413 | | 17.3 | % |
| Free cash flow | 1,097 | | 1,016 | | 81 | | 8.0 | % | 1,182 | | 1,101 | | 81 | | 7.4 | % |
Q2 2024 financial highlights
BCE operating revenues decreased by 1.0% in Q2 2024, compared to the same period last year. This year-over-year decrease was driven by lower product revenues of 8.7%, resulting from lower consumer electronic sales at The Source (Bell) Electronics Inc. (The Source) due to retail store closures related to the transaction with Best Buy Canada, as well as reduced mobile phones contracted sales and lower wireline equipment sales to large enterprise customers following the supply chain recovery in 2023. Service revenue growth of 0.1% reflected higher wireless service revenues despite sustained competitive pricing pressures, along with growth in Internet and business solutions services revenues, the contribution from acquisitions made in the past year, higher revenues from the Formula 1 Canadian Grand Prix 2024 (Formula 1), and increased media advertising revenues, despite continued traditional broadcast TV and radio advertising market softness. The service revenue growth was partly offset by ongoing erosion in legacy voice, data and satellite TV revenues, as well as lower Bell Media subscriber revenues.
Net earnings and net earnings attributable to common shareholders in the second quarter of 2024 increased by $207 million and $208 million, respectively, compared to the same period last year, mainly due to lower other expense, lower severance, acquisition and other costs, higher adjusted EBITDA and lower income taxes, partly offset by higher interest expense, higher impairment of assets and higher depreciation and amortization.
BCE's adjusted EBITDA grew by 2.0% in Q2 2024, compared to the same period last year, attributable to growth in our Bell Communication and Technology Services (Bell CTS) and Bell Media segments, reflecting disciplined subscriber acquisition combined with various cost reduction initiatives including workforce reductions and other operating efficiencies, as well as lower cost of goods sold, partly offset by decreased operating revenues. This drove a corresponding adjusted EBITDA margin of 44.9% in Q2 2024, up 1.3 pts over the same period last year, due to lower operating costs, along with a reduced proportion of low-margin product sales in our total revenue base.
BCE's EPS of $0.59 in Q2 2024 increased by $0.22 compared to the same period last year.
In the second quarter of 2024, adjusted net earnings, which excludes the impact of severance, acquisition and other costs, net mark-to-market gains (losses) on derivatives used to economically hedge equity settled share-based compensation plans, net equity gains (losses) on investments in associates and joint ventures, net gains (losses) on investments, early debt redemption costs and impairment of assets, net of tax and NCI, was $712 million, or $0.78 per common share, compared to $722 million, or $0.79 per common share, for the same period last year.
8 BCE Inc. 2024 SECOND QUARTER SHAREHOLDER REPORT
Cash flows from operating activities in the second quarter of 2024 decreased by $228 million, compared to the same period last year, mainly due to higher interest paid, higher severance and other costs paid and lower cash from working capital due in part to timing of supplier payments, partly offset by lower income taxes paid and higher adjusted EBITDA.
Free cash flow in Q2 2024 increased by $81 million, compared to the same period last year, due to lower capital expenditures, partly offset by lower cash flows from operating activities, excluding cash from acquisition and other costs paid.
1.2 Key corporate and business developments This section contains forward-looking statements, including relating to the proposed disposition of Northwestel, the intended use by Bell Canada of the proceeds from the proposed disposition and the planned continuation of a Bell Canada partnership with Northwestel beyond transaction close, the intended use of the net proceeds of Bell Canada’s May 2024 public offering and the expected timing of the opening of 167 Best Buy Express retail stores across Canada. Refer to the section Caution regarding forward-looking statements at the beginning of this MD&A.
Disposition of Northwestel
On June 10, 2024, Bell Canada entered into an agreement with Sixty North Unity, a consortium of Indigenous communities from the Yukon, the Northwest Territories and Nunavut, for the sale of Northwestel, the largest telecommunications service provider in Canada’s North, for up to $1 billion, subject to adjustments. The transaction reinforces Bell Canada’s commitment to the North by empowering local communities with control over their investment decision-making, while continuing to serve the North as the leading wireless services provider in the region. Bell Canada plans to maintain a strategic partnership with Northwestel beyond the transaction close through ongoing operational support, and as Northwestel’s largest customer. Closing of the transaction is subject to certain closing conditions, including securing financing by Sixty North Unity, the completion of confirmatory due diligence, and receipt of the Competition Bureau's approval and, as such, there can be no assurances that the transaction will ultimately be consummated. Bell Canada intends to use the proceeds from the transaction to pay down debt.
Public debt offering
On May 24, 2024, Bell Canada completed a public offering in Canada of $1.5 billion of medium-term notes (MTN) debentures in two series pursuant to its MTN program. The $400 million Series M-61 MTN debentures, which were issued pursuant to a re-opening of an existing series of MTN debentures, will mature on August 11, 2053 and carry an annual interest rate of 5.60%. The $1.1 billion Series M-63 MTN debentures will mature on August 24, 2034 and carry an annual interest rate of 5.15%. The MTN Debentures are fully and unconditionally guaranteed by BCE Inc. The net proceeds of the offering are intended to be used to fund the repayment of Bell Canada MTN Debenture debt maturing in the first quarter of 2025 and general corporate purposes.
Launch of retail partnership with Best Buy Canada
As part of Bell’s strategic partnership with Best Buy Canada to introduce 167 small-format consumer technology retail stores across Canada, the first 24 Best Buy Express stores opened in locations across British Columbia, Alberta, Ontario and Québec. This marks the beginning of a phased rollout over the next several months, with all stores expected to open by the end of 2024, following completion of renovations. Best Buy Express stores will offer a selection of consumer technology from Best Buy with over 100,000 products available through its fulfillment network, and exclusive telecommunications services from Bell, Virgin Plus and Lucky Mobile.
BCE ranked as one of Canada’s Best 50 Corporate Citizens
In June 2024, BCE was once again named to the Canada’s Best 50 Corporate Citizens list compiled by Corporate Knights, a sustainable-economy media and research company, ranking 19th overall. The annual ranking is based on a set of 25 ESG indicators that compares Canadian companies with a gross revenue of at least $1 billion, amongst other criteria(1). This is the third consecutive year BCE has made the list. Our sustainable investments and revenue, diversity and equity initiatives and pension fund quality contributed to BCE being named the top corporate citizen in the Canadian telecommunications sector in this year’s ranking. It also reflects our recognition as one of Canada’s Greenest Employers(2) by Canada’s Top Employers, an editorial competition organized by Mediacorp Canada Inc., a publisher of employment periodicals, in light of our ongoing environmental leadership.
(1)Eligible companies include: Canadian-headquartered privately held companies and Canadian Crown corporations with at least $1 billion annual revenue, Canadian-listed companies with more than $1 billion annual revenue, companies included in S&P / TSX Renewable Energy and Clean Technology Index (all revenues), top 10 largest Canadian cooperative organizations by revenue, top 10 credit unions by assets under management and those with at least 100,000 members and all 2023 Best 50 companies. All companies are scored on up to 25 key performance indicators covering resource management, employee management, financial management, sustainable revenue and sustainable investment and supplier performance in comparison to their peer group, with 50% of each company’s score assigned to sustainable revenue and sustainable investment.
(2)Winners were announced in April 2024 and were selected and evaluated in terms of: the unique environmental initiatives and programs they have developed; the extent to which they have been successful in reducing the organization’s own environmental footprint; the degree to which their employees are involved in these programs and whether they contribute any unique skills; and the extent to which these initiatives have become linked to the employer’s public identity, attracting new employees and clients to the organization.
As at the date of this MD&A, our forward-looking statements set out in the BCE 2023 Annual MD&A, as updated or supplemented in the BCE 2024 First Quarter MD&A and in this MD&A, are based on certain assumptions including, without limitation, the following assumptions, as well as the various assumptions referred to under the sub-sections entitled Assumptions set out in section 3, Business segment analysis of this MD&A.
Assumptions about the Canadian economy
We have made certain assumptions concerning the Canadian economy. In particular, we have assumed:
•Modest economic growth, given the Bank of Canada’s most recent estimated growth in Canadian gross domestic product of 1.2% in 2024, representing a decrease from the earlier estimate of 1.5%
•Easing consumer price index (CPI) inflation as monetary policy works to reduce inflationary pressures
•Easing labour market conditions
•Growth in consumer spending as lower interest rates ease debt payments
•Business investment growth underpinned by easing financial conditions and the overall growth of the economy
•Interest rates expected to remain at or near current levels
•Population growth resulting from immigration
•Canadian dollar expected to remain near current levels. Further movements may be impacted by the degree of strength of the U.S. dollar, interest rates and changes in commodity prices.
Market assumptions
•A higher level of wireline and wireless competition in consumer, business and wholesale markets
•Higher, but slowing, wireless industry penetration
•A shrinking data and voice connectivity market as business customers migrate to lower-priced telecommunications solutions or alternative OTT competitors
•The Canadian traditional broadcast TV and radio advertising market is experiencing a slowdown consistent with trends in the global advertising market, with improvement expected in the medium term, although visibility to the specific timing and pace remains limited
•Declines in broadcasting distribution undertaking (BDU) subscribers driven by increasing competition from the continued rollout of subscription video on demand (SVOD) streaming services together with further scaling of OTT aggregators
Assumptions underlying expected continuing contribution holiday in 2024 in the majority of our pension plans
•At the relevant time, our defined benefit (DB) pension plans will remain in funded positions with going concern surpluses and maintain solvency ratios that exceed the minimum legal requirements for a contribution holiday to be taken for applicable DB and defined contribution (DC) components
•No significant declines in our DB pension plans’ financial position due to declines in investment returns or interest rates
•No material experience losses from other events such as through litigation or changes in laws, regulations or actuarial standards
10 BCE Inc. 2024 SECOND QUARTER SHAREHOLDER REPORT
2 Consolidated financial analysis
This section provides detailed information and analysis about BCE’s performance in Q2 and YTD 2024 compared with Q2 and YTD 2023. It focuses on BCE’s consolidated operating results and provides financial information for our Bell CTS and Bell Media business segments. For further discussion and analysis of our business segments, refer to section 3, Business segment analysis.
2.1 BCE consolidated income statements | | | | | | | | | | | | | | | | | | | | | | | | | | |
| | Q2 2024 | Q2 2023 | $ change | % change | YTD 2024 | YTD 2023 | $ change | % change |
| Operating revenues | | | | | | | | |
| Service | 5,308 | 5,303 | 5 | | 0.1 | % | 10,500 | 10,525 | (25) | | (0.2 | %) |
| Product | 697 | 763 | (66) | | (8.7 | %) | 1,516 | 1,595 | (79) | | (5.0 | %) |
| Total operating revenues | 6,005 | 6,066 | (61) | | (1.0 | %) | 12,016 | 12,120 | (104) | | (0.9 | %) |
| Operating costs | (3,308) | (3,421) | 113 | | 3.3 | % | (6,754) | (6,937) | 183 | | 2.6 | % |
| Adjusted EBITDA | 2,697 | 2,645 | 52 | | 2.0 | % | 5,262 | 5,183 | 79 | | 1.5 | % |
| Adjusted EBITDA margin | 44.9 | % | 43.6 | % | | 1.3 pts | 43.8 | % | 42.8 | % | | 1.0 pts |
| Severance, acquisition and other costs | (22) | (100) | 78 | | 78.0 | % | (251) | (149) | (102) | | (68.5 | %) |
| Depreciation | (945) | (936) | (9) | | (1.0 | %) | (1,891) | (1,854) | (37) | | (2.0 | %) |
| Amortization | (325) | (296) | (29) | | (9.8 | %) | (641) | (579) | (62) | | (10.7 | %) |
| Finance costs | | | | | | | | |
| Interest expense | (426) | (359) | (67) | | (18.7 | %) | (842) | (703) | (139) | | (19.8 | %) |
| Net return on post-employment benefit plans | 17 | 27 | (10) | | (37.0 | %) | 33 | 54 | (21) | | (38.9 | %) |
| Impairment of assets | (60) | — | (60) | | n.m. | (73) | (34) | (39) | | n.m. |
| Other expense | (101) | (311) | 210 | | 67.5 | % | (139) | (190) | 51 | | 26.8 | % |
| Income taxes | (231) | (273) | 42 | | 15.4 | % | (397) | (543) | 146 | | 26.9 | % |
| | | | | | | | |
| | | | | | | | |
| Net earnings | 604 | 397 | 207 | | 52.1 | % | 1,061 | 1,185 | (124) | | (10.5 | %) |
| | | | | | | | |
| | | | | | | | |
| | | | | | | | |
| | | | | | | | |
| | | | | | | | |
| Net earnings attributable to: | | | | | | | | |
| Common shareholders | 537 | 329 | 208 | | 63.2 | % | 939 | 1,054 | (115) | | (10.9 | %) |
| Preferred shareholders | 46 | 46 | — | | — | | 93 | 92 | 1 | | 1.1 | % |
| Non-controlling interest | 21 | 22 | (1) | | (4.5 | %) | 29 | 39 | (10) | | (25.6 | %) |
| Net earnings | 604 | 397 | 207 | | 52.1 | % | 1,061 | 1,185 | (124) | | (10.5 | %) |
| Adjusted net earnings | 712 | 722 | (10) | | (1.4 | %) | 1,366 | 1,494 | (128) | | (8.6 | %) |
| | | | | | | | |
| | | | | | | | |
| | | | | | | | |
| EPS | 0.59 | 0.37 | 0.22 | | 59.5 | % | 1.03 | 1.16 | (0.13) | | (11.2 | %) |
| Adjusted EPS | 0.78 | 0.79 | (0.01) | | (1.3 | %) | 1.50 | 1.64 | (0.14) | | (8.5 | %) |
n.m.: not meaningful
2.2 Customer connections
BCE net activations (losses)
| | | | | | | | | | | | | | | | | | | | |
| | Q2 2024 | Q2 2023 | % change | YTD 2024 | YTD 2023 | % change |
| Mobile phone net subscriber activations (losses) | 131,043 | | 125,539 | | 4.4 | % | 156,251 | | 152,174 | | 2.7 | % |
| Postpaid | 78,500 | | 111,282 | | (29.5 | %) | 123,747 | | 154,571 | | (19.9 | %) |
| Prepaid | 52,543 | | 14,257 | | n.m. | 32,504 | | (2,397) | | n.m. |
| Mobile connected devices net subscriber activations | 87,917 | | 79,537 | | 10.5 | % | 154,323 | | 150,279 | | 2.7 | % |
| Retail high-speed Internet net subscriber activations | 23,841 | | 24,934 | | (4.4 | %) | 54,919 | | 52,208 | | 5.2 | % |
| | | | | | |
| Retail IPTV net subscriber (losses) activations | (1,313) | | 11,506 | | n.m. | 12,861 | | 22,405 | | (42.6 | %) |
| | | | | | |
| | | | | | |
| Retail residential NAS lines net losses | (53,250) | | (49,608) | | (7.3 | %) | (97,161) | | (96,489) | | (0.7 | %) |
| | | | | | |
| Total services net activations | 188,238 | | 191,908 | | (1.9 | %) | 281,193 | | 280,577 | | 0.2 | % |
n.m.: not meaningful
Total BCE customer connections
| | | | | | | | | | | | | | |
| | Q2 2024 | Q2 2023 | % change | | | |
Mobile phone subscribers(2) | 10,337,495 | | 10,028,031 | | 3.1 | % | | | |
Postpaid(2) | 9,440,775 | | 9,151,229 | | 3.2 | % | | | |
| Prepaid | 896,720 | | 876,802 | | 2.3 | % | | | |
| Mobile connected devices subscribers | 2,886,871 | | 2,589,520 | | 11.5 | % | | | |
Retail high-speed Internet subscribers(3)(4)(5) | 4,520,553 | | 4,338,511 | | 4.2 | % | | | |
| | | | | | |
Retail IPTV subscribers(1)(5) | 2,124,200 | | 2,010,829 | | 5.6 | % | | | |
| | | | | | |
| | | | | | |
Retail residential NAS lines(5) | 1,924,456 | | 2,101,740 | | (8.4 | %) | | | |
| | | | | | |
Total services subscribers(6) | 21,793,575 | | 21,068,631 | | 3.4 | % | | | |
(1)In Q2 2024, we increased our retail IPTV subscriber base by 40,997 to align the deactivation policy for our Fibe TV streaming services to our traditional Fibe TV service.
(2)In Q1 2024, we adjusted our mobile phone postpaid subscriber base to remove very low to non-revenue generating business market subscribers of 105,802.
(3)In Q1 2024, we removed 11,645 turbo hubs subscribers from our retail high-speed Internet subscriber base as we are no longer actively marketing this product in our wireless-to-the-home footprint.
(4)In Q1 2024, our retail high-speed Internet subscriber base increased by 3,850 business subscribers as a result of a small acquisition.
(5)In Q2 2023, our retail high-speed Internet, retail IPTV and retail residential NAS lines subscriber bases increased by 35,080, 243 and 7,458 subscribers, respectively, as a result of small acquisitions.
(6)As of Q1 2024, we are no longer reporting retail satellite TV subscribers as this no longer represents a significant proportion of our revenues. As a result, satellite TV subscribers have been removed from our retail TV subscriber base, and we now report exclusively retail IPTV subscribers.
BCE added 188,238 net retail subscriber activations in Q2 2024, down 1.9% compared to the same period last year. The net retail subscriber activations in Q2 2024 consisted of:
•131,043 mobile phone net subscriber activations, along with 87,917 mobile connected device net subscriber activations
•23,841 retail high-speed Internet net subscriber activations
•1,313 retail IPTV net subscriber losses
•53,250 retail residential NAS lines net losses
In the first half of the year, BCE added 281,193 net retail subscriber activations, up 0.2% compared to the same period in 2023. The net retail subscriber activations in the first half of 2024 consisted of:
•156,251 mobile phone net subscriber activations, along with 154,323 mobile connected device net subscriber activations
•54,919 retail high-speed Internet net subscriber activations
•12,861 retail IPTV net subscriber activations
•97,161 retail residential NAS lines net losses
At June 30, 2024, BCE's retail subscriber connections totalled 21,793,575, up 3.4% year over year, and consisted of:
•10,337,495 mobile phone subscribers, up 3.1% year over year, and 2,886,871 mobile connected device subscribers, up 11.5% year over year
•4,520,553 retail high-speed Internet subscribers, 4.2% higher year over year
•2,124,200 retail IPTV subscribers, up 5.6% year over year
•1,924,456 retail residential NAS lines, down 8.4% year over year
12 BCE Inc. 2024 SECOND QUARTER SHAREHOLDER REPORT
2.3 Operating revenues
| | | | | | | | |
| BCE | | BCE |
| Revenues | | Revenues |
| (in $ millions) | | (in $ millions) |
| | |
| | | | | | | | | | | | | | | | | | | | | | | | | | |
| | Q2 2024 | Q2 2023 | $ change | % change | YTD 2024 | YTD 2023 | $ change | % change |
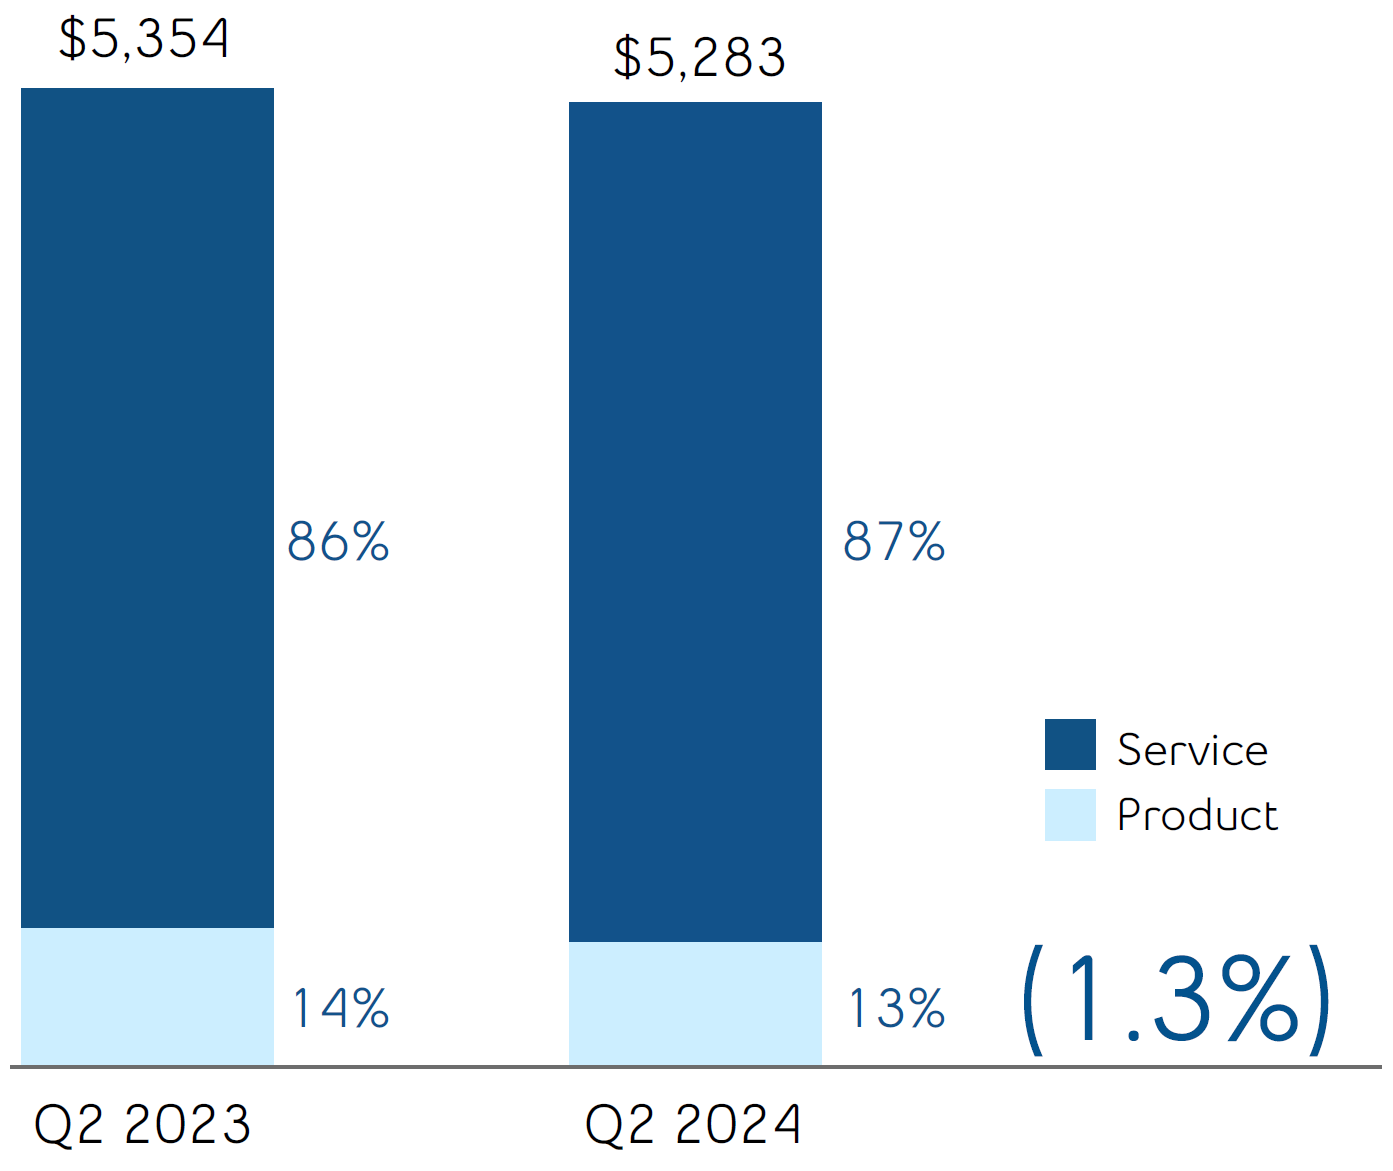
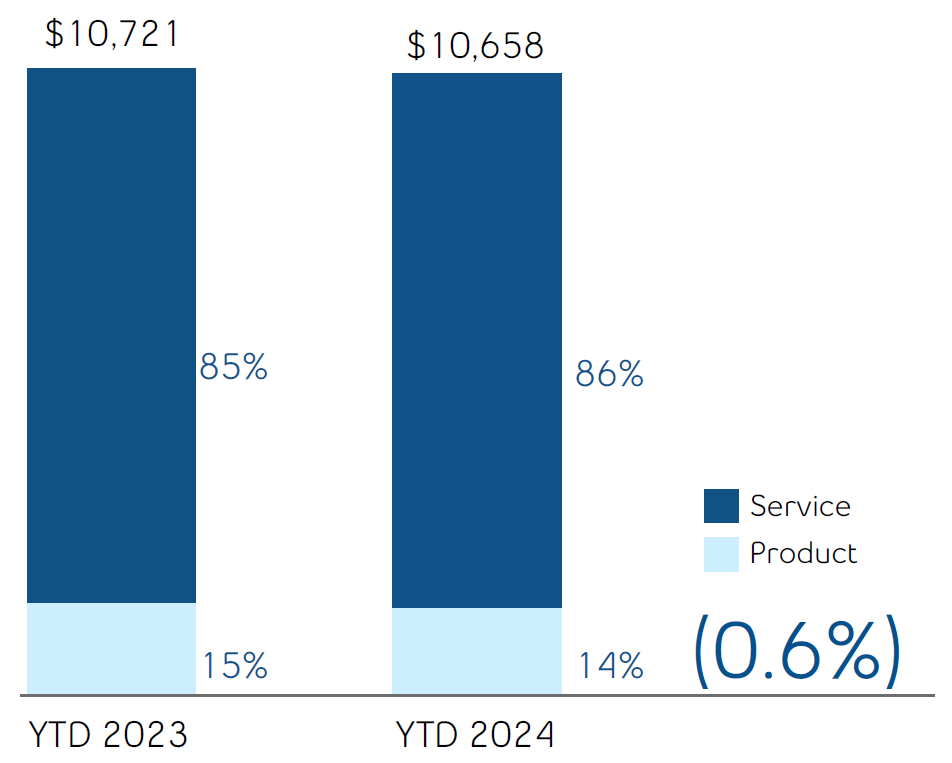
| Bell CTS | 5,283 | | 5,354 | | (71) | | (1.3 | %) | 10,658 | | 10,721 | | (63) | | (0.6 | %) |
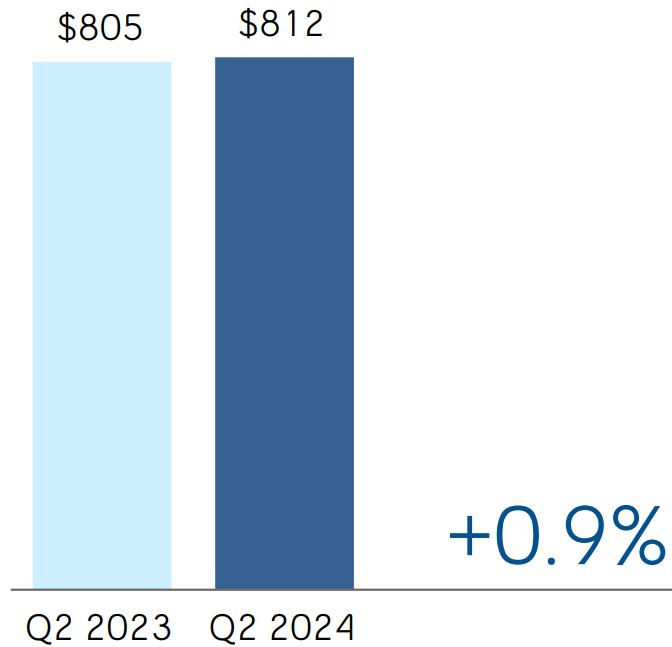
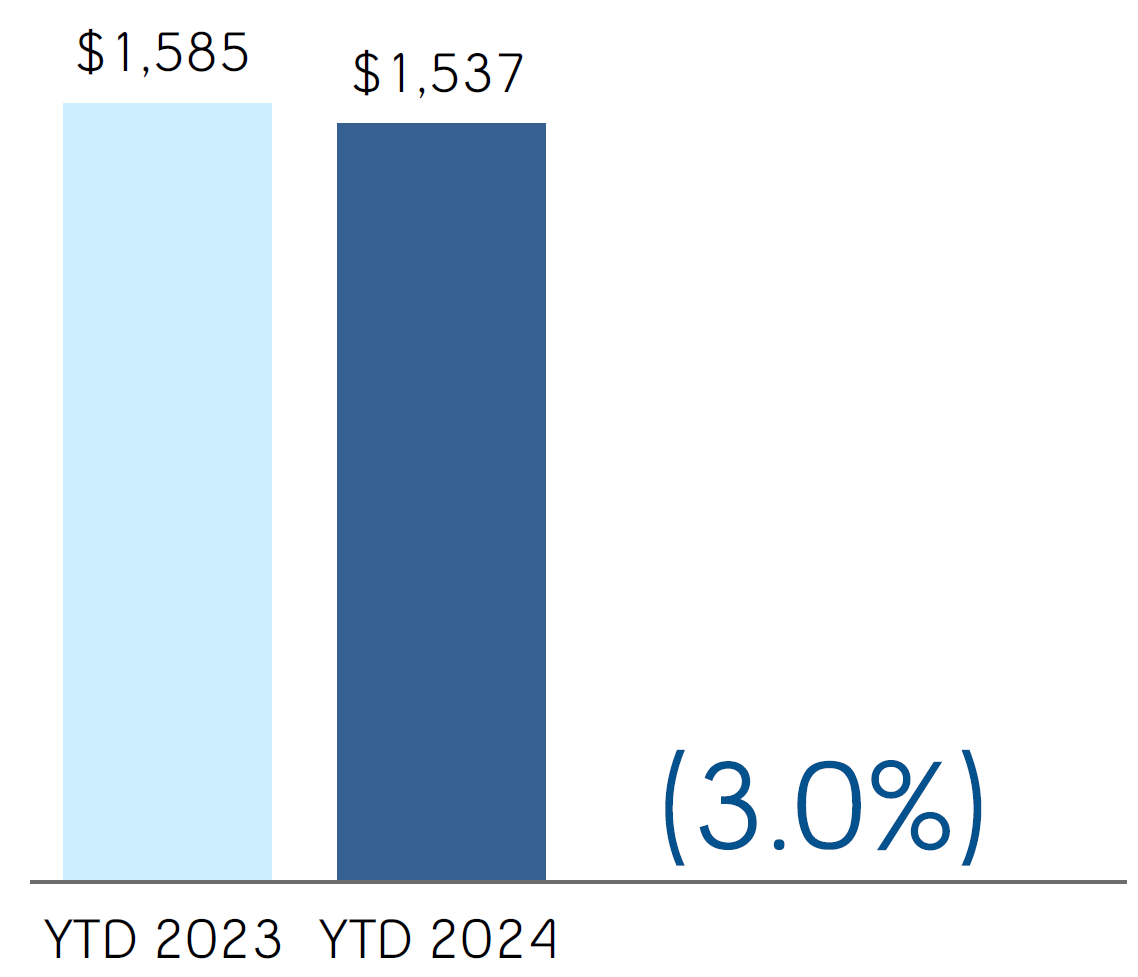
| Bell Media | 812 | | 805 | | 7 | | 0.9 | % | 1,537 | | 1,585 | | (48) | | (3.0 | %) |
| Inter-segment eliminations | (90) | | (93) | | 3 | | 3.2 | % | (179) | | (186) | | 7 | | 3.8 | % |
| Total BCE operating revenues | 6,005 | | 6,066 | | (61) | | (1.0 | %) | 12,016 | | 12,120 | | (104) | | (0.9 | %) |
BCE
BCE operating revenues decreased by 1.0% in Q2 2024, compared to Q2 2023, driven by lower product revenues, partly offset by higher service revenues. During the first six months of the year, BCE operating revenues declined by 0.9% year over year, driven by lower product and service revenues. Product revenues of $697 million in Q2 2024 and $1,516 million in the first half of the year, decreased by 8.7% and 5.0%, respectively, over the same periods last year. Service revenues of $5,308 million in Q2 2024 increased by 0.1% year-over-year, while service revenues in the first half of the year of $10,500 million declined by 0.2%.
The year-over-year decrease in Q2 2024 operating revenues reflected a decline in our Bell CTS segment, partly offset by an increase in our Bell Media segment, whereas the decline in the first six months of the year was attributable to a decrease in both our Bell CTS and Bell Media segments. Bell CTS operating revenues in the quarter declined by 1.3% year over year, due to lower product revenues of 8.7% resulting from The Source retail store closures, and decreased service revenues of 0.1%, from ongoing erosion in wireline voice revenues, moderated by continued growth in wireless and wireline data revenues. The year-to-date decline in Bell CTS operating revenues of 0.6%, was due to lower product revenues of 5.0%, partly offset by service revenues growth of 0.2% from higher wireless and wireline data revenues, moderated by continued wireline voice revenue erosion. Bell Media operating revenues increased by 0.9% in Q2 2024, compared to Q2 2023, from higher advertising and Formula 1 revenues, partly offset by lower subscriber revenues. Bell Media operating revenues during the first half of the year, decreased by 3.0% year over year, due to lower subscriber revenues, reflecting the benefit last year from a retroactive BDU revenue adjustment, partly offset by higher advertising and Formula 1 revenues.
2.4 Operating costs
| | | | | |
| BCE | BCE |
| Operating cost profile | Operating cost profile |
| Q2 2023 | Q2 2024 |
| |
| BCE | BCE |
| Operating cost profile | Operating cost profile |
| YTD 2023 | YTD 2024 |
| |
| | | | | | | | | | | | | | | | | | | | | | | | | | |
| | Q2 2024 | Q2 2023 | $ change | % change | YTD 2024 | YTD 2023 | $ change | % change |
| Bell CTS | (2,804) | | (2,923) | | 119 | | 4.1 | % | (5,731) | | (5,884) | | 153 | | 2.6 | % |
| Bell Media | (594) | | (591) | | (3) | | (0.5 | %) | (1,202) | | (1,239) | | 37 | | 3.0 | % |
| Inter-segment eliminations | 90 | | 93 | | (3) | | (3.2 | %) | 179 | | 186 | | (7) | | (3.8 | %) |
| Total BCE operating costs | (3,308) | | (3,421) | | 113 | | 3.3 | % | (6,754) | | (6,937) | | 183 | | 2.6 | % |
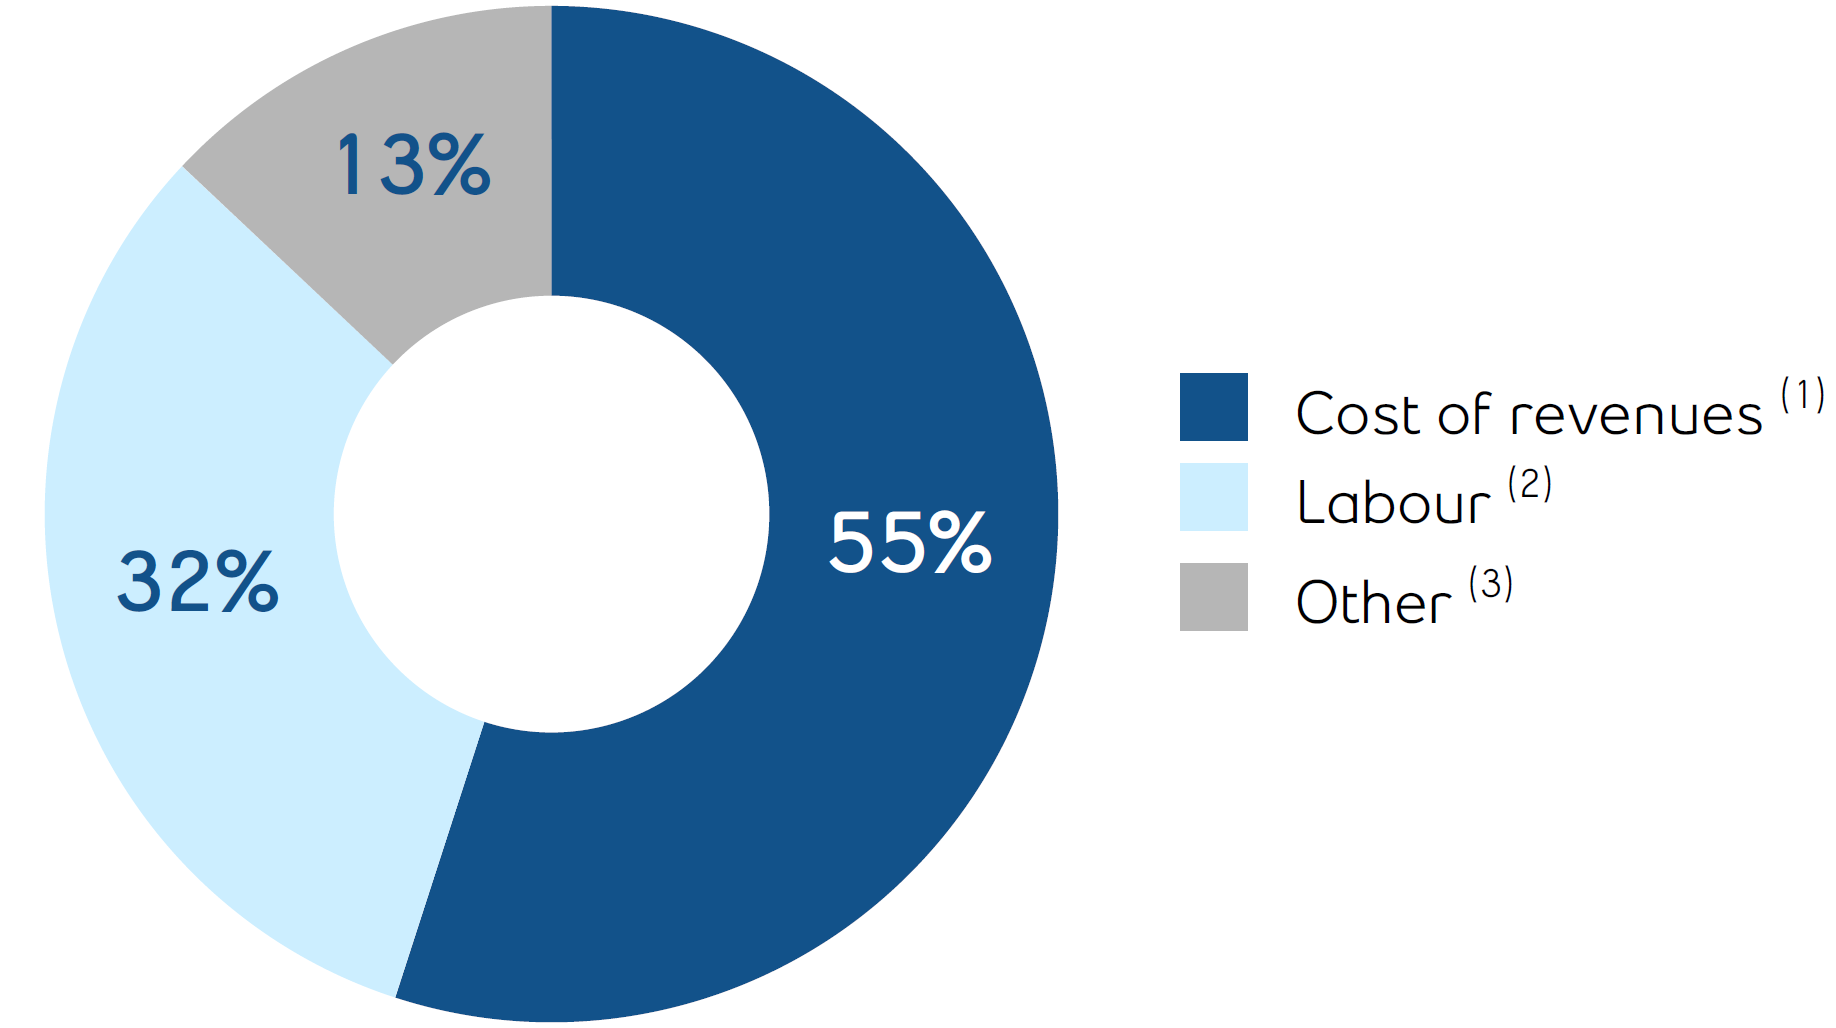
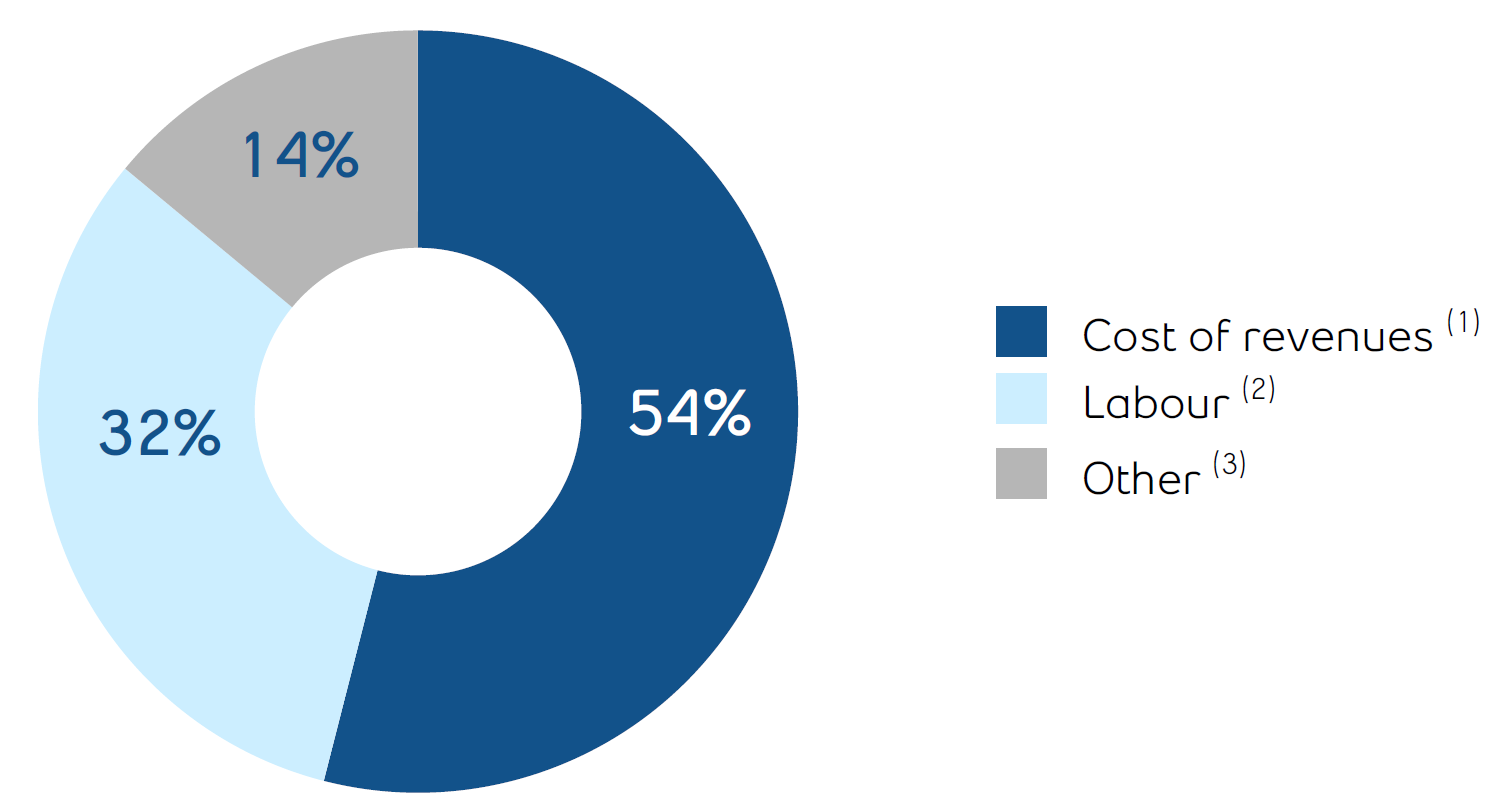
(1)Cost of revenues includes costs of wireless devices and other equipment sold, network and content costs, and payments to other carriers.
(2)Labour costs (net of capitalized costs) include wages, salaries and related taxes and benefits, post-employment benefit plans service cost, and other labour costs, including contractor and outsourcing costs.
(3)Other operating costs include marketing, advertising and sales commission costs, bad debt expense, taxes other than income taxes, IT costs, professional service fees and rent.
BCE
BCE operating costs decreased by 3.3% in Q2 2024, compared to Q2 2023, from lower expenses in Bell CTS of 4.1%, partly offset by an increase in Bell Media of 0.5%. In the first half of the year, BCE operating costs decreased by 2.6% year over year, driven by lower costs in both Bell CTS and Bell Media of 2.6% and 3.0%, respectively.
14 BCE Inc. 2024 SECOND QUARTER SHAREHOLDER REPORT
2.5 Net earnings | | | | | | | | |
| BCE | | BCE |
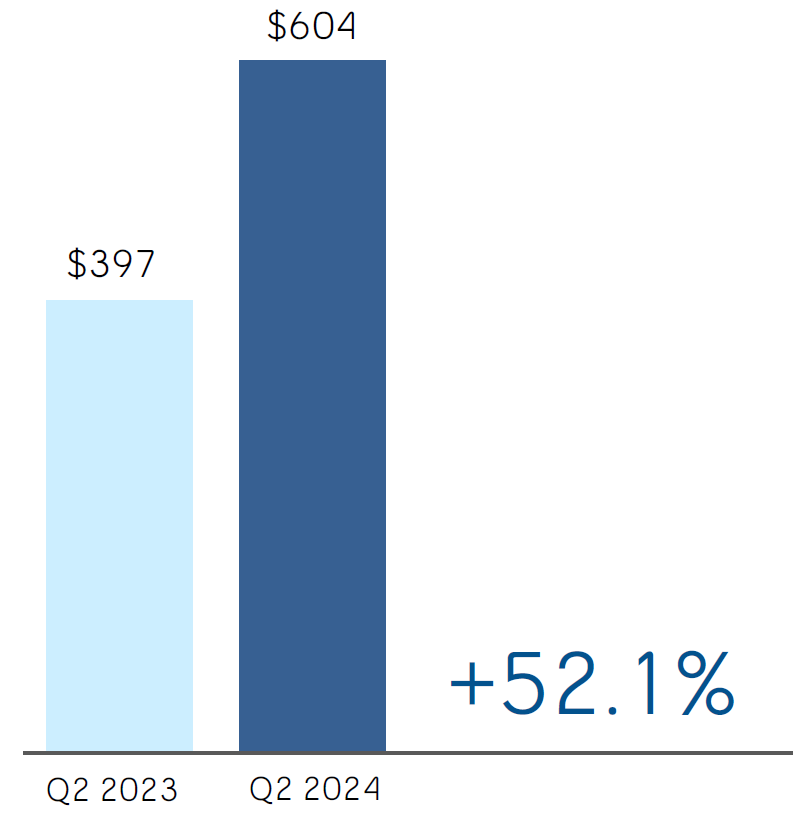
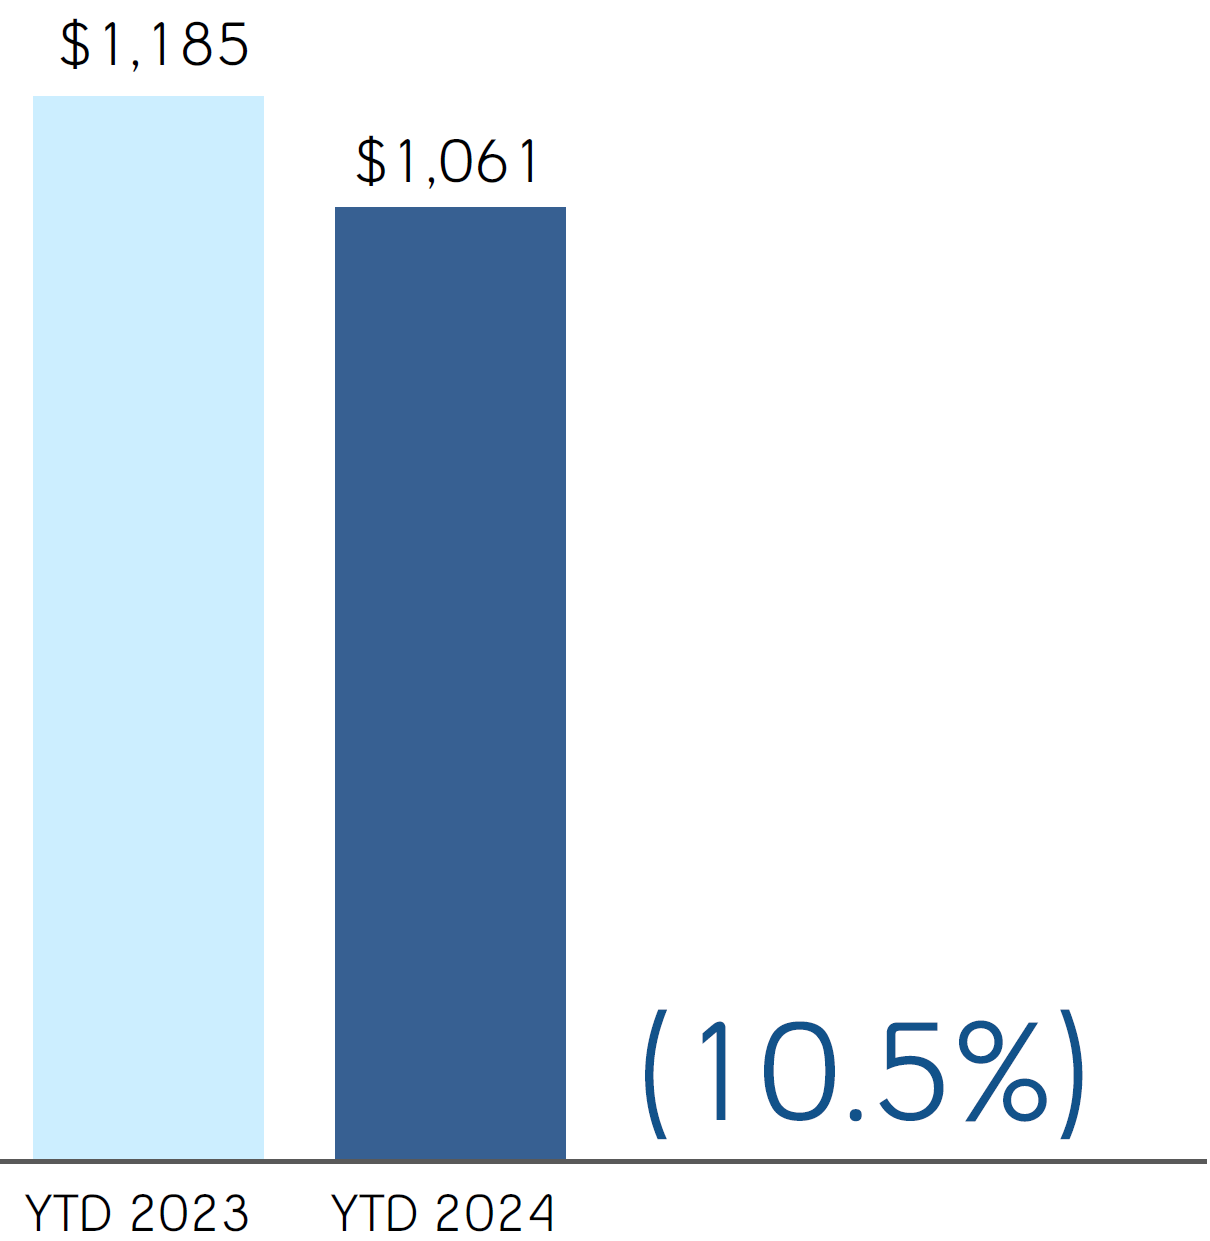
| Net earnings | | Net earnings |
| (in $ millions) | | (in $ millions) |
| | |
Net earnings in the second quarter of 2024 increased by $207 million, compared to the same period last year, mainly due to lower other expense, lower severance, acquisition and other costs, higher adjusted EBITDA and lower income taxes, partly offset by higher interest expense, higher impairment of assets and higher depreciation and amortization.
Net earnings on a year-to-date basis in 2024 decreased by $124 million, compared to the same period last year, mainly due to higher interest expense, higher severance, acquisition and other costs, higher depreciation and amortization and higher impairment of assets, partly offset by lower income taxes, higher adjusted EBITDA and lower other expense.
| | | | | | | | |
| BCE | | BCE |
| Adjusted EBITDA | | Adjusted EBITDA |
| (in $ millions ) | | (in $ millions ) |
| | |
| | | | | | | | | | | | | | | | | | | | | | | | | | |
| | Q2 2024 | Q2 2023 | $ change | % change | YTD 2024 | YTD 2023 | $ change | % change |
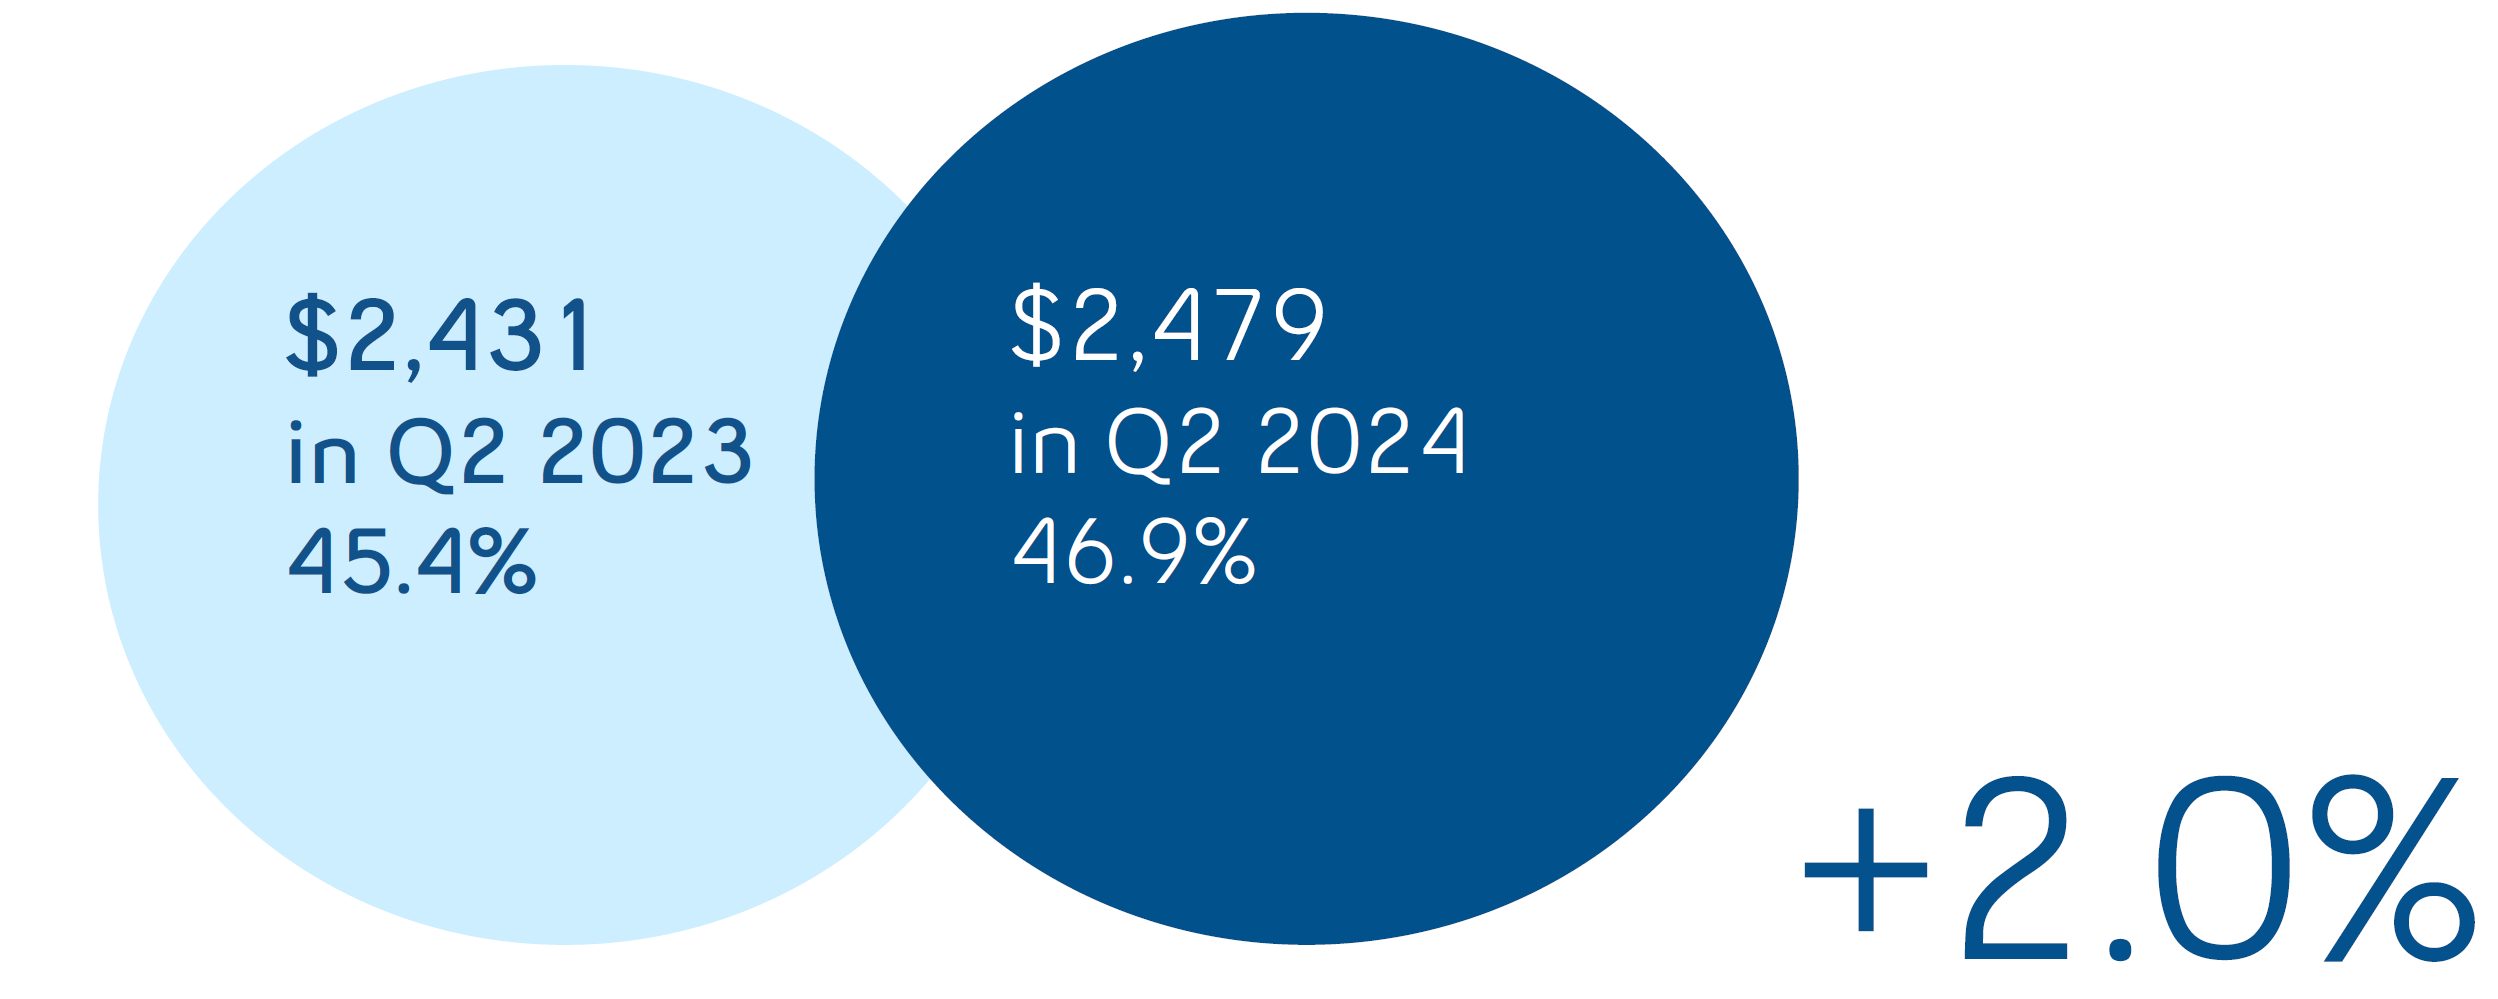
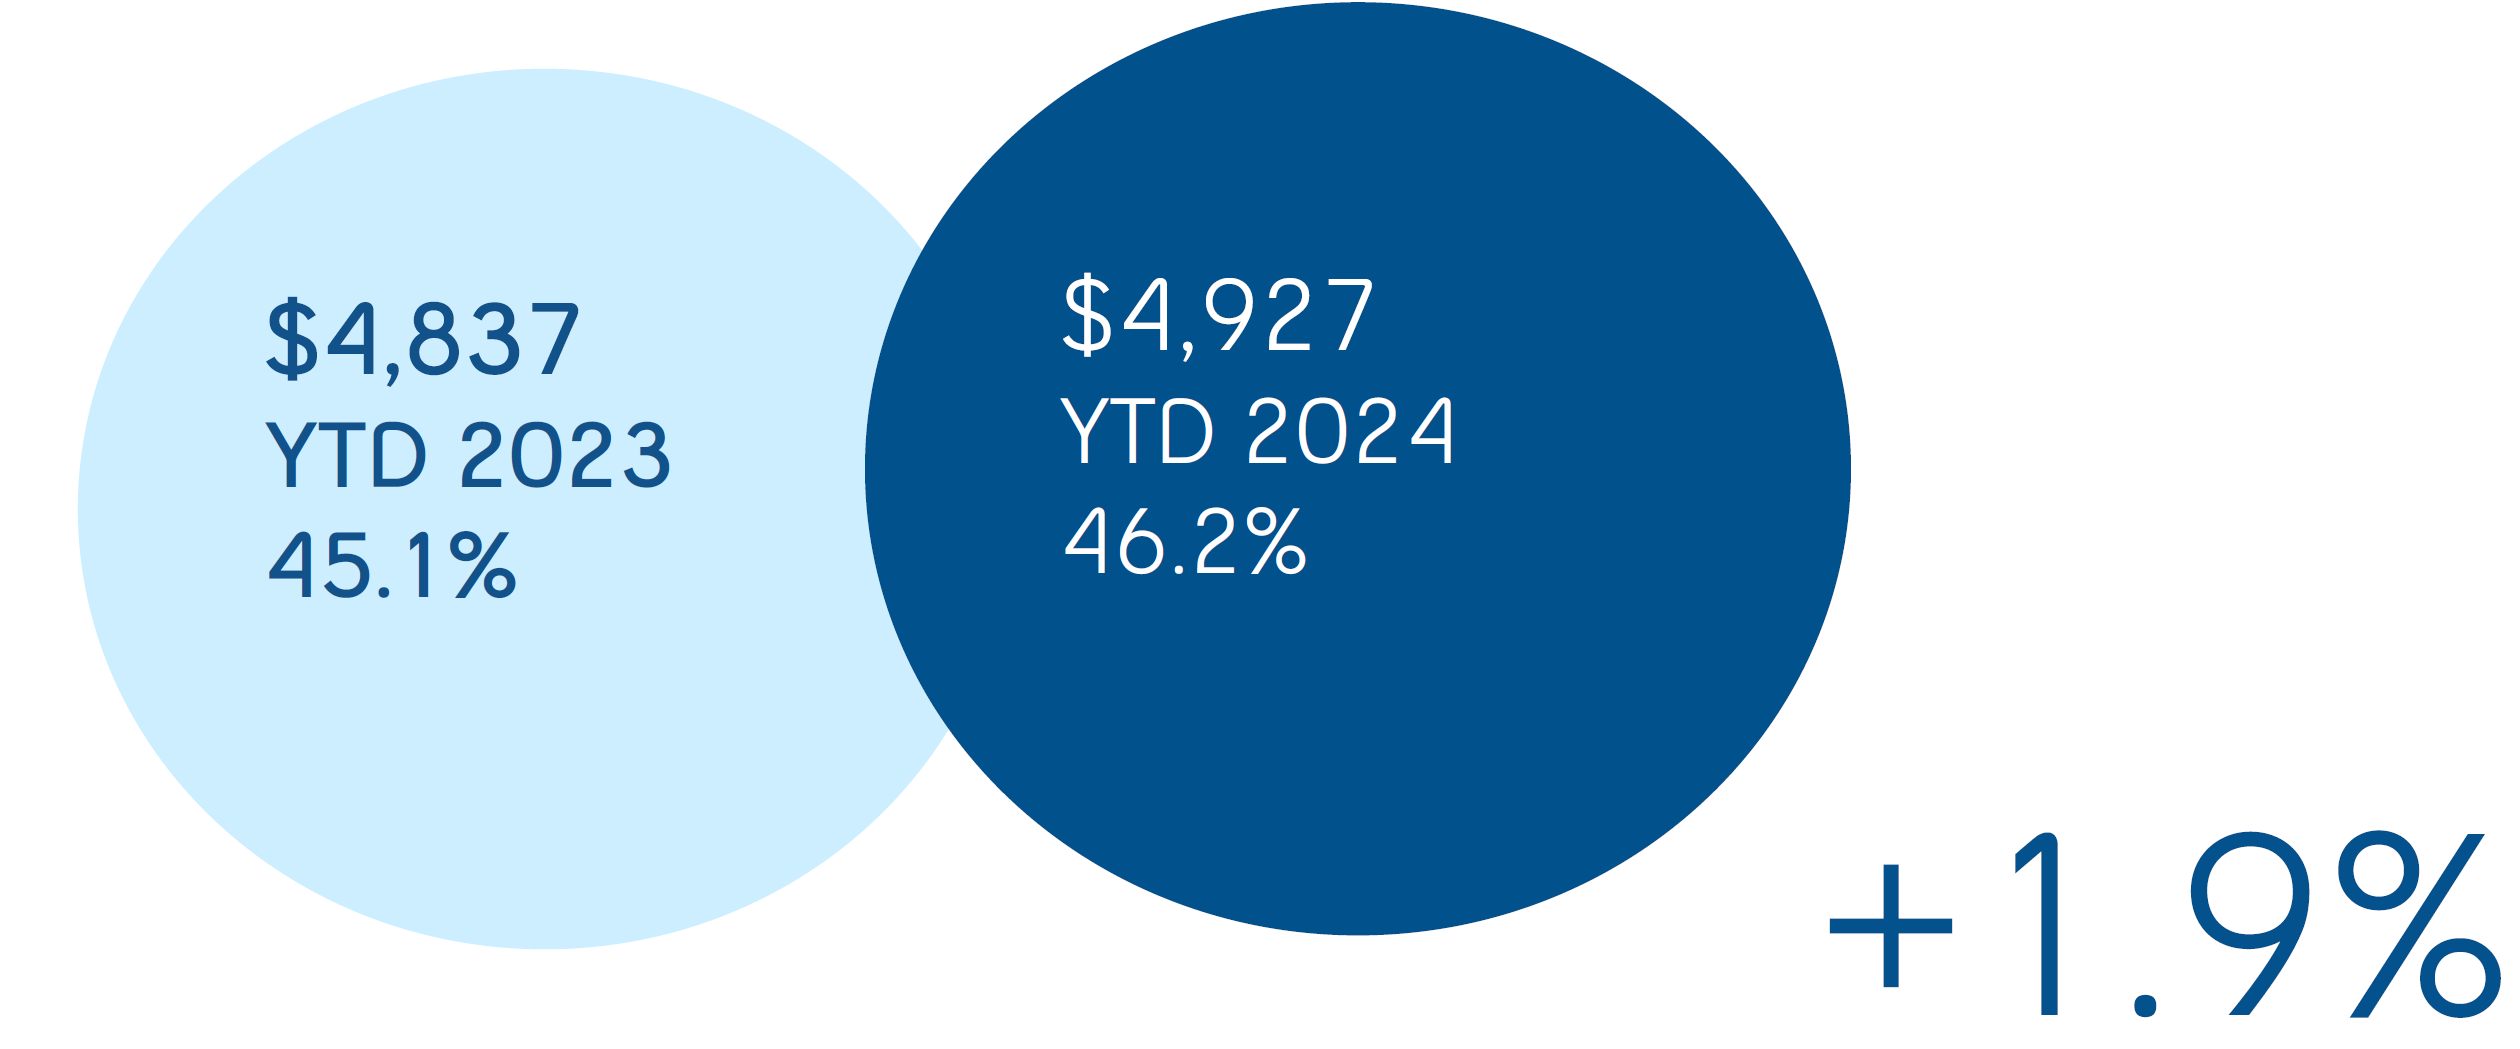
| Bell CTS | 2,479 | | 2,431 | | 48 | | 2.0 | % | 4,927 | | 4,837 | | 90 | | 1.9 | % |
| Adjusted EBITDA margin | 46.9 | % | 45.4 | % | | 1.5 pts | 46.2 | % | 45.1 | % | | 1.1 pts |
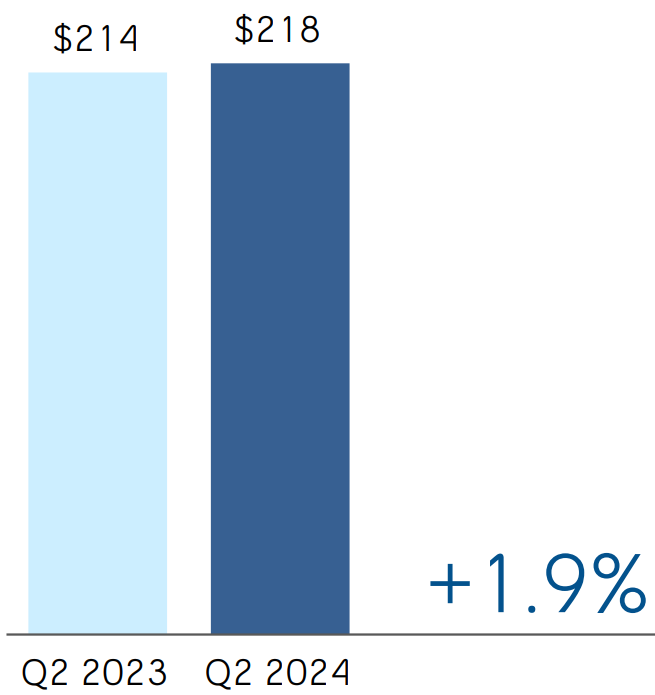
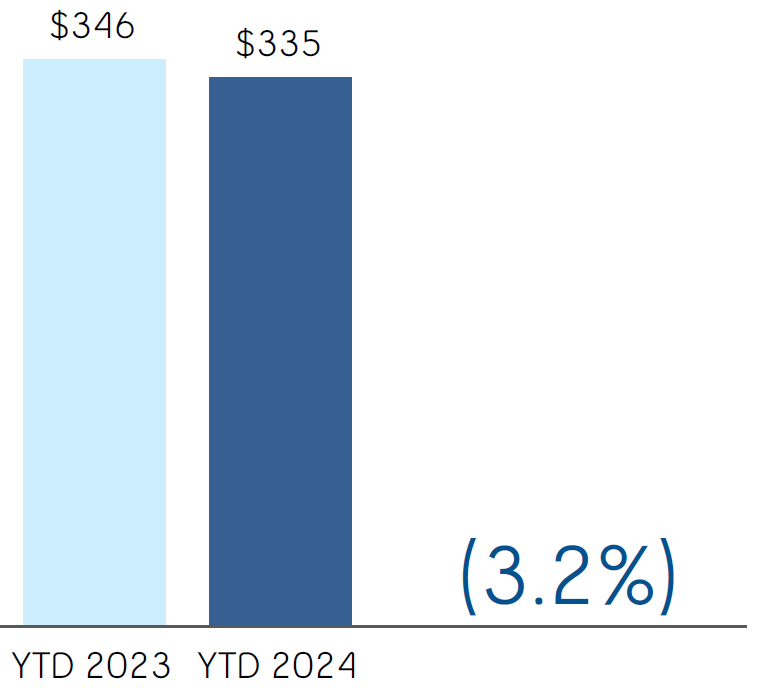
| Bell Media | 218 | | 214 | | 4 | | 1.9 | % | 335 | | 346 | | (11) | | (3.2 | %) |
| Adjusted EBITDA margin | 26.8 | % | 26.6 | % | | 0.2 pts | 21.8 | % | 21.8 | % | | — |
| Total BCE adjusted EBITDA | 2,697 | | 2,645 | | 52 | | 2.0 | % | 5,262 | | 5,183 | | 79 | | 1.5 | % |
| Adjusted EBITDA margin | 44.9 | % | 43.6 | % | | 1.3 pts | 43.8 | % | 42.8 | % | | 1.0 pts |
BCE
BCE’s adjusted EBITDA grew by 2.0% in Q2 2024, compared to Q2 2023, due to growth in Bell CTS of 2.0% and Bell Media of 1.9%. The increase in the first half of the year of 1.5% year over year was driven by growth in Bell CTS of 1.9%, partly offset by a decline in Bell Media of 3.2%. The year-over-year increase in BCE's adjusted EBITDA in Q2 2024 and year to date was driven by lower operating costs, partly offset by reduced operating revenues. Adjusted EBITDA margin of 44.9% in Q2 2024 and 43.8% year to date, increased by 1.3 pts and 1.0 pts, respectively, over the same periods last year, due to lower operating costs, driven by cost reduction initiatives, mainly associated with workforce reductions and other operating efficiencies, along with a reduced proportion of low-margin product sales in our total revenue base.
16 BCE Inc. 2024 SECOND QUARTER SHAREHOLDER REPORT
2.7 Severance, acquisition and other costs 2024
Severance, acquisition and other costs of $22 million in the second quarter of 2024 and $251 million on a year-to-date basis included:
•Severance costs recovery of $4 million in Q2 2024
•Severance costs of $230 million on a year-to-date basis related to involuntary and voluntary employee terminations, including the estimated costs of the previously announced workforce reductions incurred up to June 30, 2024
•Acquisition and other costs of $26 million in Q2 2024 and $21 million on a year-to-date basis
2023
Severance, acquisition and other costs of $100 million in the second quarter of 2023 and $149 million on a year-to-date basis included:
•Severance costs of $80 million in Q2 2023 and $109 million on a year-to-date basis related to involuntary and voluntary employee terminations
•Acquisition and other costs of $20 million in Q2 2023 and $40 million on a year-to-date basis
2.8 Depreciation and amortization Depreciation
Depreciation in the second quarter and on a year-to-date basis in 2024 increased by $9 million and $37 million, respectively, compared to the same periods in 2023, mainly due to a higher asset base as we continued to invest in our broadband and wireless networks.
Amortization
Amortization in the second quarter and on a year-to-date basis in 2024 increased by $29 million and $62 million, respectively, compared to the same periods in 2023, mainly due to a higher asset base.
Interest expense
Interest expense in the second quarter and on a year-to-date basis in 2024 increased by $67 million and $139 million, respectively, compared to the same periods in 2023, mainly due to higher average debt balances and higher interest rates.
Net return on post-employment benefit plans
Net return on our post-employment benefit plans is based on market conditions that existed at the beginning of the year as well as the net post-employment benefit plan asset (liability). On January 1, 2024, the discount rate was 4.6% compared to 5.3% on January 1, 2023.
In the second quarter and on a year-to-date basis in 2024, net return on post-employment benefit decreased by $10 million and $21 million, respectively, compared to the same periods last year, as a result of a lower discount rate in 2024 and a lower net asset position.
The impacts of changes in market conditions during the year are recognized in Other comprehensive income (loss) (OCI).
2.10 Impairment of assets Impairment charges for the second quarter and on a year-to-date basis in 2024 increased by $60 million and $39 million, respectively, compared to the same periods last year, and relate mainly to right-of-use assets for certain office spaces we ceased using as part of our real estate optimization strategy as a result of our hybrid work policy.
2024
Other expense of $101 million in the second quarter of 2024 included losses on our equity investments in associates and joint ventures which included a loss on BCE's share of an obligation to repurchase at fair value the minority interest in one of BCE's joint ventures, net mark-to-market losses on derivatives used to economically hedge equity settled share-based compensation plans and losses on retirements and disposals of property, plant and equipment and intangible assets, partly offset by interest income.
Other expense of $139 million on a year-to-date basis in 2024 included net mark-to-market losses on derivatives used to economically hedge equity settled share-based compensation plans, losses on our equity investments in associates and joint ventures which included a loss on BCE's share of an obligation to repurchase at fair value the minority interest in one of BCE's joint ventures and losses on retirements and disposals of property, plant and equipment and intangible assets, partly offset by interest income and income on operations from our equity investments.
2023
Other expense of $311 million in the second quarter of 2023 included losses on our equity investments in associates and joint ventures which included a loss on BCE's share of an obligation to repurchase at fair value the minority interest in one of BCE's joint ventures, losses on retirements and disposals of property, plant and equipment and intangible assets, partly offset by gains on our investments as a result of the sale of our 63% ownership in certain production studios.
Other expense of $190 million on a year-to-date basis in 2023 included losses on our equity investments in associates and joint ventures which included a loss on BCE's share of an obligation to repurchase at fair value the minority interest in one of BCE's joint ventures, partly offset by gains on our investments as a result of the sale of our 63% ownership in certain production studios, gains on retirements and disposals of property, plant and equipment and intangible assets related to the sale of land as part of our real estate optimization strategy, higher interest income, income on operations from our equity investments and net mark-to-market gains on derivatives used to economically hedge equity settled share-based compensation plans.
Income taxes in the second quarter and on a year-to-date basis in 2024 decreased by $42 million and $146 million, respectively, compared to the same periods last year, mainly due to a higher value of favourable tax adjustments and lower taxable income.
2.13 Net earnings attributable to common shareholders and EPS Net earnings attributable to common shareholders in the second quarter of 2024 of $537 million, increased by $208 million, compared to the same period last year, mainly due to lower other expense, lower severance, acquisition and other costs, higher adjusted EBITDA and lower income taxes, partly offset by higher interest expense, higher impairment of assets and higher depreciation and amortization.
Net earnings attributable to common shareholders on a year-to-date basis in 2024 of $939 million, decreased by $115 million, compared to the same period last year, mainly due to higher interest expense, higher severance, acquisition and other costs, higher depreciation and amortization and higher impairment of assets, partly offset by lower income taxes, higher adjusted EBITDA and lower other expense.
BCE’s EPS of $0.59 in Q2 2024 increased by $0.22 compared to the same period last year. BCE's EPS of $1.03 on a year-to-date basis in 2024 decreased by $0.13 compared to the same period last year.
In the second quarter of 2024, adjusted net earnings, which excludes the impact of severance, acquisition and other costs, net mark-to-market gains (losses) on derivatives used to economically hedge equity settled share-based compensation plans, net equity gains (losses) on investments in associates and joint ventures, net gains (losses) on investments, early debt redemption costs and impairment of assets, net of tax and NCI, was $712 million, or $0.78 per common share, compared to $722 million, or $0.79 per common share, for the same period last year. Adjusted net earnings in the first half of 2024 was $1,366 million, or $1.50 per common share, compared to $1,494 million, or $1.64 per common share, for the first six months of 2023.
18 BCE Inc. 2024 SECOND QUARTER SHAREHOLDER REPORT
3 Business segment analysis
This section contains forward-looking statements, including relating to BCE’s strategic and network deployment plans. Refer to the section Caution regarding forward-looking statements at the beginning of this MD&A.
Key business developments
Acquisition of tech services companies Stratejm and CloudKettle
On June 24, 2024, Bell acquired CloudKettle Inc. (CloudKettle), a Halifax-based professional services provider. On July 2, 2024, Bell acquired Stratejm Inc. (Stratejm), a Mississauga-based cybersecurity provider, for cash consideration of $78 million. These two acquisitions add professional and managed services expertise in cybersecurity and Salesforce digital workflow automation to Bell's existing capabilities and are expected to advance Bell's strategy to be the leader in supporting medium and large organizations' digital transformations and automation through cloud services. Combined with Bell's pure fibre and Fifth Generation (5G) networks, enterprises are expected to benefit from an artificial intelligence (AI)-powered end-to-end customer experience. These acquisitions complement Bell’s 2023 acquisition of FX Innovation, a provider of end-to-end multi-cloud services, IT workflow automation solutions and cloud consulting services.
Expansion of partnership with ServiceNow
On July 18, 2024, Bell announced an expanded multi-year strategic partnership with ServiceNow, an AI platform for business transformation, to accelerate Bell’s transformation to meet the growing customer demand for tech services and digital media. The partnership makes Bell one of ServiceNow’s largest communications customers with a first-of-its-kind collaboration in Canada. Bell will expand its use of the ServiceNow platform, supporting its own digital transformation while continuing to offer ServiceNow implementation expertise to support the digital transformation of its Bell Business Markets customers. FX Innovation, a provider of cloud-managed services and an Elite ServiceNow implementation partner, and acquired by Bell in 2023, will implement the Now Platform throughout Bell’s ecosystem. Bell will use automation, purpose-built telecommunications solutions, and AI-driven insights to provide both technicians and customers with a more efficient experience, enhancing customer service.
Deployment of 3800 MHz wireless spectrum
On May 29, 2024, Bell Mobility Inc. (Bell Mobility) announced the deployment of 3800 megahertz (MHz) spectrum in select areas of Toronto and Kitchener-Waterloo, offering customers the country's fastest mobile technology on Canada's fastest 5G+ wireless network(1). With the finalization of the acquisition of 939 licences of 3800 MHz spectrum on May 29, 2024, Bell Mobility secured the most 5G+ spectrum nationwide (combining the 3500 MHz and 3800 MHz spectrum bands), adding high-capacity airwaves critical to the advancement of 5G. Bell Mobility’s 5G+ is expected to be even faster and more responsive, allowing for a superior mobile experience with peak theoretical download speeds of up to 4 gigabits per second in select areas.
Partnership with Mila to drive AI innovation in the telecommunications sector
On June 13, 2024, Bell announced a new partnership with Mila, a Montréal-based research institute in AI, to develop AI solutions driven by a shared vision to enhance customer experience, optimize business operations and cultivate a vibrant AI ecosystem within Québec and across Canada. In line with Bell's investments in AI, this partnership reinforces Bell's transformation as a technology services leader, harnessing Mila's groundbreaking research to drive transformative improvements across Bell's operations. This announcement builds on the 18-month collaborative project Mila and Bell entered into earlier this year to apply deep learning neural network algorithms to Bell's environment.
Launch of Business Wi-Fi App
On July 24, 2024, Bell announced the launch of its new Bell Business Wi-Fi App, designed to provide small businesses in Ontario and Québec with an enhanced Wi-Fi experience that combines improved security, customizable guest Wi-Fi, employee and customer data insights, and simplified network management.
(1)Based on a third party score (Global Wireless Solutions OneScore) calculated using Bell wireless 5G and 5G+ network testing in Canada against other national wireless networks from April 2023 to June 2024.
Financial performance analysis
Q2 2024 performance highlights | | | | | | | | | | | | | | | | | | | | | | | |
| Bell CTS | Bell CTS |
| Revenues | Adjusted EBITDA |
| (in $ millions) | (in $ millions) |
| | | | (% adjusted EBITDA margin) |
| |
|
|
|
|
| | | | | | | |
| Bell CTS | Bell CTS |
| Revenues | Adjusted EBITDA |
| (in $ millions) | (in $ millions) |
| | | | (% adjusted EBITDA margin) |
| |
|
|
|
|
20 BCE Inc. 2024 SECOND QUARTER SHAREHOLDER REPORT
| | | | | | | | | | | | | | | | | | | | |
Total mobile phone subscriber growth(2) | Mobile phone postpaid net subscriber activations in Q2 2024 | Mobile phone prepaid net subscriber activations in Q2 2024 | Mobile phone postpaid churn in Q2 2024(3) | Mobile phone blended average revenue per user (ARPU)(2)(4) |
| per month | |
| +3.1% | 78,500 | 52,543 | 1.18% | (1.9%) | |
| Q2 2024 vs. Q2 2023 | Decreased (29.5%) vs. Q2 2023 | vs. net activations of 14,257 in Q2 2023 | Increased 0.24 pts vs. Q2 2023 | Q2 2024: Q2 2023: | $58.04 $59.16
| |
Retail high-speed Internet subscriber growth(5)(6)(7) | Retail high-speed Internet net subscriber activations in Q2 2024 | Retail IPTV subscriber growth(1)(7) |
| +4.2% | 23,841 | +5.6% |
| Q2 2024 vs. Q2 2023 | Decreased (4.4%) vs. Q2 2023 | Q2 2024 vs. Q2 2023 |
| Retail IPTV net subscriber losses in Q2 2024 | Retail residential NAS lines subscriber decline(7) |
| (1,313) | (8.4%) |
| vs. net activations of 11,506 in Q2 2023 | Q2 2024 vs. Q2 2023 |
(1)In Q2 2024, we increased our retail IPTV subscriber base by 40,997 to align the deactivation policy for our Fibe TV streaming services to our traditional Fibe TV service.
(2)In Q1 2024, we adjusted our mobile phone postpaid subscriber base to remove very low to non-revenue generating business market subscribers of 105,802.
(3)Mobile phone churn is defined as the rate at which existing mobile phone subscribers cancel their services. Refer to section 8.6, KPIs in this MD&A for more information on this measure.
(4)Mobile phone blended ARPU is defined as Bell CTS wireless external services revenues divided by the average mobile phone subscriber base for the specified period, expressed as a dollar unit per month.
(5)In Q1 2024, we removed 11,645 turbo hubs subscribers from our retail high-speed Internet subscriber base as we are no longer actively marketing this product in our wireless-to-the-home footprint.
(6)In Q1 2024, our retail high-speed Internet subscriber base increased by 3,850 business subscribers as a result of a small acquisition.
(7)In Q2 2023, our retail high-speed Internet, retail IPTV and retail residential NAS lines subscriber bases increased by 35,080, 243 and 7,458 subscribers, respectively, as a result of small acquisitions.
Bell CTS results
Revenues
| | | | | | | | | | | | | | | | | | | | | | | | | | |
| | Q2 2024 | Q2 2023 | $ change | % change | YTD 2024 | YTD 2023 | $ change | % change |
| Wireless | 1,788 | | 1,766 | | 22 | | 1.2 | % | 3,562 | | 3,489 | | 73 | | 2.1 | % |
| Wireline data | 2,034 | | 2,021 | | 13 | | 0.6 | % | 4,046 | | 4,022 | | 24 | | 0.6 | % |
| Wireline voice | 677 | | 722 | | (45) | | (6.2 | %) | 1,360 | | 1,448 | | (88) | | (6.1 | %) |
| Other wireline services | 79 | | 75 | | 4 | | 5.3 | % | 160 | | 153 | | 7 | | 4.6 | % |
| External service revenues | 4,578 | | 4,584 | | (6) | | (0.1 | %) | 9,128 | | 9,112 | | 16 | | 0.2 | % |
| Inter-segment service revenues | 8 | | 7 | | 1 | | 14.3 | % | 14 | | 14 | | — | | — | |
| Operating service revenues | 4,586 | | 4,591 | | (5) | | (0.1 | %) | 9,142 | | 9,126 | | 16 | | 0.2 | % |
| Wireless | 568 | | 626 | | (58) | | (9.3 | %) | 1,252 | | 1,252 | | — | | — | |
| Wireline | 129 | | 137 | | (8) | | (5.8 | %) | 264 | | 343 | | (79) | | (23.0 | %) |
| | | | | | | | |
| | | | | | | | |
| | | | | | | | |
| External/Operating product revenues | 697 | | 763 | | (66) | | (8.7 | %) | 1,516 | | 1,595 | | (79) | | (5.0 | %) |
| Total external revenues | 5,275 | | 5,347 | | (72) | | (1.3 | %) | 10,644 | | 10,707 | | (63) | | (0.6 | %) |
| Total operating revenues | 5,283 | | 5,354 | | (71) | | (1.3 | %) | 10,658 | | 10,721 | | (63) | | (0.6 | %) |
Bell CTS operating revenues decreased by 1.3% in Q2 2024, compared to Q2 2023, due to lower product revenues and lower service revenues, reflecting continued erosion in wireline voice revenues, partly offset by higher wireless and wireline data revenues. In the first half of the year, revenue decreased by 0.6% year over year, driven by lower product revenues, moderated by growth in service revenues, resulting from higher wireless and wireline data revenues, partly offset by ongoing erosion in wireline voice revenues.
Bell CTS operating service revenues decreased by 0.1% in Q2 2024, compared to Q2 2023, but increased by 0.2% in the first six months of the year, compared to the same period in 2023.
•Wireless revenues grew by 1.2% in Q2 2024 and by 2.1% in the first six months of the year, compared to the same periods last year, driven by:
•Continued growth in our mobile phone and connected device subscriber bases coupled with the flow-through of rate increases
These factors were partly offset by:
•Greater year-over-year competitive pricing pressures on rate plans
•Lower data overages driven by increased customer adoption of monthly plans with higher data thresholds, including unlimited plans
•Wireline data revenues grew by 0.6% in both Q2 2024 and the first half of the year, compared to the same periods last year, mainly driven by:
•Higher retail Internet and IPTV subscriber bases, along with the flow-through of residential rate increases
•The contribution from the acquisition of FX Innovation in June 2023 and other small acquisitions made over the past year
•Higher business solutions services sales to enterprise customers
These factors were partly offset by:
•Greater acquisition, retention and bundle discounts on residential services
•Ongoing erosion in our satellite TV subscriber base, and legacy data declines
•Wireline voice revenues declined by 6.2% in Q2 2024 and by 6.1% in the first half of the year, compared to the same periods last year, primarily due to:
•Continued retail residential NAS lines erosion, combined with business voice declines, driven by technological substitution to wireless and Internet-based services
These factors were partly offset by:
•Flow-through of residential rate increases
Bell CTS operating product revenues decreased by 8.7% in Q2 2024 and by 5.0% in the first six months of the year, compared to the same periods the last year.
•Wireless operating product revenues decreased by 9.3% in Q2 2024, compared to the same period last year, due to lower consumer electronic sales at The Source as a result of retail store closures related to the transaction with Best Buy Canada. The decline also reflected lower wireless product revenues from reduced contracted sales volumes, partly offset by a greater sales mix of premium mobile phones. In the first half of the year, wireless operating product revenues remained stable year over year, as the decline in consumer electronic sales at The Source and lower contracted wireless product sales volumes, were offset by the greater sales mix of premium mobile phones.
•Wireline operating product revenues declined by 5.8% in Q2 2024 and by 23.0% in the first six months of the year, compared to the same periods last year, attributable to exceptionally strong equipment sales in 2023 to large enterprise customers, mainly due to the recovery from global supply chain disruptions experienced in 2022, partly offset by higher land mobile radio systems sales to the government sector
Operating costs and adjusted EBITDA
| | | | | | | | | | | | | | | | | | | | | | | | | | |
| | Q2 2024 | Q2 2023 | $ change | % change | YTD 2024 | YTD 2023 | $ change | % change |
| Operating costs | (2,804) | (2,923) | 119 | | 4.1 | % | (5,731) | (5,884) | 153 | | 2.6 | % |
| Adjusted EBITDA | 2,479 | 2,431 | 48 | | 2.0 | % | 4,927 | 4,837 | 90 | | 1.9 | % |
| Adjusted EBITDA margin | 46.9 | % | 45.4 | % | | 1.5 pts | 46.2 | % | 45.1 | % | | 1.1 pts |
Bell CTS operating costs decreased by 4.1% in Q2 2024 and by 2.6% in the first half of the year, compared to the same periods in 2023, due to:
•Cost reduction initiatives, mainly attributable to workforce reductions and other operating efficiencies
•Lower cost of goods sold associated with the decline in product revenues
•Savings from lower call volumes to our customer service centres
These factors were partly offset by:
•Greater costs from the acquisitions of FX Innovation in June 2023, along with other small acquisitions made during the past year
•Higher bad debt expense
•Increased costs related to the growth in business solutions services revenue
Bell CTS adjusted EBITDA increased by 2.0% in Q2 2024 and by 1.9% in the first half of the year, compared to the same periods in 2023, driven by lower operating costs, moderated by a decline in operating revenues. Adjusted EBITDA margin of 46.9% in Q2 2024, and 46.2% in the first half of the year, increased by 1.5 pts and 1.1 pts, respectively, over the same periods
22 BCE Inc. 2024 SECOND QUARTER SHAREHOLDER REPORT
in 2023, due to lower operating expenses, reflecting the favourable impact of various cost reduction initiatives and other operating efficiencies, coupled with a lower proportion of low-margin product sales in our total revenue base.
Bell CTS operating metrics
Wireless
| | | | | | | | | | | | | | | | | | | | | | | | | | |
| | Q2 2024 | Q2 2023 | Change | % change | YTD 2024 | YTD 2023 | Change | % change |
| Mobile phones | | | | | | | | |
Blended ARPU(1) ($/month) | 58.04 | 59.16 | (1.12) | (1.9 | %) | 58.09 | 58.66 | (0.57) | (1.0 | %) |
| | | | | | | | |
| Gross subscriber activations | 575,334 | 502,940 | 72,394 | 14.4 | % | 1,082,773 | 908,475 | 174,298 | 19.2 | % |
| Postpaid | 389,213 | 347,746 | 41,467 | 11.9 | % | 756,087 | 620,355 | 135,732 | 21.9 | % |
| Prepaid | 186,121 | 155,194 | 30,927 | 19.9 | % | 326,686 | 288,120 | 38,566 | 13.4 | % |
| Net subscriber activations (losses) | 131,043 | 125,539 | 5,504 | 4.4 | % | 156,251 | 152,174 | 4,077 | 2.7 | % |
| Postpaid | 78,500 | 111,282 | (32,782) | (29.5 | %) | 123,747 | 154,571 | (30,824) | (19.9 | %) |
| Prepaid | 52,543 | 14,257 | 38,286 | n.m. | 32,504 | (2,397) | 34,901 | n.m. |
| Blended churn % (average per month) | 1.47 | % | 1.27 | % | | (0.20) pts | 1.53 | % | 1.28 | % | | (0.25) pts |
| Postpaid | 1.18 | % | 0.94 | % | | (0.24) pts | 1.20 | % | 0.92 | % | | (0.28) pts |
| Prepaid | 4.60 | % | 4.68 | % | | 0.08 pts | 5.16 | % | 4.98 | % | | (0.18) pts |
Subscribers(1) | 10,337,495 | 10,028,031 | 309,464 | 3.1 | % | 10,337,495 | 10,028,031 | 309,464 | 3.1 | % |
Postpaid(1) | 9,440,775 | 9,151,229 | 289,546 | 3.2 | % | 9,440,775 | 9,151,229 | 289,546 | 3.2 | % |
| Prepaid | 896,720 | 876,802 | 19,918 | 2.3 | % | 896,720 | 876,802 | 19,918 | 2.3 | % |
| Mobile connected devices | | | | | | | | |
| Net subscriber activations | 87,917 | 79,537 | 8,380 | 10.5 | % | 154,323 | 150,279 | 4,044 | 2.7 | % |
| Subscribers | 2,886,871 | 2,589,520 | 297,351 | 11.5 | % | 2,886,871 | 2,589,520 | 297,351 | 11.5 | % |
n.m.: not meaningful(1)In Q1 2024, we adjusted our mobile phone postpaid subscriber base to remove very low to non-revenue generating business market subscribers of 105,802.
Mobile phone blended ARPU of $58.04 in Q2 2024 and $58.09 in the first half of the year decreased by 1.9% and 1.0%, respectively, compared to the same periods last year, driven by:
•Greater year-over-year competitive pricing pressures on rate plans
•Lower data overages due to greater customer adoption of monthly plans with higher data thresholds, including unlimited plans
These factors were partly offset by:
•Flow-through of rate increases
•The impact from the Q1 2024 adjustment to our mobile phone postpaid subscriber base to remove very low to non-revenue generating business market subscribers of 105,802
Mobile phone gross subscriber activations grew by 14.4% in Q2 2024 and by 19.2% year to date, compared to the same periods last year, due to both higher postpaid and prepaid gross subscriber activations.
•Mobile phone postpaid gross subscriber activations increased year over year by 11.9% in Q2 2024 and by 21.9% in the first six months of the year, driven by effective promotions focused on growing higher-valued mobile phone subscribers, as well as reflecting the impact from population growth, and continued 5G and multi-product bundling momentum
•Mobile phone prepaid gross subscriber activations increased year over year by 19.9% in Q2 2024 and by 13.4% in the first half of the year, driven by expanded retail distribution and effective Lucky Mobile promotions
Mobile phone net subscriber activations increased by 4.4% in Q2 2024 and by 2.7% in the first half of the year, compared to the same periods last year, due to greater prepaid net subscriber activations, partly offset by lower postpaid net subscriber activations.
•Mobile phone postpaid net subscriber activations decreased year over year by 29.5% in the second quarter and by 19.9% in the first six months of the year, due to greater subscriber deactivations, partly offset by higher gross activations
•Mobile phone prepaid net subscriber activations increased year over year by 38,286 in Q2 2024, due to higher gross activations and fewer subscriber deactivations. In the first half of the year, mobile phone prepaid net subscriber activations increased by 34,901 year over year, due to higher gross activations, partly offset by greater subscriber deactivations.
Mobile phone blended churn of 1.47% in Q2 2024 and 1.53% year to date, increased by 0.20 pts and 0.25 pts, respectively, compared to the same periods in 2023.
•Mobile phone postpaid churn of 1.18% in the quarter and 1.20% in the first half of the year, increased by 0.24 pts and 0.28 pts, respectively, compared to the same periods last year, due to higher subscriber deactivations driven by greater overall competitive market activity and promotional offer intensity as we continue to focus our retention offers on higher-valued mobile phone subscribers
•Mobile phone prepaid churn of 4.60% decreased by 0.08 pts this quarter, compared to Q2 2023, due to lower subscriber deactivations driven by successful retention offers on Lucky Mobile, partly offset by greater overall market activity. Conversely, in the first six months of the year, mobile phone prepaid churn of 5.16% increased by 0.18 pts year over year, due to higher subscriber deactivations attributable to more attractive promotional offers and availability of mobile 5G service on postpaid discount brands, partly offset by successful retention offers on Lucky Mobile.
Mobile phone subscribers at June 30, 2024 totalled 10,337,495, an increase of 3.1%, from 10,028,031 subscribers reported at the end of Q2 2023. This consisted of 9,440,775 postpaid subscribers, an increase of 3.2% from 9,151,229 subscribers reported at the end of Q2 2023, and 896,720 prepaid subscribers, an increase of 2.3% from 876,802 subscribers reported at the end of Q2 2023.
Mobile connected device net subscriber activations increased by 10.5% in Q2 2024 and by 2.7% year to date, compared to the same periods last year, due to higher Internet of Things (IoT) net activations including greater connected cars subscriptions, partly offset by greater net losses from data devices.
Mobile connected device subscribers at June 30, 2024 totalled 2,886,871, up 11.5% from 2,589,520 subscribers reported at the end of Q2 2023.
Wireline data
Retail high-speed Internet
| | | | | | | | | | | | | | | | | | | | | | | | | | |
| | Q2 2024 | Q2 2023 | Change | % change | YTD 2024 | YTD 2023 | Change | % change |
| Retail net subscriber activations | 23,841 | | 24,934 | | (1,093) | | (4.4 | %) | 54,919 | | 52,208 | | 2,711 | | 5.2 | % |
| | | | | | | | |
Retail subscribers(1)(2)(3) | 4,520,553 | | 4,338,511 | | 182,042 | | 4.2 | % | 4,520,553 | | 4,338,511 | | 182,042 | | 4.2 | % |
| | | | | | | | |
(1)In Q1 2024, we removed 11,645 turbo hubs subscribers from our retail high-speed Internet subscriber base as we are no longer actively marketing this product in our wireless-to-the-home footprint.
(2)In Q1 2024, our retail high-speed Internet subscriber base increased by 3,850 business subscribers as a result of a small acquisition.
(3)In Q2 2023, our retail high-speed Internet subscriber base increased by 35,080 as a result of small acquisitions.
Retail high-speed Internet net subscriber activations decreased by 4.4% in Q2 2024, compared to the same period last year, mainly due to lower net activations in our small business market, moderated by modest growth in our residential market, mainly due to higher gross activations in our fibre-to-the-premise (FTTP) footprint and the success of our bundled service offerings with mobile services, partly offset by less new FTTP footprint expansion and greater subscriber deactivations due to aggressive promotional offers by competitors. In the first six months of the year, net activations increased by 5.2%, compared to the same period last year, as the higher year-over-year residential gross activations more than offset the unfavourable factors described above.
Retail high-speed Internet subscribers totalled 4,520,553 at June 30, 2024, up 4.2% from 4,338,511 subscribers reported at the end of Q2 2023.
Retail IPTV
| | | | | | | | | | | | | | | | | | | | | | | | | | |
| | Q2 2024 | Q2 2023 | Change | % change | YTD 2024 | YTD 2023 | Change | % change |
| Retail IPTV net subscriber (losses) activations | (1,313) | | 11,506 | | (12,819) | | n.m. | 12,861 | | 22,405 | | (9,544) | | (42.6 | %) |
| | | | | | | | |
| | | | | | | | |
Retail IPTV subscribers(1)(2) | 2,124,200 | | 2,010,829 | | 113,371 | | 5.6 | % | 2,124,200 | | 2,010,829 | | 113,371 | | 5.6 | % |
| | | | | | | | |
| | | | | | | | |
n.m.: not meaningful(1)In Q2 2024, we increased our retail IPTV subscriber base by 40,997 to align the deactivation policy for our Fibe TV streaming services to our traditional Fibe TV service.
(2)In Q2 2023, our retail IPTV subscriber base increased by 243 as a result of small acquisitions.
Retail IPTV net subscriber activations decreased by 12,819 in Q2 2024 and by 9,544 in the first six months of the year, compared to the same periods in 2023, driven by lower gross activations from our Fibe TV streaming services due to rate increases in the quarter for new subscribers, along with reduced promotional offers, greater competitive intensity and higher substitution with OTT services.
Retail IPTV subscribers at June 30, 2024 totalled 2,124,200, up 5.6% from 2,010,829 subscribers reported at the end of Q2 2023. In Q2 2024, we increased our retail IPTV subscriber base by 40,997 to align the deactivation policy for our Fibe TV streaming services to our traditional Fibe TV service.
24 BCE Inc. 2024 SECOND QUARTER SHAREHOLDER REPORT
Wireline voice
| | | | | | | | | | | | | | | | | | | | | | | | | | |
| | Q2 2024 | Q2 2023 | Change | % change | YTD 2024 | YTD 2023 | Change | % change |
| Retail residential NAS lines net losses | (53,250) | | (49,608) | | (3,642) | | (7.3 | %) | (97,161) | | (96,489) | | (672) | | (0.7 | %) |
| | | | | | | | |
Retail residential NAS lines(1) | 1,924,456 | | 2,101,740 | | (177,284) | | (8.4 | %) | 1,924,456 | | 2,101,740 | | (177,284) | | (8.4 | %) |
| | | | | | | | |
(1)In Q2 2023, our retail residential NAS lines subscriber base increased by 7,458 subscribers as a result of small acquisitions.
Retail residential NAS lines net losses declined by 7.3% in the quarter and by 0.7% in the first half of the year, compared to the same periods in 2023, due to the unfavourable impact of continued substitution to wireless and Internet-based technologies. In the first six months of the year, retail residential NAS lines net losses were favourably impacted by lower year-over-year competitive intensity in Q1 2024, resulting in lower deactivations.
Retail residential NAS lines of 1,924,456 at June 30, 2024, declined by 8.4% from 2,101,740 lines reported at the end of Q2 2023. The Q2 2024 rate of erosion of 8.4% has deteriorated over the 4.8% experienced in Q2 2023, mainly due to the impact of the acquisition of Distributel Communications Limited in Q4 2022, along with small acquisitions made in Q2 2023.
Assumptions
As at the date of this MD&A, our forward-looking statements set out in the BCE 2023 Annual MD&A, as updated or supplemented in the BCE 2024 First Quarter MD&A and in this MD&A, are based on certain assumptions including, without limitation, the following assumptions, the assumptions referred to in the Bell Media business segment discussion set out in section 3.2, Bell Media, of this MD&A, as well as the economic, market and other assumptions referred to in section 1.3, Assumptions of this MD&A.
•Increase our market share of national operators’ wireless mobile phone net additions
•Increased competitive intensity and promotional activity across all regions and market segments
•Ongoing expansion and deployment of 5G and 5G+ wireless networks, offering competitive coverage and quality
•Continued diversification of our distribution strategy with a focus on expanding direct-to-consumer (DTC) and online transactions
•In the BCE 2023 Annual MD&A, we disclosed our assumption of moderating growth in mobile phone blended ARPU. We are now assuming declining mobile phone blended ARPU, due to a higher-than-anticipated level of competitive pricing pressure which intensified progressively in the first quarter of 2024, that has carried over from the seasonally more intense Q4 2023 selling period.
•Continuing business customer adoption of advanced 5G, 5G+ and IoT solutions
•Improving wireless handset device availability in addition to stable device pricing and margins
•Further deployment of direct fibre to more homes and businesses within our wireline footprint, but at a slower pace than during any of 2020 to 2023
•Continued growth in retail Internet and IPTV subscribers
•Increasing wireless and Internet-based technological substitution
•Continued focus on the consumer household and bundled service offers for mobility and Internet customers
•Continued large business customer migration to IP-based systems
•Ongoing competitive repricing pressures in our business and wholesale markets
•Continued competitive intensity in our small and medium-sized business markets as cable operators and other telecommunications competitors continue to intensify their focus on business customers
•Traditional high-margin product categories challenged by large global cloud and OTT providers of business voice and data solutions expanding into Canada with on-demand services
•Increasing customer adoption of OTT services resulting in downsizing of TV packages
•Growing consumption of OTT TV services and on-demand video streaming, as well as the proliferation of devices, such as tablets, that consume large quantities of bandwidth, will require ongoing capital investment
•Realization of cost savings related to operating efficiencies enabled by our direct fibre footprint, changes in consumer behaviour and product innovation, digital adoption, product and service enhancements, expanding self-serve capabilities, new call centre and digital investments, other improvements to the customer service experience, management workforce reductions including attrition and retirements, and lower contracted rates from our suppliers
•No adverse material financial, operational or competitive consequences of changes in or implementation of regulations affecting our communication and technology services business
Key business developments
Acquisition of OUTFRONT Media’s Canadian out-of-home media business
On June 7, 2024, Bell Media completed the previously announced acquisition of the Canadian out-of-home (OOH) media business of OUTFRONT Media Inc., OUTEDGE Media Canada (OUTEDGE), for cash consideration of $429 million ($418 million net of cash acquired). The acquisition of OUTEDGE is expected to support Bell Media’s digital media strategy and to deliver multi-channel marketing solutions across Canada. Pursuant to a consent agreement negotiated with the Competition Bureau, Bell Media must dispose of 669 advertising displays in Québec and Ontario. The results of OUTEDGE are included in our Bell Media segment.
Bell Media Becomes Strategic Canadian Partner of TikTok’s Pulse Premiere
On June 6, 2024, Bell Media announced it joined onto a strategic partnership that brings TikTok’s Pulse Premiere to Canada. Pulse Premiere is an advertising solution that gives advertisers' brands the control and predictability to choose where their ads are placed, adjacent to select publisher partner content on the For You feed. The new partnership allows ads to be featured adjacent to Bell Media’s TikTok content.
Partnership with Dotdash Meredith to Expand Premium Digital Advertising in Canada
Bell Media was selected to become the new Canadian sales partner of Dotdash Meredith, America’s largest digital publisher, expanding premium digital advertising in Canada. This partnership leverages Dotdash Meredith’s premium digital inventory from more than 40 renowned media brands as well as Bell Media’s sales team and advertising expertise to expand the reach and effectiveness of digital ad campaigns across the country.
Launch of Bell Ads for Business, a Self-Serve Digital Advertising Buying Platform
On June 6, 2024, Bell Media announced the launch of Bell Ads for Business, a new advertising platform that allows businesses across Canada to utilize Bell’s premium Canadian data, and target intended audiences, while accessing digital inventory across the open internet and Bell Media digital properties. Powered by Bell First Party Data, Bell Ads for Business allows local advertisers to take advantage of the unique capabilities of the Bell demand-side platform (DSP) through an easy-to-use self-serve platform.
New FAST Channel platform partners
On June 6, 2024, Bell Media announced the addition of new platform partners for its 10 free ad-supported streaming television (FAST) channels which launched in April 2024 on LG Channels. Bell Media’s 10 FAST channels will launch this year on Plex and The Roku Channel, and as previously announced, Samsung TV Plus. The launch of additional FAST channel partners expands advertising opportunities for Bell Media clients, allowing advertisers to reach a wider Canadian audience and effectively engage their desired target demographics.
26 BCE Inc. 2024 SECOND QUARTER SHAREHOLDER REPORT
Financial performance analysis
Q2 2024 performance highlights
| | | | | |
| Bell Media | Bell Media |
| Revenues | Adjusted EBITDA |
| (in $ millions) | (in $ millions) |
| |
| Bell Media | Bell Media |
| Revenues | Adjusted EBITDA |
| (in $ millions) | (in $ millions) |
| |
Bell Media results
Revenues
| | | | | | | | | | | | | | | | | | | | | | | | | | |
| Q2 2024 | Q2 2023 | $ change | % change | YTD 2024 | YTD 2023 | $ change | % change |
| External revenues | 730 | | 719 | | 11 | | 1.5 | % | 1,372 | | 1,413 | | (41) | | (2.9 | %) |
| Inter-segment revenues | 82 | | 86 | | (4) | | (4.7 | %) | 165 | | 172 | | (7) | | (4.1 | %) |
| Bell Media operating revenues | 812 | | 805 | | 7 | | 0.9 | % | 1,537 | | 1,585 | | (48) | | (3.0 | %) |
Bell Media operating revenues increased by 0.9% in Q2 2024, compared to the same period last year, driven by higher advertising and other revenues, partly offset by lower subscriber revenues. In the first half of the year, operating revenues decreased by 3.0%, compared to the same period last year, due to lower subscriber revenues, partly offset by higher advertising and other revenues. Operating revenues benefited from the continued growth of digital revenues(1) of 23% in the quarter and 28% in the first six months of the year, compared to the same periods last year.
•Advertising revenues increased by 1.9% in Q2 2024 and by 1.8% year to date, compared to the same periods last year, due to continued growth in digital advertising revenues mainly resulting from increased bookings from Bell Media's strategic audience management (SAM) TV media sales tool, higher OOH revenues from the acquisition of OUTEDGE in June 2024 and growth in advertising revenues from sports specialty TV, including the benefit from the broadcast of the UEFA EURO 2024 and the CONMEBOL Copa América 2024. The growth in advertising revenues was moderated by continued lower demand for traditional broadcast TV and radio advertising, as a result of ongoing unfavourable economic conditions, coupled with content delays driven by the Writers Guild of America (WGA) and the Screen Actors Guild and American Federation of Television and Radio Artists (SAG-AFTRA) strikes in 2023.
•Subscriber revenues declined by 4.7% in Q2 2024 and by 9.4% in the first six months of the year, compared to the same periods last year, due to lower year-over-year BDU subscribers, partly offset by growth in Crave and sports streaming DTC subscribers. In the first half of the year, subscriber revenues were also unfavourably impacted by the benefit last year from a retroactive adjustment related to a contract with a Canadian TV distributor.
•Other revenues increased in Q2 2024 and in the first half of the year, compared to the same periods last year, mainly due to higher year-over-year revenues from Formula 1 and higher program sales
Operating costs and adjusted EBITDA
| | | | | | | | | | | | | | | | | | | | | | | | | | |
| Q2 2024 | Q2 2023 | $ change | % change | YTD 2024 | YTD 2023 | $ change | % change |
| Operating costs | (594) | (591) | (3) | | (0.5%) | (1,202) | (1,239) | 37 | | 3.0% |
| Adjusted EBITDA | 218 | 214 | 4 | | 1.9% | 335 | 346 | (11) | | (3.2%) |
| Adjusted EBITDA margin | 26.8 | % | 26.6 | % | | 0.2 | pts | 21.8 | % | 21.8 | % | | — | |
Bell Media operating costs increased by 0.5% in Q2 2024, compared to the same period last year, due to:
•Higher costs associated with the revenue growth from Formula 1
•Greater costs due to the acquisition of OUTEDGE
•Higher content costs from the broadcast of UEFA EURO 2024 and CONMEBOL Copa América 2024
These factors were partly offset by:
•Restructuring initiatives undertaken over the past year as a result of the unfavourable economic and broadcasting regulatory environments
•Lower costs driven by content delays due to the WGA and SAG-AFTRA strikes in 2023
In the first six months of the year, operating costs declined by 3.0% year over year, reflecting lower costs driven by content delays due to the WGA and SAG-AFTRA strikes in 2023, restructuring initiatives undertaken over the past year as a result of the unfavourable economic and broadcasting regulatory environments along with the cessation of the Canadian Radio-television and Telecommunications Commission (CRTC) Part II broadcasting licence fee, partly offset by the higher operating costs discussed above.
Bell Media adjusted EBITDA grew by 1.9% in Q2 2024, compared to Q2 2023, due to higher operating revenues, partly offset by greater operating costs. Conversely, year-to-date adjusted EBITDA decreased by 3.2% year over year, due to lower operating revenues, partly offset by decreased operating costs.
(1)Digital revenues are comprised of advertising revenue from digital platforms including websites, mobile apps, connected TV apps and OOH digital assets/platforms, as well as advertising procured through Bell digital buying platforms and subscription revenue from DTC services and video on demand services.
28 BCE Inc. 2024 SECOND QUARTER SHAREHOLDER REPORT
Assumptions
As at the date of this MD&A, our forward-looking statements set out in the BCE 2023 Annual MD&A, as updated or supplemented in the BCE 2024 First Quarter MD&A and in this MD&A, are based on certain assumptions including, without limitation, the following assumptions, the assumptions referred to in the Bell CTS business segment discussion set out in section 3.1, Bell CTS, of this MD&A, as well as the economic, market and other assumptions referred to in section 1.3, Assumptions, of this MD&A.
•Overall digital revenue expected to reflect continued scaling of our SAM TV and demand-side platform buying platforms, expansion of Addressable TV, as well as DTC subscriber growth, contributing towards the advancement of our digital-first media strategy
•Leveraging of first-party data to improve targeting, advertisement delivery including personalized viewing experience and attribution
•Continued escalation of media costs to secure quality content
•Continued scaling of Crave through optimized content offering, user experience improvements and expanded distribution
•Continued support in original French content with a focus on digital platforms such as Crave, Noovo.ca and iHeartRadio Canada, to better serve our French-language customers through a personalized digital experience
•Ability to successfully acquire and produce highly-rated and differentiated content
•Building and maintaining strategic supply arrangements for content across all screens and platforms
•No adverse material financial, operational or competitive consequences of changes in or implementation of regulations affecting our media business
4 Financial and capital management
This section tells you how we manage our cash and capital resources to carry out our strategy and deliver financial results. It provides an analysis of our financial condition, cash flows and liquidity on a consolidated basis.
| | | | | | | | | | | | | | |
| June 30, 2024 | December 31, 2023 | $ change | % change |
| Long-term debt | 32,918 | | 31,135 | | 1,783 | | 5.7 | % |
| Debt due within one year | 6,587 | | 5,042 | | 1,545 | | 30.6 | % |
50% of preferred shares(1) | 1,780 | | 1,834 | | (54) | | (2.9 | %) |
| Cash | (1,398) | | (547) | | (851) | | n.m. |
| Cash equivalents | (250) | | (225) | | (25) | | (11.1 | %) |
| Short-term investments | (750) | | (1,000) | | 250 | | 25.0 | % |
Net debt(2) | 38,887 | | 36,239 | | 2,648 | | 7.3 | % |
n.m.: not meaningful
(1)50% of outstanding preferred shares of $3,559 million and $3,667 million at June 30, 2024 and December 31, 2023, respectively, are classified as debt consistent with the treatment by some credit rating agencies.
(2)Net debt is a non-GAAP financial measure. See section 8.1, Non-GAAP financial measures in this MD&A for more information on this measure.
The increase of $1,545 million in debt due within one year and the increase of $1,783 million in long-term debt were due to:
•the issuance by Bell Canada of Series US-9 Notes, with a total principal amount of $700 million in U.S. dollars ($942 million in Canadian dollars)
•the issuance by Bell Canada of Series US-10 Notes, with a total principal amount of $750 million in U.S. dollars ($1,009 million in Canadian dollars)
•the issuance by Bell Canada of Series M-61 MTN debentures, with a total principal amount of $400 million
•the issuance by Bell Canada of Series M-63 MTN debentures, with a total principal amount of $1,100 million
•an increase in notes payable (net of repayments) of $1,383 million
•an increase in outstanding loans of $324 million under the Bell Mobility uncommitted trade loan agreement
•a net increase of $143 million due to higher lease liabilities and other debt
Partly offset by:
•the repayment at maturity of Series M-44 MTN debentures, with a total principal amount of $1,000 million
•the repayment at maturity of Series US-3 Notes, with a total principal amount of $600 million in U.S. dollars ($748 million in Canadian dollars)
•the repayment at maturity of Series 10 Notes, with a total principal amount of $225 million
The increase in cash of $851 million, the increase in cash equivalents of $25 million and the decrease in short-term investments of $250 million were mainly due to:
•$3,808 million of issuance of long-term debt
•$3,269 million of cash flows from operating activities
•$1,383 million increase in notes payable (net of repayments)
Partly offset by:
•$2,638 million repayment of long-term debt
•$1,980 million of capital expenditures
•$1,793 million of dividends paid on BCE common shares
•$518 million for spectrum licences
•$517 million for business acquisitions
•$144 million paid for the purchase on the open market of BCE common shares for the settlement of share-based payments
•$91 million of dividends paid on BCE preferred shares
•$76 million paid for the repurchase of BCE preferred shares
30 BCE Inc. 2024 SECOND QUARTER SHAREHOLDER REPORT
4.2 Outstanding share data | | | | | |
| Common shares outstanding | Number of shares |
| Outstanding, January 1, 2024 | 912,274,545 | |
| Shares issued under deferred share plan | 8,558 | |
| |
| |
| Outstanding, June 30, 2024 | 912,283,103 | |
| | | | | | | | |
| Stock options outstanding | Number of options | Weighted average
exercise price ($) |
| Outstanding, January 1, 2024 | 7,484,561 | | 61 | |
| | |
| | |
| Forfeited or expired | (930,211) | | 59 | |
| | |
| Outstanding and exercisable, June 30, 2024 | 6,554,350 | | 61 | |
| | |
| | | | | | | | | | | | | | | | | | | | | | | | | | | | | | | |
| Q2 2024 | | Q2 2023 | | $ change | % change | | YTD 2024 | | YTD 2023 | | $ change | % change |
| Cash flows from operating activities | 2,137 | | | 2,365 | | | (228) | | (9.6 | %) | | 3,269 | | | 3,612 | | | (343) | | (9.5 | %) |
| Capital expenditures | (978) | | | (1,307) | | | 329 | | 25.2 | % | | (1,980) | | | (2,393) | | | 413 | | 17.3 | % |
| Cash dividends paid on preferred shares | (45) | | | (46) | | | 1 | | 2.2 | % | | (91) | | | (101) | | | 10 | | 9.9 | % |
| Cash dividends paid by subsidiaries to non-controlling interest | (28) | | | (1) | | | (27) | | n.m. | | (42) | | | (22) | | | (20) | | (90.9 | %) |
| Acquisition and other costs paid | 11 | | | 5 | | | 6 | | n.m. | | 26 | | | 5 | | | 21 | | n.m. |
| | | | | | | | | | | | | |
| | | | | | | | | | | | | |
| Free cash flow | 1,097 | | | 1,016 | | | 81 | | 8.0 | % | | 1,182 | | | 1,101 | | | 81 | | 7.4 | % |
| | | | | | | | | | | | | |
| Business acquisitions | (435) | | | (196) | | | (239) | | n.m. | | (517) | | | (221) | | | (296) | | n.m. |
| Business dispositions | — | | | 208 | | | (208) | | (100.0 | %) | | — | | | 208 | | | (208) | | (100.0 | %) |
| Acquisition and other costs paid | (11) | | | (5) | | | (6) | | n.m. | | (26) | | | (5) | | | (21) | | n.m. |
| (Decrease) increase in short-term investments | (50) | | | — | | | (50) | | n.m. | | 250 | | | — | | | 250 | | n.m. |
| Spectrum licences | (414) | | | (145) | | | (269) | | n.m. | | (518) | | | (156) | | | (362) | | n.m. |
| | | | | | | | | | | | | |
| | | | | | | | | | | | | |
| | | | | | | | | | | | | |
| Other investing activities | (11) | | | (16) | | | 5 | | 31.3 | % | | (21) | | | 15 | | | (36) | | n.m. |
| | | | | | | | | | | | | |
| Increase (decrease) in notes payable | 404 | | | (101) | | | 505 | | n.m. | | 1,383 | | | (184) | | | 1,567 | | n.m. |
| Decrease in securitized receivables | — | | | (500) | | | 500 | | 100.0 | % | | — | | | — | | | — | | — | |
| Issue of long-term debt | 1,617 | | | 1,199 | | | 418 | | 34.9 | % | | 3,808 | | | 2,703 | | | 1,105 | | 40.9 | % |
| Repayment of long-term debt | (525) | | | (346) | | | (179) | | (51.7 | %) | | (2,638) | | | (645) | | | (1,993) | | n.m. |
| Repurchase of a financial liability | — | | | — | | | — | | — | | | — | | | (149) | | | 149 | | 100.0 | % |
| Issue of common shares | — | | | 8 | | | (8) | | (100.0 | %) | | — | | | 18 | | | (18) | | (100.0 | %) |
| | | | | | | | | | | | | |
| | | | | | | | | | | | | |
| Purchase of shares for settlement of share-based payments | (40) | | | (42) | | | 2 | | 4.8 | % | | (144) | | | (135) | | | (9) | | (6.7 | %) |
| Repurchase of preferred shares | (38) | | | (32) | | | (6) | | (18.8 | %) | | (76) | | | (63) | | | (13) | | (20.6 | %) |
| Cash dividends paid on common shares | (910) | | | (882) | | | (28) | | (3.2 | %) | | (1,793) | | | (1,721) | | | (72) | | (4.2 | %) |
| | | | | | | | | | | | | |
| | | | | | | | | | | | | |
| | | | | | | | | | | | | |
| | | | | | | | | | | | | |
| | | | | | | | | | | | | |
| Other financing activities | 4 | | | (7) | | | 11 | | n.m. | | (14) | | | (15) | | | 1 | | 6.7 | % |
| | | | | | | | | | | | | |
| Net increase (decrease) in cash | 609 | | | (201) | | | 810 | | n.m. | | 851 | | | 351 | | | 500 | | n.m. |
| Net increase in cash equivalents | 79 | | | 360 | | | (281) | | (78.1 | %) | | 25 | | | 400 | | | (375) | | (93.8 | %) |
n.m.: not meaningful
Cash flows from operating activities and free cash flow
Cash flows from operating activities in the second quarter of 2024 decreased by $228 million, compared to the same period last year, mainly due to higher interest paid, higher severance and other costs paid and lower cash from working capital due in part to timing of supplier payments, partly offset by lower income taxes paid and higher adjusted EBITDA.
Cash flows from operating activities in the first half of 2024 decreased by $343 million, compared to the same period last year, mainly due to higher interest paid, higher income taxes paid, higher severance and other costs paid and lower cash from working capital, partly offset by higher adjusted EBITDA.
Free cash flow in both the second quarter and first half of 2024 increased by $81 million, compared to the same periods last year, due to lower capital expenditures, partly offset by lower cash flows from operating activities, excluding cash from acquisition and other costs paid.
Capital expenditures
| | | | | | | | | | | | | | | | | | | | | | | | | | |
| Q2 2024 | Q2 2023 | $ change | % change | YTD 2024 | YTD 2023 | $ change | % change |
| Bell CTS | 945 | 1,271 | 326 | | 25.6 | % | 1,920 | 2,323 | 403 | | 17.3 | % |
Capital intensity(1) | 17.9 | % | 23.7 | % | | 5.8 | pts | 18.0 | % | 21.7 | % | | 3.7 | pts |
| Bell Media | 33 | 36 | 3 | | 8.3 | % | 60 | 70 | 10 | | 14.3 | % |
| Capital intensity | 4.1 | % | 4.5 | % | | 0.4 | pts | 3.9 | % | 4.4 | % | | 0.5 | pts |
| BCE | 978 | 1,307 | 329 | | 25.2 | % | 1,980 | 2,393 | 413 | | 17.3 | % |
| Capital intensity | 16.3 | % | 21.5 | % | | 5.2 | pts | 16.5 | % | 19.7 | % | | 3.2 | pts |
(1)Capital intensity is defined as capital expenditures divided by operating revenues.
BCE capital expenditures of $978 million in Q2 2024 and $1,980 million year to date, declined by $329 million and $413 million, respectively, compared to the same periods last year. This corresponded to a capital intensity ratio of 16.3% in Q2 2024 and 16.5% year to date, down 5.2 pts and 3.2 pts, respectively, over the same periods in 2023. The year-over-year declines reflected:
•Lower capital expenditures in Bell CTS of $326 million in Q2 2024 and $403 million in the first half of the year, consistent with a planned reduction in capital spending, mainly reflecting a slowdown in our FTTP rollout
•Reduced capital expenditures in Bell Media of $3 million in Q2 2024 and $10 million in the first half of the year, mainly due to greater spending in Q2 2023 on Addressable TV. Additionally, the year-to-date decline also reflected higher spending in Q1 2023 on studio expansions, partly offset by higher investments to support digital growth.
On June 7, 2024, Bell Media completed the previously announced acquisition of OUTFRONT Media Inc.’s Canadian OOH media business, OUTEDGE, for cash consideration of $429 million ($418 million net of cash acquired). The acquisition of OUTEDGE is expected to support Bell Media’s digital media strategy and to deliver multi-channel marketing solutions across Canada. Pursuant to a consent agreement negotiated with the Competition Bureau, Bell Media must dispose of 669 advertising displays in Québec and Ontario.
On June 1, 2023, Bell acquired FX Innovation, a Montréal-based provider of cloud-focused managed and professional services and workflow automation solutions for business clients, for cash consideration of $157 million, of which $12 million is payable within two years and an estimated $6 million of additional cash consideration contingent on the achievement of certain performance objectives. This contingent consideration is expected to be settled by 2027 and the maximum amount payable is $7 million. The acquisition of FX Innovation aims to position Bell as a technology services leader for our enterprise customers.
Business dispositions
On May 3, 2023, we completed the previously announced sale of our 63% ownership in certain production studios, which were included in our Bell Media segment, for net cash proceeds of $211 million.
Spectrum licences
On November 30, 2023, Bell Mobility secured the right to acquire 939 licences of 3800 MHz spectrum across Canada for $518 million. On January 17, 2024, Bell made a first payment of $104 million to Innovation, Science and Economic Development Canada (ISED). The remaining balance of $414 million was paid on May 29, 2024, at which time Bell acquired the 3800 MHz spectrum licences.
On May 19, 2023, after approval from ISED, Bell Mobility obtained the right to use, through subordination, certain of Xplore Inc.'s 3500 MHz spectrum licences in Québec, for $145 million.
32 BCE Inc. 2024 SECOND QUARTER SHAREHOLDER REPORT
Debt instruments
2024
In the second quarter of 2024, we issued debt, net of repayments. This included:
•$1,617 million issuance of long-term debt comprised of the issuance of Series M-61 MTN debentures with a total principal amount of $400 million, the issuance of Series M-63 MTN debentures with a total principal amount of $1,100 million, the increase of $81 million in outstanding loans under the Bell Mobility uncommitted trade loan agreement and the issuance of other debt of $40 million, partly offset by $4 million of discounts on our debt issuances
•$404 million issuance (net of repayments) of notes payable
Partly offset by:
•$525 million repayment of long-term debt comprised of the repayment of Series 10 Notes with a total principal amount of $225 million and net payments of leases and other debt of $300 million
In the first half of 2024, we issued debt, net of repayments. This included:
•$3,808 million issuance of long-term debt comprised of the issuance of Series US-9 Notes with a total principal amount of $700 million in U.S. dollars ($942 million in Canadian dollars), the issuance of Series US-10 Notes with a total principal amount of $750 million in U.S. dollars ($1,009 million in Canadian dollars), the issuance of Series M-61 MTN debentures with a total principal amount of $400 million, the issuance of Series M-63 MTN debentures with a total principal amount of $1,100 million, the increase of $324 million in outstanding loans under the Bell Mobility uncommitted trade loan agreement and the issuance of other debt of $40 million, partly offset by $7 million of discounts on our debt issuances
•$1,383 million issuance (net of repayments) of notes payable
Partly offset by:
•$2,638 million repayment of long-term debt comprised of the repayment of Series M-44 MTN debentures with a total principal amount of $1,000 million, the repayment of Series US-3 Notes with a total principal amount of $600 million in U.S. dollars ($748 million in Canadian dollars), the repayment of Series 10 Notes with a total principal amount of $225 million and net payments of leases and other debt of $665 million
2023
In the second quarter of 2023, we issued debt, net of repayments. This included:
•$1,199 million issuance of long-term debt comprised of the issuance of Series US-8 Notes with a total principal amount of $850 million in U.S. dollars ($1,138 million in Canadian dollars) and other debt of $62 million, partly offset by $1 million of discounts on our debt issuances
Partly offset by:
•$500 million decrease in securitized receivables
•$346 million repayment of long-term debt comprised of net payments of leases and other debt
•$101 million repayment (net of issuances) of notes payable
In the first half of 2023, we issued debt, net of repayments. This included:
•$2,703 million issuance of long-term debt comprised of the issuance of Series M-58 MTN debentures with a total principal amount of $1,050 million and series M-59 MTN debentures with a total principal amount of $450 million, the issuance of Series US-8 Notes, with a total principal amount of $850 million in U.S. dollars ($1,138 million in Canadian dollars) and the issuance of other debt of $70 million, partly offset by $5 million of discounts on our debt issuances
Partly offset by:
•$645 million repayment of long-term debt comprised of net payments of leases and other debt
•$184 million repayment (net of issuances) of notes payable
Consolidation of MLSE ownership under BCE (repurchase of a financial liability)
In January 2023, BCE repurchased the 9% interest held by the BCE Master Trust Fund (Master Trust Fund), a trust fund that holds pension fund investments serving the pension obligations of the BCE group pension plan participants, in Maple Leaf Sports & Entertainment Ltd. (MLSE) for a cash consideration of $149 million, as a result of BCE’s obligation to repurchase the Master Trust Fund’s interest in MLSE at that price.
Issuance of common shares
The issuance of common shares in the second quarter and on a year-to-date basis in 2024 decreased by $8 million and $18 million, respectively, compared to the same periods in 2023, due to no stock options having been exercised in Q2 2024 and in the first half of 2024.
Repurchase of preferred shares
2024
For the three and six months ended June 30, 2024, BCE repurchased and canceled 2,187,900 and 4,301,488 First Preferred Shares under its normal course issuer bid for a total cost of $38 million and $76 million, respectively.
2023
For the three and six months ended June 30, 2023, BCE repurchased and canceled 1,848,950 and 3,560,950 First Preferred Shares under its normal course issuer bid for a total cost of $32 million and $63 million, respectively.
Cash dividends paid on common shares
In the second quarter of 2024, cash dividends paid on common shares increased by $28 million compared to Q2 2023, due to a higher dividend paid in Q2 2024 of $0.9975 per common share compared to $0.9675 per common share in Q2 2023.
In the first half of 2024, cash dividends paid on common shares increased by $72 million compared to 2023, due to a higher dividend paid in the first half of 2024 of $1.9650 per common share compared to $1.8875 per common share for the same period last year.
4.4 Post-employment benefit plans For the three months ended June 30, 2024, we recorded an increase in our post-employment benefit plans and a gain, before taxes, in OCI of $152 million, due to an increase in the discount rate of 5.0% at June 30, 2024, compared to 4.9% at March 31, 2024, partly offset by a lower-than-expected return on plan assets and an increase in the effect of the asset limit.
For the six months ended June 30, 2024, we recorded an increase in our post-employment benefit plans and a gain, before taxes, in OCI of $581 million, due to an increase in the discount rate of 5.0% at June 30, 2024, compared to 4.6% at December 31, 2023, partly offset by a lower-than-expected return on plan assets and an increase in the effect of the asset limit.
For the three months ended June 30, 2023, we recorded a decrease in our post-employment benefit plans and a loss, before taxes, in OCI of $187 million, due in part to a lower-than-expected return on plan assets, partly offset by a decrease in the effect of the asset limit. The discount rate remained unchanged at 5.0% compared to March 31, 2023.
For the six months ended June 30, 2023, we recorded a decrease in our post-employment benefit plans and a loss, before taxes, in OCI of $361 million, due to a decrease in the discount rate of 5.0% at June 30, 2023, compared to 5.3% at December 31, 2022, partly offset by a higher-than-expected return on plan assets and a decrease in the effect of the asset limit.
4.5 Financial risk management
The following table provides the fair value details of certain financial instruments measured at amortized cost in the consolidated statements of financial position (statements of financial position).
| | | | | | | | | | | | | | | | | | | | |
| | | | June 30, 2024 | December 31, 2023 |
| | | | | | |
| Classification | Fair value methodology | Carrying value | Fair value | Carrying value | Fair value |
| | | | | | |
| | | | | | |
| | | | | | |
Debt securities
and other debt | Debt due within one year and long-term debt | Quoted market price of debt | 31,504 | | 29,828 | | 29,049 | | 28,225 | |
34 BCE Inc. 2024 SECOND QUARTER SHAREHOLDER REPORT
The following table provides the fair value details of financial instruments measured at fair value in the statements of financial position.
| | | | | | | | | | | | | | | | | |
| Classification | Fair value |
| Carrying value of asset (liability) | Quoted prices in active markets for identical assets (level 1) | Observable market data (level 2)(1) | Non-observable market inputs (level 3)(2) |
| June 30, 2024 | | | | | |
Publicly-traded and privately-held investments(3) | Other non-current assets | 599 | | 19 | | — | | 580 | |
| Derivative financial instruments | Other current assets, trade payables and other liabilities, other non-current assets and liabilities | (331) | | — | | (331) | | — | |
| | | | | |
| Other | Trade payables and other liabilities and other non-current assets | 148 | | — | | 220 | | (72) | |
| December 31, 2023 | | | | | |
Publicly-traded and privately-held investments(3) | Other non-current assets | 587 | | 10 | | — | | 577 | |
| Derivative financial instruments | Other current assets, trade payables and other liabilities, other non-current assets and liabilities | (488) | | — | | (488) | | — | |
| | | | | |
| Other | Other non-current assets and liabilities | 147 | | — | | 216 | | (69) | |
(1)Observable market data such as equity prices, interest rates, swap rate curves and foreign currency exchange rates.
(2)Non-observable market inputs such as discounted cash flows and revenue and earnings multiples. For certain privately-held investments and other financial liabilities, changes in our valuation assumptions may result in a significant increase (decrease) in the fair value of our level 3 financial instruments.
(3)Unrealized gains and losses are recorded in Other comprehensive income (loss) in the statements of comprehensive income and are reclassified from Accumulated other comprehensive loss to the Deficit in the statements of financial position when realized.
Market risk
Currency exposures
In 2024, we entered into cross currency interest rate swaps with a notional amount of $700 million in U.S. dollars ($942 million in Canadian dollars) to hedge the U.S. currency exposure of our US-9 Notes maturing in 2034. The fair value of the cross currency interest rate swaps at June 30, 2024 was a net liability of $5 million recognized in Other current assets and Other non-current liabilities in the statements of financial position.
In 2024, we entered into cross currency interest rate swaps with a notional amount of $750 million in U.S. dollars ($1,009 million in Canadian dollars) to hedge the U.S. currency exposure of our US-10 Notes maturing in 2054. In connection with these swaps, cross currency basis rate swaps outstanding at December 31, 2023 with a notional amount of $644 million were settled. The fair value of the cross currency interest rate swaps at June 30, 2024 was a net liability of $7 million recognized in Other current assets, Other non-current assets, and Other non-current liabilities in the statements of financial position.
In 2024, we entered into cross currency interest rate swaps with a notional amount of $240 million in U.S. dollars ($324 million in Canadian dollars) to hedge the U.S. currency exposure of outstanding loans maturing in 2026 under our Bell Mobility uncommitted trade loan agreement. The fair value of the cross currency interest rate swaps at June 30, 2024 was a net asset of $4 million recognized in Other current assets and Other non-current assets in the statements of financial position.
A 10% depreciation (appreciation) in the value of the Canadian dollar relative to the U.S. dollar would result in a gain of $12 million (loss of $44 million) recognized in net earnings at June 30, 2024 and a gain of $130 million (loss of $119 million) recognized in Other comprehensive income (loss) at June 30, 2024, with all other variables held constant.
The following table provides further details on our outstanding foreign currency forward contracts and options at June 30, 2024.
| | | | | | | | | | | | | | | | | | | | |
| Type of hedge | Buy
currency | Amount to receive | Sell
currency | Amount
to pay | Maturity | Hedged item |
Cash flow (1) | USD | 1,174 | | CAD | 1,607 | | 2024 | Loans |
| Cash flow | USD | 1,180 | | CAD | 1,601 | | 2024 | Commercial paper |
| Cash flow | USD | 359 | | CAD | 459 | | 2024 | Anticipated purchases |
| Cash flow | PHP | 1,470 | | CAD | 35 | | 2024 | | Anticipated purchases |
| Cash flow | USD | 608 | | CAD | 793 | | 2025 | | Anticipated purchases |
| Cash flow | PHP | 3,193 | | CAD | 75 | | 2025 | | Anticipated purchases |
| Cash flow | USD | 280 | | CAD | 377 | | 2026 | | Anticipated purchases |
| Economic | USD | 90 | | CAD | 118 | | 2024 | | Anticipated purchases |
| | | | | | |
| Economic - call options | USD | 124 | | CAD | 151 | | 2024 | Anticipated purchases |
| Economic - call options | CAD | 112 | | USD | 78 | | 2024 | Anticipated purchases |
| Economic - put options | USD | 335 | | CAD | 437 | | 2024 | Anticipated purchases |
| Economic | USD | 120 | | CAD | 158 | | 2025 | Anticipated purchases |
| Economic | CAD | 137 | | USD | 100 | | 2025 | Anticipated purchases |
Economic - options (2) | USD | 60 | | CAD | 78 | | 2025 | Anticipated purchases |
| Economic - call options | USD | 270 | | CAD | 345 | | 2025 | Anticipated purchases |
| Economic - put options | USD | 360 | | CAD | 466 | | 2025 | Anticipated purchases |
| Economic | USD | 100 | | CAD | 136 | | 2026 | Anticipated purchases |
| | | | | | |
| | | | | | |
| | | | | | |
| | | | | | |
| | | | | | |
| | | | | | |
(1)Forward contracts to hedge loans secured by receivables under our securitization program.
(2)Foreign currency options with a leverage provision and a profit cap limitation.
Interest rate exposures
In 2024, we entered into forward starting interest rate swaps, effective from 2026, with a notional amount of $336 million to hedge the fair value of our US-10 Notes maturing in 2054. The fair value of the interest rate swaps at June 30, 2024 was an asset of $2 million recognized in Other non-current assets in the statements of financial position.
In 2024, we sold interest rate swaptions, expiring in 2024, with a notional amount of $300 million to hedge economically the fair value of our M-17 MTN debentures maturing in 2035. The fair value of the interest rate swaptions at June 30, 2024 was a liability of $3 million recognized in Trade payables and other liabilities in the statements of financial position.
In 2024, we sold interest rate swaptions, expiring in 2024, with a notional amount of $750 million for $3 million to hedge economically the fair value of our M-53 MTN debentures maturing in 2027. The fair value of the interest rate swaptions at June 30, 2024 was a liability of $3 million recognized in Trade payables and other liabilities in the statements of financial position.
In 2024, we sold interest rate floors, maturing in 2029, with a notional amount of $350 million and purchased interest rate options, expiring in 2026, with a notional amount of $440 million to hedge economically the interest cost of our M-62 MTN debentures maturing in 2029. The fair value of the interest rate floors and interest rate options is a net asset of $5 million recognized in Other current assets, Other non-current assets, Trade payables and other liabilities and Other non-current liabilities in the statements of financial position.
A 1% increase (decrease) in interest rates would result in a loss of $28 million (gain of $8 million) recognized in net earnings for the six months ended June 30, 2024, with all other variables held constant.
Equity price exposures
We use equity forward contracts on BCE’s common shares to hedge economically the cash flow exposure related to the settlement of equity settled share-based compensation plans. The fair value of our equity forward contracts at June 30, 2024 and December 31, 2023 was a net liability of $266 million and $162 million, respectively, recognized in Other current assets, Trade payables and other liabilities and Other non-current liabilities in the statements of financial position. A loss of $23 million and $113 million for the three and six months ended June 30, 2024, respectively, relating to these equity forward contracts is recognized in Other expense in the income statements.
A 5% increase (decrease) in the market price of BCE’s common shares would result in a gain (loss) of $24 million recognized in net earnings at June 30, 2024, with all other variables held constant.
36 BCE Inc. 2024 SECOND QUARTER SHAREHOLDER REPORT
BCE's and Bell Canada's key credit ratings remain unchanged from those described in the 2023 Annual MD&A.
On March 11, 2024 and March 21, 2024, respectively, S&P Global Ratings Canada, a business unit of S&P Global Canada Corp., and Moody’s Canada Inc. revised their outlook on BCE and Bell Canada to negative from stable principally as a result of ongoing debt leverage above their respective thresholds for the current ratings. However, both also affirmed all of BCE’s and Bell Canada’s existing ratings. On March 28, 2024, DBRS Limited confirmed BCE's and Bell Canada’s ratings and stable trend.
This section contains forward-looking statements, including relating to the sources of liquidity we expect to use to meet our 2024 cash requirements. Refer to the section Caution regarding forward-looking statements at the beginning of this MD&A.
Available liquidity
Total available liquidity(1) at June 30, 2024 was $5.0 billion, comprised of $1,398 million in cash, $250 million in cash equivalents, $750 million in short-term investments, $687 million available under our securitized receivables program and $1.9 billion available under our $3.5 billion committed revolving and expansion credit facilities (given $1,592 million of commercial paper outstanding).
Total available liquidity at December 31, 2023 was $5.8 billion, comprised of $547 million in cash, $225 million in cash equivalents, $1,000 million in short-term investments, $700 million available under our securitized receivables program and $3.3 billion available under our $3.5 billion committed revolving and expansion credit facilities (given $197 million of commercial paper outstanding).
In Q2 2024, Bell Canada extended the term of its $2.5 billion committed revolving credit facility from May 2028 to May 2029 and the term of its $1 billion committed expansion credit facility from May 2026 to May 2027.
We expect that our cash, cash equivalents, short-term investments, amounts available under our securitized receivables program, cash flows from operations and possible capital markets financings will permit us to meet our cash requirements in 2024 for capital expenditures, post-employment benefit plans funding, dividend payments, the payment of contractual obligations, maturing debt, ongoing operations and other cash requirements.
Should our 2024 cash requirements exceed our cash, cash equivalents, short-term investments, cash generated from our operations, and funds raised under capital markets financings and our securitized receivables program, we would expect to cover such a shortfall by drawing under committed credit facilities that are currently in place or through new facilities to the extent available.
We continuously monitor our operations, capital markets and the Canadian economy with the objective of maintaining adequate liquidity.
(1)Available liquidity is a non-GAAP financial measure. Refer to section 8.1, Non-GAAP financial measures in this MD&A for more information on this measure.
5 Quarterly financial information
BCE’s Q2 2024 Financial Statements were prepared in accordance with International Financial Reporting Standards (IFRS), as issued by the International Accounting Standards Board (IASB), under International Accounting Standard (IAS) 34, Interim Financial Reporting and were approved by BCE’s board of directors on July 31, 2024. The following table, which was also prepared in accordance with IFRS, shows selected consolidated financial data of BCE for the eight most recent completed quarters.
| | | | | | | | | | | | | | | | | | | | | | | | | | | | | | | | |
| 2024 | 2023 | 2022 |
| Q2 | Q1 | Q4 | Q3 | Q2 | Q1 | Q4 | Q3 | | | | | | |
| Operating revenues | | | | | | | | | | | | | | |
| Service | 5,308 | | 5,192 | | 5,348 | | 5,281 | | 5,303 | | 5,222 | | 5,353 | | 5,193 | | | | | | | |
| Product | 697 | | 819 | | 1,125 | | 799 | | 763 | | 832 | | 1,086 | | 831 | | | | | | | |
| Total operating revenues | 6,005 | | 6,011 | | 6,473 | | 6,080 | | 6,066 | | 6,054 | | 6,439 | | 6,024 | | | | | | | |
| Adjusted EBITDA | 2,697 | | 2,565 | | 2,567 | | 2,667 | | 2,645 | | 2,538 | | 2,437 | | 2,588 | | | | | | | |
| Severance, acquisition and other costs | (22) | | (229) | | (41) | | (10) | | (100) | | (49) | | (19) | | (22) | | | | | | | |
| Depreciation | (945) | | (946) | | (954) | | (937) | | (936) | | (918) | | (922) | | (914) | | | | | | | |
| Amortization | (325) | | (316) | | (299) | | (295) | | (296) | | (283) | | (270) | | (267) | | | | | | | |
| | | | | | | | | | | | | | |
| | | | | | | | | | | | | | |
| Net earnings | 604 | | 457 | | 435 | | 707 | | 397 | | 788 | | 567 | | 771 | | | | | | | |
| Net earnings attributable to common shareholders | 537 | | 402 | | 382 | | 640 | | 329 | | 725 | | 528 | | 715 | | | | | | | |
| | | | | | | | | | | | | | |
| | | | | | | | | | | | | | |
| | | | | | | | | | | | | | |
| EPS - basic and diluted | 0.59 | | 0.44 | | 0.42 | | 0.70 | | 0.37 | | 0.79 | | 0.58 | | 0.78 | | | | | | | |
| | | | | | | | | | | | | | |
| | | | | | | | | | | | | | |
| | | | | | | | | | | | | | |
| | | | | | | | | | | | | | |
| | | | | | | | | | | | | | |
| | | | | | | | | | | | | | |
| | | | | | | | | | | | | | |
| | | | | | | | | | | | | | |
| | | | | | | | | | | | | | |
| | | | | | | | | | | | | | |
| | | | | | | | | | | | | | |
| Weighted average number of common shares outstanding – basic (millions) | 912.3 | | 912.3 | | 912.3 | | 912.3 | | 912.2 | | 912.1 | | 912.0 | | 911.9 | | | | | | | |
| | | | | | | | | | | | | | |
| | | | | | | | | | | | | | |
| | | | | | | | | | | | | | |
| | | | | | | | | | | | | | |
38 BCE Inc. 2024 SECOND QUARTER SHAREHOLDER REPORT
6 Regulatory environment
The following is an update to the regulatory initiatives and proceedings described in the BCE 2023 Annual MD&A under section 3.3, Principal business risks and section 8, Regulatory environment, as updated in the BCE 2024 First Quarter MD&A. Telecommunications Act
Review of wholesale fibre-to-the-node high-speed access service rates
On July 22, 2024, the Federal Court of Appeal issued a decision rejecting TekSavvy Solutions Inc.’s (Teksavvy) appeal of Decision 2021-182 pursuant to which the CRTC had, in May 2021, mostly reinstated wholesale Internet rates prevailing prior to August 2019.
Review of wholesale high-speed access service framework
On March 28, 2024, Bell Canada, jointly with Competitive Network Operators of Canada (CNOC), Cogeco Communications Inc., Bragg Communications Inc. (Eastlink) and Teksavvy, asked the CRTC to change the procedures for final submissions in the TNC 2023‑56 proceeding. The parties proposed that the CRTC call for final submissions on the question of whether Bell Canada, Rogers Communications Canada Inc. (Rogers) and Telus Communications Inc. (Telus) would be eligible to obtain access to aggregated wholesale FTTP. The request asked the CRTC to issue a final ruling on that single issue before aggregated wholesale FTTP access service became available on an interim basis on May 7, 2024. On May 3, 2024, the CRTC issued a letter denying the request for a procedural change and declining to issue a final ruling on that single issue on an expedited basis.
On April 8, 2024, Bell Canada filed a Notice of Appeal to the Federal Court of Appeal of Telecom Decision CRTC 2023-358 issued on November 6, 2023. However, on May 28, 2024, Bell Canada applied for a court order requesting that the appeal be held in abeyance until the CRTC issues its final decision. Bell Canada was supported in that motion by all the other parties participating in the appeal (i.e., Vidéotron Ltd., CNOC, Teksavvy and Telus). As such, on June 5, 2024, the Federal Court of Appeal issued an order holding the appeal in abeyance until the earlier of September 30, 2024 or until the CRTC issues its final decision.
Bill C-69, An Act to implement certain provisions of the budget tabled in Parliament on April 16, 2024
On June 20, 2024, Bill C-69, An Act to implement certain provisions of the budget tabled in Parliament on April 16, 2024 (Bill C-69) received royal assent. Bill C-69 includes amendments to the Telecommunications Act directing the CRTC to implement certain specific measures related to the arrangements between telecommunications providers and their customers, including prohibiting charging certain extra fees to switch carriers or modify service arrangements. The amendments require the CRTC to specify the type of fees to which the amendments will apply and the rules around how the amendments will be implemented. On July 23, 2024, the CRTC issued three sets of requests for information (RFIs) to certain Canadian telecommunications providers on their current practices related to the subject matter of the amendments. Responses to the RFIs are due August 23, 2024. The timing and outcome of any further CRTC process regarding these amendments to the Telecommunications Act are currently unknown. At this time, it is unclear what impact, if any, these legislative changes could have on our business and financial results.
Broadcasting Act
Broadcast Notice of Consultation CRTC 2023-138
On May 12, 2023, the CRTC issued Broadcasting Notice of Consultation CRTC 2023-138, The Path Forward – Working towards a modernized regulatory framework regarding the contributions to support Canadian and Indigenous content. This Notice represents the first of three steps to develop an updated regulatory framework for broadcasting undertakings, including online undertakings. A key part of this new framework is to establish the conditions under which online services would be required to make financial contributions, including initial base contributions, to support the creation and discoverability of Canadian and Indigenous content. It will also determine who the recipients of the initial base contributions will be. The CRTC held a three-week hearing beginning on November 20, 2023 to focus on these issues. On June 4, 2024, the CRTC released its decision, requiring foreign streamers to contribute 5% of their Canadian broadcasting revenue as of September 2024 to certain funds set out by the CRTC. However, Canadian streamers affiliated with a licensed broadcaster (for example, Bell Media’s linear Crave service available through cable companies) have been exempted from this requirement until the CRTC reviews the existing regulatory obligations of traditional media properties. Foreign streamers, specifically Amazon.com.ca ULC, Apple Canada Inc., the Motion Picture Association-Canada (which represents Netflix Studios, LLC, Paramount Pictures Corporation, Sony Pictures Entertainment Inc., Universal City Studios LLC, Walt Disney Studios Motion Pictures, and Warner Bros. Entertainment Inc.) and Spotify AB, have each sought leave to appeal and/or judicial review of the CRTC’s decision. Each company has challenged various different aspects of the decision, including, in some cases, the reasonableness of the CRTC exempting Canadian streamers affiliated with licensed broadcasters but not exempting foreign
streamers. While the CRTC has not yet initiated its public consultations for Steps 2 and 3, these subsequent proceedings will focus on the overall framework for both traditional and online undertakings, with a focus on how to support the creation of Canadian and Indigenous content beyond financial contribution requirements, as well as diversity, inclusion and discoverability issues. In Step 3, the CRTC intends to finalize each undertaking’s or ownership group’s contribution requirements, presumably as part of our group licence renewal. The timing and outcome of all of these proceedings is unknown. Therefore, the impact that these regulatory changes could have on our business and financial results is unclear at this time.
Other
Bill C-18, the Online News Act
On June 22, 2023, Bill C-18, An Act respecting online communications platforms that make news content available to persons in Canada (the Online News Act), received royal assent. The Online News Act requires digital news intermediaries, such as Google and Meta (until the latter elected to block all news links and thus is no longer subject to the Online News Act), that share news content produced by other news outlets to negotiate commercial arrangements with those news outlets, compensating them for the news content shared on digital platforms. The legislation entitles Bell Media’s general news services, such as CTV and Noovo, to compensation. Further details regarding the compensation framework have been set out in regulations that were released on December 15, 2023 (the Regulations). These Regulations clarify that the Online News Act applies to search engines and social media sites that provide access to news content in Canada, provided these platforms earn at least $1 billion in annual global revenue and reach at least 20 million Canadians on a monthly basis. However, the Regulations also allow Google to apply to be exempt from parts of the Online News Act if it commits to pay $100 million annually (growing each year by inflation) to a new organization to be set up to collect this amount from Google and then distribute it to all eligible news outlets. On June 7, 2024, Google submitted an application for exemption to the CRTC. On June 27, 2024, the CRTC launched a proceeding to review Google’s application for exemption under Online News Notice of Consultation CRTC 2024-143, with the record of the proceeding scheduled to close by mid-August 2024. Of the $100 million to be paid by Google if it becomes exempt, under the Regulations news outlets that are also private broadcasters, such as CTV and Noovo, cannot receive more than 30% of the overall compensation available (with other news outlets, such as those associated with newspapers and public broadcasters, receiving the rest). Given the above, the amount of compensation that Bell Media may receive from Google is unclear, as is the timing of such compensation. The full impact that the legislative changes could have on our business and financial results is unknown at this time. Finally, the CRTC must still establish its processes to administer the Online News Act. In this regard, on March 13, 2024, the CRTC issued Online News Notice of Consultation CRTC 2024-55 seeking public comments on its proposed mandatory bargaining process which would apply between news outlets and digital news intermediaries that are captured by the Online News Act if a digital news intermediary has not received an exemption from the CRTC as a result of reaching an agreement with news outlets. The period to submit comments ended on April 12, 2024 and we are awaiting a decision from the CRTC.
40 BCE Inc. 2024 SECOND QUARTER SHAREHOLDER REPORT
7 Accounting policies
BCE’s Q2 2024 Financial Statements were prepared in accordance with IFRS, as issued by the IASB, under IAS 34 - Interim Financial Reporting and were approved by BCE’s board of directors on July 31, 2024. These financial statements were prepared using the same basis of presentation, accounting policies and methods of computation as outlined in Note 2, Material accounting policies in BCE’s consolidated financial statements for the year ended December 31, 2023. BCE's Q2 2024 Financial Statements do not include all of the notes required in the annual financial statements.
Future changes to accounting standards
The following accounting standard and amendments to accounting standards issued by the IASB have not yet been adopted by BCE.
| | | | | | | | | | | |
| Standard | Description | Impact | Effective date |
| | | |
| | | |
| IFRS 18 – Presentation and Disclosure in Financial Statements | Sets out requirements and guidance on presentation and disclosure in financial statements, including: •presentation in the income statements of income and expenses within defined categories - operating, investing, financing, income taxes and discontinued operations •presentation in the income statements of new defined subtotals - operating profit and profit before financing and income taxes •disclosure of explanations of management-defined performance measures that are related to the income statements •enhanced guidance on aggregation and disaggregation of information and whether to provide information in the financial statements or in the notes •disclosure of specified expenses by nature IFRS 18 replaces IAS 1 - Presentation of Financial Statements but carries forward many of the requirements from IAS 1 unchanged. | We are currently assessing the impact of this standard. | Annual reporting periods beginning on or after January 1, 2027. Early application is permitted. |
| Amendments to the Classification and Measurement of Financial Instruments – Amendments to IFRS 9 and IFRS 7 | In particular, the amendments clarify: •the classification of financial assets with ESG and similar features •the derecognition date for financial liabilities and introduce an accounting policy option for financial liabilities settled using an electronic payment system if certain conditions are met The amendments also require additional disclosures for financial instruments with contractual terms that reference a contingent event and equity instruments classified at fair value through other comprehensive income. | We are currently assessing the impact of these amendments. | Annual reporting periods beginning on or after January 1, 2026. Early application is permitted. |
8 Non-GAAP financial measures, other financial measures and key performance indicators (KPIs)
BCE uses various financial measures to assess its business performance. Certain of these measures are calculated in accordance with International Financial Reporting Standards (IFRS or GAAP) while certain other measures do not have a standardized meaning under GAAP. We believe that our GAAP financial measures, read together with adjusted non-GAAP and other financial measures, provide readers with a better understanding of how management assesses BCE’s performance.
National Instrument 52-112, Non-GAAP and Other Financial Measures Disclosure (NI 52-112), prescribes disclosure requirements that apply to the following specified financial measures:
•Non-GAAP financial measures;
•Non-GAAP ratios;
•Total of segments measures;
•Capital management measures; and
•Supplementary financial measures.
This section provides a description and classification of the specified financial measures contemplated by NI 52-112 that we use to explain our financial results except that, for supplementary financial measures, an explanation of such measures is provided where they are first referred to if the supplementary financial measures’ labelling is not sufficiently descriptive.
8.1 Non-GAAP financial measures A non-GAAP financial measure is a financial measure used to depict our historical or expected future financial performance, financial position or cash flow and, with respect to its composition, either excludes an amount that is included in, or includes an amount that is excluded from, the composition of the most directly comparable financial measure disclosed in BCE’s consolidated primary financial statements. We believe that non-GAAP financial measures are reflective of our on-going operating results and provide readers with an understanding of management’s perspective on and analysis of our performance.
Below are descriptions of the non-GAAP financial measures that we use to explain our results as well as reconciliations to the most directly comparable IFRS financial measures.
The term adjusted net earnings does not have any standardized meaning under IFRS. Therefore, it is unlikely to be comparable to similar measures presented by other issuers.
We define adjusted net earnings as net earnings attributable to common shareholders before severance, acquisition and other costs, net mark-to-market losses (gains) on derivatives used to economically hedge equity settled share-based compensation plans, net equity losses (gains) on investments in associates and joint ventures, net losses (gains) on investments, early debt redemption costs, impairment of assets and discontinued operations, net of tax and NCI.
We use adjusted net earnings and we believe that certain investors and analysts use this measure, among other ones, to assess the performance of our businesses without the effects of severance, acquisition and other costs, net mark-to-market losses (gains) on derivatives used to economically hedge equity settled share-based compensation plans, net equity losses (gains) on investments in associates and joint ventures, net losses (gains) on investments, early debt redemption costs, impairment of assets and discontinued operations, net of tax and NCI. We exclude these items because they affect the comparability of our financial results and could potentially distort the analysis of trends in business performance. Excluding these items does not imply they are non-recurring.
The most directly comparable IFRS financial measure is net earnings attributable to common shareholders.
42 BCE Inc. 2024 SECOND QUARTER SHAREHOLDER REPORT
The following table is a reconciliation of net earnings attributable to common shareholders to adjusted net earnings on a consolidated basis.
| | | | | | | | | | | | | | |
| Q2 2024 | Q2 2023 | YTD 2024 | YTD 2023 |
| Net earnings attributable to common shareholders | 537 | | 329 | | 939 | | 1,054 | |
| Reconciling items: | | | | |
| Severance, acquisition and other costs | 22 | | 100 | | 251 | | 149 | |
Net mark-to-market losses (gains) on derivatives used to economically
hedge equity settled share-based compensation plans | 23 | | (1) | | 113 | | (19) | |
| Net equity losses on investments in associates and joint ventures | 93 | | 377 | | 93 | | 377 | |
| Net losses (gains) on investments | 2 | | (79) | | 8 | | (79) | |
| Early debt redemption costs | — | | 1 | | — | | 1 | |
| Impairment of assets | 60 | | — | | 73 | | 34 | |
| Income taxes for the above reconciling items | (25) | | (5) | | (110) | | (23) | |
| NCI for the above reconciling items | — | | — | | (1) | | — | |
| | | | |
| Adjusted net earnings | 712 | | 722 | | 1,366 | | 1,494 | |
Available liquidity
The term available liquidity does not have any standardized meaning under IFRS. Therefore, it is unlikely to be comparable to similar measures presented by other issuers.
We define available liquidity as cash, cash equivalents, short-term investments and amounts available under our securitized receivables program and our committed bank credit facilities, excluding credit facilities that are available exclusively for a pre-determined purpose.
We consider available liquidity to be an important indicator of the financial strength and performance of our businesses because it shows the funds available to meet our cash requirements, including for, but not limited to, capital expenditures, post-employment benefit plans funding, dividend payments, the payment of contractual obligations, maturing debt, on going operations, the acquisition of spectrum, and other cash requirements. We believe that certain investors and analysts use available liquidity to evaluate the financial strength and performance of our businesses. The most directly comparable IFRS financial measure is cash.
The following table is a reconciliation of cash to available liquidity on a consolidated basis.
| | | | | | | | |
| June 30, 2024 | December 31, 2023 |
| Cash | 1,398 | | 547 | |
| Cash equivalents | 250 | | 225 | |
| Short-term investments | 750 | | 1,000 | |
Amounts available under our securitized receivables program(1) | 687 | | 700 | |
Amounts available under our committed bank credit facilities(2) | 1,908 | | 3,303 | |
| Available liquidity | 4,993 | | 5,775 | |
(1)At June 30, 2024 and December 31, 2023, respectively, $687 million and $700 million were available under our securitized receivables program, under which we borrowed $1,168 million in U.S. dollars ($1,599 million in Canadian dollars) and $1,200 million in U.S. dollars ($1,588 million in Canadian dollars) as at June 30, 2024 and December 31, 2023, respectively. Loans secured by receivables are included in Debt due within one year in our consolidated financial statements.
(2)At June 30, 2024 and December 31, 2023, respectively, $1,908 million and $3,303 million were available under our committed bank credit facilities, given outstanding commercial paper of $1,163 million in U.S. dollars ($1,592 million in Canadian dollars) and $149 million in U.S. dollars ($197 million in Canadian dollars) as at June 30, 2024 and December 31, 2023, respectively. Commercial paper outstanding is included in Debt due within one year in our consolidated financial statements.
Free cash flow and excess free cash flow
The terms free cash flow and excess free cash flow do not have any standardized meaning under IFRS. Therefore, they are unlikely to be comparable to similar measures presented by other issuers.
We define free cash flow as cash flows from operating activities, excluding cash from discontinued operations, acquisition and other costs paid (which include significant litigation costs) and voluntary pension funding, less capital expenditures, preferred share dividends and dividends paid by subsidiaries to NCI. We exclude cash from discontinued operations, acquisition and other costs paid and voluntary pension funding because they affect the comparability of our financial results and could potentially distort the analysis of trends in business performance. Excluding these items does not imply they are non-recurring.
We define excess free cash flow as free cash flow less dividends paid on common shares.
We consider free cash flow and excess free cash flow to be important indicators of the financial strength and performance of our businesses. Free cash flow shows how much cash is available to pay dividends on common shares, repay debt and reinvest in our company. Excess free cash flow shows how much cash is available to repay debt and reinvest in our company, after the payment of dividends on common shares. We believe that certain investors and analysts use free cash flow and excess free cash flow to value a business and its underlying assets and to evaluate the financial strength and performance of our businesses. The most directly comparable IFRS financial measure is cash flows from operating activities.
The following table is a reconciliation of cash flows from operating activities to free cash flow and excess free cash flow on a consolidated basis.
| | | | | | | | | | | | | | |
| Q2 2024 | Q2 2023 | YTD 2024 | YTD 2023 |
| Cash flows from operating activities | 2,137 | | 2,365 | | 3,269 | | 3,612 | |
| Capital expenditures | (978) | | (1,307) | | (1,980) | | (2,393) | |
| Cash dividends paid on preferred shares | (45) | | (46) | | (91) | | (101) | |
| Cash dividends paid by subsidiaries to NCI | (28) | | (1) | | (42) | | (22) | |
| Acquisition and other costs paid | 11 | 5 | | 26 | 5 | |
| | | | |
| Free cash flow | 1,097 | | 1,016 | | 1,182 | | 1,101 | |
| Dividends paid on common shares | (910) | | (882) | | (1,793) | | (1,721) | |
| Excess free cash flow | 187 | | 134 | | (611) | | (620) | |
The term net debt does not have any standardized meaning under IFRS. Therefore, it is unlikely to be comparable to similar measures presented by other issuers.
We define net debt as debt due within one year plus long-term debt and 50% of preferred shares, less cash, cash equivalents and short-term investments, as shown in BCE’s consolidated statements of financial position. We include 50% of outstanding preferred shares in our net debt as it is consistent with the treatment by certain credit rating agencies.
We consider net debt to be an important indicator of the company’s financial leverage because it represents the amount of debt that is not covered by available cash, cash equivalents and short-term investments. We believe that certain investors and analysts use net debt to determine a company’s financial leverage.
Net debt is calculated using several asset and liability categories from the statements of financial position. The most directly comparable IFRS financial measure is long-term debt. The following table is a reconciliation of long-term debt to net debt on a consolidated basis.
| | | | | | | | |
| June 30, 2024 | December 31, 2023 |
| Long-term debt | 32,918 | | 31,135 | |
| Debt due within one year | 6,587 | | 5,042 | |
| 50% of preferred shares | 1,780 | | 1,834 | |
| Cash | (1,398) | | (547) | |
| Cash equivalents | (250) | | (225) | |
| Short-term investments | (750) | | (1,000) | |
| Net debt | 38,887 | | 36,239 | |
44 BCE Inc. 2024 SECOND QUARTER SHAREHOLDER REPORT
A non-GAAP ratio is a financial measure disclosed in the form of a ratio, fraction, percentage or similar representation and that has a non-GAAP financial measure as one or more of its components.
The term adjusted EPS does not have any standardized meaning under IFRS. Therefore, it is unlikely to be comparable to similar measures presented by other issuers.
We define adjusted EPS as adjusted net earnings per BCE common share. Adjusted net earnings is a non-GAAP financial measure. For further details on adjusted net earnings, see section 8.1, Non-GAAP financial measures.
We use adjusted EPS, and we believe that certain investors and analysts use this measure, among other ones, to assess the performance of our businesses without the effects of severance, acquisition and other costs, net mark-to-market losses (gains) on derivatives used to economically hedge equity settled share-based compensation plans, net equity losses (gains) on investments in associates and joint ventures, net losses (gains) on investments, early debt redemption costs, impairment of assets and discontinued operations, net of tax and NCI. We exclude these items because they affect the comparability of our financial results and could potentially distort the analysis of trends in business performance. Excluding these items does not imply they are non-recurring.
Dividend payout ratio
The term dividend payout ratio does not have any standardized meaning under IFRS. Therefore, it is unlikely to be comparable to similar measures presented by other issuers.
We define dividend payout ratio as dividends paid on common shares divided by free cash flow. Free cash flow is a non-GAAP financial measure. For further details on free cash flow, see section 8.1, Non-GAAP financial measures.
We consider dividend payout ratio to be an important indicator of the financial strength and performance of our businesses because it shows the sustainability of the company’s dividend payments.
8.3 Total of segments measures A total of segments measure is a financial measure that is a subtotal or total of 2 or more reportable segments and is disclosed within the Notes to BCE’s consolidated primary financial statements.
Adjusted EBITDA
We define adjusted EBITDA as operating revenues less operating costs as shown in BCE’s consolidated income statements.
The most directly comparable IFRS financial measure is net earnings. The following tables provide a reconciliation of net earnings to adjusted EBITDA on a consolidated basis.
| | | | | | | | | | | | | |
| | | YTD 2024 | Q2 2024 | Q1 2024 |
| Net earnings | | | 1,061 | | 604 | | 457 | |
| Severance, acquisition and other costs | | | | 251 | | | 22 | | 229 | |
| Depreciation | | | | 1,891 | | | 945 | | 946 | |
| Amortization | | | | 641 | | | 325 | | 316 | |
| Finance costs | | | | | |
| Interest expense | | | | 842 | | | 426 | | 416 | |
| Net return on post-employment benefit plans | | | | (33) | | | (17) | | (16) | |
| Impairment of assets | | | | 73 | | | 60 | | 13 | |
| Other expense | | | | 139 | | | 101 | | 38 | |
| Income taxes | | | 397 | | 231 | | 166 | |
| | | | | |
| | | | | |
| | | | | |
| Adjusted EBITDA | | | 5,262 | | 2,697 | | 2,565 | |
| | | | | | | | | | | | | | | | | |
| Q4 2023 | Q3 2023 | YTD 2023 | Q2 2023 | Q1 2023 |
| Net earnings | 435 | | 707 | | 1,185 | | 397 | | 788 | |
| Severance, acquisition and other costs | | 41 | | | 10 | | | 149 | | | 100 | | 49 | |
| Depreciation | 954 | | 937 | | | 1,854 | | | 936 | | 918 | |
| Amortization | 299 | | 295 | | | 579 | | | 296 | | 283 | |
| Finance costs | | | | | |
| Interest expense | 399 | | 373 | | | 703 | | | 359 | | 344 | |
| Net return on post-employment benefit plans | (27) | | (27) | | | (54) | | | (27) | | (27) | |
| Impairment of assets | 109 | | — | | | 34 | | | — | | 34 | |
| Other expense (income) | 147 | | 129 | | | 190 | | | 311 | | (121) | |
| Income taxes | 210 | | 243 | | 543 | | 273 | | 270 | |
| | | | | |
| | | | | |
| | | | | |
| Adjusted EBITDA | 2,567 | | 2,667 | | 5,183 | | 2,645 | | 2,538 | |
| | | | | | | | | | |
| | Q4 2022 | Q3 2022 | |
| Net earnings | | 567 | | 771 | | |
| Severance, acquisition and other costs | | 19 | | 22 | | |
| Depreciation | | 922 | | 914 | | |
| Amortization | | 270 | | 267 | | |
| Finance costs | | | | |
| Interest expense | | 319 | | 298 | | |
| Net return on post-employment benefit plans | | (13) | | (13) | | |
| Impairment of assets | | 150 | | 21 | | |
| Other (income) expense | | (19) | | 130 | | |
| Income taxes | | 222 | | 178 | | |
| | | | |
| | | | |
| | | | |
| Adjusted EBITDA | | 2,437 | | 2,588 | | |
46 BCE Inc. 2024 SECOND QUARTER SHAREHOLDER REPORT
8.4 Capital management measures A capital management measure is a financial measure that is intended to enable a reader to evaluate our objectives, policies and processes for managing our capital and is disclosed within the Notes to BCE’s consolidated financial statements.
The financial reporting framework used to prepare the financial statements requires disclosure that helps readers assess the company’s capital management objectives, policies, and processes, as set out in IFRS in IAS 1 – Presentation of Financial Statements. BCE has its own methods for managing capital and liquidity, and IFRS does not prescribe any particular calculation method.
Net debt leverage ratio
The net debt leverage ratio represents net debt divided by adjusted EBITDA. Net debt used in the calculation of the net debt leverage ratio is a non-GAAP financial measure. For further details on net debt, see section 8.1, Non-GAAP financial measures. For the purposes of calculating our net debt leverage ratio, adjusted EBITDA is twelve-month trailing adjusted EBITDA.
We use, and believe that certain investors and analysts use, the net debt leverage ratio as a measure of financial leverage.
8.5 Supplementary financial measures A supplementary financial measure is a financial measure that is not reported in BCE’s consolidated financial statements, and is, or is intended to be, reported periodically to represent historical or expected future financial performance, financial position, or cash flows.
An explanation of such measures is provided where they are first referred to in this MD&A if the supplementary financial measures’ labelling is not sufficiently descriptive.
In addition to the non-GAAP financial measures and other financial measures described previously, we use the following KPIs to measure the success of our strategic imperatives. These KPIs are not accounting measures and may not be comparable to similar measures presented by other issuers.
| | | | | |
| KPI | Definition |
| Adjusted EBITDA margin | Adjusted EBITDA margin is defined as adjusted EBITDA divided by operating revenues. |
| ARPU | ARPU is defined as Bell CTS wireless external services revenues divided by the average mobile phone subscriber base for the specified period, expressed as a dollar unit per month. |
| Capital intensity | Capital intensity is defined as capital expenditures divided by operating revenues. |
| Churn | Mobile phone churn is the rate at which existing mobile phone subscribers cancel their services. It is a measure of our ability to retain our customers. Mobile phone churn is calculated by dividing the number of mobile phone deactivations during a given period by the average number of mobile phone subscribers in the base for the specified period and is expressed as a percentage per month. |
Subscriber unit(1) | Mobile phone subscriber unit is comprised of a recurring revenue generating portable unit (e.g. smartphones and feature phones) on an active service plan, that has access to our wireless networks and includes voice, text and/or data connectivity. We report mobile phone subscriber units in two categories: postpaid and prepaid. Prepaid mobile phone subscriber units are considered active for a period of 90 days following the expiry of the subscriber’s prepaid balance.
Mobile connected device subscriber unit is comprised of a recurring revenue generating portable unit (e.g. tablets, wearables, mobile Internet devices and IoT) on an active service plan, that has access to our wireless networks and is intended for limited or no cellular voice capability.
Wireline subscriber unit consists of an active revenue-generating unit with access to our services, including retail Internet, IPTV, and/or residential NAS. A subscriber is included in our subscriber base when the service has been installed and is operational at the customer premise and a billing relationship has been established.
• Retail Internet and IPTV subscribers have access to stand-alone services, and are primarily represented by a dwelling unit or a business location
• Retail residential NAS subscribers are based on a line count and are represented by a unique telephone number |
(1)As of Q1 2024, we are no longer reporting retail satellite TV subscribers as this no longer represents a significant proportion of our revenues. As a result, satellite TV subscribers have been removed from our retail TV subscriber base, and we now report exclusively retail IPTV subscribers.
9 Controls and procedures
Changes in internal control over financial reporting No changes were made in our internal control over financial reporting during the quarter ended June 30, 2024 that have materially affected, or are reasonably likely to materially affect, our internal control over financial reporting.
48 BCE Inc. 2024 SECOND QUARTER SHAREHOLDER REPORT