
Christopher J. McComish Chief Executive Officer Mark Kochvar Chief Financial Officer Second Quarter 2022
Forward Looking Statements and Risk Factors This information contains or incorporates statements that we believe are “forward-looking statements” within the meaning of the Private Securities Litigation Reform Act of 1995. Forward-looking statements generally relate to our financial condition, results of operations, plans, objectives, outlook for earnings, revenues, expenses, capital and liquidity levels and ratios, asset levels, asset quality, financial position and other matters regarding or affecting S&T and its future business and operations. Forward-looking statements are typically identified by words or phrases such as “will likely result,” “expect,” “anticipate,” “estimate,” “forecast,” “project,” “intend,” “believe,” “assume,” “strategy,” “trend,” “plan,” “outlook,” “outcome,” “continue,” “remain,” “potential,” “opportunity,” “comfortable,” “current,” “position,” “maintain,” “sustain,” “seek,” “achieve,” and variations of such words and similar expressions, or future or conditional verbs such as will, would, should, could or may. Although we believe the assumptions upon which these forward-looking statements are based are reasonable, any of these assumptions could prove to be inaccurate and the forward-looking statements based on these assumptions could be incorrect. The matters discussed in these forward-looking statements are subject to various risks, uncertainties and other factors that could cause actual results and trends to differ materially from those made, projected, or implied in or by the forward-looking statements depending on a variety of uncertainties or other factors including, but not limited to: credit losses and the credit risk of our commercial and consumer loan products; changes in the level of charge-offs and changes in estimates of the adequacy of the allowance for credit losses; cyber-security concerns; rapid technological developments and changes; operational risks or risk management failures by us or critical third parties, including fraud risk; our ability to manage our reputational risks; sensitivity to the interest rate environment including a prolonged period of low interest rates, a rapid increase in interest rates or a change in the shape of the yield curve; a change in spreads on interest- earning assets and interest-bearing liabilities; the transition from LIBOR as a reference rate; regulatory supervision and oversight, including changes in regulatory capital requirements and our ability to address those requirements; unanticipated changes in our liquidity position; changes in accounting policies, practices or guidance; legislation affecting the financial services industry as a whole, and S&T, in particular; the outcome of pending and future litigation and governmental proceedings; increasing price and product/service competition; the ability to continue to introduce competitive new products and services on a timely, cost-effective basis; managing our internal growth and acquisitions; the possibility that the anticipated benefits from acquisitions, cannot be fully realized in a timely manner or at all, or that integrating the acquired operations will be more difficult, disruptive or costly than anticipated; containing costs and expenses; reliance on significant customer relationships; an interruption or cessation of an important service by a third-party provider; our ability to attract and retain talented executives and employees; our ability to successfully manage our CEO transition; general economic or business conditions, including the strength of regional economic conditions in our market area; the duration and severity of the coronavirus (“COVID-19”) pandemic, both in our principal area of operations and nationally, including the ultimate impact of the pandemic on the economy generally and on our operations; our participation in the Paycheck Protection Program; deterioration of the housing market and reduced demand for mortgages; deterioration in the overall macroeconomic conditions or the state of the banking industry that could warrant further analysis of the carrying value of goodwill and could result in an adjustment to its carrying value resulting in a non-cash charge to net income; the stability of our core deposit base and access to contingency funding; re-emergence of turbulence in significant portions of the global financial and real estate markets that could impact our performance, both directly, by affecting our revenues and the value of our assets and liabilities, and indirectly, by affecting the economy generally and access to capital in the amounts, at the times and on the terms required to support our future businesses. Many of these factors, as well as other factors, are described in our Annual Report on Form 10-K for the year ended December 31, 2021, including Part I, Item 1A-"Risk Factors" and any of our subsequent filings with the SEC. Forward-looking statements are based on beliefs and assumptions using information available at the time the statements are made. We caution you not to unduly rely on forward-looking statements because the assumptions, beliefs, expectations and projections about future events may, and often do, differ materially from actual results. Any forward-looking statement speaks only as to the date on which it is made, and we undertake no obligation to update any forward-looking statement to reflect developments occurring after the statement is made. Non-GAAP Financial Measures In addition to the results of operations presented in accordance with Generally Accepted Accounting Principles (GAAP), S&T management uses and this presentation contains or references certain non-GAAP financial measures, such as net interest income on a fully taxable equivalent basis. S&T believes these financial measures provide information useful to investors in understanding our operational performance and business and performance trends which facilitate comparisons with the performance of others in the financial services industry. Although S&T believes that these non-GAAP financial measures enhance investors’ understanding of S&T’s business and performance, these non-GAAP financial measures should not be considered an alternative to GAAP. The non-GAAP financial measures contained within this presentation should be read in conjunction with the audited financial statements and analysis as presented in the Annual Report on Form 10-K as well as the unaudited financial statements and analyses as presented in the respective Quarterly Reports in Exhibit 99.1 of Form 8-K for S&T Bancorp, Inc. and subsidiaries. 2

Corporate Profile 3 $9.1 billion in assets $7.6 billion in deposits $7.0 billion in loans $1.1 billion market cap Stock symbol: STBA 120th anniversary Serving over 230,000 customers in Pennsylvania, Ohio, and New York Market comprises 9.6 million people and 215,000 businesses 1,200 team members providing award- winning customer satisfaction Akron Columbus Philadelphia Harrisburg Pittsburgh Indiana

Award-Winning Customer Satisfaction 4 J.D. Power Award S&T Bank ranked #1 in overall customer satisfaction in the Pennsylvania region, in the 2022 U.S. Retail Banking Satisfaction Study by J.D. Power. We ranked #1 in the following areas: account offerings, convenience banking, people, and trust. For J.D. Power 2022 award information, visit jdpower.com/awards. Forbes Best-In-State Banks S&T Bank was awarded on the Forbes list of Best-In-State Banks 2022. Consumers assessed banks regarding overall satisfaction, trust, terms & conditions, branch services, digital services, customer service, and financial advice.

iHeartMedia Partnership 5 S&T Bank announced a partnership with iHeartMedia to become the first and exclusive regional presenting sponsor of the NFL Podcast Network, including all Pittsburgh NFL podcasts • Podcasts are one of the fastest growing communication channels in the country • iHeartRadio is the #1 podcast publisher • Our ads will be served consistently on hundreds of podcasts to targeted audiences across our footprint
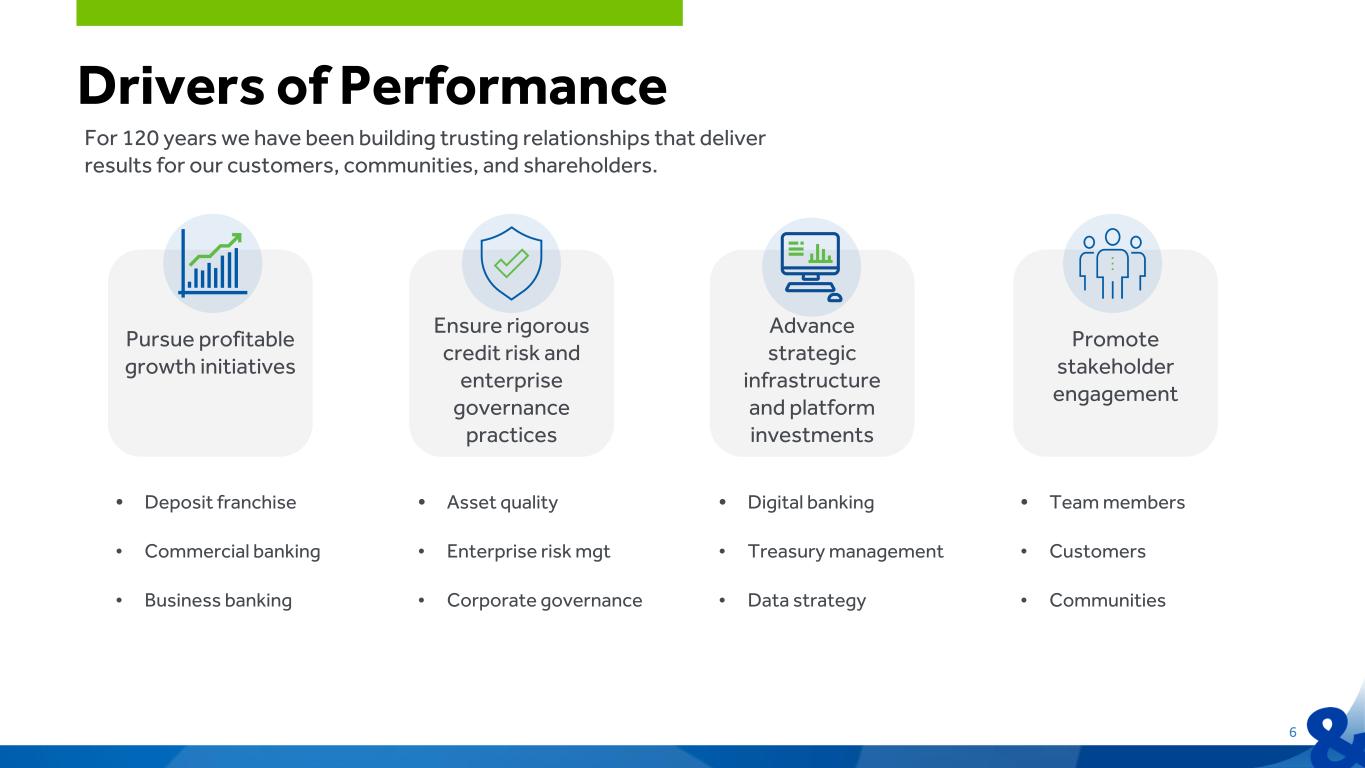
Promote stakeholder engagement Advance strategic infrastructure and platform investments Ensure rigorous credit risk and enterprise governance practices Pursue profitable growth initiatives Drivers of Performance 6 For 120 years we have been building trusting relationships that deliver results for our customers, communities, and shareholders. • Asset quality • Enterprise risk mgt • Corporate governance • Digital banking • Treasury management • Data strategy • Team members • Customers • Communities • Deposit franchise • Commercial banking • Business banking
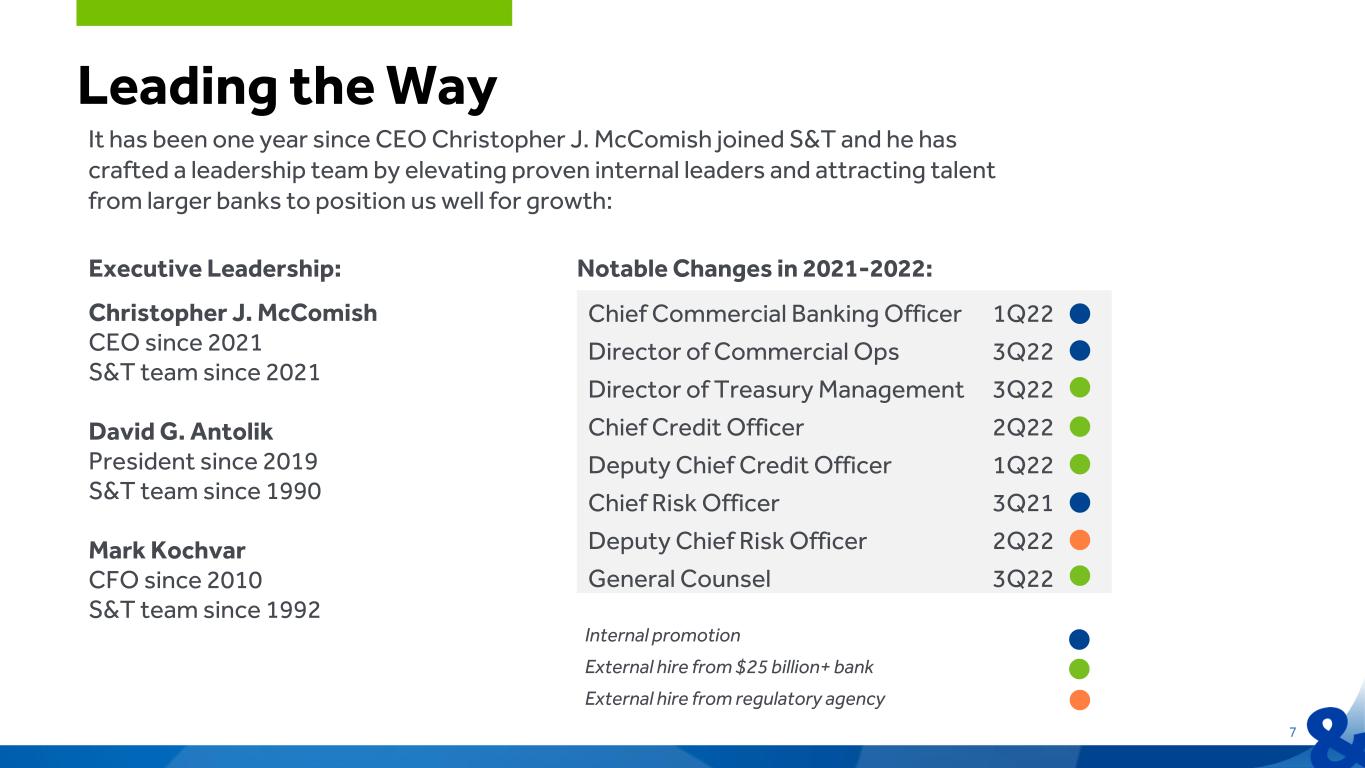
Maintain stakeholder engagement Leading the Way 7 It has been one year since CEO Christopher J. McComish joined S&T and he has crafted a leadership team by elevating proven internal leaders and attracting talent from larger banks to position us well for growth: • Team members • Customers • Market/communities Chief Commercial Banking Officer 1Q22 Director of Commercial Ops 3Q22 Director of Treasury Management 3Q22 Chief Credit Officer 2Q22 Deputy Chief Credit Officer 1Q22 Chief Risk Officer 3Q21 Deputy Chief Risk Officer 2Q22 General Counsel 3Q22 Internal promotion External hire from $25 billion+ bank External hire from regulatory agency Christopher J. McComish CEO since 2021 S&T team since 2021 David G. Antolik President since 2019 S&T team since 1990 Mark Kochvar CFO since 2010 S&T team since 1992 Notable Changes in 2021-2022:Executive Leadership:

8 Second Quarter Overview RETURNS EARNINGS *Refer to appendix for reconciliation of non-GAAP financial measures EPS $0.74 Net Income $28.9 million ROA 1.25% ROE 9.83% ROTE* 14.63% PPNR* 1.71% HIGHLIGHTS • Higher PPNR driven by a $7.5 million, or 11%, increase in net interest income • Net interest margin expansion of 40 bps to 3.56%* • NPAs declined $20.7 million, or 34.8% • Strong consumer loan growth of $111.7 million, or 27.5% annualized • S&T Bank celebrates 120 year anniversary • S&T Bank named by Forbes as Best-In- State on the heels of J.D. Power Award
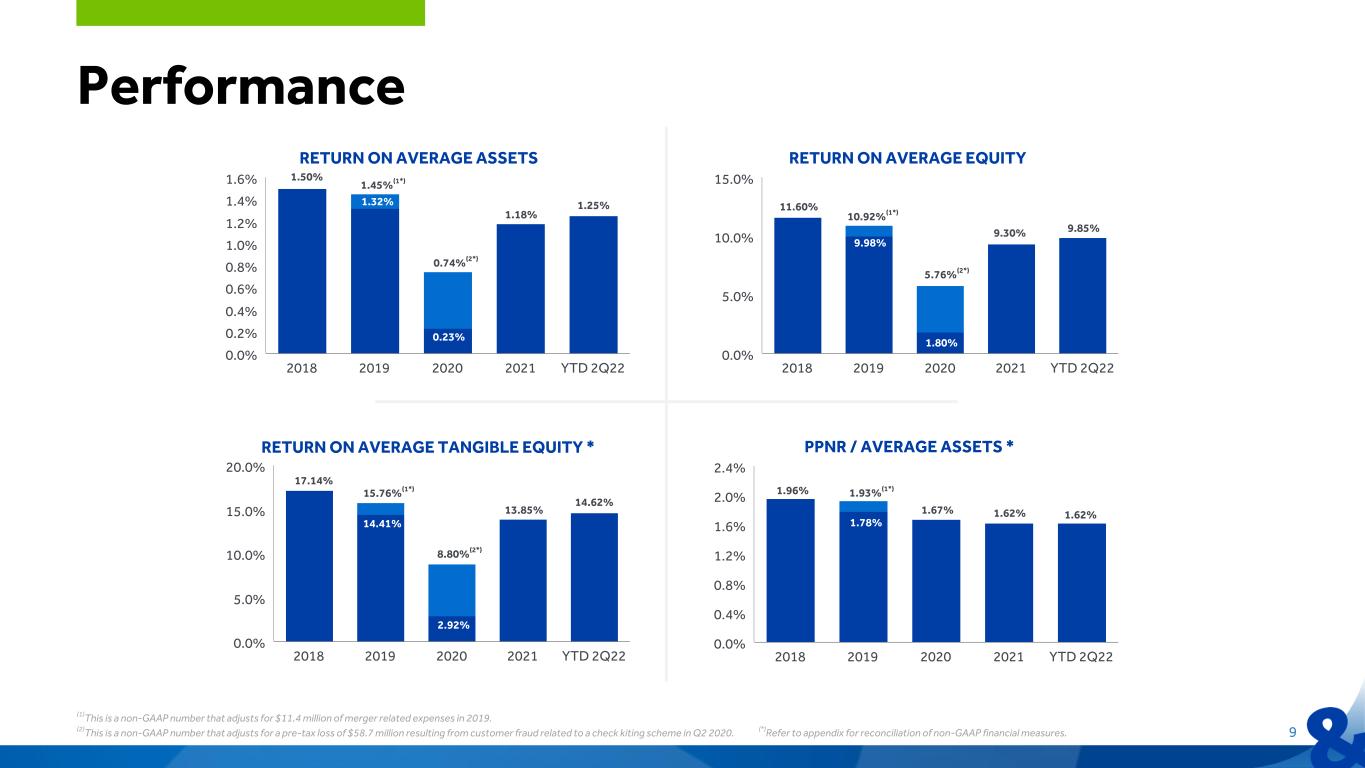
PPNR / AVERAGE ASSETS * 2018 2019 2020 2021 YTD 2Q22 0.0% 0.4% 0.8% 1.2% 1.6% 2.0% 2.4% RETURN ON AVERAGE TANGIBLE EQUITY * 2018 2019 2020 2021 YTD 2Q22 0.0% 5.0% 10.0% 15.0% 20.0% RETURN ON AVERAGE EQUITY 2018 2019 2020 2021 YTD 2Q22 0.0% 5.0% 10.0% 15.0% RETURN ON AVERAGE ASSETS 2018 2019 2020 2021 YTD 2Q22 0.0% 0.2% 0.4% 0.6% 0.8% 1.0% 1.2% 1.4% 1.6% Performance 9 1.50% 1.32% 1.45%(1*) 0.74%(2*) 0.23% 1.25% 11.60% 10.92%(1*) 5.76%(2*) 1.80% 9.85% 9.98% 1.93%(1*) 1.62% 1.96% 1.62% 1.78% 15.76%(1*) 17.14% 2.92% 8.80%(2*) 14.62% 14.41% (1)This is a non-GAAP number that adjusts for $11.4 million of merger related expenses in 2019. (2)This is a non-GAAP number that adjusts for a pre-tax loss of $58.7 million resulting from customer fraud related to a check kiting scheme in Q2 2020. (*)Refer to appendix for reconciliation of non-GAAP financial measures. 1.18% 9.30% 13.85% 1.67%
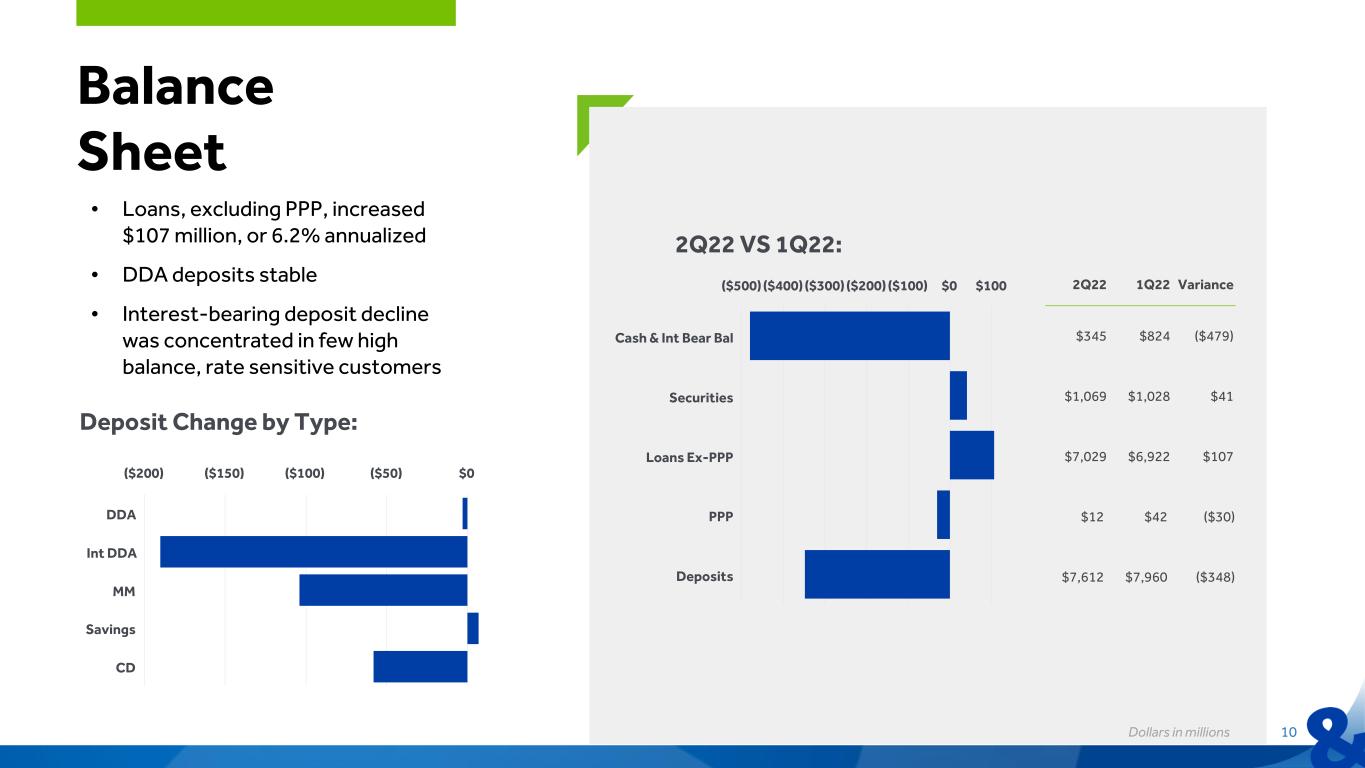
2Q22 VS 1Q22: Balance Sheet • Loans, excluding PPP, increased $107 million, or 6.2% annualized • DDA deposits stable • Interest-bearing deposit decline was concentrated in few high balance, rate sensitive customers Dollars in millions 10 2Q22 1Q22 Variance $345 $824 ($479) $1,069 $1,028 $41 $7,029 $6,922 $107 $12 $42 ($30) $7,612 $7,960 ($348) Cash & Int Bear Bal Securities Loans Ex-PPP PPP Deposits ($500) ($400) ($300) ($200) ($100) $0 $100 DDA Int DDA MM Savings CD ($200) ($150) ($100) ($50) $0 Deposit Change by Type:
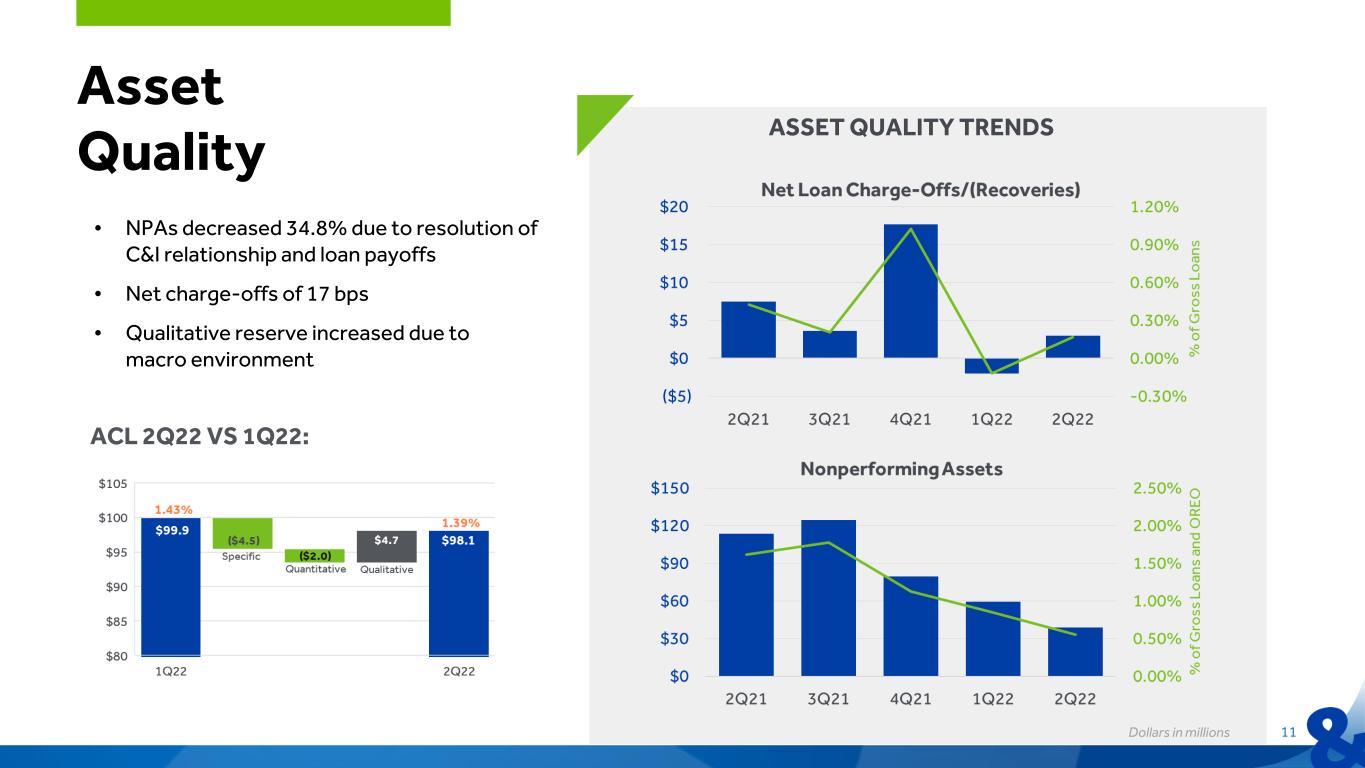
Asset Quality ACL 2Q22 VS 1Q22: Dollars in millions 11 ASSET QUALITY TRENDS • NPAs decreased 34.8% due to resolution of C&I relationship and loan payoffs • Net charge-offs of 17 bps • Qualitative reserve increased due to macro environment

• Net interest income increased $7.5 million, or 11%, due to higher rates • NIM expanded 40 bps to 3.56% • We are well-positioned to benefit from rising rates Net Interest Income Dollars in millions; *Refer to appendix for reconciliation of non-GAAP financial measures 12 Loan Rate Sensitivity Mix 52% 22% 26% Floating Adjustable Fixed
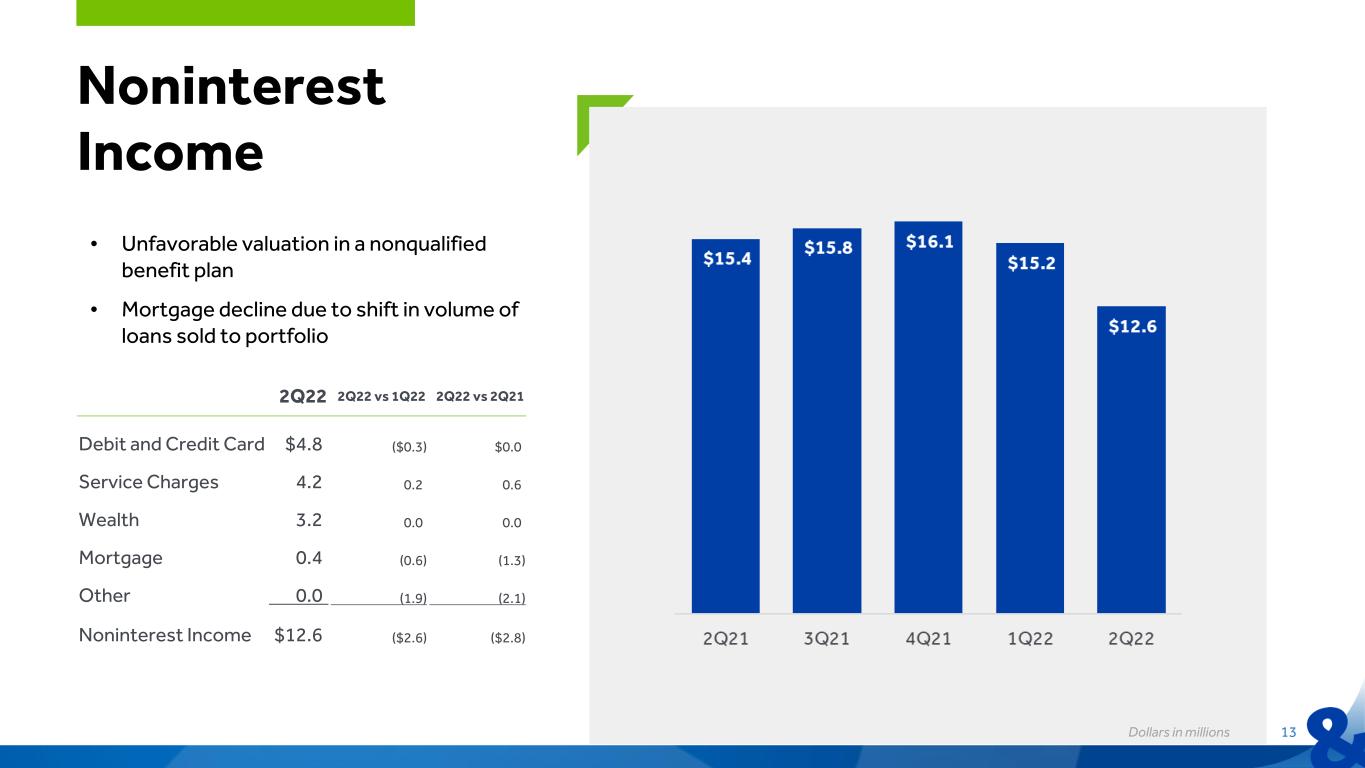
2Q22 2Q22 vs 1Q22 2Q22 vs 2Q21 Debit and Credit Card $4.8 ($0.3) $0.0 Service Charges 4.2 0.2 0.6 Wealth 3.2 0.0 0.0 Mortgage 0.4 (0.6) (1.3) Other 0.0 (1.9) (2.1) Noninterest Income $12.6 ($2.6) ($2.8) Noninterest Income 13Dollars in millions • Unfavorable valuation in a nonqualified benefit plan • Mortgage decline due to shift in volume of loans sold to portfolio
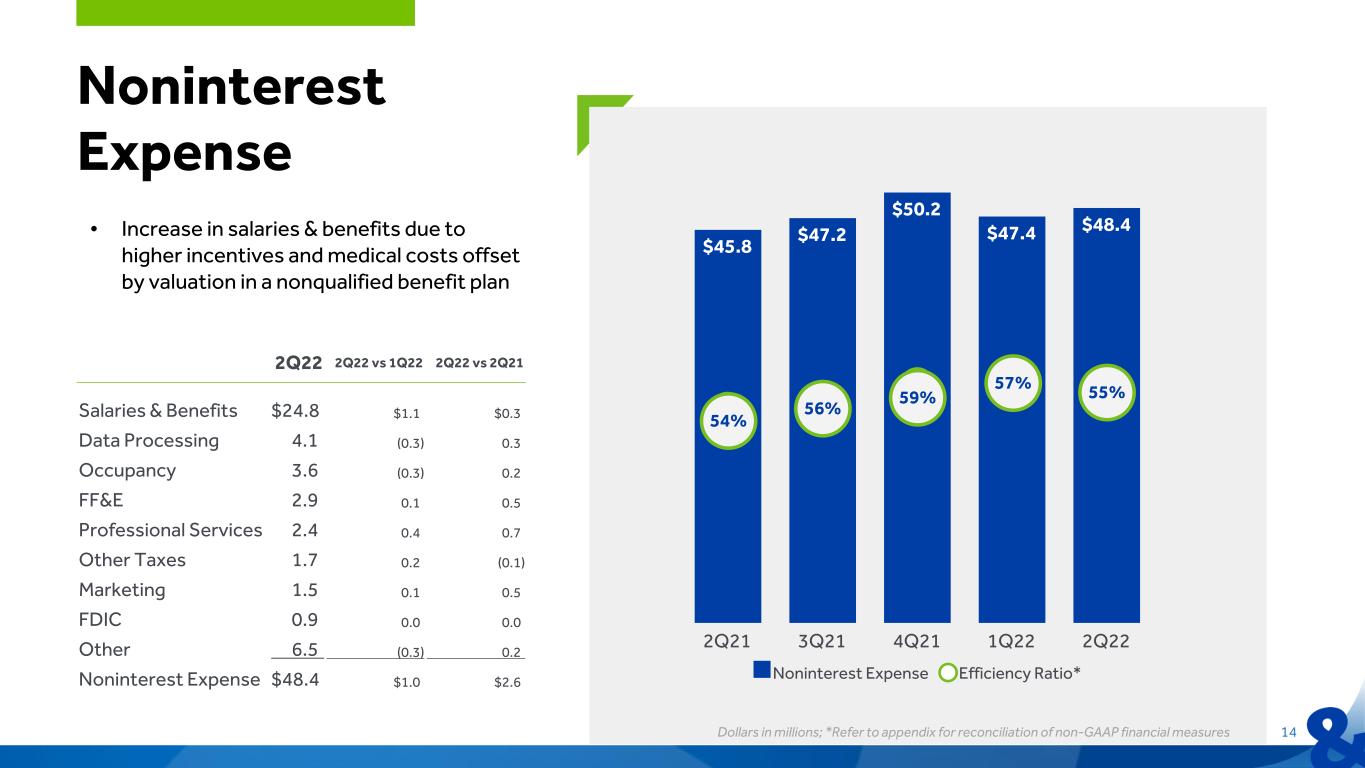
2Q22 2Q22 vs 1Q22 2Q22 vs 2Q21 Salaries & Benefits $24.8 $1.1 $0.3 Data Processing 4.1 (0.3) 0.3 Occupancy 3.6 (0.3) 0.2 FF&E 2.9 0.1 0.5 Professional Services 2.4 0.4 0.7 Other Taxes 1.7 0.2 (0.1) Marketing 1.5 0.1 0.5 FDIC 0.9 0.0 0.0 Other 6.5 (0.3) 0.2 Noninterest Expense $48.4 $1.0 $2.6 • Increase in salaries & benefits due to higher incentives and medical costs offset by valuation in a nonqualified benefit plan Noninterest Expense Dollars in millions; *Refer to appendix for reconciliation of non-GAAP financial measures 14 $45.8 $47.2 $50.2 $47.4 $48.4 Noninterest Expense Efficiency Ratio* 2Q21 3Q21 4Q21 1Q22 2Q22 54% 56% 59% 57% 55%
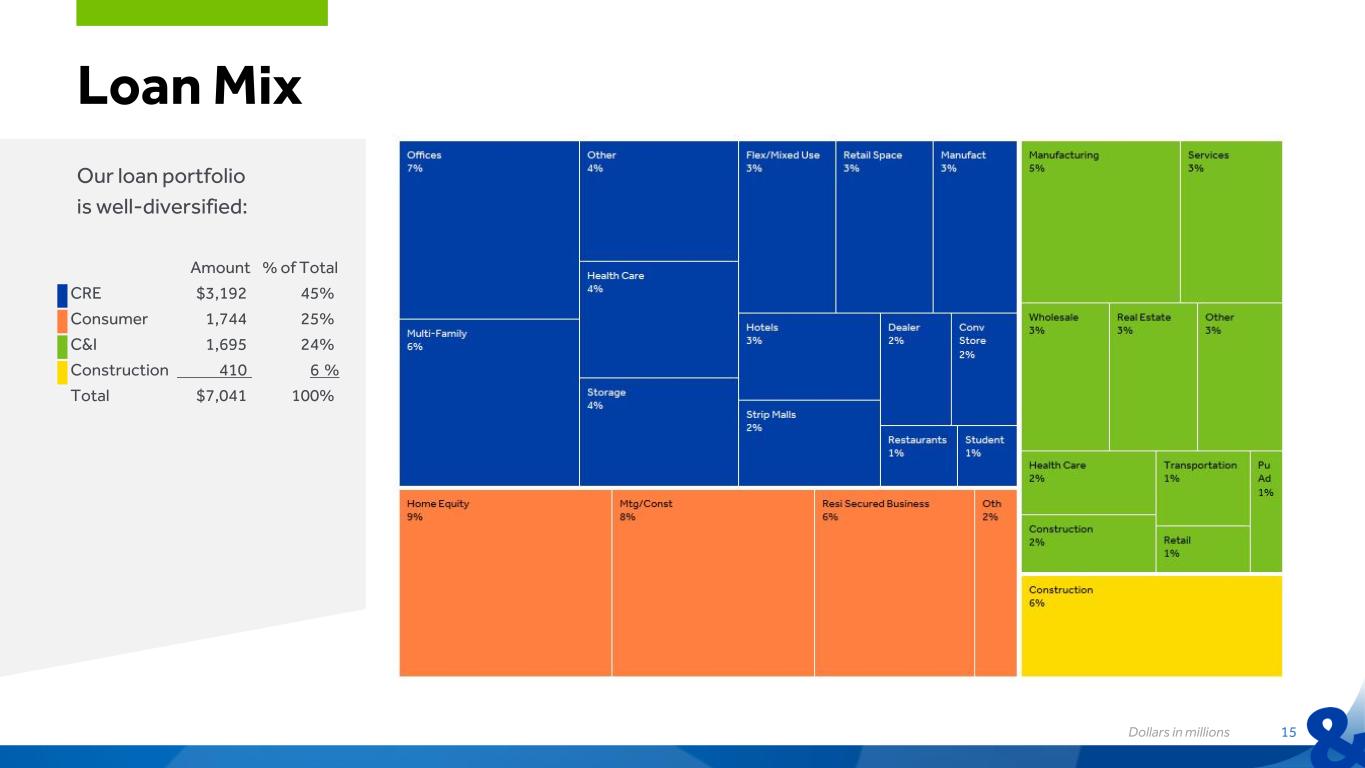
Loan Mix Our loan portfolio is well-diversified: Dollars in millions 15 Amount % of Total CRE $3,192 45% Consumer 1,744 25% C&I 1,695 24% Construction 410 6 % Total $7,041 100%

Deposit Mix We have a solid core deposit profile: Dollars in millions 16 Amount % of Total DDA $2,737 36% MM 1,889 25% Savings 1,125 15% CDs 981 12% Int Bear DDA 880 12% Total $7,612 100% Amount % of Total Personal $4,291 56% Business 3,321 44% Total $7,612 100%

Capital Dollars in millions; *Refer to appendix for reconciliation of non-GAAP financial measures 17 TOTAL CAPITAL • We have strong capital levels and are well-positioned for growth • $4.1 million of buybacks executed in 2Q22

Financial Data (1)These are non-GAAP numbers that adjusted for a pre-tax loss of $58.7 million resulting from customer fraud related to a check kiting scheme in Q2 2020. Refer to appendix for reconciliation of non-GAAP financial measures. (2)These are non-GAAP numbers that adjust for $11.4 million of merger related expenses in 2019. Refer to appendix for reconciliation of these non-GAAP financial measures (3) Upon adoption of CECL on January 1, 2020, the provision for credit losses includes provision for unfunded loan commitments. Income Statement YTD 2Q22 2021 2020 2020 2019 2019 2018 Dollars in thousands, except for share data Excludes Fraud (1) Excludes Merger Exp (2) Net Interest Income $142,927 $276,112 $279,388 $246,791 $234,438 Noninterest Income 27,856 64,610 59,719 52,558 49,181 Total Revenue 170,783 340,722 339,107 299,349 283,619 Noninterest Expense 95,838 188,839 184,302 155,766 145,445 Merger Expenses — — 2,342 11,350 — — Provision for Credit Losses(3) 2,692 16,215 131,424 72,753 14,873 14,873 14,995 Net Income Before Taxes 72,253 135,668 21,039 79,710 117,360 128,710 123,179 Taxes 14,252 25,325 (1) 12,320 19,126 21,232 17,845 Net Income $58,001 $110,343 $21,040 $67,390 $98,234 $107,478 $105,334 Diluted Earnings per Share $1.48 $2.81 $0.53 $1.72 $2.82 $3.09 $3.01 18
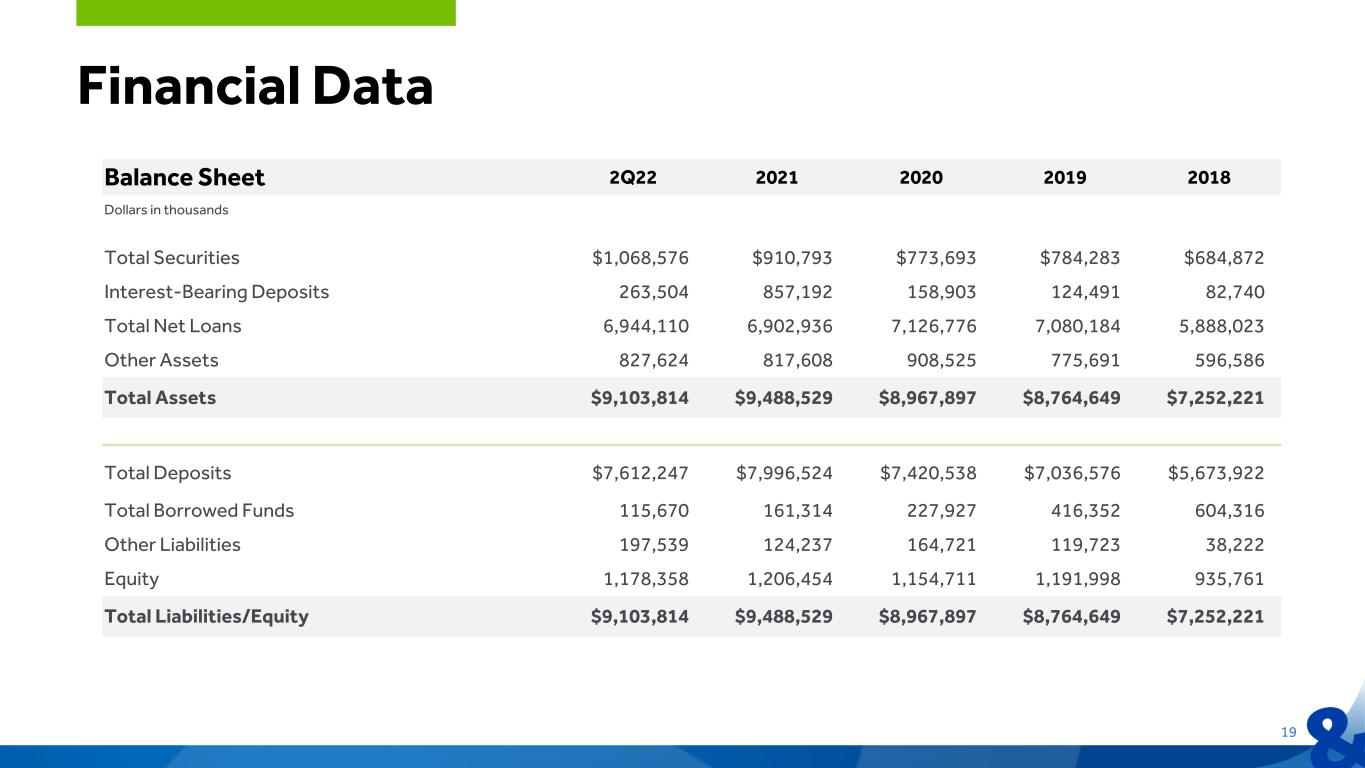
Financial Data 19 Balance Sheet 2Q22 2021 2020 2019 2018 Dollars in thousands Total Securities $1,068,576 $910,793 $773,693 $784,283 $684,872 Interest-Bearing Deposits 263,504 857,192 158,903 124,491 82,740 Total Net Loans 6,944,110 6,902,936 7,126,776 7,080,184 5,888,023 Other Assets 827,624 817,608 908,525 775,691 596,586 Total Assets $9,103,814 $9,488,529 $8,967,897 $8,764,649 $7,252,221 Total Deposits $7,612,247 $7,996,524 $7,420,538 $7,036,576 $5,673,922 Total Borrowed Funds 115,670 161,314 227,927 416,352 604,316 Other Liabilities 197,539 124,237 164,721 119,723 38,222 Equity 1,178,358 1,206,454 1,154,711 1,191,998 935,761 Total Liabilities/Equity $9,103,814 $9,488,529 $8,967,897 $8,764,649 $7,252,221
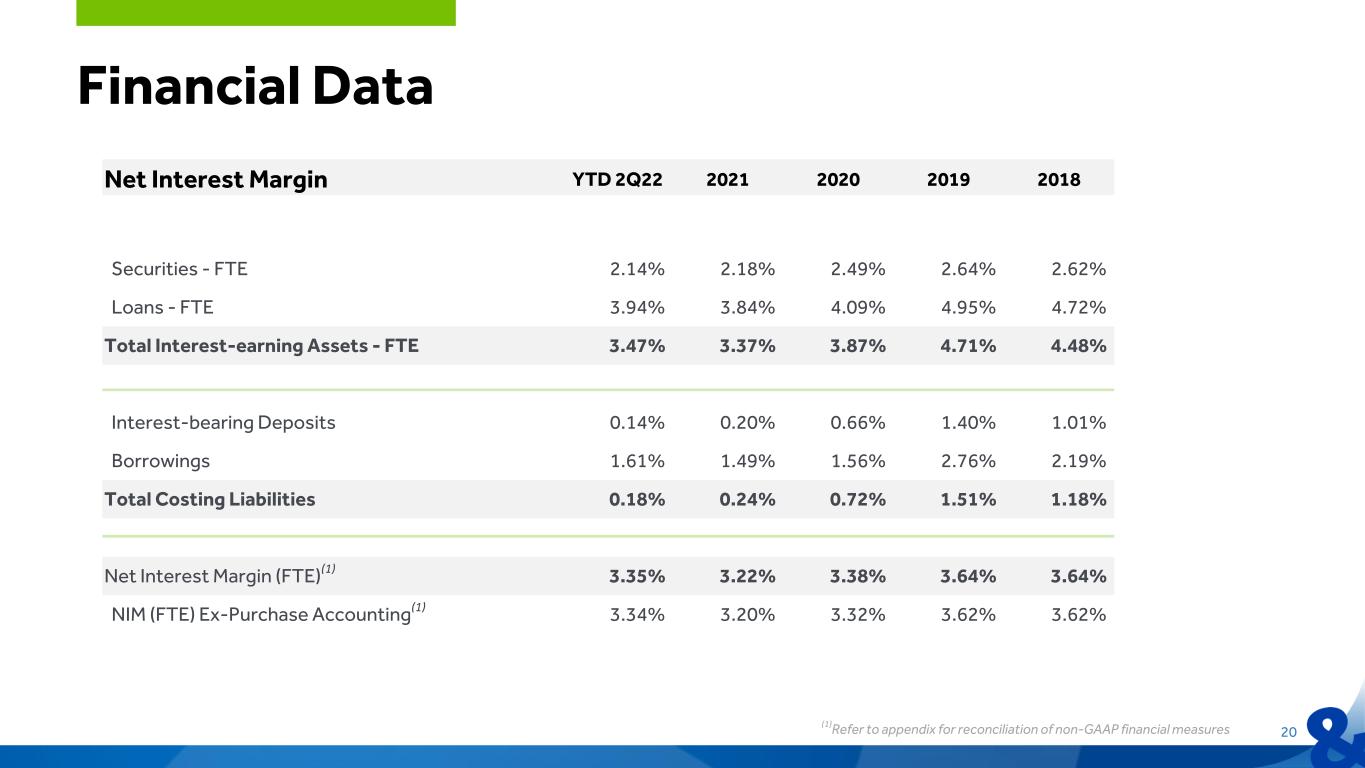
Net Interest Margin YTD 2Q22 2021 2020 2019 2018 Securities - FTE 2.14% 2.18% 2.49% 2.64% 2.62% Loans - FTE 3.94% 3.84% 4.09% 4.95% 4.72% Total Interest-earning Assets - FTE 3.47% 3.37% 3.87% 4.71% 4.48% Interest-bearing Deposits 0.14% 0.20% 0.66% 1.40% 1.01% Borrowings 1.61% 1.49% 1.56% 2.76% 2.19% Total Costing Liabilities 0.18% 0.24% 0.72% 1.51% 1.18% Net Interest Margin (FTE)(1) 3.35% 3.22% 3.38% 3.64% 3.64% NIM (FTE) Ex-Purchase Accounting(1) 3.34% 3.20% 3.32% 3.62% 3.62% Financial Data (1)Refer to appendix for reconciliation of non-GAAP financial measures 20
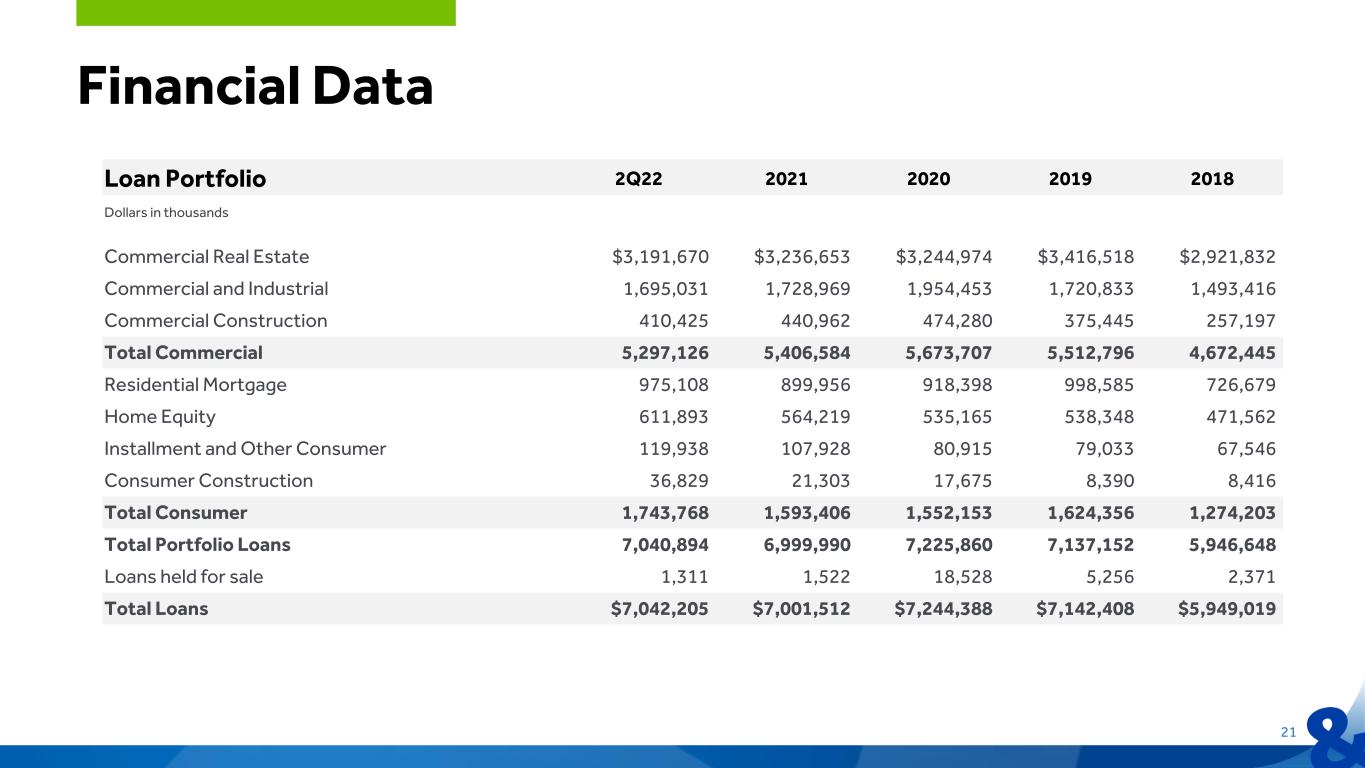
Financial Data 21 Loan Portfolio 2Q22 2021 2020 2019 2018 Dollars in thousands Commercial Real Estate $3,191,670 $3,236,653 $3,244,974 $3,416,518 $2,921,832 Commercial and Industrial 1,695,031 1,728,969 1,954,453 1,720,833 1,493,416 Commercial Construction 410,425 440,962 474,280 375,445 257,197 Total Commercial 5,297,126 5,406,584 5,673,707 5,512,796 4,672,445 Residential Mortgage 975,108 899,956 918,398 998,585 726,679 Home Equity 611,893 564,219 535,165 538,348 471,562 Installment and Other Consumer 119,938 107,928 80,915 79,033 67,546 Consumer Construction 36,829 21,303 17,675 8,390 8,416 Total Consumer 1,743,768 1,593,406 1,552,153 1,624,356 1,274,203 Total Portfolio Loans 7,040,894 6,999,990 7,225,860 7,137,152 5,946,648 Loans held for sale 1,311 1,522 18,528 5,256 2,371 Total Loans $7,042,205 $7,001,512 $7,244,388 $7,142,408 $5,949,019

Financial Data 22 Asset Quality 2Q22 2021 2020 2019 2018 Dollars in thousands Total Nonperforming Loans $31,775 $66,291 $146,774 $54,057 $46,073 Nonperforming Loans/Total Loans 0.45% 0.95% 2.03% 0.76% 0.77% Nonperforming Assets/Total Loans + OREO 0.55% 1.13% 2.06% 0.81% 0.83% YTD Net Charge-offs / Average Loans 0.17% 0.49% 1.40% 0.22% 0.18% Allowance for Credit Losses/Total Portfolio Loans 1.39% 1.41% 1.63% 0.87% 1.03% Allowance for Credit Losses/Nonperforming Loans 309% 149% 80% 115% 132%
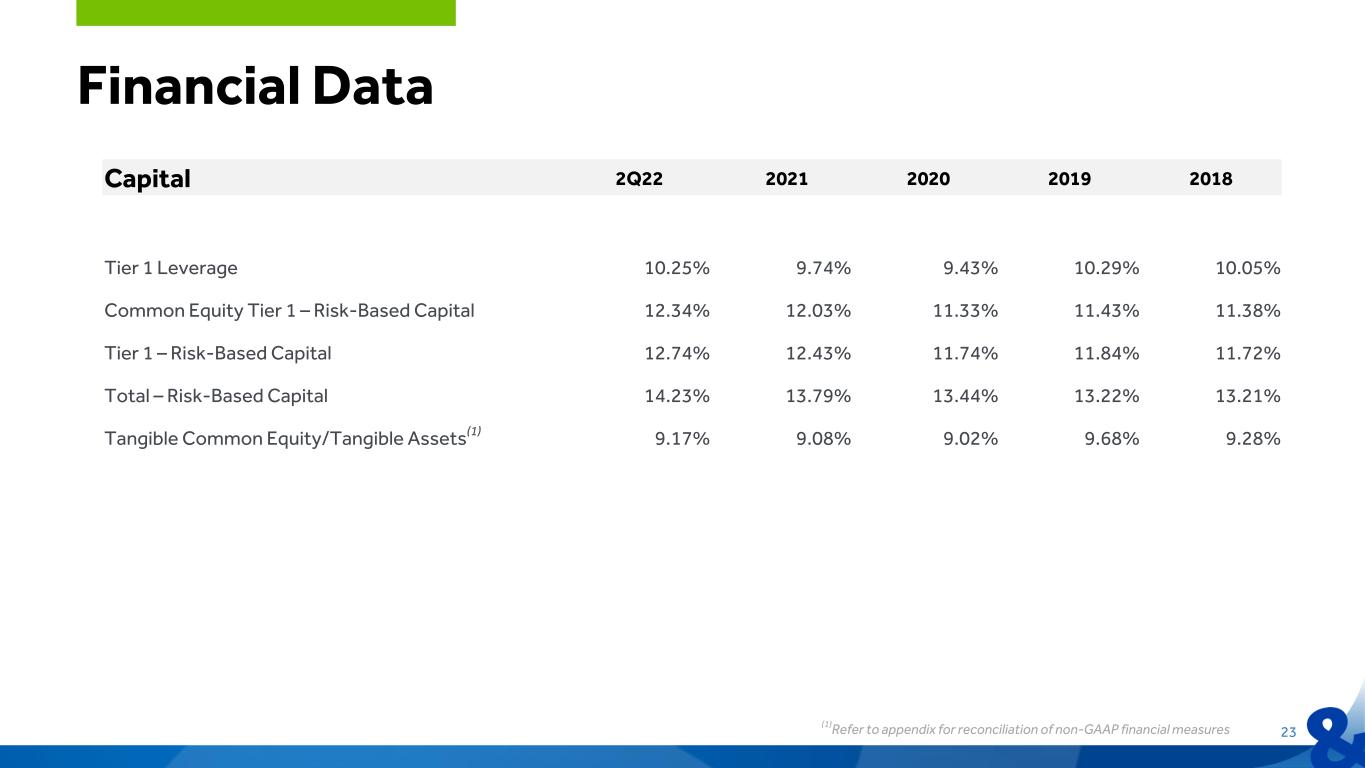
Financial Data 23 Capital 2Q22 2021 2020 2019 2018 Tier 1 Leverage 10.25% 9.74% 9.43% 10.29% 10.05% Common Equity Tier 1 – Risk-Based Capital 12.34% 12.03% 11.33% 11.43% 11.38% Tier 1 – Risk-Based Capital 12.74% 12.43% 11.74% 11.84% 11.72% Total – Risk-Based Capital 14.23% 13.79% 13.44% 13.22% 13.21% Tangible Common Equity/Tangible Assets(1) 9.17% 9.08% 9.02% 9.68% 9.28% (1)Refer to appendix for reconciliation of non-GAAP financial measures
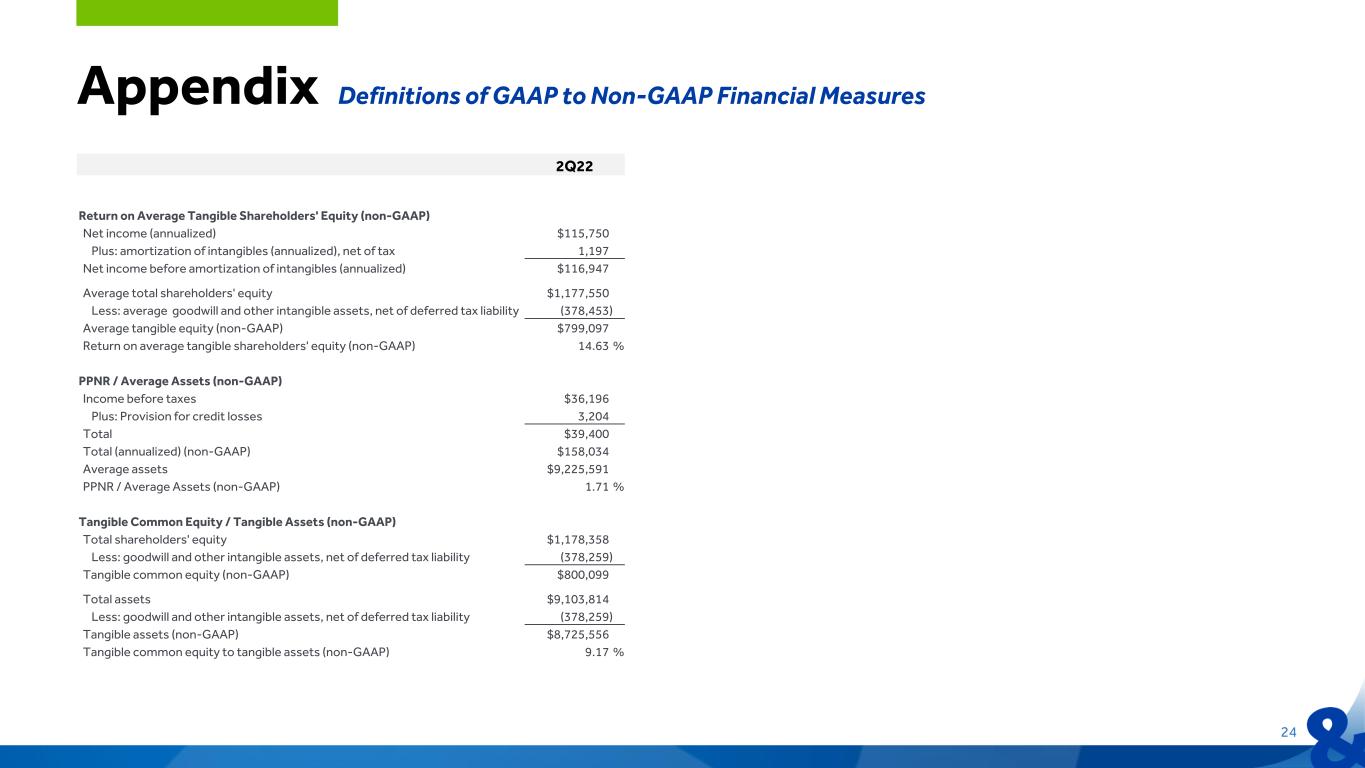
2Q22 Return on Average Tangible Shareholders' Equity (non-GAAP) Net income (annualized) $115,750 Plus: amortization of intangibles (annualized), net of tax 1,197 Net income before amortization of intangibles (annualized) $116,947 Average total shareholders' equity $1,177,550 Less: average goodwill and other intangible assets, net of deferred tax liability (378,453) Average tangible equity (non-GAAP) $799,097 Return on average tangible shareholders' equity (non-GAAP) 14.63 % PPNR / Average Assets (non-GAAP) Income before taxes $36,196 Plus: Provision for credit losses 3,204 Total $39,400 Total (annualized) (non-GAAP) $158,034 Average assets $9,225,591 PPNR / Average Assets (non-GAAP) 1.71 % Tangible Common Equity / Tangible Assets (non-GAAP) Total shareholders' equity $1,178,358 Less: goodwill and other intangible assets, net of deferred tax liability (378,259) Tangible common equity (non-GAAP) $800,099 Total assets $9,103,814 Less: goodwill and other intangible assets, net of deferred tax liability (378,259) Tangible assets (non-GAAP) $8,725,556 Tangible common equity to tangible assets (non-GAAP) 9.17 % Appendix Definitions of GAAP to Non-GAAP Financial Measures 24

2Q22 1Q22 4Q21 3Q21 2Q21 Efficiency Ratio (non-GAAP) Noninterest expense $48,424 $47,414 $50,189 $47,241 $45,829 Net interest income per consolidated statements of net income 75,194 67,733 68,438 68,712 68,304 Plus: taxable equivalent adjustment 506 493 510 557 585 Net interest income (FTE) (non-GAAP) $75,700 $68,226 $68,948 $69,269 $68,889 Noninterest income 12,630 15,226 16,104 15,846 15,424 Less: net gains on sale of securities — — — — (29) Net interest income (FTE) (non-GAAP) plus noninterest income $88,330 $83,452 $85,052 $85,115 $84,284 Efficiency ratio (non-GAAP) 54.82 % 56.82 % 59.01 % 55.50 % 54.37 % Net Interest Margin Rate (FTE) (non-GAAP) Interest income and dividend income $77,599 $70,109 $71,135 $71,769 $71,577 Less: interest expense (2,405) (2,376) (2,697) (3,058) (3,273) Net interest income per consolidated statements of net income $75,194 $67,733 $68,437 $68,711 $68,304 Plus: taxable equivalent adjustment 506 493 510 557 585 Net interest income (FTE) (non-GAAP) $75,700 $68,226 $68,947 $69,268 $68,889 Net interest income (FTE) (annualized) $303,633 $276,694 $273,537 $274,812 $276,313 Average interest-earning assets $8,535,384 $8,747,398 $8,768,329 $8,769,425 $8,729,277 Net interest margin (FTE) (non-GAAP) 3.56 % 3.16 % 3.12 % 3.14 % 3.16 % Appendix Definitions of GAAP to Non-GAAP Financial Measures 25
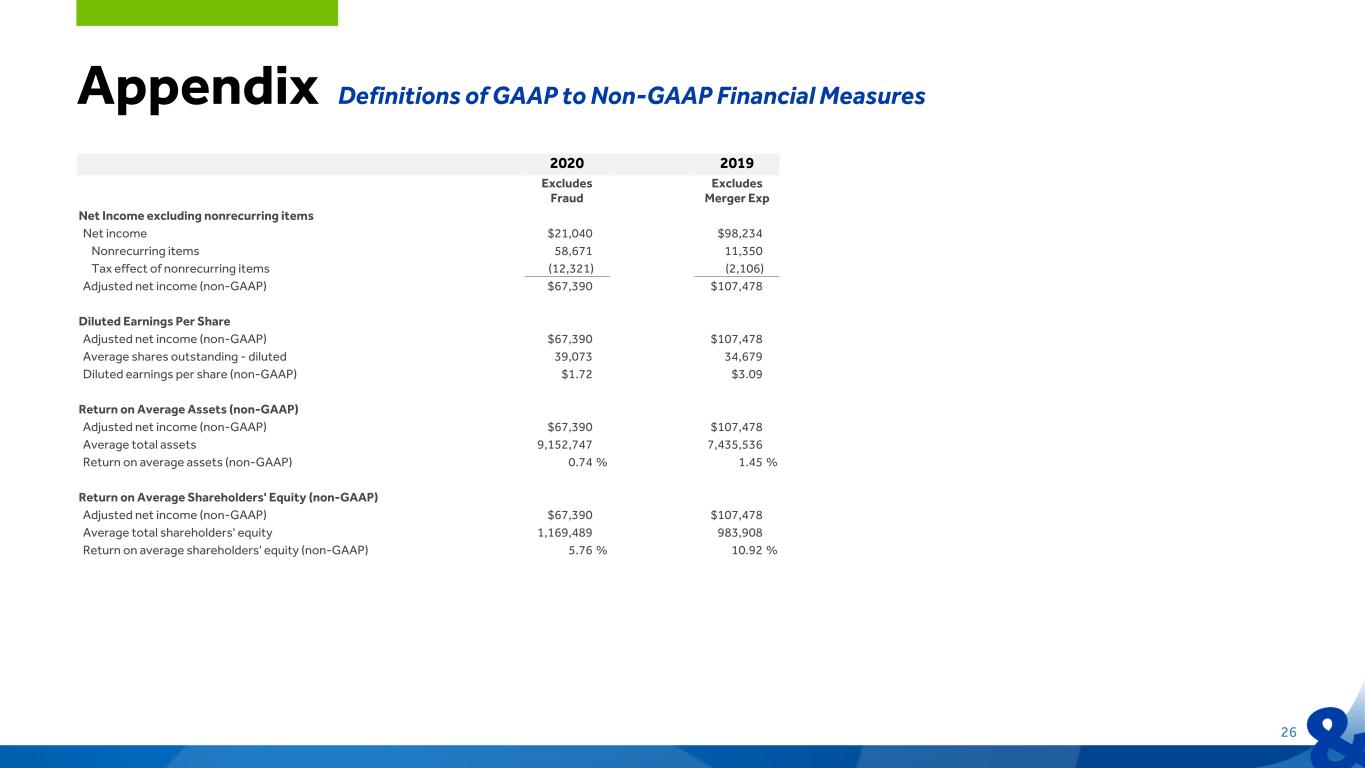
2020 2019 Excludes Fraud Excludes Merger Exp Net Income excluding nonrecurring items Net income $21,040 $98,234 Nonrecurring items 58,671 11,350 Tax effect of nonrecurring items (12,321) (2,106) Adjusted net income (non-GAAP) $67,390 $107,478 Diluted Earnings Per Share Adjusted net income (non-GAAP) $67,390 $107,478 Average shares outstanding - diluted 39,073 34,679 Diluted earnings per share (non-GAAP) $1.72 $3.09 Return on Average Assets (non-GAAP) Adjusted net income (non-GAAP) $67,390 $107,478 Average total assets 9,152,747 7,435,536 Return on average assets (non-GAAP) 0.74 % 1.45 % Return on Average Shareholders' Equity (non-GAAP) Adjusted net income (non-GAAP) $67,390 $107,478 Average total shareholders' equity 1,169,489 983,908 Return on average shareholders' equity (non-GAAP) 5.76 % 10.92 % Appendix Definitions of GAAP to Non-GAAP Financial Measures 26
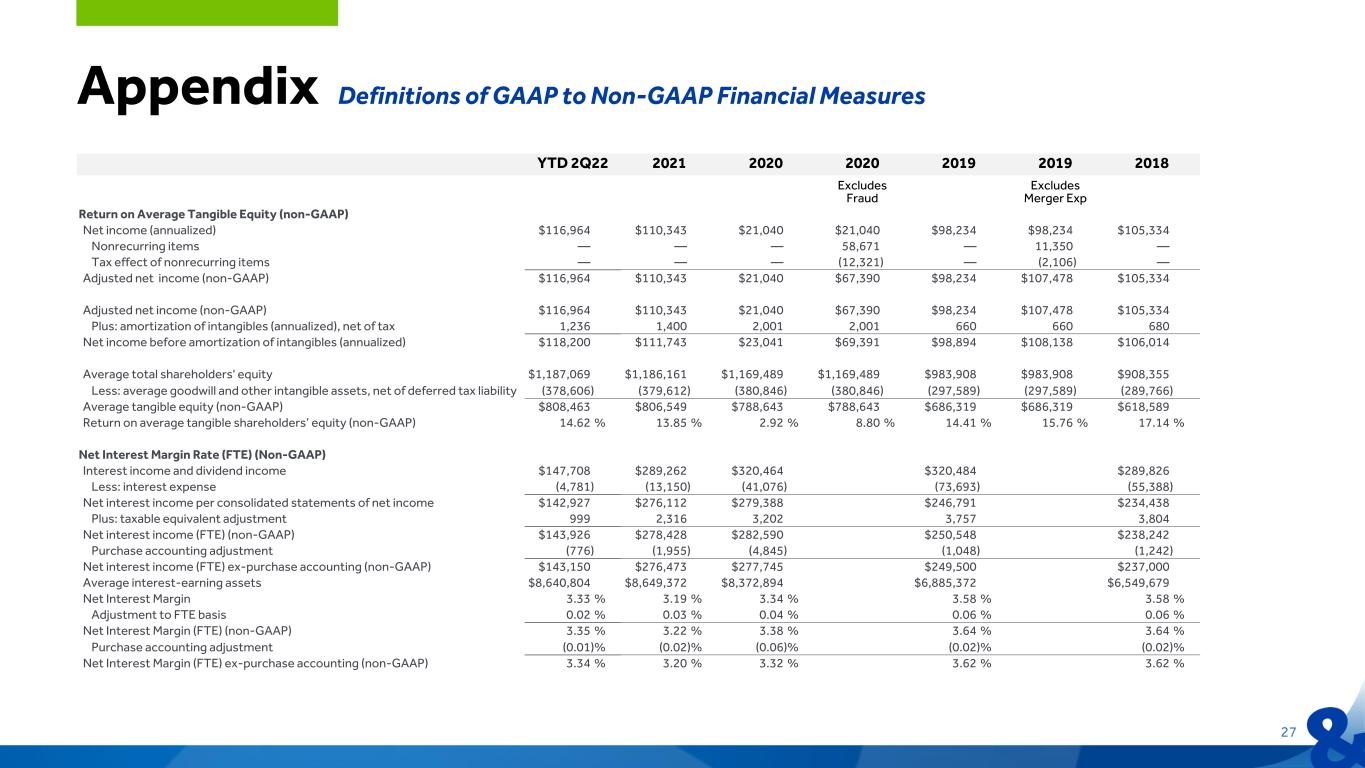
YTD 2Q22 2021 2020 2020 2019 2019 2018 Excludes Fraud Excludes Merger Exp Return on Average Tangible Equity (non-GAAP) Net income (annualized) $116,964 $110,343 $21,040 $21,040 $98,234 $98,234 $105,334 Nonrecurring items — — — 58,671 — 11,350 — Tax effect of nonrecurring items — — — (12,321) — (2,106) — Adjusted net income (non-GAAP) $116,964 $110,343 $21,040 $67,390 $98,234 $107,478 $105,334 Adjusted net income (non-GAAP) $116,964 $110,343 $21,040 $67,390 $98,234 $107,478 $105,334 Plus: amortization of intangibles (annualized), net of tax 1,236 1,400 2,001 2,001 660 660 680 Net income before amortization of intangibles (annualized) $118,200 $111,743 $23,041 $69,391 $98,894 $108,138 $106,014 Average total shareholders' equity $1,187,069 $1,186,161 $1,169,489 $1,169,489 $983,908 $983,908 $908,355 Less: average goodwill and other intangible assets, net of deferred tax liability (378,606) (379,612) (380,846) (380,846) (297,589) (297,589) (289,766) Average tangible equity (non-GAAP) $808,463 $806,549 $788,643 $788,643 $686,319 $686,319 $618,589 Return on average tangible shareholders’ equity (non-GAAP) 14.62 % 13.85 % 2.92 % 8.80 % 14.41 % 15.76 % 17.14 % Net Interest Margin Rate (FTE) (Non-GAAP) Interest income and dividend income $147,708 $289,262 $320,464 $320,484 $289,826 Less: interest expense (4,781) (13,150) (41,076) (73,693) (55,388) Net interest income per consolidated statements of net income $142,927 $276,112 $279,388 $246,791 $234,438 Plus: taxable equivalent adjustment 999 2,316 3,202 3,757 3,804 Net interest income (FTE) (non-GAAP) $143,926 $278,428 $282,590 $250,548 $238,242 Purchase accounting adjustment (776) (1,955) (4,845) (1,048) (1,242) Net interest income (FTE) ex-purchase accounting (non-GAAP) $143,150 $276,473 $277,745 $249,500 $237,000 Average interest-earning assets $8,640,804 $8,649,372 $8,372,894 $6,885,372 $6,549,679 Net Interest Margin 3.33 % 3.19 % 3.34 % 3.58 % 3.58 % Adjustment to FTE basis 0.02 % 0.03 % 0.04 % 0.06 % 0.06 % Net Interest Margin (FTE) (non-GAAP) 3.35 % 3.22 % 3.38 % 3.64 % 3.64 % Purchase accounting adjustment (0.01) % (0.02) % (0.06) % (0.02) % (0.02) % Net Interest Margin (FTE) ex-purchase accounting (non-GAAP) 3.34 % 3.20 % 3.32 % 3.62 % 3.62 % Appendix Definitions of GAAP to Non-GAAP Financial Measures 27

YTD 2Q22 2021 2020 2020 2019 2019 2018 Excludes Fraud Excludes Merger Exp PPNR / Average Assets (Non-GAAP) Income before taxes $72,253 $135,668 $21,040 $117,360 $117,360 $123,179 Plus: merger related expenses — — — — 11,350 — Plus: provision for credit losses 2,692 16,215 131,424 14,873 14,873 14,995 Total adjusted income before taxes (non-GAAP) 74,945 151,884 152,464 132,233 143,583 138,174 Total adjusted income before taxes (annualized) (non-GAAP) $151,132 $151,884 $152,464 $132,233 $143,583 $138,174 Average assets $9,339,901 $9,375,850 $9,152,747 $7,435,536 $7,435,536 $7,043,828 PPNR / Average Assets (non-GAAP) 1.62 % 1.62 % 1.67 % 1.78 % 1.93 % 1.96 % Tangible Common Equity / Tangible Assets (non-GAAP) Total shareholders' equity $1,178,358 $1,206,453 $1,154,711 $1,191,998 $935,761 Less: goodwill and other intangible assets, net of deferred tax liability ($378,259) ($378,871) (380,278) (380,247) (289,501) Tangible common equity (non-GAAP) $800,099 $827,582 $774,433 $811,751 $646,260 Total assets $9,103,814 $9,488,529 $8,967,896 $8,764,649 $7,252,221 Less: goodwill and other intangible assets, net of deferred tax liability (378,259) (378,871) (380,278) (380,247) (289,501) Tangible assets (non-GAAP) $8,725,556 $9,109,658 $8,587,618 $8,384,402 $6,962,720 Tangible common equity to tangible assets (non-GAAP) 9.17 % 9.08 % 9.02 % 9.68 % 9.28 % Provision for credit losses Provision $131,424 $131,424 Less: customer fraud — 58,671 Adjusted provision for credit losses 131,424 72,753 YTD Net loan charge offs / YTD Average loans Net charge-offs $103,379 $103,379 Less: customer fraud — 58,671 Adjusted net charge-offs 103,379 44,708 Total average YTD loans 7,410,462 7,410,462 Adjusted net loan charge offs / YTD Average loans 1.40 % 0.60 % Appendix Definitions of GAAP to Non-GAAP Financial Measures 28Member FDIC
Christopher J. McComish Chief Executive Officer Mark Kochvar Chief Financial Officer Second Quarter 2022


