
Christopher J. McComish Chief Executive Officer Mark Kochvar Chief Financial Officer First Quarter 2023
Forward Looking Statements and Risk Factors This information contains or incorporates statements that we believe are “forward-looking statements” within the meaning of the Private Securities Litigation Reform Act of 1995. Forward-looking statements generally relate to our financial condition, results of operations, plans, objectives, outlook for earnings, revenues, expenses, capital and liquidity levels and ratios, asset levels, asset quality, financial position and other matters regarding or affecting S&T and its future business and operations. Forward-looking statements are typically identified by words or phrases such as “will likely result,” “expect,” “anticipate,” “estimate,” “forecast,” “project,” “intend,” “believe,” “assume,” “strategy,” “trend,” “plan,” “outlook,” “outcome,” “continue,” “remain,” “potential,” “opportunity,” “comfortable,” “current,” “position,” “maintain,” “sustain,” “seek,” “achieve,” and variations of such words and similar expressions, or future or conditional verbs such as will, would, should, could or may. Although we believe the assumptions upon which these forward-looking statements are based are reasonable, any of these assumptions could prove to be inaccurate and the forward-looking statements based on these assumptions could be incorrect. The matters discussed in these forward-looking statements are subject to various risks, uncertainties and other factors that could cause actual results and trends to differ materially from those made, projected, or implied in or by the forward-looking statements depending on a variety of uncertainties or other factors including, but not limited to: credit losses and the credit risk of our commercial and consumer loan products; changes in the level of charge-offs and changes in estimates of the adequacy of the allowance for credit losses, or ACL; cyber-security concerns; rapid technological developments and changes; operational risks or risk management failures by us or critical third parties, including fraud risk; our ability to manage our reputational risks; sensitivity to the interest rate environment, a rapid increase in interest rates or a change in the shape of the yield curve; a change in spreads on interest-earning assets and interest-bearing liabilities; the transition from LIBOR as a reference rate; regulatory supervision and oversight, including changes in regulatory capital requirements and our ability to address those requirements; unanticipated changes in our liquidity position; unanticipated changes in regulatory and governmental policies impacting interest rates and financial markets; changes in accounting policies, practices or guidance; legislation affecting the financial services industry as a whole, and S&T, in particular; developments affecting the industry and the soundness of financial institutions and further disruption to the economy and U.S. banking system may adversely affect our business, results of operations, liquidity and stock price; the outcome of pending and future litigation and governmental proceedings; increasing price and product/service competition; the ability to continue to introduce competitive new products and services on a timely, cost-effective basis; managing our internal growth and acquisitions; the possibility that the anticipated benefits from acquisitions cannot be fully realized in a timely manner or at all, or that integrating the acquired operations will be more difficult, disruptive or costly than anticipated; containing costs and expenses; reliance on significant customer relationships; an interruption or cessation of an important service by a third-party provider; our ability to attract and retain talented executives and employees; general economic or business conditions, including the strength of regional economic conditions in our market area; environmental, social and governance practices and disclosures, including climate change, hiring practices, the diversity of the work force, and racial and social justice issues; deterioration of the housing market and reduced demand for mortgages; deterioration in the overall macroeconomic conditions or the state of the banking industry that could warrant further analysis of the carrying value of goodwill and could result in an adjustment to its carrying value resulting in a non-cash charge to net income; the stability of our core deposit base and access to contingency funding; re-emergence of turbulence in significant portions of the global financial and real estate markets that could impact our performance, both directly, by affecting our revenues and the value of our assets and liabilities, and indirectly, by affecting the economy generally and access to capital in the amounts, at the times and on the terms required to support our future businesses. Many of these factors, as well as other factors, are described in our Annual Report on Form 10-K for the year ended December 31, 2022, including Part I, Item 1A-"Risk Factors" and any of our subsequent filings with the SEC. Forward-looking statements are based on beliefs and assumptions using information available at the time the statements are made. We caution you not to unduly rely on forward-looking statements because the assumptions, beliefs, expectations and projections about future events may, and often do, differ materially from actual results. Any forward-looking statement speaks only as to the date on which it is made, and we undertake no obligation to update any forward-looking statement to reflect developments occurring after the statement is made. Non-GAAP Financial Measures In addition to the traditional measures presented in accordance with Generally Accepted Accounting Principles (GAAP), S&T management uses and this presentation contains or references certain non-GAAP financial measures, such as net interest income on a fully taxable equivalent basis. S&T believes these non-GAAP financial measures provide information useful to investors in understanding our underlying business, operational performance and performance trends which facilitate comparisons with the performance of others in the financial services industry. Although S&T believes that these non-GAAP financial measures enhance investors’ understanding of S&T’s business and performance, these non-GAAP financial measures should not be considered an alternative to GAAP or considered to be more important than financial results determined in accordance with GAAP, nor are they necessary comparable with non-GAAP measures which may be presented by other companies. The non-GAAP financial measures contained within this presentation should be read in conjunction with the audited financial statements and analysis as presented in the Annual Report on Form 10-K as well as the unaudited financial statements and analyses as presented in the respective Quarterly Reports in Exhibit 99.1 of Form 8-K for S&T Bancorp, Inc. and subsidiaries. 2
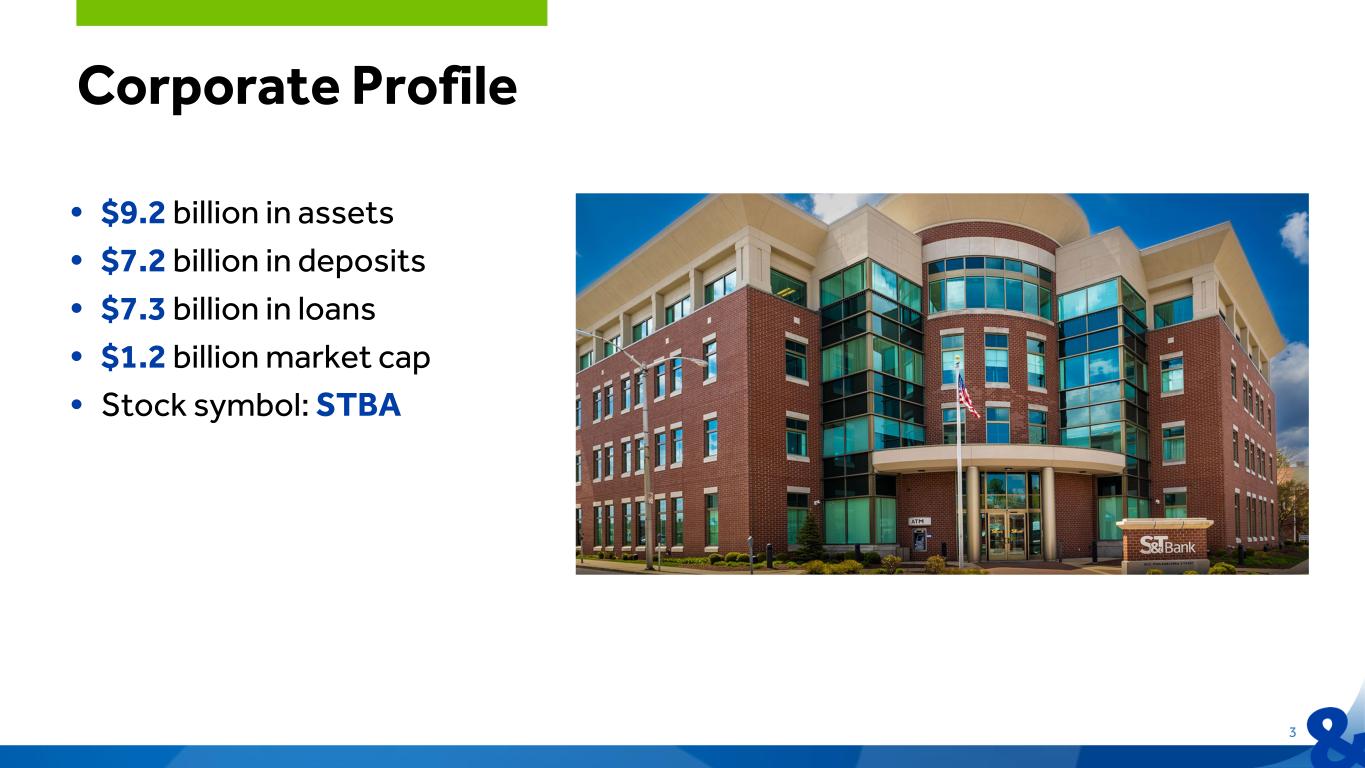
3 • $9.2 billion in assets • $7.2 billion in deposits • $7.3 billion in loans • $1.2 billion market cap • Stock symbol: STBA Corporate Profile
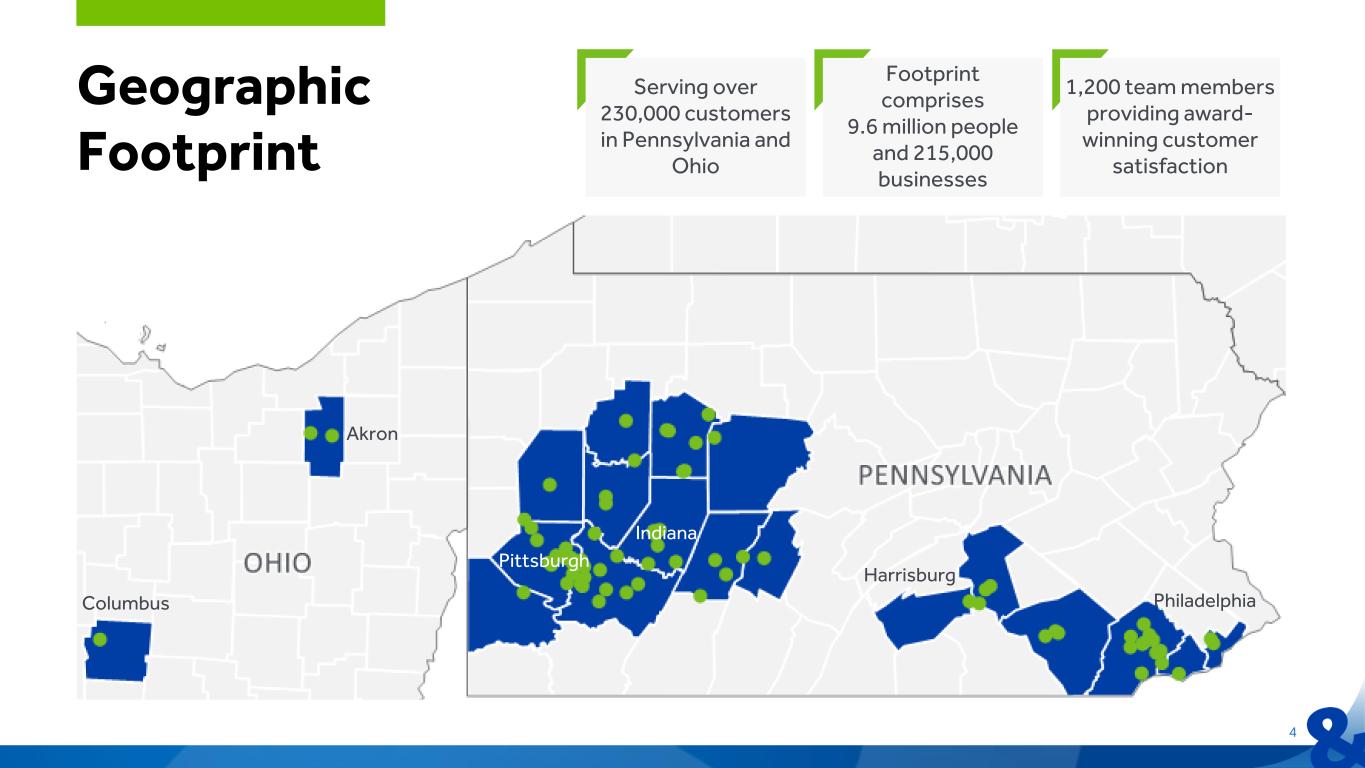
Geographic Footprint 4 Serving over 230,000 customers in Pennsylvania and Ohio Footprint comprises 9.6 million people and 215,000 businesses 1,200 team members providing award- winning customer satisfaction Akron Columbus Philadelphia Harrisburg Pittsburgh Indiana
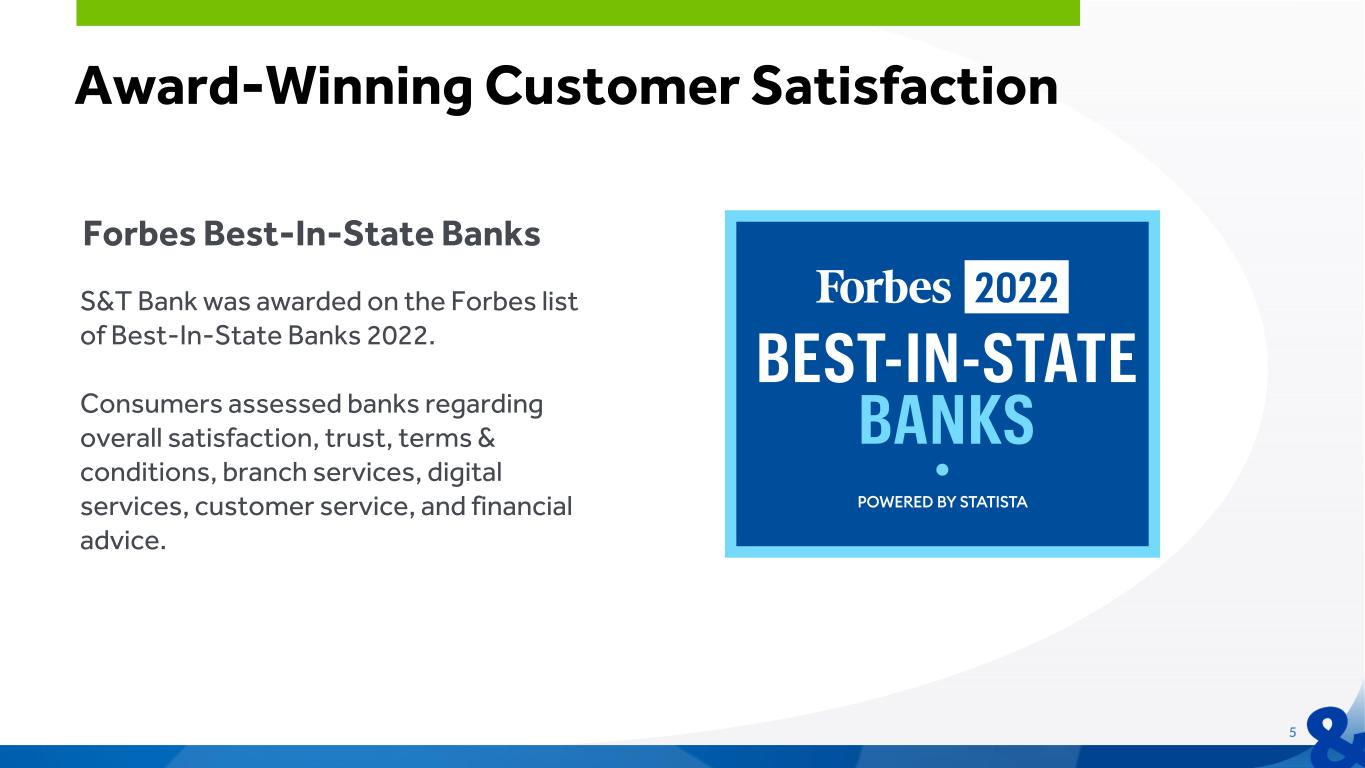
Award-Winning Customer Satisfaction 5 Forbes Best-In-State Banks S&T Bank was awarded on the Forbes list of Best-In-State Banks 2022. Consumers assessed banks regarding overall satisfaction, trust, terms & conditions, branch services, digital services, customer service, and financial advice.

Top Workplace Recognition 6 Top Workplaces for Diversity, Equity and Inclusion (Devi) S&T Bank was named a Top Workplace for Diversity, Equity and Inclusion (DE&I). The national award recognizes top workplaces that promote a welcoming and inclusive culture as well as programs that are made available to employees. Top Workplaces in the Greater Pittsburgh Region S&T Bank was recognized as a top workplace in Pittsburgh by the Pittsburgh Post-Gazette. Employers were assessed on 15 culture drivers that are critical to the success of any organization, including alignment, execution and connection. Top Workplaces USA S&T Bank has earned the 2023 Top Workplaces USA award issued by Energage. The employer recognition program recognizes organizations across the country that have built exceptional workplace cultures. Winners are chosen based solely on employee feedback gathered through an anonymous, research-based employee engagement survey. Top Workplaces Culture Excellence S&T Bank announced it earned the 2023 Top Workplaces Culture Excellence award for Work-Life Flexibility, issued by Energage. The national award recognizes organizations that provide options to their employees in how and where they work, as well as encouraging managers to acknowledge and care about their employees' concerns.
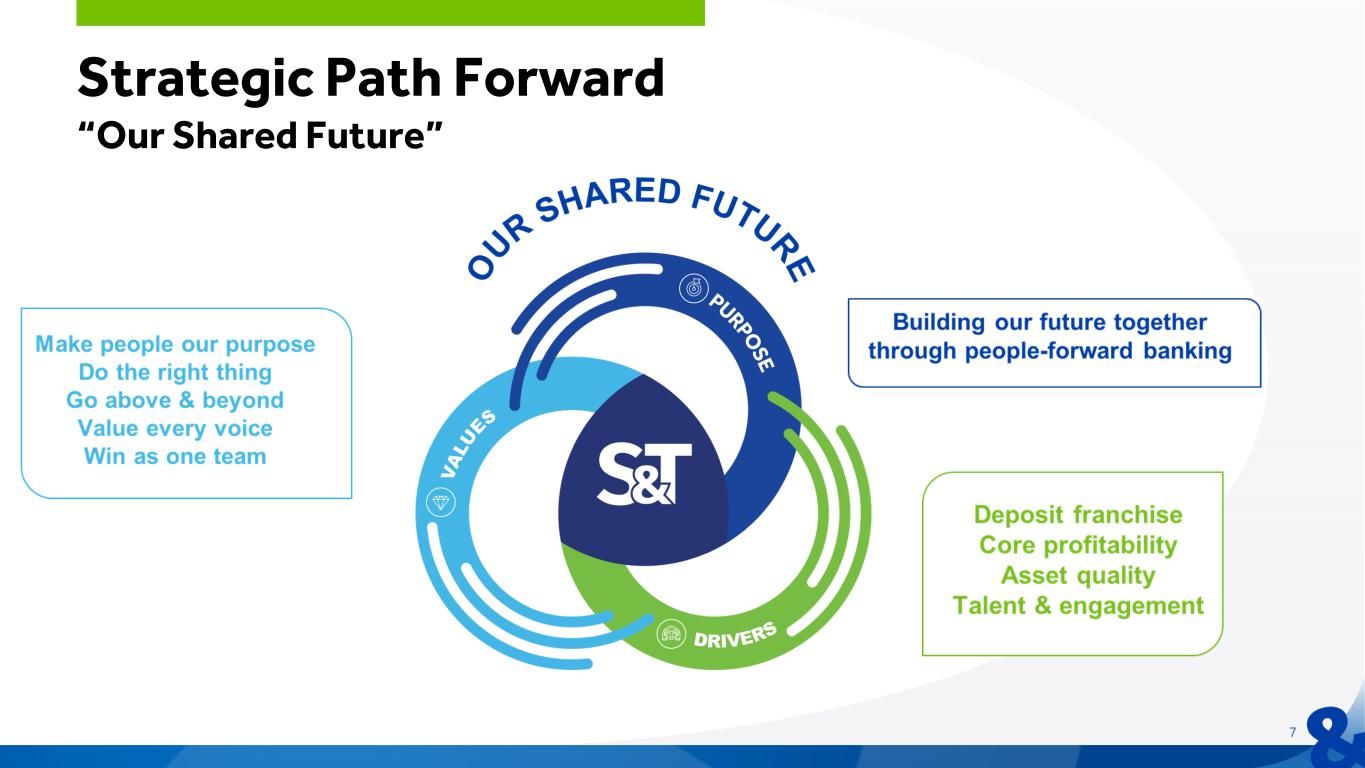
7 Strategic Path Forward “Our Shared Future”

8 ◦ NIM management ◦ Balance efficiency and infrastructure investments ◦ Data and analytics ◦ Credit risk management practices ◦ Process enhancements ◦ “Our Shared Future” culture and mindset ◦ Talent acquisition and retention ◦ Diversity, Equity & Inclusion ◦ Treasury Management ◦ Customer experience ◦ Product optimization ◦ Digital evolution DEPOSIT FRANCHISE CORE PROFITABILITY ASSET QUALITY TALENT AND ENGAGEMENT Drivers Execution on these drivers will support our long-term goal of top quartile valuation.

9 First Quarter Overview RETURNS EARNINGS *Refer to appendix for reconciliation of non-GAAP financial measures EPS $1.02 Net Income $39.8 million ROA 1.77% ROE 13.38% ROTE* 19.61% PPNR* 2.23% HIGHLIGHTS • Solid return metrics • NIM relatively unchanged from prior quarter • Net recovery of $5.1 million, or 0.29%, of average loans • Expenses well controlled with an efficiency ratio of 50.42% NIM* 4.32% NCO (0.29%) OTHER Efficiency Ratio* 50.42%
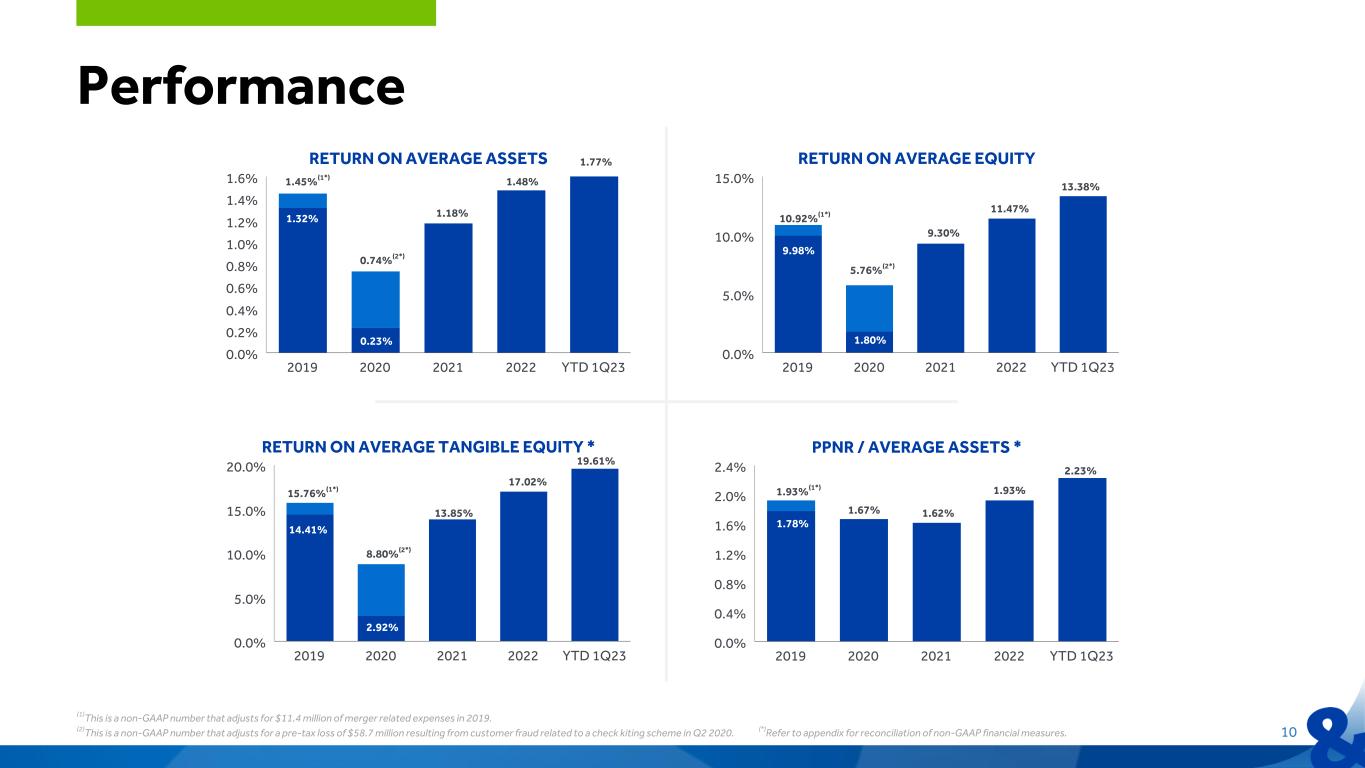
PPNR / AVERAGE ASSETS * 2019 2020 2021 2022 YTD 1Q23 0.0% 0.4% 0.8% 1.2% 1.6% 2.0% 2.4% RETURN ON AVERAGE TANGIBLE EQUITY * 2019 2020 2021 2022 YTD 1Q23 0.0% 5.0% 10.0% 15.0% 20.0% RETURN ON AVERAGE EQUITY 2019 2020 2021 2022 YTD 1Q23 0.0% 5.0% 10.0% 15.0% RETURN ON AVERAGE ASSETS 2019 2020 2021 2022 YTD 1Q23 0.0% 0.2% 0.4% 0.6% 0.8% 1.0% 1.2% 1.4% 1.6% Performance 10 1.32% 1.45%(1*) 0.74%(2*) 0.23% 1.77% 10.92%(1*) 5.76%(2*) 1.80% 13.38% 9.98% 1.93%(1*) 1.62% 2.23% 1.78% 15.76%(1*) 2.92% 8.80%(2*) 19.61% 14.41% (1)This is a non-GAAP number that adjusts for $11.4 million of merger related expenses in 2019. (2)This is a non-GAAP number that adjusts for a pre-tax loss of $58.7 million resulting from customer fraud related to a check kiting scheme in Q2 2020. (*)Refer to appendix for reconciliation of non-GAAP financial measures. 1.18% 9.30% 13.85% 1.67% 1.93% 1.32% 1.48% 9.98% 11.47% 14.41% 17.02%
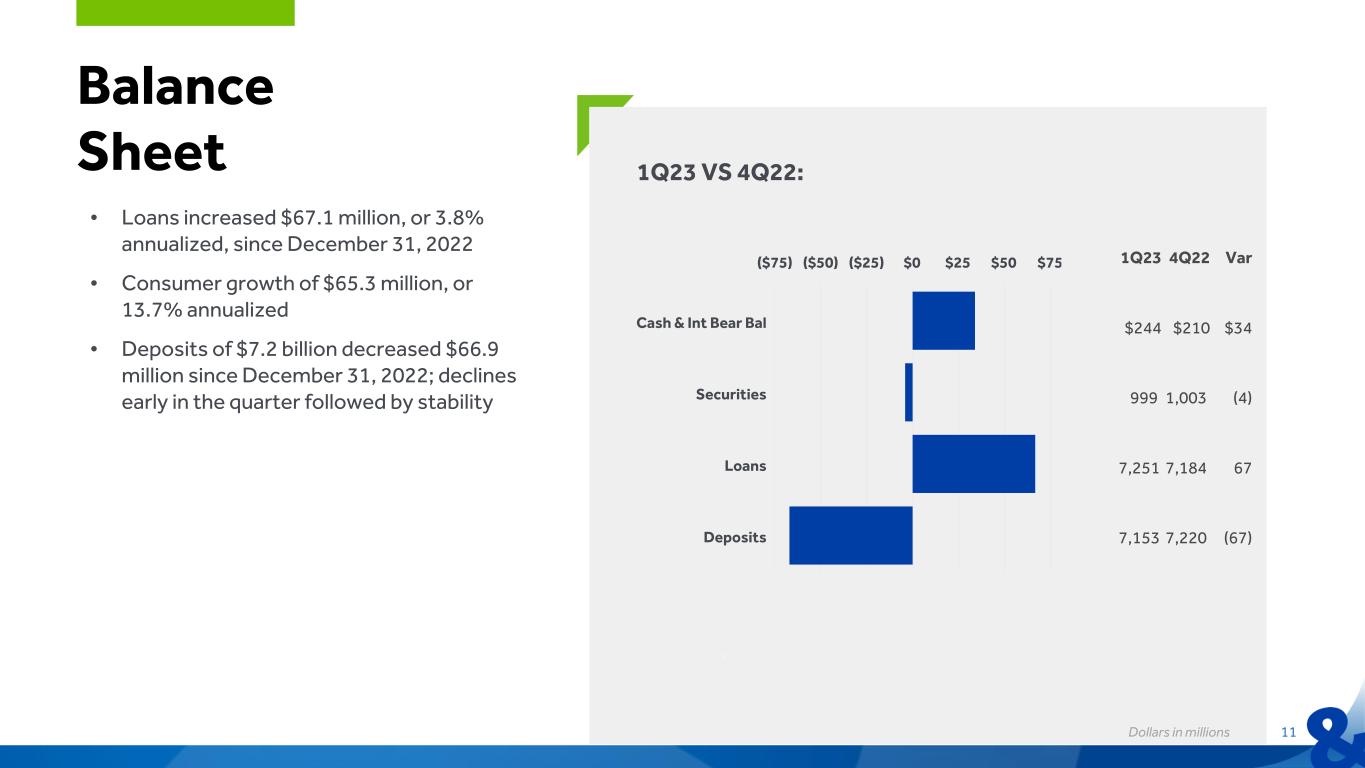
Balance Sheet • Loans increased $67.1 million, or 3.8% annualized, since December 31, 2022 • Consumer growth of $65.3 million, or 13.7% annualized • Deposits of $7.2 billion decreased $66.9 million since December 31, 2022; declines early in the quarter followed by stability Dollars in millions 11 1Q23 4Q22 Var $244 $210 $34 999 1,003 (4) 7,251 7,184 67 7,153 7,220 (67) Cash & Int Bear Bal Securities Loans Deposits ($75) ($50) ($25) $0 $25 $50 $75 1Q23 VS 4Q22:
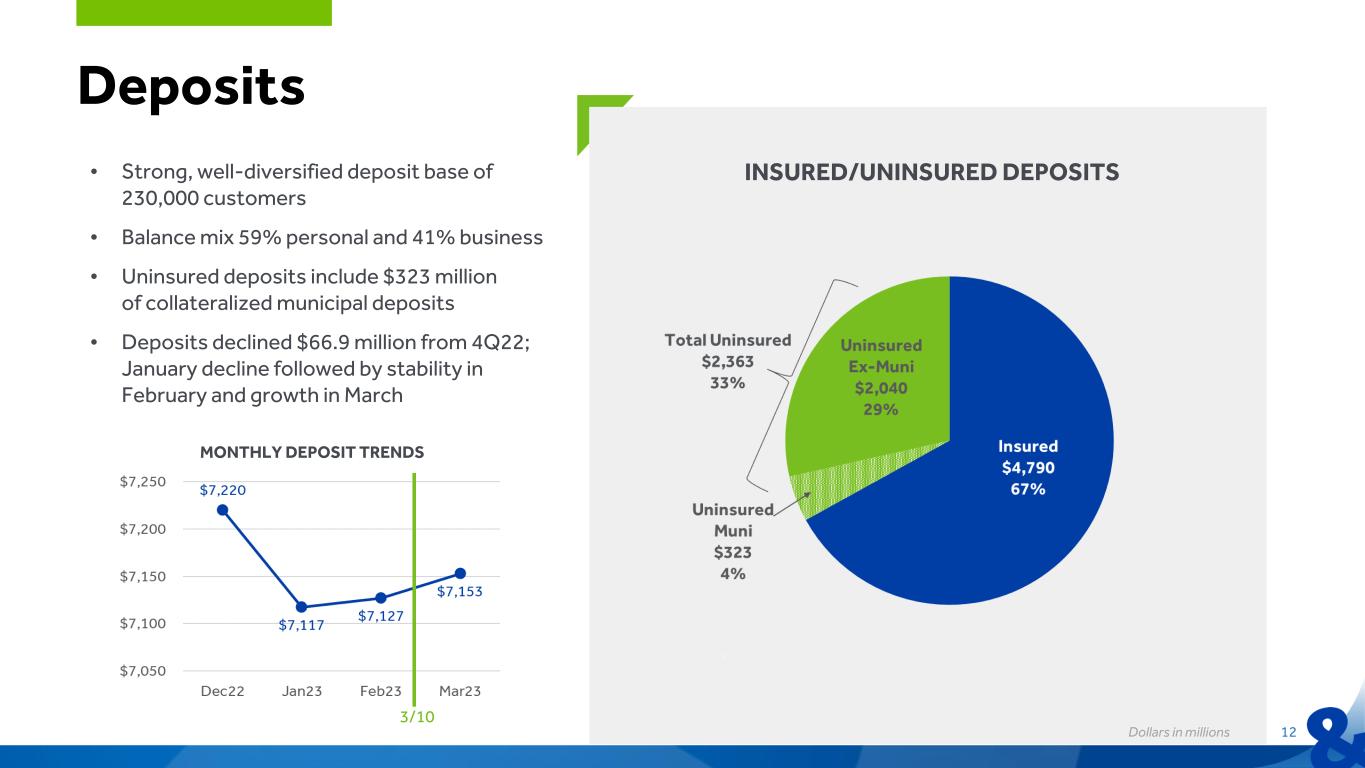
Deposits • Strong, well-diversified deposit base of 230,000 customers • Balance mix 59% personal and 41% business • Uninsured deposits include $323 million of collateralized municipal deposits • Deposits declined $66.9 million from 4Q22; January decline followed by stability in February and growth in March Dollars in millions 12 INSURED/UNINSURED DEPOSITS Business 33% MONTHLY DEPOSIT TRENDS 3/10
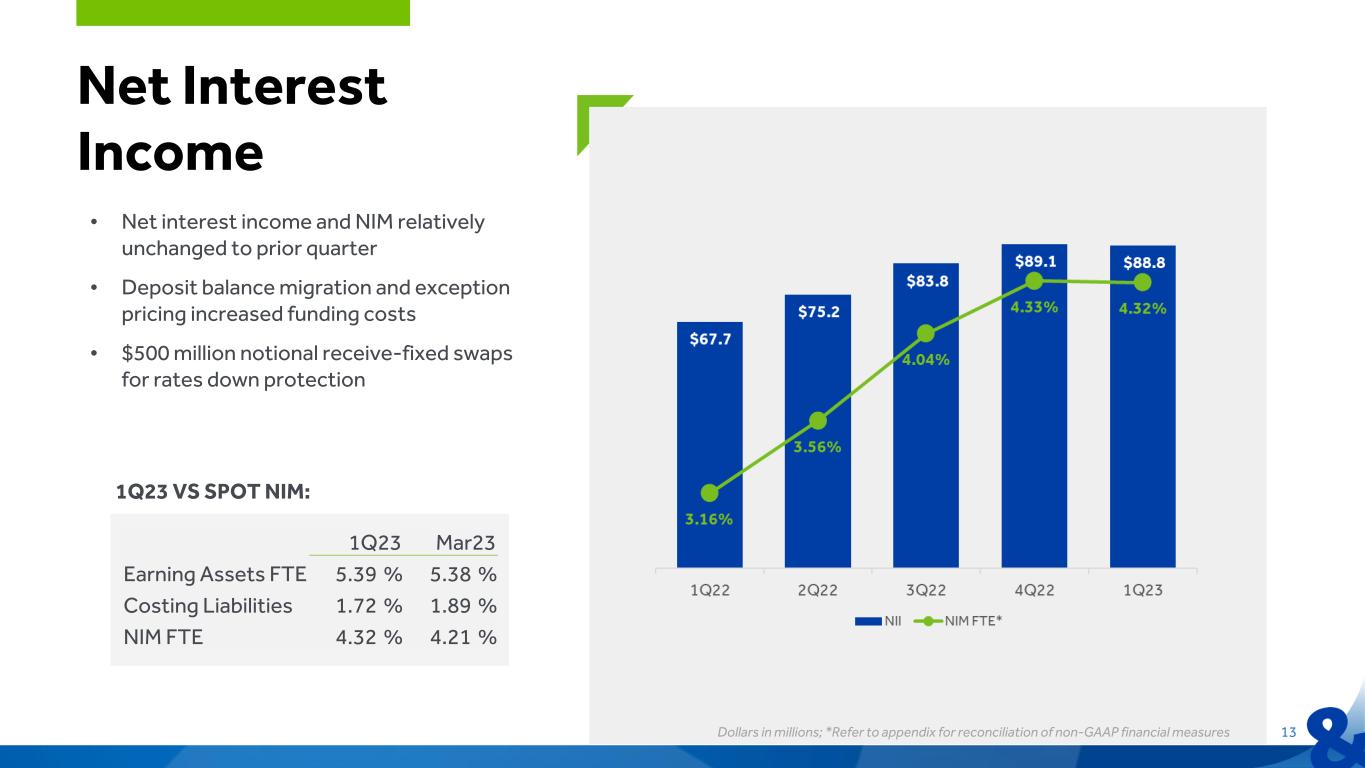
• Net interest income and NIM relatively unchanged to prior quarter • Deposit balance migration and exception pricing increased funding costs • $500 million notional receive-fixed swaps for rates down protection Net Interest Income Dollars in millions; *Refer to appendix for reconciliation of non-GAAP financial measures 13 1Q23 Mar23 Earning Assets FTE 5.39 % 5.38 % Costing Liabilities 1.72 % 1.89 % NIM FTE 4.32 % 4.21 % 1Q23 VS SPOT NIM:
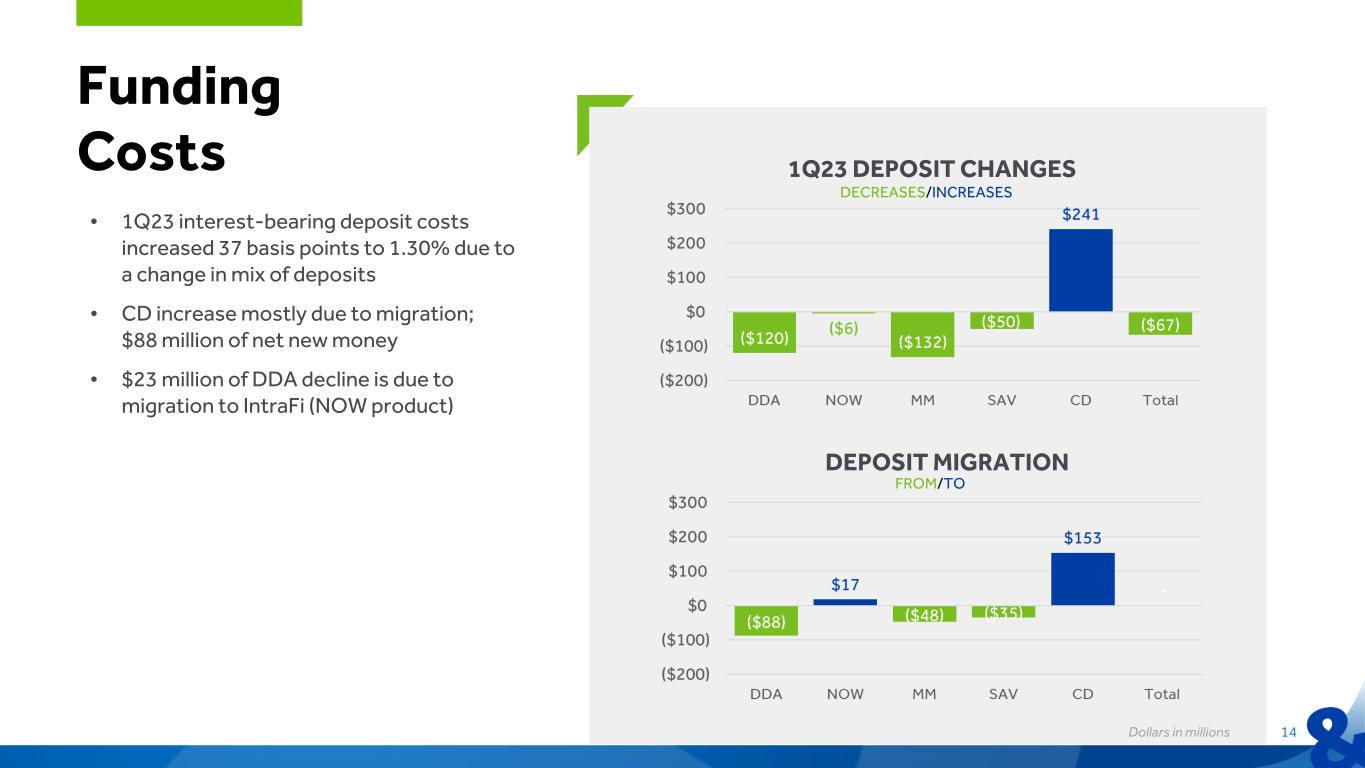
• 1Q23 interest-bearing deposit costs increased 37 basis points to 1.30% due to a change in mix of deposits • CD increase mostly due to migration; $88 million of net new money • $23 million of DDA decline is due to migration to IntraFi (NOW product) Funding Costs Dollars in millions 14 1Q23 DEPOSIT CHANGES DEPOSIT MIGRATION FROM/TO DECREASES/INCREASES

FUNDING SOURCES Funding Capacity • Strong liquidity position with well-diversified deposit base • Significant funding availability through FHLB and Federal Reserve • Funding availability meets liquidity needs in both normal and stress environments Dollars in millions 15 Capacity Used Available FHLB $2,965 $624 $2,341 Federal Reserve Window 794 0 794 Federal Reserve BTLF 731 0 731 Total Funding Sources $4,490 $624 $3,866 $3,866 $2,363 Available Funding Uninsured Deposits 164%

Asset Quality ACL 1Q23 VS 4Q22: Dollars in millions 16 ASSET QUALITY TRENDS • ACL increased mainly due to a $4.2 million specific reserve and higher qualitative reserve for macro environment • Net recovery of $5.1 million due to a $9.3 million recovery from a customer fraud in 2020 – Strategic note sale resulted in $3.4 million charge-off
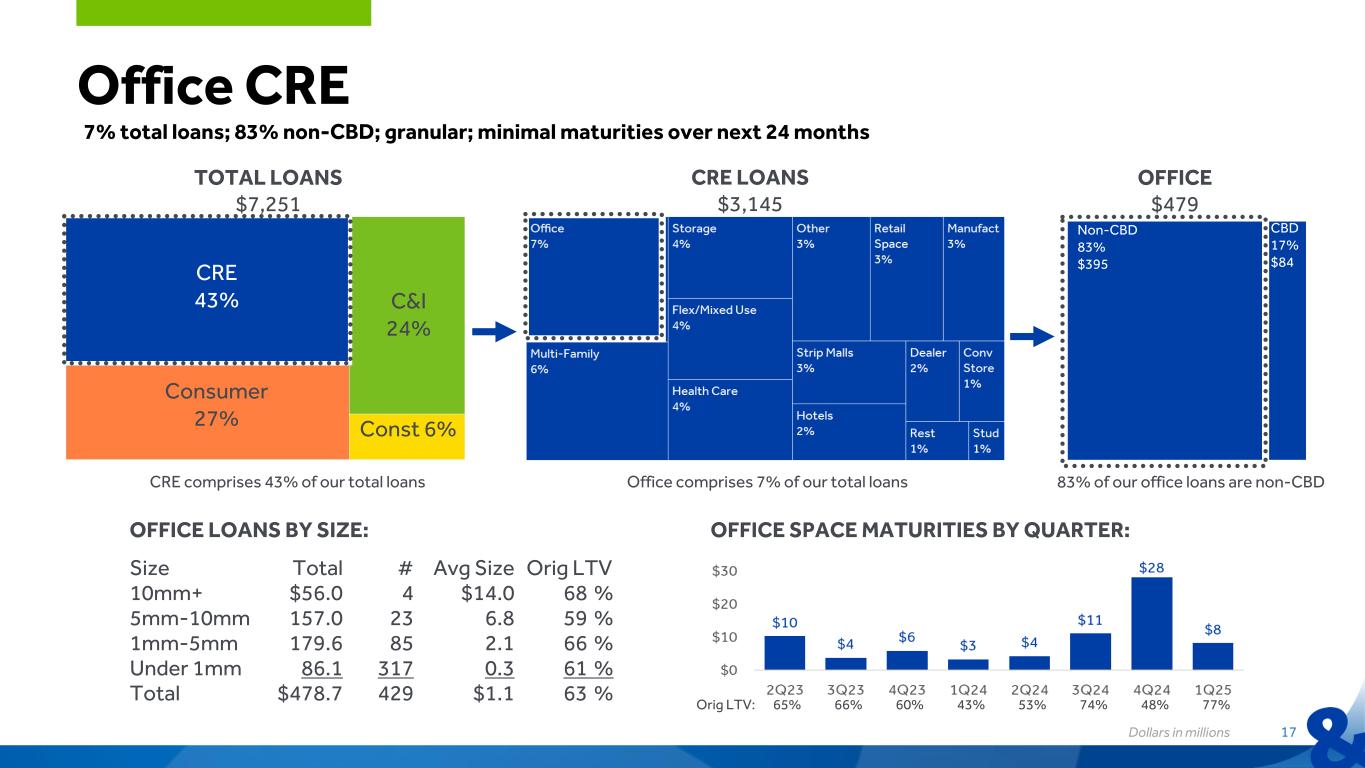
Office CRE Dollars in millions 17 CRE comprises 43% of our total loans CRE 43% Consumer 27% Const 6% C&I 24% Office comprises 7% of our total loans TOTAL LOANS $7,251 CRE LOANS $3,145 OFFICE $479 83% of our office loans are non-CBD CBD 17% $84 Non-CBD 83% $395 OFFICE LOANS BY SIZE: Size Total # Loans Avg Size Orig LTV 10mm+ $56.0 4 $14.0 68 % 5mm-10mm 157.0 23 6.8 59 % 1mm-5mm 179.6 85 2.1 66 % Under 1mm 86.1 317 0.3 61 % Total $478.7 429 $1.1 63 % OFFICE SPACE MATURITIES BY QUARTER: Orig LTV: 65% 66% 60% 43% 53% 74% 48% 77% 7% total loans; 83% non-CBD; granular; minimal maturities over next 24 months

CRE Maturities Dollars in millions 18 CRE MATURITIES BY SIZE: CRE MATURITIES BY INDUSTRY: Only 15% of our CRE loans mature in the next 24 months Size Total # Loans Avg Size 10mm+ $81.6 6 $13.6 5mm-10mm 169.6 23 7.4 1mm-5mm 175.5 81 2.2 Under 1mm 54.5 173 0.3 Total $481.2 283 $1.7 CRE MATURITIES BY QUARTER: in next 24 months
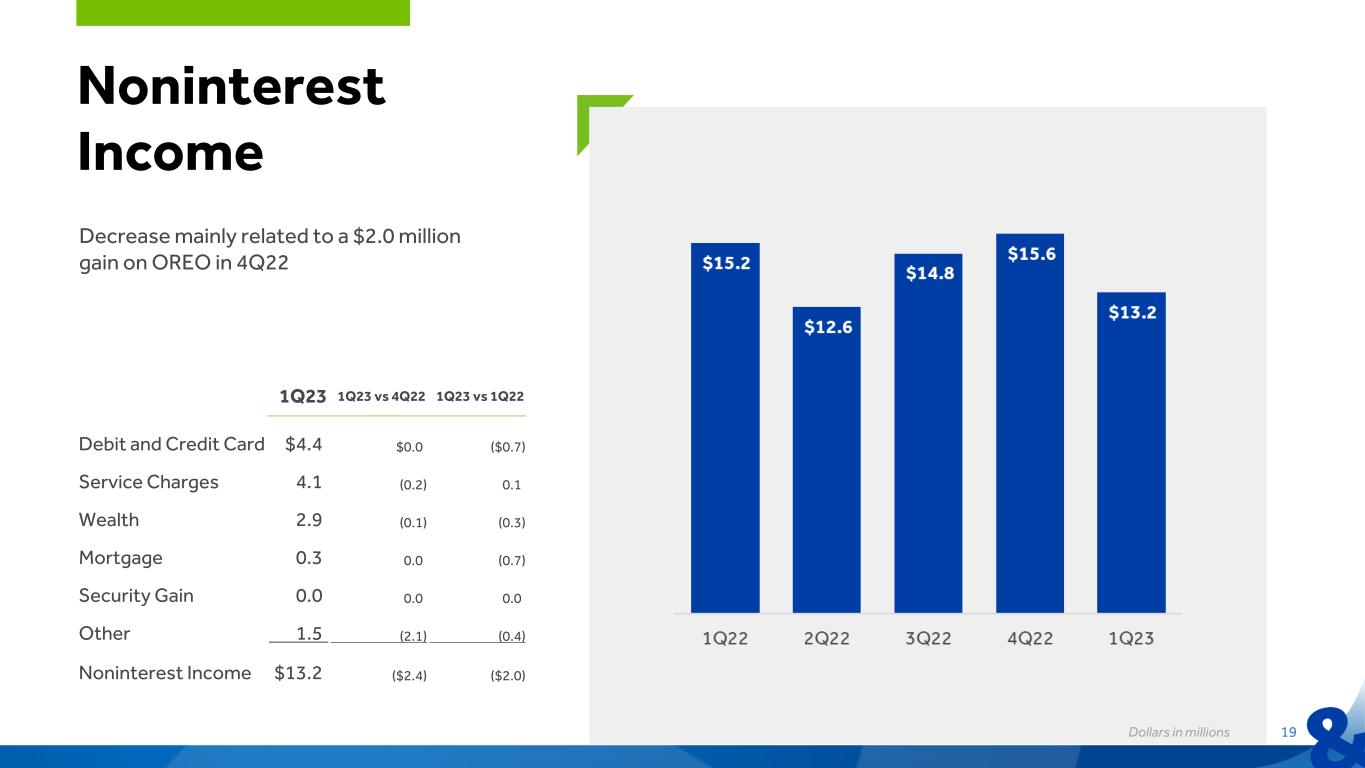
1Q23 1Q23 vs 4Q22 1Q23 vs 1Q22 Debit and Credit Card $4.4 $0.0 ($0.7) Service Charges 4.1 (0.2) 0.1 Wealth 2.9 (0.1) (0.3) Mortgage 0.3 0.0 (0.7) Security Gain 0.0 0.0 0.0 Other 1.5 (2.1) (0.4) Noninterest Income $13.2 ($2.4) ($2.0) Noninterest Income 19Dollars in millions Decrease mainly related to a $2.0 million gain on OREO in 4Q22

1Q23 1Q23 vs 4Q22 1Q23 vs 1Q22 Salaries & Benefits $27.6 ($0.4) $3.9 Data Processing 4.3 0.1 (0.1) Occupancy 3.8 — (0.1) FF&E 2.9 (0.1) 0.1 Marketing 1.9 0.6 0.5 Professional Services 1.8 (0.3) (0.1) Other Taxes 1.8 — 0.3 FDIC 1.0 0.6 0.1 Other 6.6 — (0.2) Noninterest Expense $51.7 $0.5 $4.4 Noninterest Expense Dollars in millions; *Refer to appendix for reconciliation of non-GAAP financial measures 20 FDIC higher due to increase in insurance assessment rate; marketing higher due to timing of marketing promotions
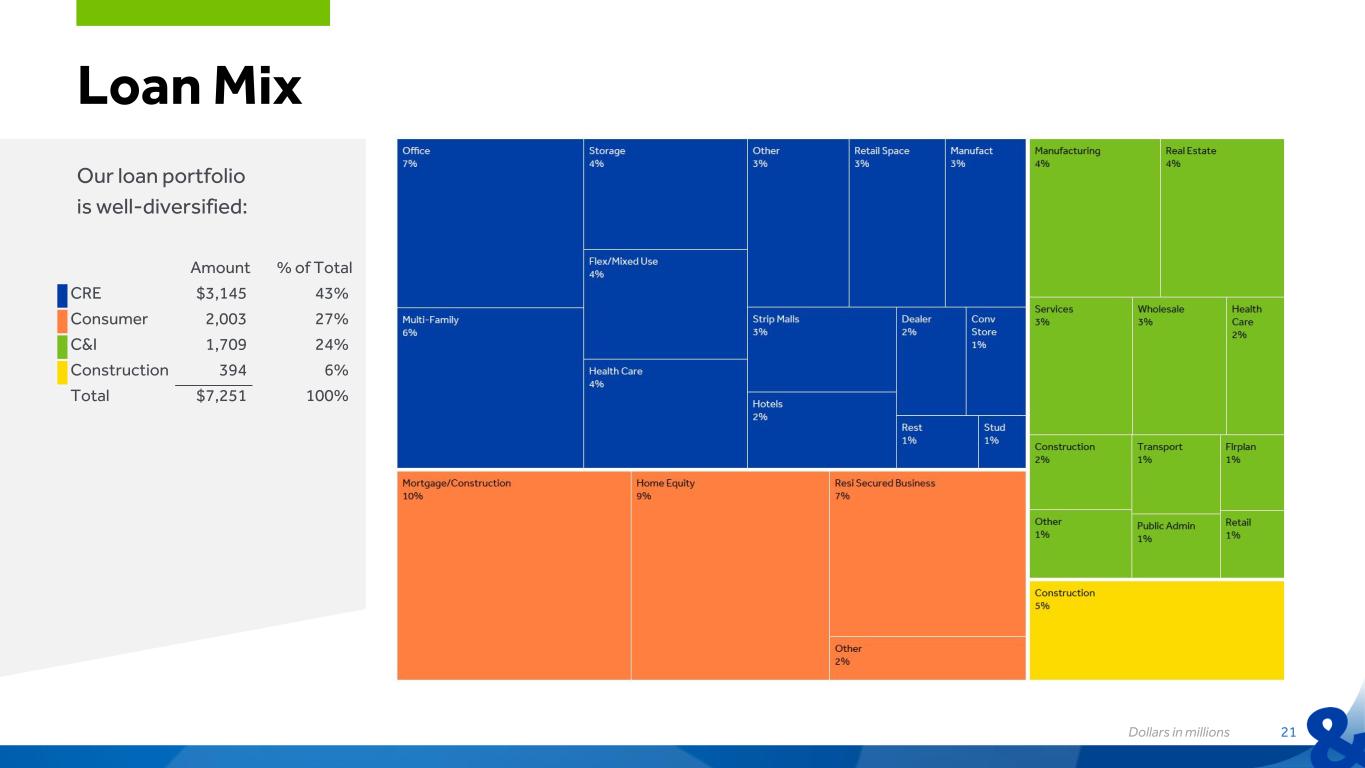
Loan Mix Our loan portfolio is well-diversified: Dollars in millions 21 Amount % of Total CRE $3,145 43% Consumer 2,003 27% C&I 1,709 24% Construction 394 6% Total $7,251 100%
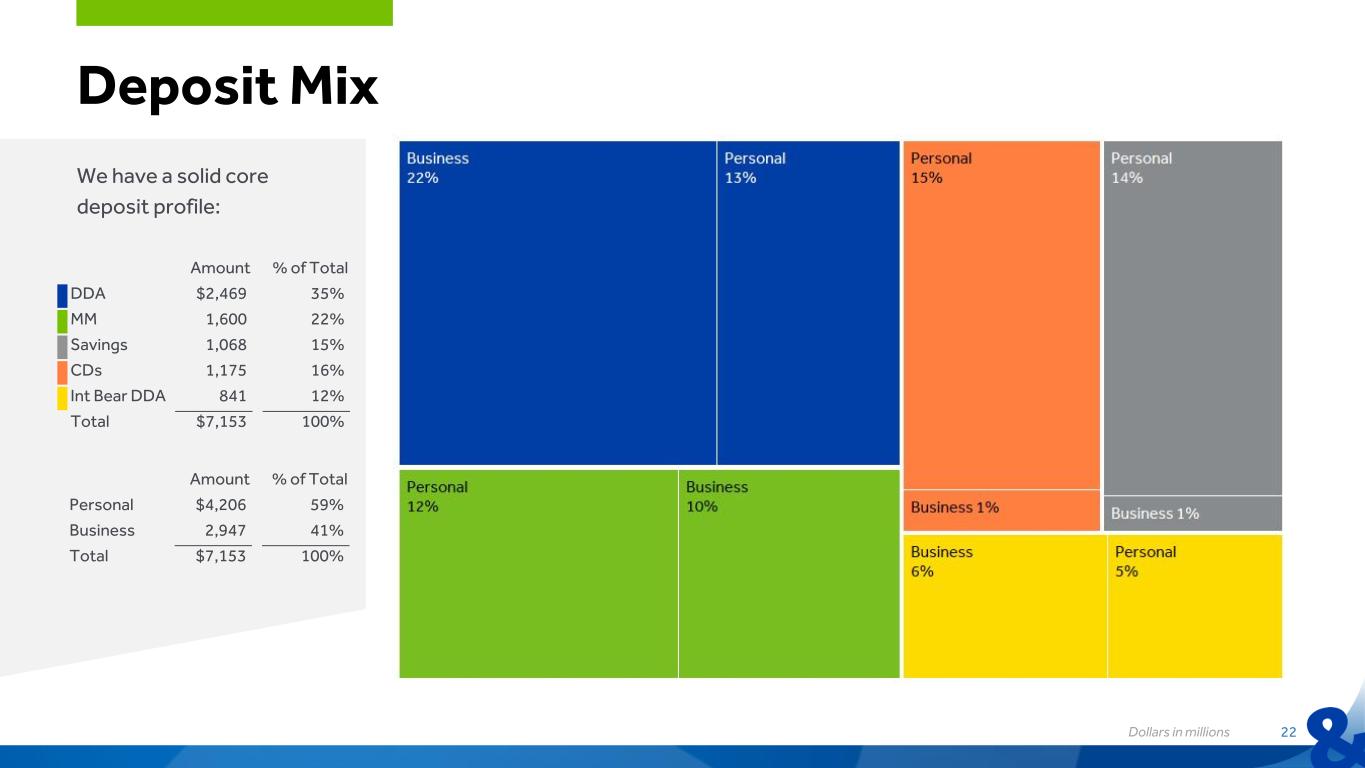
Deposit Mix We have a solid core deposit profile: Dollars in millions 22 Amount % of Total DDA $2,469 35% MM 1,600 22% Savings 1,068 15% CDs 1,175 16% Int Bear DDA 841 12% Total $7,153 100% Amount % of Total Personal $4,206 59% Business 2,947 41% Total $7,153 100%

Securities 23 • Securities portfolio is only 11% of total assets • 100% of securities portfolio is classified as available-for-sale • Average duration of 3.9 years at 1Q23 compared to 3.7 years at 4Q21 • AOCI of $69.4 million related to securities portfolio, if realized, would decrease CET1 ratio by 94 basis points from 13.10% to 12.16% SECURITIES MIX
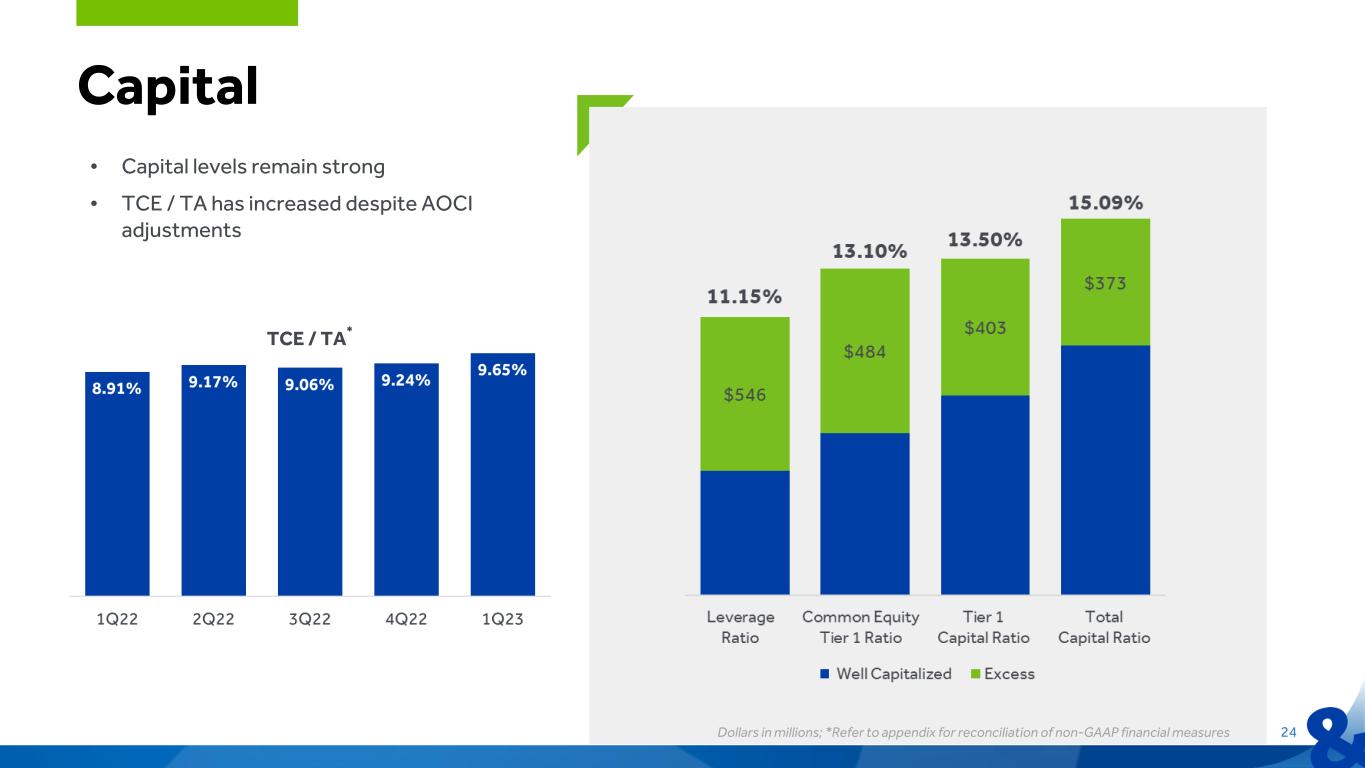
Capital Dollars in millions; *Refer to appendix for reconciliation of non-GAAP financial measures 24 TCE / TA* • Capital levels remain strong • TCE / TA has increased despite AOCI adjustments
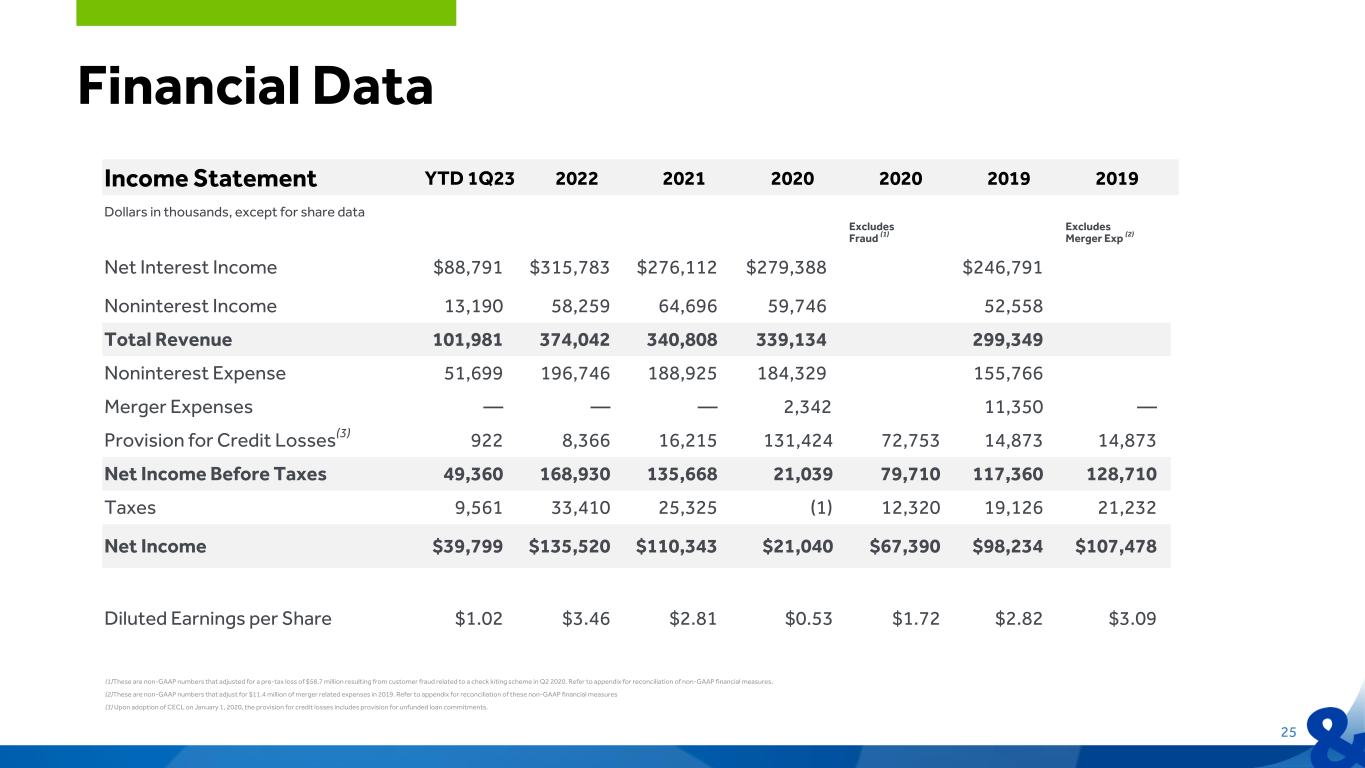
Financial Data (1)These are non-GAAP numbers that adjusted for a pre-tax loss of $58.7 million resulting from customer fraud related to a check kiting scheme in Q2 2020. Refer to appendix for reconciliation of non-GAAP financial measures. (2)These are non-GAAP numbers that adjust for $11.4 million of merger related expenses in 2019. Refer to appendix for reconciliation of these non-GAAP financial measures (3) Upon adoption of CECL on January 1, 2020, the provision for credit losses includes provision for unfunded loan commitments. Income Statement YTD 1Q23 2022 2021 2020 2020 2019 2019 Dollars in thousands, except for share data Excludes Fraud (1) Excludes Merger Exp (2) Net Interest Income $88,791 $315,783 $276,112 $279,388 $246,791 Noninterest Income 13,190 58,259 64,696 59,746 52,558 Total Revenue 101,981 374,042 340,808 339,134 299,349 Noninterest Expense 51,699 196,746 188,925 184,329 155,766 Merger Expenses — — — 2,342 11,350 — Provision for Credit Losses(3) 922 8,366 16,215 131,424 72,753 14,873 14,873 Net Income Before Taxes 49,360 168,930 135,668 21,039 79,710 117,360 128,710 Taxes 9,561 33,410 25,325 (1) 12,320 19,126 21,232 Net Income $39,799 $135,520 $110,343 $21,040 $67,390 $98,234 $107,478 Diluted Earnings per Share $1.02 $3.46 $2.81 $0.53 $1.72 $2.82 $3.09 25
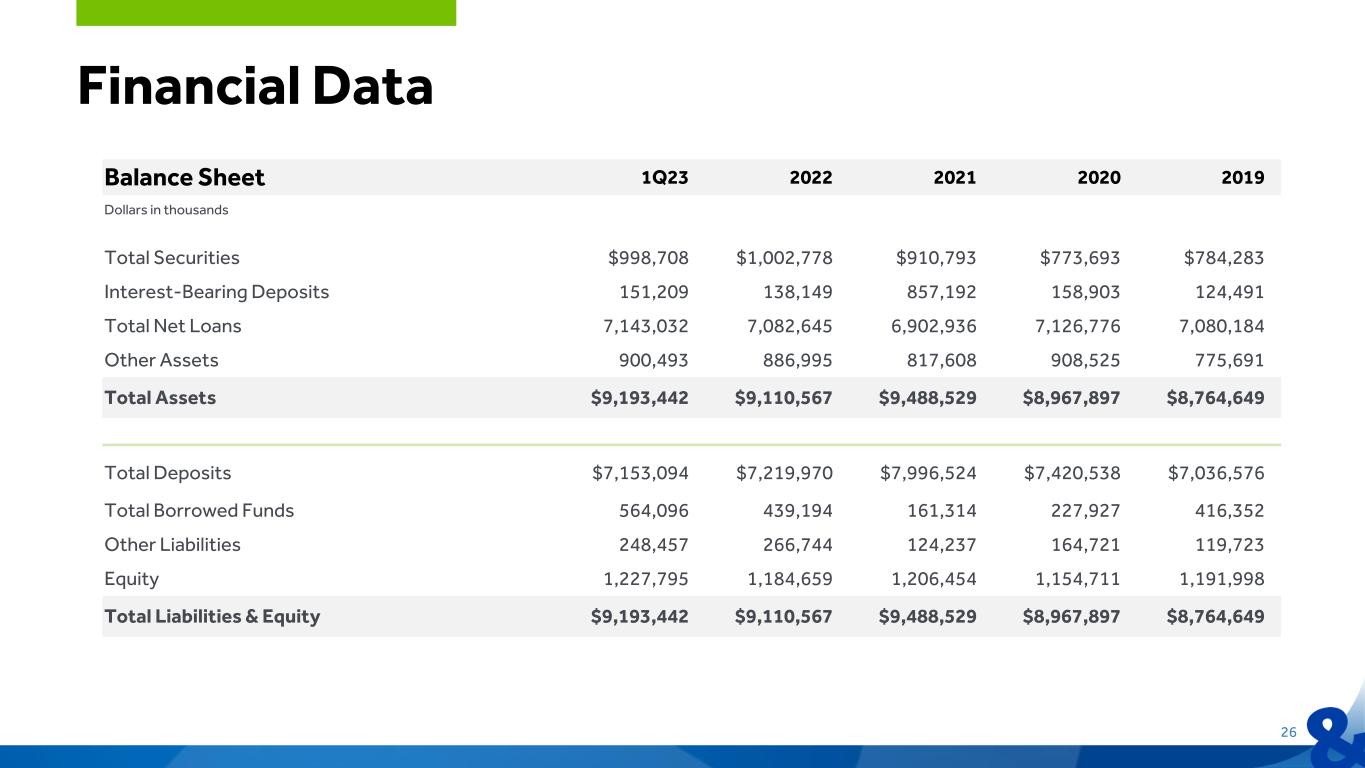
Financial Data 26 Balance Sheet 1Q23 2022 2021 2020 2019 Dollars in thousands Total Securities $998,708 $1,002,778 $910,793 $773,693 $784,283 Interest-Bearing Deposits 151,209 138,149 857,192 158,903 124,491 Total Net Loans 7,143,032 7,082,645 6,902,936 7,126,776 7,080,184 Other Assets 900,493 886,995 817,608 908,525 775,691 Total Assets $9,193,442 $9,110,567 $9,488,529 $8,967,897 $8,764,649 Total Deposits $7,153,094 $7,219,970 $7,996,524 $7,420,538 $7,036,576 Total Borrowed Funds 564,096 439,194 161,314 227,927 416,352 Other Liabilities 248,457 266,744 124,237 164,721 119,723 Equity 1,227,795 1,184,659 1,206,454 1,154,711 1,191,998 Total Liabilities & Equity $9,193,442 $9,110,567 $9,488,529 $8,967,897 $8,764,649

Net Interest Margin YTD 1Q23 2022 2021 2020 2019 Securities - FTE 2.51% 2.25% 2.18% 2.49% 2.64% Loans - FTE 5.81% 4.50% 3.84% 4.09% 4.95% Total Interest-earning Assets - FTE 5.39% 4.06% 3.37% 3.87% 4.71% Interest-bearing Deposits 1.30% 0.40% 0.20% 0.66% 1.40% Borrowings 5.13% 3.01% 1.49% 1.56% 2.76% Total Costing Liabilities 1.72% 0.49% 0.24% 0.72% 1.51% Net Interest Margin (FTE)(1) 4.32% 3.76% 3.22% 3.38% 3.64% Financial Data (1)Refer to appendix for reconciliation of non-GAAP financial measures 27

Financial Data 28 Loan Portfolio 1Q23 2022 2021 2020 2019 Dollars in thousands Commercial Real Estate $3,145,079 $3,128,187 $3,236,653 $3,244,974 $3,416,518 Commercial and Industrial 1,709,612 1,718,976 1,728,969 1,954,453 1,720,833 Commercial Construction 393,658 399,371 440,962 474,280 375,445 Total Commercial 5,248,349 5,246,534 5,406,584 5,673,707 5,512,796 Residential Mortgage 1,189,220 1,116,528 899,956 918,398 998,585 Home Equity 649,590 652,066 564,219 535,165 538,348 Installment and Other Consumer 119,843 124,896 107,928 80,915 79,033 Consumer Construction 44,062 43,945 21,303 17,675 8,390 Total Consumer 2,002,715 1,937,435 1,593,406 1,552,153 1,624,356 Total Portfolio Loans 7,251,064 7,183,969 6,999,990 7,225,860 7,137,152 Loans Held for Sale 81 16 1,522 18,528 5,256 Total Loans $7,251,145 $7,183,985 $7,001,512 $7,244,388 $7,142,408

Financial Data 29 Asset Quality 1Q23 2022 2021 2020 2019 Dollars in thousands Total Nonaccrual Loans $24,644 $19,052 $66,291 $146,774 $54,057 Nonaccrual Loans/Total Loans 0.34% 0.27% 0.95% 2.03% 0.76% Nonperforming Assets/Total Loans + OREO 0.38% 0.31% 1.13% 2.06% 0.81% YTD Net (Recoveries) Charge-offs/Average Loans (0.29%) 0.04% 0.49% 1.40% 0.22% Allowance for Credit Losses/Total Portfolio Loans 1.49% 1.41% 1.41% 1.63% 0.87% Allowance for Credit Losses/Nonaccrual Loans 439% 532% 149% 80% 115%

Financial Data 30 Capital 1Q23 2022 2021 2020 2019 Tier 1 Leverage 11.15% 11.06% 9.74% 9.43% 10.29% Common Equity Tier 1 – Risk-Based Capital 13.10% 12.81% 12.03% 11.33% 11.43% Tier 1 – Risk-Based Capital 13.50% 13.21% 12.43% 11.74% 11.84% Total – Risk-Based Capital 15.09% 14.73% 13.79% 13.44% 13.22% Tangible Common Equity/Tangible Assets(1) 9.65% 9.24% 9.08% 9.02% 9.68% (1)Refer to appendix for reconciliation of non-GAAP financial measures

1Q23 4Q22 3Q22 2Q22 1Q22 Tangible Common Equity (TCE)/Tangible Assets (non-GAAP) Total shareholders' equity $1,227,795 $1,184,659 $1,153,181 $1,178,358 $1,184,950 Less: goodwill and other intangible assets, net of deferred tax liability (377,405) (377,673) (377,961) (378,259) (378,557) Tangible common equity (non-GAAP) $850,390 $806,986 $775,220 $800,099 $806,393 Total assets $9,194,034 $9,110,567 $8,935,969 $9,103,814 $9,432,281 Less: goodwill and other intangible assets, net of deferred tax liability (377,405) (377,673) (377,961) (378,259) (378,557) Tangible assets (non-GAAP) $8,816,629 $8,732,894 $8,558,008 $8,725,555 $9,053,724 Tangible common equity to tangible assets (non-GAAP) 9.65 % 9.24 % 9.06 % 9.17 % 8.91 % Tangible common equity to tangible assets is a preferred industry measurement to evaluate capital adequacy. Efficiency Ratio (non-GAAP) Noninterest expense $51,699 $51,275 $49,633 $48,424 $47,414 Net interest income per consolidated statements of net income 88,791 89,058 83,798 75,194 67,733 Plus: taxable equivalent adjustment 555 532 521 506 493 Net interest income (FTE) (non-GAAP) $89,346 $89,590 $84,319 $75,700 $68,226 Noninterest income 13,190 15,643 14,760 12,630 15,226 Less: net gains on sale of securities — — (198) — — Net interest income (FTE) (non-GAAP) plus noninterest income $102,536 $105,233 $98,881 $88,330 $83,452 Efficiency ratio (non-GAAP) 50.42 % 48.73 % 50.19 % 54.82 % 56.82 % The efficiency ratio is noninterest divided by noninterest income plus net interest income, on an FTE basis (non-GAAP), which ensures comparability of net interest income arising from both taxable and tax-exempt sources and is consistent with industry practice. Net Interest Margin Rate (NIM) (FTE) (non-GAAP) Interest income and dividend income $110,903 $103,208 $89,835 $77,599 $70,109 Less: interest expense (22,112) (14,150) (6,037) (2,405) (2,376) Net interest income per consolidated statements of net income $88,791 $89,058 $83,798 $75,194 $67,733 Plus: taxable equivalent adjustment 555 532 521 506 493 Net interest income (FTE) (non-GAAP) $89,346 $89,590 $84,319 $75,700 $68,226 Net interest income (FTE) (annualized) $362,348 $355,438 $334,526 $303,633 $276,694 Average interest-earning assets $8,372,193 $8,220,689 $8,287,889 $8,535,384 $8,747,398 Net interest margin (FTE) (non-GAAP) 4.32 % 4.33 % 4.04 % 3.56 % 3.16 % The interest income on interest-earning assets, net interest income and net interest margin are presented on an FTE basis (non-GAAP). The FTE basis (non-GAAP) adjusts for the tax benefit of income on certain tax-exempt loans and securities and the dividend-received deduction for equity securities using the federal statutory tax rate of 21 percent for each period. We believe this to be the preferred industry measurement of net interest income that provides a relevant comparison between taxable and non-taxable sources of interest income. Appendix Definitions of GAAP to Non-GAAP Financial Measures 31

2020 2019 Excludes Fraud Excludes Merger Exp Net Income Excluding Nonrecurring items Net income $21,040 $98,234 Nonrecurring items 58,671 11,350 Tax effect of nonrecurring items (12,321) (2,106) Adjusted net income (non-GAAP) $67,390 $107,478 Diluted Earnings Per Share Adjusted net income (non-GAAP) $67,390 $107,478 Average shares outstanding - diluted 39,073 34,679 Diluted earnings per share (non-GAAP) $1.72 $3.09 Return on Average Assets (ROA) (non-GAAP) Adjusted net income (non-GAAP) $67,390 $107,478 Average total assets 9,152,747 7,435,536 Return on average assets (non-GAAP) 0.74 % 1.45 % Return on Average Shareholders' Equity (ROE) (non-GAAP) Adjusted net income (non-GAAP) $67,390 $107,478 Average total shareholders' equity 1,169,489 983,908 Return on average shareholders' equity (non-GAAP) 5.76 % 10.92 % Appendix Definitions of GAAP to Non-GAAP Financial Measures 32
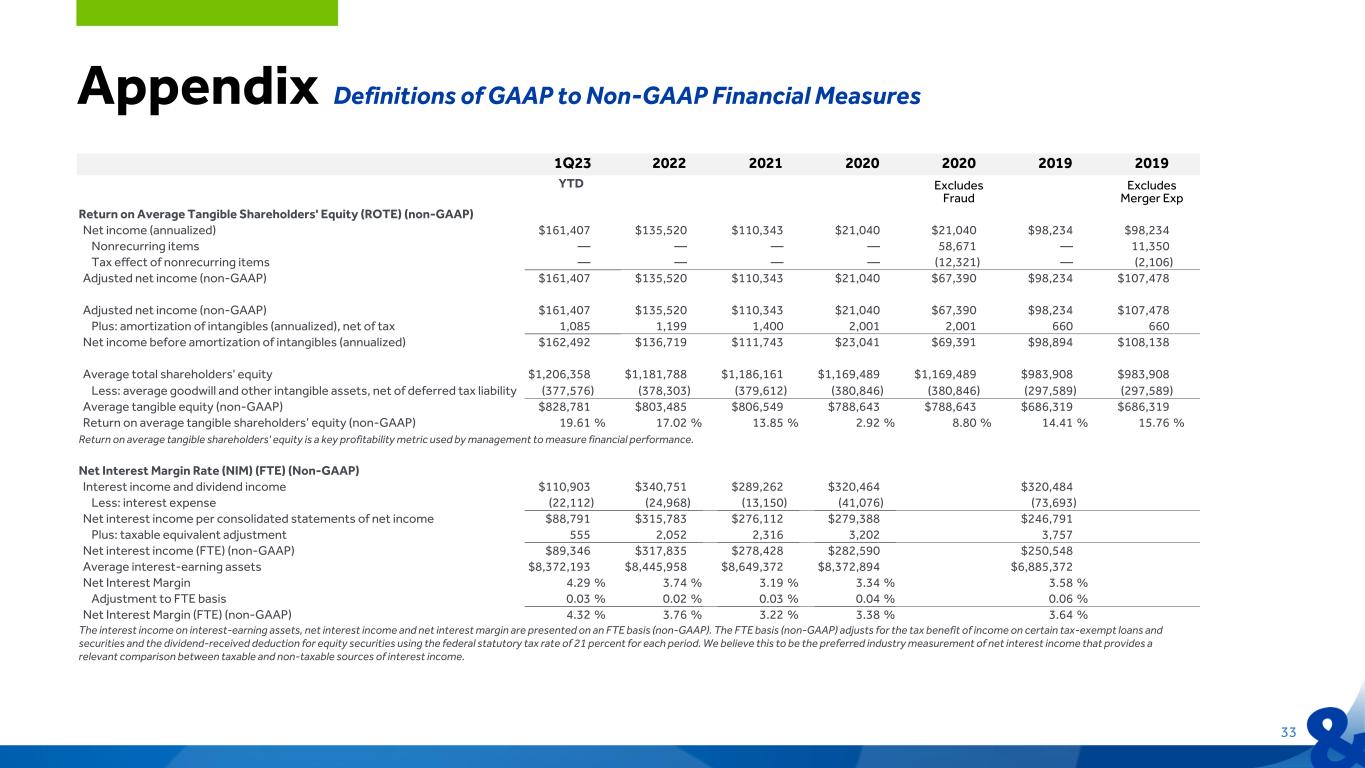
1Q23 2022 2021 2020 2020 2019 2019 YTD Excludes Fraud Excludes Merger Exp Return on Average Tangible Shareholders' Equity (ROTE) (non-GAAP) Net income (annualized) $161,407 $135,520 $110,343 $21,040 $21,040 $98,234 $98,234 Nonrecurring items — — — — 58,671 — 11,350 Tax effect of nonrecurring items — — — — (12,321) — (2,106) Adjusted net income (non-GAAP) $161,407 $135,520 $110,343 $21,040 $67,390 $98,234 $107,478 Adjusted net income (non-GAAP) $161,407 $135,520 $110,343 $21,040 $67,390 $98,234 $107,478 Plus: amortization of intangibles (annualized), net of tax 1,085 1,199 1,400 2,001 2,001 660 660 Net income before amortization of intangibles (annualized) $162,492 $136,719 $111,743 $23,041 $69,391 $98,894 $108,138 Average total shareholders' equity $1,206,358 $1,181,788 $1,186,161 $1,169,489 $1,169,489 $983,908 $983,908 Less: average goodwill and other intangible assets, net of deferred tax liability (377,576) (378,303) (379,612) (380,846) (380,846) (297,589) (297,589) Average tangible equity (non-GAAP) $828,781 $803,485 $806,549 $788,643 $788,643 $686,319 $686,319 Return on average tangible shareholders’ equity (non-GAAP) 19.61 % 17.02 % 13.85 % 2.92 % 8.80 % 14.41 % 15.76 % Return on average tangible shareholders' equity is a key profitability metric used by management to measure financial performance. Net Interest Margin Rate (NIM) (FTE) (Non-GAAP) Interest income and dividend income $110,903 $340,751 $289,262 $320,464 $320,484 Less: interest expense (22,112) (24,968) (13,150) (41,076) (73,693) Net interest income per consolidated statements of net income $88,791 $315,783 $276,112 $279,388 $246,791 Plus: taxable equivalent adjustment 555 2,052 2,316 3,202 3,757 Net interest income (FTE) (non-GAAP) $89,346 $317,835 $278,428 $282,590 $250,548 Average interest-earning assets $8,372,193 $8,445,958 $8,649,372 $8,372,894 $6,885,372 Net Interest Margin 4.29 % 3.74 % 3.19 % 3.34 % 3.58 % Adjustment to FTE basis 0.03 % 0.02 % 0.03 % 0.04 % 0.06 % Net Interest Margin (FTE) (non-GAAP) 4.32 % 3.76 % 3.22 % 3.38 % 3.64 % The interest income on interest-earning assets, net interest income and net interest margin are presented on an FTE basis (non-GAAP). The FTE basis (non-GAAP) adjusts for the tax benefit of income on certain tax-exempt loans and securities and the dividend-received deduction for equity securities using the federal statutory tax rate of 21 percent for each period. We believe this to be the preferred industry measurement of net interest income that provides a relevant comparison between taxable and non-taxable sources of interest income. Appendix Definitions of GAAP to Non-GAAP Financial Measures 33

1Q23 2022 2021 2020 2020 2019 2019 YTD Excludes Fraud Excludes Merger Exp PPNR/Average Assets (Non-GAAP) Income before taxes $49,360 $168,930 $135,668,114 $21,039 $117,360 $117,360 Plus: merger related expenses — — — — — 11,350 Plus: provision for credit losses 922 8,366 16,215,300 131,424 14,873 14,873 Total adjusted income before taxes (non-GAAP) 50,282 177,296 151,883,000 152,463 132,233 143,583 Total adjusted income before taxes (annualized) (non-GAAP) $203,921 $177,296 $151,883,000 $152,463 $132,233 $143,583 Average assets $9,126,981 $9,167,038 $9,375,850,209 $9,152,747 $7,435,536 $7,435,536 PPNR/Average Assets (non-GAAP) 2.23 % 1.93 % 1.62 % 1.67 % 1.78 % 1.93 % Pre-provision net revenue to average assets is income before taxes adjusted to exclude provision for credit losses. We believe this to be a preferred industry measurement to help evaluate our ability to fund credit losses or build capital. Tangible Common Equity (TCE)/Tangible Assets (non-GAAP) Total shareholders' equity $1,227,795 $1,184,659 $1,206,454,000 $1,154,711 $1,191,998 Less: goodwill and other intangible assets, net of deferred tax liability (377,405) (377,673) (378,871,445) (380,278) (380,247) Tangible common equity (non-GAAP) $850,390 $806,986 $827,583 $774,433 $811,751 Total assets $9,194,034 $9,110,567 $9,488,529,018 $8,967,897 $8,764,649 Less: goodwill and other intangible assets, net of deferred tax liability (377,405) (377,673) (378,871,445) (380,278) (380,247) Tangible assets (non-GAAP) $8,816,629 $8,732,894 $9,109,658 $8,587,619 $8,384,402 Tangible common equity to tangible assets (non-GAAP) 9.65 % 9.24 % 9.08 % 9.02 % 9.68 % Tangible common equity to tangible assets is a preferred industry measurement to evaluate capital adequacy. Provision for credit losses Provision $131,424 $131,424 Less: customer fraud — (58,671) Adjusted provision for credit losses $131,424 $72,753 YTD Net loan charge-offs/YTD Average loans Net charge-offs $103,379 $103,379 Less: customer fraud — (58,671) Adjusted net charge-offs $103,379 $44,708 Total average YTD loans $7,410,462 $7,410,462 Adjusted net loan charge-offs/YTD Average loans 1.40 % 0.60 % Appendix Definitions of GAAP to Non-GAAP Financial Measures 34Member FDIC
Christopher J. McComish Chief Executive Officer Mark Kochvar Chief Financial Officer First Quarter 2023


