Exhibit 99.1
S&T Bancorp, Inc
S&T Bancorp, Inc
Todd Brice
President and
Chief Executive Officer
Mark Kochvar
Sr. EVP and
Chief Financial Officer
S&T Bancorp, Inc
Forward-Looking Statement and Risk Factors
• This presentation contains certain forward-looking statements within the meaning of Section 27A of the Securities Act of 1933 and Section 21E of the Securities Exchange Act of 1934. Forward-looking statements include, among others, statements regarding trends, strategies, plans, beliefs, intentions, expectations, goals and opportunities. Forward-looking statements are typically identified by words or phrases such as believe, expect, anticipate, intend, estimate, assume, strategy, plan, outlook, outcome, continue, remain, trend and variations of such words and similar expressions, or future or conditional verbs such as will, would, should, could, may or similar expressions. Actual results and performance could differ materially from those anticipated by these forward-looking statements. Factors that could cause such a difference include, but are not limited to, general economic conditions, changes in interest rates, deposit flows, loan demand, asset quality, including real estate and other collateral values, and competition.
• S&T cautions that these forward-looking statements are subject to numerous assumptions, risks and uncertainties, which change over time. These forward-looking statements speak only as of the date hereof, and S&T assumes no duty to update forward-looking statements. Subsequent written or oral statements attributable to S&T or persons acting on its behalf are expressly qualified in their entirety by the cautionary statements contained herein and those in S&T’s reports previously and subsequently filed with the Securities and Exchange Commission.
3
S&T Bancorp, Inc
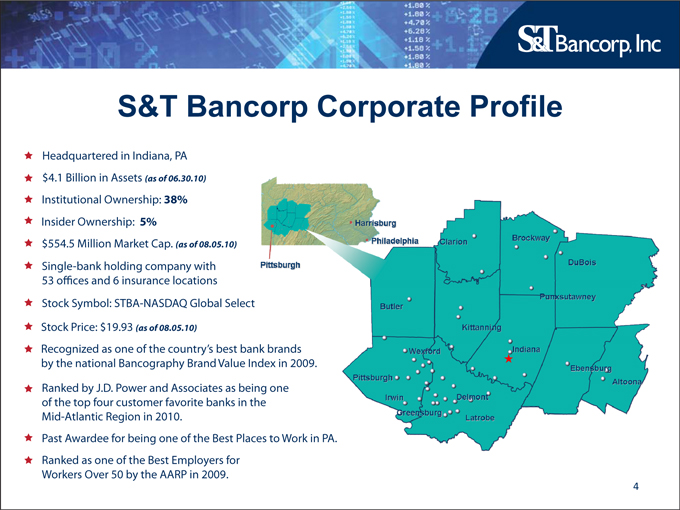
S&T Bancorp Corporate Profile
Headquartered in Indiana, PA
$4.1 Billion in Assets (as of 06.30.10)
Institutional Ownership: 38%
Insider Ownership: 5%
$554.5 Million Market Cap. (as of 08.05.10)
Single-bank holding company with 53 offices and 6 insurance locations
Stock Symbol: STBA-NASDAQ Global Select
Stock Price: $19.93 (as of 08.05.10)
Recognized as one of the country’s best bank brands by the national Bancography Brand Value Index in 2009.
Ranked by J.D.Po wer and Associates as being one of the top four customer favorite banks in the Mid-Atlantic Region in 2010.
Past Awardee for being one of the Best Places to Work in PA.
Ranked as one of the Best Employers for
Workers Over 50 by the AARP in 2009.
4
S&T Bancorp, Inc
Investor Highlights
•Historically High Performing Bank
•Experienced Management Team
•Relationship Banking Model
•Well-Positioned for Growth
5
S&T Bancorp, Inc
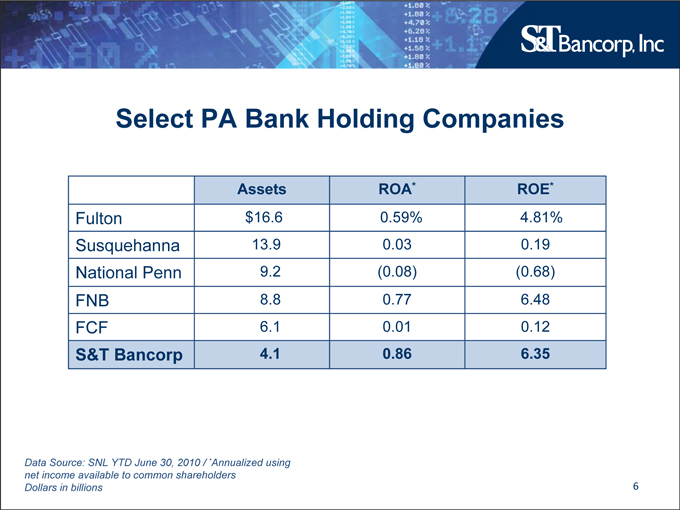
Select PA Bank Holding Companies
Assets ROA* ROE*
Fulton $16.6 0.59% 4.81%
Susquehanna 13.9 0.03 0.19
National Penn 9.2(0.08)(0.68)
FNB 8.8 0.77 6.48
FCF 6.1 0.01 0.12
S&T Bancorp 4.1 0.86 6.35
Data Source: SNL YTD June 30, 2010 / *Annualized using net income available to common shareholders
Dollars in billions
6
S&T Bancorp, Inc
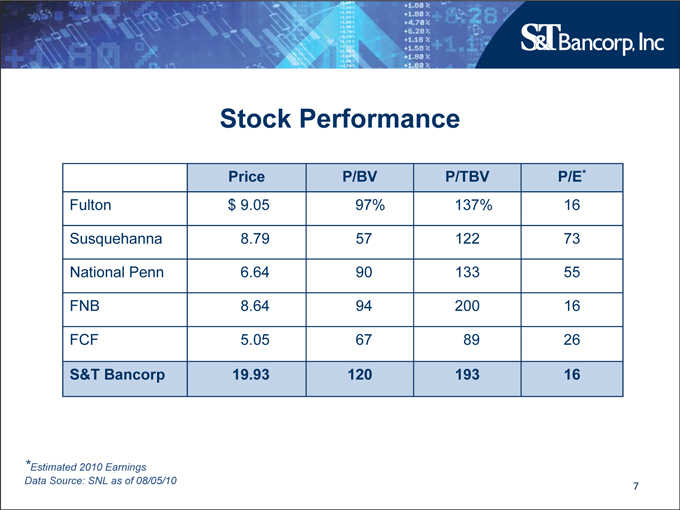
Stock Performance
Price P/BV P/TBV P/E*
Fulton $ 9.05 97% 137% 16
Susquehanna 8.79 57 122 73
National Penn 6.64 90 133 55
FNB 8.64 94 200 16
FCF 5.05 67 89 26
S&T Bancorp 19.93 120 193 16
*Estimated 2010 Earnings Data Source: SNL as of 08/05/10
7
S&T Bancorp, Inc
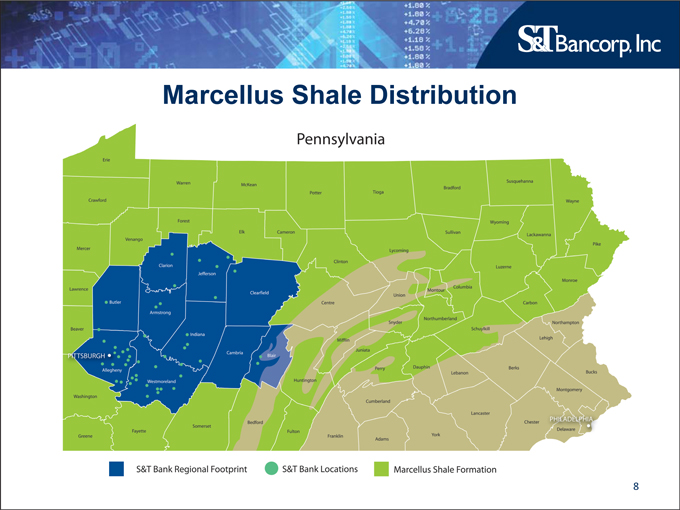
Marcellus Shale Distribution
Pennsylvania
S&T Bank Regional Footprint
S&T Bank Locations
Marcellus Share Formation
8
S&T Bancorp, Inc
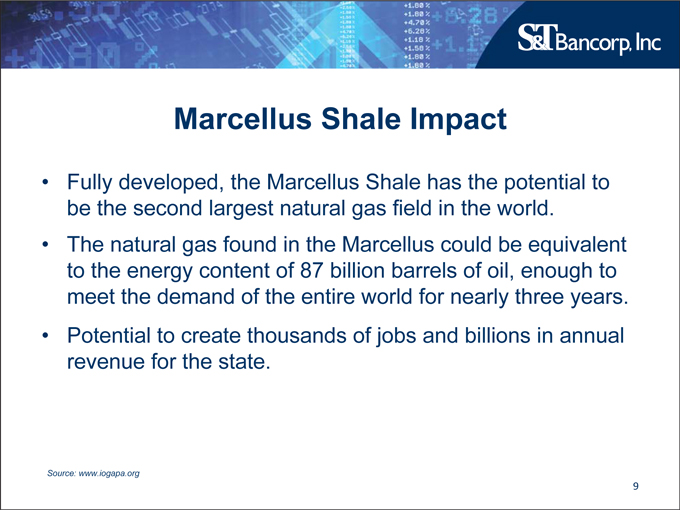
Marcellus Shale Impact
•Fully developed, the Marcellus Shale has the potential to be the second largest natural gas field in the world.
•The natural gas found in the Marcellus could be equivalent to the energy content of 87 billion barrels of oil, enough to meet the demand of the entire world for nearly three years.
•Potential to create thousands of jobs and billions in annual revenue for the state.
Source: www.iogapa.org
9
S&T Bancorp, Inc
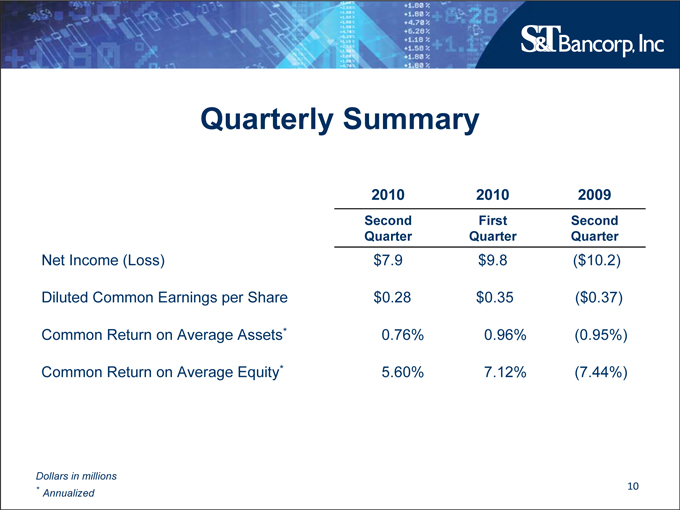
Quarterly Summary
2010 2010 2009
Second First Second
Quarter Quarter Quarter
Net Income (Loss) $7.9 $9.8($10.2)
Diluted Common Earnings per Share $0.28 $0.35($0.37)
Common Return on Average Assets* 0.76% 0.96%(0.95%)
Common Return on Average Equity* 5.60% 7.12%(7.44%)
Dollars in millions
* Annualized
10
S&T Bancorp, Inc
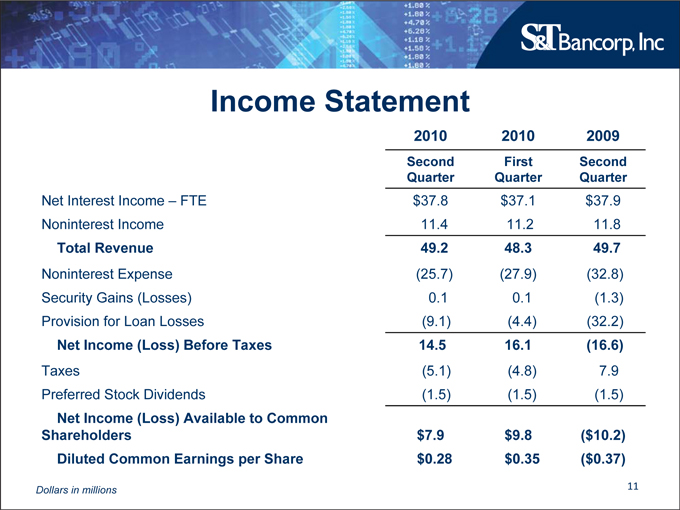
Income Statement
2010 2010 2009
Second First Second
Quarter Quarter Quarter
Net Interest Income – FTE $37.8 $37.1 $37.9
Noninterest Income 11.4 11.2 11.8
Total Revenue 49.2 48.3 49.7
Noninterest Expense(25.7)(27.9)(32.8)
Security Gains (Losses) 0.1 0.1(1.3)
Provision for Loan Losses(9.1)(4.4)(32.2)
Net Income (Loss) Before Taxes 14.5 16.1(16.6)
Taxes(5.1)(4.8) 7.9
Preferred Stock Dividends(1.5)(1.5)(1.5)
Net Income (Loss) Available to Common
Shareholders $7.9 $9.8($10.2)
Diluted Common Earnings per Share $0.28 $0.35($0.37)
Dollars in millions
11

S&T Bancorp, Inc
Net Interest Margin
2010 2010 2009
Second First Second
Quarter Quarter Quarter
Securities 4.20% 4.35% 4.30%
Loans 5.08 5.08 5.25
Total Earning Assets 5.05 5.02 5.15
Deposits 1.15 1.21 1.52
Borrowings 2.79 2.47 2.43
Total Costing Liabilities 1.27 1.33 1.66
Net Interest Margin—FTE 4.05 4.00 3.86
12
S&T Bancorp, Inc
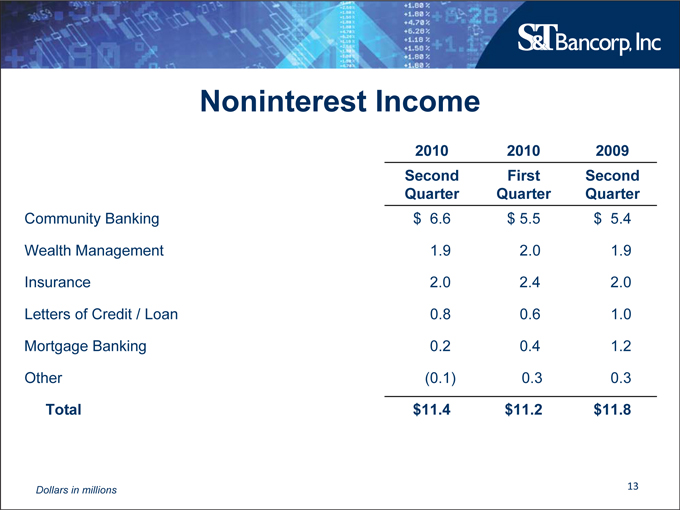
Noninterest Income
2010 2010 2009
Second First Second
Quarter Quarter Quarter
Community Banking $ 6.6 $ 5.5 $ 5.4
Wealth Management 1.9 2.0 1.9
Insurance 2.0 2.4 2.0
Letters of Credit / Loan 0.8 0.6 1.0
Mortgage Banking 0.2 0.4 1.2
Other(0.1) 0.3 0.3
Total $11.4 $11.2 $11.8
Dollars in millions
13
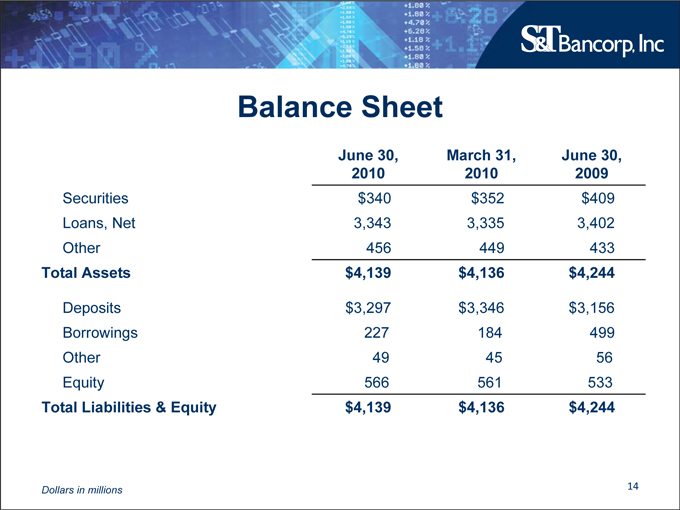
S&T Bancorp, Inc
Balance Sheet
June 30, March 31, June 30,
2010 2010 2009
Securities $340 $352 $409
Loans, Net 3,343 3,335 3,402
Other 456 449 433
Total Assets $4,139 $4,136 $4,244
Deposits $3,297 $3,346 $3,156
Borrowings 227 184 499
Other 49 45 56
Equity 566 561 533
Total Liabilities & Equity $4,139 $4,136 $4,244
Dollars in millions
14
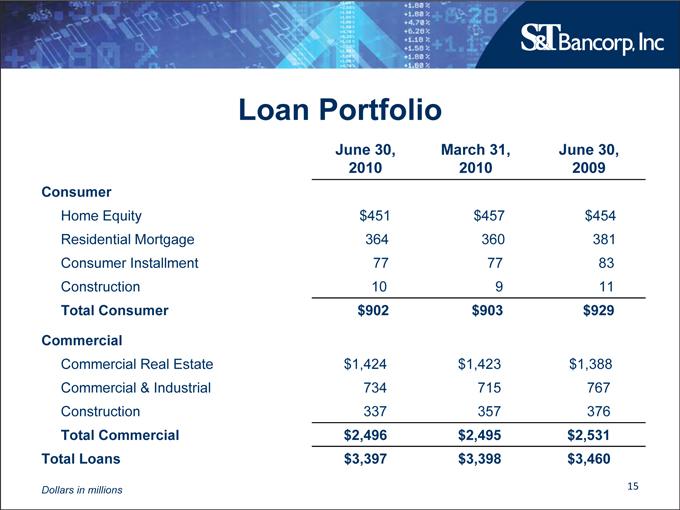
S&T Bancorp, Inc
Loan Portfolio
June 30, March 31, June 30,
2010 2010 2009
Consumer
Home Equity $451 $457 $454
Residential Mortgage 364 360 381
Consumer Installment 77 77 83
Construction 10 9 11
Total Consumer $902 $903 $929
Commercial
Commercial Real Estate $1,424 $1,423 $1,388
Commercial & Industrial 734 715 767
Construction 337 357 376
Total Commercial $2,496 $2,495 $2,531
Total Loans $3,397 $3,398 $3,460
Dollars in millions
15
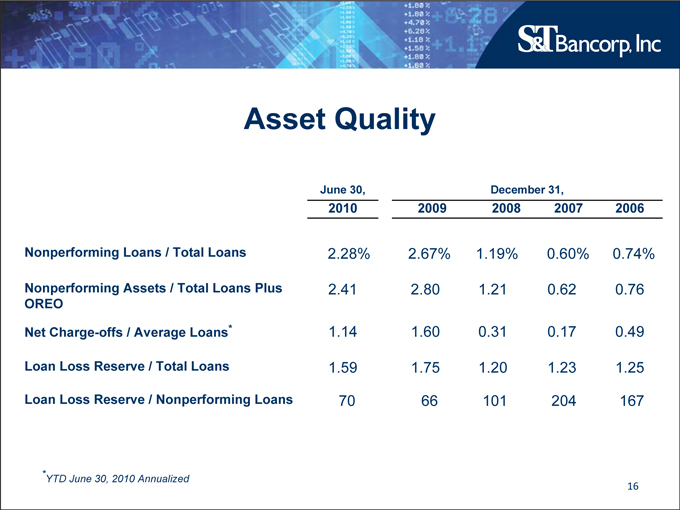
S&T Bancorp, Inc
Asset Quality
June 30, December 31,
2010 2009 2008 2007 2006
Nonperforming Loans / Total Loans 2.28% 2.67% 1.19% 0.60% 0.74%
Nonperforming Assets / Total Loans Plus 2.41 2.80 1.21 0.62 0.76
OREO
Net Charge-offs / Average Loans* 1.14 1.60 0.31 0.17 0.49
Loan Loss Reserve / Total Loans 1.59 1.75 1.20 1.23 1.25
Loan Loss Reserve / Nonperforming Loans 70 66 101 204 167
*YTD June 30, 2010 Annualized
16
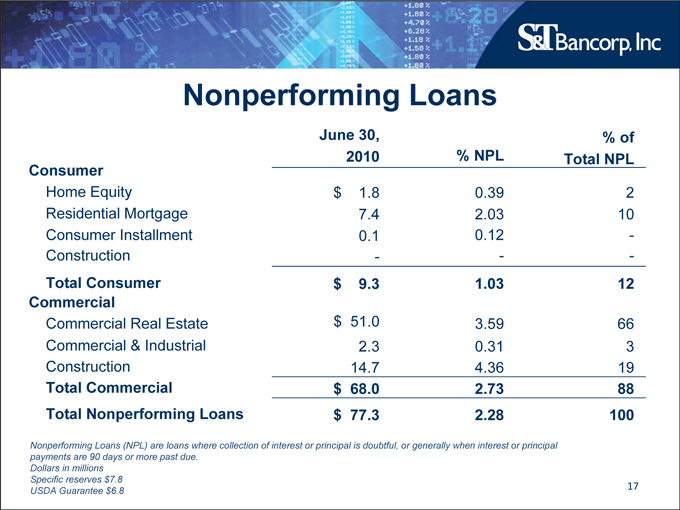
S&T Bancorp, Inc
Nonperforming Loans
June 30,% of
Consumer 2010% NPL Total NPL
Home Equity $ 1.8 0.39 2
Residential Mortgage 7.4 2.03 10
Consumer Installment 0.1 0.12 -
Construction——
Total Consumer $ 9.3 1.03 12
Commercial
Commercial Real Estate $ 51.0 3.59 66
Commercial & Industrial 2.3 0.31 3
Construction 14.7 4.36 19
Total Commercial $ 68.0 2.73 88
Total Nonperforming Loans $ 77.3 2.28 100
Nonperforming Loans (NPL) are loans where collection of interest or principal is doubtful, or generally when interest or principal payments are 90 days or more past due.
Dollars in millions Specific reserves $7.8 USDA Guarantee $6.8
17
S&T Bancorp, Inc
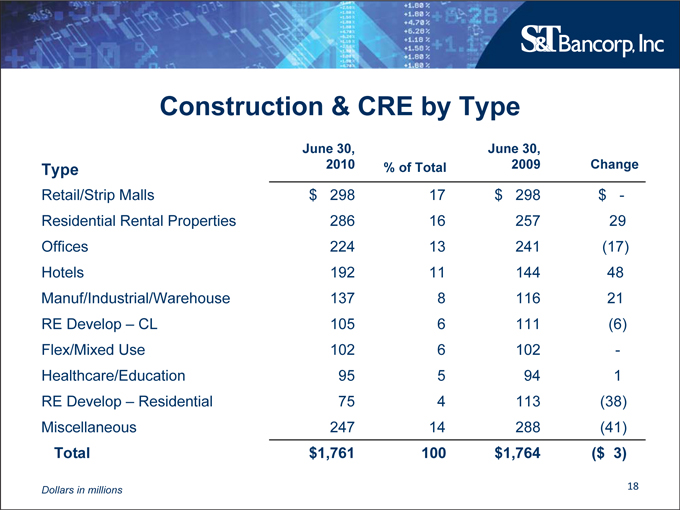
Construction & CRE by Type
June 30, June 30,
Type 2010% of Total 2009 Change
Retail/Strip Malls $ 298 17 $ 298 $ -
Residential Rental Properties 286 16 257 29
Offices 224 13 241(17)
Hotels 192 11 144 48
Manuf/Industrial/Warehouse 137 8 116 21
RE Develop – CL 105 6 111(6)
Flex/Mixed Use 102 6 102 -
Healthcare/Education 95 5 94 1
RE Develop – Residential 75 4 113(38)
Miscellaneous 247 14 288(41)
Total $1,761 100 $1,764($ 3)
Dollars in millions
18
S&T Bancorp, Inc
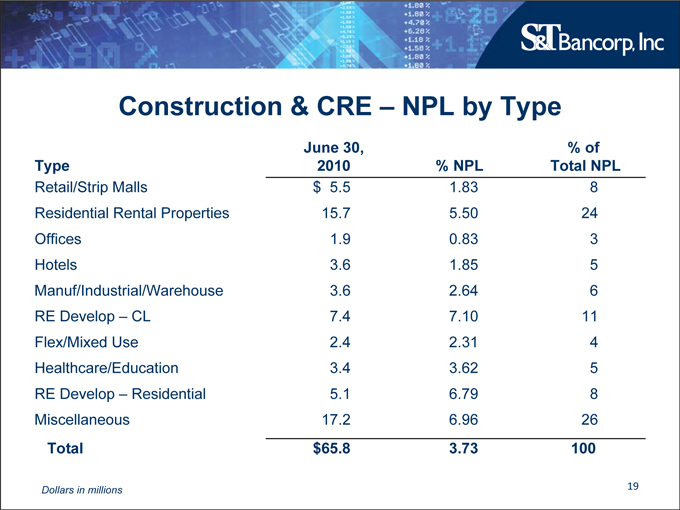
Construction & CRE – NPL by Type
June 30,% of
Type 2010% NPL Total NPL
Retail/Strip Malls $ 5.5 1.83 8
Residential Rental Properties 15.7 5.50 24
Offices 1.9 0.83 3
Hotels 3.6 1.85 5
Manuf/Industrial/Warehouse 3.6 2.64 6
RE Develop – CL 7.4 7.10 11
Flex/Mixed Use 2.4 2.31 4
Healthcare/Education 3.4 3.62 5
RE Develop – Residential 5.1 6.79 8
Miscellaneous 17.2 6.96 26
Total $65.8 3.73 100
Dollars in millions
19
S&T Bancorp, Inc
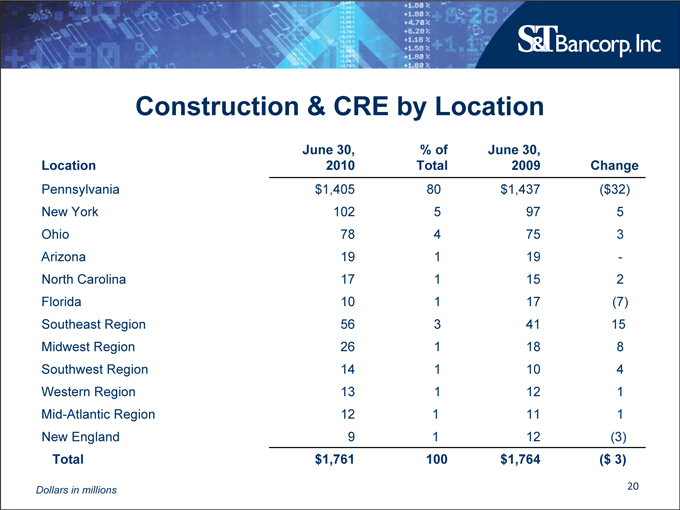
Construction & CRE by Location
June 30,% of June 30,
Location 2010 Total 2009 Change
Pennsylvania $1,405 80 $1,437($32)
New York 102 5 97 5
Ohio 78 4 75 3
Arizona 19 1 19 -
North Carolina 17 1 15 2
Florida 10 1 17(7)
Southeast Region 56 3 41 15
Midwest Region 26 1 18 8
Southwest Region 14 1 10 4
Western Region 13 1 12 1
Mid-Atlantic Region 12 1 11 1
New England 9 1 12(3)
Total $1,761 100 $1,764($ 3)
Dollars in millions
20
S&T Bancorp, Inc
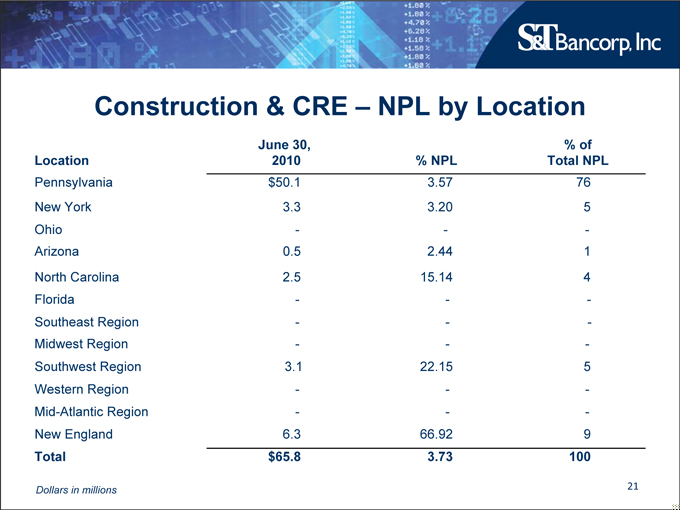
Construction & CRE – NPL by Location
June 30,% of
Location 2010% NPL Total NPL
Pennsylvania $50.1 3.57 76
New York 3.3 3.20 5
Ohio——
Arizona 0.5 2.44 1
North Carolina 2.5 15.14 4
Florida——
Southeast Region——
Midwest Region——
Southwest Region 3.1 22.15 5
Western Region——
Mid-Atlantic Region——
New England 6.3 66.92 9
Total $65.8 3.73 100
Dollars in millions
21
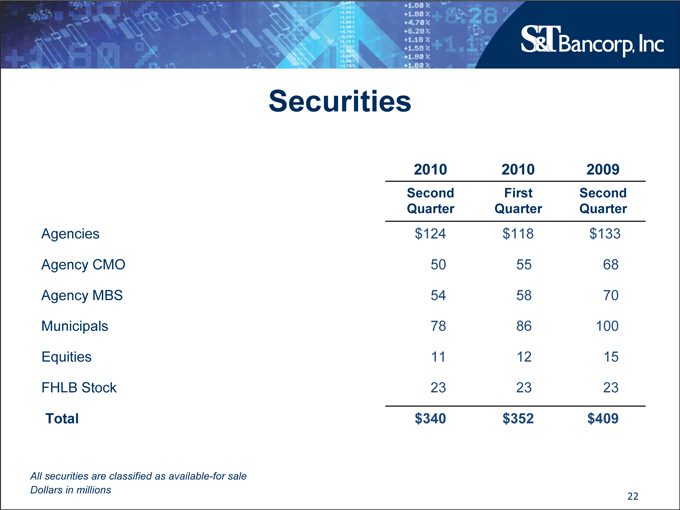
S&T Bancorp, Inc
Securities
2010 2010 2009
Second First Second
Quarter Quarter Quarter
Agencies $124 $118 $133
Agency CMO 50 55 68
Agency MBS 54 58 70
Municipals 78 86 100
Equities 11 12 15
FHLB Stock 23 23 23
Total $340 $352 $409
All securities are classified as available-for sale Dollars in millions
22
S&T Bancorp, Inc
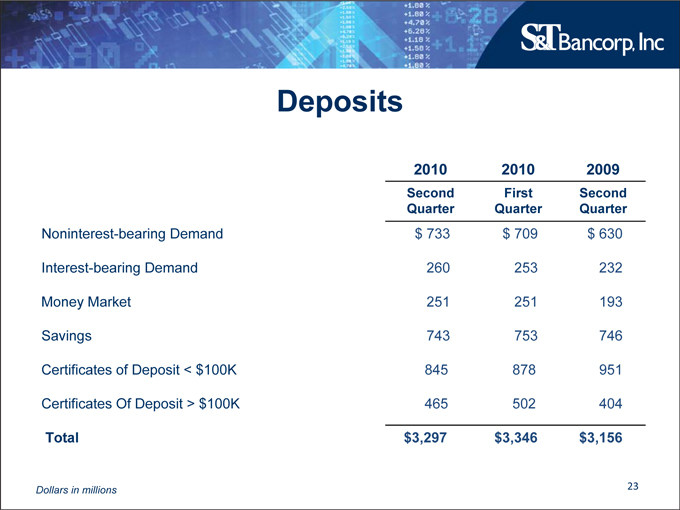
Deposits
2010 2010 2009
Second First Second
Quarter Quarter Quarter
Noninterest-bearing Demand $ 733 $ 709 $ 630
Interest-bearing Demand 260 253 232
Money Market 251 251 193
Savings 743 753 746
Certificates of Deposit < $100K 845 878 951
Certificates Of Deposit > $100K 465 502 404
Total $3,297 $3,346 $3,156
Dollars in millions
23

S&T Bancorp, Inc
Borrowings
2010 2010 2009
Second First Second
Quarter Quarter Quarter
Repos and FFP $ 44 $ 48 $ 97
Short-term Borrowings 52—195
Long-term Borrowings 40 45 116
Subordinated Debt 70 70 70
Trust Preferred 21 21 21
Total $227 $184 $499
Dollars in millions
24
S&T Bancorp, Inc
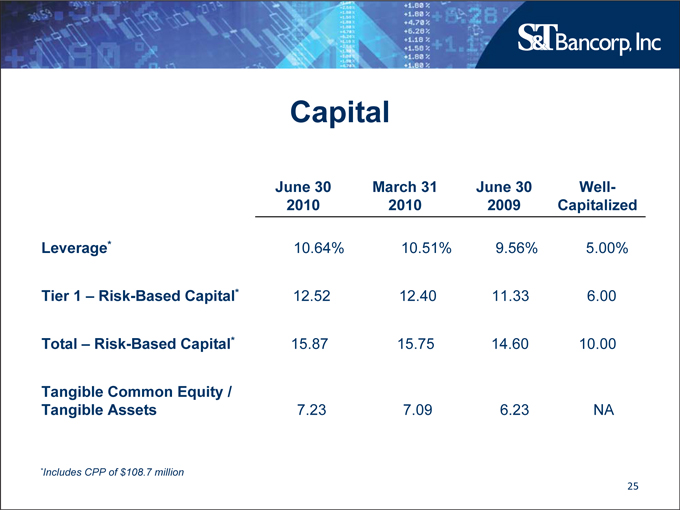
Capital
June 30 March 31 June 30 Well-
2010 2010 2009 Capitalized
Leverage* 10.64% 10.51% 9.56% 5.00%
Tier 1 – Risk-Based Capital* 12.52 12.40 11.33 6.00
Total – Risk-Based Capital* 15.87 15.75 14.60 10.00
Tangible Common Equity /
Tangible Assets 7.23 7.09 6.23 NA
*Includes CPP of $108.7 million
25
S&T Bancorp, Inc
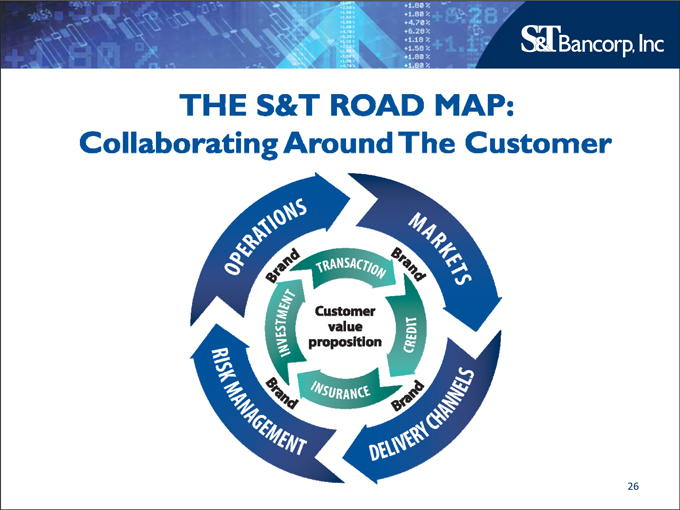
THE S&T ROAD MAP:
Collaborating Around The Customer
OPERATIONS
MARKETS
DELIVERY CHANNELS
RISK MANAGEMENT
Brand
Brand
Brand
Brand
TRANSACTION
CREDIT
INSURANCE
INVESTMENT
Customer Value Proposition
26
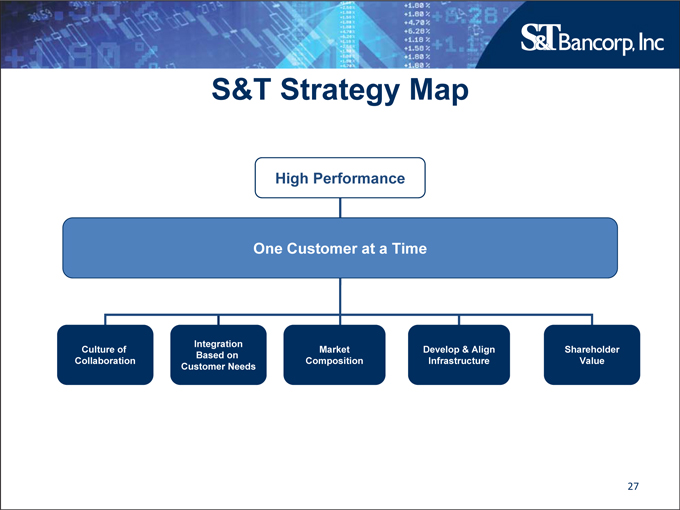
S&T Bancorp, Inc
S&T Strategy Map
High Performance
One Customer at a Time
Integration
Culture of Market Develop & Align Shareholder Based on Collaboration Composition Infrastructure Value Customer Needs
27

S&T Bancorp, Inc