 Exhibit 99.1 |
 |
 Forward Looking Statement and Risk Factor • This presentation contains certain forward-looking statements within the meaning of Section 27A of the Securities Act of 1933 and Section 21E of the Securities Exchange Act of 1934. Forward- looking statements include, among others, statements regarding trends, strategies, plans, beliefs, intentions, expectations, goals and opportunities. Forward looking statements are typically identified by words or phrases such as believe, expect, anticipate, intend, estimate, assume, strategy, plan, outlook, outcome, continue, remain, trend and variations of such words and similar expressions, or future or conditional verbs such as will, would, should, could, may or similar expressions. Actual results and performance could differ materially from those anticipated by these forward-looking statements. Factors that could cause such a difference include, but are not limited to, general economic conditions, changes in interest rates, deposit flows, loan demand, asset quality, including real estate and other collateral values, and competition. • S&T cautions that these forward-looking statements are subject to numerous assumptions, risks and uncertainties, which change over time. These forward-looking statements speak only as of the date hereof, and S&T assumes no duty to update forward-looking statements. Subsequent written or oral statements attributable to S&T or persons acting on its behalf are expressly qualified in their entirety by the cautionary statements contained herein and those in S&T’s reports previously and subsequently filed with the Securities and Exchange Commission. 3 |
 4 Non-GAAP Financial Measures • In addition to the results of operations presented in accordance with Generally Accepted Accounting Principles (GAAP), S&T management uses and this presentation contains or references, certain non-GAAP financial measures, such as net interest income on a fully taxable equivalent basis, that S&T believes provide information useful to investors in understanding our underlying operational performance and our business and performance trends as they facilitate comparisons with the performance of others in the financial services industry. Although S&T believes that these non-GAAP financial measures enhance investors’ understanding of S&T’s business and performance, these non-GAAP financial measures should not be considered an alternative to GAAP. The non-GAAP financial measures contained therein should be read in conjunction with the audited financial statements and analysis as presented in the Annual Report on Form 10-K as well as the unaudited financial statements and analyses as presented in the respective Quarterly Reports on Forms 10-Q for S&T Bancorp, Inc. and subsidiaries. |
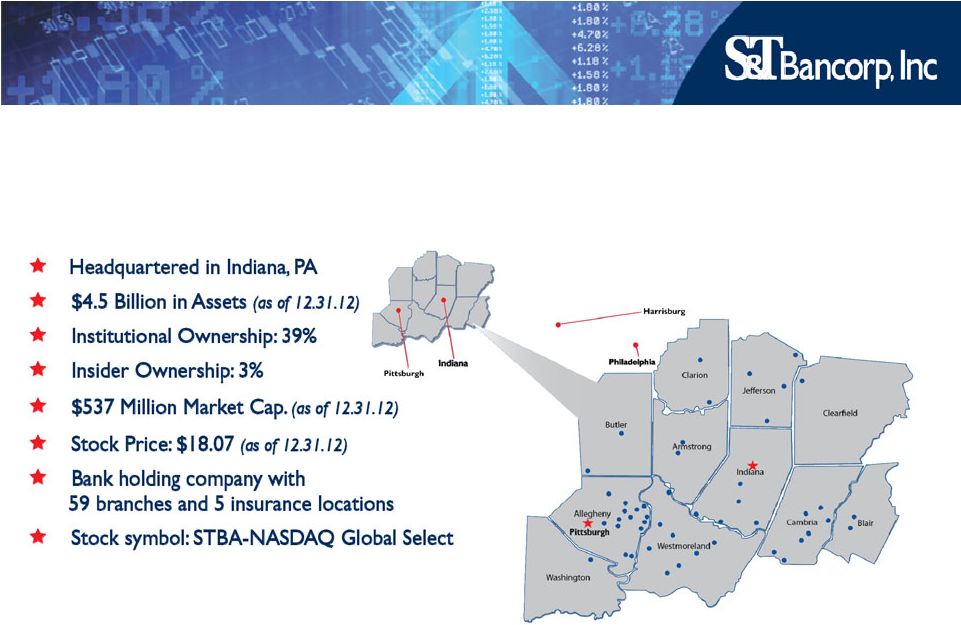 5 Corporate Profile |
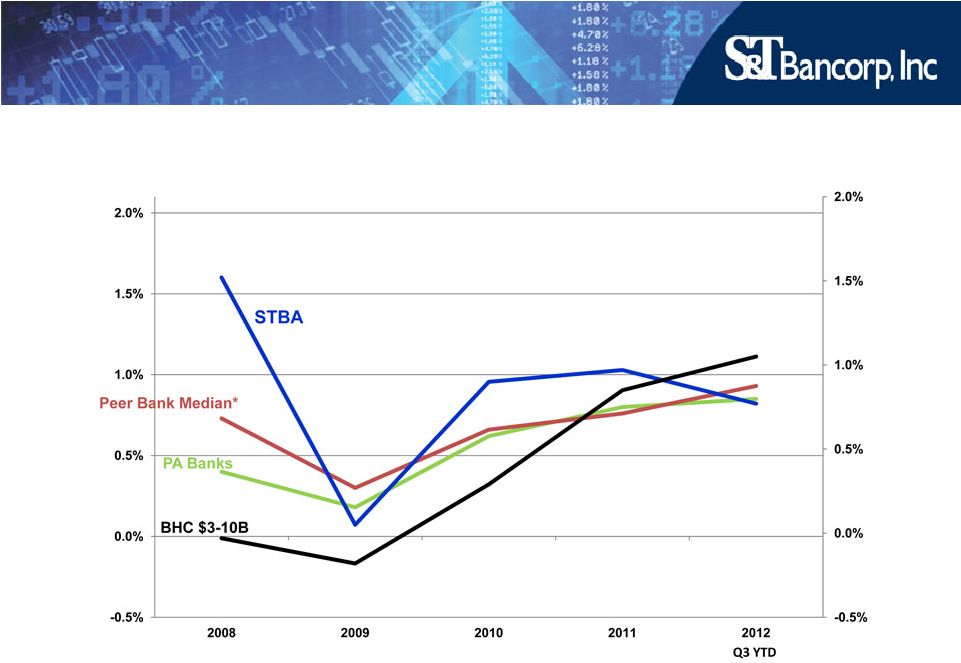 6 * 2012 peer banks per 2012 proxy statement Common Return on Assets |
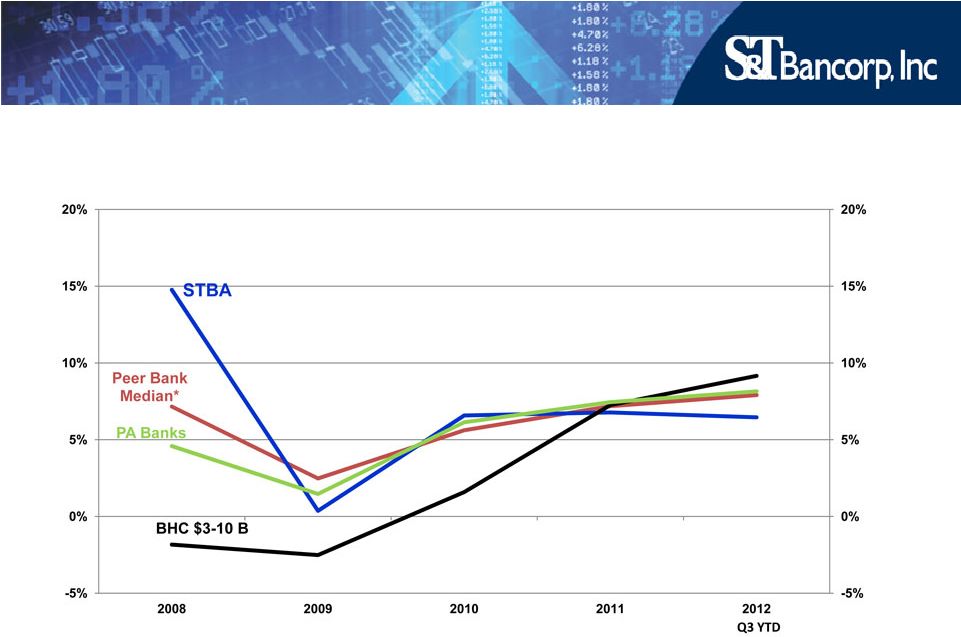 7 Common Return on Equity * 2012 peer banks per 2012 proxy statement |
 8 Summary 2012 2011 2010 Net Income Available to Common Shareholders $34.2 $39.7 $37.3 Diluted Earnings per Common Share $1.18 $1.41 $1.34 Common Return on Average Assets 0.79% 0.97% 0.90% Common Return on Average Equity 6.62% 6.78% 6.58% Dollars in millions |
 9 4 Lines of Business |
 Commercial Banking • 34 commercial lenders • 14 community lenders • Privately held companies with sales up to $150 million • $1-7 million preferred facility • Growing pipeline • Adding producers 10 |
 Retail Banking • Over 100,000 Households • 59 branches • Average branch size of $61.5 million • Home Center • 92% of customers highly satisfied • Over 70,000 customers enrolled in online banking • Over 9,500 customers enrolled in Mobile Banking 11 |
 Wealth Management • $1.7 billion AUM • 3 Divisions – S&T Trust – S&T Financial Services – RIA/Stewart Capital • Annual revenue of $9.8 million • Adding producers 12 |
 Insurance • Purchased Evergreen Insurance in 2002 • Full service agency – Commercial P&C (65%) – Group Life and Health (20%) – Personal Lines (15%) • Annual revenue of $5.2 million 13 |
 14 Quarterly Summary Dollars in millions, except per share data * Annualized 2012 2012 2011 Fourth Quarter Third Quarter Fourth Quarter Net Income Available to Common Shareholders $9.5 $12.6 $ 9.3 Diluted Earnings per Common Share $0.32 $ 0.43 $0.33 Common Return on Average Assets 0.86% 1.15% 0.91% Common Return on Average Equity 7.05% 9.56% 6.41% * * |
 15 Income Statement Dollars in millions, except per share data * Refer to appendix for reconciliation of Non-GAAP financial measures 2012 2012 2011 Fourth Quarter Third Quarter Fourth Quarter Net Interest Income – FTE * $35.4 $34.9 $35.1 Noninterest Income 11.5 12.5 11.6 Total Revenue 46.9 47.4 46.7 Noninterest Expense (29.7) (31.0) (26.7) Security Gains (Losses) - 2.2 - Provision for Loan Losses (4.2) (2.3) (2.3) Net Income Before Taxes 13.0 16.3 17.7 Taxes (3.5) (3.7) (5.5) Preferred Stock Dividends/Amortization - - (2.9) Net Income Available to Common Shareholders $ 9.5 $12.6 $9.3 Diluted Earnings per Common Share $ 0.32 $0.43 $ 0.33 |
 16 Balance Sheet Dollars in millions December 31, 2012 September 30, 2012 December 31, 2011 Securities $ 468 $ 432 $ 376 Interest Bearing Balances 257 285 209 Loans, Net 3,323 3,236 3,084 Other 479 469 451 Total Assets $4,527 $4,422 $4,120 Deposits $3,638 $3,594 $3,336 Borrowings 263 206 228 Other Liabilities 89 88 65 Equity 537 534 491 Total Liabilities & Equity $4,527 $4,422 $4,120 |
 17 Loan Portfolio Dollars in millions December 31, 2012 September 30, 2012 December 31, 2011 Consumer Home Equity $ 431 $ 447 $ 411 Residential Mortgage 427 410 359 Installment and Other Consumer 74 75 67 Construction 3 2 3 Total Consumer 935 934 840 Commercial Commercial Real Estate 1,452 1,439 1,415 Commercial & Industrial 792 748 686 Construction 168 158 189 Total Commercial 2,412 2,345 2,290 Total Portfolio Loans 3,347 3,279 3,130 Total Loans Held for Sale 22 3 3 Total Loans $ 3,369 $3,282 $ 3,133 |
 18 Asset Quality * QTD annualized December 31, September 31, December 31, 2012 2012 2011 Nonperforming Loans / Total Loans 1.63% 2.01% 1.79% Nonperforming Assets / Total Loans Plus OREO 1.66 2.06 1.92 Net Charge-offs / Average Loans* 0.49 0.33 0.64 Loan Loss Reserve / Total Loans 1.38 1.41 1.56 Loan Loss Reserve / Nonperforming Loans 85 70 87 |
 19 Nonperforming Loans 45.8 1.81 43.8 Total Commercial 6.5 4.03 6.8 Construction 7.6 0.81 6.4 Commercial & Industrial 31.7 2.10 30.6 Commercial Real Estate Commercial 10.3 1.20 11.2 Total Consumer 0.2 8.95 0.2 Construction - 0.05 - Installment and Other Consumer 7.2 1.70 7.3 Residential Mortgage $ 2.9 0.85 $ 3.7 Home Equity Dec. 31, 2011 Consumer % NPL Dec. 31, 2012 Total Nonperforming Loans $56.1 1.64% $55.0 Nonperforming Loans (NPL) are loans where collection of interest or principal is doubtful or generally when interest or principal payments are 90 days or more past due. Dollars in millions $ 5.5 $ 2.2 Specific Reserves |
 20 Net Interest Margin 2012 2012 2011 Fourth Quarter Third Quarter Fourth Quarter Securities - FTE 2.76% 2.89% 3.36% Interest Bearing Deposits-FTE 0.29 0.28 0.28 Loans - FTE 4.44 4.52 4.83 Total Earning Assets-FTE 3.97 4.00 4.45 Deposits 0.53 0.59 0.83 Borrowings 2.16 1.92 2.43 Total Costing Liabilities 0.64 0.70 0.93 Net Interest Margin – FTE * 3.51% 3.50% 3.79% * Refer to appendix for reconciliation of Non-GAAP financial measures |
 21 Noninterest Income Dollars in millions 2012 2012 2011 Fourth Quarter Third Quarter Fourth Quarter Service Charges on Deposit Accounts $ 2.6 $ 2.6 $ 2.6 Debit and Credit Card 2.7 3.0 2.7 Mortgage Banking 0.7 0.8 0.8 Wealth Management 2.4 2.4 2.0 Insurance 1.7 2.4 1.8 Other 1.4 1.3 1.7 Total $11.5 $12.5 $11.6 |
 22 Securities Dec.31, 2012 Sept. 30, 2012 Dec. 31, 2011 Agencies $212 $193 $143 Agency CMO 58 60 65 Agency MBS 61 54 49 Municipals 113 99 89 Equities 10 9 12 FHLB Stock 14 17 18 Total $468 $432 $376 All securities are classified as available-for sale Dollars in millions |
 23 Deposits Dollars in millions Dec. 31, 2012 Sept. 30, 2012 Dec. 31, 2011 Noninterest-bearing Demand $ 961 $ 928 $ 819 Interest-bearing Demand 317 322 283 Money Market 361 317 278 Savings 966 949 803 Certificates of Deposit < $100K 665 737 795 Certificates Of Deposit > $100K 368 341 358 Total $3,638 $3,594 $3,336 |
 24 Capital Ratios Dec. 31, 2012 Sept. 30, 2012 Dec. 31, 2011 Well- Capitalized Leverage 9.31% 9.27% 9.17% 5.00% Tier 1 – Risk-Based Capital 11.98 12.01 11.63 6.00 Total – Risk-Based Capital 15.39 15.45 15.20 10.00 Tangible Common Equity / Tangible Assets * 8.20 8.32 8.09 NA * Refer to appendix for reconciliation of Non-GAAP financial measures |
 Growth – Merger & Acquisition Activity • 2012 - Gateway Bank of Pennsylvania • 2012 - Mainline Bancorp • 2008 – IBT Bancorp • 2002 - Peoples Financial Corp • 1997 - Peoples Bank of Unity • 1991 - Atlantic Financial Savings Bank • 1991 - Vanguard Savings Bank 25 |
 26 Merger Overview S&T Bancorp, Inc. Mainline Bancorp, Inc. Gateway Bank of PA Total Assets $4,526.7 $236.2 $132.3 Gross Loans 3,369.1 129.5 99.1 Total Deposits 3,638.4 206.0 105.4 Total Equity 537.4 21.1 16.0 Total Branches 49 8 2 S&T Bancorp as of 12/31/12; Mainline and Gateway as of merger dates, 3/09/12 and 8/10/12 respectively. In millions, except per share data |
 27 The Right Size • Big Enough to: – Provide full complement of products and services – Access technology – Access Capital Markets – Attract talent – Expand – Mergers and Acquisitions/DeNovo • Small Enough to: – Stay close to our customers – Understand our markets – Be responsive |
 2012 Fourth Quarter 2012 Third Quarter 2011 Fourth Quarter Interest Income per Consolidated Statements of Income $38.9 $38.8 $40.2 Adjustment to Fully Taxable-equivalent Basis 1.1 1.1 1.1 Interest Income Adjusted to Fully Taxable-equivalent Basis 40.0 39.9 41.3 Interest Expense per Consolidated Statements of Income 4.6 5.0 6.2 Net Interest Income Adjusted to Fully Taxable- equivalent Basis (non-GAAP) $35.4 $34.9 $35.1 APPENDIX – Non-GAAP Measures Dollars in millions 28 |
 2012 2012 2011 Fourth Quarter Third Quarter Fourth Quarter Securities 2.34% 2.44% 2.92% Adjustment to Fully Taxable-equivalent Basis 0.42 0.45 0.44 Securities Adjusted to Fully Taxable-equivalent Basis 2.76 2.89 3.36 Interest-bearing Deposits 0.29 0.28 0.28 Adjustment to Fully Taxable-equivalent Basis 0.00 0.00 0.00 Interest-bearing Deposits Adjusted to Fully Taxable-equivalent Basis 0.29 0.28 0.28 Loans 4.40 4.48 4.79 Adjustment to Fully Taxable-equivalent Basis 0.04 0.04 0.04 Loans Adjusted to Fully Taxable-equivalent Basis 4.44 4.52 4.83 Total Earning Assets 3.89 3.92 4.37 Adjustment to Fully Taxable-Equivalent Basis 0.08 0.08 0.08 Total Earning Assets Adjusted to Fully Taxable-equivalent Basis 3.97 4.00 4.45 Net Interest Margin 3.43 3.41 3.69 Adjustment to Fully Taxable-Equivalent Basis 0.08 0.09 0.10 Net Interest Margin Adjusted to Fully Taxable-equivalent Basis 3.51 3.50 3.79 APPENDIX – Non-GAAP Measures /cont./ 29 |
 Dec. 31, 2012 Sept. 30, 2012 Dec. 31, 2011 Tangible Common Equity/Tangible Assets Common Equity/Assets (GAAP Basis) 11.87% 12.08% 11.91% Effect of Excluding Intangible Assets -3.67% -3.76% -3.82% Tangible Common Equity/Tangible Assets 8.20% 8.32% 8.09% APPENDIX – Non-GAAP Measures /cont./ 30 |
 |