 2013 Annual Meeting James Miller Chairman Exhibit 99.1 |
 Todd Brice President & CEO |
 Forward Looking Statement and Risk Factor • This presentation contains certain forward-looking statements within the meaning of Section 27A of the Securities Act of 1933 and Section 21E of the Securities Exchange Act of 1934. Forward- looking statements include, among others, statements regarding trends, strategies, plans, beliefs, intentions, expectations, goals and opportunities. Forward looking statements are typically identified by words or phrases such as believe, expect, anticipate, intend, estimate, assume, strategy, plan, outlook, outcome, continue, remain, trend and variations of such words and similar expressions, or future or conditional verbs such as will, would, should, could, may or similar expressions. Actual results and performance could differ materially from those anticipated by these forward-looking statements. Factors that could cause such a difference include, but are not limited to, general economic conditions, changes in interest rates, deposit flows, loan demand, asset quality, including real estate and other collateral values, and competition. • S&T cautions that these forward-looking statements are subject to numerous assumptions, risks and uncertainties, which change over time. These forward-looking statements speak only as of the date hereof, and S&T assumes no duty to update forward-looking statements. Subsequent written or oral statements attributable to S&T or persons acting on its behalf are expressly qualified in their entirety by the cautionary statements contained herein and those in S&T’s reports previously and subsequently filed with the Securities and Exchange Commission. 3 |
 4 Non-GAAP Financial Measures • In addition to the results of operations presented in accordance with Generally Accepted Accounting Principles (GAAP), S&T management uses and this presentation contains or references, certain non-GAAP financial measures, such as net interest income on a fully taxable equivalent basis, that S&T believes provide information useful to investors in understanding our underlying operational performance and our business and performance trends as they facilitate comparisons with the performance of others in the financial services industry. Although S&T believes that these non-GAAP financial measures enhance investors’ understanding of S&T’s business and performance, these non-GAAP financial measures should not be considered an alternative to GAAP. The non-GAAP financial measures contained therein should be read in conjunction with the audited financial statements and analysis as presented in the Annual Report on Form 10-K as well as the unaudited financial statements and analyses as presented in the respective Quarterly Reports on Forms 10-Q for S&T Bancorp, Inc. and subsidiaries. |
 Todd Brice President & CEO |
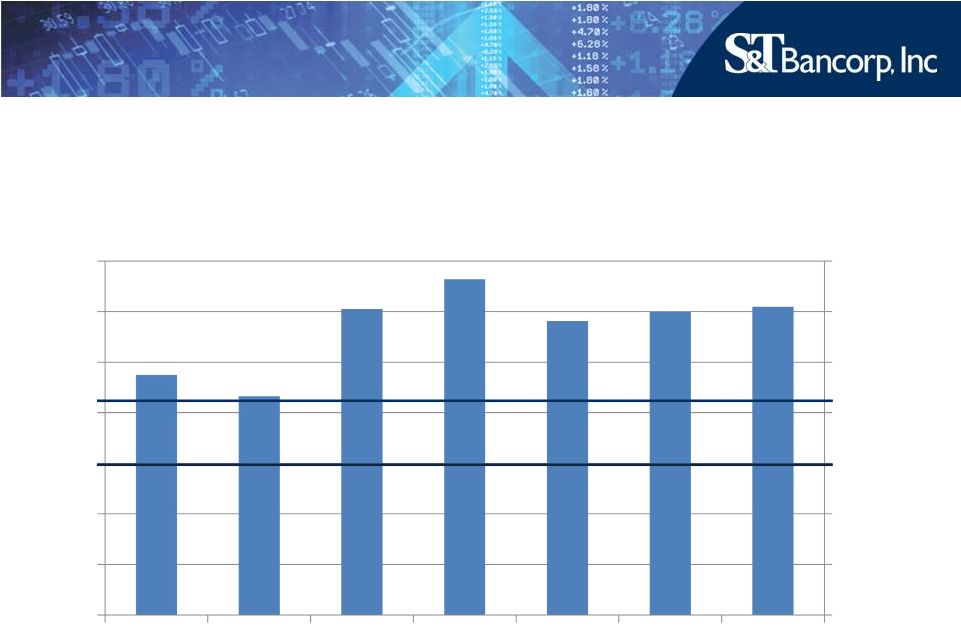
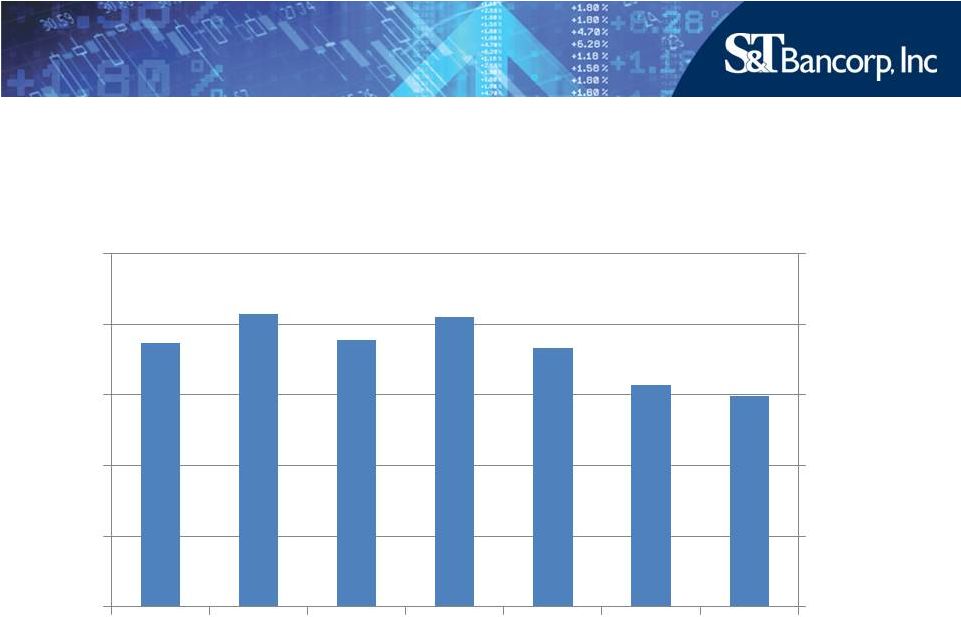 6 Challenges and Opportunities – NIM * Refer to appendix for reconciliation of Non-GAAP financial measures. Net Interest Margin- FTE * 4.50% 2.00% 2.50% 3.00% 3.50% 4.00% 4.50% 2.00% 2.50% 3.00% 3.50% 4.00% 2007 1Q 2013 2012 2011 2010 2009 2008 |
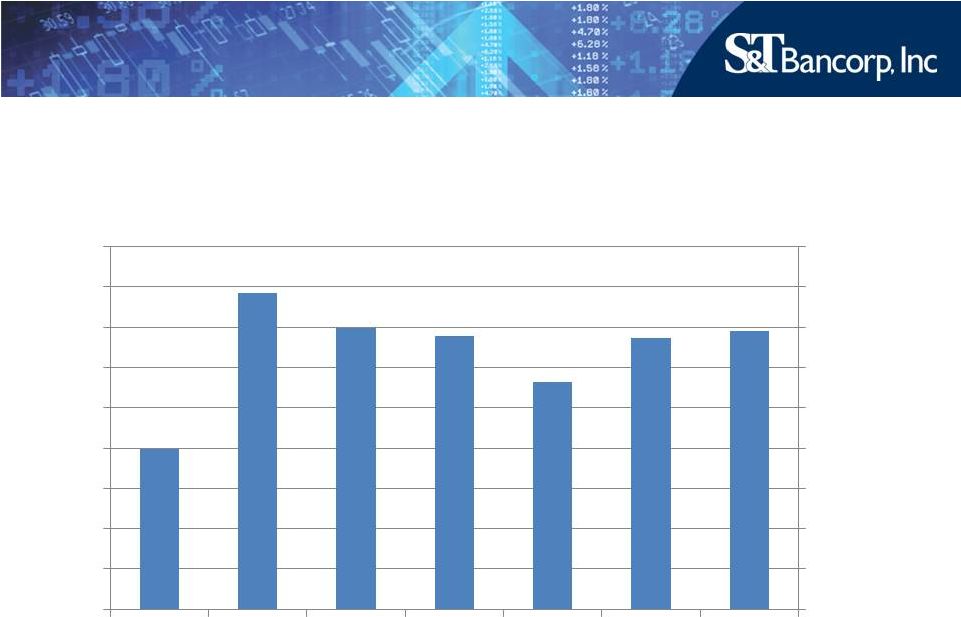 7 Challenges and Opportunities – Loan Growth $ in millions Total Loans $3,800 $2,200 $2,200 $2,400 $2,600 $2,800 $3,000 $3,200 $3,400 $3,600 $3,800 $2,200 $2,200 $2,400 $2,600 $2,800 $3,000 $3,200 $3,400 $3,600 2007 2008 2009 2010 2011 1Q 2013 2012 |
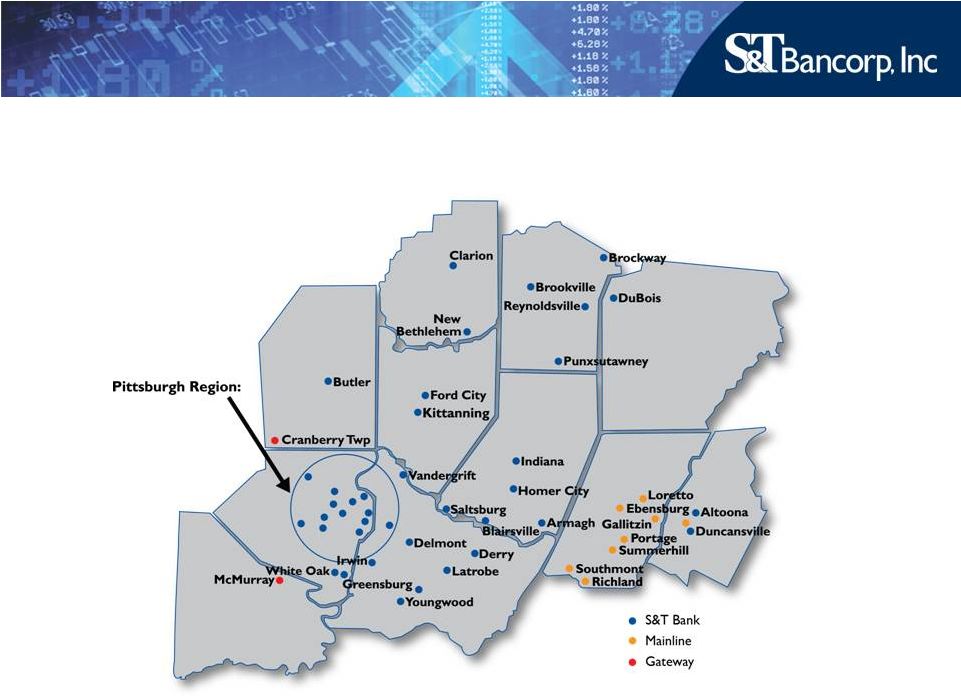 8 Mainline and Gateway Mergers |
 Growth – Merger & Acquisition Activity • 2012 - Gateway Bank of Pennsylvania $ 105 • 2012 - Mainline Bancorp 206 • 2008 - IBT Bancorp 793 • 2002 - Peoples Financial Corp 295 • 1998 - Branch Purchase from Mellon 39 • 1997 - Peoples Bank of Unity 288 • 1991 - Atlantic Financial Savings Bank 100 • 1991 - Vanguard Savings Bank 112 9 Assets/Deposits Acquired (in millions) $1,938 |
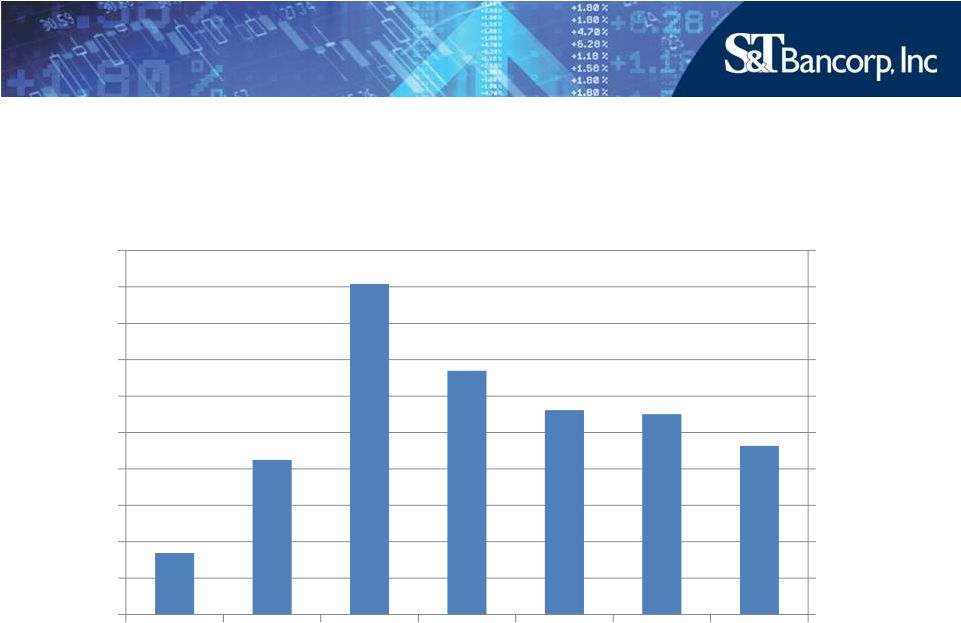 10 Challenges and Opportunities – Asset Quality $ in millions $100 $90 $80 $70 $60 $50 $40 $30 $20 $10 $0 2007 2008 2009 2010 2011 2012 1Q 2013 $100 $90 $80 $70 $60 $50 $40 $30 $20 $10 $0 Non-Performing Loans |
 Mark Kochvar Sr. EVP & CFO |
 12 Challenges and Opportunities – Capital Current Well-Capitalized Requirement Proposed Well-Capitalized Requirement Tier 1 Capital Ratio 14% 12% 10% 8% 6% 4% 2% 0% 2007 2008 2009 2010 2011 2012 1Q 2013 0% 2% 4% 6% 8% 10% 12% 14% |
 13 Quarterly Summary 2013 2012 2012 First Quarter Fourth Quarter First Quarter Net Income Available to Common Shareholders $12.3 $9.5 $3.5 Diluted Earnings per Common Share $0.41 $0.32 $0.12 Common Return on Average Assets 1.12% 0.86% 0.34% Common Return on Average Equity 9.25% 7.05% 2.82% Dollars in millions, except per share data * Annualized * * |
 14 First Quarter 2013 Highlights • Improved Loan Demand and Net Growth • Improved Asset Quality • Sale of Merchant Card Servicing Business |
 Net Interest Margin Adjustment to Fully Taxable Equivalent Basis Net Interest Margin Adjusted to Fully Taxable-Equivalent Basis First Quarter 2013 3.37% 0.12% 3.49% Full Year 2012 3.46 0.11 3.57 Full Year 2011 3.72 0.11 3.83 Full Year 2010 3.93 0.12 4.05 Full Year 2009 3.76 0.13 3.89 Full Year 2008 3.93 0.14 4.07 Full Year 2007 3.72 0.15 3.87 APPENDIX – Non-GAAP Measures 15 |
 2013 First Quarter 2012 Fourth Quarter 2012 First Quarter Interest Income per Consolidated Statements of Income $37.8 $38.9 $39.1 Adjustment to Fully Taxable-equivalent Basis 1.2 1.1 1.2 Interest Income Adjusted to Fully Taxable-equivalent Basis 39.0 40.0 40.3 Interest Expense per Consolidated Statements of Income 4.2 4.6 5.8 Net Interest Income Adjusted to Fully Taxable- equivalent Basis (non-GAAP) $34.8 $35.4 $34.5 APPENDIX – Non-GAAP Measures Dollars in millions 16 |
 2013 Annual Meeting |