 Todd Brice President and Chief Executive Officer Mark Kochvar Chief Financial Officer Third Quarter 2014 Exhibit 99.1 |
 Forward Looking Statement and Risk Factor • This presentation contains certain forward-looking statements within the meaning of Section 27A of the Securities Act of 1933 and Section 21E of the Securities Exchange Act of 1934. Forward- looking statements include, among others, statements regarding trends, strategies, plans, beliefs, intentions, expectations, goals and opportunities. Forward looking statements are typically identified by words or phrases such as believe, expect, anticipate, intend, estimate, assume, strategy, plan, outlook, outcome, continue, remain, trend and variations of such words and similar expressions, or future or conditional verbs such as will, would, should, could, may or similar expressions. Actual results and performance could differ materially from those anticipated by these forward-looking statements. Factors that could cause such a difference include, but are not limited to, general economic conditions, changes in interest rates, deposit flows, loan demand, asset quality, including real estate and other collateral values, and competition. • S&T cautions that these forward-looking statements are subject to numerous assumptions, risks and uncertainties, which change over time. These forward-looking statements speak only as of the date hereof, and S&T assumes no duty to update forward-looking statements. Subsequent written or oral statements attributable to S&T or persons acting on its behalf are expressly qualified in their entirety by the cautionary statements contained herein and those in S&T’s reports previously and subsequently filed with the Securities and Exchange Commission. 1 |
 Non-GAAP Financial Measures • In addition to the results of operations presented in accordance with Generally Accepted Accounting Principles (GAAP), S&T management uses and this presentation contains or references certain non-GAAP financial measures, such as net interest income on a fully taxable equivalent basis. S&T believes these financial measures provide information useful to investors in understanding our operational performance and business and performance trends which facilitate comparisons with the performance of others in the financial services industry. Although S&T believes that these non-GAAP financial measures enhance investors’ understanding of S&T’s business and performance, these non-GAAP financial measures should not be considered an alternative to GAAP. The non-GAAP financial measures contained therein should be read in conjunction with the audited financial statements and analysis as presented in the Annual Report on Form 10-K as well as the unaudited financial statements and analyses as presented in the respective Quarterly Reports on Forms 10-Q for S&T Bancorp, Inc. and subsidiaries. 2 |
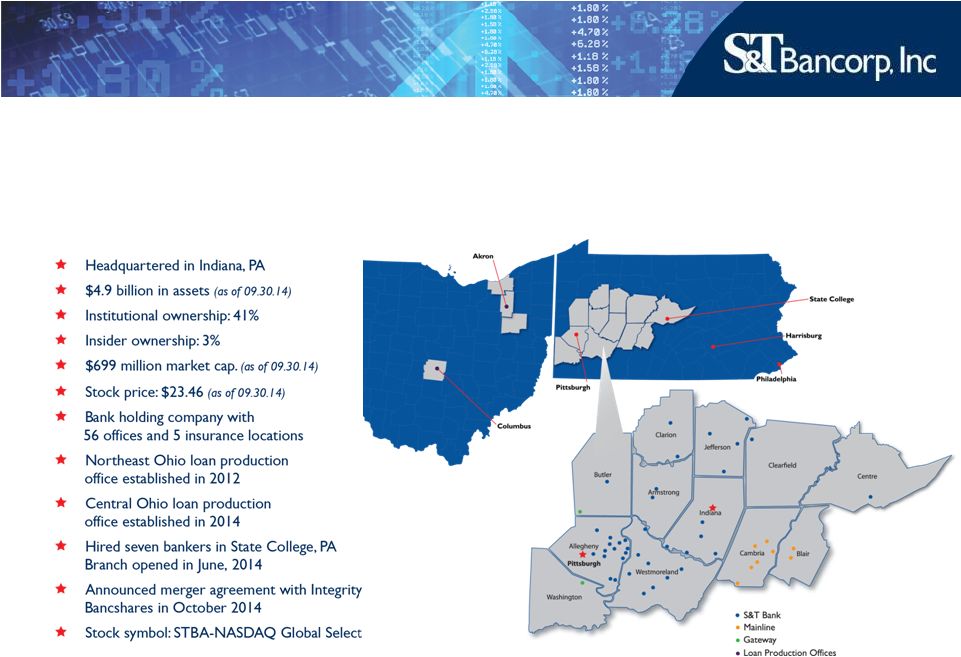 Corporate Profile 3 |
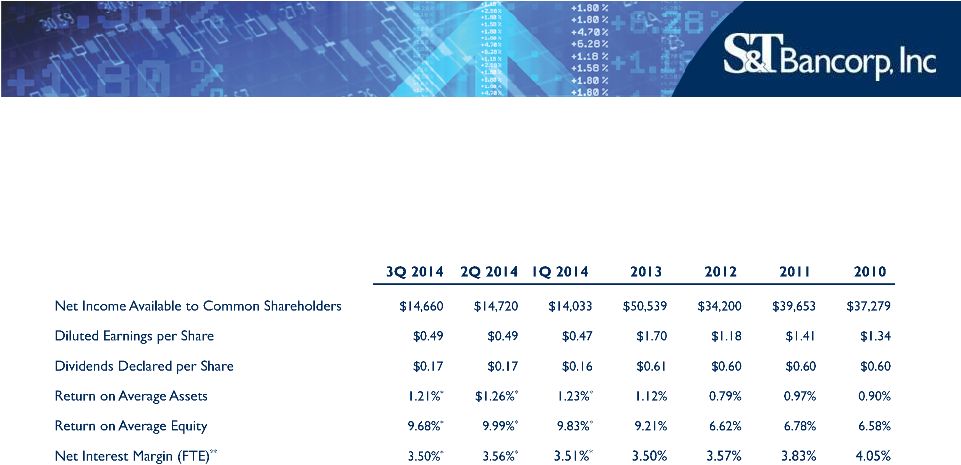 Performance Summary Dollars in thousands, except per share data *Annualized ** Refer to appendix for reconciliation of Non-GAAP financial measures 4 |
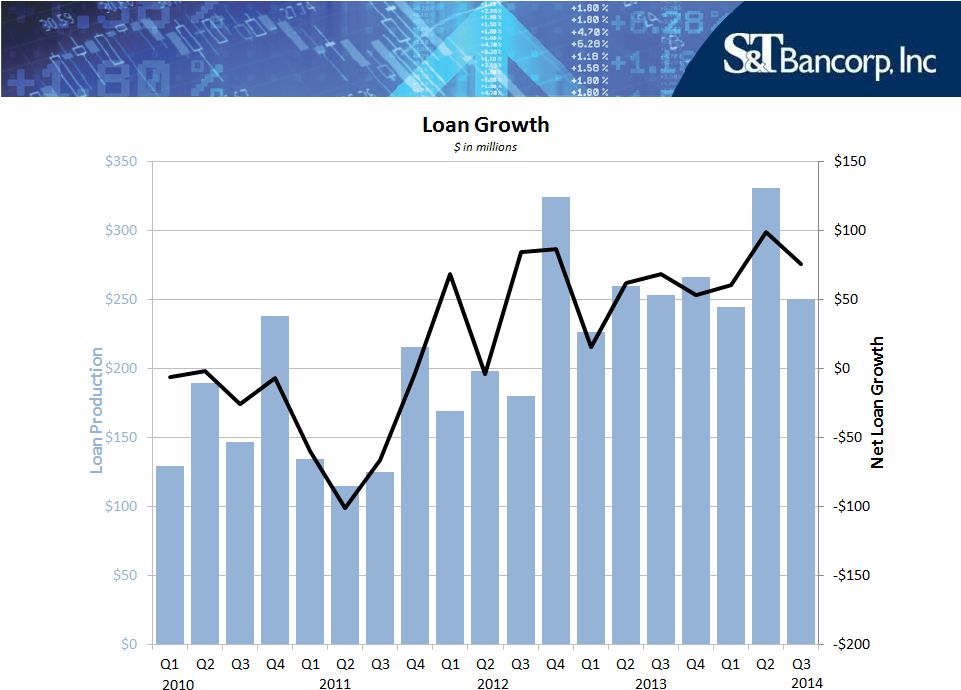
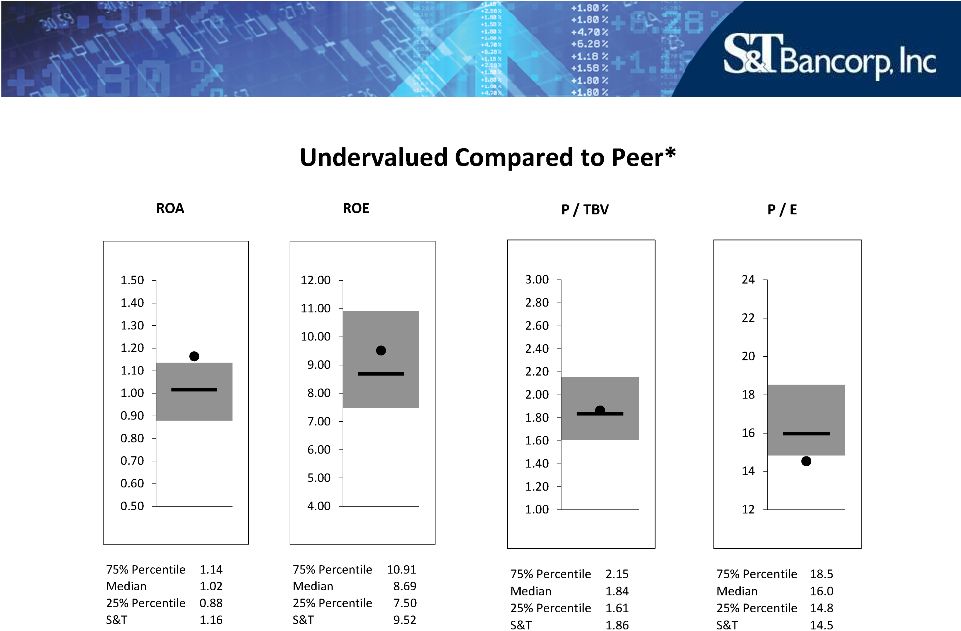
 STBA Investment Thesis • Stable Western PA economy • Long-term Marcellus Shale benefit • Strategic & effective acquisitions/expansions • Loan growth • Excellent asset quality • Demonstrated expense discipline and efficiency • Historically high performer • Undervalued compared to peer 5 |
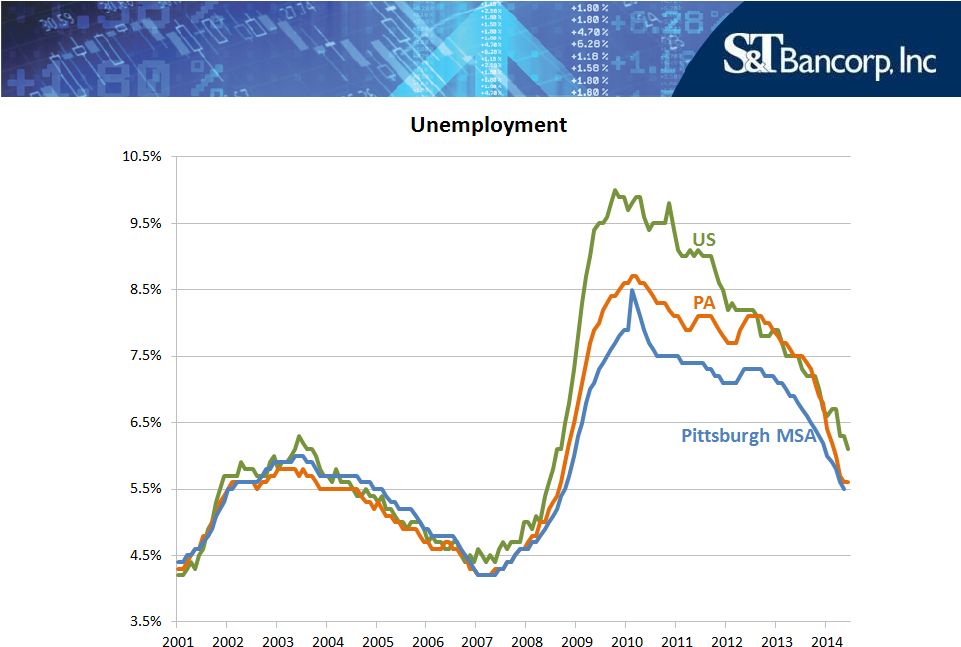 Source: Bureau of Labor Statistics Seasonally adjusted 6 |
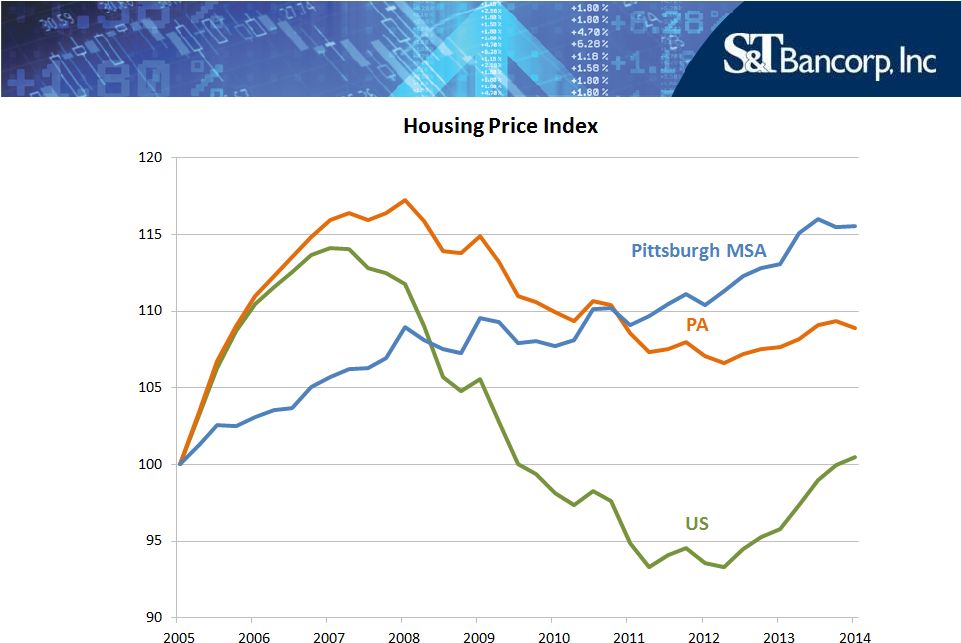 Source: Federal Housing Finance Agency All Transactions; Not seasonally adjusted Index 2005: Q1=100 7 |
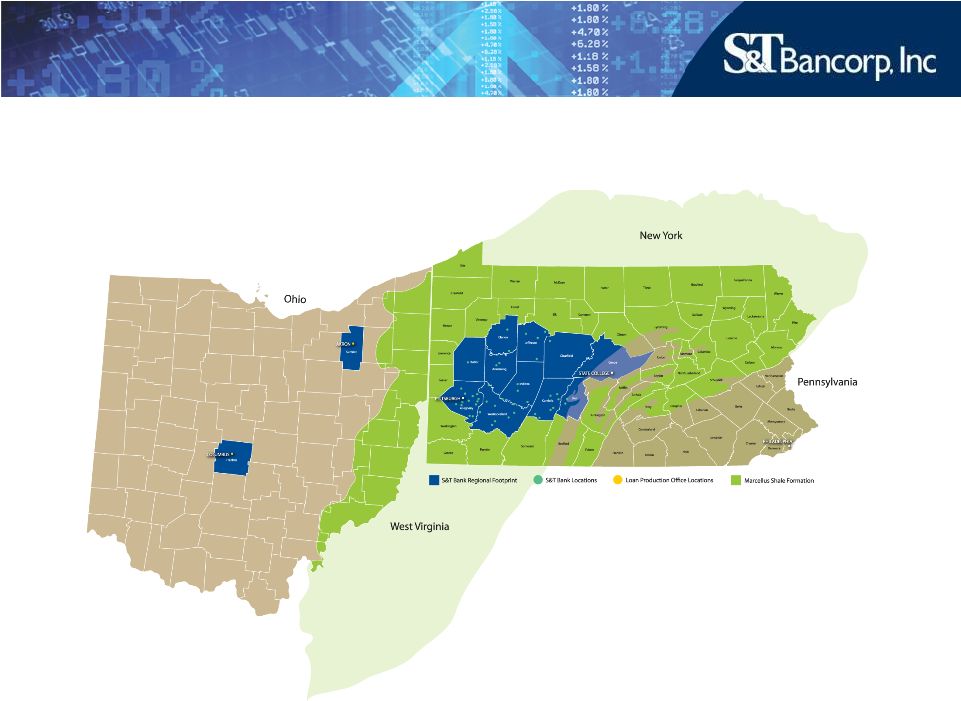 Long-Term Marcellus Shale Benefit 8 |
 Strategic and Effective Acquisitions • 2012 - Gateway Bank of Pennsylvania $ 126 • 2012 - Mainline Bancorp 242 • 2008 - IBT Bancorp 827 • 2002 - Peoples Financial Corp 344 • 1998 - Branch Purchase from Mellon 39 • 1997 - Peoples Bank of Unity 287 • 1991 - Atlantic Financial Savings Bank 100 • 1991 - Vanguard Savings Bank 112 Assets/Deposits Acquired $2,077 Dollars in Millions 9 |
 Strategic and Effective Expansions • 2012 – Loan production office opened in northeast Ohio, August 2012 • 2014 – Loan production office opened in central Ohio, January 2014 • 2014 – Hired seven bankers in State College, PA and branch opened in June, 2014 10 |
 11 |
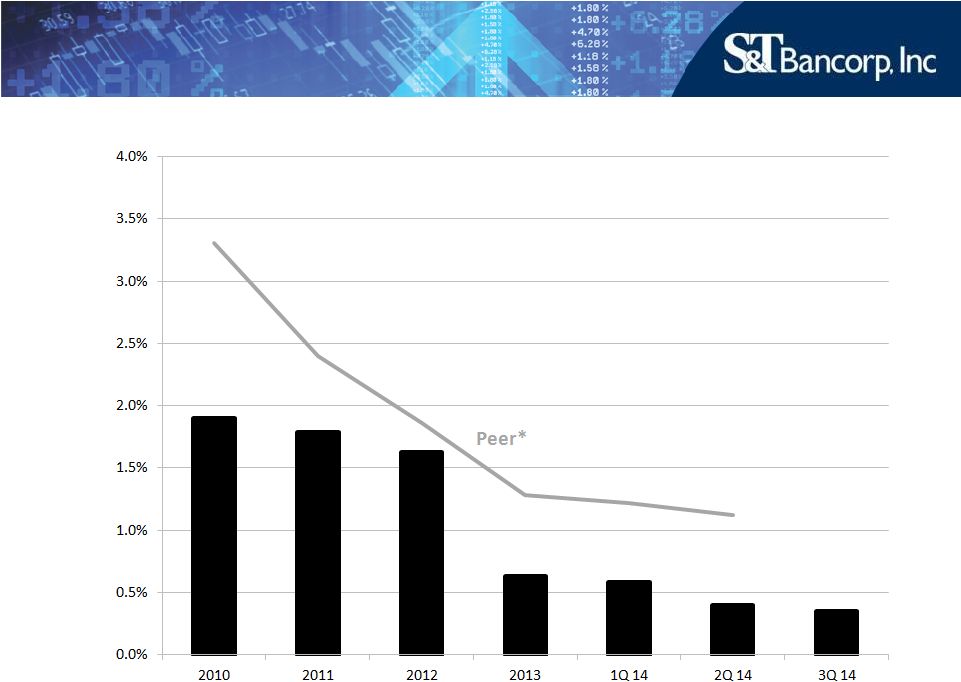 * Bank Holding Companies $3-10 Billion of Assets 12 Non Performing Loans / Total Loans |
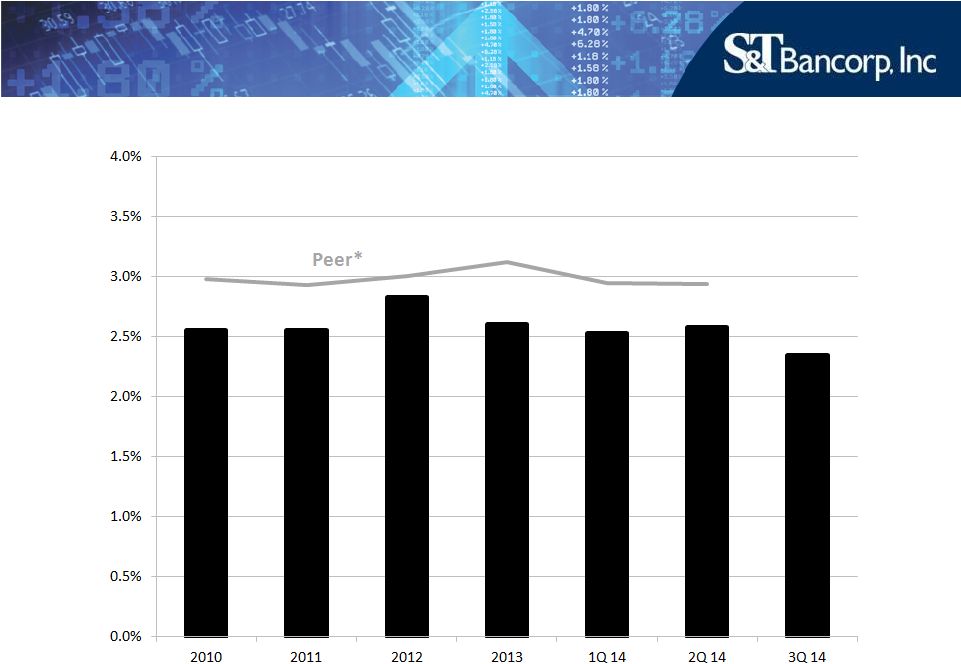
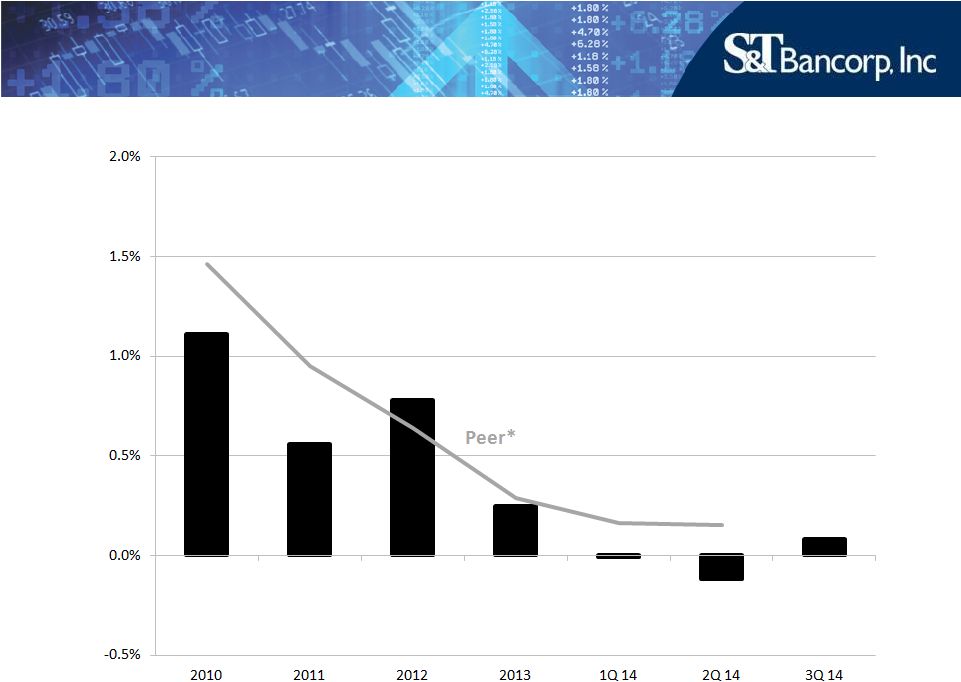 * Bank Holding Companies $3-10 Billion of Assets 13 Net Charge Offs / Average Loans |
 * Bank Holding Companies $3-10 Billion of Assets 14 Non Interest Expense / Average Assets |
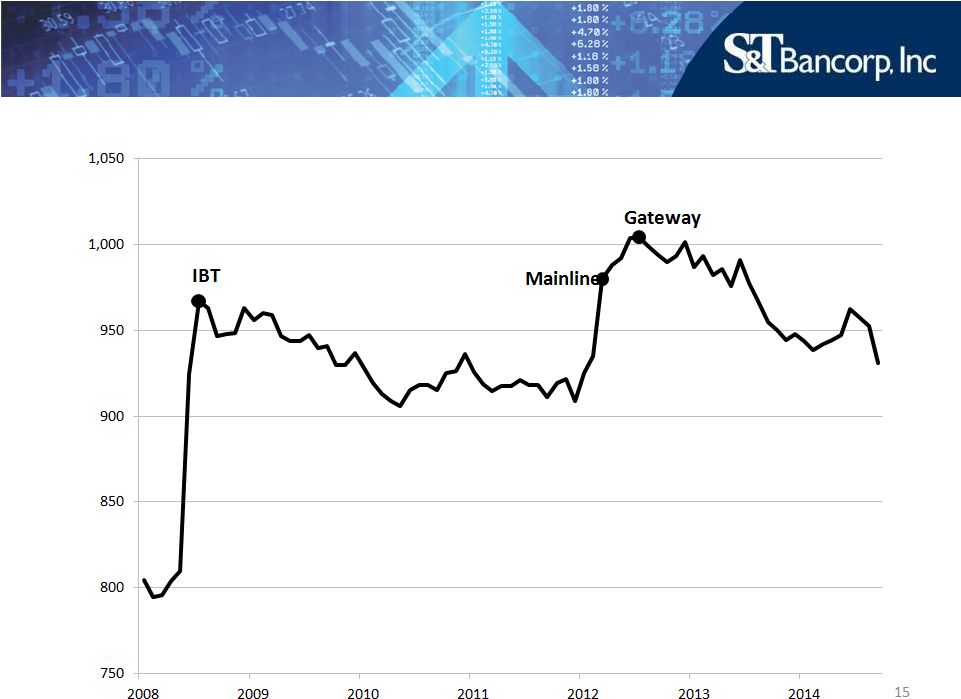 Full Time Equivalent Employees |
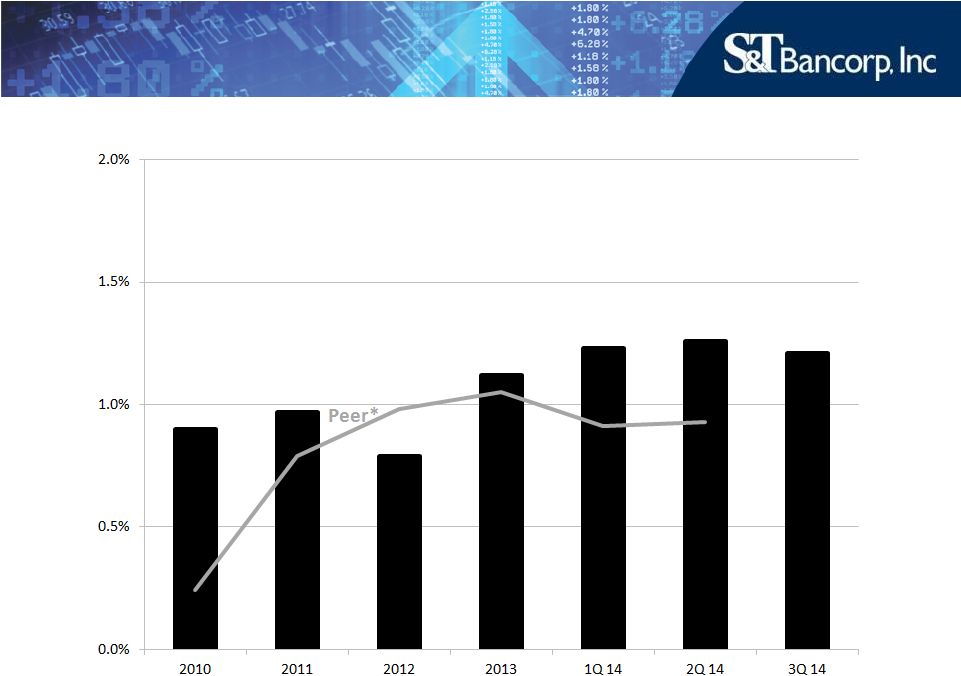 * Bank Holding Companies $3-10 Billion of Assets 16 Return on Average Assets |
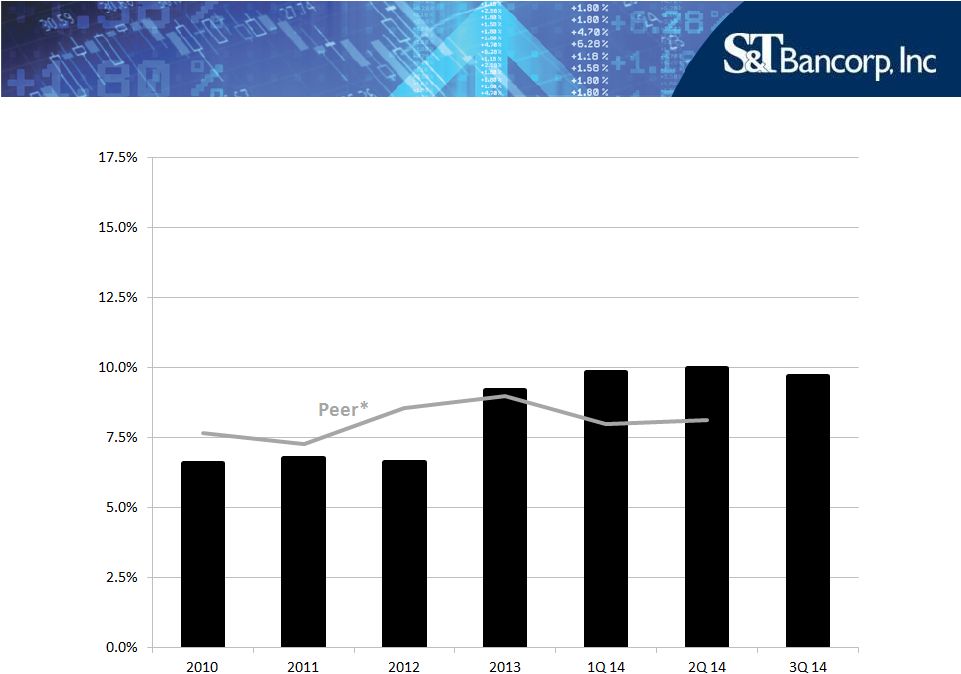 * Bank Holding Companies $3-10 Billion of Assets 17 Return on Average Equity |
 Source: Bloomberg *KRX – KBW Regional Banking Index as of 10.30.14 18 |
 4 Lines of Business Commercial Banking Retail Banking Wealth Management Insurance 19 |
 Commercial Banking • 40 commercial lenders • 15 business bankers • Privately held companies with sales up to $150 million • Northeast Ohio loan production office, August, 2012 • Central Ohio loan production office, January, 2014 20 |
 Retail Banking • Over 110,000 households • 56 branches • Average branch size of $66.5 million • Over 80,000 customers enrolled in online banking • Over 27,000 customers enrolled in mobile banking 21 |
 Wealth Management • $1.9 billion AUM • 3 divisions – S&T Trust – S&T Financial Services – RIA/Stewart Capital • Annual revenue of $10.7 million; double digit growth • Mineral management capabilities • Stewart Capital Mid-Cap Fund (SCMFX) with over $95 million in assets; Top 1% performance YTD (10.30.14) 22 |
 S&T-Evergreen Insurance • Full service agency – Commercial P&C (75%) – Group life and health (13%) – Personal lines (12%) • Annual revenue of $5.4 million • Focus on increasing penetration of S&T customer base 23 |
 The Right Size • Big enough to: – Provide full complement of products and services – Access technology – Access capital markets – Attract talent – Expand – mergers and acquisitions/de novo • Small enough to: – Stay close to our customers – Understand our markets – Be responsive 24 |
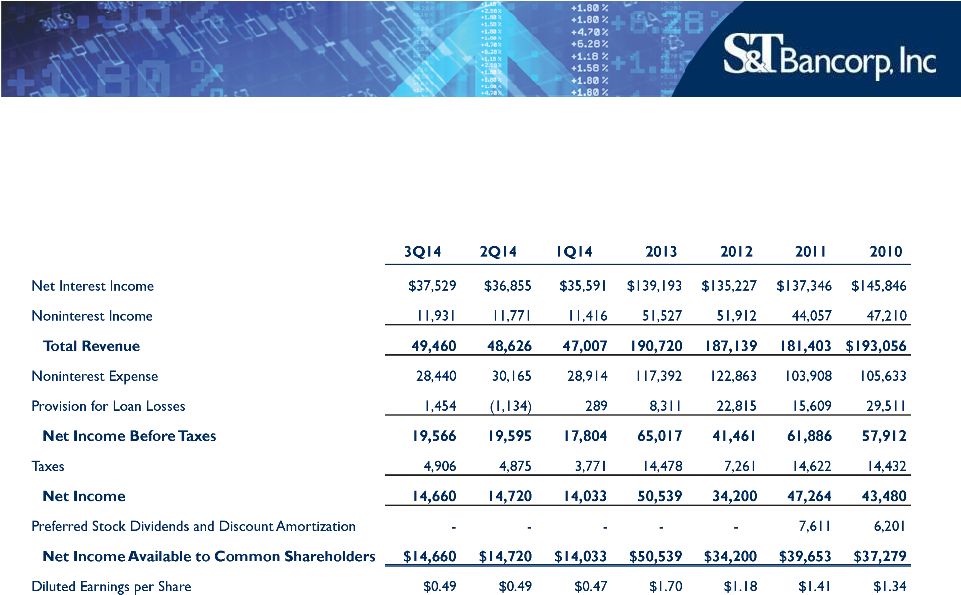 Income Statement Dollars in thousands, except per share data 25 |
 Balance Sheet Dollars in thousands 26 |
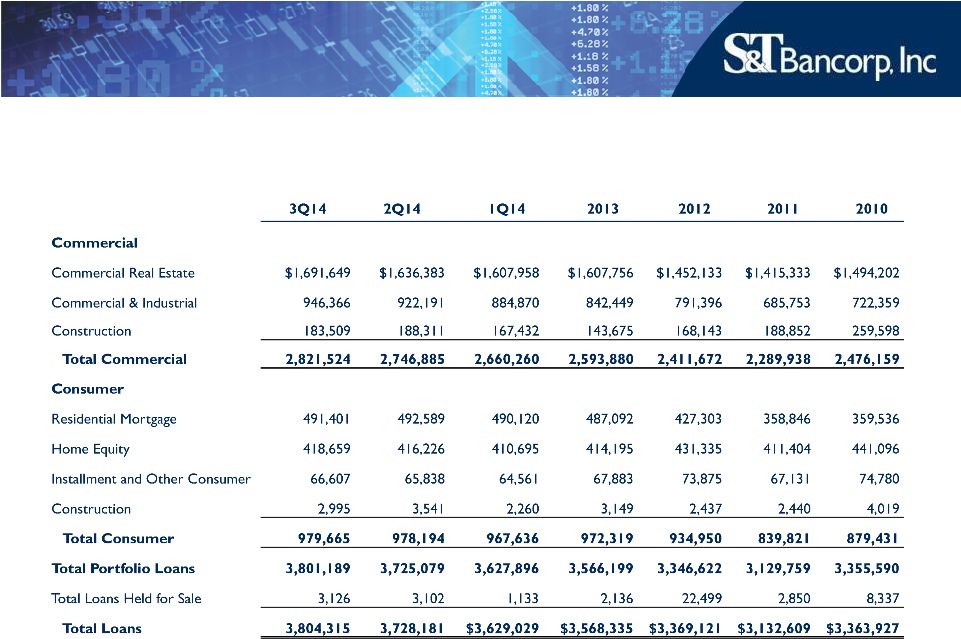 Loan Portfolio Dollars in thousands 27 |
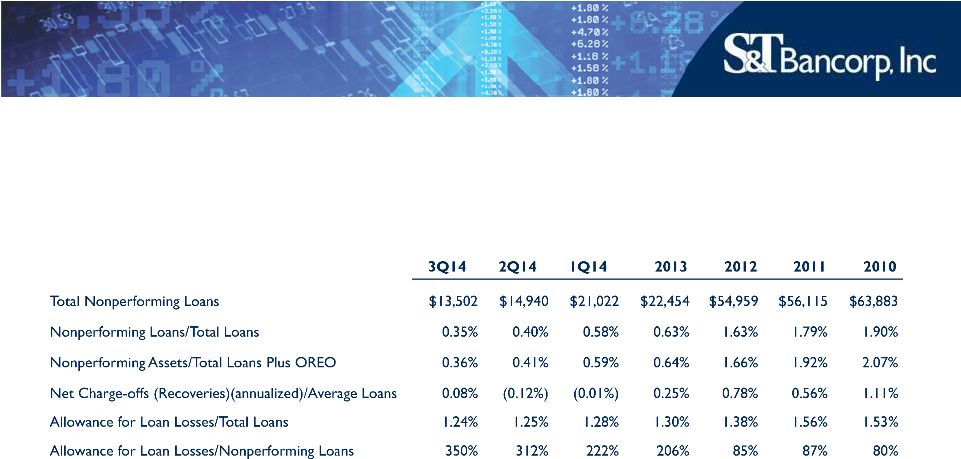 Asset Quality 28 Dollars in thousands |
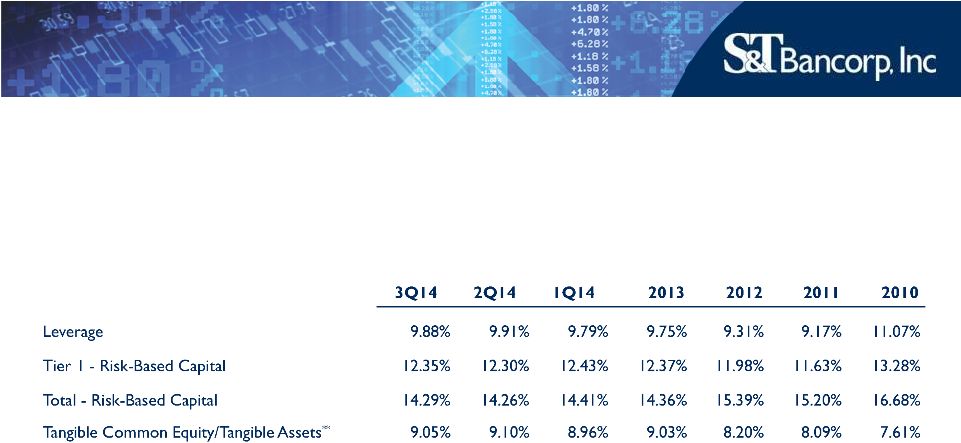 Capital Ratios ** Refer to appendix for reconciliation of Non-GAAP financial measures 29 |
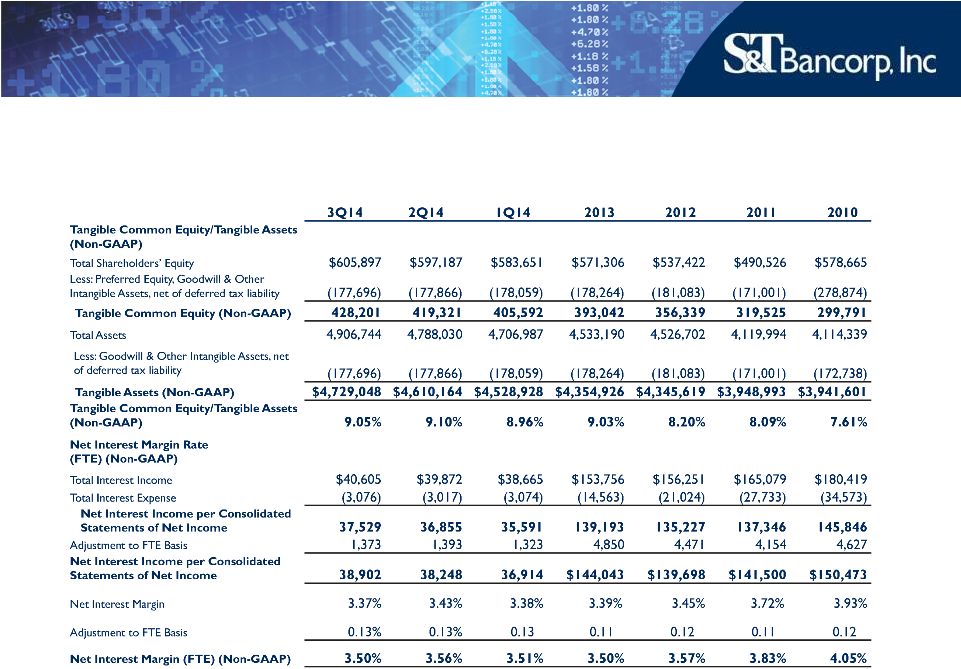 APPENDIX – Non-GAAP Measures 30 |
 |