|
Exhibit 99.1 
|
Todd Brice
President and Chief Executive Officer
Mark Kochvar
Chief Financial Officer
Full Year 2014
Forward Looking Statement and Risk Factor
This presentation contains certain forward-looking statements within the meaning of Section 27A of the Securities Act of 1933 and Section 21E of the Securities Exchange Act of 1934. Forward-looking statements include, among others, statements regarding trends, strategies, plans, beliefs, intentions, expectations, goals and opportunities. Forward looking statements are typically identified by words or phrases such as believe, expect, anticipate, intend, estimate, assume, strategy, plan, outlook, outcome, continue, remain, trend and variations of such words and similar expressions, or future or conditional verbs such as will, would, should, could, may or similar expressions. Actual results and performance could differ materially from those anticipated by these forward-looking statements. Factors that could cause such a difference include, but are not limited to, general economic conditions, changes in interest rates, deposit flows, loan demand, asset quality, including real estate and other collateral values, and competition.
S&T cautions that these forward-looking statements are subject to numerous assumptions, risks and uncertainties, which change over time. These forward-looking statements speak only as of the date hereof, and S&T assumes no duty to update forward-looking statements. Subsequent written or oral statements attributable to S&T or persons acting on its behalf are expressly qualified in their entirety by the cautionary statements contained herein and those in S&T’s reports previously and subsequently filed with the Securities and Exchange Commission.
1
Non-GAAP Financial Measures
In addition to the results of operations presented in accordance with Generally Accepted Accounting Principles (GAAP), S&T management uses and this presentation contains or references certain non-GAAP financial measures, such as net interest income on a fully taxable equivalent basis. S&T believes these financial measures provide information useful to investors in understanding our operational performance and business and performance trends which facilitate comparisons with the performance of others in the financial services industry. Although S&T believes that these non-GAAP financial measures enhance investors’ understanding of S&T’s business and performance, these non-GAAP financial measures should not be considered an alternative to GAAP. The non-GAAP financial measures contained therein should be read in conjunction with the audited financial statements and analysis as presented in the Annual Report on Form 10-K as well as the unaudited financial statements and analyses as presented in the respective Quarterly Reports on Forms 10-Q for S&T Bancorp, Inc. and subsidiaries.
2
Corporate Profile
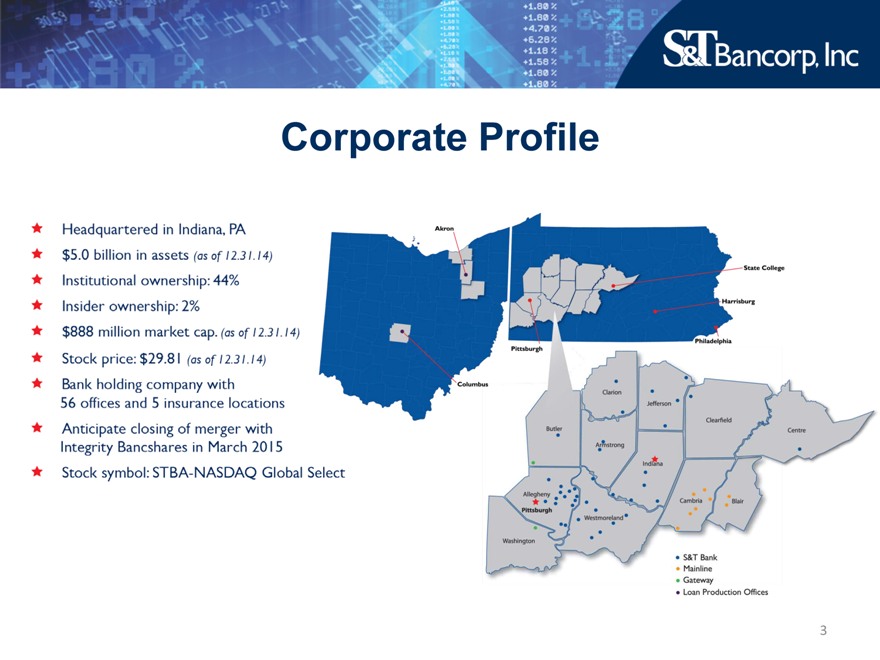
Headquartered in Indiana, PA
$5.0 billion in assets (as of 12.31.14)
Institutional ownership: 44%
Insider ownership:2%
$888 million market cap. (as of 12.31.14)
Stock price: $29.81 (as of 12.31.14)
Bank holding company with 56 offices and 5 insurance locations
Anticipate closing of merger with Intergrity Bancshares in March 2015
Stock symbol: STBA-NASDAQ Global Selected
Akron
Pittsburgh
Columbus
State College
Harrisburg
Philadelphia
Butler Clarion
Jefferson
Clearfield
Centre
Armstrong
Indiana
Cambria
Blair
Allegheny Pittsburgh
Washington
Westmoreland
S&T Bank Mainline Gateway Loan Production Offices
3
Performance Summary
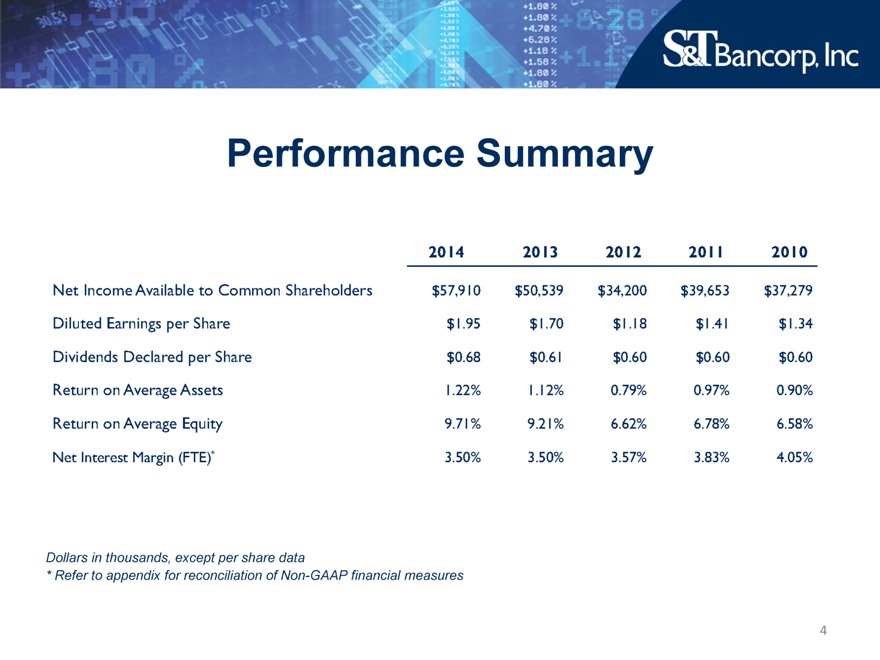
2014 2013 2012 2011 2010
Net Income Available to Common Shareholders $57,910 $50,539 $34,200 $39,653 $37,279
Diluted Earnings per Share $1.95 $1.70 $1.18 $1.41 $1.34
Dividends Declared per share $0.68 $0.61 $0.60 $0.60 $0.60
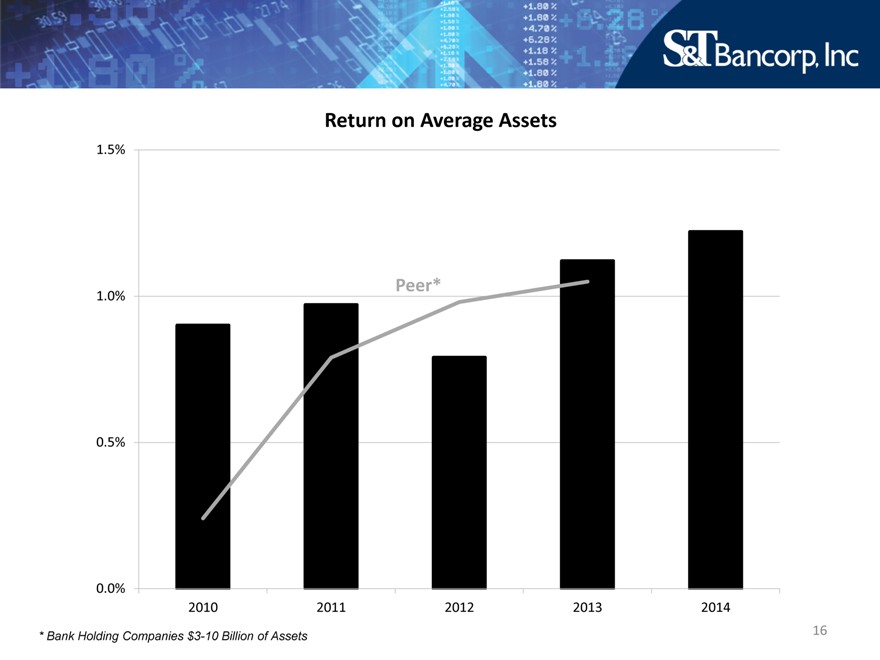
Return on Average Assets 1.22% 1.12% 0.79% 0.97% 0.90%
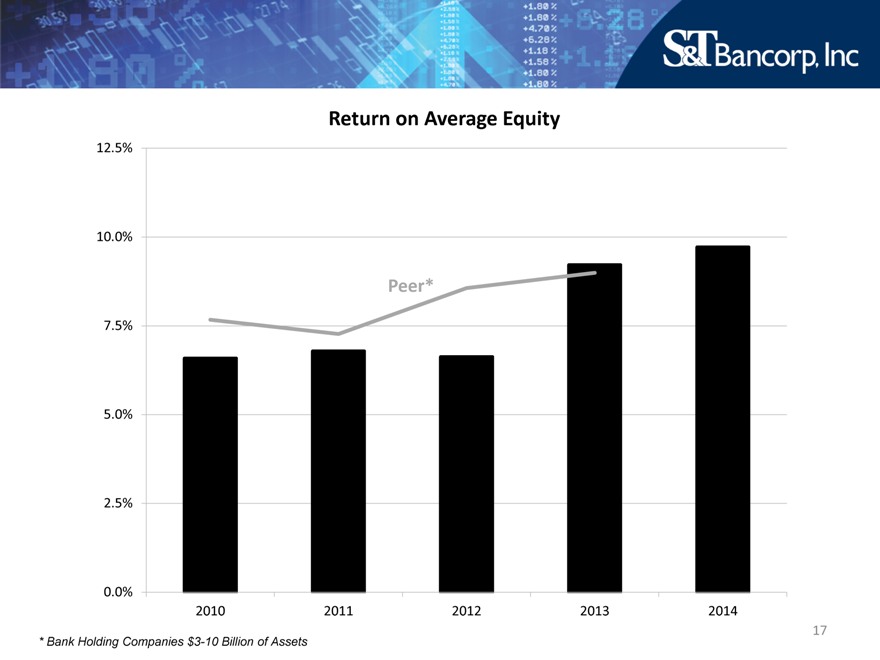
Return on Average Equity 9.71% 9.21% 6.62% 6.78% 6.58%
Net interest Margin (FTE)* 3.50% 3.50% 3.57% 3.83% 4.05 %
Dollars in thousands, except per share data
* Refer to appendix for reconciliation of Non-GAAP financial measures
4
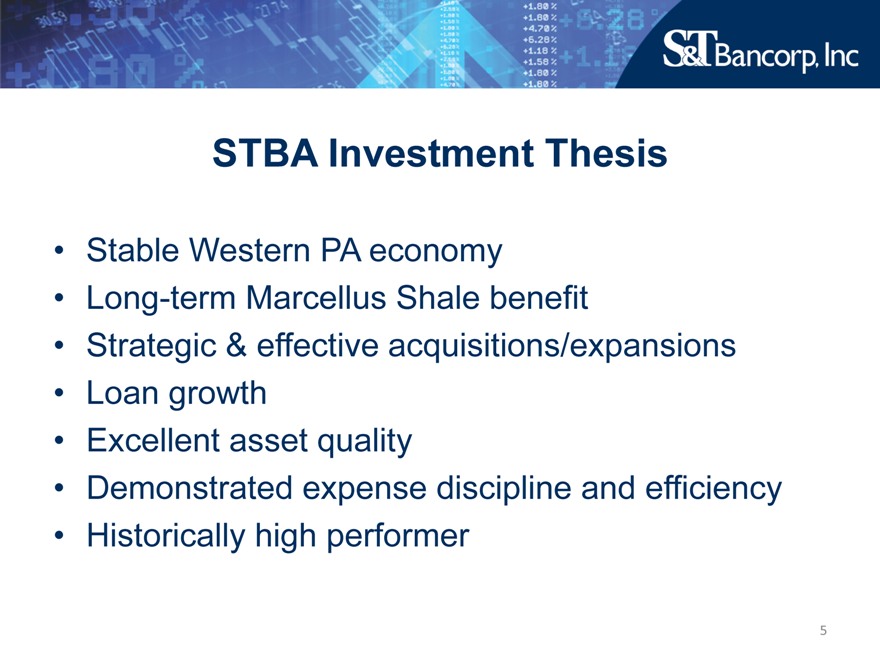
STBA Investment Thesis
Stable Western PA economy
Long-term Marcellus Shale benefit
Strategic & effective acquisitions/expansions
Loan growth
Excellent asset quality
Demonstrated expense discipline and efficiency
Historically high performer
5
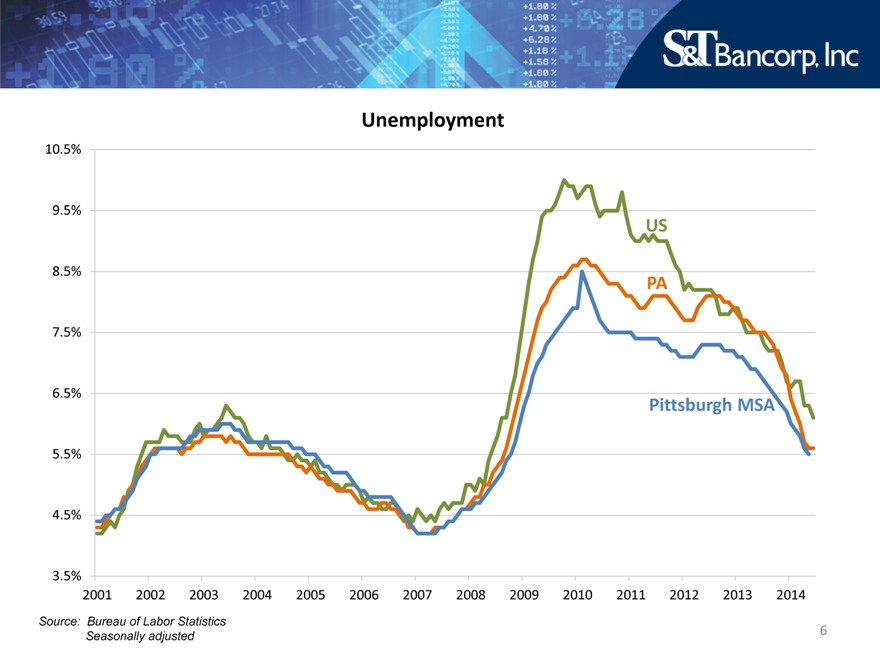
Unemployment
10.5%
9.5%
US
8.5% PA
7.5%
6.5% Pittsburgh MSA
5.5%
4.5%
3.5%
2001 2002 2003 2004 2005 2006 2007 2008 2009 2010 2011 2012 2013 2014
Source: Bureau of Labor Statistics Seasonally adjusted
6
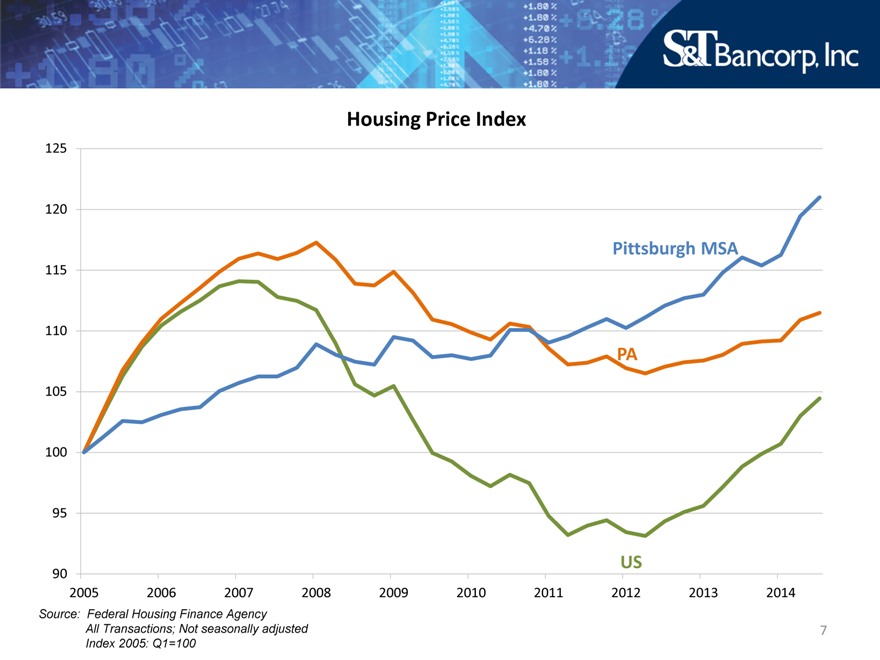
Housing Price Index
125
120
Pittsburgh MSA
115
110
PA
105
100
95
90 US
2005 2006 2007 2008 2009 2010 2011 2012 2013 2014
Source: Federal Housing Finance Agency All Transactions; Not seasonally adjusted Index 2005: Q1=100
7
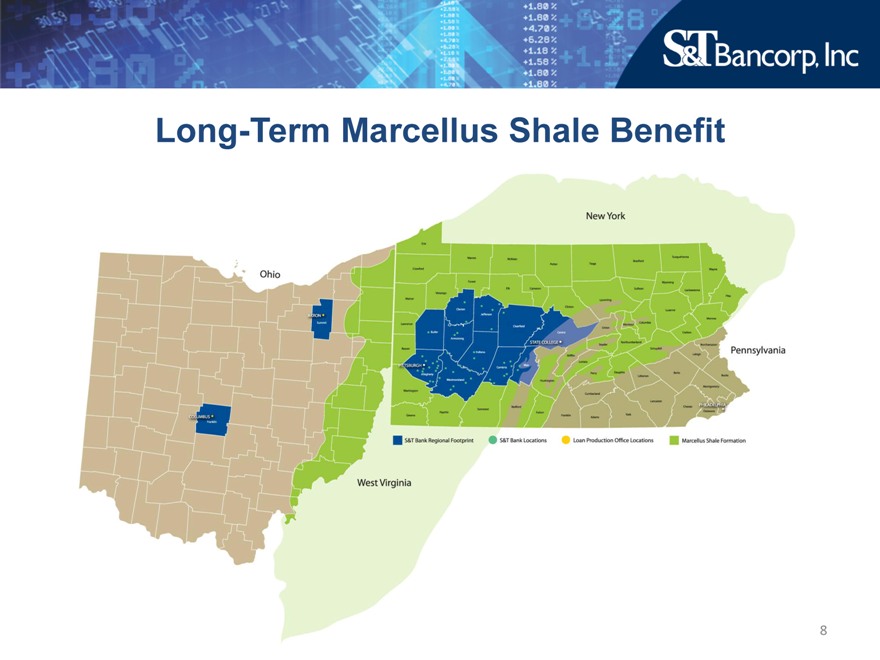
Long-Term Marcellus Shale Benefit
Ohio New York
West Virginia
8
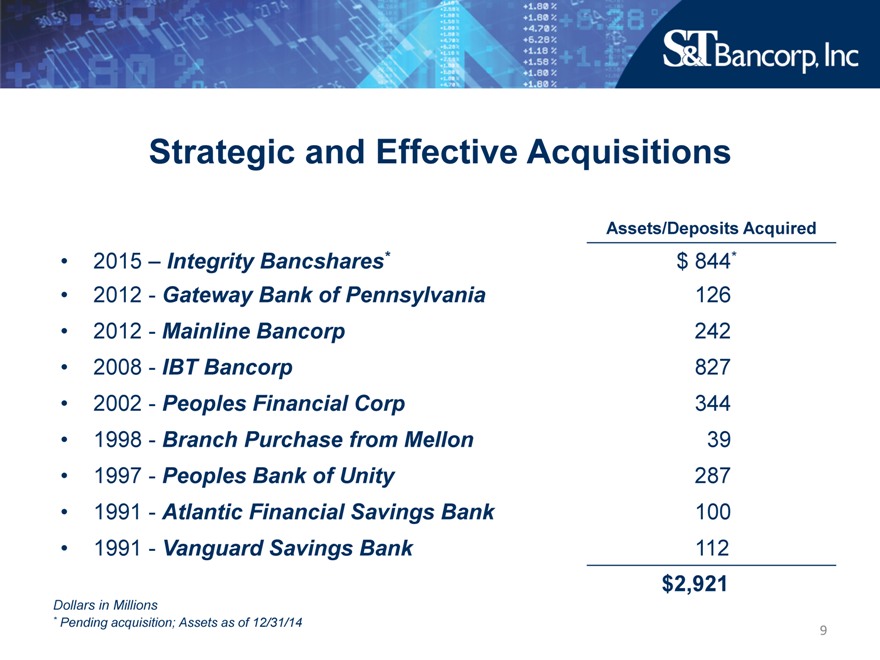
Strategic and Effective Acquisitions
Assets/Deposits Acquired
2015 – Integrity Bancshares* $ 844*
2012 —Gateway Bank of Pennsylvania 126
2012 —Mainline Bancorp 242
2008 —IBT Bancorp 827
2002 —Peoples Financial Corp 344
1998 —Branch Purchase from Mellon 39
1997 —Peoples Bank of Unity 287
1991 —Atlantic Financial Savings Bank 100
1991 —Vanguard Savings Bank 112
$2,921
Dollars in Millions
* Pending acquisition; Assets as of 12/31/14
9
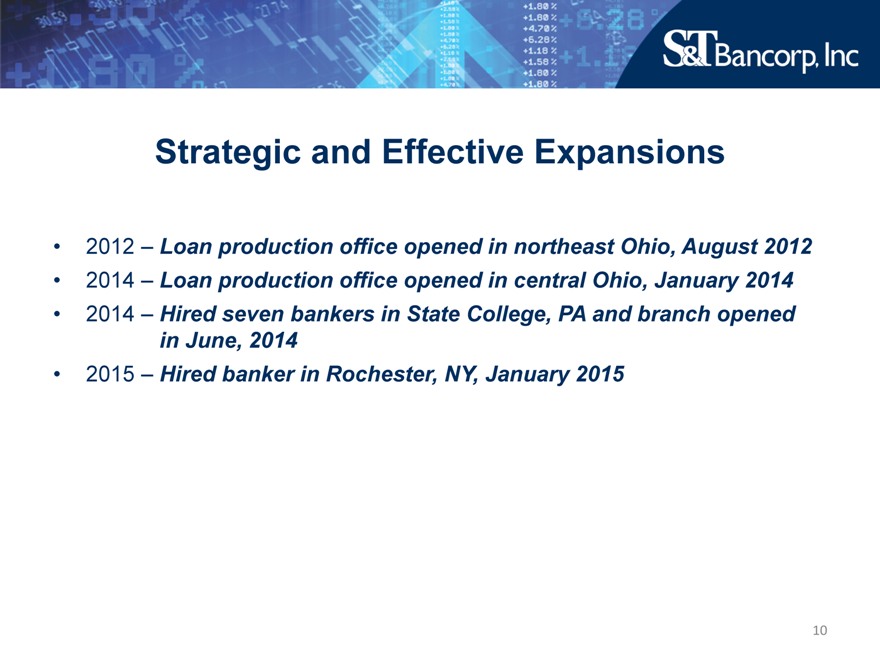
Strategic and Effective Expansions
2012 – Loan production office opened in northeast Ohio, August 2012
2014 – Loan production office opened in central Ohio, January 2014
2014 – Hired seven bankers in State College, PA and branch opened in June, 2014
2015 – Hired banker in Rochester, NY, January 2015
10
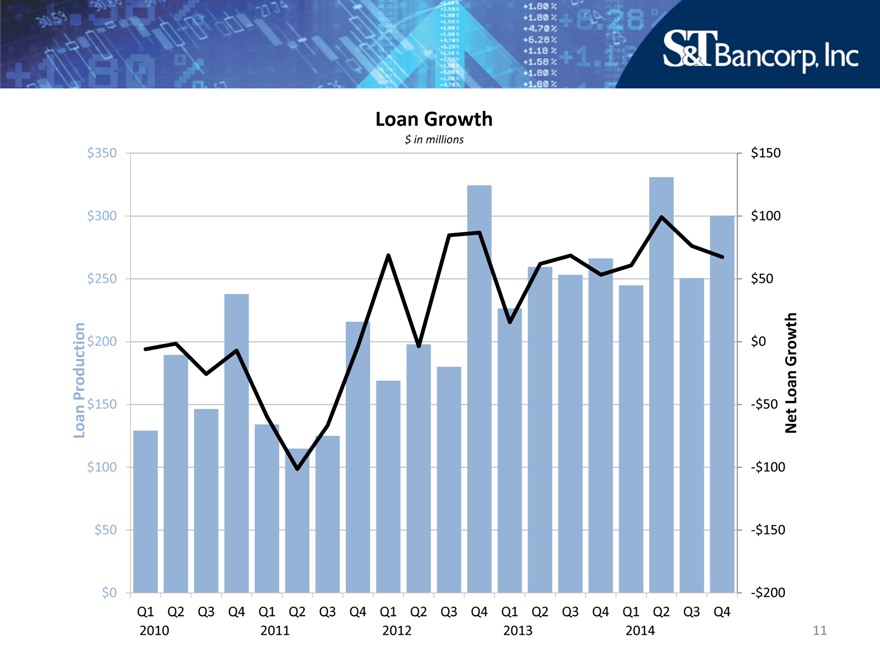
Loan Growth
$ in millions
$350 $150
$300 $100
$250 $50
Production $200 $0 Growth
$150 -$50 Loan
Loan Net
$100 -$100
$50 -$150
$0 -$200
Q1 Q2 Q3 Q4 Q1 Q2 Q3 Q4 Q1 Q2 Q3 Q4 Q1 Q2 Q3 Q4 Q1 Q2 Q3 Q4
2010 2011 2012 2013 2014
11
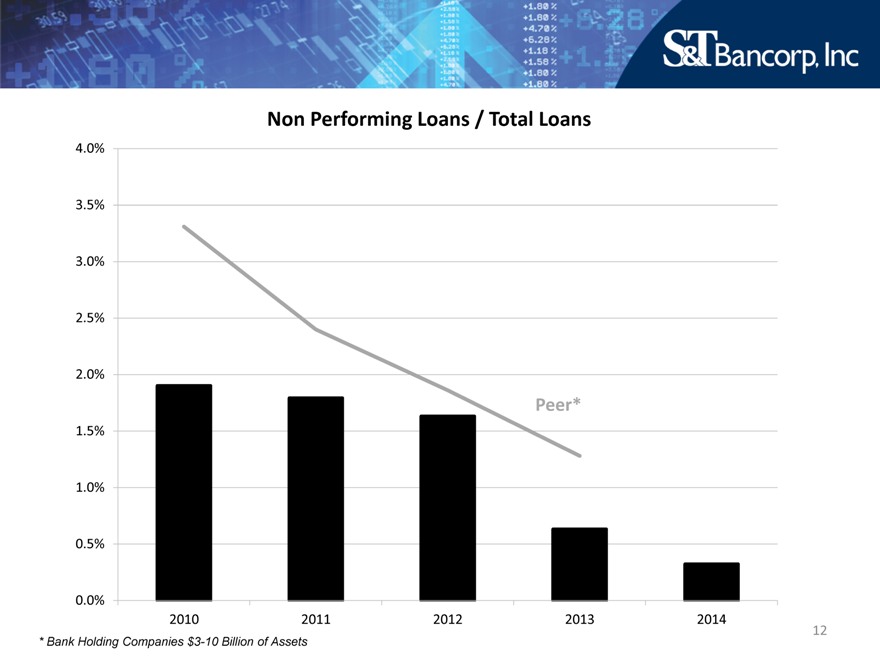
Non Performing Loans / Total Loans
4.0%
3.5%
3.0%
2.5%
2.0%
Peer*
1.5%
1.0%
0.5%
0.0%
2010 2011 2012 2013 2014
* Bank Holding Companies $3-10 Billion of Assets
12
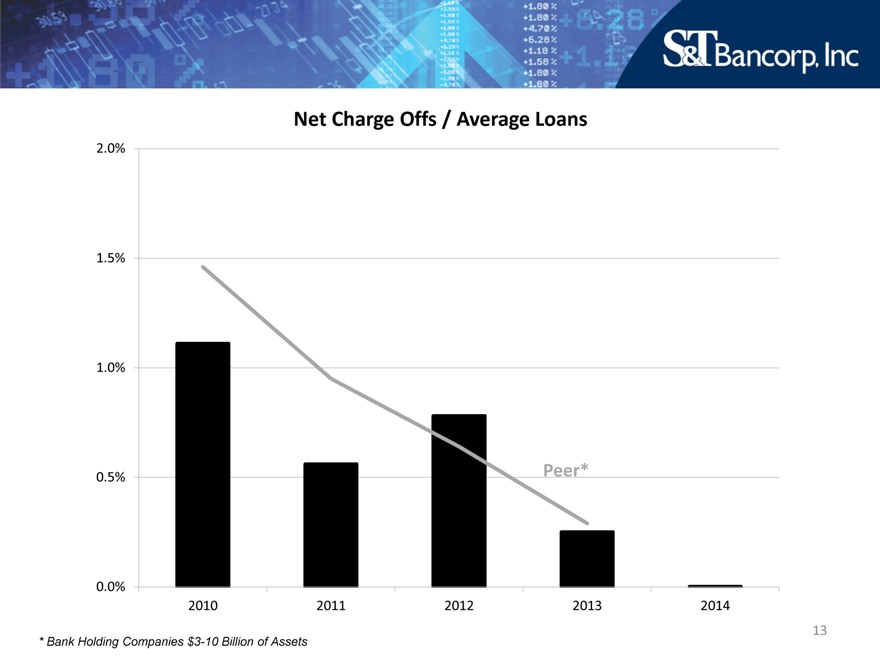
Net Charge Offs / Average Loans
2.0%
1.5%
1.0%
0.5% Peer*
0.0%
2010 2011 2012 2013 2014
13
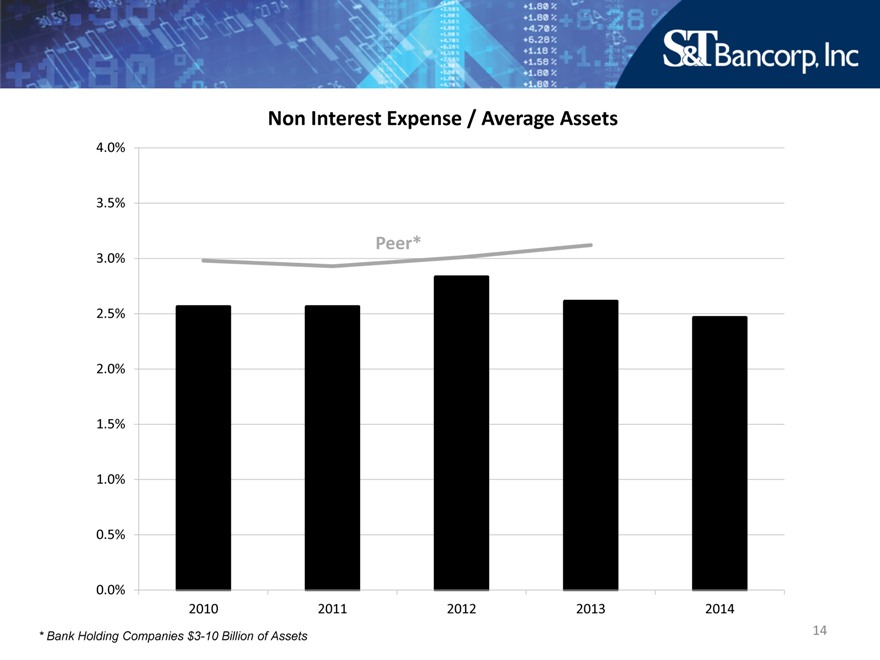
Non Interest Expense / Average Assets
4.0%
3.5%
Peer*
3.0%
2.5%
2.0%
1.5%
1.0%
0.5%
0.0%
2010 2011 2012 2013 2014
* Bank Holding Companies $3-10 Billion of Assets
14
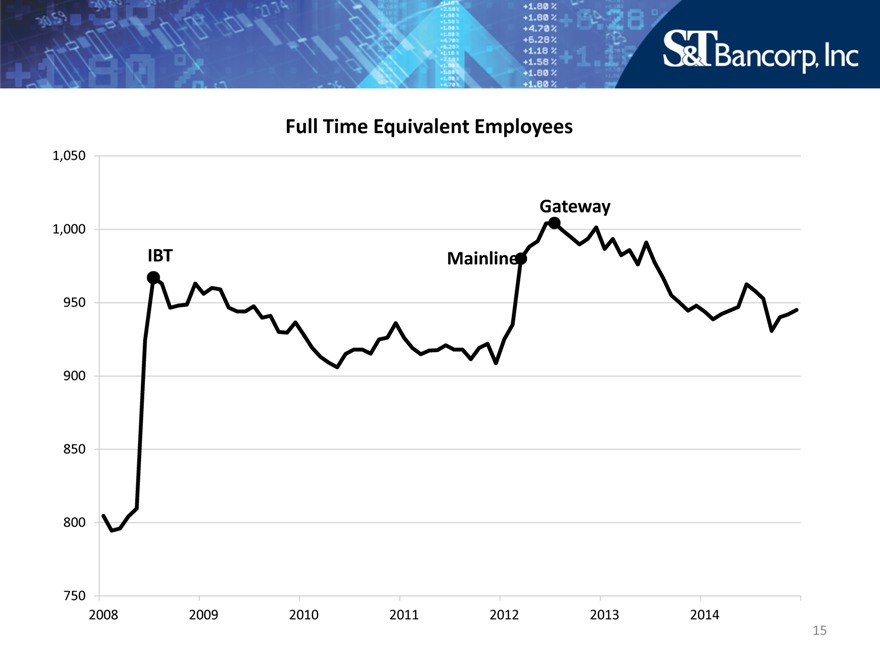
Full Time Equivalent Employees
1,050
Gateway
1,000
IBT Mainline
950
900
850
800
750
2008 2009 2010 2011 2012 2013 2014
15
Return on Average Assets
1.5%
1.0% Peer*
0.5%
0.0%
2010 2011 2012 2013 2014
* Bank Holding Companies $3-10 Billion of Assets
16
Return on Average Equity
12.5%
10.0%
Peer*
7.5%
5.0%
2.5%
0.0%
2010 2011 2012 2013 2014
* Bank Holding Companies $3-10 Billion of Assets
17
4 Lines of Business
Commercial Banking Retail Banking
Wealth Management Insurance
18
Commercial Banking
39 commercial bankers
16 business bankers
Privately held companies with sales up to $150 million
Northeast Ohio loan production office, August, 2012
Central Ohio loan production office, January, 2014
State College, PA branch, June 2014
Hired banker in Rochester, NY, January 2015
19
Retail Banking
Competitive, relationship driven
Robust suite of deposit and loan products
Over 110,000 households
56 branches; average size of $66.1 million
Technology driven with over 87,000 online banking and over 29,000 mobile banking customers
20
Wealth Management
$2.0 billion AUM
3 divisions
– S&T Trust
– S&T Financial Services
– RIA/Stewart Capital
Annual revenue of $11.3 million
Stewart Capital Mid-Cap Fund (SCMFX) with $95 million in assets; Top 14% performance in 2014
21
S&T-Evergreen Insurance
Full service agency
– Commercial P&C (75%)
– Group life and health (13%)
– Personal lines (12%)
Annual revenue of $5.2 million
Focus on increasing penetration of S&T customer base
22
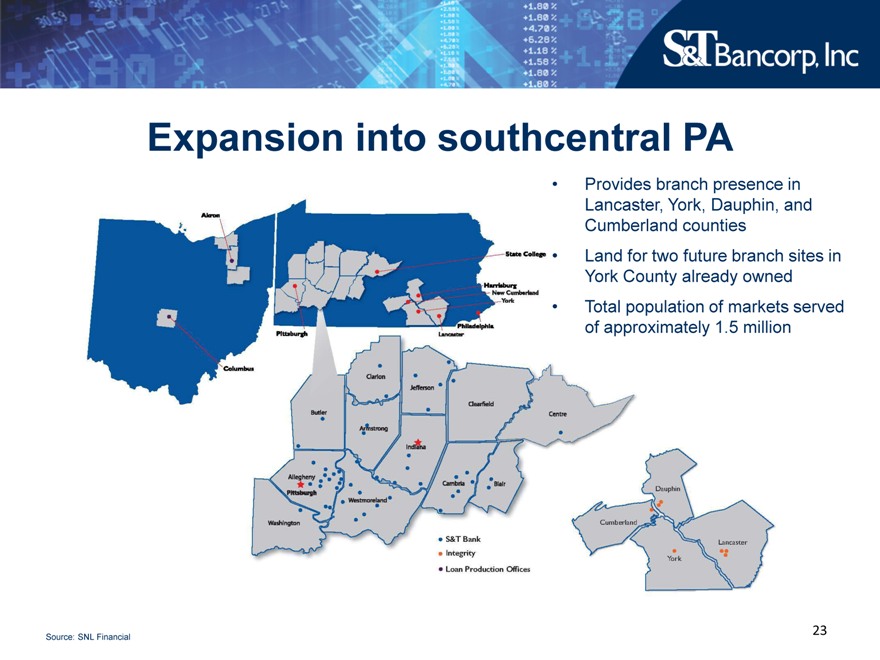
Expansion into southcentral PA
Provides branch presence in Lancaster, York, Dauphin, and Cumberland counties Land for two future branch sites in York County already owned Total population of markets served of approximately 1.5 million
Source: SNL Financial
23
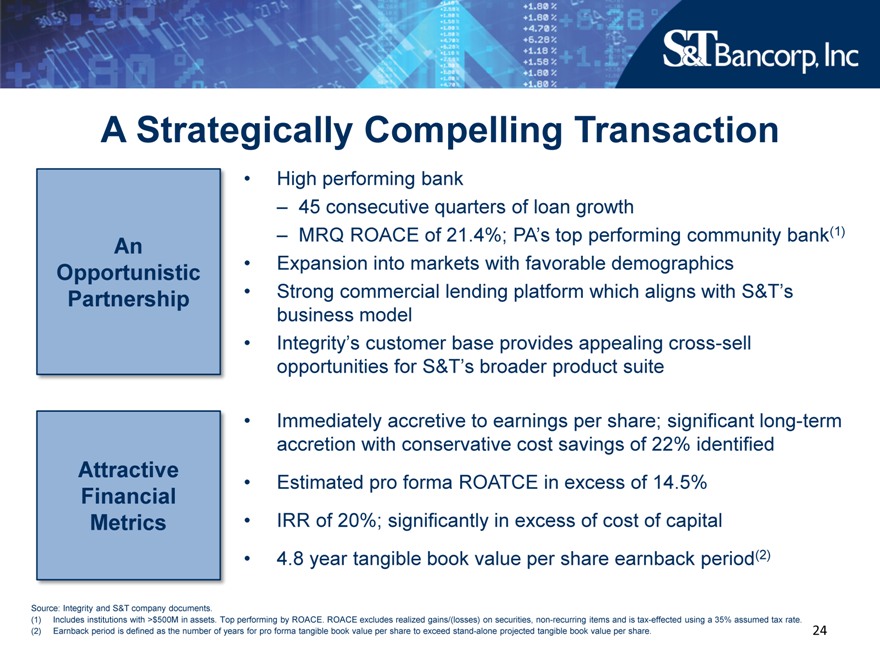
A Strategically Compelling Transaction
An Opportunistic Partnership
Attractive Financial Metrics
High performing bank
– 45 consecutive quarters of loan growth
– MRQ ROACE of 21.4%; PA’s top performing community bank(1)
Expansion into markets with favorable demographics
Strong commercial lending platform which aligns with S&T’s business model
Integrity’s customer base provides appealing cross-sell opportunities for S&T’s broader product suite
Immediately accretive to earnings per share; significant long-term accretion with conservative cost savings of 22% identified
Estimated pro forma ROATCE in excess of 14.5%
IRR of 20%; significantly in excess of cost of capital
4.8 year tangible book value per share earnback period(2)
Source: Integrity and S&T company documents.
(1) Includes institutions with >$500M in assets. Top performing by ROACE. ROACE excludes realized gains/(losses) on securities, non-recurring items and is tax-effected using a 35% assumed tax rate. (2) Earnback period is defined as the number of years for pro forma tangible book value per share to exceed stand-alone projected tangible book value per share.
24
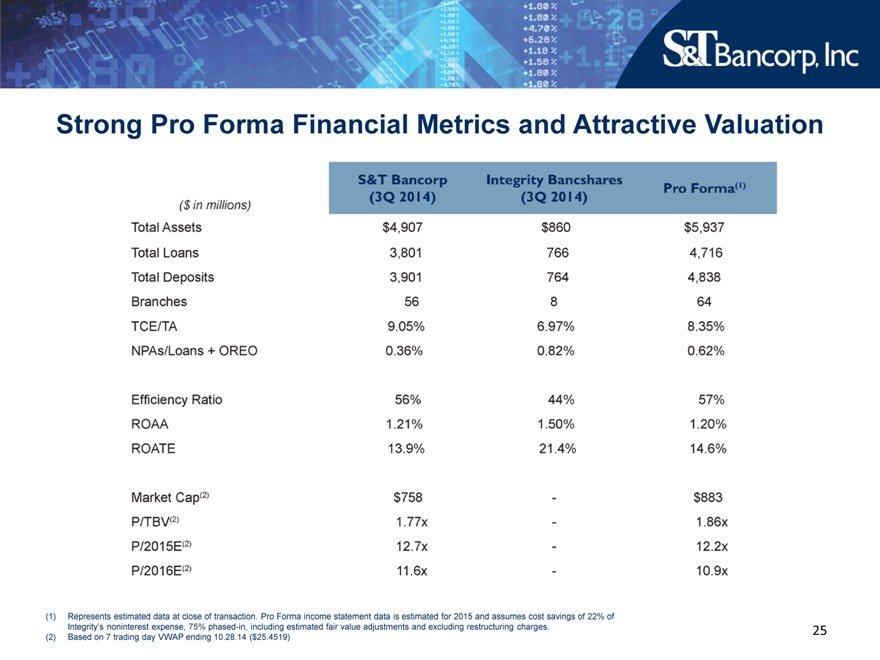
Strong Pro Forma Financial Metrics and Attractive Valuation
($ in millions) S&T Bancorp Integrity Bancshares
(3Q 2014) (3Q 2014) Pro Forma (1)
Total Assets $4,907 $860 $5,937
Total loans 3,801 766 4,716
Total Deposits 3,901 764 4,838
Branches 56 8 64
TCE/TA 9.05% 6.97% 8.35%
NPAs/Loans + OREO 0.36% 0.82% 0.62%
Efficiency Ratio 56% 44% 57%
ROAA 1.21% 1.50% 1.20%
ROATE 13.9% 21.4% 14.6%
Market Cap(2) $758 — $883
P/TBV(2) 1.77x — 1.86x
P/2015E(2) 12.7x — 12.2x
P2016E(2) 11.6x — 10.9x
(1) Represents estimated data at close of transaction. Pro Forma income statement data is estimated for 2015 and assumes cost savings of 22% of Integrity’s noninterest expense, 75% phased-in, including estimated fair value adjustments and excluding restructuring charges.
(2) Based on 7 trading day VWAP ending 10.28.14 ($25.4519)
25
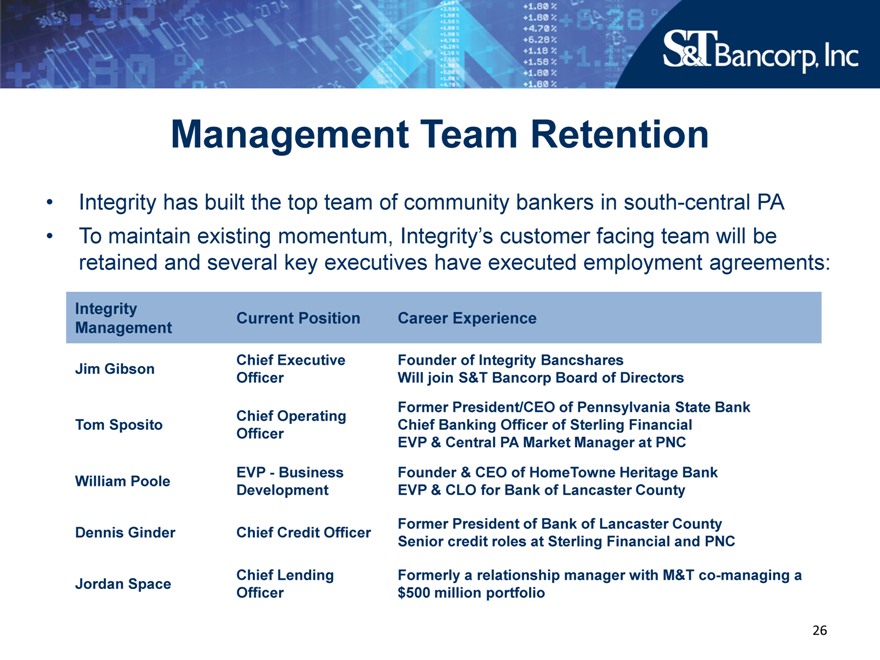
Management Team Retention
Integrity has built the top team of community bankers in south-central PA
To maintain existing momentum, Integrity’s customer facing team will be retained and several key executives have executed employment agreements:
Integrity Current Position Career Experience
Management
Chief Executive Founder of Integrity Bancshares
Jim Gibson Officer Will join S&T Bancorp Board of Directors
Chief Operating Former President/CEO of Pennsylvania State Bank
Tom Sposito Chief Banking Officer of Sterling Financial
Officer EVP & Central PA Market Manager at PNC
William Poole EVP—Business Founder & CEO of HomeTowne Heritage Bank
Development EVP & CLO for Bank of Lancaster County
Dennis Ginder Chief Credit Officer Former President of Bank of Lancaster County
Senior credit roles at Sterling Financial and PNC
Jordan Space Chief Lending Formerly a relationship manager with M&T co-managing a
Officer $500 million portfolio
26
The Right Size
Big enough to:
– Provide full complement of products and services
– Access technology
– Access capital markets
– Attract talent
– Expand – mergers and acquisitions/de novo
Small enough to:
– Stay close to our customers
– Understand our markets
– Be responsive
27
Income Statement
2014 2013 2012 2011 2010
Net Interest Income $148,042 $139,193 $135,227 $137,346 $145,846
Noninterest Income 46,338 51,527 51,912 44,057 47,210
Total Revenue 194,380 190,720 187,139 181,403 $193,056
Noninterest Expense 117,240 117,392 122,863 103,908 105,633
Provision for Loan Losses 1,715 8,311 22,815 15,609 29,511
Net Income Before Taxes 75,425 65,017 41,461 61,886 57,912
Taxes 17,515 14,478 7,261 14,622 14,432
Net Income 57,910 50,539 34,200 47,264 43,480
Preferred Stock Dividends and Discount Amortization — — — 7,611 6,201
Net Income Available to Common Shareholders $57,910 $50,539 $34,200 $39,653 $37,279
Diluted Earnings per Share $1.95 $1.70 $1.18 $1.41 $1.34
Dollars in thousands, except per share data
28
Balance Sheet
2014 2013 2012 2011 2010
Securities $640,273 $509,425 $452,266 $356,371 $286,887
Interest-bearing Balances 57,048 53,594 257,116 208,854 61,260
Loans, Net 3,823,805 3,522,080 3,322,637 3,083,768 3,312,540
Other 443,560 448,091 494,683 471,001 453,652
Total Assets $4,964,686 $4,533,190 $4,526,702 $4,119,994 $4,114,339
Deposits $3,908,842 $3,672,308 $3,638,428 $3,335,859 $3,317,524
Borrowings 385,666 241,276 262,302 227,863 160,637
Other Liabilities 61,789 48,300 88,550 65,746 57,513
Equity 608,389 571,306 537,422 490,526 578,665
Total Liabilities & Equity $4,964,686 $4,533,190 $4,526,702 $4,119,994 $4,114,339
Dollars in thousands
29
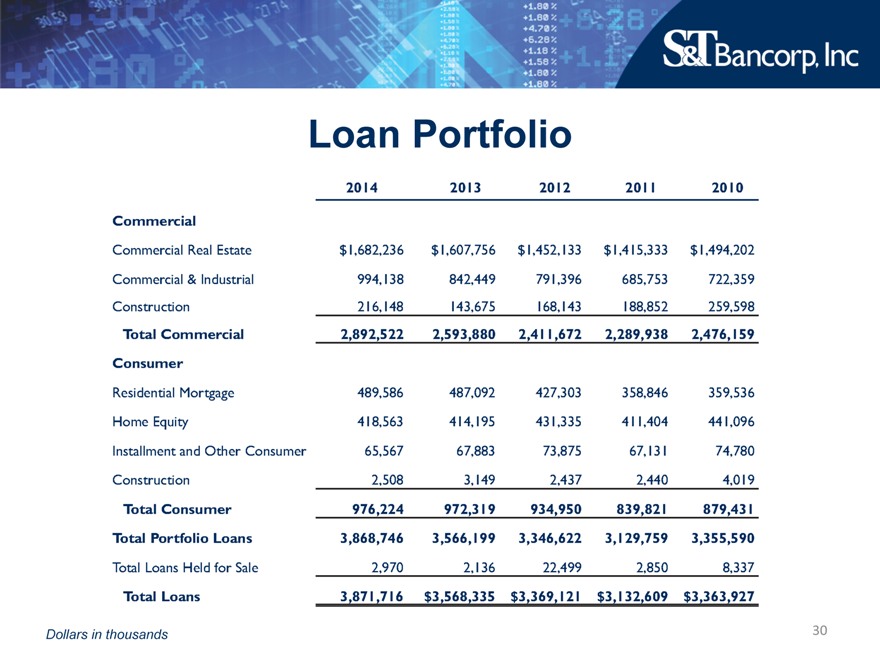
Loan Portfolio
2014 2013 2012 2011 2010
Commercial
Commercial Real Estate $1,682,236 $1,607,756 $1,452,133 $1,415,333 $1,494,202
Commercial & Industrial 994,138 842,449 791,396 685,753 722,359
Construction 216,148 143,675 168,143 188,852 259,598
Total Commercial 2,892,522 2,593,880 2,411,672 2,289,938 2,476,159
Consumer
Residential Mortgage 489,586 487,092 427,303 358,846 359,536
Home Equity 418,563 414,195 431,335 411,404 441,096
Installment and Other Consumer 65,567 67,883 73,875 67,131 74,780
Construction 2,508 3,149 2,437 2,440 4,019
Total Consumer 976,224 972,319 934,950 839,821 879,431
Total Portfolio Loans 3,868,746 3,566,199 3,346,622 3,129,759 3,355,590
Total Loans Held for Sale 2,970 2,136 22,499 2,850 8,337
Total Loans 3,871,716 $3,568,335 $3,369,121 $3,132,609 $3,363,927
Dollars in thousands
30
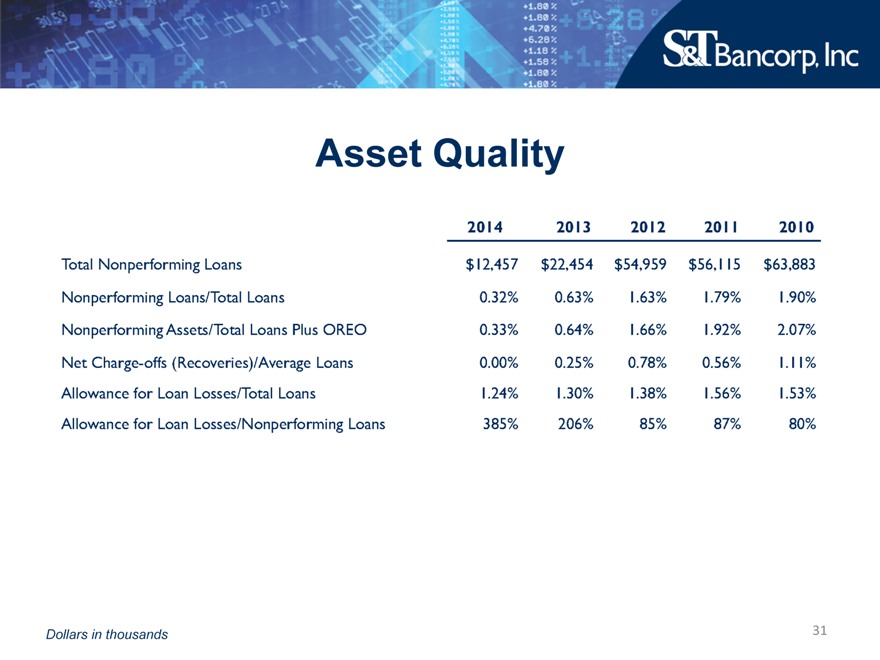
Asset Quality
2014 2013 2012 2011 2010
Total Nonperforming Loans $12,457 $22,454 $54,959 $56,115 $63,883
Nonperforming Loans/Total Loans 0.32% 0.63% 1.63% 1.79% 1.90%
Nonperforming Assets/Total Loans Plus OREO 0.33% 0.64% 1.66% 1.92% 2.07%
Net Charge-offs (Recoveries)/Average Loans 0.00% 0.25% 0.78% 0.56% 1.11%
Allowance for Loan Losses/Total Loans 1.24% 1.30% 1.38% 1.56% 1.53%
Allowance for Loan Losses/Nonperforming Loans 385% 206% 85% 87% 80%
Dollars in thousands
31
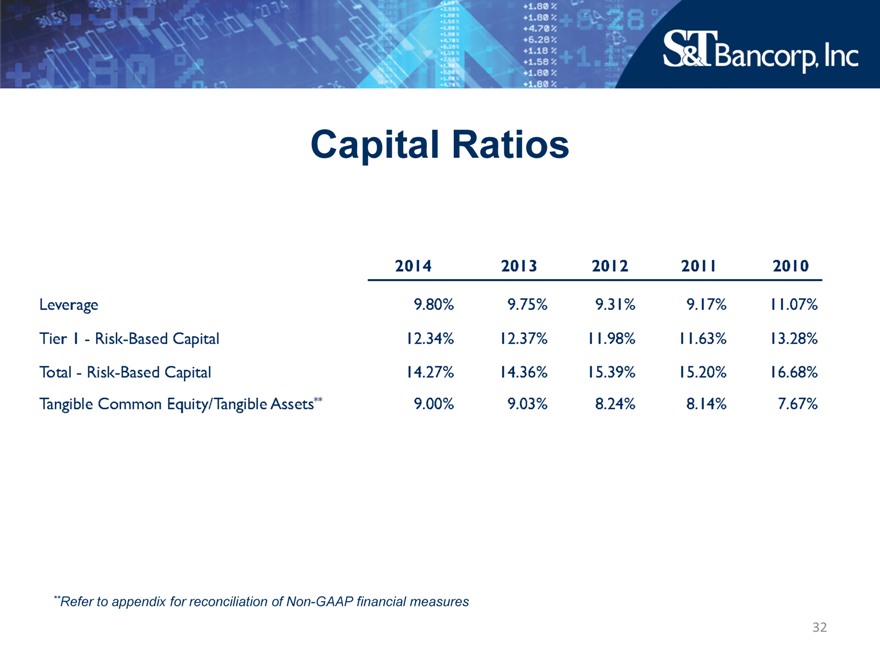
Capital Ratios
2014 2013 2012 2011 2010
Leverage 9.80% 9.75% 9.31% 9.17% 11.07%
Tier I – Risk-Based Capital 12.34% 12.37% 11.98% 11.63% 13.28%
Total – Risk-Based Capital 14.27% 14.36% 15.39% 15.20% 16.68%
Tangible Common Equity/Tangible Assets** 9.00% 9.03% 8.24% 8.14% 7.67%
**Refer to appendix for reconciliation of Non-GAAP financial measures
32
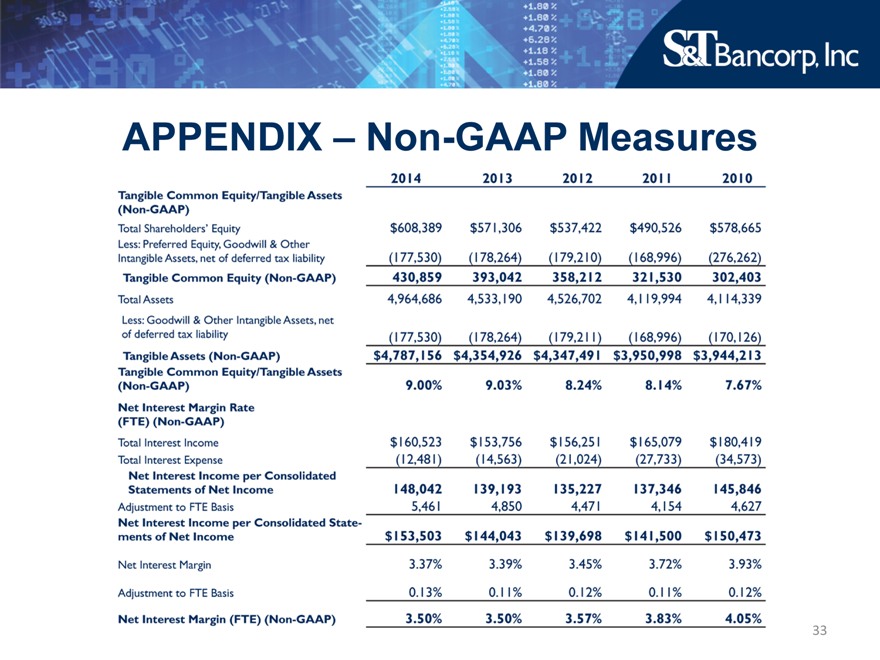
APPENDIX – Non-GAAP Measures
2014 2013 2012 2011 2010
Tangible Common Equity/Tangible Assets
(Non-GAAP)
Total Shareholders’ Equity $608,389 $571,306 $537,422 $490,526 $578,665
Less: Preferred Equity, Goodwill & Other
Intangible Assets, net of deferred tax liability (177,530) (178,264) (179,210) (168,996) (276,262)
Tangible Common Equity (Non-GAAP) 430,859 393,042 358,212 321,530 302,403
Total Assets 4,964,686 4,533,190 4,526,702 4,119,994 4,114,339
Less: Goodwill & Other Intangible Assets, net
of deferred tax liability (177,530) (178,264) (179,211) (168,996) (170,126)
Tangible Assets (Non-GAAP) $4,787,156 $4,354,926 $4,347,491 $3,950,998 $3,944,213
Tangible Common Equity/Tangible Assets
(Non-GAAP) 9.00% 9.03% 8.24% 8.14% 7.67%
Net Interest Margin Rate
(FTE) (Non-GAAP)
Total Interest Income $160,523 $153,756 $156,251 $165,079 $180,419
Total Interest Expense (12,481) (14,563) (21,024) (27,733) (34,573)
Net Interest Income per Consolidated
Statements of Net Income 148,042 139,193 135,227 137,346 145,846
Adjustment of FTE Basis 5,461 4,850 4,471 4,154 4,627
Net Interest Income per Consolidated State-
ments of Net Income $153,503 $144,043 $139,698 $141,500 $150,473
Net Interest Margin 3.37% 3.39% 3.45% 3.72% 3.93%
Adjustment to FTE Basis 0.13% 0.11% 0.12% 0.11% 0.12%
Net Interest Margin (FTE) (Non-GAAP) 3.50% 3.50% 3.57% 3.83% 4.05%
33
S&T Bancorp, Inc