UNITED STATES
SECURITIES AND EXCHANGE COMMISSION
Washington, D.C. 20549
FORM 20-F
o | | REGISTRATION STATEMENT PURSUANT TO SECTION 12(b) OR (g) OF THE SECURITIES EXCHANGE ACT OF 1934 |
|
Or |
|
x | | ANNUAL REPORT PURSUANT TO SECTION 13 OR 15(d) OF THE SECURITIES EXCHANGE ACT OF 1934 |
|
For the fiscal year ended September 30, 2012 |
|
Or |
|
o | | TRANSITION REPORT PURSUANT TO SECTION 13 OR 15(d) OF THE SECURITIES
EXCHANGE ACT OF 1934 |
|
Or |
|
o | | SHELL COMPANY REPORT PURSUANT TO SECTION 13 OR 15(d) OF THE SECURITIES
EXCHANGE ACT OF 1934 |
Commission File Number: 1-10167
WESTPAC BANKING CORPORATION
Australian Business Number 33 007 457 141
(Exact name of Registrant as specified in its charter)
New South Wales, Australia
(Jurisdiction of incorporation or organization)
275 Kent Street, Sydney, NSW 2000, Australia
(Address of principal executive offices)
Securities registered or to be registered pursuant to Section 12(b) of the Act:
Title of each class | | Name of each exchange on which registered |
Ordinary shares | | Listed on the New York Stock Exchange, not for trading, but only in connection with the registration of related American Depositary Shares, pursuant to the requirements of the New York Stock Exchange. |
American Depositary Shares, each representing the right to receive five ordinary shares | | New York Stock Exchange |
Securities registered or to be registered pursuant to Section 12(g) of the Act: None
Securities for which there is a reporting obligation pursuant to Section 15(d) of the Act: 2.25% Notes due November 19, 2012, 2.10% Notes due August 2, 2013, 1.85% Notes due December 9, 2013, Floating Rate Notes due 2013, 4.20% Notes due February 27, 2015, 3.00% Notes due August 4, 2015, 1.125% Notes due September 2015, Floating Rate Notes due September 2015, 3.0% Notes due December 9, 2015, 2.0% Notes due August 2017, 4.625% Subordinated Notes due 2018, 4.875% Notes due November 19, 2019 and notes issued from time to time under our Retail Medium-Term Notes program (Registration Statement No. 333-172579)
Indicate the number of outstanding shares of each of the issuer’s classes of capital or common stock as of the close of the period covered by the annual report.
Ordinary shares | | 3,080,192,894 fully paid |
Indicate by check mark if the registrant is a well-known seasoned issuer, as defined in Rule 405 of the Securities Act.
Yes x No o
If this report is an annual or transition report, indicate by check mark if the registrant is not required to file reports pursuant to Section 13 or 15(d) of the Securities Exchange Act of 1934.
Yes o No x
Indicate by check mark whether the registrant (1) has filed all reports required to be filed by Section 13 or 15(d) of the Securities Exchange Act of 1934 during the preceding 12 months (or for such shorter period that the registrant was required to file such reports), and (2) has been subject to such filing requirements for the past 90 days.
Yes x No o
Indicate by check mark whether the registrant has submitted electronically and posted on its corporate web site, if any, every Interactive Data File required to be submitted and posted pursuant to Rule 405 of Regulation S-T during the preceding 12 months (or for such shorter period that the registrant was required to submit and post such files).
Yes o No x (not currently applicable to registrant)
Indicate by check mark whether registrant is a large accelerated filer, an accelerated filer, or a non-accelerated filer.
Large accelerated filer x Accelerated Filer o Non-accelerated filer o
Indicate by check mark which basis of accounting the registrant has used to prepare the financial statements included in this filing:
U.S. GAAP o International Financial Reporting Standards as issued by the International Accounting Standards Board x
Other o
If this is an annual report, indicate by check mark whether the registrant is a shell company.
Yes o No x
| WESTPAC GROUP |
| |
| 2012 ANNUAL REPORT |
| |
| |
| |
| |
| |
| US FORM 20-F |
| |
| |
| Annual Report | |
| Form 20-F cross-reference index | 2 |
| Guide 3 cross-reference index | 4 |
| Section 1 | 5 |
| Information on Westpac | 6 |
| Business strategy | 6 |
| Westpac’s approach to sustainability | 9 |
| Five year non-financial summary | 11 |
| Outlook | 13 |
| Significant developments | 14 |
| Corporate governance | 22 |
| Directors’ report | 40 |
| Remuneration report | 51 |
| Section 2 | 73 |
| Five year summary | 74 |
| Reading this report | 75 |
| Review of Group operations | 77 |
| Income statement review | 79 |
| Balance sheet review | 88 |
| Capital resources | 92 |
| Commitments | 93 |
| Divisional performance | 95 |
| Australian Financial Services | 98 |
| Westpac Retail & Business Banking | 99 |
| St.George Banking Group | 101 |
| BT Financial Group (Australia) | 103 |
| Westpac Institutional Bank | 105 |
| Westpac New Zealand | 106 |
| Other divisions | 108 |
| Risk and risk management | 113 |
| Risk factors | 113 |
| Risk management | 118 |
| Credit risk | 118 |
| Liquidity risk | 121 |
| Market risk | 122 |
In this Annual Report a reference to ‘Westpac’, ‘Group’, ‘Westpac Group’, ‘we’, ‘us’ and ‘our’ is to Westpac Banking Corporation ABN 33 007 457 141 and its subsidiaries unless it clearly means just Westpac Banking Corporation. For certain information about the basis of preparing the financial information in this Annual Report see ‘Reading this report’ in Section 2. In addition, this Annual Report contains statements that constitute ‘forward-looking statements’ within the meaning of section 21E of the US Securities Exchange Act of 1934. For an explanation of forward-looking statements and the risks, uncertainties and assumptions to which they are subject, see ‘Reading this report’ in Section 2. Information contained in or accessible through the websites mentioned in this Annual Report does not form part of this report unless we specifically state that it is incorporated by reference and forms part of this report. All references in this report to websites are inactive textual references and are for information only. | Operational and compliance risk | 123 |
Other risks | 123 |
Other Westpac business information | 126 |
Section 3 | 129 |
Financial statements | 130 |
Notes to the financial statements | 135 |
Statutory statements | 291 |
Section 4 | 297 |
Shareholding information | 298 |
Additional information | 309 |
Information for shareholders | 314 |
Glossary of abbreviations and defined terms | 316 |
| | |
| 2012 WESTPAC GROUP ANNUAL REPORT | 1 |
FORM 20-F CROSS-REFERENCE INDEX
(for the purpose of filing with the United States Securities and Exchange Commission)
20-F item number and description | Page |
Part I | | |
Item 1. | Identity of directors, senior management and advisers | Not applicable |
Item 2. | Offer statistics and expected timetable | Not applicable |
Item 3. | Key information | |
| Selected financial data | 74, 79, 88–89, 312 |
| Capitalisation and indebtedness | Not applicable |
| Reasons for the offer and use of proceeds | Not applicable |
| Risk factors | 113–118 |
Item 4. | Information on Westpac | |
| History and development of Westpac | 6, 13–19 |
| Business overview | 6–9, 13–21 |
| Organisational structure | 7–8, 276–278 |
| Property, plant and equipment | 126 |
Item 4A. | Unresolved staff comments | Not applicable |
Item 5. | Operating and financial review and prospects | |
| Operating results | 77–92, 95–112 |
| Liquidity and capital resources | 92–94, 121, 123–125 |
| Research and development, patents, licences etc. | Not applicable |
| Trend information | 79–92, 95–112 |
| Off-balance sheet arrangements | 125 |
| Tabular disclosure of contractual obligations | 93 |
| Safe harbor | 75 |
Item 6. | Directors, senior management and employees | |
| Directors and senior management | 40–45, 47–48 |
| Compensation | 51–69, 280–289 |
| Board practices | 24–37, 40–43 |
| Employees | 126 |
| Share ownership | 47–48, 280–289 |
Item 7. | Major equity holders and related party transactions | |
| Major equity holders | 298–302 |
| Related party transactions | 127, 280 |
| Interests of experts and counsel | Not applicable |
Item 8. | Financial information | |
| Consolidated statements and other financial information | 129–296 |
| Significant changes | 14–19, 290 |
Item 9. | The offer and listing | |
| Offer and listing details | 303 |
| Plan of distribution | Not applicable |
| Markets | 314 |
| Selling shareholders | Not applicable |
| Dilution | Not applicable |
| Expenses of the issue | Not applicable |
| | |
2 | 2012 WESTPAC GROUP ANNUAL REPORT | |
FORM 20-F CROSS-REFERENCE INDEX
(for the purpose of filing with the United States Securities and Exchange Commission)
| | Page |
| | |
Item 10. | Additional information | |
| Share capital | Not applicable |
| Memorandum and articles of association | 309–311 |
| Material contracts | 267–268 |
| Exchange controls | 305–306 |
| Taxation | 306–308 |
| Dividends and paying agents | Not applicable |
| Statements by experts | Not applicable |
| Documents on display | 311 |
| Subsidiary information | Not applicable |
Item 11. | Quantitative and qualitative disclosures about market risk | 122, 236–239, 255 |
Item 12. | Description of securities other than equity securities | |
| Debt securities | Not applicable |
| Warrants and rights | Not applicable |
| Other securities | Not applicable |
| American depositary shares | 304 |
Part II | | |
Item 13. | Defaults, dividend arrearages and delinquencies | Not applicable |
Item 14. | Material modifications to the rights of security holders and use of proceeds | Not applicable |
Item 15. | Controls and procedures | 125, 292, 295–296 |
Item 16A. | Audit committee financial expert | 31 |
Item 16B. | Code of ethics | 28–30 |
Item 16C. | Principal accountant fees and services | 32, 266 |
Item 16D. | Exemptions from the Listing Standards for audit committees | Not applicable |
Item 16E. | Purchases of equity securities by the issuer and affiliated purchasers | 93, 185–186 |
Item 16F. | Changes in Registrant’s certifying accountant | Not applicable |
Item 16G. | Corporate governance | 22 |
Item 16H. | Mine safety disclosure | Not applicable |
| | |
| | |
Part III | | |
Item 17. & 18. | Financial statements | 129–290 |
Item 19. | Exhibits | |
Consolidated income statements for the years ended 30 September 2012, 2011 and 2010 | 130 |
Consolidated balance sheets as at 30 September 2012 and 2011 | 132 |
Consolidated statements of comprehensive income for the years ended 30 September 2012, 2011 and 2010 | 131 |
Consolidated statements of cash flows for the years ended 30 September 2012, 2011 and 2010 | 134 |
Notes to the financial statements | 135–290 |
Management’s report on the internal control over financial reporting | 292 |
Report of independent registered public accounting firm | 293–296 |
| | |
| 2012 WESTPAC GROUP ANNUAL REPORT | 3 |
GUIDE 3 CROSS-REFERENCE INDEX
| Page |
Part I Distribution of assets, liabilities and stockholders’ equity: interest rates and interest differential | |
Average balance sheets | 88, 197–200 |
Analysis of net interest earnings | 80–81, 197–200 |
Volume and rate movement | 80, 197–200 |
Part II Investment portfolio | |
Book value of investments | 161 |
Maturity profile | 162, 233–234 |
Book value and market value > 10% of shareholders | 161 |
Part III Loan portfolio | |
Types of loans | 163–164 |
Maturities and sensitivities of loans to changes in interest rates | 165 |
Risk elements | |
Non-accrual, past due and restructured loans | 91–92, 224–225 |
Potential problem loans | 91–92 |
Foreign outstandings | 120 |
Loan concentrations | 118–119 |
Other interest bearing assets | 160–162, 217 |
Part IV Summary of loan loss experience | |
Analysis of the allowance for loan losses | 166–169 |
Allocation of the allowance for loan losses | 166–169 |
Part V Deposits | 177–178 |
Part VI Return on equity and assets | 74, 89 |
Part VII Short-term borrowings | 180–181 |
| | |
4 | 2012 WESTPAC GROUP ANNUAL REPORT | |
INFORMATION ON WESTPAC
CORPORATE GOVERNANCE
DIRECTORS’ REPORT
REMUNERATION REPORT
Westpac is one of the four major banking organisations in Australia and one of the largest banking organisations in New Zealand. We provide a broad range of banking and financial services in these markets, including retail, business and institutional banking and wealth management services.
We have branches, affiliates and controlled entities1 throughout Australia, New Zealand and the Pacific region, and maintain branches and offices in some of the key financial centres around the world2.
We were founded in 1817 and were the first bank established in Australia. In 1850 we were incorporated as the Bank of New South Wales by an Act of the New South Wales Parliament. In 1982 we changed our name to Westpac Banking Corporation following our merger with the Commercial Bank of Australia. On 23 August 2002, we were registered as a public company limited by shares under the Australian Corporations Act 2001 (Cth) (Corporations Act).
As at 30 September 2012, our market capitalisation was $76.5 billion3 and we had total assets of $675 billion.
Business strategy
Westpac’s vision is ‘To be one of the world’s great companies, helping our customers, communities and people to prosper and grow’.
Our strategy seeks to deliver on this vision by providing superior returns for our shareholders, building deep and enduring customer relationships, being a leader in the community and being a place where the best people want to work.
In delivering on our strategy we are focused on our core markets of Australia, New Zealand and the near Pacific, where we provide a comprehensive range of financial products and services that assist us in meeting all the financial services needs of our customers. With our strong position in these markets, and nearly 12 million customers, our focus is on organic growth, growing customer numbers in our chosen segments and building stronger and deeper customer relationships.
A key element of this approach is our portfolio of financial services brands which enables us to appeal to a broader range of customers, and provides us with the strategic flexibility to offer solutions that better meet individual customer needs.
In implementing this strategy, we seek to grow customer numbers in chosen segments and increase the number of products per customer with a specific focus on deposits, and wealth and insurance cross sell.
Asia is an important market for us and we are progressively building our presence and capability across the region to better support Australian and New Zealand customers operating, trading and transacting in the region, along with Asian customers seeking financial solutions and services in Australia and New Zealand.
While continuing to build the business, the more challenging financial services environment has required us to focus on strengthening our financial position while at the same time improving efficiency. This strengthening has involved lifting the level and quality of our capital, improving our funding and liquidity position and maintaining a high level of asset quality and provisioning.
While we currently have a relatively low cost to income ratio, we continue to seek opportunities to streamline and simplify our business, to improve the quality of experience for customers and reduce our unit costs.
Our sustainability strategy supports this approach by anticipating and shaping the most pressing emerging social issues where we have the skills and experience to make a meaningful difference and drive business value. These areas are:
§ anticipating the big shifts of demographic and cultural change and their impact on our workplace and customers;
§ creating economic solutions to environmental challenges; and
§ helping customers achieve sustainable financial futures in a changed landscape.
Our approach seeks to make sustainability part of the way we do business, embedded in our strategy, values, culture and processes.
We believe that successful execution of our strategy will lead to higher revenue per customer and strong credit quality (because we know our customers very well) and a superior cost profile.
Supporting our customer focused strategy is a strong set of company-wide values, which are well embedded in our culture. These are:
§ delighting customers;
§ working as one team, valuing each other;
§ acting with integrity;
§ having the courage to deal with change; and
§ achievement.
1 Refer to Note 38 to the financial statements for a list of our controlled entities as at 30 September 2012.
2 Contact details for our head office, major businesses and offshore locations can be found on the inside back cover.
3 Based on the closing share price of our ordinary shares on the ASX as at 28 September 2012.
| | |
6 | 2012 WESTPAC GROUP ANNUAL REPORT | |
Strategic priorities
To meet the challenges of the current environment, and deliver on our strategy, we have a set of strategic priorities that are reviewed and refreshed each year. We will continue to manage these priorities in a balanced way with an appropriate mix of growth, return, risk and productivity. Our current strategic priorities are to:
a) Maintain a strong company
§ maintain strong levels of capital, to meet the needs of all our stakeholders and regulators;
§ further strengthen our funding and liquidity position, including increasing the proportion of customer deposits in our funding base;
§ maintain a high quality portfolio of assets, coupled with strong provisioning; and
§ maintain a strong reputation and sustainability leadership.
b) Reorient the business to higher growth/higher return sectors and segments
§ targeted investment in higher growth sectors and segments, including deposits, the pre-retiree/retiree segment, along with the resources, trade, agribusiness and small business sectors;
§ increase investment in our wealth businesses, including development of a new next generation funds platform; and
§ building the reach and capability of our Asian network.
c) Continue building deeper customer relationships
§ place customers at the centre of everything we do, with a focus on meeting their total financial needs, throughout their lives;
§ drive a deposits first culture and further building the connectivity between wealth/insurance and banking;
§ strengthen the skills of our people, to better support customers and their complete financial services needs; and
§ drive digital innovation to better meet customer demands for more banking on the move.
d) Materially simplify products and processes
§ complete the investment and implementation of the strategic investment priorities and the supplier programs;
§ continue to enhance our digital offers to support more customers online and assist the Group in the move to smaller, more flexible and agile branch formats;
§ simplify our products and processes and continue to drive continuous improvement; and
§ focus on both revenue and cost productivity.
e) Strengthen our one team approach
§ continuing the drive to a customer centred, high performance workforce and culture;
§ strengthening the skills of our people, to better support customers’ complete financial services needs;
§ empowering innovation and responsiveness to change; and
§ continuing to enhance the diversity of our workforce.
Organisational structure
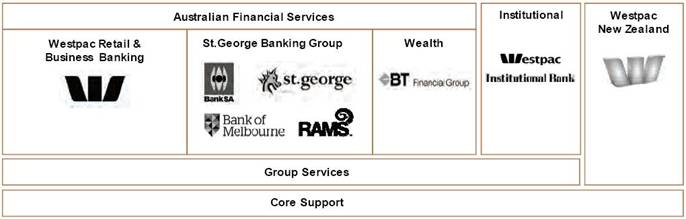
Our operations comprise the following key customer-facing business divisions operating under multiple brands serving around 12 million customers1.
§ Australian Financial Services (AFS) is responsible for the Westpac Group’s Australian retail banking, business banking and wealth operations. AFS also includes the product and risk responsibilities for Australian Banking. It incorporates the operations of Westpac Retail & Business Banking (Westpac RBB), St.George Banking Group (St.George) and BT Financial Group Australia (BTFG), as follows:
– Westpac RBB is responsible for sales and service for our consumer, small-to-medium enterprise (SME) customers and commercial customers (typically with turnover of up to $100 million) in Australia under the Westpac brand. Activities are conducted through Westpac RBB’s network of branches, business banking centres, and specialised consumer and business relationship managers, with the support of cash flow, financial markets and wealth specialists, customer service centres, automatic teller machines (ATMs) and internet channels;
– St.George is responsible for sales and service for our consumer, business and corporate customers in Australia under the St.George, BankSA, Bank of Melbourne and RAMS brands. RAMS is a financial service group specialising in mortgages. Consumer activities are conducted through a network of branches, third-party distributors, call centres, ATMs, EFTPOS terminals and internet banking services. Business and corporate customers (businesses with facilities typically up to $150 million) are provided with a wide range of banking and financial products and services including specialist advice for cash flow finance, trade finance, automotive and equipment finance, property finance, transaction banking and treasury services. Sales and service activities for business and corporate customers are conducted by relationship managers via business banking centres, internet and customer service centre channels; and
1 All customers, primary and secondary, with an active relationship (excludes channel only and potential relationships) as at 30 September 2012.
| | |
| 2012 WESTPAC GROUP ANNUAL REPORT | 7 |
– BTFG is Westpac’s Australian wealth management division. BTFG’s funds management operations include the manufacturing and distribution of investment, superannuation and retirement products; investment platforms such as Wrap and master trusts; and private banking and financial planning. BTFG’s insurance solutions cover the manufacturing and distribution of life, general and lenders mortgage insurance. BTFG’s brands include Advance Asset Management, Ascalon, Asgard, BT, BT Investment Management (64.5% owned by Westpac and consolidated in BTFG’s Funds Management business), BT Select, Licensee Select, Magnitude, Securitor and the advice, private banking and insurance operations of Bank of Melbourne, BankSA, St.George and Westpac.
§ Westpac Institutional Bank (WIB) delivers a broad range of financial services to commercial, corporate, institutional and government customers with connections to Australia and New Zealand. WIB operates through dedicated industry relationship and specialist product teams, with expert knowledge in transactional banking, financial and debt capital markets, specialised capital and alternative investment solutions. Customers are supported through branches and subsidiaries located in Australia, New Zealand, the United States, United Kingdom and Asia.
§ Westpac New Zealand is responsible for the sales and service of banking, wealth and insurance products for consumers, business and institutional customers in New Zealand. Westpac conducts its New Zealand banking business through two banks in New Zealand; Westpac New Zealand Limited, which is incorporated in New Zealand and Westpac Banking Corporation (NZ Division) 5, which is incorporated in Australia. Westpac New Zealand operates via an extensive network of branches and ATMs across both the North and South Islands. Business and institutional customers are also served through relationship and specialist products teams. Banking products are provided under the Westpac and WIB brands, while insurance and wealth products are provided under Westpac Life and BT brands respectively.
Other divisions in the Group include:
§ Pacific Banking, which provides banking services for retail and business customers in seven Pacific Island Nations. Branches, ATMs, telephone banking and internet banking channels are used to deliver business activities in Fiji, Papua New Guinea (PNG), Vanuatu, Cook Islands, Tonga, Solomon Islands and Samoa. Pacific Banking’s financial products include personal savings accounts, business transactional accounts, personal and business lending products, business services and a range of international products;
§ Group Services, encompassing technology, banking operations, legal and property services;
§ Treasury, which is primarily focused on the management of the Group’s interest rate risk and funding requirements; and
§ Core Support, which comprises those functions performed centrally including finance, risk and human resources.
These businesses are described in more detail in Section 2, including a summary of net profit and total assets by business division, and management’s discussion and analysis of business division performance.
1 On 1 November 2011, various business activities of Westpac Banking Corporation (NZ Division) were transferred to Westpac New Zealand Limited. See ‘New Zealand – Transfer of additional banking operations to Westpac New Zealand Limited on 1 November 2011’ in ‘Significant developments’.
| | |
8 | 2012 WESTPAC GROUP ANNUAL REPORT | |
Westpac’s approach to sustainability
As an acknowledged global leader in sustainability we continue to adapt our approach and actions to fit the changing world within which we live.
Our sustainability strategy is based upon the use of the widely accepted global standard for Corporate Responsibility and Sustainable Development (AA10001).
Our sustainability principles
In line with the global standard, we have adopted the standard’s three key principles. These are:
1. Involving all stakeholders upon whom we have an impact in developing our strategy – Inclusivity;
2. Evaluating all issues identified to determine the impact they may have on our stakeholders and ourselves – Sustainability materiality; and
3. Ensuring that our decisions, actions and performance, as well as our communication with stakeholders, are responsive to the issues identified with our stakeholders – Responsiveness.
Inclusivity
Key components of our approach to inclusivity during 2012 have included:
§ continued work to understand and address customer concerns;
§ collaborating with key external stakeholders in order to inform our approach;
§ consulting with employees so as to better understand the drivers of strong employee engagement;
§ ongoing monitoring of our reputation across a wide range of mediums; and
§ a close working relationship with numerous community organisations through employee volunteering, workplace giving and community support.
Sustainability materiality
As part of our materiality review we identify, prioritise and define issues according to their impact on our stakeholders and our business. These issues are reviewed externally and internally before being assured by KPMG.
Significant sustainability issues identified in 2012 include:
§ financial literacy and inclusion;
§ managing regulation;
§ responsible lending and investment;
§ diversity, flexibility and participation;
§ customer relationships;
§ digitisation;
§ climate change;
§ providing social outcomes;
§ workforce restructuring;
§ the global financial crisis;
§ wealth management;
§ reputation; and
§ attracting and retaining talent.
Responsiveness
The issues identified feed directly into the development of our sustainability strategy, objectives setting and performance measures.
In 2008, we set ourselves a number of objectives for completion between 2011 and 2014, and we have achieved good progress in most areas.
Details of our current performance are provided on the following pages.
In December 2011, the Board endorsed a refreshed sustainability strategy which is to anticipate and respond to the most pressing emerging societal issues where we have the skills and experience to make a meaningful, positive impact.
This new strategy and supporting objectives are discussed in greater detail in the ‘Business Strategy’ section of this report.
1 AA1000 is a voluntary framework developed by the AccountAbility organisation using a multi-stakeholder consultation process. This standard provides a framework for identifying, prioritising and responding to sustainability challenges.
| | |
| 2012 WESTPAC GROUP ANNUAL REPORT | 9 |
The following table sets out our performance against financial year sustainability objectives from 2008 to 2013.
Customer | | |
To be ranked as 1 and 2 for Net Promoter Score (NPS) 1 in Australia amongst the major banks and St.George Banking Group. | | Partially achieved – St.George continues to be ranked 1 for NPS amongst the major banks for business customers, while Westpac is currently ranked 3. St.George and Westpac also hold these ranks in the SME business segment, while in the Commercial business segment St.George and Westpac are currently ranked 1 and 4 respectively amongst the major banks. In the Affluent segment, Westpac holds 5th place. Next year we will adopt ‘Growth in MyBank Customers’ as a more appropriate measure to assess our progress on ‘driving deep and enduring customer relationships’ (one of our key strategic objectives). MyBank customers have a quality and frequent transaction relationship with us and at least two additional quality financial needs met. |
| | |
To achieve Net Promoter Scores of +1 for retail and –12 for business in Westpac New Zealand. | | Not achieved – While the NZ retail NPS has steadily improved the target has not yet been met. The target has been revised from 2011, as we are now using a business unit NPS measure. |
| | |
To be a top 3 regional player in carbon related markets by 2013. | | Achieved – Westpac Institutional Bank offers a full range of financial solutions across regional carbon markets. Westpac has traded in the European carbon market since 2006 and is the largest financial intermediary and the principal New Zealand unit price maker in the domestic currency. Westpac’s capabilities in carbon markets are well positioned for the introduction of the Australian Carbon Price Mechanism and its future linkage with the EU Emissions Trading Scheme. |
Employee | | |
To increase the percentage of Women in Leadership roles to 40% by the end of 2014. | | Due 2014 – As at 30 September 2012, 40% of leadership roles were filled by women against our Full Year 2012 target of 38.5% and from a base of 33% early in 2010. |
| | |
To implement initiatives to address the outcomes of our Diversity Audit. | | Achieved – We continue to build momentum in our broader Diversity Program including: establishing a roadmap for embedding more flexible ways to work as a key focus for 2013; continuing our commitment to Indigenous communities in Australia, New Zealand and the Pacific; building strength in making our workplace accessible to all, including people with disabilities; refreshing our mature age strategy to further cement Westpac Group’s position as an employer of choice; and supporting greater inclusion of people of all sexualities through the establishment of an Employee Action Group (EAG) and extending the range of the EAG. |
Community | | |
To reduce Scope 1 and 22 emissions by 30% on 2008 baseline3 by 2013. | | Due 2013 – Emissions are currently tracking below pre-2008 levels but are above the levels required to meet the 2013 five-year target. |
| | |
To embed Organisational Mentoring into operational processes by 2013. | | Achieved – Organisational mentoring is now fully embedded into operational processes. In Full Year 2012, there were 75 active participants supporting approximately 33 not-for-profit organisations, social enterprises and social sector projects. Organisational mentoring is also being utilised by employees as a unique development opportunity in addition to providing meaningful community support. |
| | |
To provide the Managing Your Money program to 45,000 New Zealanders by 2013; and implement financial literacy education for SME customers in New Zealand. | | Achieved – Since launching the ‘Managing Your Money’ program in 2006 over 63,000 New Zealanders have participated in the workshops and online tutorials, and 137 employees have been trained to deliver the program. Building on this success, Westpac launched a new program in Full Year 2012 catering for the SME market. |
| | |
To launch a major initiative to help address social disadvantage. | | Achieved – In its second year, the Group’s partnership with Mission Australia provided funding for specific projects to help address family homelessness in Australia including: a national research project with the goal to enhance the wellbeing of homeless children; and a new Mission Australia Centre in Kingswood (NSW), which will provide accommodation options and support services for families in need. |
1 An explanation of NPS is provided in footnote 5 to the Five Year Non-Financial Summary.
2 Scope 1 emissions are all direct greenhouse gas (GHG) emissions generated by the organisation. Scope 2 emissions are GHG emissions from energy (typically electricity) purchased by the organisation.
3 The 2008 baseline has been adjusted to include St.George Banking Group on a pro forma basis.
| | |
10 | 2012 WESTPAC GROUP ANNUAL REPORT | |
Business | | |
Consideration of Environmental, Social and Governance (ESG) issues incorporated into relevant risk management policies, practices and decision making processes by 2013. | | Achieved – The Group’s ESG Risk Management Framework, ESG Credit Risk Policy and suite of position statements were reviewed and updated during Full Year 2012 to ensure that ESG considerations are embedded more consistently across the Group’s activities. ESG risk management training sessions were also conducted for risk and credit managers. |
| | |
Responsible lending and investment practices embedded in key processes by 2013. | | Due 2013 – In Full Year 2012, BTFG participated in a voluntary pilot of the United Nations Principles of Responsible Investment’s new reporting framework. Advance Asset Management also developed an ESG Research Framework to further embed ESG factors into the investment process. |
FIVE YEAR NON-FINANCIAL SUMMARY
Non-financial information as at 30 September unless indicated otherwise1 | | 2012 | | 2011 | | 2010 | | 2009 | | 2008 | |
Customer | | | | | | | | | | | |
Total customers (millions)2 | | 11.8 | | 11.5 | | 11.3 | | 10.6 | | 6.9 | |
Total online customers – active registrations (millions)3 | | 4.0 | | 3.7 | | 3.4 | | 4.3 | | 3.3 | |
Number of points of bank representation | | 1,538 | | 1,532 | | 1,517 | | 1,491 | | 1,089 | |
Number of ATMs | | 3,639 | | 3,544 | | 3,625 | | 3,540 | | 2,285 | |
Percentage of Talking ATMs (%)4 | | 91 | | 88 | | | | | | | |
NPS5 – Westpac Australia – affluent6 | | (18) | | (17) | | (24) | | (16) | | | |
NPS – Westpac Australia – commercial7 | | (4) | | 3 | | (7) | | (5) | | | |
NPS – Westpac Australia – SME7 | | (17) | | (10) | | (21) | | (24) | | | |
NPS – St.George8 consumer6 | | - | | (2) | | (4) | | (9) | | (13) | |
NPS – St.George8 business7 | | 1 | | (5) | | 3 | | (21) | | | |
Social Sector Banking Footings ($m)9 | | 11,490 | | 8,210 | | 7,101 | | 6,072 | | | |
Responsible Investment Funds Under Management ($m)10 | | 981 | | 644 | | 891 | | 717 | | 513 | |
| | | | | | | | | | | |
Employees | | | | | | | | | | | |
Total core full time equivalent staff (number at financial year end) | | 33,418 | | 33,898 | | 35,055 | | 34,189 | | 26,717 | |
Employee Engagement (%)11 | | 84 | | 81 | | 80 | | 81 | | 78 | |
Employee Voluntary Attrition (%)12 | | 9.9 | | 11.5 | | 11.8 | | | | | |
New Starter Retention (%)13 | | 84.8 | | 83.8 | | | | | | | |
High Performer Retention (%)14 | | 95.9 | | 95.3 | | 94.3 | | | | | |
Lost Time Injury Frequency Ratio (LTIFR)15 | | 1.9 | | 2.5 | | 2.6 | | 2.6 | | 3.4 | |
Women as a percentage of the total workforce (%) | | 61 | | 61 | | 61 | | 62 | | 63 | |
Women in Leadership (%)16 | | 40 | �� | 38 | | 35 | | | | | |
| | | | | | | | | | | |
Environment | | | | | | | | | | | |
Total Scope 1 and 2 emissions – Aust and NZ (tonnes CO2-e)17 | | 185,534 | | 184,124 | | 189,425 | | 187,239 | | 197,002 | |
Total Scope 3 emissions – Aust and NZ (tonnes CO2-e)18 | | 51,369 | | 57,163 | | 70,457 | | 61,846 | | 47,694 | |
Total paper usage – Aust and NZ (tonnes)19 | | 6,030 | | 6,262 | | 6,655 | | 7,146 | | 8,791 | |
Proportion of infrastructure and utilities financing in renewables and hydro – Aust and NZ (%)20 | | 52 | | 45 | | 52 | | 51 | | 56 | |
Finance assessed under the Equator Principles – Group ($m)21 | | 1,140 | | 383 | | 364 | | 1,292 | | 1,315 | |
| | | | | | | | | | | |
Social | | | | | | | | | | | |
Community investment ($m)22 | | 133 | | 155 | | 116 | | 84 | | 64 | |
Community investment as a percentage of pre-tax profits (%)23 | | 1.50 | | 1.82 | | 1.44 | | 1.38 | | 1.22 | |
Community investment as a percentage of operating profit before income tax (Cash Earnings basis)24 | | 1.41 | | 1.72 | | 1.37 | | 1.24 | | 1.20 | |
Financial education (number of attendees)25 | | 36,182 | | 42,109 | | | | | | | |
Financial education (number of hours)26 | | 73,301 | | 85,194 | | | | | | | |
| | | | | | | | | | | |
Supply chain | | | | | | | | | | | |
Total supply chain spend – Aust ($bn)27 | | 4.22 | | 4.61 | | 4.39 | | 4.17 | | 2.70 | |
Percentage of top 150 suppliers ($ invoiced) screened for sustainability – Aust (%)28 | | 94 | | 92 | | 86 | | 99 | | 99 | |
| | |
| 2012 WESTPAC GROUP ANNUAL REPORT | 11 |
1 Unless otherwise stated, all data from 2009 includes St.George Banking Group. Dark grey shading indicates information was not collected in the relevant year.
2 All customers, primary and secondary, with an active relationship (excludes channel only and potential relationships).
3 Refers to the number of customers registered for online banking that have signed in within the last 90 days as at 30 September.
4 ATMs with an additional functionality to allow users to plug in an earpiece for oral instruction to provide additional assistance for visually impaired users.
5 Refers to Net Promoter Score to determine the net percentage of customers who would recommend their Main Financial Institution to a friend or colleague. Net Promoter ScoreSM is a trademark of Bain & Co Inc., Satmetrix Systems, Inc., and Mr Frederick Reichheld.
6 Source: Roy Morgan Research, 6MMA (six month moving average).
7 Sources: DBM Consultants Business Financial Service Monitor, September 2011–2012, 6MMA; TNS Business Financial Monitor September 2008-2009, 6MMA.
8 NPS consumer and business scores are for the St.George Banking Group. NPS Business Score for 2010 restated from TNS Business Finance Monitor to DBM Business Financial Services Monitor in order to align with metrics reported by Westpac RBB.
9 Data refers to the total of assets (loans), liabilities (deposits) and funds under management (FUM) of the Westpac RBB business unit dedicated to social sector customers. Social sector customers are categorised according to specific criteria, including organisation structure, account types held, key words and special condition groups. 2010 revised to include footings as at 30 September 2010.
10 Refers to FUM which are managed using sustainable and/or ethical investment processes.
11 Employee engagement score is determined through a voluntary employee survey conducted internally using Towers Watson’s licensed survey methodology and is a score of employee engagement levels at the time the survey is administered. 2011 data excludes Pacific Banking.
12 Employee Voluntary Attrition refers to the total voluntary separation of permanent employees / 12 month average total permanent headcount (full time, part time and maximum term employees). Excludes Pacific Banking.
13 Total New Starter retention / 12 month rolling New Starter headcount for the period (includes full time and part time permanent employees). Excludes Pacific Banking.
14 Total High Performer Retention / 12 month rolling High Performer headcount for the period (includes full time, part time permanent and maximum term employees). Excludes Pacific Banking.
15 Lost Time Injury Frequency Rate (LTIFR) measures the number of injuries or illnesses resulting in an employee being unable to work for a full scheduled day (or shift) where work was a significant factor, per one million hours worked. Excludes Pacific Banking.
16 Women in Leadership refers to the proportion of women (permanent and maximum term employees) in people leadership roles or senior roles of influence as at 30 September as a proportion of all leaders across the Group. Includes CEO, Executive Team, General Managers, Senior Managers refers to direct reports to General Managers and the next two levels of management. Aligned to the Equal Opportunity for Women in the Workplace Agency (EOWA) standard. Excludes Pacific Banking.
17 Refers to Scope 1 and 2 emissions in Australia and New Zealand. Amounts are reported for the period 1 July to 30 June. Prepared in line with the Greenhouse Gas Protocol, ISO 14064-1 standard, the National Greenhouse and Energy Reporting Act 2007 for Australia, and the Certified Emissions Measurement and Reduction Scheme (CEMARS) for New Zealand. Total Scope 1 and 2 emissions data for 2012 includes refrigerant data for the first time in line with the National Carbon Offset Standard. Total Scope 1 and 2 emissions data for 2012 excluding refrigerant data is 182,840 tonnes CO2-e.
18 Refers to Scope 3 emissions in Australia and New Zealand. Amounts are reported for the period 1 July to 30 June. Prepared in line with the Greenhouse Gas Protocol.
19 Total paper consumed (in tonnes) by Westpac Group as reported by its suppliers. Amounts are reported for the 12 months ended 30 June. Includes copy paper and printed materials, including direct mail and marketing documents. Australian figure also includes stationery and kitchen and bathroom products.
20 Refers to aggregate committed exposures, as per APRA reporting standards.
21 The Equator Principles are a voluntary set of standards for determining, assessing and managing social and environmental risk in project financing.
22 2008 was previously disclosed for Australia only and has been revised to include the Group total. Community investment information has been restated for 2010 and 2011 in accordance with the Global Reporting Initiative G3 Sustainability Reporting Guidelines - Financial Sector Services Supplement and in alignment with the Westpac Group Annual Review and Sustainability Report.
23 2008 was previously disclosed for Australia only and has been revised to include the Group total.
24 The 2008 ratio is on reported (not pro forma) Cash Earnings.
25 Refers to the number of attendees (staff, customers and general public) at a financial education course offered by the Westpac Group. Excludes internet based courses and keynote presentations offered by the Davidson Institute.
26 Refers to the number of hours of financial education received by staff, customers and general public, offered by the Westpac Group. Excludes internet based courses and keynote presentations offered by the Davidson Institute.
27 Refers to the total dollars spent in AUD with external suppliers during the reporting period.
28 Refers to the percentage of top 150 suppliers by spend that have provided a self assessment against the Sustainable Supply Chain Management (SSCM) Code of Conduct and/or SSCM Questionnaire since the introduction of SSCM in 2003.
| | |
12 | 2012 WESTPAC GROUP ANNUAL REPORT | |
Competition
The Westpac Group operates in a highly competitive environment across the regions in which we do business.
We serve the banking and wealth needs of customer segments from small businesses to large corporate and institutional clients in our business segments and across all consumer segments. The Westpac Group competes with other industry players for customers covering their needs of transacting, saving, investing, protecting and borrowing with a wide set of products and services. Our competitors range from large global organisations with broad offerings to entities more focused on specific regions or products. Our competitors include financial services and advisory companies such as banks, investment banks, credit unions, building societies, mortgage originators, credit card issuers, brokerage firms, fund and asset management companies, insurance companies and internet-based financial services providers.
Our competitive position across customer segments, products and geographies is determined by a variety of factors. These factors include:
§ the type of customer served;
§ customer service quality and convenience;
§ the effectiveness of, and access to, distribution channels;
§ brand reputation and preference;
§ the quality, range, innovation and pricing of products and services offered;
§ technology solutions; and
§ the talent and experience of our employees.
In Australia, we have seen intense competition for deposits continue to be driven in part by clearer global regulatory requirements for liquidity management and balance sheet composition. Banks and other financial institutions also seek to achieve a higher proportion of deposit funding as credit rating agencies and debt investors look for strong balance sheet positions in their assessment of quality institutions.
We expect competition for lending to also remain high, with slower credit growth compared to the significant credit expansion Australia experienced over the majority of the last two decades. Businesses and consumers are cautious about the global outlook and continue to trim back debt. In mortgages, this lower growth and the desire of some players to maintain or expand their market share using price has seen strong competition over the last year. This is expected to continue, particularly if lending growth remains modest. Serving business customers’ transaction and trade financing needs has been at the centre of competitive activity as customer expectations increase.
In our wealth business, we expect competition to increase as financial institutions and industry funds move to capture a greater share of this fast growing market, particularly in superannuation (or pensions) and financial advice as the market responds to regulatory changes.
The New Zealand market is experiencing strong competition as banks vie for new customers. The home lending market is particularly competitive on price and switching incentives.
Outlook1
Australian economic indicators have, in aggregate, remained relatively robust throughout much of 2012 with moderate growth, low unemployment and benign inflation. Despite these strengths, the experience across sectors has been diverse, business and consumer confidence remained soft, and a loss of momentum emerged as the year progressed. The mining sector has continued to be the growth driver of the economy, with other sectors experiencing more challenging conditions given consumer caution and ongoing strains from the high Australian dollar.
Conditions globally have also remained challenging. World growth lost momentum in 2012. Europe is in recession, US growth is moderate and China’s economy has cooled as a result of past policy tightening. Policy makers in the major economies are now responding to these developments with more aggressive stimulus measures. This is likely to lead to a gradual strengthening of activity. However, the outlook remains uncertain. Europe may continue to contract and the pace of recovery elsewhere in the developed world will be constrained by fiscal consolidation, excessive household debt and weak financial systems. Prospects for the developing economies are likely to improve as those regions have ample scope for effective policy stimulus.
The Reserve Bank of Australia (RBA) has resumed the monetary policy easing cycle in response to global and domestic developments and given the scope provided by a benign inflation environment. The stance of monetary policy is now expansionary, with additional policy easing widely expected.
Given this backdrop, in 2013 we expect Australia’s economic fundamentals to remain stronger and more stable than other developed nations. GDP growth is forecast to be around 3% for 2013, inflation is likely to remain benign and unemployment, while edging higher, is forecast to remain below 6%. Economic growth is likely to become more broadly based as the lower interest rate environment supports conditions in the broader economy. The mining investment boom is set to transition to a mining export upswing over the next two to three years as additional capacity comes on stream and given likely strong demand for commodities from the Asian region, boosted by a cyclical recovery in China.
For banking, we expect that demand for credit will improve a little, but growth is likely to remain modest, while we expect deposits to expand at a relatively strong rate.
1 All data and opinions under ‘Outlook’ are generated by our internal economists and management.
| | |
| 2012 WESTPAC GROUP ANNUAL REPORT | 13 |
With a solid operating performance across all divisions in Full Year 2012, combined with a further strengthening of the balance sheet, Westpac believes it is well positioned to respond to this challenging operating environment. Particular areas of focus will include:
§ continuing to improve productivity, including completion of the new supplier arrangements commenced in early 2012;
§ continued strengthening of the balance sheet with a particular focus on improving the asset/liability mix; and
§ responding pro-actively and in a disciplined way to the increased regulatory agenda.
The Group will also continue to invest in the year ahead with our approach remaining highly targeted to areas where the greatest opportunities exist. These include the build-out of Bank of Melbourne, and commencing the development of a new wealth platform. The Group will also continue to build its capacity and capability in Asia via an increased network and by further building relationships with strategic partners. Our SIPs investment program is also a key element of investment that we expect to continue to enhance and strengthen our technology infrastructure, particularly in online and mobile banking.
Given our strong starting position, and the momentum we carried into the final part of the 2012 financial year, we believe that Westpac is well placed to continue delivering sound, high quality returns for shareholders.
Significant developments
Commencement of new Chairman
On 14 December 2011, Lindsay Maxsted became Chairman of Westpac Banking Corporation following the retirement of Ted Evans AC. Mr Maxsted joined the Board in 2008 as an independent Director and Chairman of the Audit Committee.
New organisational structure
On 24 November 2011 Westpac announced a new organisational structure for the Westpac Group creating two new divisions:
§ AFS which encompasses Westpac RBB, St.George, BTFG, and Banking Products and Risk Management; and
§ Group Services encompassing Technology, Banking Operations, Property Services and Legal.
Consolidation of office space in Sydney and Melbourne
On 22 June 2012 Westpac announced that it had committed to a long-term lease at Sydney’s Barangaroo development, which is expected to be completed in 2015. Westpac will lease approximately 60,000 square metres at Barangaroo. The developer, Lend Lease, has also agreed to purchase two Westpac-owned buildings at 182 George Street and 33-35 Pitt Street. Once completed, it is expected that the new site will enable the Group to consolidate into two locations in the Sydney CBD – its existing head office at 275 Kent Street and Barangaroo.
On 9 December 2011 Westpac announced that it had committed to consolidate its Melbourne city office space from 360 and 367 Collins Street to a new building at 150 Collins Street, a joint development by APN Property Group and Grocon.
Liquidity
On 16 December 2010, the Basel Committee on Banking Supervision (BCBS) released the final text of the Basel III liquidity framework. The framework introduces two new liquidity measures; the Liquidity Coverage Ratio (LCR) and the Net Stable Funding Ratio (NSFR).
The LCR requires banks to hold sufficient high-quality liquid assets, as defined, to withstand 30 days under an acute stress scenario. Since there are insufficient Government bonds available in the Australian marketplace to allow institutions to meet the LCR, the Reserve Bank of Australia (RBA) has announced, jointly with the Australian Prudential Regulation Authority (APRA), that it will make available to Australian institutions a committed secured liquidity facility that can be used to meet the LCR requirement.
The timetable for implementing the liquidity standard schedules the LCR to be introduced from 1 January 2015 and the NSFR from 1 January 2018. Both liquidity measures are subject to an observation and review period prior to implementation and as such are potentially subject to modification.
In November 2011, APRA released for consultation a discussion paper outlining its proposed implementation of the Basel III liquidity reforms in Australia. However, until the final Australian standards are released, the full extent of the impact on the Westpac Group is uncertain.
Capital
On 16 December 2010, the BCBS released the final text of the Basel III capital framework. The framework was revised in June 2011 and incorporates higher global minimum capital requirements and the introduction of two new capital buffers. The framework includes:
§ an increase in the minimum common equity requirement from 2.0% to 4.5%;
§ an increase in the minimum Tier 1 capital requirement from 4.0% to 6.0%;
§ a capital conservation buffer at 2.5%, to be met with common equity; and
§ a countercyclical buffer of between 0% to 2.5% to be met with common equity or other fully loss absorbing capital (subject to further BCBS guidance). The buffer is intended to be applied during times of excess credit growth.
The framework includes a compliance timetable, with phase-in arrangements starting from 1 January 2013 and some elements not becoming fully effective until 1 January 2019.
On 28 September 2012, APRA released the four final revised capital adequacy standards that will govern the implementation of the Basel III capital framework in Australia. APRA is requiring Australian ADIs to meet the new minimum capital requirements from 1 January 2013 and has proposed that the capital conservation buffer apply in full from its introduction date of 1 January 2016. Westpac believes it is well placed to meet the new capital requirements within the timeframes proposed.
| | |
14 | 2012 WESTPAC GROUP ANNUAL REPORT | |
Westpac Convertible Preference Shares
On 23 March 2012, Westpac issued approximately $1.19 billion of new Tier 1 hybrid securities known as Westpac Convertible Preference Shares (Westpac CPS), which qualify as Non-innovative Residual Tier 1 capital of Westpac for regulatory capital purposes. Westpac CPS will also be eligible for transitional treatment as Additional Tier 1 capital under APRA’s Basel III capital adequacy framework.
Credit ratings
On 1 December 2011, Standard & Poor’s announced that, following changes to its criteria for assessing bank credit ratings globally, the ratings of the major Australian banks, including Westpac, were lowered by one notch. As a result, Westpac’s long-term, senior unsecured credit rating was assessed as AA- down from AA. The outlook for the rating is stable. Westpac’s short-term credit rating was affirmed at A1+.
On 24 February 2012, Fitch Ratings advised that Westpac, along with the other major Australian banks, had its long-term senior unsecured issuer default rating downgraded to AA- down from AA. The outlook for the rating is stable. Westpac’s short-term issuer default rating was affirmed at F1+.
Systemically Important Financial Institutions (SIFIs)
In November 2011, the BCBS published ‘Global systemically important banks: Assessment methodology and the additional loss absorbency requirement’. This document announced the final methodology for determining Global Systemically Important Banks (G-SIBs), and the Financial Stability Board (FSB) named 29 G-SIBs that would be subject to higher capital requirements and greater oversight. No Australian bank has been named as a G-SIB based on the current methodology and data.
The G20 also directed the FSB to consider how to extend the framework to a broader set of SIFIs, including Domestic Systemically Important Banks (D-SIBs), and to make recommendations to the G20. On 12 October 2012, the BCBS issued the paper ‘A framework for dealing with domestic systemically important banks’. The paper sets out a principles based framework for regulating D-SIBs. However, until APRA develops the rules for implementing the framework in Australia, any impact on Westpac cannot be determined.
Recovery and resolution planning
In November 2011, the FSB finalised a comprehensive package of policy measures to improve the capacity of authorities to resolve failing SIFIs, without systemic disruption and without exposing taxpayers to risk of loss. As part of the package, a Recovery and Resolution Plan is required for any firm deemed by its home authority to have systemic importance to the domestic economy. In addition, SIFIs will be subject to resolvability assessments to ensure they may be resolved without severe systemic disruption and taxpayer loss while at the same time protecting systemically important functions. APRA has undertaken a pilot Recovery Planning project applying to Australia’s largest banks, with final plans delivered to APRA in mid-2012. APRA has indicated that it intends to extend its recovery planning program once the results of the pilot program have been analysed. The final form of any resulting requirements, the implications, and the timing for Westpac are at this stage unknown.
OTC derivatives reform
The over-the-counter (OTC) derivatives market is undergoing significant regulatory reform globally. The reforms aim to improve transparency, mitigate systemic risk and protect against market abuse in the OTC derivatives market by encouraging clearing through central counterparties, reporting to trade repositories, exchange trading where appropriate, and imposing higher capital requirements on non-cleared contracts.
Locally, the Council of Financial Regulators (APRA, ASIC, RBA and the Australian Treasury) issued a report on OTC Derivatives Market Reform Considerations in March 2012, which was followed by the release of a joint report on the Australian OTC Derivatives Market by APRA, ASIC and the RBA in October 2012. In addition, the Australian Government has introduced into Parliament the Corporations Legislation Amendment (Derivatives Transactions) Bill 2012, which creates a framework to allow the Minister for Financial Services and Superannuation to determine that mandatory obligations should apply to certain classes of OTC derivatives, requiring those classes to be reported, centrally cleared, and traded on suitable trading platforms.
Westpac is closely monitoring the local and international OTC derivatives reforms including regulatory changes being implemented by the US Commodity Futures Trading Commission under the Dodd-Frank Wall Street Reform and Consumer Protection Act (Dodd-Frank Act) and is actively engaging with regulators, trade associations, banks and clearing houses. Westpac is developing clearing, reporting and trade processing solutions to ensure that it is compliant with applicable global regulations within the required timeframes, including any foreign registration obligations. As both the international and local reforms are yet to be finalised, the full extent of the impact on the Westpac Group’s operations remains unclear.
Exception fees class action
On 16 December 2011 a class action was commenced against Westpac in the Federal Court of Australia on behalf of certain customers of Westpac. A second class action against Westpac, brought on behalf of certain customers of St.George Bank and BankSA, was commenced on 1 February 2012. The claims in both class actions allege that certain exception fees charged by Westpac prior to October 2009 were unlawful. The claims against Westpac form part of a series of class actions against a number of Australian banks initiated by the litigation funding company IMF (Australia) Ltd. Westpac intends to defend the proceedings. By agreement between the parties, the proceedings against Westpac are on hold until at least December 2012, pending developments in a related class action against another Australian bank.
Bell litigation
Westpac was one of 20 defendant banks named in proceedings concerning the Bell Group of companies. The proceedings were brought by the liquidators of several Bell Group companies who challenged the defendant banks’ entitlement to receive the proceeds of realisation of Bell Group assets in the early 1990s. Judgment was delivered on 28 October 2008 and final orders were handed down on 30 April 2009.
| | |
| 2012 WESTPAC GROUP ANNUAL REPORT | 15 |
Westpac, along with the other defendant banks, was found liable to repay its share of the monies received from the Bell Group plus interest. The defendant banks appealed the decision. Judgment was handed down by the Court of Appeal of the Supreme Court of Western Australia on 17 August 2012. By a majority decision, the defendant banks were unsuccessful in the appeal and the amount of interest payable was increased. The defendant banks have applied for special leave to appeal to the High Court of Australia.
Tax developments
Following the Tax Forum conducted by the Australian Federal Government in Canberra on 4 and 5 October 2011, to discuss tax reform following the report from Australia’s Future Tax System Review (the Henry Review), the Deputy Prime Minister and Treasurer announced the appointment of a business tax working group to look at how the Australian tax system could be improved. Measures considered by this working group include the carry back of tax losses and the possible reduction of the corporate tax rate where it is funded by the business tax base broadening. The working group released a draft final report on 24 October 2012. The working group concluded that while there could be benefits associated with a cut in the company tax rate, they declined to make a recommendation as to how such a cut could be undertaken in a revenue neutral manner. This was based on a conclusion by the working group that there was a lack of agreement in the business community as to how to fund such a reduction in the corporate tax rate.
On 30 March 2011, the Assistant Treasurer announced a review of the tax consolidation provisions dealing with rights to future income and the residual tax cost setting rules. The consideration was whether these rules needed to be amended, and, if so, whether any amendments will take effect retrospectively. The residual tax cost setting rules are the provisions under which amounts were allocated to the St.George in the money derivatives in the tax consolidation process (and from which deductions are claimed by Westpac under the general taxing provisions).
In June 2012, the Government passed new legislation (Tax Laws Amendment (2012 Measures No.2) Act) that introduced a number of changes to the income tax law as it applied to the Taxation of Financial Arrangements (TOFA) and tax consolidated groups. The new legislation:
§ confirmed the tax treatment adopted by Westpac for the derivative assets and liabilities consolidated as part of the St.George Bank merger. This gave rise to a reduction in income tax expense of approximately $685 million for the 2010 financial year and approximately $1,110 million for the 2011 financial year, as previously announced in October 2010 and March 2011; and
§ applied retrospective amendments to TOFA that applied to certain liabilities consolidated as part of the St.George Bank merger. This gave rise to an additional income tax expense of approximately $165 million for the 2012 financial year, as reported on 27 June 2012.
Changes to accounting standards
In continuing response to the global financial crisis, governments, regulators and accounting standard setters are working to revise certain accounting standards. The objective is to achieve convergence towards a single set of high-quality, global and independent accounting standards. The specific areas that have been targeted include accounting for financial instruments, provisioning for loan impairment charges, off-balance sheet exposures and the impairment and valuation of financial assets and lease accounting. The Group expects that there will be a number of new standards issued in the next three years that will require changes to our current accounting approaches.
United States
There are a number of significant regulatory reforms currently occurring in the United States (US). These include:
Dodd-Frank Act
In response to the global financial crisis, legislation designed to reform the system for supervision and regulation of financial firms in the US was signed into law on 21 July 2010. The Dodd-Frank Act contains a wide range of provisions that will affect financial institutions operating in the US, including foreign banks like Westpac. Included among its provisions are reforms designed to reduce systemic risk presented by very large financial institutions, promote enhanced supervision, regulation, and prudential standards for financial institutions, establish comprehensive supervision of financial markets, impose new limitations on permissible financial institution activities and investments, expand regulation of the derivatives markets, protect consumers and investors from financial abuse, and provide the US Government with the tools needed to manage a financial crisis. Many of the provisions of the Dodd-Frank Act require extensive rulemaking by US regulatory agencies before the provisions become effective. The issuance of final rules under the Dodd-Frank Act remains far from complete, with the process continuing. Aside from the observations regarding OTC derivatives reform above, until there is greater clarity regarding the final forms of the rules and their extra-territorial application, it is not possible to assess the full impact of the law and the regulations on our operations. However in the event that some of the rules are implemented in or close to the current draft, significant investment in compliance and reporting programs and changes to business activities are likely to be required.
| | |
16 | 2012 WESTPAC GROUP ANNUAL REPORT | |
Foreign Account Tax Compliance Act (FATCA)
Legislation incorporating provisions referred to as FATCA was passed in the US on 18 March 2010. The legislation and subsequent guidance require Foreign Financial Institutions (FFIs) such as Westpac to enter into an FFI agreement under which they agree to identify and provide the US Internal Revenue Service (IRS) with information on accounts held by US persons and US owned foreign entities, or otherwise face 30% withholding tax on certain payments made to the FFI. In addition, FFIs that have entered into an FFI agreement will be required to withhold on certain payments made to FFIs that have not entered into an FFI agreement and account holders who do not respond to requests to confirm their US person status and/or do not agree to the FFI reporting certain account related information to the IRS. This description is based on guidance issued to date by the IRS, including proposed regulations. Future guidance may affect the application of FATCA to Westpac. Given Westpac’s expectation that the FATCA provisions will be implemented in or near to their current form, substantial investment will be required to ensure that Westpac will be able to adhere to the FATCA requirements from a compliance and reporting perspective across all jurisdictions in which Westpac operates.
The IRS has published a Model Intergovernmental Agreement (the Model IGA) in connection with the implementation of FATCA. The Australian Government is currently exploring the feasibility of entering into such an Intergovernmental Agreement (IGA) with the US. If the Australian Government does enter into an IGA with the US, based on the Model IGA, Westpac would likely be able to report the required information relating to its Australian branches to the Australian Taxation Office (ATO), which would provide such information to the IRS under existing Exchange of Information protocols. Further, Westpac’s Australian branches/affiliates would be relieved of the requirements to enter into an FFI Agreement with the IRS and to withhold from payments to, or close the accounts of, certain account holders at such branches/affiliates but will still be required to identify certain US accounts. While it is anticipated that such an IGA would reduce the compliance costs and operational burdens of FATCA for Westpac, there is no certainty that Australia will enter into an IGA with the US. Moreover, even if such an IGA is entered into, Westpac currently expects that it will enter into an FFI agreement, as described above, with respect to its branches and affiliated FFIs not located in Australia or another country that has entered into an IGA.
New Zealand
Regulatory reforms and significant developments in New Zealand include:
Transfer of additional banking operations to Westpac New Zealand Limited on 1 November 2011
Until 1 November 2006, Westpac conducted its banking operations within New Zealand through a branch structure. On that date, and after extensive consultation with the Reserve Bank of New Zealand (RBNZ), Westpac adopted a dual registration operating model comprised of a locally incorporated subsidiary, WNZL, to conduct its consumer and business banking operations in New Zealand, and a branch, Westpac’s NZ Branch (NZ Branch), to conduct its institutional and financial markets operations.
Following an independent review of the structure of the operating model of Westpac’s business in New Zealand, the RBNZ, WNZL and Westpac reached agreement on changes to the operating model. As a result, and pursuant to the Westpac New Zealand Act 2011, the following assets and liabilities associated with certain business activities and associated employees were transferred from the NZ Branch to WNZL on 1 November 2011:
§ institutional customer deposits;
§ institutional customer transactional banking;
§ institutional customer lending other than trade financing activities;
§ debt capital markets activities carried out in assisting corporates to obtain funding, such as customer loan syndication and securitisation arrangements, but excluding the debt securities team activities, such as arrangement of commercial paper and bond program;
§ corporate advisory; and
§ institutional customer foreign currency accounts.
The NZ Branch has retained its financial markets operations for external customers, including sales and trading of capital markets products and foreign exchange for corporate and institutional customers, pricing and risk management for interest rate, foreign exchange and commodity products for retail, business and institutional customers of WNZL and trading of capital markets products and foreign exchange as principal. In addition, the NZ Branch has retained its global intra-group financing functions, correspondent bank relationships, debt securities team activities, such as arrangement of commercial paper and bond programs, and international business (including trade finance activities but excluding customer foreign currency accounts).
Open Bank Resolution (OBR)
The RBNZ released a consultation paper on OBR in March 2011. OBR contemplates a bank being open for business on the next business day following an insolvency event or event that triggered putting it under statutory management. The RBNZ’s consultation paper recommended that all locally incorporated banks with retail funding over NZ$1 billion participate in a pre-positioning process and therefore the policy will apply to WNZL. In the event of failure, a bank must be able to achieve certain outcomes which include being able to freeze accounts and process pending payments, determine customers’ account balances on a per account basis, set aside a proportion of account balances that have been frozen, and resume customers’ access to their transaction and other accounts on the next business day following the bank’s closure. Banks were required to submit detailed implementation plans to the RBNZ by 29 February 2012 and the RBNZ is requiring that they be fully pre-positioned for OBR by 30 June 2013. A new condition of registration to formally impose the OBR requirements is expected to be in place by the end of the calendar year and take effect from 1 July 2013.
| | |
| 2012 WESTPAC GROUP ANNUAL REPORT | 17 |
Basel III
The RBNZ is adopting the core Basel III capital measures relating to new capital ratios, including the conservation buffer, and most of the recommendations relating to the definition of capital. Total Tier 1 capital will increase to 6.0% plus the conservation buffer of 2.5%. Tier 1 capital will need to include common equity of 7.0% (Tier 1 ratio of 4.5% and the conservation buffer). The countercyclical capital buffer is also being adopted and will be imposed when the RBNZ judges that excess private sector credit growth or rapid growth in asset prices is leading to a build-up of system-wide risk. The RBNZ is not specifying any upper limit on the countercyclical buffer. The leverage ratio is not being adopted. The RBNZ is implementing Basel III ahead of the Basel Committee on Banking Supervision’s (BCBS) and APRA’s timetable. The new capital ratios will come into effect on 1 January 2013. The conservation buffer will be implemented in full from 1 January 2014, in contrast to the BCBS’s framework, which proposes that the buffer be implemented over a three year period (from 2016). The countercyclical capital buffer will be able to be deployed from 1 January 2014.
Financial Markets Conduct Bill (FMCB)
The FMCB was introduced into the New Zealand Parliament in October 2011 and was reported back from Select Committee in early September 2012. It is expected to be passed in the first half of 2013. The FMCB represents an overhaul of the existing securities law regime in New Zealand and will impact various aspects of the wider Westpac New Zealand business. It introduces changes to product disclosure and governance, and introduces new licensing and registration requirements. The new regime will do away with the existing prospectus/investment statement dual disclosure model and introduce a single product disclosure statement, supported by an online register of other material documentation. Much of the detail from the Bill has been left to be prescribed in regulations.
Credit law reform/responsible lending
The New Zealand Government is proposing to amend the Credit Contracts and Consumer Finance Act 2003 (CCCFA) by introducing a duty to lend responsibly. An exposure draft of the amendment Bill was released in April 2012. The Bill will provide for a regulatory responsible lending code and will strengthen existing consumer protections by changing current CCCFA provisions on disclosure, fees, hardship and ‘oppressive contracts’.
Reserve Bank of New Zealand (Covered Bonds) Amendment Bill
A bill that provides a legislative framework for the issuance of covered bonds by New Zealand registered banks was introduced into Parliament in May 2012 and is expected to be passed this year. New Zealand registered banks are currently permitted by the RBNZ to issue covered bonds and have conditions of registration which impose a limit on this issuance of 10% of total assets. However, the legislation will provide certainty for investors that the cover pool assets will be disgorged from statutory management and liquidation regimes. The Bill will require the registration of covered bond programs and provides for a transition period for the registration of existing covered bond programs.
Other significant developments
The Australian Federal Government has embarked on a program of regulatory reform which will affect Westpac. This includes:
§ Credit law reform – as part of the second phase of the credit law reforms, since 1 January 2012, credit providers have been required to produce Key Facts Sheets for standard home loans. Further reforms relating to credit cards commenced on 1 July 2012. These reforms include a credit card Key Facts Sheet, a minimum repayment warning on statements, a mandatory order of application of payments, over the limit notifications and a requirement for consent before sending written credit limit increase invitations. In addition, through the Consumer Credit and Corporations Legislation Amendment (Enhancements) Act 2012, amendments have been introduced to the regulation of reverse mortgages, hardship applications under the National Credit Code, short-term and small amount loans, consumer leases and other ‘enhancements’, most of which will commence 1 March 2013.
§ Superannuation changes – the Government’s response to the Super System (Cooper) Review will require introduction of a new ‘MySuper’ product from 1 July 2013. MySuper is a low cost, simple superannuation product. A MySuper product will be the default investment option where investment choice is not elected by the member. Other legislative changes include enhanced trustee and director obligations as well as ‘SuperStream’, a measure to improve the efficiency of processing superannuation transactions through the use of technology. All legislation to execute this reform agenda should be in force by the end of 2012. A project team has been created to assess the impact of these changes to our existing superannuation products and to ensure compliance with the new requirements.
§ Financial advice changes – on 27 June 2012 the Government’s Future of Financial Advice (FOFA) reforms became law. Regulations were registered on 12 July 2012 and 2 October 2012, and further regulations are still expected. The FOFA reforms are aimed at improving consumer trust and confidence in, and the quality of, financial advice. The FOFA reforms include a ban on certain conflicted payments and soft dollar benefits, a ban on volume-based shelf space fees, a ban on the charging of asset-based fees on borrowed funds, a statutory best interests duty so that financial advisers must act in the best interests of their clients, and an ‘adviser charging regime’ where the investor will be required to opt-in every two years to receive ongoing advice and where advisers will be required to give annual disclosure of ongoing fees and services to investors. The majority of the proposed reforms will commence for the Westpac Group on 1 July 2013. Certain aspects of the reforms, including an anti-avoidance provision and increased ASIC powers, commenced on 1 July 2012.
| | |
18 | 2012 WESTPAC GROUP ANNUAL REPORT | |
§ Privacy law reform – the Privacy Act, first introduced in Australia in 1988, regulates how personal information is collected, used, disclosed and maintained by organisations. It also grants rights to individuals to access and request the correction of their personal information. The Privacy Amendment (Enhancing Privacy Protection) Bill 2012 has been passed by the House of Representatives and is currently before the Senate. This Bill contains new Australian Privacy Principles to replace the current National Privacy Principles and amends, among other things, how credit reporting is conducted.
§ Proposed amendments to the Insurance Contracts Act – on 21 March 2012, the Insurance Contracts Amendment Bill 2011 was passed by the Australian Parliament, introducing a standardised definition of ‘flood’ for home and contents insurance policies and establishing additional mandatory disclosure requirements for home and contents insurance policies. In addition to those changes, the Government is currently reviewing the availability and affordability of flood insurance, while amendments to the Insurance Contracts Act 1984 (Cth) and related legislation may result in insurance contracts being subject to the ‘unfair contracts’ regime, updated duties of disclosure being imposed upon insureds, and the option of providing notices and documents under the Act electronically.
§ The introduction of a new regulatory framework for personal property securities – on 30 January 2012 the Personal Property Securities Act (PPSA) commenced. The PPSA is a national personal property securities regime involving a single register and a uniform set of rules that replaces a wide range of complex State and Territory based legislation and registers. The PPSA regime has introduced fundamental changes to the treatment of security interests in personal property in Australia.
§ Changes to APRA’s crisis management powers – on 12 September 2012 the Australian Federal Treasury released for public consultation a paper entitled Strengthening APRA’s Crisis Management Powers which seeks comments on a series of reform proposals directed at strengthening APRA’s crisis management powers. Proposals under consideration include providing APRA with the ability, in times of financial distress, to direct regulated entities (including Westpac) in relation to disclosure requirements and broadening APRA’s powers to issue other directions to regulated entities. If implemented, these proposals could impact on the regulatory framework applying to Westpac and its controlled entities. However, until final proposals are published and implemented, the full extent of the impact on us is uncertain.
§ Covered bonds – on 13 October 2011, the Australian Parliament passed an amendment to the Banking Act 1959 permitting ADIs to issue covered bonds. Among other things, this legislation caps at 8% the value of an ADI’s assets in Australia that can be included in a cover pool supporting covered bonds.
Westpac continues to review these developments, engage with Government, regulators and industry bodies as appropriate, and amend its systems, processes and operations to align with regulatory changes as they occur.
Supervision and regulation
Australia
Within Australia we are subject to supervision and regulation by six principal agencies: APRA; the Reserve Bank of Australia (RBA); the Australian Securities and Investments Commission (ASIC); the Australian Securities Exchange (ASX); the Australian Competition and Consumer Commission (ACCC); and the Australian Transaction Reports and Analysis Centre (AUSTRAC).
APRA is responsible for the prudential supervision of banks, credit unions, building societies, life and general insurance companies, friendly societies and most superannuation (pension) funds. APRA’s roles include establishing and enforcing prudential standards and practices designed to ensure that, under all reasonable circumstances, financial promises made to customers by the institutions it supervises are met.
As an ADI, we report prudential information to APRA including information in relation to capital adequacy, large exposures, credit quality and liquidity. Our controlled entities in Australia that are authorised insurers and trustees of superannuation funds are also subject to the APRA regulatory regime. Reporting is supplemented by consultations, on-site inspections and targeted reviews. Our external auditors also have an obligation to report on compliance with certain statutory and regulatory banking requirements and on any matters that in their opinion may have the potential to materially prejudice the interests of depositors and other stakeholders.
Australia’s risk-based capital adequacy guidelines are generally consistent with the approach agreed upon by the Basel Committee on Banking Supervision. Refer to ‘Capital resources – Basel Capital Accord’ in Section 2.
The RBA is responsible for monetary policy, maintaining financial system stability and promoting the safety and efficiency of the payments system. The RBA is an active participant in the financial markets, manages Australia’s foreign reserves, issues Australian currency notes and serves as banker to the Australian Government.
ASIC is the national regulator of Australian companies. Its primary responsibility is to regulate and enforce company, consumer credit, financial markets and financial services laws that protect consumers, investors and creditors. With respect to financial services, it promotes honesty and fairness by providing consumer protection, using regulatory powers to enforce laws relating to deposit-taking activities, general insurance, life insurance, superannuation, retirement savings accounts, securities (such as shares, debentures and managed investments) and futures contracts and financial advice. ASIC has responsibility for supervising trading on Australia’s domestic licensed markets and of trading participants.
The ASX operates Australia’s primary national market for trading of securities issued by listed companies. Some of our securities (including our ordinary shares) are listed on the ASX and we therefore have obligations to comply with the ASX Listing Rules, which have statutory backing under the Corporations Act. The ASX has responsibility for the oversight of listed entities under the ASX Listing Rules and for monitoring and enforcing compliance with the ASX Operating Rules by market, clearing and settlement participants.
| | |
| 2012 WESTPAC GROUP ANNUAL REPORT | 19 |
The ACCC is an independent statutory authority responsible for the regulation and prohibition of anti-competitive and unfair market practices and mergers and acquisitions in Australia. Its broad objective is to administer the Competition and Consumer Act 2010 and related legislation to bring greater competitiveness, fair trading, consumer protection and product safety to the Australian economy. The ACCC’s role in consumer protection complements that of Australian state and territory consumer affairs agencies that administer the unfair trading legislation of their jurisdictions.
The Australian Government’s present policy, known as the ‘four pillars policy’, is that there should be no fewer than four major banks to maintain appropriate levels of competition in the banking sector. Under the Financial Sector (Shareholding) Act, the Australian Government’s Treasurer must approve an entity acquiring a stake of more than 15% in a financial sector company.
Proposals for foreign acquisitions of a stake in Australian banks are subject to the Australian Government’s foreign investment policy and, where required, approval by the Australian Government under the Australian Foreign Acquisitions and Takeovers Act 1975. For further details refer to ‘Limitations affecting security holders’ in Section 4.
AUSTRAC oversees the compliance of Australian reporting entities including Westpac, within the requirements under the Anti-Money Laundering and Counter-Terrorism Financing Act 2006 and the Financial Transaction Reports Act 1988.
These requirements include:
§ implementing programs for identifying and monitoring customers, and for managing the risks of money laundering and terrorism financing;
§ reporting suspicious matters, threshold transactions and international funds transfer instructions; and
§ submitting an annual compliance report.
AUSTRAC provides financial information to state, territory and Australian federal law enforcement, security, social justice and revenue agencies, and certain international counterparts.
New Zealand
The RBNZ is responsible for supervising New Zealand registered banks. The New Zealand prudential supervision regime requires that registered banks publish quarterly disclosure statements, which contain information on financial performance and risk positions as well as attestations by the directors about the bank’s compliance with its conditions of registration and certain other matters.
United States
Our New York branch is a US federally licensed branch and therefore is subject to supervision, examination and extensive regulation by the US Office of the Comptroller of the Currency, and the Board of Governors of the Federal Reserve System (the US Federal Reserve) under the US International Banking Act of 1978 (IBA) and related regulations. Under the IBA, we may not open any branch, agency or representative office in the US or acquire more than 5% of the voting stock of any US bank without the prior approval of the US Federal Reserve.
A US federal branch must maintain, with a US Federal Reserve member bank, a capital equivalency deposit as prescribed by the US Comptroller of the Currency in an amount which is the greater of:
§ the amount of capital (but not surplus) that would be required of a national bank organised at the same location; or
§ 5% of its total liabilities (including acceptances, but excluding accrued expenses, and amounts due and other liabilities to other branches, agencies, and subsidiaries of the foreign bank).
In addition, a US federal branch is examined by the US Comptroller of the Currency at least once each calendar year. The examination covers risk management, operations, credit and asset quality, and compliance with the record-keeping and reporting requirements that apply to national banks, including the maintenance of its accounts and records separate from those of the foreign bank, and any additional requirements prescribed by the US Comptroller of the Currency.
A US federal branch of a foreign bank is, by virtue of the IBA, subject to the receivership powers exercisable by the US Comptroller of the Currency.
At this time we have not elected to become, and therefore we are not, a financial holding company as defined in the Gramm-Leach-Bliley Act of 1999.
| | |
20 | 2012 WESTPAC GROUP ANNUAL REPORT | |
Anti-money laundering regulation
Australia
Westpac has a Group-wide program to manage its obligations under the Anti-Money Laundering and Counter-Terrorism Financing Act 2006. We continue to actively engage with the regulator, AUSTRAC, on our activities.
United States
The USA Patriot Act requires US financial institutions, including the US branches of foreign banks, to take certain steps to prevent, detect and report individuals and entities involved in international money laundering and the financing of terrorism. The required actions include verifying the identity of financial institutions and other customers and counterparties, terminating correspondent accounts for foreign ‘shell banks’ and obtaining information about the owners of foreign bank clients and the identity of the foreign bank’s agent for service of process in the US. The anti-money laundering compliance requirements of the USA Patriot Act include requirements to adopt and implement an effective anti-money laundering program, report suspicious transactions or activities, and implement due diligence procedures for correspondent and other customer accounts.
Outsourcing contracts
Westpac’s significant long-term contracts are summarised in Note 34 to the financial statements.
Legal proceedings
Our entities are defendants from time-to-time in legal proceedings arising from the conduct of our business and material legal proceedings, if any, are described in Note 36 to the financial statements. An assessment of likely losses is made on a case-by-case basis for the purposes of the financial statements.
Principal office
Our principal office is located at 275 Kent Street, Sydney, New South Wales, 2000, Australia. Our telephone number for calls within Australia is 132 032 and our international telephone number is (+61) 2 9293 9270.
| | |
| 2012 WESTPAC GROUP ANNUAL REPORT | 21 |
INTRODUCTION
This statement describes our corporate governance framework, policies and practices as at 5 November 2012.
Framework and approach
Our approach to corporate governance is based on a set of values and behaviours that underpin day-to-day activities, provide transparency and fair dealing, and seek to protect stakeholder interests.
This approach includes a commitment to excellence in governance standards, which Westpac sees as fundamental to the sustainability of our business and our performance. It includes monitoring local and global developments in corporate governance and assessing their implications.
Australia
We comply with the ASX Corporate Governance Principles and Recommendations (ASXCGC Recommendations) published by the ASX Corporate Governance Council (ASXCGC). We must also comply with the Corporations Act and as an ADI must comply with governance requirements prescribed by APRA under Prudential Standard CPS 510 Governance.
This statement addresses each of the eight ASXCGC Recommendations with an explanation of our corporate governance practices, demonstrating our compliance with each Recommendation. A checklist summarising our compliance is included at the end of this statement.
Further details about the ASXCGC Recommendations can be found on the ASX Limited (ASX) website www.asx.com.au.
New Zealand
Westpac also has ordinary shares quoted on the NZSX, which is the main board equity security market operated by NZX Limited (NZX). As an overseas listed issuer in New Zealand, we are deemed to satisfy and comply with the NZSX Listing Rules, provided that we remain listed on the ASX and comply with the ASX Listing Rules.
The ASX, through the ASXCGC Recommendations, and NZX have adopted a similar ‘comply or explain’ general approach to corporate governance. However, the ASXCGC Recommendations may materially differ from the corporate governance rules and the principles of NZX’s Corporate Governance Best Practice Code.
United States
Westpac has American Depositary Shares (ADS) representing its ordinary shares quoted on the New York Stock Exchange (NYSE). Under the NYSE Listing Rules, foreign private issuers are permitted to follow home country practice in respect of corporate governance in lieu of the NYSE Listing Rules. However, we are still required to comply with certain audit committee and additional notification requirements.
We comply in all material respects with all NYSE listing rules applicable to us.
Under the NYSE Listing Rules, foreign private issuers are required to disclose any significant ways in which their corporate governance practices differ from those followed by domestic US companies. We have compared our corporate governance practices to the corporate governance requirements of the NYSE Listing Rules and note the significant differences below.
The NYSE Listing Rules require that, subject to limited exceptions, shareholders be given the opportunity to vote on equity compensation plans and material revisions to those plans.
In Australia there are no laws or securities exchange listing rules that require shareholder approval of equity based incentive plans or individual grants under those plans (other than for Directors, including the Chief Executive Officer (CEO)).
Westpac’s employee equity plans have been disclosed in the Remuneration report in Section 9 of the Directors’ report, which is subject to a non-binding shareholder vote at the Annual General Meeting (AGM) and grants to our CEO are approved by shareholders. The details of all grants under our equity-based incentive plans have been disclosed in Note 25 of our financial statements for the year ended 30 September 2012.
The NYSE Listing Rules provide that the Nominations Committee’s responsibilities should include selecting, or recommending that the Board select, the Director nominees for the next annual meeting for shareholders, and overseeing the evaluation of the Board. The Board, rather than the Nominations Committee, reviews and recommends the Director nominees for election at the AGM and undertakes an annual review of its performance.
Websites
This statement and a range of documents referred to in it are available on our corporate governance website at www.westpac.com.au/corpgov. This website is regularly updated and contains copies and summaries of charters, principles and policies referred to in this statement.
| | |
22 | 2012 WESTPAC GROUP ANNUAL REPORT | |
GOVERNANCE FRAMEWORK
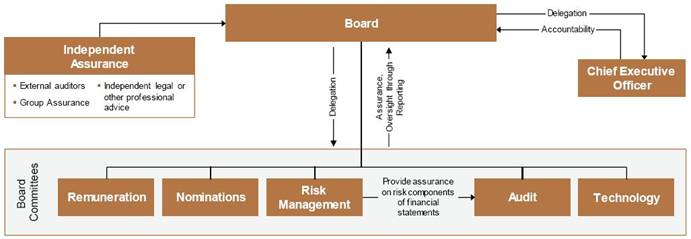
From time to time the Board may form other Committees or request Directors to undertake specific extra duties. In 2010, the Board introduced a temporary Committee to provide specific focus on Health, Safety and Wellbeing (HS&W) across the Group. By late 2011 the HS&W Committee considered the improvement program sufficiently implemented to warrant a recommendation to the Board that the committee be dissolved as of 1 January 2012. That recommendation was accepted and the Board is again responsible for the overall monitoring of HS&W across the Westpac Group.
Further, on 6 March 2012 the Board re-assumed responsibility for the oversight and monitoring of sustainability and dissolved the Sustainability Committee. This decision reflects that the Westpac Group’s sustainability agenda is well embedded across the organisation, and with sustainability playing a core part in our overall approach to doing business, it is now appropriate for the Board to more directly play a larger role.
In addition, from time to time the Board participates (either directly or through representatives) in due diligence committees in relation to strategic decisions, capital and funding activities.
The Executive Team, Disclosure Committee and Executive Risk Committees are not Board Committees (that is, they have no delegation of authority from the Board) but sit beneath the CEO and the Board Committees to implement Board-approved strategies, policies and management of risk across the Group.
The key functions of the Board and each of the Board Committees are outlined in this corporate governance statement. All Board Committee Charters are available on our corporate governance website at www.westpac.com.au/corpgov.
| | |
| 2012 WESTPAC GROUP ANNUAL REPORT | 23 |
BOARD, COMMITTEES AND OVERSIGHT OF MANAGEMENT
Board of Directors
Roles and responsibilities
The Board Charter outlines the roles and responsibilities of the Board. Key responsibilities in summary are:
§ approving the strategic direction of Westpac Group;
§ evaluating Board performance and determining Board size and composition;
§ considering and approving the Westpac Board Renewal Policy;
§ appointing and determining the duration, remuneration and other terms of appointment of the CEO and Chief Financial Officer (CFO);
§ evaluating the performance of the CEO, and monitoring the performance of other senior executives;
§ succession planning for the Board, CEO and Group Executives;
§ approving the appointment of Group Executives, General Manager Group Assurance and Group General Counsel and monitoring the performance of senior management;
§ approving the annual targets and financial statements and monitoring performance against forecast and prior periods;
§ determining our dividend policy;
§ determining our capital structure;
§ approving our risk management strategy and frameworks, and monitoring their effectiveness;
§ considering the social, ethical and environmental impact of our activities and monitoring compliance with our sustainability policies and practices;
§ monitoring Workplace Health and Safety (WH&S) issues in Westpac Group and considering appropriate WH&S reports and information;
§ maintaining an ongoing dialogue with Westpac’s auditors and, where appropriate, principal regulators; and
§ internal governance including delegated authorities, policies for appointments to our controlled entity Boards and monitoring resources available to senior executives.
Delegated authority
The Constitution and the Board Charter enable the Board to delegate to Committees and management.
The roles and responsibilities delegated to the Board Committees are captured in the Charters of each of the five established Committees, namely:
§ Audit;
§ Risk Management;
§ Nominations;
§ Remuneration; and
§ Technology.
The Board Charter, Board Committee Charters and the Constitution are available on our corporate governance website www.westpac.com.au/corpgov.
The Delegated Authority Policy Framework outlines principles to govern decision-making within the Westpac Group, including appropriate escalation and reporting to the Board. The Board has also delegated to the CEO, and through the CEO to other executives, responsibility for the day-to-day management of our business. The scope of, and limitations to, management delegated authority is clearly documented and covers areas such as operating and capital expenditure, funding and securitisation, and lending. These delegations balance effective oversight with appropriate empowerment and accountability of management.
Independence
Together, the Board members have a broad range of relevant financial and other skills and knowledge, combined with the extensive experience necessary to guide our business. Details are set out in Section 1 of the Directors’ report.
All of our Non-executive Directors satisfy our criteria for independence, which align with the guidance provided in the ASXCGC Recommendations and the criteria applied by the NYSE.
The Board assesses the independence of our Directors on appointment and annually. Each Director provides an annual attestation of his or her interests and independence.
Directors are considered independent if they are independent of management and free from any business or other relationship that could materially interfere with, or reasonably be perceived to materially interfere with, the exercise of their unfettered and independent judgment. Materiality is assessed on a case by case basis by reference to each Director’s individual circumstances rather than by applying general materiality thresholds. The assessment has regard to the criteria applied by the NYSE and US Securities and Exchange Commission (SEC).
Each Director is expected to disclose any business or other relationship that he or she has directly, or as a partner, shareholder or officer of a company or other entity that has an interest with Westpac or a related entity. The Board considers information about any such interests or relationships, including any related financial or other details, when it assesses the Director’s independence.
| | |
24 | 2012 WESTPAC GROUP ANNUAL REPORT | |
Size and membership of Board Committees as at 30 September 2012
| | Status | | Board Audit
Committee | | Board Risk
Management
Committee | | Board Nominations
Committee | | Board Remuneration
Committee | | Board
Technology
Committee |
| | | | | | | | | | | | |
Lindsay Maxsted | | Chairman,
Non-executive, Independent | | ü | | ü | | Chair
ü | | | | |
| | | | | | | | | | | | |
| | | | | | | | | | | | |
John Curtis | | Deputy Chairman, Non-executive, Independent | | | | ü | | ü | | Chair
ü | | |
| | | | | | | | | | | | |
| | | | | | | | | | | | |
Gail Kelly | | CEO, Executive | | | | | | | | | | ü |
| | | | | | | | | | | | |
| | | | | | | | | | | | |
Elizabeth Bryan | | Non-executive, Independent | | | | Chair
ü | | ü | | ü | | ü |
| | | | | | | | | | | | |
| | | | | | | | | | | | |
Gordon Cairns | | Non-executive, Independent | | | | ü | | | | ü | | |
| | | | | | | | | | | | |
| | | | | | | | | | | | |
Robert Elstone | | Non-executive, Independent | | ü | | ü | | | | | | ü |
| | | | | | | | | | | | |
| | | | | | | | | | | | |
Peter Hawkins | | Non-executive, Independent | | ü | | ü | | ü | | | | Chair
ü |
| | | | | | | | | | | | |
| | | | | | | | | | | | |
Ann Pickard | | Non-executive, Independent | | | | ü | | | | ü | | |
| | | | | | | | | | | | |
| | | | | | | | | | | | |
Peter Wilson | | Non-executive, Independent | | Chair
ü | | ü | | ü | | | | |
| | | | | | | | | | | | |
This table shows membership of standing Committees of the Board.
The charts below demonstrate that our Board comprises a majority of independent Directors and show the tenure of our current Non-executive Directors.
Length of tenure of Non-executive Directors | | Balance of Non-executive and Executive Directors |
| | |
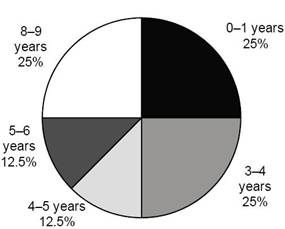
| | 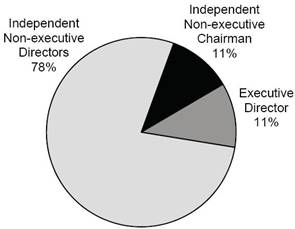
|
| | |
| 2012 WESTPAC GROUP ANNUAL REPORT | 25 |
Chairman
The Board elects one of the independent Non-executive Directors as Chairman. Our current Chairman is Lindsay Maxsted, who became Chairman on 14 December 2011 following the retirement of Ted Evans at the AGM held on that day. The Chairman’s role includes:
§ providing effective leadership to the Board in relation to all Board matters;
§ guiding the agenda and conducting all Board meetings;
§ in conjunction with the Company Secretaries, arranging regular Board meetings throughout the year, confirming that minutes of meetings accurately record decisions taken and, where appropriate, the views of individual Directors;
§ overseeing the process for appraising Directors and the Board as a whole;
§ overseeing Board succession;
§ acting as a conduit between management and Board, and being the primary point of communication between the Board and CEO;
§ representing the views of the Board to the public; and
§ taking a leading role in creating and maintaining an effective corporate governance system.
Deputy Chairman
Our Deputy Chairman is John Curtis. The Deputy Chairman’s role includes:
§ chairing Board and shareholder meetings when the Chairman is unable to do so; and
§ undertaking additional matters on the Chairman’s behalf, as requested by the Chairman.
CEO
Our CEO is Gail Kelly. The CEO’s role includes:
§ leadership of the management team;
§ developing strategic objectives for the business; and
§ the day-to-day management of the Westpac Group’s operations.
Board meetings
The Board had nine scheduled meetings for the financial year ended 30 September 2012, with additional meetings held as required. In July each year the Board discusses our strategic plan and approves our overall strategic direction. The Board also conducts a half year review of our strategy. The Board conducts workshops on specific subjects relevant to our business throughout the year. Board meetings are characterised by robust exchanges of views, with Directors bringing their experience and independent judgment to bear on the issues and decisions at hand.
Non-executive Directors regularly meet without management present, so that they can discuss issues appropriate to such a forum. In all other respects, senior executives are invited, where considered appropriate, to participate in Board meetings. They also are available to be contacted by Directors between meetings.
Meetings attended by Directors for the financial year ended 30 September 2012 are reported in Section 8 of the Directors’ report.
Nomination and appointment
The Board Nominations Committee is responsible for:
§ developing and reviewing policies on Board composition, strategic function and size;
§ reviewing and making recommendations to the Board annually on diversity generally within the Westpac Group, measurable objectives for achieving diversity and progress in achieving those objectives;
§ planning succession of the Non-executive Directors;
§ developing and implementing induction programs for new Directors and ongoing education for existing Directors;
§ developing eligibility criteria for the appointment of Directors;
§ recommending appointment of Directors to the Board; and
§ considering and recommending candidates for appointment to the Boards of relevant subsidiaries.
Westpac seeks to maintain a Board of Directors with a broad range of financial and other skills, experience and knowledge necessary to guide the business of the Westpac Group.
The Board Nominations Committee considers and makes recommendations to the Board on candidates for appointment as Directors. Such recommendations pay particular attention to the mix of skills, experience, expertise, diversity and other qualities of existing Directors, and how the candidate’s attributes will balance and complement those qualities. External consultants are used to access a wide base of potential Directors.
New Directors receive an induction pack which includes a letter of appointment setting out the expectations of the role, conditions of appointment including the expected term of appointment, and remuneration. This letter conforms to the ASXCGC Recommendations.
The attendance of Board Nominations Committee members at the Committee’s meetings is set out in Section 8 of the Directors’ report.
Term of office
The Board may appoint a new Director, either to fill a casual vacancy or as an addition to the existing Directors, provided the total number of Directors does not exceed 15 Non-executive Directors and three Executive Directors. Except for the Managing Director, a Director appointed by the Board holds office only until the close of the next AGM but is eligible for election by shareholders at that meeting.
Our constitution states that at each AGM, one-third of eligible Directors, and any other Director who has held office for three or more years since their last election, must retire. In determining the number of Directors to retire by rotation, no account is to be taken of Directors holding casual vacancy positions or of the CEO. The Directors to retire by rotation are those who have been the longest in office. A retiring Director holds office until the conclusion of the meeting at which he or she retires but is eligible for re-election by shareholders at that meeting.
| | |
26 | 2012 WESTPAC GROUP ANNUAL REPORT | |
The Board makes recommendations concerning the election or re-election of any Director by shareholders. In considering whether to support a candidate, the Board takes into account the results of the Board performance evaluation conducted during the year. In addition to information on the candidates provided to shareholders in the Notice of Meeting, the candidates are invited to give a short presentation at the AGM.
The Board has a Tenure Policy, which limits the maximum tenure of office that any Non-executive Director other than the Chairman may serve to nine years, from the date of first election by shareholders. The maximum tenure for the Chairman is 12 years (inclusive of any term as a Director prior to being elected as Chairman), from the date of first election by shareholders. The Board, on its initiative and on an exceptional basis, may exercise discretion to extend the maximum terms specified above where it considers that such an extension would benefit the Group. Such discretion will be exercised on an annual basis and the Director concerned will be required to stand for re-election annually.
Education
On appointment, all Directors are offered an induction program appropriate to their experience to familiarise them with our business, strategy and any current issues before the Board. The induction program includes meetings with the Chairman, the CEO, the Board Committee Chairs and each Group Executive.
The Board encourages Directors to continue their education by participating in workshops held throughout the year, attending relevant site visits and undertaking relevant external education.
Access to information and advice
All Directors have unrestricted access to company records and information, and receive regular detailed financial and operational reports from executive management. Each Director also enters into an access and indemnity agreement which, among other things, provides for access to documents for up to seven years after his or her retirement as a Director.
The Chairman and other Non-executive Directors regularly consult with the CEO, CFO and other senior executives, and may consult with, and request additional information from, any of our employees.
All Directors have access to advice from senior internal legal advisors including the Group General Counsel.
In addition, the Board collectively, and all Directors individually, have the right to seek independent professional advice, at our expense, to help them carry out their responsibilities. While the Chairman’s prior approval is needed, it may not be unreasonably withheld.
Company Secretaries
We have two Company Secretaries appointed by the Board. The Senior Company Secretary, who is also Legal Counsel to the Board, attends Board and Board Committee meetings and is responsible for providing Directors with advice on legal and corporate governance issues together with the Group General Counsel. The Group Company Secretary attends Board and Board Committee meetings and is responsible for the operation of the secretariat function, including implementing our governance framework and, in conjunction with management, giving practical effect to the Board’s decisions.
Profiles of our Company Secretaries are set out in Section 1 of the Directors’ report.
Board Committees
Composition and independence
Board Committee members are chosen for the skills and experience they can contribute to the respective Board Committees. All of the Board Committees are comprised of independent Non-executive Directors. The CEO is also a member of the Board Technology Committee.
Operation and reporting
Scheduled meetings of the Board Committees occur quarterly, with the exception of the Board Technology Committee which has scheduled meetings three times a year. All Board Committees are able to meet more frequently as necessary. Each Board Committee is entitled to the resources and information it requires and has direct access to our employees and advisers. The CEO attends all Board Committee meetings, except where she has a material personal interest in a matter being considered. Senior executives and other selected employees are invited to attend Board Committee meetings as required. All Directors can receive all Board Committee papers and can attend any Board Committee meeting, provided there is no conflict of interest.
Performance
Board, Board Committees and Directors
The Board undertakes ongoing self-assessment as well as commissioning an annual performance review by an independent consultant.
The review process includes an assessment of the performance of the Board, the Board Committees and each Director.
The performance review process conducted in 2012 included interviews by an independent consultant with Directors and certain senior executives. The review was wide-ranging, with outputs collected and analysed and presented to the Board. The Board discussed the results and agreed follow-up action on matters relating to Board composition, process and priorities.
The Chairman also discusses the results with individual Directors and Board Committee Chairs. The full Board (excluding the Chairman) reviews the results of the performance review of the Chairman and results are then privately discussed between the Chairman and Deputy Chairman.
| | |
| 2012 WESTPAC GROUP ANNUAL REPORT | 27 |
Management
The Board, in conjunction with its Board Remuneration Committee, is responsible for approving the performance objectives and measures for the CEO and other senior executives, and providing input into the evaluation of performance against these objectives. The Board Risk Management Committee also refers to the Board Remuneration Committee any matters that come to its attention that are relevant with respect to remuneration policy or practices.
Management performance evaluations for the financial year ended 30 September 2012 will be conducted following the end of the financial year.
There is a further discussion on performance objectives and performance achieved in the Remuneration report in the Directors’ report.
All new senior executives are provided with extensive briefing on our strategies and operations, and the respective roles and responsibilities of the Board and senior management.
Advisory Boards
Each brand in our portfolio has its own unique identity and market position. Westpac maintains an Advisory Board for each of BankSA and Bank of Melbourne. Each assists in preserving the unique identity of these brands within the overall multi-brand strategy of the Westpac Group through oversight of management reports in relation to their brand health and positioning.
In particular, the Advisory Boards are responsible for:
§ overseeing management’s strategies and initiatives to continue to strengthen the unique brand position and identity;
§ overseeing the management of the relevant brand so as to promote and preserve its distinct position and identity and align brand values with those of the relevant communities served;
§ considering and assessing reports provided by management on the health of the relevant brand;
§ acting as ambassadors for the relevant bank, including through supporting community and major corporate promotional events to assist in building relationships with the bank’s customers, local communities and the business and government sector, and advising senior management on community matters relevant to the provision of financial services in the community it serves; and
§ alerting management to local market opportunities and issues of which Advisory Board members are aware that would enhance the provision of services to customers and potential customers and the position of the bank in its local communities.
ETHICAL AND RESPONSIBLE
DECISION-MAKING
Code of Conduct and Principles for Doing Business
Our ‘Code of Conduct’ sets out six principles that we believe will maintain the trust and confidence placed in us by our customers, shareholders, suppliers and the community at large. We recognise that this trust can only be retained by acting ethically and responsibly in all our dealings and by seeking to continually improve in all that we do. The Code of Conduct applies to all of our employees and contractors and is supported by the Board. The six principles are:
§ we act with honesty and integrity;
§ we comply with laws and with our policies;
§ we respect confidentiality and do not misuse information;
§ we value and maintain our professionalism;
§ we work as a team; and
§ we manage conflicts of interest responsibly.
Our ‘Principles for Doing Business’ (the Principles) set out how we aim to conduct ourselves across our business in the areas of:
§ governance and ethical practices;
§ customers;
§ employees;
§ environment;
§ community; and
§ suppliers.
The Principles are also aligned with significant global initiatives that promote responsible business practices. Our Principles apply to all Directors and employees.
We also have a range of internal guidelines, communications and training processes and tools, including an online learning module entitled ‘Doing the Right Thing’, which apply to and support our Code of Conduct and the Principles.
Key policies
In addition to our Code of Conduct and the Principles, we have a number of key policies to manage our compliance and human resource requirements. We also voluntarily subscribe to a range of external industry codes, such as the Code of Banking Practice and the Electronic Funds Transfer Code of Conduct.
| | |
28 | 2012 WESTPAC GROUP ANNUAL REPORT | |
Code of Ethics for Senior Finance Officers
The Code of Accounting Practice and Financial Reporting (the Code) complements our Code of Conduct. The Code is designed to assist the CEO, CFO and other principal financial officers in applying the highest ethical standards to the performance of their duties and responsibilities with respect to accounting practice and financial reporting. The Code requires that those officers:
§ act honestly and ethically, particularly with respect to conflicts of interest;
§ provide full, fair, accurate and timely disclosure in reporting and other communications;
§ comply with applicable laws, rules and regulations;
§ promptly report violations of the Code; and
§ be accountable for adherence to the Code.
Conflicts of interest
Westpac Group has a conflicts of interest framework, which includes a Group policy supported by more specific policies and guidelines aimed at recognising and managing potential conflicts.
The Board
All Directors are required to disclose any actual or potential conflict of interest upon appointment and are required to keep these disclosures to the Board up to date.
Any Director with a material personal interest in a matter being considered by the Board must declare their interest and, unless the Board resolves otherwise, may not be present during the boardroom discussions or vote on the relevant matter.
Our employees
Our employees are not permitted to participate in activities that involve a conflict with their duties and responsibilities or which are prejudicial to our business. We expect our employees to:
§ manage conflicts of interest;
§ obtain consent from senior management before accepting a directorship on the board of a non Westpac Group company;
§ disclose any material interests they have with our customers or suppliers to their manager and not be involved with customer relationships where they have such an interest;
§ not participate in business activities outside their employment with us (whether as a principal, partner, director, agent, guarantor, investor or employee) without approval or when it could adversely affect their ability to carry out their duties and responsibilities; and
§ not solicit, provide facilitation payments, accept or offer money, gifts, favours or entertainment which might influence, or might appear to influence, their business judgment.
Fit and Proper Person assessments
Our Fit and Proper Policy complies with the related APRA Prudential Standards and ASIC guidelines. In accordance with that policy, we assess the fitness and propriety of our Directors and also of employees who perform specified roles. The Chairman of the Board (and in the case of the Chairman, the Board) is responsible for assessing the main Board Directors, Non-executive Directors on subsidiary Boards and Group Executives. An executive Fit and Proper Committee assesses other employees. In all cases the individual is asked to provide a detailed declaration and background checks are undertaken. Assessments are performed upon appointment to the relevant position and are re-assessed annually.
Concern reporting and whistleblower protection
Under our Whistleblower Protection Policy, our employees are encouraged to raise any concerns about activities or behaviour that may be unlawful or unethical with management, the human resources team, the compliance team or the Financial Crime Management business unit. Concerns may include suspected breaches of the Code of Conduct, the Principles and any internal policy or regulatory requirement.
Employees can raise possible wrongdoings on an anonymous basis. Employees may choose to involve the Whistleblower Protection Officer, who is responsible for protecting the employee against disadvantage.
We investigate reported concerns in a manner that is fair and objective to all people involved. If the investigation shows that wrongdoing has occurred, we are committed to changing our processes and taking action in relation to employees who have behaved incorrectly. Where illegal conduct has occurred, this may involve reporting the matter to relevant authorities.
The concern reporting system meets all relevant Australian and New Zealand legislative requirements, including the Australian Standard AS8004 (Whistleblower Protection Programs for Entities), in addition to our obligations under the United States Sarbanes-Oxley Act of 2002. The system is monitored and reviewed annually and statistics about concerns raised are reported quarterly to both the Board Risk Management Committee and the Westpac Group Operational Risk & Compliance Committee.
Securities trading
Under the Westpac Group Securities Trading Policy, Directors and all Westpac employees are restricted from dealing in our shares and other financial products if they possess inside information. They are also prohibited from passing on inside information to others who may use that information to trade in securities. In addition, Directors and any employees who, because of their seniority or the nature of their position, may have access to material non-public information about Westpac (Prescribed Employees), are subject to further restrictions, including prohibitions on trading prior to and immediately following annual and half year profit announcements.
| | |
| 2012 WESTPAC GROUP ANNUAL REPORT | 29 |
We manage and monitor our obligations through:
§ the insider trading provisions of our policy, which prohibit any dealing in any securities where a Director or employee has access to inside information that may affect the price of those securities;
§ the new issues provisions of our policy, which place limitations upon Directors and employees participating in a new product issue where their position puts them in a real or perceived position of conflict of interest;
§ restrictions limiting the periods in which the Directors and Prescribed Employees can trade in our shares or other company securities (Blackout Periods);
§ requiring Directors and Prescribed Employees to notify their intention to trade outside Blackout Periods and confirm that they have no inside information;
§ monitoring the trading of Westpac securities by Directors and Prescribed Employees;
§ maintaining a register of Prescribed Employees, which is regularly updated;
§ notifying ASX of trades by Directors of Westpac securities as required under the ASX Listing Rules; and
§ forbidding employees from entering into hedging arrangements in relation to their unvested employee shares or securities, whether directly or indirectly.
DIVERSITY
Westpac Group has a Group Diversity Policy that sets out the diversity initiatives for the Westpac Group. In this context, diversity covers gender, age, ethnicity, cultural background, sexual orientation and religious beliefs.
The objectives of the policy are to ensure that the Westpac Group:
§ has a workforce profile that delivers competitive advantage through the ability to garner a deep understanding of customer needs;
§ has a truly inclusive workplace where every individual can shine regardless of gender, cultural identity, age, work style or approach;
§ leverages the value of diversity for all our stakeholders to deliver the best customer experience, improved financial performance and a stronger corporate reputation; and
§ continues to take a leadership position on diversity practices and setting the agenda in the external community.
To achieve these objectives the Westpac Group:
§ has set Board determined, measurable objectives for achieving gender diversity. The Board assesses annually both the objectives and progress in achieving them;
§ assesses pay equity on an annual basis;
§ encourages and supports the application of flexibility policy into practice across the business;
§ meets our commitment to the Australian Employment Covenant to assist Indigenous Australians to access employment across our brands; and
§ implements our Accessibility Action Plan for employees and customers with a disability, including providing employment opportunities for people with disabilities.
The implementation of these objectives is overseen by the Westpac Group Diversity Council chaired by the CEO.
The Board, or an appropriate Committee of the Board, will receive regular updates from the Westpac Group Diversity Council on these diversity initiatives.
We will also continue to listen to the needs of our employees through our employee surveys and specific diversity focused surveys.
In October 2010, the Board set a measurable objective to increase the proportion of women in leadership roles (over 5,000 leaders from our executive team through to our bank managers) from 33% to 40% by 2014.
At 30 September 2012, the proportion of women employed by Westpac Group was as follows:
§ Board of Directors: 33%;
§ leadership1 roles: 40%; and
§ total Westpac workforce: 61%
CORPORATE SUSTAINABILITY
We view sustainable and responsible business practices as important for our business and to add shareholder value. This means conducting our business in a responsible, trustworthy and ethical manner, while accepting accountability for our impacts on society and the environment.
We are committed to transparency and fair dealing, treating employees and customers responsibly, and having solid links with the community.
Reporting
We report on our social, ethical and environmental performance as a part of the Annual Review and Sustainability Report and the full Annual Report, and provide additional detailed information on our website. Where appropriate, we include what we believe are the most material environmental, social and governance metrics within our financial results announcements.
Our management and our reporting of sustainability aim to address the issues that we believe are the most material for our business and stakeholders, now and in the future. We understand that this is an evolving agenda and seek to progressively embed the management of sustainability issues into business as usual practice. We also seek to anticipate and shape emerging social issues where we have the skills and experience to make a meaningful difference and drive business value.
We follow the Global Reporting Initiative reporting framework.
1 Women in leadership refers to the proportion of women (permanent and maximum term) in people leadership roles or senior roles of influence as a proportion of all leaders across the Group. It includes the CEO, Executive Team, General Managers, Senior Managers as direct reports to General Managers and the next two levels of management.
| | |
30 | 2012 WESTPAC GROUP ANNUAL REPORT | |
The sustainability content of the Annual Review and Sustainability Report is independently assured against the AA1000 Assurance Standard and follows the Global Reporting Initiative framework. The assurance process not only tests the integrity of the data, but also tests the effectiveness of our underlying systems and processes, and the extent to which corporate responsibility and sustainability policies and processes are embedded across our organisation.
In addition, we actively participate in various independent external assessments by authoritative sustainability and governance rating organisations benchmarking us against the highest standards of governance.
Board Sustainability Committee
In recognition of the embedded nature of our approach to sustainability, the Board Sustainability Committee was dissolved in March 2012, with the full Board reassuming oversight and responsibility of the Group’s sustainability activities.
FINANCIAL REPORTING
Approach to financial reporting
Our approach to financial reporting reflects three core principles:
§ that our financial reports present a true and fair view;
§ that our accounting methods comply with applicable accounting rules and policies; and
§ that our external auditor is independent and serves security holders’ interests.
The Board, through the Board Audit Committee, monitors Australian and international developments relevant to these principles, and reviews our practices accordingly.
The Board delegates oversight responsibility for risk management between the Board Audit Committee and the Board Risk Management Committee.
Board Audit Committee
As detailed in its charter, the Board Audit Committee has oversight of:
§ the integrity of the financial statements and financial reporting systems;
§ the external auditor’s qualifications, performance, independence and fees;
§ performance of the internal audit function;
§ financial reporting and regulatory compliance with reference to the Board Risk Management Committee. This includes an oversight of regulatory and statutory reporting requirements; and
§ procedures for the receipt, retention and treatment of financial complaints, including accounting, internal controls or auditing matters, and the confidential reporting by employees of concerns regarding accounting or auditing matters.
The Board Audit Committee reviews and assesses:
§ any significant estimates and judgments in financial reports, and monitors the methods used to account for unusual transactions;
§ the processes used to monitor and comply with laws, regulations and other requirements relating to external reporting of financial and non-financial information;
§ the major financial risk exposures; and
§ the process surrounding the disclosures made by the CEO and CFO in connection with their personal certifications of the annual financial statements.
The Board Audit Committee conducts regular discussions with:
§ the Board Risk Management Committee, CFO, Chief Risk Officer (CRO), Group Assurance (our internal audit function), management and the external auditor, about our major financial risk exposures and the steps management has taken to monitor and control such exposures;
§ the external auditor concerning their audit and any significant findings, and the adequacy of management’s responses;
§ management and the external auditor concerning the half year and annual financial statements;
§ management and the external auditor regarding any correspondence, with regulators or government agencies, and reports that raise issues of a material nature; and
§ the Legal Counsel to the Board and the Group General Legal Counsel regarding any legal matters that may have a material impact on, or require disclosure in, the financial statements.
Periodically, the Board Audit Committee consults with the external auditor without the presence of management about internal controls over financial information, reporting and disclosure and the fullness and accuracy of Westpac’s financial statements. The Board Audit Committee also meets with the General Manager, Group Assurance without management being present.
Financial knowledge
The Board Audit Committee comprises four independent, Non-executive Directors and is chaired by Peter Wilson.
All Board Audit Committee members have appropriate financial experience, an understanding of the financial services industry and satisfy the independence requirements under the ASXCGC Recommendations, the United States Securities Exchange Act of 1934 (as amended) and its related rules, and the NYSE Listing Rules.
The Board has determined that Lindsay Maxsted, member of the Board Audit Committee, is an ‘audit committee financial expert’ and independent in accordance with US securities law.
| | |
| 2012 WESTPAC GROUP ANNUAL REPORT | 31 |
The designation of Lindsay Maxsted as an audit committee financial expert does not impose duties, obligations or liability on him that are greater than those imposed on him as a Board Audit Committee member, and does not affect the duties, obligations or liability of any other Board Audit Committee member or Board member. Audit committee financial experts are not deemed as an ‘expert’ for any other purpose.
The Board Audit Committee’s membership is set out in the table entitled ‘Size and membership of Board Committees as at 30 September 2012’. The full qualifications of the Audit Committee members and their attendance at Board Audit Committee meetings are set out in Section 1 and Section 8 of the Directors’ report.
External auditor
The role of the external auditor is to provide an independent opinion that our financial reports are true and fair, and comply with applicable regulations.
Our external auditor is PricewaterhouseCoopers (PwC), appointed by shareholders at the 2002 AGM. Our present PwC lead audit partner is Michael Codling and the review audit partner is Victor Clarke. Michael Codling and Victor Clarke assumed responsibility for these roles in December 2012 and December 2011 respectively.
The external auditor receives all Board Audit Committee papers, attends all Board Audit Committee meetings and is available to Board Audit Committee members at any time. The external auditor also attends the AGM to answer questions from shareholders regarding the conduct of its audit, the audit report and financial statements and its independence.
As our external auditor, PwC is required to confirm their independence and compliance with specified independence standards on a quarterly basis.
The roles of lead audit partner and review audit partner must be rotated every five years and cannot be resumed by the same person for a minimum of five years.
We strictly govern our relationship with the external auditor, including restrictions on employment, business relationships, financial interests and use of our financial products by the external auditor.
Engagement of the external auditor
To avoid possible independence or conflict issues, the external auditor is not permitted to carry out certain types of non-audit services for Westpac and may be limited as to the extent to which it can perform other non-audit services as specified in our ‘Pre-approval of engagement of PwC for audit and non-audit services’ (the Guidelines). Use of the external audit firm for any non-audit services must be assessed and approved in accordance with the pre-approval process determined by the Board Audit Committee and set out in the Guidelines.
The breakdown of the aggregate fees billed by the external auditor in respect of each of the two most recent financial years for audit, audit-related, tax and other services is provided in Note 33 to our financial statements for the year ended 30 September 2012. A declaration regarding the Board’s satisfaction that the provision of non-audit services by PwC is compatible with the general standards of auditor independence is provided in Section 10 of the Directors’ report.
Group Assurance (internal audit)
Group Assurance is Westpac’s internal audit function providing the Board and Executive Management with an independent and objective evaluation of the adequacy and effectiveness of management’s control over risk. Group Assurance covers the governance, risk management and internal control frameworks of Westpac and its wholly owned subsidiaries. It has access to all of our entities, and conducts audits and reviews following a risk-based planning approach.
Group Assurance provides regular reports to the Board Audit Committee and, as deemed appropriate, the Board Risk Management Committee, and raises any significant issues with those Committees. The General Manager, Group Assurance has a reporting line to the Chairman of the Board Audit Committee.
MARKET DISCLOSURE
We maintain a level of disclosure that seeks to provide all investors with equal, timely, balanced and meaningful information. Consistent with these standards the Westpac Group maintains a Board approved Market Disclosure Policy, which governs how we communicate with our shareholders and the investment community.
The policy reflects the requirements of the ASX, NZX and other offshore stock exchanges where we have disclosure obligations, as well as relevant securities and corporations legislation. Under our policy, information that a reasonable person would expect to have a material effect on the price or value of our securities must first be disclosed via the ASX unless an exception applies under regulatory requirements.
Our Disclosure Committee is responsible for determining what information should be disclosed publicly under the policy, and for assisting employees in understanding what information may require disclosure to the market on the basis that it is price sensitive. The Disclosure Committee is comprised of the CEO, the Executive Team, the Group General Counsel and the General Manager, Corporate Affairs and Sustainability.
The Chief Operating Officer is the Disclosure Officer. The Disclosure Officer is ultimately responsible for all communication with relevant stock exchanges and notifying regulators in any jurisdiction as a result of market disclosure.
Once relevant information is disclosed to the market and available to investors, it is also published on our website. This includes investor discussion packs, containing presentations on and explanations about our financial results. Our website information also includes Annual Review and Sustainability Reports, Annual Reports, profit announcements, CEO and executive briefings (including webcasts, recordings or transcripts of all major events), economic updates, notices of meetings and media releases.
| | |
32 | 2012 WESTPAC GROUP ANNUAL REPORT | |
SHAREHOLDER COMMUNICATION AND PARTICIPATION
We seek to keep our shareholders fully informed through a variety of communication mediums. These are regularly reviewed to improve our communications and utilise new technologies. These approaches include:
§ direct communications with shareholders via mail and email;
§ the publication of all relevant company information in the Investor Centre section of our website; and
§ access to all major market briefings and shareholder meetings via webcasts.
Shareholders are provided with advance notice of all major market briefings and shareholder meetings, through ASX announcements and/or the publication of an investor calendar of events on our website.
Shareholders are given the option to receive information in print or electronic format.
We regard the AGM as an important opportunity for engaging and communicating with shareholders. Shareholders are encouraged to attend and actively participate in our AGM, which is webcast and can also be viewed at a later time from our website. Shareholders who are unable to attend the AGM are able to lodge their proxies through a number of channels, including electronically via the internet. At the time of receiving the Notice of Meeting, shareholders are also invited to put forward questions they would like addressed at the AGM.
RISK MANAGEMENT
Roles and responsibilities
The Board is responsible for reviewing and approving our overall risk management strategy, including determining our appetite for risk. The Board has delegated to the Board Risk Management Committee responsibility for providing recommendations to the Board on Westpac Group’s risk-reward strategy, setting risk appetite, approving frameworks, policies and processes for managing risk, and determining whether to accept risks beyond management’s approval discretion.
The Board Risk Management Committee monitors the alignment of our risk profile with our risk appetite, which is defined in the Board Statement of Risk Appetite, and with our current and future capital requirements. The Board Risk Management Committee receives regular reports from management on the effectiveness of our management of Westpac’s material business risks. More detail about the role of the Board Risk Management Committee is set out later in this section under ‘Board Risk Management Committee’.
The CEO and executive management team are responsible for implementing our risk management strategy and frameworks, and for developing policies, controls, processes and procedures for identifying and managing risk in all of Westpac’s activities.
Our approach to risk management is that ‘risk is everyone’s business’ and that responsibility and accountability for risk begins with the business units that originate the risk.
The 1st Line of Defence – Risk identification, risk management and self-assurance
Divisional business units are responsible for identifying, evaluating and managing the risks that they originate within approved risk appetite and policies. They are required to establish and maintain appropriate risk management controls, resources and self-assurance processes.
The 2nd Line of Defence – Establishment of risk management frameworks and policies and risk management oversight
Our 2nd Line of Defence has three layers:
§ our executive risk committees lead the optimisation of risk-reward by overseeing the development of risk appetite statements, risk management frameworks, policies and risk concentration controls, and monitoring Westpac’s risk profile for alignment with approved appetites and strategies;
§ our Group Risk function is independent from the business divisions, reports to the Chief Risk Officer (CRO), and establishes and maintains the Group-wide risk management frameworks, policies and concentration limits that are approved by the Board Risk Management Committee. It also reports on Westpac’s risk profile to executive risk committees and the Board Risk Management Committee; and
§ divisional risk areas are responsible for developing division-specific risk appetite statements, policies, controls, procedures, monitoring and reporting capability, which align to the Board’s Statement of Risk Appetite and the risk management frameworks approved by the Board Risk Management Committee. These risk areas are independent of the Divisions’ 1st Line business areas, with each divisional CRO having a direct reporting line to the CRO, as well as to their Division’s Group Executive.
The 3rd Line of Defence – Independent assurance
Our Group Assurance function independently evaluates the adequacy and effectiveness of the Group’s overall risk management framework and controls.
Our overall risk management approach is summarised in the following diagram:
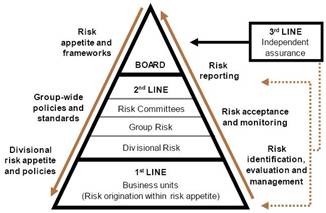
Our overall risk management governance structure is set out in more detail in the table ‘Risk Management Governance Structure’ included in this statement.
| | |
| 2012 WESTPAC GROUP ANNUAL REPORT | 33 |
Risk management approach
We regard managing the risks that affect our business as a fundamental activity, as they influence our performance, reputation and future success. Effective risk management involves taking an integrated and balanced approach to risk and reward, and enables us to both increase financial growth opportunities and mitigate potential loss or damage. Mitigation and optimisation strategies are of equal importance and need to be effectively aligned and integrated.
We distinguish five main types of risk:
§ credit risk – the risk of financial loss where a customer or counterparty fails to meet their financial obligations;
§ liquidity risk – the risk of not being able to fund our assets and meet obligations as they come due, without incurring unacceptable losses;
§ market risk – the risk of an adverse impact on earnings resulting from changes in market factors, such as foreign exchange rates, interest rates, commodity prices and equity prices. This includes interest rate risk in the banking book – the risk to interest income from a mismatch between the duration of assets and liabilities that arises in the normal course of business activities;
§ operational risk – operational risk is the risk of loss resulting from inadequate or failed internal processes, people and systems or from external events. The definition is aligned to the regulatory (Basel II) definition, including legal and regulatory risk but excluding strategic and reputation risk; and
§ compliance risk – the risk of legal or regulatory sanction, and financial or reputation loss, arising from our failure to abide by the compliance obligations required of us.
In addition to, and linked to, these five main types of risk, we also manage the following risks:
§ business risk – the risk associated with the vulnerability of a line of business to changes in the business environment;
§ environmental, social and governance risks – the risk of damage to the Group’s reputation or financial performance due to failure to recognise or address material existing or emerging sustainability related environmental, social or governance issues;
§ equity risk – the potential for financial loss arising from movements in the value of our direct and indirect equity investments;
§ insurance risk – the risk of mis-estimation of the expected cost of insured events, volatility in the number or severity of insured events, and mis-estimation of the cost of incurred claims;
§ related entity (contagion) risk – the risk that problems arising in other Westpac Group members compromise the financial and operational position of the authorised deposit-taking institutions in the Westpac Group; and
§ reputation risk – the risk to earnings or capital arising from negative public opinion resulting from the loss of reputation or public trust and standing.
Westpac has received advanced accreditation from APRA and the RBNZ under the Basel II Capital Framework, and uses the Advanced Internal Ratings Based (AIRB) approach for credit risk and the Advanced Measurement Approach (AMA) for operational risk when calculating regulatory capital.
Board Risk Management Committee
The Board Risk Management Committee comprises all of Westpac’s independent, Non-executive Directors and is chaired by Elizabeth Bryan.
As set out in its charter, the Board Risk Management Committee:
§ provides recommendations to the Board on Westpac Group’s risk-reward strategy;
§ sets risk appetite;
§ reviews and approves the frameworks for managing risk, including capital, credit, liquidity, market, operational, compliance and reputation risk;
§ reviews and approves the limits and conditions that apply to the taking of risk, including the authority delegated by the Board to the CEO, CFO and CRO;
§ monitors the risk profile, performance, capital levels, exposures against limits and the management and control of our risks;
§ monitors changes anticipated in the economic and business environment and other factors considered relevant to our risk profile and risk appetite;
§ oversees the development and ongoing review of key policies that support our frameworks for managing risk; and
§ may approve accepting risks beyond management’s approval discretion.
From the perspective of specific types of risk, the Board Risk Management Committee role includes:
§ capital – approving the internal capital adequacy assessment process and in doing so reviewing the outcomes of enterprise wide stress testing, setting the target capital ranges for regulatory capital having regard to Westpac internal economic capital measures, and reviewing and monitoring capital levels for consistency with the Westpac Group’s risk appetite;
§ credit risk – approving key policies and limits supporting the credit risk management framework, and monitoring the risk profile, performance and management of our credit portfolio;
§ liquidity risk – approving the internal liquidity assessment process, key policies and limits supporting the liquidity risk management framework, including our funding strategy and liquidity requirements, and monitoring the liquidity risk profile;
§ market risk – approving key policies and limits supporting the market risk management framework, including the Value at Risk and Net Interest Income at Risk limits, and monitoring the market risk profile;
§ operational risk – monitoring the operational risk profile, the performance of operational risk management and controls, and the development and ongoing review of operational risk policies; and
| | |
34 | 2012 WESTPAC GROUP ANNUAL REPORT | |
§ compliance risk – reviewing compliance risk processes and our compliance with applicable laws, regulations and regulatory requirements, discussing with management and the external auditor any material correspondence with regulators or government agencies and any published reports that raise material issues, and reviewing complaints and whistleblower concerns.
The Board Risk Management Committee also:
§ provides relevant periodic assurances to the Board Audit Committee regarding the operational integrity of the risk management framework; and
§ refers to other Board Committees any matters that come to the attention of the Board Risk Management Committee that are relevant for those respective Board Committees.
The Board Risk Management Committee’s membership is set out in the table titled ‘Size and membership of Board Committees as at 30 September 2012’. The full qualifications of Board Risk Management Committee members and their attendance at Board Risk Management Committee meetings are set out in Section 1 and Section 8 of the Directors’ report.
Compliance Management Framework
Westpac’s Compliance Management Framework reflects the following core principles and practices:
§ complying with both the letter and spirit of regulatory standards is an essential part of our core values and is critical to our success;
§ regulatory standards are embedded into how we do business, how we conduct ourselves, how our systems and processes are designed and how they operate; and
§ compliance is the responsibility of everyone in every part of Westpac. Visibility and accountability of senior management encourages a strong compliance culture.
The mechanisms we use to implement these principles include:
§ maintaining a strong governance environment;
§ identifying obligations, developing and maintaining compliance plans and implementing change;
§ developing, implementing and testing compliance controls; and
§ monitoring and reporting incidents, issues and risks.
As with other forms of risk, business line management is primarily responsible for managing compliance risk. This is supported by a dedicated Compliance function covering the Group and each area of business activity. The Compliance function reports to the Chief Compliance Officer.
Regular reports are provided to the Operational Risk & Compliance Committee and the Board Risk Management Committee on the status of compliance across the Group.
CEO and CFO assurance
The Board receives regular reports from management about our financial condition and operational results, as well as that of our controlled entities. The CEO and the CFO annually provide formal statements to the Board, and have done so for the financial year ended 30 September 2012, that state in all material respects:
§ Westpac’s financial records for the financial year have been properly maintained in that they:
– correctly record and explain its transactions, and financial position and performance;
– enable true and fair financial statements to be prepared and audited; and
– are retained for seven years after the transactions covered by the records are completed;
§ the financial statements and notes required by the accounting standards for the financial year comply with the accounting standards;
§ the financial statements and notes for the financial year give a true and fair view of Westpac’s and its consolidated entities’ financial position and of their performance;
§ any other matters that are prescribed by the Corporations Act and regulations as they relate to the financial statements and notes for the financial year are satisfied; and
§ the declarations provided in accordance with section 295A of the Corporations Act are founded on a sound system of risk management and internal control, and that the system is operating effectively in all material respects in relation to financial reporting risks.
REMUNERATION
The Board Remuneration Committee assists the Board by ensuring that Westpac has coherent remuneration policies and practices that fairly and responsibly reward individuals having regard to performance, Westpac’s risk management framework, the law and the highest standards of governance.
The Board Remuneration Committee has been in place for the whole of the financial year and is comprised of four independent non-executive directors and is chaired by John Curtis. All members of the Board Remuneration Committee are also members of the Board Risk Management Committee, which assists in the integration of effective risk management into the remuneration framework.
As set out in its charter, the Board Remuneration Committee:
§ reviews and makes recommendations to the Board in relation to the Westpac Group Remuneration Policy (Group Remuneration Policy) and assesses the Group Remuneration Policy’s effectiveness and its compliance with prudential standards;
§ reviews and makes recommendations to the Board in relation to the individual remuneration levels of the CEO, Non-executive Directors, Group Executives, other Executives who report directly to the CEO, other persons whose activities in the Board’s opinion affect the financial soundness of Westpac, any person specified by APRA, and any other person the Board determines;
§ reviews and makes recommendations to the Board in relation to the remuneration structures for each category of persons covered by the Group Remuneration Policy;
| | |
| 2012 WESTPAC GROUP ANNUAL REPORT | 35 |
§ reviews and makes recommendations to the Board on corporate goals and objectives relevant to the remuneration of the CEO, and the performance of the CEO in light of these objectives;
§ reviews and makes recommendations to the Board on the short-term and long-term incentive plans for Group Executives;
§ reviews and makes recommendations to the Board in relation to approving any and all equity based plans; and
§ oversees general remuneration practices across the Group.
The Board Remuneration Committee reviews and recommends to the Board the size of variable reward pools each year based on consideration of pre-determined business performance indicators and the financial soundness of Westpac. The Board Remuneration Committee also approves remuneration arrangements outside of the Group Remuneration Policy relating to individuals or groups of individuals which are significant because of their sensitivity, precedent or disclosure implications. In addition, the Board Remuneration Committee considers and evaluates the performance of senior executives when making remuneration determinations and otherwise as required.
Independent remuneration consultants are engaged by the Board Remuneration Committee to provide information across a range of issues including remuneration benchmarking, market practices and emerging trends and regulatory reforms.
The Board Remuneration Committee’s membership is set out in the table titled ‘Size and membership of Board Committees as at 30 September 2012’. The full qualifications of Board Remuneration Committee members and their attendance at Board Remuneration Committee meetings are set out in Section 1 and Section 8 of the Directors’ report.
Further details of our remuneration framework are included in the Remuneration report in Section 9 of the Directors’ report.
Risk Management Governance Structure
Westpac’s risk management governance structure is set out in the table below:
Board |
§ reviews and approves our overall risk management strategy. |
Board Risk Management Committee (BRMC) |
§ provides recommendations to the Board on the Westpac Group’s risk-reward strategy; § sets risk appetite; § approves frameworks and key policies for managing risk; § monitors our risk profile, performance, capital levels, exposures against limits and management and control of our risks; § monitors changes anticipated in the economic and business environment and other factors relevant to our risk profile; § oversees the development and ongoing review of key policies that support our frameworks for managing risk; and § determines whether to accept risks beyond the approval discretion provided to management. |
Other Board Committees with a risk focus |
Board Audit Committee |
§ oversees the integrity of financial statements and financial reporting systems. |
Board Remuneration Committee |
§ reviews any matters raised by the BRMC with respect to risk-adjusted remuneration. |
Board Technology Committee |
§ oversees information technology strategy and implementation. |
Executive Team |
§ executes the Board-approved strategy; § assists with the development of the Board Statement of Risk Appetite; § delivers the Group’s various strategic and performance goals within the approved risk appetite; and § monitors key risks within each business unit, capital adequacy and the Group’s reputation. |
Executive risk committees |
Westpac Group Credit Risk Committee (CREDCO) |
§ leads the optimisation of credit risk-reward across the Group; § oversees the credit risk management framework and key policies; § oversees our credit risk profile; and § identifies emerging credit risks and appropriate actions to address these. |
Westpac Group Market Risk Committee (MARCO) |
§ leads the optimisation of market risk-reward across the Group; § oversees the market risk management framework and key policies; § oversees our market risk profile; and § identifies emerging market risks and appropriate actions to address these. |
| | |
36 | 2012 WESTPAC GROUP ANNUAL REPORT | |
Risk Management Governance Structure (continued)
Executive risk committees (continued) |
Westpac Group Asset & Liability Committee (ALCO) |
§ leads the optimisation of funding and liquidity risk-reward across the Group; § oversees the liquidity risk management framework and key policies; § oversees the funding and liquidity risk profile and balance sheet risk profile; and § identifies emerging funding and liquidity risks and appropriate actions to address these. |
Westpac Group Operational Risk & Compliance Committee (OPCO) |
§ leads the optimisation of operational risk-reward across the Group; § oversees the operational risk management framework, the compliance management framework and key supporting policies; § oversees our operational risk and compliance profiles; § oversees the reputation risk and environmental, social and governance (ESG) risk management frameworks and key supporting policies; and § identifies emerging operational and compliance risks and appropriate actions to address these. |
Westpac Group Remuneration Oversight Committee (ROC) |
§ responsible for ensuring that risk is embedded in all key steps in our remuneration framework; § reviews and makes recommendations to the CEO for recommendation to the Board Remuneration Committee on the Group Remuneration Policy and provides assurance that remuneration arrangements across the Group encourage behaviour that supports Westpac’s long-term financial soundness and the risk management framework; § reviews and monitors the remuneration arrangements (other than for Group Executives) for Responsible Persons (as defined in the Group’s Statutory Officers Fit and Proper Policy), risk and financial control personnel, and all other employees for whom a significant portion of total remuneration is based on performance and whose activities, either individually or collectively, may affect the financial soundness of Westpac; and § reviews and recommends to the CEO for recommendation to the Board Remuneration Committee the criteria and rationale for determining the total quantum of the Group variable reward pool. |
Group and divisional risk management |
Group Risk |
§ develops the Group-level risk management frameworks for approval by the BRMC; § directs the review and development of key policies supporting the risk management frameworks; § establishes risk concentration limits and monitors risk concentrations; and § monitors emerging risk issues. |
Compliance Function |
§ develops the Group-level compliance framework for approval by the BRMC; § directs the review and development of compliance policies, compliance plans, controls and procedures; § monitors compliance and regulatory obligations and emerging regulatory developments; and § reports on compliance standards. |
Divisional risk management § develops division-specific policies, risk appetite statements, controls, procedures, and monitoring and reporting capability that align to the frameworks approved by the BRMC. |
Independent internal review |
Group Assurance § reviews the adequacy and effectiveness of management controls for risk. |
Divisional business units |
Business Units |
§ responsible for identifying, evaluating and managing the risks that they originate within approved risk appetite policies; and § establish and maintain appropriate risk management controls, resources and self-assurance processes. |
| | |
| 2012 WESTPAC GROUP ANNUAL REPORT | 37 |
Checklist of Westpac’s compliance with ASXCGC Recommendations
| | ASXCGC Recommendations (with 2010 Amendments) | | Reference | | Compliance |
Principle 1: | | Lay solid foundations for management and oversight | | | | |
1.1 | | Establish the functions reserved to the Board and those delegated to senior executives and disclose those functions. | | Page 24 | | Comply |
1.2 | | Disclose the process for evaluating the performance of senior executives. | | Page 28 | | Comply |
1.3 | | Provide the information indicated in Guide to reporting on Principle 1. | | Pages 24, 28 | | Comply |
Principle 2: | | Structure the Board to add value | | | | |
2.1 | | A majority of the Board should be independent Directors. | | Pages 24–25 | | Comply |
2.2 | | The chair should be an independent Director. | | Page 26 | | Comply |
2.3 | | The roles of chair and chief executive officer should not be exercised by the same individual. | | Page 26 | | Comply |
2.4 | | The Board should establish a nomination committee. | | Page 26 | | Comply |
2.5 | | Disclose the process for evaluating the performance of the Board, its committees and individual Directors. | | Pages 27–28 | | Comply |
2.6 | | Provide the information indicated in Guide to reporting on Principle 2. | | Pages 24–27 | | Comply |
Principle 3: | | Promote ethical and responsible decision-making | | | | |
3.1 | | Establish a code of conduct and disclose the code or a summary of the code as to: | | Page 28 | | Comply |
| | 3.1.1 the practices necessary to maintain confidence in the company’s integrity 3.1.2 the practices necessary to take into account their legal obligations and the reasonable expectations of their stakeholders 3.1.3 the responsibility and accountability of individuals for reporting and investigating reports of unethical practices. | | | | |
3.2 | | Establish a policy concerning diversity and disclose the policy or a summary of that policy. | | Page 30 | | Comply |
3.3 | | Disclose the measurable objectives for achieving gender diversity set by the Board in accordance with the diversity policy and progress towards achieving them. | | Page 30 | | Comply |
3.4 | | Disclose the proportion of women employees in the whole organisation, women in senior executive positions and women on the Board. | | Page 30 | | Comply |
3.5 | | Provide the information indicated in Guide to reporting on Principle 3. | | Pages 28, 30 | | Comply |
Principle 4: | | Safeguard integrity in financial reporting | | | | |
4.1 | | The Board should establish an audit committee. | | Page 31 | | Comply |
4.2 | | Structure the audit committee so that it: | | Pages 25, 31 | | Comply |
| | § consists only of Non-executive Directors; § consists of a majority of independent Directors; § is chaired by an independent chair, who is not chair of the Board; and § has at least three members. | | | | |
4.3 | | The audit committee should have a formal charter. | | Page 31 | | Comply |
4.4 | | Provide the information indicated in Guide to reporting on Principle 4. | | Pages 25,
31–32 | | Comply |
| | |
38 | 2012 WESTPAC GROUP ANNUAL REPORT | |
| | ASXCGC Recommendations (with 2010 Amendments) | | Reference | | Compliance |
Principle 5: | | Make timely and balanced disclosure | | | | |
5.1 | | Establish written policies designed to ensure compliance with ASX Listing Rule disclosure requirements and to ensure accountability at a senior executive level for that compliance and disclose those policies or a summary of those policies. | | Page 32 | | Comply |
5.2 | | Provide the information indicated in Guide to reporting on Principle 5. | | Page 32 | | Comply |
Principle 6: | | Respect the rights of shareholders | | | | |
6.1 | | Design a communications policy for promoting effective communication with shareholders and encouraging their participation at general meetings and disclose the policy or a summary of that policy. | | Page 33 | | Comply |
6.2 | | Provide the information indicated in Guide to reporting on Principle 6. | | Page 33 | | Comply |
Principle 7: | | Recognise and manage risk | | | | |
7.1 | | Establish policies for the oversight and management of material business risks and disclose a summary of those policies. | | Pages 33–37 | | Comply |
7.2 | | The Board should require management to design and implement the risk management and internal control system to manage the company’s material business risks and report to it on whether those risks are being managed effectively. The Board should disclose that management has reported to it as to the effectiveness of the company’s management of its material business risks. | | Pages 33–37 | | Comply |
7.3 | | The Board should disclose whether it has received assurance from the chief executive officer (or equivalent) and the chief financial officer (or equivalent) that the declaration provided in accordance with section 295A of the Corporations Act is founded on a sound system of risk management and internal control and that the system is operating effectively in all material respects in relation to financial reporting risks. | | Page 35 | | Comply |
7.4 | | Provide the information indicated in Guide to reporting on Principle 7. | | Pages 33–37 | | Comply |
Principle 8: | | Remunerate fairly and responsibly | | | | |
8.1 | | Establish a remuneration committee. | | Pages 35–36 | | Comply |
8.2 | | The remuneration committee should be structured so that it: § consists of a majority of independent Directors; § is chaired by an independent chair; and § has at least three members. | | Page 25 | | Comply |
8.3 | | Clearly distinguish the structure of Non-executive Directors’ remuneration from that of executive Directors and senior executives. | | Pages 35–36 | | Comply |
8.4 | | Provide the information indicated in Guide to reporting on Principle 8. | | Pages 30,
35–36 | | Comply |
| | |
| 2012 WESTPAC GROUP ANNUAL REPORT | 39 |
Our Directors present their report together with the financial statements of the Group for the financial year ended 30 September 2012.
1. DIRECTORS
The names of the persons who have been Directors, or appointed as Directors, during the period since 1 October 2011 and up to the date of this report are: Lindsay Philip Maxsted, Edward (Ted) Alfred Evans (retired as Director and Chairman on 14 December 2011), Gail Patricia Kelly, John Simon Curtis, Elizabeth Blomfield Bryan, Gordon McKellar Cairns, Robert George Elstone (Director from 1 February 2012), Peter John Oswin Hawkins, Carolyn Judith Hewson (retired as Director on 30 June 2012), Ann Darlene Pickard (Director from 1 December 2011), Graham John Reaney (retired as Director on 14 December 2011) and Peter David Wilson.
Particulars of the skills, experience, expertise and responsibilities of the Directors at the date of this report, including all directorships of other listed companies held by a Director at any time in the past three years immediately before 30 September 2012 and the period for which each directorship has been held, are set out below.

| | Name: Lindsay Maxsted,
DipBus (Gordon), FCA, FAICD Age: 58 Term of office: Director since March 2008 and Chairman since December 2011. Date of next scheduled
re-election: December 2014. Independent: Yes. Current directorships of listed entities and dates of office: Director of Transurban Group (since March 2008, and Chairman since August 2010). Director of BHP Billiton Limited (since March 2011) and BHP Billiton plc (since March 2011). | | Other principal directorships: Managing Director of Align Capital Pty Limited and Director of Baker IDI Heart & Diabetes Institute Holdings Limited. Other interests: Nil. Other Westpac related entities directorships and period of office: Nil. Skills, experience and expertise: Lindsay was the CEO of KPMG from January 2001 to December 2007 and was a partner of KPMG from July 1984 to February 2008. Lindsay’s principal area of practice prior to becoming CEO was in the corporate recovery field managing a number of Australia’s | | largest insolvency / workout / turnaround engagements. At the request of the Victorian State Government, Lindsay was appointed to the Board of the Public Transport Corporation in December 1995 and was Chairman from 1997 to 2001. Westpac Board Committee membership: Chairman of the Board Nominations Committee. Member of each of the Board Audit and Board Risk Management Committees. Directorships of other listed entities over the past three years and dates of office: Nil. |
| | | | | | |

| | Name: Gail Kelly,
HigherDipEd, BA, MBA with Distinction, HonDBus Age: 56 Term of office: Managing Director & Chief Executive Officer since February 2008. Date of next scheduled
re-election: Not applicable. Independent: No. Current directorships of listed entities and dates of office: Nil. Other principal directorships: The Business Council of Australia and the Financial Markets Foundation for Children. | | Other interests: Director of the Australian Bankers’ Association. Member of the Global Board of Advisers at the US Council on Foreign Relations and is a member of the Sydney Cricket and Sports Ground Trust. Other Westpac related entities directorships and dates of office: Nil. Skills, experience and expertise: Gail began her banking career in 1980, and by 2001 Gail had held various senior management roles in a broad range of areas including retail and commercial banking, strategy, marketing and human resources. Gail has spent the last ten years as CEO of two Australian banks, St.George Bank from 2002 to 2007 and Westpac from 1 February 2008 to date. Gail is Care Australia’s Ambassador for Women’s Empowerment. | | Westpac Board Committee membership: Member of the Board Technology Committee. Directorships of other listed entities over the past three years and dates of office: Nil. |
| | |
40 | 2012 WESTPAC GROUP ANNUAL REPORT | |

| | Name: John Curtis AM,
BA, LLB (Hons.) Age: 62 Term of office: Director and Deputy Chairman since December 2008. Date of next scheduled
re-election: December 2014. Independent: Yes. Current directorships of listed entities and dates of office: Nil. Other principal directorships: Chairman of Allianz Australia Limited. Other interests: Nil. Other Westpac related entities directorships: Nil. | | Skills, experience and expertise: For the past 25 years John has been a professional company director and has been chairman and director of a wide variety of public companies, government entities and foreign corporations. In more recent times he has been largely involved in the financial services sector with his current appointments as set out above and former appointments with Merrill Lynch, Perpetual Limited and First Data Corporation in Australia. Prior to 1987, John was a Director of Wormald International Limited and was responsible for its operations in Australia, Europe, Asia and the | | Americas. During part of that time he was Chairman of the National Building and Construction Council, the peak industry body. Westpac Board Committee membership: Chairman of the Board Remuneration Committee. Member of each of the Board Nominations and Board Risk Management Committees. Directorships of other listed entities over the past three years and dates of office: Nil. |
| | | | | | |

| | Name: Elizabeth Bryan, BA (Econ.), MA (Econ.) Age: 66 Term of office: Director since November 2006. Date of next scheduled
re-election: December 2013. Independent: Yes. Current directorships of listed entities and dates of office: Director of Caltex Australia Limited (since July 2002, and Chairman since October 2007). Other principal directorships: Nil. | | Other interests: Member of the Takeovers Panel. Other Westpac related entities directorships and dates of office: Nil. Skills, experience and expertise: Elizabeth has over 32 years experience in the financial services industry, government policy and administration, and on the boards of companies and statutory organisations. Prior to becoming a professional director she served for six years as Managing Director of Deutsche Asset Management and its | | predecessor organisation, NSW State Superannuation Investment and Management Corporation. Westpac Board Committee membership: Chairman of the Board Risk Management Committee. Member of each of the Board Nominations, Board Remuneration and Board Technology Committees. Directorships of other listed entities over the past three years and dates of office: Nil. |
| | | | | | |

| | Name: Gordon Cairns,
MA (Hons.) Age: 62 Term of office: Director since July 2004. Date of next scheduled
re-election: December 2012. Independent: Yes. Current directorships of listed entities and dates of office: Director of Origin Energy Limited (since June 2007). Other principal directorships: World Education Australia Limited. Chairman of the Origin Foundation. Executive Chairman of Quick Service Restaurant Group Pty Limited. | | Other interests: Senior Advisor to each of McKinsey & Company and Greenhill Australia (formerly Greenhill Caliburn). Other Westpac related entities directorships and dates of office: Nil. Skills, experience and expertise: Gordon has extensive Australian and international experience as a senior executive, most recently as CEO of Lion Nathan Limited. Gordon has also held a wide range of senior management positions in marketing and finance with PepsiCo, Cadbury Schweppes and Nestlé (Spillers). | | Westpac Board Committee membership: Member of each of the Board Remuneration and Board Risk Management Committees. Directorships of other listed entities over the past three years and dates of office: Nil. |
| | |
| 2012 WESTPAC GROUP ANNUAL REPORT | 41 |

| | Name: Robert Elstone
BA (Hons.), MA (Econ.), MCom Age: 59 Term of office: Director since February 2012. Date of next scheduled
re-election: December 2012. Independent: Yes. Current directorships of listed entities and dates of office: Nil. Other principal directorships: Nil. Other interests: Adjunct Professor in the School of Business at the University of Sydney. | | Other Westpac related entities directorships and dates of office: Nil. Skills, experience and expertise: Robert has over 30 years experience in senior management roles spanning investment banking, corporate finance, wholesale financial markets and risk management. Most recently from 2006 to 2011, Robert was Managing Director and CEO of the Australian Securities Exchange, prior to which he was Managing Director and CEO of the Sydney Futures Exchange from 2000 to 2006 and, before that, Finance Director of Pioneer International from 1995 to 2000. | | Robert was a Non-executive Director of the National Australia Bank from 2004 to 2006, an inaugural member of the Board of Guardians of the Future Fund from 2006 and was Chairman of the Financial Sector Advisory Council to the Federal Treasurer between 2007 and 2009. Westpac Board Committee membership: Member of each of the Board Audit, Board Technology and Board Risk Management Committees. Directorships of other listed entities over the past three years and dates of office: ASX Limited (July 2006 to October 2011). |
| | | | | | |

| | Name: Peter Hawkins,
BCA (Hons.), SF Fin, FAIM, ACA (NZ), FAICD Age: 58 Term of office: Director since December 2008. Date of next scheduled
re-election: December 2013. Independent: Yes. Current directorships of listed entities and dates of office: Mirvac Limited Group (since January 2006). Other principal directorships: Liberty Financial Pty Limited, Treasury Corporation of Victoria, Murray Goulburn
Co-operative Company Limited and Clayton Utz. | | Other interests: Nil. Other Westpac related entities directorships and dates of office: Member of the Bank of Melbourne Advisory Board since November 2010. Skills, experience and expertise: Peter’s career in the banking and financial services industry spans over 41 years in Australia and overseas at both the highest levels of management and directorship of major organisations. Peter has held various senior management and directorship positions with Australia and New Zealand Banking Group Limited from 1971 to 2005, and was also a Director of BHP (NZ) Steel | | Limited from 1990 to 1991, ING Australia Limited from 2002 to 2005 and Esanda Finance Corporation from 2002 to 2005. Westpac Board Committee membership: Chairman of the Board Technology Committee. Member of each of the Board Audit, Board Nominations and Board Risk Management Committees. Directorships of other listed entities over the past three years and dates of office: Nil. |
| | | | | | |

| | Name: Ann Pickard
BA, MA Age: 57 Term of office: Director since December 2011. Date of next scheduled
re-election: December 2014. Independent: Yes. Current directorships of listed entities and dates of office: Nil. Other principal directorships: Shell Energy Holdings Australia Limited, Arrow Energy Holdings Pty Limited and the Energy & Minerals Institute, University of Western Australia. Other interests: Nil. | | Other Westpac related entities directorships and dates of office: Nil. Skills, experience and expertise: Ann has 25 years of international experience as a senior manager in large organisations, with responsibility for major corporate transformations, maximising return on assets in challenging environments, complex negotiations, large scale development projects and strategic planning. In March 2010, Ann became the Executive Vice President of Royal Dutch Shell’s upstream business in Australia. In August 2010, her role was expanded to Country Chair of Shell in Australia. | | Before her current role, Ann was Shell’s Regional Executive Vice President for Sub Sahara Africa, overseeing the company’s exploration and production, gas and LNG activities in the region. She has also held the position of Director - Global Businesses and Strategy and been a member of the Shell Gas & Power Executive Committee with responsibility for Global LNG, Power and Gas & Power Strategy. Westpac Board Committee membership: Member of each of the Board Risk Management and Board Remuneration Committees. Directorships of other listed entities over the past three years and dates of office: Nil. |
| | |
42 | 2012 WESTPAC GROUP ANNUAL REPORT | |

| | Name: Peter Wilson, CA Term of office: Director since October 2003. Age: 71 Date of next scheduled
re-election: Not applicable.
Peter Wilson will retire following the 2012 AGM. Independent: Yes. Current directorships of listed entities and dates of office: Chairman of New Zealand listed Augusta Capital Limited since October 2006 (formerly Kermadec Property Fund Limited). Other principal directorships:
P F Olsen Limited and Farmlands Trading Society Limited. Deputy Chairman of Meridian Energy Limited. | | Other interests: Member of the New Zealand Markets Disciplinary Tribunal and Chairman of the Special Division of that Tribunal. Other Westpac related entities directorships and dates of office: Director of Westpac New Zealand Limited (since September 2006, and Chairman since January 2008). Skills, experience and expertise: Peter is a chartered accountant and a former partner at Ernst & Young, with extensive experience in banking, business establishment, problem resolution, asset sale and management of change functions. Peter was a Director, and from 1991, Chairman of | | Trust Bank New Zealand Limited which Westpac acquired in 1996. Westpac Board Committee membership: Chairman of the Board Audit Committee. Member of each of the Board Risk Management and Board Nominations Committees. Directorships of other listed entities over the past three years and dates of office: The Colonial Motor Company Limited (July 1998 to November 2011), listed in New Zealand. |
| | | | | | |
Company Secretary
Our Company Secretaries as at 30 September 2012 were John Arthur and Tim Hartin.
John Arthur (LLB (Hons.)) was appointed Group Executive, Counsel & Secretariat and Company Secretary on 1 December 2008. On 24 November 2011, John was appointed Chief Operating Officer and continues to hold the position of Senior Company Secretary. Most recently prior to that appointment, John was Managing Director & Chief Executive of Investa Property Group until 2007. Previously, John has been a partner at Freehills and Group General Counsel of Lend Lease Limited. He also served as Chairman of legal firm Gilbert + Tobin and has had a distinguished career as legal partner, corporate executive and non-executive director.
Tim Hartin (LLB (Hons.)) was appointed Group Company Secretary on 9 November 2011. Prior to his appointment, Tim worked for a number of years as a transactional lawyer at Henderson Boyd Jackson W.S. in Scotland and in London in Herbert Smith’s corporate and corporate finance division. Tim joined Gilbert + Tobin as a Consultant in 2004, where he provided corporate advisory services to ASX listed companies. Tim joined Westpac in 2006 as Counsel, Corporate Core and most recently was the Head of Legal - Risk Management & Workouts, Counsel & Secretariat.
2. EXECUTIVE TEAM
As at 30 September 2012 our Executive Team was:
Name | | Position | | Year Joined
Group | | Year Appointed
to Position |
Gail Kelly | | Managing Director & Chief Executive Officer | | 2008 | | 2008 |
John Arthur | | Chief Operating Officer | | 2008 | | 2011 |
Peter Clare | | Chief Executive Officer, Westpac New Zealand Limited | | 2008 | | 2012 |
Philip Coffey | | Chief Financial Officer | | 1996 | | 2005 |
Brad Cooper | | Chief Executive Officer, BT Financial Group | | 2007 | | 2010 |
George Frazis | | Chief Executive Officer, St.George Banking Group | | 2009 | | 2012 |
Brian Hartzer | | Chief Executive, Australian Financial Services | | 2012 | | 2012 |
Christine Parker | | Group Executive, Human Resources & Corporate Affairs | | 2007 | | 2011 |
Greg Targett | | Chief Risk Officer | | 2008 | | 2009 |
Rob Whitfield | | Group Executive, Westpac Institutional Bank | | 1986 | | 2009 |
Jason Yetton | | Group Executive, Westpac Retail & Business Banking | | 1992 | | 2011 |
There are no family relationships between or among any of our Directors or Executive Team members.
| | |
| 2012 WESTPAC GROUP ANNUAL REPORT | 43 |

| | Gail Kelly HigherDipEd, BA, MBA with Distinction, HonDBus. Age 56
Managing Director & Chief Executive Officer Gail began her banking career in 1980, and by 2001 she had held various senior management roles in a broad range of areas including retail and commercial banking, strategy, marketing and human resources. Gail has spent the last ten years as Chief Executive Officer of two Australian banks, St.George Bank from 2002 to 2007 and Westpac from 1 February 2008 to date. Gail holds a Bachelor of Arts degree and Higher Diploma of Education from Cape Town University, an MBA with Distinction from the University of Witwatersrand, and an Honorary Doctorate of Business from Charles Sturt University. Gail is a non-executive director of the Business Council of Australia, the Australian Bankers’ Association and the Financial Markets Foundation for Children. She sits on the Global Board of Advisers at the US Council on Foreign Relations and is a member of the Sydney Cricket and Sports Ground Trust. Gail is also Care Australia’s Ambassador for Women’s Empowerment. |
| | |

| | John Arthur LLB (Hons.). Age 57
Chief Operating Officer John was appointed Chief Operating Officer on 24 November 2011 with responsibility for Group Services, which encompasses technology, banking operations, property, compliance, legal and secretariat services. He joined Westpac as Group Executive, Counsel & Secretariat on 1 December 2008. Before that appointment, John was Managing Director & CEO of Investa Property Group. Previously, John has been a partner at Freehills and Group General Counsel of Lend Lease Limited. He also served as Chairman of legal firm Gilbert + Tobin and has had a distinguished career as a legal partner, corporate executive and non-executive director. |
| | |

| | Peter Clare BCom, MBA. Age 49
Chief Executive Officer, Westpac New Zealand Limited Peter was appointed Chief Executive Officer, Westpac New Zealand Limited, in April 2012. Prior to this appointment, Peter held the role of Chief Operating Officer, Australian Financial Services from November 2011. Before that appointment, Peter held the role of Group Executive, Product & Operations from 17 July 2008. Peter joined Westpac as Group Executive, Consumer Financial Services in March 2008, with responsibility for sales, service, third-party consumer product relationships and product development for Westpac’s consumer customers across Australia. Prior to joining Westpac, Peter was Group Executive, Group Technology & Operations at St.George Bank Limited following five years as Group Executive, Strategy with St.George Bank Limited. Between 1997 and 2002, Peter worked for the Commonwealth Bank of Australia in a range of senior roles, covering strategy, merger programs, operations and performance improvement. He has also worked in management consultancy and accountancy roles. |
| | |

| | Philip Coffey BEc (Hons.). Age 55
Chief Financial Officer Philip was appointed Chief Financial Officer in December 2005, with responsibility for Westpac’s strategy, finance, tax, treasury and investor relations functions. He joined Westpac in 1996, and was appointed Group Executive, Westpac Institutional Bank in 2002. He has extensive experience in financial markets, funds management and finance, firstly with the Reserve Bank of Australia, then Citicorp and AIDC Limited. He has held roles in the UK and New Zealand. Philip has an honours degree in economics and has completed the Executive Program at Stanford University Business School. |
| | |

| | Brad Cooper DipBM, MBA. Age 50
Chief Executive Officer, BT Financial Group Brad was appointed Chief Executive Officer, BT Financial Group on 1 February 2010. Brad initially joined Westpac in April 2007 as Chief Executive, Westpac New Zealand Limited and after successfully leading a change program in that market, moved to the role of Group Chief Transformation Officer leading the Westpac Group’s St.George merger implementation. Prior to joining Westpac, Brad was Chairman of GE Capital Bank and CEO of GE Consumer Finance UK & Ireland. He drove GE’s UK Six Sigma program and was certified as a Quality Leader (Black Belt) in December 2002. He was promoted to CEO of GE Consumer Finance UK in January 2003 and appointed Chairman of GE Capital Bank in April 2004. |
| | |
44 | 2012 WESTPAC GROUP ANNUAL REPORT | |

| | George Frazis B Eng (Hons.), MBA (AGSM/Wharton). Age 48
Chief Executive Officer, St.George Banking Group George was appointed Chief Executive Officer, St.George Banking Group in April 2012. Prior to this appointment, George joined the Westpac Group in March 2009 as Chief Executive, Westpac New Zealand Limited. George is highly experienced in the financial services industry. He was formerly Group Executive General Manager at National Australia Bank. Prior to that, George was a senior executive in Commonwealth Bank of Australia’s Institutional Banking Division and has also been a partner with the Boston Consulting Group. |
| | |

| | Brian Hartzer Age 45
Chief Executive, Australian Financial Services Brian joined Westpac as Chief Executive, Australian Financial Services on 25 June 2012. Australian Financial Services comprises Westpac Retail & Business Banking, St.George Banking Group and BT Financial Group. Prior to joining Westpac, Brian spent three years in the UK as CEO for Retail, Wealth and Ulster Bank at the Royal Bank of Scotland Group. Prior to that, he spent ten years with ANZ in Australia in a variety of roles, including his final role as CEO, Australia and Global Segment Lead for Retail and Wealth. Before joining ANZ, Brian spent ten years as a financial services consultant in New York, San Francisco, and Melbourne. Brian graduated from Princeton University with a degree in European History and is a Chartered Financial Analyst. |
| | |

| | Christine Parker BGDipBus (HRM). Age 52
Group Executive, Human Resources & Corporate Affairs Christine was appointed Group Executive, Human Resources & Corporate Affairs on 1 October 2011, with responsibility for human resources strategy and management, including reward and recognition, safety, learning and development, careers and talent, employee relations and employment policy. She is also responsible for Corporate Affairs & Sustainability. Prior to this appointment, she was Group General Manager, Human Resources, from March 2010, with responsibilities across the entire Westpac Group. Prior to that, Christine was General Manager, Human Resources, Westpac New Zealand Limited, when she joined Westpac in 2007. Prior to joining Westpac, Christine was Group HR Director, Carter Holt Harvey, and from 1999 to 2004, she was Director of HR with Restaurant Brands New Zealand. |
| | |

| | Greg Targett BEc, DipEd, F Fin, CFTP. Age 55
Chief Risk Officer Greg was appointed Chief Risk Officer on 2 July 2009. Greg joined Westpac as Deputy Chief Risk Officer on 1 December 2008. Prior to the merger between Westpac and St.George Bank Limited, Greg was Chief Risk Officer of St.George Bank Limited and was a member of the St.George Bank Limited Executive Management Committee from 2006. He joined St.George Bank Limited in May 2003 from National Australia Bank where he held the role of General Manager, Wholesale and Business Banking Credit. During his 23 year career with National Australia Bank, Greg had a variety of senior roles in Australia and overseas in venture capital, planning and strategy, credit risk, corporate banking and retail banking. |
| | |

| | Rob Whitfield BCom, GradDipBanking, GradDipFin, AMP (Harvard). Age 48
Group Executive, Westpac Institutional Bank Rob was appointed Group Executive, Westpac Institutional Bank in July 2009. He has responsibility for Westpac’s global relationships with corporate, institutional and government clients, and core product offerings across financial and capital markets, transactional banking and working capital and payments. In addition, Rob has responsibility for Hastings Funds Management Limited and Westpac’s structured finance, global treasury, Asia and Pacific Island businesses. Rob joined Westpac as a graduate in 1986, where he gained broad financial markets experience. He joined Treasury in 1993 and was appointed Group Treasurer in 2000. In 2004, he became Chief Risk Officer and joined the Executive Team in December 2005. From April 2007, Rob undertook advisory work as a Group Executive for Westpac’s CEO with responsibility for the oversight of the merger with St.George Bank Limited. He was appointed Group Executive, Risk Management in November 2008 prior to assuming his current role. |
| | |

| | Jason Yetton BCom, GDAppFin, TGMP (Harvard). Age 42
Group Executive, Westpac Retail & Business Banking Jason was appointed Group Executive, Westpac Retail & Business Banking on 24 November 2011. Prior to this appointment, he was General Manager, Retail and Regional Banking, Westpac Retail & Business Banking from 2010. Before that, Jason was General Manager, Retail Banking from 2008. During 2008, he was a member of the Group’s 2017 strategy team. Prior to that role, Jason held a number of roles in BT Financial Group, including Head of Product, General Manager, Customer Solutions and CEO Commerce BT Unit Trust (based in Malaysia from 1997 to 1999). He joined BT as a graduate trainee in 1992. |
| | |
| 2012 WESTPAC GROUP ANNUAL REPORT | 45 |
3. REPORT ON THE BUSINESS
a) Principal activities
The principal activities of the Group during the financial year ended 30 September 2012 were the provision of financial services including lending, deposit taking, payments services, investment portfolio management and advice, superannuation and funds management, insurance services, leasing finance, general finance, foreign exchange and money market services.
There have been no significant changes in the nature of the principal activities of the Group during 2012.
b) Review of and results of operations and financial position
A review of the operations of the Group and its divisions and their results for the financial year ended 30 September 2012 is set out in Section 2 of the Annual Report under the sections ‘Review of Group operations’ and ‘Divisional performance’, which form part of this report.
Further information about our financial position and financial results is included in the financial statements in Section 3 of the Annual Report, which form part of this report.
The net profit attributable to equity holders of Westpac for the financial year ended 30 September 2012 was $5,970 million.
c) Dividends
Since 30 September 2012, Westpac has announced a final dividend of 84 cents per ordinary share, totalling approximately $2,588 million for the year ended 30 September 2012 (2011 final dividend of 80 cents per Westpac ordinary share, totalling $2,425 million). The final dividend will be fully franked and will be paid on 20 December 2012.
An interim dividend for the current financial year of 82 cents per ordinary share, totalling $2,506 million, was paid as a fully franked dividend on 4 July 2012 (2011 interim dividend of 76 cents per ordinary share, totalling $2,288 million).
d) Significant changes in state of affairs and events during and after the end of 2012 financial year
Significant changes in the state of affairs of the Group during 2012 were:
§ the commencement of Lindsay Maxsted as the Chairman of Westpac on 14 December 2011;
§ the implementation of a new organisational structure for the Westpac Group with the creation of two divisions – Australian Financial Services and Group Services;
§ a change to the operating model in New Zealand from 1 November 2011, which resulted in various business activities and associated employees being transferred from Westpac’s NZ branch to WNZL;
§ the change to Westpac’s long-term senior unsecured credit rating by Standard & Poor’s and long-term senior unsecured issuer default rating by Fitch to AA- from AA, along with the other major Australian banks;
§ the finalisation of all components of tax consolidation related to Westpac’s merger with St.George Bank Limited; and
§ ongoing regulatory changes and developments, which has included changes to liquidity, capital, derivatives, financial services, taxation and other regulatory requirements.
For a discussion of these matters, please refer to ‘Significant developments’ in Section 1 of the Annual Report under ‘Information on Westpac’.
In addition, the continued deterioration of the fiscal position of a number of countries has contributed to continuing market volatility and a negative global growth outlook. Europe is already in recession, US growth has moderated and China has also slowed. Any recovery remains uncertain with growth constrained by ongoing fiscal deficits and weak financial systems. Combined with ongoing tensions in the Middle East, this has created a level of uncertainty around the globe. To date, these events have had little direct impact on Westpac, given Westpac Group’s focus on Australia and New Zealand. However, slowing global growth has impacted consumer and business confidence in Australia and contributed to the decision of the Reserve Bank to further ease monetary policy. It is possible that Westpac Group may be impacted in the future if global growth and demand weakens further or if events in Europe see the failure of some of that region’s financial institutions. For a discussion of these matters and how Westpac may be impacted, please refer to ‘Risk factors’ in Section 2.
The Directors are not aware of any other matter or circumstance that has occurred since the end of the financial year that has significantly affected or may significantly affect the operations of the Group, the results of these operations or the state of affairs of the Group in subsequent financial years.
e) Business strategies, developments and expected results
Our business strategies, prospects and likely major developments in the Group’s operations in future financial years and the expected results of those operations are discussed in Section 1 of the Annual Report under ‘Information on Westpac’, including under ‘Significant developments’.
Further information on our business strategies and prospects for future financial years and likely developments in our operations and the expected results of operations have not been included in this report because the Directors believe it would be likely to result in unreasonable prejudice to us.
| | |
46 | 2012 WESTPAC GROUP ANNUAL REPORT | |
4. DIRECTORS’ INTERESTS
a) Directors’ interests in securities
The following particulars for each Director are set out in the Remuneration report in Section 9 of the Directors’ report and Note 41 of our consolidated financial statements for the year ended 30 September 2012 and in the tables below:
§ their relevant interests in our shares or the shares of any of our related bodies corporate;
§ their relevant interests in debentures of, or interests in, any registered managed investment scheme made available by us or any of our related bodies corporate;
§ their rights or options over shares in, debentures of, or interests in, any registered managed investment scheme made available by us or any of our related bodies corporate; and
§ any contracts:
– to which the Director is a party or under which they are entitled to a benefit; and
– that confer a right to call for or deliver shares in, debentures of, or interests in, any registered managed investment scheme made available by us or any of our related bodies corporate.
Directors’ interests in Westpac and related bodies corporate as at 5 November 2012
Number of relevant
interests in Westpac
Ordinary Shares | | Number of Westpac
Share Options | | Number of Westpac
Share Rights | | Westpac
SPS | | Westpac
SPS II | | Westpac
CPS | |
Westpac Banking Corporation | | | | | | | | | | | |
Current Directors | | | | | | | | | | | | | |
Lindsay Maxsted | | 16,039 | | - | | - | | - | | - | | - | |
Gail Kelly | | 1,839,971 | 1 | 400,043 | 2 | 627,029 | 3 | - | | - | | - | |
John Curtis | | 40,953 | | - | | - | | - | | - | | - | |
Elizabeth Bryan | | 23,737 | | - | | - | | - | | - | | - | |
Gordon Cairns | | 17,038 | | - | | - | | - | | - | | - | |
Robert Elstone | | 10,000 | | - | | - | | - | | - | | - | |
Peter Hawkins | | 15,218 | | - | | - | | 1,465 | | - | | 1,370 | |
Ann Pickard | | 9,800 | 4 | - | | - | | - | | - | | - | |
Peter Wilson | | 16,598 | | - | | - | | - | | - | | - | |
| | | | | | | | | | | | | |
Former Directors | | | | | | | | | | | | | |
Ted Evans | | 24,408 | 5 | - | | - | | - | | - | | - | |
Carolyn Hewson | | 16,348 | 6 | - | | - | | - | | - | | - | |
Graham Reaney | | 75,361 | 7 | - | | - | | - | | - | | - | |
1 Gail Kelly’s interest in Westpac ordinary shares includes 118,850 restricted shares held under the CEO Restricted Share Plan.
2 Options issued under the CEO Performance Plan.
3 Share rights issued under the CEO Performance Plan.
4 Ann Pickard’s relevant interests arise through holding 1,960 Westpac American Depository Shares (ADS). One ADS is comprised of five Westpac fully paid ordinary shares.
5 Figure displayed is as at Ted Evans’ retirement date of 14 December 2011.
6 Figure displayed is as at Carolyn Hewson’s retirement date of 30 June 2012. As at 30 June 2012, Carolyn Hewson also held relevant interests in 27,937 ordinary shares in BT Investment Management Limited.
7 Figure displayed is as at Graham Reaney’s retirement date of 14 December 2011.
| | |
| 2012 WESTPAC GROUP ANNUAL REPORT | 47 |
b) Other relevant interests as at 5 November 2012
Certain subsidiaries of Westpac offer a range of registered schemes. The Directors from time to time invest in these schemes and are required to provide a statement to the ASX when any of their interests in these schemes change (except interests in a number of cash management trusts) 1. Directors currently hold no relevant interests in any registered schemes of Westpac.
c) Indemnities and insurance
Under the Westpac Constitution, unless prohibited by statute, we must indemnify each of the Directors and Company Secretaries of Westpac and of each of our related bodies corporate (except related bodies corporate listed on a recognised stock exchange), each employee of Westpac or our subsidiaries (except subsidiaries listed on a recognised stock exchange), and each person acting as a responsible manager under an Australian Financial Services Licence of any of Westpac’s wholly-owned subsidiaries against every liability incurred by each such person in their capacity as director, company secretary, employee or responsible manager, as the case may be; and all legal costs incurred in defending or resisting (or otherwise in connection with) proceedings, whether civil or criminal or of an administrative or investigatory nature, in which the person becomes involved because of that capacity.
Each of the Directors named in this Directors’ report and each of the Company Secretaries of Westpac has the benefit of this indemnity.
Consistent with shareholder approval at the 2000 Annual General Meeting, Westpac has entered into a Deed of Access and Indemnity with each of the Directors, which includes indemnification in identical terms to that provided in the Westpac Constitution.
Westpac also executed a deed poll in September 2009 providing indemnification equivalent to that provided under the Westpac Constitution to individuals acting as:
§ statutory officers (other than as a director) of Westpac;
§ directors and other statutory officers of wholly-owned subsidiaries of Westpac; and
§ directors and statutory officers of other nominated companies as approved by Westpac in accordance with the terms of the deed poll and Westpac’s contractual indemnity policy.
Some employees of Westpac’s related bodies corporate and responsible managers of Westpac and its related bodies corporate are also currently covered by a deed poll that was executed in November 2004, which is in similar terms to the September 2009 deed poll.
The Westpac Constitution also permits us, to the extent permitted by law, to pay or agree to pay premiums for contracts insuring any person who is or has been a Director or Company Secretary of Westpac or any of its related bodies corporate against liability incurred by that person in that capacity, including a liability for legal costs, unless:
§ we are forbidden by statute to pay or agree to pay the premium; or
§ the contract would, if we paid the premium, be made void by statute.
Under the September 2009 deed poll, Westpac also agrees to provide directors’ and officers’ insurance to Directors of Westpac and Directors of Westpac’s wholly-owned subsidiaries.
For the year ended 30 September 2012, the Group has insurance cover in respect of the amounts which we may have to pay under the indemnities set out above. That cover is subject to the terms and conditions of the relevant insurance, including but not limited to the limit of indemnity provided by the insurance. The insurance policies prohibit disclosure of the premium payable and the nature of the liabilities covered.
d) Options and share rights outstanding
As at the date of this report there are 8,738,069 share options outstanding and 4,070,157 share rights outstanding in relation to Westpac ordinary shares. The expiry date of the share options range between 20 January 2013 and 1 December 2018 and the weighted average exercise price is $23.47. The latest dates for exercise of the share rights range between 20 January 2013 and 1 September 2022.
Holders of outstanding share options and share rights in relation to Westpac ordinary shares do not have any rights under the share options and share rights to participate in any share issue or interest of Westpac or any other body corporate.
e) Proceedings on behalf of Westpac
No person has applied to the Court under section 237 of the Corporations Act for leave to bring proceedings on behalf of Westpac, or to intervene in any proceedings to which Westpac is a party, for the purpose of taking responsibility on behalf of Westpac for all or part of those proceedings.
No proceedings have been brought or intervened in on behalf of Westpac with leave of the Court under section 237 of the Corporations Act.
1 | ASIC has exempted each Director from the obligation to notify the ASX of a relevant interest in a security that is an interest in BT Cash Management Trust (ARSN 087 531 539), BT Premium Cash Fund (ARSN 089 299 730), Westpac Cash Management Trust (ARSN 088 187 928), BT Institutional Managed Cash Fund (ARSN 088 832 491) or BT Institutional Enhanced Cash Fund (ARSN 088 863 469). | | |
| | |
48 | 2012 WESTPAC GROUP ANNUAL REPORT | |
5. ENVIRONMENTAL DISCLOSURE
The Westpac Group’s environmental framework starts with ‘Our Principles for Doing Business’, which outline our broad environmental principles. This framework includes:
§ our environmental policy statement ‘Westpac and the Environment: Our Environmental Policy’, which has been in place since 1992;
§ our Sustainable Supply Chain Management framework; and
§ public reporting of our environmental performance. We also participate in a number of voluntary initiatives including the Carbon Disclosure Project, the Equator Principles and the United Nations Global Compact CEO Water Mandate.
The Westpac Group is required to comply with the NSW Energy Administration Amendment (Water & Savings) Act 2005 (EAA). We comply with our obligations pursuant to the EAA as a designated energy user and a designated water user through an Energy Savings Action Plan for Westpac’s North Ryde site which was approved by the NSW Government on 14 February 2008. The final Annual Progress Report for the North Ryde site was submitted this year on 28 September 2012. We comply with our obligations under the EAA and the Energy Savings Action Plan.
The National Greenhouse and Energy Reporting Act 2007 (Cth) (National Greenhouse Act) came into effect in July 2008. The Group reports on greenhouse gas emissions, energy consumption and production under the National Greenhouse Act for the period 1 July through 30 June each year.
The Group is subject to the reporting requirements of the Energy Efficiency Opportunities Act 2006 (Cth) (EEO Act), which requires a report to be submitted to the Commonwealth Government and the public identifying and evaluating cost effective energy savings opportunities. The Group registered under the EEO Act on 24 March 2010. Our Assessment and Reporting Schedule was submitted on 22 December 2010. The second public report will be submitted to the Commonwealth Government by 31 December 2012. The public report is available on the Westpac website once it is submitted. We comply with our obligations under the EEO Act.
Our operations are not subject to any other particular and significant environmental regulation under any law of the Commonwealth of Australia or of any State or Territory of Australia. We may, however, become subject to environmental regulation as a result of our lending activities in the ordinary course of business and we have policies in place to ensure that this potential risk is addressed as part of our normal processes.
We have not incurred any liability (including for rectification costs) under any environmental legislation.
Further details on our environmental performance, including progress against our climate change strategy and details of our emissions profile are available on our website at www.westpac.com.au/aboutwestpac/sustainability-and-community.
6. ROUNDING OF AMOUNTS
Westpac is an entity to which ASIC Class Order 98/100 dated 10 July 1998, relating to the rounding of amounts in Directors’ report and financial reports, applies. Pursuant to this Class Order, amounts in this Directors’ report and the accompanying financial report have been rounded to the nearest million dollars, unless indicated to the contrary.
7. POLITICAL EXPENDITURE
In line with Westpac policy, no cash donations were made to political parties during the financial year ended 30 September 2012. The expenditure reflected in the table below relates to payment for participation in legitimate political activities where they were assessed to be of direct business benefit to Westpac. Such activities include business observer programs attached to annual party conferences, policy dialogue forums and other political functions such as speeches and events with industry participants.
Political expenditure, year ended 30 September 2012
Australia
| | Amount
$1 |
Australian Labor Party | | 87,232.50 |
Liberal Party of Australia | | 106,464.00 |
National Party of Australia | | 9,440.00 |
Total | | 203,136.50 |
1 Represents aggregate amount at both Federal and State/Territory levels.
New Zealand
There was no expenditure on political activities in New Zealand for the year ended 30 September 2012. In line with Westpac policy, no cash donations were made to political parties in New Zealand during the year.
| | |
| 2012 WESTPAC GROUP ANNUAL REPORT | 49 |
8. DIRECTORS’ MEETINGS
Each Director attended the following meetings of the Board and Committees of the Board during the financial year ended 30 September 2012:
| Notes | Board Meetings | | Board Audit
Committee | | Board Risk
Management
Committee | | Board
Nominations
Committee | | Board
Remuneration
Committee | | Board
Sustainability
Committee13 | | Board
Technology
Committee |
Number of meetings held during the year | | | | | | | | | | | | | | | | | | | | | |
Director | | A | B | | A | B | | A | B | | A | B | | A | B | | A | B | | A | B |
Lindsay Maxsted | 1 | 9 | 9 | | 4 | 4 | | 4 | 4 | | 4 | 4 | | | | | | | | | |
Gail Kelly | 2 | 9 | 9 | | | | | | | | | | | | | | 2 | 2 | | 3 | 3 |
John Curtis | 3 | 9 | 9 | | 2 | 2 | | 4 | 4 | | 4 | 3 | | 5 | 5 | | | | | | |
Robert Elstone | 4 | 6 | 6 | | 2 | 2 | | 2 | 2 | | | | | | | | | | | 1 | 1 |
Ted Evans | 5 | 3 | 3 | | 1 | 1 | | 1 | 1 | | 1 | 1 | | | | | | | | 1 | 1 |
Elizabeth Bryan | 6 | 9 | 9 | | 2 | 2 | | 4 | 4 | | 4 | 4 | | 5 | 5 | | | | | 3 | 3 |
Gordon Cairns | 7 | 9 | 9 | | 2 | 2 | | 4 | 4 | | | | | 5 | 5 | | | | | | |
Peter Hawkins | 8 | 9 | 8 | | 4 | 4 | | 4 | 4 | | 4 | 4 | | | | | | | | 3 | 3 |
Carolyn Hewson | 9 | 7 | 7 | | 2 | 2 | | 3 | 3 | | 3 | 3 | | 4 | 4 | | | | | | |
Ann Pickard | 10 | 7 | 7 | | | | | 2 | 2 | | | | | 2 | 2 | | | | | | |
Graham Reaney | 11 | 3 | 3 | | 1 | 1 | | 1 | 1 | | | | | | | | 1 | 1 | | | |
Peter Wilson | 12 | 9 | 9 | | 4 | 4 | | 4 | 4 | | 4 | 4 | | | | | 2 | 2 | | | |
This table shows membership of standing committees of the Board. From time to time the Board may form other Committees or request Directors to undertake specific extra duties.
A - Meetings eligible to attend as a member | B - Meetings attended as a member |
Unless otherwise stated, each Director has been a member, or the Chairman, of the relevant Committee for the whole of the period from 1 October 2011.
1 Lindsay Maxsted was appointed as Chairman of the Board on 14 December 2011. Chairman of the Board Nominations Committee from 1 July 2012. Member of the Board Nominations Committee until 30 June 2012. Chairman of the Board Audit Committee until 13 December 2011 and Member from 14 December 2011. Member of the Board Risk Management Committee.
2 Member of the Board Technology Committee and member of the Board Sustainability Committee up to its dissolution on 6 March 2012.
3 Chairman of the Board Remuneration Committee. Member of the Board Risk Management Committee and the Board Nominations Committee. Member of the Board Audit Committee until 6 March 2012.
4 Robert Elstone was appointed as a Director on 1 February 2012. Member of the Board Risk Management Committee, the Board Audit Committee and the Board Technology Committee from 6 March 2012.
5 Ted Evans retired as Chairman and Director of the Board and its Committees on 14 December 2011.
6 Chairman of the Board Risk Management Committee. Member of the Board Nominations Committee, the Board Remuneration Committee and the Board Technology Committee. Member of the Board Audit Committee until 6 March 2012.
7 Member of the Board Risk Management Committee and the Board Remuneration Committee. Member of the Board Audit Committee until 6 March 2012.
8 Chairman of the Board Technology Committee. Member of the Board Audit Committee, the Board Risk Management Committee and the Board Nominations Committee.
9 Member of the Board Audit Committee until 6 March 2012. Carolyn Hewson retired from the Board and its Committees on 30 June 2012.
10 Ann Pickard was appointed as a Director on 1 December 2011. Member of the Board Risk Management Committee and the Board Remuneration Committee from 6 March 2012.
11 Graham Reaney retired from the Board and its Committees on 14 December 2011.
12 Chairman of the Board Audit Committee from 14 December 2011. Member of the Board Audit Committee until 13 December 2011. Member of the Board Risk Management Committee and the Board Nominations Committee. Chairman of the Board Sustainability Committee up to its dissolution on 6 March 2012.
13 On 6 March 2012, the Board re-assumed responsibility for the oversight and monitoring of sustainability and dissolved the Board Sustainability Committee.
All Directors receive the papers for all meetings of the Board and for Board Committee meetings of which they are a member. The above table only sets out attendance by members of the relevant Board Committees.
| | |
50 | 2012 WESTPAC GROUP ANNUAL REPORT | |
9. REMUNERATION REPORT
Introduction from the Chairman of the Board Remuneration Committee
Dear Shareholder,
We are pleased to present Westpac’s 2012 Remuneration Report (Report).
Over the past twelve months, the Board has continued to refine our remuneration practices and policies following the substantive changes made last year. We continue to be mindful of the changing external market with regard to executive remuneration and of shareholder expectations that Westpac’s approach to managing executive remuneration reflects today’s world. It is in this context that the Board reviewed our executive reward policy during the year and made further changes to components of our executive reward framework.
Our philosophy
We believe that Executive Reward is designed to:
§ motivate executives to strong performance against short and long-term performance measures;
§ appropriately manage risk;
§ link pay to shareholder interests; and
§ attract and retain high performing executives.
Our framework
We made two important changes to components of the framework to apply for the 2012 performance year:
1. We have established a policy to align the target pay mix for the CEO and Senior Executives, that is, the percentage in fixed remuneration, short-term incentive (STI) and long-term incentive (LTI). Under the new policy, 34% will be equally allocated to fixed remuneration and STI, and 32% to LTI. This approach increases the weighting of LTI and reduces the emphasis on STI. The new policy will apply to existing Senior Executives over time with annual remuneration adjustments directed to the LTI target until the desired pay mix is achieved.
2. We have reduced the maximum opportunity available under the STI plan from 200% to 150% of target.
The realignment of the STI and LTI opportunities and the reduction of the STI plan maximum will rebalance executive reward going forward and provide an even stronger alignment with the long-term interests of shareholders.
Executive pay
We did not increase the fixed remuneration or incentive targets in 2012 for the CEO or Senior Executives, except where there was a change in role or a significant market anomaly. In these cases, the majority of the increase was allocated to the LTI target and so value is delivered only if future performance hurdles are achieved.
We have done the same for 2013 and we will not be increasing the remuneration of the CEO, Senior Executives or the majority of General Managers across the Group. We have made this decision acknowledging the continued challenges of delivering sustainable performance in a low growth environment across our industry. We are confident that the existing ‘at risk’ incentive arrangements allow us to recognise and reward high performance across our business.
Risk and governance
In 2012, we maintained our active engagement with regulators, contributing to the consultation process and industry forums.
The Board is confident that Westpac’s remuneration framework positions us well to respond to the evolving legislative and regulatory environment.
In preparing this Report, we have aimed to further improve the clarity of presentation of our remuneration policies, practices and outcomes. We have included a section ‘Linking Reward and Performance’ where we outline the performance highlights for the year and the resulting remuneration outcomes for the CEO and Senior Executives. For ease of review, we have included all statutory remuneration disclosures in one section of the Report.
Finally, as a Board, we believe our role is to balance the competing priorities of managing against a changing external remuneration environment whilst still attracting and retaining high calibre executives to ensure Westpac’s ongoing success. We are confident that our current policies, framework and outcomes presented in this Report are appropriate in that context.
As ever, we welcome your feedback as we strive to make the Report simpler and easier to understand.

John Curtis
Chairman – Board Remuneration Committee
| | |
| 2012 WESTPAC GROUP ANNUAL REPORT | 51 |
1. Remuneration snapshot
This section provides an overview of the Group’s remuneration arrangements during the 2012 financial year.
1.1. Remuneration strategy, principles and framework
Executive remuneration framework
The CEO and Senior Executives (Group Executives and members of Westpac’s Executive Team) are remunerated based on a Total Reward framework which is designed to:
§ motivate executives to strong performance against short and long-term performance measures;
§ appropriately manage risk;
§ link pay to shareholder interests; and
§ attract and retain high performing executives.
The Total Reward framework has three components and, in aggregate, is benchmarked against relative financial services competitors.
Fixed remuneration – takes into account the size and complexity of the role, individual responsibilities, experience, skills and disclosed market-related pay levels within the financial services industry. Fixed remuneration includes cash salary, salary sacrifice items and employer superannuation contributions.
Short-term incentive (STI) – comprises cash and deferred shares. The level of payment is determined based on an STI target set using similar principles to those used for fixed remuneration, and on individual, divisional and Group performance objectives for the year. Performance is measured against risk-adjusted financial targets and non-financial targets that support the Group’s short and long-term strategy.
Long-term incentive (LTI) – is comprised of performance share rights, which vest over a three year period if performance hurdles are achieved. The amount of the award takes into account market benchmarks, individual performance over time, succession potential and key skills.
Executive remuneration framework changes in 2012
While our remuneration strategy and principles remain unchanged, the Board approved two key changes to our executive remuneration framework in May this year, both of which were implemented for the 2012 performance year. The Board were informed by market benchmarking reports provided by Guerdon Associates in making their decision regarding the changes.
a) Target pay mix – CEO and Senior Executives
A revised pay mix policy was approved to apply to all new appointments at the CEO or Senior Executive level. Under the new policy, 34% of a Senior Executive’s Target Total Reward will be equally allocated to fixed remuneration and STI. The remaining 32% of the Target Total Reward will be allocated to LTI. The changes will deliver a greater proportion of Total Reward as LTI (which is subject to 3 year performance hurdles) and result in a greater proportion of Total Reward being deferred over a longer period. The revised pay mix will be achieved over time for existing Senior Executives, with annual remuneration adjustments directed towards LTI until the desired pay mix is achieved. We believe the approach provides a stronger alignment with the long-term interests of shareholders.
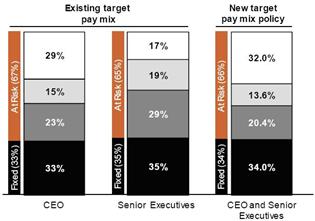

| LTI – Performance share rights |

| Deferred STI – Restricted shares |

| Cash STI |

| Fixed remuneration |
b) STI – CEO and Senior Executives
The STI scheme was reviewed with two changes approved by the Board:
§ in light of shareholder sentiment regarding Executive pay levels, the maximum STI opportunity was reduced from 200% of target to 150% of target; and
§ as a result of the increased weighting of LTI, which has a 3 year vesting profile, the vesting profile for deferred STI has been adjusted to 2 years (previously 3 years). This change brings Westpac in line with current practice amongst the major Australian banks.
| | |
52 | 2012 WESTPAC GROUP ANNUAL REPORT | |
1.2. Remuneration for all other employees
The remuneration strategy for all other employees remains aligned with our approach for Senior Executives. In particular:
§ fixed remuneration is aligned to the market and is reviewed annually;
§ we provide superannuation for employees in Australia, New Zealand and some other countries in which we operate;
§ employees have the opportunity to participate in an STI scheme designed to support the objectives of their division and the Group, including risk management. In some cases a portion is deferred;
§ key employees may also receive an LTI award in the form of deferred shares; and
§ eligible employees may receive an annual award of Westpac ordinary shares up to the value of $1,000 under the Employee Share Plan provided the Group meets at least one of two hurdles: an increase in share price or in customer advocacy. The CEO, Senior Executives and any employees who received an STI award deferred into equity or an LTI award during the year are not eligible to receive an Employee Share Plan award for that year.
1.3. Key management personnel remuneration disclosed in this Report
The remuneration of key management personnel (KMP) for the Westpac Group is disclosed in this Report. In 2012, KMP included Non-executive Directors, the CEO and Senior Executives who report to the CEO and/or lead significant parts of the business.
CEO and Senior Executives
Movements in the Senior Executive team during the year have resulted in changes to our KMP:
§ Rob Chapman ceased to be a KMP upon vacating the role of Chief Executive Officer, St.George Banking Group on 31 March 2012. Although currently remaining an employee of the Group it is expected that Rob will cease employment with Westpac in March 2013 resulting in payments comprising outplacement and statutory entitlements such as annual and long service leave. STI and LTI awards will be treated in accordance with his contract provisions;
§ Rob Coombe vacated the role of Group Executive, Westpac Retail & Business Banking effective 23 November 2011;
§ Brian Hartzer was appointed to the role of Chief Executive, Australian Financial Services effective 25 June 2012; and
§ Jason Yetton was appointed to the role of Group Executive, Westpac Retail & Business Banking effective 24 November 2011.
Name | | Position | | Term as KMP |
| | | | |
Gail Kelly | | Managing Director & Chief Executive Officer | | Full Year |
Senior Executives | | | | |
John Arthur1 | | Chief Operating Officer | | Full Year |
Peter Clare2 | | Chief Executive Officer, Westpac New Zealand Limited | | Full Year |
Philip Coffey | | Chief Financial Officer | | Full Year |
Brad Cooper | | Chief Executive Officer, BT Financial Group | | Full Year |
George Frazis3 | | Chief Executive Officer, St.George Banking Group | | Full Year |
Peter Hanlon4 | | Chief Executive, Australian Financial Services | | Full Year |
Brian Hartzer | | Chief Executive, Australian Financial Services | | Part Year |
Christine Parker | | Group Executive, Human Resources & Corporate Affairs | | Full Year |
Greg Targett | | Chief Risk Officer | | Full Year |
Rob Whitfield | | Group Executive, Westpac Institutional Bank | | Full Year |
Jason Yetton | | Group Executive, Westpac Retail & Business Banking | | Part Year |
Former Senior Executives | | |
Rob Chapman | | Chief Executive Officer, St.George Banking Group | | Part Year |
Rob Coombe | | Group Executive, Westpac Retail & Business Banking | | Part Year |
| | | | |
1 John Arthur was the Group Executive, Counsel & Secretariat prior to his appointment to the new role of Chief Operating Officer on 24 November 2011.
2 Peter Clare was the Group Executive, Product and Operations until his appointment as the Chief Operating Officer, Australian Financial Services on 24 November 2011. He was subsequently appointed to the role of Chief Executive Officer, Westpac New Zealand Limited on 1 April 2012.
3 George Frazis was the Chief Executive Officer, Westpac New Zealand Limited prior to his appointment to the role of Chief Executive Officer St.George Banking Group on 1 April 2012.
4 Peter Hanlon has been disclosed for the full year given his contribution in key roles during the period.
| | |
| 2012 WESTPAC GROUP ANNUAL REPORT | 53 |
Non-executive Directors
Name | | Position | | Term as KMP |
| | | | |
Lindsay Maxsted | | Chairman | | Full Year |
Ted Evans1 | | Former Chairman | | Part Year |
John Curtis | | Deputy Chairman | | Full Year |
Elizabeth Bryan | | Director | | Full Year |
Gordon Cairns | | Director | | Full Year |
Robert Elstone2 | | Director | | Part Year |
Peter Hawkins | | Director | | Full Year |
Carolyn Hewson3 | | Director | | Part Year |
Ann Pickard4 | | Director | | Part Year |
Graham Reaney5 | | Director | | Part Year |
Peter Wilson | | Director | | Full Year |
| | | | |
1 Retired 14 December 2011.
2 Appointed 1 February 2012.
3 Retired 30 June 2012.
4 Appointed 1 December 2011.
5 Retired 14 December 2011.
2. Governance and risk management
This section details the Group’s approach to governance and risk management as they relate to remuneration.
2.1. Governance
The Group’s remuneration policies and practices strive to fairly and responsibly reward employees, having regard to performance, Westpac’s risk management framework, the law and high standards of governance.
The role of the Board is to provide strategic guidance for the Group and effective oversight of management. In this way the Board is accountable to shareholders for performance. As part of this role, the Board has overall responsibility for remuneration.
The Remuneration Committee supports the Board. Its primary function is to assist the Board in fulfilling its responsibilities to shareholders with regard to remuneration. The Remuneration Committee monitors the Group’s remuneration policies and practices, external remuneration practices, market expectations and regulatory requirements in Australia and internationally. The Committee’s purpose, responsibilities and duties are outlined in the Charter which is available on the Group’s website.
All Board Committee Charters are reviewed every two years. The Board Remuneration Committee Charter was reviewed and amended in May 2012.
Members of the Remuneration Committee during 2012
All members of the Remuneration Committee are independent Non-executive Directors. During 2012 the members were:
§ John Curtis (Chairman);
§ Elizabeth Bryan;
§ Gordon Cairns;
§ Ann Pickard (Member from 6 March 2012); and
§ Carolyn Hewson (Member until 30 June 2012).
Independent remuneration consultant
During 2012, the Board retained Guerdon Associates as its independent consultant to provide specialist information on executive remuneration and other Group remuneration matters. These services are provided directly to the Remuneration Committee and are independent of management. The Chairman of the Remuneration Committee oversees the engagement of, remuneration arrangements for, and payment of, the independent consultant.
Work undertaken by Guerdon Associates during 2012 included the provision of information relating to the benchmarking of CEO and Senior Executive remuneration; the structure of remuneration (specifically pay mix and our STI scheme) and market practices; and analysis regarding our Earnings per Share (EPS) based LTI hurdle. No remuneration recommendations as prescribed under the Corporations Act were made by Guerdon Associates in 2012.
Other internal governance structures
The Westpac internal governance structure includes three levels of Remuneration Oversight Committees (ROCs) which focus on the appropriateness and consistency of remuneration arrangements and outcomes within individual functions, divisions and across the Group. The ROCs support the Board Remuneration Committee by ensuring that the Group-wide remuneration frameworks and outcomes are consistent with the Board’s approved policy.
2.2. Risk management
The Group’s remuneration strategy, executive remuneration framework, policies and practices all reflect the sound risk management that is fundamental to the way we operate. The performance of each division within the Group is reviewed and measured with reference to how risk is managed and the results influence remuneration outcomes.
The executive remuneration framework specifically includes features to take account of risk. The framework is composed of a mix of fixed pay and variable reward, a portion of which is deferred. The CEO and Senior Executives receive deferred compensation in two forms: deferred shares as part of the STI; and an LTI award of performance share rights, which deliver value if the Group meets or exceeds predetermined performance hurdles. These help to align the interests of the CEO and Senior Executives with those of shareholders.
| | |
54 | 2012 WESTPAC GROUP ANNUAL REPORT | |
Each year the Board determines the size of the variable reward pool. This is based on an assessment of how profit should be shared among shareholders, employees and retained for ongoing capital requirements. The primary financial indicator used is economic profit, which measures profitability adjusted for risk in the business. Cash earnings, cash earnings per share and dividends are also taken into account.
STI outcomes are based on both financial and non-financial measures, with the latter reflecting risk management outcomes and the Group’s progress on the implementation of our strategy. Economic profit accounted for 40% of the CEO’s and Senior Executives’ scoreboards for 2012. A performance measure related to the Board’s Risk Appetite Statement accounted for a further 10% of the CEO’s and Senior Executives’ scoreboards. In addition, the CEO and each Senior Executive is assessed on specific risk measures that may influence any discretionary adjustment to the scoreboard. Ultimately, the Board has 100% discretion with the STI outcome. We believe this discretion is vital to balance a mechanistic approach in determining performance and reward outcomes and to enable previous decisions (either good or bad) to be taken into account. This discretion may be exercised both up and down.
Shareholding requirements and hedging policy
To further align their interests with shareholders, the CEO and Senior Executives are expected to build and maintain a substantial Westpac shareholding within five years of being appointed to their role. For the CEO the value of that shareholding is expected to be no less than five times her annual fixed package. For Senior Executives, the expected minimum is $1.2 million.
Participants in the Group’s equity plans are forbidden from entering either directly or indirectly into hedging arrangements for unvested shares in their STI and LTI equity awards. No financial products of any kind may be used to mitigate the risk associated with these equity instruments. Any attempt to hedge these securities makes them subject to forfeiture. These restrictions have been in place for some time and satisfy the requirements of the Corporations Act which prohibit hedging of unvested shares.
Approval of remuneration decisions
We aim to integrate effective risk management into the remuneration framework throughout the organisation. The Chairman of the Board Risk Management Committee is a member of the Remuneration Committee, and members of the Remuneration Committee are also members of the Board Risk Management Committee. In carrying out its duties, the Remuneration Committee can access personnel from risk and financial control, and engages external advisors who are independent of management.
We follow a strict process of ‘two-up’ approval for all remuneration decisions. This means that remuneration is approved by the next most senior person above the employee’s manager. This concept is also reflected in our requirement for the Board, based on recommendations from the Remuneration Committee, to approve:
§ performance outcomes and remuneration for the CEO and Senior Executives; and
§ performance outcomes and remuneration for other executives who report directly to the CEO, other persons whose activities in the Board’s opinion affect the financial soundness of the Group and any other person specified by APRA.
Performance and remuneration outcomes for all General Managers (who report to Senior Executives) are approved by the CEO, on the recommendation of the Senior Executive to whom they report.
Any significant remuneration arrangements that fall outside the Group Remuneration Policy are referred to the Remuneration Committee for review and approval.
3. Executive remuneration
3.1. Remuneration structure and policy
a) Fixed remuneration
Fixed remuneration comprises cash salary, salary sacrifice items and employer superannuation.
The Group provides superannuation contributions of 9% of fixed package in line with statutory obligations. During 2012, one Senior Executive remained a member of the legacy defined benefit superannuation fund (which is closed to new members).
Fixed remuneration is reviewed annually and is effective from 1 January each year taking into consideration:
§ roles and accountabilities;
§ relative market benchmarks within the financial services industry; and
§ the attraction, retention and motivation of key executives given increasing competition for talent in a challenging environment.
There were no increases to fixed remuneration for the CEO or Senior Executives following the last annual remuneration review with the exception of three Senior Executives where there was a material change in role or a significant market anomaly:
§ John Arthur – appointed to a new role as Chief Operating Officer effective 24 November 2011;
§ Philip Coffey – where the role of Chief Financial Officer was expanded to include accountability for Group Strategy; and
§ Greg Targett – market adjustment.
| | |
| 2012 WESTPAC GROUP ANNUAL REPORT | 55 |
b) STI
STI provides the opportunity for participants to earn cash and deferred equity incentives where specific outcomes have been achieved in the financial year. The CEO and Senior Executives each have a balanced scoreboard, which is reviewed and approved by the Board. The balanced scoreboard combines both annual financial and non-financial objectives supporting the Group’s strategic short and long-term goals.
STI targets
The CEO’s target STI opportunity for 2012 was $3.6 million.
STI targets for Senior Executives are set by the Remuneration Committee and approved by the Board at the beginning of each performance year based on a number of factors including market competitiveness and the nature of the role. The STI targets for the 2012 performance year did not increase for the CEO and Senior Executives whose fixed remuneration remained unchanged in 2012. The STI awards for Senior Executives are managed within the Group-wide variable reward pool.
In 2012, the Board reduced the maximum STI opportunity available for the CEO and Senior Executives to 150% of target.
STI outcomes are subject to both a quantitative and qualitative assessment, including a risk management overlay, which is embedded in our scoreboard measurement process. The Board has the capacity to adjust STI outcomes (and reduce STI outcomes to zero if appropriate) during the assessment process.
STI structure
The 2012 STI outcome for the CEO and Senior Executives will be paid as cash (60%) in November 2012 and the remainder (40%) deferred in the form of Westpac ordinary shares or rights to ordinary shares, which will vest in two equal tranches in October 2013 and October 2014 (unless forfeited on cessation of employment).
The table below details the type of equity and the instrument used to grant the 2012 deferred STI allocated to executives.
Executive | | Deferred STI – Type of Equity1 | | Deferred STI – Equity Plan |
| | | | |
CEO | | Westpac ordinary shares | | CEO Restricted Share Plan |
Senior Executives – in Australia | | Westpac ordinary shares | | Restricted Share Plan |
Senior Executives – outside Australia | | Rights to ordinary shares, which entitle the holder to Westpac ordinary shares at the time of vesting | | Westpac Performance Plan |
| | | | |
1 Shares granted under the CEO Restricted Share Plan and the Restricted Share Plan rank equally with Westpac ordinary shares for dividends and voting rights from the date they are granted. The Board has the discretion to satisfy vested grants and the allocation of subsequent shares to participants, or the allocation of restricted shares under the deferred STI, by either the issue of new shares or on-market purchase of shares.
By deferring a portion of the STI in the form of restricted equity, incentive payments are better aligned with the interests of shareholders as the ultimate value of the deferred portion is tied to movement in share price over the restriction period. Deferred STI also supports our objective of retaining key talent, as it is generally forfeited if the holder resigns during the restriction period. Deferred shares are forfeited if the Executive is dismissed for cause. The deferred STI awards recognise past performance and are not subject to further performance conditions. The shares are subject to forfeiture at Board discretion, in the event of a material risk or financial mis-statement issues. The shares attract dividend distributions over the vesting period. Details of deferred STI allocations granted in prior years, which have been exercised during the year ended 30 September 2012, are included in Section 5.3 of this Report.
c) LTI
The CEO and Senior Executives are also eligible for an LTI award.
LTI award opportunities
The CEO was granted an LTI award of $2.7 million for 2012 under the CEO Performance Plan, unchanged from 2011.
The award was received in the form of share rights under arrangements approved by shareholders at the 2010 Annual General Meeting.
Senior Executives receive annual LTI awards in the form of share rights under the Westpac Reward Plan. A share right is not a Westpac Share and does not attract the payment of dividends.
At the beginning of each year, the Board, advised by the Remuneration Committee, sets the dollar value of the LTI award target for each Senior Executive. With the exception of the three Senior Executives who received fixed remuneration adjustments for 2012 (refer Section 3.1 a), the LTI targets for Senior Executives remained unchanged from 2011.
The actual LTI award granted to each Senior Executive is determined at the Board’s discretion taking into account matters that include market benchmarks, individual performance over time, succession potential and key skills.
| | |
56 | 2012 WESTPAC GROUP ANNUAL REPORT | |
LTI structure
The following table sets out the key features of LTI awards made in December 2011 to the CEO under the CEO Performance Plan and to Senior Executives under the Westpac Reward Plan.
| | CEO Performance Plan and Westpac Reward Plan |
Instrument | | Share rights – the Board has the discretion to satisfy vested grants and the allocation of subsequent shares to participants by either the issue of new shares or on-market purchase of shares. |
Determining the number of securities | | The number of share rights each individual receives is determined by dividing the dollar value of the LTI award by the value of the share rights at the beginning of the performance assessment period (performance period). The value of share rights is determined using a Binomial/Monte Carlo simulation pricing model, which uses assumptions based on expected life, volatility, risk free interest rate and dividend yield associated with the securities and the risk of forfeiture attributed to each performance hurdle. The Binomial/Monte Carlo simulation pricing model discounts the market price of Westpac shares at grant to take into consideration these assumptions. The value of a share right may differ depending on the performance hurdle applied. The value of share rights to be allocated is calculated by an independent valuer. |
Performance hurdles | | The CEO and Senior Executives receive value from their LTI awards where the performance hurdles are achieved. The two hurdles for the 2012 grants are Westpac’s relative Total Shareholder Return (TSR) and Compound Annual Growth in Cash EPS (Cash EPS CAGR). Relative TSR provides an external comparative measure of overall returns over a specified timeframe incorporating share price movements and assuming that dividends over the period have been reinvested. The TSR data is averaged over the three months preceding the measurement date. The Cash EPS CAGR over a three year period was introduced as an internal earnings measure for grants made from October 2011 in response to feedback from investors and a subsequent independent review of our LTI performance hurdles. Cash EPS CAGR provides a measure of Westpac’s underlying financial growth. The measure was implemented given its strong alignment with shareholder interests and is consistent with the adoption of a non market hurdle by a number of ASX top 50 companies. Together, the use of these two hurdles is intended to provide a balanced view of the Group’s overall performance. Both hurdles operate independently and are subject to a single assessment at the completion of the three year performance period (1 October 2011–30 September 2014). There is no subsequent re-testing. |
| | |
| | TSR
(50% of the allocation) | | | Cash EPS CAGR
(50% of the allocation) |
| | Westpac’s TSR percentile ranking must equal or exceed the 50th percentile of a defined group of comparator companies (the ‘ranking group’) over the performance period. The ranking group is comprised of the top 10 selected Australian banking and financial sector companies listed on the ASX with which Westpac competes for customers. This measure provides a link with the creation of value for shareholders over the long-term (up to three years). The companies in the 2012 ranking groups for the CEO Performance Plan and the Westpac Reward Plan are: ¾ AMP Limited; ¾ ASX Limited; ¾ Australia and New Zealand Banking Group Limited; ¾ Bendigo and Adelaide Bank Limited; ¾ Commonwealth Bank of Australia; ¾ Insurance Australia Group Limited; ¾ Lend Lease Group; ¾ Macquarie Group Limited; ¾ National Australia Bank Limited; and ¾ Suncorp Group Limited. | | | The Cash EPS CAGR measure focuses on growth in cash earnings over a three year performance period. A description of the process used to determine cash earnings is provided at Note 32 to the financial statements. |
| | |
| 2012 WESTPAC GROUP ANNUAL REPORT | 57 |
| | CEO Performance Plan and Westpac Reward Plan |
Vesting framework focuses on longer-term performance | | The TSR component of the allocation will be measured at 30 September 2014 and will vest as follows: | | | The Cash EPS CAGR measure provides for a vesting scale where: ¾ below the threshold target – 0% will vest; ¾ at threshold target – 50% will vest; and ¾ at maximum target – 100% will vest. There is a pro-rata vesting scale for performance between threshold and maximum targets. Westpac has a policy of not providing guidance to the market. Accordingly, the Board decided that specific EPS targets and the Group’s performance against target will only be advised following the test date in 2014. The EPS targets were developed with the assistance of an independent external adviser who was provided access to Westpac’s long-term business plan and analyst forecasts in regard to the long-term performance of Westpac and its peers. |
Westpac’s Relative TSR Ranking | TSR Allocation
to Vest (%) | | |
| | Below the 50th percentile | 0 | | |
| | At the 50th percentile | 50 | | |
| | At the 60th percentile | 70 | | |
| | At the 70th percentile | 90 | | |
| | At or above the 75th percentile | 100 | | |
| | | | |
| | | | |
Targets are set for stretch performance | | The Board considers the above vesting profile as being appropriate as 100% vesting will only occur where Westpac is ranked 3rd out of the total of 11 companies (including Westpac). The TSR performance will be measured once at the completion of the performance period i.e., 30 September 2014. Any unvested share rights will lapse and there will be no further re-testing. Westpac shares will be allocated in satisfaction of vested share rights at no cost to participants. | | | The target for the December 2011 grant was determined by the Board. It is the Board’s view that the EPS targets are stretching and the threshold will be difficult to achieve in the current economic environment. The expensed value of the December 2011 grant in Table 5.2 has been discounted by 50% to reflect the Board’s current assessment of the probability of the EPS hurdle being met and share rights vesting over time. |
Who measures the performance hurdle outcomes? | | To ensure objectivity and external validation, TSR results are calculated by an independent external consultant and are provided to the Board or its delegate to review and determine vesting outcomes. | | | The Cash EPS CAGR will be determined by the Board based on the Cash EPS disclosed in our reported results for the 2014 financial year in respect of the December 2011 awards. |
Early vesting is possible in limited cases | | For awards made since 1 October 2009, unvested securities may vest before a test date if the employee is no longer employed by the Group due to retirement, death or disability. In general, any such vesting is not subject to performance hurdles being met. For the CEO, all unvested securities will vest if the CEO leaves the Group due to sickness or in certain circumstances within 12 months of a change of control. |
Retesting | | There is no re-testing on awards made since 2011. Any securities remaining unvested after the nominated measurement period lapse immediately. |
Lapsing of securities | | Where the CEO or Senior Executive leaves the Group due to resignation or dismissal for cause before vesting occurs, securities will lapse unless the Board determines otherwise. Unexercised performance share rights (whether vested or unvested) will lapse, unless the Board determines otherwise, where the holder acts fraudulently or dishonestly or is in material breach of his or her obligations under the CEO Performance Plan and the Westpac Reward Plan or to the Group. |
Other plans and awards
We provide separate reward plans for small, specialised parts of the business. Payments under these plans are directly linked to growth of that part of the business and are capped at an appropriate proportion of the value and/or profitability of the relevant part of the business. These plans are designed to provide market competitive remuneration for the relevant employees. Westpac also has ‘grandfathered’ plans, under which no further awards are made and performance or vesting periods have passed. These vested securities continue to run their course.
Other long-term awards
The Restricted Share Plan and Westpac Performance Plan are also used from time to time for one-off awards to attract Senior Executives, executives or specialist employees to the Group or for retention in specific circumstances. Where awards are made on joining, these typically compensate for real value forfeited on leaving the previous employer which might otherwise deter that executive from joining the Group.
| | |
58 | 2012 WESTPAC GROUP ANNUAL REPORT | |
LTI awards to key employees below senior management level may also be made under the Restricted Share Plan and Westpac Performance Plan. Under these arrangements, employees receive awards of Westpac ordinary shares or share rights, which are restricted for a period as determined by the Board. This allows the flexibility to tailor the restriction period to the circumstances of the award.
3.2. Linking reward and performance
CEO performance objectives and key highlights
The Remuneration Committee reviews and makes recommendations to the Board on individual performance objectives for the CEO and Senior Executives. These objectives are intended to provide a robust link between remuneration outcomes and the key drivers of long-term shareholder value. The STI objectives are set in the form of a scoreboard with targets and measures cascaded from the CEO scoreboard to the relevant Senior Executive scoreboard. The key financial and non financial objectives for the CEO in the 2012 financial year with commentary on key highlights are provided below.
| | | | | | |
Category | | Weighting | | Measure1 | | Performance highlights |
Financial | | 40% | | ¾ Economic Profit | | ¾ 110% of target |
Risk | | 10% | | ¾ Adherence to Group Risk Appetite Statement | | ¾ Further improvements in the level of capital, the mix of funding, and the amount of liquidity. ¾ Asset quality also improved over the year with provisioning cover continuing to be at the upper end of the sector. ¾ Maintained our AA ratings with S&P, Moody’s and Fitch following reviews in 2011 and 2012. |
Customer/ Strategy/ Sustainability | | 40% | | Customer ¾ Depth of customer relationship | | ¾ Customers with four or more products at 29.8%, ahead of target. |
| | | | ¾ Relationship Strength Index | | ¾ Westpac Institutional Bank was ranked clear #1 in the Peter Lee RSI customer feedback survey, exceeding target. |
| | | | | | |
| | | | Funding ¾ Deposit to Loan Ratio ¾ Stable Funding Ratio | | ¾ Achieved 67.6%, well ahead of 65% target. ¾ Achieved 83%, well up on 77% achieved in 2011. |
| | | | Productivity ¾ Cost to Income Ratio ¾ Revenue per Full-Time Equivalent Employee (FTE) | | ¾ Achieved 40.8%, improved 70bps on 2011 result. ¾ Achieved target 5% improvement. |
| | | | ¾ Strategic Investment Priorities | | ¾ SIPs are 70% complete, on plan. |
| | | | Growth ¾ Wealth Penetration | | ¾ Westpac ranked #1 in the sector (Roy Morgan survey) for wealth penetration, i.e., banking customers who hold wealth products. Westpac RBB up from 19.8% to 20.8% and St.George up from 12.6% to 15%. |
| | | | ¾ Bank of Melbourne | | ¾ First year milestone of 54,000 new customers achieved. |
| | | | ¾ Target industries, segments and products | | ¾ Milestones exceeded including trade finance growth up 12% and global transactional growth up 13%. |
People | | 10% | | ¾ Employee Engagement | | ¾ Westpac Group employee engagement increased from 81% in 2011 to 84% in 2012 which is top quartile performance. |
| | | | ¾ Women in leadership positions | | ¾ We exceeded our 2012 target and currently have 40% of leadership roles filled by women. |
| | | | ¾ Retention of high performing employees | | ¾ We retained 95.9% of our high performing employees during the year, ahead of target. |
| | | | ¾ Lost Time Injury Frequency Rate (LTIFR) | | ¾ The health and safety of our employees continues to be a priority for us and our LTIFR improved by 25% this year, outperforming our target. |
1 Individual measures will differ for each Senior Executive.
| | |
| 2012 WESTPAC GROUP ANNUAL REPORT | 59 |
Our primary financial measure is economic profit, which the Board believes is the best measure of risk adjusted returns and of the value created for shareholders. The remaining measures focus on the strength of our customer relationships, effective risk and financial management and our people, which are central to our success and ongoing sustainability. Each individual objective has a baseline or minimum outcome which must be achieved, below which there is a nil outcome.
Application of discretion
The Board and the Remuneration Committee recognise that the scoreboard approach, while embracing a number of complementary performance objectives, will never entirely assess overall performance. The Remuneration Committee may therefore make discretionary adjustments, positive and negative, to the scoreboard outcomes for the CEO and Senior Executives. The Remuneration Committee uses the following criteria to apply discretionary adjustments:
¾ matters not known or not relevant at the beginning of the financial year, which are relevant to the under or over performance of the CEO and Senior Executives during the financial year;
¾ the degree of stretch implicit in the scoreboard measures and targets themselves and the context in which the targets were set;
¾ whether the operating environment during the financial year has been materially better or worse than forecast;
¾ comparison with the performance of the Group’s principal competitors, particularly major shareholder and customer benchmarks;
¾ any major positive or negative risk management or reputational issue that impacts the Group;
¾ the quality of the financial result as shown by its composition and consistency;
¾ whether there have been major positive or negative aspects regarding the quality of leadership and/or behaviours consistent with our values; and
¾ any other relevant over or under performance or other matter not captured.
At the end of the year the Remuneration Committee reviews performance against objectives and applies any adjustments it considers appropriate. The Remuneration Committee then recommends STI outcomes for the CEO and each Senior Executive to the Board for approval, thereby ensuring the Board retains oversight of final awards.
LTI performance outcomes
The following table provides the Group’s TSR, dividend, share price and cash earnings per share performance each year from 2008 to 2012.
| | Years Ended 30 September | |
| | 2012 | | 2011 | | 2010 | | 2009 | | 2008 | |
TSR – three years | | 25.61% | | 9.6% | | 3.7% | | 20.0% | | 29.5% | |
TSR – five years | | 20.03% | | 18.5% | | 51.5% | | 76.7% | | 75.0% | |
Dividends per Westpac share (cents) | | 166 | | 156 | | 139 | | 116 | | 142 | |
Cash Earnings per Westpac share1,2 | | $2.16 | | $2.09 | | $1.98 | | $1.64 | | $1.98 | |
Share price – high | | $24.99 | | $25.60 | | $28.43 | | $26.74 | | $31.32 | |
Share price – low | | $19.00 | | $17.84 | | $20.56 | | $14.40 | | $18.36 | |
Share price – close | | $24.85 | | $20.34 | | $23.24 | | $26.25 | | $21.48 | |
1 Cash earnings are not prepared in accordance with A-IFRS and have not been subject to audit.
2 2009 cash earnings per share are on a pro forma basis, that is, prepared as if the merger with St.George was completed on 1 October 2008.
The vesting outcomes for awards made to the CEO and Senior Executives under the CEO Performance Plan and Westpac Reward Plan that reached a scheduled test date during the reporting period are set out below.
| | | | | | | | | | | | | | Remain | |
| | | | Commencement | | | | TSR Percentile in | | Vested | | Lapsed | | in Plan | |
Equity Instrument | | Type of Equity | | Date1 | | Test Date | | Ranking Group | | % | | % | | % | |
CEO Performance Plan | | Performance options | | 1 February 2008 | | 1 February 2012 | | 80th percentile | | 100 | | - | | - | |
| | and share rights | | 1 December 2008 | | 1 December 2011 | | 70th percentile | | 90 | | - | | 10 | |
Westpac Reward Plan | | Performance options | | 1 October 2008 | | 1 October 2011 | | 70th percentile | | 90 | | - | | 10 | |
| | | | 1 March 2009 | | 1 March 2012 | | 80th percentile | | 100 | | - | | - | |
1 Commencement date refers to the commencement of the performance period.
| | |
60 | 2012 WESTPAC GROUP ANNUAL REPORT | |
3.3. Remuneration outcomes for the CEO and Senior Executives
The following table has been prepared to provide shareholders with an outline of the remuneration which has been received for the 2012 performance year either as cash or in the case of prior equity awards, the value which has vested in 2012 (see note 6 below). For former Senior Executives, the table outlines the remuneration for the period they were KMP during 2012. Details in this table supplement the statutory requirements in Section 5.2. Unlike the statutory table, which represents remuneration outcomes prepared in accordance with accounting standards (A-IFRS), this table shows the actual remuneration value received by Executives.
| | Fixed
Remuneration &
Superannuation1 | | 2012 STI Cash
Payment2 | | STI Outcome as
% of Target3 | | Other Short-
term Benefits4 | | 2012 Total
Cash
Payments5 | | Prior Year* Equity
Awards6 Vested
during 2012 | | Prior Year* Equity
Awards6 Forfeited
during 2012 | |
| | $ | | $ | | % | | $ | | $ | | $ | | $ | |
CEO | | | | | | | | | | | | | | | |
Gail Kelly | | 3,028,816 | | 2,268,000 | | 105 | % | - | | 5,296,816 | | 5,430,496 | | - | |
| | | | | | | | | | | | | | | |
| | | | | | | | | | | | | | | |
Senior Executives | | | | | | | | | | | | | | | |
John Arthur | | 1,175,021 | | 702,000 | | 90 | % | - | | 1,877,021 | | 159,671 | | - | |
Peter Clare | | 988,020 | | 810,000 | | 90 | % | - | | 1,798,020 | | 248,139 | | - | |
Philip Coffey | | 1,355,301 | | 1,080,000 | | 100 | % | - | | 2,435,301 | | 485,490 | | - | |
Brad Cooper | | 1,006,976 | | 1,080,000 | | 90 | % | - | | 2,086,976 | | 291,290 | | - | |
George Frazis | | 1,033,412 | | 912,000 | | 95 | % | - | | 1,945,412 | | 1,329,146 | | - | |
Peter Hanlon | | 1,388,442 | | 945,000 | | 105 | % | - | | 2,333,442 | | 280,502 | | - | |
Brian Hartzer7 | | 632,694 | | 150,000 | | 100 | % | 370,000 | | 1,152,694 | | 1,250,580 | | - | |
Christine Parker | | 844,664 | | 600,000 | | 111 | % | - | | 1,444,664 | | 125,321 | | - | |
Greg Targett | | 1,367,499 | | 690,000 | | 100 | % | - | | 2,057,499 | | 125,567 | | - | |
Rob Whitfield | | 1,736,049 | | 1,296,000 | | 135 | % | - | | 3,032,049 | | 400,463 | | - | |
Jason Yetton8 | | 859,092 | | 660,000 | | 116 | % | - | | 1,519,092 | | 333,959 | | - | |
| | | | | | | | | | | | | | | |
| | | | | | | | | | | | | | | |
Former Senior Executives | | | | | | | | | | | | | | | |
Rob Chapman8 | | 458,218 | | - | | n/a | | - | | 458,218 | | 162,262 | | - | |
Rob Coombe8,9 | | 260,530 | | 291,667 | | n/a | | 2,182,500 | | 2,734,697 | | 721,771 | | (959,760 | ) |
* | Prior year awards comprise STI deferred in the form of equity and LTI awards subject to performance vesting hurdles with the exception of Brian Hartzer, refer to note below. |
| |
1 | Fixed remuneration includes cash salary, annual leave accrual and salary sacrificed items plus employer superannuation. |
2 | The cash STI payment represents 60% of the 2012 STI outcome and will be paid in November 2012. The remaining 40% is deferred in the form of equity and will vest in equal tranches in October 2013 and 2014. |
3 | The maximum STI opportunity is 150% of target. |
4 | Incorporates payments made upon any cessation of employment or other contracted amounts. Payments made to Rob Coombe as at 31 December 2011 include accrued leave, long service leave, outplacement assistance and a payment in lieu of the provision of notice of termination as per his contract provisions. The payment to Brian Hartzer reflects annual incentive foregone from his previous employer. |
5 | This is the addition of the first, second and fourth columns. |
6 | Prior year equity awards include both deferred STI and LTI allocations which have vested in 2012. The vested value for Rob Coombe includes awards which vested upon him leaving the Group as provided for in the various plan rules. The equity value has been calculated as the number of securities that vested during the year ended 30 September 2012, multiplied by the five day volume weighted average price of Westpac ordinary shares at the time they vested, less any exercise price payable. |
7 | Brian Hartzer — Chief Executive, Australian Financial Services - was recruited to the Group in late 2011 and commenced employment in June 2012. The value shown as vested equity above relates to a specific allocation which reflects equity foregone with his previous employer. |
8 | Rob Coombe ceased being a KMP on 23 November 2011 when he vacated the role of Group Executive, Westpac Retail & Business Banking. Jason Yetton became a KMP on his appointment to the role on 24 November 2011. Rob Chapman vacated the role of Chief Executive Officer, St.George Banking Group on 31 March 2012. |
9 | Rob Coombe — former Group Executive, Westpac Retail & Business Banking - left the group on 31 December 2011 after nearly 16 years service. The provisions outlined above include a payment in lieu of notice as per his contract provisions and a cash payment in lieu of his deferred STI in 2011. Prior year equity awards also vested on him leaving the Group in accordance with the equity plan rules. An amount of $959,760 in unvested equity was also forfeited by Mr Coombe consistent with the equity plan rules. |
This table is not prepared in accordance with A-IFRS.
4. Non-executive Director Remuneration
4.1. Structure and policy
Remuneration policy
Westpac’s Non-executive Director remuneration strategy is designed to attract and retain experienced, qualified Board members and remunerate them appropriately for their time and expertise.
As the Board’s focus is on strategic direction, long-term corporate performance and the creation of shareholder value, fees for Non-executive Directors are not directly related to the Group’s short-term results and Non-executive Directors do not receive performance-based remuneration.
| | |
| 2012 WESTPAC GROUP ANNUAL REPORT | 61 |
Non-executive Director remuneration consists of the following components:
Remuneration component | | | Paid as | | | Detail |
| | | | | | |
Base fee | | | Cash | | | This fee is for service on the Westpac Banking Corporation Board. The base fee for the Chairman covers all responsibilities, including all Board Committees. |
Committee fees | | | Cash | | | Additional fees are paid to Non-executive Directors for chairing or participating in Board Committees. |
Superannuation | | | Superannuation | | | Reflects statutory superannuation contributions (9% of fees) which are capped at the superannuation maximum contributions base as prescribed under the Superannuation Guarantee legislation. |
Subsidiary Board and Advisory Board fees | | | Cash | | | Fees are for service on Subsidiary Boards and Advisory Boards. These fees are paid by the relevant subsidiary company. |
Changes to Non-executive Director remuneration in 2012
For the year ended 30 September 2012, the following changes were made to Non-executive Director remuneration:
Non-executive Director fee review — effective 1 January 2012
Non-executive Director committee fees were last increased in 2007 and have remain unchanged over a period of significant increased workload as the regulatory environment evolved through, and post, the global financial crisis. In addition, two Board Committees were dissolved during the year with work of those Board Committees assumed by the full Board.
The Board reviewed the Non-executive Director fee framework in October 2011 and, on the basis of market data provided by Guerdon Associates and current workloads, approved the following adjustments to Non-executive Director fees effective from 1 January 2012:
¾ the Westpac Group Board Chairman fee increased from $735,000 to $760,000 per annum;
¾ the Westpac Group Board Deputy Chairman fee increased from $262,500 to $270,000 per annum;
¾ for both the Audit Committee and Risk Management Committee, fees for the Committee Chairman increased from $50,000 to $60,000 per annum and fees for Committee members increased from $25,000 to $30,000 per annum;
¾ for the Remuneration Committee, fees for the Committee Chairman increased from $45,000 to $48,000 per annum and fees for Committee members increased from $20,000 to $24,000 per annum; and
¾ for the Technology and Sustainability Committees, the fee for the Committee Chairman decreased from $40,000 to $30,000 per annum and fees for Committee members decreased from $20,000 to $15,000 per annum. The Technology Committee fees have been set at 50% of the Audit Committee fees.
These changes included both increases and decreases in committee fees and have positioned Westpac Non-executive Director fees as second of the four major banks and reflect our relative size, scale and market capitalisation.
At the time of the review of the fee framework, two board committees were also dissolved, bringing the accountabilities within the oversight of the full Board.
Changes to Board and Committee composition
Following the retirement of Ted Evans (Chairman) and Graham Reaney on 14 December 2011, the following changes were made to Board and Committee composition:
¾ Lindsay Maxsted was appointed Chairman of the Westpac Group Board, effective 15 December 2011;
¾ Peter Wilson was appointed Chairman of the Audit Committee, replacing Lindsay Maxsted, effective 15 December 2011;
¾ Ann Pickard and Robert Elstone were appointed as Non-executive Directors to the Westpac Board effective 1 December 2011 and 1 February 2012 respectively;
¾ the Health, Safety and Wellbeing Committee (HS&W) was introduced as a temporary Committee in 2010. The outcomes delivered under the Committee’s improvement program were substantially completed, and in January 2012 the Committee was dissolved with the Board assuming responsibility for the overall monitoring of HS&W across the Group;
¾ the Sustainability Committee was dissolved on 6 March 2012, the Westpac Group’s sustainability agenda being well embedded across the organisation. The Board has assumed responsibility for its oversight and monitoring as a core part of our overall approach to doing business;
¾ effective 6 March 2012, a number of changes were made to committee membership. Section 1 of the Directors’ report shows Board Committee membership during 2012; and
¾ consistent with Westpac’s director tenure policy, Carolyn Hewson retired from the Westpac Board on 30 June 2012.
| | |
62 | 2012 WESTPAC GROUP ANNUAL REPORT | |
Fee pool
At the 2008 Annual General Meeting, the current fee pool of $4.5 million per annum was approved by shareholders. For the year ended 30 September 2012, $3.5 million (77%) of this fee pool was used. The fee pool is inclusive of employer superannuation contributions but does not include retirement allowances.
Fee framework
This section details the current Non-executive Director fee framework.
Base and committee fees
The following table sets out the Board and standing Committee fees payable from 1 January 2012:
| | Annual Rate | |
Base Fee | | $ | |
Chairman | | 760,000 | |
Deputy Chairman | | 270,000 | |
Non-executive Directors | | 210,000 | |
Committee Chairman Fees | | | |
Audit Committee | | 60,000 | |
Risk Management Committee | | 60,000 | |
Remuneration Committee | | 48,000 | |
Sustainability Committee1 | | 30,000 | |
Technology Committee | | 30,000 | |
Health, Safety & Wellbeing Committee (HS&W)2 | | 40,000 | |
Committee Membership Fees | | | |
Audit Committee | | 30,000 | |
Risk Management Committee | | 30,000 | |
Remuneration Committee | | 24,000 | |
Sustainability Committee1 | | 15,000 | |
Technology Committee | | 15,000 | |
Health, Safety & Wellbeing Committee (HS&W)2 | | 20,000 | |
1 The Sustainability Committee was dissolved effective 6 March 2012.
2 The HS&W Committee was dissolved effective 1 January 2012.
Committee fees are not payable to the Chairman and members of the Nominations Committee.
Superannuation
The Group pays superannuation contributions to Non-executive Directors of up to 9% of their fees. These contributions are capped at the maximum compulsory superannuation contributions base prescribed under Superannuation Guarantee legislation. Employer contributions are paid into an eligible superannuation fund nominated by the Director.
Subsidiary Board and Advisory Board fees
Throughout the reporting period, additional fees were payable to certain Directors for membership on Subsidiary Boards or Advisory Boards. These fees vary according to the position held, the size, level and nature of activity in the division and the time commitment required.
The table below sets out the annual fees payable to the relevant Directors for service on Subsidiary and Advisory Boards in 2012:
Director | | Subsidiary/Advisory Board | | Role | | Annual Rate |
Peter Hawkins | | Bank of Melbourne Advisory Board | | Director | | $35,000 |
Carolyn Hewson | | BT Investment Management Board | | Director | | $110,000 |
Graeme Reaney1 | | BankSA Advisory Board | | Director | | $13,750 |
Peter Wilson2 | | Westpac New Zealand Limited | | Chair | | $131,875 |
1 Graham Reaney retired from the BankSA Advisory Board effective 14 December 2011.
2 The fees for service on the WNZL Subsidiary Board are paid in New Zealand dollars and have been converted to Australian dollars using the 2012 year to date average exchange rate (1AUD = 1.2891NZD).
Equity participation
Non-executive Directors have voluntarily resolved to build and maintain their individual holdings of Westpac ordinary shares to align their interests with the long-term interests of shareholders. Details of Non-executive Directors’ Westpac (and related bodies corporate) shareholdings are set out in Section 4(a) of the Directors’ report.
| | |
| 2012 WESTPAC GROUP ANNUAL REPORT | 63 |
Retiring Allowance
The retiring allowance for Non-executive Directors appointed prior to July 2003 was frozen in December 2005 and was indexed in line with average weekly earnings. The indexed amount is payable on retirement.
A retiring allowance of $489,266 was paid to Ted Evans following his retirement from the Westpac Group Board on 14 December 2011, and a retiring allowance of $347,186 was paid to Carolyn Hewson following her retirement from the Westpac Group Board on 30 June 2012.
As at 1 July 2012, there are no longer any Non-executive Directors with a retiring allowance.
5. Required remuneration disclosures
5.1. Details of Non-executive Director remuneration
Details of Non-executive Director remuneration are set out in the table below:
| | Short-term Benefits | | Post Employment Benefits | | | | | |
| | Westpac Banking
Corporation Board Fees1 | | Subsidiary and
Advisory Board Fees | | Superannuation | | Retiring Allowance
Accrued During the
Year2 | | Total | | Total Retiring
Allowance Accrued | |
Name | | $ | | $ | | $ | | $ | | $ | | $ | |
| | | | | | | | | | | | | |
Lindsay Maxsted, Chairman | | | | | | | | | | | |
2012 | | 661,503 | | - | | 15,961 | | - | | 677,464 | | - | |
2011 | | 285,000 | | - | | 15,345 | | - | | 300,345 | | - | |
| | | | | | | | | | | | | |
John Curtis, Deputy Chairman | | | | | | | | | | | |
2012 | | 365,770 | | - | | 15,961 | | - | | 381,731 | | - | |
2011 | | 392,420 | | - | | 15,345 | | - | | 407,765 | | - | |
| | | | | | | | | | | | | |
Elizabeth Bryan | | | | | | | | | | | | | |
2012 | | 323,377 | | - | | 15,961 | | - | | 339,338 | | - | |
2011 | | 341,230 | | 2,650 | | 15,345 | | - | | 359,225 | | - | |
| | | | | | | | | | | | | |
Gordon Cairns | | | | | | | | | | | | | |
2012 | | 278,377 | | - | | 15,961 | | - | | 294,338 | | - | |
2011 | | 306,250 | | - | | 15,345 | | - | | 321,595 | | - | |
| | | | | | | | | | | | | |
Robert Elstone, appointed 1 February 2012 | | | | | | | | | | | |
2012 | | 182,254 | | - | | 9,194 | | - | | 191,448 | | - | |
| | | | | | | | | | | | | |
Peter Hawkins | | | | | | | | | | | | | |
2012 | | 300,000 | | 35,000 | | 15,961 | | - | | 350,961 | | - | |
2011 | | 295,940 | | 32,180 | | 15,345 | | - | | 343,465 | | - | |
| | | | | | | | | | | | | |
Ann Pickard, appointed 1 December 2011 | | | | | | | | | | | |
2012 | | 205,836 | | - | | 13,332 | | - | | 219,168 | | - | |
| | | | | | | | | | | | | |
Peter Wilson | | | | | | | | | | | | | |
2012 | | 306,489 | | 131,875 | | 15,961 | | - | | 454,325 | | - | |
2011 | | 300,000 | | 120,600 | | 15,345 | | - | | 435,945 | | - | |
| | | | | | | | | | | | | |
Former Non-executive Directors | | | | | | | | | | | |
Ted Evans, retired as Chairman on 14 December 2011 | | | | | | | | | |
2012 | | 150,615 | | - | | 3,233 | | 4,309 | | 158,157 | | - | |
2011 | | 735,000 | | - | | 15,345 | | 18,333 | | 768,678 | | 484,957 | |
| | | | | | | | | | | | | |
Carolyn Hewson, retired on 30 June 2012 | | | | | | | | | |
2012 | | 206,989 | | 110,000 | | 21,693 | | 10,118 | | 348,800 | | - | |
2011 | | 286,170 | | 109,580 | | 25,890 | | 12,501 | | 434,141 | | 337,068 | |
| | | | | | | | | | | | | |
Graeme Reaney, retired on 14 December 2011 | | | | | | | | | |
2012 | | 57,377 | | 2,818 | | 3,233 | | - | | 63,428 | | - | |
2011 | | 280,000 | | 15,000 | | 15,345 | | - | | 310,345 | | - | |
| | | | | | | | | | | | | |
Total fees | | | | | | | | | | | | | |
2012 | | 3,038,587 | | 279,693 | | 146,451 | | 14,427 | | 3,479,158 | | - | |
2011 | | 3,222,010 | | 280,010 | | 148,650 | | 30,834 | | 3,681,504 | | 822,025 | |
| | | | | | | | | | | | | |
| |
1 | Includes fees paid to Chairman and members of Board Committees, including fees for the temporary HS&W Committee. |
| |
2 | Retiring allowances were frozen for individual Non-executive Directors between December 2005 and February 2006. Accruals shown for 2012 include indexation in line with average weekly earnings following the freezing of the retiring allowances. Retiring allowances are not included in calculations for the Non-executive Director fee pool. |
| | |
64 | 2012 WESTPAC GROUP ANNUAL REPORT | |
5.2. Remuneration details – KMP and other Senior Executives
This section sets out details of remuneration for the CEO and Senior Executives for the 2012 financial year, calculated in accordance with statutory accounting requirements.
| | Short-term Benefits | | Post Employment Benefits | | Share-based Payments | | | |
| | Fixed Remu-
neration1 | | STI (cash)2 | | Non-
monetary
Benefits3 | | Other
Short-term
Benefits4 | | Superann-
uation
Benefits5 | | Long
Service
Leave6 | | Restricted
Shares7 | | Options8 | | Share
Rights8 | | Total9 | |
Name | | $ | | $ | | $ | | $ | | $ | | $ | | $ | | $ | | $ | | $ | |
| | | | | | | | | | | | | | | | | | | | | |
Senior Executives | | | | | | | | | | | | | | | | | | | | | |
Gail Kelly, Managing Director & Chief Executive Officer | | | | | | | | | | | | | | | |
2012 | | 3,001,714 | | 2,268,000 | | 2,565 | | - | | 27,102 | | 51,217 | | 1,704,358 | | 63,862 | | 2,473,166 | | 9,591,984 | |
2011 | | 2,901,656 | | 2,376,000 | | - | | - | | 27,281 | | 68,816 | | 1,786,612 | | 533,809 | | 2,170,642 | | 9,864,816 | |
John Arthur, Chief Operating Officer | | | | | | | | | | | | | | | |
2012 | | 1,131,518 | | 702,000 | | 13,053 | | - | | 43,503 | | 31,205 | | 471,581 | | - | | 384,414 | | 2,777,274 | |
2011 | | 819,544 | | 792,000 | | 1,078 | | - | | 50,058 | | 17,326 | | 246,847 | | - | | 263,029 | | 2,189,882 | |
Peter Clare, Chief Executive Offier, Westpac New Zealand Limited | | | | | | | | | | | | | |
2012 | | 973,964 | | 810,000 | | 158,423 | | - | | 14,056 | | 15,975 | | 592,446 | | 173 | | 409,671 | | 2,974,708 | |
2011 | | 988,822 | | 990,000 | | 1,078 | | - | | 24,326 | | 16,729 | | 341,059 | | 63,258 | | 258,067 | | 2,683,339 | |
Philip Coffey, Chief Financial Officer | | | | | | | | | | | | | | | | | |
2012 | | 1,312,031 | | 1,080,000 | | 2,033 | | - | | 43,270 | | 44,198 | | 825,490 | | 222 | | 548,696 | | 3,855,940 | |
2011 | | 1,164,312 | | 1,350,000 | | - | | - | | 49,450 | | 52,148 | | 571,940 | | 110,540 | | 348,565 | | 3,646,955 | |
Brad Cooper, Chief Executive Officer, BT Financial Group | | | | | | | | | | | | | | | |
2012 | | 956,185 | | 1,080,000 | | 3,013 | | - | | 50,791 | | 15,244 | | 766,713 | | 195 | | 594,341 | | 3,466,482 | |
2011 | | 995,851 | | 1,320,000 | | 7,150 | | - | | 19,339 | | 39,298 | | 571,860 | | 98,080 | | 366,971 | | 3,418,549 | |
George Frazis, Chief Executive Officer, St.George Banking Group | | | | | | | | | | | | | |
2012 | | 1,005,158 | | 912,000 | | 2,888 | | - | | 28,254 | | 7,627 | | 486,064 | | 167,365 | | 660,959 | | 3,270,315 | |
2011 | | 969,696 | | 1,200,000 | | 52,882 | | - | | 18,324 | | - | | - | | 399,634 | | 899,680 | | 3,540,216 | |
Peter Hanlon, Chief Executive, Australian Financial Services | | | | | | | | | | | | | | | |
2012 | | 1,190,304 | | 945,000 | | 77,061 | | - | | 198,138 | | (72,651 | ) | 621,668 | | 166 | | 409,671 | | 3,369,357 | |
2011 | | 879,346 | | 1,062,000 | | 166,797 | | - | | 183,652 | | (116,214 | ) | 360,846 | | 78,197 | | 258,067 | | 2,872,691 | |
Brian Hartzer, Chief Executive, Australian Financial Services | | | | | | | | | | | | | | | |
2012 | | 622,080 | | 150,000 | | 185,712 | | 370,000 | | 10,614 | | 8,985 | | 2,461,533 | | - | | - | | 3,808,924 | |
Christine Parker, Group Executive, Human Resources & Corporate Affairs | | | | | | | | | | | |
2012 | | 825,411 | | 600,000 | | 46,109 | | - | | 19,253 | | 17,357 | | 307,823 | | 26 | | 84,774 | | 1,900,753 | |
Greg Targett, Chief Risk Officer | | | | | | | | | | | | | | | | | |
2012 | | 1,323,898 | | 690,000 | | 3,013 | | - | | 43,601 | | 33,242 | | 537,857 | | - | | 493,833 | | 3,125,444 | |
2011 | | 1,176,961 | | 828,000 | | - | | - | | 49,253 | | 37,982 | | 287,456 | | - | | 316,709 | | 2,696,361 | |
Rob Whitfield, Group Executive, Westpac Institutional Bank | | | | | | | | | | | | | |
2012 | | 1,711,723 | | 1,296,000 | | 160,603 | | - | | 24,326 | | 27,423 | | 688,660 | | 130 | | 530,560 | | 4,439,425 | |
2011 | | 1,838,371 | | 1,104,000 | | 210,993 | | - | | 33,696 | | 27,390 | | 525,697 | | 71,589 | | 348,565 | | 4,160,301 | |
Jason Yetton, Group Executive, Westpac Retail & Business Banking | | | | | | | | | | | | | |
2012 | | 834,966 | | 660,000 | | 1,736 | | - | | 24,126 | | 30,681 | | 339,824 | | - | | 124,471 | | 2,015,804 | |
| | | | | | | | | | | | | | | | | | | | | |
Former Senior Executives10 | | | | | | | | | | | | | | | | | |
Rob Chapman, Chief Executive Officer, St.George Banking Group | | | | | | | | | | | | | |
2012 | | 448,674 | | - | | 1,017 | | - | | 9,544 | | 12,111 | | 206,894 | | - | | 118,938 | | 797,178 | |
2011 | | 921,475 | | 734,400 | | 613,184 | | - | | 19,392 | | 75,495 | | 227,557 | | - | | 114,706 | | 2,706,209 | |
Rob Coombe, Group Executive, Westpac Retail & Business Banking | | | | | | | | | | | | | |
2012 | | 256,635 | | 291,667 | | 297 | | 2,182,500 | | 3,895 | | (35,156 | ) | 232,648 | | 233 | | 563,321 | | 3,496,040 | |
2011 | | 940,352 | | 1,200,000 | | 1,078 | | - | | 26,340 | | 26,413 | | 401,312 | | 115,760 | | 325,331 | | 3,036,586 | |
| | | | | | | | | | | | | | | | | | | | | |
| |
1 | Fixed remuneration is the total cost of salary, salary sacrificed benefits (including motor vehicles, parking, etc. and any associated fringe benefits tax) and an accrual for annual leave entitlements. Peter Hanlon received a higher duty allowance while CEO of Australian Financial Services for the period from 24 November 2011. |
2 | 2012 STI figures reflect annual cash performance awards accrued but not yet paid in respect of the year ended 30 September 2012. |
| | |
| 2012 WESTPAC GROUP ANNUAL REPORT | 65 |
3 | Non-monetary benefits are determined on the basis of the cost to the Group (including associated fringe benefits tax, where applicable) and include annual health checks, provision of taxation advice, relocation costs, living away from home expenses and allowances. |
4 | Incorporates payments made upon any cessation of employment or other contracted amounts. Payments made to Rob Coombe after nearly 16 years service include statutory payments such as annual and long service leave, outplacement assistance, payment in lieu of notice in accordance with his contract provisions and the equity portion of his 2011 STI outcome. The payment to Brian Hartzer reflects annual incentive foregone from his previous employer. |
5 | The CEO and Senior Executives are provided with insurance cover under the Westpac Group Plan at no cost. Peter Hanlon is a member of a legacy defined benefit superannuation fund. Superannuation benefits have been calculated consistent with AASB 119. |
6 | Peter Hanlon took long service leave during the year which resulted in a negative accrual of ($72,651). Rob Coombe also took long service leave during the year resulting in a negative accrual of ($35,156). |
7 | The value of restricted shares is amortised over the applicable vesting period, and the amount shown is the amortisation relating to the 2012 reporting year (and 2011 year as comparison). |
| The equity granted to Brian Hartzer on his recruitment relates to equity foregone with his previous employer and will be forfeited if Mr Hartzer resigns or is terminated for cause before the vesting dates. |
8 | Equity-settled remuneration is based on the amortisation over the vesting period (normally two or three years) of the ‘fair value’ at grant date of hurdled and unhurdled options and share rights that were granted during the four years ended 30 September 2012. Details of prior years’ grants have been disclosed in previous Annual Reports. |
9 | The percentage of the total remuneration which is performance related (i.e., STI cash plus share based payments) was: Gail Kelly 68%, John Arthur 56%, Rob Chapman 41%, Peter Clare 61%, Philip Coffey 64%, Rob Coombe 31%, Brad Cooper 70%, George Frazis 68%, Peter Hanlon 59%, Brian Hartzer 69%, Christine Parker 52%, Greg Targett 55%, Rob Whitfield 57% and Jason Yetton 56%. The percentage of total remuneration delivered in the form of options (including share rights) was: Gail Kelly 26%, John Arthur 14%, Rob Chapman 15%, Peter Clare 14%, Philip Coffey 14%, Rob Coombe 16%, Brad Cooper 17%, George Frazis 25%, Peter Hanlon 12%, Brian Hartzer 0%, Christine Parker 4%, Greg Targett 16%, Rob Whitfield 12% and Jason Yetton 6%. |
10 | Rob Chapman ceased to be a KMP when he vacated the role of Chief Executive Officer, St.George Banking Group on 31 March 2012. Rob Coombe vacated the role of Group Executive, Westpac Retail & Business Banking effective 23 November 2011 and subsequently left the Group on 31 December 2011 – see note 4 above. |
| | |
66 | 2012 WESTPAC GROUP ANNUAL REPORT | |
5.3. Movement in equity-settled instruments during the year
This table shows the details of movements during 2012 in the number and value of equity instruments for the CEO and Senior Executives under the relevant plans.
Name | | Type of Equity Instrument | | Number
Granted1 | | Number
Vested2 | | Number
Exercised3 | | Value
Granted4
$ | | Value
Exercised5
$ | | Value Forfeited
or Lapsed5,6
$ |
| | | | | | | | | | | | | | |
Senior Executives | | | | | | | | | | | | | | |
Gail Kelly | | CEO Performance options | | - | | 429,842 | | 320,513 | | - | | 1,935,386 | | - |
| | CEO Performance share rights | | 272,929 | | 132,445 | | 132,445 | | 3,501,210 | | 2,759,057 | | - |
| | Shares under the CEO Restricted Share Plan | | 77,799 | | 78,364 | | n/a | | 1,582,881 | | n/a | | - |
| | | | | | | | | | | | | | |
John Arthur | | Performance share rights | | 40,433 | | - | | - | | 525,604 | | - | | - |
| | Shares under Restricted Share Plan | | 25,933 | | 7,889 | | n/a | | 527,627 | | n/a | | - |
| | | | | | | | | | | | | | |
Peter Clare | | Performance options | | - | | 73,619 | | - | | - | | - | | - |
| | Performance share rights | | 50,542 | | - | | - | | 657,018 | | - | | - |
| | Shares under Restricted Share Plan | | 32,416 | | 12,260 | | n/a | | 659,529 | | n/a | | - |
| | | | | | | | | | | | | | |
Philip Coffey | | Performance options | | - | | 94,325 | | 127,308 | | - | | 1,140,105 | | - |
| | Performance share rights | | 66,715 | | - | | - | | 867,257 | | - | | - |
| | Shares under Restricted Share Plan | | 44,204 | | 23,987 | | n/a | | 899,365 | | n/a | | - |
| | | | | | | | | | | | | | |
Brad Cooper | | Performance options | | - | | 82,822 | | - | | - | | - | | - |
| | Performance share rights | | 75,813 | | - | | - | | 985,526 | | - | | - |
| | Shares under Restricted Share Plan | | 43,222 | | 14,392 | | n/a | | 879,385 | | n/a | | - |
| | | | | | | | | | | | | | |
George Frazis | | Performance options | | - | | 260,869 | | 260,869 | | - | | 1,524,999 | | - |
| | Performance share rights | | 55,596 | | - | | - | | 722,716 | | - | | - |
| | Unhurdled share rights | | - | | 9,995 | | 9,995 | | - | | 227,779 | | - |
| | Shares under Restricted Share Plan | | 39,292 | | - | | n/a | | 799,426 | | n/a | | - |
| | | | | | | | | | | | | | |
Peter Hanlon | | Performance options | | - | | 70,398 | | - | | - | | - | | - |
| | Performance share rights | | 50,542 | | - | | - | | 657,018 | | - | | - |
| | Shares under Restricted Share Plan | | 34,774 | | 13,859 | | n/a | | 707,504 | | n/a | | - |
| | | | | | | | | | | | | | |
Brian Hartzer | | Shares under Restricted Share Plan | | 331,906 | | 52,306 | | n/a | | 7,158,864 | | n/a | | - |
| | | | | | | | | | | | | | |
Christine Parker | | Performance options | | - | | 10,984 | | - | | - | | - | | - |
| | Performance share rights | | 11,927 | | - | | - | | 155,045 | | - | | - |
| | Unhurdled share rights | | - | | 2,838 | | - | | - | | - | | - |
| | Shares under Restricted Share Plan | | 17,015 | | 3,340 | | n/a | | 346,038 | | n/a | | - |
| | | | | | | | | | | | | | |
Greg Targett | | Performance share rights | | 60,650 | | - | | 4,822 | | 788,414 | | 105,511 | | - |
| | Shares under Restricted Share Plan | | 27,111 | | 6,204 | | n/a | | 551,594 | | n/a | | - |
| | | | | | | | | | | | | | |
Rob Whitfield | | Performance options | | - | | 55,214 | | - | | - | | - | | - |
| | Performance share rights | | 60,650 | | - | | - | | 788,414 | | - | | - |
| | Shares under Restricted Share Plan | | 36,149 | | 19,786 | | n/a | | 735,479 | | n/a | | - |
| | | | | | | | | | | | | | |
Jason Yetton | | Performance options | | - | | 29,447 | | - | | - | | - | | - |
| | Performance share rights | | 17,689 | | - | | - | | 229,945 | | - | | - |
| | Shares under Restricted Share Plan | | 21,990 | | 16,471 | | n/a | | 447,294 | | n/a | | - |
| | | | | | | | | | | | | | |
Former Senior Executives | | | | | | | | | | | | |
Rob Chapman | | Performance share rights | | 42,960 | | - | | - | | 558,453 | | - | | - |
| | Shares under Restricted Share Plan | | 24,047 | | 8,017 | | n/a | | 489,255 | | n/a | | - |
| | | | | | | | | | | | | | |
Rob Coombe | | Performance options | | - | | 110,224 | | - | | - | | - | | - |
| | Performance share rights | | 60,650 | | - | | 26,827 | | 788,414 | | 567,549 | | 959,760 |
| | Shares under Restricted Share Plan | | - | | 35,579 | | n/a | | - | | n/a | | - |
| | | | | | | | | | | | | | |
1 No performance options were granted in 2012.
2 For unhurdled share rights granted in December 2009, 100% vested in 2012. The unvested performance options granted to the CEO in February 2008 and the performance options granted to Senior Executives in December 2008 were assessed against a TSR ranking group that consisted of the top 10 largest Australian banking and financial sector companies by market capitalisation at the time of grant (excluding Westpac). The remaining 30% of the performance options granted to the CEO in February 2008 vested during 2012 and 90% of the performance options granted to Senior Executives in October 2008 vested during 2012.
3 Vested options and share rights that were granted prior to October 2009 can be exercised up to a maximum of 10 years from their commencement date. For each share right and each performance option exercised during the year, the relevant Executive received one fully paid Westpac ordinary share. The exercise price for share rights is nil.
| | |
| 2012 WESTPAC GROUP ANNUAL REPORT | 67 |
4 For share rights, the value granted represents the number of securities granted multiplied by the fair value per instrument as set out in the table titled ‘Fair value of LTI grants made during the year’ below. For restricted shares, the value granted represents the number of ordinary shares granted multiplied by the five day volume weighted average price of a Westpac ordinary share on the date the shares were granted. These values, which represent the full value of the equity-based awards made to disclosed Executives in 2012, do not reconcile with the amount shown in the table in Section 5.2, which shows amortised totals of equity awards over their vesting period. The minimum total value of the grants for future financial years is nil and an estimate of the maximum possible total value in future financial years is the fair value, as shown above.
As part of Brian Hartzer’s sign-on arrangements and to reflect equity foregone with his previous employer, equity was granted under the RSP which will be forfeited if Mr Hartzer resigns or is terminated for cause before the vesting dates.
5 The value of each option or share right exercised or lapsed is calculated based on the five day volume weighted average price of Westpac ordinary shares on the ASX on the date of exercise (or lapse), less the relevant exercise price (if any). Where the exercise price is greater than the five day volume weighted average price of Westpac ordinary shares, the value has been calculated as nil.
Performance share rights forfeited during 2012 were as a result of leaving the Group in 2012. Vested performance options were also forfeited in 2012 at nil value (exercise price greater than the five day weighted average price).
6 Apart from equity instruments referred to in this section, no other equity instruments granted in prior years vested or were forfeited during the financial year.
Fair value of LTI grants made during the year
The table below provides a summary of the fair value of LTI awards granted to the CEO and Senior Executives during 2012 calculated in accordance with Australian accounting standard AASB 2 Share-based Payments and used for accounting purposes only. The LTI grants will vest on satisfaction of performance and/or service conditions tested in future financial years.
| | | | | | | | | | | | | | Fair |
| | Performance | | | | | | Commencement | | First Possible | | | | Value2 per |
Equity Instrument | | Hurdle | | Granted to | | Grant Date | | Date1 | | Vesting Date | | Expiry | | Instrument |
CEO Performance Plan | | Relative TSR | | Gail Kelly | | 21 December 2011 | | 1 October 2011 | | 1 October 2014 | | 1 October 2021 | | $9.20 |
Share Rights | | Cash EPS CACG | | | | 21 December 2011 | | 1 October 2011 | | 1 October 2014 | | 1 October 2021 | | $16.66 |
Westpac Reward Plan | | Relative TSR | | All Senior | | 29 November 2011 | | 1 October 2011 | | 1 October 2014 | | 1 October 2021 | | $9.59 |
Performance Share Rights | | Cash EPS CACG | | Executives | | 29 November 2011 | | 1 October 2011 | | 1 October 2014 | | 1 October 2021 | | $16.60 |
1 | The commencement date is the start of the performance period in the case of share rights. Awards to the CEO were approved by shareholders at the Annual General Meeting held on 15 December 2010. |
2 | The fair values of share rights granted during the year included in the table above have been independently calculated at their respective grant dates based on the requirements of Australian accounting standard AASB 2 Share-based Payments. The fair value of rights without TSR based hurdles, including rights with Cash EPS CAGR hurdles, has been assessed with reference to the share price at grant date and a discount rate reflecting the expected dividend yield over their vesting periods. The fair value of rights with hurdles based on TSR performance relative to a group of comparator companies also takes into account the average TSR outcome determined using a Monte Carlo simulation pricing model. |
5.4. Employment agreements
The remuneration and other terms of employment for the CEO and Senior Executives are formalised in their employment agreements. Each of these employment agreements provide for the payment of fixed and performance-based remuneration, superannuation and other benefits such as death and disablement insurance cover.
The term and termination provisions of the employment agreements for the current KMP are summarised below.
| | | | |
Term | | Who | | Conditions |
Duration of agreement | | ¾ CEO and Senior Executives | | ¾ Ongoing until notice given by either party |
| | | | |
Notice to be provided by the executive or the Group to terminate the employment agreement | | ¾ CEO and Senior Executives | | ¾ 12 months1 |
| | | |
| ¾ Jason Yetton | | ¾ 6 months1 |
| | | | |
Termination payments to be made on termination without cause | | ¾ CEO and all Senior Executives | | ¾ Deferred STI and LTI awards vest according to the applicable equity plan rules |
| | | | |
Termination for cause | | ¾ CEO, John Arthur, Brian Hartzer, Christine Parker, Greg Targett, Rob Whitfield and Jason Yetton | | ¾ Immediately for misconduct ¾ 3 months notice for poor performance |
| | | | |
| | ¾ All other Senior Executives | | ¾ Immediately for misconduct ¾ Standard contractual notice period for poor performance |
| | | | |
Post-employment restraints | | ¾ CEO and all Senior Executives | | ¾ 12 month non-solicitation restraint |
1 Payment in lieu of notice may in certain circumstances be approved by the Board for some or all of the notice period.
| | |
68 | 2012 WESTPAC GROUP ANNUAL REPORT | |
Certain individuals have provisions in their contracts for different terms due to grandfathered contractual benefits or individual circumstances:
¾ Gail Kelly – The restricted period on all unvested restricted shares (deferred STI) will continue to the full term when Gail Kelly ceases employment with Westpac, except for death, sickness or disability or in certain circumstances within 12 months of change of control of Westpac. In these circumstances all unvested restricted shares will vest. On immediate termination for misconduct, all restricted shares will be forfeited. When Gail Kelly ceases employment with Westpac, all unvested performance share rights (LTI) will lapse at the Board’s discretion, except for under circumstances of death, sickness or disability and in certain circumstances within 12 months of change of control of Westpac. In these circumstances all unvested performance share rights will vest. On immediate termination for misconduct, all unvested performance share rights will lapse;
¾ Peter Clare – Provisions relating to his relocation from Sydney to Auckland;
¾ Peter Hanlon – Provisions relating to accommodation in Sydney, and travel between Adelaide and Sydney;
¾ Brian Hartzer – Provisions relating to his relocation from London to Sydney;
¾ Christine Parker – Provisions relating her relocation from Auckland to Sydney; and
¾ Rob Whitfield – Provisions relating to accommodation in Sydney.
| | |
| 2012 WESTPAC GROUP ANNUAL REPORT | 69 |
10. AUDITOR
a) Auditor’s independence declaration
A copy of the auditor’s independence declaration as required under section 307C of the Corporations Act is below:

|
|
AUDITOR’S INDEPENDENCE DECLARATION As lead auditor for the audit of Westpac Banking Corporation for the year ended 30 September 2012, I declare that to the best of my knowledge and belief, there have been: a. no contraventions of the auditor independence requirements of the Corporations Act 2001 in relation to the audit; and b. no contraventions of any applicable code of professional conduct in relation to the audit. This declaration is in respect of Westpac Banking Corporation and the entities it controlled during the period. |
|
|

|
|
Michael Codling
Partner
PricewaterhouseCoopers | Sydney, Australia
5 November 2012 |
|
| | |
|
PricewaterhouseCoopers, ABN 52 780 433 757 Darling Park Tower 2, 201 Sussex Street, GPO BOX 2650, SYDNEY NSW 1171 T +61 2 8266 0000, F +61 2 8266 9999, www.pwc.com.au |
|
|
| | | |
b) Non-audit services
We may decide to engage PwC on assignments additional to their statutory audit duties where their expertise or experience with Westpac or a controlled entity is important.
Details of the non-audit service amounts paid or payable to PwC for non-audit services provided during the 2011 and 2012 financial years are set out in Note 33 to the financial statements.
PwC also provides audit and non-audit services to non-consolidated entities, non-consolidated trusts of which a Westpac Group entity is trustee, manager or responsible entity and non-consolidated superannuation funds or pension funds. The fees in respect of these services were approximately $8.6 million in total (2011 $8.5 million). PwC may also provide audit and non-audit services to other entities in which Westpac holds a minority interest and which are not consolidated. Westpac is not aware of the amount of any fees paid to PwC by those entities.
Westpac has a policy on engaging PwC, details of which are set out in the ‘Corporate governance’ section, including the subsection entitled ‘Engagement of the external auditor’, which forms part of this Directors’ report.
The Board has considered the position and, in accordance with the advice received from the Board Audit Committee, is satisfied that the provision of the non-audit services during 2012 by PwC is compatible with the general standard of independence for auditors imposed by the Corporations Act. The Directors are satisfied that the provision of non-audit services by PwC, as set out above, did not compromise the auditor independence requirements of the Corporations Act for the following reasons:
§ all non-audit services have been reviewed by the Board Audit Committee to ensure they do not impact the impartiality and objectivity of the auditor; and
§ none of the services undermine the general principles relating to auditor independence as set out in APES 110 Code of Ethics for Professional Accounts.
| | |
70 | 2012 WESTPAC GROUP ANNUAL REPORT | |
Signed in accordance with a resolution of the Board.

| 
|
Lindsay Maxsted
Chairman
5 November 2012 | Gail Kelly
Managing Director & Chief Executive Officer
5 November 2012 |
| | |
| 2012 WESTPAC GROUP ANNUAL REPORT | 71 |
This page is intentionally left blank
| | |
72 | 2012 WESTPAC GROUP ANNUAL REPORT | |

FIVE YEAR SUMMARY
READING THIS REPORT
REVIEW OF GROUP OPERATIONS
DIVISIONAL PERFORMANCE
RISK AND RISK MANAGEMENT
OTHER WESTPAC BUSINESS INFORMATION
(in $millions unless otherwise indicated) | | 2012 | | | 2011 | | 2010 | | 2009 | | 2008 | |
Income statements for the years ended 30 September2 | | | | | | | | | | | | |
Net interest income | | 12,502 | | | 11,996 | | 11,842 | | 11,646 | | 7,222 | |
Non-interest income | | 5,481 | | | 4,917 | | 5,068 | | 4,859 | | 4,383 | |
Net operating income before operating expenses and impairment charges | | 17,983 | | | 16,913 | | 16,910 | | 16,505 | | 11,605 | |
Operating expenses | | (7,909 | ) | | (7,406 | ) | (7,416 | ) | (7,171 | ) | (5,455 | ) |
Impairment charges | | (1,212 | ) | | (993 | ) | (1,456 | ) | (3,238 | ) | (931 | ) |
Profit before income tax | | 8,862 | | | 8,514 | | 8,038 | | 6,096 | | 5,219 | |
Income tax expense | | (2,826 | ) | | (1,455 | ) | (1,626 | ) | (2,579 | ) | (1,287 | ) |
Profit attributable to non-controlling interests | | (66 | ) | | (68 | ) | (66 | ) | (71 | ) | (73 | ) |
Net profit attributable to owners of Westpac Banking Corporation | | 5,970 | | | 6,991 | | 6,346 | | 3,446 | | 3,859 | |
Balance sheet as at 30 September2 | | | | | | | | | | | | |
Loans | | 514,445 | | | 496,609 | | 477,655 | | 463,459 | | 313,545 | |
Other assets | | 160,520 | | | 173,619 | | 140,622 | | 126,128 | | 126,131 | |
Total assets | | 674,965 | | | 670,228 | | 618,277 | | 589,587 | | 439,676 | |
Deposits | | 394,991 | | | 370,278 | | 337,385 | | 329,456 | | 233,730 | |
Debt issues and acceptances | | 147,847 | | | 165,931 | | 150,971 | | 133,024 | | 100,369 | |
Loan capital | | 9,537 | | | 8,173 | | 9,632 | | 11,138 | | 8,718 | |
Other liabilities | | 76,371 | | | 82,038 | | 80,171 | | 79,398 | | 77,388 | |
Total liabilities | | 628,746 | | | 626,420 | | 578,159 | | 553,016 | | 420,205 | |
Total shareholders’ equity and non-controlling interests | | 46,219 | | | 43,808 | | 40,118 | | 36,571 | | 19,471 | |
Key financial ratios | | | | | | | | | | | | |
Shareholder value | | | | | | | | | | | | |
Dividends per ordinary share (cents) | | 166 | | | 156 | | 139 | | 116 | | 142 | |
Dividend payout ratio (%) | | 84.8 | | | 67.0 | | 64.9 | | 92.6 | | 68.9 | |
Return on average ordinary equity (%) | | 14.0 | | | 17.8 | | 17.4 | | 10.8 | | 23.1 | |
Basic earnings per share (cents) | | 195.8 | | | 233.0 | | 214.2 | | 125.3 | | 206.0 | |
Net tangible assets per ordinary share ($)3 | | 10.47 | | | 9.96 | | 8.96 | | 7.89 | | 7.71 | |
Share price ($): | | | | | | | | | | | | |
High | | 24.99 | | | 25.60 | | 28.43 | | 26.74 | | 31.32 | |
Low | | 19.00 | | | 17.84 | | 20.56 | | 14.40 | | 18.36 | |
Close | | 24.85 | | | 20.34 | | 23.24 | | 26.25 | | 21.48 | |
Business performance | | | | | | | | | | | | |
Operating expenses to operating income ratio (%) | | 44.0 | | | 43.8 | | 43.9 | | 43.4 | | 47.0 | |
Net interest margin | | 2.16 | | | 2.19 | | 2.21 | | 2.38 | | 2.07 | |
Capital adequacy | | | | | | | | | | | | |
Total equity to total assets (%) | | 6.8 | | | 6.5 | | 6.5 | | 6.2 | | 4.4 | |
Total equity to total average assets (%) | | 7.0 | | | 7.0 | | 6.6 | | 6.3 | | 4.8 | |
Tier 1 ratio (%)4 | | 10.3 | | | 9.7 | | 9.1 | | 8.1 | | 7.8 | |
Total capital ratio (%)4 | | 11.7 | | | 11.0 | | 11.0 | | 10.8 | | 10.8 | |
Credit quality | | | | | | | | | | | | |
Net impaired assets to equity and collectively assessed provisions (%) | | 5.6 | | | 6.3 | | 6.2 | | 5.7 | | 3.0 | |
Total provisions for impairment on loans and credit commitments to total loans (basis points) | | 82 | | | 88 | | 105 | | 101 | | 69 | |
Other information | | | | | | | | | | | | |
Core full-time equivalent employees (number at financial year end)5 | | 33,418 | | | 33,898 | | 35,055 | | 34,189 | | 26,717 | |
1 | Where accounting classifications have changed or where changes in accounting policy are adopted retrospectively, comparatives have been revised and may differ from results previously reported. |
2 | The above income statement extracts for 2012, 2011 and 2010 and balance sheet extracts for 2012 and 2011 are derived from the consolidated financial statements included in this Annual Report. The above income statement extracts for 2009 and 2008 and balance sheet extracts for 2010, 2009 and 2008 are derived from financial statements previously published. |
3 | Total equity attributable to owners of Westpac Banking Corporation, after deducting goodwill and other intangible assets divided by the number of ordinary shares outstanding, less treasury shares held. |
4 | For details on this ratio, please refer to Note 30 to the financial statements. |
5 | Core full-time equivalent employees includes full-time and pro-rata part-time staff. It excludes staff on unpaid absences (e.g. unpaid maternity leave), overtime, temporary and contract staff. |
| | |
74 | 2012 WESTPAC GROUP ANNUAL REPORT | |
Disclosure regarding forward-looking statements
This Annual Report contains statements that constitute ‘forward-looking statements’ within the meaning of Section 21E of the US Securities Exchange Act of 1934.
Forward-looking statements are statements about matters that are not historical facts. Forward-looking statements appear in a number of places in this Annual Report and include statements regarding our intent, belief or current expectations with respect to our business and operations, market conditions, results of operations and financial condition, including, without limitation, future loan loss provisions and financial support to certain borrowers. We use words such as ‘will’, ‘may’, ‘expect’, ‘intend’, ‘seek’, ‘would’, ‘should’, ‘could’, ‘continue’, ‘plan’, ‘estimate’, ‘anticipate’, ‘believe’, ‘probability’, ‘risk’ or other similar words to identify forward-looking statements. These forward-looking statements reflect our current views with respect to future events and are subject to change, certain risks, uncertainties and assumptions which are, in many instances, beyond our control, and have been made based upon management’s expectations and beliefs concerning future developments and their potential effect upon us. There can be no assurance that future developments will be in accordance with our expectations or that the effect of future developments on us will be those anticipated. Actual results could differ materially from those which we expect, depending on the outcome of various factors, including, but not limited to:
¾ the effect of, and changes in, laws, regulations, taxation or accounting standards or practices and government policy, particularly changes to liquidity, leverage and capital requirements;
¾ the stability of Australian and international financial systems and disruptions to financial markets and any losses or business impacts Westpac or its customers or counterparties may experience as a result;
¾ market volatility, including uncertain conditions in funding, equity and asset markets;
¾ adverse asset, credit or capital market conditions;
¾ changes to our credit ratings;
¾ levels of inflation, interest rates, exchange rates and market and monetary fluctuations;
¾ market liquidity and investor confidence;
¾ changes in economic conditions, consumer spending, saving and borrowing habits in Australia, New Zealand and in other countries in which Westpac or its customers or counterparties conduct their operations and our ability to maintain or to increase market share and control expenses;
¾ the effects of competition in the geographic and business areas in which Westpac conducts its operations;
¾ reliability and security of Westpac’s technology and risks associated with changes to technology systems;
¾ the timely development and acceptance of new products and services and the perceived overall value of these products and services by customers;
¾ the effectiveness of our risk management policies, including our internal processes, systems and employees;
¾ the occurrence of environmental change or external events in countries in which Westpac or its customers or counterparties conduct their operations;
¾ internal and external events which may adversely impact our reputation;
¾ changes in political, social or economic conditions in any of the major markets in which Westpac or its customers or counterparties operate;
¾ the success of strategic decisions involving business expansion and integration of new businesses; and
¾ various other factors beyond Westpac’s control.
The above list is not exhaustive. For certain other factors that may impact on forward-looking statements made by us, refer to ‘Risk factors’ under the section ‘Risk and risk management’. When relying on forward-looking statements to make decisions with respect to us, investors and others should carefully consider the foregoing factors and other uncertainties and events.
Westpac is under no obligation, and does not intend, to update any forward-looking statements contained in this Annual Report, whether as a result of new information, future events or otherwise, after the date of this Annual Report.
Significant developments
For a discussion of significant developments impacting the Group, refer to ‘Significant developments’ under ‘Information on Westpac’ in Section 1.
Currency of presentation, exchange rates and certain definitions
In this Annual Report, ‘financial statements’ means our audited consolidated balance sheets as at 30 September 2012 and 30 September 2011 and income statements, statements of comprehensive income, changes in equity and cash flows for each of the years ended 30 September 2012, 2011 and 2010 together with accompanying notes which are included in this Annual Report.
Our financial year ends on 30 September. As used throughout this Annual Report, the financial year ended 30 September 2012 is referred to as 2012 and other financial years are referred to in a corresponding manner.
We publish our consolidated financial statements in Australian dollars. In this Annual Report, unless otherwise stated or the context otherwise requires, references to ‘dollars’, ‘dollar amounts’, ‘$’, ‘AUD’ or ‘A$’ are to Australian dollars, references to ‘US$’, ‘USD’ or ‘US dollars’ are to United States dollars and references to ‘NZ$’, ‘NZD’ or ‘NZ dollars’ are to New Zealand dollars. Solely for the convenience of the reader, certain Australian dollar amounts have been translated into US dollars at a specified rate. These translations should not be construed as representations that the Australian dollar amounts actually represent such US dollar amounts or have been or could be converted into US dollars at the rate indicated. Unless otherwise stated, the translations of Australian dollars into US dollars have been made at the rate of A$1.00 = US$1.0388, the noon buying rate in New York City for cable transfers in Australian dollars as certified for customs purposes by the Federal Reserve Bank of New York (the
| | |
| 2012 WESTPAC GROUP ANNUAL REPORT | 75 |
‘noon buying rate’) as of Friday, 28 September 2012. The Australian dollar equivalent of New Zealand dollars at 28 September 2012 was A$1.00 = NZ$1.2542, being the closing spot exchange rate on that date. Refer to ‘Exchange rates’ in Section 4 for information regarding the rates of exchange between the Australian dollar and the US dollar for the financial years ended 30 September 2008 to 30 September 2012.
Any discrepancies between totals and sums of components in tables contained in this Annual Report are due to rounding.
| | |
76 | 2012 WESTPAC GROUP ANNUAL REPORT | |
REVIEW OF GROUP OPERATIONS
Selected consolidated financial and operating data
We have derived the following selected financial information as of, and for the financial years ended, 30 September 2012, 2011, 2010, 2009 and 2008 from our audited consolidated financial statements and related notes.
This information should be read together with our audited consolidated financial statements and the accompanying notes included elsewhere in this Annual Report.
Accounting standards
The financial statements and other financial information included elsewhere in this Annual Report, unless otherwise indicated, have been prepared and presented in accordance with Australian Accounting Standards (A-IFRS). They also comply with International Financial Reporting Standards (IFRS) as issued by the International Accounting Standards Board (IASB).
The financial statements have been prepared in accordance with the accounting policies described in Note 1 to the financial statements.
Recent accounting developments
For a discussion of recent accounting developments refer to Note 1 to the financial statements.
Critical accounting estimates
Our reported results are sensitive to the accounting policies, assumptions and estimates that underlie the preparation of the income statement and the balance sheet. Our principal accounting policies are disclosed in Note 1 to the financial statements. Note 1 also includes a description of our critical accounting assumptions and estimates. We have discussed the development and selection of the critical accounting estimates with our Board Audit Committee (BAC). The following is a summary of the areas we consider involve our most critical accounting estimates. For more detail refer to Note 1 to the financial statements.
Fair value of financial instruments
Financial instruments classified as held-for-trading or designated at fair value through profit or loss and financial assets classified as available-for-sale are recognised in the financial statements at fair value. All derivatives are measured and recognised at fair value. As far as possible, financial instruments are valued with reference to quoted, observable market prices or by using models which employ observable valuation parameters. Where valuation models rely on parameters for which inputs are not observable, judgments and estimation may be required.
As at 30 September 2012, the fair value of trading securities, financial assets designated at fair value through profit or loss, loans designated at fair value, available-for-sale securities and life insurance assets was $91,816 million (2011: $88,189 million). The fair value of trading liabilities and financial liabilities designated at fair value through profit or loss, deposits at fair value and debt issues at fair value was $88,319 million (2011: $112,140 million). The fair value of outstanding derivatives was a net liability of $3,446 million (2011: $9,740 million net asset). The fair value of life insurance assets of $8,240 million (2011: $7,916 million) was substantially based on quoted market prices. The fair value of financial assets and financial liabilities determined by valuation models that use unobservable market prices was $1,276 million (2011: $1,473 million) and $100 million
(2011: $74 million), respectively. The fair value of other financial assets and financial liabilities, including derivatives, is largely determined based on valuation models using observable market prices and rates. Where observable market inputs are not available, day one profits or losses are not recognised.
We believe that the judgments and estimates used are reasonable in the current market. However, a change in these judgments and estimates would lead to different results as future market conditions can vary from those expected.
Provisions for impairment charges on loans
Provisions for loan impairment charges represent management’s best estimate of the losses incurred in the loan portfolios as at the balance date. There are two components of our loan impairment provisions: individually assessed provisions (IAPs) and collectively assessed provisions (CAPs).
In determining IAPs, considerations that have a bearing on the expected future cash flows are taken into account. For example, the business prospects of the customer, the realisable value of collateral, our position relative to other claimants, the reliability of customer information and the likely cost and duration of the work-out process. These judgments and estimates can change with time as new information becomes available or as work-out strategies evolve, resulting in revisions to the impairment provision as individual decisions are made.
The CAPs are established on a portfolio basis taking into account the level of arrears, collateral and security, past loss experience and expected defaults based on portfolio trends. The most significant factors in establishing these provisions are estimated loss rates and related emergence periods. The future credit quality of these portfolios is subject to uncertainties that could cause actual credit losses to differ from reported loan impairment provisions. These uncertainties include the economic environment, notably interest rates, unemployment levels, payment behaviour and bankruptcy rates.
As at 30 September 2012, gross loans to customers were $518,279 million (2011: $500,654 million) and the provision for impairment on loans was $3,834 million (2011: $4,045 million).
Goodwill
Goodwill represents the excess of purchase consideration, the amount of any non-controlling interest in the acquiree and the acquisition date fair value of any previous equity interest in the acquiree, over the fair value of the Group’s share of the identified net assets of acquired businesses. The determination of the fair value of the assets and liabilities of acquired businesses requires the exercise of management judgment. Different fair values would result in changes to the goodwill and to the post-acquisition performance of the acquisitions.
| | |
| 2012 WESTPAC GROUP ANNUAL REPORT | 77 |
Goodwill is tested for impairment annually by determining if the carrying value of the cash-generating unit (CGU) that it has been allocated to is recoverable. The recoverable amount is the higher of the CGU’s fair value less costs to sell and its value in use. Determination of appropriate cash flows and discount rates for the calculation of the value in use is subjective. As at 30 September 2012, the carrying value of goodwill was $8,797 million (2011: $8,582 million). Refer to Note 13 to the financial statements for further information.
Superannuation obligations
The actuarial valuation of our defined benefit plan obligations are dependent upon a series of assumptions, the key ones being discount rate, compensation increase rate, mortality, morbidity and investment returns assumptions. Different assumptions could significantly alter the amount of the difference between plan assets and defined benefit obligations and the amount recognised directly in retained earnings.
The superannuation deficits across all our plans as at 30 September 2012 were in aggregate $632 million (2011: $676 million).
Provisions (other than loan impairment charges)
Provisions are held in respect of a range of obligations such as employee entitlements, restructuring costs, litigation provisions and non-lending losses, impairment charges on credit commitments and surplus lease space. Some of the provisions involve significant judgment about the likely outcome of various events and estimated future cash flows.
Income taxes
The Group is subject to income taxes in Australia and jurisdictions where it has foreign operations. All our businesses predominantly operate in jurisdictions with similar tax rates to the Australian corporate tax rate. Significant judgment is required in determining the worldwide provision for income taxes. There are many transactions and calculations undertaken during the ordinary course of business for which the ultimate tax determination is uncertain. The Group estimates its tax liabilities based on the Group’s understanding of the tax law. Where the final outcome of these matters is different from the amounts that were initially recorded, such differences will impact the current and deferred tax provisions in the period where such determination is made.
Provisions for taxation held in respect of uncertain tax positions represent the tax benefits at risk. The assessment of the amount of tax benefits at risk involves the exercise of management judgments about the ultimate outcomes of the transactions.
| | |
78 | 2012 WESTPAC GROUP ANNUAL REPORT | |
REVIEW OF GROUP OPERATIONS
INCOME STATEMENT REVIEW
Consolidated income statement1
| | Year Ended 30 September |
| | 2012 | | 2012 | | | 2011 | | 2010 | | 2009 | | 2008 |
(in $millions unless otherwise indicated) | | US$2 | | A$ | | | A$ | | A$ | | A$ | | A$ |
Interest income | | 38,304 | | 36,873 | | | 38,098 | | 34,151 | | 30,446 | | 29,081 |
Interest expense | | (25,317) | | (24,371 | ) | | (26,102) | | (22,309) | | (18,800) | | (21,859) |
Net interest income | | 12,987 | | 12,502 | | | 11,996 | | 11,842 | | 11,646 | | 7,222 |
Non-interest income | | 5,694 | | 5,481 | | | 4,917 | | 5,068 | | 4,859 | | 4,383 |
Net operating income before operating expenses and impairment charges | | 18,681 | | 17,983 | | | 16,913 | | 16,910 | | 16,505 | | 11,605 |
Operating expenses | | (8,216) | | (7,909 | ) | | (7,406) | | (7,416) | | (7,171) | | (5,455) |
Impairment charges | | (1,259) | | (1,212 | ) | | (993) | | (1,456) | | (3,238) | | (931) |
Profit before income tax | | 9,206 | | 8,862 | | | 8,514 | | 8,038 | | 6,096 | | 5,219 |
Income tax expense | | (2,936) | | (2,826 | ) | | (1,455) | | (1,626) | | (2,579) | | (1,287) |
Net profit for the year | | 6,270 | | 6,036 | | | 7,059 | | 6,412 | | 3,517 | | 3,932 |
Profit attributable to non-controlling interests | | (68) | | (66 | ) | | (68) | | (66) | | (71) | | (73) |
Net profit attributable to owners of Westpac Banking Corporation | | 6,202 | | 5,970 | | | 6,991 | | 6,346 | | 3,446 | | 3,859 |
Weighted average number of ordinary shares (millions) | | 3,043 | | 3,043 | | | 2,997 | | 2,960 | | 2,747 | | 1,871 |
Basic earnings per ordinary share (cents) | | 203.4 | | 195.8 | | | 233.0 | | 214.2 | | 125.3 | | 206.0 |
Diluted earnings per share (cents)3 | | 197.9 | | 190.5 | | | 223.6 | | 207.1 | | 123.2 | | 200.1 |
Dividends per ordinary share (cents) | | 172 | | 166 | | | 156 | | 139 | | 116 | | 142 |
Dividend payout ratio (%)4 | | 84.8 | | 84.8 | | | 67.0 | | 64.9 | | 92.6 | | 68.9 |
1 Where accounting classifications have changed or where changes in accounting policy are adopted retrospectively, comparatives have been revised and may differ from results previously reported.
2 Australian dollar amounts have been translated into US dollars solely for the convenience of the reader at the rate of A$1.00 = US$1.0388, the noon buying rate in New York City on 28 September 2012.
3 Based on basic earnings per share, with the weighted average number of fully paid ordinary shares outstanding adjusted for the conversion of dilutive potential ordinary shares, issued for no consideration, and after adjusting earnings for distributions on dilutive potential ordinary shares.
4 Calculated by dividing the dividends per ordinary share by the basic earnings per ordinary share.
Overview of performance – 2012 v 2011
Net profit attributable to owners of Westpac Banking Corporation was $5,970 million in 2012, a decrease of $1,021 million or 15% compared to 2011. The lower net profit for the year reflected a $1,070 million or 6% increase in net operating income before operating expenses and impairment charges which was more than offset by a 7% increase in operating expenses, 22% increase in impairment charges and 94% increase in income tax expense.
Net interest income was $12,502 million in 2012, an increase of $506 million or 4% compared to 2011, reflecting growth in loans and deposits. A 5% increase in average interest earning assets, particularly in Australian housing loans, was partially offset by a decrease in the net interest margin of 3 basis points due to funding costs increasing at a faster pace than asset repricing.
Non-interest income was $5,481 million in 2012, an increase of $564 million or 11% compared to 2011, reflecting growth in the retail banking division and wealth earnings including additional income from the acquisition of J O Hambro. Higher markets income benefited from favourable market conditions driving trading and customer sales income in foreign exchange and interest rate businesses.
Operating expenses were $7,909 million in 2012, an increase of $503 million or 7% compared to 2011. This primarily reflects increased salaries, other staff expenses and restructuring costs including higher operating costs from expansion in Asia and Bank of Melbourne, and restructuring costs associated with the Group’s supplier program. Prior period investment also resulted in higher equipment and occupancy costs, which included higher software amortisation expense. An additional expense was incurred from an increase in provisions for longstanding legal proceedings.
Impairment charges were $1,212 million in 2012, an increase of $219 million or 22% compared to 2011. 2011 benefited from a $107 million net reduction in economic overlay provision and the benefits of improved asset quality and write-backs. 2012 included a $17 million increase in economic overlay and a reduced benefit from write-backs.
The effective tax rate was 31.9% in 2012 and 17.1% in 2011. In 2012, income tax expense included a tax charge of $165 million relating to the retrospective impact of new TOFA legislation and its application to the merger with St.George, while in 2011 a benefit of $1,110 million was received relating to the impact of tax consolidation of the St.George merger.
| | |
| 2012 WESTPAC GROUP ANNUAL REPORT | 79 |
2012 earnings per share were 195.8 cents per share compared to 233.0 cents per share in 2011. The increase in the number of shares on issue in 2012 was primarily due to shares issued under the Dividend Reinvestment Plan (DRP).
A final dividend of 84 cents per share has been declared by the Board, taking the full year dividend for 2012 to 166 cents per share. The dividend is fully franked. This full year dividend represents an increase of 6% over the dividends declared in 2011 and a pay-out ratio of 85%.
Income statement review – 2012 v 2011
Net interest income – 2012 v 2011
| | 2012 | | | 2011 | | 2010 |
| | $m | | | $m | | $m |
Interest income | | 36,873 | | | 38,098 | | 34,151 |
Interest expense | | (24,371) | | | (26,102) | | (22,309) |
Net interest income | | 12,502 | | | 11,996 | | 11,842 |
Increase/(decrease) in net interest income | | | | | | | |
Due to change in volume | | 556 | | | 207 | | 1,344 |
Due to change in rate | | (50) | | | (53) | | (1,148) |
Change in net interest income | | 506 | | | 154 | | 196 |
Net interest income was $12,502 million in 2012, an increase of $506 million or 4% compared to 2011.
Net interest margins declined 3 basis points to 2.16% in 2012 from 2.19% in 2011. Increased funding costs and a more competitive environment for deposits (particularly term deposits) were the main drivers of the decline, though these were partially offset by improved margins from asset repricing in our housing and business lending portfolios.
Loan growth1 in 2012 was 4% higher compared to 2011, with the key feature being the 4% growth in Australian housing loans and 2% growth in Australian business loans. New Zealand lending growth was 5%.
Loan growth had the following specific components:
§ Australian housing loans increased $11.8 billion or 4%;
§ Australian business lending increased $2.6 billion or 2%. Growth occurred in AFS and institutional lending;
§ Australian personal lending increased $0.7 billion or 4%, driven by growth in the Auto Finance portfolio;
§ New Zealand lending increased $2.1 billion or 5%, with housing loans increasing $1.2 billion or 4% and business loans increasing $0.9 billion or 5%; and
§ other overseas loans increased $1.0 billion or 16% due primarily to growth in trade finance in Asia.
Total deposits1 increased 7% or $24.7 billion in 2012 compared to 2011. Growth in customer deposits exceeded growth in loans resulting in the deposit to loan ratio increasing 510 basis points.
Deposit growth had the following specific components:
§ Australian term deposits increased $26.7 billion or 24%, with the Group seeking to improve its funding base by prioritising term deposit growth. Growth was broadly based across all customer segments;
§ Australian at call deposits increased $4.6 billion or 3%, particularly due to customer flows in the second half of 2012;
§ Australian non-interest bearing deposits increased $2.7 billion or 20%, due to increased balances in mortgage offset accounts;
§ New Zealand deposits increased $3.5 billion or 11%, with growth in both at call and term deposits; and
§ other overseas deposits declined $8.6 billion or 26% and Australian certificates of deposit declined $4.3 billion or 12% due to reductions in the Group’s reliance on short-term wholesale funding.
1 For the purposes of this discussion on net interest income, loan and deposit growth has been determined by comparing balances at 30 September 2012 to balances at 30 September 2011.
| | |
80 | 2012 WESTPAC GROUP ANNUAL REPORT | |
REVIEW OF GROUP OPERATIONS
Interest spread and margin – 2012 v 2011
| | 2012 | | | 2011 | | 2010 |
| | $m | | | $m | | $m |
Group | | | | | | | |
Net interest income | | 12,502 | | | 11,996 | | 11,842 |
Average interest earning assets | | 577,745 | | | 548,221 | | 534,991 |
Average interest bearing liabilities | | 540,527 | | | 513,535 | | 501,968 |
Average net non-interest bearing liabilities and equity | | 37,218 | | | 34,686 | | 33,023 |
Interest spread1 | | 1.87% | | | 1.87% | | 1.94% |
Benefit from free funds2 | | 0.29% | | | 0.32% | | 0.27% |
Net interest margin3 | | 2.16% | | | 2.19% | | 2.21% |
1 Interest spread is the difference between the average yield on all interest earning assets and the average rate paid on all interest bearing liabilities.
2 The benefit of net non-interest bearing assets, liabilities and equity is determined by applying the average rate of interest paid on all interest bearing liabilities to the average level of net non-interest bearing funds as a percentage of average interest earning assets.
3 Net interest margin is calculated by dividing net interest income by average interest earning assets.
Net interest margin was 2.16% in 2012, a decline of 3 basis points compared to 2011. Key drivers of the margin decrease were:
§ an 18 basis point decline from higher retail and wholesale funding costs relative to market rates. This included:
– a 14 basis point decline from customer deposits. 9 basis points reflected the lower spread from intense competition, particularly for term deposits. The 9 basis point decline included a reduction in the benefit from hedging low interest accounts of 2 basis points. Product mix impacts reduced margins by 5 basis points, with growth weighted towards lower spread products, particularly term deposits; and
– a 4 basis point decline from wholesale funding costs and the cost of holding increased average liquid asset balances.
§ a 12 basis point increase from asset repricing, primarily due to repricing of the housing and business lending portfolios;
§ capital and other impacts were flat with the benefit from higher capital values offsetting lower earnings due to falling interest rates;
§ a 1 basis point increase reflecting lower amortisation of fair value adjustments relating to the merger with St.George; and
§ a 2 basis point increase reflecting increased Treasury interest income offsetting lower contribution of Markets net interest income.
Non-interest income – 2012 v 2011
| | 2012 | | | 2011 | | 2010 |
| | $m | | | $m | | $m |
Fees and commissions | | 2,630 | | | 2,568 | | 2,469 |
Wealth management and insurance income | | 1,791 | | | 1,618 | | 1,560 |
Trading income | | 850 | | | 558 | | 797 |
Other income | | 210 | | | 173 | | 242 |
Total non-interest income | | 5,481 | | | 4,917 | | 5,068 |
Non-interest income was $5,481 million in 2012, an increase of $564 million or 11% compared to 2011. The increase was primarily driven by higher trading, wealth management and insurance income.
Fees and commissions income were $2,630 million in 2012, an increase of $62 million or 2% compared to 2011. This increase was primarily due to:
§ an increase in facility fees as a result of higher business and commercial lending fees of $74 million; offset by
§ a decline in merchant fees as average interchange rates reduced in line with changes in the mix of spending by householders.
| | |
| 2012 WESTPAC GROUP ANNUAL REPORT | 81 |
Wealth management and insurance income was $1,791 million in 2012, an increase of $173 million or 11% compared to 2011. This increase was primarily due to:
§ higher performance fees predominantly in Hastings of $130 million;
§ revenue contribution from the J O Hambro acquisition of $73 million;
§ increase in General and Life insurance income of $87 million as a result of repricing of premiums, growth in sales through the branch networks and decreased claims as 2011 had significantly higher catastrophe claims; offset by
§ lenders mortgage insurance income decrease of $36 million due to lower credit demand and as a result of the Group’s decision to reduce underwriting risk on the mortgage insurance on loans with an LVR greater than 90%;
§ lower FUM/FUA related income of $14 million predominantly due to lower margins; and
§ reduced income in the Equities business of $17 million due to reduction in broking volumes and trading revenue.
Trading income increased by $292 million or 52% compared to 2011. WIB markets benefited from volatile market conditions driving customer sales income in foreign exchange and interest rate businesses. Risk management income also increased during the year.
Other income was $210 million in 2012, an increase of $37 million or 21% compared to 2011. This increase was primarily driven by an increase in technology research and development tax credits.
Operating expenses – 2012 v 2011
| | 2012 | | | 2011 | | | 2010 | | |
| | $m | | | $m | | | $m | | |
Salaries and other staff expenses | | 4,258 | | | 4,055 | | | 3,990 | | |
Equipment and occupancy expenses | | 1,278 | | | 1,115 | | | 1,082 | | |
Other expenses | | 2,373 | | | 2,236 | | | 2,344 | | |
Total operating expenses | | 7,909 | | | 7,406 | | | 7,416 | | |
Total operating expenses to net operating income ratio | | 44.0 | % | | 43.8 | % | | 43.9 | % | |
Operating expenses were $7,909 million in 2012, an increase of $503 million compared to 2011. The expense to income ratio was 44% in 2012, an increase of 20 basis points compared to 2011.
Salaries and other staff expenses were $4,258 million in 2012, an increase of $203 million or 5% compared to 2011. This increase was driven by:
§ average salary increases of 3% and higher restructuring costs. The prior period also benefited from release of excess employee provisions which was not repeated in 2012;
§ increased investment in Bank of Melbourne and WIB’s Asia operations as well as higher spend on regulatory change and compliance programs and the impact of the J O Hambro acquisition ($38 million); partially offset by
§ lower FTE as a result of delivery of productivity initiatives.
Equipment and occupancy expenses were $1,278 million in 2012, an increase of $163 million or 15% compared to 2011. This increase was driven by:
§ software amortisation and depreciation increased $110 million compared to 2011 as a result of delivery of strategic programs into normal business operations and higher depreciation costs associated with the new data centre and Enterprise Perimeter Security SIP; and
§ operating lease rentals and other equipment and occupancy costs increased 9% or $53 million compared to 2011. The increase was driven by cost increases following annual rental reviews and additional expenses associated with expansion of the distribution network. The Group expanded its footprint with an additional 12 branches and 42 ATMs.
Other expenses were $2,373 million in 2012, an increase of $137 million or 6% compared to 2011. This increase was driven by a provision recognised with respect to longstanding legal proceedings and higher investment spend.
| | |
82 | 2012 WESTPAC GROUP ANNUAL REPORT | |
REVIEW OF GROUP OPERATIONS
Impairment charges – 2012 v 2011
| | 2012 | | | 2011 | | 2010 |
| | $m | | | $m | | $m |
Impairment charges | | 1,212 | | | 993 | | 1,456 |
Impairment charges to average gross loans (basis points) | | 24 | | | 20 | | 30 |
The impairment charge for 2012 was $1,212 million, an increase of 22% compared to 2011. The increase was primarily due to higher collectively assessed provisions as the rate of improving asset quality slowed. The higher charge was also due to a $107 million reduction in economic overlay provisions in 2011 while there was a small increase (up $17 million) in the economic overlay in 2012.
Key movements in impairment charges were:
§ new collectively assessed provisions were $366 million higher compared to 2011 as benefits from improving asset quality were smaller as the recovery slowed. The movement in economic overlay provision also contributed to the rise;
§ WIB recorded the largest change in collective provisions from a reduction in upgrades and refinancing from a smaller decrease in watchlist and substandard companies returning to full health. In St.George and Westpac New Zealand portfolios the improvement in stressed assets also slowed in 2012. In Westpac RBB the collective provisioning charge was lower; and
§ new individually assessed provisions less write-backs and recoveries were $147 million lower compared to 2011 principally due to fewer new impaired assets, particularly in WIB, St.George and New Zealand and much lower write-backs in the WIB portfolio. This was partially offset by higher new individually assessed provisions in Westpac RBB.
Income tax expense – 2012 v 2011
| | 2012 | | | 2011 | | | 2010 | |
| | $m | | | $m | | | $m | |
Income tax expense | | 2,826 | | | 1,455 | | | 1,626 | |
Tax as a percentage of profit before income tax expense (effective tax rate) | | 31.9 | % | | 17.1 | % | | 20.2 | % |
Income tax expense was $2,826 million in 2012, an increase of $1,371 million or 94% compared to 2011. The effective tax rate increased to 31.9% in 2012, from 17.1% in 2011.
The increase was driven by the following tax impacts:
§ retrospective amendments to the income tax law during the year ended 30 September 2012 which applied to consolidated groups and TOFA. These amendments have had an adverse impact to certain liabilities that were consolidated as part of the St.George merger. This led to an additional $165 million tax expense for 2012; and
§ a benefit of $1,110 million was received in 2011 relating to the impact of tax consolidation of the St.George merger.
Excluding the impact of these adjustments, the effective tax rates for 2012 and 2011 would have been 30.0% and 30.1% respectively.
Overview of performance – 2011 v 2010
Net profit attributable to owners of Westpac Banking Corporation was $6,991 million in 2011, an increase of $645 million or 10% compared to $6,346 million in 2010. The result was characterised by stable net operating income before operating expenses and impairment charges, which increased by $3 million; a small operating expense reduction, which reduced by $10 million; a large reduction of $463 million or 32% in impairment charges on loans; and a lower effective tax rate. The large reduction in impairment charges on loans reflected the improved performance of the Australian and New Zealand economies.
Net profit attributable to owners of Westpac Banking Corporation grew in the majority of our divisions.
Net interest income was $11,996 million in 2011, an increase of $154 million or 1% compared to 2010. A 2 basis point decline in net interest margin was more than offset by 2% growth in average interest earning assets, particularly in Australian housing loans. Net interest margin reduced as Treasury earnings fell and due to the unwind of fair value adjustments related to the merger with St.George Bank Limited.
Non-interest income was $4,917 million in 2011, a decrease of $151 million or 3% compared to 2010. Fees and commissions increased as business and corporate line fees were repriced; wealth management and insurance income was up with good customer inflows into funds under administration (FUA); and increased wealth cross sell, although the contribution was partially held back by higher insurance claims and weaker asset markets. Trading income was significantly lower as highly volatile markets, particularly in the second half of 2011, resulted in lower trading income.
Operating expenses were $7,406 million in 2011, a decrease of $10 million compared to 2010. Annual cost increases, including salaries and other staff expense increases, were more than offset by lower expenditure on the St.George integration project and benefits from productivity programs.
| | |
| 2012 WESTPAC GROUP ANNUAL REPORT | 83 |
Impairment charges on loans were $993 million in 2011, a decrease of $463 million or 32% compared to $1,456 million in 2010. Lower impairments in Westpac RBB, WIB, St.George Banking Group and Westpac New Zealand were the primary drivers of the reduction.
The effective tax rate was 17.1% in 2011 and 20.2% in 2010. The effective tax rate was reduced in both years by tax adjustments following finalisation of the tax consolidation impacts related to the merger with St.George Bank Limited. In 2011 a reduction to tax expense of $1,110 million was recorded, compared to a reduction of $685 million in 2010. Excluding the impact of these adjustments, the effective tax rates for 2011 and 2010 would have been 30.1% and 28.8%, respectively.
2011 earnings per share were 233.0 cents per share compared to 214.2 cents per share in 2010. There were no major capital transactions during 2011. The increase in the number of shares on issue in 2011 was primarily due to shares issued under the DRP.
Given the improved earnings and capital position in 2011, a final dividend of 80 cents per share was declared by the Board, taking the full year dividend for 2011 to 156 cents per share. The dividend was fully franked. This full year dividend represented an increase of 12% over the dividends declared in 2010 and a pay-out ratio of 67%.
Income statement review – 2011 v 2010
Net interest income – 2011 v 2010
Net interest income was $11,996 million in 2011, an increase of $154 million or 1% compared to 2010.
Net interest margins declined 2 basis points to 2.19% in 2011 from 2.21% in 2010. Lower Treasury income and the unwind of fair value adjustments on financial instruments relating to the merger with St.George Bank Limited were the main drivers of the decline, partially offset by improved margins in our customer divisions of 4 basis points.
Loan growth1 in 2011 was 4% compared to 2010, with the key feature being the 6% growth in Australian housing loans. The growth in Australian housing loans was partially offset by reductions in Australian business loans. New Zealand lending growth was modest.
Loan growth had the following specific components:
§ Australian housing loans experienced solid growth with balances increasing 6% or $16.8 billion compared to 2010. Westpac RBB mortgages grew 8%, which was ahead of banking system2. St.George Banking Group mortgages growth of 2% was impacted by reduced flow from mortgage brokers;
§ Australian business and corporate loans declined 1% or $1.8 billion compared to 2010 due to contractions in commercial property lending and the WIB lending portfolios, partially offset by positive growth in the SME segment;
§ New Zealand lending increased 3% or NZ$1.4 billion compared to 2010, reflecting the low growth environment in New Zealand. The majority of growth occurred in housing lending, with growth in business lending improving in the second half of 2011; and
§ growth in other overseas loans was in the WIB portfolio, reflecting WIB’s expanded presence in Asia.
Total deposits1 increased 10% or $32.9 billion in 2011 compared to 2010. The growth in deposits resulted in customer deposit growth exceeding loan growth and the deposit to loan ratio improving 380 basis points.
Deposit growth had the following specific components:
§ Australian customer deposits increased 10% or $23.9 billion. This was driven by growth in Australian term deposits, which grew 25% or $22.2 billion, reflecting increased savings rates and the strength of the franchise in uncertain times, as well as an increased focus on customer deposit raising initiatives;
§ Australian non-interest bearing accounts increased 12% or $1.5 billion, reflecting growth in mortgage offset accounts; and
§ New Zealand customer deposits increased 5% or NZ$1.9 billion with growth across both at call and term deposits products.
1 For the purposes of this discussion on net interest income, loan and deposit growth has been determined by comparing balances at 30 September 2011 to balances at 30 September 2010.
2 APRA system growth, 12 months to 30 September 2011.
| | |
84 | 2012 WESTPAC GROUP ANNUAL REPORT | |
REVIEW OF GROUP OPERATIONS |
|
Interest spread and margin – 2011 v 2010
Net interest margin was 2.19% in 2011, a decline of 2 basis points compared to 2010. Key drivers of the margin decrease were:
§ an 11 basis point decline from higher retail and wholesale funding costs, due to a:
– 7 basis point decline from customer deposits, largely due to competition for online savings accounts in the prior year, with the full period impact carrying into 2011. A decline in the benefit from hedging low interest transaction accounts also had a 3 basis point negative impact on margins. Mix impacts were also negative as customer preferences resulted in deposit growth skewed towards products with lower spreads; and
– 4 basis point decline from higher wholesale funding costs, as relatively low cost funding was replaced by higher cost funding since the global financial crisis. Wholesale funding costs include the cost of funding growth in liquid assets, which had an impact of approximately 1 basis point.
§ a 3 basis point decline due to the impact of amortisation of fair value adjustments relating to the merger with St.George Bank Limited;
§ a 3 basis point decline reflecting a reduction in Treasury income following stronger revenues in 2010; partially offset by
§ a 15 basis point increase in assets, primarily from repricing, which occurred predominantly in mortgages.
Non-interest income – 2011 v 2010
Non-interest income was $4,917 million in 2011, a decrease of $151 million or 3% compared to 2010. The decrease was primarily due to the impact of market volatility on trading income, particularly in the second half of 2011. Lower trading income was partially offset by growth in fees and commissions and wealth management and insurance income.
Fees and commissions income was $2,568 million in 2011, an increase of $99 million or 4% compared to 2010. This increase was primarily due to:
§ higher facility fees of $73 million, primarily due to:
– higher business and commercial fees of $106 million from repricing of line fees, partially offset by an accounting reclassification in the St.George Banking Group which resulted in fees of $30 million being transferred to net interest income; and
– increased banking related fees of $16 million in WIB, more than offset by lower deposit account keeping fees of $17 million as customers migrated to accounts with lower fees, and reduced mortgage fees of $7 million from lower new lending volumes.
§ higher transaction fees and commissions of $27 million, primarily due to:
– an increase in advice commissions of $53 million, which included a $32 million benefit from the update of amortisation profiles of capitalised fees and costs; partially offset by
– a decrease in merchant fees of $6 million as average interchange rates reduced in line with changes in the mix of spending; and
– a decrease in deposit transaction fees of $18 million as customers migrated to accounts with lower fees.
Wealth management and insurance income was $1,618 million in 2011, an increase of $58 million or 4% compared to 2010. This increase was primarily due to:
§ higher funds management income of $83 million due to the higher average Group Funds under Management (FUM)/Group Funds under Administration (FUA) from positive net inflows, a benefit from the revaluation of investments in Ascalon funds of $23 million, and the sale of single manager rights which resulted in a gain of $12 million;
– an increase in average FUM of $0.8 billion or 2% compared to 2010 from inflows in wholesale portfolios, partly offset by outflows in retail and WIB portfolios; and
– an increase in average FUA of $4.9 billion or 6% compared to 2010 due to inflows in the wrap platforms and corporate super portfolios in addition to a marginally positive impact from asset markets.
§ an increase in insurance income of $25 million compared to 2010 due to premium growth in general and life insurance, reduced claims in lenders mortgage insurance and improved returns on the investment portfolio, which more than offset higher claims related to various natural disasters, including the Victorian and Queensland floods; partially offset by
§ returns from invested capital decreased by $41 million compared to 2010. This primarily reflected a change in how capital was invested with more investments in fixed income products, which is reflected in net interest income and not in wealth management income.
Trading income decreased by $239 million or 30% compared to 2010. Volatility in the market, especially in the second half of the year, impacted interest rate trading activities, which resulted in a decrease in WIB markets trading income.
Other income was $173 million in 2011, a decrease of $69 million or 29% compared to 2010. This decrease was primarily driven by movements in economic hedges relating to hybrid instruments.
| | |
| 2012 WESTPAC GROUP ANNUAL REPORT | 85 |
Operating expenses – 2011 v 2010
Operating expenses were $7,406 million in 2011, a decrease of $10 million compared to 2010. The expense to income ratio was 43.8% in 2011, a decrease of 10 basis points compared to 2010.
Salaries and other staff expenses were $4,055 million in 2011, an increase of $65 million or 2% compared to 2010. This increase was driven by:
§ increased salary and employee entitlement costs due to an average salary increase of 4% from January 2011; and
§ increased restructure costs due to productivity restructuring in 2011; partially offset by
§ reduced FTE as a result of productivity initiatives; and
§ lower transaction and integration expenses related to the St.George merger.
Equipment and occupancy expenses were $1,115 million, an increase of $33 million or 3% compared to 2010. The increase was driven by:
§ additional rental and property related costs, increases in corporate property space to accommodate projects and additional expenses associated with refurbishment and expansion of branch and ATM networks, including the conversion of 34 St.George branches in Victoria to the Bank of Melbourne brand. The Westpac Group also expanded its footprint with a net additional 15 branches (including Bank of Melbourne) and installed an additional 119 proprietary ATMs; partially offset by
§ a decrease in software costs due to non-recurrence of impairments recognised in 2010.
Other expenses were $2,236 million in 2011, a decrease of $108 million or 5% compared to 2010. The decrease was driven by:
§ a decrease in costs relating to technology purchased services and professional services due to reduced spend on St.George integration activities and implementation progression of the SIPs program from design phase in 2010, to build and deliver in 2011; and
§ the one-off donation of $20 million to the Westpac Foundation in 2010, which was not repeated in 2011; partially offset by
§ an increase in advertising costs, credit card loyalty costs and outsourced costs.
Impairment charges on loans – 2011 v 2010
Impairment charges on loans were $993 million in 2011, a decrease of $463 million or 32% compared to 2010 as asset quality continued to improve and the work-out of stressed and impaired facilities progressed. The improvement in asset quality is reflected in a 72 basis point decline, to 248 basis points, in the ratio of stressed assets to total committed exposures, supported by a decline in the rate of emerging new stress, and some large upgrades and repayments as facilities were worked out.
New individually assessed provisions have remained relatively high as the work-out of the stressed portfolio saw companies downgraded from watchlist and substandard categories of stress into impaired. A top-up of existing impaired provisions has also been required, particularly in the second half of 2011 as the Group updated the assessment of security values.
Movements in collectively assessed provisions in 2011 reflected the improvement in watchlist and substandard facilities, an increase in mortgage delinquencies through the year, and a reduction in economic overlay provisions in the first half of 2011.
The economic overlay in 2011 was $107 million lower compared to 2010. In the first half of 2011, $174 million in provisions associated with commercial property and economic conditions were no longer required as identified provisions were booked through both individually assessed provisions and collectively assessed provisions. Partially offsetting this reduction was a $68 million increase in provisions associated with floods and cyclones in Australia and the second Christchurch earthquake. In the second half of 2011, with greater certainty around the impact of the floods and earthquakes, $55 million was released from these provisions as well as the commercial property overlay from reductions in stress. This release was offset by increases in provisions of $54 million for other sectors of the Australian economy that are likely to be impacted by the high Australian dollar and weaker consumer and business sentiment.
Key movements in impairment charges on loans were:
§ new collectively assessed provisions decreased by $387 million compared to 2010, mainly driven by:
– lower collective provisions recorded in each of the divisions, with the largest reductions recorded in WIB from repayments and companies returning to full health. In Westpac RBB, St.George Banking Group and Westpac New Zealand portfolios, improvement was seen across both the business and consumer segments; and
– the release of economic overlay provisions in 2011.
§ new individually assessed provisions less write-backs and recoveries decreased by $76 million compared to 2010, primarily due to:
– higher write-backs, particularly in WIB; partially offset by
– higher new individually assessed provisions in the Australian banking portfolios of Westpac RBB and St.George Banking Group from a number of small top-ups for existing impaired assets and from the migration of some exposures to impaired that were previously in the watchlist category.
| | |
86 | 2012 WESTPAC GROUP ANNUAL REPORT | |
REVIEW OF GROUP OPERATIONS |
|
Income tax expense – 2011 v 2010
Income tax expense was $1,455 million in 2011, a decrease of $171 million or 11% compared to 2010. The effective tax rate decreased to 17.1% in 2011, from 20.2% in 2010. The decrease was driven by the following tax impacts:
§ finalisation of the tax consolidation related to the merger with St.George Group gave rise to an income tax expense adjustment of $1,110 million during the year ended 30 September 2011 (2010: $685 million). The tax consolidation process required Westpac to reset the tax value of certain St.George Bank Limited assets to the appropriate market value of those assets as at the effective date of the tax consolidation (31 March 2009); and
§ changes in tax provisioning for New Zealand structured finance transactions entered into between 1998 and 2002 significantly impacted the tax rate in both the 2009 and 2010 years. In 2009, a provision of $703 million was raised following a decision by the New Zealand High Court in proceedings relating to those transactions, while $106 million was then released from the provision in 2010 following a settlement with the Commissioner of Inland Revenue (CIR).
Excluding the impact of the St.George related benefits and the New Zealand structured finance transactions, the effective tax rate in 2011, 2010 and 2009 would have been 30%, 30% and 31% respectively.
| | |
| 2012 WESTPAC GROUP ANNUAL REPORT | 87 |
BALANCE SHEET REVIEW
Selected consolidated balance sheet data1
The detailed components of the balance sheet are set out in the notes to the financial statements.
| | | As at 30 September | |
| | | 2012 | | 2012 | | | 2011 | | 2010 | | 2009 | | 2008 | |
| | | | | | | | | | | | | | | |
| | | US$m2 | | A$m | | | A$m | | A$m | | A$m | | A$m | |
Cash and balances with central banks | | | 13,009 | | 12,523 | | | 16,258 | | 4,464 | | 3,272 | | 4,809 | |
Receivables due from other financial institutions | | | 10,625 | | 10,228 | | | 8,551 | | 12,588 | | 9,974 | | 10,434 | |
Derivative financial instruments | | | 36,866 | | 35,489 | | | 49,145 | | 36,102 | | 33,187 | | 34,810 | |
Trading securities, other financial assets designated at fair value and available-for-sale securities | | | 74,522 | | 71,739 | | | 69,006 | | 55,599 | | 47,807 | | 54,605 | |
Loans | | | 534,405 | | 514,445 | | | 496,609 | | 477,655 | | 463,459 | | 313,545 | |
Life insurance assets | | | 8,560 | | 8,240 | | | 7,916 | | 12,310 | | 12,384 | | 12,547 | |
All other assets | | | 23,166 | | 22,301 | | | 22,743 | | 19,559 | | 19,504 | | 8,926 | |
Total assets | | | 701,153 | | 674,965 | | | 670,228 | | 618,277 | | 589,587 | | 439,676 | |
Payables due to other financial institutions | | | 7,857 | | 7,564 | | | 14,512 | | 8,898 | | 9,235 | | 15,861 | |
Deposits | | | 410,317 | | 394,991 | | | 370,278 | | 337,385 | | 329,456 | | 233,730 | |
Derivative financial instruments | | | 40,446 | | 38,935 | | | 39,405 | | 44,039 | | 36,478 | | 24,970 | |
Trading liabilities and other financial liabilities designated at fair value | | | 10,351 | | 9,964 | | | 9,803 | | 4,850 | | 10,848 | | 16,689 | |
Debt issues and acceptances | | | 153,583 | | 147,847 | | | 165,931 | | 150,971 | | 133,024 | | 100,369 | |
Life insurance liabilities | | | 7,488 | | 7,208 | | | 7,002 | | 11,560 | | 11,737 | | 11,953 | |
All other liabilities | | | 13,193 | | 12,700 | | | 11,316 | | 10,824 | | 11,100 | | 7,915 | |
Total liabilities excluding loan capital | | | 643,235 | | 619,209 | | | 618,247 | | 568,527 | | 541,878 | | 411,487 | |
Total loan capital3 | | | 9,907 | | 9,537 | | | 8,173 | | 9,632 | | 11,138 | | 8,718 | |
Total liabilities | | | 653,142 | | 628,746 | | | 626,420 | | 578,159 | | 553,016 | | 420,205 | |
Net assets | | | 48,011 | | 46,219 | | | 43,808 | | 40,118 | | 36,571 | | 19,471 | |
Total equity attributable to owners of Westpac Banking Corporation | | | 45,965 | | 44,249 | | | 41,826 | | 38,189 | | 34,637 | | 17,547 | |
Non-controlling interests | | | 2,046 | | 1,970 | | | 1,982 | | 1,929 | | 1,934 | | 1,924 | |
Total shareholders’ equity and non-controlling interests | | 48,011 | | 46,219 | | | 43,808 | | 40,118 | | 36,571 | | 19,471 | |
Average balances | | | | | | | | | | | | | | | |
Total assets | | | 687,828 | | 662,137 | | | 628,428 | | 607,677 | | 577,831 | | 401,468 | |
Loans and other receivables4 | | | 520,561 | | 501,118 | | | 476,083 | | 469,999 | | 426,845 | | 294,672 | |
Shareholders’ equity | | | 44,258 | | 42,605 | | | 39,378 | | 36,434 | | 32,008 | | 16,699 | |
Non-controlling interests | | | 2,040 | | 1,964 | | | 1,921 | | 1,914 | | 1,915 | | 1,918 | |
1 Where accounting classifications have changed or where changes in accounting policy are adopted retrospectively, comparatives have been revised and may differ from results previously reported.
2 Australian dollar amounts have been translated into US dollars solely for the convenience of the reader at the rate of A$1.00 = US$1.0388, the noon buying rate in New York City on 28 September 2012.
3 This includes Westpac Convertible Preference Shares (Westpac CPS), Westpac Stapled Preferred Securities (SPS), Westpac Stapled Preferred Securities II (SPS II) and 2004 Trust Preferred Securities (2004 TPS) in 2012, SPS, SPS II and 2004 TPS in 2011, 2010 and 2009, SPS and 2004 TPS in 2008.
4 Other receivables include other assets, cash and balances with central banks.
| | |
88 | 2012 WESTPAC GROUP ANNUAL REPORT | |
REVIEW OF GROUP OPERATIONS |
|
Summary of consolidated ratios
| | | Year Ended 30 September | |
| | | 2012 | | 2012 | | | 2011 | | 2010 | | 2009 | | 2008 | |
(in $millions unless otherwise indicated) | | | US$1 | | A$ | | | A$ | | A$ | | A$ | | A$ | |
Profitability ratios (%) | | | | | | | | | | | | | | | |
Net interest margin2 | | | 2.16 | | 2.16 | | | 2.19 | | 2.21 | | 2.38 | | 2.07 | |
Return on average assets3 | | | 0.90 | | 0.90 | | | 1.11 | | 1.04 | | 0.60 | | 0.96 | |
Return on average ordinary equity4 | | | 14.0 | | 14.0 | | | 17.8 | | 17.4 | | 10.8 | | 23.1 | |
Return on average total equity5 | | | 13.4 | | 13.4 | | | 16.9 | | 16.5 | | 10.2 | | 20.7 | |
Capital ratio (%) | | | | | | | | | | | | | | | |
Average total equity to average total assets | | | 6.7 | | 6.7 | | | 6.6 | | 6.3 | | 5.9 | | 4.6 | |
Tier 1 ratio (%)6 | | | 10.3 | | 10.3 | | | 9.7 | | 9.1 | | 8.1 | | 7.8 | |
Total capital ratio6 | | | 11.7 | | 11.7 | | | 11.0 | | 11.0 | | 10.8 | | 10.8 | |
Earnings ratios | | | | | | | | | | | | | | | |
Basic earnings per ordinary share (cents)7 | | | 203.4 | | 195.8 | | | 233.0 | | 214.2 | | 125.3 | | 206.0 | |
Diluted earnings per ordinary share (cents)8 | | | 197.9 | | 190.5 | | | 223.6 | | 207.1 | | 123.2 | | 200.1 | |
Dividends per ordinary share (cents) | | | 172 | | 166 | | | 156 | | 139 | | 116 | | 142 | |
Dividend payout ratio (%)9 | | | 84.8 | | 84.8 | | | 67.0 | | 64.9 | | 92.6 | | 68.9 | |
Credit quality ratios | | | | | | | | | | | | | | | |
Impairment charges on loans written off (net of recoveries) | | | 1,666 | | 1,604 | | | 1,867 | | 1,300 | | 1,874 | | 439 | |
Impairment charges on loans written off (net of recoveries) to average loans (%) | | | 0.32 | | 0.32 | | | 0.38 | | 0.27 | | 0.43 | | 0.15 | |
1 Australian dollar amounts have been translated into US dollars solely for the convenience of the reader at the rate of A$1.00 = US$1.0388, the noon buying rate in New York City on 28 September 2012.
2 Calculated by dividing net interest income by average interest earning assets.
3 Calculated by dividing net profit attributable to owners of Westpac Banking Corporation by average total assets.
4 Calculated by dividing net profit attributable to owners of Westpac Banking Corporation by average ordinary equity.
5 Calculated by dividing net profit attributable to owners of Westpac Banking Corporation by average ordinary equity and non-controlling interests.
6 For details on this ratio refer to Note 30 to the financial statements.
7 Based on the weighted average number of fully paid ordinary shares.
8 Based on basic earnings per share, with the weighted average number of fully paid ordinary shares outstanding adjusted for the conversion of dilutive potential ordinary shares, issued for no consideration, and after adjusting earnings for distributions on dilutive potential ordinary shares.
9 Calculated by dividing the dividends per ordinary share by the basic earnings per ordinary share.
Balance sheet review
Assets – 2012 v 2011
Total assets as at 30 September 2012 were $675.0 billion, an increase of $4.7 billion or 1% compared to 30 September 2011. This growth was primarily due to:
§ cash and balances with central banks decreased $3.7 billion due to lower holdings of this form of liquid assets;
§ receivables due from other financial institutions increased $1.7 billion. The majority of this increase was attributable to higher collateral posted with counterparties;
§ trading securities, other financial assets designated at fair value and available-for-sale securities increased by $2.7 billion due to increased securities trading activity in WIB;
§ derivative assets decreased $13.7 billion due to the impact of the Australian dollar strengthening against the US dollar and other major currencies on foreign exchange forwards and swaps; and
§ loans increased $17.8 billion primarily due to growth in Australian loans of $14.7 billion and New Zealand loans of $2.2 billion. In Australia, housing loans increased by $11.8 billion and business lending increased by $2.6 billion.
Liabilities and equity – 2012 v 2011
Total liabilities as at 30 September 2012 were $628.7 billion, an increase of $2.3 billion compared to 30 September 2011. Growth in total liabilities was primarily due to:
§ payables due to other financial institutions decreased $6.9 billion, primarily due to a decrease in collateral balances received from counterparties in relation to derivatives;
§ deposits increased $24.7 billion. Growth was due to Australian deposits increasing $29.8 billion and New Zealand deposits increased $3.5 billion. Partially offsetting this growth was a fall in other overseas deposits of $8.6 billion. Australian deposit growth was predominantly in term deposits which increased by $26.7 billion. The reduction in offshore deposits related to our decision to reduce our reliance on offshore short-term funding given Australian deposit growth;
| | |
| 2012 WESTPAC GROUP ANNUAL REPORT | 89 |
§ debt issues and acceptances decreased $18.1 billion. This decline was due to a reduction in short-term wholesale funding reliance and the impact of the appreciation in the Australian dollar during the year on foreign currency denominated debt; and
§ loan capital increased $1.4 billion due to the issuance of a new hybrid, Westpac CPS and issuance of new subordinated debt. This was partially offset by subordinated debt redemptions and the impact of the appreciation of the Australian dollar during the year.
Assets – 2011 v 2010
The key movements in assets are outlined below:
§ cash balances with central banks increased $12 billion primarily due to an increase in liquid assets from increased collateral balances following the sharp end-of-period decline in the value of the Australian dollar;
§ receivables due from other financial institutions decreased $4 billion due to a decline in collateral placed, partially offset by an increase in interbank lending due to seasonal trends;
§ derivative financial instruments (assets) increased $13 billion primarily due to cross currency swaps hedging our offshore borrowings, which were impacted by principal resets following exchange rate movements;
§ trading securities, other financial assets designated at fair value and available-for-sale securities increased $13 billion primarily in holdings of Government, Semi-Government and bank securities and was largely an increase in liquid asset holdings;
§ loans increased $19 billion primarily due to growth in Australian loans of $15.1 billion and New Zealand loans of $2.4 billion. In Australia, an increase of $16.8 billion or 6% in Australian housing loans was partially offset by a decrease in Australian business lending of $1.8 billion or 1% and a decrease in Australian margin lending of $669 million or 19%;
§ life insurance assets decreased $4 billion through a successor funds transfer, BTFG transferred certain superannuation funds out of life companies into separately managed super funds, which are not consolidated. A corresponding change occurred in life insurance liabilities; and
§ other assets increased $3 billion primarily due to securities trading activities in WIB.
Liabilities and equity – 2011 v 2010
The key movements in liabilities and equity are outlined below:
§ payables due to other financial institutions increased $6 billion primarily due to an increase in collateral received;
§ deposits increased $33 billion primarily as a result of an increase in Australian term deposits of $22.2 billion or 25% as savings rates in Australia increased and the Group’s increased focus on customer deposit raising initiatives. Growth in mortgage offset accounts resulted in an increase in Australian non-interest bearing accounts of $1.5 billion or 12%. Increased overseas deposits of $8 billion reflected growth in corporate customer balances and investors’ preference for certificates of deposit;
§ derivative financial instruments (liabilities) decreased $5 billion due to cross currency swaps liabilities, partially offset by an increase in interest rate swap liabilities due to changes in interest rates;
§ trading liabilities and other financial liabilities designated at fair value increased $5 billion primarily due to securities trading activities in WIB;
§ debt issues and acceptances increased $15 billion due to growth in the wholesale funding portfolio;
§ life insurance liabilities decreased $5 billion through a successor funds transfer, BTFG transferred certain superannuation funds out of life companies into separately managed super funds, which are not consolidated. A corresponding change occurred in life insurance assets;
§ loan capital decreased $1 billion due to the redemption of term subordinated bonds, notes and debentures; and
§ equity attributable to owners of Westpac Banking Corporation increased $4 billion due to an increase in net retained profits after dividend payment and the issuance of shares to satisfy the DRP.
Loan quality 2012 v 2011
| | As at 30 September | |
| | 2012 | | | 2011 | | 2010 | |
| | $m | | | $m | | $m | |
Total gross loans1 | | 518,279 | | | 500,654 | | 482,366 | |
Average gross loans | | | | | | | | |
Australia | | 455,753 | | | 439,165 | | 428,861 | |
New Zealand | | 45,911 | | | 44,279 | | 45,171 | |
Other overseas | | 6,930 | | | 5,228 | | 5,428 | |
Total average gross loans | | 508,594 | | | 488,672 | | 479,460 | |
1 Gross loans are stated before related provisions for impairment.
| | |
90 | 2012 WESTPAC GROUP ANNUAL REPORT | |
REVIEW OF GROUP OPERATIONS |
|
Total gross loans represented 77% of the total assets of the Group as at 30 September 2012, compared to 75% in 2011.
Australia and New Zealand average loans were $501.7 billion in 2012, an increase of $18.3 billion or 4% from $483.4 billion in 2011. This increase was primarily due to growth in Australian housing lending.
Other overseas average loans were $6.9 billion in 2012, an increase of $1.7 billion or 33% from $5.2 billion in 2011.
Approximately 18% of the loans at 30 September 2012 mature within one year and 23% mature between one year and five years. Retail lending comprises the bulk of the loan portfolio maturing after five years.
| | As at 30 September | |
| | 2012 | | | 2011 | | 2010 | | 2009 | | 2008 | |
| | $m | | | $m | | $m | | $m | | $m | |
Impaired loans | | | | | | | | | | | | |
Non-performing loans1: | | | | | | | | | | | | |
Gross | | 4,034 | | | 4,287 | | 4,240 | | 3,526 | | 1,059 | |
Impairment provisions | | (1,463 | ) | | (1,487 | ) | (1,677 | ) | (1,308 | ) | (438 | ) |
Net | | 2,571 | | | 2,800 | | 2,563 | | 2,218 | | 621 | |
Restructured loans: | | | | | | | | | | | | |
Gross | | 153 | | | 129 | | 132 | | 71 | | 6 | |
Impairment provisions | | (44 | ) | | (29 | ) | (32 | ) | (26 | ) | - | |
Net | | 109 | | | 100 | | 100 | | 45 | | 6 | |
Overdrafts, personal loans and revolving credit greater than 90 days past due: | | | | | | | | | | | | |
Gross | | 199 | | | 200 | | 213 | | 173 | | 112 | |
Impairment provisions | | (134 | ) | | (147 | ) | (155 | ) | (148 | ) | (97 | ) |
Net | | 65 | | | 53 | | 58 | | 25 | | 15 | |
Net impaired loans | | 2,745 | | | 2,953 | | 2,721 | | 2,288 | | 642 | |
Provisions for impairment on loans and credit commitments | | | | | | | | | | | | |
Individually assessed provisions | | 1,470 | | | 1,461 | | 1,622 | | 1,228 | | 413 | |
Collectively assessed provisions | | 2,771 | | | 2,953 | | 3,439 | | 3,506 | | 1,761 | |
Total provisions for impairment on loans and credit commitments | | 4,241 | | | 4,414 | | 5,061 | | 4,734 | | 2,174 | |
Loan quality | | | | | | | | | | | | |
Total impairment provisions for impaired loans to total impaired loans2 | | 37.4% | | | 36.0% | | 40.7% | | 39.3% | | 45.4% | |
Total impaired loans to total loans | | 0.85% | | | 0.92% | | 0.95% | | 0.81% | | 0.37% | |
Total provisions for impairment on loans and credit commitments to total loans | | 0.82% | | | 0.88% | | 1.05% | | 1.01% | | 0.69% | |
Total provisions for impairment on loans and credit commitments to total impaired loans | | 96.7% | | | 95.6% | | 110.4% | | 125.6% | | 184.8% | |
Collectively assessed provisions to non-housing performing loans | | 1.6% | | | 1.7% | | 2.0% | | 1.8% | | 1.1% | |
1 Non-performing loans are loans with an impaired internal risk grade, excluding restructured assets.
2 Impairment provisions relating to impaired loans include individually assessed provisions plus the proportion of the collectively assessed provisions that relate to impaired loans. The proportion of the collectively assessed provisions that relate to impaired loans was $171 million as at 30 September 2012 (2011: $202 million, 2010: $244 million, 2009: $254 million, 2008: $121 million). This sum is compared to the total gross impaired loans to determine this ratio.
The quality of our loan portfolio as at 30 September 2012 remains relatively stable, with 76% of our exposure to either investment grade or secured consumer mortgages (2011: 76%, 2010: 74%) and 97% of our exposure in our core markets of Australia, New Zealand and the Pacific region (2011: 98%, 2010: 99%).
Potential problem loans as at 30 September 2012 amounted to $2,115 million, a decrease of 15% from $2,489 million at 30 September 2011. The reduction of potential problem loans is due mainly to the upgrade or repayment of some of these assets. A smaller amount of this movement is due to some of these loans being downgraded to impaired.
Potential problem loans are facilities that are performing and no loss is expected, but the customer demonstrates significant weakness in debt servicing or security cover that could jeopardise repayment of debt on current terms if not rectified. Potential problem loans are identified using established credit frameworks and policies, which includes the ongoing monitoring of facilities through the use of watchlists.
At 30 September 2012, total impaired loans as a percentage of total gross loans were 0.85%, a decrease of 0.07% from 0.92% at 30 September 2011.
| | |
| 2012 WESTPAC GROUP ANNUAL REPORT | 91 |
At 30 September 2012, we had 12 impaired counterparties with exposure greater than $50 million, collectively accounting for 23% of total impaired loans. This compares to 12 impaired counterparties with exposure greater than $50 million in 2011 accounting for 21% of total impaired loans. There were 25 impaired exposures at 30 September 2012 that were less than $50 million and greater than $20 million (2011: 37 impaired exposures).
We believe that Westpac remains appropriately provisioned with total impairment provisions for impaired loans to total impaired loans coverage at 37.4% at 30 September 2012 compared to 36.0% at 30 September 2011. Total provisions for impairment in loans and credit commitments represented 96.7% of total impaired loans as at 30 September 2012, up from 95.6% at 30 September 2011. Total provisions for impairments on loans and credit commitments to total loans was 0.82% at 30 September 2012, down from 0.88% at 30 September 2011 (2010: 1.05%).
Consumer mortgage loans 90 days past due at 30 September 2012 were 0.51% of outstandings, a decrease of 4 basis points from 0.55% of outstandings at 30 September 2011 (2010: 0.47%).
Other consumer loan delinquencies (including credit card and personal loan products) were 1.11% of outstandings as at 30 September 2012, a decrease of 5 basis points from 1.16% of outstandings as at 30 September 2011 (2010: 1.25%).
CAPITAL RESOURCES
Capital management strategy
Westpac’s approach to capital management seeks to balance the fact that capital is an expensive form of funding with the need to be adequately capitalised. Westpac considers the need to balance efficiency, flexibility and adequacy when determining sufficiency of capital and when developing capital management plans.
Westpac evaluates these considerations through an Internal Capital Adequacy Assessment Process (ICAAP), the key features of which include:
§ the development of a capital management strategy including target capital ratios, capital buffers and contingency plans which guide the development of specific capital plans;
§ consideration of both economic and regulatory capital requirements;
§ a process which challenges the capital measures, coverage and requirements, which incorporates a comparison of economic and regulatory requirements and the use of the Quantitative Scenario Analysis (stress testing) framework that considers, amongst other things, the impact of adverse economic scenarios that threaten the achievement of planned outcomes; and
§ consideration of the perspectives of external stakeholders such as regulators, rating agencies and equity and debt investors.
Westpac’s capital ratios are in compliance with APRA minimum capital adequacy requirements.
Basel Capital Accord
The regulatory limits applied to our capital ratios are consistent with the International Convergence of Capital Measurement and Capital Standards: A Revised Framework, also known as Basel II, issued by the Bank of International Settlements. This framework reflects the advanced risk management practices that underpin the calculation of regulatory capital through a broad array of risk classes and advanced measurement processes.
As provided for in the Basel II accord, APRA has exercised discretions to make the framework more relevant in the Australian market, and in particular has required that Australian banks using the most sophisticated models for credit and operational risk to hold regulatory capital for the interest rate risk taken in the banking book. The models used to quantify this risk are similar to the models used for traded market risk. In addition APRA has applied discretion in the calculation of the components of regulatory capital.
Westpac is accredited by APRA to use the AIRB approach for credit risk, the AMA for operational risk and the internal model approach for Interest Rate Risk in the Banking Book (IRRBB). Accreditation to use AIRB and AMA was effective from 1 January 2008, and IRRBB from 1 July 2008. We believe that using the advanced approaches for risk monitoring and measurement is in the interests of all our stakeholders. Effective risk management is regarded as a key activity performed at all levels of the Group. Achieving advanced accreditation from APRA has resulted in a broad array of changes to risk management practices that have been implemented across all risk classes. We recognise that embedding these principles and practices into day-to-day activities of the divisions to achieve the full benefits of these changes is an ongoing facet of risk management.
Changes to Basel II regulations, commonly referred to as ‘Basel 2.5’, relating to securitisation and market risk were implemented from 1 January 2012.
Refer to ‘Significant developments’ in Section 1 for a discussion on future regulatory developments that may impact upon capital requirements.
| | |
92 | 2012 WESTPAC GROUP ANNUAL REPORT | |
REVIEW OF GROUP OPERATIONS
Purchases of equity securities
The following table details share repurchase activity for the year ended 30 September 2012:
| | Total Number of
Ordinary Shares
Purchased | | Average Price Paid
per Ordinary Share
$ | | Total Number of Ordinary
Shares Purchased as Part of
a Publicly Announced
Program | | Maximum Number
(or Approximate $ Value) of Ordinary
Shares that may yet be Purchased
Under the Plans or Programs |
Month | | | | | | | | |
October (2011) | | - | | - | | - | | n/a |
November (2011) | | 2,168 | | 20.82 | | - | | n/a |
December (2011) | | 59,045 | | 20.46 | | - | | n/a |
January (2012) | | - | | - | | - | | n/a |
February (2012) | | - | | - | | - | | n/a |
March (2012) | | - | | - | | - | | n/a |
April (2012) | | 307 | | 22.14 | | - | | n/a |
May (2012) | | - | | - | | - | | n/a |
June (2012) | | 21,407 | | 20.66 | | - | | n/a |
July (2012) | | 349,359 | | 21.05 | | - | | n/a |
August (2012) | | 6,230 | | 24.20 | | - | | n/a |
September (2012) | | 1,419 | | 24.26 | | - | | n/a |
Total | | 439,935 | | 21.01 | | - | | - |
Purchases of ordinary shares during the year were made on market and relate to the following:
§ to deliver to employees upon the exercise of options and performance share rights: 17,440 ordinary shares;
§ treasury shares held by statutory life funds and managed investment schemes and ordinary shares held by Westpac in respect of equity derivatives sold to customers: 31,544 ordinary shares; and
§ to allocate to eligible employees under the Restricted Share Plan (RSP): 390,951 ordinary shares.
Refer to Note 24 to the financial statements for a discussion of treasury share purchases.
COMMITMENTS
Contractual obligations and commitments
In connection with our operating activities we enter into certain contractual obligations and commitments. The following table shows our significant contractual cash obligations as at 30 September 2012:
| | Up to | | Over 1 | | Over 3 | | Over | | | |
| | 1 Year | | to 3 Years | | to 5 Years | | 5 Years | | Total | |
| | $m | | $m | | $m | | $m | | $m | |
On balance sheet long-term debt1 | | 25,544 | | 48,372 | | 31,366 | | 12,698 | | 117,980 | |
Operating leases2 | | 490 | | 826 | | 739 | | 1,708 | | 3,763 | |
Other commitments2 | | 687 | | 1,042 | | 408 | | 64 | | 2,201 | |
Total contractual cash obligations | | 26,721 | | 50,240 | | 32,513 | | 14,470 | | 123,944 | |
1 Refer to Note 22 to the financial statements for details of on balance sheet long-term debt.
2 Refer to Note 34 to the financial statements for details of expenditure commitments.
The above table excludes deposits and other liabilities taken in the normal course of banking business and short-term and undated liabilities.
| | |
| 2012 WESTPAC GROUP ANNUAL REPORT | 93 |
Commercial commitments1
The following table shows our significant commercial commitments as at 30 September 2012:
| | Up to | | Over 1 | | Over 3 | | Over | | | |
| | 1 Year | | to 3 Years | | to 5 Years | | 5 Years | | Total | |
| | $m | | $m | | $m | | $m | | $m | |
Standby letters of credit and financial guarantees | | 1,334 | | 2,160 | | 493 | | 487 | | 4,474 | |
Trade letters of credit | | 2,589 | | - | | - | | - | | 2,589 | |
Non-financial guarantees | | 5,080 | | 1,555 | | 218 | | 2,055 | | 8,908 | |
Commitments to extend credit | | 46,369 | | 39,890 | | 12,492 | | 41,058 | | 139,809 | |
Other commitments | | 36 | | - | | - | | 62 | | 98 | |
Total commercial commitments | | 55,408 | | 43,605 | | 13,203 | | 43,662 | | 155,878 | |
1 The numbers in this table are notional amounts (refer to Note 36 to the financial statements).
| | |
94 | 2012 WESTPAC GROUP ANNUAL REPORT | |
DIVISIONAL PERFORMANCE
DIVISIONAL PERFORMANCE – 2012 v 2011
Our operations comprise three primary customer-facing business divisions:
§ Australian Financial Services (AFS) which incorporates the operations of:
– Westpac Retail & Business Banking, which we refer to as Westpac RBB;
– St.George Banking Group, which we refer to as St.George; and
– BT Financial Group (Australia), which we refer to as BTFG
§ Westpac Institutional Bank, which we refer to as WIB; and
§ Westpac New Zealand.
Other divisions in the Group include Pacific Banking, Group Services, Treasury and Core Support.
The accounting standard AASB 8 Operating Segments requires segment results to be presented on a basis that is consistent with information provided internally to Westpac’s key decision makers. In assessing its financial performance, including divisional results, the Westpac Group uses a measure of performance we refer to as ‘Cash Earnings’. Cash Earnings is not a measure of cash flow or net profit determined on a cash accounting basis, as it includes non-cash items reflected in net profit determined in accordance with A-IFRS. The specific adjustments outlined below include both cash and non-cash items. Cash Earnings, as calculated by Westpac, is viewed as a measure of the level of profit that is generated by ongoing operations and is expected to be available over the long term for distributions to shareholders.
A reconciliation of Cash Earnings to net profit attributable to owners of Westpac Banking Corporation for each business division is set out in Note 32 to the financial statements. To calculate Cash Earnings, Westpac adjusts net profit attributable to owners of Westpac Banking Corporation for the items outlined below. Management believes this allows the Group to more effectively assess performance for the current period against prior periods and to compare performance across business divisions and across peer companies.
Three categories of adjustments are made to statutory results to determine Cash Earnings:
§ material items that key decision makers at the Westpac Group believe do not reflect ongoing operations;
§ items that are not considered when dividends are recommended, such as the amortisation of intangibles, impact of Treasury shares and economic hedging impacts; and
§ accounting reclassifications between individual line items that do not impact statutory results, such as policyholder tax recoveries1.
The discussion of our divisional performance in this section is presented on a Cash Earnings basis unless otherwise stated. Cash Earnings is not directly comparable to statutory results presented in other parts of this Annual Report.
Outlined below are the current Cash Earnings adjustments to the statutory results:
1. Trust Preferred Securities (TPS) revaluations – adjustment for movements in economic hedges, including associated tax effects impacting the Foreign Currency Translation Reserve, relating to hybrid instruments classified as non-controlling interests. The adjustment is required as these hybrid instruments are not fair valued, however, the hedges are fair valued and therefore there is a mismatch in the timing of income recognition in the statutory results. The mismatch is added back to statutory results in deriving Cash Earnings as it does not affect the Group’s profits over time;
2. Treasury shares – under A-IFRS, Westpac shares held by the Group in the managed funds and life business are deemed to be Treasury shares and the results of holding these shares are not permitted to be recognised as income in the statutory results. In deriving Cash Earnings, these results are included to ensure there is no asymmetrical impact on the Group’s profits because the Treasury shares support policyholder liabilities and equity derivative transactions which are re-valued in deriving income;
3. Ineffective hedges – the gain/(loss) on ineffective hedges is reversed in deriving Cash Earnings for the period because the gain or loss arising from the fair value movement in these hedges reverses over time and does not affect the Group’s profits over time;
4. Fair value gain/(loss) on economic hedges (which do not qualify for hedge accounting under A-IFRS) comprises:
– the unrealised fair value gain/(loss) on foreign exchange hedges of future New Zealand earnings impacting non-interest income is reversed in deriving Cash Earnings as they may create a material timing difference on reported earnings but do not affect the Group’s Cash Earnings during the life of the hedge;
1 Policyholder tax recoveries – income and tax amounts that are grossed up to comply with the A-IFRS accounting standard covering life insurance business (policyholder tax recoveries) are reversed in deriving income and taxation expense on a Cash Earnings basis.
| | |
| 2012 WESTPAC GROUP ANNUAL REPORT | 95 |
– the unrealised fair value gain/(loss) on foreign exchange hedges of fees payable for the use of the Government guarantee on foreign denominated wholesale funding is reversed in deriving Cash Earnings as they may create a material timing difference on reported earnings but do not affect the Group’s Cash Earnings during the life of the hedge; and
– the unrealised fair value gain/(loss) on hedges of accrual accounted term funding transactions are reversed in deriving Cash Earnings as they may create a material timing difference on reported earnings but do not affect the Group’s Cash Earnings during the life of the hedge.
5. Gain/(loss) on buyback of Government guaranteed debt – during 2011, the Group bought back some Government guaranteed debt which reduced Government guarantee fees (70 basis points) paid. In undertaking the buybacks, in addition to the 70 basis point fee saving, a cost was incurred reflecting the difference between current interest rates and the rate at which the debt was initially issued. In the statutory result the cost incurred is recognised at the time of the buybacks. In Cash Earnings the cost incurred is being amortised over the original term of the debt that was bought back. The Cash Earnings adjustment gives effect to the timing difference between reported earnings and Cash Earnings;
6. Tax provision – during 2011, the Group increased tax provisions by $70 million in respect of certain existing positions for transactions previously undertaken by the Group. The increase reflected the recent trend of global taxation authorities challenging the historical tax treatment of cross border and complex transactions. This increase in tax provisions was treated as a Cash Earnings adjustment as it related to the global management of historical tax positions and does not reflect ongoing operations. The Group’s management of tax positions has moved to disclosing any such transactions to the taxation authorities at or around the time of execution;
7. Supplier program – during 2012, the Group incurred and provisioned for non-recurring expenses as part of its program to increase the use of global specialists in certain technology and back office operations. These expenses included costs associated with streamlining and better documenting systems and processes, technology costs to enable infrastructure and enhance interaction with suppliers, and costs associated with restructuring the workforce. Given these significant expenses are not considered in determining dividends, they are being treated as Cash Earnings adjustments;
8. Amortisation of intangible assets – the acquisition of J O Hambro, previously a privately owned London-based equity investment manager, by BT Investment Management (BTIM) during 2012 resulted in the recognition of management contract intangible assets. These intangible items are amortised over their useful lives, ranging between five and twenty years. The amortisation of intangible assets (excluding capitalised software) is a Cash Earnings adjustment because it is a non-cash flow item and does not affect cash distributions available to shareholders;
9. Litigation provision – the Group recognised a provision of $111 million ($78 million after tax) with respect to longstanding legal proceedings. This has been treated as a Cash Earnings adjustment due to its size, the historical nature of the proceedings and it does not reflect ongoing operations;
10. St.George merger related Cash Earnings adjustments:
– as part of the merger with St.George, transaction and integration expenses incurred over three years following the merger were treated as a Cash Earnings adjustment as they did not impact the earnings expected from St.George following the integration period. The integration project was completed in 2011;
– amortisation of intangible assets – the merger with St.George resulted in the recognition of core deposit intangibles and customer relationships intangible assets that are amortised over their useful lives, ranging between five and nine years. The amortisation of intangible assets (excluding capitalised software) is a Cash Earnings adjustment because it is a non-cash flow item and does not affect cash distributions available to shareholders;
– the accounting for the merger with St.George resulted in the recognition of fair value adjustments on the St.George retail bank loans, deposits, wholesale funding and associated hedges, with these fair value adjustments being amortised over the life of the underlying transactions. The amortisation of these adjustments is considered to be a timing difference relating to non-cash flow items that do not affect cash distributions available to shareholders and therefore have been treated as a Cash Earnings adjustment;
– tax consolidation adjustment – finalisation of tax consolidation related to the merger with St.George gave rise to a reduction in income tax expense of $1,110 million during 2011 and $685 million during 2010. The tax consolidation process required Westpac to reset the tax value of certain St.George assets to the appropriate market value of those assets at the effective date of the tax consolidation (31 March 2009). These adjustments have been treated as a Cash Earnings adjustment due to their size and because they do not reflect ongoing operations; and
– TOFA tax consolidation adjustment – new legislation that included retrospective amendments to the income tax law as it applies to TOFA and tax consolidated groups was introduced during 2012. The amendments have an adverse application to certain liabilities that were consolidated as part of the merger with St.George. This gave rise to an additional income tax expense of $165 million for 2012. Consistent with other tax adjustments relating to the merger with St.George this adjustment has been treated as a Cash Earnings adjustment due to its size and because it does not reflect ongoing operations.
| | |
96 | 2012 WESTPAC GROUP ANNUAL REPORT | |
DIVISIONAL PERFORMANCE
Organisational Changes
During 2012 the Group updated its approach on how capital is allocated and how transfer pricing is determined.
These new models have been designed to better align the Group’s economic capital and pricing approaches to the new regulatory requirements, especially minimum prudential capital and liquidity requirements. The models also take into account the changed funding markets, especially higher marginal deposits and term wholesale funding costs.
During 2012 the Group also transferred management responsibility for:
§ the equities business from WIB to BTFG;
§ RAMS from Westpac RBB to St.George; and
§ the New Zealand Institutional banking business from WIB to Westpac New Zealand. For further details, please refer to ‘New Zealand’ in Section 1 under ‘Significant developments’.
Results have been prepared on the basis that transfers and methodology changes took place on 1 October 2009. Comparatives have been restated accordingly.
Cash Earnings and assets by division
The following tables present, for each of the key divisions of our business, the Cash Earnings and total assets at the end of the financial years ended 30 September 2012, 2011 and 2010. Refer to Note 32 to the financial statements for the disclosure of our geographic and business segments and the reconciliation to net profit attributable to owners of Westpac Banking Corporation.
Cash Earnings by business division
| | Years Ended 30 September | |
| | 2012 | | 2011 | | 2010 | |
| | $m | | $m | | $m | |
Australian Financial Services | | | | | | | | |
Westpac Retail & Business Banking | | 2,114 | | | 1,850 | | 1,729 | |
St.George Banking Group | | 1,231 | | | 1,233 | | 1,067 | |
BT Financial Group (Australia) | | 653 | | | 729 | | 693 | |
Westpac Institutional Bank | | 1,473 | | | 1,427 | | 1,383 | |
Westpac New Zealand | | 548 | | | 442 | | 356 | |
Other divisions | | 579 | | | 620 | | 651 | |
Total Cash Earnings | | 6,598 | | | 6,301 | | 5,879 | |
Total assets by business division
| | As at 30 September | |
| | 2012 | | 2011 | | 2010 | |
| | $bn | | $bn | | $bn | |
Australian Financial Services | | | | | | | | |
Westpac Retail & Business Banking | | 255 | | | 247 | | 232 | |
St.George Banking Group | | 155 | | | 150 | | 146 | |
BT Financial Group (Australia) | | 27 | | | 26 | | 32 | |
Westpac Institutional Bank | | 98 | | | 101 | | 88 | |
Westpac New Zealand | | 49 | | | 46 | | 46 | |
Other divisions | | 91 | | | 100 | | 74 | |
Total assets | | 675 | | | 670 | | 618 | |
In presenting divisional results on a management reporting basis, internal charges and transfer pricing adjustments are included in the performance of each business reflecting our management structure rather than a legal one. (These results cannot be compared to results for individual legal entities.) Where management reporting structures or accounting classifications have changed, comparatives have been revised and may differ from results previously reported.
Our internal transfer pricing framework attributes value between divisions. Its primary attributes are:
§ Treasury funding – product balances are transfer-priced at interbank rates according to the tenor of the underlying transactions;
§ overhead costs are allocated to revenue generating businesses; and
§ capital charges are allocated to business groups based upon designated risk factors.
| | |
| 2012 WESTPAC GROUP ANNUAL REPORT | 97 |
AUSTRALIAN FINANCIAL SERVICES
Australian Financial Services (AFS) is responsible for the Westpac Group’s Australian retail banking, business banking and wealth operations. It incorporates the operations of Westpac Retail & Business Banking (Westpac RBB), St.George Banking Group (St.George) and BT Financial Group (Australia) (BTFG). AFS also includes the product and risk responsibilities for Australian Banking.
Performance of AFS
| | 2012 | | | 2011 | | 2010 | |
| | $m | | | $m | | $m | |
Net interest income | | 8,694 | | | 8,534 | | 8,175 | |
Non-interest income | | 3,399 | | | 3,253 | | 3,155 | |
Net operating income before operating expenses and impairment charges | | 12,093 | | | 11,787 | | 11,330 | |
Operating expenses | | (5,553 | ) | | (5,415 | ) | (5,254 | ) |
Impairment charges | | (863 | ) | | (936 | ) | (1,087 | ) |
Profit before income tax | | 5,677 | | | 5,436 | | 4,989 | |
Income tax expense | | (1,671 | ) | | (1,617 | ) | (1,492 | ) |
Profit attributable to non-controlling interests | | (8 | ) | | (7 | ) | (8 | ) |
Cash Earnings for the year | | 3,998 | | | 3,812 | | 3,489 | |
Net Cash Earnings adjustments | | (151 | ) | | (146 | ) | (146 | ) |
Net profit attributable to owners of Westpac Banking Corporation | | 3,847 | | | 3,666 | | 3,343 | |
| | $bn | | | $bn | | $bn | |
Deposits | | 239.3 | | | 214.3 | | 196.1 | |
Loans | | 412.0 | | | 398.5 | | 380.5 | |
Total assets | | 436.8 | | | 422.8 | | 409.4 | |
Total operating expenses to net operating income ratio | | 45.9 | % | | 45.9 | % | 46.4 | % |
| | |
98 | 2012 WESTPAC GROUP ANNUAL REPORT | |
DIVISIONAL PERFORMANCE
WESTPAC RETAIL & BUSINESS BANKING
Westpac Retail & Business Banking (Westpac RBB) is responsible for sales and service for our consumer, small-to-medium enterprise (SME) customers and commercial customers (typically with turnover of up to $100 million) in Australia under the Westpac brand.
Activities are conducted through Westpac RBB’s network of branches and business banking centres and specialised consumer and business relationship managers, with the support of cash flow, financial markets and wealth specialists, customer service centres, ATMs and internet and mobile channels.
Performance of Westpac RBB
| | 2012 | | | 2011 | | 2010 | |
| | $m | | | $m | | $m | |
Net interest income | | 5,304 | | | 5,166 | | 5,052 | |
Non-interest income | | 1,184 | | | 1,091 | | 1,009 | |
Net operating income before operating expenses and impairment charges | | 6,488 | | | 6,257 | | 6,061 | |
Operating expenses | | (3,079 | ) | | (3,087 | ) | (2,999 | ) |
Impairment charges | | (429 | ) | | (547 | ) | (587 | ) |
Profit before income tax | | 2,980 | | | 2,623 | | 2,475 | |
Income tax expense | | (866 | ) | | (773 | ) | (746 | ) |
Cash Earnings for the year | | 2,114 | | | 1,850 | | 1,729 | |
Net Cash Earnings adjustments | | - | | | - | | - | |
Net profit attributable to owners of Westpac Banking Corporation | | 2,114 | | | 1,850 | | 1,729 | |
| | $bn | | | $bn | | $bn | |
Deposits | | 138.5 | | | 125.1 | | 114.5 | |
Loans | | 250.3 | | | 242.1 | | 227.4 | |
Total assets | | 255.3 | | | 247.0 | | 231.7 | |
Total operating expenses to net operating income ratio | | 47.5 | % | | 49.3 | % | 49.5 | % |
2012 v 2011
Westpac RBB Cash Earnings were $2,114 million in 2012, an increase of $264 million or 14% compared to 2011.
Net interest income increased by $138 million or 3% compared to 2011. This was driven by an increase in interest-earning assets partly offset by a decline in margins. Features of this result included:
§ loans increased by $8.2 billion or 3% compared to 2011, primarily due to:
– an increase in mortgages of $6.5 billion or 3% compared to 2011 which accounted for the majority of lending growth;
– an increase in business lending of $1.7 billion or 4% compared to 2011 with most of the growth in term lending to commercial and SME customers; and
– other consumer lending increased $0.1 million or 1% compared to 2011.
§ deposits increased by $13.4 billion or 11% compared to 2011, primarily due to:
– an increase in term deposits of $7.4 billion or 14% compared to 2011; and
– an increase in other deposits of $6.0 billion or 8% driven by growth in consumer and business deposits, partly offset by a decline in online deposits as the business chose not to match some of the more aggressive market pricing.
§ margins reduced by 3 basis points to 2.23% in 2012 compared to 2.26% in 2011, primarily due to:
– higher funding costs as the costs of deposits increased, particularly term deposits, and product mix impacts with growth occurring in the higher interest rate term deposits; partially offset by
– increased lending spreads (up 17 basis points), mostly from the repricing of mortgages and business loans to better reflect higher funding costs.
Non-interest income increased by $93 million or 9% compared to 2011, primarily due to:
§ an increase in business lending fees, which have continued to be repriced to more appropriately reflect the cost of providing business facilities; and
§ a rise in financial markets income related to customers managing interest rate risk.
| | |
| 2012 WESTPAC GROUP ANNUAL REPORT | 99 |
Operating expenses decreased $8 million compared to 2011, primarily due to:
§ productivity gains from the implementation of new banking platforms streamlining activity;
§ a divisional restructure which reduced duplication and improved coordination in back office and technology business units;
§ lower credit growth and improved productivity has reduced the need for resources supporting housing lending; and
§ disciplined management across all variable costs; offset by
§ normal salary increases processed in January and a rise in investment related spending, particularly amortisation of technology investments.
Impairment charges decreased $118 million or 22% compared to 2011, primarily due to:
§ lower consumer impairment charges of $89 million due to a reduction in both mortgage 90+ day delinquencies and other consumer delinquencies driven by cautionary consumer behaviour; and
§ lower business impairments of $29 million due to lower stressed assets.
For a discussion of the results of Westpac RBB for 2011 v 2010, refer to ‘Divisional performance – 2011 v 2010’.
| | |
100 | 2012 WESTPAC GROUP ANNUAL REPORT | |
ST.GEORGE BANKING GROUP
St.George Banking Group (St.George) is responsible for sales and service for consumer, business and corporate customers in Australia under the St.George, BankSA, Bank of Melbourne and RAMS brands. RAMS is a financial services group specialising in mortgages and online deposits.
Consumer activities are conducted through a network of branches, third party distributors, call centres, ATMs, EFTPOS terminals and internet banking services.
Business and corporate customers (businesses with facilities typically up to $150 million) are provided with a wide range of banking and financial products and services including specialist advice for cash flow finance, trade finance, automotive and equipment finance, property finance, transaction banking and treasury services. Sales and service activities for business and corporate customers are conducted by relationship managers via business banking centres, internet and customer service centre channels.
Performance of St.George
| | 2012 | | | 2011 | | 2010 | |
| | $m | | | $m | | $m | |
Net interest income | | 2,966 | | | 2,930 | | 2,747 | |
Non-interest income | | 565 | | | 549 | | 577 | |
Net operating income before operating expenses and impairment charges | | 3,531 | | | 3,479 | | 3,324 | |
Operating expenses | | (1,341 | ) | | (1,323 | ) | (1,288 | ) |
Impairment charges | | (433 | ) | | (393 | ) | (513 | ) |
Profit before income tax | | 1,757 | | | 1,763 | | 1,523 | |
Income tax expense | | (526 | ) | | (530 | ) | (456 | ) |
Cash Earnings for the year | | 1,231 | | | 1,233 | | 1,067 | |
Net Cash Earnings adjustments | | (129 | ) | | (129 | ) | (129 | ) |
Net profit attributable to owners of Westpac Banking Corporation | | 1,102 | | | 1,104 | | 938 | |
| | | | | | | | |
| | $bn | | | $bn | | $bn | |
Deposits | | 80.9 | | | 70.8 | | 65.6 | |
Loans | | 147.6 | | | 142.0 | | 138.5 | |
Total assets | | 154.6 | | | 149.6 | | 146.0 | |
Total operating expenses to net operating income ratio | | 38.0 | % | | 38.0 | % | 38.7 | % |
2012 v 2011
St.George Cash Earnings were $1,231 million in 2012, a decrease of $2 million compared to 2011.
Net interest income increased $36 million or 1% compared to 2011. This was driven by an increase in interest-earning assets, partially offset by a decrease in margins. Features of this result included:
§ loans increased $5.6 billion or 4% compared to 2011 primarily due to:
– an increase in mortgages of $5.1 billion or 5% compared to 2011 which accounted for the majority of loan growth;
– a decrease in business lending of $0.3 billion or 1% compared to 2011 from lower commercial property lending; and
– other consumer lending increased $0.8 billion or 13% compared to 2011 due to growth in fixed term personal loans and a modest rise in credit card balances.
§ deposits increased $10.1 billion or 14% compared to 2011, primarily due to:
– an increase in term deposits of $6.5 billion or 19% compared to 2011, sourced evenly from consumer and business customers; and
– other deposits increased $3.6 billion or 10% compared to 2011 driven by growth in consumer online savings products.
§ a decrease in margins of 3 basis points compared to 2011, driven by:
– higher funding costs as the costs of deposits increased, particularly term deposits, and product mix impacts with growth occurring in the higher interest rate term deposits; partially offset by
– increased lending spreads (up 22 basis points), mostly from the repricing of mortgages and, to a lesser extent, business lending to better reflect increased funding costs.
Non-interest income increased $16 million or 3% compared to 2011, driven by:
§ higher foreign exchange and interest rate risk management products income; and
§ increased income share from higher home and contents insurance cross sell.
2012 WESTPAC GROUP ANNUAL REPORT | 101 |
Operating expenses increased $18 million or 1% compared to 2011, primarily due to:
§ costs associated with the investment in Bank of Melbourne including increased employees, higher lease costs and higher depreciation and amortisation; partially offset by
§ lower professional services costs associated with the design and launch of Bank of Melbourne; and
§ productivity initiatives and control of variable expenses.
Impairment charges increased $40 million or 10% compared to 2011 due to:
§ higher consumer impairment charges up $5 million, due to an increase in both mortgage 90+ day delinquencies and other consumer delinquencies; and
§ higher business impairments of $35 million mostly due to higher collective provisioning charges, offsetting falls in individual impairments.
For a discussion of the results of St.George Banking Group for 2011 v 2010, refer to ‘Divisional performance – 2011 v 2010’.
102 | 2012 WESTPAC GROUP ANNUAL REPORT | |
BT FINANCIAL GROUP (AUSTRALIA)
BT Financial Group (Australia) (BTFG) is Westpac’s Australian wealth management division.
BTFG’s funds management operations include the manufacturing and distribution of investment, superannuation and retirement products, investment platforms such as Wrap and Master Trusts, private banking, financial planning as well as margin lending and broking. BTFG’s insurance solutions cover the manufacturing and distribution of life, general and lenders mortgage insurance.
BTFG’s brands include Advance Asset Management, Ascalon, Asgard, BT, BT Investment Management (64.5% owned by the Westpac Group and consolidated in BTFG’s Funds Management business), Licensee Select, Magnitude, BT Select, Securitor, and the Advice, Private Banking and Insurance operations of Bank of Melbourne, BankSA, St.George and Westpac.
Performance of BTFG
| | 2012 | | | 2011 | | 2010 | |
| | $m | | | $m | | $m | |
Net interest income | | 424 | | | 438 | | 376 | |
Non-interest income | | 1,650 | | | 1,613 | | 1,569 | |
Net operating income before operating expenses and impairment charges | | 2,074 | | | 2,051 | | 1,945 | |
Operating expenses | | (1,133 | ) | | (1,005 | ) | (967 | ) |
Impairment charges | | (1 | ) | | 4 | | 13 | |
Profit before income tax | | 940 | | | 1,050 | | 991 | |
Income tax expense | | (279 | ) | | (314 | ) | (290 | ) |
Profit attributable to non-controlling interests | | (8 | ) | | (7 | ) | (8 | ) |
Cash Earnings for the year | | 653 | | | 729 | | 693 | |
Net Cash Earnings adjustments | | (22 | ) | | (17 | ) | (17 | ) |
Net profit attributable to owners of Westpac Banking Corporation | | 631 | | | 712 | | 676 | |
| | | | | | | | |
| | $bn | | | $bn | | $bn | |
Deposits | | 19.9 | | | 18.4 | | 16.0 | |
Loans | | 14.1 | | | 14.4 | | 14.6 | |
Total assets | | 26.9 | | | 26.2 | | 31.7 | |
Funds under management | | 56.5 | | | 41.4 | | 42.5 | |
Funds under administration | | 87.9 | | | 77.4 | | 79.9 | |
Total operating expenses to net operating income ratio | | 54.6 | % | | 49.0 | % | 49.7 | % |
2012 v 2011
BTFG Cash Earnings were $653 million in 2012, a decrease of $76 million or 10% compared to 2011.
Net interest income decreased $14 million or 3% compared to 2011, primarily due to:
§ a $25 million reduction, mostly from lower margin lending balances (down $16 million) and lower revenue from structured product sales (down $6 million); partially offset by
§ increased loan and deposit balances with mortgage margin improvement, offset by deposit margin compression.
Non-interest income increased $37 million or 2% compared to 2011 due to:
§ an increase in life insurance revenue with net earned premiums increasing 15%, reflecting new business following the expansion of distribution to the Independent Financial Advisor market;
§ an increase in general insurance revenue due to increased sales, repricing and reduced claims; partially offset by
§ a reduction in funds management income due to:
– a decrease in FUM income, primarily due to:
– increase in average FUM of 20%, driven by the acquisition of J O Hambro; offset by
– lower margins reflecting a change in product mix; and
– weaker asset markets.
– an increase in FUA income, driven by:
– average FUA increase of 3% compared to 2011, predominantly by flows and the transfer of the Westpac Group staff superannuation fund; and
– higher FUA margins from product repricing; offset by
– weaker asset markets; and
2012 WESTPAC GROUP ANNUAL REPORT | 103 |
§ a decrease in lenders mortgage insurance income due to lower credit demand and the decision to reduce underwriting risk on loans with LVR greater than 90%.
Operating expenses increased $128 million or 13% compared to 2011, primarily due to:
§ the full impact of the J O Hambro acquisition of $38 million;
§ expansion of the distribution network and development costs of the next generation funds platform of $29 million;
§ increased salaries and other sales related costs; and
§ increased compliance and regulatory costs.
Impairment charges increased $5 million due to a lower benefit from write-backs and recoveries of impaired loans.
For a discussion of the results of BTFG for 2011 v 2010, refer to ‘Divisional performance – 2011 v 2010’.
104 | 2012 WESTPAC GROUP ANNUAL REPORT | |
WESTPAC INSTITUTIONAL BANK
Westpac Institutional Bank (WIB) delivers a broad range of financial services to commercial, corporate, institutional and government customers with connections to Australia and New Zealand.
WIB operates through dedicated industry relationship and specialist product teams, with expert knowledge in transactional banking, financial and debt capital markets, specialised capital, and alternative investment solutions.
Customers are supported through branches and subsidiaries located in Australia, New Zealand, US, UK and Asia.
Performance of WIB
| | 2012 | | | 2011 | | 2010 | |
| | $m | | | $m | | $m | |
Net interest income | | 1,706 | | | 1,700 | | 1,616 | |
Non-interest income | | 1,484 | | | 1,182 | | 1,400 | |
Net operating income before operating expenses and impairment charges | | 3,190 | | | 2,882 | | 3,016 | |
Operating expenses | | (987 | ) | | (938 | ) | (917 | ) |
Impairment charges | | (127 | ) | | 90 | | (150 | ) |
Profit before income tax | | 2,076 | | | 2,034 | | 1,949 | |
Income tax expense | | (603 | ) | | (607 | ) | (566 | ) |
Cash Earnings for the year | | 1,473 | | | 1,427 | | 1,383 | |
Net Cash Earnings adjustments | | - | | | - | | - | |
Net profit attributable to owners of Westpac Banking Corporation | | 1,473 | | | 1,427 | | 1,383 | |
| | | | | | | | |
| | $bn | | | $bn | | $bn | |
Deposits | | 64.5 | | | 48.3 | | 43.6 | |
Loans | | 53.9 | | | 51.8 | | 52.9 | |
Total assets | | 97.8 | | | 101.5 | | 88.3 | |
Total operating expenses to net operating income ratio | | 30.9 | % | | 32.5 | % | 30.4 | % |
2012 v 2011
WIB Cash Earnings were $1,473 million in 2012, an increase of $46 million or 3% compared to 2011.
Net interest income increased $6 million compared to 2011. The result reflected an increase in interest-earning assets of $3 billion or 5%, offset by an 11 basis point decline in margins. Features of this result included:
§ loans increased $2 billion due to an increase in business lending and trade finance from both demand and increased resources devoted to this sector, particularly in Asia;
§ deposits increased $16 billion or 34% compared to 2011 from both a more concerted focus on transaction business and a preference of corporates to remain highly liquid; and
§ margins decreased 11 basis points to 2.49% primarily due to lower Markets income recorded as net interest income and increased competition for lending.
Non-interest income increased $302 million or 26% compared to 2011, primarily due to:
§ growth in markets income from both improved customer flows and a stronger risk management performance;
§ a $130 million increase in revenue from Hastings including the impact from corporate activity in the division’s listed funds; partially offset by
§ credit valuation adjustment was a charge of $58 million in 2012 compared with a $16 million benefit in 2011.
Operating expenses increased $49 million or 5% compared to 2011, primarily due to higher FTE and increased technology costs associated with the division’s expansion in Asia, which was partially offset by controlled variable expenses.
Asset quality improved over the year although the rate of reduction in stressed assets has slowed. There were top-ups to provisions on existing stressed and impaired assets and downgrades to companies experiencing pressure from the high Australian dollar and soft consumer spending. This led to a $127 million impairment charge in 2012 compared to an impairment benefit of $90 million in 2011.
For a discussion of the results of WIB for 2011 v 2010, refer to ‘Divisional performance – 2011 v 2010’.
2012 WESTPAC GROUP ANNUAL REPORT | 105 |
WESTPAC NEW ZEALAND
Westpac New Zealand is responsible for sales and service of banking, wealth and insurance products for consumers, business and institutional customers in New Zealand.
Westpac conducts its New Zealand banking business through two banks in New Zealand: Westpac New Zealand Limited, which is incorporated in New Zealand and Westpac Banking Corporation (NZ Division), a branch of Westpac, which is incorporated in Australia.
The division operates via an extensive network of branches and ATMs across both the North and South Islands. Business and institutional customers are also served through relationship and specialist product teams. Banking products are provided under the Westpac and WIB brands while insurance and wealth products are provided under Westpac Life and BT brands respectively.
Performance of Westpac New Zealand
| | 2012 | | | 2011 | | 2010 | |
| | $m | | | $m | | $m | |
Net interest income | | 1,224 | | | 1,137 | | 1,090 | |
Non-interest income | | 336 | | | 304 | | 302 | |
Net operating income before operating expenses and impairment charges | | 1,560 | | | 1,441 | | 1,392 | |
Operating expenses | | (653 | ) | | (627 | ) | (612 | ) |
Impairment charges | | (148 | ) | | (185 | ) | (274 | ) |
Profit before income tax | | 759 | | | 629 | | 506 | |
Income tax expense | | (208 | ) | | (184 | ) | (148 | ) |
Profit attributable to non-controlling interests | | (3 | ) | | (3 | ) | (2 | ) |
Cash Earnings for the year | | 548 | | | 442 | | 356 | |
Net Cash Earnings adjustments | | - | | | - | | - | |
Net profit attributable to owners of Westpac Banking Corporation | | 548 | | | 442 | | 356 | |
| | | | | | | | |
| | $bn | | | $bn | | $bn | |
Deposits | | 33.5 | | | 29.8 | | 27.4 | |
Loans | | 47.4 | | | 45.2 | | 43.0 | |
Total assets | | 48.6 | | | 46.3 | | 45.6 | |
Funds under management | | 2.9 | | | 2.1 | | 1.7 | |
Total operating expenses to net operating income ratio | | 41.9 | % | | 43.5 | % | 44.0 | % |
2012 v 2011
Westpac New Zealand Cash Earnings were $548 million in 2012, an increase of $106 million or 24% compared to 2011.
Net interest income increased $87 million or 8% compared to 2011, primarily due to:
§ loans increased by $2.2 billion or 5% compared to 2011, primarily due to an increase in mortgages of $1.2 billion and business and institutional lending of $0.9 billion;
§ deposits increased $3.7 billion, primarily due to:
– term deposits increased $2.1 billion or 13% and other deposits increased $1.6 billion or 12% driven by growth in consumer online savings and business transaction accounts.
§ an increase in margins of 8 basis points to 2.72% compared to 2.64% in 2011, primarily due to improved mortgage and business lending spreads.
Non-interest income increased $32 million or 11% compared to 2011 driven by:
§ improved cross sell contributing to insurance premium growth, and increased wealth fee income; and
§ increased business and institutional fees.
Operating expenses increased $26 million or 4% compared to 2011, primarily due to:
§ annual salary increases and higher occupancy costs associated with adding six branches to the network in 2011; and
§ higher technology costs from both investment and volume driven demand; offset by
§ productivity initiatives contributing to lower average FTE and lower costs associated with the completion of the transfer of the New Zealand institutional business from WIB to Westpac New Zealand.
106 | 2012 WESTPAC GROUP ANNUAL REPORT | |
Impairment charges decreased $37 million or 20% compared to 2011 due to lower consumer delinquencies and a fall in individually assessed provisions, partially offset by a small number of pre-2007 exposures requiring an increase in the amount of impairment provisions.
A change in the corporate tax rate from 30% to 28% effective from 1 October 2011 contributed to a reduction in the division’s tax rate in 2012.
For a discussion of the results of Westpac New Zealand for 2011 v 2010, refer to ‘Divisional performance – 2011 v 2010’.
2012 WESTPAC GROUP ANNUAL REPORT | 107 |
OTHER DIVISIONS
Other divisions comprise:
Pacific Banking
Pacific Banking provides banking services for retail and business customers in seven Pacific Island Nations. Branches, ATMs, telephone banking and internet banking channels are used to deliver business activities in Fiji, Papua New Guinea (PNG), Vanuatu, Cook Islands, Tonga, Solomon Islands and Samoa. Pacific Banking’s financial products include personal savings, business transactional accounts, personal and business lending products, business services and a range of international products.
Group Services
Group Services encompasses technology, banking operations, legal and property services.
Treasury
Treasury is primarily focused on the management of the Group’s interest rate risk and funding requirements by managing the mismatch between Group assets and liabilities. Treasury’s earnings are primarily impacted by the hedging decisions taken on behalf of the Group to manage net interest income outcomes and assist net interest income growth.
Core Support
Core Support comprises those functions performed centrally, including finance, risk and human resources.
Core Support includes earnings on capital not allocated to divisions, accounting entries for certain intra-group transactions that facilitate the presentation of the performance of our operating segments, earnings from non core asset sales and certain other head office items such as centrally raised provisions.
Performance of Other divisions
| | 2012 | | | 2011 | | 2010 | |
| | $m | | | $m | | $m | |
Net interest income | | 939 | | | 798 | | 974 | |
Non-interest income | | 294 | | | 215 | | 198 | |
Net operating income before operating expenses and impairment charges | | 1,233 | | | 1,013 | | 1,172 | |
Operating expenses | | (186 | ) | | (126 | ) | (189 | ) |
Impairment charges | | (74 | ) | | 38 | | 55 | |
Profit before income tax | | 973 | | | 925 | | 1,038 | |
Income tax expense | | (336 | ) | | (247 | ) | (331 | ) |
Profit attributable to non-controlling interests | | (58 | ) | | (58 | ) | (56 | ) |
Cash Earnings for the year | | 579 | | | 620 | | 651 | |
Net Cash Earnings adjustments | | (477 | ) | | 836 | | 613 | |
Net profit attributable to owners of Westpac Banking Corporation | | 102 | | | 1,456 | | 1,264 | |
2012 v 2011
Other divisions’ Cash Earnings were $579 million in 2012, a decrease of $41 million or 7% compared to 2011.
Net interest income increased by $141 million or 18% compared to 2011 primarily from improved Treasury income.
Non-interest income increased by $79 million or 37% primarily due to:
§ higher research and development tax credits;
§ higher foreign exchange volumes and improved market spreads in Pacific Banking; and
§ higher fee income from net customer growth of approximately 68,000 to over 361,000 in Pacific Banking.
Operating expenses increased by $60 million or 48% primarily due to higher restructuring expenses and employee provisions.
The increase in impairments of $112 million reflected an increase in economic overlay provisions whereas 2011 benefited from a release.
The increase in the effective tax rate from 26.7% in 2011 to 34.5% in 2012 reflects the tax benefit in 2011 from the release of excess tax provisions.
For a discussion of the results of this division for 2011 v 2010, refer to ‘Divisional performance – 2011 v 2010’.
108 | 2012 WESTPAC GROUP ANNUAL REPORT | |
DIVISIONAL PERFORMANCE – 2011 V 2010
Westpac Retail & Business Banking
2011 v 2010
Westpac RBB Cash Earnings were $1,850 million in 2011, an increase of $121 million or 7% compared to 2010.
The result was driven by net interest income growth of 2%, non-interest income growth of 8%, and productivity initiatives holding expense growth to 3%. Impairment charges on loans were also lower, down 7%.
Net interest income increased by $114 million or 2% compared to 2010. The increase was driven by an increase in interest earning assets, partially offset by a reduction in margins. Features of this result included:
§ margins reduced by 11 basis points to 2.26% in 2011 compared to 2.37% in 2010, primarily due to:
– the carry forward of margins decline in 2010;
– higher retail funding costs as the cost of deposits increased, particularly in online accounts and mix impacts with most new growth occurring in higher interest rate term deposits; and
– higher wholesale funding costs; partially offset by
– the repricing of lending, mostly mortgages, which occurred in November 2010.
§ loans increased by $14.7 billion or 6% compared to 2010, primarily due to:
– an increase in mortgages of $12.9 billion or 7% compared to 2010 which accounted for the majority of lending growth and which was above banking system1 growth of 6.7%. 60% of mortgages were written through the proprietary network; and
– an increase in business lending of $2.2 billion or 5% compared to 2010. Most of the business growth was in term lending to SME and commercial customers, supported by the investment in business bankers in local markets in prior periods; partially offset by
– a decrease in other consumer lending of $0.4 billion or 4% due to the run-off of low rate card balances.
§ deposits increased by $10.6 billion or 9% compared to 2010, primarily due to:
– an increase in term deposits of $9.1 billion or 21% compared to 2010. Term deposits now represent 41% of total deposits; and
– an increase in other deposits (online/saving/transaction) of $1.5 billion or 2%.
Non-interest income increased by $82 million or 8% compared to 2010, primarily due to:
§ strong growth in business line fees following the repricing of those fees; and
§ higher wealth advice fees over the year, reflecting an increased focus on referrals and cross sell.
Operating expenses increased by $88 million or 3% compared to 2010, primarily due to:
1 APRA system growth, 12 months to 30 September 2011.
§ higher project costs and general salary increases of 4.3%, partially offset by efficiency initiatives commenced in early 2011; and
§ higher advertising spending due to the launch of the ‘First Bank’ branding campaigns in Australia, along with the spring home loan initiatives in the second half of 2011.
Impairment charges on loans decreased by $40 million or 7% compared to 2010 due to:
§ an improvement in performance of the business portfolio; and
§ consumer performance which was broadly stable in 2011, with a reduction in other consumer delinquencies offset by higher mortgage 90 day delinquencies.
The effective tax rate of 29.5% was lower for 2011 compared to 30.1% in 2010 after clarity was received on the deductibility of certain expenses incurred in prior periods.
Westpac Institutional Bank
2011 v 2010
WIB Cash Earnings were $1,427 million in 2011, an increase of $44 million or 3% compared to 2010.
The result was driven by higher net interest income (up 5% compared to 2010), partially offset by lower non-interest income (down 16% compared to 2010), impairment benefits of $90 million and a 2% increase in operating expenses compared to 2010.
In 2011 WIB delivered a sound result in Global Transactional Services and in FX and Commodity, Carbon and Energy trading (CCE), where customers sought to manage their exposure to market volatility. The European sovereign debt crisis and the US debt concerns have created significant uncertainty and contributed to softer overall markets performance and lower equities broking volumes. Hastings’ performance fees were also lower. Lending and debt market activity remained subdued.
Net interest income increased by $84 million or 5% compared to 2010, primarily due to:
§ an increase in margins of 39 basis points due to increased risk pricing across the book, the early amortisation of establishment fees and interest recoveries for impaired facilities; partially offset by
§ a decrease in lending of $1.1 billion or 2% compared to 2010, with the de-gearing of institutions particularly prevalent in the first quarter of 2011. Margin lending balances were also significantly lower for 2011; and
§ an increase in deposits of $4.7 billion or 11% compared to 2010, with transaction accounts increasing by around $1 billion and term deposits rising by around $2.9 billion.
Non-interest income decreased by $218 million or 16% compared to 2010 driven by:
§ lower markets income from debt markets and equities; and
§ asset sales in 2010 totalling $46 million that were not repeated in 2011; partially offset by
§ an improved contribution from FX and CCE, especially in the second half of 2011.
| | |
| 2012 WESTPAC GROUP ANNUAL REPORT | 109 |
Operating expenses increased by $21 million or 2% compared to 2010 due to an increase in allocated costs year-on-year. Strong cost controls remain in WIB’s underlying cost base.
Impairment benefits on loans contributed $90 million to profit before income tax in 2011 compared to an impairment charge of $150 million in 2010. This was due to upgrades, write-backs and improvements in asset quality.
St.George Banking Group
2011 v 2010
St.George Banking Group Cash Earnings were $1,233 million in 2011, an increase of $166 million or 16% compared to 2010.
The result was driven by net operating income before operating expenses and impairment charges growth of 5% and a 23% decline in impairment charges on loans.
Over the year, movements in net interest income and non-interest income were impacted by a reclassification of fees and commissions from non-interest income to net interest income. Excluding this reclassification, net interest income increased by 5% while non-interest income was virtually unchanged.
Net interest income increased by $183 million or 7% compared to 2010, primarily due to:
§ an increase in margins of 10 basis points compared to 2010, driven by:
– improved mortgage spreads due to repricing and from the roll-off of low spread one-year specials written in 2010; partially offset by
– lower deposit spreads due to intense competition over the year and from mix impacts as all growth was in lower spread term deposits; and
– higher wholesale funding costs. However the impact was limited as loan growth was modest and customer deposits fully funded lending over the year.
§ loans increased by $3.5 billion or 3% compared to 2010 primarily due to:
– an increase in mortgages of $3.9 billion or 4% compared to 2010. This increase accounted for the majority of growth which was lower than banking system1 due to the decision in the prior year to reduce the reliance on third parties. Most of the growth in mortgages was due to loans written through the network of St.George brands;
– an increase in other consumer lending of $0.4 billion or 7% compared to 2010, mainly in auto loans and the new Amplify credit card; partially offset by
– a decrease in business lending of $0.8 billion or 3% compared to 2010. Declining commercial loan balances were partially offset by higher SME and business auto lending.
§ deposits increased by $5.2 billion or 8% compared to 2010, primarily due to:
1 APRA system growth, 12 months to 30 September 2011.
– term deposits growth of $7 billion or 26% compared to 2010 as a result of targeted advertising campaigns through the year; partially offset by
– lower other deposits including the run-down in some highly priced commercial deposits and the decision not to match some of the more aggressive online pricing.
Non-interest income decreased by $28 million or 5% compared to 2010. Excluding the reclassification of fees and commissions, non-interest income was virtually unchanged compared to 2010. The movement in non-interest income was due to:
§ lower consumer fees; partially offset by
§ higher business fees and markets customer related income.
Operating expenses increased $35 million or 3% compared to 2010, primarily due to:
§ costs of $45 million associated with preparations for the launch of Bank of Melbourne;
§ cost associated with the opening of 14 new Bank of Melbourne branches; and
§ advertising expenses increased to support additional brand marketing.
Excluding the preparation costs for the launch of Bank of Melbourne, operating expenses increased by 2%.
Impairment charges on loans decreased by $120 million or 23% compared to 2010 due to:
§ the improvement in asset quality, including the run-down in commercial property; and
§ newly impaired assets declining with most of the new impairments due to the top-up of existing facilities; partially offset by
§ an increase of business impaired assets. The rate of new downgrades to impaired slowed during 2011, however the slow pace of economic recovery has led to longer work-out periods for impaired exposures; and
§ higher consumer impairment charges earlier in the year, which declined in the second half of the year to be lower overall compared to 2010.
BT Financial Group (Australia)
2011 v 2010
BTFG Cash Earnings were $729 million in 2011, an increase of $36 million or 5% compared to 2010.
This result was driven by a 5% increase in net operating income before operating expenses and impairment charges and a 69% reduction in impairment charges on loans, partially offset by a 4% increase in operating expenses.
Net interest income increased by $62 million or 16% compared to 2010 due to:
§ an increase in earnings on invested capital recognised in net interest income;
§ higher lending and deposit volumes in the private bank; and
§ improved lending spreads on mortgages; partially offset by
| | |
110 | 2012 WESTPAC GROUP ANNUAL REPORT | |
§ lower term deposit spreads.
Non-interest income increased by $44 million or 3% compared to 2010 due to:
§ an increase in average FUM of 3%, primarily due to:
– wholesale net inflows and stronger markets early in the year;
– growth in BT Super for Life with average FUM increased by $604 million or 86%; partially offset by
– retail and institutional outflows;
– weaker markets in the second half of 2011; and
– FUM margins 4 basis points lower, due to reductions across both retail and wholesale products.
§ an increase in average FUA of 5%, primarily due to:
– positive net inflows of $4.7 billion on both the BT Wrap platform and into corporate super were supported by stronger asset markets in the first half of 2011, partially offset by weaker markets toward the end of 2011; and
– flat FUA margins as margin declines across products were offset by customers moving funds into higher margin cash products.
§ one-off items that added $54 million to revenues in 2011, including sale of single manager investment rights, a review of the amortisation profile for deferred fees and deferred costs associated with the origination of superannuation, investments and portfolio management products to align with their assessed life;
§ an increase in life insurance revenue of $54 million or 18% compared to 2010 with in-force premiums increasing 12% and net earned premiums increasing 17%. New business sales were stronger across all channels, particularly retail, following the extension of distribution to the Independent Financial Adviser market and from the launch of new protection plans. Loss rates were also lower over the year, which assisted returns; and
§ an increase in lenders mortgage insurance non-interest income of $26 million or 31% compared to 2010, although adjusting for transfers from net interest income, the underlying revenue increased $11 million. Gross written premiums decreased significantly over the year following the decision not to underwrite mortgages with loan to value ratios (LVRs) greater than 90%. The improved result was mostly due to flat earned premiums and lower loss rates (falling from 23% to 16%) compared to 2010; partially offset by
§ a decrease in general insurance revenue of $32 million or 36% compared to 2010, with the higher claims associated with the Queensland and Victorian floods and the Queensland cyclone more than offsetting a 17% increase in net earned premiums from improved sales.
Operating expenses increased by $38 million or 4% compared to 2010, primarily due to:
§ costs associated with the acquisition of J O Hambro by BTIM of $13 million;
§ an increase in operating expenses of $8 million in the life insurance business consistent with the expansion of the distribution network into St.George and into the Independent Financial Adviser network; and
§ costs associated with establishing wealth distribution capabilities through the Bank of Melbourne; partially offset by
§ lower FTE and reduced expenses due to productivity initiatives initiated early in 2011.
Westpac New Zealand
2011 v 2010
Westpac New Zealand Cash Earnings were $442 million in 2011, an increase of $86 million or 24% compared to 2010.
This result was driven by a 4% increase in net operating income before operating expenses and impairment charges and a 32% reduction in impairment charges on loans, partially offset by a 2% increase in operating expenses.
Net interest income increased by $47 million or 4% compared to 2010, primarily due to:
§ an increase in margins of 15 basis points to 2.63% compared to 2.48% in 2010, primarily due to stronger mortgage and business lending spreads, partially offset by tighter deposit spreads;
§ loans increased by $2.2 billion or 5% compared to 2010, primarily due to an increase in mortgages, with growth in business lending improving in the second half of 2011; and
§ deposits increased by $2.4 billion or 9% compared to 2010, with growth across both at call and term deposit accounts.
Non-interest income increased by $2 million or 1% compared to 2010, primarily due to:
§ an increase in product transaction fees; partially offset by
§ higher life insurance claims.
Operating expenses increased by $15 million or 2% compared to 2010, primarily due to:
§ higher operating lease and occupancy expenses following the move in April 2011 to a new head office in Auckland. Additional costs included lease costs being incurred on two locations for a short period, moving costs and some remediation costs for the old head office;
§ wage increases, restructuring costs to support productivity initiatives, and increased technology costs; partially offset by
§ cost reduction due to lower average FTE; and
§ productivity improvements carried out in 2011, which positively impacted the cost base.
Impairment charges on loans decreased by $89 million or 32% compared to 2010. This was driven by a decline in stressed assets, a fall in new impaired assets and lower consumer delinquencies due to enhancements to the credit decision process and the ongoing economic recovery in New Zealand.
Other divisions
2011 v 2010
Other divisions Cash Earnings were $620 million in 2011, a decrease of $31 million or 5% compared to 2010.
Lower net operating income before operating expenses and impairment charges was partially offset by lower operating expenses and a reduced tax rate.
| | |
| 2012 WESTPAC GROUP ANNUAL REPORT | 111 |
Net interest income reduced by $176 million or 18% primarily due to:
§ lower Group Treasury income, given the high market volatility in asset and swap prices, which resulted in reduced income from management of the Group’s balance sheet, including liquid assets; partially offset by
§ higher earnings on capital.
Non-interest income increased by $17 million or 9%, primarily due to an increase in FX spread income in Pacific Banking.
Operating expenses decreased by $63 million or 33% compared to 2010, primarily due to:
§ lower employee provisions, including centrally held bonus provisions;
§ lower project activity; and
§ a one-off contribution in 2010 of $20 million to the Westpac Foundation, which was not repeated in 2011.
Impairment benefits on loans decreased by $17 million or 31% compared to 2010, primarily due to:
§ higher impairment charges in Pacific Banking, which increased $24 million to $25 million in 2011; partially offset by
§ small releases of centrally-held economic overlay impairment provisions, which occurred in 2011 and 2010.
The effective tax rate reduced from 26.7% in 2010 to 31.9% in 2011 due to the release of an excess tax provision. This followed resolution of several outstanding taxation matters.
| | |
112 | 2012 WESTPAC GROUP ANNUAL REPORT | |
Our business is subject to risks that can adversely impact our business, results of operations, financial condition and future performance. If any of the following risks occur, our business, results of operations, financial condition or future performance could be materially adversely affected, with the result that the trading price of our securities could decline and you could lose all, or part, of your investment. You should carefully consider the risks described and the other information in this Annual Report before investing in our securities. The risks and uncertainties described below are not the only ones we may face. Additional risks and uncertainties that we are unaware of, or that we currently deem to be immaterial, may also become important factors that affect us.
Our businesses are highly regulated and we could be adversely affected by failing to comply with existing laws and regulations or by changes in laws and regulations and regulatory policy
As a financial institution, we are subject to detailed laws and regulations in each of the jurisdictions in which we operate or obtain funding, including Australia, New Zealand and the United States. We are also supervised by a number of different regulatory authorities which have broad administrative power over our businesses. In Australia, the relevant regulatory authorities include the Australian Prudential Regulation Authority (APRA), Reserve Bank of Australia (RBA), Australian Securities and Investments Commission (ASIC), Australian Securities Exchange (ASX), Australian Competition and Consumer Commission (ACCC) and Australian Transaction Reports and Analysis Centre (AUSTRAC). The Reserve Bank of New Zealand (RBNZ) has supervisory oversight of our New Zealand operations. In the United States we are subject to supervision and regulation by the US Office of the Comptroller of the Currency, the Board of Governors of the Federal Reserve System and the U.S. Securities and Exchange Commission (SEC).
We are responsible for ensuring that we comply with all applicable legal and regulatory requirements (including accounting standards) and industry codes of practice in the jurisdictions in which we operate or obtain funding, as well as meeting our ethical standards.
Compliance risk arises from these legal and regulatory requirements. If we fail to comply with applicable laws and regulations, we may be subject to fines, penalties or restrictions on our ability to do business. An example of the broad administrative power available to regulatory authorities is the power available to APRA under the Banking Act in certain circumstances to investigate our affairs and/or issue a direction to us (such as a direction to comply with a prudential requirement, to conduct an audit, to remove a director, executive officer or employee or not to undertake transactions). Any such costs and restrictions could adversely affect our business, reputation, prospects, financial performance or financial condition.
As with other financial services providers, we continue to face increased supervision and regulation in most of the jurisdictions in which we operate or obtain funding, particularly in the areas of funding, liquidity, capital adequacy and prudential regulation. For example in December 2010 the
BCBS announced a revised global regulatory framework known as Basel III. Basel III will, among other things, increase the required quality and quantity of capital held by banks and introduce new minimum standards for the management of liquidity risk. APRA has announced that it supports the Basel III framework and it will incorporate the framework into its prudential standards. The Basel III framework comes into effect from 1 January 2013, subject to various transitional arrangements. Further details on the Basel III framework are set out in Section 1 under ‘Information on Westpac’.
During the year ended 30 September 2012 there has also been a series of other regulatory releases from authorities in the various jurisdictions in which we operate or obtain funding proposing significant regulatory change for financial institutions. This includes global OTC derivatives reform and recovery and resolution planning requirements proposed by the FSB, as well as other components of the US Dodd-Frank legislation (including the Volcker Rule) which is designed to reform the entire system for the supervision and regulation of financial firms that operate in or have a connection with the US, including foreign banks like Westpac. Other areas of potential change that could impact us include changes to accounting and reporting requirements, tax legislation, regulation relating to remuneration, consumer protection and competition legislation and bribery, anti-money laundering and counter-terrorism financing laws. In addition, further changes may occur driven by policy, prudential or political factors.
Regulation is becoming increasingly extensive and complex. Some areas of potential regulatory change involve multiple jurisdictions seeking to adopt a coordinated approach. Such an approach may not appropriately respond to the specific requirements of the jurisdictions in which we operate and, in addition, such changes may be inconsistently introduced across jurisdictions.
Changes may also occur in the oversight approach of regulators. It is possible that governments in jurisdictions in which we operate or obtain funding might revise their application of existing regulatory policies that apply to, or impact, Westpac’s business, including for reasons relating to national interest and/or systemic stability.
Regulatory changes and the timing of their introduction continue to evolve and we currently manage our businesses in the context of regulatory uncertainty. The nature and impact of future changes are not predictable and are beyond our control. Regulatory compliance and the management of regulatory change is an increasingly important part of our strategic planning. We expect that we will be required to continue to invest significantly in compliance and the management and implementation of regulatory change and, at the same time, significant management attention and resources will be required to update existing or implement new processes and procedures to comply with the new regulations.
Regulatory change may also impact our operations by requiring us to have increased levels of liquidity and higher levels of, and better quality, capital as well as place restrictions on the businesses we conduct or require us to alter our product and service offerings. If regulatory change
| | |
| 2012 WESTPAC GROUP ANNUAL REPORT | 113 |
has any such effect, it could adversely affect one or more of our businesses, restrict our flexibility, require us to incur substantial costs and impact the profitability of one or more of our business lines. Any such costs or restrictions could adversely affect our business, prospects, financial performance or financial condition.
For further information refer to ‘Significant developments’ in Section 1 and the sections ‘Changes in accounting policy’, ‘Critical accounting assumptions and estimates’ and ‘Future developments in accounting policies’ in Note 1 to the financial statements.
Adverse credit and capital market conditions may significantly affect our ability to meet funding and liquidity needs and may increase our cost of funding
We rely on credit and capital markets to fund our business and as a source of liquidity. Our liquidity and costs of obtaining funding are related to credit and capital market conditions.
Global credit and capital markets have experienced extreme volatility, disruption and decreased liquidity in recent years. While there have been periods of stability in these markets, the environment has become more volatile and unpredictable. This has been exacerbated by the potential for sovereign debt defaults and/or banking failures in Europe which has contributed to volatility in stock prices and credit spreads. Adding to the uncertainty has been a slowing in the economic outlook for a number of countries, including China and the uncertain recovery of the US economy. Our direct exposure to the affected European countries is immaterial, with the main risks we face being damage to market confidence, changes to the access and cost of funding and a slowing in global activity or through other impacts on entities with whom we do business.
As of 30 September 2012, approximately 35% of our total net funding originated from domestic and international wholesale markets, of this around 59% was sourced outside Australia and New Zealand.
A shift in investment preferences of businesses and consumers away from bank deposits toward other asset or investment classes would increase our need for funding from relatively less stable or more expensive forms of funding.
If market conditions deteriorate due to economic, financial, political or other reasons, our funding costs may be adversely affected and our liquidity and our funding and lending activities may be constrained.
If our current sources of funding prove to be insufficient, we may be forced to seek alternative financing. The availability of such alternative financing, and the terms on which it may be available, will depend on a variety of factors, including prevailing market conditions, the availability of credit, our credit ratings and credit market capacity. Even if available, the cost of these alternatives may be more expensive or on unfavourable terms, which could adversely affect our results of operations, liquidity, capital resources and financial condition. There is no assurance that we will be able to obtain adequate funding and do so at acceptable prices, nor that we will be able to recover any additional costs.
If Westpac is unable to source appropriate funding, we may also be forced to reduce our lending or begin to sell liquid securities. Such actions may adversely impact our business,
prospects, liquidity, capital resources, financial performance or financial condition.
Westpac enters into collateralised derivative positions, which may require Westpac to post additional collateral based on adverse movements in market rates, which would adversely affect Westpac’s liquidity.
For a more detailed description of liquidity risk, refer to the section ‘Liquidity Risk’ in this section and Note 27 to the financial statements.
Failure to maintain credit ratings could adversely affect our cost of funds, liquidity, competitive position and access to capital markets
Credit ratings are opinions on our creditworthiness. Our credit ratings affect the cost and availability of our funding from capital markets and other funding sources and they may be important to customers or counterparties when evaluating our products and services. Therefore, maintaining high quality credit ratings is important.
The credit ratings assigned to us by rating agencies are based on an evaluation of a number of factors, including our financial strength, structural considerations regarding the Australian financial system and the credit rating of the Australian Federal Government. A credit rating downgrade could be driven by the occurrence of one or more of the other risks identified in this section or by other events including changes to the methodologies used by the rating agencies to determine ratings.
For example, Standard & Poor’s has changed its methodology for determining bank ratings and published new criteria on 9 November 2011. On 1 December 2011 Standard & Poor’s announced the updated ratings for certain banks across the Asia-Pacific region under the revised approach and Westpac, along with the other major Australian Banks, was issued a long-term, senior unsecured credit rating of AA- down from AA.
On 24 February 2012, following its review of the debt ratings of the four major Australian banks, Fitch announced that Westpac had been issued a long-term senior unsecured issuer default rating of AA- down from AA, and in line with the other major Australian banks.
If we fail to maintain our current credit ratings, this could adversely affect our cost of funds and related margins, collateral requirements, liquidity, competitive position and our access to capital markets. The extent and nature of these impacts would depend on various factors, including the extent of any ratings change, whether our ratings differ among agencies (split ratings) and whether any ratings changes also impact our peers or the sector.
A systemic shock in relation to the Australian, New Zealand or other financial systems could have adverse consequences for Westpac or its customers or counterparties that would be difficult to predict and respond to
There is a risk that a major systemic shock could occur that causes an adverse impact on the Australian, New Zealand or other financial systems.
As outlined above, the financial services industry and capital markets have been, and may continue to be, adversely
| | |
114 | 2012 WESTPAC GROUP ANNUAL REPORT | |
affected by continuing market volatility and the negative outlook for global economic conditions. During the first half of 2012, there was an increased focus on the potential for sovereign debt defaults and/or significant bank failures in the 17 countries comprising the Eurozone which exacerbated these conditions. There can be no assurance that the market disruptions in the Eurozone, including the increased cost of funding for certain Eurozone governments, will not spread, nor can there be any assurance that future assistance packages will be available or sufficiently robust to address any further market contagion in the Eurozone or elsewhere. If the situation in the Eurozone worsens, there could be serious implications for the European Union and the euro, which, if destabilised, could result in currency fluctuations and operational disruptions that negatively impact the Group.
Any such market and economic disruptions could adversely affect financial institutions such as Westpac because consumer and business spending may decrease, unemployment may rise and demand for the products and services we provide may decline, thereby reducing our earnings. These conditions may also affect the ability of our borrowers to repay their loans or our counterparties to meet their obligations, causing us to incur higher credit losses. These events could also result in the undermining of confidence in the financial system, reducing liquidity and impairing our access to funding and impairing our customers and counterparties and their businesses. If this were to occur, our business, prospects, financial performance or financial condition or could be adversely affected.
The nature and consequences of any such event are difficult to predict and there can be no guarantee that we could respond effectively to any such event.
Declines in asset markets could adversely affect our operations or profitability
Declines in Australian, New Zealand or other asset markets, including equity, residential and commercial property and other asset markets, could adversely affect our operations and profitability.
Declining asset prices impact our wealth management business and other asset holdings. Earnings in our wealth management business are, in part, dependent on asset values because we receive fees based on the value of securities and/or assets held or managed. A decline in asset prices could negatively impact the earnings of this business.
Declining asset prices could also impact customers and counterparties and the value of security we hold against loans and derivatives which may impact our ability to recover amounts owing to us if customers or counterparties were to default. It may also affect our level of provisioning which in turn impacts profitability.
Our business is substantially dependent on the Australian and New Zealand economies
Our revenues and earnings are dependent on economic activity and the level of financial services our customers require. In particular, lending is dependent on various factors including economic growth, business investment, levels of employment, interest rates and trade flows in the countries in which we operate.
We currently conduct the majority of our business in Australia and New Zealand and, consequently, our performance is influenced by the level and cyclical nature of lending in these countries. These factors are in turn impacted by both domestic and international economic conditions, natural disasters and political events. A significant decrease in the Australian and New Zealand housing markets or property valuations could adversely impact our home lending activities because the ability of our borrowers to repay their loans or counterparties to honour their obligations may be affected, causing us to incur higher credit losses, or the demand for our home lending products may decline.
Adverse changes to the economic and business conditions in Australia and New Zealand and other countries such as China, India and Japan, could also adversely affect the Australian economy and customers. In particular, due to the current relationship between Australia and China in the mining and resources sectors, a slowdown in China’s economic growth could negatively impact the Australian economy. Changes in economic conditions could in turn result in reduced demand for our products and services and affect the ability of our borrowers to repay their loans. If this were to occur, it could negatively impact our business, prospects, financial performance or financial condition.
An increase in defaults in credit exposures could adversely affect our liquidity, capital resources, financial performance or financial condition
Credit risk is a significant risk and arises primarily from our lending activities. The risk arises from the possibility that some customers and counterparties will be unable to honour their obligations to us, including the repayment of loans and interest.
Credit risk also arises from certain derivative contracts we enter into and from our dealings with, and holdings of, debt securities issued by other banks, financial institutions, companies, governments and government bodies the financial conditions of which may be impacted to varying degrees by economic conditions in global financial markets.
We hold collective and individually assessed provisions for our credit exposures. If economic conditions deteriorate, some customers and/or counterparties could experience higher levels of financial stress and we may experience a significant increase in defaults and write-offs, and be required to increase our provisioning. Such events would diminish available capital and could adversely affect our liquidity, capital resources, financial performance or financial condition.
For a discussion of our risk management procedures, including the management of credit risk, refer to the ‘Risk management’ section and Note 27 to the financial statements.
We face intense competition in all aspects of our business
The financial services industry is highly competitive. We compete, both domestically and internationally, with retail and commercial banks, asset managers, investment banking firms, brokerage firms, other financial service firms and businesses in other industries with emerging financial services aspirations. This includes specialist competitors
| | |
| 2012 WESTPAC GROUP ANNUAL REPORT | 115 |
that may not be subject to the same capital and regulatory requirements and therefore may be able to operate more efficiently.
If we are unable to compete effectively in our various businesses and markets, our market share may decline. Increased competition may also adversely affect our results of operations by diverting business to our competitors or creating pressure to lower margins.
Increased competition for deposits could also increase our cost of funding and cause us to access other types of funding. We rely on bank deposits to fund a significant portion of our balance sheet and deposits have been a relatively stable source of funding. We compete with banks and other financial services firms for such deposits. To the extent that we are not able to successfully compete for deposits, we would be forced to rely more heavily on more expensive or less stable forms of funding, or reduce lending.
We are also dependent on our ability to offer products and services that match evolving customer preferences. If we are not successful in developing or introducing new products and services or responding or adapting to changes in customer preferences and habits, we may lose customers to our competitors. This could adversely affect our business, prospects, financial performance or financial condition.
For more detail on how we address competitive pressures refer to the section ‘Competition’ in Section 1.
We could suffer losses due to market volatility
We are exposed to market risk as a consequence of our trading activities in financial markets and through the asset and liability management of our financial position. In our financial markets trading business, we are exposed to losses arising from adverse movements in levels and volatility of interest rates, foreign exchange rates, commodity prices, credit prices and equity prices. If we were to suffer substantial losses due to any market volatility it may adversely affect our business, prospects, liquidity, capital resources, financial performance or financial condition. For a discussion of our risk management procedures, including the management of market risk, refer to the ‘Risk management’ section.
We could suffer losses due to technology failures
The reliability and security of our information and technology infrastructure and our customer databases are crucial in maintaining our banking applications and processes. There is a risk that these information and technology systems might fail to operate properly or become disabled as a result of events that are wholly or partially beyond our control or that our security measures may prove inadequate or ineffective. Any failure of these systems could result in business interruption, loss of customers, theft of intellectual property and customer data, reputational damage and claims for compensation and regulatory investigations and penalties, which could adversely affect our business, prospects, financial performance, or financial condition.
Further, our ability to develop and deliver products and services to customers is dependent upon technology that requires periodic renewal. We are constantly managing technology projects including projects to consolidate duplicate
technology platforms, simplify and enhance our technology and operations environment, improve productivity and provide for a better customer experience. This includes our current Strategic Investment Priorities (SIPs) program. Failure to implement these projects or manage associated change effectively could result in cost overruns, a failure to achieve anticipated productivity, operational instability, reputational damage or operating technology that could place us at a competitive disadvantage and may adversely affect our financial performance.
We could suffer losses due to operational risks
Operational risk is the risk of loss resulting from technology failure, inadequate or failed internal processes, people, systems or from external events. As a financial services organisation we are exposed to a variety of operational risks.
Our operations rely on the secure processing, storage and transmission of confidential and other information on our computer systems and networks, and the systems and networks of external suppliers. Although we implement significant measures to protect the security and confidentiality of our information, there is a risk that the computer systems, software and networks on which we rely may be subject to security breaches, unauthorised access, computer viruses, external attacks or internal breaches that could have an adverse security impact and compromise our confidential information or that of our customers and counterparts. Any such security breach could result in regulatory enforcement actions, reputational damage and reduced operational effectiveness. Such events could subsequently adversely affect our business, prospects, financial performance or financial condition.
We are also highly dependent on the conduct of our employees. We could, for example, be adversely affected in the event of human error, inadequate or failed processes or if an employee engages in fraudulent conduct. While we have policies and processes to minimise the risk of human error and employee misconduct, these policies and processes may not always be effective.
Fraudulent conduct can also emerge from external parties seeking to access the bank’s systems and customers’ accounts. If systems, procedures and protocols for managing and minimising fraud fail, or are ineffective, they could lead to loss which could adversely affect our business, prospects, reputation, financial performance, or financial condition.
Westpac relies on a number of suppliers, both in Australia and overseas, to provide services to it and its customers. Failure by these suppliers to deliver services as required could disrupt services and adversely impact Westpac’s operations, profitability or reputation.
Operational risks could impact on our operations or adversely affect demand for our products and services. Operational risks can directly impact our reputation and result in financial losses which would adversely affect our financial performance or financial condition.
For a discussion of our risk management procedures, including the management of operational risk, refer to the ‘Risk management’ section.
| | |
116 | 2012 WESTPAC GROUP ANNUAL REPORT | |
We could suffer losses due to failures in risk management strategies
We have implemented risk management strategies and internal controls involving processes and procedures intended to identify, monitor and mitigate the risks to which we are subject, including liquidity risk, credit risk, market risk (including interest rate and foreign exchange risk) and operational risk.
However, there are inherent limitations with any risk management framework as there may exist, or emerge in the future, risks that we have not anticipated or identified.
If any of our risk management processes and procedures prove ineffective or inadequate or are otherwise not appropriately implemented, we could suffer unexpected losses and reputational damage which could adversely affect our business, prospects, financial performance or financial condition.
For a discussion of our risk management procedures, refer to the ‘Risk management’ section.
We could suffer losses due to environmental factors
We and our customers operate businesses and hold assets in a diverse range of geographical locations. Any significant environmental change or external event (including fire, storm, flood, earthquake or pandemic) in any of these locations has the potential to disrupt business activities, impact on our operations, damage property and otherwise affect the value of assets held in the affected locations and our ability to recover amounts owing to us. In addition, such an event could have an adverse impact on economic activity, consumer and investor confidence, or the levels of volatility in financial markets.
This risk of losses due to environmental factors is also relevant to our insurance business. The frequency and severity of external events such as natural disasters is difficult to predict and it is possible that the amounts we reserve for such events may not be adequate to cover actual claims that may arise, which could adversely affect our business, prospects, financial performance or financial condition.
Reputational damage could harm our business and prospects
Our ability to attract and retain customers and our prospects could be adversely affected if our reputation is damaged.
There are various potential sources of reputational damage including potential conflicts of interest, pricing policies, failing to comply with legal and regulatory requirements, ethical issues, engagements and conduct of external suppliers, failing to comply with money laundering laws, trade sanctions and counter-terrorism finance legislation or privacy laws, litigation, information security policies, improper sales and trading practices, failing to comply with personnel and supplier policies, improper conduct of companies in which we hold strategic investments, technology failures, security breaches and risk management failures. Our reputation could also be adversely affected by the actions of the financial services industry in general or from the actions of customers and counterparties.
Failure to appropriately address issues that could or do give rise to reputational risk could also impact the regulatory
change agenda, give rise to additional legal risk, subject us to regulatory enforcement actions, fines and penalties, or remediation costs, or harm our reputation among customers, investors and the marketplace. This could lead to loss of business which could adversely affect our business, prospects, financial performance or financial condition.
We could suffer losses if we fail to syndicate or sell down underwritten securities
As a financial intermediary we underwrite listed and unlisted debt and equity securities. Underwriting activities include the development of solutions for corporate and institutional customers who need capital and investor customers who have an appetite for certain investment products. We may guarantee the pricing and placement of these facilities. We could suffer losses if we fail to syndicate or sell down our risk to other market participants. This risk is more pronounced in times of market volatility.
Certain strategic decisions may have adverse effects on our business
Westpac, at times, evaluates and may undertake strategic decisions which may include business expansion. The expansion, or integration of a new business, can be complex and costly and may require Westpac to comply with additional local or foreign regulatory requirements which may carry additional risks. These decisions may, for a variety of reasons, not deliver the anticipated positive business results and could have a negative impact on our business, prospects, engagement with regulators, financial performance or financial condition.
Limitation on Independent Registered Public Accounting Firm’s Liability
The liability of PricewaterhouseCoopers (an Australian partnership which we refer to as PwC Australia), with respect to claims arising out of its audit report included in this Annual Report, is subject to the limitations set forth in the Professional Standards Act 1994 of New South Wales, Australia, as amended (the Professional Standards Act) and The Institute of Chartered Accountants in Australia (NSW) Scheme adopted by The Institute of Chartered Accountants in Australia (ICAA) and approved by the New South Wales Professional Standards Council pursuant to the Professional Standards Act (the ‘NSW Accountants Scheme’) or, in relation to matters occurring on or prior to 7 October 2007, the predecessor scheme. The current NSW Accountants Scheme expires on 7 October 2013 unless further extended or replaced.
The Professional Standards Act and the NSW Accountants Scheme may limit the liability of PwC Australia for damages with respect to certain civil claims arising in, or governed by the laws of, New South Wales directly or vicariously from anything done or omitted in the performance of its professional services for us, including, without limitation, its audits of our financial statements, to the lesser of (in the case of audit services) ten times the reasonable charge for the service provided and a maximum liability for audit work of $75 million or, in relation to matters occurring on or prior to 7 October 2007, $20 million. The limit does not apply to claims for breach of trust, fraud or dishonesty.
In addition there is equivalent professional standards legislation in place in other states and territories in Australia and amendments have been made to a number of Australian
| 2012 WESTPAC GROUP ANNUAL REPORT | 117 |
federal statutes to limit liability under those statutes to the same extent as liability is limited under state and territory laws by professional standards legislation.
These limitations of liability may limit recovery upon the enforcement in Australian courts of any judgment under US or other foreign laws rendered against PwC Australia based on or related to its audit report on our financial statements. Substantially all of PwC Australia’s assets are located in Australia. However, the Professional Standards Act and the NSW Accountants Scheme have not been subject to judicial consideration and therefore how the limitation will be applied by the courts and the effect of the limitation on the enforcement of foreign judgments are untested.
RISK MANAGEMENT
Our vision is to be one of the world’s great companies, helping our customers, communities and people to prosper and grow.
Effective risk management is one of the keys to achieving this goal. It influences our customer experiences and public perceptions, our financial performance, reputation and shareholder expectations, and thus our future success. We regard managing risk to be a fundamental activity, performed at all levels of the Group.
Our risk management strategy is approved by our Board and implemented through the CEO and the executive management team.
The BRMC has been delegated the responsibility for approving and maintaining an effective risk management framework. For further information regarding the role and responsibilities of the BRMC and other Board committees in managing risk, refer to ‘Corporate governance – Risk management’ in Section 1.
The CEO and executive management team are responsible for implementing the risk management strategy and frameworks and for developing policies, controls, processes and procedures for identifying and managing risk in all of Westpac’s activities.
We follow a ‘Three Lines of Defence’ philosophy for risk management. As outlined in the ‘Corporate governance’ section our approach to managing risk is that ‘risk is everyone’s business’ and that responsibility and accountability for risk begins with the business units that originate the risk.
For a comprehensive discussion of the risks to which Westpac is exposed, and its policies to manage these risks, refer to ‘Corporate governance – Risk management’ in Section 1 and Note 27 to the financial statements.
CREDIT RISK
Credit risk is the risk of financial loss where a customer or counterparty fails to meet their financial obligations.
The extension of credit is underpinned by the Group’s Principles of Responsible Lending. This is reflected in our commitment to comply with all local legislation, codes of practices and relevant guidelines and obligations to market our products responsibly and stay in touch with the expectations of customers and the community.
We have a well-established framework and supporting policies for managing the credit risk associated with lending across our business divisions. The framework and policies encompass all stages of the credit cycle—origination, evaluation, approval, documentation, settlement, ongoing administration and problem management. For example, we have established product-based standards for lending to individuals, with key controls including minimum serviceability standards and maximum loan to security value ratios. We offer residential property loans to both owner-occupiers and investors at both fixed and variable rates, secured by a mortgage over the subject property or other acceptable collateral. Where we lend to higher loan to value ratios we typically also require lenders mortgage insurance. Similarly, we have established criteria for business, commercial, corporate and institutional lending, which can vary by industry segment. In this area we focus on the performance of key financial risk ratios, including interest coverage, debt serviceability and balance sheet structure. When providing finance to smaller business, commercial and corporate borrowers we typically obtain security, such as a mortgage over property and/or a general security agreement over business assets. For larger corporates and institutions we typically also require compliance with selected financial ratios and undertakings and may hold security. In respect of commercial property lending we maintain loan origination and ongoing risk management standards, including specialised management for higher value loans. We consider factors such as the nature, location, quality and expected demand for the asset, tenancy profile and experience and quality of management. We actively monitor the Australian and New Zealand property markets and the composition of our commercial property loan book across the Group.
Refer to Note 27 to the financial statements for details of our credit risk management policies.
Provisions for impairment charges on loans
For information on the basis for determining the provision for impairment charges on loans refer to ‘Critical accounting assumptions and estimates’ in Note 1 to the financial statements.
Credit risk concentrations
We monitor our credit portfolio to manage risk concentrations. At 30 September 2012, our exposure to consumers comprised 71% (2011: 71%, 2010: 69%) of our on-balance sheet loans and 57% (2011: 56%, 2010: 57%) of total credit commitments. At 30 September 2012, 91% (2011: 91%, 2010: 89%) of our exposure to consumers was supported by residential real estate mortgages. The consumer category includes investment property loans to individuals, credit cards, personal loans, overdrafts and lines of credit. Our consumer credit risks are diversified, with substantial consumer market share in every state and territory in Australia, New Zealand and the Pacific region. Moreover, these customers service their debts with incomes derived from a wide range of occupations, in city as well as country areas.
Exposures to businesses, government and other financial institutions are classified into a number of industry clusters based on groupings of related Australian and New Zealand Standard Industrial Classification (ANZSIC) codes and are monitored against industry risk limits. The level of industry
118 | 2012 WESTPAC GROUP ANNUAL REPORT | |
risk is measured and monitored on a dynamic basis. Exposures are actively managed from a portfolio perspective, with risk mitigation techniques used to regularly re-balance the portfolio. We also control the concentration risks that can arise from large exposures to individual borrowers.
| 2012 WESTPAC GROUP ANNUAL REPORT | 119 |
Cross-border outstandings
Cross-border outstandings are loans, placements with banks, interest earning investments and monetary assets denominated in currencies other than the borrower’s local currency. They are grouped on the basis of the country of domicile of the borrower or the ultimate guarantor of the risk. The table below excludes irrevocable letters of credit, amounts of which are immaterial. The relevant foreign denominated currencies have been converted at the closing spot exchange rate used in the financial statements.
Our cross-border outstandings to borrowers in countries that individually represented in excess of 0.75% of Group total assets as at 30 September in each of the past three years were as follows:
(in $millions unless otherwise indicated) | | Governments and
Official Institutions | | Banks and Other
Financial
Institutions | | Other (Primarily
Commercial
and Industrial) | | Total | | %
of Total
Assets |
2012 | | | | | | | | | | |
Australia | | 22 | | 2,393 | | 3,110 | | 5,525 | | 0.8% |
2011 | | | | | | | | | | |
United States | | - | | 16,014 | | 1,557 | | 17,571 | | 2.6% |
Australia | | 12 | | 7,504 | | 4,022 | | 11,538 | | 1.7% |
United Kingdom | | 10 | | 6,711 | | 446 | | 7,167 | | 1.1% |
2010 | | | | | | | | | | |
Australia | | 7 | | 5,353 | | 3,172 | | 8,532 | | 1.4% |
Impaired assets among cross-border outstandings were $125 million as at 30 September 2012 (2011: $224 million, 2010: $136 million).
120 | 2012 WESTPAC GROUP ANNUAL REPORT | |
RISK AND RISK MANAGEMENT
LIQUIDITY RISK
Liquidity risk is the risk that we will be unable to fund our assets and meet our obligations as they come due, without incurring unacceptable losses. This could potentially arise as a result of mismatched cash flows generated by the Group’s banking business. Liquidity risk is managed through our BRMC-approved liquidity framework.
Refer to Note 27 to the financial statements for a more detailed discussion of our liquidity risk management policies.
Westpac debt programs and issuing shelves
Access in a timely and flexible manner to a diverse range of debt markets and investors is provided by the following programs and issuing shelves as at 30 September 2012:
Program Limit | | Issuer(s) | | Program/Issuing Shelf Type |
| | | | |
Australia | | | | |
No limit | | WBC | | Debt Issuance Program |
| | | | |
Euro Market | | | | |
USD 2.5 billion | | WBC | | Euro Transferable Certificate of Deposit Program |
USD 20 billion | | WBC/WSNZL1 | | Euro Commercial Paper and Certificate of Deposit Program |
USD 70 billion | | WBC | | Euro Medium Term Note Program |
USD 7.5 billion | | WSNZL1 | | Euro Medium Term Note Program |
USD 20 billion | | WBC2 | | Global Covered Bond Program |
EUR 5 billion | | WSNZL3 | | Global Covered Bond Program |
| | | | |
Japan | | | | |
JPY 750 billion | | WBC | | Samurai shelf |
JPY 750 billion | | WBC | | Uridashi shelf |
| | | | |
United States | | | | |
USD 45 billion | | WBC | | US Commercial Paper Program |
USD 10 billion | | WSNZL1 | | US Commercial Paper Program |
USD 35 billion | | WBC | | US MTN Program |
USD 10 billion | | WSNZL1 | | US MTN Program |
USD 15 billion | | WBC (NY Branch) | | Medium Term Deposit Notes |
No limit | | WBC (NY Branch) | | Certificate of Deposit Program |
No limit | | WBC | | US Securities and Exchange Commission registered shelf |
No limit | | WBC | | US Securities and Exchange Commission registered shelf for retail MTNs |
| | | | |
New Zealand | | | | |
No limit | | WNZL | | Medium Term Note and Registered Certificate of Deposit Program |
| | | | |
1 Notes issued under this program by Westpac Securities NZ Limited, London branch are guaranteed by Westpac New Zealand Limited, its parent company.
2 Notes issued under this program are guaranteed by BNY Trust Company of Australia Limited as trustee of the Westpac Covered Bond Trust.
3 Notes issued under this program by Westpac Securities NZ Limited, London branch are guaranteed by Westpac New Zealand Limited, its parent company, and Westpac NZ Covered Bond Limited.
| | |
| 2012 WESTPAC GROUP ANNUAL REPORT | 121 |
MARKET RISK
Market risk is the risk of an adverse impact on earnings resulting from changes in market factors, such as foreign exchange rates, interest rates, commodity prices and equity prices. Market risk arises in both trading and banking book activities.
Our trading activities are conducted in our Financial Markets and Treasury businesses. Financial Market’s trading book activity represents dealings that encompass book running and distribution activity. Treasury’s trading activity represents dealings that include the management of interest rate, foreign exchange (FX) and credit spread risk associated with wholesale funding, liquid asset portfolios and FX repatriations.
Refer to Note 27 to the financial statements for a more detailed discussion of our market risk management policies.
The table below depicts the aggregate Value at Risk (VaR), by risk type, for the six months ended 30 September 2012, 31 March 2012 and 30 September 2011:
| | 30 September 2012 | | | 31 March 2012 | | 30 September 2011 | |
| | High | | Low | | Average | | | High | | Low | | Average | | High | | Low | | Average | |
Six months ended | | $m | | $m | | $m | | | $m | | $m | | $m | | $m | | $m | | $m | |
| | | | | | | | | | | | | | | | | | | | |
Interest rate risk | | 23.5 | | 10.5 | | 17.1 | | | 29.0 | | 14.8 | | 19.7 | | 40.9 | | 16.5 | | 28.4 | |
Foreign exchange risk | | 7.5 | | 0.8 | | 2.6 | | | 8.0 | | 1.6 | | 4.1 | | 8.4 | | 0.9 | | 3.4 | |
Equity risk | | 1.1 | | 0.2 | | 0.6 | | | 1.8 | | 0.4 | | 0.5 | | 1.7 | | 0.3 | | 0.6 | |
Commodity risk1 | | 2.4 | | 1.0 | | 1.7 | | | 5.1 | | 1.7 | | 3.2 | | 6.6 | | 1.1 | | 3.5 | |
Other market risks2 | | 20.7 | | 7.8 | | 15.2 | | | 21.6 | | 14.9 | | 18.0 | | 24.9 | | 16.6 | | 20.6 | |
Diversification effect | | n/a | | n/a | | (10.6) | | | n/a | | n/a | | (14.4) | | n/a | | n/a | | (21.9) | |
Net market risk | | 38.9 | | 16.8 | | 26.6 | | | 41.2 | | 25.7 | | 31.1 | | 50.0 | | 25.8 | | 34.6 | |
1 Includes electricity risk.
2 Includes prepayment risk and credit spread risk (exposure to movements in generic credit rating bands).
The graph below compares the actual profit and loss from trading activities on a daily basis to VaR over the reporting period:

Each point on the graph represents one day’s profit or loss from trading activities. The result is placed on the graph relative to the associated VaR utilisation. The downward sloping line represents the point where a loss is equal to VaR utilisation. Therefore any point below the line represents a back-test exception (i.e. where the loss is greater than VaR).
| | |
122 | 2012 WESTPAC GROUP ANNUAL REPORT | |
RISK AND RISK MANAGEMENT
OPERATIONAL RISK AND COMPLIANCE RISK
Operational risk arises from inadequate or failed internal processes and systems, human error or misconduct, or from external events. It also includes, among other things, technology risk, model risk and outsourcing risk.
The way operational risk is managed has the potential to positively or negatively impact our customers, our financial performance and our reputation.
Compliance risk is the risk of legal or regulatory sanction, and financial or reputational loss, arising from our failure to abide by the compliance obligations required of us.
Compliance is focused on meeting our legal and regulatory obligations in each of the jurisdictions in which we operate. Non-compliance can result in legal or regulatory sanction and financial and/or reputational loss. Refer to the Corporate Governance report in Section 1 for information on our management of operational and compliance risk.
The Group’s Operational Risk Management Framework and Compliance Management Framework assist all divisions to achieve their objectives through the effective identification, measurement, management and monitoring of their risks. The Frameworks define the principles, policies and processes, systems, and roles and responsibilities that we use to meet our obligations under the law, based on the letter and spirit of the regulatory standards that apply to the Group. The Frameworks are underpinned by a culture of individual accountability and responsibility, based on a Three Lines of Defence model. This is discussed in further detail in Note 27 to the financial statements.
OTHER RISKS
Business risk
The risk associated with the vulnerability of a line of business to changes in the business environment.
Environmental, social and governance risks
The risk of damage to Westpac’s reputation or financial performance due to failure to recognise or address material existing or emerging sustainability-related environmental, social or governance issues.
The Group has in place a Risk Management Framework that is supported by a suite of key supporting policies and position statements. These include the Principles for Doing Business, Principles for Responsible Lending, ESG Credit Risk Policy and Sustainable Supply Chain Policy, many of which are publicly available. The Framework was reviewed and updated in 2012.
Westpac is also a signatory to a number of voluntary principles-based frameworks that guide the integration of ESG-related issues into investment analysis. These include the Equator Principles covering project finance activities and the United Nations Principles for Responsible Investment covering investment analysis.
Equity risk
The potential for financial loss arising from movements in the value of our direct and indirect equity investments.
The Group’s direct equity risks result from our involvement in underwriting capital raisings undertaken by our customers, trading in equity derivatives, holdings of direct equity investments, asset warehousing, any other strategic investments that the Group may choose to make from time to time and the potential for exposure via obligations to our various employee defined benefits superannuation funds. Our indirect equity risk is primarily related to the potential for equity market volatility to impact on fee income that is based on the size of funds under management and administration.
The Group has in place various policies, limits and controls to manage these risks and the conflicts of interest that can potentially arise.
Insurance risk
The risk of misestimation of the expected cost of insured events, volatility in the number or severity of insured events, and misestimation of the cost of incurred claims.
Subsidiaries within the Group’s BT Financial Group undertake life insurance, general insurance and lenders mortgage insurance. They are governed by independent boards and are subject to separate regulatory oversight and controls. These subsidiaries have comprehensive reinsurance arrangements in place to transfer risk and protect against catastrophic events. They are capitalised to a level that exceeds the minimum required by the relevant regulator.
Related entity (contagion) risk
The risk that problems arising in other Westpac Group members compromise the financial and operational position of the ADI in the Westpac Group.
The Group has in place a Risk Management Framework and a suite of supporting policies and procedures governing the control of dealings with, and activities that may be undertaken by, Group members. Controls include the measurement, approval and monitoring of, and limitations on, the extent of intra-group credit exposures and other forms of parent entity support, plus requirements related to control of Group badging, product distribution, promotional material, service-level agreements and managing potential conflicts of interest.
| | |
| 2012 WESTPAC GROUP ANNUAL REPORT | 123 |
Reputation risk
The risk to earnings or capital arising from negative public opinion resulting from the loss of reputation or public trust and standing.
Reputation risk can arise from gaps between current and/or emerging stakeholder perceptions and expectations relative to our current or planned activities, performance or behaviours. It can affect the Group’s brands and businesses positively or negatively. Stakeholder perceptions can include (but are not limited to) views on financial performance, quality of products or services, quality of management, leadership and governance, history and heritage and our approach to sustainability, social responsibility and ethical behaviour.
We have a Risk Management Framework and key supporting policies in place covering the way we manage reputation risk as one of our key risks across the Group, including the setting of risk appetite and roles and responsibilities for risk identification, measurement and management, monitoring and reporting.
SPECIAL PURPOSE ENTITIES
We are associated with a number of special purpose entities (also known as special purpose vehicles or SPVs) in the ordinary course of business, primarily to provide funding and financial services products to our customers.
SPVs are typically set up for a single, pre-defined purpose, have a limited life and generally are not operating entities nor do they have employees. The most common form of SPV structure involves the acquisition of financial assets by the SPV that are funded by the issuance of securities to external investors (securitisation). Repayment of the securities is determined by the performance of the assets acquired by the SPV.
Under A-IFRS, an SPV is consolidated and reported as part of the Group if it is controlled by the parent entity in line with AASB 127 Consolidated and Separate Financial Statements or deemed to be controlled in applying UIG Interpretation 112 Consolidation — Special Purpose Entities. The definition of control is based on the substance rather than the legal form. Refer to Note 1 to the financial statements for a description of how we apply the requirements to evaluate whether to consolidate SPVs.
In the ordinary course of business, we have established or sponsored the establishment of SPVs in relation to securitisation, as detailed below. Capital is held, as appropriate, against all SPV-related transactions and exposures.
ASSET SECURITISATION
Through our rated loan securitisation programs we package our equitable interests in loans (principally housing mortgage loans) as securities which are sold to investors. We provide arm’s length interest rate swaps and liquidity facilities to the programs in accordance with relevant prudential guidelines. We have no obligation to repurchase any securitisation securities, other than in certain circumstances (excluding loan impairment) where there is a breach of representation or warranty within 120 days of the initial sale (except in respect of our program in New Zealand which imposes no such time limitation). We may remove loans from the program where they cease to conform with the terms and conditions of the securitisation programs or through a program’s clean-up features.
As at 30 September 2012, own assets securitised through a combination of privately or publicly placed issues to Australian, New Zealand, European and United States investors was $10.1 billion (2011: $11.4 billion).
Under A-IFRS substantially all of the SPVs involved in our loan securitisation programs are consolidated by the Group.
Refer to Note 31 to the financial statements for further details.
CUSTOMER FUNDING CONDUITS
We arrange financing for certain customer transactions through a commercial paper conduit that provides customers with access to the commercial paper market. As at 30 September 2012, we administered one significant conduit (2011: one), that was created prior to 1 February 2003, with commercial paper outstanding of $2.6 billion (2011: $2.8 billion). We provide a letter of credit facility as credit support to the commercial paper issued by the conduit. This facility is a variable interest in the conduit that we administer and represents a maximum exposure to loss of $266 million as at 30 September 2012 (2011: $284 million). The conduit is consolidated by the Group.
Refer to Note 31 to the financial statements for further details.
STRUCTURED FINANCE TRANSACTIONS
We are involved with SPVs to provide financing to customers or to provide financing to the Group. Any financing arrangements to customers are entered into under normal lending criteria and are subject to our normal credit approval processes. The assets arising from these financing activities are generally included in receivables due from other financial institutions or available-for-sale securities. The liabilities arising from these financing activities are generally included in payables due to other financial institutions, debt issues or financial liabilities designated at fair value. Exposures in the form of guarantees or undrawn credit lines are included within contingent liabilities and credit-related commitments.
| | |
124 | 2012 WESTPAC GROUP ANNUAL REPORT | |
OFF-BALANCE SHEET ARRANGEMENTS
Wealth management activity
Refer to Note 37 to the financial statements for details of our wealth management activities.
Other off-balance sheet arrangements
Refer to Note 35 to the financial statements for details of our superannuation plans.
FINANCIAL REPORTING
Internal control over financial reporting
The US Congress passed the Public Company Accounting Reform and Investor Protection Act in July 2002, which is commonly known as the Sarbanes-Oxley Act of 2002 (SOX). SOX is a wide ranging piece of US legislation concerned largely with financial reporting and corporate governance. We are obligated to comply with SOX by virtue of being a foreign registrant with the SEC and we have established procedures designed to ensure compliance with all applicable requirements of SOX.
Disclosure controls and procedures
Our management, with the participation of our CEO and CFO, evaluated the effectiveness of the design and operation of our disclosure controls and procedures (as defined in Rule 13a-15(e) under the US Securities Exchange Act of 1934) as of 30 September 2012.
Based upon this evaluation, our CEO and CFO have concluded that the design and operation of our disclosure controls and procedures were effective as of 30 September 2012.
Management’s Report on internal control over financial reporting
Rule 13a-15(a) under the US Securities Exchange Act of 1934 requires us to maintain an effective system of internal control over financial reporting. Please refer to the sections headed ‘Management’s report on internal control over financial reporting’ and ‘Report of independent registered public accounting firm’ in Section 3 for those reports.
Changes in our internal control over financial reporting
There has been no change in our internal control over financial reporting (as defined in Rule 13a-15(f) of the US Securities Exchange Act of 1934) for the year ended 30 September 2012 that has been identified that has materially affected, or is reasonably likely to materially affect, our internal control over financial reporting.
| | |
| 2012 WESTPAC GROUP ANNUAL REPORT | 125 |
OTHER WESTPAC BUSINESS INFORMATION
EMPLOYEES
The number of employees in each area of business as at 30 September1:
| | 2012 | | 2011² | | 2010² | |
AFS | | | | | | | |
Westpac RBB | | 10,171 | | 10,940 | | 11,860 | |
St.George | | 5,106 | | 5,190 | | 5,614 | |
BTFG | | 3,898 | | 3,709 | | 3,750 | |
WIB | | 1,751 | | 1,707 | | 1,782 | |
Westpac New Zealand | | 4,691 | | 4,660 | | 4,782 | |
Other | | 10,058 | | 11,600 | | 11,174 | |
Total employees | | 35,675 | | 37,806 | | 38,962 | |
1 The number of employees includes core and implied FTE (including FTE working on merger integration projects). Core FTE includes full-time and pro-rata part-time staff. Implied FTE includes overtime, temporary and contract staff.
2 2011 and 2010 FTE restated for changes in business structure.
2012 v 2011
Total FTE decreased by 2,131 compared to 30 September 2011. This decrease is primarily driven by the delivery of productivity initiatives primarily as a result of the creation of AFS and Group Services divisions.
Specifically, the movement comprised:
§ a net decrease of 664 FTE across AFS due to benefits realised from the establishment of the AFS division and delivery of productivity program benefits of 858 FTE, partly offset by investment in Bank of Melbourne (124 FTE) as well as additional FTE to support expanded planner network (90 FTE);
§ a net decrease of 1,542 FTE across other businesses mainly from productivity program benefits. This includes a reorganisation of external supplier arrangements whereby 971 FTE were reclassified, partially offset by on-boarding 501 FTE for mortgage processing activities and an increase in FTE to support regulatory change and compliance programs;
§ an increase of 44 FTE in WIB directly attributable to increased presence in Asia and additional staff to support investment in target segments including natural resources and agribusiness; and
§ an increase of 31 FTE in Westpac New Zealand mainly to support projects.
2011 v 2010
Total FTE decreased by 1,156 compared to 30 September 2010. This decrease is primarily driven by continuous productivity and restructuring initiatives across various business units.
Specifically, the movement comprised:
§ a net decrease of 1,385 FTE across AFS as a result of continuous productivity initiatives and business restructures within the Group, partly offset by an increase of 161 FTE for new customer facing employees associated with the Bank of Melbourne;
§ a decrease of 122 FTE in Westpac New Zealand as a result of productivity initiatives and business restructures within the Group; and
§ a net increase of 351 FTE in other businesses driven by project demand predominantly related to the SIPs program, business restructures within the Group and the direct employment of IT support staff previously supplied by an external vendor, partially offset by productivity initiatives.
PROPERTY
We occupy premises primarily in Australia, New Zealand and the Pacific Islands including 1,538 branches, (2011: 1,532) as at 30 September 2012. As at 30 September 2012, we owned approximately 2.2% (2011: 2.9%) of the premises we occupied in Australia, none (2011: none) in New Zealand and 55% (2011: 59%) in the Pacific Islands. The remainder of premises are held under commercial lease with the terms generally averaging five years. As at 30 September 2012, the carrying value of our directly owned premises and sites was approximately $223 million (2011: $198 million).
Westpac Place in the Sydney CBD is the Group’s head office and has a 6,102 seat capacity. In 2006 we signed a 12 year lease, which commenced in November 2006 and contains three six-year options to extend.
60 Martin Place in the Sydney CBD is the next largest corporate site. The Martin Place office has a 2,338 seat capacity. A lease commitment at this site extends to 2015 with two two-year options to extend.
We have retained a corporate presence in Kogarah, in the Sydney metro area, which is a key corporate office of St.George. The Kogarah head office has a 2,276 seat capacity. A lease commitment at this site extends to 2021 with five five-year options to extend.
On 27 July 2010, Westpac entered into a lease and services agreement for a purpose built data centre in Western Sydney. This agreement relates to the design, construction and operation of the data centre and is for a period of 15 years with two further five year option periods. The site was handed over on 28 September 2011.
On 30 November 2011, an Agreement for Lease for part of 150 Collins Street, Melbourne was executed between the following parties: Westpac Banking Corporation (Lessee), APN (Lessor), and APN and Grocon (Developers). The term of the lease is 12 years and expected lease commencement is in mid 2014.
On 21 June 2012 an Agreement for Lease between Westpac and Lend Lease was executed with Westpac as anchor tenant at the new Barangaroo development. The term of the lease is 15 years and occupancy is expected mid to late 2015.
‘Westpac on Takutai Square’ is New Zealand’s head office, located at the Eastern end of Britomart Precinct near Customs Street in Auckland, contains 23,000 square metres of office space across two buildings and has a capacity of approximately 1,800 seats. A lease commitment at this site extends to 2021, with two six-year options to extend.
SIGNIFICANT LONG TERM AGREEMENTS
Westpac’s significant long term agreements are summarised in Note 34 to the financial statements.
| | |
| 2012 WESTPAC GROUP ANNUAL REPORT | 126 |
OTHER WESTPAC BUSINESS INFORMATION
RELATED PARTY DISCLOSURES
Details of our related party disclosures are set out in Note 40 to the financial statements and details of Directors’ interests in securities are set out in Note 41 to the financial statements. The related party disclosures relate principally to transactions with our Directors and Director-related parties as we do not have individually significant shareholders and our transactions with other related parties are not significant.
Other than as disclosed in Note 40 and Note 41 to the financial statements, if applicable, loans made to parties related to Directors and other key management personnel of Westpac are made in the ordinary course of business on normal terms and conditions (including interest rates and collateral). Loans are made on the same terms and conditions (including interest rates and collateral) as apply to other employees and certain customers in accordance with established policy. These loans do not involve more than the normal risk of collectability or present any other unfavourable features.
AUDITOR’S REMUNERATION
Auditor’s remuneration, including goods and services tax, to the external auditor for the years ended 30 September 2012 and 2011 is provided in Note 33 to the financial statements.
Audit related services
Westpac Group Secretariat monitors the application of the pre-approval process in respect of audit, audit-related and non-audit services provided by PricewaterhouseCoopers (PwC) and promptly brings to the attention of the BAC any exceptions that need to be approved pursuant to paragraph (c)(7)(i)(C) of Rule 2-01 of Regulation S-X. The pre-approval guidelines are communicated to Westpac’s divisions through publication on the Westpac intranet.
During the year ended 30 September 2012, there were no fees paid by Westpac to PwC that required approval by the BAC pursuant to paragraph (c)(7)(i)(C) of Rule 2-01 of Regulation S-X.
| | |
| 2012 WESTPAC GROUP ANNUAL REPORT | 127 |
This page has been intentionally left blank.
| | |
128 | 2012 WESTPAC GROUP ANNUAL REPORT | |

Income statements
Statements of comprehensive income
Balance sheets
Statements of changes in equity
Cash flow statements
NOTES TO THE FINANCIAL STATEMENTS
Note 1 | Summary of significant accounting policies | Note 24 | Shareholders’ equity and non-controlling interests |
Note 2 | Net interest income | Note 25 | Share-based payments |
Note 3 | Non-interest income | Note 26 | Average balance sheet and interest rates |
Note 4 | Operating expenses | Note 27 | Financial risk |
Note 5 | Income tax | Note 27.1 | Approach to risk management |
Note 6 | Dividends | Note 27.2 | Credit risk management |
Note 7 | Earnings per share | Note 27.3 | Funding and liquidity risk management |
Note 8 | Receivables due from other financial institutions | Note 27.4 | Market risk |
Note 9 | Trading securities and other financial assets designated at fair value | Note 28 | Fair values of financial assets and liabilities |
| Note 29 | Derivative financial instruments |
Note 10 | Available-for-sale securities | Note 30 | Capital adequacy |
Note 11 | Loans | Note 31 | Securitisation and covered bonds |
Note 12 | Provisions for impairment charges | Note 32 | Group segment information |
Note 13 | Goodwill and other intangible assets | Note 33 | Auditor’s remuneration |
Note 14 | Property, plant and equipment | Note 34 | Expenditure commitments |
Note 15 | Deferred tax assets and deferred tax liabilities | Note 35 | Superannuation commitments |
Note 16 | Other assets | Note 36 | Contingent liabilities, contingent assets and credit commitments |
Note 17 | Payables due to other financial institutions | Note 37 | Fiduciary activities |
Note 18 | Deposits | Note 38 | Group entities |
Note 19 | Trading liabilities and other financial liabilities designated at fair value | Note 39 | Other group investments |
| Note 40 | Related party disclosures |
Note 20 | Provisions | Note 41 | Director and other key management personnel disclosures |
Note 21 | Other liabilities | Note 42 | Notes to the cash flow statements |
Note 22 | Debt issues | Note 43 | Subsequent events |
Note 23 | Loan capital | | |
| | | | |
Directors’ declaration
Management’s report on internal control over financial reporting
Independent Auditor’s report to the members of Westpac Banking Corporation
Report of independent registered public accounting firm
FINANCIAL STATEMENTS
Income statements for the years ended 30 September
Westpac Banking Corporation
| | | | Consolidated | | Parent Entity | |
| | | | 2012 | | | 2011 | | 2010 | | 2012 | | | 2011 | |
| | Note | | $m | | | $m | | $m | | $m | | | $m | |
Interest income | | 2 | | 36,873 | | | 38,098 | | 34,151 | | 36,401 | | | 37,107 | |
Interest expense | | 2 | | (24,371 | ) | | (26,102 | ) | (22,309 | ) | (25,851 | ) | | (26,755 | ) |
Net interest income | | | | 12,502 | | | 11,996 | | 11,842 | | 10,550 | | | 10,352 | |
Non-interest income | | 3 | | 5,481 | | | 4,917 | | 5,068 | | 4,041 | | | 3,579 | |
Net operating income before operating expenses and impairment charges | | | | 17,983 | | | 16,913 | | 16,910 | | 14,591 | | | 13,931 | |
Operating expenses | | 4 | | (7,909 | ) | | (7,406 | ) | (7,416 | ) | (6,491 | ) | | (6,096 | ) |
Impairment charges | | 12 | | (1,212 | ) | | (993 | ) | (1,456 | ) | (1,001 | ) | | (775 | ) |
Profit before income tax | | | | 8,862 | | | 8,514 | | 8,038 | | 7,099 | | | 7,060 | |
Income tax expense | | 5 | | (2,826 | ) | | (1,455 | ) | (1,626 | ) | (2,147 | ) | | (847 | ) |
Net profit for the year | | | | 6,036 | | | 7,059 | | 6,412 | | 4,952 | | | 6,213 | |
Profit attributable to non-controlling interests | | | | (66 | ) | | (68 | ) | (66 | ) | - | | | - | |
Net profit attributable to owners of Westpac Banking Corporation | | | | 5,970 | | | 6,991 | | 6,346 | | 4,952 | | | 6,213 | |
Earnings per share | | | | | | | | | | | | | | | |
Basic (cents) | | 7 | | 195.8 | | | 233.0 | | 214.2 | | | | | | |
Diluted (cents) | | 7 | | 190.5 | | | 223.6 | | 207.1 | | | | | | |
The above income statements should be read in conjunction with the accompanying notes.
| | |
130 | 2012 WESTPAC GROUP ANNUAL REPORT | |
FINANCIAL STATEMENTS
Statements of comprehensive income for the years ended 30 September
Westpac Banking Corporation
| | Consolidated | | Parent Entity | |
| | 2012 | | | 2011 | | 2010 | | 2012 | | | 2011 | |
| | $m | | | $m | | $m | | $m | | | $m | |
Net profit for the year | | 6,036 | | | 7,059 | | 6,412 | | 4,952 | | | 6,213 | |
Other comprehensive income: | | | | | | | | | | | | | |
Gains/(losses) on available-for-sale securities: | | | | | | | | | | | | | |
Recognised in equity | | 139 | | | (73 | ) | 92 | | 69 | | | (106 | ) |
Transferred to income statements | | (127 | ) | | (66 | ) | (1 | ) | (46 | ) | | (48 | ) |
Gains/(losses) on cash flow hedging instruments recognised in equity | | 519 | | | 796 | | (106 | ) | 473 | | | 761 | |
Defined benefit obligation actuarial gains/(losses) recognised in equity (net of tax) | | 23 | | | (189 | ) | (99 | ) | 37 | | | (181 | ) |
Exchange differences on translation of foreign operations | | (64 | ) | | 25 | | (122 | ) | (210 | ) | | 7 | |
Income tax on items taken directly to or transferred directly from equity: | | | | | | | | | | | | | |
Available-for-sale securities reserve | | (1 | ) | | 39 | | (28 | ) | (10 | ) | | 43 | |
Cash flow hedging reserve | | (160 | ) | | (243 | ) | 36 | | (142 | ) | | (229 | ) |
Foreign currency translation reserve | | 4 | | | (32 | ) | 6 | | 4 | | | (34 | ) |
Other comprehensive income for the year (net of tax) | | 333 | | | 257 | | (222 | ) | 175 | | | 213 | |
Total comprehensive income for the year | | 6,369 | | | 7,316 | | 6,190 | | 5,127 | | | 6,426 | |
Attributable to: | | | | | | | | | | | | | |
Owners of Westpac Banking Corporation | | 6,303 | | | 7,248 | | 6,124 | | 5,127 | | | 6,426 | |
Non-controlling interests | | 66 | | | 68 | | 66 | | - | | | - | |
Total comprehensive income for the year | | 6,369 | | | 7,316 | | 6,190 | | 5,127 | | | 6,426 | |
The above statements of comprehensive income should be read in conjunction with the accompanying notes.
| | |
| 2012 WESTPAC GROUP ANNUAL REPORT | 131 |
Balance sheets as at 30 September
Westpac Banking Corporation
| | | | Consolidated | | Parent Entity | |
| | | | 2012 | | | 2011 | | 2012 | | | 2011 | |
| | Note | | $m | | | $m | | $m | | | $m | |
Assets | | | | | | | | | | | | | |
Cash and balances with central banks | | 42 | | 12,523 | | | 16,258 | | 10,993 | | | 14,750 | |
Receivables due from other financial institutions | | 8 | | 10,228 | | | 8,551 | | 7,328 | | | 5,237 | |
Derivative financial instruments | | 29 | | 35,489 | | | 49,145 | | 35,184 | | | 48,879 | |
Trading securities | | 9 | | 44,603 | | | 47,971 | | 42,975 | | | 45,290 | |
Other financial assets designated at fair value | | 9 | | 2,664 | | | 2,960 | | 1,903 | | | 2,093 | |
Available-for-sale securities | | 10 | | 24,472 | | | 18,075 | | 21,039 | | | 15,426 | |
Loans – housing and personal | | 11 | | 365,221 | | | 351,969 | | 331,228 | | | 319,842 | |
Loans – business | | 11 | | 149,224 | | | 144,640 | | 126,261 | | | 127,537 | |
Life insurance assets | | | | 8,240 | | | 7,916 | | - | | | - | |
Regulatory deposits with central banks overseas | | | | 1,893 | | | 1,739 | | 1,773 | | | 1,649 | |
Due from subsidiaries | | | | - | | | - | | 92,740 | | | 56,938 | |
Deferred tax assets | | 15 | | 2,176 | | | 2,651 | | 2,032 | | | 2,456 | |
Investments in subsidiaries | | | | - | | | - | | 4,692 | | | 4,927 | |
Goodwill and other intangible assets | | 13 | | 12,134 | | | 11,779 | | 9,609 | | | 9,600 | |
Property, plant and equipment | | 14 | | 1,137 | | | 1,158 | | 960 | | | 982 | |
Other assets | | 16 | | 4,961 | | | 5,416 | | 3,888 | | | 4,426 | |
Total assets | | | | 674,965 | | | 670,228 | | 692,605 | | | 660,032 | |
Liabilities | | | | | | | | | | | | | |
Payables due to other financial institutions | | 17 | | 7,564 | | | 14,512 | | 7,490 | | | 14,397 | |
Deposits | | 18 | | 394,991 | | | 370,278 | | 359,329 | | | 341,457 | |
Derivative financial instruments | | 29 | | 38,935 | | | 39,405 | | 37,803 | | | 38,530 | |
Trading liabilities and other financial liabilities designated at fair value | | 19 | | 9,964 | | | 9,803 | | 9,964 | | | 9,803 | |
Debt issues | | 22 | | 147,581 | | | 165,659 | | 124,433 | | | 137,766 | |
Acceptances | | | | 266 | | | 272 | | 266 | | | 272 | |
Current tax liabilities | | | | 1,022 | | | 581 | | 937 | | | 541 | |
Deferred tax liabilities | | 15 | | 33 | | | 11 | | - | | | 1 | |
Life insurance liabilities | | | | 7,208 | | | 7,002 | | - | | | - | |
Due to subsidiaries | | | | - | | | - | | 93,379 | | | 61,782 | |
Provisions | | 20 | | 1,935 | | | 1,671 | | 1,764 | | | 1,480 | |
Other liabilities | | 21 | | 9,710 | | | 9,053 | | 7,940 | | | 7,243 | |
Total liabilities excluding loan capital | | | | 619,209 | | | 618,247 | | 643,305 | | | 613,272 | |
Loan capital | | 23 | | 9,537 | | | 8,173 | | 9,537 | | | 8,173 | |
Total liabilities | | | | 628,746 | | | 626,420 | | 652,842 | | | 621,445 | |
Net assets | | | | 46,219 | | | 43,808 | | 39,763 | | | 38,587 | |
Shareholders’ equity | | | | | | | | | | | | | |
Share capital: | | | | | | | | | | | | | |
Ordinary share capital | | 24 | | 26,355 | | | 25,456 | | 26,355 | | | 25,456 | |
Treasury shares and RSP treasury shares | | 24 | | (192 | ) | | (187 | ) | (114 | ) | | (118 | ) |
Reserves | | | | 958 | | | 498 | | 753 | | | 490 | |
Retained profits | | | | 17,128 | | | 16,059 | | 10,877 | | | 10,867 | |
Convertible debentures | | 24 | | - | | | - | | 1,892 | | | 1,892 | |
Total equity attributable to owners of Westpac Banking Corporation | | | | 44,249 | | | 41,826 | | 39,763 | | | 38,587 | |
Non-controlling interests | | 24 | | 1,970 | | | 1,982 | | - | | | - | |
Total shareholders’ equity and non-controlling interests | | | | 46,219 | | | 43,808 | | 39,763 | | | 38,587 | |
Contingent liabilities, contingent assets and credit commitments | | 36 | | | | | | | | | | | |
The above balance sheets should be read in conjunction with the accompanying notes.
| | |
132 | 2012 WESTPAC GROUP ANNUAL REPORT | |
FINANCIAL STATEMENTS
Statements of changes in equity as at 30 September
Westpac Banking Corporation
| | Consolidated | | Parent Entity | |
| | 2012 | | 2011 | | 2010 | | 2012 | | 2011 | |
| | $m | | $m | | $m | | $m | | $m | |
Share capital | | | | | | | | | | | |
Balance as at beginning of the year | | 25,269 | | 24,496 | | 23,496 | | 25,338 | | 24,568 | |
Shares issued: | | | | | | | | | | | |
Dividend reinvestment plan | | 873 | | 747 | | 961 | | 873 | | 747 | |
Option and share rights schemes | | 26 | | 23 | | 44 | | 26 | | 23 | |
Shares purchased for delivery upon exercise of options and share rights (net of tax) | | - | | - | | (3 | ) | - | | - | |
(Acquisition)/disposal of treasury shares | | 3 | | 3 | | (2 | ) | 12 | | - | |
Acquisition of RSP treasury shares | | (8 | ) | - | | - | | (8 | ) | - | |
Balance as at end of the year | | 26,163 | | 25,269 | | 24,496 | | 26,241 | | 25,338 | |
Available-for-sale securities reserve | | | | | | | | | | | |
Balance as at beginning of the year | | 31 | | 131 | | 66 | | (52 | ) | 59 | |
Current period movement due to changes in other comprehensive income: | | | | | | | | | | | |
Net gains/(losses) from changes in fair value | | 139 | | (73 | ) | 92 | | 69 | | (106 | ) |
Exchange differences | | 2 | | - | | 2 | | - | | - | |
Income tax effect | | (39 | ) | 23 | | (31 | ) | (24 | ) | 31 | |
Transferred to income statements | | (127 | ) | (66 | ) | (1 | ) | (46 | ) | (48 | ) |
Income tax effect | | 38 | | 16 | | 3 | | 14 | | 12 | |
Balance as at end of the year | | 44 | | 31 | | 131 | | (39 | ) | (52 | ) |
Share-based payment reserve | | | | | | | | | | | |
Balance as at beginning of the year | | 648 | | 540 | | 420 | | 602 | | 499 | |
Current period movement due to transactions with employees | | 142 | | 108 | | 120 | | 125 | | 103 | |
Balance as at end of the year | | 790 | | 648 | | 540 | | 727 | | 602 | |
Cash flow hedging reserve | | | | | | | | | | | |
Balance as at beginning of the year | | 112 | | (441 | ) | (371 | ) | 153 | | (379 | ) |
Current period movement due to changes in other comprehensive income: | | | | | | | | | | | |
Net gains/(losses) from changes in fair value | | 519 | | 796 | | (106 | ) | 473 | | 761 | |
Income tax effect | | (160 | ) | (243 | ) | 36 | | (142 | ) | (229 | ) |
Balance as at end of the year | | 471 | | 112 | | (441 | ) | 484 | | 153 | |
Foreign currency translation reserve | | | | | | | | | | | |
Balance as at beginning of the year | | (294 | ) | (287 | ) | (171 | ) | (254 | ) | (227 | ) |
Current period movement due to changes in other comprehensive income: | | | | | | | | | | | |
Foreign currency translation adjustment | | (64 | ) | 25 | | (122 | ) | (210 | ) | 7 | |
Tax on foreign currency translation adjustment | | 4 | | (32 | ) | 6 | | 4 | | (34 | ) |
Balance as at end of the year | | (354 | ) | (294 | ) | (287 | ) | (460 | ) | (254 | ) |
Other reserves | | | | | | | | | | | |
Balance as at beginning of the year | | 1 | | - | | - | | 41 | | 41 | |
Transactions with owners | | 6 | | 1 | | - | | - | | - | |
Balance as at end of the year | | 7 | | 1 | | - | | 41 | | 41 | |
Total reserves | | 958 | | 498 | | (57 | ) | 753 | | 490 | |
Movements in retained profits | | | | | | | | | | | |
Balance as at beginning of the year | | 16,059 | | 13,750 | | 11,197 | | 10,867 | | 9,393 | |
Current period movement due to changes in other comprehensive income: | | | | | | | | | | | |
Actuarial gains/(losses) on defined benefit obligations (net of tax) | | 23 | | (189 | ) | (99 | ) | 37 | | (181 | ) |
Profit attributable to owners of Westpac Banking Corporation | | 5,970 | | 6,991 | | 6,346 | | 4,951 | | 6,213 | |
Transaction with owners: | | | | | | | | | | | |
Ordinary dividends paid | | (4,924 | ) | (4,493 | ) | (3,694 | ) | (4,931 | ) | (4,500 | ) |
Distributions on convertible debentures | | - | | - | | - | | (47 | ) | (58 | ) |
Balance as at end of the year | | 17,128 | | 16,059 | | 13,750 | | 10,877 | | 10,867 | |
Total comprehensive income attributable to non-controlling interests | | 66 | | 68 | | 66 | | - | | - | |
Total comprehensive income attributable to owners of Westpac Banking Corporation | | 6,303 | | 7,248 | | 6,124 | | 5,127 | | 6,426 | |
Total comprehensive income for the year | | 6,369 | | 7,316 | | 6,190 | | 5,127 | | 6,426 | |
The above statements of changes in equity should be read in conjunction with the accompanying notes.
| | |
| 2012 WESTPAC GROUP ANNUAL REPORT | 133 |
Cash flow statements for the years ended 30 September
Westpac Banking Corporation
| | Consolidated | | Parent Entity | |
| | 2012 | | 2011 | | 2010 | | 2012 | | 2011 | |
| | $m | | $m | | $m | | $m | | $m | |
Cash flows from operating activities | | | | | | | | | | | |
Interest received | | 36,966 | | 37,864 | | 33,225 | | 36,590 | | 36,859 | |
Interest paid | | (24,317 | ) | (25,866 | ) | (20,854 | ) | (25,816 | ) | (26,517 | ) |
Dividends received excluding life business | | 12 | | 17 | | 25 | | 575 | | 637 | |
Other non-interest income received | | 3,703 | | 2,649 | | 3,785 | | 3,053 | | 1,726 | |
Operating expenses paid | | (5,646 | ) | (5,461 | ) | (6,036 | ) | (4,443 | ) | (4,393 | ) |
Net (purchases)/sales of trading and fair value assets | | 4,271 | | (8,117 | ) | 1,819 | | 3,112 | | (8,996 | ) |
Net purchases/(sales) in trading and fair value liabilities | | 155 | | 4,932 | | (5,936 | ) | 158 | | 4,933 | |
Net (payments)/receipts relating to derivative financial instruments | | 5,013 | | (16,960 | ) | (2,418 | ) | 4,989 | | (16,732 | ) |
Income tax paid excluding life business | | (1,897 | ) | (1,861 | ) | (3,537 | ) | (1,912 | ) | (1,755 | ) |
Life business: | | | | | | | | | | | |
Receipts from policyholders and customers | | 1,789 | | 2,256 | | 2,463 | | - | | - | |
Interest and other items of similar nature | | 41 | | 40 | | 24 | | - | | - | |
Dividends received | | 387 | | 379 | | 449 | | - | | - | |
Payments to policyholders and suppliers | | (1,898 | ) | (1,831 | ) | (2,475 | ) | - | | - | |
Income tax paid | | (95 | ) | (55 | ) | (66 | ) | - | | - | |
Net cash provided by/(used in) operating activities | | 18,484 | | (12,014 | ) | 468 | | 16,306 | | (14,238 | ) |
Cash flows from investing activities | | | | | | | | | | | |
Proceeds from sale of available-for-sale securities | | 3,651 | | 2,845 | | 3,080 | | 996 | | 742 | |
Purchase of available-for-sale securities | | (8,783 | ) | (7,978 | ) | (12,962 | ) | (5,491 | ) | (4,613 | ) |
Net (increase)/decrease in: | | | | | | | | | | | |
Receivables due from other financial institutions | | (2,418 | ) | 3,674 | | (3,330 | ) | (2,830 | ) | 4,454 | |
Loans | | (18,893 | ) | (18,325 | ) | (19,683 | ) | (11,815 | ) | (16,663 | ) |
Life insurance assets and liabilities | | (32 | ) | (254 | ) | (367 | ) | - | | - | |
Regulatory deposits with central banks overseas | | (263 | ) | (384 | ) | (685 | ) | (233 | ) | (339 | ) |
Other assets | | 168 | | (447 | ) | 530 | | 537 | | - | |
Investments in controlled entities | | - | �� | - | | - | | (8 | ) | - | |
Net movement in amounts due to/from controlled entities | | - | | - | | - | | (4,461 | ) | 1,004 | |
Purchase of intangible assets | | (603 | ) | (742 | ) | (508 | ) | (511 | ) | (635 | ) |
Purchase of property, plant and equipment | | (252 | ) | (402 | ) | (366 | ) | (213 | ) | (347 | ) |
Proceeds from disposal of property, plant and equipment | | 7 | | 15 | | 33 | | 7 | | 8 | |
Purchase of controlled entity, net of cash acquired | | (270 | ) | - | | - | | - | | - | |
Net cash used in investing activities | | (27,688 | ) | (21,998 | ) | (34,258 | ) | (24,022 | ) | (16,389 | ) |
Cash flows from financing activities | | | | | | | | | | | |
Issue of loan capital (net of issue costs) | | 4,124 | | - | | - | | 4,124 | | - | |
Redemption of loan capital | | (2,631 | ) | (1,404 | ) | (1,225 | ) | (2,631 | ) | (1,404 | ) |
Proceeds from share placement and share purchase plan | | - | | 68 | | - | | - | | - | |
Proceeds from exercise of employee options | | 25 | | 23 | | 48 | | 25 | | 23 | |
Purchase of shares on exercise of employee options and rights | | - | | - | | (5 | ) | - | | - | |
Net increase/(decrease) in: | | | | | | | | | | | |
Payables due to other financial institutions | | (6,807 | ) | 5,439 | | (406 | ) | (6,767 | ) | 5,333 | |
Deposits | | 26,381 | | 31,498 | | 12,379 | | 20,206 | | 29,497 | |
Debt issues and acceptances | | (9,955 | ) | 14,328 | | 27,666 | | (5,577 | ) | 12,214 | |
Other liabilities and provisions | | (1,075 | ) | (1,318 | ) | (531 | ) | (840 | ) | (1,147 | ) |
Purchase of treasury shares | | (8 | ) | (3 | ) | (13 | ) | (8 | ) | - | |
Sale of treasury shares | | 3 | | 6 | | 7 | | 12 | | - | |
Payment of dividends | | (4,050 | ) | (3,746 | ) | (2,733 | ) | (4,104 | ) | (3,812 | ) |
Payment of distributions to non-controlling interests | | (72 | ) | (82 | ) | (76 | ) | - | | - | |
Net cash provided by financing activities | | 5,935 | | 44,809 | | 35,111 | | 4,440 | | 40,704 | |
Net increase/(decrease) in cash and cash equivalents | | (3,269 | ) | 10,797 | | 1,321 | | (3,276 | ) | 10,077 | |
Effect of exchange rate changes on cash and cash equivalents | | (466 | ) | 997 | | (129 | ) | (481 | ) | 980 | |
Cash and cash equivalents as at the beginning of the year | | 16,258 | | 4,464 | | 3,272 | | 14,750 | | 3,693 | |
Cash and cash equivalents as at the end of the year | | 12,523 | | 16,258 | | 4,464 | | 10,993 | | 14,750 | |
The above cash flow statements should be read in conjunction with the accompanying notes.
Details of the reconciliation of net cash provided by operating activities to net profit attributable to owners of Westpac Banking Corporation are provided in Note 42.
| | |
134 | 2012 WESTPAC GROUP ANNUAL REPORT | |
NOTES TO THE FINANCIAL STATEMENTS
NOTE 1. SUMMARY OF SIGNIFICANT ACCOUNTING POLICIES
a. Basis of accounting
(i) General
This general purpose financial report has been prepared in accordance with the requirements for an authorised deposit-taking institution under the Banking Act 1959 (as amended), Australian Accounting Standards (A-IFRS), other authoritative pronouncements of the Australian Accounting Standards Board (AASB), Urgent Issues Group Interpretations and the Corporations Act 2001. Westpac Banking Corporation is a for-profit entity for the purposes of preparing this financial report.
The principal accounting policies adopted in the preparation of the financial report are set out below. These policies have been consistently applied to all the periods presented, unless otherwise stated.
This financial report also complies with International Financial Reporting Standards (IFRS) as issued by the International Accounting Standards Board (IASB).
This financial report also includes additional disclosures required for foreign registrants by the United States Securities and Exchange Commission. References to standards and interpretations under A-IFRS in this financial report have similar references in the standards and interpretations of IFRS as issued by the IASB.
This financial report of Westpac Banking Corporation (the Parent Entity), together with its controlled entities (the Group or Westpac), for the year ended 30 September 2012 was authorised for issue by the Board of Directors on 5 November 2012.
(ii) Comparative revisions
Comparative information has been revised where appropriate to enhance comparability. Where necessary, comparative figures have been adjusted to conform with changes in presentation in the current year.
(iii) Changes in accounting policies
As a result of the new and revised accounting standards which became operative for the annual reporting period commencing 1 October 2011, the following standards, interpretations and amendments have been adopted in the 2012 financial year and have not had a material impact on the Group:
AASB 2010-6 Amendments to Australian Accounting Standards — Disclosures on Transfers of Financial Assets was issued in November 2010 and is applicable to the 2012 financial year. This Standard adds and amends disclosure requirements in AASB 7 Financial Instruments: Disclosures about transfers of financial assets, including in respect of the nature of the financial assets involved and the risks associated with them.
AASB 2011-1 Amendments to Australian Accounting Standards arising from the Trans-Tasman Convergence Project and AASB 1054 Australian Additional Disclosures were issued in May 2011 and are applicable to the 2012 financial year. In 2009, the Australian and New Zealand Federal Governments announced their intention to undertake various short- to medium-term projects to support the aim of a single economic market. This included a single set of accounting standards that was accepted in both jurisdictions. AASB 2011-1 eliminates most of the existing differences between AASB, local New Zealand standards and IFRS. Where additional disclosures were considered necessary, these disclosures were moved to AASB 1054. The amendments simplify some current disclosures, remove others altogether and align the requirements of the two countries.
AASB 2010-4 Further Amendments to Australian Accounting Standards arising from the Annual Improvements Project was released in June 2010 and is applicable to the 2012 financial year. This standard makes amendments to various disclosure requirements in AASB 7 Financial Instruments: Disclosures, AASB 101 Presentation of Financial Statements and AASB 134 Interim Financial Reporting.
(iv) Historical cost convention
The financial report has been prepared under the historical cost convention, as modified by applying fair value accounting to available-for-sale financial assets and financial assets and liabilities (including derivative instruments) at fair value through profit or loss.
(v) Principles of consolidation
The consolidated financial statements incorporate the assets and liabilities of all subsidiaries (including special purpose entities) controlled by the Parent Entity and the results of all subsidiaries. The effects of all transactions between entities in the Group are eliminated. Control exists when the Parent Entity has the power, directly or indirectly, to govern the financial and operating policies of an entity so as to obtain benefits from its activities. The definition of control is based on the substance rather than the legal form of an arrangement. In assessing control, potential voting rights that are presently exercisable or convertible are taken into account.
Subsidiaries are fully consolidated from the date on which control commences and they are de-consolidated from the date that control ceases.
The purchase method of accounting is used to account for the acquisition of subsidiaries (refer to Note 1(e)).
| | |
| 2012 WESTPAC GROUP ANNUAL REPORT | 135 |
NOTE 1. SUMMARY OF SIGNIFICANT ACCOUNTING POLICIES (CONTINUED)
Changes in the Group’s ownership interest in a subsidiary after control is obtained that do not result in a loss of control are accounted for as transactions with equity holders in their capacity as equity holders. Any difference between the amount by which the non-controlling interest is adjusted and the fair value of the consideration paid or received is recognised directly in equity.
When the Group ceases to control a subsidiary any retained interest in the entity is remeasured to its fair value, with any resulting gain or loss recognised in the income statement.
The interest of non-controlling shareholders is stated at their proportion of the net profit and net assets of a subsidiary attributable to equity interests that are not owned, directly or indirectly, by Westpac.
(vi) Foreign currency translation
a. Functional and presentation currency
Items included in the financial statements of each of the Group’s entities are measured using the currency of the primary economic environment in which the entity operates (the functional currency). The financial statements are presented in Australian dollars. All amounts are expressed in Australian dollars except where otherwise indicated.
b. Transactions and balances
Foreign currency transactions are translated into the functional currency using the exchange rates prevailing at the dates of the transactions. Foreign exchange gains and losses resulting from the settlement of such transactions and from the translation at year-end exchange rates of monetary assets and liabilities denominated in foreign currencies are recognised in the income statements, except where deferred in other comprehensive income as qualifying cash flow hedges and qualifying net investment hedges.
c. Group companies
Assets and liabilities of overseas branches and subsidiaries that have a functional currency other than the Australian dollar are translated at exchange rates prevailing on the balance date. Income and expenses are translated at average exchange rates prevailing during the period. Other equity balances are translated at historical exchange rates. Exchange differences are recognised through the Statement of comprehensive income in the foreign currency translation reserve.
On consolidation, exchange differences arising from the translation of borrowings and other currency instruments designated as hedges of the net investment in overseas branches and subsidiaries are reflected in the foreign currency translation reserve. When all or part of a foreign operation is sold or borrowings that are part of the net investments are repaid, a proportionate share of such exchange differences are recognised in the income statement as part of the gain or loss on sale or repayment of borrowing.
Goodwill and fair value adjustments arising on the acquisition of a foreign entity are treated as assets and liabilities of the foreign entity and translated at the closing exchange rate.
b. Revenue recognition
(i) Interest income
Interest income for all interest earning financial assets including those at fair value is recognised in the income statement using the effective interest rate method.
The effective interest rate method is a method of calculating the amortised cost of a financial asset or a financial liability and of allocating the interest income or interest expense over the relevant period. The effective interest rate is the rate that exactly discounts estimated future cash payments or receipts through the expected life of the financial instrument to the net carrying amount of the financial asset or financial liability. When calculating the effective interest rate, cash flows are estimated based upon all contractual terms of the financial instrument (for example, prepayment options) but do not consider future credit losses. The calculation includes all fees and other amounts paid or received between parties to the contract that are an integral part of the effective interest rate, transaction costs and all other premiums or discounts.
Interest relating to impaired loans is recognised using the loan’s original effective interest rate based on the net carrying value of the impaired loan after giving effect to impairment charges or for a variable rate loan, the current effective interest rate determined under the contract. This rate is also used to discount the future cash flows for the purpose of measuring impairment charges. For loans that have been impaired this method results in cash receipts being apportioned between interest and principal.
(ii) Leasing
Finance leases are accounted for under the net investment method whereby income recognition is based on a pattern reflecting a constant periodic rate of return on the net investment in the finance lease and is included as part of interest income.
| | |
136 | 2012 WESTPAC GROUP ANNUAL REPORT | |
NOTES TO THE FINANCIAL STATEMENTS
NOTE 1. SUMMARY OF SIGNIFICANT ACCOUNTING POLICIES (CONTINUED)
(iii) Fee income
Fees and commissions are generally recognised on an accrual basis over the period during which the service is performed. All fees relating to the successful origination or settlement of a loan (together with the related direct costs) are deferred and recognised as an adjustment to the effective interest rate on the loan. Portfolio and other management advisory and service fees are recognised based on the applicable service contracts, usually on a time proportionate basis. Asset management fees related to investment funds are recognised over the period the service is provided. The same principle is applied for wealth management, financial planning and custody services that are continuously provided over an extended period of time.
(iv) Net trading income
Realised gains or losses, and unrealised gains or losses arising from changes in the fair value of the trading assets and liabilities are recognised as trading income in the income statement in the period in which they arise except for recognition of day one profits or losses which are deferred where certain valuation inputs are unobservable. Dividend income on the trading portfolio is also recorded as part of non-interest income. Interest income or expense on the trading portfolio is recognised as part of net interest income.
(v) Other dividend income
Dividends on quoted shares are recognised on the ex-dividend date. Dividends on unquoted shares are recognised when the company’s right to receive payment is established.
(vi) Gain or loss on sale of property, plant and equipment
The gain or loss arising on the disposal or retirement of an asset is determined as the difference between the sale proceeds less costs of disposal, and the carrying amount of the asset, and is recognised as non-interest income.
c. Expense recognition
(i) Interest expense
Interest expense, including premiums or discounts and associated expenses incurred on the issue of financial liabilities, is recognised in the income statement using the effective interest rate method (refer to Note 1(b)(i)).
(ii) Impairment on loans and receivables carried at amortised cost
The charge recognised in the income statement for impairment on loans and receivables carried at amortised cost reflects the net movement in the provisions for individually assessed and collectively assessed loans, write-offs and recoveries of impairments previously written-off.
(iii) Leasing
Operating lease payments are recognised in the income statement as an expense on a straight-line basis over the lease term unless another systematic basis is more representative of the time pattern of the benefit received. Incentives received on entering into operating leases are recorded as liabilities and amortised as a reduction of rental expense on a straight-line basis over the lease term.
(iv) Commissions and other fees
External commissions and other costs paid to acquire loans are capitalised and amortised using the effective interest rate method (refer to Note 1(b)(i)). All other fees and commissions are recognised in the income statement over the period in which the related service is received.
(v) Wealth management acquisition costs
Acquisition costs are the variable costs of acquiring new business principally in relation to the Group’s life insurance and retail funds management business.
Managed investment acquisition costs
Deferred acquisition costs associated with the retail funds management business are costs that are directly related to and incremental to the acquisition of new business. These costs are recorded as an asset and are amortised in the income statement on the same basis as the recognition of related revenue.
Life insurance acquisition costs
Deferred acquisition costs associated with the life insurance business are costs that are incremental to the acquisition of new business. These costs are recorded as an asset and are amortised in the income statement on the same basis as the recognition of related revenue.
| | |
| 2012 WESTPAC GROUP ANNUAL REPORT | 137 |
NOTE 1. SUMMARY OF SIGNIFICANT ACCOUNTING POLICIES (CONTINUED)
(vi) Share-based payment
Certain employees are entitled to participate in option and share ownership schemes.
Options and share rights
The fair value of options and share rights provided to employees as share-based payments is recognised as an expense with a corresponding increase in equity. The fair value is measured at grant date and is recognised over the period the services are received which is the expected vesting period during which the employees would become entitled to exercise the option or share right.
The fair value of options and share rights is estimated at grant date using a Binomial/Monte Carlo simulation pricing model incorporating the vesting and hurdle features of the grants. The fair value of the options and share rights excludes the impact of any non-market vesting conditions such as participants’ continued employment by the Group. The non-market vesting conditions are included in assumptions used when determining the number of options and share rights expected to become exercisable for which an expense is recognised. At each reporting date these assumptions are revised and the expense recognised each year takes into account the most recent estimates.
Employee Share Plan
The value of shares expected to be issued to employees for nil consideration under the Employee Share Plan (ESP) is recognised as an expense over the financial year and accrued in other liabilities. The fair value of any ordinary shares issued to satisfy the obligation to employees is recognised within equity, or if purchased on market, the obligation to employees is satisfied by delivering shares that have been purchased on market.
Restricted Share Plan
The fair value of shares allocated to employees for nil consideration under the Restricted Share Plan (RSP) is recognised as an expense over the vesting period. The fair value of ordinary shares issued to satisfy the obligation to employees is measured at grant date and is recognised as a separate component of equity.
Westpac has formed a trust to hold any shares forfeited by employees until they are reallocated to employees in subsequent grants in the Group’s RSP. Shares allocated to employees under the RSP, which have not yet vested, are treated as treasury shares and deducted from shareholders’ equity.
d. Income tax
Income tax expense on the profit for the year comprises current tax and the movement in deferred tax balances.
Current tax is the expected tax payable on the taxable income for the financial year using tax rates that have been enacted or substantively enacted for each jurisdiction at the balance date, and any adjustment to tax payable in respect of previous years.
Deferred tax is accounted for using the balance sheet method, providing for temporary differences between the carrying amounts of assets and liabilities in the financial statements and the corresponding amounts used for taxation purposes. Deferred tax assets and liabilities are not recognised if the temporary difference arises from goodwill or other intangible assets with indefinite expected life, the initial recognition of assets and liabilities that affect neither accounting nor taxable profit (other than in a business combination), or differences relating to investments in subsidiaries to the extent that they will probably not reverse in the foreseeable future. The amount of deferred tax provided is based on the expected manner of realisation or settlement of the carrying amount of assets and liabilities, using tax rates that have been enacted or substantively enacted for each jurisdiction at the balance date that are expected to apply when the liability is settled or the asset is realised.
Current and deferred tax attributable to amounts recognised in other comprehensive income are also recognised in other comprehensive income.
Except as noted above, deferred tax liabilities are recognised for all taxable temporary differences and deferred tax assets are recognised to the extent that it is probable that future taxable profits will be available against which the asset can be utilised. For presentation purposes deferred tax assets and deferred tax liabilities have been offset where they relate to the same taxation authority on the same taxable entity or different entities in the same taxable group.
For members of Westpac’s Australian tax consolidated group, tax expense/income, deferred tax liabilities and assets arising from temporary differences are recognised in the separate financial statements of the members of the tax-consolidated group using a ‘group allocation basis’ that removes the tax impact of certain transactions between members of the tax-consolidated group. Deferred tax liabilities and assets are recognised by reference to the carrying amounts in the separate financial statements of each entity and the tax values applying under tax consolidation. Current tax liabilities and assets and deferred tax assets arising from unused tax losses and relevant tax credits of the members of the tax-consolidated group are recognised by the Parent Entity (as head entity in the tax-consolidated group).
| | |
138 | 2012 WESTPAC GROUP ANNUAL REPORT | |
NOTES TO THE FINANCIAL STATEMENTS
NOTE 1. SUMMARY OF SIGNIFICANT ACCOUNTING POLICIES (CONTINUED)
e. Acquisitions of assets
(i) External acquisitions
The purchase method of accounting is used to account for all acquisitions of assets (including business combinations) regardless of whether equity instruments or other assets are acquired. Cost is measured as the fair value of the assets given, equity instruments issued or liabilities incurred or assumed at the date of exchange. Acquisition-related costs are expensed as incurred. Where equity instruments are issued in an acquisition, the value of the instruments is their published market price as at the date of exchange. Transaction costs arising on the issue of equity instruments are recognised directly in equity.
Identifiable assets acquired and liabilities and contingent liabilities assumed in a business combination are measured initially at their fair value at the acquisition date. For each business combination, the non-controlling interest is measured either at fair value or at the proportionate share of the acquiree’s identifiable net assets. The excess of the cost of acquisition, the amount of any non-controlling interest in the acquiree and the acquisition date fair value of any previous equity interest in the acquiree, over the fair value of the Group’s share of the identifiable net assets acquired, is recorded as goodwill.
Where settlement of any part of cash consideration is deferred, amounts payable in the future are discounted to their present value as at the date of exchange. The discount rate used is the Group’s incremental borrowing rate.
(ii) Common control transactions
The predecessor method of accounting is used to account for business combinations between entities in the Group.
Assets acquired and liabilities assumed in a common control transaction are measured initially at the acquisition date at the carrying value from the Group’s perspective. The excess of the cost of acquisition over the initial carrying values of the Entity’s share of the net assets acquired is recorded as part of a common control reserve.
Where relevant, in the financial report the phrase ‘additions through merger’ includes both balances acquired through external acquisitions and through common control transactions.
f. Assets
(i) Financial assets
The Group classifies its financial assets in the following categories: financial assets at fair value through profit or loss, loans and receivables, held-to-maturity investments and available-for-sale securities. Management determines the classification of its financial assets at initial recognition.
· Financial assets at fair value through profit or loss
This category has two sub-categories: firstly financial assets held for trading and secondly those designated at fair value through profit or loss at inception. A financial asset is classified in this category if acquired principally for the purpose of selling it in the near term, if it is part of a portfolio of financial instruments that are managed together and for which there is evidence of a recent pattern of short-term profit taking, if it is a derivative that is not a designated hedging instrument, or if so designated on acquisition by management, in accordance with conditions set out in Note 1(f)(i)(e).
· Loans and receivables
Loans and receivables are non-derivative financial assets with fixed or determinable payments that are not quoted in an active market.
· Held-to-maturity investments
Held-to-maturity investments are non-derivative financial assets with fixed or determinable payments and fixed maturity that the Group’s management has the positive intention and ability to hold to maturity.
· Available-for-sale securities
Available-for-sale securities are those debt or equity securities that are designated as available-for-sale or that are not classified as financial assets at fair value through profit or loss, loans and receivables or held-to-maturity investments.
Other investments, which comprise of unlisted equity securities that do not have a quoted price in an active market and where fair value cannot be estimated within a reasonable range of probable outcomes, are carried at cost.
Recognition of financial assets
Purchases and sales of financial assets at fair value through profit or loss, held-to-maturity and available-for-sale are recognised on trade-date, the date on which the Group commits to purchase or sell the asset. Loans are recognised when cash is advanced to the borrowers. Financial assets at fair value through profit or loss are recognised initially at fair value. All other financial assets are recognised initially at fair value plus directly attributable transaction costs.
| | |
| 2012 WESTPAC GROUP ANNUAL REPORT | 139 |
NOTE 1. SUMMARY OF SIGNIFICANT ACCOUNTING POLICIES (CONTINUED)
Available-for-sale financial assets and financial assets recognised at fair value through profit or loss are subsequently carried at fair value. Loans and receivables and held-to-maturity investments are subsequently carried at amortised cost using the effective interest method unless loans are designated at fair value through profit or loss in order to reduce an accounting mismatch. Realised and unrealised gains or losses arising from changes in the fair value of financial assets at fair value through profit or loss are included in the income statement in the period in which they arise. Gains and losses arising from changes in the fair value of available-for-sale financial assets are recognised in other comprehensive income until the financial asset is derecognised or impaired, at which time the cumulative gain or loss previously recognised in other comprehensive income is recognised in the income statement. Dividends on available-for-sale equity instruments are recognised in the income statement when the right to receive payment is established. Foreign exchange gains or losses and interest, calculated using the effective interest rate method, on available-for-sale debt instruments are also recognised in the income statement.
The fair values of quoted investments in active markets are based on current bid prices. If the market for a financial asset is not active, the Group establishes fair value using valuation techniques. These include the use of recent arm’s length transactions, discounted cash flow analysis, option pricing models and other valuation techniques commonly used by market participants.
a. Cash and balances with central banks
Cash and balances with central banks includes cash at branches, Reserve Bank settlement account balances and nostro balances. They are brought to account at the face value or the gross value of the outstanding balance, where appropriate. These balances have a maturity of less than three months.
b. Receivables due from other financial institutions
Receivables due from other financial institutions include conduit assets, collateral placed and interbank lending. They are accounted for as loans and receivables and subsequently measured at amortised cost using the effective interest rate method.
c. Derivative financial instruments
Derivative financial instruments including forwards, futures, swaps and options are recognised in the balance sheet at fair value. Fair value is obtained from quoted market prices, independent dealer price quotations, discounted cash flow models and option pricing models, which incorporate current market and contractual prices for the underlying instrument, time to expiry, yield curves and volatility of the underlying. Also included in the determination of the fair value of derivatives is a credit valuation adjustment (CVA). Where the derivative has a positive fair value (asset), this credit adjustment is to reflect the credit worthiness of the counterparty. Where the derivative has a negative fair value (liability), this credit adjustment reflects the Group’s own credit risk. These credit adjustments are taken into account after considering any relevant collateral or master netting agreements.
d. Trading securities
Trading securities include debt and equity instruments which are actively traded and securities purchased under agreement to resell. They are accounted for as financial assets at fair value through profit or loss.
e. Other financial assets designated at fair value
Certain non-trading bonds, notes and commercial bills are designated as fair value through profit or loss. This designation is only made if the financial asset contains an embedded derivative, it is managed on a fair value basis in accordance with a documented strategy, or if designating it at fair value reduces an accounting mismatch.
f. Available-for-sale securities
Available-for-sale securities are public and other debt and equity securities that are not classified as fair value through profit or loss, loans and receivables or as held-to-maturity investments. The accounting policy for available-for-sale securities is set out in Note 1(f)(i).
g. Loans
Loans includes advances, overdrafts, home loans, credit card and other personal lending, term loans, leasing receivables, bill financing and acceptances. The accounting policy for loans and receivables is in Note 1(f)(i).
Security is obtained if, based on an evaluation of the customer’s credit worthiness, it is considered necessary for the customer’s overall borrowing facility. Security would normally consist of assets such as cash deposits, receivables, inventory, plant and equipment, real estate or investments.
Loan products that have both a mortgage and deposit facility are presented on a gross basis in the balance sheet, segregating the loan and deposit component into the respective balance sheet line items. Interest earned on this product is presented on a net basis in the income statement as this reflects how the customer is charged.
| | |
140 | 2012 WESTPAC GROUP ANNUAL REPORT | |
NOTES TO THE FINANCIAL STATEMENTS |
|
NOTE 1. SUMMARY OF SIGNIFICANT ACCOUNTING POLICIES (CONTINUED)
h. Regulatory deposits with central banks overseas
In several countries in which the Group operates, the law requires that regulatory deposits be lodged with the local central bank at a rate of interest generally below that prevailing in the market. The amount of the deposit and the interest rate receivable is determined in accordance with the requirements of the local central bank. They are measured at amortised cost using the effective interest rate method.
i. Life insurance assets
Assets held by the life insurance companies, including investments in funds managed by the Group, are designated at fair value through profit or loss as required by AASB 1038 Life Insurance Contracts. Changes in fair value are included in the income statement. Most assets are held in the life insurance statutory funds and can only be used within the restrictions imposed under the Life Insurance Act 1995. The main restrictions are that the assets in a fund can only be used to meet the liabilities and expenses of that fund, to acquire investments to further the business of the fund or as distribution when solvency and capital adequacy requirements are met. Therefore they are not as liquid as other financial assets.
j. Derecognition of financial assets
A financial asset (or, where applicable, a part of a financial asset or part of a group of similar financial assets) is derecognised where:
§ the rights to receive cash flows from the asset have expired; or
§ the entity has transferred its rights to receive cash flows from the asset or has assumed an obligation to pay the received cash flows in full without material delay to a third party under a ‘pass-through’ arrangement and cannot sell or repledge the asset other than to the transferee; and
§ either the Group has transferred substantially all the risks and rewards of the asset, or the Group has neither transferred nor retained substantially all the risks and rewards of the asset, but has transferred control of the asset.
Where the Group transfers its right to receive cashflows from an asset or has entered into a pass-through arrangement without transferring nor retaining substantially all the risks and rewards of ownership nor transferred control of these assets, the asset continues to be recognised on the balance sheet to the extent of the Group’s continuing involvement in the asset.
(ii) Impairment of financial assets
Assets carried at amortised cost
The Group assesses at each balance date whether there is objective evidence that a financial asset or group of financial assets is impaired. A financial asset or a group of financial assets is impaired and impairment charges are recognised if there is objective evidence of impairment as a result of one or more events that occurred after the initial recognition of the asset (a ‘loss event’) and that loss event (or events) has an impact on the estimated future cash flows of the financial asset or group of financial assets that can be reliably estimated. Objective evidence that a financial asset or group of assets is impaired includes observable data that comes to the attention of the Group about the following loss events:
a. significant financial difficulty of the issuer or obligor;
b. a breach of contract, such as a default or delinquency in interest or principal payments;
c. the Group granting to the borrower, for economic or legal reasons relating to the borrower’s financial difficulty, a concession that the Group would not otherwise consider;
d. it becoming probable that the borrower will enter bankruptcy or other financial reorganisation;
e. the disappearance of an active market for that financial asset because of financial difficulties; or
f. observable data indicating that there is a measurable decrease in the estimated future cash flows from a group of financial assets since the initial recognition of those assets, although the decrease cannot yet be identified with the individual financial assets in the Group, including:
– adverse changes in the payment status of borrowers in the Group; or
– national or local economic conditions that correlate with defaults on the assets in the Group.
The Group first assesses whether objective evidence of impairment exists individually for financial assets that are individually significant, and individually or collectively for financial assets that are not individually significant. If the Group determines that no objective evidence of impairment exists for an individually assessed financial asset, whether significant or not, it includes the asset in a group of financial assets with similar credit risk characteristics and collectively assesses them for impairment. Assets that are individually assessed for impairment and for which an impairment is, or continues to be, recognised are not included in a collective assessment of impairment.
| | |
| 2012 WESTPAC GROUP ANNUAL REPORT | 141 |
NOTE 1. SUMMARY OF SIGNIFICANT ACCOUNTING POLICIES (CONTINUED)
If there is objective evidence that an impairment on loans and receivables or held-to-maturity investments has been incurred, the amount of the charge is measured as the difference between the asset’s carrying amount and the present value of estimated future cash flows (excluding future credit losses that have not been incurred) discounted at the financial asset’s original effective interest rate. The carrying amount of the asset is reduced through the use of a provision account and the amount of the loss is recognised in the income statement. If a loan or held-to-maturity investment has a variable interest rate, the discount rate for measuring any impairment is the current effective interest rate determined under the contract.
The calculation of the present value of the estimated future cash flows of a collateralised financial asset reflects the cash flows that may result from foreclosure less costs for obtaining and selling the collateral, whether or not foreclosure is probable. For the purposes of a collective evaluation of impairment, financial assets are grouped on the basis of similar credit risk characteristics (i.e. on the basis of the Group’s grading process that considers asset type, industry, geographical location, collateral type, past-due status and other relevant factors). Those characteristics are relevant to the estimation of future cash flows for groups of such assets by being indicative of the debtors’ ability to pay all amounts due according to the contractual terms of the assets being evaluated. Future cash flows for a group of financial assets that are collectively evaluated for impairment are estimated on the basis of the contractual cash flows of the assets in the group and historical loss experience for assets with credit risk characteristics similar to those in the group. Historical loss experience is adjusted on the basis of current observable data to reflect the effects of current conditions that did not affect the period on which the historical loss experience is based and to remove the effects of conditions in the historical period that do not exist currently.
Estimates of changes in future cash flows for groups of assets reflect, and are directionally consistent with, changes in related observable data from period to period (for example, changes in unemployment rates, property prices, payment status, or other factors indicative of changes in the probability of losses in the group and their magnitude). The methodology and assumptions used for estimating future cash flows are reviewed regularly by the Group to reduce any differences between loss estimates and actual loss experience. When a loan or a part of a loan is uncollectable, it is written off against the related provision for loan impairment. Such loans are written off after all the necessary procedures have been completed and the amount of the loss has been determined. Subsequent recoveries of amounts previously written off decrease the amount of the charge for loan impairment in the income statement. If, in a subsequent period, the amount of the impairment charge decreases and the decrease can be related objectively to an event occurring after the impairment was recognised (such as an improvement in the debtor’s credit rating), the previously recognised impairment charge is reversed by adjusting the provision account. The amount of the reversal is recognised in the income statement.
Available-for-sale
The Group assesses at each reporting date whether there is objective evidence that a financial asset or a group of financial assets is impaired. For debt instruments classified as available-for-sale, impairment is determined by using the same methodology as Note 1(f)(ii). For equity investments classified as available-for-sale, a significant or prolonged decline in the fair value of the security below its cost is also considered in determining whether the assets are impaired. If any such evidence exists for available-for-sale financial assets, the cumulative loss – measured as the difference between the acquisition cost and the current fair value, less any impairment charge on that financial asset previously recognised in profit or loss – is removed from other comprehensive income and recognised in the income statement. If, in a subsequent period, the fair value of a debt instrument classified as available-for-sale increases and the increase can be objectively related to an event occurring after the impairment charge was recognised in the income statement, the impairment charge is reversed through the income statement. Subsequent reversal of impairment charges on equity instruments are not recognised in the income statement.
(iii) Non-financial assets
a. Property, plant and equipment
Property, plant and equipment is carried at cost less accumulated depreciation and impairment. Cost is the fair value of the consideration provided plus incidental costs directly attributable to the acquisition. Other subsequent expenditure is capitalised only when it increases the future economic benefits embodied in the item of property, plant and equipment. All other expenditure is recognised in the income statement as an expense as incurred. Impairment is recognised as a part of operating expenses in the income statement.
Computer software is capitalised at cost and classified as property, plant and equipment where it is integral to the operation of associated hardware.
Depreciation is calculated using the straight-line method to allocate the cost of assets less any residual value over their estimated useful lives, as follows:
§ Premises and sites | Up to 50 years |
| |
§ Leasehold improvements | Up to 10 years |
| |
§ Furniture and equipment | 3 to 15 years |
The gain or loss arising on the disposal or retirement of an asset is determined as the difference between the sale proceeds less costs of disposal, and the carrying amount of the asset, and is recognised as non-interest income.
| | |
142 | 2012 WESTPAC GROUP ANNUAL REPORT | |
NOTES TO THE FINANCIAL STATEMENTS |
|
NOTE 1. SUMMARY OF SIGNIFICANT ACCOUNTING POLICIES (CONTINUED)
b. Intangible assets
Goodwill
Goodwill represents amounts arising on the acquisition of businesses. Prior to the revised AASB 3 Business Combinations, goodwill represented the excess of purchase consideration, including directly attributable expenses associated with the acquisition, over the fair value of the Group’s share of the identifiable net assets of the acquired business. Goodwill arising on the acquisition of a business subsequent to the adoption of the revised AASB 3 represents the excess of the purchase consideration, the amount of any non-controlling interest in the acquiree and the acquisition date fair value of any previous equity interest in the acquiree, over the fair value of the Group’s share of net identifiable assets acquired.
All goodwill is considered to have an indefinite life.
Goodwill is tested for impairment annually and whenever there is an indication that it may be impaired, and is carried at cost or deemed cost less accumulated impairment. Gains or losses on the disposal of an entity include the carrying amount of goodwill relating to the entity sold.
Goodwill is allocated to CGUs based on management’s analysis of where the synergies resulting from an acquisition are expected to arise.
§ Brands
Brand intangible assets are recognised on the acquisition of businesses and represent the value attributed to brand names associated with businesses acquired. The useful life of brands recognised is estimated to be indefinite as there is no foreseeable limit to the period over which the brand name is expected to generate net cash flows. Brands are not amortised but tested for impairment annually or more frequently when indicators of impairment are identified.
§ Core deposit intangibles
Core deposit intangibles were recognised as part of the merger with St.George and represent the value, or avoided cost, of having a deposit base from consumer and business transaction accounts, savings accounts, term deposits and other money market and cash management accounts that provide a valuable source of funding.
Core deposit intangibles are amortised using the straight-line method over a period of nine years and are stated at cost less accumulated amortisation and impairment. Core deposit intangibles are assessed for impairment at each reporting date and whenever there is an indicator of impairment.
Other intangibles
Other intangibles are stated at cost less accumulated amortisation (where relevant) and impairment. Other intangibles consist of distribution relationships, customer relationships, computer software, value of in-force business and service contracts. These are assessed for impairment at each reporting date and whenever there is an indicator of impairment. For significant other intangibles, the accounting policies are as follows:
§ Financial planner distribution relationships
Distribution relationship intangibles were recognised as part of the merger with St.George and represent the value attributable to financial planner relationships. These assets are amortised using the straight-line method to allocate the cost of the assets over their estimated useful lives of eight years.
§ Credit card customer relationships
The credit card customer relationship intangibles were recognised as part of the merger with St.George and represent the value attributable to the future fee and interest revenue from credit card relationships. These assets are amortised using the straight-line method to allocate the cost of the assets over their estimated useful lives of five years.
§ Computer software
Internal and external costs directly incurred in the purchase or development of computer software, including subsequent upgrades and enhancements are recognised as intangible assets when it is probable that they will generate future economic benefits attributable to the Group. These assets are amortised using the straight-line method to allocate the cost of the asset less any residual value over their estimated useful lives of between three and ten years.
(iv) Investments in controlled entities
Investments in controlled entities are initially recorded by Westpac at cost. Investments in controlled entities are subsequently held at the lower of cost and recoverable amount.
| | |
| 2012 WESTPAC GROUP ANNUAL REPORT | 143 |
NOTE 1. SUMMARY OF SIGNIFICANT ACCOUNTING POLICIES (CONTINUED)
(v) Impairment of non-financial assets
The carrying amount of the Group’s non-financial assets, other than deferred tax assets and assets arising from employee benefits, are reviewed at each balance date to determine whether there is any indication of impairment. If such an indication exists, the asset’s recoverable amount is estimated. An impairment charge is recognised whenever the carrying amount of an asset or the CGU to which it is allocated exceeds its recoverable amount. With the exception of goodwill for which impairment charges are not reversed, where an impairment charge subsequently reverses, the carrying amount of the asset (or CGU) is increased to the revised estimate of its recoverable amount, such that the increased carrying amount does not exceed the carrying amount that would have been determined had no impairment charge been recognised for the asset (or CGU) in prior years. Impairment charges and reversals of impairment charges are recognised in the income statement.
The recoverable amount of an asset is the greater of its fair value less cost to sell and value-in-use. In assessing value-in-use, estimated future cash flows are discounted to their present value using a pre-tax discount rate that reflects current market assessments of the time value of money and the risks specific to the asset. For an asset that does not generate largely independent cash inflows, the recoverable amount is determined for the CGU to which the asset belongs.
g. Liabilities
(i) Financial liabilities
Financial liabilities are initially recognised at fair value plus transaction costs except where they are subsequently measured at fair value, in which case transaction costs are expensed as incurred. They are subsequently measured at amortised cost except for derivatives and liabilities at fair value, which are held at fair value through profit or loss. Financial liabilities are recognised when an obligation arises and derecognised when it is discharged, cancelled or expires.
a. Payables due to other financial institutions
Payables due to other financial institutions includes interbank lending, vostro balances, collateral received and settlement account balances due to other financial institutions. They are measured at amortised cost.
b. Deposits at fair value
Deposits at fair value include certificates of deposit and interest bearing deposits. They are classified at fair value through profit or loss as they are managed as part of a trading portfolio.
c. Deposits at amortised cost
Deposits at amortised cost include non-interest bearing deposits repayable at call, certificates of deposit and interest bearing deposits. They are measured at amortised cost.
d. Derivative financial instruments
Derivative financial instruments including forwards, futures, swaps and options are recognised in the balance sheet at fair value. Fair values are obtained from quoted market prices, independent dealer price quotations, discounted cash flow models and option pricing models, which incorporate current market and contractual prices for the underlying instrument, time to expiry, yield curves and volatility of the underlying. Also included in the determination of the fair value of derivatives is a CVA. Where the derivative has a positive fair value (asset), this credit adjustment reflects the credit worthiness of the counterparty. Where the derivative has a negative fair value (liability), this credit adjustment reflects the Group’s own credit risk. These credit adjustments are taken into account after considering any relevant collateral or master netting agreements.
e. Trading liabilities and other financial liabilities designated at fair value
Securities sold under repurchase agreements as part of a trading portfolio and securities sold short are classified as trading liabilities. They are accounted for as financial liabilities at fair value through profit or loss.
f. Debt issues
These are bonds, notes, commercial paper and debentures that have been issued by entities in the Westpac Group. Debt issues are measured either at fair value through profit or loss or at amortised cost using the effective interest rate method. Debt issues are measured at fair value through profit or loss to reduce an accounting mismatch, which arises from associated derivatives executed for risk management purposes.
g. Acceptances
These are bills of exchange initially accepted and discounted by Westpac that have been subsequently rediscounted into the market. They are measured at amortised cost. Bill financing provided to customers by the acceptance and discount of bills of exchange is reported as part of loans. Acceptances have been reported separately from debt issues, on the face of the balance sheet, as these are predominantly rediscounted to retail investors.
| | |
144 | 2012 WESTPAC GROUP ANNUAL REPORT | |
NOTES TO THE FINANCIAL STATEMENTS |
|
NOTE 1. SUMMARY OF SIGNIFICANT ACCOUNTING POLICIES (CONTINUED)
h. Loan capital
Loan capital includes 2004 Trust Preferred Securities (2004 TPS), Westpac Convertible Preference Shares and Westpac SPS and SPS II that qualify as Tier 1 capital and subordinated bonds, notes and debentures that qualify as Tier 2 capital as defined by APRA for capital adequacy purposes. Loan capital is measured at amortised cost using the effective interest method.
i. Financial guarantees
Financial guarantee contracts are recognised as financial liabilities at the time the guarantee is issued. The liability is initially measured at fair value and subsequently at the higher of the amount determined in accordance with AASB 137 Provisions, Contingent Liabilities and Contingent Assets and the amount initially recognised less cumulative amortisation, where appropriate.
The fair value of a financial guarantee contract is determined as the present value of the difference in net cash flows between the contractual payments under the debt instrument and the payments that would be required without the guarantee, or the estimated amount that would be payable to a third party for assuming the obligation.
j. Derecognition of financial liabilities
A financial liability is derecognised when the obligation under the liability is discharged, cancelled or expires. Where an existing financial liability is replaced by another from the same lender on substantially different terms, or the terms of an existing liability are substantially modified, such an exchange or modification is treated as a derecognition of the original liability and the recognition of a new liability, and the difference in the respective carrying amounts is recognised in profit or loss.
(ii) Life insurance liabilities
Life insurance liabilities consist of life insurance contract liabilities, life investment contract liabilities and external liabilities of managed investment schemes controlled by statutory life funds.
Life insurance contract liabilities
The value of life insurance contract liabilities is calculated using the margin on services methodology. The methodology takes into account the risks and uncertainties of the particular classes of the life insurance business written. Deferred policy acquisition costs are included in the measurement basis of life insurance contract liabilities and are therefore equally sensitive to the factors that are considered in the liabilities measurement. This methodology is in accordance with Actuarial Standard 1.04 Valuation of Policy Liabilities issued by the Life Insurance Actuarial Standard Board (LIASB) under the Life Insurance Act 1995.
Under this methodology, planned profit margins and an estimate of future liabilities are calculated separately for each related product group using applied assumptions at each reporting date. Profit margins are released over each reporting period in line with the service that has been provided. The balance of the planned profit is deferred by including them in the value of policy liabilities.
The key factors that affect the estimation of these liabilities and related assets are:
§ the cost of providing benefits and administrating the contracts;
§ mortality and morbidity experience, including enhancements to policyholder benefits;
§ discontinuance experience, which affects the Group’s ability to recover the cost of acquiring new business over the life of the contracts; and
§ the rate at which projected future cash flows are discounted.
In addition, factors such as regulation, competition, interest rates, taxes, securities market conditions and general economic conditions affect the level of these liabilities. In some contracts, the Group shares experience on investment results with its customers, which can offset the impacts of these factors on the profitability of these products.
Life investment contract liabilities
Life investment contract liabilities are designated at fair value through profit or loss. Fair value is based on the higher of the valuation of linked assets, or the minimum current surrender value.
External liabilities of managed investment schemes controlled by statutory life funds
External liabilities of managed investment schemes controlled by statutory life funds are designated at fair value through profit or loss.
| | |
| 2012 WESTPAC GROUP ANNUAL REPORT | 145 |
NOTE 1. SUMMARY OF SIGNIFICANT ACCOUNTING POLICIES (CONTINUED)
(iii) Provisions
a. Employee entitlements
Wages and salaries, annual leave and sick leave
Liabilities for wages and salaries, including non-monetary benefits, annual leave and accumulating sick leave expected to be settled within 12 months of the balance date are recognised in provisions in respect of employees’ services up to the balance date and are measured at the amounts expected to be paid when the liabilities are settled.
No provision is made for non-vesting sick leave as the pattern of sick leave taken indicates that no additional liability will arise for non-vesting sick leave.
Long service leave
Liabilities for long service leave expected to be settled within 12 months of the balance date are recognised in the provision for long service leave and are measured at the amounts expected to be paid when the liabilities are settled.
Liabilities for long service leave and other deferred employee benefits expected to be settled more than 12 months from the balance date are recognised in the provision for long service leave and are measured at the present value of future payments expected to be made in respect of services provided by employees up to the balance date. Consideration is given to expected future wage and salary levels, experience of employee departure and periods of service. Expected future payments are discounted to their net present value using market yields at the balance date on government bonds with terms that match as closely as possible the estimated timing of future cash flows.
Employee benefit on-costs
A liability is also carried for on-costs, including payroll tax, in respect of provisions for certain employee benefits which attract such costs.
Termination benefits
Liabilities for termination benefits are recognised when a detailed plan for the terminations has been developed and a valid expectation has been raised in those employees affected that the terminations will be carried out. Liabilities for termination benefits are recognised within other liabilities unless the timing or amount is uncertain, in which case they are recognised as provisions.
Liabilities for termination benefits expected to be settled within 12 months are measured at amounts expected to be paid when they are settled. Amounts expected to be settled more than 12 months from the balance date are measured at the estimated cash outflows, discounted using market yields at the balance date on government bonds with terms to maturity and currency that match, as closely as possible, the estimated future payments, where the effect of discounting is material.
b. Provision for leasehold premises
The provision for leasehold premises covers net outgoings on certain unoccupied leased premises or sub-let premises where projected rental income falls short of rental expense. The liability is determined on the basis of the present value of net future cash flows.
c. Provision for restructuring
A provision for restructuring is recognised where there is a demonstrable commitment and a detailed plan such that there is little or no discretion to avoid payments to other parties and the amount can be reliably estimated.
d. Provision for dividends
A liability for dividends is recognised when dividends are declared, determined or publicly recommended by the Directors but not distributed as at the balance date.
e. Provision for litigation and non-lending losses
A provision for litigation is recognised where it is probable that there will be an outflow of economic resources. Non-lending losses are any losses that have not arisen as a consequence of an impaired credit decision. Those provisions include litigation and associated costs, frauds and the correction of operational issues.
f. Provision for impairment on credit commitments
A provision for undrawn contractually committed facilities and guarantees provided are calculated using the same methodology as provision for impairment charges on loans (refer to Note 1(j)(ii)).
| | |
146 | 2012 WESTPAC GROUP ANNUAL REPORT | |
NOTES TO THE FINANCIAL STATEMENTS |
|
NOTE 1. SUMMARY OF SIGNIFICANT ACCOUNTING POLICIES (CONTINUED)
h. Equity
(i) Ordinary shares
Ordinary shares are recognised at the amount paid up per ordinary share net of directly attributable issue costs.
(ii) Treasury shares
Where the Parent Entity or other members of the consolidated Group purchases shares in the Parent Entity, the consideration paid is deducted from total shareholders’ equity and the shares are treated as treasury shares until they are subsequently sold, reissued or cancelled. Where such shares are sold or reissued, any consideration received is included in shareholders’ equity.
(iii) Other equity instruments
Convertible debentures issued by the parent entity in respect of the 2003 Trust Preferred Securities (2003 TPS) and 2006 Trust Preferred Securities (2006 TPS) are recognised in the balance sheet at the amount of consideration received net of issue costs. They are translated into Australian currency using the rate of exchange on issue date and distributions on them are recognised when entitlements are determined in accordance with the terms of the convertible debentures.
(iv) Non-controlling interests
Non-controlling interests represents the share in the net assets of subsidiaries attributable to equity interests that are not owned directly or indirectly by the Parent Entity. The Group also has on issue 2003 TPS and 2006 TPS that are hybrid instruments and are classified as non-controlling interests.
(v) Reserves
Foreign currency translation reserve
As noted in Note 1(a)(vi), exchange differences arising on translation of the assets and liabilities of overseas branches and subsidiaries are reflected in the foreign currency translation reserve. Any offsetting gains or losses on hedging these balances, together with any tax effect are also reflected in this reserve, which may be either a debit or credit balance. Any credit balance in this reserve would not normally be regarded as being available for payment of dividends until such gains are realised.
Available-for-sale securities reserve
This comprises the changes in the fair value of available-for-sale financial securities, net of tax. These changes are transferred to the income statement in non-interest income when the asset is either derecognised or impaired.
Cash flow hedging reserve
This comprises the fair value gains and losses associated with the effective portion of designated cash flow hedging instruments.
Share-based payment reserve
This comprises the fair value of share-based payments recognised as an expense.
Other reserves
Other reserves for the Parent Entity consists of the common control reserve (refer Note 1(e)(ii)). Other reserves for the Group consists of transactions relating to a change in the parent entity’s ownership of a subsidiary that does not result in a loss of control. The amount recorded in other reserves reflects the difference between the amount by which non-controlling interests are adjusted and the fair value of any consideration paid or received.
i. Other accounting principles and policies
(i) Hedging
The Group uses derivative instruments as part of its asset and liability management activities to manage exposures to interest rates and foreign currency, including exposures arising from forecast transactions. The method of recognising the fair value gain or loss of derivatives depends on the nature of the hedging relationship. Hedging relationships are of three types:
§ fair value hedge: a hedge of the change in fair value of recognised assets or liabilities or unrecognised firm commitments;
§ cash flow hedge: a hedge of variability in highly probable future cash flows attributable to a recognised asset or liability, or a forecasted transaction; and
§ hedge of a net investment in a foreign operation: a hedge of the amount of the Group’s interest in the net assets of a foreign operation.
The Group uses hedge accounting for derivatives designated in this way when certain criteria are met. At the time a financial instrument is designated as a hedge, the Group formally documents the relationship between the hedging instrument and hedged item, together with the methods that will be used to assess the effectiveness of the hedging relationship. The Group formally assesses, both at the inception of the hedge and on an ongoing basis, whether the hedging derivatives have been highly effective in offsetting changes in the fair value or cash flows of the hedged items.
| | |
| 2012 WESTPAC GROUP ANNUAL REPORT | 147 |
NOTE 1. SUMMARY OF SIGNIFICANT ACCOUNTING POLICIES (CONTINUED)
A hedge is regarded as highly effective if, at inception and throughout its life, the Group can expect changes in the fair value or cash flows of the hedged item to be almost fully offset by the changes in the fair value or cash flows of the hedging instrument, and actual results of the hedge are within a range of 80% to 125% of these changes. Hedge ineffectiveness represents the amount by which the changes in the fair value of the hedging derivative differ from changes in the fair value of the hedged item or the amount by which changes in the cash flow of the hedging derivative differ from changes (or expected changes) in the present value of the cash flows of the hedged item.
a. Fair value hedge
Changes in the fair value of derivatives that are designated and qualify as fair value hedges are recorded in the income statement, together with any changes in the fair value of the hedged asset or liability that are attributed to the hedged risk.
If the hedge no longer meets the criteria for hedge accounting, any previous adjustment to the carrying amount of a hedged item recognised at amortised cost is amortised to the income statement over the period to maturity.
b. Cash flow hedge
The effective portion of changes in the fair value of derivatives that are designated and qualify as cash flow hedges are recognised in other comprehensive income. The gain or loss relating to any ineffective portion is recognised immediately in the income statement.
When a hedging instrument expires or is sold, terminated or exercised, or when the hedge no longer meets the criteria for hedge accounting, any cumulative gain or loss existing in other comprehensive income at that time remains in other comprehensive income and is recognised in the period in which the hedge item affects profit or loss. When a forecast transaction is no longer expected to occur, the cumulative gain or loss that was reported in other comprehensive income is immediately transferred to the income statement.
c. Hedge of a net investment in a foreign operation
Hedges of net investments in overseas branches and subsidiaries are accounted for in a manner similar to cash flow hedges. Any gain or loss on the hedging instrument relating to the effective portion of the hedge is recognised in the foreign currency translation reserve in other comprehensive income and the gain or loss relating to the ineffective portion is recognised immediately in the income statement. Gains and losses accumulated in other comprehensive income are included in the income statement when the overseas branch or subsidiary is disposed.
(ii) Embedded derivatives
In certain instances a derivative may be embedded in a host contract. If the host contract is not carried at fair value through profit or loss, the embedded derivative is separated from the host contract and accounted for as a standalone derivative instrument at fair value where the economic characteristics and risks of the embedded derivative are not closely related to the economic characteristics and risks of the host contract.
(iii) Recognition of deferred day one profit or loss
The best evidence of fair value at initial recognition is the transaction price, unless the fair value of that instrument is evidenced by comparison with other observable current market transactions in the same instrument, or based on a valuation technique whose variables include only data from observable markets.
Westpac has entered into transactions where fair value is determined using valuation models for which not all significant inputs are market observable prices or rates. Such a financial instrument is initially recognised at the transaction price which is the best indicator of fair value, although the value obtained from the relevant valuation model may differ. The difference between the transaction price and the model value, commonly referred to as ‘day one profit or loss’, is not recognised immediately in profit or loss.
The timing of recognition of deferred day one profit or loss is determined individually. It is either amortised over the life of the transaction, deferred until the instrument’s fair value can be determined using market observable inputs, or realised through settlement. The financial instrument is subsequently measured at fair value, adjusted for the deferred day one profit or loss. Subsequent changes in fair value are recognised immediately in the income statement without reversal of deferred day one profits or losses.
(iv) Loan securitisation
The Group, through its loan securitisation program, packages and sells loans (principally housing mortgage loans) as securities to investors. The program includes the securitisation of the Group’s own assets as well as assets from customer funding conduits. In such transactions, the Group provides an equitable interest in the loans to investors who provide funding to the Group. Securitised loans that do not qualify for derecognition and associated funding are included in loans and debt issues respectively.
| | |
148 | 2012 WESTPAC GROUP ANNUAL REPORT | |
NOTES TO THE FINANCIAL STATEMENTS
NOTE 1. SUMMARY OF SIGNIFICANT ACCOUNTING POLICIES (CONTINUED)
(v) Fiduciary activities
Certain controlled entities within the Group conduct investment management and other fiduciary activities as responsible entity or manager on behalf of individuals, trusts, retirement benefit plans and other institutions. These activities involve the management of assets in investment schemes and superannuation funds, and the holding or placing of assets on behalf of third parties.
Where controlled entities, as responsible entities, incur liabilities in respect of these activities, a right of indemnity exists against the assets of the applicable trusts. As these assets are sufficient to cover liabilities, and it is not probable that the controlled entities will be required to settle them, the assets and liabilities are not included in the consolidated financial statements.
The Group also manages life insurance statutory fund assets that are included in the consolidated financial statements.
(vi) Offsetting
Financial assets and liabilities are offset and the net amount reported in the balance sheet when there is a legally enforceable right to set off the recognised amounts and there is an intention to settle on a net basis, or to realise the asset and settle the liability simultaneously.
(vii) Securities borrowed or lent and repurchase or reverse repurchase agreements
As part of its trading activities, Westpac lends and borrows securities on a collateralised basis. The securities subject to the borrowing or lending are not derecognised from the balance sheet, as the risks and rewards of ownership remain with the initial holder. Where cash is provided as collateral, the cash paid to third parties on securities borrowed is recorded as a receivable, while cash received from third parties on securities lent is recorded as a borrowing. Repurchase transactions, where Westpac sells securities under an agreement to repurchase, and reverse repurchase transactions, where Westpac purchases securities under an agreement to resell, are conducted on a collateralised basis. Certificates of deposit sold, but subject to repurchase agreements that are due from financial institutions are disclosed as part of trading liabilities and other financial assets designated at fair value. Fees and interest relating to stock borrowing or lending and repurchase or reverse repurchase agreements are recognised in interest income and interest expense in the income statement, using the effective interest rate method, over the expected life of the agreements. Westpac continually reviews the fair value of the underlying securities and, where appropriate, requests or provides additional collateral to support the transactions.
(viii) Superannuation obligations
Obligations for contributions to the defined contribution superannuation plan are recognised as an expense in the income statement as incurred.
The asset or liability recognised in the balance sheet in respect of the defined benefit superannuation plan is the present value of the defined benefit obligation as at the reporting date less the fair value of the plan’s assets. The present value of the defined benefit obligation is determined by discounting the estimated future cash flows using interest rates of government bonds that have terms to maturity approximating to the terms of the related superannuation liability. The calculation is performed at least annually by an independent qualified actuary using the projected unit credit method.
The actuarial valuation of plan obligations is dependent upon a series of assumptions, the key ones being price inflation, earnings growth, mortality, morbidity and investment returns assumptions. Different assumptions could significantly alter the amount of difference between plan assets and obligations, and the superannuation cost charged to the income statement.
Actuarial gains and losses related to the defined benefit superannuation plan are recorded directly in retained earnings. The net surplus or deficit that arises within the plan is recognised and disclosed separately in other assets and other liabilities respectively.
(ix) Earnings per share
Basic earnings per share (EPS) is determined by dividing net profit after tax attributable to equity holders of Westpac, excluding costs of servicing other equity instruments, by the weighted average number of ordinary shares outstanding during the financial year, excluding the number of ordinary shares purchased by the Group and held as treasury shares.
Diluted EPS is calculated by adjusting the earnings and number of shares used in the determination of the basic EPS for the effects of dilutive options, share rights and other dilutive potential ordinary shares.
In relation to options, share rights and restricted shares, the weighted average number of shares is adjusted to take into account the weighted average number of shares assumed to have been issued for nil consideration in determining diluted EPS. The number of ordinary shares assumed to be issued for nil consideration represents the difference between the number that would have been issued at the exercise price and the number that would have been issued at the average market price over the reporting period.
In relation to instruments convertible into ordinary shares under certain conditions, the weighted average number of shares is adjusted to determine the number of ordinary shares that may arise on conversion, by dividing the face value of the instruments by the average market price over the reporting period, taking into account any applicable discount on conversion weighted by the number of instruments on issue.
| | |
| 2012 WESTPAC GROUP ANNUAL REPORT | 149 |
NOTE 1. SUMMARY OF SIGNIFICANT ACCOUNTING POLICIES (CONTINUED)
(x) Leases
Leases are classified as either finance leases or operating leases. Under a finance lease, substantially all the risks and rewards incidental to legal ownership are transferred to the lessee. In contrast, an operating lease exists where the leased assets are allocated to the lessor.
In its capacity as a lessor, the Group primarily offers finance leases. The Group recognises the assets held under finance lease in the balance sheet as loans at an amount equal to the net investment in the lease. The recognition of finance income is based on a pattern reflecting a constant periodic return on the Group’s net investment in the finance lease. Finance lease income is included within interest income in the income statement (refer to Note 1(b)(ii)).
In its capacity as a lessee, the Group mainly uses property and equipment under operating leases. Payments due to the lessor under operating leases are charged to equipment and occupancy expense on a straight-line basis over the term of the lease (refer to Note 1(c)(iii)).
(xi) Segment reporting
Operating segments are presented on a basis that is consistent with information provided internally to Westpac’s key decision makers. In assessing the financial performance of its divisions internally, Westpac uses a measure of performance it refers to as ‘Cash Earnings’. To calculate Cash Earnings, Westpac adjusts the statutory result for material items that key decision makers believe do not reflect ongoing operations, items that are not considered when dividends are recommended and accounting reclassifications between individual line items that do not impact statutory results, such as policyholder tax recoveries. Details of the specific adjustments made to the statutory result in arriving at Cash Earnings are included in Note 32.
(xii) Rounding of amounts
In accordance with ASIC Class Order 98/100, all amounts have been rounded to the nearest million dollars unless otherwise stated.
j. Critical accounting assumptions and estimates
The application of the Group’s accounting policies necessarily requires the use of judgment, estimates and assumptions. Should different assumptions or estimates be applied, the resulting values would change, impacting the net assets and income of the Group.
The nature of assumptions and estimates used and the value of the resulting asset and liability balances are included in the policies below.
(i) Fair value of financial instruments
Financial instruments classified as held-for-trading or designated at fair value through profit or loss and financial assets classified as available-for-sale are recognised in the financial statements at fair value. All derivatives are measured and recognised at fair value.
The fair value of a financial instrument is the amount at which the instrument could be exchanged in a current transaction between willing parties, other than in a forced or liquidation sale.
Financial instruments are either priced with reference to a quoted market price for that instrument or by using a valuation model. Where the fair value is calculated using financial market pricing models, the methodology used is to calculate the expected cash flows under the terms of each specific contract and then discount these values back to the present value. These models use as their basis independently sourced market parameters including, for example, interest rate yield curves, equities and commodities prices, option volatilities and currency rates. Most market parameters are either directly observable or are implied from instrument prices; however, profits or losses are recognised upon initial recognition only when such profits can be measured by reference to observable current market transactions or valuation techniques based on observable market inputs.
The calculation of fair value for any financial instrument may also require adjustment of the quoted price or model value to reflect the cost of credit risk (where not embedded in underlying models or prices used). The process of calculating fair value on illiquid instruments or from a valuation model may require estimation of certain pricing parameters, assumptions or model characteristics.
These estimates are calibrated against industry standards, economic models and observed transaction prices.
The fair value of financial instruments is provided in Note 28 as well as the mechanism by which fair value has been derived.
| | |
150 | 2012 WESTPAC GROUP ANNUAL REPORT | |
NOTES TO THE FINANCIAL STATEMENTS
NOTE 1. SUMMARY OF SIGNIFICANT ACCOUNTING POLICIES (CONTINUED)
The majority of the Group’s derivatives are valued using valuation techniques that utilise observable market inputs. The fair value of substantially all securities positions carried at fair value is determined directly from quoted prices or from market observable inputs applied in valuation models. The Group has financial assets measured at fair value of $127,305 million (2011: $137,334 million). $1,276 million of this is measured at fair value based on significant unobservable market inputs (2011: $1,473 million). The Group has financial liabilities measured at fair value of $127,254 million (2011: $151,545 million). $100 million of this is measured at fair value based on significant unobservable market inputs (2011: $74 million). Sensitivities to reasonably possible changes in non-market observable valuation assumptions would not have a material impact on the Group or the Parent Entity’s reported results.
(ii) Provisions for impairment charges on loans and credit commitments
The Group’s loan impairment provisions are established to recognise incurred impairment in its portfolio of loans. A loan is impaired when there is objective evidence that events occurring since the loan was recognised have affected expected cash flows from the loan. The impairment charge is the difference between the carrying value of the loan and the present value of estimated future cash flows calculated at the loan’s original effective interest rate for fixed rate loans and the loan’s current effective interest rate for variable rate loans. Provisions for loan impairment represent management’s estimate of the impairment charges incurred in the loan portfolios as at the balance date. Changes to the provisions for loan impairment and changes to the provisions for undrawn contractually committed facilities and guarantees provided are reported in the income statement as part of impairment charges on loans.
At 30 September 2012, gross loans to customers totalled $518,279 million (2011: $500,654 million) and the provision for loan impairment was $3,834 million (2011: $4,045 million). There are two components to the Group’s loan impairment provisions: individual and collective.
Individual component
All impaired loans that exceed specified thresholds are individually assessed for impairment. Individually assessed loans principally comprise the Group’s portfolio of commercial loans to medium and large businesses. Impairment is recognised as the difference between the carrying value of the loan and the discounted value of management’s best estimate of future cash repayments and proceeds from any security held (discounted at the loan’s original effective interest rate for fixed rate loans and the loan’s current effective interest rate for variable rate loans). Relevant considerations that have a bearing on the expected future cash flows are taken into account, including the business prospects for the customer, the realisable value of collateral, the Group’s position relative to other claimants, the reliability of customer information and the likely cost and duration of the work-out process. Subjective judgments are made in this process. Furthermore, judgments can change with time as new information becomes available or as work-out strategies evolve, resulting in revisions to the impairment provision as individual decisions are taken.
Collective component
This is made up of two elements: loan impairment provisions for impaired loans that are below individual assessment thresholds (collective impaired loan provisions) and for loan impairments that have been incurred but have not been separately identified at the balance sheet date (incurred but not reported provisions). These are established on a portfolio basis taking into account the level of arrears, collateral, past loss experience and defaults based on portfolio trends. The most significant factors in establishing these provisions are the estimated loss rates and the related emergence periods. The emergence period for each loan product type is determined through detailed studies of loss emergence patterns. Loan files where losses have emerged are reviewed to identify the average time period between observable loss indicator events and the loss becoming identifiable. These portfolios include credit card receivables and other personal advances including mortgages. The future credit quality of these portfolios is subject to uncertainties that could cause actual credit losses to differ materially from reported loan impairment provisions. These uncertainties include the economic environment, notably interest rates and their effect on customer spending, unemployment levels, payment behaviour and bankruptcy rates.
The impairment charge reflected in the income statement is $1,212 million (2011: $993 million) and the provision balance at 30 September 2012 of $3,834 million (2011: $4,045 million) represents 0.74% of loans (2011: 0.81%).
Provisions for credit commitments are calculated using the same methodology as described above. The provision for credit commitments was $407 million (2011: $369 million) and was disclosed as part of Note 20.
(iii) Goodwill
As stated in Note 1(f)(iii)(b), goodwill represents the excess of purchase consideration, the amount of any non-controlling interest in the acquiree and the acquisition date fair value of any previous equity interest in the acquiree, over the fair value of the Group’s share of the identified net assets of acquired businesses. Goodwill is tested for impairment at least annually. The carrying value of goodwill as at 30 September 2012 was $8,797 million (2011: $8,582 million).
The determination of the fair value of assets and liabilities of the acquired businesses requires the exercise of management judgment. Different fair values would result in changes to the goodwill balance and to the post-acquisition performance of the acquisition.
| | |
| 2012 WESTPAC GROUP ANNUAL REPORT | 151 |
NOTE 1. SUMMARY OF SIGNIFICANT ACCOUNTING POLICIES (CONTINUED)
To determine if goodwill is impaired the carrying value of the identified CGU to which the goodwill is allocated, including the allocated goodwill, is compared to its recoverable amount. Recoverable amount is the higher of the CGU’s fair value less costs to sell and its value in use. Value in use is the present value of expected future cash flows from the CGU. Determination of appropriate cash flows and discount rates for the calculation of value in use is subjective. Fair value is the amount obtainable for the sale of the CGU in an arm’s length transaction between knowledgeable, willing parties. The assumptions applied to determine if any impairment exists are outlined in Note 13.
Goodwill impairment testing resulted in an impairment of goodwill of nil (2011: nil).
(iv) Superannuation obligations
The Group operates a number of defined benefit plans as described in Note 35. For each of these plans, actuarial valuations of the plan’s obligations and the fair value measurements of the plan’s assets are performed at least annually in accordance with the requirements of AASB 119 Employee Benefits.
The actuarial valuation of plan obligations is dependent upon a series of assumptions, the key ones being price inflation, earnings growth, mortality, morbidity and investment returns assumptions. Different assumptions could significantly alter the amount of the difference between plan assets and obligations, and the superannuation cost charged to the income statement.
Refer to Note 35 for details of the Group’s defined benefit deficit balances.
(v) Provisions (other than loan impairment)
Provisions are held in respect of a range of obligations such as employee entitlements, restructuring costs, litigation provisions and non-lending losses and onerous contracts (for example leases with surplus space). Provisions carried for long service leave are supported by an independent actuarial report. Some of the provisions involve significant judgment about the likely outcome of various events and estimated future cash flows. The deferral of these benefits involves the exercise of management judgments about the ultimate outcomes of the transactions. Payments that are expected to be incurred after more than one year are discounted at a rate which reflects both current interest rates and the risks specific to that provision.
(vi) Income taxes
The Group is subject to income taxes in Australia and jurisdictions where it has foreign operations. Significant judgment is required in determining the worldwide provision for income taxes. There are many transactions and calculations undertaken during the ordinary course of business for which the ultimate tax outcome is unclear. Provisions for tax are held to reflect these tax uncertainties. The Group estimates its tax liabilities based on the Group’s understanding of the tax law. Where the final outcome of these matters is different from the amounts that were initially recorded, such differences will impact the current and deferred tax provisions in the period where such determination is made.
Refer to Note 15 for details of the Group’s deferred tax balances.
k. Future developments in accounting policies
The following new standards and interpretations which may have a material impact on the Group have been issued, but are not yet effective and have not been early adopted by the Group:
AASB 9 Financial Instruments (Part 1: Classification and Measurement) was issued by the Australian Accounting Standards Board in December 2009. If the standard is not early adopted it will be effective for the 30 September 2016 financial year end. The major changes under the standard are:
§ | AASB 9 Financial Instruments replaces the multiple classification and measurement models in AASB 139 Financial Instruments: Recognition and Measurement with a single model that has two classification categories: amortised cost and fair value; |
| |
§ | a financial asset is measured at amortised cost if two criteria are met: a) the objective of the business model is to hold the financial asset for the collection of the contractual cash flows, and b) the contractual cash flows under the instrument solely represent the payment of principal and interest; |
| |
§ | if a financial asset is eligible for amortised cost measurement, an entity can elect to measure it at fair value if it eliminates or significantly reduces an accounting mismatch; |
| |
§ | there will be no separation of an embedded derivative where the instrument is a financial asset; |
| |
§ | equity instruments must be measured at fair value however, an entity can elect on initial recognition to present the fair value changes on an equity investment directly in other comprehensive income. There is no subsequent recycling of fair value gains and losses to profit or loss; however dividends from such investments will continue to be recognised in profit or loss; |
| |
§ | if an entity holds an investment in asset-backed securities (ABS) it must determine the classification of that investment by looking through to the underlying assets and assess the credit quality of the investment compared with the underlying portfolio of assets. If an entity is unable to look through to the underlying assets, then the investment must be measured at fair value; and |
| | |
152 | 2012 WESTPAC GROUP ANNUAL REPORT | |
NOTES TO THE FINANCIAL STATEMENTS
NOTE 1. SUMMARY OF SIGNIFICANT ACCOUNTING POLICIES (CONTINUED)
§ | the portion of a change of fair value relating to the entity’s own credit risk for financial liabilities measured at fair value utilising the fair value option is presented in other comprehensive income, except when that would create an accounting mismatch. If such a mismatch would be created or enlarged, the entity is required to present all changes in fair value (including the effects of changes in the credit risk of the liability) in profit or loss. |
As a result of the issuance and reissuance of AASB 9, two further standards have been issued by the AASB which give effect to consequential changes to a number of Australian Accounting Standards and Interpretations. These standards are AASB 2009-11 Amendments to Australian Accounting Standards arising from AASB 9 which was issued in December 2009 and AASB 2010-7 Amendments to Australian Accounting Standards arising from AASB 9 (December 2010) which was issued in December 2010. These standards will be applicable when AASB 9 is adopted by the Group.
AASB 9 will impact the classification and measurement of the Group’s financial instruments when adopted.
AASB 2010-8 Amendments to Australian Accounting Standards – Deferred Tax: Recovery of Underlying Assets was issued in December 2010 and will be effective for the 30 September 2013 financial year end. The amended standard introduces a rebuttable presumption in AASB 112 Income Taxes, applicable specifically to investment properties, property plant and equipment and intangible assets which are measured using the fair value model or the revaluation model, that the asset will be recovered entirely through sale unless there is clear evidence that recovery will occur in another manner. The amendment is not expected to have a material impact on the Group.
AASB 2011-4 Amendments to Australian Accounting Standards to Remove Individual Key Management Personnel Disclosure Requirements was issued in July 2011 and will be effective for the 30 September 2014 financial year end. The amendments remove all the individual key management personnel (KMP) disclosures in AASB 124 Related Party Disclosures that were specific to Australian entities. The amendments are expected to simplify the Group’s related party disclosures.
AASB 10 Consolidated Financial Statements and AASB 12 Disclosure of Interests in Other Entities were issued in August 2011 and will be effective for the 30 September 2014 financial year end. The new consolidation standard changes the definition of control and requires that it be applied to all entities to determine whether control exists. The new definition focuses on the need for both power and exposure to variability of returns in order for control to be present and the new disclosure standard increases the disclosure requirements for both consolidated and unconsolidated entities. The new standards are not expected to have a material impact on the Group.
AASB 13 Fair Value Measurement was issued in September 2011 and will be effective for the 30 September 2014 financial year end. The new standard replaces existing guidance on fair value measurement in several standards with a single, unified definition of fair value and a framework for measuring and disclosing fair values. AASB 13 applies to all assets and liabilities measured at fair value, not just financial instruments. The new standard is not expected to have a material impact on the Group.
AASB 2011-9 Amendments to Australian Accounting Standards – Presentation of Items of Other Comprehensive Income was issued in September 2011 and will be effective for the 30 September 2013 financial year end. The new standard amends AASB 101 Presentation of financial statements. Under the amended standard, the format of other comprehensive income will need to be changed to separate items that might be recycled to net profit from items that will not be recycled. Items included in other comprehensive income that may be recycled into profit or loss in future periods include gains or losses on cash flow hedges and exchange differences on the translation of foreign operations. Those that will not be recycled include defined benefits actuarial gains and losses.
A revised AASB 119 Employee Benefits was issued in September 2011 which will be effective for the 30 September 2014 financial year end. The amendments require entities to account immediately, in retained earnings, for all estimated changes in the cost of providing these benefits and all changes in the value of plan assets (often referred to as the removal of ‘corridor method’). The amendments also contain a new presentation approach that clearly distinguishes the different components of the cost of these benefits. Minimal impact is expected as a result of both these changes as the Group’s current accounting and presentation treatment is in line with the new amendments. Two areas of impact will be the change in the measurement of pension expense and additional disclosures to provide clearer information about the risks arising from defined benefits plans.
AASB 2012-2 Amendments to Australian accounting Standards – Disclosures – Offsetting Financial Assets and Financial Liabilities was issued in June 2012 and will be effective for the 30 September 2014 financial year end. The amendment requires disclosure of information that will enable users to evaluate the effect or potential effect of netting arrangements, including rights of set-off associated with recognised financial assets and liabilities on the Group’s financial position. The amendment is expected to result in additional disclosures.
AASB 2012-3 Amendments to Australian accounting Standards – Offsetting Financial Assets and Financial Liabilities was issued in June 2012 and will be effective for the 30 September 2015 financial year end. The amendment provides application guidance to addressing inconsistencies applied to offsetting criteria provided in AASB 132 Financial Instruments: Presentation, including clarifying the meaning of current legal enforceable right of set-off and that some gross settlement systems may be considered as the equivalent to net settlement. The amendment is not expected to have a material impact on the Group.
| | |
| 2012 WESTPAC GROUP ANNUAL REPORT | 153 |
NOTE 2. NET INTEREST INCOME
| | Consolidated | | Parent Entity | |
| | 2012 | 2011 | 2010 | 2012 | 2011 |
| | $m | $m | $m | $m | $m |
Interest income | | | | | | | | | | | |
Cash | | 99 | | 71 | | 60 | | 77 | | 70 | |
Receivables due from other financial institutions | | 188 | | 251 | | 234 | | 77 | | 88 | |
Net ineffectiveness on qualifying hedges | | 8 | | (13 | ) | 1 | | 7 | | (14 | ) |
Trading securities | | 2,091 | | 2,356 | | 2,035 | | 2,019 | | 2,287 | |
Other financial assets designated at fair value | | 108 | | 99 | | 64 | | 99 | | 96 | |
Available-for-sale securities | | 1,116 | | 789 | | 368 | | 908 | | 702 | |
Loans | | 33,238 | | 34,530 | | 31,377 | | 29,643 | | 31,168 | |
Regulatory deposits with central banks overseas | | 24 | | 12 | | 4 | | 24 | | 12 | |
Due from subsidiaries | | - | | - | | - | | 3,546 | | 2,696 | |
Other interest income | | 1 | | 3 | | 8 | | 1 | | 2 | |
Total interest income1 | | 36,873 | | 38,098 | | 34,151 | | 36,401 | | 37,107 | |
Interest expense | | | | | | | | | | | |
Payables due to other financial institutions | | (244 | ) | (191 | ) | (151 | ) | (242 | ) | (191 | ) |
Certificates of deposit | | (1,619 | ) | (1,907 | ) | (1,855 | ) | (1,586 | ) | (1,860 | ) |
At call and term deposits | | (12,983 | ) | (12,775 | ) | (10,695 | ) | (11,942 | ) | (11,828 | ) |
Trading liabilities | | (4,500 | ) | (5,738 | ) | (3,414 | ) | (4,129 | ) | (5,357 | ) |
Other financial liabilities designated at fair value | | (20 | ) | (38 | ) | (19 | ) | - | | - | |
Debt issues and acceptances | | (4,388 | ) | (4,578 | ) | (4,539 | ) | (3,684 | ) | (3,949 | ) |
Due to subsidiaries | | - | | - | | - | | (3,697 | ) | (2,993 | ) |
Loan capital | | (454 | ) | (469 | ) | (545 | ) | (428 | ) | (441 | ) |
Other interest expense | | (163 | ) | (406 | ) | (1,091 | ) | (143 | ) | (136 | ) |
Total interest expense2 | | (24,371 | ) | (26,102 | ) | (22,309 | ) | (25,851 | ) | (26,755 | ) |
Net interest income | | 12,502 | | 11,996 | | 11,842 | | 10,550 | | 10,352 | |
1 | Total interest income for financial assets that are not at fair value through profit or loss is $34,666 million (2011: $35,656 million, 2010: $32,051 million) for the Group and $34,276 million (2011: $34,738 million, 2010: $27,870 million) for the Parent Entity. |
2 | Total interest expense for financial liabilities that are not at fair value through profit or loss is $17,990 million (2011: $18,300 million, 2010: $17,300 million) for the Group and $19,916 million (2011: $19,440 million, 2010 $16,167 million) for the Parent Entity. |
| | |
154 | 2012 WESTPAC GROUP ANNUAL REPORT | |
NOTES TO THE FINANCIAL STATEMENTS
NOTE 3. NON-INTEREST INCOME
| | Consolidated | | Parent Entity | |
| | 2012 | 2011 | 2010 | 2012 | 2011 |
| | $m | $m | $m | $m | $m |
Fees and commissions | | | | | | | | | | | |
Facility fees | | 1,179 | | 1,105 | | 1,032 | | 1,182 | | 1,116 | |
Transaction fees and commissions received | | 1,185 | | 1,180 | | 1,153 | | 1,092 | | 1,124 | |
Other non-risk fee income | | 266 | | 283 | | 284 | | 329 | | 246 | |
Total fees and commissions | | 2,630 | | 2,568 | | 2,469 | | 2,603 | | 2,486 | |
Wealth management and insurance income | | | | | | | | | | | |
Life insurance and funds management net operating income | | 1,613 | | 1,463 | | 1,394 | | - | | - | |
General insurance and lenders mortgage insurance net
operating income | | 178 | | 155 | | 166 | | - | | - | |
Total wealth management and insurance income | | 1,791 | | 1,618 | | 1,560 | | - | | - | |
Trading income | | | | | | | | | | | |
Foreign exchange income | | 476 | | 329 | | 462 | | 387 | | 276 | |
Other trading securities | | 374 | | 229 | | 335 | | 350 | | 217 | |
Total trading income | | 850 | | 558 | | 797 | | 737 | | 493 | |
Other income | | | | | | | | | | | |
Dividends received from subsidiaries | | - | | - | | - | | 568 | | 624 | |
Dividends received from other entities | | 12 | | 17 | | 25 | | 7 | | 13 | |
Rental income | | 1 | | 2 | | 6 | | 1 | | 1 | |
Net gain on disposal of assets | | 46 | | 51 | | 46 | | 45 | | 42 | |
Net gain/(loss) on ineffective hedges | | 3 | | (5 | ) | 10 | | 3 | | (5 | ) |
Net gain on hedging overseas operations | | 78 | | 55 | | 29 | | 13 | | 1 | |
Net gain/(loss) on derivatives held for risk management purposes1 | | (36 | ) | (28 | ) | 27 | | (32 | ) | (25 | ) |
Net gain/(loss) on financial instruments designated at fair value | | 27 | | 28 | | 41 | | 31 | | (21 | ) |
Other | | 79 | | 53 | | 58 | | 65 | | (30 | ) |
Total other income | | 210 | | 173 | | 242 | | 701 | | 600 | |
Total non-interest income | | 5,481 | | 4,917 | | 5,068 | | 4,041 | | 3,579 | |
Wealth management and insurance income comprised | | | | | | | | | | | |
Funds management income | | 1,037 | | 914 | | 896 | | - | | - | |
Life insurance premium income | | 637 | | 559 | | 501 | | - | | - | |
Life insurance commissions, investment income and other income | | 836 | | 99 | | 455 | | - | | - | |
Life insurance claims and changes in life insurance liabilities | | (897 | ) | (109 | ) | (458 | ) | - | | - | |
General insurance and lenders mortgage insurance
premiums earned | | 370 | | 356 | | 341 | | - | | - | |
General insurance and lenders mortgage insurance commissions, investment and other income | | 30 | | 30 | | 15 | | - | | - | |
General insurance and lenders mortgage insurance claims incurred, underwriting and commission expenses | | (222 | ) | (231 | ) | (190 | ) | - | | - | |
Total wealth management and insurance income | | 1,791 | | 1,618 | | 1,560 | | - | | - | |
1 | Income from derivatives held for risk management purposes primarily comprises net gains or losses on realised and unrealised hedges on New Zealand future earnings and net gains or losses on the hedge of our 2003 Trust Preferred Securities. |
| | |
| 2012 WESTPAC GROUP ANNUAL REPORT | 155 |
NOTE 4. OPERATING EXPENSES
| | Consolidated | | Parent Entity | |
| | 2012 | | 2011 | | 2010 | | 2012 | | 2011 | |
| | $m | | $m | | $m | | $m | | $m | |
Salaries and other staff expenses | | | | | | | | | | | |
Salaries and wages | | 3,113 | | 3,015 | | 3,052 | | 2,514 | | 2,448 | |
Employee entitlements | | 326 | | 305 | | 258 | | 284 | | 261 | |
Employee related taxes | | 209 | | 194 | | 177 | | 181 | | 165 | |
Superannuation expense: | | | | | | | | | | | |
Defined contribution plans | | 237 | | 234 | | 212 | | 190 | | 187 | |
Defined benefit plans (Note 35) | | 39 | | 29 | | 39 | | 39 | | 29 | |
Equity based compensation | | 155 | | 112 | | 125 | | 119 | | 77 | |
Restructuring costs | | 159 | | 110 | | 56 | | 143 | | 103 | |
Other | | 20 | | 56 | | 71 | | 9 | | 42 | |
Total salaries and other staff expenses | | 4,258 | | 4,055 | | 3,990 | | 3,479 | | 3,312 | |
Equipment and occupancy expenses | | | | | | | | | | | |
Operating lease rentals | | 535 | | 505 | | 482 | | 464 | | 408 | |
Depreciation, amortisation and impairment: | | | | | | | | | | | |
Premises | | 14 | | 16 | | 17 | | 13 | | 15 | |
Leasehold improvements | | 106 | | 89 | | 62 | | 92 | | 81 | |
Furniture and equipment | | 62 | | 63 | | 61 | | 54 | | 54 | |
Technology | | 85 | | 76 | | 66 | | 71 | | 59 | |
Software | | 352 | | 265 | | 300 | | 291 | | 208 | |
Equipment repairs and maintenance | | 76 | | 80 | | 75 | | 66 | | 68 | |
Electricity, water and rates | | 12 | | 12 | | 11 | | 8 | | 9 | |
Land tax | | 8 | | 6 | | 5 | | 7 | | 6 | |
Other | | 28 | | 3 | | 3 | | 20 | | (8 | ) |
Total equipment and occupancy expenses | | 1,278 | | 1,115 | | 1,082 | | 1,086 | | 900 | |
Other expenses | | | | | | | | | | | |
Amortisation of deferred expenditure | | 6 | | 4 | | 6 | | 18 | | 18 | |
Amortisation and impairment of intangible assets | | 225 | | 208 | | 208 | | 208 | | 208 | |
Non-lending losses | | 172 | | 43 | | 38 | | 161 | | 39 | |
Purchased services: | | | | | | | | | | | |
Technology and information services | | 278 | | 254 | | 280 | | 208 | | 196 | |
Legal | | 29 | | 29 | | 33 | | 17 | | 16 | |
Other professional services | | 402 | | 448 | | 483 | | 285 | | 311 | |
Credit card loyalty programs | | 133 | | 127 | | 117 | | 133 | | 127 | |
Stationery | | 78 | | 82 | | 83 | | 58 | | 60 | |
Postage and freight | | 151 | | 145 | | 139 | | 123 | | 116 | |
Outsourcing costs | | 620 | | 592 | | 583 | | 496 | | 455 | |
Insurance | | 16 | | 14 | | 21 | | 11 | | 12 | |
Advertising | | 147 | | 176 | | 162 | | 94 | | 128 | |
Training | | 20 | | 28 | | 29 | | 13 | | 20 | |
Travel | | 66 | | 70 | | 73 | | 48 | | 51 | |
Other expenses | | 30 | | 16 | | 89 | | 53 | | 127 | |
Total other expenses | | 2,373 | | 2,236 | | 2,344 | | 1,926 | | 1,884 | |
Operating expenses | | 7,909 | | 7,406 | | 7,416 | | 6,491 | | 6,096 | |
| | |
156 | 2012 WESTPAC GROUP ANNUAL REPORT | |
NOTES TO THE FINANCIAL STATEMENTS
NOTE 5. INCOME TAX
| | Consolidated | | Parent Entity | |
| | 2012 | | | 2011 | | 2010 | | 2012 | | | 2011 | |
| | $m | | | $m | | $m | | $m | | | $m | |
The income tax expense for the year is reconciled to the profit before income tax as follows | | | | | | | | | | | | | |
Profit before income tax | | 8,862 | | | 8,514 | | 8,038 | | 7,099 | | | 7,060 | |
Prima facie income tax based on the Australian company tax rate of 30% | | 2,659 | | | 2,554 | | 2,411 | | 2,130 | | | 2,118 | |
The effect of amounts which are not deductible (assessable) in calculating taxable income | | | | | | | | | | | | | |
Change in tax rate1 | | 1 | | | 7 | | 6 | | 2 | | | 1 | |
Rebatable and exempt dividends | | (1 | ) | | (2 | ) | (5 | ) | (168 | ) | | (184 | ) |
Life insurance: | | | | | | | | | | | | | |
Tax adjustment on policyholders’ earnings2 | | 8 | | | (10 | ) | (8 | ) | - | | | - | |
Adjustment for life business tax rates | | (6 | ) | | (6 | ) | (9 | ) | 2 | | | - | |
Other non-assessable items | | (29 | ) | | (40 | ) | (26 | ) | (17 | ) | | (17 | ) |
Other non-deductible items | | 63 | | | 66 | | 36 | | 55 | | | 68 | |
Adjustment for overseas tax rates | | 3 | | | 1 | | 1 | | 21 | | | 1 | |
Income tax (over)/under provided in prior years | | (10 | ) | | (33 | ) | (4 | ) | (12 | ) | | (21 | ) |
St.George tax consolidation adjustment3 | | - | | | (1,110 | ) | (685 | ) | - | | | (1,110 | ) |
TOFA tax consolidation adjustment4 | | 165 | | | - | | - | | 165 | | | - | |
Other items | | (27 | ) | | 28 | | (91 | ) | (31 | ) | | (9 | ) |
Total income tax expense in the income statement | | 2,826 | | | 1,455 | | 1,626 | | 2,147 | | | 847 | |
Income tax analysis | | | | | | | | | | | | | |
| | | | | | | | | | | | | |
| | | | | | | | | | | | | |
Income tax expense attributable to profit from ordinary activities comprised: | | | | | | | | | | | | | |
Current income tax: | | | | | | | | | | | | | |
Australia | | 2,175 | | | 1,809 | | 1,705 | | 1,767 | | | 1,464 | |
Overseas | | 344 | | | 180 | | 184 | | 140 | | | 30 | |
| | 2,519 | | | 1,989 | | 1,889 | | 1,907 | | | 1,494 | |
Deferred income tax: | | | | | | | | | | | | | |
Australia | | 319 | | | (591 | ) | (224 | ) | 259 | | | (669 | ) |
Overseas | | (2 | ) | | 90 | | (35 | ) | (7 | ) | | 43 | |
| | 317 | | | (501 | ) | (259 | ) | 252 | | | (626 | ) |
Under/(over) provision in prior years: | | | | | | | | | | | | | |
Australia | | (8 | ) | | (20 | ) | (3 | ) | (7 | ) | | (9 | ) |
Overseas | | (2 | ) | | (13 | ) | (1 | ) | (5 | ) | | (12 | ) |
| | (10 | ) | | (33 | ) | (4 | ) | (12 | ) | | (21 | ) |
Total Australia | | 2,486 | | | 1,198 | | 1,478 | | 2,019 | | | 786 | |
Total overseas | | 340 | | | 257 | | 148 | | 128 | | | 61 | |
Total income tax expense attributable to profit from ordinary activities | | 2,826 | | | 1,455 | | 1,626 | | 2,147 | | | 847 | |
1 | During 2012 the company tax rates in the UK and Fiji reduced from 26% to 24%, and 28% to 20% respectively. The impact of these changes has been taken into account in the measurement of deferred tax at the end of the reporting period. The impact of the change in New Zealand’s company tax rate from 30% to 28% was included in 2011. |
2 | In accordance with the requirements of AASB 1038, tax expense for 2012 includes a $12 million tax charge on policyholders’ investment earnings (2011: $14 million tax benefit, 2010: $12 million tax benefit) of which $4 million is prima facie a tax expense (2011: $4 million tax benefit, 2010: $4 million tax benefit) and the balance of $8 million tax expense (2011: $10 million tax benefit, 2010: $8 million tax benefit) is shown here. |
3 | Following the redemption of St.George Bank Limited’s hybrid instruments on 31 March 2009, St.George and all its wholly owned Australian subsidiaries joined the Westpac tax consolidated group. Westpac was required to reset the tax value of certain St.George assets to the appropriate market value of those assets. Given the complexity of this process, the assessed tax treatment for the 2009 and 2010 financial years was finalised and the approach agreed with the ATO in October 2010, which gave rise to a reduction of income tax expense of $685 million. The assessed tax treatment for the 2011 financial year and following years was agreed with the ATO in March 2011 and gave rise to a reduction of income tax expense of $1,110 million. |
4 | New legislation that included retrospective amendments to the income tax law as it applies to TOFA and tax consolidated groups was introduced during the 2012 financial year. The amendments have an adverse application to certain liabilities that were consolidated as part of the St.George merger. This gave rise to an additional income tax expense of $165 million for the 2012 financial year. |
| | |
| 2012 WESTPAC GROUP ANNUAL REPORT | 157 |
NOTE 5. INCOME TAX (CONTINUED)
Tax consolidation
The Parent Entity and its wholly owned, Australian-controlled entities implemented the tax consolidation legislation as of 1 October 2002. All entities in the tax consolidated group have entered into a tax sharing agreement which, in the opinion of the Directors, limits the joint and several liabilities of the wholly owned entities in the case of a default by the head entity, Westpac.
The entities have also entered into a tax funding agreement under which the wholly owned entities fully compensate the Parent Entity for any current tax payable assumed and are compensated by the Parent Entity for any current tax receivable and deferred tax assets relating to unused tax losses or unused tax credits that are transferred to the Parent Entity under the tax consolidation legislation. The funding amounts are determined by reference to the amounts recognised in the wholly owned entities’ financial statements.
The amounts receivable/payable under the tax funding agreement are settled on a quarterly basis in line with the Parent Entity’s obligations to pay tax instalments. Any unpaid amounts at balance date are recognised as current intercompany receivables or payables.
Taxation of financial arrangements
TOFA applies to all entities in the Australian tax consolidation group from 1 October 2010. Subject to certain elections being made, TOFA improves the alignment of the tax treatment of gains and losses from financial arrangements with the accounting treatment adopted in the financial statements. Other than the recent retrospective change in law, referred to above, TOFA did not significantly impact the Group. This is because of the transitional rules which require existing estimated deferred tax balances impacted by TOFA to be amortised to taxable income over a four year period.
NOTE 6. DIVIDENDS
| | Consolidated | | Parent Entity | |
| | 2012 | | | 2011 | | 2010 | | 2012 | | | 2011 | |
| | $m | | | $m | | $m | | $m | | | $m | |
Recognised amounts | | | | | | | | | | | | | |
Ordinary dividends | | | | | | | | | | | | | |
2011 final dividend paid 80 cents per share (2010: 74 cents per share, 2009: 60 cents per share) all fully franked at 30% | | 2,423 | | | 2,209 | | 1,762 | | 2,425 | | | 2,212 | |
2012 interim dividend paid 82 cents per share (2011: 76 cents per share, 2010: 65 cents per share) all fully franked at 30% | | 2,501 | | | 2,284 | | 1,932 | | 2,506 | | | 2,288 | |
Total ordinary dividends | | 4,924 | | | 4,493 | | 3,694 | | 4,931 | | | 4,500 | |
Distributions on other equity instruments | | | | | | | | | | | | | |
Convertible debentures | | - | | | - | | - | | 47 | | | 58 | |
Total distributions on other equity instruments | | - | | | - | | - | | 47 | | | 58 | |
Dividends not recognised at year end | | | | | | | | | | | | | |
Since year end the Directors have recommended the payment of the following final ordinary dividend: | | | | | | | | | | | | | |
Ordinary shares 84 cents per share (2011: 80 cents per share, 2010: 74 cents per share) all fully franked at 30% | | 2,584 | | | 2,423 | | 2,209 | | 2,588 | | | 2,425 | |
The amount disclosed as recognised for ordinary dividends is the final dividend paid in respect of the prior financial year and the interim dividend paid in respect of the current financial year.
The Board has determined to satisfy the DRP for the 2012 final dividend by issuing Westpac ordinary shares.
| | Parent Entity | |
| | 2012 | | | 2011 | | 2010 | |
| | $m | | | $m | | $m | |
Franking account balance | | | | | | | | |
Franking account balance as at year end | | 1,453 | | | 2,118 | | 2,595 | |
Franking credits that will arise from payment of current income tax | | 685 | | | 273 | | (31 | ) |
Adjusted franking account balance after payment of current income tax | | 2,138 | | | 2,391 | | 2,564 | |
Franking credits to be utilised for payment of unrecognised final dividend | | (1,109 | ) | | (1,048 | ) | (956 | ) |
Adjusted franking account balance | | 1,029 | | | 1,343 | | 1,608 | |
| | |
158 | 2012 WESTPAC GROUP ANNUAL REPORT | |
NOTES TO THE FINANCIAL STATEMENTS
NOTE 7. EARNINGS PER SHARE
Basic earnings per share (EPS) is calculated by dividing the net profit attributable to equity holders of Westpac by the weighted average number of ordinary shares on issue during the year, excluding the number of ordinary shares purchased by the Group and held as Treasury shares. Diluted EPS is calculated by adjusting the earnings and the weighted average number of ordinary shares outstanding to assume conversion of all dilutive potential ordinary shares.
| | Consolidated | |
| | 2012 | | | 2011 | | 2010 | |
| | Basic | | Diluted | | | Basic | | Diluted | | Basic | | Diluted | |
Reconciliation of earnings used in the calculation of earnings per ordinary share ($m) | | | | | | | | | | | | | | |
Net profit attributable to owners of Westpac Banking Corporation | | 5,970 | | 5,970 | | | 6,991 | | 6,991 | | 6,346 | | 6,346 | |
RSP treasury shares distributions1 | | (11 | ) | - | | | (8 | ) | - | | (6 | ) | - | |
2004 TPS distributions | | - | | 18 | | | - | | 20 | | - | | 20 | |
2007 convertible notes distributions | | - | | 16 | | | - | | 31 | | - | | 27 | |
Westpac SPS distributions | | - | | 34 | | | - | | 37 | | - | | 33 | |
Westpac SPS II distributions | | - | | 36 | | | - | | 39 | | - | | 36 | |
Westpac CPS dividends | | - | | 34 | | | - | | - | | - | | - | |
Net profit attributable to owners of Westpac Banking Corporation adjusted for the effect of dilution | | 5,959 | | 6,108 | | | 6,983 | | 7,118 | | 6,340 | | 6,462 | |
| | | | | | | | | | | | | | |
Weighted average number of ordinary shares (millions) | | | | | | | | | | | | | | |
Weighted average number of ordinary shares | | 3,056 | | 3,056 | | | 3,010 | | 3,010 | | 2,972 | | 2,972 | |
Effect of own shares held | | (13 | ) | (13 | ) | | (13 | ) | (13 | ) | (12 | ) | (12 | ) |
Potential dilutive adjustment: | | | | | | | | | | | | | | |
Exercise of options and share rights and vesting of restricted shares | | - | | 13 | | | - | | 7 | | - | | 9 | |
Conversion of 2004 TPS | | - | | 21 | | | - | | 27 | | - | | 23 | |
Conversion of 2007 convertible notes | | - | | 23 | | | - | | 52 | | - | | 44 | |
Conversion of Westpac SPS | | - | | 43 | | | - | | 53 | | - | | 45 | |
Conversion of Westpac SPS II | | - | | 38 | | | - | | 47 | | - | | 39 | |
Conversion of Westpac CPS | | - | | 26 | | | - | | - | | - | | - | |
Total weighted average number of ordinary shares | | 3,043 | | 3,207 | | | 2,997 | | 3,183 | | 2,960 | | 3,120 | |
Earnings per ordinary share (cents) | | 195.8 | | 190.5 | | | 233.0 | | 223.6 | | 214.2 | | 207.1 | |
1 | While the equity granted to employees remains unvested, RSP treasury shares are deducted from ordinary shares on issue in arriving at the weighted average number of ordinary shares outstanding. Despite the shares being unvested, employees are entitled to dividends and to voting rights on the shares. Consequently, a portion of the profit for the period is allocated to RSP treasury shares to arrive at earnings attributed to ordinary shareholders. |
Information concerning the classification of securities
Options and share rights
Options and share rights granted to employees prior to 30 September 2012 are considered to be potential ordinary shares and have been considered in the determination of diluted EPS. The options and share rights have not been considered in the determination of basic EPS. Details relating to options and share rights are set out in Note 25.
During the year, 2,146,405 (2011: 2,114,547, 2010: 3,823,525) options and share rights were converted to ordinary shares. The diluted EPS calculation includes that portion of these options and share rights assumed to be issued for nil consideration, weighted with reference to the date of conversion.
The exercise prices of all options are included in Note 25. In determining diluted EPS, options and share rights with an exercise price (including grant date fair value that will be expensed in future periods) greater than the average Westpac share price over the year have not been included, as these are not considered dilutive. Performance options and performance share rights are only included in determining diluted EPS to the extent that they are dilutive and performance hurdles are met at year end.
Subsequent to 30 September 2012:
¾ 200,591 ordinary shares were issued to employees due to the exercise of options (2011: 170,290, 2010: 76,000); and
¾ 709,521 ordinary shares were issued to employees due to the exercise of share rights (2011: 31,128, 2010: 126,106).
| | |
| 2012 WESTPAC GROUP ANNUAL REPORT | 159 |
NOTE 7. EARNINGS PER SHARE (CONTINUED)
Restricted Share Plan
Under the Restricted Share Plan (RSP), Westpac ordinary shares are allocated to eligible employees for nil consideration. Full entitlement to these shares does not vest until a service period has been completed. RSP shares have not been included in determining basic EPS. For further details, refer to Note 25.
2004 TPS
As 2004 TPS can be exchanged for ordinary shares in certain circumstances, any dilutive impact must be considered. For 2012, 2004 TPS were dilutive (2011: dilutive, 2010: dilutive) and have been included in the determination of diluted EPS.
2004 TPS have not been included in the determination of basic EPS.
2007 convertible notes
The 2007 convertible notes were redeemed for cash on 19 April 2012. As the 2007 convertible notes could be exchanged into ordinary shares at the discretion of Westpac upon certain conditions being satisfied, the potential dilutive effect has been considered. For 2012, the 2007 convertible notes were dilutive (2011: dilutive, 2010: dilutive) and have been included in the determination of diluted EPS. The computation of the number of ordinary shares that may arise from conversion has been weighted for the proportion of the year that the 2007 convertible notes were on issue.
2007 convertible notes have not been included in the determination of basic EPS.
Westpac Stapled Preferred Securities (Westpac SPS and Westpac SPS II)
Westpac SPS and Westpac SPS II are securities, each consisting of a perpetual, unsecured, non-cumulative subordinated note issued by Westpac’s New York branch, stapled to a preference share issued by Westpac. Westpac SPS were issued on 30 July 2008 and Westpac SPS II were issued on 31 March 2009. As Westpac SPS and Westpac SPS II can be exchanged for ordinary shares in certain circumstances, any dilutive impact must be considered. For 2012, the Westpac SPS and Westpac SPS II were dilutive (2011: dilutive, 2010: dilutive) and have been included in the determination of diluted EPS.
Westpac SPS and Westpac SPS II have not been included in the determination of basic EPS.
Westpac Convertible Preference Shares (Westpac CPS)
Westpac CPS are fully paid, perpetual, non-cumulative, unsecured preference shares issued by Westpac on 23 March 2012. As Westpac CPS are convertible into ordinary shares on the scheduled conversion date or under certain circumstances, any dilutive impact must be considered. For 2012, Westpac CPS were dilutive and have been included in the determination of diluted EPS. Westpac CPS was weighted for the proportion of the year the instrument was on issue.
Westpac CPS have not been included in the determination of basic EPS.
The terms and conditions associated with 2004 TPS, Westpac SPS, Westpac SPS II and Westpac CPS are discussed in more detail in Note 23.
NOTE 8. RECEIVABLES DUE FROM OTHER FINANCIAL INSTITUTIONS
| | Consolidated | | Parent Entity | |
| | 2012 | | | 2011 | | 2012 | | | 2011 | |
| | $m | | | $m | | $m | | | $m | |
Conduit assets | | 2,544 | | | 2,779 | | - | | | - | |
Cash collateral | | 4,737 | | | 1,650 | | 4,409 | | | 1,580 | |
Interbank lending | | 2,947 | | | 4,122 | | 2,919 | | | 3,657 | |
Total receivables due from other financial institutions | | 10,228 | | | 8,551 | | 7,328 | | | 5,237 | |
| | |
160 | 2012 WESTPAC GROUP ANNUAL REPORT | |
NOTES TO THE FINANCIAL STATEMENTS
NOTE 9. TRADING SECURITIES AND OTHER FINANCIAL ASSETS DESIGNATED AT FAIR VALUE
| | Consolidated | | Parent Entity | |
| | 2012 | | | 2011 | | 2010 | | 2012 | | | 2011 | |
| | $m | | | $m | | $m | | $m | | | $m | |
Securities | | 34,455 | | | 45,195 | | 37,749 | | 32,827 | | | 42,514 | |
Securities purchased under agreement to resell | | 10,148 | | | 2,776 | | 2,262 | | 10,148 | | | 2,776 | |
Total trading securities | | 44,603 | | | 47,971 | | 40,011 | | 42,975 | | | 45,290 | |
Other financial assets designated at fair value | | 2,664 | | | 2,960 | | 3,464 | | 1,903 | | | 2,093 | |
Total trading securities and other financial assets designated at fair value | | 47,267 | | | 50,931 | | 43,475 | | 44,878 | | | 47,383 | |
Trading securities includes the following:
| | Consolidated | | Parent Entity | |
| | 2012 | | | 2011 | | 2010 | | 2012 | | | 2011 | |
| | $m | | | $m | | $m | | $m | | | $m | |
Australian public securities: | | | | | | | | | | | | | |
Commonwealth securities | | 3,172 | | | 1,996 | | 928 | | 3,172 | | | 1,996 | |
State Government securities | | 6,249 | | | 8,821 | | 4,387 | | 6,158 | | | 8,813 | |
Australian equity securities | | 44 | | | 48 | | 102 | | 44 | | | 48 | |
Australian debt securities1 | | 20,952 | | | 28,419 | | 27,936 | | 20,463 | | | 26,622 | |
Overseas public securities | | 826 | | | 2,024 | | 1,489 | | 639 | | | 1,211 | |
Overseas debt securities1 | | 3,164 | | | 3,842 | | 2,893 | | 2,303 | | | 3,779 | |
Other securities | | 48 | | | 45 | | 14 | | 48 | | | 45 | |
Total securities | | 34,455 | | | 45,195 | | 37,749 | | 32,827 | | | 42,514 | |
Securities purchased under agreement to resell | | 10,148 | | | 2,776 | | 2,262 | | 10,148 | | | 2,776 | |
Total trading securities | | 44,603 | | | 47,971 | | 40,011 | | 42,975 | | | 45,290 | |
1 In the current year we have revised classifications within trading securities.
Other financial assets designated at fair value include:
| | Consolidated | | Parent Entity | |
| | 2012 | | | 2011 | | 2010 | | 2012 | | | 2011 | |
| | $m | | | $m | | $m | | $m | | | $m | |
Australian debt securities | | 1,840 | | | 2,145 | | 3,060 | | 1,313 | | | 1,498 | |
Overseas debt securities | | 545 | | | 677 | | 404 | | 475 | | | 585 | |
Australian equity securities | | 279 | | | 138 | | - | | 115 | | | 10 | |
Total other financial assets designated at fair value | | 2,664 | | | 2,960 | | 3,464 | | 1,903 | | | 2,093 | |
The Group has total holdings of debt securities from two Australian financial institutions and three Australian State-Government Institutions, the aggregate book and market value, each of which exceeded 10% of the Group total shareholders’ equity at 30 September 2012.
The Group holds $37 million of US Government bonds recognised in the categories trading securities, other financial assets designated at fair value or available-for-sale securities (Note 10) at 30 September 2012 (2011: $344 million, 2010: $330 million).
| | |
| 2012 WESTPAC GROUP ANNUAL REPORT | 161 |
NOTE 10. AVAILABLE-FOR-SALE SECURITIES
| | Consolidated | | Parent Entity | |
| | 2012 | | | 2011 | | 2010 | | 2012 | | | 2011 | |
| | $m | | | $m | | $m | | $m | | | $m | |
Available-for-sale securities – at fair value | | | | | | | | | | | | | |
Australian public securities (State Government securities) | | 18,342 | | | 14,572 | | 9,996 | | 18,343 | | | 14,553 | |
Australian debt securities | | 2,667 | | | 615 | | 523 | | 2,369 | | | 244 | |
Overseas public securities | | 2,427 | | | 1,788 | | 485 | | - | | | 91 | |
Overseas debt securities | | 801 | | | 855 | | 684 | | 219 | | | 380 | |
Australian equity securities | | 106 | | | 66 | | 147 | | 105 | | | 66 | |
Overseas equity securities | | 122 | | | 169 | | 280 | | - | | | 92 | |
| | 24,465 | | | 18,065 | | 12,115 | | 21,036 | | | 15,426 | |
Available-for-sale securities – at cost1 | | | | | | | | | | | | | |
Unlisted securities | | 7 | | | 10 | | 9 | | 3 | | | - | |
Total available-for-sale securities | | 24,472 | | | 18,075 | | 12,124 | | 21,039 | | | 15,426 | |
1 Investments in certain unlisted securities are measured at cost because the fair value cannot be reliably measured. These investments represent non-controlling interests in companies for which active markets do not exist and quoted prices are not available.
Available-for-sale securities change in fair value resulted in a gain of $139 million for the Group (2011: $73 million loss) and a gain of $69 million for the Parent Entity (2011: $106 million loss) being recognised in other comprehensive income (refer to ‘Statements of changes in equity’).
The following table shows the maturities of the Group’s available-for-sale securities and their weighted-average yield as at 30 September 2012. There are no tax-exempt securities.
| | 2012 | |
| | Within | | Over 1 Year | | Over 5 Years | | Over | | No Specific | | | | | Weighted | |
| | 1 Year | | to 5 Years | | to 10 Years | | 10 Years | | Maturity | | Total | | | Average | |
| | $m | | % | | $m | | % | | $m | | % | | $m | | % | | $m | | % | | $m | | | % | |
Carrying amount | | | | | | | | | | | | | | | | | | | | | | | | | | |
Australian public securities | | - | | - | | 3,413 | | 5.5 | | 10,868 | | 5.3 | | 4,061 | | 4.9 | | - | | - | | 18,342 | | | 5.2 | |
Australian debt securities | | 4 | | - | | 2,064 | | 7.7 | | 599 | | 4.5 | | - | | - | | - | | - | | 2,667 | | | 7.4 | |
Overseas public securities | | 664 | | 3.7 | | 407 | | 4.9 | | 1,299 | | 4.1 | | 57 | | 3.8 | | - | | - | | 2,427 | | | 4.1 | |
Overseas debt securities | | 144 | | 2.4 | | 620 | | 3.0 | | 37 | | 6.5 | | - | | - | | - | | - | | 801 | | | 3.4 | |
Australian equity securities | | - | | - | | - | | - | | - | | - | | - | | - | | 106 | | - | | 106 | | | - | |
Overseas equity securities | | - | | - | | - | | - | | - | | - | | - | | - | | 122 | | - | | 122 | | | - | |
Unlisted securities at cost | | - | | - | | - | | - | | - | | - | | - | | - | | 7 | | - | | 7 | | | - | |
Total by maturity | | 812 | | | | 6,504 | | | | 12,803 | | | | 4,118 | | | | 235 | | | | 24,472 | | | | |
The maturity profile is determined based upon contractual terms for available-for-sale instruments.
| | |
162 | 2012 WESTPAC GROUP ANNUAL REPORT | |
NOTES TO THE FINANCIAL STATEMENTS
NOTE 11. LOANS
The following table shows loans disaggregated by type of product. Loans are classified based on the location of the lending office:
| | Consolidated | | Parent Entity | |
| | 2012 | | | 2011 | | 2012 | | | 2011 | |
| | $m | | | $m | | $m | | | $m | |
Australia | | | | | | | | | | | |
Overdrafts | | 3,171 | | | 3,247 | | 3,171 | | | 3,247 | |
Credit card outstandings | | 9,675 | | | 9,532 | | 9,675 | | | 9,532 | |
Overnight and at call money market loans | | 136 | | | 13 | | 136 | | | 13 | |
Acceptance of finance | | 38,175 | | | 39,260 | | 38,175 | | | 39,260 | |
Term loans:1 | | | | | | | | | | | |
Housing | | 283,703 | | | 269,597 | | 283,703 | | | 269,589 | |
Housing – line of credit | | 32,639 | | | 34,972 | | 32,639 | | | 34,972 | |
Total housing | | 316,342 | | | 304,569 | | 316,342 | | | 304,561 | |
Non-housing | | 84,244 | | | 79,479 | | 78,267 | | | 74,049 | |
Finance leases | | 5,997 | | | 6,296 | | 3,657 | | | 3,855 | |
Margin lending | | 2,279 | | | 2,852 | | 2,279 | | | 2,852 | |
Other | | 2,995 | | | 3,234 | | 2,995 | | | 3,234 | |
Total Australia | | 463,014 | | | 448,482 | | 454,697 | | | 440,603 | |
New Zealand | | | | | | | | | | | |
Overdrafts | | 1,147 | | | 970 | | - | | | 229 | |
Credit card outstandings | | 1,045 | | | 996 | | - | | | - | |
Overnight and at call money market loans | | 1,215 | | | 1,235 | | 3 | | | 625 | |
Term loans: | | | | | | | | | | | |
Housing | | 28,685 | | | 27,486 | | - | | | - | |
Non-housing | | 15,784 | | | 15,035 | | 20 | | | 4,282 | |
Other | | 369 | | | 387 | | 285 | | | 262 | |
Total New Zealand | | 48,245 | | | 46,109 | | 308 | | | 5,398 | |
Total other overseas | | 7,020 | | | 6,063 | | 5,672 | | | 4,821 | |
Total loans | | 518,279 | | | 500,654 | | 460,677 | | | 450,822 | |
Provisions on loans (refer to Note 12) | | (3,834 | ) | | (4,045 | ) | (3,188 | ) | | (3,443 | ) |
Total net loans2 | | 514,445 | | | 496,609 | | 457,489 | | | 447,379 | |
Net loans classification3 | | | | | | | | | | | |
Loans – housing and personal | | 365,221 | | | 351,969 | | 331,228 | | | 319,842 | |
Loans – business | | 149,224 | | | 144,640 | | 126,261 | | | 127,537 | |
Total net loans2 | | 514,445 | | | 496,609 | | 457,489 | | | 447,379 | |
1 | Securitised loans are included in term loans. Further detail on securitised assets is disclosed in Note 31. |
2 | Included in net loans is $12 billion (2011: $11 billion) of loans designated at fair value to reduce an accounting mismatch. The cumulative change in fair value of the loans attributable to credit risk is a decrease of $125 million (2011: $133 million) for the Group and Parent Entity. The change in fair value of loans attributable to credit risk recognised during the period is $8 million (2011: $2 million) for the Group and Parent Entity. |
3 | Loans – housing and personal include products of a retail nature including mortgages, personal loans, credit cards and customer overdrafts. |
| Loans – business include corporate funding, working capital, trade and overdraft facilities. |
| | |
| 2012 WESTPAC GROUP ANNUAL REPORT | 163 |
NOTE 11. LOANS (CONTINUED)
The following table shows loans presented based on their industry classification.
| | Consolidated | |
| | 2012 | | | 2011 | | 2010 | | 2009 | | 2008 | |
| | $m | | | $m | | $m | | $m | | $m | |
Australia | | | | | | | | | | | | |
Accommodation, cafes and restaurants | | 7,035 | | | 7,121 | | 7,195 | | 7,174 | | 3,862 | |
Agriculture, forestry and fishing | | 7,683 | | | 7,790 | | 7,797 | | 7,795 | | 5,625 | |
Construction | | 6,610 | | | 6,084 | | 5,968 | | 6,511 | | 4,201 | |
Finance and insurance | | 14,376 | | | 15,925 | | 13,643 | | 19,388 | | 18,570 | |
Government, administration and defence | | 1,285 | | | 781 | | 806 | | 563 | | 451 | |
Manufacturing | | 10,798 | | | 11,339 | | 10,958 | | 12,287 | | 10,223 | |
Mining | | 2,104 | | | 1,488 | | 1,337 | | 1,883 | | 1,864 | |
Property, property services and business services | | 46,728 | | | 45,559 | | 48,398 | | 54,066 | | 35,975 | |
Services1 | | 9,548 | | | 8,936 | | 9,408 | | 10,163 | | 6,853 | |
Trade2 | | 15,925 | | | 16,094 | | 16,240 | | 15,683 | | 10,768 | |
Transport and storage | | 7,741 | | | 6,677 | | 7,351 | | 8,039 | | 5,485 | |
Utilities3 | | 2,716 | | | 2,581 | | 2,421 | | 2,640 | | 2,347 | |
Retail lending | | 328,109 | | | 316,777 | | 301,150 | | 267,490 | | 154,985 | |
Other | | 2,356 | | | 1,330 | | 1,282 | | 2,389 | | 1,663 | |
Total Australia | | 463,014 | | | 448,482 | | 433,954 | | 416,071 | | 262,872 | |
Overseas | | | | | | | | | | | | |
Accommodation, cafes and restaurants | | 594 | | | 580 | | 570 | | 691 | | 649 | |
Agriculture, forestry and fishing | | 5,345 | | | 4,975 | | 4,699 | | 4,903 | | 4,739 | |
Construction | | 1,220 | | | 1,180 | | 1,180 | | 1,242 | | 1,225 | |
Finance and insurance | | 2,406 | | | 1,998 | | 1,886 | | 2,699 | | 2,904 | |
Government, administration and defence | | 533 | | | 464 | | 474 | | 450 | | 339 | |
Manufacturing | | 3,682 | | | 2,925 | | 2,143 | | 2,607 | | 3,063 | |
Mining | | 640 | | | 368 | | 363 | | 291 | | 301 | |
Property, property services and business services | | 9,620 | | | 9,659 | | 9,156 | | 9,844 | | 10,113 | |
Services1 | | 2,174 | | | 2,149 | | 2,026 | | 2,392 | | 2,751 | |
Trade2 | | 4,411 | | | 4,047 | | 3,289 | | 2,976 | | 3,499 | |
Transport and storage | | 1,589 | | | 1,928 | | 1,800 | | 1,976 | | 1,683 | |
Utilities3 | | 1,212 | | | 1,010 | | 1,104 | | 1,340 | | 1,199 | |
Retail lending | | 21,766 | | | 20,723 | | 19,574 | | 19,103 | | 18,703 | |
Other | | 73 | | | 166 | | 148 | | 1,258 | | 1,450 | |
Total overseas | | 55,265 | | | 52,172 | | 48,412 | | 51,772 | | 52,618 | |
Total loans | | 518,279 | | | 500,654 | | 482,366 | | 467,843 | | 315,490 | |
Provisions on loans | | (3,834 | ) | | (4,045 | ) | (4,711 | ) | (4,384 | ) | (1,945 | ) |
Total net loans | | 514,445 | | | 496,609 | | 477,655 | | 463,459 | | 313,545 | |
1 Services includes education, health and community services, cultural and recreational services and personal and other services.
2 Trade includes wholesale trade and retail trade.
3 Utilities includes electricity, gas and water and communication services.
| | |
164 | 2012 WESTPAC GROUP ANNUAL REPORT | |
NOTES TO THE FINANCIAL STATEMENTS
NOTE 11. LOANS (CONTINUED)
The following table shows the consolidated contractual maturity distribution of all loans by type of customer as at 30 September 2012:
| | 2012 | |
| | Up to 1 Year | | 1 to 5 Years | | Over 5 Years | | | Total | |
| | $m | | $m | | $m | | | $m | |
Loans by type of customer in Australia | | | | | | | | | | |
Accommodation, cafes and restaurants | | 3,732 | | 2,430 | | 873 | | | 7,035 | |
Agriculture, forestry and fishing | | 3,182 | | 3,295 | | 1,206 | | | 7,683 | |
Construction | | 1,538 | | 3,535 | | 1,537 | | | 6,610 | |
Finance and insurance | | 4,826 | | 6,738 | | 2,812 | | | 14,376 | |
Government, administration and defence | | 187 | | 599 | | 499 | | | 1,285 | |
Manufacturing | | 4,372 | | 5,234 | | 1,192 | | | 10,798 | |
Mining | | 323 | | 1,467 | | 314 | | | 2,104 | |
Property, property services and business services | | 20,434 | | 20,246 | | 6,048 | | | 46,728 | |
Services1 | | 2,844 | | 4,790 | | 1,914 | | | 9,548 | |
Trade2 | | 6,342 | | 7,148 | | 2,435 | | | 15,925 | |
Transport and storage | | 1,298 | | 5,342 | | 1,101 | | | 7,741 | |
Utilities3 | | 543 | | 1,963 | | 210 | | | 2,716 | |
Retail lending | | 25,202 | | 47,773 | | 255,134 | | | 328,109 | |
Other | | 1,617 | | 346 | | 393 | | | 2,356 | |
Total Australia | | 76,440 | | 110,906 | | 275,668 | | | 463,014 | |
Total overseas | | 15,571 | | 8,734 | | 30,960 | | | 55,265 | |
Total loans | | 92,011 | | 119,640 | | 306,628 | | | 518,279 | |
1 Services includes education, health and community services, cultural and recreational services and personal and other services.
2 Trade includes wholesale trade and retail trade.
3 Utilities includes electricity, gas and water and communication services.
| | Consolidated | |
| | 2012 | | 2011 | |
| | Loans at | | Loans at | | | | Loans at | | Loans at | | | |
| | Variable | | Fixed | | | | Variable | | Fixed | | | |
| | Interest | | Interest | | | | Interest | | Interest | | | |
| | Rates | | Rates | | Total | | Rates | | Rates | | Total | |
| | $m | | $m | | $m | | $m | | $m | | $m | |
Interest rate segmentation of Group loans maturing after one year | | | | | | | | | | | | | |
By offices in Australia | | 330,398 | | 56,176 | | 386,574 | | 307,899 | | 51,063 | | 358,962 | |
By offices overseas | | 17,568 | | 22,126 | | 39,694 | | 16,797 | | 21,730 | | 38,527 | |
Total loans maturing after one year | | 347,966 | | 78,302 | | 426,268 | | 324,696 | | 72,793 | | 397,489 | |
2012 WESTPAC GROUP ANNUAL REPORT | 165 |
NOTE 11. LOANS (CONTINUED)
Loans include the following finance receivables:
| | Consolidated | | Parent Entity | |
| | 2012 | | 2011 | | 2012 | | 2011 | |
| | $m | | $m | | $m | | $m | |
Gross investment in finance leases, receivable: | | | | | | | | | |
Due within one year | | 747 | | 669 | | 425 | | 408 | |
Due after one year but not later than five years | | 5,692 | | 6,294 | | 3,377 | | 3,682 | |
Due after five years | | 797 | | 658 | | 432 | | 402 | |
Unearned future finance income on finance leases | | (1,034 | ) | (1,137 | ) | (527 | ) | (586 | ) |
Net investment in finance leases | | 6,202 | | 6,484 | | 3,707 | | 3,906 | |
Accumulated allowance for uncollectible minimum lease payments | | (27 | ) | (47 | ) | (26 | ) | (47 | ) |
Net investment in finance leases after accumulated allowance | | 6,175 | | 6,437 | | 3,681 | | 3,859 | |
The net investment in finance leases may be analysed as follows: | | | | | | | | | |
Due within one year | | 716 | | 654 | | 410 | | 395 | |
Due after one year but not later than five years | | 4,901 | | 5,307 | | 2,966 | | 3,210 | |
Due after five years | | 585 | | 523 | | 331 | | 301 | |
Total net investment in finance leases | | 6,202 | | 6,484 | | 3,707 | | 3,906 | |
NOTE 12. PROVISIONS FOR IMPAIRMENT CHARGES
| | Consolidated | | Parent Entity | |
| | 2012 | | 2011 | | 2010 | | 2012 | | 2011 | |
| | $m | | $m | | $m | | $m | | $m | |
Collectively assessed provisions | | | | | | | | | | | |
Balance as at beginning of the year | | 2,953 | | 3,439 | | 3,506 | | 2,536 | | 2,977 | |
Transfers1 | | - | | - | | - | | (44 | ) | - | |
Provisions raised/(released) | | 342 | | (24 | ) | 363 | | 285 | | (37 | ) |
Write-offs | | (756 | ) | (739 | ) | (667 | ) | (646 | ) | (644 | ) |
Interest adjustment | | 229 | | 264 | | 276 | | 195 | | 230 | |
Exchange rate and other adjustments | | 3 | | 13 | | (39 | ) | 10 | | 10 | |
Balance as at end of the year | | 2,771 | | 2,953 | | 3,439 | | 2,336 | | 2,536 | |
Individually assessed provisions | | | | | | | | | | | |
Balance as at beginning of the year | | 1,461 | | 1,622 | | 1,228 | | 1,251 | | 1,360 | |
Transfers1 | | - | | - | | - | | (31 | ) | - | |
Provisions raised | | 1,442 | | 1,619 | | 1,497 | | 1,219 | | 1,362 | |
Write-backs | | (468 | ) | (542 | ) | (353 | ) | (416 | ) | (502 | ) |
Write-offs | | (952 | ) | (1,188 | ) | (684 | ) | (787 | ) | (918 | ) |
Interest adjustment | | (38 | ) | (11 | ) | (43 | ) | (35 | ) | (17 | ) |
Exchange rate and other adjustments | | 25 | | (39 | ) | (23 | ) | 26 | | (34 | ) |
Balance as at end of the year | | 1,470 | | 1,461 | | 1,622 | | 1,227 | | 1,251 | |
Total provisions for impairment charges on loans and credit commitments | | 4,241 | | 4,414 | | 5,061 | | 3,563 | | 3,787 | |
Less provisions for credit commitments (refer to Note 20) | | (407 | ) | (369 | ) | (350 | ) | (375 | ) | (344 | ) |
Total provisions for impairment charges on loans | | 3,834 | | 4,045 | | 4,711 | | 3,188 | | 3,443 | |
1 In the current financial year, provisions in respect of loans were transferred to Westpac New Zealand Limited as part of the business reorganisation. Refer to Note 32 for further details.
| | Consolidated | | Parent Entity | |
| | 2012 | | 2011 | | 2010 | | 2012 | | 2011 | |
| | $m | | $m | | $m | | $m | | $m | |
Reconciliation of impairment charges | | | | | | | | | | | |
Individually assessed provisions raised | | 1,442 | | 1,619 | | 1,497 | | 1,219 | | 1,362 | |
Write-backs | | (468 | ) | (542 | ) | (353 | ) | (416 | ) | (502 | ) |
Recoveries | | (104 | ) | (60 | ) | (51 | ) | (87 | ) | (48 | ) |
Collectively assessed provisions raised/(released) | | 342 | | (24 | ) | 363 | | 285 | | (37 | ) |
Impairment charges | | 1,212 | | 993 | | 1,456 | | 1,001 | | 775 | |
166 | 2012 WESTPAC GROUP ANNUAL REPORT | |
NOTES TO THE FINANCIAL STATEMENTS
NOTE 12. PROVISIONS FOR IMPAIRMENT CHARGES (CONTINUED)
The following table presents provisions for impairment charges on loans by industry classification for the past five years:
| | Consolidated | |
| | 2012 | | 2011 | | 2010 | | 2009 | | 2008 | |
| | $m | | % | | $m | | % | | $m | | % | | $m | | % | | $m | | % | |
Individually assessed provisions by type of customer | | | | | | | | | | | | | | | | | | | | | |
Australia | | | | | | | | | | | | | | | | | | | | | |
Accommodation, cafes and restaurants | | 53 | | 1.2 | | 45 | | 1.0 | | 44 | | 0.9 | | 50 | | 1.1 | | 1 | | - | |
Agriculture, forestry and fishing | | 46 | | 1.1 | | 28 | | 0.6 | | 27 | | 0.5 | | 43 | | 0.9 | | 3 | | 0.1 | |
Construction | | 73 | | 1.7 | | 63 | | 1.4 | | 32 | | 0.6 | | 33 | | 0.7 | | 3 | | 0.1 | |
Finance and insurance | | 38 | | 0.9 | | 58 | | 1.3 | | 60 | | 1.2 | | 74 | | 1.6 | | 50 | | 2.3 | |
Manufacturing | | 116 | | 2.7 | | 90 | | 2.0 | | 143 | | 2.8 | | 93 | | 2.0 | | 17 | | 0.8 | |
Mining | | 2 | | 0.1 | | 2 | | - | | 31 | | 0.6 | | 46 | | 1.0 | | - | | - | |
Property, property services and business services | | 518 | | 12.2 | | 559 | | 12.7 | | 595 | | 11.8 | | 409 | | 8.6 | | 51 | | 2.4 | |
Services1 | | 121 | | 2.9 | | 96 | | 2.2 | | 51 | | 1.0 | | 49 | | 1.0 | | 137 | | 6.3 | |
Trade2 | | 87 | | 2.1 | | 97 | | 2.2 | | 47 | | 0.9 | | 62 | | 1.3 | | 55 | | 2.6 | |
Transport and storage | | 47 | | 1.1 | | 38 | | 0.9 | | 80 | | 1.6 | | 15 | | 0.3 | | 3 | | 0.1 | |
Utilities3 | | 22 | | 0.5 | | 23 | | 0.5 | | 27 | | 0.5 | | 37 | | 0.8 | | - | | - | |
Retail lending | | 67 | | 1.6 | | 74 | | 1.7 | | 137 | | 2.7 | | 148 | | 3.1 | | 9 | | 0.4 | |
Other | | 7 | | 0.2 | | 7 | | 0.2 | | 26 | | 0.5 | | 23 | | 0.5 | | 2 | | 0.1 | |
Total Australia | | 1,197 | | 28.3 | | 1,180 | | 26.7 | | 1,300 | | 25.6 | | 1,082 | | 22.9 | | 331 | | 15.2 | |
New Zealand | | | | | | | | | | | | | | | | | | | | | |
Accommodation, cafes and restaurants | | 5 | | 0.1 | | 2 | | - | | 2 | | - | | 2 | | - | | 1 | | - | |
Agriculture, forestry and fishing | | 20 | | 0.5 | | 20 | | 0.5 | | 46 | | 0.9 | | 17 | | 0.4 | | 6 | | 0.3 | |
Construction | | 2 | | 0.1 | | 4 | | 0.1 | | 2 | | - | | 4 | | 0.1 | | 1 | | - | |
Finance and insurance | | 9 | | 0.2 | | 3 | | 0.1 | | 1 | | - | | 1 | | - | | - | | - | |
Manufacturing | | 16 | | 0.4 | | 29 | | 0.7 | | 10 | | 0.2 | | 14 | | 0.3 | | 1 | | - | |
Mining | | - | | - | | 1 | | - | | - | | - | | - | | - | | - | | - | |
Property, property services and business services | | 116 | | 2.7 | | 112 | | 2.5 | | 143 | | 2.9 | | 43 | | 0.9 | | 22 | | 1.0 | |
Services1 | | 35 | | 0.8 | | 6 | | 0.1 | | 5 | | 0.1 | | 4 | | 0.1 | | 1 | | - | |
Trade2 | | 3 | | 0.1 | | 7 | | 0.2 | | 13 | | 0.3 | | 6 | | 0.1 | | 4 | | 0.2 | |
Transport and storage | | - | | - | | - | | - | | - | | - | | 2 | | - | | - | | - | |
Utilities3 | | - | | - | | - | | - | | 12 | | 0.2 | | - | | - | | - | | - | |
Retail lending | | 14 | | 0.3 | | 27 | | 0.6 | | 36 | | 0.8 | | 31 | | 0.7 | | 20 | | 0.9 | |
Total New Zealand | | 220 | | 5.2 | | 211 | | 4.8 | | 270 | | 5.4 | | 124 | | 2.6 | | 56 | | 2.4 | |
Other overseas | | | | | | | | | | | | | | | | | | | | | |
Accommodation, cafes and restaurants | | 2 | | 0.1 | | 2 | | - | | 1 | | - | | 4 | | 0.1 | | 1 | | - | |
Agriculture, forestry and fishing | | 2 | | 0.1 | | - | | - | | 1 | | - | | 3 | | 0.1 | | 1 | | - | |
Construction | | 7 | | 0.2 | | - | | - | | - | | - | | 8 | | 0.2 | | - | | - | |
Finance and insurance | | 23 | | 0.5 | | 17 | | 0.6 | | - | | - | | - | | - | | - | | - | |
Manufacturing | | 2 | | - | | 2 | | - | | - | | - | | - | | - | | 5 | | 0.2 | |
Mining | | - | | - | | - | | - | | - | | - | | - | | - | | 1 | | - | |
Property, property services and business services | | 9 | | 0.2 | | 19 | | 0.4 | | 6 | | 0.1 | | - | | - | | 11 | | 0.5 | |
Services1 | | 2 | | - | | 1 | | - | | 16 | | 0.3 | | 1 | | - | | - | | - | |
Trade2 | | 1 | | - | | 2 | | - | | - | | - | | 4 | | 0.1 | | 2 | | 0.1 | |
Transport and storage | | 1 | | - | | 17 | | 0.4 | | 19 | | 0.4 | | 2 | | - | | 2 | | 0.1 | |
Retail lending | | 4 | | 0.1 | | 10 | | 0.2 | | 9 | | 0.2 | | - | | - | | 1 | | - | |
Other | | - | | - | | - | | - | | - | | - | | - | | - | | 2 | | 0.1 | |
Total other overseas | | 53 | | 1.2 | | 70 | | 1.6 | | 52 | | 1.0 | | 22 | | 0.5 | | 26 | | 1.0 | |
Total overseas | | 273 | | 6.4 | | 281 | | 6.4 | | 322 | | 6.4 | | 146 | | 3.1 | | 82 | | 3.4 | |
Total individually assessed provisions | | 1,470 | | 34.7 | | 1,461 | | 33.1 | | 1,622 | | 32.0 | | 1,228 | | 26.0 | | 413 | | 18.6 | |
Total collectively assessed provisions | | 2,771 | | 65.3 | | 2,953 | | 66.9 | | 3,439 | | 68.0 | | 3,506 | | 74.0 | | 1,761 | | 81.4 | |
Total provisions for impairment charges and credit commitments | | 4,241 | | 100.0 | | 4,414 | | 100.0 | | 5,061 | | 100.0 | | 4,734 | | 100.0 | | 2,174 | | 100.0 | |
1 Services includes education, health and community services, cultural and recreational services and personal and other services.
2 Trade includes wholesale trade and retail trade.
3 Utilities includes electricity, gas and water and communication services.
2012 WESTPAC GROUP ANNUAL REPORT | 167 |
NOTE 12. PROVISIONS FOR IMPAIRMENT CHARGES (CONTINUED)
The following table shows details of loan write-offs by industry classifications for the past five years:
| | Consolidated | |
| | 2012 | | 2011 | | 2010 | | 2009 | | 2008 | |
| | $m | | $m | | $m | | $m | | $m | |
Write-offs | | | | | | | | | | | |
Australia | | | | | | | | | | | |
Accommodation, cafes and restaurants | | (24 | ) | (34 | ) | (47 | ) | (5 | ) | (3 | ) |
Agriculture, forestry and fishing | | (11 | ) | (23 | ) | (9 | ) | (6 | ) | (7 | ) |
Construction | | (106 | ) | (27 | ) | (68 | ) | (37 | ) | (5 | ) |
Finance and insurance | | (11 | ) | (5 | ) | (30 | ) | (327 | ) | - | |
Manufacturing | | (45 | ) | (134 | ) | (45 | ) | (37 | ) | (30 | ) |
Mining | | (1 | ) | (15 | ) | (14 | ) | (13 | ) | - | |
Property, property services and business services | | (453 | ) | (507 | ) | (272 | ) | (156 | ) | (26 | ) |
Services1 | | (41 | ) | (28 | ) | (32 | ) | (107 | ) | (6 | ) |
Trade2 | | (53 | ) | (57 | ) | (51 | ) | (115 | ) | (10 | ) |
Transport and storage | | (37 | ) | (60 | ) | (25 | ) | (13 | ) | (7 | ) |
Utilities3 | | (33 | ) | (7 | ) | (4 | ) | (101 | ) | - | |
Retail lending | | (597 | ) | (661 | ) | (566 | ) | (611 | ) | (291 | ) |
Other | | (11 | ) | (21 | ) | (39 | ) | (22 | ) | (9 | ) |
Total Australia | | (1,423 | ) | (1,579 | ) | (1,202 | ) | (1,550 | ) | (394 | ) |
New Zealand | | | | | | | | | | | |
Accommodation, cafes and restaurants | | (2 | ) | (3 | ) | (2 | ) | (1 | ) | - | |
Agriculture, forestry and fishing | | (23 | ) | (59 | ) | (4 | ) | - | | - | |
Construction | | (9 | ) | (24 | ) | (4 | ) | (27 | ) | - | |
Finance and insurance | | (2 | ) | (1 | ) | (1 | ) | (3 | ) | - | |
Manufacturing | | (17 | ) | (12 | ) | (15 | ) | (70 | ) | (1 | ) |
Mining | | (1 | ) | - | | - | | - | | - | |
Property, property services and business services | | (105 | ) | (126 | ) | (29 | ) | (146 | ) | (4 | ) |
Services1 | | (5 | ) | (4 | ) | (4 | ) | (3 | ) | (1 | ) |
Trade2 | | (3 | ) | (15 | ) | (3 | ) | (10 | ) | (16 | ) |
Transport and storage | | (1 | ) | - | | (2 | ) | - | | - | |
Utilities3 | | - | | (13 | ) | - | | - | | - | |
Retail lending | | (59 | ) | (84 | ) | (79 | ) | (88 | ) | (53 | ) |
Other | | (1 | ) | (1 | ) | (3 | ) | (2 | ) | - | |
Total New Zealand | | (228 | ) | (342 | ) | (146 | ) | (350 | ) | (75 | ) |
Other overseas | | | | | | | | | | | |
Accommodation, cafes and restaurants | | (3 | ) | - | | - | | (3 | ) | - | |
Agriculture, forestry and fishing | | (1 | ) | - | | - | | (2 | ) | - | |
Construction | | (3 | ) | - | | - | | (5 | ) | - | |
Finance and insurance | | (12 | ) | - | | - | | - | | - | |
Manufacturing | | (1 | ) | (3 | ) | - | | - | | - | |
Property, property services and business services | | (7 | ) | (1 | ) | (3 | ) | (3 | ) | - | |
Services1 | | (2 | ) | - | | - | | (6 | ) | - | |
Trade2 | | (2 | ) | - | | - | | (3 | ) | - | |
Transport and storage | | (19 | ) | - | | - | | (1 | ) | - | |
Retail lending | | (7 | ) | - | | - | | - | | (1 | ) |
Other | | - | | (2 | ) | - | | - | | (1 | ) |
Total other overseas | | (57 | ) | (6 | ) | (3 | ) | (23 | ) | (2 | ) |
Total write-offs | | (1,708 | ) | (1,927 | ) | (1,351 | ) | (1,923 | ) | (471 | ) |
Write-offs in relation to: | | | | | | | | | | | |
Collectively assessed provisions | | (756 | ) | (739 | ) | (667 | ) | (632 | ) | (378 | ) |
Individually assessed provisions | | (952 | ) | (1,188 | ) | (684 | ) | (1,291 | ) | (93 | ) |
Total write-offs | | (1,708 | ) | (1,927 | ) | (1,351 | ) | (1,923 | ) | (471 | ) |
1 Services includes education, health and community services, cultural and recreational services and personal and other services.
2 Trade includes wholesale trade and retail trade.
3 Utilities includes electricity, gas and water and communication services.
168 | 2012 WESTPAC GROUP ANNUAL REPORT | |
NOTES TO THE FINANCIAL STATEMENTS
NOTE 12. PROVISIONS FOR IMPAIRMENT CHARGES (CONTINUED)
The following table shows details of recoveries of loans by industry classifications for the past five years:
| | Consolidated | |
| | 2012 | | 2011 | | 2010 | | 2009 | | 2008 | |
| | $m | | $m | | $m | | $m | | $m | |
Recoveries | | | | | | | | | | | |
Australia | | | | | | | | | | | |
Accommodation, cafes and restaurants | | - | | - | | 1 | | - | | - | |
Construction | | 1 | | - | | 2 | | - | | - | |
Finance and insurance | | 2 | | - | | - | | - | | - | |
Manufacturing | | 5 | | - | | 2 | | - | | 1 | |
Property, property services and business services | | 23 | | 9 | | 3 | | - | | - | |
Services1 | | 1 | | - | | 1 | | - | | - | |
Trade2 | | 1 | | - | | 1 | | - | | - | |
Transport and storage | | 1 | | - | | 1 | | - | | - | |
Utilities3 | | - | | - | | - | | 2 | | - | |
Retail lending | | 61 | | 46 | | 31 | | 37 | | 22 | |
Other | | 1 | | - | | 2 | | 2 | | - | |
Total Australia | | 96 | | 55 | | 44 | | 41 | | 23 | |
Total New Zealand | | 8 | | 5 | | 4 | | - | | - | |
Total other overseas | | - | | - | | 3 | | 8 | | 9 | |
Total recoveries | | 104 | | 60 | | 51 | | 49 | | 32 | |
Total write-offs | | (1,708 | ) | (1,927 | ) | (1,351 | ) | (1,923 | ) | (471 | ) |
Net write-offs and recoveries | | (1,604 | ) | (1,867 | ) | (1,300 | ) | (1,874 | ) | (439 | ) |
1 Services includes education, health and community services, cultural and recreational services and personal and other services.
2 Trade includes wholesale trade and retail trade.
3 Utilities includes electricity, gas and water and communication services.
2012 WESTPAC GROUP ANNUAL REPORT | 169 |
NOTE 13. GOODWILL AND OTHER INTANGIBLE ASSETS
| | Consolidated | | Parent Entity | |
| | 2012 | | 2011 | | 2012 | | 2011 | |
| | $m | | $m | | $m | | $m | |
Goodwill | | | | | | | | | |
Balance as at beginning of the year | | 8,582 | | 8,569 | | 6,653 | | 6,653 | |
Additions through business combination1 | | 214 | | - | | - | | - | |
Exchange rate and other adjustments | | 1 | | 13 | | - | | - | |
Balance as at end of the year | | 8,797 | | 8,582 | | 6,653 | | 6,653 | |
Computer software | | | | | | | | | |
Balance as at beginning of the year | | 1,303 | | 832 | | 1,135 | | 708 | |
Additions | | 603 | | 740 | | 511 | | 635 | |
Impairment | | (23 | ) | (6 | ) | (23 | ) | (5 | ) |
Amortisation | | (329 | ) | (259 | ) | (268 | ) | (203 | ) |
Exchange rate adjustments | | (2 | ) | (4 | ) | - | | - | |
Other | | (1 | ) | - | | (4 | ) | - | |
Balance as at end of the year | | 1,551 | | 1,303 | | 1,351 | | 1,135 | |
Cost | | 2,382 | | 2,119 | | 1,617 | | 1,431 | |
Accumulated amortisation | | (831 | ) | (816 | ) | (266 | ) | (296 | ) |
Carrying amount | | 1,551 | | 1,303 | | 1,351 | | 1,135 | |
Brand names | | | | | | | | | |
Balance as at beginning of the year | | 670 | | 668 | | 636 | | 636 | |
Additions | | - | | 2 | | - | | - | |
Balance as at end of the year | | 670 | | 670 | | 636 | | 636 | |
Carrying amount | | 670 | | 670 | | 636 | | 636 | |
Core deposit intangibles | | | | | | | | | |
Balance as at beginning of the year | | 1,016 | | 1,182 | | 1,016 | | 1,182 | |
Amortisation | | (165 | ) | (166 | ) | (165 | ) | (166 | ) |
Balance as at end of the year | | 851 | | 1,016 | | 851 | | 1,016 | |
Cost | | 1,494 | | 1,494 | | 1,279 | | 1,279 | |
Accumulated amortisation | | (643 | ) | (478 | ) | (428 | ) | (263 | ) |
Carrying amount | | 851 | | 1,016 | | 851 | | 1,016 | |
Other intangible assets | | | | | | | | | |
Balance as at beginning of the year | | 208 | | 253 | | 160 | | 202 | |
Additions through business combination1 | | 120 | | - | | - | | - | |
Impairment | | (5 | ) | - | | - | | - | |
Amortisation | | (55 | ) | (45 | ) | (42 | ) | (42 | ) |
Exchange rate and other adjustments | | (3 | ) | - | | - | | - | |
Balance as at end of the year | | 265 | | 208 | | 118 | | 160 | |
Cost | | 544 | | 428 | | 226 | | 226 | |
Accumulated amortisation | | (279 | ) | (220 | ) | (108 | ) | (66 | ) |
Carrying amount | | 265 | | 208 | | 118 | | 160 | |
Total goodwill and other intangible assets | | 12,134 | | 11,779 | | 9,609 | | 9,600 | |
1 Attributable to the acquisition of J O Hambro Capital Management Limited.
170 | 2012 WESTPAC GROUP ANNUAL REPORT | |
NOTES TO THE FINANCIAL STATEMENTS
NOTE 13. GOODWILL AND OTHER INTANGIBLE ASSETS (CONTINUED)
Goodwill has been allocated to the following Cash Generating Units (CGUs):
| | Consolidated | | Parent Entity | |
| | 2012 | | 2011 | | 2012 | | 2011 | |
| | $m | | $m | | $m | | $m | |
Westpac Retail & Business Banking1 | | 980 | | 1,112 | | 980 | | 999 | |
St.George Banking Group1 | | 4,464 | | 4,332 | | 4,351 | | 4,332 | |
Westpac Institutional Bank1 | | 543 | | 613 | | 487 | | 487 | |
BT Financial Group (Australia)1 | | 2,103 | | 2,033 | | 835 | | 835 | |
Hambro | | 208 | | - | | - | | - | |
New Zealand Retail Banking | | 411 | | 404 | | - | | - | |
BT New Zealand | | 11 | | 11 | | - | | - | |
Hastings | | 64 | | 64 | | - | | - | |
Bank of Tonga | | 13 | | 13 | | - | | - | |
Total goodwill | | 8,797 | | 8,582 | | 6,653 | | 6,653 | |
1 During the year management responsibility for RAMS was transferred from Westpac Retail & Business Banking to St.George Banking Group and the equities business was transferred from Westpac Institutional Bank to BT Financial Group (Australia). The historical goodwill attributable to these businesses of $132 million (Parent Entity: $19 million) and $70 million respectively has been reallocated accordingly.
Impairment tests for goodwill
To assess whether goodwill is impaired, the carrying amount of each CGU is compared to their recoverable amount determined on a value in use basis.
Key assumptions used in recoverable amount calculations
The recoverable amount of each CGU is determined based on the Group’s projections of future pre-tax cash flows discounted by the Group’s after tax return on equity rate of 11.0% (2011: 11.0%), adjusted to a pre-tax rate of 15.7% for Australia, 15.3% for New Zealand and 14.5% for the United Kingdom (2011: 15.7% for Australia, 15.3% for New Zealand, not applicable for the United Kingdom). All future cash flows are based on approved two (2011: three) year forecasts. All cash flows beyond the two year period have an assumed growth rate of zero for all CGUs for the purpose of goodwill impairment testing. The strategic business plan assumes certain economic conditions and business performance, which are considered appropriate as they are consistent with observable historical information and current market expectations of the future. The forecasts applied by management are not reliant on any one particular assumption and no impairment would arise in significant CGUs even if zero growth is achieved over the two year forecast period.
Sensitivity to changes in assumptions
Management consider alternative key assumptions including, for example, increasing the discount rate by 2% or reducing future cash flows by 10%. Under these scenarios the recoverable amount of each significant CGU would continue to exceed its carrying value.
2012 WESTPAC GROUP ANNUAL REPORT | 171 |
NOTE 14. PROPERTY, PLANT AND EQUIPMENT
| | Consolidated | | Parent Entity | |
| | 2012 | | 2011 | | 2012 | | 2011 | |
| | $m | | $m | | $m | | $m | |
Premises and sites | | | | | | | | | |
Cost | | 364 | | 312 | | 252 | | 200 | |
Accumulated depreciation | | (141 | ) | (114 | ) | (53 | ) | (27 | ) |
Net carrying amount | | 223 | | 198 | | 199 | | 173 | |
Leasehold improvements | | | | | | | | | |
Cost | | 980 | | 937 | | 770 | | 755 | |
Accumulated amortisation | | (463 | ) | (374 | ) | (357 | ) | (284 | ) |
Net carrying amount | | 517 | | 563 | | 413 | | 471 | |
Furniture and equipment | | | | | | | | | |
Cost | | 698 | | 641 | | 503 | | 451 | |
Accumulated depreciation | | (516 | ) | (472 | ) | (348 | ) | (311 | ) |
Net carrying amount | | 182 | | 169 | | 155 | | 140 | |
Technology | | | | | | | | | |
Cost | | 574 | | 610 | | 307 | | 320 | |
Accumulated depreciation | | (359 | ) | (382 | ) | (114 | ) | (122 | ) |
Net carrying amount | | 215 | | 228 | | 193 | | 198 | |
Total property, plant and equipment | | 1,137 | | 1,158 | | 960 | | 982 | |
172 | 2012 WESTPAC GROUP ANNUAL REPORT | |
NOTES TO THE FINANCIAL STATEMENTS
NOTE 14. PROPERTY, PLANT AND EQUIPMENT (CONTINUED)
Reconciliations of the carrying amount for each class of property, plant and equipment are set out below:
| | Consolidated | | Parent Entity | |
| | 2012 | | | 2011 | | 2012 | | | 2011 | |
| | $m | | | $m | | $m | | | $m | |
Premises and sites | | | | | | | | | | | |
Balance as at beginning of the year | | 198 | | | 210 | | 173 | | | 184 | |
Additions | | 2 | | | 5 | | 2 | | | 5 | |
Disposals | | (1 | ) | | (2 | ) | (1 | ) | | (1 | ) |
Depreciation | | (14 | ) | | (16 | ) | (13 | ) | | (15 | ) |
Exchange rate adjustments | | - | | | 1 | | - | | | - | |
Other1 | | 38 | | | - | | 38 | | | - | |
Balance as at end of the year | | 223 | | | 198 | | 199 | | | 173 | |
Leasehold improvements | | | | | | | | | | | |
Balance as at beginning of the year | | 563 | | | 454 | | 471 | | | 377 | |
Additions | | 101 | | | 201 | | 76 | | | 176 | |
Disposals | | (4 | ) | | (5 | ) | (4 | ) | | (1 | ) |
Amortisation | | (106 | ) | | (89 | ) | (92 | ) | | (81 | ) |
Exchange rate adjustments | | 1 | | | 2 | | - | | | - | |
Other1 | | (38 | ) | | - | | (38 | ) | | - | |
Balance as at end of the year | | 517 | | | 563 | | 413 | | | 471 | |
Furniture and equipment | | | | | | | | | | | |
Balance as at beginning of the year | | 169 | | | 181 | | 140 | | | 162 | |
Additions | | 76 | | | 52 | | 70 | | | 33 | |
Disposals | | (1 | ) | | (2 | ) | (1 | ) | | (1 | ) |
Depreciation | | (62 | ) | | (63 | ) | (54 | ) | | (54 | ) |
Exchange rate adjustments | | - | | | 1 | | - | | | - | |
Balance as at end of the year | | 182 | | | 169 | | 155 | | | 140 | |
Technology | | | | | | | | | | | |
Balance as at beginning of the year | | 228 | | | 165 | | 198 | | | 129 | |
Additions | | 73 | | | 144 | | 65 | | | 133 | |
Disposals | | (1 | ) | | (6 | ) | (1 | ) | | (5 | ) |
Depreciation | | (85 | ) | | (76 | ) | (71 | ) | | (59 | ) |
Exchange rate adjustments | | (1 | ) | | 1 | | (1 | ) | | - | |
Other | | 1 | | | - | | 3 | | | - | |
Balance as at end of the year | | 215 | | | 228 | | 193 | | | 198 | |
1 During the current financial year, assets were reclassified from leasehold improvements to premises and sites.
| | |
| 2012 WESTPAC GROUP ANNUAL REPORT | 173 |
NOTE 15. DEFERRED TAX ASSETS AND DEFERRED TAX LIABILITIES
Deferred tax assets
| | Consolidated | | Parent Entity | |
| | 2012 | | | 2011 | | 2012 | | | 2011 | |
| | $m | | | $m | | $m | | | $m | |
The balance comprises temporary differences attributable to: | | | | | | | | | | | |
Amounts recognised in income statements | | | | | | | | | | | |
Provisions for impairment charges on loans | | 1,126 | | | 1,195 | | 934 | | | 1,012 | |
Provision for employee benefits | | 297 | | | 299 | | 249 | | | 240 | |
Treasury/financial market products | | 87 | | | (4 | ) | 64 | | | (32 | ) |
Property, plant and equipment | | 227 | | | 156 | | 222 | | | 152 | |
Provision for litigation and non-lending losses | | 91 | | | 56 | | 89 | | | 56 | |
Provision for credit commitments | | 111 | | | 99 | | 111 | | | 99 | |
Provision for restructuring | | 34 | | | 7 | | 34 | | | 6 | |
Provision for lease liabilities | | 29 | | | 17 | | 26 | | | 24 | |
Other provisions | | 44 | | | 38 | | 41 | | | 36 | |
Other liabilities | | 780 | | | 1,145 | | 767 | | | 1,115 | |
Life insurance policy liabilities | | 36 | | | 57 | | - | | | - | |
Tax losses recognised | | 1 | | | - | | - | | | - | |
Change in tax rate (refer to Note 5) | | (1 | ) | | (13 | ) | (1 | ) | | (2 | ) |
| | 2,862 | | | 3,052 | | 2,536 | | | 2,706 | |
Amounts recognised directly in other comprehensive income | | | | | | | | | | | |
Available-for-sale securities | | (18 | ) | | (16 | ) | (2 | ) | | 10 | |
Retirement benefit deficit | | 190 | | | 208 | | 190 | | | 208 | |
Other equity items | | 4 | | | 4 | | 4 | | | 4 | |
| | 176 | | | 196 | | 192 | | | 222 | |
Set-off of deferred tax liabilities pursuant to set-off provisions1 | | (862 | ) | | (597 | ) | (696 | ) | | (472 | ) |
Net deferred tax assets | | 2,176 | | | 2,651 | | 2,032 | | | 2,456 | |
Net deferred tax assets to be recovered within 12 months | | 673 | | | 911 | | 639 | | | 874 | |
Net deferred tax assets to be recovered after more than 12 months | | 1,503 | | | 1,740 | | 1,393 | | | 1,582 | |
Movement | | | | | | | | | | | |
Opening balance as at beginning of the year | | 2,651 | | | 2,290 | | 2,456 | | | 1,938 | |
Credited to income statements | | 407 | | | 843 | | 302 | | | 869 | |
Recognised in other comprehensive income | | (20 | ) | | 115 | | (30 | ) | | 121 | |
Set-off of deferred tax liabilities pursuant to set-off provisions1 | | (862 | ) | | (597 | ) | (696 | ) | | (472 | ) |
Closing balance as at end of the year | | 2,176 | | | 2,651 | | 2,032 | | | 2,456 | |
1 Deferred tax assets and liabilities are set-off where they relate to income tax levied by the same taxation authority on either the same taxable entity or different taxable entities within the same taxable group.
| | |
174 | 2012 WESTPAC GROUP ANNUAL REPORT | |
NOTES TO THE FINANCIAL STATEMENTS
NOTE 15. DEFERRED TAX ASSETS AND DEFERRED TAX LIABILITIES (CONTINUED)
Unrecognised deferred tax assets
Deferred tax assets have not been recognised in respect of the following items:
| | Consolidated | | Parent Entity | |
| | 2012 | | | 2011 | | 2012 | | | 2011 | |
| | $m | | | $m | | $m | | | $m | |
Tax losses on revenue account | | 78 | | | 85 | | 74 | | | 75 | |
The deferred tax assets related to losses will only be recognised if:
§ the Group or relevant entity derives future assessable income of a nature or amount sufficient to enable the benefits from the deductions for the losses to be utilised;
§ the Group or relevant entity continues to comply with the conditions of deductibility imposed by tax legislation;
§ no changes in tax legislation adversely affect the Group or relevant entity in realising the benefits from the deductions for the losses; and
§ the deductible temporary differences and tax losses have not expired under current tax legislation.
Deferred tax assets have not been recognised in respect of these items because it is not considered probable that future taxable profit will be available against which they can be realised.
Deferred tax liabilities
| | Consolidated | | Parent Entity | |
| | 2012 | | | 2011 | | 2012 | | | 2011 | |
| | $m | | | $m | | $m | | | $m | |
The balance comprises temporary differences attributable to: | | | | | | | | | | | |
Amounts recognised in income statements | | | | | | | | | | | |
Treasury/financial market products | | 32 | | | (54 | ) | 39 | | | (45 | ) |
Finance lease transactions | | 166 | | | 138 | | 33 | | | 40 | |
Property, plant and equipment | | 111 | | | 40 | | 109 | | | 39 | |
Life insurance assets | | 5 | | | 8 | | - | | | - | |
Other assets | | 378 | | | 433 | | 308 | | | 373 | |
| | 692 | | | 565 | | 489 | | | 407 | |
Amounts recognised directly in other comprehensive income | | | | | | | | | | | |
Cash flow hedges | | 203 | | | 43 | | 207 | | | 66 | |
| | 203 | | | 43 | | 207 | | | 66 | |
Set-off of deferred tax liabilities pursuant to set-off provisions1 | | (862 | ) | | (597 | ) | (696 | ) | | (472 | ) |
Net deferred tax liabilities | | 33 | | | 11 | | - | | | 1 | |
Net deferred tax liabilities to be recovered within 12 months | | 15 | | | 5 | | - | | | - | |
Net deferred tax liabilities to be recovered after more than 12 months | | 18 | | | 6 | | - | | | 1 | |
Movements | | | | | | | | | | | |
Opening balance as at beginning of the year | | 11 | | | 24 | | 1 | | | 1 | |
Charged to income statements | | 724 | | | 342 | | 554 | | | 243 | |
Recognised in other comprehensive income | | 160 | | | 242 | | 141 | | | 229 | |
Set-off of deferred tax liabilities pursuant to set-off provisions1 | | (862 | ) | | (597 | ) | (696 | ) | | (472 | ) |
Closing balance as at end of the year | | 33 | | | 11 | | - | | | 1 | |
1 Deferred tax assets and liabilities are set-off where they relate to the same taxation authority on either the same taxable entity or different entities within the same taxable group.
Deferred tax liabilities relating to aggregate temporary differences of $29 million (2011: $25 million) associated with investments in subsidiaries have not been recognised because the Parent Entity controls whether the liability will be incurred and it is satisfied that the liability will not be incurred in the foreseeable future.
| | |
| 2012 WESTPAC GROUP ANNUAL REPORT | 175 |
NOTE 16. OTHER ASSETS
| | Consolidated | | Parent Entity | |
| | 2012 | | | 2011 | | 2012 | | | 2011 | |
| | $m | | | $m | | $m | | | $m | |
Accrued interest receivable | | 1,278 | | | 1,412 | | 1,108 | | | 1,297 | |
Securities sold not delivered | | 1,841 | | | 2,038 | | 1,841 | | | 2,038 | |
Deferred expenditure | | 17 | | | 13 | | 2 | | | - | |
Deferred acquisition costs | | 143 | | | 144 | | 1 | | | 2 | |
Trade debtors | | 534 | | | 452 | | 176 | | | 117 | |
Prepayments | | 96 | | | 108 | | 79 | | | 89 | |
Accrued fees and commissions | | 323 | | | 188 | | 106 | | | 104 | |
Other | | 729 | | | 1,061 | | 575 | | | 779 | |
Total other assets | | 4,961 | | | 5,416 | | 3,888 | | | 4,426 | |
NOTE 17. PAYABLES DUE TO OTHER FINANCIAL INSTITUTIONS
| | Consolidated | | Parent Entity | |
| | 2012 | | | 2011 | | 2012 | | | 2011 | |
| | $m | | | $m | | $m | | | $m | |
Cash collateral | | 1,356 | | | 6,641 | | 1,354 | | | 6,641 | |
Offshore central bank deposits | | 1,595 | | | 1,067 | | 1,595 | | | 1,067 | |
Interbank lending | | 4,564 | | | 6,804 | | 4,492 | | | 6,689 | |
Securities sold under agreements to repurchase | | 49 | | | - | | 49 | | | - | |
Total payables due to other financial institutions | | 7,564 | | | 14,512 | | 7,490 | | | 14,397 | |
| | |
176 | 2012 WESTPAC GROUP ANNUAL REPORT | |
NOTES TO THE FINANCIAL STATEMENTS |
|
NOTE 18. DEPOSITS
| | Consolidated | | Parent Entity | |
| | 2012 | | | 2011 | | 2012 | | | 2011 | |
| | $m | | | $m | | $m | | | $m | |
Australia | | | | | | | | | | | |
Certificates of deposit | | | | | | | | | | | |
At fair value | | 32,786 | | | 36,620 | | 33,234 | | | 36,620 | |
At amortised cost | | 119 | | | 602 | | 119 | | | 602 | |
Total certificates of deposit | | 32,905 | | | 37,222 | | 33,353 | | | 37,222 | |
At call and term deposits | | | | | | | | | | | |
Non-interest bearing, repayable at call | | 16,659 | | | 13,932 | | 16,659 | | | 13,932 | |
Other interest bearing: | | | | | | | | | | | |
At call | | 147,038 | | | 142,411 | | 147,042 | | | 142,411 | |
Term | | 139,351 | | | 112,617 | | 139,351 | | | 112,617 | |
Total at call and term deposits | | 303,048 | | | 268,960 | | 303,052 | | | 268,960 | |
Total Australia | | 335,953 | | | 306,182 | | 336,405 | | | 306,182 | |
New Zealand | | | | | | | | | | | |
Certificates of deposit | | | | | | | | | | | |
At fair value | | 1,134 | | | 1,221 | | - | | | - | |
Total certificates of deposit | | 1,134 | | | 1,221 | | - | | | - | |
At call and term deposits | | | | | | | | | | | |
Non-interest bearing, repayable at call | | 2,368 | | | 2,160 | | - | | | 42 | |
Other interest bearing: | | | | | | | | | | | |
At call | | 12,702 | | | 11,287 | | - | | | 2,341 | |
Term | | 18,392 | | | 16,381 | | - | | | 1,296 | |
Total at call and term deposits | | 33,462 | | | 29,828 | | - | | | 3,679 | |
Total New Zealand | | 34,596 | | | 31,049 | | - | | | 3,679 | |
Other overseas | | | | | | | | | | | |
Certificates of deposit | | | | | | | | | | | |
At fair value | | 13,081 | | | 20,538 | | 13,081 | | | 20,538 | |
At amortised cost | | 149 | | | 1,158 | | 149 | | | 1,158 | |
Total certificates of deposit | | 13,230 | | | 21,696 | | 13,230 | | | 21,696 | |
At call and term deposits | | | | | | | | | | | |
Non-interest bearing, repayable at call | | 732 | | | 567 | | 232 | | | 213 | |
Other interest bearing: | | | | | | | | | | | |
At call | | 1,982 | | | 1,995 | | 1,518 | | | 1,597 | |
Term | | 8,498 | | | 8,789 | | 7,944 | | | 8,090 | |
Total at call and term deposits | | 11,212 | | | 11,351 | | 9,694 | | | 9,900 | |
Total other overseas | | 24,442 | | | 33,047 | | 22,924 | | | 31,596 | |
Total deposits | | 394,991 | | | 370,278 | | 359,329 | | | 341,457 | |
Deposits at fair value | | 47,086 | | | 58,561 | | 46,400 | | | 57,313 | |
Deposits at amortised cost | | 347,905 | | | 311,717 | | 312,929 | | | 284,144 | |
Total deposits | | 394,991 | | | 370,278 | | 359,329 | | | 341,457 | |
| | |
| 2012 WESTPAC GROUP ANNUAL REPORT | 177 |
NOTE 18. DEPOSITS (CONTINUED)
The following table shows average balances and average rates in each of the past three years for major categories of deposits:
| | Consolidated | |
| | 2012 | | | 2011 | | 2010 | |
| | Average | | Average | | | Average | | Average | | Average | | Average | |
| | Balance | | Rate | | | Balance | | Rate | | Balance | | Rate | |
| | $m | | % | | | $m | | % | | $m | | % | |
Australia | | | | | | | | | | | | | | |
Non-interest bearing | | 15,101 | | | | | 13,134 | | | | 11,404 | | | |
Certificates of deposit | | 34,401 | | 4.4% | | | 38,161 | | 4.7% | | 43,268 | | 3.9% | |
Other interest bearing at call | | 143,130 | | 3.8% | | | 141,719 | | 4.3% | | 136,906 | | 3.6% | |
Other interest bearing term | | 124,881 | | 5.1% | | | 99,994 | | 5.5% | | 90,375 | | 5.2% | |
Total Australia | | 317,513 | | | | | 293,008 | | | | 281,953 | | | |
Overseas | | | | | | | | | | | | | | |
Non-interest bearing | | 2,875 | | | | | 2,515 | | | | 2,360 | | | |
Certificates of deposit | | 18,478 | | 0.6% | | | 19,840 | | 0.6% | | 20,010 | | 0.6% | |
Other interest bearing at call | | 14,260 | | 2.7% | | | 12,600 | | 2.9% | | 12,655 | | 2.8% | |
Other interest bearing term | | 24,953 | | 3.2% | | | 22,066 | | 3.9% | | 19,326 | | 4.0% | |
Total overseas | | 60,566 | | | | | 57,021 | | | | 54,351 | | | |
Certificates of deposit and term deposits
All certificates of deposit issued by foreign offices were greater than US$100,000.
The maturity profile of certificates of deposit and term deposits greater than US$100,000 issued by Australian operations is set out below:
| | Consolidated 2012 | |
| | | | Between | | Between | | | | | |
| | Less Than | | 3 and | | 6 Months | | Over | | | |
| | 3 Months | | 6 Months | | and 1 Year | | 1 Year | | Total | |
| | $m | | $m | | $m | | $m | | $m | |
Certificates of deposit greater than US$100,000 | | 24,679 | | 7,480 | | 627 | | 119 | | 32,905 | |
Term deposits greater than US$100,000 | | 68,013 | | 29,723 | | 13,110 | | 6,703 | | 117,549 | |
NOTE 19. TRADING LIABILITIES AND OTHER FINANCIAL LIABILITIES DESIGNATED AT FAIR VALUE
| | Consolidated | | Parent Entity | |
| | 2012 | | | 2011 | | 2012 | | | 2011 | |
| | $m | | | $m | | $m | | | $m | |
Securities sold under agreements to repurchase | | 6,776 | | | 5,715 | | 6,776 | | | 5,715 | |
Securities sold short | | 3,187 | | | 4,030 | | 3,187 | | | 4,030 | |
Total trading liabilities | | 9,963 | | | 9,745 | | 9,963 | | | 9,745 | |
Other financial liabilities designated at fair value | | 1 | | | 58 | | 1 | | | 58 | |
Total trading liabilities and other financial liabilities designated at fair value | | 9,964 | | | 9,803 | | 9,964 | | | 9,803 | |
The amount that would be contractually required to be paid at maturity to the holders of the financial liabilities designated at fair value through profit or loss for the Group and the Parent Entity is $1 million (2011: $73 million).
| | |
178 | 2012 WESTPAC GROUP ANNUAL REPORT | |
NOTES TO THE FINANCIAL STATEMENTS |
|
NOTE 20. PROVISIONS
| | Consolidated | | Parent Entity | |
| | 2012 | | | 2011 | | 2012 | | | 2011 | |
| | $m | | | $m | | $m | | | $m | |
Long service leave | | 334 | | | 309 | | 308 | | | 275 | |
Annual leave and other employee benefits | | 740 | | | 742 | | 638 | | | 620 | |
Litigation and non-lending losses | | 306 | | | 188 | | 297 | | | 185 | |
Provision for impairment on credit commitments (refer to Note 12) | | 407 | | | 369 | | 375 | | | 344 | |
Leasehold premises | | 34 | | | 32 | | 34 | | | 32 | |
Restructuring provisions | | 114 | | | 31 | | 112 | | | 24 | |
Total provisions | | 1,935 | | | 1,671 | | 1,764 | | | 1,480 | |
Litigation and non-lending losses
Litigation and non-lending loss provisions include litigation and associated costs, frauds and the correction of operational issues.
Provision for impairment on credit commitments
Provision is made for incurred losses as a result of the commitment to extend credit.
Leasehold premises
Provisions are made for unavoidable costs in relation to making good the property to the same or similar state as when the lease was entered into and for premises sub let at lower rates of rent than payable under the head lease.
Restructuring provisions
Provisions are recognised for restructuring activities when a detailed financial plan has been developed and a valid expectation that the plan will be carried out is held by those affected by it. The majority of restructuring provisions are expected to be used within 12 months after 30 September 2012.
| | | | Annual Leave | | Litigation | | Provision for | | | | | | | |
| | Long | | and Other | | and Non- | | Impairment | | | | | | | |
| | Service | | Employee | | Lending | | on Credit | | Leasehold | | Restructuring | | | |
| | Leave | | Benefits | | Losses | | Commitments | | Premises | | Provisions | | Total | |
| | $m | | $m | | $m | | $m | | $m | | $m | | $m | |
Consolidated | | | | | | | | | | | | | | | |
Balance as at beginning of the year | | 309 | | 742 | | 188 | | 369 | | 32 | | 31 | | 1,671 | |
Additions | | 62 | | 917 | | 145 | | - | | 3 | | 152 | | 1,279 | |
Utilised | | (35 | ) | (887 | ) | (24 | ) | - | | - | | (60 | ) | (1,006 | ) |
Unutilised reversed | | - | | (34 | ) | (3 | ) | - | | (1 | ) | (9 | ) | (47 | ) |
Increase on unwinding of discount | | - | | - | | - | | 16 | | - | | - | | 16 | |
Other | | (2 | ) | 2 | | - | | 22 | | - | | - | | 22 | |
Balance as at end of the year | | 334 | | 740 | | 306 | | 407 | | 34 | | 114 | | 1,935 | |
Parent Entity | | | | | | | | | | | | | | | |
Balance as at beginning of the year | | 275 | | 620 | | 185 | | 344 | | 32 | | 24 | | 1,480 | |
Additions | | 60 | | 830 | | 139 | | - | | 3 | | 148 | | 1,180 | |
Utilised | | (32 | ) | (780 | ) | (22 | ) | - | | - | | (52 | ) | (886 | ) |
Unutilised reversed | | - | | (32 | ) | (3 | ) | - | | (1 | ) | (8 | ) | (44 | ) |
Increase on unwinding of discount | | - | | - | | - | | 14 | | - | | - | | 14 | |
Other | | 5 | | - | | (2 | ) | 17 | | - | | - | | 20 | |
Balance as at end of the year | | 308 | | 638 | | 297 | | 375 | | 34 | | 112 | | 1,764 | |
| | |
| 2012 WESTPAC GROUP ANNUAL REPORT | 179 |
NOTE 21. OTHER LIABILITIES
| | Consolidated | | Parent Entity | |
| | 2012 | | | 2011 | | 2012 | | | 2011 | |
| | $m | | | $m | | $m | | | $m | |
Unearned general insurance premiums | | 370 | | | 405 | | - | | | - | |
Outstanding general insurance claims | | 248 | | | 252 | | - | | | - | |
Defined benefit deficit1 | | 632 | | | 676 | | 570 | | | 631 | |
Accrued interest payable | | 3,346 | | | 3,292 | | 3,035 | | | 3,000 | |
Credit card loyalty program | | 317 | | | 299 | | - | | | - | |
Securities purchased not delivered | | 1,884 | | | 1,148 | | 1,884 | | | 1,148 | |
Trade creditors and other accrued expenses | | 917 | | | 1,000 | | 702 | | | 771 | |
Other | | 1,996 | | | 1,981 | | 1,749 | | | 1,693 | |
Total other liabilities | | 9,710 | | | 9,053 | | 7,940 | | | 7,243 | |
1 Refer to Note 35 for more details.
NOTE 22. DEBT ISSUES
Presented below are the Group and Parent Entity’s debt issues at 30 September 2012 and 2011. The distinction between short-term and long-term debt is based on the maturity of the underlying security at origination.
| | Consolidated | | Parent Entity | |
| | 2012 | | | 2011 | | 2012 | | | 2011 | |
| | $m | | | $m | | $m | | | $m | |
Debt issues | | | | | | | | | | | |
Short-term debt: | | | | | | | | | | | |
Own issuances | | 27,058 | | | 41,116 | | 23,805 | | | 35,407 | |
Customer conduits | | 2,543 | | | 2,867 | | - | | | - | |
Total short-term debt | | 29,601 | | | 43,983 | | 23,805 | | | 35,407 | |
Long-term debt: | | | | | | | | | | | |
Covered bonds | | 11,951 | | | 1,376 | | 10,392 | | | - | |
Senior | | 95,506 | | | 108,145 | | 90,236 | | | 101,359 | |
Securitisation | | 10,079 | | | 10,911 | | - | | | - | |
Convertible notes | | 25 | | | 1,000 | | - | | | 1,000 | |
Structured notes | | 419 | | | 244 | | - | | | - | |
Total long-term debt | | 117,980 | | | 121,676 | | 100,628 | | | 102,359 | |
Total debt issues | | 147,581 | | | 165,659 | | 124,433 | | | 137,766 | |
Debt issues at fair value1 | | 31,269 | | | 43,776 | | 27,601 | | | 37,470 | |
Debt issues at amortised cost | | 116,312 | | | 121,883 | | 96,832 | | | 100,296 | |
Total debt issues | | 147,581 | | | 165,659 | | 124,433 | | | 137,766 | |
1 The amount that would be contractually required to be paid at maturity to the holders of the financial liabilities designated at fair value through profit or loss for the Group is $31,312 million (2011: $43,936 million) and for the Parent Entity is $27,629 million (2011: $37,575 million).
| | |
180 | 2012 WESTPAC GROUP ANNUAL REPORT | |
NOTES TO THE FINANCIAL STATEMENTS |
|
NOTE 22. DEBT ISSUES (CONTINUED)
| | Consolidated | |
| | 2012 | | | 2011 | |
| | $m | | | $m | |
Short-term debt | | | | | | |
US commercial paper | | 25,320 | | | 40,885 | |
Euro commercial paper (by currency): | | | | | | |
AUD | | 18 | | | 33 | |
CAD | | 12 | | | - | |
EUR | | - | | | 41 | |
GBP | | 1,164 | | | - | |
NZD | | - | | | 43 | |
SGD | | - | | | 16 | |
USD | | 506 | | | 61 | |
Total euro commercial paper | | 1,700 | | | 194 | |
Asset backed commercial paper (by currency): | | | | | | |
AUD | | 1,733 | | | 2,296 | |
USD | | 810 | | | 571 | |
Total asset backed commercial paper | | 2,543 | | | 2,867 | |
NZD promissory notes | | 38 | | | 37 | |
Total short-term debt | | 29,601 | | | 43,983 | |
Long-term debt (by currency): | | | | | | |
AUD | | 39,003 | | | 38,951 | |
CAD | | 708 | | | 717 | |
CHF | | 1,969 | | | 2,158 | |
EUR | | 14,019 | | | 15,734 | |
GBP | | 2,676 | | | 2,287 | |
HKD | | 808 | | | 1,535 | |
JPY | | 14,719 | | | 15,033 | |
NOK | | 531 | | | 55 | |
NZD | | 2,256 | | | 1,719 | |
SGD | | 309 | | | 314 | |
USD | | 40,938 | | | 43,125 | |
ZAR | | 44 | | | 48 | |
Total long-term debt | | 117,980 | | | 121,676 | |
| | Consolidated | |
(in $millions unless otherwise stated) | | 2012 | | | 2011 | | 2010 | |
Short-term borrowings | | | | | | | | |
US commercial paper | | | | | | | | |
Maximum amount outstanding at any month end | | 43,842 | | | 42,280 | | 51,300 | |
Approximate average amount outstanding | | 35,969 | | | 37,991 | | 41,588 | |
Approximate weighted average interest rate on: | | | | | | | | |
Average amount outstanding | | 0.5% | | | 0.4% | | 0.3% | |
Outstanding as at end of the year | | 0.7% | | | 0.4% | | 0.4% | |
| | |
| 2012 WESTPAC GROUP ANNUAL REPORT | 181 |
NOTE 23. LOAN CAPITAL
| | Consolidated | | | Parent Entity | |
| | 2012 | | | 2011 | | | 2012 | | | 2011 | |
| | $m | | | $m | | | $m | | | $m | |
Loan capital | | | | | | | | | | | | |
Subordinated bonds | | 5,521 | | | 5,226 | | | 5,521 | | | 5,226 | |
Subordinated perpetual notes | | 337 | | | 400 | | | 337 | | | 400 | |
Convertible debentures and Trust preferred securities | | 568 | | | 616 | | | 568 | | | 616 | |
Stapled preferred securities | | 1,936 | | | 1,931 | | | 1,936 | | | 1,931 | |
Convertible preference shares | | 1,175 | | | - | | | 1,175 | | | - | |
Total loan capital | | 9,537 | | | 8,173 | | | 9,537 | | | 8,173 | |
Details of loan capital are as follows:
| | Consolidated | | | Parent Entity | |
| | 2012 | | | 2011 | | | 2012 | | | 2011 | |
| | $m | | | $m | | | $m | | | $m | |
Subordinated bonds | | | | | | | | | | | | |
USD 75 million subordinated bonds due 2015 | | 81 | | | 88 | | | 81 | | | 88 | |
USD 400 million subordinated bonds due 2015 | | 389 | | | 428 | | | 389 | | | 428 | |
USD 300 million subordinated bonds due 20161 | | - | | | 307 | | | - | | | 307 | |
AUD 1,000 million subordinated bonds due 20172 | | - | | | 997 | | | - | | | 997 | |
CAD 250 million subordinated bonds due 20173 | | - | | | 225 | | | - | | | 225 | |
AUD 600 million subordinated bonds due 20174 | | - | | | 576 | | | - | | | 576 | |
AUD 200 million subordinated bonds due 20175 | | - | | | 188 | | | - | | | 188 | |
USD 250 million subordinated bonds due 20176 | | - | | | 256 | | | - | | | 256 | |
AUD 160 million subordinated bonds due 2018 | | 158 | | | 157 | | | 158 | | | 157 | |
AUD 500 million subordinated bonds due 2018 | | 500 | | | 500 | | | 500 | | | 500 | |
USD 350 million subordinated bonds due 2018 | | 394 | | | 415 | | | 394 | | | 415 | |
GBP 200 million subordinated bonds due 2018 | | 318 | | | 340 | | | 318 | | | 340 | |
AUD 625 million subordinated bonds due 2018 | | 627 | | | 624 | | | 627 | | | 624 | |
AUD 125 million subordinated bonds due 2018 | | 125 | | | 125 | | | 125 | | | 125 | |
AUD 500 million subordinated bonds due 2022 | | 499 | | | - | | | 499 | | | - | |
AUD 1,676 million subordinated bonds due 2022 | | 1,661 | | | - | | | 1,661 | | | - | |
USD 800 million subordinated bonds due 2023 | | 769 | | | - | | | 769 | | | - | |
Total subordinated bonds | | 5,521 | | | 5,226 | | | 5,521 | | | 5,226 | |
1 These bonds were redeemed on 20 October 2011.
2 These bonds were redeemed on 24 January 2012.
3 These bonds were redeemed on 23 April 2012.
4 These bonds were redeemed on 25 May 2012.
5 These bonds were redeemed on 20 June 2012.
6 These bonds were redeemed on 27 July 2012.
| | Consolidated | | | Parent Entity | |
| | 2012 | | | 2011 | | | 2012 | | | 2011 | |
| | $m | | | $m | | | $m | | | $m | |
Subordinated perpetual notes | | | | | | | | | | | | |
US$352.1 million (2011: US$390.2 million) subordinated perpetual floating rate notes | | 337 | | | 400 | | | 337 | | | 400 | |
| | | | | | | | | | | | |
Convertible debentures and Trust preferred securities | | | | | | | | | | | | |
Convertible debentures issued on 5 April 2004 US$525,000,000 | | - | | | - | | | 568 | | | 616 | |
525,000 2004 TPS of US$1,000 each | | 568 | | | 616 | | | - | | | - | |
Total convertible debentures and Trust preferred securities | | 568 | | | 616 | | | 568 | | | 616 | |
| | |
182 | 2012 WESTPAC GROUP ANNUAL REPORT | |
NOTES TO THE FINANCIAL STATEMENTS |
|
NOTE 23. LOAN CAPITAL (CONTINUED)
| | Consolidated | | | Parent Entity | |
| | 2012 | | | 2011 | | | 2012 | | | 2011 | |
| | $m | | | $m | | | $m | | | $m | |
Stapled preferred securities | | | | | | | | | | | | |
10,362,670 Westpac SPS of A$100 each | | 1,033 | | | 1,030 | | | 1,033 | | | 1,030 | |
9,083,278 Westpac SPS II of A$100 each | | 903 | | | 901 | | | 903 | | | 901 | |
Total stapled preferred securities | | 1,936 | | | 1,931 | | | 1,936 | | | 1,931 | |
| | | | | | | | | | | | |
Convertible preference shares | | | | | | | | | | | | |
11,893,605 Westpac CPS of A$100 each | | 1,175 | | | - | | | 1,175 | | | - | |
Subordinated perpetual notes
These notes have no final maturity but may, subject to the approval of APRA and subject to certain other conditions, be redeemed at par at the option of Westpac. The rights of the noteholders and couponholders are subordinated to the claims of all creditors (including depositors) of Westpac other than those creditors whose claims against Westpac are expressed to rank equally with or after the claims of the noteholders and couponholders. Interest is cumulative and is payable on the notes semi-annually, subject to Westpac being solvent immediately after making the payment and having paid any dividend on any class of share capital of Westpac within the prior 12 month period.
Convertible debentures and 2004 TPS
A wholly owned entity Westpac Capital Trust IV (Capital Trust IV) issued 525,000 2004 TPS in the United States of America at US$1,000 each on 5 April 2004, with non-cumulative semi-annual distributions (31 March and 30 September) in arrears at the annual rate of 5.256% up to but excluding 31 March 2016. From, and including 31 March 2016 the 2004 TPS will pay non-cumulative quarterly distributions (30 June, 30 September, 31 December and 31 March) in arrears at a floating rate equal to the London InterBank Offer Rate (LIBOR) plus 1.7675% per year. Capital Trust IV has also issued common securities with a total price of US$1,000 to Westpac Capital Holdings Inc. 2004 TPS qualify as innovative residual Tier 1 capital of Westpac.
The sole assets of the Capital Trust IV comprise 525,001 2004 Funding TPS issued by a wholly owned entity, Tavarua Funding Trust IV (Funding Trust IV) totalling US$525,001,000. The 2004 Funding TPS have an issue price of US$1,000 each with non-cumulative semi-annual distributions in arrears at the annual rate of 5.256% up to but excluding 31 March 2016. From and including 31 March 2016, the 2004 Funding TPS will pay non-cumulative quarterly distributions (30 June, 30 September, 31 December and 31 March) in arrears at a floating rate equal to LIBOR plus 1.7675% per year.
Funding Trust IV has issued common securities with a total price of US$1,000 to Westpac. The assets of Funding Trust IV comprise convertible debentures issued by Westpac in aggregate amount of US$525,001,000 and US Government securities purchased with the proceeds of the common securities.
The convertible debentures are unsecured, junior subordinated obligations of Westpac and will rank subordinate and junior in right of payment of principal and distributions to Westpac’s obligations to its depositors and creditors. The convertible debentures will only pay distributions to the extent they are declared by the Board of Directors of Westpac, or an authorised committee of the Board. Any distribution is subject to the satisfaction that no deferral conditions exist. If certain deferral conditions exist a distribution is not permitted to be declared unless approved by APRA. The convertible debentures have no stated maturity, but will automatically convert into American Depositary Receipts (ADRs) each representing 40 Westpac preference shares (non-cumulative preference shares in Westpac with a liquidation amount of US$25) on 31 March 2053, or earlier in the event that a distribution is not made or certain other events occur. Upon issue the amount paid up on each Westpac preference share will be deemed to be US$25. The 2004 TPS will then be redeemed for ADRs. The dividend payment dates and distribution rates on Westpac preference shares will be the same as those otherwise applicable to 2004 TPS. The holders of the ADRs will, in certain circumstances, have the right to convert their Westpac preference shares into a variable number of Westpac ordinary shares on 31 March 2054 by giving notice to Westpac. The variable number of Westpac ordinary shares will be determined by reference to the weighted average trading price of Westpac ordinary shares in the 20 trading days immediately preceding 31 March 2054.
Westpac has guaranteed, on a subordinated basis, the payment in full of distributions or redemption amounts, the delivery of ADRs and other payments on the 2004 TPS and the 2004 Funding TPS to the extent that the Capital Trust IV and the Funding Trust IV have funds available.
With the prior written consent of APRA, if required, Westpac may elect to redeem the convertible debentures for cash before 31 March 2016 in whole upon the occurrence of certain specific events, and in whole or in part on any distribution date on or after 31 March 2016. The proceeds received by Funding Trust IV from the redemption of the convertible debentures must be used to redeem the 2004 Funding TPS and ultimately the 2004 TPS. The redemption price of the 2004 TPS will equal US$1,000 per 2004 TPS plus the accrued and unpaid distribution for the then current semi-annual or quarterly period to the date of redemption or, if the date of redemption is a distribution date, the accrued and unpaid distribution for the most recent semi-annual or quarterly period.
| | |
| 2012 WESTPAC GROUP ANNUAL REPORT | 183 |
NOTE 23. LOAN CAPITAL (CONTINUED)
The holders of the convertible debentures, 2004 Funding TPS and 2004 TPS do not have an option to require redemption of these instruments. The laws of the United States of America, Australia and New Zealand apply to various parts of this transaction.
Westpac SPS and Westpac SPS II
Westpac issued 10,362,670 Westpac SPS at a face value of $100 each on 30 July 2008 and 9,083,278 Westpac SPS II at a face value of $100 each on 31 March 2009. Westpac SPS and Westpac SPS II are stapled securities, each consisting of a perpetual, unsecured, non-cumulative subordinated note issued by Westpac’s New York branch stapled to a preference share issued by Westpac. Westpac SPS and Westpac SPS II qualify as non-innovative residual Tier 1 capital of Westpac.
Westpac SPS and Westpac SPS II are expected to pay non-cumulative, floating rate quarterly distributions (30 September, 31 December, 31 March and 30 June) which are expected to be fully franked. The distribution rate on Westpac SPS is calculated as the Australian 90-day bank bill rate plus the margin of 2.40% per annum, together multiplied by one minus the Australian corporate tax rate (30% during the year ended 30 September 2012). The distribution rate on Westpac SPS II is calculated as the Australian 90-day bank bill rate plus the margin of 3.80% per annum, together multiplied by one minus the Australian corporate tax rate (30% during the year ended 30 September 2012). Westpac SPS and Westpac SPS II distributions are subject to a distribution payment test and distributions will not be paid if the Westpac directors determine not to pay a distribution, the distribution payment exceeds the distributable profits of Westpac (unless APRA otherwise gives its prior written approval), or APRA objects to the payment of the distribution.
Westpac SPS and Westpac SPS II distributions will consist of interest payment on the notes while the notes remain stapled to the preference shares. Following an assignment event, the notes will unstaple from the preference shares and holders will only hold preference shares. Dividends will then become payable on the preference shares if the preference shares have not been converted or redeemed.
An assignment event includes, among others, a date selected by Westpac at its absolute discretion, the date preference shares are converted or redeemed, or where interest on the notes has not been paid in full.
On 26 September 2013 and 30 September 2014, the initial mandatory conversion dates of Westpac SPS and Westpac SPS II respectively, it is expected that the Westpac SPS and Westpac SPS II will either be converted into a variable number of Westpac ordinary shares (subject to a conversion discount) provided certain conversion conditions are satisfied, or transferred to a nominated party at the election of Westpac for cash equal to their face value. If the conversion conditions are not satisfied, Westpac SPS and Westpac SPS II may in certain circumstances be redeemed for their face value subject to APRA approval.
If Westpac SPS and Westpac SPS II are not converted, transferred or redeemed on the initial mandatory conversion date, they will remain on issue and may either be converted, transferred or redeemed at the next possible conversion date, subject to satisfaction of the conversion conditions. Following an acquisition event, if Westpac has not otherwise elected to convert or redeem, the Westpac SPS and Westpac SPS II will automatically convert (as above) providing the conversion conditions are satisfied. In certain other limited circumstances Westpac SPS and Westpac SPS II may be converted (as above), transferred or redeemed at Westpac’s election prior to the initial mandatory conversion date.
Westpac SPS and Westpac SPS II rank for payment in a winding up of Westpac ahead of ordinary shares and equally with equal ranking capital securities but are subordinated to claims of Westpac deposit holders and other senior creditors. Holders of Westpac SPS and Westpac SPS II are entitled to vote at a general meeting of Westpac in limited circumstances only.
Westpac CPS
Westpac issued 11,893,605 Westpac Convertible Preference Shares (CPS) at a face value of $100 each on 23 March 2012. Westpac CPS are fully paid, perpetual, non-cumulative, convertible, unguaranteed and unsecured preference shares which rank in priority to ordinary shares. Westpac CPS qualify as non-innovative residual Tier 1 capital of Westpac.
Westpac CPS are expected to pay preferred, non-cumulative, floating rate semi-annual dividends (30 September and 31 March) which are expected to be fully franked. The dividend rate is calculated as the Australian 180-day bank bill rate per annum plus the margin of 3.25% per annum, together multiplied by one minus the Australian corporate tax rate (30% during the year ended 30 September 2012). Westpac CPS are subject to a dividend payment test and dividends will not be paid if the Westpac directors determine not to pay a dividend, the dividend payment exceeds the distributable profits of Westpac (unless APRA otherwise gives its prior written approval), or APRA objects to the payment of the dividend.
On the scheduled conversion date, it is expected that the Westpac CPS will either be converted into a variable number of Westpac ordinary shares (subject to a conversion discount) provided certain conversion conditions are satisfied, or transferred to a nominated party at the election of Westpac for cash equal to their face value. The scheduled conversion date will be the earlier of 31 March 2020 and the first dividend payment date after 31 March 2020 on which the conversion conditions are satisfied.
The Westpac CPS will be converted (as above) earlier upon a capital trigger event or, provided the conversion conditions are satisfied, an acquisition event. A capital trigger event will occur when Westpac’s core Tier 1 ratio is equal to or less than 5.125% (on a level 2 basis). Westpac must convert the Westpac CPS if a capital trigger event occurs.
| | |
184 | 2012 WESTPAC GROUP ANNUAL REPORT | |
NOTES TO THE FINANCIAL STATEMENTS |
|
NOTE 23. LOAN CAPITAL (CONTINUED)
In certain other limited circumstances Westpac may elect to convert, transfer or redeem Westpac CPS. Conversions or redemptions at Westpac’s election are subject to APRA’s prior written approval and, in respect of conversions, to satisfaction of the conversion conditions.
Westpac CPS rank for payment in a winding up of Westpac ahead of ordinary shares and equally with equal ranking capital securities but are subordinated to claims of Westpac deposit holders and other senior creditors. Holders of Westpac CPS are entitled to vote at a general meeting of Westpac in limited circumstances only.
NOTE 24. SHAREHOLDERS’ EQUITY AND NON-CONTROLLING INTERESTS
| | Consolidated | | | Parent Entity | |
| | 2012 | | | 2011 | | | 2012 | | | 2011 | |
| | $m | | | $m | | | $m | | | $m | |
Contributed equity | | | | | | | | | | | | |
Ordinary shares 3,080,192,894 (2011: 3,030,226,016) each fully paid | | 26,355 | | | 25,456 | | | 26,355 | | | 25,456 | |
RSP treasury shares 8,697,511 (2011: 7,171,874) | | (108 | ) | | (100 | ) | | (108 | ) | | (100 | ) |
Other treasury shares 4,965,188 (2011: 6,019,937) | | (84 | ) | | (87 | ) | | (6 | ) | | (18 | ) |
| | (192 | ) | | (187 | ) | | (114 | ) | | (118 | ) |
Share capital | | 26,163 | | | 25,269 | | | 26,241 | | | 25,338 | |
Other equity instruments | | | | | | | | | | | | |
Convertible debentures: | | | | | | | | | | | | |
Issued on 13 August 2003 NZ$1,293,105,172 (with net issue costs of NZ$9 million) | | - | | | - | | | 1,137 | | | 1,137 | |
Issued on 21 June 2006 A$762,737,500 (with net issue costs of A$8 million) | | - | | | - | | | 755 | | | 755 | |
Total other equity instruments | | - | | | - | | | 1,892 | | | 1,892 | |
Non-controlling interests | | | | | | | | | | | | |
Trust preferred securities: | | | | | | | | | | | | |
750,000 2003 TPS of US$1,000 each (with net issue costs of A$9 million) | | 1,137 | | | 1,137 | | | - | | | - | |
7,627,375 2006 TPS of A$100 each (with net issue costs of A$8 million) | | 755 | | | 755 | | | - | | | - | |
Other | | 78 | | | 90 | | | - | | | - | |
Total non-controlling interests | | 1,970 | | | 1,982 | | | - | | | - | |
Ordinary shares
In accordance with the Corporations Act Westpac does not have authorised capital and all ordinary shares issued have no par value.
Ordinary shares entitle the holder to participate in dividends as declared and in the event of winding up of Westpac, to participate in the proceeds in proportion to the number of and amounts paid on the shares held.
Ordinary shares entitle the holder to one vote per share, either in person or by proxy, at a meeting of Westpac shareholders.
During the year ended 30 September 2012, the following ordinary shares were issued:
§ to eligible staff under the ESP, 1,323,392 ordinary shares issued for nil consideration;
§ to equity holders in relation to the DRP, 18,103,605 ordinary shares at a price of $20.32 and 24,794,854 ordinary shares at a price of $20.38;
§ to eligible executives and senior management under the Westpac Performance Plan (WPP), 584,352 ordinary shares at an average exercise price of $16.74 upon the exercise of performance options, 212,976 ordinary shares and 219,810 ordinary shares for nil consideration upon the exercise of performance share rights and share rights, respectively;
§ to eligible employees upon exercise of performance options under the Westpac Reward Plan (WRP), 260,869 ordinary shares at an average exercise price of $16.49;
§ to eligible employees under the Restricted Share Plan (RSP), 3,538,263 ordinary shares for nil consideration;
§ to senior officers upon the exercise of options under the Senior Officers’ Share Purchase Scheme (SOSPS), 398,000 ordinary shares at an average exercise price of $14.71;
§ to the CEO under the Chief Executive Officer Restricted Share Plan (CEO RSP), 77,799 ordinary shares for nil consideration; and
§ to the CEO under the Chief Executive Performance Plan (CEOPP) upon the exercise of performance options, 320,513 ordinary shares at an average exercise price of $16.80, and 132,445 ordinary shares upon the exercise of performance share rights issued for nil consideration.
| | |
| 2012 WESTPAC GROUP ANNUAL REPORT | 185 |
NOTE 24. SHAREHOLDERS’ EQUITY AND NON-CONTROLLING INTERESTS (CONTINUED)
During the year ended 30 September 2012, the following ordinary shares were purchased on market:
§ 17,440 ordinary shares at an average price of $21.52 and delivered to employees upon the exercise of performance share rights under the WPP for nil consideration; and
§ 390,951 ordinary shares at an average price of $21.37 and allocated to employees under the RSP for nil consideration.
Restricted Share Plan treasury shares
Ordinary shares allocated to eligible employees under the RSP are classified as treasury shares until unconditional ownership of the shares vest at the end of the restriction period.
Other treasury shares
Treasury shares includes ordinary shares held by statutory life funds and managed investment schemes and ordinary shares held by Westpac in respect of equity derivatives sold to customers.
During the year 31,544 treasury shares were purchased at an average price of $21.54 and 736,634 treasury shares were sold at an average price of $21.02.
During the year 349,659 direct treasury shares held in a superannuation fund in Westpac Life Insurance Services were derecognised as the assets of this superannuation fund and were transferred to a fund not consolidated by Westpac.
Convertible debentures and 2003 TPS
A wholly owned entity Westpac Capital Trust III (Capital Trust III) issued 750,000 2003 TPS in the United States of America at US$1,000 each on 13 August 2003, with non-cumulative semi-annual distributions (31 March and 30 September) in arrears at the annual rate of 5.819% up to but excluding 30 September 2013. From, and including, 30 September 2013 the 2003 TPS will pay non-cumulative quarterly distributions (31 December, 31 March, 30 June and 30 September) in arrears at a floating rate of LIBOR plus 2.05% per year. Capital Trust III has also issued common securities with a total price of US$1,000 to Westpac Capital Holdings Inc.
The sole assets of the Capital Trust III comprise 750,001 Funding 2003 TPS issued by a wholly owned entity, Tavarua Funding Trust III (Funding Trust III) totalling US$750,001,000. The Funding 2003 TPS have an issue price of US$1,000 each with a non-cumulative semi-annual distributions in arrears at the annual rate of 5.819% up to, but excluding 30 September 2013 and subsequently, including 30 September 2013, quarterly distributions in arrears at the annual rate of LIBOR plus 2.05%.
Funding Trust III has issued common securities with a total price of US$1,000 to Westpac Funding Holdings Pty Limited. The assets of Funding Trust III comprise convertible debentures issued by Westpac in aggregate amount of NZ$1,293,105,172, US Government securities purchased with the proceeds of the common securities and a currency swap with Westpac.
The convertible debentures are unsecured, junior subordinated obligations of Westpac and will rank subordinate and junior in right of payment of principal and distributions to Westpac’s obligations to its depositors and creditors. The convertible debentures are limited in aggregate principal amount to the New Zealand dollar equivalent, based on a fixed exchange rate of US$0.58, of the sum of the stated liquidation amounts of the 2003 TPS and the proceeds of the common securities issued by Capital Trust III. The convertible debentures will only pay distributions to the extent they are declared by the Board of Directors of Westpac, or an authorised committee of the Board. Any distribution is subject to the satisfaction that no deferral conditions exist. If certain deferral conditions exist a distribution is not permitted to be declared unless approved by APRA. The convertible debentures have no stated maturity, but will automatically convert into ADRs each representing 40 Westpac preference shares (non-cumulative preference shares in Westpac with a liquidation amount of US$25) on 30 September 2053, or earlier in the event that a distribution is not made or certain other events occur. Upon issue the amount paid up on each Westpac preference share will be deemed to be US$25. The 2003 TPS will then be redeemed for ADRs. The dividend payment dates and distribution rates on Westpac preference shares will be the same as those otherwise applicable to the 2003 TPS.
Under the currency swap, Funding Trust III initially paid an amount equal to the proceeds of the issue of the Funding 2003 TPS in US dollars to Westpac, in exchange for the New Zealand dollar equivalent using a fixed exchange rate of NZ$1.00 = US$0.58. Funding Trust III is also required to pay to Westpac any amount in New Zealand dollars it receives under the convertible debentures, in return for an amount denominated in US dollars at the fixed exchange rate.
The currency swap terminates upon the payment in full of the cash redemption price of the outstanding convertible debentures and the exchange of such redemption price for US dollars or the conversion of the convertible debentures into ADRs.
A netting agreement has been entered into between Westpac and Funding Trust III. Pursuant to the netting agreement, the distributions on the convertible debentures will be treated as a payment by Funding Trust III under the currency swap. In return, Westpac will pay US dollars to Funding Trust III under the currency swap equal to the NZ dollars it would have received from Funding Trust III under the currency swap (calculated by reference to the fixed exchange rate).
Westpac has guaranteed, on a subordinated basis, the payment in full of distributions or redemption amounts, the delivery of ADRs and other payments on the 2003 TPS and the Funding 2003 TPS to the extent that the Capital Trust III and the Funding Trust III have funds available.
| | |
186 | 2012 WESTPAC GROUP ANNUAL REPORT | |
NOTES TO THE FINANCIAL STATEMENTS |
|
NOTE 24. SHAREHOLDERS’ EQUITY AND NON-CONTROLLING INTERESTS (CONTINUED)
With the prior written consent of APRA, if required, Westpac may elect to redeem the convertible debentures for cash before 30 September 2013 in whole upon the occurrence of certain specific events, and in whole or in part on any distribution date on or after 30 September 2013. The proceeds received by Funding Trust III from the redemption of the convertible debentures must be used to redeem the Funding 2003 TPS and ultimately the 2003 TPS. The redemption price of the 2003 TPS will equal US$1,000 per 2003 TPS plus the unpaid distribution for the then current semi-annual or quarterly period to the date of redemption or, if the date of redemption is a distribution payment date, the unpaid distribution for the most recent semi-annual or quarterly period.
The holders of the convertible debentures, Funding 2003 TPS and 2003 TPS do not have an option to require redemption of these instruments.
The laws of the United States of America, Australia and New Zealand apply to various parts of this transaction.
Convertible notes and 2006 TPS
A Westpac controlled entity, Westpac TPS Trust, issued 7,627,375 2006 TPS in Australia at $100 each on 21 June 2006. The 2006 TPS are preferred units in the Westpac TPS Trust, with non-cumulative floating rate distributions which are expected to be fully franked. Westpac TPS Trust also issued one ordinary unit with an issue price of $100 to Westpac. Westpac, as holder of the ordinary unit, is entitled to any residual income or assets of the Westpac TPS Trust not distributed to holders of 2006 TPS.
The principal assets of Westpac TPS Trust are 7,627,375 convertible notes (the notes) issued by Westpac in an aggregate amount of $762,737,500.
The 2006 TPS are scheduled to pay quarterly distributions (30 September, 31 December, 31 March and 30 June) in arrears, subject to certain conditions being satisfied. The distribution rate on 2006 TPS, until 30 June 2016 (the step-up date), is calculated as the Australian 90 day bank bill rate plus 1% per annum (the initial margin), together multiplied by one minus the Australian corporate tax rate (30% during the year ended 30 September 2012). After the step-up date, the initial margin will increase by a one time step-up of 1% per annum.
The notes are unsecured obligations of Westpac and rank subordinate and junior in right of payment of principal and interest to Westpac’s obligations to depositors and creditors, other than subordinated creditors holding subordinated indebtedness that is stated to rank equally with, or junior to the notes.
Distributions on the 2006 TPS will only be made if Westpac pays interest on the notes and certain other conditions (which correspond to the interest payment conditions on the notes) are satisfied. Interest on the notes is subject to a distribution payment test and interest will not be paid if Westpac directors have not resolved to make the interest payment, the payment of interest exceeds distributable profits (unless APRA gives its prior approval) and APRA does not otherwise object to the payment. The interest payments on the notes are expected to exceed the aggregate amount of the distributions to be made on 2006 TPS. The excess will be distributed to Westpac, as holder of the ordinary unit in the Westpac TPS Trust, on each distribution payment date.
Westpac can require holders to exchange each of their 2006 TPS for $100 cash (subject to any required APRA approval) or a variable number of Westpac ordinary shares calculated in accordance with the applicable conversion number, on the step-up date or any distribution payment date after the step-up date, or in certain other limited circumstances. If Westpac elects to initiate redemption of 2006 TPS for cash or conversion into a variable number of ordinary shares, Westpac must also redeem or convert the notes in a corresponding manner.
The 2006 TPS will automatically exchange into Westpac preference shares upon the occurrence of an automatic exchange event, that is, if the 2006 TPS are still on issue on 30 September 2055 or in certain other limited circumstances, including the occurrence of an event of default or an APRA event (unless APRA determines otherwise). On exchange, all 2006 TPS on issue will exchange into preference shares directly issued by Westpac and the notes and the 2006 TPS will be redeemed simultaneously. On exchange, 2006 TPS holders will receive one preference share for each 2006 TPS.
The laws of Australia and New Zealand apply to various parts of this transaction.
NOTE 25. SHARE-BASED PAYMENTS
Executive and Senior Officer equity plans
Options, restricted shares and/or share rights are granted to the CEO, selected executives and key senior employees under the following schemes.
(i) Westpac Reward Plan
The Westpac Reward Plan (WRP) was introduced in 2006. It provides a mechanism for rewarding superior long-term performance from the most senior management in Australia and overseas.
| | |
| 2012 WESTPAC GROUP ANNUAL REPORT | 187 |
NOTE 25. SHARE-BASED PAYMENTS (CONTINUED)
Under the WRP senior managers may be invited to receive an award of performance options or performance share rights. An option or share right under the WRP is the right to acquire a share in the future provided all conditions are met, with an exercise price set at the commencement of the performance period. The exercise price for options is based on the prevailing market price of Westpac ordinary shares at the commencement of the performance period. The exercise price for share rights is nil. No performance options have been awarded since October 2009.
Awards made from October 2011 are subject to two performance measures each applying to 50% of the value of the award. The two hurdles are Westpac’s relative Total Shareholder Return (TSR)1 and Compound Annual Growth in Cash EPS (Cash EPS CAGR).
Full vesting of TSR hurdled performance share rights occurs when Westpac’s TSR is at (or exceeds) the 75th percentile relative to the comparator group, scaling down to 50% vesting on a straight-line basis for median performance. Below median performance, no vesting occurs. The comparator group for TSR comparisons focuses on the top 10 financial sector peers. Full vesting of Cash EPS CAGR hurdled share rights occurs when a maximum target Cash EPS CAGR is achieved, scaling down to 50% vesting at a threshold Cash EPS CAGR target. Below the threshold target Cash EPS CAGR, no vesting occurs. These awards are subject to a single test at the end of the three year performance period. Any securities remaining unvested after the performance period lapse immediately.
For awards made prior to October 2011 all awards were subject to a TSR hurdle and the initial TSR performance is tested at the third anniversary of the commencement of the performance period, with subsequent performance testing possible at the fourth and fifth anniversaries of the commencement of the performance period. At subsequent performance test dates (where they exist) further vesting may occur only if the TSR ranking has improved.
Upon exercising vested performance options and performance share rights, the executive has the right to take up his or her entitlement in whole or in part as fully paid ordinary shares. The exercise price is payable at that time. A performance option or performance share right lapses if it is not exercised prior to the end of its term.
WRP – outstanding performance options and performance share rights
The following table sets out details of outstanding performance options and performance share rights under the WRP:
Commencement
Date | | Latest Date for
Exercise | | Exercise
Price | | Outstanding
at 1 October
2011 | | Granted
During
the Year | | Exercised
During
the Year | | Lapsed
During
the Year | | Outstanding
at
30 September
2012 | | Outstanding
and
Exercisable at
30 September 2012 | |
| | | | | | | | | | | | | | | | | |
Performance options | | | | | | | | | | | | | | | |
17 December 2007 | | 20 December 2017 | | $30.10 | | 1,712,682 | | - | | - | | 118,796 | | 1,593,886 | | 1,593,886 | |
1 October 2008 | | 1 October 2018 | | $23.40 | | 1,537,566 | | - | | - | | 138,702 | | 1,398,864 | | 1,279,735 | |
1 March 2009 | | 1 March 2019 | | $16.49 | | 260,869 | | - | | 260,869 | | - | | - | | - | |
Total 2012 | | | | | | 3,511,117 | | - | | 260,869 | | 257,498 | | 2,992,750 | | 2,873,621 | |
Weighted average exercise price | | | | $26.15 | | - | | $16.49 | | $26.49 | | $26.97 | | $27.12 | |
Performance share rights | | | | | | | | | | | | | | | |
1 October 2009 | | 1 October 2019 | | nil | | 689,060 | | - | | - | | 14,010 | | 675,050 | | - | |
1 October 2010 | | 1 October 2020 | | nil | | 812,641 | | - | | - | | 58,835 | | 753,806 | | - | |
1 October 2011 | | 1 October 2021 | | nil | | - | | 1,389,308 | | - | | 116,256 | | 1,273,052 | | - | |
Total 2012 | | | | | | 1,501,701 | | 1,389,308 | | - | | 189,101 | | 2,701,908 | | - | |
Total 2011 | | | | | | | | | | | | | | | | | |
Options | | | | | | 3,620,484 | | - | | 58,666 | | 50,701 | | 3,511,117 | | 1,900,400 | |
Weighted average exercise price – options | | $26.07 | | - | | $23.40 | | $23.62 | | $26.15 | | $29.44 | |
Performance share rights | | 722,800 | | 836,022 | | 9,510 | | 47,611 | | 1,501,701 | | - | |
1 TSR measures a company’s share price movement and assuming that dividends over the period have been reinvested (i.e. the change in value of an investment in that company’s shares) and excluding tax effects.
| | |
188 | 2012 WESTPAC GROUP ANNUAL REPORT | |
NOTES TO THE FINANCIAL STATEMENTS |
|
NOTE 25. SHARE-BASED PAYMENTS (CONTINUED)
The weighted average remaining contractual life of outstanding performance options at 30 September 2012 was 5.6 years (2011: 6.7 years). The weighted average remaining contractual life of outstanding performance share rights at 30 September 2012 was 8.2 years (2011: 8.5 years). The weighted average fair value at grant date of WRP performance share rights issued during the year was $13.00 (2011: $12.68).
(ii) Westpac Performance Plan
The Westpac Performance Plan (WPP) was introduced in 2002 and was used to provide awards of performance options and/or performance share rights to senior executives and other key employees. Currently the WPP is primarily used for employees based in New Zealand to provide long-term incentive awards or as a mechanism for the mandatory deferral of a portion of their short-term incentives.
An option or share right under the WPP is the right to acquire a share in the future provided all conditions are met, with an exercise price generally set at the time the invitation is made. The exercise price for options is equal to the average market price of Westpac ordinary shares traded on the ASX over the five trading days up to the time the invitation is made. The exercise price for share rights is nil.
Performance options and performance share rights
Performance options and performance share rights under the WPP have all vested. Upon exercising vested performance options or performance share rights, the executive has the right to take up his or her entitlement in whole or in part as fully paid ordinary shares. The exercise price is payable at that time. A performance option or performance share right lapses if it is not exercised prior to the end of its term.
WPP – outstanding performance options
No performance options were granted under the WPP during the year. The following table sets out details of outstanding performance options granted under the WPP in previous years:
Commencement
Date | | Latest Date for
Exercise | | Exercise
Price | | Outstanding
at 1 October
2011 | | Granted
During
the Year | | Exercised
During
the Year | | Lapsed
During
the Year | | Outstanding
at
30 September
2012 | | Outstanding
and
Exercisable at
30 September
2012 | |
20 January 2003 | | 20 January 2013 | | $13.59 | | 187,260 | | - | | 165,353 | | - | | 21,907 | | 21,907 | |
1 May 2003 | | 1 May 2013 | | $15.04 | | 16,433 | | - | | - | | - | | 16,433 | | 16,433 | |
21 January 2004 | | 21 January 2014 | | $16.34 | | 614,225 | | - | | 264,285 | | - | | 349,940 | | 349,940 | |
20 January 2005 | | 20 January 2015 | | $18.98 | | 1,080,237 | | - | | 63,675 | | - | | 1,016,562 | | 1,016,562 | |
20 December 2005 | | 20 December 2015 | | $20.53 | | 1,110,195 | | - | | 50,174 | | - | | 1,060,021 | | 1,060,021 | |
20 December 2005 | | 20 December 2015 | | $22.53 | | 69,971 | | - | | - | | 13,379 | | 56,592 | | 56,592 | |
15 December 2006 | | 15 December 2016 | | $23.98 | | 1,533,117 | | - | | 40,865 | | 160,026 | | 1,332,226 | | 1,332,226 | |
Total 2012 | | | | | | 4,611,438 | | - | | 584,352 | | 173,405 | | 3,853,681 | | 3,853,681 | |
Weighted average exercise price | | | | $20.48 | | - | | $16.74 | | $23.87 | | $20.90 | | $20.90 | |
Total 2011 | | | | | | 5,315,814 | | - | | 701,473 | | 2,903 | | 4,611,438 | | 4,590,089 | |
Weighted average exercise price | | | | $20.30 | | - | | $19.05 | | $23.78 | | $20.48 | | $20.47 | |
The weighted average remaining contractual life of outstanding performance options at 30 September 2012 was 3.1 years (2011: 4.0 years).
| | |
| 2012 WESTPAC GROUP ANNUAL REPORT | 189 |
NOTE 25. SHARE-BASED PAYMENTS (CONTINUED)
WPP – outstanding performance share rights
The following table sets out details of outstanding vested performance share rights granted under the WPP:
Commencement
Dates | | Latest Dates for Exercise | | Outstanding at
1 October
2011 | | Granted
During
the Year | | Exercised
During
the Year | | Lapsed
During
the Year | | Outstanding at
30 September
2012 | | Outstanding
and
Exercisable at
30 September
2012 | |
Two-year initial testing period | | | | | | | | | | | |
20 January 2003 to
1 August 2003 | | 20 January 2013 to
1 August 2013 | | 16,001 | | - | | - | | - | | 16,001 | | 16,001 | |
3 November 2003 to
3 August 2004 | | 3 November 2013 to
3 August 2014 | | 64,482 | | - | | 6,196 | | 1,126 | | 57,160 | | 57,160 | |
5 November 2004 to
1 August 2005 | | 5 November 2014 to
1 August 2015 | | 160,330 | | - | | 63,069 | | - | | 97,261 | | 97,261 | |
1 November 2005 to
3 August 2006 | | 1 November 2015 to
3 August 2016 | | 140,773 | | - | | 29,630 | | 1,201 | | 109,942 | | 109,942 | |
1 November 2006 to
15 December 2006 | | 1 November 2016 to
15 December 2016 | | 50,415 | | - | | 10,279 | | - | | 40,136 | | 40,136 | |
1 December 2008 to
1 March 2009 | | 1 December 2018 to
1 March 2019 | | 45,265 | | - | | 27,906 | | - | | 17,359 | | 17,359 | |
| | | | | | | | | | | | | | | |
Three-year initial testing period | | | | | | | | | | | | | |
20 January 2003 to
1 August 2003 | | 20 January 2013 to
1 August 2013 | | 26,866 | | - | | 3,844 | | - | | 23,022 | | 23,022 | |
3 November 2003 to
3 August 2004 | | 3 November 2013 to
3 August 2014 | | 52,435 | | - | | 10,479 | | 975 | | 40,981 | | 40,981 | |
5 November 2004 to
1 August 2005 | | 5 November 2014 to
1 August 2015 | | 95,780 | | - | | 21,406 | | - | | 74,374 | | 74,374 | |
1 November 2005 to
3 August 2006 | | 1 November 2015 to
3 August 2016 | | 213,977 | | - | | 40,167 | | 1,227 | | 172,583 | | 172,583 | |
1 November 2006 to
15 December 2006 | | 1 November 2016 to
15 December 2016 | | 1,877 | | - | | - | | - | | 1,877 | | 1,877 | |
Total 2012 | | | | 868,201 | | - | | 212,976 | | 4,529 | | 650,696 | | 650,696 | |
Total 2011 | | | | 1,207,726 | | - | | 316,376 | | 23,149 | | 868,201 | | 868,201 | |
The weighted average remaining contractual life of outstanding performance share rights at 30 September 2012 was 2.7 years (2011: 3.8 years).
Unhurdled options and unhurdled share rights
The WPP is also used for key employees based outside Australia, who received unhurdled share rights restricted for one to three years. No unhurdled options were granted under the WPP during the year. After the restriction period applying to them has passed, vested unhurdled options and unhurdled share rights can be exercised to receive the underlying fully paid ordinary shares.
| | |
190 | 2012 WESTPAC GROUP ANNUAL REPORT | |
NOTES TO THE FINANCIAL STATEMENTS
NOTE 25. SHARE-BASED PAYMENTS (CONTINUED)
WPP – outstanding unhurdled options and unhurdled share rights
The following table sets out details of outstanding unhurdled options and unhurdled share rights granted under the WPP:
Commencement
Date | | Latest Date for
Exercise | | Exercise
Price | | Outstanding at
1 October
2011 | | Granted
During
the Year | | Exercised
During
the Year | | Lapsed
During
the Year | | | Outstanding
at
30 September
2012 | | Outstanding
and
Excercisable at
30 September
2012 |
Options | | | | | | | | | | | | | | | | | |
15 December 2006 | | 15 December 2016 | | $23.93 | | 56,147 | | - | | - | | 13,368 | | | 42,779 | | 42,779 |
Total 2012 | | | | | | 56,147 | | - | | - | | 13,368 | | | 42,779 | | 42,779 |
Share rights | | | | | | | | | | | | | | | | | |
One-year vesting period | | | | | | | | | | | | | | | |
1 December 2008 to
1 June 2009 | | 1 December 2018 to
1 June 2019 | | nil | | 5,681 | | - | | - | | - | | | 5,681 | | 5,681 |
1 November 2009 to
1 April 2010 | | 1 November 2019 to
1 April 2020 | | nil | | 21,492 | | - | | 20,418 | | - | | | 1,074 | | 1,074 |
1 November 2010 to
1 April 2011 | | 1 November 2020 to
1 April 2021 | | nil | | 25,416 | | - | | 15,673 | | - | | | 9,743 | | 9,743 |
1 October 2011 to
1 August 2012 | | 1 October 2021 to
1 August 2022 | | nil | | - | | 52,201 | | - | | - | | | 52,201 | | - |
Two-year vesting period | | | | | | | | | | | | | | | |
1 November 2007 to
1 September 2008 | | 1 November 2017 to
1 September 2018 | | nil | | 18,752 | | - | | 6,417 | | - | | | 12,335 | | 12,335 |
1 October 2008 to
1 April 2009 | | 1 October 2018 to
1 April 2019 | | nil | | 7,814 | | - | | 2,501 | | - | | | 5,313 | | 5,313 |
1 October 2009 to
1 April 2010 | | 1 October 2019 to
1 April 2020 | | nil | | 81,271 | | - | | 64,916 | | - | | | 16,355 | | 16,355 |
1 October 2010 to
1 August 2011 | | 1 October 2020 to
1 August 2021 | | nil | | 113,958 | | - | | - | | 3,194 | | | 110,764 | | - |
1 October 2011 to
1 August 2012 | | 1 October 2021 to
1 August 2022 | | nil | | - | | 65,926 | | - | | - | | | 65,926 | | - |
Three-year vesting period | | | | | | | | | | | | | | | |
15 December 2006 to
1 June 2007 | | 15 December 2016 to
1 June 2017 | | nil | | 47,310 | | - | | 17,918 | | - | | | 29,392 | | 29,392 |
17 December 2007 to
1 September 2008 | | 17 December 2017 to
1 September 2018 | | nil | | 52,454 | | - | | 26,628 | | - | | | 25,826 | | 25,826 |
1 October 2008 to
1 April 2009 | | 1 October 2018 to
1 April 2019 | | nil | | 103,429 | | - | | 82,779 | | - | | | 20,650 | | 20,650 |
1 October 2009 to
1 April 2010 | | 1 October 2019 to
1 April 2020 | | nil | | 113,420 | | - | | - | | - | | | 113,420 | | - |
1 October 2010 to 1 August 2011 | | 1 October 2020 to
1 August 2021 | | nil | | 176,382 | | - | | - | | 613 | | | 175,769 | | - |
1 October 2011 to
1 June 2012 | | 1 October 2021 to
1 June 2022 | | nil | | - | | 162,161 | | - | | - | | | 162,161 | | - |
Total 2012 | | | | | | 767,379 | | 280,288 | | 237,250 | | 3,807 | | | 806,610 | | 126,369 |
Total 2011 | | | | | | | | | | | | | | | | | |
Options | | | | $23.93 | | 56,147 | | - | | - | | - | | | 56,147 | | 56,147 |
Performance share rights | | nil | | 764,827 | | 315,756 | | 313,419 | | (215 | ) | | 767,379 | | 161,827 |
The weighted average fair value at grant date of unhurdled share rights issued during the year was $17.59 per right (2011: $18.91 per right). The weighted average remaining contractual life of outstanding unhurdled options and unhurdled share rights at 30 September 2012 was 7.7 years (2011: 7.8 years).
| | |
| 2012 WESTPAC GROUP ANNUAL REPORT | 191 |
NOTE 25. SHARE-BASED PAYMENTS (CONTINUED)
(iii) Chief Executive Officer Performance Plan (Gail Kelly)
Gail Kelly currently holds performance options and performance share rights under the Chief Executive Officer Performance Plan (CEOPP). Grants to Mrs Kelly under the CEOPP were approved by shareholders at Westpac’s AGM on 13 December 2007, 16 December 2009 and 15 December 2010.
Performance options granted under the CEOPP have an exercise price equal to the volume weighted average market price of Westpac ordinary shares traded on the ASX during the one week period immediately before the start of the performance period. Performance share rights have a nil exercise price. No performance options have been awarded since December 2008.
Awards made from October 2011 are subject to two performance measures each applying to 50% of the value of the award. The two hurdles are Westpac’s relative TSR and Cash EPS CAGR. The vesting conditions for these awards are the same as set out above for awards made under the WRP from October 2011.
For awards made prior to October 2011 all awards were subject to a TSR hurdle and the vesting conditions for these awards are also the same as awards made under the WRP prior to October 2011.
CEOPP – outstanding performance options and performance share rights
The following table sets out details of outstanding awards of performance options and performance share rights granted under the CEOPP:
Commencement
Date | | Latest Date for
Exercise | | Exercise
Price | | | Outstanding at
1 October
2011 | | Granted
During
the Year | | Exercised
During
the Year | | Lapsed
During
the Year | | | Outstanding at
30 September
2012 |
Options | | | | | | | | | | | | | | | | |
1 February 2008 | | 1 February 2018 | | $25.89 | | | 364,431 | | - | | - | | - | | | 364,431 |
1 December 2008 | | 1 December 2018 | | $16.80 | | | 356,125 | | - | | 320,513 | | - | | | 35,612 |
Total 2012 | | | | | | | 720,556 | | - | | 320,513 | | - | | | 400,043 |
Weighted average exercise price – options | | | | | $21.40 | | - | | 16.80 | | - | | | $25.08 |
Performance share rights | | | | | | | | | | | | | | | |
1 February 2008 | | 1 February 2018 | | nil | | | 24,687 | | - | | 24,687 | | - | | | - |
1 December 2008 | | 1 December 2018 | | nil | | | 119,731 | | - | | 107,758 | | - | | | 11,973 |
21 December 2009 | | 21 December 2019 | | nil | | | 166,002 | | - | | - | | - | | | 166,002 |
1 October 2010 | | 1 October 2020 | | nil | | | 176,125 | | - | | - | | - | | | 176,125 |
1 October 2011 | | 1 October 2021 | | nil | | | - | | 272,929 | | - | | - | | | 272,929 |
Total 2012 | | | | | | | 486,545 | | 272,929 | | 132,445 | | - | | | 627,029 |
Total 2011 | | | | | | | | | | | | | | | | |
Options | | | | | | | 720,556 | | - | | - | | - | | | 720,556 |
Weighted average exercise price – options | | | | | $21.40 | | - | | - | | - | | | $21.40 |
Performance share rights | | | | nil | | | 368,023 | | 176,125 | | 57,603 | | - | | | 486,545 |
The weighted average fair value at grant date of performance share rights granted during the year was $12.83 per right (2011: $13.58 per right). As at 30 September 2012, 364,431 outstanding performance options issued to Mrs Kelly were exercisable and no outstanding share rights issued to Mrs Kelly were exercisable. The remaining weighted average contractual life of outstanding performance options at 30 September 2012 was 5.4 years (2011: 6.8 years) and outstanding performance share rights was 8.2 years (2011: 8.2 years).
| | |
192 | 2012 WESTPAC GROUP ANNUAL REPORT | |
NOTES TO THE FINANCIAL STATEMENTS
NOTE 25. SHARE-BASED PAYMENTS (CONTINUED)
(iv) Fair value assumptions
The fair values of share rights granted during the year included in the tables above have been independently calculated at their respective grant dates based on the requirements of Australian accounting standard AASB 2 Share-based Payments.
The fair values of rights without TSR based hurdles, including rights with Cash EPS CAGR hurdles, have been assessed with reference to the share price at grant date and a discount rate reflecting the expected dividend yield over their vesting periods.
The fair value of rights with hurdles based on TSR performance relative to a group of comparator companies also takes into account the average TSR outcome determined using a Monte Carlo simulation pricing model.
§ the assumptions included in the valuation of the awards of performance share rights to Gail Kelly include a risk free interest rate of 3.01%, a dividend yield on Westpac ordinary shares of 7.6% and a volatility in the Westpac share price of 27.5%;
§ the assumptions included in the valuation of the awards of share rights under the WRP and WPP include a risk free interest rate of 3.14%, a dividend yield on Westpac ordinary shares of 7.6% and a volatility in the Westpac share price of 28.5%;
§ volatility has been assessed by considering the historic volatility of the market price of Westpac shares; and
§ other assumptions include volatilities of, and correlation factors between, share price movements of the comparator group members and Westpac which are used to assess the impact of the TSR performance hurdles and have been derived from the historic volatilities and correlations.
(v) Chief Executive Officer Restricted Share Plan
Gail Kelly received awards of Westpac ordinary shares under the Chief Executive Officer Restricted Share Plan (CEO RSP) in relation to her employment agreement. The awards were approved by Westpac shareholders at Westpac’s AGM on 16 December 2009, 15 December 2010 and 14 December 2011.
Like the general RSP, Westpac ordinary shares are allocated under the CEO RSP at no cost to Mrs Kelly, with vesting subject to remaining employed with Westpac for a set period. Shares in the CEO RSP are held in Mrs Kelly’s name and are restricted until satisfaction of the vesting conditions. Shares in the CEO RSP rank equally with Westpac ordinary shares for dividends and voting rights. For awards made prior to October 2009, shares may be held in the CEO RSP for up to 10 years from the date they are granted. For awards made from October 2009, shares are released from the CEO RSP on vesting.
The following table details outstanding awards of shares issued under the CEO RSP:
Allocation date | | Outstanding at
1 October 2011 | | Granted During
the Year | | Released | | Forfeited During
the Year | | | Outstanding at
30 September 2012 |
21 December 2009 | | 37,313 | | - | | 37,313 | | - | | | - |
22 December 2010 | | 82,102 | | - | | 41,051 | | - | | | 41,051 |
22 December 2011 | | - | | 77,799 | | - | | - | | | 77,799 |
Total 2012 | | 119,415 | | 77,799 | | 78,364 | | - | | | 118,850 |
Total 2011 | | 120,739 | | 82,102 | | 83,426 | | - | | | 119,415 |
| | |
| 2012 WESTPAC GROUP ANNUAL REPORT | 193 |
NOTE 25. SHARE-BASED PAYMENTS (CONTINUED)
(vi) Restricted Share Plan
The Restricted Share Plan (RSP) provides Westpac with an instrument for attracting and rewarding key employees. Under the RSP, Westpac shares may be allocated to eligible employees at no cost with vesting subject to remaining employed with Westpac for a period determined by the Board. Shares in the RSP are held in the name of the employee and are restricted until satisfaction of the vesting conditions. Shares in the RSP rank equally with Westpac ordinary shares for dividends and voting rights. For awards made prior to October 2009, shares may be held in the RSP for up to 10 years from the date they are granted. For awards made from October 2009, shares are released from the RSP on vesting.
Outstanding RSP awards
The following table details outstanding awards of shares issued under the RSP:
Allocation date | | Outstanding at
1 October 2011 | | Granted During the Year | | Released | | Forfeited During
the Year | | | Outstanding at
30 September 2012 | |
October – December 2006 | | 428,135 | | - | | 110,687 | | - | | | 317,448 | |
January – March 2007 | | 4,784 | | - | | 1,196 | | - | | | 3,588 | |
April – June 2007 | | 15,161 | | - | | - | | - | | | 15,161 | |
July – September 2007 | | 7,023 | | - | | 2,648 | | - | | | 4,375 | |
October – December 2007 | | 655,795 | | - | | 146,740 | | - | | | 509,055 | |
January – March 2008 | | 22,124 | | - | | 11,901 | | - | | | 10,223 | |
April – June 2008 | | 37,389 | | - | | 3,022 | | - | | | 34,367 | |
July – September 2008 | | 10,328 | | - | | 1,916 | | - | | | 8,412 | |
October – December 2008 | | 1,720,742 | | - | | 667,687 | | - | | | 1,053,055 | |
January – March 2009 | | 112,419 | | - | | 34,645 | | - | | | 77,774 | |
April – June 2009 | | 23,786 | | - | | 15,052 | | - | | | 8,734 | |
January – March 2010 | | 2,286,142 | | - | | 844,690 | | 34,259 | | | 1,407,193 | |
April – June 2010 | | 52,333 | | - | | 25,410 | | - | | | 26,923 | |
July – September 2010 | | 33,612 | | - | | 12,569 | | - | | | 21,043 | |
October – December 2010 | | 3,176,770 | | - | | 31,642 | | 73,309 | | | 3,071,819 | |
January – March 2011 | | 53,062 | | - | | 49,410 | | - | | | 3,652 | |
April – June 2011 | | 58,873 | | - | | 22,982 | | - | | | 35,891 | |
July – September 2011 | | 59,040 | | - | | 19,130 | | - | | | 39,910 | |
October – December 2011 | | - | | 3,589,472 | | 58,924 | | 62,491 | | | 3,468,057 | |
January – March 2012 | | - | | 80,367 | | 8,042 | | 5,552 | | | 66,773 | |
April – June 2012 | | - | | 41,639 | | - | | - | | | 41,639 | |
July – September 2012 | | - | | 410,738 | | 52,306 | | - | | | 358,432 | |
Total 2012 | | 8,757,518 | | 4,122,216 | | 2,120,599 | | 175,611 | | | 10,583,524 | |
Total 2011 | | 6,939,972 | | 3,423,629 | | 1,411,208 | | 194,875 | | | 8,757,518 | |
(vii) Chief Executive Securities Agreement 2003 (David Morgan)
The former CEO continues to hold performance options received under the Chief Executive Securities Agreement 2003, approved by shareholders at Westpac’s AGM on 11 December 2003. At 30 September 2012 there were 1,649,407 performance options outstanding (2011: 1,649,407) with a weighted average exercise price of $22.14 (2011: $22.14) and a weighted average remaining contractual life of 3.3 years (2011: 4.3 years), all of which are exercisable.
(viii) Other Group share-based plans
Westpac also provides plans for small, specialised parts of the Group. The benefits under these plans are directly linked to growth and performance of the relevant part of the business. The plans individually and in aggregate are not material to the Group.
(ix) Senior Officers’ Share Purchase Scheme
The Senior Officers’ Share Purchase Scheme (SOSPS) was approved by shareholders in December 1998 and was closed to new invitations in 2002.
As at 30 September 2012, there were no outstanding share options (2011: 398,000 with a weighted average exercise price of $14.71 and a weighted contractual life of 0.3 years). During 2012, 398,000 options were exercised at a weighted average exercise price of $14.71 (2011: 657,500 with a weighted average exercise price of $13.70).
| | |
194 | 2012 WESTPAC GROUP ANNUAL REPORT | |
NOTES TO THE FINANCIAL STATEMENTS
NOTE 25. SHARE-BASED PAYMENTS (CONTINUED)
General information on Executive and Senior Officer share plans
The market price of Westpac’s ordinary shares as at the close of business on 28 September 2012 was $24.85 (2011: $20.34). Details of the shares issued on exercise of options and share rights under each of the Executive and Senior Officer share plans during the year ended 30 September 2012 are set out below:
Plan/Agreement | | Dates on which Options or
Share Rights Were Exercised | | Exercise Price
$ | | Total Number of
Shares Issued/
Allocated | | Weighted
Average Share
Price at Date of
Exercise
$ | | Consideration
Received
($’000) | |
2012 | | WRP and WPP | | | | | | | | | | | |
| | Options | | October – December 2011 | | 13.59 - 18.98 | | 182,949 | | 22.51 | | 2,679 | |
| | | | January – March 2012 | | - | | - | | - | | - | |
| | | | April – June 2012 | | 16.34 - 18.98 | | 506,082 | | 22.32 | | 8,437 | |
| | | | July – September 2012 | | 13.59 - 23.98 | | 156,190 | | 24.27 | | 2,970 | |
| | | | | | | | | | | | | |
| | Share rights | | October – December 2011 | | - | | 149,237 | | 21.22 | | - | |
| | | | January – March 2012 | | - | | 42,181 | | 21.06 | | - | |
| | | | April – June 2012 | | - | | 175,072 | | 21.45 | | - | |
| | | | July – September 2012 | | - | | 83,736 | | 22.43 | | - | |
| | | | | | | | | | | | | |
| | Chief Executive Officer Performance Plan | | | | | | | | | | | |
| | Options | | April – June 2012 | | 16.80 | | 320,513 | | 22.84 | | 5,385 | |
| | | | | | | | | | | | | |
| | Share rights | | October – December 2011 | | - | | 107,758 | | 20.37 | | - | |
| | | | April – June 2012 | | - | | 24,687 | | 22.84 | | - | |
| | | | | | | | | | | | | |
| | SOSPS | | | | | | | | | | | |
| | | | October – December 2011 | | 14.65 | | 343,000 | | 21.54 | | 5,025 | |
| | | | January – March 2012 | | 14.65 - 16.24 | | 55,000 | | 20.41 | | 830 | |
2011 | | WRP and WPP | | | | | | | | | | | |
| | Options | | October – December 2010 | | 20.53 | | 33,448 | | 23.15 | | 687 | |
| | | | January – March 2011 | | 13.59 | | 28,856 | | 22.76 | | 392 | |
| | | | April – June 2011 | | 13.59 - 23.98 | | 636,164 | | 24.70 | | 12,462 | |
| | | | July – September 2011 | | 18.98 - 20.53 | | 61,671 | | 21.22 | | 1,196 | |
| | | | | | | | | | | | | |
| | Share rights | | October – December 2010 | | - | | 279,432 | | 22.84 | | - | |
| | | | January – March 2011 | | - | | 152,093 | | 23.41 | | - | |
| | | | April – June 2011 | | - | | 136,405 | | 24.16 | | - | |
| | | | July – September 2011 | | - | | 71,375 | | 20.96 | | - | |
| | | | | | | | | | | | | |
| | Chief Executive Officer Performance Plan | | | | | | | | | | | |
| | Share rights | | April – June 2011 | | - | | 57,603 | | 24.18 | | - | |
| | | | | | | | | | | | | |
| | SOSPS | | October – December 2010 | | 13.26 - 14.65 | | 464,500 | | 21.45 | | 6,311 | |
| | | | January – March 2011 | | 13.26 - 14.65 | | 96,000 | | 22.69 | | 1,344 | |
| | | | April – June 2011 | | 14.65 | | 25,000 | | 24.36 | | 366 | |
| | | | July – September 2011 | | 14.65 | | 72,000 | | 20.36 | | 835 | |
Shares allotted to satisfy the exercise of options or share rights under the employee equity plans will rank equally with all other issued Westpac ordinary shares and qualify for the payment of dividends and shareholder voting rights from the day of allotment.
The employee equity plans are operated in compliance with ASIC Regulatory Guide 49 which provides relief from the disclosure and licensing provisions of the Corporations Act. Included in the ASIC regulatory guide is a five percent limit on the number of shares that can be issued under an employee equity plan without issuing a prospectus.
| | |
| 2012 WESTPAC GROUP ANNUAL REPORT | 195 |
NOTE 25. SHARE-BASED PAYMENTS (CONTINUED)
Under the regulatory guide, the number of shares (including shares that are the subject of options and share rights) to be offered to employees at any particular time cannot, at the time the offer is made and when aggregated with the number of shares the subject of previously issued unexercised options and share rights issued to employees under those plans and with the number of shares issued during the previous five years under all employee share schemes, exceed 5% of the total number of shares on issue at the time that offer is made.
The names of all persons who hold options and/or share rights currently on issue are entered in Westpac’s register of option holders which may be inspected at Link Market Services, Level 12, 680 George Street, Sydney, New South Wales.
Employee Share Plan
Under the Employee Share Plan (ESP), Westpac ordinary shares may be allocated at no cost to employees to recognise their contribution to Westpac’s financial performance over the previous financial year. The maximum annual award value under the ESP is $1,000 per employee per year. However, the number of shares employees receive (if any) depends on Westpac’s share price performance over the 12 months to 30 September or a customer-centric measure, and is subject to Board discretion.
The shares must normally remain within the ESP for three years unless the employee leaves Westpac. Participants are entitled to receive any dividend or other distribution attaching to shares held under the ESP. Participants are also entitled to exercise voting rights attaching to the shares.
Westpac’s Australian permanent employees (including part-time employees) who have been in six months continuous employment as at 30 September each year are eligible to participate in the ESP. Executives and senior management who participate in any Westpac long-term incentive plan or deferred short-term incentive plan are not eligible to participate in the ESP during the same year. The number of shares employees receive is calculated by dividing the award value by the prevailing market price of Westpac’s ordinary shares when the shares are granted.
Share allocation in the 2011 ESP award was by way of newly issued shares. The following table provides details of shares issued under the ESP during the years ended 30 September:
| | Allocation
Date | | Number of
Participants | | Average Number
of Shares Allocated
per Participant | | Total Number
of Shares
Allocated | | Market
Price per Share | | Total
Fair Value | |
2012 | | 2 December 2011 | | 27,005 | | 49 | | 1,323,245 | | $20.35 | | $26,928,036 | |
2011 | | 3 December 2010 | | 27,234 | | 46 | | 1,252,764 | | $21.46 | | $26,884,315 | |
The liability accrued in respect of the ESP at 30 September 2012 is $28 million (2011: $30 million) and is included in other liabilities.
| | |
196 | 2012 WESTPAC GROUP ANNUAL REPORT | |
NOTES TO THE FINANCIAL STATEMENTS
NOTE 26. AVERAGE BALANCE SHEET AND INTEREST RATES
The following table lists the average balances and related interest for the major categories of the Group’s interest earning assets and interest bearing liabilities. Averages used are predominantly daily averages:
| | | | | | | | | Consolidated | | | | | | | |
| | Year Ended | | | Year Ended | | Year Ended | |
| | 30 September 2012 | | | 30 September 2011 | | 30 September 2010 | |
| | Average | | Interest | | Average | | | Average | | Interest | | Average | | Average | | Interest | | Average | |
| | Balance | | Income | | Rate | | | Balance | | Income | | Rate | | Balance | | Income | | Rate | |
| | $m | | $m | | % | | | $m | | $m | | % | | $m | | $m | | % | |
Assets | | | | | | | | | | | | | | | | | | | | |
Interest earning assets | | | | | | | | | | | | | | | | | | | | |
Receivables due from other financial institutions: | | | | | | | | | | | | | | | | | | | | |
Australia | | 3,215 | | 135 | | 4.2% | | | 3,800 | | 172 | | 4.5% | | 4,539 | | 176 | | 3.9% | |
New Zealand | | 220 | | 4 | | 1.8% | | | 328 | | 26 | | 7.9% | | 305 | | 24 | | 7.9% | |
Other overseas | | 4,935 | | 49 | | 1.0% | | | 5,382 | | 53 | | 1.0% | | 4,948 | | 34 | | 0.7% | |
Trading securities: | | | | | | | | | | | | | | | | | | | | |
Australia | | 36,082 | | 1,873 | | 5.2% | | | 37,265 | | 2,133 | | 5.7% | | 37,847 | | 1,838 | | 4.9% | |
New Zealand | | 4,538 | | 123 | | 2.7% | | | 4,733 | | 149 | | 3.1% | | 4,622 | | 133 | | 2.9% | |
Other overseas | | 5,072 | | 95 | | 1.9% | | | 4,159 | | 74 | | 1.8% | | 3,720 | | 64 | | 1.7% | |
Other financial assets designated at fair value: | | | | | | | | | | | | | | | | | | | | |
Australia | | 1,708 | | 100 | | 5.9% | | | 1,397 | | 95 | | 6.8% | | 1,089 | | 57 | | 5.2% | |
Other overseas | | 311 | | 8 | | 2.6% | | | 156 | | 4 | | 2.6% | | 244 | | 7 | | 2.9% | |
Available-for-sale securities: | | | | | | | | | | | | | | | | | | | | |
Australia | | 16,240 | | 1,006 | | 6.2% | | | 12,238 | | 743 | | 6.1% | | 5,457 | | 340 | | 6.2% | |
New Zealand | | 1,784 | | 80 | | 4.5% | | | 391 | | 20 | | 5.1% | | - | | - | | - | |
Other overseas | | 1,062 | | 30 | | 2.8% | | | 986 | | 26 | | 2.6% | | 858 | | 28 | | 3.3% | |
Regulatory deposits: | | | | | | | | | | | | | | | | | | | | |
Other overseas | | 1,460 | | 24 | | 1.6% | | | 1,303 | | 12 | | 0.9% | | 1,363 | | 4 | | 0.3% | |
Loans and other receivables1: | | | | | | | | | | | | | | | | | | | | |
Australia | | 440,416 | | 30,202 | | 6.9% | | | 425,905 | | 31,467 | | 7.4% | | 419,148 | | 28,208 | | 6.7% | |
New Zealand | | 46,416 | | 2,870 | | 6.2% | | | 44,694 | | 2,900 | | 6.5% | | 45,486 | | 3,053 | | 6.7% | |
Other overseas | | 14,286 | | 274 | | 1.9% | | | 5,484 | | 224 | | 4.1% | | 5,365 | | 185 | | 3.4% | |
Total interest earning assets and interest income | | 577,745 | | 36,873 | | 6.4% | | | 548,221 | | 38,098 | | 6.9% | | 534,991 | | 34,151 | | 6.4% | |
Non-interest earning assets | | | | | | | | | | | | | | | | | | | | |
Cash, receivables due from other financial institutions and regulatory deposits | | 2,745 | | | | | | | 1,350 | | | | | | 1,097 | | | | | |
Derivative financial instruments | | 36,688 | | | | | | | 33,952 | | | | | | 29,790 | | | | | |
Life insurance assets | | 8,027 | | | | | | | 10,507 | | | | | | 12,257 | | | | | |
All other assets2 | | 36,932 | | | | | | | 34,398 | | | | | | 29,542 | | | | | |
Total non-interest earning assets | | 84,392 | | | | | | | 80,207 | | | | | | 72,686 | | | | | |
Total assets | | 662,137 | | | | | | | 628,428 | | | | | | 607,677 | | | | | |
1 | Loans and receivables are stated net of provisions for impairment charges on loans. Other receivables include other assets, cash and balances with central banks. |
2 | Includes property, plant and equipment, goodwill and intangibles, other assets, deferred tax and non-interest bearing loans relating to mortgage offset accounts. |
| | |
| 2012 WESTPAC GROUP ANNUAL REPORT | 197 |
NOTE 26. AVERAGE BALANCE SHEET AND INTEREST RATES (CONTINUED)
| | | | | | | | | Consolidated | | | | | | | |
| | Year Ended | | | Year Ended | | Year Ended | |
| | 30 September 2012 | | | 30 September 2011 | | 30 September 2010 | |
| | Average | | Interest | | Average | | | Average | | Interest | | Average | | Average | | Interest | | Average | |
| | Balance | | Expense | | Rate | | | Balance | | Expense | | Rate | | Balance | | Expense | | Rate | |
| | $m | | $m | | % | | | $m | | $m | | % | | $m | | $m | | % | |
Liabilities | | | | | | | | | | | | | | | | | | | | |
Interest bearing liabilities | | | | | | | | | | | | | | | | | | | | |
Payables due to other financial institutions: | | | | | | | | | | | | | | | | | | | | |
Australia | | 4,072 | | 186 | | 4.6% | | | 2,927 | | 135 | | 4.6% | | 2,569 | | 101 | | 3.9% | |
New Zealand | | 336 | | 6 | | 1.8% | | | 502 | | 11 | | 2.2% | | 454 | | 12 | | 2.6% | |
Other overseas | | 4,837 | | 52 | | 1.1% | | | 4,656 | | 45 | | 1.0% | | 4,926 | | 38 | | 0.8% | |
Deposits: | | | | | | | | | | | | | | | | | | | | |
Australia | | 302,412 | | 13,301 | | 4.4% | | | 279,874 | | 13,352 | | 4.8% | | 270,549 | | 11,293 | | 4.2% | |
New Zealand | | 30,324 | | 1,066 | | 3.5% | | | 28,283 | | 1,086 | | 3.8% | | 27,750 | | 1,017 | | 3.7% | |
Other overseas | | 27,367 | | 235 | | 0.9% | | | 26,223 | | 244 | | 0.9% | | 24,241 | | 240 | | 1.0% | |
Loan capital: | | | | | | | | | | | | | | | | | | | | |
Australia | | 5,129 | | 327 | | 6.4% | | | 5,802 | | 332 | | 5.7% | | 7,738 | | 418 | | 5.4% | |
Other overseas | | 2,455 | | 127 | | 5.2% | | | 2,457 | | 137 | | 5.6% | | 2,528 | | 127 | | 5.0% | |
Other interest bearing liabilities1: | | | | | | | | | | | | | | | | | | | | |
Australia | | 151,204 | | 8,426 | | n/a | | | 149,514 | | 10,235 | | n/a | | 146,993 | | 8,505 | | n/a | |
New Zealand | | 11,841 | | 616 | | n/a | | | 12,292 | | 431 | | n/a | | 8,663 | | 481 | | n/a | |
Other overseas | | 550 | | 29 | | n/a | | | 1,005 | | 94 | | n/a | | 5,557 | | 77 | | n/a | |
Total interest bearing liabilities and interest expense | | 540,527 | | 24,371 | | 4.5% | | | 513,535 | | 26,102 | | 5.1% | | 501,968 | | 22,309 | | 4.4% | |
Non-interest bearing liabilities | | | | | | | | | | | | | | | | | | | | |
Deposits and payables due to other financial institutions: | | | | | | | | | | | | | | | | | | | | |
Australia | | 15,920 | | | | | | | 13,965 | | | | | | 12,273 | | | | | |
New Zealand | | 2,237 | | | | | | | 2,089 | | | | | | 1,981 | | | | | |
Other overseas | | 657 | | | | | | | 472 | | | | | | 414 | | | | | |
Derivative financial instruments | | 37,788 | | | | | | | 36,052 | | | | | | 31,061 | | | | | |
Life insurance policy liabilities | | 6,919 | | | | | | | 9,951 | | | | | | 11,503 | | | | | |
All other liabilities2 | | 13,520 | | | | | | | 11,065 | | | | | | 10,129 | | | | | |
Total non-interest bearing liabilities | | 77,041 | | | | | | | 73,594 | | | | | | 67,361 | | | | | |
Total liabilities | | 617,568 | | | | | | | 587,129 | | | | | | 569,329 | | | | | |
Shareholders’ equity | | 42,605 | | | | | | | 39,378 | | | | | | 36,434 | | | | | |
Non-controlling interests | | 1,964 | | | | | | | 1,921 | | | | | | 1,914 | | | | | |
Total equity | | 44,569 | | | | | | | 41,299 | | | | | | 38,348 | | | | | |
Total liabilities and equity | | 662,137 | | | | | | | 628,428 | | | | | | 607,677 | | | | | |
1 | Includes net impact of Treasury balance sheet management activities. |
2 | Includes provisions for current and deferred tax liabilities and other liabilities. |
| | |
198 | 2012 WESTPAC GROUP ANNUAL REPORT | |
NOTES TO THE FINANCIAL STATEMENTS
NOTE 26. AVERAGE BALANCE SHEET AND INTEREST RATES (CONTINUED)
The following table allocates changes in net interest income between changes in volume and changes in rate for the last two fiscal years. Volume and rate variances have been calculated on the movement in average balances and the change in the interest rates on average interest earning assets and average interest bearing liabilities. The variance caused by change in both volume and rate has been allocated in proportion to the relationship of the absolute dollar amount of each change to the total.
| | Consolidated | |
| | 2012 | | | 2011 | |
| | Change Due to | | | Change Due to | |
| | Volume | | Rate | | Total | | | Volume | | Rate | | Total | |
| | $m | | $m | | $m | | | $m | | $m | | $m | |
Interest earning assets | | | | | | | | | | | | | | |
Receivables due from other financial institutions: | | | | | | | | | | | | | | |
Australia | | (26 | ) | (11 | ) | (37 | ) | | (29 | ) | 25 | | (4 | ) |
New Zealand | | (9 | ) | (13 | ) | (22 | ) | | 2 | | - | | 2 | |
Other overseas | | (4 | ) | - | | (4 | ) | | 3 | | 16 | | 19 | |
Trading securities: | | | | | | | | | | | | | | |
Australia | | (68 | ) | (192 | ) | (260 | ) | | (28 | ) | 323 | | 295 | |
New Zealand | | (6 | ) | (20 | ) | (26 | ) | | 3 | | 13 | | 16 | |
Other overseas | | 16 | | 5 | | 21 | | | 8 | | 2 | | 10 | |
Other financial assets designated at fair value: | | | | | | | | | | | | | | |
Australia | | 21 | | (16 | ) | 5 | | | 16 | | 22 | | 38 | |
Other overseas | | 4 | | - | | 4 | | | (2 | ) | (1 | ) | (3 | ) |
Available-for-sale securities: | | | | | | | | | | | | | | |
Australia | | 243 | | 20 | | 263 | | | 422 | | (19 | ) | 403 | |
New Zealand | | 71 | | (11 | ) | 60 | | | 20 | | - | | 20 | |
Other overseas | | 2 | | 2 | | 4 | | | 4 | | (6 | ) | (2 | ) |
Regulatory deposits: | | | | | | | | | | | | | | |
Other overseas | | 1 | | 11 | | 12 | | | - | | 8 | | 8 | |
Loans and other receivables: | | | | | | | | | | | | | | |
Australia | | 1,072 | | (2,337 | ) | (1,265 | ) | | 455 | | 2,804 | | 3,259 | |
New Zealand | | 112 | | (142 | ) | (30 | ) | | (53 | ) | (100 | ) | (153 | ) |
Other overseas | | 360 | | (310 | ) | 50 | | | 4 | | 35 | | 39 | |
Total change in interest income | | 1,789 | | (3,014 | ) | (1,225 | ) | | 825 | | 3,122 | | 3,947 | |
| | |
| 2012 WESTPAC GROUP ANNUAL REPORT | 199 |
NOTE 26. AVERAGE BALANCE SHEET AND INTEREST RATES (CONTINUED)
| | Consolidated | |
| | 2012 | | | 2011 | |
| | Change Due to | | | Change Due to | |
| | Volume | | Rate | | Total | | | Volume | | Rate | | Total | |
| | $m | | $m | | $m | | | $m | | $m | | $m | |
Interest bearing liabilities | | | | | | | | | | | | | | |
Payables due to other financial institutions: | | | | | | | | | | | | | | |
Australia | | 53 | | (2 | ) | 51 | | | 14 | | 20 | | 34 | |
New Zealand | | (4 | ) | (1 | ) | (5 | ) | | 1 | | (2 | ) | (1 | ) |
Other overseas | | 2 | | 5 | | 7 | | | (2 | ) | 9 | | 7 | |
Deposits: | | | | | | | | | | | | | | |
Australia | | 1,075 | | (1,126 | ) | (51 | ) | | 389 | | 1,670 | | 2,059 | |
New Zealand | | 78 | | (98 | ) | (20 | ) | | 20 | | 49 | | 69 | |
Other overseas | | 11 | | (20 | ) | (9 | ) | | 20 | | (16 | ) | 4 | |
Loan capital: | | | | | | | | | | | | | | |
Australia | | (39 | ) | 34 | | (5 | ) | | (105 | ) | 19 | | (86 | ) |
Other overseas | | - | | (10 | ) | (10 | ) | | (4 | ) | 14 | | 10 | |
Other interest bearing liabilities: | | | | | | | | | | | | | | |
Australia | | 116 | | (1,925 | ) | (1,809 | ) | | 146 | | 1,584 | | 1,730 | |
New Zealand | | (16 | ) | 201 | | 185 | | | 202 | | (252 | ) | (50 | ) |
Other overseas | | (43 | ) | (22 | ) | (65 | ) | | (63 | ) | 80 | | 17 | |
Total change in interest expense | | 1,233 | | (2,964 | ) | (1,731 | ) | | 618 | | 3,175 | | 3,793 | |
Change in net interest income: | | | | | | | | | | | | | | |
Australia | | 37 | | 483 | | 520 | | | 392 | | (138 | ) | 254 | |
New Zealand | | 110 | | (288 | ) | (178 | ) | | (251 | ) | 118 | | (133 | ) |
Other overseas | | 409 | | (245 | ) | 164 | | | 66 | | (33 | ) | 33 | |
Total change in net interest income | | 556 | | (50 | ) | 506 | | | 207 | | (53 | ) | 154 | |
| | |
200 | 2012 WESTPAC GROUP ANNUAL REPORT | |
NOTES TO THE FINANCIAL STATEMENTS
NOTE 27. FINANCIAL RISK
Westpac’s risk appetite is set by the Board. The risk appetite cannot be defined by a single metric. It has many dimensions and is an amalgam of top-down requirements (including Westpac’s target debt rating and complying with regulatory requirements) and bottom-up aggregates (such as risk concentration limits). Westpac uses an economic capital model as the basis of risk measurement, calibrated to its target debt rating.
Westpac’s appetite for risk is influenced by a range of factors, including whether a risk is considered consistent with its strategy (core risk) and whether an appropriate return can be achieved from taking that risk. Westpac has a lower appetite for risks that are not part of its core strategy. Westpac seeks to achieve an appropriate return on risk and prices its products accordingly.
Westpac seeks to maximise total shareholder returns over the longer term by achieving an appropriate balance between growth and volatility of returns and by ultimately returning that value to shareholders.
Westpac distinguishes the following types of risk, and takes an integrated approach towards managing them. These risks are:
Type of risk | | Description |
| | |
Key risks | | ¾ credit risk – the risk of financial loss where a customer or counterparty fails to meet their financial obligations; ¾ funding and liquidity risk – the risk that we will be unable to fund our assets and meet obligations as they come due, without incurring unacceptable losses; ¾ market risk – the risk of an adverse impact on earnings resulting from changes in market factors, such as foreign exchange rates, interest rates, commodity prices and equity prices. This includes interest rate risk in the banking book – the risk to interest income from a mismatch between the duration of assets and liabilities that arises in the normal course of business activities; ¾ operational risk – the risk that arises from inadequate or failed internal processes and systems, human error or misconduct, or from external events. It also includes, among other things, technology risk, model risk and outsourcing risk; and ¾ compliance risk – the risk of legal or regulatory sanction, and financial or reputation loss, arising from our failure to abide by the compliance obligations required of us. |
Other related risks | | ¾ business risk – the risk associated with the vulnerability of a line of business to changes in the business environment; ¾ environmental, social and governance risks – the risk of damage to the Group’s reputation or financial performance due to failure to recognise or address material existing or emerging sustainability related environmental, social or governance issues; ¾ equity risk – the potential for financial loss arising from movements in the value of our direct and indirect equity investments; ¾ insurance risk – the risk of mis-estimation of the expected cost of insured events, volatility in the number or severity of insured events, and mis-estimation of the cost of incurred claims; ¾ related entity (contagion) risk – the risk that problems arising in other Westpac Group members compromise the financial and operational position of the authorised deposit-taking institution in the Westpac Group; and ¾ reputation risk – the risk to earnings or capital arising from negative public opinion resulting from the loss of reputation or public trust and standing. |
| | |
| 2012 WESTPAC GROUP ANNUAL REPORT | 201 |
NOTE 27. FINANCIAL RISK (CONTINUED)
Note 27 provides a summary of Westpac’s risk management framework, as well as a discussion of Westpac’s financial risk management policies and practices and quantitative information on some of its principal financial risk exposures. The information contained in Note 27 comprises the following:
27.1 Approach to risk management
27.2 Credit risk management
27.2.1 Credit risk management policy
27.2.2 Provision and impairment policy
27.2.3 Internal credit risk ratings system
27.2.4 Credit risk mitigation, collateral and other credit enhancements
27.2.5 Credit risk concentrations
27.2.6 Credit quality of financial assets
27.2.7 Financial assets that are neither past due nor impaired
27.2.8 Financial assets that are past due, but not impaired
27.2.9 Items 90 days past due, or otherwise in default, but well secured and not impaired
27.2.10 Impaired loans
27.3 Funding and liquidity risk management
27.3.1 Sources of liquidity
27.3.2 Liquidity reporting
27.3.3 Market developments
27.3.4 Contractual maturity of financial liabilities
27.3.5 Expected maturity
27.4 Market risk
27.4.1 Traded market risk
27.4.2 Non-traded market risk
27.1 Approach to risk management
The Board is responsible for reviewing and approving our overall risk management strategy, including determining our appetite for risk. The Board has delegated to the BRMC responsibility for providing recommendations to the Board on the Westpac Group’s risk-reward strategy, setting risk appetite, approving frameworks, policies and processes for managing risk, and determining whether to accept risks beyond management’s approval discretion.
The BRMC monitors the alignment of our risk profile with our risk appetite, which is defined in the Board Statement of Risk Appetite, and with our current and future capital requirements. The BRMC receives regular reports from management on the effectiveness of our management of Westpac’s material business risks. More detail about the role of the BRMC is set out in the Westpac risk management governance structure table below.
The CEO and executive management team are responsible for implementing our risk management strategy and frameworks, and for developing policies, controls, processes and procedures for identifying and managing risk in all of Westpac’s activities.
Our approach to risk management is that ‘risk is everyone’s business’ and that responsibility and accountability for risk begins with the business units that originate the risk.
Westpac follows a ‘3 Lines of Defence’ philosophy of risk management, for which the key elements are:
The 1st Line of Defence – risk identification, risk management and self-assurance
Divisional business units are responsible for identifying, evaluating and managing the risks that they originate within approved risk appetite and policies. They are required to establish and maintain appropriate risk management controls, resources and self-assurance processes.
| | |
202 | 2012 WESTPAC GROUP ANNUAL REPORT | |
NOTES TO THE FINANCIAL STATEMENTS
NOTE 27. FINANCIAL RISK (CONTINUED)
The 2nd Line of Defence – establishment of risk management frameworks and policies and risk management oversight
Our 2nd Line of Defence has three layers:
¾ our executive risk committees lead the optimisation of risk-reward by overseeing the development of risk appetite statements, risk management frameworks, policies and risk concentration controls and monitoring Westpac’s risk profile for alignment with approved appetites and strategies;
¾ our Group Risk function is independent from the business divisions, reports to the CRO, and establishes and maintains the Group-wide risk management frameworks, policies and concentration limits that are approved by the BRMC. It also provides reporting on Westpac’s risk profile to executive risk committees and the BRMC; and
¾ divisional risk areas are responsible for developing division-specific risk appetite statements, policies, controls, procedures, monitoring and reporting capability, which align to the Board’s Statement of Risk Appetite and the risk management frameworks approved by the BRMC. These risk areas are independent of the Divisions’ 1st Line business areas, with each divisional CRO having a direct reporting line to the CRO, as well as to their Division’s Group Executive.
The 3rd Line of Defence – independent assurance
Our Group Assurance function independently evaluates the adequacy and effectiveness of the Group’s overall risk management framework and controls.
This approach allows risks within our risk appetite to be balanced against appropriate rewards.
Westpac’s risk management governance structure is set out in more detail in the following table:
Board |
¾ | reviews and approves our overall risk management strategy. |
| |
Board Risk Management Committee (BRMC) |
¾ | provides recommendations to the Board on the Westpac Group’s risk-reward strategy; |
¾ | sets risk appetite; |
¾ | approves frameworks and key policies for managing risk; |
¾ | monitors our risk profile, performance, capital levels, exposures against limits and management and control of our risks; |
¾ | monitors changes anticipated in the economic and business environment and other factors relevant to our risk profile; |
¾ | oversees the development and ongoing review of key policies that support our frameworks for managing risk; and |
¾ | determines whether to accept risks beyond the approval discretion provided to management. |
| |
Other Board Committees with a risk focus |
Board Audit Committee |
¾ | oversees the integrity of financial statements and financial reporting systems. |
Board Remuneration Committee |
¾ | reviews any matters raised by the BRMC with respect to risk-adjusted remuneration. |
Board Technology Committee |
¾ | oversees information technology strategy and implementation. |
| |
Executive Team |
¾ | executes the Board-approved strategy; |
¾ | assists with the development of the Board Statement of Risk Appetite; |
¾ | delivers the Group’s various strategic and performance goals within the approved risk appetite; and |
¾ | monitors key risks within each business unit, capital adequacy and the Group’s reputation. |
| |
Executive risk committees |
Westpac Group Credit Risk Committee (CREDCO) |
¾ | leads the optimisation of credit risk-reward across the Group; |
¾ | oversees the credit risk management framework and key policies; |
¾ | oversees our credit risk profile; and |
¾ | identifies emerging credit risks and appropriate actions to address these. |
Westpac Group Market Risk Committee (MARCO) |
¾ | leads the optimisation of market risk-reward across the Group; |
¾ | oversees the market risk management framework and key policies; |
¾ | oversees our market risk profile; and |
¾ | identifies emerging market risks and appropriate actions to address these. |
| | |
| 2012 WESTPAC GROUP ANNUAL REPORT | 203 |
NOTE 27. FINANCIAL RISK (CONTINUED)
Executive risk committees (continued) |
Westpac Group Asset & Liability Committee (ALCO) |
¾ | leads the optimisation of funding and liquidity risk-reward across the Group; |
¾ | oversees the liquidity risk management framework and key policies; |
¾ | oversees the funding and liquidity risk profile and balance sheet risk profile; and |
¾ | identifies emerging funding and liquidity risks and appropriate actions to address these. |
Westpac Group Operational Risk & Compliance Committee (OPCO) |
¾ | leads the optimisation of operational risk-reward across the Group; |
¾ | oversees the operational risk management framework, the compliance management framework and key supporting policies; |
¾ | oversees our operational risk and compliance profiles; |
¾ | oversees the reputation risk and environmental, social and governance (ESG) risk management frameworks and key supporting policies; and |
¾ | identifies emerging operational and compliance risks and appropriate actions to address these. |
Westpac Group Remuneration Oversight Committee (ROC) |
¾ | responsible for ensuring that risk is embedded in all key steps in our remuneration framework; |
¾ | reviews and makes recommendations to the CEO for recommendation to the Board Remuneration Committee on the Group Remuneration Policy and provides assurance that remuneration arrangements across the Group encourage behaviour that supports Westpac’s long-term financial soundness and the risk management framework; |
¾ | reviews and monitors the remuneration arrangements (other than for Group Executives) for Responsible Persons (as defined in the Group’s Statutory Officers Fit and Proper Policy), risk and financial control personnel, and all other employees for whom a significant portion of total remuneration is based on performance and whose activities, either individually or collectively, may affect the financial soundness of Westpac; and |
¾ | reviews and recommends to the CEO for recommendation to the Board Remuneration Committee the criteria and rationale for determining the total quantum of the Group variable reward pool. |
Group and divisional risk management |
Group Risk |
¾ | develops the Group-level risk management frameworks for approval by the BRMC; |
¾ | directs the review and development of key policies supporting the risk management frameworks; |
¾ | establishes risk concentration limits and monitors risk concentrations; and |
¾ | monitors emerging risk issues. |
Compliance Function |
¾ | develops the Group-level compliance framework for approval by the BRMC; |
¾ | directs the review and development of compliance policies, compliance plans, controls and procedures; |
¾ | monitors compliance and regulatory obligations and emerging regulatory developments; and |
¾ | reports on compliance standards. |
Divisional risk management |
¾ | develops division-specific policies, risk appetite statements, controls, procedures, and monitoring and reporting capability that align to the frameworks approved by the BRMC. |
Independent internal review |
Group Assurance |
¾ | reviews the adequacy and effectiveness of management controls for risk. |
Divisional business units |
Business Units |
¾ | responsible for identifying, evaluating and managing the risks that they originate within approved risk appetite policies; and |
¾ | establish and maintain appropriate risk management controls, resources and self-assurance processes. |
| | |
204 | 2012 WESTPAC GROUP ANNUAL REPORT | |
NOTES TO THE FINANCIAL STATEMENTS
NOTE 27. FINANCIAL RISK (CONTINUED)
27.2 Credit risk management
Credit risk is the risk of financial loss where a customer or counterparty fails to meet their financial obligations.
27.2.1 Credit risk management policy
Westpac maintains a credit risk management framework and a number of key supporting policies, which are intended to clearly define roles and responsibilities, acceptable practices, limits and key controls:
¾ the Credit Risk Management framework describes the principles, methodologies, systems, roles and responsibilities, reports and key controls that exist for managing credit risk in Westpac;
¾ the Credit Risk Rating System policy describes the credit risk rating system philosophy, design, key features and uses of rating outcomes; and
¾ Westpac has established policies governing the management of three key types of concentration risk:
– individual customers or groups of related customers;
– specific industries (e.g. property); and
– individual countries.
Westpac has an established policy governing the delegation of credit approval authorities and a set of formal limits for the extension of credit. These limits represent the delegation of credit approval authority to responsible individuals throughout the organisation.
Credit manuals exist in each business unit to govern the extension of credit. These manuals include general policies covering the origination, evaluation, approval, documentation, settlement and ongoing management of credit risks including management of problem loans. These manuals are regularly updated by the business units, with significant changes approved by Group Risk.
Sector policies exist to guide the extension of credit where industry-specific guidelines are considered necessary (e.g. acceptable financial ratios or types of collateral). These policies are maintained by the business unit risk management teams.
Westpac has an established related entity risk management framework and supporting policies, which include governance of credit exposures to related entities, so as to minimise contagion risk for the extended licensed entity and to ensure compliance with the prudential requirements prescribed by APRA.
27.2.2 Provision and impairment policy
Provisions for loan impairment represent management’s best estimate of the losses incurred in the loan portfolios as at the balance date. There are two components of Westpac’s loan impairment provisions: individually assessed provisions and collectively assessed provisions. In determining the individually assessed provisions, relevant considerations that have a bearing on the expected future cash flows are taken into account, for example, the business prospects of the customer, the realisable value of collateral, Westpac’s position relative to other claimants, the reliability of customer information and the likely cost and duration of the work-out process. These judgments and estimates can change with time as new information becomes available or as work-out strategies evolve, resulting in revisions to the impairment provision as individual decisions are made.
The collectively assessed provisions are established on a portfolio basis taking into account the level of arrears, collateral, past loss experience and expected defaults based on portfolio trends. The most significant factors in establishing these provisions are estimated loss rates and related emergence periods. The future credit quality of these portfolios is subject to uncertainties that could cause actual credit losses to differ from reported loan impairment provisions. These uncertainties include the economic environment, notably interest rates, unemployment levels, payment behaviour and bankruptcy rates.
| | |
| 2012 WESTPAC GROUP ANNUAL REPORT | 205 |
NOTE 27. FINANCIAL RISK (CONTINUED)
27.2.3 Internal credit risk ratings system
The principal objective of the credit risk rating system is to produce a reliable assessment of the credit risk to which the Group is exposed.
Westpac’s internal credit risk rating system for transaction-managed customers assigns a Customer Risk Grade (CRG) to each customer, corresponding to their expected probability of default (PD). Each facility is assigned a loss given default (LGD). The Westpac risk rating system has 20 risk grades for non-defaulted customers and 10 risk grades for defaulted customers. Non-defaulted CRGs are mapped to Moody’s and Standard & Poor’s (S&P) external senior ranking unsecured ratings. Customers that are not transaction-managed (referred to as the program-managed portfolio) are segmented into pools of similar risk. Segments are created by analysing characteristics that have historically proven predictive in determining if an account is likely to go into default. Customers are then grouped according to these predictive characteristics and each segment assigned a PD and LGD.
The table below shows the current alignment between Westpac’s CRGs and the corresponding external rating. Note that only high-level CRG groupings are shown.
Financial Statement Disclosure | Westpac CRG | Moody’s Rating | S&P Rating |
Strong | A | Aaa – Aa3 | AAA – AA– |
| B | A1 – A3 | A+ – A– |
| C | Baa1 – Baa3 | BBB+ – BBB– |
Good/satisfactory | D | Ba1 – B1 | BB+ – B+ |
| | | |
| | | |
Financial Statement Disclosure | Westpac CRG | | Definitions |
Weak | E | | Watchlist |
| F | | Special Mention |
Weak/default/non-performing | G – H | | Substandard/Default |
Control mechanisms for the credit risk rating system
Westpac’s credit risk rating system is reviewed annually to confirm that the rating criteria and procedures are appropriate given the current portfolio and external conditions. The BRMC and CREDCO monitor the risk profile, performance and management of Westpac’s credit portfolio and development and review of key credit risk policies. All models materially impacting the risk rating process are periodically reviewed in accordance with Westpac’s model risk policies. Specific credit risk estimates (including PD, LGD and exposure at default (EAD) levels) are overseen, reviewed annually and approved by the Credit Risk Estimates Committee (a subcommittee of CREDCO).
| | |
206 | 2012 WESTPAC GROUP ANNUAL REPORT | |
NOTES TO THE FINANCIAL STATEMENTS
NOTE 27. FINANCIAL RISK (CONTINUED)
27.2.4 Credit risk mitigation, collateral and other credit enhancements
Westpac uses a variety of techniques to reduce the credit risk arising from its lending activities. Enforceable legal documentation establishes Westpac’s direct, irrevocable and unconditional recourse to any collateral, security or other credit enhancements provided.
The table below describes the nature of collateral held for financial asset classes:
Cash and other balances held with central banks, including regulatory deposits | | These exposures are generally considered to be low risk due to the nature of the counterparties. Collateral is generally not sought on these balances. |
Receivables due from other financial institutions | | These exposures are mainly to relatively low risk banks (Rated A+, AA– or better). Collateral is generally not sought on these balances. |
Derivative financial instruments | | Master netting agreements are typically used to enable the effects of derivative assets and liabilities with the same counterparty to be offset when measuring these exposures. Additionally, collateralisation agreements are also typically entered into with major derivatives counterparties to avoid the potential build up of excessive mark-to-market positions. |
Trading securities | | These exposures are carried at fair value which reflects the credit risk. No collateral is sought directly from the issuer or counterparty; however this may be implicit in the terms of the instrument. |
Other financial assets designated at fair value | | These exposures are carried at fair value which reflects the credit risk. The terms of debt securities may include collateralisation. |
Available-for-sale securities | | Collateral is not sought directly with respect to these exposures; however collateralisation may be implicit in the structure of the asset. |
Loans – housing and personal1 | | Loans – housing and personal may be secured, partially secured or unsecured depending on the product. Security is typically taken by a mortgage over property and/or a general security agreement over other assets. |
Loans – business1 | | Loans – business may be secured, partially secured or unsecured. Security is typically taken by way of a mortgage over property and/or a general security agreement over business assets, or other assets. Other forms of credit protection may also be sought or taken out if warranted. |
Life insurance assets | | These assets are carried at fair value, which reflects the credit risk. Collateral is typically not held other than for investments in Australian mortgages where recourse to a charge over the underlying properties is held. |
Due from subsidiaries | | These exposures are generally considered to be low risk due to the nature of the counterparties. Collateral is generally not sought on these balances. |
1 This includes collateral held in relation to associated credit commitments.
Risk reduction
Westpac recognises the following as eligible collateral for credit risk mitigation by way of risk reduction:
§ cash, primarily in Australian dollars (AUD), New Zealand dollars (NZD), US dollars (USD), Canadian dollars (CAD), British pounds (GBP) or European Union euro (EUR);
§ bonds as issued by Australian Commonwealth, State and Territory governments or their Public Sector Enterprises, provided these attract a zero risk-weighting under Australian Prudential Standard (APS) 112;
§ securities issued by other specified AA– / Aa3-rated sovereign governments; and
§ credit-linked notes (provided the proceeds are invested in cash or other eligible collateral described above).
| | |
| 2012 WESTPAC GROUP ANNUAL REPORT | 207 |
NOTE 27. FINANCIAL RISK (CONTINUED)
Risk transfer
For mitigation by way of risk transfer, Westpac only recognises unconditional irrevocable guarantees or standby letters of credit issued by, or eligible credit derivative protection bought from, the following entities, provided they are not related to the underlying obligor:
§ sovereign entities;
§ public sector entities in Australia and New Zealand;
§ ADIs and overseas banks; and
§ other entities with a minimum risk grade equivalent of A3 / A–.
Management of risk mitigation
Westpac facilitates the management of these risks through controls covering:
§ collateral valuation and management;
§ credit portfolio management; and
§ netting.
Collateral valuation and management
Westpac revalues collateral related to financial markets positions on a daily basis to monitor the net risk position, and has formal processes in place so that calls for collateral top-up or exposure reduction are made promptly. An independent operational unit has responsibility for monitoring these positions. The collaterisation arrangements are documented via the Support Annex of the International Swaps and Derivatives Association (ISDA) dealing agreements.
Credit Portfolio Management
Credit Portfolio Management (CPM) is a division that manages the overall risk in Westpac’s corporate, sovereign and bank credit portfolios. CPM includes a dedicated portfolio trading desk with the specific mandate of actively monitoring the underlying exposure and any offsetting hedge positions. Specific reporting is maintained and monitored on the matching of hedges with underlying facilities, with any adjustments to hedges (including unwinds or extensions) managed dynamically. CPM ensures that credit protection is acquired from entities meeting our acceptability criteria as described under the Risk reduction and Risk transfer sections above.
Netting
Risk reduction by way of current account set-off is recognised for exposures to creditworthy customers domiciled in Australia and New Zealand only. Customers are required to enter into formal agreements giving Westpac the unfettered right to set-off gross credit and debit balances in their nominated accounts to determine Westpac’s net exposure within each of these two jurisdictions. Cross-border set-offs are not permitted.
Close-out netting is undertaken for off balance sheet financial market transactions with counterparties with whom Westpac has entered into master netting agreements which allow such netting in specified jurisdictions. Close-out netting effectively aggregates pre-settlement risk exposure at time of default, thus reducing overall exposure.
27.2.5 Credit risk concentrations
A concentration of credit risk exists when a number of counterparties are engaged in similar activities and have similar economic characteristics that would cause their ability to meet contractual obligations to be similarly affected by changes in economic or other conditions.
Westpac monitors its credit portfolio to manage risk concentrations. Exposures are actively managed from a portfolio perspective, with risk mitigation techniques used to re-balance the portfolio.
Individual customers or groups of related customers
Westpac has large exposure limits governing the aggregate size of credit exposure normally acceptable to individual customers and groups of related customers. These limits are tiered by customer risk grade.
Specific industries
Exposures to businesses, governments and other financial institutions are classified into a number of industry clusters based on groupings of related Australian and New Zealand Standard Industrial Classification (ANZSIC) codes and are monitored against industry risk appetite limits. The level of industry risk is measured on a dynamic basis.
Individual countries
Westpac has limits governing risks related to individual countries, such as political situations, government policies, economic conditions or other country-specific events, that may adversely affect either a customer’s ability to purchase or transfer currency to meet its obligations to Westpac, or Westpac’s ability to realise its assets in a particular country. Such risks include, but are not limited to, exchange control events, nationalisation, war, disaster, economic meltdown or government failure.
| | |
208 | 2012 WESTPAC GROUP ANNUAL REPORT | |
NOTES TO THE FINANCIAL STATEMENTS
NOTE 27. FINANCIAL RISK (CONTINUED)
The table below sets out the maximum exposure to credit risk (excluding any collateral received) and the credit risk concentrations to which the Group and the Parent Entity are exposed. The total will not reconcile to the Group or Parent Entity’s total assets on the balance sheet as cash, non-financial assets and other financial assets have been excluded from the table below. Investments in subsidiaries and amounts due from subsidiaries have also been excluded from the Parent Entity’s disclosure.
| | Consolidated 2012 | |
| | Trading
Securities | | Other
Financial
Assets
Designated
at Fair Value | | Available-
For-Sale
Securities | | Loans -
Housing
and
Personal | | Loans -
Business | | Derivatives | | Life
Insurance
Assets | | Total (On
Balance
Sheet) | | Credit
Commit-
ments | |
| | $m | | $m | | $m | | $m | | $m | | $m | | $m | | $m | | $m | |
Australia | | | | | | | | | | | | | | | | | | | |
Accommodation, cafes and restaurants | | - | | - | | - | | 166 | | 6,869 | | 30 | | 24 | | 7,089 | | 995 | |
Agriculture, forestry and fishing | | - | | - | | - | | 118 | | 7,565 | | 33 | | - | | 7,716 | | 1,783 | |
Construction | | - | | - | | - | | 421 | | 6,189 | | 35 | | 29 | | 6,674 | | 3,817 | |
Finance and insurance | | 17,941 | | 1,959 | | 2,369 | | 1,583 | | 12,793 | | 26,842 | | 6,098 | | 69,585 | | 16,311 | |
Government, administration and defence | | 18,403 | | 21 | | 18,340 | | 1 | | 1,284 | | 228 | | - | | 38,277 | | 1,304 | |
Manufacturing | | 116 | | - | | - | | 210 | | 10,588 | | 369 | | 215 | | 11,498 | | 7,861 | |
Mining | | 13 | | 45 | | - | | 33 | | 2,071 | | 92 | | 582 | | 2,836 | | 3,025 | |
Property, property services and business services | | 28 | | 17 | | 1 | | 3,156 | | 43,572 | | 791 | | 724 | | 48,289 | | 13,279 | |
Services1 | | 66 | | 23 | | 11 | | 714 | | 8,834 | | 201 | | 133 | | 9,982 | | 5,373 | |
Trade2 | | 32 | | - | | - | | 514 | | 15,411 | | 273 | | 66 | | 16,296 | | 7,111 | |
Transport and storage | | 114 | | 39 | | 316 | | 89 | | 7,652 | | 827 | | 40 | | 9,077 | | 3,059 | |
Utilities3 | | 107 | | 128 | | 170 | | 35 | | 2,681 | | 1,187 | | 140 | | 4,448 | | 2,850 | |
Retail lending | | - | | 120 | | - | | 328,068 | | 41 | | 47 | | - | | 328,276 | | 66,833 | |
Other | | 8 | | - | | 1 | | - | | 2,356 | | 90 | | - | | 2,455 | | 244 | |
Total Australia | | 36,828 | | 2,352 | | 21,208 | | 335,108 | | 127,906 | | 31,045 | | 8,051 | | 562,498 | | 133,845 | |
New Zealand | | | | | | | | | | | | | | | | | | | |
Accommodation, cafes and restaurants | | 2 | | - | | - | | 278 | | 160 | | 1 | | 2 | | 443 | | 69 | |
Agriculture, forestry and fishing | | - | | - | | - | | 503 | | 4,774 | | 58 | | - | | 5,335 | | 494 | |
Construction | | - | | - | | - | | 754 | | 394 | | 1 | | 1 | | 1,150 | | 332 | |
Finance and insurance | | 2,702 | | - | | 470 | | 561 | | 1,119 | | 3,319 | | 151 | | 8,322 | | 1,417 | |
Government, administration and defence | | 440 | | - | | 1,715 | | 5 | | 520 | | 162 | | 27 | | 2,869 | | 722 | |
Manufacturing | | - | | - | | - | | 386 | | 1,509 | | 74 | | 3 | | 1,972 | | 1,054 | |
Mining | | - | | - | | - | | 21 | | 369 | | 5 | | - | | 395 | | 143 | |
Property, property services and business services | | 60 | | - | | - | | 4,372 | | 4,876 | | 171 | | 3 | | 9,482 | | 1,622 | |
Services1 | | - | | - | | - | | 1,222 | | 879 | | 25 | | - | | 2,126 | | 855 | |
Trade2 | | - | | - | | - | | 1,015 | | 1,630 | | 35 | | - | | 2,680 | | 1,211 | |
Transport and storage | | - | | - | | - | | 202 | | 836 | | 58 | | - | | 1,096 | | 478 | |
Utilities3 | | 8 | | - | | - | | 69 | | 982 | | 288 | | 2 | | 1,349 | | 1,270 | |
Retail lending | | - | | - | | - | | 20,737 | | 41 | | - | | - | | 20,778 | | 5,393 | |
Other | | - | | - | | - | | - | | 31 | | 192 | | - | | 223 | | 248 | |
Total New Zealand | | 3,212 | | - | | 2,185 | | 30,125 | | 18,120 | | 4,389 | | 189 | | 58,220 | | 15,308 | |
1 Services includes education, health and community services, cultural and recreational services and personal and other services.
2 Trade includes wholesale trade and retail trade.
3 Utilities includes electricity, gas and water and communication services.
| | |
| 2012 WESTPAC GROUP ANNUAL REPORT | 209 |
NOTE 27. FINANCIAL RISK (CONTINUED)
| | Consolidated 2012 | |
| | Trading
Securities | | Other
Financial
Assets
Designated
at Fair Value | | Available-
For-Sale
Securities | | Loans -
Housing
and
Personal | | Loans -
Business | | Derivatives | | Life
Insurance
Assets | | Total (On
Balance
Sheet) | | Credit
Commit-
ments | |
| | $m | | $m | | $m | | $m | | $m | | $m | | $m | | $m | | $m | |
Other overseas | | | | | | | | | | | | | | | | | | | |
Accommodation, cafes and restaurants | | - | | - | | - | | 4 | | 152 | | - | | - | | 156 | | 23 | |
Agriculture, forestry and fishing | | - | | - | | - | | - | | 68 | | - | | - | | 68 | | 88 | |
Construction | | - | | - | | - | | 7 | | 65 | | - | | - | | 72 | | 83 | |
Finance and insurance | | 4,460 | | 288 | | 389 | | 1 | | 725 | | 54 | | - | | 5,917 | | 1,211 | |
Government, administration and defence | | 103 | | - | | 685 | | - | | 8 | | - | | - | | 796 | | 42 | |
Manufacturing | | - | | - | | - | | 2 | | 1,785 | | - | | - | | 1,787 | | 2,346 | |
Mining | | - | | - | | - | | 1 | | 249 | | - | | - | | 250 | | 909 | |
Property, property services and business services | | - | | - | | - | | 55 | | 317 | | - | | - | | 372 | | 173 | |
Services1 | | - | | 24 | | - | | 4 | | 69 | | - | | - | | 97 | | 20 | |
Trade2 | | - | | - | | - | | 9 | | 1,757 | | - | | - | | 1,766 | | 1,522 | |
Transport and storage | | - | | - | | - | | 3 | | 548 | | 1 | | - | | 552 | | 90 | |
Utilities3 | | - | | - | | 5 | | - | | 161 | | - | | - | | 166 | | 97 | |
Retail lending | | - | | - | | - | | 933 | | 55 | | - | | - | | 988 | | 121 | |
Other | | - | | - | | - | | 11 | | 31 | | - | | - | | 42 | | - | |
Total other overseas | | 4,563 | | 312 | | 1,079 | | 1,030 | | 5,990 | | 55 | | - | | 13,029 | | 6,725 | |
Other risk concentrations | | | | | | | | | | | | | | | | | | | |
Amounts due from financial institutions | | | | | | | | | | | | | | | | 10,228 | | | |
Regulatory deposits | | | | | | | | | | | | | | | | 1,893 | | | |
Total gross credit risk | | 44,603 | | 2,664 | | 24,472 | | 366,263 | | 152,016 | | 35,489 | | 8,240 | | 645,868 | | 155,878 | |
1 Services includes education, health and community services, cultural and recreational services and personal and other services.
2 Trade includes wholesale trade and retail trade.
3 Utilities includes electricity, gas and water and communication services.
| | |
210 | 2012 WESTPAC GROUP ANNUAL REPORT | |
NOTES TO THE FINANCIAL STATEMENTS
NOTE 27. FINANCIAL RISK (CONTINUED)
| | Consolidated 2011 | |
| | Trading
Securities | | Other
Financial
Assets
Designated
at Fair Value | | Available-
For-Sale
Securities | | Loans -
Housing
and
Personal | | Loans -
Business | | Derivatives | | Life
Insurance
Assets | | Total (On
Balance
Sheet) | | Credit
Commit-
ments | |
| | $m | | $m | | $m | | $m | | $m | | $m | | $m | | $m | | $m | |
| | | | | | | | | | | | | | | | | | | |
Australia | | | | | | | | | | | | | | | | | | | |
Accommodation, cafes and restaurants | | - | | - | | - | | 147 | | 6,974 | | 33 | | 17 | | 7,171 | | 861 | |
Agriculture, forestry and fishing | | 1 | | - | | - | | 108 | | 7,682 | | 45 | | - | | 7,836 | | 1,718 | |
Construction | | 4 | | - | | - | | 376 | | 5,708 | | 75 | | - | | 6,163 | | 3,446 | |
Finance and insurance | | 23,735 | | 2,182 | | 574 | | 1,397 | | 14,528 | | 39,812 | | 6,001 | | 88,229 | | 16,666 | |
Government, administration and defence | | 13,622 | | 23 | | 14,552 | | - | | 781 | | 974 | | - | | 29,952 | | 1,448 | |
Manufacturing | | 136 | | 17 | | 56 | | 204 | | 11,135 | | 475 | | 133 | | 12,156 | | 7,825 | |
Mining | | 24 | | 45 | | - | | 32 | | 1,456 | | 152 | | 571 | | 2,280 | | 2,464 | |
Property, property services and business services | | 13 | | 103 | | 81 | | 2,941 | | 42,618 | | 770 | | 695 | | 47,221 | | 11,599 | |
Services1 | | 55 | | 20 | | 9 | | 644 | | 8,292 | | 79 | | 94 | | 9,193 | | 4,956 | |
Trade2 | | 160 | | - | | - | | 496 | | 15,598 | | 378 | | 108 | | 16,740 | | 6,647 | |
Transport and storage | | 159 | | 26 | | 168 | | 78 | | 6,599 | | 474 | | 69 | | 7,573 | | 3,062 | |
Utilities3 | | 84 | | 56 | | 213 | | 28 | | 2,553 | | 788 | | 82 | | 3,804 | | 2,783 | |
Retail lending | | - | | 229 | | - | | 316,747 | | 30 | | 228 | | - | | 317,234 | | 67,694 | |
Other | | - | | - | | - | | 11 | | 1,319 | | 80 | | - | | 1,410 | | 1,385 | |
Total Australia | | 37,993 | | 2,701 | | 15,653 | | 323,209 | | 125,273 | | 44,363 | | 7,770 | | 556,962 | | 132,554 | |
New Zealand | | | | | | | | | | | | | | | | | | | |
Accommodation, cafes and restaurants | | - | | - | | - | | 274 | | 147 | | 1 | | 1 | | 423 | | 66 | |
Agriculture, forestry and fishing | | 1 | | - | | - | | 501 | | 4,450 | | 86 | | 2 | | 5,040 | | 576 | |
Construction | | - | | - | | - | | 753 | | 294 | | 4 | | 1 | | 1,052 | | 570 | |
Finance and insurance | | 1,918 | | - | | 206 | | 462 | | 1,010 | | 3,665 | | 110 | | 7,371 | | 1,396 | |
Government, administration and defence | | 2,714 | | - | | 1,022 | | 4 | | 446 | | 191 | | 24 | | 4,401 | | 768 | |
Manufacturing | | 11 | | - | | - | | 396 | | 1,292 | | 139 | | 3 | | 1,841 | | 1,086 | |
Mining | | - | | - | | - | | 20 | | 211 | | 3 | | - | | 234 | | 274 | |
Property, property services and business services | | 40 | | - | | - | | 4,252 | | 4,959 | | 148 | | - | | 9,399 | | 1,347 | |
Services1 | | 36 | | - | | - | | 1,236 | | 866 | | 12 | | 2 | | 2,152 | | 1,000 | |
Trade2 | | - | | - | | - | | 1,019 | | 1,832 | | 30 | | - | | 2,881 | | 1,152 | |
Transport and storage | | 1 | | - | | - | | 191 | | 874 | | 71 | | - | | 1,137 | | 407 | |
Utilities3 | | 29 | | - | | - | | 67 | | 753 | | 206 | | 3 | | 1,058 | | 1,193 | |
Retail lending | | - | | - | | - | | 19,680 | | - | | - | | - | | 19,680 | | 5,140 | |
Other | | - | | - | | - | | - | | 120 | | 152 | | - | | 272 | | 9 | |
Total New Zealand | | 4,750 | | - | | 1,228 | | 28,855 | | 17,254 | | 4,708 | | 146 | | 56,941 | | 14,984 | |
1 Services includes education, health and community services, cultural and recreational services and personal and other services.
2 Trade includes wholesale trade and retail trade.
3 Utilities includes electricity, gas and water and communication services.
2012 WESTPAC GROUP ANNUAL REPORT | 211 |
NOTE 27. FINANCIAL RISK (CONTINUED)
| | Consolidated 2011 | |
| | Trading
Securities | | Other
Financial
Assets
Designated
at Fair Value | | Available-
For-Sale
Securities | | Loans -
Housing
and
Personal | | Loans -
Business | | Derivatives | | Life
Insurance
Assets | | Total (On
Balance
Sheet) | | Credit
Commit-
ments | |
| | $m | | $m | | $m | | $m | | $m | | $m | | $m | | $m | | $m | |
| | | | | | | | | | | | | | | | | | | |
Other overseas | | | | | | | | | | | | | | | | | | | |
Accommodation, cafes and restaurants | | - | | - | | - | | 4 | | 155 | | - | | - | | 159 | | 27 | |
Agriculture, forestry and fishing | | - | | - | | - | | 1 | | 23 | | - | | - | | 24 | | 11 | |
Construction | | - | | - | | - | | 5 | | 128 | | - | | - | | 133 | | 86 | |
Finance and insurance | | 5,226 | | 259 | | 492 | | - | | 525 | | 73 | | - | | 6,575 | | 1,508 | |
Government, administration and defence | | 2 | | - | | 695 | | - | | 14 | | - | | - | | 711 | | 48 | |
Manufacturing | | - | | - | | - | | 4 | | 1,233 | | - | | - | | 1,237 | | 2,079 | |
Mining | | - | | - | | - | | 1 | | 136 | | - | | - | | 137 | | 1,019 | |
Property, property services and business services | | - | | - | | - | | 69 | | 379 | | - | | - | | 448 | | 180 | |
Services1 | | - | | - | | - | | 4 | | 43 | | - | | - | | 47 | | 10 | |
Trade2 | | - | | - | | - | | 10 | | 1,186 | | - | | - | | 1,196 | | 1,398 | |
Transport and storage | | - | | - | | - | | 4 | | 859 | | 1 | | - | | 864 | | 114 | |
Utilities3 | | - | | - | | 7 | | - | | 190 | | - | | - | | 197 | | 55 | |
Retail lending | | - | | - | | - | | 969 | | 65 | | - | | - | | 1,034 | | 167 | |
Other | | - | | - | | - | | 14 | | 42 | | - | | - | | 56 | | 4 | |
Total other overseas | | 5,228 | | 259 | | 1,194 | | 1,085 | | 4,978 | | 74 | | - | | 12,818 | | 6,706 | |
Other risk concentrations | | | | | | | | | | | | | | | | | | | |
Amounts due from financial institutions | | | | | | | | | | | | | | | | 8,551 | | | |
Regulatory deposits | | | | | | | | | | | | | | | | 1,739 | | | |
Total gross credit risk | | 47,971 | | 2,960 | | 18,075 | | 353,149 | | 147,505 | | 49,145 | | 7,916 | | 637,011 | | 154,244 | |
1 Services includes education, health and community services, cultural and recreational services and personal and other services.
2 Trade includes wholesale trade and retail trade.
3 Utilities includes electricity, gas and water and communication services.
212 | 2012 WESTPAC GROUP ANNUAL REPORT | |
NOTES TO THE FINANCIAL STATEMENTS
NOTE 27. FINANCIAL RISK (CONTINUED)
| | Parent Entity 2012 | |
| | Trading
Securities | | Other
Financial
Assets
Designated
at Fair Value | | Available-
For-Sale
Securities | | Loans -
Housing
and
Personal | | Loans -
Business | | Derivatives | | Life
Insurance
Assets | | Total (On
Balance
Sheet) | | Credit
Commit-
ments | |
| | $m | | $m | | $m | | $m | | $m | | $m | | $m | | $m | | $m | |
| | | | | | | | | | | | | | | | | | | |
Australia | | | | | | | | | | | | | | | | | | | |
Accommodation, cafes and restaurants | | - | | - | | - | | 166 | | 6,761 | | 30 | | - | | 6,957 | | 995 | |
Agriculture, forestry and fishing | | - | | - | | - | | 118 | | 7,337 | | 33 | | - | | 7,488 | | 1,783 | |
Construction | | - | | - | | - | | 421 | | 5,440 | | 35 | | - | | 5,896 | | 3,817 | |
Finance and insurance | | 17,941 | | 1,396 | | 2,336 | | 1,583 | | 12,625 | | 26,553 | | - | | 62,434 | | 16,311 | |
Government, administration and defence | | 18,402 | | - | | 18,341 | | 1 | | 1,185 | | 228 | | - | | 38,157 | | 1,304 | |
Manufacturing | | 116 | | - | | - | | 210 | | 10,257 | | 369 | | - | | 10,952 | | 7,861 | |
Mining | | 13 | | - | | - | | 33 | | 1,932 | | 92 | | - | | 2,070 | | 3,025 | |
Property, property services and business services | | 28 | | 5 | | - | | 3,156 | | 42,533 | | 791 | | - | | 46,513 | | 13,278 | |
Services1 | | 66 | | 23 | | 11 | | 714 | | 7,981 | | 201 | | - | | 8,996 | | 5,371 | |
Trade2 | | 32 | | - | | - | | 514 | | 14,838 | | 273 | | - | | 15,657 | | 7,081 | |
Transport and storage | | 114 | | 16 | | 67 | | 89 | | 7,156 | | 827 | | - | | 8,269 | | 3,058 | |
Utilities3 | | 107 | | 126 | | 154 | | 35 | | 2,647 | | 1,187 | | - | | 4,256 | | 2,850 | |
Retail Lending | | - | | 120 | | - | | 324,588 | | 41 | | 47 | | - | | 324,796 | | 66,833 | |
Other | | 8 | | - | | 1 | | - | | 2,336 | | 90 | | - | | 2,435 | | 244 | |
Total Australia | | 36,827 | | 1,686 | | 20,910 | | 331,628 | | 123,069 | | 30,756 | | - | | 544,876 | | 133,811 | |
New Zealand | | | | | | | | | | | | | | | | | | | |
Accommodation, cafes and restaurants | | 2 | | - | | - | | - | | - | | 1 | | - | | 3 | | - | |
Agriculture, forestry and fishing | | - | | - | | - | | - | | - | | 58 | | - | | 58 | | 35 | |
Construction | | - | | - | | - | | - | | - | | 1 | | - | | 1 | | 40 | |
Finance and insurance | | 1,263 | | - | | - | | - | | 3 | | 3,312 | | - | | 4,578 | | 65 | |
Government, administration and defence | | 252 | | - | | - | | - | | 1 | | 162 | | - | | 415 | | 85 | |
Manufacturing | | - | | - | | - | | - | | 30 | | 74 | | - | | 104 | | 135 | |
Mining | | - | | - | | - | | - | | 1 | | 5 | | - | | 6 | | - | |
Property, property services and business services | | 60 | | - | | - | | - | | 76 | | 171 | | - | | 307 | | 26 | |
Services1 | | - | | - | | - | | - | | - | | 25 | | - | | 25 | | 20 | |
Trade2 | | - | | - | | - | | - | | 6 | | 35 | | - | | 41 | | 201 | |
Transport and storage | | - | | - | | - | | - | | 18 | | 58 | | - | | 76 | | 112 | |
Utilities3 | | 8 | | - | | - | | - | | 162 | | 288 | | - | | 458 | | 244 | |
Retail lending | | - | | - | | - | | - | | 2 | | - | | - | | 2 | | 1 | |
Other | | - | | - | | - | | - | | 9 | | 192 | | - | | 201 | | 1 | |
Total New Zealand | | 1,585 | | - | | - | | - | | 308 | | 4,382 | | - | | 6,275 | | 965 | |
1 Services includes education, health and community services, cultural and recreational services and personal and other services.
2 Trade includes wholesale trade and retail trade.
3 Utilities includes electricity, gas and water and communication services.
2012 WESTPAC GROUP ANNUAL REPORT | 213 |
NOTE 27. FINANCIAL RISK (CONTINUED)
| | Parent Entity 2012 | |
| | Trading
Securities | | Other
Financial
Assets
Designated
at Fair Value | | Available-
For-Sale
Securities | | Loans -
Housing
and
Personal | | Loans -
Business | | Derivatives | | Life
Insurance
Assets | | Total (On
Balance
Sheet) | | Credit
Commit-
ments | |
| | $m | | $m | | $m | | $m | | $m | | $m | | $m | | $m | | $m | |
| | | | | | | | | | | | | | | | | | | |
Other overseas | | | | | | | | | | | | | | | | | | | |
Accommodation, cafes and restaurants | | - | | - | | - | | 4 | | 127 | | - | | - | | 131 | | 22 | |
Agriculture, forestry and fishing | | - | | - | | - | | - | | 62 | | - | | - | | 62 | | 61 | |
Construction | | - | | - | | - | | 4 | | 46 | | - | | - | | 50 | | 75 | |
Finance and insurance | | 4,460 | | 217 | | 129 | | - | | 651 | | 46 | | - | | 5,503 | | 1,208 | |
Government, administration and defence | | 103 | | - | | - | | - | | 7 | | - | | - | | 110 | | 42 | |
Manufacturing | | - | | - | | - | | 2 | | 1,661 | | - | | - | | 1,663 | | 2,195 | |
Mining | | - | | - | | - | | - | | 226 | | - | | - | | 226 | | 864 | |
Property, property services and business services | | - | | - | | - | | 16 | | 169 | | - | | - | | 185 | | 163 | |
Services1 | | - | | - | | - | | 1 | | 53 | | - | | - | | 54 | | 19 | |
Trade2 | | - | | - | | - | | 4 | | 1,628 | | - | | - | | 1,632 | | 1,459 | |
Transport and storage | | - | | - | | - | | 2 | | 410 | | - | | - | | 412 | | 68 | |
Utilities3 | | - | | - | | - | | - | | 134 | | - | | - | | 134 | | 96 | |
Retail lending | | - | | - | | - | | 397 | | 33 | | - | | - | | 430 | | 34 | |
Other | | - | | - | | - | | 7 | | 28 | | - | | - | | 35 | | - | |
Total other overseas | | 4,563 | | 217 | | 129 | | 437 | | 5,235 | | 46 | | - | | 10,627 | | 6,306 | |
Other risk concentrations | | | | | | | | | | | | | | | | | | | |
Amounts due from financial institutions | | | | | | | | | | | | | | | | 7,328 | | | |
Regulatory deposits | | | | | | | | | | | | | | | | 1,773 | | | |
Total gross credit risk | | 42,975 | | 1,903 | | 21,039 | | 332,065 | | 128,612 | | 35,184 | | - | | 570,879 | | 141,082 | |
1 Services includes education, health and community services, cultural and recreational services and personal and other services.
2 Trade includes wholesale trade and retail trade.
3 Utilities includes electricity, gas and water and communication services.
214 | 2012 WESTPAC GROUP ANNUAL REPORT | |
NOTES TO THE FINANCIAL STATEMENTS |
|
NOTE 27. FINANCIAL RISK (CONTINUED)
| Parent Entity 2011 |
| Trading
Securities | Other
Financial
Assets
Designated
at Fair Value | Available-
For-Sale
Securities | Loans -
Housing
and
Personal | Loans -
Business | Derivatives | Life
Insurance
Assets | Total (On
Balance
Sheet) | Credit
Commitments |
| $m | $m | $m | $m | $m | $m | $m | $m | $m |
Australia | | | | | | | | | |
Accommodation, cafes and restaurants | - | - | - | 145 | 6,613 | 33 | - | 6,791 | 843 |
Agriculture, forestry and fishing | 1 | - | - | 107 | 7,278 | 45 | - | 7,431 | 1,713 |
Construction | 4 | - | - | 373 | 5,423 | 75 | - | 5,875 | 3,439 |
Finance and insurance | 23,637 | 1,523 | 549 | 1,379 | 14,264 | 39,569 | - | 80,921 | 16,652 |
Government, administration and defence | 13,622 | - | 14,551 | - | 753 | 974 | - | 29,900 | 1,448 |
Manufacturing | 136 | 17 | - | 202 | 10,798 | 475 | - | 11,628 | 7,815 |
Mining | 24 | - | - | 32 | 1,416 | 152 | - | 1,624 | 2,464 |
Property, property services and business services | 13 | 85 | 58 | 2,913 | 40,730 | 770 | - | 44,569 | 11,464 |
Services1 | 55 | 20 | 9 | 637 | 8,086 | 79 | - | 8,886 | 4,906 |
Trade2 | 159 | - | - | 492 | 14,741 | 378 | - | 15,770 | 6,585 |
Transport and storage | 135 | 26 | 13 | 77 | 6,367 | 474 | - | 7,092 | 3,062 |
Utilities3 | 84 | 55 | 100 | 28 | 2,535 | 788 | - | 3,590 | 2,783 |
Retail Lending | - | 229 | - | 313,923 | 30 | 228 | - | 314,410 | 67,687 |
Other | - | - | - | 3 | 1,258 | 80 | - | 1,341 | 1,317 |
Total Australia | 37,870 | 1,955 | 15,280 | 320,311 | 120,292 | 44,120 | - | 539,828 | 132,178 |
New Zealand | | | | | | | | | |
Accommodation, cafes and restaurants | - | - | - | - | 2 | 1 | - | 3 | 3 |
Agriculture, forestry and fishing | 1 | - | - | - | 354 | 86 | - | 441 | 150 |
Construction | - | - | - | - | 74 | 4 | - | 78 | 314 |
Finance and insurance | 173 | - | - | - | 734 | 3,645 | - | 4,552 | 1,195 |
Government, administration and defence | 1,901 | - | - | - | 48 | 191 | - | 2,140 | 462 |
Manufacturing | 11 | - | - | - | 584 | 139 | - | 734 | 778 |
Mining | - | - | - | - | 177 | 3 | - | 180 | 262 |
Property, property services and business services | 40 | - | - | - | 1,062 | 148 | - | 1,250 | 229 |
Services1 | 36 | - | - | - | 287 | 12 | - | 335 | 506 |
Trade2 | - | - | - | - | 913 | 30 | - | 943 | 591 |
Transport and storage | 1 | - | - | - | 457 | 71 | - | 529 | 294 |
Utilities3 | 29 | - | - | - | 654 | 206 | - | 889 | 1,125 |
Retail lending | - | - | - | - | - | - | - | - | 7 |
Other | - | - | - | - | 52 | 152 | - | 204 | - |
Total New Zealand | 2,192 | - | - | - | 5,398 | 4,688 | - | 12,278 | 5,916 |
1 Services includes education, health and community services, cultural and recreational services and personal and other services.
2 Trade includes wholesale trade and retail trade.
3 Utilities includes electricity, gas and water and communication services.
| | |
| 2012 WESTPAC GROUP ANNUAL REPORT | 215 |
NOTE 27. FINANCIAL RISK (CONTINUED)
| Parent Entity 2011 |
| Trading
Securities | Other
Financial
Assets
Designated
at Fair Value | Available-
For-Sale
Securities | Loans -
Housing
and
Personal | Loans -
Business | Derivatives | Life
Insurance
Assets | Total (On
Balance
Sheet) | Credit
Commitments |
| $m | $m | $m | $m | $m | $m | $m | $m | $m |
Other overseas | | | | | | | | | |
Accommodation, cafes and restaurants | - | - | - | 4 | 132 | - | - | 136 | 27 |
Agriculture, forestry and fishing | - | - | - | 1 | 13 | - | - | 14 | 1 |
Construction | - | - | - | 2 | 110 | - | - | 112 | 83 |
Finance and insurance | 5,226 | 138 | 143 | - | 488 | 71 | - | 6,066 | 1,506 |
Government, administration and defence | 2 | - | 3 | - | 13 | - | - | 18 | 47 |
Manufacturing | - | - | - | 3 | 1,169 | - | - | 1,172 | 1,920 |
Mining | - | - | - | - | 104 | - | - | 104 | 968 |
Property, property services and business services | - | - | - | 21 | 217 | - | - | 238 | 158 |
Services1 | - | - | - | 1 | 24 | - | - | 25 | 9 |
Trade2 | - | - | - | 4 | 1,067 | - | - | 1,071 | 1,358 |
Transport and storage | - | - | - | 2 | 768 | - | - | 770 | 103 |
Utilities3 | - | - | - | - | 155 | - | - | 155 | 35 |
Retail lending | - | - | - | 440 | 33 | - | - | 473 | 37 |
Other | - | - | - | 11 | 39 | - | - | 50 | - |
Total other overseas | 5,228 | 138 | 146 | 489 | 4,332 | 71 | - | 10,404 | 6,252 |
Other risk concentrations | | | | | | | | | |
Amounts due from financial institutions | | | | | | | | 5,237 | |
Regulatory deposits | | | | | | | | 1,649 | |
Total gross credit risk | 45,290 | 2,093 | 15,426 | 320,800 | 130,022 | 48,879 | - | 569,396 | 144,346 |
1 Services includes education, health and community services, cultural and recreational services and personal and other services.
2 Trade includes wholesale trade and retail trade.
3 Utilities includes electricity, gas and water and communication services.
| | |
216 | 2012 WESTPAC GROUP ANNUAL REPORT | |
NOTES TO THE FINANCIAL STATEMENTS |
|
NOTE 27. FINANCIAL RISK (CONTINUED)
27.2.6 Credit quality of financial assets
The tables below segregate the financial assets of the Group and Parent Entity between financial assets that are neither past due nor impaired, past due but not impaired and impaired. Non-financial assets of the Group and Parent Entity are excluded from the tables below and therefore the total will not reconcile to total assets on the balance sheets.
An asset is considered to be past due when any payment under the contractual terms has been missed. The amount included as past due is the entire contractual balance, rather than the overdue portion. The breakdown in the tables below does not always align with the underlying basis by which credit risk is managed within Westpac.
Financial assets of the Group at 30 September can be disaggregated as follows:
| Consolidated 2012 |
| Neither Past | Past Due | | | | | Total |
| Due Nor | But Not | | | Impairment | | Carrying |
| Impaired | Impaired | Impaired | Total | Provision | | Value |
| $m | $m | $m | $m | $m | | $m |
Cash and balances with central banks | 12,523 | - | - | 12,523 | - | | 12,523 |
Receivables due from other financial institutions | 10,228 | - | - | 10,228 | - | | 10,228 |
Derivative financial instruments | 35,489 | - | - | 35,489 | - | | 35,489 |
Trading securities | 44,603 | - | - | 44,603 | - | | 44,603 |
Other financial assets designated at fair value | 2,664 | - | - | 2,664 | - | | 2,664 |
Available-for-sale securities | 24,471 | - | 1 | 24,472 | - | | 24,472 |
Loans: | | | | | | | |
Loans – housing and personal | 353,094 | 12,538 | 631 | 366,263 | (1,042 | ) | 365,221 |
Loans – business | 144,266 | 3,995 | 3,755 | 152,016 | (2,792 | ) | 149,224 |
Life insurance assets | 8,237 | 3 | - | 8,240 | - | | 8,240 |
Regulatory deposits with central banks overseas | 1,893 | - | - | 1,893 | - | | 1,893 |
Other financial assets | 4,273 | 41 | 11 | 4,325 | - | | 4,325 |
Total | 641,741 | 16,577 | 4,398 | 662,716 | (3,834 | ) | 658,882 |
| Consolidated 2011 |
| Neither Past | Past Due | | | | | Total |
| Due Nor | But Not | | | Impairment | | Carrying |
| Impaired | Impaired | Impaired | Total | Provision | | Value |
| $m | $m | $m | $m | $m | | $m |
Cash and balances with central banks | 16,258 | - | - | 16,258 | - | | 16,258 |
Receivables due from other financial institutions | 8,551 | - | - | 8,551 | - | | 8,551 |
Derivative financial instruments | 49,145 | - | - | 49,145 | - | | 49,145 |
Trading securities | 47,971 | - | - | 47,971 | - | | 47,971 |
Other financial assets designated at fair value | 2,960 | - | - | 2,960 | - | | 2,960 |
Available-for-sale securities | 18,042 | - | 33 | 18,075 | - | | 18,075 |
Loans: | | | | | | | |
Loans – housing and personal | 338,490 | 14,042 | 617 | 353,149 | (1,180 | ) | 351,969 |
Loans – business | 139,636 | 3,870 | 3,999 | 147,505 | (2,865 | ) | 144,640 |
Life insurance assets | 7,909 | 7 | - | 7,916 | - | | 7,916 |
Regulatory deposits with central banks overseas | 1,739 | - | - | 1,739 | - | | 1,739 |
Other financial assets | 4,130 | 51 | 13 | 4,194 | (12 | ) | 4,182 |
Total | 634,831 | 17,970 | 4,662 | 657,463 | (4,057 | ) | 653,406 |
| | |
| 2012 WESTPAC GROUP ANNUAL REPORT | 217 |
NOTE 27. FINANCIAL RISK (CONTINUED)
Financial assets of the Parent Entity at 30 September can be disaggregated as follows:
| Parent Entity 2012 |
| Neither Past | Past Due | | | | | Total |
| Due Nor | But Not | | | Impairment | | Carrying |
| Impaired | Impaired | Impaired | Total | Provision | | Value |
| $m | $m | $m | $m | $m | | $m |
Cash and balances with central banks | 10,993 | - | - | 10,993 | - | | 10,993 |
Receivables due from other financial institutions | 7,328 | - | - | 7,328 | - | | 7,328 |
Derivative financial instruments | 35,184 | - | - | 35,184 | - | | 35,184 |
Trading securities | 42,975 | - | - | 42,975 | - | | 42,975 |
Other financial assets designated at fair value | 1,903 | - | - | 1,903 | - | | 1,903 |
Available-for-sale securities | 21,039 | - | - | 21,039 | - | | 21,039 |
Loans: | | | | | | | |
Loans – housing and personal | 320,632 | 10,960 | 473 | 332,065 | (837 | ) | 331,228 |
Loans – business | 122,193 | 3,410 | 3,009 | 128,612 | (2,351 | ) | 126,261 |
Life insurance assets | - | - | - | - | - | | - |
Regulatory deposits with central banks overseas | 1,773 | - | - | 1,773 | - | | 1,773 |
Due from subsidiaries | 92,740 | - | - | 92,740 | - | | 92,740 |
Other financial assets | 3,721 | 35 | 8 | 3,764 | - | | 3,764 |
Total | 660,481 | 14,405 | 3,490 | 678,376 | (3,188 | ) | 675,188 |
| Parent Entity 2011 |
| Neither Past | Past Due | | | | | Total |
| Due Nor | But Not | | | Impairment | | Carrying |
| Impaired | Impaired | Impaired | Total | Provision | | Value |
| $m | $m | $m | $m | $m | | $m |
Cash and balances with central banks | 14,750 | - | - | 14,750 | - | | 14,750 |
Receivables due from other financial institutions | 5,237 | - | - | 5,237 | - | | 5,237 |
Derivative financial instruments | 48,879 | - | - | 48,879 | - | | 48,879 |
Trading securities | 45,290 | - | - | 45,290 | - | | 45,290 |
Other financial assets designated at fair value | 2,093 | - | - | 2,093 | - | | 2,093 |
Available-for-sale securities | 15,394 | - | 32 | 15,426 | - | | 15,426 |
Loans: | | | | | | | |
Loans – housing and personal | 307,667 | 12,699 | 434 | 320,800 | (958 | ) | 319,842 |
Loans – business | 123,385 | 3,253 | 3,384 | 130,022 | (2,485 | ) | 127,537 |
Life insurance assets | - | - | - | - | - | | - |
Regulatory deposits with central banks overseas | 1,649 | - | - | 1,649 | - | | 1,649 |
Due from subsidiaries | 56,938 | - | - | 56,938 | - | | 56,938 |
Other financial assets | 3,640 | 46 | 11 | 3,697 | (10 | ) | 3,687 |
Total | 624,922 | 15,998 | 3,861 | 644,781 | (3,453 | ) | 641,328 |
| | |
218 | 2012 WESTPAC GROUP ANNUAL REPORT | |
| NOTES TO THE FINANCIAL STATEMENTS |
| |
NOTE 27. FINANCIAL RISK (CONTINUED)
27.2.7 Financial assets that are neither past due nor impaired
The credit quality of financial assets of the Group that are neither past due nor impaired have been assessed by reference to the credit risk rating system adopted internally:
| | Consolidated | |
| | 2012 | | 2011 | |
| | Strong | | Good/
Satisfactory | | Weak | | Total | | Strong | | Good/
Satisfactory | | Weak | | Total | |
| | $m | | $m | | $m | | $m | | $m | | $m | | $m | | $m | |
Cash and balances with central banks | | 12,523 | | - | | - | | 12,523 | | 16,258 | | - | | - | | 16,258 | |
Receivables due from other financial institutions | | 10,228 | | - | | - | | 10,228 | | 8,551 | | - | | - | | 8,551 | |
Derivative financial instruments | | 34,611 | | 781 | | 97 | | 35,489 | | 47,984 | | 1,080 | | 81 | | 49,145 | |
Trading securities1 | | 44,553 | | 50 | | - | | 44,603 | | 47,908 | | 62 | | 1 | | 47,971 | |
Other financial assets designated at fair value1 | | 2,450 | | 210 | | 4 | | 2,664 | | 2,615 | | 343 | | 2 | | 2,960 | |
Available-for-sale securities1 | | 23,777 | | 694 | | - | | 24,471 | | 17,320 | | 699 | | 23 | | 18,042 | |
Loans: | | | | | | | | | | | | | | | | | |
Loans – housing and personal2 | | n/a | | 353,094 | | n/a | | 353,094 | | n/a | | 338,490 | | n/a | | 338,490 | |
Loans – business | | 53,790 | | 81,736 | | 8,740 | | 144,266 | | 52,793 | | 78,068 | | 8,775 | | 139,636 | |
Life insurance assets1 | | 8,143 | | 94 | | - | | 8,237 | | 7,800 | | 109 | | - | | 7,909 | |
Regulatory deposits with central banks overseas | | 1,706 | | 125 | | 62 | | 1,893 | | 1,583 | | 96 | | 60 | | 1,739 | |
Other financial assets3 | | 3,085 | | 1,182 | | 6 | | 4,273 | | 2,812 | | 1,311 | | 7 | | 4,130 | |
Total financial assets | | 194,866 | | 437,966 | | 8,909 | | 641,741 | | 205,624 | | 420,258 | | 8,949 | | 634,831 | |
1 Trading securities, other financial assets designated at fair value, available-for-sale securities and life insurance assets of $7,550 million (2011: $7,192 million) that do not have assigned credit ratings have been included in the strong category. These assets primarily include assets held in regulated life insurance entities with specific investment policies regarding the quality of the assets invested in and listed equity securities and are therefore considered strong credit quality.
2 Loans – housing and personal do not qualify as strong credit quality based on Westpac’s CRGs. This class of loans are also not deemed to be weak as non-performing loans would be categorised as past due or impaired.
3 Other financial assets includes accrued interest of $1,226 million (2011: $1,359 million) which is allocated to the relevant credit quality classifications in proportion to and to correspond with the loan balances to which it relates. Securities sold not yet delivered of $1,841 million (2011: $2,038 million) is also included in this balance which is allocated proportionately based on the trading securities balance classifications.
| | |
| 2012 WESTPAC GROUP ANNUAL REPORT | 219 |
NOTE 27. FINANCIAL RISK (CONTINUED)
| | Parent Entity | |
| | 2012 | | 2011 | |
| | Strong | | Good/
Satisfactory | | Weak | | Total | | Strong | | Good/
Satisfactory | | Weak | | Total | |
| | $m | | $m | | $m | | $m | | $m | | $m | | $m | | $m | |
Cash and balances with central banks | | 10,993 | | - | | - | | 10,993 | | 14,750 | | - | | - | | 14,750 | |
Receivables due from other financial institutions | | 7,328 | | - | | - | | 7,328 | | 5,237 | | - | | - | | 5,237 | |
Derivative financial instruments | | 34,306 | | 781 | | 97 | | 35,184 | | 47,719 | | 1,079 | | 81 | | 48,879 | |
Trading securities1 | | 42,925 | | 50 | | - | | 42,975 | | 45,227 | | 62 | | 1 | | 45,290 | |
Other financial assets designated at fair value1 | | 1,779 | | 120 | | 4 | | 1,903 | | 1,852 | | 239 | | 2 | | 2,093 | |
Available-for-sale securities1 | | 21,036 | | 3 | | - | | 21,039 | | 15,391 | | 3 | | - | | 15,394 | |
Loans: | | | | | | | | | | | | | | | | | |
Loans – housing and personal2 | | n/a | | 320,632 | | n/a | | 320,632 | | n/a | | 307,667 | | n/a | | 307,667 | |
Loans – business | | 47,156 | | 67,759 | | 7,278 | | 122,193 | | 50,484 | | 65,434 | | 7,467 | | 123,385 | |
Regulatory deposits with central banks overseas | | 1,705 | | 6 | | 62 | | 1,773 | | 1,583 | | 6 | | 60 | | 1,649 | |
Due from subsidiaries | | 92,740 | | - | | - | | 92,740 | | 56,938 | | - | | - | | 56,938 | |
Other financial assets3 | | 2,685 | | 1,031 | | 5 | | 3,721 | | 2,429 | | 1,205 | | 6 | | 3,640 | |
Total financial assets | | 262,653 | | 390,382 | | 7,446 | | 660,481 | | 241,610 | | 375,695 | | 7,617 | | 624,922 | |
1 Trading securities and other financial assets designated at fair value of $193 million (2011: $169 million) that do not have assigned credit ratings have been included in the strong category.
2 Loans – housing and personal do not qualify as strong credit quality based on Westpac’s CRGs. This class of loans are also not deemed to be weak as non-performing loans would be categorised as past due or impaired.
3 Other financial assets includes accrued interest of $1,065 million (2011: $1,250 million) which is allocated to the relevant credit quality classifications in proportion to and to correspond with the loan balances to which it relates. Securities sold not yet delivered of $1,841 million (2011: $2,038 million) is also included in this balance which is allocated proportionately based on the trading securities balance classifications.
The following analysis shows our assessment of the coverage provided by collateral held in support of financial assets that are neither past due nor impaired. The estimated realisable value of collateral held is based on a combination of:
§ formal valuations currently held in respect of such collateral; and
§ management’s assessment of the estimated realisable value of all collateral held given its experience with similar types of assets in similar situations and the circumstances peculiar to the subject collateral.
This analysis also takes into consideration any other relevant knowledge available to management at the time. It is our practice to obtain updated valuations when either management considers that it cannot satisfactorily estimate a realisable value or when it is determined to be necessary to move to a forced sale of the collateral.
In the table below, a financial asset that is neither past due nor impaired is deemed to be ‘fully secured’ where the ratio of the asset amount to our current estimated net present value of the realisable collateral is less than or equal to 100%. Such assets are deemed to be ‘partially secured’ when this ratio exceeds 100% but not more than 150%, and ‘unsecured’ when either no security is held (e.g. can include credit cards, personal loans, and exposure to highly rated corporate entities) or where the secured loan to estimated recoverable value exceeds 150%.
| | Consolidated | |
| | 2012 | | 2011 | |
| | Loans – | | | | | | Loans – | | | | | |
| | Housing and | | Loans – | | | | Housing and | | Loans – | | | |
| | Personal | | Business | | Total | | Personal | | Business | | Total | |
| | % | | % | | % | | % | | % | | % | |
Fully secured | | 94.7 | | 55.0 | | 83.2 | | 93.8 | | 56.0 | | 82.8 | |
Partially secured | | 1.7 | | 24.5 | | 8.3 | | 2.6 | | 25.7 | | 9.3 | |
Unsecured | | 3.6 | | 20.5 | | 8.5 | | 3.6 | | 18.3 | | 7.9 | |
Total | | 100.0 | | 100.0 | | 100.0 | | 100.0 | | 100.0 | | 100.0 | |
| | |
220 | 2012 WESTPAC GROUP ANNUAL REPORT | |
| NOTES TO THE FINANCIAL STATEMENTS |
| |
NOTE 27. FINANCIAL RISK (CONTINUED)
| | Parent Entity | |
| | 2012 | | 2011 | |
| | Loans – | | | | | | Loans – | | | | | |
| | Housing and | | Loans – | | | | Housing and | | Loans – | | | |
| | Personal | | Business | | Total | | Personal | | Business | | Total | |
| | % | | % | | % | | % | | % | | % | |
Fully secured | | 95.8 | | 54.5 | | 84.4 | | 94.8 | | 53.9 | | 83.1 | |
Partially secured | | 0.8 | | 25.7 | | 7.6 | | 1.8 | | 27.0 | | 9.0 | |
Unsecured | | 3.4 | | 19.8 | | 8.0 | | 3.4 | | 19.1 | | 7.9 | |
Total | | 100.0 | | 100.0 | | 100.0 | | 100.0 | | 100.0 | | 100.0 | |
27.2.8 Financial assets that are past due, but not impaired
An age analysis of financial assets that are past due, but not impaired is set out in the table below. For the purposes of this analysis an asset is considered to be past due when any payment under the contractual terms has been missed. The amount included is the entire contractual amount, rather than the overdue amount.
The Group expends considerable effort in monitoring overdue assets. Assets may be overdue for a number of reasons, including late payments or incomplete documentation. Late payment may be influenced by factors such as the holiday periods and the timing of weekends.
Financial assets that were past due, but not impaired can be disaggregated based on days overdue at 30 September as follows:
| | Consolidated | |
| | 2012 | | 2011 | |
| | 1–5 days | | 6–89 days | | 90+ days | | Total | | 1–5 days | | 6–89 days | | 90+ days | | Total | |
| | $m | | $m | | $m | | $m | | $m | | $m | | $m | | $m | |
Loans | | | | | | | | | | | | | | | | | |
Loans – housing and personal | | 3,249 | | 7,697 | | 1,592 | | 12,538 | | 4,155 | | 8,341 | | 1,546 | | 14,042 | |
Loans – business | | 1,671 | | 1,199 | | 1,125 | | 3,995 | | 861 | | 2,053 | | 956 | | 3,870 | |
Life insurance assets | | - | | 3 | | - | | 3 | | - | | 7 | | - | | 7 | |
Other financial assets | | 12 | | 22 | | 7 | | 41 | | 14 | | 30 | | 7 | | 51 | |
Total | | 4,932 | | 8,921 | | 2,724 | | 16,577 | | 5,030 | | 10,431 | | 2,509 | | 17,970 | |
| | Parent Entity | |
| | 2012 | | 2011 | |
| | 1–5 days | | 6–89 days | | 90+ days | | Total | | 1–5 days | | 6–89 days | | 90+ days | | Total | |
| | $m | | $m | | $m | | $m | | $m | | $m | | $m | | $m | |
Loans | | | | | | | | | | | | | | | | | |
Loans – housing and personal | | 2,776 | | 6,734 | | 1,450 | | 10,960 | | 3,673 | | 7,561 | | 1,465 | | 12,699 | |
Loans – business | | 1,563 | | 841 | | 1,006 | | 3,410 | | 701 | | 1,730 | | 822 | | 3,253 | |
Life insurance assets | | - | | - | | - | | - | | - | | - | | - | | - | |
Other financial assets | | 11 | | 18 | | 6 | | 35 | | 13 | | 26 | | 7 | | 46 | |
Total | | 4,350 | | 7,593 | | 2,462 | | 14,405 | | 4,387 | | 9,317 | | 2,294 | | 15,998 | |
The following analysis shows our assessment of the coverage provided by collateral held in support of financial assets that are past due but not impaired. The estimated realisable value of collateral held is based on a combination of:
§ formal valuations currently held in respect of such collateral; and
§ management’s assessment of the estimated realisable value of all collateral held given its experience with similar types of assets in similar situations and the circumstances peculiar to the subject collateral.
This analysis also takes into consideration any other relevant knowledge available to management at the time. It is our practice to obtain updated valuations when either management considers that it cannot satisfactorily estimate a realisable value or when it is determined to be necessary to move to a forced sale of the collateral.
| | |
| 2012 WESTPAC GROUP ANNUAL REPORT | 221 |
NOTE 27. FINANCIAL RISK (CONTINUED)
In the table below, a financial asset that is past due but not impaired is deemed to be ‘fully secured’ where the ratio of the asset amount to our current estimated net present value of the realisable collateral is less than or equal to 100%. Such assets are deemed to be ‘partially secured’ when this ratio exceeds 100% but not more than 150%, and ‘unsecured’ when either no security is held (e.g. can include credit cards, personal loans, and exposure to highly rated corporate entities) or where the secured loan to estimated recoverable value exceeds 150%.
| | Consolidated | |
| | 2012 | | 2011 | |
| | Loans – | | | | | | Loans – | | | | | |
| | Housing and | | Loans – | | | | Housing and | | Loans – | | | |
| | Personal | | Business | | Total | | Personal | | Business | | Total | |
| | % | | % | | % | | % | | % | | % | |
Fully secured | | 92.6 | | 52.0 | | 82.8 | | 90.1 | | 48.6 | | 81.2 | |
Partially secured | | 2.2 | | 24.4 | | 7.5 | | 1.8 | | 23.8 | | 6.5 | |
Unsecured | | 5.2 | | 23.6 | | 9.7 | | 8.1 | | 27.6 | | 12.3 | |
Total | | 100.0 | | 100.0 | | 100.0 | | 100.0 | | 100.0 | | 100.0 | |
| | Parent Entity | |
| | 2012 | | 2011 | |
| | Loans – | | | | | | Loans – | | | | | |
| | Housing and | | Loans – | | | | Housing and | | Loans – | | | |
| | Personal | | Business | | Total | | Personal | | Business | | Total | |
| | % | | % | | % | | % | | % | | % | |
Fully secured | | 94.7 | | 51.1 | | 84.3 | | 93.8 | | 47.7 | | 84.4 | |
Partially secured | | 0.5 | | 24.9 | | 6.3 | | 0.1 | | 23.5 | | 4.9 | |
Unsecured | | 4.8 | | 24.0 | | 9.4 | | 6.1 | | 28.8 | | 10.7 | |
Total | | 100.0 | | 100.0 | | 100.0 | | 100.0 | | 100.0 | | 100.0 | |
27.2.9 Items 90 days past due, or otherwise in default, but well secured and not impaired
These include financial assets that are:
§ currently 90 days or more past due but well secured;
§ assets that were, but are no longer 90 days past due however are yet to satisfactorily demonstrate sustained improvement to allow reclassification; and
§ other assets in default, but well secured and not impaired, such as where an order for bankruptcy or similar legal action has been instituted in respect of credit obligations (e.g. appointment of an Administrator or Receiver).
| | Consolidated | |
| | Australia | | New Zealand | | Other Overseas | | Total | |
| | 2012 | | 2011 | | 2010 | | 2012 | | 2011 | | 2010 | | 2012 | | 2011 | | 2010 | | 2012 | | 2011 | | 2010 | |
| | $m | | $m | | $m | | $m | | $m | | $m | | $m | | $m | | $m | | $m | | $m | | $m | |
Gross amount | | 2,528 | | 2,840 | | 2,943 | | 121 | | 138 | | 148 | | 37 | | 46 | | 52 | | 2,686 | | 3,024 | | 3,143 | |
| | |
222 | 2012 WESTPAC GROUP ANNUAL REPORT | |
NOTES TO THE FINANCIAL STATEMENTS
NOTE 27. FINANCIAL RISK (CONTINUED)
27.2.10 Impaired loans
Financial assets assessed as impaired
The gross amount of impaired loans, along with the provision for impairment, by class of asset at 30 September, is summarised in the tables below:
| | | | | | Consolidated | | | | | |
| | | | 2012 | | | | | | 2011 | | | |
| | Loans – | | | | | | Loans – | | | | | |
| | Housing and | | Loans – | | | | Housing and | | Loans – | | | |
| | Personal | | Business | | Total | | Personal | | Business | | Total | |
| | $m | | $m | | $m | | $m | | $m | | $m | |
Individually impaired | | | | | | | | | | | | | |
Gross amount | | 297 | | 3,658 | | 3,955 | | 335 | | 3,865 | | 4,200 | |
Impairment provision | | (128 | ) | (1,342 | ) | (1,470 | ) | (146 | ) | (1,315 | ) | (1,461 | ) |
Carrying amount | | 169 | | 2,316 | | 2,485 | | 189 | | 2,550 | | 2,739 | |
Collectively impaired | | | | | | | | | | | | | |
Gross amount | | 334 | | 97 | | 431 | | 282 | | 134 | | 416 | |
Impairment provision | | (151 | ) | (20 | ) | (171 | ) | (161 | ) | (41 | ) | (202 | ) |
Carrying amount | | 183 | | 77 | | 260 | | 121 | | 93 | | 214 | |
Total gross amount | | 631 | | 3,755 | | 4,386 | | 617 | | 3,999 | | 4,616 | |
Total impairment provision | | (279 | ) | (1,362 | ) | (1,641 | ) | (307 | ) | (1,356 | ) | (1,663 | ) |
Total carrying amount | | 352 | | 2,393 | | 2,745 | | 310 | | 2,643 | | 2,953 | |
| | | | | | Parent Entity | | | | | |
| | | | 2012 | | | | | | 2011 | | | |
| | Loans – | | | | | | Loans – | | | | | |
| | Housing and | | Loans – | | | | Housing and | | Loans – | | | |
| | Personal | | Business | | Total | | Personal | | Business | | Total | |
| | $m | | $m | | $m | | $m | | $m | | $m | |
Individually impaired | | | | | | | | | | | | | |
Gross amount | | 196 | | 2,920 | | 3,116 | | 204 | | 3,269 | | 3,473 | |
Impairment provision | | (79 | ) | (1,148 | ) | (1,227 | ) | (92 | ) | (1,159 | ) | (1,251 | ) |
Carrying amount | | 117 | | 1,772 | | 1,889 | | 112 | | 2,110 | | 2,222 | |
Collectively impaired | | | | | | | | | | | | | |
Gross amount | | 277 | | 89 | | 366 | | 230 | | 115 | | 345 | |
Impairment provision | | (130 | ) | (19 | ) | (149 | ) | (121 | ) | (11 | ) | (132 | ) |
Carrying amount | | 147 | | 70 | | 217 | | 109 | | 104 | | 213 | |
Total gross amount | | 473 | | 3,009 | | 3,482 | | 434 | | 3,384 | | 3,818 | |
Total impairment provision | | (209 | ) | (1,167 | ) | (1,376 | ) | (213 | ) | (1,170 | ) | (1,383 | ) |
Total carrying amount | | 264 | | 1,842 | | 2,106 | | 221 | | 2,214 | | 2,435 | |
| | |
| 2012 WESTPAC GROUP ANNUAL REPORT | 223 |
NOTE 27. FINANCIAL RISK (CONTINUED)
The following analysis shows our assessment of the coverage provided by collateral held in support of impaired financial assets. The estimated realisable value of collateral held is based on a combination of:
§ formal valuations currently held in respect of such collateral; and
§ management’s assessment of the estimated realisable value of all collateral held given its experience with similar types of assets in similar situations and the circumstances peculiar to the subject collateral.
This analysis also takes into consideration any other relevant knowledge available to management at the time. It is our practice to obtain updated valuations when either management considers that it cannot satisfactorily estimate a realisable value or when it is determined to be necessary to move to a forced sale of the collateral.
In the table below, an individually impaired financial asset is deemed to be ‘fully secured’ where the ratio of the impaired asset amount to our current estimated net present value of realisable collateral is less than or equal to 100%. Such assets are deemed to be ‘partially secured’ when this ratio exceeds 100% but not more than 150%, and ‘unsecured’ when either no security is held (e.g. can include credit cards, personal loans and exposure to highly rated corporate entities) or where the secured loan to recoverable value exceeds 150%.
| | | | | | Consolidated | | | | | |
| | | | 2012 | | | | | | 2011 | | | |
| | Loans – | | | | | | Loans – | | | | | |
| | Housing and | | Loans – | | | | Housing and | | Loans – | | | |
| | Personal | | Business | | Total | | Personal | | Business | | Total | |
| | % | | % | | % | | % | | % | | % | |
Fully secured | | 62.0 | | 19.8 | | 25.9 | | 43.7 | | 13.3 | | 17.4 | |
Partially secured | | 10.0 | | 27.9 | | 25.3 | | 12.5 | | 25.1 | | 23.4 | |
Unsecured | | 28.0 | | 52.3 | | 48.8 | | 43.8 | | 61.6 | | 59.2 | |
Total | | 100.0 | | 100.0 | | 100.0 | | 100.0 | | 100.0 | | 100.0 | |
| | | | | | Parent Entity | | | | | |
| | | | 2012 | | | | | | 2011 | | | |
| | Loans – | | | | | | Loans – | | | | | |
| | Housing and | | Loans – | | | | Housing and | | Loans – | | | |
| | Personal | | Business | | Total | | Personal | | Business | | Total | |
| | % | | % | | % | | % | | % | | % | |
Fully secured | | 66.0 | | 17.0 | | 23.7 | | 45.0 | | 14.2 | | 17.7 | |
Partially secured | | 4.7 | | 26.7 | | 23.7 | | 0.9 | | 22.3 | | 19.9 | |
Unsecured | | 29.3 | | 56.3 | | 52.6 | | 54.1 | | 63.5 | | 62.4 | |
Total | | 100.0 | | 100.0 | | 100.0 | | 100.0 | | 100.0 | | 100.0 | |
Impaired loans comprise non-performing loans, overdrafts, personal loans, revolving credit facilities greater than 90 days past due and restructured loans.
Non-performing loans
Non-performing loans are loans with an impaired internal risk grade, excluding restructured assets. These were attributed to the following geographical segments:
| | Consolidated | |
| | Australia | | New Zealand | | Other Overseas | | Total | |
| | 2012 | | 2011 | | 2010 | | 2012 | | 2011 | | 2010 | | 2012 | | 2011 | | 2010 | | 2012 | | 2011 | | 2010 | |
| | $m | | $m | | $m | | $m | | $m | | $m | | $m | | $m | | $m | | $m | | $m | | $m | |
Gross amount | | 3,212 | | 3,437 | | 3,456 | | 743 | | 736 | | 691 | | 79 | | 114 | | 93 | | 4,034 | | 4,287 | | 4,240 | |
Impairment provision | | (1,199 | ) | (1,215 | ) | (1,359 | ) | (224 | ) | (212 | ) | (281 | ) | (40 | ) | (60 | ) | (37 | ) | (1,463 | ) | (1,487 | ) | (1,677 | ) |
Net | | 2,013 | | 2,222 | | 2,097 | | 519 | | 524 | | 410 | | 39 | | 54 | | 56 | | 2,571 | | 2,800 | | 2,563 | |
| | |
224 | 2012 WESTPAC GROUP ANNUAL REPORT | |
NOTES TO THE FINANCIAL STATEMENTS
NOTE 27. FINANCIAL RISK (CONTINUED)
Overdrafts, personal loans and revolving credit facilities greater than 90 days past due
Overdrafts, personal loans and revolving credit facilities greater than 90 days past due for the Group were attributed to the following geographical segments:
| | Consolidated | |
| | Australia | | New Zealand | | Other Overseas | | Total | |
| | 2012 | | 2011 | | 2010 | | 2012 | | 2011 | | 2010 | | 2012 | | 2011 | | 2010 | | 2012 | | 2011 | | 2010 | |
| | $m | | $m | | $m | | $m | | $m | | $m | | $m | | $m | | $m | | $m | | $m | | $m | |
Gross amount | | 186 | | 186 | | 197 | | 12 | | 13 | | 15 | | 1 | | 1 | | 1 | | 199 | | 200 | | 213 | |
Impairment provision | | (126 | ) | (138 | ) | (141 | ) | (7 | ) | (8 | ) | (13 | ) | (1 | ) | (1 | ) | (1 | ) | (134 | ) | (147 | ) | (155 | ) |
Net | | 60 | | 48 | | 56 | | 5 | | 5 | | 2 | | - | | - | | - | | 65 | | 53 | | 58 | |
Restructured financial assets
Assets are deemed to be restructured financial assets when the original contractual terms have been formally modified to provide for concessions of interest or principal for reasons related to the financial difficulties of the customer.
Restructured financial assets for the Group were attributed to the following geographical segments:
| | Consolidated | |
| | Australia | | New Zealand | | Other Overseas | | Total | |
| | 2012 | | 2011 | | 2010 | | 2012 | | 2011 | | 2010 | | 2012 | | 2011 | | 2010 | | 2012 | | 2011 | | 2010 | |
| | $m | | $m | | $m | | $m | | $m | | $m | | $m | | $m | | $m | | $m | | $m | | $m | |
Gross amount | | 43 | | 21 | | 25 | | - | | 1 | | - | | 110 | | 107 | | 107 | | 153 | | 129 | | 132 | |
Impairment provision | | (19 | ) | (11 | ) | (12 | ) | - | | - | | - | | (25 | ) | (18 | ) | (20 | ) | (44 | ) | (29 | ) | (32 | ) |
Net | | 24 | | 10 | | 13 | | - | | 1 | | - | | 85 | | 89 | | 87 | | 109 | | 100 | | 100 | |
Restructured financial assets of the parent entity as at 30 September 2012 were:
| | | | | | | | | | | | | | | | | | | | | | 2012 | | 2011 | |
| | | | | | | | | | | | | | | | | | | | | | $m | | $m | |
Gross amount | | | | | | | | | | | | | | | | | | | | | | 150 | | 126 | |
Impairment provision | | | | | | | | | | | | | | | | | | | | | | (44 | ) | (28 | ) |
Net | | | | | | | | | | | | | | | | | | | | | | 106 | | 98 | |
The following table summarises the interest received and forgone on impaired and restructured financial assets:
| | | | | | | | | | | | | | Consolidated 2012 | |
| | | | | | | | | | | | | | Australia | | Overseas | | Total | |
| | | | | | | | | | | | | | $m | | $m | | $m | |
Interest received | | | | | | | | | | | | | | 31 | | 18 | | 49 | |
Interest forgone | | | | | | | | | | | | | | 283 | | 15 | | 298 | |
27.3 Funding and liquidity risk management
Liquidity risk is the risk that we will be unable to fund increases in assets or meet our obligations as they become due, without incurring unacceptable losses. This could potentially arise as a result of mismatched cash flows generated by the Group’s banking business. Liquidity risk is managed through our BRMC-approved liquidity framework.
Responsibility for liquidity management is delegated to Treasury, under the oversight of ALCO. Treasury manages liquidity on a daily basis and submits monthly reports to ALCO and quarterly reports to the BRMC. Monthly reports are provided to APRA. Treasury is also responsible for monitoring and managing our funding base so that it is prudently maintained and adequately diversified.
Our liquidity risk management framework models our ability to fund under both normal conditions and during a crisis situation, with models run globally and for specific geographical regions: Australia, New Zealand and offshore. This approach is designed to ensure that our funding framework is sufficiently flexible to accommodate a wide range of market conditions. The global liquidity management framework is reviewed annually. The annual review encompasses the funding scenarios modelled, the modelling approach, wholesale funding capacity, limit determination and minimum holdings of liquid assets. The liquidity framework is reviewed by ALCO prior to approval by the BRMC.
| | |
| 2012 WESTPAC GROUP ANNUAL REPORT | 225 |
NOTE 27. FINANCIAL RISK (CONTINUED)
Treasury also undertakes an annual funding review that outlines the funding strategy for the coming year. This review encompasses trends in global markets, peer analysis, wholesale funding capacity, expected funding requirements and a funding risk analysis. This strategy is continuously reviewed to take account of changing market conditions, investor sentiment and estimations of asset and liability growth rates. The annual funding strategy is reviewed and supported by ALCO prior to approval by the BRMC.
We maintain a contingency funding plan that details the broad actions to be taken in response to severe disruptions in our ability to fund some or all of our activities in a timely manner and at a reasonable cost. This document is reviewed annually and defines a committee of senior executives to manage a crisis and allocates responsibility to individuals for key tasks.
27.3.1 Sources of liquidity
Sources of liquidity are regularly reviewed to maintain a wide diversification by currency, geography, product and term. Sources include, but are not limited to:
§ deposits;
§ debt issues;
§ proceeds from sale of marketable securities;
§ repurchase agreements with central banks;
§ principal repayments on loans;
§ interest income;
§ fee income; and
§ an interbank deposit agreement.
The Group does not rely on committed funding lines as a source of liquidity.
Wholesale funding
The Group monitors the composition and stability of its funding base so it is maintained within the Group’s funding liquidity risk appetite. This includes a target of greater than 75% for the stable funding ratio. Stable funding includes customer deposits, wholesale term funding with residual maturity greater than 12 months, equity and securitisation.
The composition and stability of the Group’s funding base has strengthened over the last 12 months. The stable funding ratio has increased by six percentage points to 83%, reflecting increased customer deposits and reduced short-term wholesale funding. Customer deposits increased by $37.6 billion over the year and comprised 58% of the Group’s total funding at 30 September 2012. Long-term wholesale funding comprised 16% of the Group’s total funding, in line with 2011, and short-term wholesale funding (including long-term wholesale funding with less than 12 months to maturity) comprised 17%, down from 23% in 2011.
In 2012, the Group raised a total of $33 billion in long-term wholesale funding, up from $25 billion in 2011. The increase reflects the refinancing of a larger amount of redemptions in 2012 and the replacement of a portion of short-term wholesale funding with more stable long-term funding. The duration of the total long-term wholesale funding portfolio has again improved, with new issuance during 2012 having a weighted average maturity of over four years for the fourth successive year.
Maintaining a diverse funding base and ensuring the Group has capacity and flexibility to access a wide range of funding markets, debt investors and products is an important part of managing liquidity risk.
Over the last 12 months, the Group’s funding profile in global wholesale markets has supported issuance in Australia, New Zealand, United States, Japan, Europe, Asia, Switzerland and United Kingdom. The Group is the only Australian bank to issue in SEC registered format in the United States enabling it to access both institutional and retail investors. In addition, the Group accessed the domestic securitisation market twice during the year for approximately $2.5 billion of funding.
Borrowings and outstandings from existing debt programmes and issuing shelves at 30 September 2012 can be found in various notes to the financial statements including Note 17, Note 18, Note 22 and Note 23.
In Management’s opinion, liquidity is sufficient to meet our present requirements.
| | |
226 | 2012 WESTPAC GROUP ANNUAL REPORT | |
NOTES TO THE FINANCIAL STATEMENTS
NOTE 27. FINANCIAL RISK (CONTINUED)
Credit ratings
As at 30 September 2012 the Parent Entity’s credit ratings were:
| | | | 2012 | | |
| | Short-term | | Long-term | | Outlook |
Standard & Poor’s | | A–1+ | | AA– | | Stable |
Moody’s Investors Services | | P–1 | | Aa2 | | Stable |
Fitch Ratings | | F1+ | | AA– | | Stable |
As of 30 September 2012, approximately 35% of the Group’s total net funding originated from wholesale funding markets, principally in Australia, the United States, Europe and Japan. Investors in these markets have historically relied significantly upon credit ratings issued by independent credit rating organisations in making their investment decisions. If Westpac’s credit ratings were to decline from current levels, the Group’s borrowing costs and capacity may be adversely affected. A downgrade in Westpac’s credit ratings from current levels is likely to require the Group to pay higher interest rates than we do currently on our wholesale borrowings. This would increase the Group’s funding costs and could reduce net interest margins. In addition, the Group’s borrowing capacity could be diminished, which may adversely affect the Group’s ability to fund the growth of our balance sheet or reduce our liquidity.
A credit rating is not a recommendation to buy, sell or hold Westpac securities. Such ratings are subject to revision or withdrawal at any time by the assigning rating agency. Investors are cautioned to evaluate each rating independently of any other rating.
Liquid assets
Treasury holds a portfolio of high quality liquid assets as a buffer against unforeseen funding requirements. These assets are 100% eligible for repurchase agreements with the Reserve Bank of Australia or another central bank and are held in cash, Government, State Government and highly rated investment grade paper. The level of liquid asset holdings is reviewed frequently and is consistent with both the requirements of the balance sheet and market conditions.
Liquid assets that qualify as eligible collateral for repurchase agreements with an applicable central bank (including internal securitisation) have increased by $6.8 billion to $110.2 billion over the last 12 months, as we focussed on strengthening our liquidity position. This has provided flexibility to the Group to be selective in its timing of executing wholesale issuances.
WIB also has holdings of trading securities which arise from its daily business operations. These assets are typically high quality investment grade names and stock is generally very liquid. While these assets are excluded from the Group’s prudential liquidity portfolio, we do consider them as a source of funds in our crisis scenario analysis.
A summary of liquid asset holdings is as follows:
| | 2012 | | | 2011 | |
| | Actual | | Average | | | Actual | | Average | |
| | $m | | $m | | | $m | | $m | |
Cash | | 9,057 | | 7,981 | | | 12,935 | | 1,965 | |
Receivables due from other financial institutions | | 2,026 | | 1,648 | | | 3,167 | | 2,503 | |
Trading securities | | 32,680 | | 36,083 | | | 32,123 | | 37,314 | |
Available-for-sale securities | | 22,462 | | 19,401 | | | 21,393 | | 12,735 | |
Loans1 | | 43,108 | | 35,917 | | | 33,384 | | 33,323 | |
Regulatory deposits with central banks | | 841 | | 394 | | | 413 | | 329 | |
Total liquid assets | | 110,174 | | 101,424 | | | 103,415 | | 88,169 | |
1 Loans are self-originated AAA rated mortgage backed securities which are eligible for repurchase with the Reserve Bank of Australia and Reserve Bank of New Zealand.
| | |
| 2012 WESTPAC GROUP ANNUAL REPORT | 227 |
NOTE 27. FINANCIAL RISK (CONTINUED)
27.3.2 Liquidity reporting
Scenario analysis
In fulfilling our obligations under APRA’s liquidity prudential standard, the Group performs scenario analysis on a daily basis. The ‘going concern’ and ‘crisis’ scenarios present the maturity profiles of cash flows, based on assumptions agreed with APRA.
The ‘going concern’ model measures our liquidity requirements under normal business conditions. Wholesale debt maturities are added to planned net asset growth to provide an estimate of the wholesale funding task across a range of time horizons. The cumulative liquidity mismatch is managed within a Board approved limit structure; with limits set at intervals from one week, to twelve months.
The ‘crisis’ scenario measures liquidity requirements during the first week of a name-specific crisis. The crisis model reflects normal model flows plus expected sources and applications of funds under crisis conditions. Under a crisis scenario Westpac is expected to experience large customer and wholesale outflows against which liquid assets are held to ensure continued solvency. In this scenario, the cumulative mismatch must be positive out to five business days.
Liquidity review
The table below outlines the review performed in managing our liquidity:
Frequency | Liquidity report |
| |
Daily | § Produced by Finance |
| § Reviewed by FMTR1 |
| § Monitored within Treasury |
| |
Monthly | § Submitted to the BBRC2 |
| § Submitted to ALCO |
| § Submitted to APRA |
| |
Quarterly | § Submitted to the BRMC |
1 FMTR is Westpac’s Financial Markets and Treasury Risk Division.
2 BBRC is the Banking Book Risk Committee, a sub-committee of MARCO, responsible for oversight of liquidity and interest rate risk mismatches in the banking book.
27.3.3 Market developments
In late 2010, the BCBS released the final text of Basel III. The framework introduces two new liquidity measures; the Liquidity Coverage Ratio (LCR) and the Net Stable Funding Ratio (NSFR). The LCR is scheduled to be introduced from 1 January 2015 and the NSFR from 1 January 2018. Both liquidity measures are subject to an observation and review period prior to implementation and, as such, are potentially subject to modification.
APRA has released draft prudential standards regarding the implementation of the Basel III liquidity framework in Australia but, until the final standards are released, the full extent of the impact on the Group is uncertain. Notwithstanding the uncertain requirements, Westpac expects to continue to increase its holding of collateral that is eligible under the RBA committed secured liquidity facility.
| | |
228 | 2012 WESTPAC GROUP ANNUAL REPORT | |
NOTES TO THE FINANCIAL STATEMENTS
NOTE 27. FINANCIAL RISK (CONTINUED)
27.3.4 Contractual maturity of financial liabilities
The tables below present cash flows associated with financial liabilities including derivative liabilities, payable at the balance sheet date, by remaining contractual maturity. The amounts disclosed in the table are the contractual undiscounted cash flows, whereas the Group manages inherent liquidity risk based on expected cash flows.
Cash flows associated with liabilities include both principal payments as well as fixed or variable interest payments incorporated into the relevant coupon period. Principal payments reflect the earliest contractual maturity date. Derivative liabilities designed for hedging purposes are expected to be held for their remaining contractual lives, and reflect gross cash flows derived as the fixed rate and/or the expected variable rate applied to the notional principal over the remaining contractual term and where relevant includes the receipt and payment of the notional amount under the contract.
Foreign exchange obligations have been translated to Australian dollars using the closing spot rates at the end of the reporting period.
The balances in the tables below will not necessarily agree to amounts presented on the face of the balance sheet as amounts in the table incorporate cash flows on an undiscounted basis and include both principal and associated future interest payments.
Trading liabilities and certain other liabilities designated at fair value through profit or loss are not all managed for liquidity purposes on the basis of their contractual maturity. The liabilities that we manage based on their contractual maturity are presented on a contractual undiscounted basis in the tables below:
| | Consolidated 2012 | |
| | | | Over | | Over | | Over | | | | | |
| | Up to | | 1 Month to | | 3 Months to | | 1 Year to | | Over | | | |
| | 1 Month | | 3 Months | | 1 Year | | 5 Years | | 5 Years | | Total | |
| | $m | | $m | | $m | | $m | | $m | | $m | |
Liabilities | | | | | | | | | | | | | |
Payables due to other financial institutions | | 6,100 | | 980 | | 49 | | 445 | | - | | 7,574 | |
Deposits | | 229,158 | | 76,518 | | 78,380 | | 16,302 | | 745 | | 401,103 | |
Debt issues and acceptances | | 8,603 | | 14,266 | | 33,074 | | 93,803 | | 11,155 | | 160,901 | |
Other financial liabilities | | 2,116 | | 466 | | 2,094 | | - | | - | | 4,676 | |
Trading liabilities and other financial liabilities designated at fair value | | 9,555 | | 1 | | 31 | | 262 | | 159 | | 10,008 | |
Derivative financial instruments: | | | | | | | | | | | | | |
Held for trading | | 28,852 | | - | | - | | - | | - | | 28,852 | |
Held for hedging purposes (net settled) | | 72 | | 186 | | 903 | | 2,367 | | 955 | | 4,483 | |
Held for hedging purposes (gross settled): | | | | | | | | | | | | | |
Cash outflow | | 1,555 | | 6,091 | | 9,679 | | 25,481 | | 3,612 | | 46,418 | |
Cash inflow | | (1,396 | ) | (5,406 | ) | (6,461 | ) | (20,142 | ) | (2,979 | ) | (36,384 | ) |
Total liabilities excluding loan capital | | 284,615 | | 93,102 | | 117,749 | | 118,518 | | 13,647 | | 627,631 | |
Loan capital1 | | 3,130 | | 76 | | 1,818 | | 4,062 | | 1,128 | | 10,214 | |
Total undiscounted financial liabilities | | 287,745 | | 93,178 | | 119,567 | | 122,580 | | 14,775 | | 637,845 | |
Total contingent liabilities and commitments | | | | | | | | | | | | | |
Commitments to extend credit | | 139,809 | | - | | - | | - | | - | | 139,809 | |
Other commitments | | 98 | | - | | - | | - | | - | | 98 | |
Total undiscounted contingent liabilities and commitments | | 139,907 | | - | | - | | - | | - | | 139,907 | |
1 Where the terms of loan capital instruments include contingent settlement clauses, amounts due have been disclosed as up to one month.
| | |
| 2012 WESTPAC GROUP ANNUAL REPORT | 229 |
NOTE 27. FINANCIAL RISK (CONTINUED)
| | Consolidated 2011 | |
| | | | Over | | Over | | Over | | | | | |
| | Up to | | 1 Month to | | 3 Months to | | 1 Year to | | Over | | | |
| | 1 Month | | 3 Months | | 1 Year | | 5 Years | | 5 Years | | Total | |
| | $m | | $m | | $m | | $m | | $m | | $m | |
Liabilities | | | | | | | | | | | | | |
Payables due to other financial institutions | | 13,103 | | 1,054 | | 253 | | 3 | | 100 | | 14,513 | |
Deposits | | 213,577 | | 75,804 | | 75,450 | | 10,704 | | 975 | | 376,510 | |
Debt issues and acceptances | | 11,574 | | 15,338 | | 47,490 | | 91,026 | | 14,064 | | 179,492 | |
Other financial liabilities | | 1,661 | | 1,029 | | 4,628 | | - | | - | | 7,318 | |
Trading liabilities and other financial liabilities designated at fair value | | 8,894 | | 26 | | 16 | | 461 | | 408 | | 9,805 | |
Derivative financial instruments: | | | | | | | | | | | | | |
Held for trading | | 32,126 | | - | | - | | - | | - | | 32,126 | |
Held for hedging purposes (net settled) | | 104 | | 156 | | 660 | | 1,552 | | 353 | | 2,825 | |
Held for hedging purposes (gross settled): | | | | | | | | | | | | | |
Cash outflow | | 245 | | 1,902 | | 7,656 | | 24,553 | | 4,489 | | 38,845 | |
Cash inflow | | (125 | ) | (1,241 | ) | (6,131 | ) | (19,714 | ) | (3,616 | ) | (30,827 | ) |
Total liabilities excluding loan capital | | 281,159 | | 94,068 | | 130,022 | | 108,585 | | 16,773 | | 630,607 | |
Loan capital1 | | 2,280 | | 57 | | 2,454 | | 2,494 | | 1,008 | | 8,293 | |
Total undiscounted financial liabilities | | 283,439 | | 94,125 | | 132,476 | | 111,079 | | 17,781 | | 638,900 | |
Total contingent liabilities and commitments | | | | | | | | | | | | | |
Commitments to extend credit | | 136,160 | | - | | - | | - | | - | | 136,160 | |
Other commitments | | 526 | | - | | - | | - | | - | | 526 | |
Total undiscounted contingent liabilities and commitments | | 136,686 | | - | | - | | - | | - | | 136,686 | |
1 Where the terms of loan capital instruments include contingent settlement clauses, amounts due have been disclosed as up to one month.
| | |
230 | 2012 WESTPAC GROUP ANNUAL REPORT | |
NOTES TO THE FINANCIAL STATEMENTS
NOTE 27. FINANCIAL RISK (CONTINUED)
| | Parent Entity 2012 |
| | Up to
1 Month | | Over
1 Month to
3 Months | | Over
3 Months to
1 Year | | Over
1 Year to
5 Years | | Over
5 Years | | | Total |
| | $m | | $m | | $m | | $m | | $m | | | $m |
Liabilities | | | | | | | | | | | | | |
Payables due to other financial institutions | | 6,080 | | 941 | | 49 | | 430 | | - | | | 7,500 |
Deposits | | 207,693 | | 71,021 | | 70,840 | | 14,559 | | 743 | | | 364,856 |
Debt issues and acceptances | | 6,463 | | 11,538 | | 27,817 | | 81,081 | | 9,234 | | | 136,133 |
Other financial liabilities | | 2,079 | | 389 | | 1,747 | | - | | - | | | 4,215 |
Due to subsidiaries | | 93,379 | | - | | - | | - | | - | | | 93,379 |
Trading liabilities and other financial liabilities designated at fair value | | 9,555 | | 1 | | 31 | | 262 | | 159 | | | 10,008 |
Derivative financial instruments: | | | | | | | | | | | | | |
Held for trading | | 29,124 | | - | | - | | - | | - | | | 29,124 |
Held for hedging purposes (net settled) | | 50 | | 182 | | 746 | | 2,295 | | 926 | | | 4,199 |
Held for hedging purposes (gross settled): | | | | | | | | | | | | | |
Cash outflow | | 1,452 | | 4,879 | | 5,252 | | 22,227 | | 3,338 | | | 37,148 |
Cash inflow | | (1,331 | ) | (4,199 | ) | (3,772 | ) | (17,867 | ) | (2,780 | ) | | (29,949) |
Total liabilities excluding loan capital | | 354,544 | | 84,752 | | 102,710 | | 102,987 | | 11,620 | | | 656,613 |
Loan capital1 | | 3,130 | | 76 | | 1,818 | | 4,062 | | 1,128 | | | 10,214 |
Total undiscounted financial liabilities | | 357,674 | | 84,828 | | 104,528 | | 107,049 | | 12,748 | | | 666,827 |
Total contingent liabilities and commitments | | | | | | | | | | | | | |
Commitments to extend credit | | 125,787 | | - | | - | | - | | - | | | 125,787 |
Other commitments | | 98 | | - | | - | | - | | - | | | 98 |
Total undiscounted contingent liabilities and commitments | | 125,885 | | - | | - | | - | | - | | | 125,885 |
1 Where the terms of loan capital instruments include contingent settlement clauses, amounts due have been disclosed as up to one month.
| | |
| 2012 WESTPAC GROUP ANNUAL REPORT | 231 |
NOTE 27. FINANCIAL RISK (CONTINUED)
| | Parent Entity 2011 |
| | Up to
1 Month | | Over
1 Month to
3 Months | | Over
3 Months to
1 Year | | Over
1 Year to
5 Years | | Over
5 Years | | Total |
| | $m | | $m | | $m | | $m | | $m | | $m |
Liabilities | | | | | | | | | | | | |
Payables due to other financial institutions | | 12,988 | | 1,054 | | 253 | | 3 | | 100 | | 14,398 |
Deposits | | 197,704 | | 70,197 | | 69,175 | | 9,054 | | 968 | | 347,098 |
Debt issues and acceptances | | 9,163 | | 9,149 | | 41,737 | | 78,509 | | 11,001 | | 149,559 |
Other financial liabilities | | 1,595 | | 896 | | 4,023 | | - | | - | | 6,514 |
Due to subsidiaries | | 61,782 | | - | | - | | - | | - | | 61,782 |
Trading liabilities and other financial liabilities designated at fair value | | 8,894 | | 26 | | 16 | | 461 | | 408 | | 9,805 |
Derivative financial instruments: | | | | | | | | | | | | |
Held for trading | | 32,388 | | - | | - | | - | | - | | 32,388 |
Held for hedging purposes (net settled) | | 71 | | 140 | | 581 | | 1,499 | | 350 | | 2,641 |
Held for hedging purposes (gross settled): | | | | | | | | | | | | |
Cash outflow | | 99 | | 1,585 | | 6,712 | | 21,118 | | 2,519 | | 32,033 |
Cash inflow | | (27 | ) | (1,004 | ) | (5,431 | ) | (17,106 | ) | (1,919 | ) | (25,487) |
Total liabilities excluding loan capital | | 324,657 | | 82,043 | | 117,066 | | 93,538 | | 13,427 | | 630,731 |
Loan capital1 | | 2,280 | | 57 | | 2,454 | | 2,494 | | 1,008 | | 8,293 |
Total undiscounted financial liabilities | | 326,937 | | 82,100 | | 119,520 | | 96,032 | | 14,435 | | 639,024 |
Total contingent liabilities and commitments | | | | | | | | | | | | |
Commitments to extend credit | | 126,575 | | - | | - | | - | | - | | 126,575 |
Other commitments | | 526 | | - | | - | | - | | - | | 526 |
Total undiscounted contingent liabilities and commitments | | 127,101 | | - | | - | | - | | - | | 127,101 |
1 Where the terms of loan capital instruments include contingent settlement clauses, amounts due have been disclosed as up to one month.
| | |
232 | 2012 WESTPAC GROUP ANNUAL REPORT | |
NOTES TO THE FINANCIAL STATEMENTS
NOTE 27. FINANCIAL RISK (CONTINUED)
27.3.5 Expected maturity
The tables below present the balance sheet based on expected maturity dates. The liability balances in the following tables will not agree to the contractual maturity tables (27.3.4 Contractual maturity of financial liabilities) due to the analysis below being based on expected rather than contractual maturities, the impact of discounting and the exclusion of interest accruals beyond the reporting period. Included in the tables below are equity securities classified as trading securities, available-for-sale investments and life insurance assets that have no specific maturity. These assets have been classified based on the expected period of disposal. Deposits are presented in the table below on a contractual basis, however as part of our normal banking operations we would expect a large proportion of these balances to roll over.
| | Consolidated 2012 | |
| | Due within | | Greater than | | | |
| | 12 Months | | 12 Months | | Total | |
| | $m | | $m | | $m | |
Assets | | | | | | | |
Cash and balances with central banks | | 12,523 | | - | | 12,523 | |
Receivables due from other financial institutions | | 10,228 | | - | | 10,228 | |
Derivative financial instruments | | 23,922 | | 11,567 | | 35,489 | |
Trading securities | | 22,843 | | 21,760 | | 44,603 | |
Other financial assets designated at fair value | | 1,102 | | 1,562 | | 2,664 | |
Available-for-sale securities | | 822 | | 23,650 | | 24,472 | |
Loans (net of provisions) | | 89,931 | | 424,514 | | 514,445 | |
Life insurance assets | | 723 | | 7,517 | | 8,240 | |
Regulatory deposits with central banks overseas | | 225 | | 1,668 | | 1,893 | |
All other assets | | 5,553 | | 14,855 | | 20,408 | |
Total assets | | 167,872 | | 507,093 | | 674,965 | |
Liabilities | | | | | | | |
Payables due to other financial institutions | | 7,131 | | 433 | | 7,564 | |
Deposits | | 380,189 | | 14,802 | | 394,991 | |
Derivative financial instruments | | 25,522 | | 13,413 | | 38,935 | |
Trading liabilities and other financial liabilities designated at fair value | | 9,959 | | 5 | | 9,964 | |
Debt issues and acceptances | | 50,496 | | 97,351 | | 147,847 | |
Life insurance policy liabilities | | 13 | | 7,195 | | 7,208 | |
All other liabilities | | 10,738 | | 1,962 | | 12,700 | |
Total liabilities excluding loan capital | | 484,048 | | 135,161 | | 619,209 | |
Loan capital | | 2,762 | | 6,775 | | 9,537 | |
Total liabilities | | 486,810 | | 141,936 | | 628,746 | |
Net assets/(net liabilities) | | (318,938 | ) | 365,157 | | 46,219 | |
| | |
| 2012 WESTPAC GROUP ANNUAL REPORT | 233 |
NOTE 27. FINANCIAL RISK (CONTINUED)
| | Consolidated 2011 | |
| | Due within | | Greater than | | | |
| | 12 Months | | 12 Months | | Total | |
| | $m | | $m | | $m | |
Assets | | | | | | | |
Cash and balances with central banks | | 16,258 | | - | | 16,258 | |
Receivables due from other financial institutions | | 8,551 | | - | | 8,551 | |
Derivative financial instruments | | 33,375 | | 15,770 | | 49,145 | |
Trading securities | | 23,209 | | 24,762 | | 47,971 | |
Other financial assets designated at fair value | | 1,085 | | 1,875 | | 2,960 | |
Available-for-sale securities | | 1,333 | | 16,742 | | 18,075 | |
Loans (net of provisions) | | 99,511 | | 397,098 | | 496,609 | |
Life insurance assets | | 475 | | 7,441 | | 7,916 | |
Regulatory deposits with central banks overseas | | 914 | | 825 | | 1,739 | |
All other assets | | 6,245 | | 14,759 | | 21,004 | |
Total assets | | 190,956 | | 479,272 | | 670,228 | |
Liabilities | | | | | | | |
Payables due to other financial institutions | | 14,410 | | 102 | | 14,512 | |
Deposits | | 360,352 | | 9,926 | | 370,278 | |
Derivative financial instruments | | 27,956 | | 11,449 | | 39,405 | |
Trading liabilities and other financial liabilities designated at fair value | | 9,156 | | 647 | | 9,803 | |
Debt issues and acceptances | | 68,005 | | 97,926 | | 165,931 | |
Life insurance policy liabilities | | 38 | | 6,964 | | 7,002 | |
All other liabilities | | 9,450 | | 1,866 | | 11,316 | |
Total liabilities excluding loan capital | | 489,367 | | 128,880 | | 618,247 | |
Loan capital | | 4,143 | | 4,030 | | 8,173 | |
Total liabilities | | 493,510 | | 132,910 | | 626,420 | |
Net assets/(net liabilities) | | (302,554 | ) | 346,362 | | 43,808 | |
| | |
234 | 2012 WESTPAC GROUP ANNUAL REPORT | |
NOTES TO THE FINANCIAL STATEMENTS
NOTE 27. FINANCIAL RISK (CONTINUED)
| | Parent Entity 2012 | |
| | Due within | | Greater than | | | | |
| | 12 Months | | 12 Months | | | Total | |
| | $m | | $m | | | $m | |
Assets | | | | | | | | |
Cash and balances with central banks | | 10,993 | | - | | | 10,993 | |
Receivables due from other financial institutions | | 7,328 | | - | | | 7,328 | |
Derivative financial instruments | | 23,625 | | 11,559 | | | 35,184 | |
Trading securities | | 21,453 | | 21,522 | | | 42,975 | |
Other financial assets designated at fair value | | 779 | | 1,124 | | | 1,903 | |
Available-for-sale securities | | 15 | | 21,024 | | | 21,039 | |
Loans (net of provisions) | | 75,957 | | 381,532 | | | 457,489 | |
Due from subsidiaries | | 92,740 | | - | | | 92,740 | |
Investment in subsidiaries | | - | | 4,692 | | | 4,692 | |
Regulatory deposits with central banks overseas | | 106 | | 1,667 | | | 1,773 | |
All other assets | | 4,526 | | 11,963 | | | 16,489 | |
Total assets | | 237,522 | | 455,083 | | | 692,605 | |
Liabilities | | | | | | | | |
Payables due to other financial institutions | | 7,071 | | 419 | | | 7,490 | |
Deposits | | 346,131 | | 13,198 | | | 359,329 | |
Derivative financial instruments | | 25,466 | | 12,337 | | | 37,803 | |
Trading liabilities and other liabilities designated at fair value | | 9,959 | | 5 | | | 9,964 | |
Debt issues and acceptances | | 42,858 | | 81,841 | | | 124,699 | |
Due to subsidiaries | | 93,379 | | - | | | 93,379 | |
All other liabilities | | 9,140 | | 1,501 | | | 10,641 | |
Total liabilities excluding loan capital | | 534,004 | | 109,301 | | | 643,305 | |
Loan capital | | 2,762 | | 6,775 | | | 9,537 | |
Total liabilities | | 536,766 | | 116,076 | | | 652,842 | |
Net assets/(net liabilities) | | (299,244 | ) | 339,007 | | | 39,763 | |
| | |
| 2012 WESTPAC GROUP ANNUAL REPORT | 235 |
NOTE 27. FINANCIAL RISK (CONTINUED)
| | Parent Entity 2011 | |
| | Due within | | Greater than | | | |
| | 12 Months | | 12 Months | | Total | |
| | $m | | $m | | $m | |
Assets | | | | | | | |
Cash and balances with central banks | | 14,750 | | - | | 14,750 | |
Receivables due from other financial institutions | | 5,237 | | - | | 5,237 | |
Derivative financial instruments | | 33,334 | | 15,545 | | 48,879 | |
Trading securities | | 20,699 | | 24,591 | | 45,290 | |
Other financial assets designated at fair value | | 633 | | 1,460 | | 2,093 | |
Available-for-sale securities | | 183 | | 15,243 | | 15,426 | |
Loans (net of provisions) | | 93,065 | | 354,314 | | 447,379 | |
Due from subsidiaries | | 56,938 | | - | | 56,938 | |
Investment in subsidiaries | | - | | 4,927 | | 4,927 | |
Regulatory deposits with central banks overseas | | 829 | | 820 | | 1,649 | |
All other assets | | 5,300 | | 12,164 | | 17,464 | |
Total assets | | 230,968 | | 429,064 | | 660,032 | |
Liabilities | | | | | | | |
Payables due to other financial institutions | | 14,295 | | 102 | | 14,397 | |
Deposits | | 333,049 | | 8,408 | | 341,457 | |
Derivative financial instruments | | 27,876 | | 10,654 | | 38,530 | |
Trading liabilities and other liabilities designated at fair value | | 9,156 | | 647 | | 9,803 | |
Debt issues and acceptances | | 56,724 | | 81,314 | | 138,038 | |
Due to subsidiaries | | 61,782 | | - | | 61,782 | |
All other liabilities | | 7,809 | | 1,456 | | 9,265 | |
Total liabilities excluding loan capital | | 510,691 | | 102,581 | | 613,272 | |
Loan capital | | 4,143 | | 4,030 | | 8,173 | |
Total liabilities | | 514,834 | | 106,611 | | 621,445 | |
Net assets/(net liabilities) | | (283,866 | ) | 322,453 | | 38,587 | |
27.4 Market risk
Market risk is the risk of an adverse impact on earnings resulting from changes in market factors, such as foreign exchange rates, interest rates, commodity prices and equity prices. This includes interest rate risk in the banking book – the risk to interest income from a mismatch between the duration of assets and liabilities that arises in the normal course of business activities.
27.4.1 Traded market risk
Approach
Westpac’s exposure to traded market risk arises out of the trading activities of Financial Markets and Treasury. These activities are controlled by a Board-approved market risk framework that incorporates a Board-approved Value at Risk (VaR) limit. VaR is the primary mechanism for measuring and controlling market risk. Market risk is managed using VaR and structural risk limits (including volume limits and basis point value limits) in conjunction with scenario analysis and stress testing. Market risk limits are allocated to business managers based upon business strategies and experience, in addition to the consideration of market liquidity and concentration of risks. All trades are fair valued daily, using independently sourced or reviewed rates. Rates that have limited independent sources are reviewed at least on a monthly basis.
Financial Market’s trading book activity represents dealings that encompass book running and distribution activity. The types of market risk arising from these activities include interest rate, foreign exchange, commodity, equity price, credit spread and volatility risk.
Treasury’s trading activity represents dealings that include the management of interest rate, foreign exchange and credit spread risk associated with wholesale funding, liquid asset portfolios and foreign exchange repatriations.
| | |
236 | 2012 WESTPAC GROUP ANNUAL REPORT | |
NOTES TO THE FINANCIAL STATEMENTS
NOTE 27. FINANCIAL RISK (CONTINUED)
VaR limits
Market risk arising from trading book activities is primarily measured using VaR based on an historical simulation methodology. VaR is the potential loss in earnings from adverse market movements calculated over a one-day time horizon to a 99% confidence level using a minimum of one year of historical data. VaR takes account of all material market variables that may cause a change in the value of the trading portfolio, including interest rates, foreign exchange rates, price changes, volatility and the correlations between these variables.
In addition to the Board approved market risk VaR limit for trading activities, MARCO has approved separate VaR sub-limits for the trading activities of Financial Markets and Treasury.
Backtesting
Daily backtesting of VaR results is performed to support model integrity. A review of both the potential profit or loss outcomes is also undertaken to monitor any skew created by the historical data.
Stress testing
Daily stress testing against pre-determined scenarios is carried out to analyse potential losses arising from extreme or unexpected movements beyond the 99% confidence level. An escalation framework around selective stress tests has been approved by MARCO. Stress and scenario tests include historical market movements, those defined by MARCO or Financial Markets and Treasury Risk (FMTR) and independent scenarios developed by Westpac’s economics department.
Profit or loss notification framework
The BRMC has approved a profit or loss notification framework. Included in this framework are levels of escalation in accordance with the size of the profit or loss. Triggers are applied to both a 1-day and a rolling 20-day cumulative total.
Risk reporting
Daily monitoring of current exposure and limit utilisation is conducted independently by the FMTR unit, which monitors market risk exposures against VaR and structural limits. Daily VaR position reports are produced by risk type, by product lines and by geographic region. These are supplemented by structural risk reporting, advice of profit or loss trigger levels and stress testing escalation trigger points. Model accreditation has been granted by APRA to use the internal model for the determination of regulatory capital for the key classes of interest rate (general market), foreign exchange, commodity and equity risks (including specific risk). Specific risk refers to the variations in individual security prices that cannot be explained by general market movements and event and default risk. Interest rate specific risk capital (specific issuer risk) is calculated using the Standard method.
As of 1 January 2012, regulatory capital includes an additional VaR component referred to as ‘Stressed VaR’. Stressed VaR is calculated to a 10-day, 99th percentile, one-tailed confidence interval and is based upon a continuous 12 month period of historical market data that includes a period of significant financial stress (e.g. the global financial crisis) and is then added to the existing VaR regulatory capital measure.
Risk mitigation
Market risk positions are managed by the trading desks consistent with delegated trading and product authorities. Risks are consolidated into portfolios based on product and risk types. Risk management is carried out by suitably qualified personnel with varying levels of seniority commensurate with the nature and scale of market risks under management.
Determination of fair value
Refer to Note 28 for the basis for determining fair value.
The following controls allow for continuous monitoring of market risk by management:
§ trading authorities and responsibilities are clearly delineated at all levels to provide accountability;
§ a structured system of limits and reporting of exposures;
§ all new products and significant product variations undergo an approval process to confirm business risks have been identified prior to launch;
§ models that are used to determine risk or profit or loss for Westpac’s financial statements are independently reviewed;
§ duties are segregated so that employees involved in the origination, processing and valuation of transactions operate under separate reporting lines, minimising the opportunity for collusion; and
§ legal counsel approves documentation for compliance with relevant laws and regulations.
| | |
| 2012 WESTPAC GROUP ANNUAL REPORT | 237 |
NOTE 27. FINANCIAL RISK (CONTINUED)
The table below depicts the aggregate VaR, by risk type, for the six months ended 30 September 2012, 31 March 2012 and 30 September 2011:
| | Consolidated and Parent Entity | |
| | 30 September 2012 | | 31 March 2012 | | | 30 September 2011 | |
| | High | | Low | | Average | | | High | | Low | | Average | | | High | | Low | | Average | |
| | $m | | $m | | $m | | | $m | | $m | | $m | | | $m | | $m | | $m | |
Interest rate risk | | 23.5 | | 10.5 | | 17.1 | | | 29.0 | | 14.8 | | 19.7 | | | 40.9 | | 16.5 | | 28.4 | |
Foreign exchange risk | | 7.5 | | 0.8 | | 2.6 | | | 8.0 | | 1.6 | | 4.1 | | | 8.4 | | 0.9 | | 3.4 | |
Equity risk | | 1.1 | | 0.2 | | 0.6 | | | 1.8 | | 0.4 | | 0.5 | | | 1.7 | | 0.3 | | 0.6 | |
Commodity risk1 | | 2.4 | | 1.0 | | 1.7 | | | 5.1 | | 1.7 | | 3.2 | | | 6.6 | | 1.1 | | 3.5 | |
Other market risks2 | | 20.7 | | 7.8 | | 15.2 | | | 21.6 | | 14.9 | | 18.0 | | | 24.9 | | 16.6 | | 20.6 | |
Diversification effect | | n/a | | n/a | | (10.6 | ) | | n/a | | n/a | | (14.4 | ) | | n/a | | n/a | | (21.9 | ) |
Net market risk | | 38.9 | | 16.8 | | 26.6 | | | 41.2 | | 25.7 | | 31.1 | | | 50.0 | | 25.8 | | 34.6 | |
1 Includes electricity risk.
2 Includes prepayment risk and credit spread risk (exposure to movements in generic credit rating bands).
Commodity, Carbon and Energy trading
Commodity, Carbon and Energy trading (CCE) activity is part of our Financial Markets business. All trades are marked-to-market daily, using independently sourced or reviewed rates. Rates are compared to Australian Financial Market Association published prices, brokers’ quotes, and futures prices as appropriate. Rates that have limited independent sources are reviewed on a regular basis by the WIB Revaluation Committee. The CCE business is managed within market risk structural and VaR limits. Credit risk is controlled by pre-settlement risk limits by counterparty.
CCE trading activities include electricity, gas, oil, emission, agricultural products, base metals and precious metals. These activities involve dealings in swaps, options, swaptions, Asian options and futures. Energy trading also includes Settlement Residue Auctions (SRAs) and Renewable Energy Certificates (RECs).
The total fair value of commodity and energy contracts outstanding as at 30 September 2012 were net derivative assets of $8 million (2011: net derivative assets of $63 million).
27.4.2 Non-traded market risk
Approach
The banking book activities that give rise to market risk include lending activities, balance sheet funding and capital management. Interest rate risk, currency risk and funding and liquidity risk are inherent in these activities. Treasury’s Asset and Liability Management (ALM) unit is responsible for managing the interest rate risk arising from these activities.
All material regions, business lines and legal entities are included in Westpac’s IRRBB framework.
Asset and Liability Management
ALM manages the structural interest rate mismatch associated with the transfer priced balance sheet, including the investment of Westpac’s capital to its agreed benchmark duration. A key risk management objective is to achieve reasonable stability of net interest income (NII) over time. These activities are overseen by the independent FMTR unit, reviewed by MARCO and conducted within a risk framework and appetite set down by the BRMC.
Material non-traded interest rate risk is managed in five centres: Sydney manages risk associated with the Australian balance sheet, the Auckland office manages risk associated with the New Zealand balance sheet, the Singapore office manages risk associated with the Asian balance sheet, while New York and London centres manage risk associated with those locations respectively. The risk from these five centres is monitored both at a local and aggregate level.
NII sensitivity
NII sensitivity is managed in terms of the net interest income-at-risk (NaR) modelled over a three year time horizon using a 99% confidence interval for movements in wholesale market interest rates. The position managed covers the Australian and New Zealand banking books, where the banking book is defined as the entire banking balance sheet less the trading book. A simulation model is used to calculate Westpac’s potential NaR. The NII simulation framework combines the underlying balance sheet data with assumptions about run off and new business, expected repricing behaviour and changes in wholesale market interest rates. Simulations using a range of interest rate scenarios are used to provide a series of potential future NII outcomes. The interest rate scenarios modelled include those projected using historical market interest rate volatility as well as 100 and 200 basis point shifts up and down from the current market yield curves in Australia and New Zealand. Additional stressed interest rate scenarios are also considered and modelled.
A comparison between the NII outcomes from these modelled scenarios indicates the sensitivity to interest rate changes.
| | |
238 | 2012 WESTPAC GROUP ANNUAL REPORT | |
NOTES TO THE FINANCIAL STATEMENTS
NOTE 27. FINANCIAL RISK (CONTINUED)
NaR limit
The BRMC has approved a NaR limit. This limit is managed by the Group Treasurer and is expressed as a deviation from benchmark hedge levels over a one-year rolling time frame, to a 99% confidence level. This limit is monitored by FMTR.
VaR limit
The BRMC has also approved a VaR limit for ALM activities. This limit is managed by the Group Treasurer and monitored by FMTR. Additionally, FMTR sets structural risk limits to prevent undue concentration of risk.
Structural foreign exchange risk
Structural foreign exchange rate risk results from the generation of foreign currency denominated earnings and from the foreign currency capital that we have deployed in offshore branches and subsidiaries with functional currencies other than Australian dollars.
As a result of the requirement to translate earnings and net assets of the foreign operations into our Australian dollar consolidated financial statements, movements in exchange rates could lead to changes in the Australian dollar equivalent of offshore earnings and capital which could introduce variability to our reported financial results. This is referred to as translation risk. In order to minimise this exposure, we manage the foreign exchange rate risk associated with offshore earnings and capital as follows:
§ foreign currency denominated earnings that are generated during the current financial year are hedged. This hedging removes the impact of changes in exchange rates on the cash flows that result from the repatriation of our profits or capital;
§ capital that is defined to be permanently employed in an offshore jurisdiction (for example to meet regulatory or prudential requirements) and which has no fixed term is hedged;
§ capital or profits that are denominated in currencies to which we have an immaterial exposure are not hedged; and
§ ALCO determines the appropriateness of the foreign exchange earnings hedges and associated limits. The identification and management of structural foreign exchange risk is reported to ALCO monthly.
Risk reporting
IRRBB risk measurement systems and personnel are centralised in Sydney. These include front office product systems, which capture all treasury funding and derivative transactions; the transfer pricing system, which captures all retail transactions in Australia and New Zealand; non-traded VaR systems; and the NII system, which calculates NII and NaR for the Australian and New Zealand balance sheets.
Daily monitoring of current exposure and limit utilisation is conducted independently by FMTR, which monitors market risk exposures against VaR and NaR limits. Reports detailing structural positions and VaR are produced and distributed daily for use by dealers and management across all stakeholder groups. Monthly and quarterly reports are produced for the senior management market risk forums of MARCO and the BRMC respectively to provide transparency of material market risks and issues.
Risk mitigation
Market risk arising in the banking book stems from the ordinary course of banking activities, including structural interest rate risk (the mismatch between the duration of assets and liabilities) and capital management. Hedging Westpac’s exposure to interest rate risk is undertaken using derivatives. The hedge accounting strategy adopted is to utilise a combination of cash flow, fair value and net investment hedge approaches. Some derivatives held for economic hedging purposes do not meet the criteria for hedge accounting as defined under AASB 139 Financial Instruments: Recognition and Measurement, and therefore are accounted for in the same way as derivatives held for trading.
The same controls as used to monitor traded market risk allow for the continuous monitoring by management of non-traded market risk.
The table below depicts the aggregate VaR for non-traded market rate risk for the six months ended 30 September 2012, 31 March 2012 and 30 September 2011:
| | | | | | | | Consolidated | | | | | | | |
| | 30 September 2012 | | 31 March 2012 | | 30 September 2011 | |
| | High | | Low | | Average | | High | | Low | | Average | | High | | Low | | Average | |
| | $m | | $m | | $m | | $m | | $m | | $m | | $m | | $m | | $m | |
Half year ended | | 15.7 | | 3.9 | | 9.4 | | 11.7 | | 2.4 | | 7.4 | | 11.1 | | 1.8 | | 5.0 | |
As at 30 September 2012 the non-traded VaR for the Parent Entity was $9.4 million (31 March 2012: $9.6 million, 30 September 2011: $4.0 million).
| | |
| 2012 WESTPAC GROUP ANNUAL REPORT | 239 |
NOTE 28. FAIR VALUES OF FINANCIAL ASSETS AND LIABILITIES
Fair Valuation Control Framework
Westpac uses a well established Fair Valuation Control Framework to determine the fair value of financial assets and liabilities. The framework consists of policies and procedures that ensure the Group is in compliance with relevant accounting, industry and regulatory standards. This framework includes details on the approach taken with respect to the revaluation of financial instruments, independent price verification, fair value adjustments and financial reporting.
The method of determining a fair value according to the Fair Valuation Control Framework falls into one of two main approaches:
§ Mark-to-market
Where the valuation uses independent unadjusted quoted market prices.
§ Mark to model
Where valuation techniques are used to determine the valuation.
Valuation techniques often require adjustments to ensure correct fair value representation. Some of our more significant valuation adjustments include:
§ Credit valuation adjustment (CVA): Some market and model derived valuations assume similar credit quality for all counterparties. To correct for this assumption, a CVA is employed on the majority of derivative positions which reflects the market view of the counterparty credit risk. A debit valuation adjustment (DVA) is employed to adjust for our own credit risk. Westpac uses a Monte Carlo simulation methodology to calculate the expected future credit exposure for all derivative exposures including inputs regarding probabilities of default (PDs) and loss given default (LGD). PDs are derived from market observed credit spreads by reference to credit default swap (CDS) sector curves for the relevant tenors to calculate CVA, and Westpac’s CDS curve for the relevant tenors to calculate DVA. PDs are then applied to the horizon of potential exposures to derive both the CVA and DVA.
§ Bid-offer spreads adjustment: The fair value of financial assets and liabilities should reflect bid prices for assets and offer prices for liabilities. Prices are adjusted to reflect current bid-offer spreads.
The fair values of large holdings of financial instruments are based on a multiple of the estimated value of a single instrument, and do not include block adjustments for the size of the holding.
Fair value hierarchy
Westpac categorises all fair value instruments according to the following hierarchy:
§ Quoted market price (Level 1)
This valuation technique uses recent unadjusted quoted prices for identical assets or liabilities in active markets where the price represents actual and regularly occurring market transactions on an arm’s length basis.
Financial instruments included in this class are spot and exchange traded derivatives for commodities, equities, foreign exchange and interest rate products.
§ Valuation technique using observable inputs (Level 2)
This valuation technique is used for financial instruments where quoted market prices are not available so prices are derived from standard valuation models, and inputs to these models are directly observable. The valuation techniques include the use of discounted cash flow analysis, option pricing models and other valuation techniques widely used and accepted by market participants. The financial instruments included in this category are mainly OTC derivatives with observable market inputs and financial instruments with fair value derived from consensus pricing with sufficient contributors. Financial instruments included in the Level 2 category are trading securities including government bonds, state government bonds, corporate fixed rate bonds and floating rate bonds and derivatives including interest rate swaps, CDSs, FX swaps, equity options and FX options.
§ Valuation technique with significant unobservable inputs (Level 3)
This valuation technique is used where at least one significant input is not observable and reliance is placed on reasonable assumptions based on market conditions. These estimates are calibrated against industry standards, economic models and observable transaction prices where possible. The financial instruments included in this class show illiquidity in the market. Some valuations rely on estimation from related markets or proxies.
Financial instruments included in the Level 3 category are trading securities, including some ABS and non-Australian dollar-denominated government securities issued by Pacific Islands governments.
Valuation techniques, valuation inputs and asset classification
A variety of valuation techniques are used to derive the fair value of each instrument. Mark-to-market is the preferred valuation technique for all products. However, when markets are illiquid and prices are not quoted, modelling techniques are used to derive fair value. The specific valuation techniques, the observability of the inputs used in valuation models and the subsequent classification for each significant product category are outlined below:
| | |
240 | 2012 WESTPAC GROUP ANNUAL REPORT | |
NOTES TO THE FINANCIAL STATEMENTS
NOTE 28. FAIR VALUES OF FINANCIAL ASSETS AND LIABILITIES (CONTINUED)
Interest rate products
§ Exchange traded interest rate options and futures
Exchange traded interest rate options and futures are liquid and their prices are observable. No modelling or assumptions are used in valuation. Thus, interest rate options and futures are categorised as Level 1 instruments.
§ Other interest rate derivatives
These are products with a payoff linked to interest rates; for example Bank Bills Swap Rate (BBSW), London InterBank Offer Rate (LIBOR) or inflation rates. This category includes interest rate and inflation swaps, swaptions, caps, floors and collars and other complex interest rate derivatives. For these instruments, as market prices are unavailable, Westpac uses valuation models to derive fair value. The models are industry standard and mostly employ a Black–Scholes framework to calculate the expected future value of payments by product, which is discounted back to a present value. The models’ interest rate inputs are benchmark interest rates such as BBSW and active broker quoted interest rates in the swap, bond and futures markets. Interest rate volatilities are sourced through a consensus data provider. As such the input parameters into the models are deemed observable, thus these interest rate derivatives are categorised as Level 2 instruments.
FX products
§ FX spot and futures
There are observable markets for futures and spot contracts in major global currencies. No modelling or assumptions are used in valuation of these instruments. These assets are categorised as Level 1 instruments.
§ FX swaps, options, forwards (outright) and other FX derivatives
FX swaps and forwards are not traded on exchanges. FX swap and forward valuations are derived from consensus data providers. Both simple and complex derivatives are valued using industry standard models which revolve around a Black–Scholes framework. The inputs to the calculation include FX spot rates, interest rates and FX volatilities. In general, these inputs are market observable or provided by consensus data providers. Thus, FX swaps, options, forwards and other FX derivatives are categorised as Level 2 instruments.
Debt and credit market products
§ Single Name and Index CDS
CDSs are mainly traded OTC, therefore market prices are not always observable. Westpac uses a standard industry model to derive the fair value of CDSs. The main input the model relies on is the credit spread. Credit spreads are obtained from consensus market data providers, thus CDS single name and index are classified as Level 2 assets.
§ Government bonds, state government bonds, corporate bonds, commercial paper, certificates of deposit and notes
Within this category, most instruments do not have quoted market prices. Westpac uses valuation models to derive the fair value of these instruments. The valuation techniques are standard and mainly use a discounted cashflow approach. The main model inputs are observed instrument data used to derive the discount curves. Thus, Debt market products are classified as Level 2 instruments.
Asset backed products
§ Australian Residential Mortgage Backed Securities (RMBS) denominated in Australian dollars
Australian RMBS denominated in Australian dollars are classified as Level 2. They are valued using a market accepted model with observable inputs sourced from a consensus data provider. The main inputs to the model are the trading margin and the weighted average life of the security.
§ Australian RMBS denominated in foreign currency and offshore RMBS
Despite the availability of an RMBS model in Westpac, input data for the trading margin on Australian issued RMBS, denominated in foreign currency is considered unreliable. Trading levels in these instruments are low. Therefore, proxy data from the Australian denominated RMBS market is used to derive the fair value for these instruments. Australian issued RMBS denominated in foreign currency are classified as Level 3 instruments.
Offshore RMBS are classified as Level 2 and consensus data is used to determine their fair value.
§ Synthetic collateralised debt obligations (CDOs)
As synthetic CDO prices are not generally available, Synthetic CDOs are valued using a model. The model uses a combination of established analytic and numerical approaches. The model calculates fair value based on observable and unobservable parameters including credit spreads, recovery rates, correlations and interest rates. As some of the model inputs (e.g. correlations) are indirectly implied or unobservable, synthetic CDOs are classified as Level 3 instruments.
§ Cash CDOs, collateralised loan obligations (CLOs), and other asset-backed securities (ABSs)
Cash CDO, CLO and ABS prices are obtained from broker quotes and consensus data providers. Modelling is not used in the valuation as generally there is no information on the underlying asset pool. If consensus pricing data is available these are classified as Level 2 instruments. Otherwise, Cash CDOs, CLOs and other ABSs are classified as Level 3 instruments.
| | |
| 2012 WESTPAC GROUP ANNUAL REPORT | 241 |
NOTE 28. FAIR VALUES OF FINANCIAL ASSETS AND LIABILITIES (CONTINUED)
Equity products
§ Cash equities and index
The Australian cash equity market is liquid and cash equities and index prices are listed on the ASX. No modelling or assumptions are used in valuation. Thus, cash equities are categorised as Level 1 assets.
§ Exchange traded equity options, OTC equity options and equity warrants
Exchange traded equity options and warrants are traded on the ASX, however there is little liquidity in the market for these instruments beyond one year. For OTC equity options there is no observable source of pricing. Therefore, industry standard models are used to value options and warrants, which are based on a Black—Scholes framework. The models calculate fair value based on input parameters such as stock prices, dividends, volatilities and interest rates. In general, these input parameters are deemed observable. Thus, exchange traded equity options, OTC equity options and warrants are categorised as Level 2 instruments.
Commodity products
§ Commodity and energy spot and futures and carbon futures
The commodity and energy spot and futures and carbon futures markets are generally liquid and instruments are listed on major global exchanges. Traded commodity and energy spot and futures include metals, agriculture, oil related, power and natural gas. No modelling or assumptions are used in the valuation of these instruments. Thus, commodity and energy spot and futures and carbon futures are categorised as Level 1 instruments.
§ Commodity, carbon and energy swaps
Energy, carbon and commodity swaps are not traded on exchanges. Options, although traded on exchanges, are not generally liquid. Therefore, market prices are not regularly observed. Westpac uses models to derive the fair value of these instruments. The models calculate the expected future value of deliveries and payments and discounts them back to a present value. The model inputs include forward curves, volatility surfaces, discount curves and underlying spot and futures prices. Most of these inputs are market observable or provided by consensus data providers. Thus carbon, commodity and energy derivatives are categorised as Level 2 instruments.
Certificates of deposit
The fair value of certificates of deposit are determined using a discounted cash flow analysis using markets rates offered for deposits of similar remaining maturities and are therefore classified as Level 2 instruments.
Debt issues at fair value
Where a quoted price is not available the fair value of debt issues is determined using a discounted cash flow approach, using a discount rate which reflects the terms of the instrument and the timing of cash flows adjusted for market observable changes in the applicable credit rating of Westpac. These instruments are therefore classified as Level 2 instruments.
Disclosure of fair value
Due to the number of different valuation models used and the underlying assumptions made regarding inputs selected, such as timing and amounts of future cash flows, discount rates, credit risk and volatility, it is often difficult to compare the fair value information disclosed here, against the fair value information disclosed by other financial institutions.
The fair values disclosed in this note represent estimates at which the instruments could be exchanged. However, the intention is to hold many of these instruments to maturity and thus it is possible that the realised amount may differ to the amounts disclosed in the tables below.
| | |
242 | 2012 WESTPAC GROUP ANNUAL REPORT | |
NOTES TO THE FINANCIAL STATEMENTS
NOTE 28. FAIR VALUES OF FINANCIAL ASSETS AND LIABILITIES (CONTINUED)
The table below summarises the attribution of financial instruments to the fair value hierarchy based on the measurement basis after initial recognition:
| | | | | | | | Consolidated | | | | | | |
| | | | 2012 | | | | | | 2011 | | |
| | | | Valuation | | Valuation | | | | | | Valuation | | Valuation | | |
| | Quoted | | Techniques | | Techniques | | | | Quoted | | Techniques | | Techniques | | |
| | Market | | (Market | | (Non-Market | | | | Market | | (Market | | (Non-Market | | |
| | Prices | | Observable) | | Observable) | | | | Prices | | Observable) | | Observable) | | |
| | (Level 1) | | (Level 2) | | (Level 3) | | Total | | (Level 1) | | (Level 2) | | (Level 3) | | Total |
| | $m | | $m | | $m | | $m | | $m | | $m | | $m | | $m |
| | | | | | | | | | | | | | | | |
Assets | | | | | | | | | | | | | | | | |
| | | | | | | | | | | | | | | | |
Derivative financial instruments | | 33 | | 35,444 | | 12 | | 35,489 | | 209 | | 48,925 | | 11 | | 49,145 |
Trading securities | | 18 | | 44,585 | | - | | 44,603 | | 47 | | 47,924 | | - | | 47,971 |
Other financial assets designated at fair value | | 159 | | 2,067 | | 438 | | 2,664 | | 381 | | 1,886 | | 693 | | 2,960 |
Available-for-sale securities | | 193 | | 23,446 | | 826 | | 24,465 | | 226 | | 17,070 | | 769 | | 18,065 |
Loans1 | | - | | 11,844 | | - | | 11,844 | | - | | 11,277 | | - | | 11,277 |
Life insurance assets | | 7,712 | | 528 | | - | | 8,240 | | 7,388 | | 528 | | - | | 7,916 |
Total assets carried at fair value | | 8,115 | | 117,914 | | 1,276 | | 127,305 | | 8,251 | | 127,610 | | 1,473 | | 137,334 |
Liabilities | | | | | | | | | | | | | | | | |
Deposits at fair value | | - | | 47,086 | | - | | 47,086 | | - | | 58,561 | | - | | 58,561 |
| | | | | | | | | | | | | | | | |
Derivative financial instruments | | 38 | | 38,824 | | 73 | | 38,935 | | 178 | | 39,175 | | 52 | | 39,405 |
Trading liabilities and other financial liabilities designated at fair value | | 71 | | 9,893 | | - | | 9,964 | | 72 | | 9,731 | | - | | 9,803 |
Debt issues at fair value | | - | | 31,242 | | 27 | | 31,269 | | - | | 43,754 | | 22 | | 43,776 |
Total liabilities carried at fair value | | 109 | | 127,045 | | 100 | | 127,254 | | 250 | | 151,221 | | 74 | | 151,545 |
1 In the current year, we have revised our presentation to include loans designated at fair value. To improve presentation, we have included $11,277 million of loans measured at fair value under Level 2 in the comparative period.
| | |
| 2012 WESTPAC GROUP ANNUAL REPORT | 243 |
NOTE 28. FAIR VALUES OF FINANCIAL ASSETS AND LIABILITIES (CONTINUED)
| | | | | | | | Parent Entity | | | | | | |
| | | | 2012 | | | | | | 2011 | | |
| | | | Valuation | | Valuation | | | | | | Valuation | | Valuation | | |
| | Quoted | | Techniques | | Techniques | | | | Quoted | | Techniques | | Techniques | | |
| | Market | | (Market | | (Non-Market | | | | Market | | (Market | | (Non-Market | | |
| | Prices | | Observable) | | Observable) | | | | Prices | | Observable) | | Observable) | | |
| | (Level 1) | | (Level 2) | | (Level 3) | | Total | | (Level 1) | | (Level 2) | | (Level 3) | | Total |
| | $m | | $m | | $m | | $m | | $m | | $m | | $m | | $m |
| | | | | | | | | | | | | | | | |
Assets | | | | | | | | | | | | | | | | |
| | | | | | | | | | | | | | | | |
Derivative financial instruments | | 33 | | 35,139 | | 12 | | 35,184 | | 209 | | 48,659 | | 11 | | 48,879 |
Trading securities | | 18 | | 42,957 | | - | | 42,975 | | 47 | | 45,243 | | - | | 45,290 |
Other financial assets designated at fair value | | 105 | | 1,398 | | 400 | | 1,903 | | 97 | | 1,338 | | 658 | | 2,093 |
Loans1 | | - | | 11,844 | | - | | 11,844 | | - | | 11,277 | | - | | 11,277 |
Available-for-sale securities | | 97 | | 20,810 | | 129 | | 21,036 | | 150 | | 15,218 | | 58 | | 15,426 |
Total assets carried at fair value | | 253 | | 112,148 | | 541 | | 112,942 | | 503 | | 121,735 | | 727 | | 122,965 |
Liabilities | | | | | | | | | | | | | | | | |
Deposits at fair value | | - | | 46,400 | | - | | 46,400 | | - | | 57,313 | | - | | 57,313 |
| | | | | | | | | | | | | | | | |
Derivative financial instruments | | 38 | | 37,692 | | 73 | | 37,803 | | 175 | | 38,303 | | 52 | | 38,530 |
Trading liabilities and other financial liabilities designated at fair value | | 71 | | 9,893 | | - | | 9,964 | | 72 | | 9,731 | | - | | 9,803 |
Debt issues at fair value | | - | | 27,601 | | - | | 27,601 | | - | | 37,470 | | - | | 37,470 |
Total liabilities carried at fair value | | 109 | | 121,586 | | 73 | | 121,768 | | 247 | | 142,817 | | 52 | | 143,116 |
1 In the current year, we have revised our presentation to include loans designated at fair value. To improve presentation, we have included $11,277 million of loans measured at fair value in Level 2 in the comparative period.
Sensitivities to reasonably possible changes in non-market observable valuation assumptions would not have a material impact on the Group or Parent Entity’s reported results.
| | |
244 | 2012 WESTPAC GROUP ANNUAL REPORT | |
NOTES TO THE FINANCIAL STATEMENTS
NOTE 28. FAIR VALUES OF FINANCIAL ASSETS AND LIABILITIES (CONTINUED)
The following table summarises the changes in financial instruments carried at fair value derived from non-market observable valuation techniques (Level 3) for the year ended 30 September 2012.
Reconciliation of non-market observables
| | | | | | | | Consolidated 2012 | | | | | | |
| | | | | | | | | | | | | | | | |
| | Derivatives | | Trading
Securities | | Other
Financial Assets
Designated at
Fair Value | | Available-
for-Sale
Securities | | Total Assets | | Derivatives | | Debt Issues
at Fair Value | | Total
Liabilities |
| | $m | | $m | | $m | | $m | | $m | | $m | | $m | | $m |
Balance as at beginning of year | | 11 | | - | | 693 | | 769 | | 1,473 | | 52 | | 22 | | 74 |
Gains/(losses) on assets/ (gains)/losses on liabilities recognised in: | | | | | | | | | | | | | | | | |
Income statements | | - | | - | | (17) | | - | | (17) | | (8) | | 5 | | (3) |
Available-for-sale reserve | | - | | - | | - | | 2 | | 2 | | - | | - | | - |
Acquisitions | | 6 | | - | | 160 | | 1,899 | | 2,065 | | 35 | | - | | 35 |
Issues | | - | | - | | 4 | | - | | 4 | | - | | - | | - |
Disposals | | - | | - | | (308) | | (1,845) | | (2,153) | | - | | - | | - |
Settlements | | - | | - | | (86) | | - | | (86) | | (7) | | - | | (7) |
Transfers into or out of non-market observables | | (5) | | - | | - | | - | | (5) | | 1 | | - | | 1 |
Others | | - | | - | | (8) | | 1 | | (7) | | - | | - | | - |
Balance as at end of year | | 12 | | - | | 438 | | 826 | | 1,276 | | 73 | | 27 | | 100 |
Unrealised gains/(losses) recognised in the income statements for financial instruments held as at 30 September 2012 | | - | | - | | (25) | | - | | (25) | | 8 | | (5) | | 3 |
| | | | | | | | Consolidated 2011 | | | | | | |
| | | | | | | | | | | | | | | | |
| | Derivatives | | Trading
Securities | | Other
Financial Assets Designated at
Fair Value | | Available-
for-Sale
Securities | | Total Assets | | Derivatives | | Debt Issues
at Fair Value | | Total
Liabilities |
| | $m | | $m | | $m | | $m | | $m | | $m | | $m | | $m |
Balance as at beginning of year | | 9 | | 45 | | 652 | | 458 | | 1,164 | | 44 | | 109 | | 153 |
Gains/(losses) on assets/ (gains)/losses on liabilities recognised in: | | | | | | | | | | | | | | | | |
Income statements | | 2 | | - | | (4) | | 1 | | (1) | | 8 | | 1 | | 9 |
Available-for-sale reserve | | - | | - | | - | | (3) | | (3) | | - | | - | | - |
Acquisitions | | 4 | | - | | 305 | | 832 | | 1,141 | | - | | - | | - |
Issues | | - | | - | | 1 | | - | | 1 | | - | | - | | - |
Disposals | | - | | (45) | | (209) | | (611) | | (865) | | - | | (88) | | (88) |
Settlements | | (1) | | - | | (52) | | - | | (53) | | - | | - | | - |
Transfers into or out of non-market observables | | (3) | | - | | - | | - | | (3) | | - | | - | | - |
Others | | - | | - | | - | | 92 | | 92 | | - | | - | | - |
Balance as at end of year | | 11 | | - | | 693 | | 769 | | 1,473 | | 52 | | 22 | | 74 |
Unrealised gains/(losses) recognised in the income statements for financial instruments held as at 30 September 2011 | | 2 | | - | | (15) | | - | | (13) | | (7) | | (1) | | (8) |
| | |
| 2012 WESTPAC GROUP ANNUAL REPORT | 245 |
NOTE 28. FAIR VALUES OF FINANCIAL ASSETS AND LIABILITIES (CONTINUED)
| | Parent Entity 2012 |
| | Derivatives | | Trading
Securities | | Other
Financial Assets
Designated at
Fair Value | | Available-
for-Sale
Securities | | Total Assets | | Derivatives | | Debt Issues
at Fair Value | | Total
Liabilities |
| | $m | | $m | | $m | | $m | | $m | | $m | | $m | | $m |
Balance as at beginning of year | | 11 | | - | | 658 | | 58 | | 727 | | 52 | | - | | 52 |
Gains/(losses) on assets/ (gains)/losses on liabilities recognised in: | | | | | | | | | | | | | | | | |
Income statements | | - | | - | | (23) | | - | | (23) | | (8) | | - | | (8) |
Available-for-sale reserve | | - | | - | | - | | 2 | | 2 | | - | | - | | - |
Acquisitions | | 6 | | - | | 160 | | 168 | | 334 | | 35 | | - | | 35 |
Issues | | - | | - | | 4 | | - | | 4 | | - | | - | | - |
Disposals | | - | | - | | (308) | | (94) | | (402) | | - | | - | | - |
Settlements | | - | | - | | (86) | | - | | (86) | | (7) | | - | | (7) |
Transfers into or out of non-market observables | | (5) | | - | | - | | - | | (5) | | 1 | | - | | 1 |
Others | | - | | - | | (5) | | (5) | | (10) | | - | | - | | - |
Balance as at end of year | | 12 | | - | | 400 | | 129 | | 541 | | 73 | | - | | 73 |
Unrealised gains/(losses) recognised in the income statements for financial instruments held as at 30 September 2012 | | - | | - | | (31) | | - | | (31) | | 8 | | - | | 8 |
| | Parent Entity 2011 |
| | Derivatives | | Trading
Securities | | Other
Financial Assets
Designated at
Fair Value | | Available-
for-Sale
Securities | | Total Assets | | Derivatives | | Debt Issues
at Fair Value | | Total
Liabilities |
| | $m | | $m | | $m | | $m | | $m | | $m | | $m | | $m |
Balance as at beginning of year | | 9 | | 45 | | 601 | | 28 | | 683 | | 44 | | - | | 44 |
Gains/(losses) on assets/ (gains)/losses on liabilities recognised in: | | | | | | | | | | | | | | | | |
Income statements | | 2 | | - | | (4) | | (5) | | (7) | | 8 | | - | | 8 |
Available-for-sale reserve | | - | | - | | - | | 1 | | 1 | | - | | - | | - |
Acquisitions | | 4 | | - | | 305 | | 195 | | 504 | | - | | - | | - |
Issues | | - | | - | | 1 | | - | | 1 | | - | | - | | - |
Disposals | | - | | (45) | | (193) | | (161) | | (399) | | - | | - | | - |
Settlements | | (1) | | - | | (52) | | - | | (53) | | - | | - | | - |
Transfers into or out of non-market observables | | (3) | | - | | - | | - | | (3) | | - | | - | | - |
Others | | - | | - | | - | | - | | - | | - | | - | | - |
Balance as at end of year | | 11 | | - | | 658 | | 58 | | 727 | | 52 | | - | | 52 |
Unrealised gains/(losses) recognised in the income statements for financial instruments held as at 30 September 2011 | | 2 | | - | | (16) | | - | | (14) | | (7) | | - | | (7) |
| | |
246 | 2012 WESTPAC GROUP ANNUAL REPORT | |
NOTES TO THE FINANCIAL STATEMENTS
NOTE 28. FAIR VALUES OF FINANCIAL ASSETS AND LIABILITIES (CONTINUED)
There have been no significant transfers of financial instruments between Level 1 and Level 2. Transfers into and out of Level 3 have occurred due to changes in observability in the significant inputs into the valuation models used to determine the fair value of the related financial instruments.
Day one profit or loss
For financial assets and financial liabilities measured at fair value through the profit or loss, when the transaction price is different to the fair value from other observable current market transactions in the same instrument or based on a valuation technique whose inputs include only data from observable markets, Westpac recognises the difference between the transaction price and the fair value (‘day one’ profit or loss) in the income statement as non-interest income. In cases where use is made of data which is not observable, day one profit or loss is only recognised in the income statement when the inputs become observable, or over the life of the instrument.
The following table summarises the deferral and recognition of day one profit or loss for the Group and the Parent Entity, where a valuation technique has been applied for which not all the inputs are observable in the market:
| | Consolidated | | Parent Entity |
| | 2012 | | 2011 | | 2012 | | 2011 |
| | $m | | $m | | $m | | $m |
Balance at the beginning of the period | | 5 | | 9 | | 5 | | 9 |
Deferral on new transactions | | 4 | | 2 | | 2 | | 2 |
Recognised in the income statements during the period | | (2) | | (6) | | (1) | | (6) |
Derecognition of the instruments | | (1) | | - | | (1) | | - |
Balance at the end of the period | | 6 | | 5 | | 5 | | 5 |
| | |
| 2012 WESTPAC GROUP ANNUAL REPORT | 247 |
NOTE 28. FAIR VALUES OF FINANCIAL ASSETS AND LIABILITIES (CONTINUED)
Fair value of financial instruments
Financial assets and financial liabilities are measured on an ongoing basis either at fair value or at amortised cost. AASB 7 Financial Instruments: Disclosures requires the disclosure of the fair value of those financial instruments not already carried at fair value in the balance sheet. The fair value is the amount for which an asset could be exchanged, or a liability settled, in an arm’s length transaction between knowledgeable, willing parties. The fair value disclosure does not cover those instruments that are not considered to be financial instruments from an accounting perspective, such as income tax and intangible assets.
The following table summarises the carrying value and fair value of all financial instruments of the Group and the Parent Entity as at 30 September 2012:
| | Consolidated |
| | 2012 | | 2011 |
| | Carrying
Amount | | Fair Value | | Carrying
Amount | | Fair Value |
| | $m | | $m | | $m | | $m |
Financial assets | | | | | | | | |
Cash and balances with central banks | | 12,523 | | 12,523 | | 16,258 | | 16,258 |
Receivables due from other financial institutions | | 10,228 | | 10,228 | | 8,551 | | 8,551 |
Derivative financial instruments | | 35,489 | | 35,489 | | 49,145 | | 49,145 |
Trading securities | | 44,603 | | 44,603 | | 47,971 | | 47,971 |
Other financial assets designated at fair value | | 2,664 | | 2,664 | | 2,960 | | 2,960 |
Available-for-sale securities1 | | 24,472 | | 24,472 | | 18,075 | | 18,075 |
Loans (net of impairment provision) | | 514,445 | | 515,384 | | 496,609 | | 496,857 |
Life insurance assets | | 8,240 | | 8,240 | | 7,916 | | 7,916 |
Regulatory deposits with central banks overseas | | 1,893 | | 1,893 | | 1,739 | | 1,739 |
Other financial assets | | 4,325 | | 4,325 | | 4,448 | | 4,448 |
Total financial assets | | 658,882 | | 659,821 | | 653,672 | | 653,920 |
Financial liabilities | | | | | | | | |
Payables due to other financial institutions | | 7,564 | | 7,564 | | 14,512 | | 14,512 |
Deposit at fair value | | 47,086 | | 47,086 | | 58,561 | | 58,561 |
Deposits at amortised cost | | 347,905 | | 348,922 | | 311,717 | | 312,597 |
Derivative financial instruments | | 38,935 | | 38,935 | | 39,405 | | 39,405 |
Trading liabilities and other financial liabilities designated at fair value | | 9,964 | | 9,964 | | 9,803 | | 9,803 |
Debt issues at fair value | | 31,269 | | 31,269 | | 43,776 | | 43,776 |
Debt issues at amortised cost | | 116,312 | | 117,423 | | 121,883 | | 120,370 |
Acceptances | | 266 | | 266 | | 272 | | 272 |
Loan capital | | 9,537 | | 9,526 | | 8,173 | | 7,939 |
Other financial liabilities | | 8,022 | | 8,022 | | 7,318 | | 7,318 |
Total financial liabilities | | 616,860 | | 618,977 | | 615,420 | | 614,553 |
1 At 30 September 2012 financial instruments with a carrying value of $7 million (2011: $10 million) were included in available-for-sale securities, however as their fair value could not be reliably measured these were carried at cost. These amounts have not been included in the fair value hierarchy tables; however have been included in the tables above.
| | |
248 | 2012 WESTPAC GROUP ANNUAL REPORT | |
NOTES TO THE FINANCIAL STATEMENTS
NOTE 28. FAIR VALUES OF FINANCIAL ASSETS AND LIABILITIES (CONTINUED)
| | Parent Entity |
| | 2012 | | 2011 |
| | Carrying
Amount | | Fair Value | | Carrying
Amount | | Fair Value |
| | $m | | $m | | $m | | $m |
Financial assets | | | | | | | | |
Cash and balances with central banks | | 10,993 | | 10,993 | | 14,750 | | 14,750 |
Receivables due from other financial institutions | | 7,328 | | 7,328 | | 5,237 | | 5,237 |
Derivative financial instruments | | 35,184 | | 35,184 | | 48,879 | | 48,879 |
Trading securities | | 42,975 | | 42,975 | | 45,290 | | 45,290 |
Other financial assets designated at fair value | | 1,903 | | 1,903 | | 2,093 | | 2,093 |
Available-for-sale securities1 | | 21,039 | | 21,039 | | 15,426 | | 15,426 |
Loans (net of impairment provision) | | 457,489 | | 458,122 | | 447,379 | | 447,419 |
Regulatory deposits with central banks overseas | | 1,773 | | 1,773 | | 1,649 | | 1,649 |
Due from subsidiaries | | 92,740 | | 92,740 | | 56,938 | | 56,938 |
Other financial assets | | 3,764 | | 3,764 | | 3,758 | | 3,758 |
Total financial assets | | 675,188 | | 675,821 | | 641,399 | | 641,439 |
Financial liabilities | | | | | | | | |
Payables due to other financial institutions | | 7,490 | | 7,490 | | 14,397 | | 14,397 |
Deposit at fair value | | 46,400 | | 46,400 | | 57,313 | | 57,313 |
Deposits at amortised cost | | 312,929 | | 313,880 | | 284,144 | | 284,961 |
Derivative financial instruments | | 37,803 | | 37,803 | | 38,530 | | 38,530 |
Trading liabilities and other financial liabilities designated at fair value | | 9,964 | | 9,964 | | 9,803 | | 9,803 |
Debt issues at fair value | | 27,601 | | 27,601 | | 37,470 | | 37,470 |
Debt issues at amortised cost | | 96,832 | | 98,083 | | 100,296 | | 99,321 |
Acceptances | | 266 | | 266 | | 272 | | 272 |
Due to subsidiaries | | 93,379 | | 93,379 | | 61,782 | | 61,782 |
Loan capital | | 9,537 | | 9,526 | | 8,173 | | 7,939 |
Other financial liabilities | | 7,250 | | 7,250 | | 6,514 | | 6,514 |
Total financial liabilities | | 649,451 | | 651,642 | | 618,694 | | 618,302 |
1 At 30 September 2012 financial instruments with a carrying value of $3 million (2011: nil) were included in available-for-sale securities, however as their fair value could not be reliably measured these were carried at cost. These amounts have not been included in the fair value hierarchy tables, however have been included in the tables above.
For financial instruments not carried at fair value in the balance sheet, fair value has been derived as follows:
Loans
The carrying value of loans is net of individually and collectively assessed provisions for impairment charges. The fair value of loans is based on observable market transactions, where available. In the absence of observable market transactions, fair value is estimated using discounted cash flow models. For variable rate loans, the discount rate used is the current effective interest rate. The discount rate applied for fixed rate loans reflects the market rate for the maturity of the loan and the credit worthiness of the borrower.
Deposits
Deposits by customers’ accounts are grouped by maturity. Fair values of deposit liabilities payable on demand (interest free, interest bearing and savings deposits) approximate their carrying value. Fair values for term deposits are estimated using discounted cash flows, applying market rates offered for deposits of similar remaining maturities.
Debt issues and loan capital
Fair values are calculated using a discounted cash flow model. The discount rates applied reflect the terms of the instruments, the timing of the estimated cash flows and are adjusted for any changes in Westpac’s credit spreads.
Other financial assets and liabilities
For all other financial assets and liabilities, the carrying value approximates to the fair value. These items are either short-term in nature, re-price frequently or are of a high credit rating.
| | |
| 2012 WESTPAC GROUP ANNUAL REPORT | 249 |
NOTE 29. DERIVATIVE FINANCIAL INSTRUMENTS
Derivative contracts include forwards, futures, swaps and options, all of which are bilateral contracts or payment exchange agreements, whose values derive from the value of an underlying asset, reference rate or index. Derivatives are flexible and cost-effective tools for assisting in the management of interest rate, exchange rate, commodity, credit and equity exposures.
The following terms are used in the remainder of this note to describe the Group and the Parent Entity’s exposure to derivatives. Reference to the Group applies equally to the Parent Entity.
A forward contract obliges one party to buy and the other to sell a specific underlying product or instrument at a specific price, amount and date in the future. A forward rate agreement is an agreement between two parties establishing a contract interest rate on a notional principal over a specified period commencing at a specific future date.
A futures contract is similar to a forward contract. A futures contract obliges its owner to buy a specific underlying commodity or financial instrument at a specified price on the contract maturity date (or to settle the value for cash). Futures are exchange traded.
A swap transaction obliges the two parties to the contract to exchange a series of cash flows at specified intervals known as payment or settlement dates.
An option contract gives the option holder the right, but not the obligation, to buy or sell a specified amount of a given commodity or financial instrument at a specified price during a certain period or on a specific date. The writer of the option contract is obliged to perform if the holder exercises the right contained therein.
A credit default swap (CDS) is a contract that provides for a specified payment to be made to the purchaser of the swap following a defined credit event.
The notional amount is a measure of the volume which may be used for examining changes in derivative activity over time. The notional amount is the face value of the contract and does not reflect the amount at risk, which is generally only a small fraction of this value.
The notional amounts of certain types of financial instruments provide a basis for comparison with instruments recognised on the balance sheet, but do not necessarily indicate the amount of future cash flows involved or the current fair value of the instruments, and therefore do not indicate the Group’s exposure to credit or price risk.
Certain leveraged derivatives include an explicit leverage factor in the payment formula. The leverage factor has the effect of multiplying the notional amount such that the impact of changes in the underlying price or prices may be greater than that indicated by the notional amount alone. The Group has no exposure to these types of transactions.
The derivative instruments become favourable (assets) or unfavourable (liabilities) as a result of fluctuations in the reference rate or index relative to their terms. The aggregate contractual or notional amount of derivative financial instruments on hand, the extent to which instruments are favourable or unfavourable and thus the aggregate fair values of derivative financial assets and liabilities can fluctuate significantly from time to time.
The Group uses derivatives in two distinct capacities: as a trader, and as an end-user as part of its asset and liability management activities.
Trading
As a trader, the Group’s primary objective is to derive income from the sale of derivatives to meet Westpac’s customers’ needs. In addition to the sale of derivatives to customers, the Group also undertakes market making and discretionary trading activities. Market making involves providing quotes to other dealers, who reciprocate by providing the Group with their own quotes. This process provides liquidity in the key markets in which the Group operates. The Group also trades on its own account to exploit arbitrage opportunities and market anomalies, as well as to take outright views on market direction. These activities, known as proprietary trading, represent a limited part of the Group’s derivative activities.
Hedging
Hedging the Group’s exposures to interest rate, credit and foreign exchange rate risk is undertaken in the normal course of business by using derivatives. This activity is principally carried out by Treasury within the risk management framework of limits, practices and procedures set and overseen by MARCO.
The hedge accounting strategy adopted by Westpac is to utilise a combination of cash flow, fair value and net investment hedge approaches. Some derivatives held for economic hedging purposes do not meet the criteria for hedge accounting as defined under AASB 139 Financial Instruments: Recognition and Measurement and therefore are accounted for in the same way as derivatives held for trading. This includes the management of risks associated with future New Zealand dollar earnings and the management of credit risk exposures in Westpac’s lending portfolio.
| | |
250 | 2012 WESTPAC GROUP ANNUAL REPORT | |
NOTES TO THE FINANCIAL STATEMENTS
NOTE 29. DERIVATIVE FINANCIAL INSTRUMENTS (CONTINUED)
a. Fair value hedges
The Group hedges a proportion of its interest rate risk and foreign exchange risk from medium-term debt issuances using single currency and cross-currency interest rate derivatives. The Group also hedges part of its interest rate risk from fixed rate assets denominated both in local and foreign currencies using interest rate derivatives designated as fair value hedges.
For the Group, the change in the fair value of hedging instruments designated in fair value hedges was $1,213 million loss (2011: $723 million loss) while the change in the fair value of hedged items attributed to the hedge risk was $1,210 million gain (2011: $719 million gain).
For the Parent Entity, the change in the fair value of hedging instruments designated in fair value hedges was $1,191 million loss (2011: $767 million loss) while the change in the fair value of hedged items attributed to the hedge risk was $1,188 million gain (2011: $761 million gain).
b. Cash flow hedges
Exposure to the volatility of interest cash flows from floating rate customer deposits, at call balances and loans is hedged through the use of interest rate derivatives.
Exposure to foreign currency principal and interest cash flows from floating rate medium-term debt issuances is hedged through the use of cross-currency derivatives.
Underlying cash flows from cash flow hedges are, as a proportion of total cash flows, expected to occur in the following periods:
| | Less Than | | 1 Month to | | 3 Months | | 1 Year to | | 2 Years to | | 3 Years to | | 4 Years to | | Over | |
| | 1 Month | | 3 Months | | to 1 Year | | 2 Years | | 3 Years | | 4 Years | | 5 Years | | 5 Years | |
2012 | | | | | | | | | | | | | | | | | |
Cash inflows (assets) | | 1.7% | | 10.6% | | 21.0% | | 35.3% | | 20.2% | | 5.2% | | 3.6% | | 2.3% | |
Cash outflows (liabilities) | | 1.8% | | 10.9% | | 20.2% | | 36.1% | | 20.0% | | 5.0% | | 3.7% | | 2.2% | |
2011 | | | | | | | | | | | | | | | | | |
Cash inflows (assets) | | 1.8% | | 3.6% | | 15.7% | | 25.1% | | 29.8% | | 15.4% | | 4.2% | | 4.5% | |
Cash outflows (liabilities) | | 2.2% | | 4.1% | | 16.6% | | 24.5% | | 29.5% | | 14.5% | | 4.1% | | 4.5% | |
For the Group, a gain on cashflow hedges of $10 million was recognised due to hedge ineffectiveness (2011: $8 million loss). For the Parent Entity, a gain on cashflow hedges of $10 million was recognised due to hedge ineffectiveness (2011: $8 million loss).
c. Dual fair value and cash flow hedges
Fixed rate foreign currency denominated medium-term debt is hedged using cross-currency interest rate derivatives, designated as fair value hedges of foreign interest rates and cash flow hedges of foreign exchange rates.
d. Net investment hedges
The Group hedges the majority of the currency translation risk of net investments in foreign operations through foreign exchange forward contracts. There were no significant changes to the level of hedging during the current year.
| | |
| 2012 WESTPAC GROUP ANNUAL REPORT | 251 |
NOTE 29. DERIVATIVE FINANCIAL INSTRUMENTS (CONTINUED)
The notional amount and fair value of derivative instruments held for trading and designated in hedge relationships are set out in the following tables:
| | Consolidated | |
| | 30 September 2012 | | | 30 September 2011 | |
| | | | Fair Value | | Fair Value | | | | | Fair Value | | Fair Value | |
| | Notional | | Asset | | Liability | | | Notional | | Asset | | Liability | |
| | $m | | $m | | $m | | | $m | | $m | | $m | |
Held for trading | | | | | | | | | | | | | | |
Interest rate: | | | | | | | | | | | | | | |
Futures1 | | 106,703 | | - | | - | | | 61,187 | | - | | - | |
Forwards | | 146,344 | | 36 | | (46 | ) | | 50,918 | | 20 | | (41 | ) |
Swaps | | 1,004,349 | | 17,496 | | (17,292 | ) | | 866,445 | | 13,633 | | (12,898 | ) |
Options | | 36,881 | | 287 | | (211 | ) | | 34,748 | | 230 | | (144 | ) |
Foreign exchange: | | | | | | | | | | | | | | |
Forwards | | 461,873 | | 3,948 | | (4,897 | ) | | 484,395 | | 10,567 | | (9,502 | ) |
Swaps | | 270,610 | | 9,196 | | (5,491 | ) | | 296,022 | | 19,495 | | (7,969 | ) |
Options | | 23,130 | | 281 | | (303 | ) | | 22,217 | | 470 | | (519 | ) |
Commodities | | 3,365 | | 100 | | (112 | ) | | 4,724 | | 239 | | (176 | ) |
Equities | | 386 | | 14 | | (9 | ) | | 460 | | 57 | | (19 | ) |
Credit | | 64,067 | | 443 | | (491 | ) | | 58,394 | | 834 | | (858 | ) |
Total held for trading derivatives | | 2,117,708 | | 31,801 | | (28,852 | ) | | 1,879,510 | | 45,545 | | (32,126 | ) |
Fair value hedges | | | | | | | | | | | | | | |
Interest rate: | | | | | | | | | | | | | | |
Swaps2 | | 33,930 | | 827 | | (2,772 | ) | | 31,618 | | 821 | | (1,269 | ) |
Foreign exchange: | | | | | | | | | | | | | | |
Swaps2,3 | | 30,359 | | 440 | | (4,097 | ) | | 30,771 | | 758 | | (3,569 | ) |
Total fair value hedging derivatives | | 64,289 | | 1,267 | | (6,869 | ) | | 62,389 | | 1,579 | | (4,838 | ) |
Cash flow hedges | | | | | | | | | | | | | | |
Interest rate: | | | | | | | | | | | | | | |
Swaps2 | | 97,521 | | 2,251 | | (1,330 | ) | | 89,280 | | 1,431 | | (1,122 | ) |
Foreign exchange: | | | | | | | | | | | | | | |
Swaps2,3 | | 13,833 | | 168 | | (1,805 | ) | | 15,734 | | 529 | | (1,304 | ) |
Total cash flow hedging derivatives | | 111,354 | | 2,419 | | (3,135 | ) | | 105,014 | | 1,960 | | (2,426 | ) |
Net investment hedges | | 3,713 | | 2 | | (79 | ) | | 3,161 | | 61 | | (15 | ) |
Total derivatives | | 2,297,064 | | 35,489 | | (38,935 | ) | | 2,050,074 | | 49,145 | | (39,405 | ) |
1 The fair value differential of futures contracts are settled daily with the exchange. The notional balance represents open contracts as at 30 September.
2 The unrealised foreign exchange gains or loss on derivatives in hedge relationships are substantially offset by the retranslation at spot exchange rates of the foreign currency denominated debt being hedged, which affects profit and loss in the current year.
3 Included within foreign exchange swaps are derivatives designated in both cash flow and fair value hedge relationships under the dual designation strategy.
| | |
252 | 2012 WESTPAC GROUP ANNUAL REPORT | |
NOTES TO THE FINANCIAL STATEMENTS
NOTE 29. DERIVATIVE FINANCIAL INSTRUMENTS (CONTINUED)
| | Parent Entity | |
| | 30 September 2012 | | | 30 September 2011 | |
| | | | Fair Value | | Fair Value | | | | | Fair Value | | Fair Value | |
| | Notional | | Asset | | Liability | | | Notional | | Asset | | Liability | |
| | $m | | $m | | $m | | | $m | | $m | | $m | |
Held for trading | | | | | | | | | | | | | | |
Interest rate: | | | | | | | | | | | | | | |
Futures1 | | 106,703 | | - | | - | | | 61,187 | | - | | - | |
Forwards | | 146,344 | | 36 | | (48 | ) | | 50,918 | | 20 | | (41 | ) |
Swaps | | 1,009,876 | | 17,541 | | (17,368 | ) | | 872,017 | | 13,715 | | (13,078 | ) |
Options | | 36,881 | | 287 | | (211 | ) | | 34,748 | | 230 | | (144 | ) |
Foreign exchange: | | | | | | | | | | | | | | |
Forwards | | 461,566 | | 3,941 | | (4,885 | ) | | 483,834 | | 10,555 | | (9,480 | ) |
Swaps | | 272,483 | | 8,908 | | (5,700 | ) | | 297,821 | | 19,550 | | (8,076 | ) |
Options | | 23,130 | | 281 | | (303 | ) | | 22,217 | | 470 | | (519 | ) |
Commodities | | 3,365 | | 100 | | (112 | ) | | 4,724 | | 239 | | (176 | ) |
Equities | | 386 | | 14 | | (9 | ) | | 460 | | 57 | | (19 | ) |
Credit | | 64,050 | | 443 | | (488 | ) | | 58,377 | | 834 | | (855 | ) |
Total held for trading derivatives | | 2,124,784 | | 31,551 | | (29,124 | ) | | 1,886,303 | | 45,670 | | (32,388 | ) |
Fair value hedges | | | | | | | | | | | | | | |
Interest rate: | | | | | | | | | | | | | | |
Swaps2 | | 29,760 | | 783 | | (2,575 | ) | | 27,029 | | 518 | | (1,148 | ) |
Foreign exchange: | | | | | | | | | | | | | | |
Swaps2,3 | | 27,358 | | 440 | | (3,784 | ) | | 27,429 | | 711 | | (3,484 | ) |
Total fair value hedging derivatives | | 57,118 | | 1,223 | | (6,359 | ) | | 54,458 | | 1,229 | | (4,632 | ) |
Cash flow hedges | | | | | | | | | | | | | | |
Interest rate: | | | | | | | | | | | | | | |
Swaps2 | | 93,869 | | 2,241 | | (1,265 | ) | | 86,569 | | 1,423 | | (994 | ) |
Foreign exchange: | | | | | | | | | | | | | | |
Swaps2,3 | | 11,100 | | 168 | | (980 | ) | | 12,236 | | 513 | | (504 | ) |
Total cash flow hedging derivatives | | 104,969 | | 2,409 | | (2,245 | ) | | 98,805 | | 1,936 | | (1,498 | ) |
Net investment hedges | | 2,866 | | 1 | | (75 | ) | | 2,300 | | 44 | | (12 | ) |
Total derivatives | | 2,289,737 | | 35,184 | | (37,803 | ) | | 2,041,866 | | 48,879 | | (38,530 | ) |
1 The fair value differential of futures contracts are settled daily with the exchange. The notional balance represents open contracts as at 30 September.
2 The unrealised foreign exchange gains or loss on derivatives in hedge relationships are substantially offset by the retranslation at spot exchange rates of the foreign currency denominated debt being hedged, which affects profit and loss in the current year.
3 Included within foreign exchange swaps are derivatives designated in both cash flow and fair value hedge relationships under the dual designation strategy.
Credit derivatives
Through the use of credit derivatives, the Group is exposed to or protected from the risk of default of the underlying entity referenced by the derivative, dependant on whether the Group is a purchaser or seller of credit protection. The primary credit derivatives used by the Group are CDSs, which are predominantly executed with other financial institutions.
| | |
| 2012 WESTPAC GROUP ANNUAL REPORT | 253 |
NOTE 29. DERIVATIVE FINANCIAL INSTRUMENTS (CONTINUED)
Credit derivatives are primarily entered into to facilitate institutional customer transactions and to manage our credit risk exposures. The notional amount and fair value of credit derivatives are presented in the following tables:
| | | | | | Consolidated | | | | | |
| | | | 2012 | | | | | | | 2011 | | | |
| | | | Fair Value | | Fair Value | | | | | Fair Value | | Fair Value | |
| | Notional | | Asset | | Liability | | | Notional | | Asset | | Liability | |
| | $m | | $m | | $m | | | $m | | $m | | $m | |
Credit protection bought1 | | 32,554 | | 220 | | (226 | ) | | 29,293 | | 749 | | (81 | ) |
Credit protection sold | | 31,495 | | 223 | | (259 | ) | | 29,084 | | 86 | | (774 | ) |
Total2 | | 64,049 | | 443 | | (485 | ) | | 58,377 | | 835 | | (855 | ) |
1 Counterparties to derivatives relating to credit protection bought are predominantly financial institutions.
2 The table above does not include total return swaps included with credit derivatives in the previous table.
| | | | | | Parent Entity | | | | | |
| | | | 2012 | | | | | | | 2011 | | | |
| | | | Fair Value | | Fair Value | | | | | Fair Value | | Fair Value | |
| | Notional | | Asset | | Liability | | | Notional | | Asset | | Liability | |
| | $m | | $m | | $m | | | $m | | $m | | $m | |
Credit protection bought1 | | 32,554 | | 220 | | (226 | ) | | 29,293 | | 749 | | (81 | ) |
Credit protection sold | | 31,495 | | 223 | | (259 | ) | | 29,084 | | 86 | | (774 | ) |
Total2 | | 64,049 | | 443 | | (485 | ) | | 58,377 | | 835 | | (855 | ) |
1 Counterparties to derivatives relating to credit protection bought are predominantly financial institutions.
2 The table above does not include total return swaps included with credit derivatives in the previous table.
NOTE 30. CAPITAL ADEQUACY
APRA has responsibility for the prudential supervision of ADIs, life and general insurance companies and superannuation funds in Australia. Westpac is an ADI.
Australia’s risk-based capital adequacy guidelines are generally consistent but not completely aligned with the approach agreed upon by the BCBS. APRA has exercised its discretion in applying the Basel framework to Australian ADIs. On balance, the applications of these discretions act to reduce reported capital ratios relative to those reported in other jurisdictions.
Under Basel II, Australian banks are required to maintain a minimum ratio of capital to risk-adjusted assets of at least 8%. At least half of this capital must be in the form of Tier 1 capital. Subject to certain limitations, Tier 1 capital consists of paid-up share capital, retained profits, certain reserves and other equity instruments, less the deduction of certain intangible assets, capitalised expenses and software, and retained earnings in insurance and funds management subsidiaries that are not consolidated for capital adequacy purposes. The balance of eligible capital is defined as supplementary or Tier 2 capital. Supplementary capital includes, subject to limitations, mandatory convertible notes, perpetual floating rate notes and like instruments, and term subordinated debt (provided such term debt is not in excess of 50% of Tier 1 capital) less a deduction for holdings of Westpac’s own subordinated debt. Deductions with equal scaling at Tier 1 and Tier 2 include capital invested or guarantees or similar support provided to entities involved in securitisation, in insurance and funds management, controlled entities not already deducted at Tier 1 level, excess investments in non-subsidiary entities and any shortfall of provisions compared to regulatory expected loss.
Westpac’s capital ratios are in compliance with APRA minimum capital adequacy requirements.
Capital management strategy
Westpac’s approach to capital management seeks to balance the fact that capital is an expensive form of funding with the need to be adequately capitalised. Westpac considers the need to balance efficiency, flexibility and adequacy when determining sufficiency of capital and when developing capital management plans.
Westpac evaluates these considerations through an Internal Capital Adequacy Assessment Process (ICAAP), the key features of which include:
§ the development of a capital management strategy including target capital ratios, capital buffers and contingency plans which guide the development of specific capital plans;
§ consideration of both economic and regulatory capital requirements;
§ a process which challenges the capital measures, coverage and requirements, which incorporates a comparison of economic and regulatory requirements and the use of the Quantitative Scenario Analysis (stress testing) framework that considers, amongst other things, the impact of adverse economic scenarios that threaten the achievement of planned outcomes; and
§ consideration of the perspectives of external stakeholders such as regulators, rating agencies and equity and debt investors.
| | |
254 | 2012 WESTPAC GROUP ANNUAL REPORT | |
NOTES TO THE FINANCIAL STATEMENTS
NOTE 31. SECURITISATION AND COVERED BONDS
Westpac derives rewards and has exposure to risks from various forms of securitisation structures:
§ own asset securitisation; and
§ customer funding conduits.
Own assets securitised
Securitisation is a funding, liquidity and capital management tool. Securitisation provides Westpac the option to liquefy a pool of assets and increase the Group’s wholesale funding capacity. Westpac may provide arm’s length facilities to the securitisation vehicles. The facilities entered into typically include the provision of liquidity, funding and derivative contracts.
Where the Parent Entity and the Group have continuing involvement with the securitisation vehicle, through ongoing exposure to the risks and rewards associated with the assets, the provision of derivatives, liquidity facilities and trust management and operational services, the originated assets remain recognised on the balance sheet for accounting purposes, and Westpac consolidates the securitisation vehicles.
Customer funding conduits
The Group arranges funding for certain customer transactions through a securitisation conduit (Waratah Receivables Corporation Limited and other related SPVs) that provides customers with access to funding from commercial paper markets. Given that Westpac provides liquidity, credit enhancements, foreign exchange facilities and management and operational services, it is deemed to have exposure to the associated risks and rewards and is required to consolidate the vehicles.
Revenue from securitisation structures
Fee income
Westpac receives a market-based fee or margin in return for its services as trust manager, servicer, foreign exchange counterparty and facilities provider.
Securitisation risk management
Credit exposure
Where relevant, counterparty exposure arising from funding, liquidity, credit support and funding facilities, foreign exchange and swap arrangements for both own asset securitisation and customer funding conduits are approved within the Group’s normal credit process and are captured and monitored in key source systems along with other facilities and derivatives entered into by Westpac.
Market risk
Exposures arising from transactions with securitisation conduits and other counterparties are captured as part of Westpac’s traded and non-traded market risk reporting and limit management framework.
The interest rate and basis risk generated by Westpac’s provision of hedge arrangements to securitisation vehicles are captured and managed in Westpac’s ALM framework. The risk generated by Westpac’s provision of liquidity and redraw facilities to own asset vehicles is captured and managed within Treasury’s liquidity risk policies along with all other contingent liquidity facilities.
Funding and liquidity management
Exposure to and the impact of securitisation transactions are managed under the Market and Liquidity Risk Management Framework and are integrated into routine reporting for capital and liquidity positions, net interest margin analysis, balance sheet forecasting and funding scenario testing. The Group’s funding plan incorporates consideration of overall liquidity risk limits and the level of securitisation of Westpac originated assets. Westpac provided undrawn liquidity facilities to the customer funding conduit of $2,552 million at 30 September 2012 (30 September 2011: $2,800 million). Similarly undrawn funding and liquidity facilities of $369 million were provided by Westpac (30 September 2011: $366 million) for the securitisation of its own assets.
| | |
| 2012 WESTPAC GROUP ANNUAL REPORT | 255 |
NOTE 31. SECURITISATION AND COVERED BONDS (CONTINUED)
The table below presents assets securitised by the Group:
| | Consolidated |
| | 2012 | | | 2011 | |
| | | | Customer | | | | | | | Customer | | | |
| | Own Assets | | Conduits | | Total | | | Own Assets | | Conduits | | Total | |
| | $m | | $m | | $m | | | $m | | $m | | $m | |
Residential mortgage | | 10,763 | | 2,544 | | 13,307 | | | 11,337 | | 2,775 | | 14,112 | |
Auto and equipment finance | | - | | - | | - | | | 105 | | - | | 105 | |
Other assets securitised | | - | | 10 | | 10 | | | - | | 62 | | 62 | |
Other1 | | 350 | | - | | 350 | | | 487 | | - | | 487 | |
Total | | 11,113 | | 2,554 | | 13,667 | | | 11,929 | | 2,837 | | 14,766 | |
1 This reflects cash and accrued income held by the own asset securitisation vehicles, which have not yet been distributed to noteholders.
The table below presents assets securitised by the Parent Entity:
| | Parent Entity |
| | 2012 | | | 2011 | |
| | | | Customer | | | | | | | Customer | | | |
| | Own Assets1 | | Conduits | | Total | | | Own Assets1 | | Conduits | | Total | |
| | $m | | $m | | $m | | | $m | | $m | | $m | |
Residential mortgage | | 59,941 | | - | | 59,941 | | | 45,572 | | - | | 45,572 | |
Auto and equipment finance | | - | | - | | - | | | - | | - | | - | |
Other assets securitised | | - | | - | | - | | | - | | - | | - | |
Other2 | | 3,598 | | - | | 3,598 | | | 1,083 | | - | | 1,083 | |
Total | | 63,539 | | - | | 63,539 | | | 46,655 | | - | | 46,655 | |
1 Own assets securitised by the Parent Entity include internal mortgage backed securitisation of $49,178 million (2011: $34,235 million) which are available for external issuance and qualifies for repurchase with the RBA.
2 This reflects cash and accrued income held by the own asset securitisation vehicles, which have not yet been distributed to noteholders.
The table below presents the underlying liabilities of the Group as a result of the securitisation of assets:
| | Consolidated |
| | 2012 | | | 2011 | |
| | | | Customer | | | | | | | Customer | | | |
| | Own Assets | | Conduits | | Total | | | Own Assets | | Conduits | | Total | |
| | $m | | $m | | $m | | | $m | | $m | | $m | |
Notes issued | | 10,078 | | 2,543 | | 12,621 | | | 10,911 | | 2,867 | | 13,778 | |
The table below presents the underlying liabilities of the Parent Entity as a result of the securitisation of assets:
| | Parent Entity |
| | 2012 | | | 2011 | |
| | | | Customer | | | | | | | Customer | | | |
| | Own Assets | | Conduits | | Total | | | Own Assets | | Conduits | | Total | |
| | $m | | $m | | $m | | | $m | | $m | | $m | |
Due to subsidiaries | | 62,504 | | - | | 62,504 | | | 45,655 | | - | | 45,655 | |
Certain own asset securitisation and customer funding conduit notes have been issued in foreign currencies and have been translated to Australian dollars using the spot foreign exchange rate on the balance sheet date. These foreign exchange exposures are fully hedged with foreign exchange derivatives. Associated derivatives are not presented in the tables above and explain the mismatch between assets securitised and notes issued.
| | |
256 | 2012 WESTPAC GROUP ANNUAL REPORT | |
NOTES TO THE FINANCIAL STATEMENTS
NOTE 31. SECURITISATION AND COVERED BONDS (CONTINUED)
The table below presents the fair value of assets securitised and underlying liabilities as a result of the securitisation of assets for the Consolidated Group and Parent Entity:
| | Consolidated | | Parent Entity | |
| | 2012 | | 2012 | |
| | $m | | $m | |
Residential mortgage | | 10,784 | | 60,036 | |
Other | | 350 | | 3,598 | |
Fair value of assets securitised | | 11,134 | | 63,634 | |
Notes issued | | 9,950 | | 61,217 | |
Fair value of underlying liabilities | | 9,950 | | 61,217 | |
Net fair value | | 1,184 | | 2,417 | |
Covered bonds
The Group has two covered bond programmes: one utilises Australian residential mortgages (Australian Programme) and one utilises New Zealand residential mortgages (New Zealand Programme). Pursuant to these programmes, selected pools of residential mortgages are assigned to bankruptcy remote special purpose vehicles (SPVs). Those SPVs provide unconditional and irrevocable guarantees of the related covered bonds that are issued by members of the Group. As such, the covered bondholders have recourse to the issuer of the covered bond and, in the event that the issuer fails to make a payment when due, to the covered bond SPV.
The Group has continuing involvement with the covered bond SPVs as it is exposed to the risks and rewards associated with the pools of residential mortgages (including by way of the derivatives it has entered into with the SPVs). Accordingly, for accounting purposes, the SPVs are consolidated entities of the Group.
As at 30 September 2012, the carrying value of covered bonds on issue for the Group was $11,951 million (2011: $1,376 million) and for the Parent Entity $10,392 million (2011: nil). The carrying value of assets pledged for the covered bond programmes for the Group was $18,333 million (2011: $2,158 million) and for the Parent Entity $15,333 million (2011: nil).
NOTE 32. GROUP SEGMENT INFORMATION
The accounting standard AASB 8 Operating Segments requires segment results to be presented on a basis that is consistent with information provided internally to Westpac’s key decision makers. In assessing its financial performance, including divisional results, the Westpac Group uses a measure of performance referred to as ‘Cash Earnings’.
Cash Earnings is not a measure of cash flow or net profit determined on a cash accounting basis, as it includes non-cash items reflected in net profit determined in accordance with A-IFRS. The specific adjustments outlined below include both cash and non-cash items. Cash Earnings, as calculated by Westpac, is viewed as a measure of the level of profit that is generated by ongoing operations and is expected to be available over the long term for distributions to shareholders. Management believes this allows the Group to more effectively assess performance for the current period against prior periods and to compare performance across business divisions and across peer companies.
Three categories of adjustments are made to statutory results to determine Cash Earnings:
§ material items that key decision makers at Westpac believe do not reflect ongoing operations;
§ items that are not considered when dividends are recommended, such as the amortisation of intangibles, impact of Treasury shares and economic hedging impacts; and
§ accounting reclassifications between individual line items that do not impact statutory results, such as policyholder tax recoveries1.
The basis of segment reporting reflects the management of the business, rather than the legal structure of the Group. The operating segment results have been presented on a management reporting basis and consequently internal charges and transfer pricing adjustments have been reflected in the performance of each operating segment. Inter-segment pricing is determined on an arm’s length basis.
1 Policyholder tax recoveries – income and tax amounts that are grossed up to comply with the A-IFRS accounting standard covering Life Insurance Business (policyholder tax recoveries) are reversed in deriving income and taxation expense on a Cash Earnings basis.
| | |
| 2012 WESTPAC GROUP ANNUAL REPORT | 257 |
NOTE 32. GROUP SEGMENT INFORMATION (CONTINUED)
Reportable operating segments
The operating segments are defined by the customers they service and the services they provide:
§ Australian Financial Services (AFS) is responsible for the Westpac Group’s Australian retail banking, business banking and wealth operations. It incorporates the operations of:
– Westpac Retail & Business Banking (Westpac RBB), which is responsible for sales and service for our consumer, small-to-medium enterprise customers and commercial customers in Australia under the Westpac brand;
– St.George Banking Group (St.George), which is responsible for sales and service for our consumer, business and corporate customers in Australia under the St.George, BankSA, Bank of Melbourne and RAMS1 brands;
– BT Financial Group (Australia) (BTFG), which is Westpac’s Australian wealth management business. Its operations include funds management and insurance solutions. BTFG’s brands include Advance Asset Management, Ascalon, Asgard, BT, BT Investment Management (BTIM)2, BT Select, Licensee Select, Magnitude, Securitor, and the advice, private banking and insurance operations of Bank of Melbourne, BankSA, St.George and Westpac.
§ Westpac Institutional Bank (WIB) delivers a broad range of financial services to commercial, corporate, institutional and government customers with connections to Australia and New Zealand. Customers are supported through branches and subsidiaries located in Australia, New Zealand, US, UK and Asia;
§ Westpac New Zealand is responsible for sales and service of banking, wealth and insurance products for consumers, business and institutional customers in New Zealand. Banking products are provided under the Westpac and Westpac Institutional brands while insurance and wealth products are provided by Westpac Life and BT brands respectively.
Other divisions in the Group include:
§ Pacific Banking, which provides banking services for retail and business customers in seven Pacific Island Nations;
§ Treasury, which is primarily focused on the management of the Group’s interest rate risk and funding requirements by managing the mismatch between Group assets and liabilities;
§ Group Services, which encompasses technology, banking operations, legal and property services;
§ Core Support, which comprises those functions performed centrally including finance, risk, legal and human resources; and
§ Group items, including earnings on capital not allocated to divisions, accounting entries for certain intra-group transactions that facilitate the presentation of the performance of our operating segments, earnings from non core asset sales and certain other head office items such as centrally raised provisions.
Organisational changes
On 1 November 2011 Westpac’s New Zealand branch transferred certain business activities and associated employees to Westpac New Zealand Limited, a wholly owned licensed bank incorporated in New Zealand. The transfer followed an agreement with the Reserve Bank of New Zealand on the business that should be conducted through Westpac New Zealand Limited. The business transferred relates to institutional customers, debt capital markets, corporate advisory and customer foreign currency accounts. This resulted in the transfer of assets and liabilities between Westpac Institutional Bank and Westpac New Zealand.
During the year, the Group also transferred management responsibility for the equities business from WIB to BTFG and RAMS from Westpac RBB to St.George Banking Group, effective 1 October 2011.
In addition to these business transfers, the Group has updated its approach on how capital is allocated and how transfer pricing is determined. These new models have been designed to better align the Group’s economic capital and pricing approaches to new regulatory requirements and to reflect changes in funding markets.
Comparative information has been revised for all of these changes.
1 RAMS is a financial services group specialising in mortgages.
2 BTIM is 64.5% owned by the Westpac Group and consolidated in BTFG’s Funds Management business.
| | |
258 | 2012 WESTPAC GROUP ANNUAL REPORT | |
NOTES TO THE FINANCIAL STATEMENTS
NOTE 32. GROUP SEGMENT INFORMATION (CONTINUED)
The tables below present the segment results on a Cash Earnings basis:
| | Consolidated 2012 | |
| | Westpac | | | | | | | | | | | | | | | |
| | Retail & | | St.George | | BT Financial | | | | Westpac | | Westpac | | | | | |
| | Business | | Banking | | Group | | | | Institutional | | New | | Other | | | |
| | Banking | | Group | | (Australia) | | AFS | | Bank | | Zealand | | Divisions | | Total | |
| | $m | | $m | | $m | | $m | | $m | | $m | | $m | | $m | |
Net interest income | | 5,304 | | 2,966 | | 424 | | 8,694 | | 1,706 | | 1,224 | | 939 | | 12,563 | |
Non-interest income | | 1,184 | | 565 | | 1,650 | | 3,399 | | 1,484 | | 336 | | 294 | | 5,513 | |
Net operating income before operating expenses and impairment charges | | 6,488 | | 3,531 | | 2,074 | | 12,093 | | 3,190 | | 1,560 | | 1,233 | | 18,076 | |
Operating expenses | | (3,079 | ) | (1,341 | ) | (1,133 | ) | (5,553 | ) | (987 | ) | (653 | ) | (186 | ) | (7,379 | ) |
Impairment charges | | (429 | ) | (433 | ) | (1 | ) | (863 | ) | (127 | ) | (148 | ) | (74 | ) | (1,212 | ) |
Profit before income tax | | 2,980 | | 1,757 | | 940 | | 5,677 | | 2,076 | | 759 | | 973 | | 9,485 | |
Income tax expense | | (866 | ) | (526 | ) | (279 | ) | (1,671 | ) | (603 | ) | (208 | ) | (336 | ) | (2,818 | ) |
Profit attributable to non-controlling interests | | - | | - | | (8 | ) | (8 | ) | - | | (3 | ) | (58 | ) | (69 | ) |
Cash Earnings for the year | | 2,114 | | 1,231 | | 653 | | 3,998 | | 1,473 | | 548 | | 579 | | 6,598 | |
Net Cash Earnings adjustments | | - | | (129 | ) | (22 | ) | (151 | ) | - | | - | | (477 | ) | (628 | ) |
Net profit attributable to owners of Westpac Banking Corporation | | 2,114 | | 1,102 | | 631 | | 3,847 | | 1,473 | | 548 | | 102 | | 5,970 | |
| | | | | | | | | | | | | | | | | |
Additional information | | | | | | | | | | | | | | | | | |
Depreciation, amortisation and impairments | | (70 | ) | (44 | ) | (41 | ) | (155 | ) | (37 | ) | (51 | ) | (382 | ) | (625 | ) |
| | | | | | | | | | | | | | | | | |
Balance sheet | | | | | | | | | | | | | | | | | |
Total assets | | 255,268 | | 154,642 | | 26,871 | | 436,781 | | 97,823 | | 48,648 | | 91,713 | | 674,965 | |
Total liabilities | | 159,120 | | 82,421 | | 28,554 | | 270,095 | | 110,389 | | 33,970 | | 214,292 | | 628,746 | |
Acquisition of property, plant and equipment, goodwill and other intangible assets | | 122 | | 105 | | 366 | | 593 | | 56 | | 84 | | 456 | | 1,189 | |
| | |
| 2012 WESTPAC GROUP ANNUAL REPORT | 259 |
NOTE 32. GROUP SEGMENT INFORMATION (CONTINUED)
| | Consolidated 2011 | |
| | Westpac | | | | | | | | | | | | | | | |
| | Retail & | | St.George | | BT Financial | | | | Westpac | | Westpac | | | | | |
| | Business | | Banking | | Group | | | | Institutional | | New | | Other | | | |
| | Banking | | Group | | (Australia) | | AFS | | Bank | | Zealand | | Divisions | | Total | |
| | $m | | $m | | $m | | $m | | $m | | $m | | $m | | $m | |
Net interest income | | 5,166 | | 2,930 | | 438 | | 8,534 | | 1,700 | | 1,137 | | 798 | | 12,169 | |
Non-interest income | | 1,091 | | 549 | | 1,613 | | 3,253 | | 1,182 | | 304 | | 215 | | 4,954 | |
Net operating income before operating expenses and impairment charges | | 6,257 | | 3,479 | | 2,051 | | 11,787 | | 2,882 | | 1,441 | | 1,013 | | 17,123 | |
Operating expenses | | (3,087 | ) | (1,323 | ) | (1,005 | ) | (5,415 | ) | (938 | ) | (627 | ) | (126 | ) | (7,106 | ) |
Impairment charges | | (547 | ) | (393 | ) | 4 | | (936 | ) | 90 | | (185 | ) | 38 | | (993 | ) |
Profit before income tax | | 2,623 | | 1,763 | | 1,050 | | 5,436 | | 2,034 | | 629 | | 925 | | 9,024 | |
Income tax expense | | (773 | ) | (530 | ) | (314 | ) | (1,617 | ) | (607 | ) | (184 | ) | (247 | ) | (2,655 | ) |
Profit attributable to non-controlling interests | | - | | - | | (7 | ) | (7 | ) | - | | (3 | ) | (58 | ) | (68 | ) |
Cash Earnings for the year | | 1,850 | | 1,233 | | 729 | | 3,812 | | 1,427 | | 442 | | 620 | | 6,301 | |
Net Cash Earnings adjustments | | - | | (129 | ) | (17 | ) | (146 | ) | - | | - | | 836 | | 690 | |
Net profit attributable to owners of Westpac Banking Corporation | | 1,850 | | 1,104 | | 712 | | 3,666 | | 1,427 | | 442 | | 1,456 | | 6,991 | |
| | | | | | | | | | | | | | | | | |
Additional information | | | | | | | | | | | | | | | | | |
Depreciation, amortisation and impairments | | (39 | ) | (16 | ) | (30 | ) | (85 | ) | (37 | ) | (49 | ) | (342 | ) | (513 | ) |
| | | | | | | | | | | | | | | | | |
Balance sheet | | | | | | | | | | | | | | | | | |
Total assets | | 246,989 | | 149,595 | | 26,223 | | 422,807 | | 101,482 | | 46,336 | | 99,603 | | 670,228 | |
Total liabilities | | 146,226 | | 72,216 | | 26,978 | | 245,420 | | 96,643 | | 30,366 | | 253,991 | | 626,420 | |
Acquisition of property, plant and equipment, goodwill and other intangible assets | | 94 | | 52 | | 83 | | 229 | | 96 | | 83 | | 736 | | 1,144 | |
| | |
260 | 2012 WESTPAC GROUP ANNUAL REPORT | |
NOTES TO THE FINANCIAL STATEMENTS
NOTE 32. GROUP SEGMENT INFORMATION (CONTINUED)
| | Consolidated 2010 | |
| | Westpac | | | | | | | | | | | | | | | |
| | Retail & | | St.George | | BT Financial | | | | Westpac | | Westpac | | | | | |
| | Business | | Banking | | Group | | | | Institutional | | New | | Other | | | |
| | Banking | | Group | | (Australia) | | AFS | | Bank | | Zealand | | Divisions | | Total | |
| | $m | | $m | | $m | | $m | | $m | | $m | | $m | | $m | |
Net interest income | | 5,052 | | 2,747 | | 376 | | 8,175 | | 1,616 | | 1,090 | | 974 | | 11,855 | |
Non-interest income | | 1,009 | | 577 | | 1,569 | | 3,155 | | 1,400 | | 302 | | 198 | | 5,055 | |
Net operating income before operating expenses and impairment charges | | 6,061 | | 3,324 | | 1,945 | | 11,330 | | 3,016 | | 1,392 | | 1,172 | | 16,910 | |
Operating expenses | | (2,999 | ) | (1,288 | ) | (967 | ) | (5,254 | ) | (917 | ) | (612 | ) | (189 | ) | (6,972 | ) |
Impairment charges | | (587 | ) | (513 | ) | 13 | | (1,087 | ) | (150 | ) | (274 | ) | 55 | | (1,456 | ) |
Profit before income tax | | 2,475 | | 1,523 | | 991 | | 4,989 | | 1,949 | | 506 | | 1,038 | | 8,482 | |
Income tax expense | | (746 | ) | (456 | ) | (290 | ) | (1,492 | ) | (566 | ) | (148 | ) | (331 | ) | (2,537 | ) |
Profit attributable to non-controlling interests | | - | | - | | (8 | ) | (8 | ) | - | | (2 | ) | (56 | ) | (66 | ) |
Cash Earnings for the year | | 1,729 | | 1,067 | | 693 | | 3,489 | | 1,383 | | 356 | | 651 | | 5,879 | |
Net Cash Earnings adjustments | | - | | (129 | ) | (17 | ) | (146 | ) | - | | - | | 613 | | 467 | |
Net profit attributable to owners of Westpac Banking Corporation | | 1,729 | | 938 | | 676 | | 3,343 | | 1,383 | | 356 | | 1,264 | | 6,346 | |
| | | | | | | | | | | | | | | | | |
Additional information | | | | | | | | | | | | | | | | | |
Depreciation, amortisation and impairments | | (32 | ) | (16 | ) | (27 | ) | (75 | ) | (41 | ) | (53 | ) | (343 | ) | (512 | ) |
| | | | | | | | | | | | | | | | | |
Balance sheet | | | | | | | | | | | | | | | | | |
Total assets | | 231,738 | | 145,962 | | 31,745 | | 409,445 | | 88,317 | | 45,598 | | 74,917 | | 618,277 | |
Total liabilities | | 134,555 | | 85,734 | | 28,737 | | 249,026 | | 89,102 | | 27,953 | | 212,078 | | 578,159 | |
Acquisition of property, plant and equipment, goodwill and other intangible assets | | 112 | | 69 | | 42 | | 223 | | 65 | | 68 | | 518 | | 874 | |
| | |
| 2012 WESTPAC GROUP ANNUAL REPORT | 261 |
NOTE 32. GROUP SEGMENT INFORMATION (CONTINUED)
Reconciliation of Cash Earnings to net profit
Consolidated 2012
| | Cash Earnings
for the Year | | Policyholder
Tax
Recoveries | | TPS
Revaluations1 | | Treasury
Shares2 | | Ineffective
Hedges3 | | Fair Value
Gain/(Loss) on
Economic Hedges5 | | |
�� | | $m | | $m | | $m | | $m | | $m | | $m | | |
Net interest income | | 12,563 | | - | | - | | - | | 8 | | (10) | | |
Non-interest income | | 5,513 | | 12 | | (17) | | (30) | | 3 | | - | | |
Net operating income before operating expenses and impairment charges | | 18,076 | | 12 | | (17) | | (30) | | 11 | | (10) | | |
Operating expenses | | (7,379) | | - | | - | | - | | - | | - | | |
Impairment charges | | (1,212) | | - | | - | | - | | - | | - | | |
Profit before income tax | | 9,485 | | 12 | | (17) | | (30) | | 11 | | (10) | | |
Income tax expense | | (2,818) | | (12) | | (10) | | 3 | | (4) | | 3 | | |
Profit attributable to non-controlling interests | | (69) | | - | | - | | - | | - | | - | | |
Cash Earnings for the year | | 6,598 | | - | | (27) | | (27) | | 7 | | (7) | | |
Consolidated 2011
| | Cash Earnings
for the Year | | Policyholder
Tax Recoveries | | TPS
Revaluations1 | | Treasury
Shares2 | | Ineffective
Hedges3 | | Merger Transaction
and Integration
Expenses4 | | |
| | $m | | $m | | $m | | $m | | $m | | $m | | |
Net interest income | | 12,169 | | - | | - | | - | | (13) | | (3) | | |
Non-interest income | | 4,954 | | (12) | | (27) | | 7 | | (5) | | - | | |
Net operating income before operating expenses and impairment charges | | 17,123 | | (12) | | (27) | | 7 | | (18) | | (3) | | |
Operating expenses | | (7,106) | | - | | - | | - | | - | | (92) | | |
Impairment charges | | (993) | | - | | - | | - | | - | | - | | |
Profit before income tax | | 9,024 | | (12) | | (27) | | 7 | | (18) | | (95) | | |
Income tax expense | | (2,655) | | 12 | | 6 | | (1) | | 5 | | 29 | | |
Profit attributable to non-controlling interests | | (68) | | - | | - | | - | | - | | - | | |
Cash Earnings for the year | | 6,301 | | - | | (21) | | 6 | | (13) | | (66) | | |
Consolidated 2010
| | Cash Earnings
for the Year | | Policyholder
Tax Recoveries | | TPS
Revaluations1 | | Treasury
Shares2 | | Ineffective
Hedges3 | | Merger Transaction
and Integration
Expenses4 | | |
| | $m | | $m | | $m | | $m | | $m | | $m | | |
Net interest income | | 11,855 | | - | | - | | - | | (1) | | (3) | | |
Non-interest income | | 5,055 | | (12) | | 13 | | 12 | | 10 | | - | | |
Net operating income before operating expenses and impairment charges | | 16,910 | | (12) | | 13 | | 12 | | 9 | | (3) | | |
Operating expenses | | (6,972) | | - | | - | | - | | - | | (236) | | |
Impairment charges | | (1,456) | | - | | - | | - | | - | | - | | |
Profit before income tax | | 8,482 | | (12) | | 13 | | 12 | | 9 | | (239) | | |
Income tax expense | | (2,537) | | 12 | | (27) | | (2) | | (3) | | 72 | | |
Profit attributable to non-controlling interests | | (66) | | - | | - | | - | | - | | - | | |
Cash Earnings for the year | | 5,879 | | - | | (14) | | 10 | | 6 | | (167) | | |
| | |
262 | 2012 WESTPAC GROUP ANNUAL REPORT | |
NOTES TO THE FINANCIAL STATEMENTS
| | Amortisation
of Intangible
Assets6 | | Fair Value
Amortisation of
Financial
Instruments8 | | Buyback of
Government
Guaranteed
Debt10 | | TOFA Tax
Consolidation
Adjustment12 | | Supplier
Program13 | | Litigation
Provision14 | | Total Cash
Earnings
Adjustments | | Net Profit
for the Year |
| | $m | | $m | | $m | | $m | | $m | | $m | | $m | | $m |
| | - | | (66) | | 7 | | - | | - | | - | | (61) | | 12,502 |
| | - | | - | | - | | - | | - | | - | | (32) | | 5,481 |
| | | | | | | | | | | | | | | | |
| | | | | | | | | | | | | | | | |
| | - | | (66) | | 7 | | - | | - | | - | | (93) | | 17,983 |
| | (220) | | - | | - | | - | | (199) | | (111) | | (530) | | (7,909) |
| | - | | - | | - | | - | | - | | - | | - | | (1,212) |
| | (220) | | (66) | | 7 | | - | | (199) | | (111) | | (623) | | 8,862 |
| | 66 | | 20 | | (2) | | (165) | | 60 | | 33 | | (8) | | (2,826) |
| | 3 | | - | | - | | - | | - | | - | | 3 | | (66) |
| | (151) | | (46) | | 5 | | (165) | | (139) | | (78) | | (628) | | 5,970 |
| | Fair Value
Gain/(Loss) on
Economic
Hedges5 | | Amortisation
of Intangible
Assets6 | | Fair Value
Amortisation of
Financial
Instruments8 | | Tax
Consolidation
Adjustment9 | | Buyback of
Government
Guaranteed
Debt10 | | Tax Provision11 | | Total Cash
Earnings
Adjustments | | Net Profit
for the Year |
| | $m | | $m | | $m | | $m | | $m | | $m | | $m | | $m |
| | (52) | | - | | (98) | | - | | (7) | | - | | (173) | | 11,996 |
| | - | | - | | - | | - | | - | | - | | (37) | | 4,917 |
| | | | | | | | | | | | | | | | |
| | | | | | | | | | | | | | | | |
| | (52) | | - | | (98) | | - | | (7) | | - | | (210) | | 16,913 |
| | - | | (208) | | - | | - | | - | | - | | (300) | | (7,406) |
| | - | | - | | - | | - | | - | | - | | - | | (993) |
| | (52) | | (208) | | (98) | | - | | (7) | | - | | (510) | | 8,514 |
| | 16 | | 62 | | 29 | | 1,110 | | 2 | | (70) | | 1,200 | | (1,455) |
| | - | | - | | - | | - | | - | | - | | - | | (68) |
| | (36) | | (146) | | (69) | | 1,110 | | (5) | | (70) | | 690 | | 6,991 |
| | Fair Value
Gain/(Loss) on
Economic Hedges5 | | Amortisation
of Intangible
Assets6 | | NZ Structured
Finance
Transactions7 | | Fair Value
Amortisation of
Financial Instruments8 | | Tax Consolidation
Adjustment9 | | Total Cash
Earnings
Adjustments | | Net Profit
for the Year |
| | $m | | $m | | $m | | $m | | $m | | $m | | $m |
| | (66) | | - | | - | | 57 | | - | | (13) | | 11,842 |
| | (10) | | - | | - | | - | | - | | 13 | | 5,068 |
| | | | | | | | | | | | | | |
| | | | | | | | | | | | | | |
| | (76) | | - | | - | | 57 | | - | | - | | 16,910 |
| | - | | (208) | | - | | - | | - | | (444) | | (7,416) |
| | - | | - | | - | | - | | - | | - | | (1,456) |
| | (76) | | (208) | | - | | 57 | | - | | (444) | | 8,038 |
| | 23 | | 62 | | 106 | | (17) | | 685 | | 911 | | (1,626) |
| | - | | - | | - | | - | | - | | - | | (66) |
| | (53) | | (146) | | 106 | | 40 | | 685 | | 467 | | 6,346 |
| | |
| 2012 WESTPAC GROUP ANNUAL REPORT | 263 |
NOTE 32. GROUP SEGMENT INFORMATION (CONTINUED)
| | Year Ended | | Year Ended | | Year Ended | |
| | 30 September 2012 | | 30 September 2011 | | 30 September 2010 | |
| | $m | | $m | | $m | |
Cash Earnings for the year | | 6,598 | | 6,301 | | 5,879 | |
Cash Earnings adjustments: | | | | | | | |
TPS revaluations1 | | (27 | ) | (21 | ) | (14 | ) |
Treasury shares2 | | (27 | ) | 6 | | 10 | |
Ineffective hedges3 | | 7 | | (13 | ) | 6 | |
Merger transaction and integration expenses4 | | - | | (66 | ) | (167 | ) |
Fair value gain/(loss) on economic hedges5 | | (7 | ) | (36 | ) | (53 | ) |
Amortisation of intangible assets6 | | (151 | ) | (146 | ) | (146 | ) |
NZ structured finance transactions7 | | - | | - | | 106 | |
Fair value amortisation of financial instruments8 | | (46 | ) | (69 | ) | 40 | |
St.George tax consolidation adjustment9 | | - | | 1,110 | | 685 | |
Buyback of government guaranteed debt10 | | 5 | | (5 | ) | - | |
Tax Provision11 | | - | | (70 | ) | - | |
TOFA tax consolidation adjustment12 | | (165 | ) | - | | - | |
Supplier program13 | | (139 | ) | - | | - | |
Litigation provision14 | | (78 | ) | - | | - | |
Total Cash Earnings adjustments | | (628 | ) | 690 | | 467 | |
Net profit attributable to owners of Westpac Banking Corporation | | 5,970 | | 6,991 | | 6,346 | |
1 Adjustment for movements in economic hedges, including associated tax effects impacting the Foreign Currency Translation Reserve, relating to hybrid instruments classified as non-controlling interests. The adjustment is required as these hybrid instruments are not fair valued, however, the hedges are fair valued and therefore, there is a mismatch in the timing of income recognition in the statutory results. The mismatch is added back to statutory results in deriving Cash Earnings as it does not affect the Group’s profits over time.
2 Under A-IFRS, Westpac shares held by the Group in the managed funds and life business are deemed to be Treasury shares and the results of holding these shares are not permitted to be recognised as income in the statutory results. In deriving Cash Earnings, these results are included to ensure there is no asymmetrical impact on the Group’s profits because the Treasury shares support policyholder liabilities and equity derivative transactions which are re-valued in deriving income.
3 The gain/(loss) on ineffective hedges is reversed in deriving Cash Earnings for the period because the gain or loss arising from the fair value movement in these hedges reverses over time and does not affect the Group’s profits over time.
4 As part of the merger with St.George, transaction and integration expenses incurred over three years following the merger were treated as a Cash Earnings adjustment as they did not impact the earnings expected from St.George following the integration period. The integration project was completed in 2011.
5 Fair value gain/(loss) on economic hedges (which do not qualify for hedge accounting under A-IFRS) comprises:
§ the unrealised fair value gain/(loss) on foreign exchange hedges of future New Zealand earnings impacting non-interest income is reversed in deriving Cash Earnings as they may create a material timing difference on statutory results but do not affect the Group’s Cash Earnings during the life of the hedge;
§ the unrealised fair value gain/(loss) on foreign exchange hedges of fees payable for the use of the Government guarantee on foreign denominated wholesale funding is reversed in deriving Cash Earnings as they may create a material timing difference on statutory results but do not affect the Group’s Cash Earnings during the life of the hedge; and
§ the unrealised fair value gain/(loss) on hedges of accrual accounted term funding transactions are reversed in deriving Cash Earnings as they may create a material timing difference on statutory results but do not affect the Group’s Cash Earnings during the life of the hedge.
6 Acquisition of intangible assets comprise:
§ the merger with St.George resulted in the recognition of core deposit intangibles and customer relationships intangible assets that are amortised over their useful lives, ranging between five and nine years. The amortisation of intangible assets (excluding capitalised software) is a Cash Earnings adjustment because it is a non-cash flow item and does not affect cash distributions available to shareholders; and
§ the acquisition of J O Hambro, previously a privately owned London-based equity investment manager, by BT Investment Management (BTIM) during the year ended 30 September 2012 resulted in the recognition of management contract intangible assets. These intangible items are amortised over their useful lives, ranging between five and twenty years. The amortisation of intangible assets (excluding capitalised software) is a Cash Earnings adjustment because it is a non-cash flow item and does not affect cash distributions available to shareholders.
7 During the year ended 30 September 2010, $106 million out of the $703 million tax provision raised in September 2009 was reversed following settlement with the New Zealand Commissioner of Inland Revenue (CIR) in relation to New Zealand structured finance transaction entered into between 1998 and 2002. The Group agreed to pay 80% of the full amount of primary tax and interest. Given the size and historical nature of the issue, the original tax provision and the subsequent reversal were treated as Cash Earnings adjustments.
8 The accounting for the merger with St.George resulted in the recognition of fair value adjustments on the St.George retail bank loans, deposits, wholesale funding and associated hedges, with these fair value adjustments being amortised over the life of the underlying transactions. The amortisation of these adjustments is considered to be a timing difference relating to non-cash flow items that do not affect cash distributions available to shareholders, and therefore have been treated as a Cash Earnings adjustment.
9 Finalisation of tax consolidation related to the merger with St.George gave rise to a reduction in income tax expense of $1,110 million during the year ended 30 September 2011 and $685 million during the year ended 30 September 2010. The tax consolidation process required Westpac to reset the tax value of certain St.George assets to the appropriate market value of those assets at the effective date of the tax consolidation (31 March 2009). These adjustments have been treated as a Cash Earnings adjustment due to their size and because they do not reflect ongoing operations.
| | |
264 | 2012 WESTPAC GROUP ANNUAL REPORT | |
NOTES TO THE FINANCIAL STATEMENTS
NOTE 32. GROUP SEGMENT INFORMATION (CONTINUED)
10 During the year ended 30 September 2011, the Group bought back some Government guaranteed debt which reduced Government guarantee fees (70 basis points) paid. In undertaking the buybacks, in addition to the 70 basis point fee saving, a cost was incurred reflecting the difference between current interest rates and the rate at which the debt was initially issued. In the statutory result, the cost incurred is recognised at the time of the buybacks. In Cash Earnings, the cost incurred is being amortised over the original term of the debt that was bought back. The Cash Earnings adjustment gives effect to the timing difference between statutory results and Cash Earnings.
11 During the year ended 30 September 2011, the Group increased tax provisions by $70 million in respect of certain existing positions for transactions previously undertaken by the Group. The increase reflected the recent trend of global taxation authorities challenging the historical tax treatment of cross border and complex transactions. This increase in tax provisions was treated as a Cash Earnings adjustment as it related to the global management of historical tax positions and does not reflect ongoing operations. The Group’s management of tax positions has moved to disclosing any such transactions to the taxation authorities at or around the time of execution.
12 During the year ended 30 September 2012, new legislation that included retrospective amendments to the income tax law as it applies to the Taxation of Financial Arrangements (TOFA) and tax consolidated groups was introduced. The amendments have an adverse application to certain liabilities that were consolidated as part of the merger with St.George. This gave rise to an additional income tax expense of $165 million for the year ended 30 September 2012. Consistent with other tax adjustments relating to the merger with St.George this adjustment has been treated as a Cash Earnings adjustment due to its size and because it does not reflect ongoing operations.
13 During the year ended 30 September 2012, the Group incurred and provisioned for non-recurring expenses as part of its program to increase the use of global specialists in certain technology and back office operations. These expenses included costs associated with streamlining and better documenting systems and processes, technology costs to enable infrastructure and enhance interaction with suppliers, and costs associated with restructuring the workforce. Given these significant expenses are not considered in determining dividends they are being treated as Cash Earnings adjustments.
14 The Group recognised a provision of $111 million ($78 million after tax) with respect to longstanding legal proceedings. This has been treated as a Cash Earnings adjustment due to its size, the historical nature of the proceedings and because it does not reflect ongoing operations.
Revenue from Products and Services
Details of revenue from external customers by product or service are disclosed in Notes 2 and 3. No single customer amounts to greater than 10% of the Group’s revenue.
Secondary reporting – geographic segments
Geographic segments are based on the location of the office in which the following items are recognised:
| | 2012 | | 2011 | | 2010 | |
| | $m | | % | | $m | | % | | $m | | % | |
Revenue | | | | | | | | | | | | | |
Australia | | 38,195 | | 90.2 | | 39,192 | | 91.1 | | 35,376 | | 90.2 | |
New Zealand | | 3,676 | | 8.7 | | 3,559 | | 8.3 | | 3,592 | | 9.2 | |
Other1 | | 483 | | 1.1 | | 264 | | 0.6 | | 251 | | 0.6 | |
Total | | 42,354 | | 100.0 | | 43,015 | | 100.0 | | 39,219 | | 100.0 | |
Non-current assets2 | | | | | | | | | | | | | |
Australia | | 12,250 | | 92.3 | | 12,282 | | 94.9 | | 11,912 | | 95.2 | |
New Zealand | | 650 | | 4.9 | | 605 | | 4.7 | | 564 | | 4.5 | |
Other1 | | 371 | | 2.8 | | 50 | | 0.4 | | 38 | | 0.3 | |
Total | | 13,271 | | 100.0 | | 12,937 | | 100.0 | | 12,514 | | 100.0 | |
1 Other includes Pacific Islands, Asia, the Americas and Europe.
2 Non-current assets includes property, plant and equipment, goodwill and other intangible assets.
| | |
| 2012 WESTPAC GROUP ANNUAL REPORT | 265 |
NOTE 33. AUDITOR’S REMUNERATION
During the financial year, the auditor of the Group and Parent Entity, PricewaterhouseCoopers (PwC), and its related practices earned the following remuneration including goods and services tax:
| | Consolidated | | Parent Entity | |
| | 2012 | | 2011 | | 2012 | | 2011 | |
| | $’000 | | $’000 | | $’000 | | $’000 | |
PwC – Australian firm | | | | | | | | | |
Audit and review of financial reports of Westpac Banking Corporation or any entity in the Group | | 15,249 | | 14,111 | | 14,874 | | 13,757 | |
Other audit-related work | | 1,476 | | 1,802 | | 1,465 | | 1,741 | |
Total audit and other assurance services | | 16,725 | | 15,913 | | 16,339 | | 15,498 | |
Taxation | | 65 | | 222 | | 65 | | 62 | |
Other services | | 696 | | 2,504 | | 668 | | 1,194 | |
Total remuneration paid to PwC – Australian firm | | 17,486 | | 18,639 | | 17,072 | | 16,754 | |
| | | | | | | | | |
Related practices of PwC | | | | | | | | | |
Audit and review of financial reports of Westpac Banking Corporation or any entity in the Group | | 2,773 | | 2,762 | | 340 | | 108 | |
Other audit-related work | | 139 | | 157 | | - | | - | |
Total audit and other assurance services | | 2,912 | | 2,919 | | 340 | | 108 | |
Taxation | | 114 | | 84 | | - | | 6 | |
Other services | | - | | 97 | | - | | 43 | |
Total remuneration paid to related practices of PwC | | 3,026 | | 3,100 | | 340 | | 157 | |
Total remuneration paid to PwC | | 20,512 | | 21,739 | | 17,412 | | 16,911 | |
For compliance with SEC disclosure requirements, remuneration to the external auditor, including goods and services tax, for the years ended 30 September 2012 and 2011 is summarised from the table above as follows:
| | 2012 | | 2011 | |
| | $’000 | | $’000 | |
Audit fees | | 18,022 | | 16,873 | |
Non-audit fees: | | | | | |
Audit-related fees | | 1,615 | | 1,959 | |
Tax fees | | 179 | | 306 | |
All other fees | | 696 | | 2,601 | |
Total non-audit fees | | 2,490 | | 4,866 | |
Total fees paid to PwC | | 20,512 | | 21,739 | |
It is Westpac’s policy to engage the external auditors on assignments additional to their statutory audit duties, only if their independence is not impaired or seen to be impaired, and where their expertise and experience with Westpac is important. All services were approved by the Audit Committee in accordance with the pre-approval policy and procedures.
In the tables above, audit services include the audit of the year end and review of the half year statutory reports and comfort letters associated with debt issues and capital raisings for the Parent Entity, its controlled entities and the consolidated Group.
Audit-related services include consultations regarding accounting standards and reporting requirements and regulatory compliance reviews.
Taxation services include tax compliance and tax advisory services.
Other services include consulting services in relation to the Supplier Program and the Business Resilience Framework.
The external auditor, PwC, also provides audit and non-audit services to non-consolidated entities sponsored by the Group, non-consolidated trusts of which a Westpac Group entity is trustee, manager or responsible entity and non-consolidated superannuation funds or pension funds. The fees in respect of their services were approximately $8.6 million in total (2011: $8.5 million). PwC may also provide audit and non-audit services to other entities in which Westpac holds a minority interest, and which are not consolidated. Westpac is not aware of the amount of any fees paid by those entities.
| | |
266 | 2012 WESTPAC GROUP ANNUAL REPORT | |
NOTES TO THE FINANCIAL STATEMENTS
NOTE 34. EXPENDITURE COMMITMENTS
| | Consolidated | | Parent Entity | |
| | 2012 | | 2011 | | 2012 | | 2011 | |
| | $m | | $m | | $m | | $m | |
Lease commitments (all leases are classified as operating leases) | | | | | | | | | |
Premises and sites | | 3,747 | | 2,470 | | 3,423 | | 2,166 | |
Furniture and equipment | | 16 | | 13 | | 9 | | 9 | |
Total lease commitments | | 3,763 | | 2,483 | | 3,432 | | 2,175 | |
Due within one year | | 490 | | 467 | | 437 | | 414 | |
Due after one year but not later than five years | | 1,565 | | 1,304 | | 1,401 | | 1,165 | |
Due after five years | | 1,708 | | 712 | | 1,594 | | 596 | |
Total lease commitments | | 3,763 | | 2,483 | | 3,432 | | 2,175 | |
Other expenditure commitments1 | | | | | | | | | |
Payable within one year | | 687 | | 697 | | 623 | | 595 | |
Payable later than one year but not later than five years | | 1,450 | | 1,572 | | 1,214 | | 1,293 | |
Payable after five years | | 64 | | 47 | | 64 | | 47 | |
Total other expenditure commitments | | 2,201 | | 2,316 | | 1,901 | | 1,935 | |
1 Amounts presented for other expenditure commitments represent the estimated spend on Westpac’s significant contracts over their remaining term. This would differ from the contractually committed amount.
As at 30 September 2012, the total future minimum lease payments expected to be received by the Group and Parent Entity from non-cancellable sub-leases was $21 million (2011: $23 million) and $21 million (2011: $22 million) respectively.
Operating lease arrangements
Operating leases are entered into to meet the business needs of entities in the Group. Leases are primarily over commercial and retail premises and plant and equipment. Lease rentals are determined in accordance with market conditions when leases are entered into or on rental review dates.
Leased premises that have become excess to the Group’s business needs have been sublet where possible and any expected rental shortfalls fully provided for. There are no restrictions imposed on the Group by lease arrangements other than in respect of the specific premises being leased.
The Group has lease commitments resulting from the sale and lease back of various premises. These leases are generally for a term of five years with an option to extend for another five years. In most instances, other than the lease arrangement, the Group has no ongoing interests in the premises.
Service agreements
The maximum contingent liability for termination benefits in respect of service agreements with the CEO and other Group Key Management Personnel at 30 September 2012 was $15.1 million (2011: $13.4 million).
Significant long term agreements
With the expiry of Westpac’s agreement with Cash Services Australia and unwind of services by 28 November 2012, Westpac will take on direct responsibility for commercial and operational governance of cash-in-transit providers under a multi vendor model. On 1 July 2012 and 30 July 2012, Westpac entered into five year agreements with Toll Transport Pty Limited and Linfox Armaguard Pty Limited respectively for the provision of cash-in-transit services.
On 14 July 2008 Westpac entered into a three year agreement with Toll Transport Pty Ltd for the provision of freight and courier services, which was extended on 14 July 2011 for 18 months. On 30 June 2012, Westpac signed a further extension with Toll for 4.5 years expiring on 11 July 2017.
On 25 June 2012 Westpac entered into a five year agreement with InfoSys Technologies Limited to provide applications development, maintenance and support services within the corporate systems and applications testing area of technology.
On 25 June 2012 Westpac entered into a five year agreement with Tata Consultancy Services Ltd to provide applications developments, maintenance and support services within the information systems area of technology.
On 1 January 2012, the agreement between Westpac and IBM Daksh Business Process Services Pty Limited for the provision of business process outsourcing services was novated to IBM Australia Limited and the term extended by two years to December 2018.
On 30 September 2011, Westpac extended its agreement with IBM New Zealand Limited for a further five years, commencing 1 March 2012 to 28 February 2017. IBM is responsible for Westpac’s IT infrastructure services in New Zealand including mainframes and midrange systems, storage, security, data centre network services and workplace printing.
On 26 August 2011, Westpac extended its agreement with Telstra Corporation Limited for a further two years, to December 2013. The extended agreement relates to the provision of telecommunications outsourcing services to Westpac in Australia and internationally, including the Pacific Islands, Asia and Europe.
| | |
| 2012 WESTPAC GROUP ANNUAL REPORT | 267 |
NOTE 34. EXPENDITURE COMMITMENTS (CONTINUED)
On 18 May 2011, Westpac entered an agreement with HP Enterprise Services BPA Limited (HP) to amend and extend its loan processing service agreement for a further four years. Under the revised agreement, Westpac will assume business mortgage processing services that had been previously provided by HP, with HP continuing to provide IT services that underpin the business processing functions for the duration of the contract.
On 29 December 2010, Westpac entered into a three year mortgage services agreement with Unisys Mortgage Processing (No. 1) Pty Ltd (UMP) to provide back office servicing of RAMS home loans, and to appoint UMP as an authorised credit representative under Westpac’s Australian credit licence. The agreement commenced on 1 January 2011. On 25 November 2011 the agreement was varied so as to include the back office servicing of RAMS deposit products, and to appoint UMP as an authorised representative under Westpac’s Australian Financial Services Licence.
On 19 November 2010, Westpac entered into an agreement with IBM Australia Limited to replace the existing agreement with IBM Global Services Australia which ended in April 2011. The new agreement relates to the core banking technology operations in Australia and has an initial term of five years.
On 27 July 2010, Westpac entered into an agreement with Fujitsu Australia Limited to construct a purpose built data centre facility in Western Sydney. Completion of the data centre triggered the services agreement and the lease for the data centre. The lease is for 15 years with three further five year options and the services agreement is for 15 years with two further five year options.
On 28 June 2010, Westpac extended its agreement with FD Australia Limited to provide a managed service for cards processing until 2019. This involves managing the application within the Westpac/IBM environment. FD Australia Limited has been providing services for Westpac’s Australasian cards processing in phases since October 2002. Westpac retains control of its cards sales, credit, collections and customer service functions.
On 24 June 2010, Westpac entered into an agreement with Fiserv Solutions of Australia Pty Limited (Fiserv) under which Westpac licenses certain software and Fiserv provides services in connection with Westpac’s online transformation program. The term of maintenance and support has been extended to eight years that can be renewed by Westpac for periods of 12 months each. The agreement continues until Fiserv’s obligations have been completed in respect of the program.
On 22 December 2009, Westpac entered into a five year master services agreement with United Group Services Pty Limited (now trading as DTZ Australia Pty Ltd) for the provision of real estate services, facilities management, workplace management, program management and finance management. The agreement commenced on 1 April 2010.
On 1 October 2007, St.George entered into a four year agreement with Optus Networks Pty Limited for the provision of telecommunications carriage services and various outsourced administration functions. Following the initial four year term the agreement was extended for a fifth year due to certain service level agreements being met.
On 3 November 2006, Westpac entered into a master relationship agreement with Genpact U.S. LLC for the provision of back office administrative support services. Following expiry of the initial five year term, the agreement term will automatically extend until terminated.
On 4 February 2005, Westpac, in conjunction with the National Australia Bank and the Commonwealth Bank of Australia, entered into a 12 year agreement with Fiserv Solutions Australia Pty Limited for the provision of voucher (cheque) processing services.
Commitments in relation to long-term contracts are included in other expenditure commitments above.
| | |
268 | 2012 WESTPAC GROUP ANNUAL REPORT | |
NOTES TO THE FINANCIAL STATEMENTS
NOTE 35. SUPERANNUATION COMMITMENTS
Westpac had the following defined benefit plans at 30 September 2012:
Name of Plan | | Type | | Form of Benefit | | Date of Last Actuarial
Assessment of the Funding
Status |
| | | | | | |
Westpac Group Plan (WGP)1 | | Defined benefit and accumulation | | Indexed pension and lump sum | | 30 June 2012 |
| | | | | | |
Westpac New Zealand Superannuation Scheme (WNZS) | | Defined benefit and accumulation | | Indexed pension and lump sum | | 30 June 2011 |
| | | | | | |
Westpac Banking Corporation UK Staff Superannuation Scheme (UKSS) | | Defined benefit | | Indexed pension and lump sum | | 5 April 20092 |
| | | | | | |
Westpac UK Medical Benefits Scheme | | Defined benefit | | Medical benefits | | Not applicable |
| | | | | | |
1 Formerly the Westpac Staff Superannuation Plan (WSSP) and the M&F Defined Benefit Category of the St.George Staff sub-plan of the Plum Superannuation Fund (SGPSF).
2 An actuarial assessment of the fund at 5 April 2012 is currently in progress.
All of the defined benefit sections of the schemes are closed to new members.
Contributions
Funding recommendations are made based on the Attained Age Method, which impacts the timing of contribution requirements and assumes that the plans will not be discontinued.
The specific contributions for each of the plans are set out below:
¾ WGP – contributions are made to the WGP at the rate of 11.6% of members’ salaries;
¾ WNZS – contributions are made to the WNZS at the rate of 12% of members’ salaries; and
¾ UKSS – contributions are made to the UKSS at the rate of £4.27 million per annum.
The table below summarises the calculation of the surplus/(deficit) used to make funding recommendations, based on the guidance in Australian Accounting Standard AAS 25 Financial Reporting by Superannuation Plans:
| | Consolidated | | Parent Entity | |
| | 2012 | ¹ | 2011 | ² | 2012 | ¹ | 2011² | |
| | $m | | $m | | $m | | $m | |
Market value of assets | | 1,667 | | 1,800 | | 1,610 | | 1,739 | |
Present value of accrued benefits | | 1,642 | | 1,724 | | 1,575 | | 1,655 | |
Surplus/(deficit) | | 25 | | 76 | | 35 | | 84 | |
1 Calculated as at 30 June 2012 (WGP), 5 April 2009 (UKSS) and 30 June 2011 (WNZS).
2 Calculated as at 30 June 2009 (WSSP), 5 April 2009 (UKSS), 30 June 2010 (WNZS) and 30 June 2009 (SGPSF).
The following economic assumptions applied for the funding calculations differ to assumptions used in the accounting calculations due to different valuation dates, discount rates and assumptions linked to expected returns on assets.
| | WGP | | WNZS | | UKSS | |
Discount rate | | 7.3% | | 5.5% | | 6.5% | |
Expected return on plan assets | | 7.3% | | 5.5% | | 5.4% | |
Expected increase in average salary of plan members | | 4.0% | | 3.5% | | 4.7% | |
| | |
| 2012 WESTPAC GROUP ANNUAL REPORT | 269 |
NOTE 35. SUPERANNUATION COMMITMENTS (CONTINUED)
Defined benefit deficit
The defined benefit deficit amount reported in the balance sheet, based on the AASB 119 Employee Benefits accounting calculations can be reconciled as follows:
| | Consolidated | | Parent Entity | |
| | 2012 | | 2011 | | 2010 | | 2009 | | 2008 | | 2012 | | 2011 | | 2010 | | 2009 | | 2008 | |
| | $m | | $m | | $m | | $m | | $m | | $m | | $m | | $m | | $m | | $m | |
Present value of funded and unfunded obligations | | 2,368 | | 2,345 | | 2,134 | | 2,042 | | 2,139 | | 2,254 | | 2,241 | | 2,039 | | 1,915 | | 2,041 | |
Fair value of plan assets | | 1,736 | | 1,669 | | 1,709 | | 1,654 | | 1,666 | | 1,679 | | 1,610 | | 1,651 | | 1,553 | | 1,604 | |
Net obligations | | (632 | ) | (676 | ) | (425 | ) | (388 | ) | (473 | ) | (575 | ) | (631 | ) | (388 | ) | (362 | ) | (437 | ) |
Defined benefit superannuation expense
The amount recognised in the income statement is as follows:
| | Consolidated | | Parent Entity | |
| | 2012 | | | 2011 | | 2010 | | 2012 | | | 2011 | | 2010 | |
| | $m | | | $m | | $m | | $m | | | $m | | $m | |
Current service cost | | 60 | | | 56 | | 57 | | 59 | | | 55 | | 56 | |
Past service cost | | - | | | (3 | ) | - | | - | | | (3 | ) | - | |
Interest cost | | 89 | | | 96 | | 98 | | 87 | | | 94 | | 95 | |
Expected return on fund assets | | (110 | ) | | (120 | ) | (116 | ) | (107 | ) | | (117 | ) | (112 | ) |
Net defined benefit superannuation expense | | 39 | | | 29 | | 39 | | 39 | | | 29 | | 39 | |
Change in benefit obligation
The change in the present value of the defined benefit obligation is as follows:
| | Consolidated | | Parent Entity | |
| | 2012 | | | 2011 | | 2012 | | | 2011 | |
| | $m | | | $m | | $m | | | $m | |
Benefit obligation at the beginning of the period | | 2,345 | | | 2,134 | | 2,241 | | | 2,039 | |
Current service cost | | 60 | | | 56 | | 59 | | | 55 | |
Past service cost | | - | | | (3 | ) | - | | | (3 | ) |
Interest cost | | 89 | | | 96 | | 87 | | | 94 | |
Actuarial losses/(gains) | | 43 | | | 234 | | 27 | | | 233 | |
Contributions by members | | 16 | | | 18 | | 16 | | | 17 | |
Benefits paid | | (182 | ) | | (199 | ) | (172 | ) | | (189 | ) |
Exchange and other adjustments | | (3 | ) | | 9 | | (4 | ) | | (5 | ) |
Benefit obligation at the end of the period | | 2,368 | | | 2,345 | | 2,254 | | | 2,241 | |
Funded status of plans: | | | | | | | | | | | |
Unfunded obligations1 | | 14 | | | 17 | | 14 | | | 17 | |
Wholly or partly funded obligations | | 2,354 | | | 2,328 | | 2,240 | | | 2,224 | |
| | 2,368 | | | 2,345 | | 2,254 | | | 2,241 | |
1 Unfunded obligations relate to the UK medical benefits scheme in respect of which assets are not held in a separate plan. Westpac’s obligations for the UK medical benefits scheme is included in the defined benefit liability.
| | |
270 | 2012 WESTPAC GROUP ANNUAL REPORT | |
NOTES TO THE FINANCIAL STATEMENTS
NOTE 35. SUPERANNUATION COMMITMENTS (CONTINUED)
Change in plan assets
The change in the fair value of plan assets is as follows:
| | Consolidated | | Parent Entity | |
| | 2012 | | | 2011 | | 2012 | | | 2011 | |
| | $m | | | $m | | $m | | | $m | |
Fair value of plan assets at beginning of the year | | 1,669 | | | 1,709 | | 1,610 | | | 1,651 | |
Expected returns on plan assets | | 110 | | | 120 | | 107 | | | 117 | |
Actuarial (losses)/gains | | 77 | | | (31 | ) | 76 | | | (29 | ) |
Actual returns on plan assets | | 187 | | | 89 | | 183 | | | 88 | |
Employer contributions | | 49 | | | 54 | | 46 | | | 47 | |
Contributions by members | | 16 | | | 18 | | 16 | | | 17 | |
Benefits paid | | (182 | ) | | (199 | ) | (172 | ) | | (189 | ) |
Exchange and other adjustments | | (3 | ) | | (2 | ) | (4 | ) | | (4 | ) |
Fair value of plan assets at end of the year | | 1,736 | | | 1,669 | | 1,679 | | | 1,610 | |
Assumptions used in the AASB 119 accounting calculations
| | Consolidated and Parent Entity |
| | 2012 | | | 2011 |
| | Australian | | Overseas | | | Australian | | Overseas |
| | Funds | | Funds | | | Fund | | Funds |
Discount rate1 | | 4.1% | | 2.5-4.4% | | | 4.3-4.7% | | 3.2-5.2% |
Expected return on plan assets – active members | | 6.6% | | 5.1-6.0% | | | 6.7-6.8% | | 6.0-6.1% |
Expected return on plan assets – pensioners | | 7.5% | | 5.1-6.0% | | | 7.8% | | 6.0-6.1% |
Expected increase in average salary of plan members | | 3.5% | | 3.5-4.7% | | | 3.5-4.5% | | 3.5-4.8% |
Rate of increase for pensions | | 2.5% | | 2.5-3.0% | | | 2.5% | | 2.5-3.2% |
Initial health care inflation | | n/a | | 7.0% | | | n/a | | 6.0% |
Long-term health care inflation | | n/a | | 2.0-4.0% | | | n/a | | 4.0% |
1 In the current year we have changed the discount rate assumption for WGP (formerly the WSSP and SGPSF) from one based on the yield on 10 year Australian Federal Government bonds to a rate based on the weighted average yield on the population of available state and federal government bonds with durations exceeding 10 years. The change of assumption reduced the defined benefit obligation by $79 million, recognised directly in retained earnings as part of actuarial gains and losses.
In addition to the financial assumptions presented above, the pension mortality assumptions may also have a significant impact on measuring the net obligation. The average mortality assumptions are age related and allowances are made for future mortality improvements. The assumptions for our principal fund the WGP for 2012 are that a 60-year-old male pensioner is assumed to have a remaining life expectancy of 31.3 and a 60-year-old female pensioner is assumed to have a remaining life expectancy of 35.0.
AASB 119 requires that the expected return on assets be based on assumptions about the expected long-term rate of return. The expected returns on assets were calculated as the weighted average return based on the benchmark asset allocation and estimates of the expected future return in each sector in each asset class (consistent with the inflation assumption). The expected return on assets for active members is net of tax and the expected return on pensioner assets is gross of tax.
Experience adjustments
| | Consolidated | | Parent Entity | |
| | 2012 | | 2011 | | 2010 | | 2009 | | 2008 | | 2012 | | 2011 | | 2010 | | 2009 | | 2008 | |
| | $m | | $m | | $m | | $m | | $m | | $m | | $m | | $m | | $m | | $m | |
Experience adjustments on plan assets | | 77 | | (31 | ) | (3 | ) | (69 | ) | (473 | ) | 76 | | (29 | ) | (1 | ) | (66 | ) | (454 | ) |
Experience adjustments on plan liabilities | | (43 | ) | (234 | ) | (125 | ) | 112 | | (64 | ) | (27 | ) | (233 | ) | (113 | ) | 96 | | (56 | ) |
| | |
| 2012 WESTPAC GROUP ANNUAL REPORT | 271 |
NOTE 35. SUPERANNUATION COMMITMENTS (CONTINUED)
Asset allocation
The actual asset allocation at 30 September was:
| | Consolidated and Parent Entity | |
| | 2012 | | | 2011 | |
| | Australian | | Overseas | | | Australian | | Overseas | |
| | Funds | | Funds | | | Fund | | Funds | |
Cash | | 4% | | 1% | | | 6% | | 1% | |
Equity instruments | | 50% | | 40–57% | | | 49–66% | | 47–55% | |
Debt instruments | | 21% | | 42–50% | | | 21–30% | | 44–53% | |
Property | | 6% | | 10% | | | 4–7% | | - | |
Other assets | | 19% | | - | | | 17% | | - | |
| | 100% | | 100% | | | 100% | | 100% | |
Investments held in Westpac and related entities
| | Consolidated | | Parent Entity | |
| | 2012 | | | 2011 | | 2012 | | | 2011 | |
| | $m | | | $m | | $m | | | $m | |
Value of plan assets invested in debt and equity securities of Westpac1 | | 7 | | | 73 | | - | | | 66 | |
Value of plan assets invested in related parties of Westpac | | 13 | | | 13 | | 13 | | | 13 | |
Total | | 20 | | | 86 | | 13 | | | 79 | |
1 On 31 March 2012, WGP was established. All assets, members and benefits of the former WSSP and SGPSF Plans were transferred to WGP. Under the new structure, the plan no longer holds a direct investment in Westpac securities.
Post-retirement health care
The effect of a one percentage point change in assumed health care trend rates, assuming all other assumptions remain constant, would not be material on either the current service costs or the accumulated benefit obligation of the Westpac UK Medical Benefits Scheme at 30 September 2012.
NOTE 36. CONTINGENT LIABILITIES, CONTINGENT ASSETS AND CREDIT COMMITMENTS
The Group is a party to financial instruments with off-balance sheet credit risk in the normal course of business to meet the financing needs of its customers and in managing its own risk profile. These financial instruments include commitments to extend credit, bill endorsements, financial guarantees, standby letters of credit and underwriting facilities.
The Group’s exposure to credit loss in the event of non-performance by the other party is represented by the contract or notional amount of those financial instruments. However, some commitments to extend credit and provide underwriting facilities can be cancelled or revoked at any time at the Group’s option.
The Group uses the same credit policies in making commitments and conditional obligations as it does for on-balance sheet instruments.
The Group takes collateral where it is considered necessary to support both on- and off-balance sheet financial instruments with credit risk. The Group evaluates each customer’s credit worthiness on a case-by-case basis. The amount of collateral taken, if deemed necessary, on the provision of a financial facility is based on management’s evaluation of the credit risk of the counterparty.
| | |
272 | 2012 WESTPAC GROUP ANNUAL REPORT | |
NOTES TO THE FINANCIAL STATEMENTS
NOTE 36. CONTINGENT LIABILITIES, CONTINGENT ASSETS AND CREDIT COMMITMENTS (CONTINUED)
Off-balance sheet credit risk-related financial instruments excluding derivatives at 30 September are as follows:
| | Contract or Notional Amount | |
| | Consolidated | | Parent Entity | |
| | 2012 | | 2011 | | 2012 | | 2011 | |
| | $m | | $m | | $m | | $m | |
Credit risk-related instruments | | | | | | | | | | | | |
Standby letters of credit and financial guarantees1 | | 4,474 | | | 5,072 | | | 4,402 | | | 5,014 | |
Trade letters of credit2 | | 2,589 | | | 3,558 | | | 2,542 | | | 3,513 | |
Non-financial guarantees3 | | 8,908 | | | 8,928 | | | 8,253 | | | 8,718 | |
Commitments to extend credit4 | | 139,809 | | | 136,160 | | | 125,787 | | | 126,575 | |
Other commitments5 | | 98 | | | 526 | | | 98 | | | 526 | |
Total credit risk-related instruments | | 155,878 | | | 154,244 | | | 141,082 | | | 144,346 | |
1 Standby letters of credit are undertakings to pay, against presentation documents, an obligation in the event of a default by a customer. Guarantees are unconditional undertakings given to support the obligations of a customer to third parties. The Group may hold cash as collateral for certain guarantees issued.
2 Trade letters of credit are undertakings by the Group to pay or accept drafts drawn by an overseas supplier of goods against presentation of documents in the event of default by a customer.
3 Non-financial guarantees include undertakings that oblige the Group to pay third parties should a customer fail to fulfil a contractual
non-monetary obligation.
4 Commitments to extend credit include all obligations on the part of the Group to provide credit facilities. As facilities may expire without being drawn upon, the notional amounts do not necessarily reflect future cash requirements. In addition to the commercial commitments disclosed above at 30 September 2012, the Group offered $7.4 billion (2011: $6.2 billion) of facilities to customers, which had not yet been accepted.
5 Other commitments include underwriting facilities.
| | Consolidated 2012 | |
| | Up to | | Over 1 | | Over 3 | | Over | | | |
| | 1 Year | | to 3 Years | | to 5 Years | | 5 Years | | Total | |
| | $m | | $m | | $m | | $m | | $m | |
Standby letters of credit and financial guarantees | | 1,334 | | 2,160 | | 493 | | 487 | | 4,474 | |
Trade letters of credit | | 2,589 | | - | | - | | - | | 2,589 | |
Non-financial guarantees | | 5,080 | | 1,555 | | 218 | | 2,055 | | 8,908 | |
Commitments to extend credit | | 46,369 | | 39,890 | | 12,492 | | 41,058 | | 139,809 | |
Other commitments | | 36 | | - | | - | | 62 | | 98 | |
Total commercial commitments | | 55,408 | | 43,605 | | 13,203 | | 43,662 | | 155,878 | |
Contingent assets
The credit commitments shown in the table above also constitute assets. These commitments would be classified as loans and other assets in the balance sheet on the contingent event occurring.
Additional liabilities and commitments
Legislative liabilities
The Group had the following assessed liabilities as at 30 September 2012:
§ $24 million (2011: $21 million) based on an actuarial assessment as a self-insurer under the Workers’ Compensation Act 1987 and the Workplace Injury Management and Workers’ Compensation Act 1998 (New South Wales);
§ $11 million (2011: $9 million) based on actuarial assessment as a self-insurer under the Accident Compensation Act 1985 (Victoria);
§ $5 million (2011: $4 million) based on actuarial assessment as a self-insurer under the Workers’ Rehabilitation and Compensation Act 1986 (South Australia);
§ $2 million (2011: $2 million) based on an actuarial assessment as a self-insurer under the Workers’ Compensation and Rehabilitation Act 2003 (Queensland); and
§ $1 million (2011: nil) based on an actuarial assessment as a self-insurer under the Workers’ Compensation Act 1951 (Australian Capital Territory).
Adequate provision has been made for these liabilities in the provision for annual leave and other employee benefits (refer to Note 20).
| | |
| 2012 WESTPAC GROUP ANNUAL REPORT | 273 |
NOTE 36. CONTINGENT LIABILITIES, CONTINGENT ASSETS AND CREDIT COMMITMENTS (CONTINUED)
Litigation
Contingent liabilities exist in respect of actual and potential claims and proceedings. An assessment of the Group’s likely loss has been made on a case-by-case basis for the purpose of the financial statements and specific provisions have been made where appropriate.
§ Westpac has been served with two separate class action proceedings by customers seeking to recover exception fees paid by those customers. The first set of proceedings was commenced by customers of the Westpac brand; the second by customers of the St.George Bank and BankSA brands. Westpac has agreed with the plaintiffs to put the proceedings against Westpac, St.George and BankSA on hold until at least December 2012, pending further developments in similar litigation commenced against another Australian bank.
§ Westpac was one of 20 defendant banks named in proceedings concerning the Bell Group of companies. The proceedings were brought by the liquidators of several Bell Group companies who challenged the defendant banks’ entitlement to receive the proceeds of realisation of Bell Group assets in the early 1990s. Judgment was delivered on 28 October 2008 and final orders were handed down on 30 April 2009.
Westpac, along with the other defendant banks, was found liable to repay its share of the monies received from the Bell Group plus interest. The defendant banks appealed the decision. Judgment was handed down by the Court of Appeal of the Supreme Court of Western Australia on 17 August 2012. By a majority decision, the defendant banks were unsuccessful in the appeal and the amount of interest payable was increased. Westpac considers that appropriate provisioning has been made for this matter. The defendant banks have applied for special leave to appeal to the High Court of Australia, however, the outcome and timing of the application for special leave and, if granted, the appeal are uncertain. Westpac is also entitled to lodge a claim as a creditor in the liquidation of the Bell Group.
Parent Entity guarantees and undertakings
The following guarantees and undertakings are extended to entities in the Group by the Parent Entity:
§ issue of letters of comfort in respect of certain subsidiaries in the normal course of business. The letters recognise that Westpac has a responsibility to ensure that those subsidiaries continue to meet their obligations;
§ guarantees to its Westpac Bank-PNG-Limited and Westpac Bank Samoa Limited subsidiaries that support loans made to customers in those two jurisdictions, to the extent that the loans exceed prescribed limits; and
§ guarantees to certain wholly owned subsidiaries that are Australian financial services or credit licensees to comply with legislative requirements. Each guarantee provided does not exceed $40 million per annum. The guarantees will only give rise to a liability where the entity concerned becomes legally obliged to pay on account of a claim under the relevant licence. The Parent Entity has a right of indemnity to recover funds payable under the guarantees.
Liquidity support
Westpac is a participant to the Interbank Deposit Agreement along with three other Australian banks. In accordance with the Interbank Deposit Agreement, a deposit notice may be served upon the other participants by a bank which is experiencing liquidity problems. The other participants are then required to deposit equal amounts of up to $2 billion each for a period of 30 days. At the end of 30 days the deposit holder has the option to repay the deposit in cash or by way of assignment of mortgages to the value of the deposit.
| | |
274 | 2012 WESTPAC GROUP ANNUAL REPORT | |
NOTES TO THE FINANCIAL STATEMENTS
NOTE 36. CONTINGENT LIABILITIES, CONTINGENT ASSETS AND CREDIT COMMITMENTS (CONTINUED)
Assets pledged
In addition to assets supporting securitisation and covered bond programmes disclosed in Note 31, the Group and Parent Entity have provided collateral to secure liabilities as part of standard terms of transaction with other financial institutions. The carrying value of financial assets pledged as collateral to secure liabilities is:
| | Consolidated | | Parent Entity | |
| | 2012 | | 2011 | | 2012 | | 2011 | |
| | $m | | $m | | $m | | $m | |
Cash | | | 4,666 | | | 1,603 | | | 4,409 | | | 1,580 | |
Cash deposit on stock borrowed | | | 71 | | | 47 | | | - | | | - | |
Securities (including certificates of deposit) | | | 459 | | | 236 | | | 459 | | | 236 | |
Securities pledged under repurchase agreements | | | 6,776 | | | 5,715 | | | 6,776 | | | 5,715 | |
Total amount pledged to secure liabilities1 | | | 11,972 | | | 7,601 | | | 11,644 | | | 7,531 | |
1 Assets relating to covered bond programmes are disclosed under Note 31. To improve presentation we have revised the comparative period.
Collateral received
All collateral received from counterparties to secure liabilities, besides residential mortgages, is received in the form of cash or securities. Cash held as collateral, recognised on the Group and Parent Entity’s balance sheets as at 30 September 2012 was $1,356 million (2011: $6,641 million). Securities received as collateral under reverse repurchase agreements as at 30 September 2012 was $10,148 million (2011: $2,776 million).
NOTE 37. FIDUCIARY ACTIVITIES
Certain controlled entities within the Group conduct investment management and other fiduciary activities as responsible entity or manager on behalf of individuals, trusts, retirement benefit plans and other institutions. These activities involve the management of assets in investment schemes and superannuation funds, and the holding or placing of assets on behalf of third parties.
Where controlled entities, as responsible entities, incur liabilities in respect of these activities, a right of indemnity exists against the assets of the applicable investment schemes or funds. As these assets are sufficient to cover liabilities, and it is not probable that the controlled entities will be required to settle them, the liabilities are not included in the consolidated financial statements.
The Group also manages life insurance statutory fund assets that are included in the consolidated financial statements.
| | |
| 2012 WESTPAC GROUP ANNUAL REPORT | 275 |
The consolidated Group as at 30 September 2012 includes the following controlled entities1:
Name | | Country of Incorporation | | Name | | Country of Incorporation |
Westpac Banking Corporation | | Australia | | Hastings Forests Australia Pty Limited | | Australia |
1925 Advances Pty Limited | | Australia | | Hastings Funds Management (UK) Limited | | UK |
General Credit Holdings Pty Limited | | Australia | | Hastings Funds Management (USA) Inc. | | USA |
General Credits Pty Limited | | Australia | | Hastings Advisers, LLC | | USA |
G.C.L. Investments Pty Limited | | Australia | | Hastings Investment LLC | | USA |
Ascalon Capital Managers Limited | | Australia | | Hastings Investment Capital, LP | | USA |
Ascalon Capital Managers (Asia) Limited | | Hong Kong | | Hastings Private Equity Fund IIA Pty Limited | | Australia |
Ascalon Funds Seed Pool Trust | | Australia | | TIF International 1 Pty Limited | | Australia |
Asgard Wealth Solutions Limited | | Australia | | Hastings Investment Managment Pty Limited3,5 | | Australia |
Asgard Capital Management Limited | | Australia | | Hickory Trust | | Australia |
Hitton Pty Limited | | Australia | | Nationwide Management Pty Limited | | Australia |
EQR Securities Pty Limited | | Australia | | St.George Custodial Pty Limited | | Australia |
Securitor Financial Group Limited | | Australia | | Orion Trust | | Australia |
Australian Loan Processing Security Company Pty Limited | | Australia | | Partnership Pacific Limited | | Australia |
Australian Loan Processing Security Trust | | Australia | | Partnership Pacific Securities Limited | | Australia |
Bill Acceptance Corporation Limited | | Australia | | Phoenix Trust | | Australia |
Mortgage Management Limited | | Australia | | RMS Warehouse Trust 2007-1 | | Australia |
BLE Capital Limited | | Australia | | Seed Pool Trust No 2 | | Australia |
BLE Capital Investments Pty Limited | | Australia | | Series 2005-1G WST Trust | | Australia |
BLE Development Pty Limited | | Australia | | Series 2007-1G WST Trust | | Australia |
BLE Holdings Pty Limited | | Australia | | Series 2008-1M WST Trust | | Australia |
BT Short Term Income Fund | | Australia | | Series 2009-1 WST Trust | | Australia |
Castlereagh Trust | | Australia | | Series 2011-1 WST Trust | | Australia |
CBA Limited | | Australia | | Series 2011-2 WST Trust | | Australia |
Belliston Pty Limited | | Australia | | Series 2011-3 WST Trust2 | | Australia |
Challenge Limited | | Australia | | Series 2012-1 WST Trust2 | | Australia |
Challenge Finance Pty Limited | | Australia | | Sixty Martin Place (Holdings) Pty Limited | | Australia |
Crusade CP Management Pty Limited | | Australia | | 1925 (Commercial) Pty Limited | | Australia |
Crusade CP No.1 Pty Limited8 | | Australia | | 1925 (Industrial) Pty Limited | | Australia |
Crusade CP Trust No. 41 | | Australia | | Athena Finance Pty Limited | | Australia |
Crusade CP Trust No. 44 | | Australia | | Halcyon Securities Limited | | Australia |
Crusade CP Trust No. 48 | | Australia | | Infrastructure Australia (No.3) Limited | | Australia |
Crusade CP Trust No. 49 | | Australia | | Infrastructure Australia (No.4) Limited | | Australia |
Crusade CP Trust No. 50 | | Australia | | Packaging Properties 1 Pty Limited | | Australia |
Crusade CP Trust No. 52 | | Australia | | Packaging Properties 2 Pty Limited | | Australia |
Crusade CP Trust No. 53 | | Australia | | Packaging Properties 3 Pty Limited | | Australia |
Crusade CP Trust No. 54 | | Australia | | Pashley Investments Pty Limited | | Australia |
Crusade CP Trust No. 55 | | Australia | | Westpac Investment Vehicle No.3 Pty Limited | | Australia |
Crusade CP Trust No. 56 | | Australia | | Sallmoor Pty Limited | | Australia |
Crusade CP Trust No. 57 | | Australia | | Teuton Pty Limited | | Australia |
Crusade CP Trust No. 58 | | Australia | | Westpac Administration Pty Limited | | Australia |
Crusade CP Trust No. 60 | | Australia | | Westpac Asian Lending Pty Limited | | Australia |
Crusade Management Limited | | Australia | | Westpac Debt Securities Pty Limited | | Australia |
Crusade ABS Series 2008-2 | | Australia | | Westpac Direct Equity Investments Pty Limited | | Australia |
Crusade Euro Trust 1 E of 2004 | | Australia | | Westpac Equipment Finance Limited | | Australia |
Crusade Euro Trust 1 E of 2006 | | Australia | | Westpac Equipment Finance (No.1) Pty Limited | | Australia |
Crusade Euro Trust 1 E of 2007 | | Australia | | Westpac Group Investments Australia Pty Limited | | Australia |
Crusade Global Trust 1 of 2004 | | Australia | | W1 Investments Pty Limited | | Australia |
Crusade Global Trust 2 of 2004 | | Australia | | Westpac Investment Vehicle Pty limited | | Australia |
Crusade Global Trust 1 of 2005 | | Australia | | Westpac Funds Financing Holdco Pty Limited | | Australia |
Crusade Global Trust 2 of 2005 | | Australia | | Westpac Funds Financing Pty Limited | | Australia |
Crusade Global Trust 1 of 2006 | | Australia | | Westpac Investment Vehicle No.2 Pty Limited | | Australia |
Crusade Global Trust 2 of 2006 | | Australia | | Westpac Cook Cove Trust I | | Australia |
Crusade Global Trust 1 of 2007 | | Australia | | Westpac Cook Cove Trust II | | Australia |
Crusade Trust 1A of 2005 | | Australia | | Westpac Pacific Limited Partnership | | Australia |
Crusade Trust 2P of 2008 | | Australia | | Westpac Syndications Management Pty Limited | | Australia |
Danaby Pty Limited | | Australia | | St.George Business Finance Pty Limited | | Australia |
FAI No. 2 Trust | | Australia | | St.George Equity Finance Limited | | Australia |
Gemini Trust | | Australia | | St.George Finance Holdings Limited | | Australia |
Hastings Management Pty Limited | | Australia | | St.George Finance Limited | | Australia |
Hastings Funds Management Limited | | Australia | | St.George Motor Finance Limited6 | | Australia |
Australian Infrastructure Fund International 1 Pty Limited | | Australia | | St.George Group Holdings Pty Limited | | Australia |
Hastings Forestry Investments Limited | | New Zealand | | St.George Insurance Australia Pty Limited | | Australia |
| | |
276 | 2012 WESTPAC GROUP ANNUAL REPORT | |
NOTES TO THE FINANCIAL STATEMENTS
NOTE 38. GROUP ENTITIES (CONTINUED)
| Name | | Country of Incorporation | | Name | | Country of Incorporation |
| St.George Life Limited | | Australia | | Westpac RE Limited | | Australia |
| St.George Procurement Management Pty Limited | | Australia | | Westpac Securities Administration Limited | | Australia |
| St.George Security Holdings Pty Limited | | Australia | | Westpac General Insurance Services Limited | | Australia |
| Sydney Capital Corp Inc8 | | USA | | BT Long Term Income Fund | | Australia |
| Tasman LLC | | USA | | Westpac Equity Pty Limited | | Australia |
| Tavarua Funding Trust IV | | USA | | Westpac General Insurance Limited | | Australia |
| The Mortgage Company Pty Limited | | Australia | | Westpac Lenders Mortgage Insurance Limited | | Australia |
| Value Nominees Pty Limited | | Australia | | Westpac Private Equity Pty Limited | | Australia |
| Waratah Receivables Corp Pty Limited8 | | Australia | | Westpac Securities Limited | | Australia |
| Waratah Securities Australia Limited8 | | Australia | | Net Nominees Limited | | Australia |
| Westpac Altitude Rewards Trust | | Australia | | Westpac Securitisation Management Pty Limited | | Australia |
| Westpac Bank of Tonga | | Tonga | | Westpac Europe Limited | | UK |
| Westpac Bank Samoa Limited6 | | Samoa | | Westpac Financial Holdings Pty Limited | | Australia |
| Westpac Bank-PNG-Limited6 | | Papua New Guinea | | BT Securities Limited | | Australia |
| Westpac Capital Corporation | | USA | | BT (Queensland) Pty Limited | | Australia |
| Westpac Capital Holdings Inc. | | USA | | Westpac Funding Holdings Pty Limited | | Australia |
| Westpac Capital Trust III | | USA | | Tavarua Funding Trust III | | USA |
| Westpac Capital Trust IV | | USA | | Westpac Investments U.K. Limited | | UK |
| Westpac Covered Bond Trust2 | | Australia | | Codrington S.a.r.l. | | Luxembourg |
| Westpac Delta LLC | | USA | | Westpac Leasing Nominees-Vic.-Pty Limited | | Australia |
| Westpac Equity Holdings Pty Limited | | Australia | | Westpac Overseas Holdings No. 2 Pty Limited | | Australia |
| Altitude Administration Pty Limited | | Australia | | Westpac New Zealand Group Limited | | New Zealand |
| Altitude Rewards Pty Limited | | Australia | | Westpac New Zealand Limited | | New Zealand |
| Hastings Group Pty Limited | | Australia | | Westpac NZ Operations Limited | | New Zealand |
| Qvalent Pty Limited | | Australia | | Aotearoa Financial Services Limited | | New Zealand |
| RAMS Financial Group Pty Limited | | Australia | | Number 120 Limited | | New Zealand |
| Westpac Financial Consultants Limited | | Australia | | The Home Mortgage Company Limited | | New Zealand |
| Westpac Financial Services Group Limited | | Australia | | The Warehouse Financial Services Limited6 | | New Zealand |
| Advance Asset Management Limited3 | | Australia | | Westpac (NZ) Investments Limited | | New Zealand |
| BT Financial Group (NZ) Limited | | New Zealand | | Westpac Securities NZ Limited | | New Zealand |
| BT Funds Management (NZ) Limited | | New Zealand | | Westpac NZ Leasing Limited | | New Zealand |
| BT Financial Group Pty Limited | | Australia | | Westpac NZ Securitisation Holdings Limited6 | | New Zealand |
| BT Australia Pty Limited | | Australia | | Westpac NZ Securitisation Limited | | New Zealand |
| BT Funds Management Limited | | Australia | | Westpac NZ Covered Bond Holdings Limited6 | | New Zealand |
| Oniston Pty Limited | | Australia | | Westpac NZ Covered Bond Limited | | New Zealand |
| BT Life Limited | | Australia | | Westpac Term PIE Fund8 | | New Zealand |
| BT Portfolio Services Limited | | Australia | | Westpac Overseas Holdings Pty Limited | | Australia |
| Magnitude Group Pty Limited | | Australia | | A.G.C. (Pacific) Limited | | Papua New Guinea |
| BT Funds Management No.2 Limited | | Australia | | Westpac Americas Inc. | | USA |
| BT Private Nominees Pty Limited3,5 | | Australia | | Westpac Investment Capital Corporation | | USA |
| BT Investment Management Limited6 | | Australia | | Westpac USA Inc. | | USA |
| BT Investment Management (RE) Limited | | Australia | | Southern Cross Inc. | | USA |
| BT IM UK Limited2 | | UK | | Westpac Finance (HK) Limited | | Hong Kong |
| J O Hambro Capital Management Holdings Limited2 | | UK | | WFAL No.1 Loan Trust | | Hong Kong |
| J O Hambro Capital Management Limited2 | | UK | | Westpac Group Investment-NZ-Limited | | New Zealand |
| JOHCM (Singapore) Pte Limited2 | | Singapore | | Westpac Holdings-NZ-Limited | | New Zealand |
| JOHCM (USA) General Partner Inc2 | | USA | | Westpac Capital-NZ-Limited | | New Zealand |
| JOHCMG Share Trustee Limited2 | | UK | | Westpac Equity Investments NZ Limited | | New Zealand |
| Westpac Custodian Nominees Limited | | Australia | | Westpac Securities Inc. | | USA |
| Westpac Financial Services Group-NZ-Limited | | New Zealand | | Westpac Singapore Limited | | Singapore |
| Westpac Life-NZ-Limited | | New Zealand | | Westpac Capital Markets Holding Corp2 | | USA |
| Westpac Nominees-NZ-Limited | | New Zealand | | Westpac Capital Markets LLC2 | | USA |
| HLT Custodian Trust | | New Zealand | | Westpac Properties Limited | | Australia |
| MIF Custodian Trust | | New Zealand | | Westpac Securitisation Holdings Pty Limited | | Australia |
| Westpac Superannuation Nominees-NZ-Limited | | New Zealand | | Westpac Structured Products Limited | | Australia |
| Westpac Financial Services Limited | | Australia | | Westpac TPS Trust | | Australia |
| Westpac Life Insurance Services Limited | | Australia | | Westpac Unit Trust | | Australia |
| | |
| 2012 WESTPAC GROUP ANNUAL REPORT | 277 |
NOTE 38. GROUP ENTITIES (CONTINUED)
Notes
1 | Controlled entities shown in bold type are owned directly by Westpac Banking Corporation (WBC). Overseas companies predominantly carry on business in the country of incorporation. For unincorporated entities, ‘Country of Incorporation’ refers to the country where business is carried on. The financial years of all controlled entities are the same as that of Westpac unless otherwise stated. From time to time the Group consolidates a small number of unit trusts where ownership exceeds 50%. Ownership of these entities is part of the ongoing investment activities of the life insurance and wealth businesses and are not separately disclosed. |
2 | The following controlled entities were incorporated, formed or acquired during the period 1 October 2011 to 30 September 2012: |
| § | BTIM UK Limited | | Acquired | | 26 October 2011 |
| § | J O H C M GmbH | | Acquired | | 26 October 2011 |
| § | J O Hambro Capital Limited | | Acquired | | 26 October 2011 |
| § | J O Hambro Capital Management Holdings Limited | | Acquired | | 26 October 2011 |
| § | J O Hambro Capital Management Limited | | Acquired | | 26 October 2011 |
| § | J O Hambro Unit Trust Managers Limited | | Acquired | | 26 October 2011 |
| § | JOHCM (Singapore) Pte Limited | | Acquired | | 26 October 2011 |
| § | JOHCM (USA) General Partner Inc | | Acquired | | 26 October 2011 |
| § | JOHCMG Share Trustee Limited | | Acquired | | 26 October 2011 |
| § | Series 2011-3 WST Trust | | Created | | 10 October 2011 |
| § | Series 2012-1 WST Trust | | Created | | 16 May 2012 |
| § | Silver Metis Investment Management Limited | | Acquired | | 26 October 2011 |
| § | Westpac Capital Markets Holding Corp. | | Created | | 7 June 2012 |
| § | Westpac Capital Markets LLC | | Created | | 7 June 2012 |
| § | Westpac Covered Bond Trust | | Created | | 26 October 2011 |
3 | The following controlled entities changed their ownership during the period 1 October 2011 to 30 September 2012: |
| § | Advance Asset Management Limited | | | | 30 September 2012 |
| § | BT Private Nominees Pty Limited | | | | 22 December 2011 |
| § | Hastings Investment Management Pty Limited | | | | 23 May 2012 |
4 | The following controlled entities ceased to be controlled or were disposed of during the period 1 October 2011 to 30 September 2012: |
| § | Autodirect Pty Limited | | Deregistered | | 23 November 2011 |
| § | J O Hambro Capital Limited | | Dissolved | | 19 June 2012 |
| § | J O Hambro Unit Trust Managers Limited | | Dissolved | | 19 June 2012 |
| § | J O H C M GmbH | | Dissolved | | 3 September 2012 |
| § | Silver Metis Investment Management Limited | | Dissolved | | 11 September 2012 |
| § | St.George New Zealand Limited | | Struck off | | 20 July 2012 |
| § | Tasman Pacific Investments Pty Limited | | Deregistered | | 1 January 2012 |
| § | TBNZ Investments (UK) Limited | | Deregistered | | 27 December 2011 |
| § | Westpac Matching Gifts Limited | | Ceased control | | 1 October 2011 |
5 | The following controlled entities changed their name during the period 1 October 2011 to 30 September 2012: | | |
| § | BT Investment Management No.2 Limited to BT Private Nominees Pty Limited | | | | 22 December 2011 |
| § | Hasting Private Equity Fund IIB Pty Limited to Hastings Investment Management Pty Limited | | | | 24 May 2012 |
6 | All entities listed in this note are wholly owned controlled entities except the following: |
| |
| | | Percentage Owned | |
| | | 2012 | | | 2011 | |
| BT Investment Management Limited | | 64.5% | | | 64.5% | |
| St.George Motor Finance Limited | | 75.0% | | | 75.0% | |
| The Warehouse Financial Services Limited | | 51.0% | | | 51.0% | |
| Westpac Bank-PNG-Limited | | 89.9% | | | 89.9% | |
| Westpac Bank Samoa Limited | | 93.5% | | | 93.5% | |
| Westpac NZ Covered Bond Holdings Limited7 | | 19.0% | | | 19.0% | |
| Westpac NZ Securitisation Holdings Limited7 | | 19.0% | | | 19.0% | |
| |
7 | 9.5% of the equity in both Westpac NZ Securitisation Holdings Limited (WNZSHL) and Westpac NZ Covered Bond Holdings Limited (WNZCBHL) is held directly by Westpac Holdings -NZ- Limited and another 9.5% is held directly by Westpac NZ Operations Limited. Although WBC and its controlled entities only own a total of 19%, due to contractual and structural arrangements, each of WNZSHL and WNZCBHL is considered to be a controlled entity within WBC. |
8 | The Group has funding agreements in place with these entities and is deemed to have exposure to the associated risks and rewards. These entities are therefore deemed to be controlled without ownership. |
| | | | | | | | | | | | |
| | |
278 | 2012 WESTPAC GROUP ANNUAL REPORT | |
NOTES TO THE FINANCIAL STATEMENTS
NOTE 39. OTHER GROUP INVESTMENTS
The Group had a significant non-controlling shareholding in the following entities as at 30 September 2012:
| | Country Where | | Beneficial | | |
| | Business is | | Interest | | |
| | Carried On | | % | | Nature of Business |
Above The Index Asset Management Pty Limited | | Australia | | 33.3 | | Funds management |
Alleron Investment Management Limited | | Australia | | 39.7 | | Funds management |
Angusknight Pty Limited | | Australia | | 50.0 | | Employment and training |
Arkx Investment Management Pty Limited | | Australia | | 28.0 | | Funds management |
Athos Capital Limited | | Hong Kong | | 35.0 | | Funds management |
Boyd Cook Cove Unit Trust | | Australia | | 50.0 | | Investment fund |
Canning Park Capital Pte Limited | | Singapore | | 30.0 | | Funds management |
Cardlink Services Limited | | Australia | | 25.0 | | Card clearing system |
Cards NZ Limited | | New Zealand | | 18.8 | | Credit card provider |
Cash Services Australia Pty Limited | | Australia | | 25.0 | | Cash logistics |
Continuum Capital Management Limited | | Australia | | 45.0 | | Funds management |
Cook Cove Investment Pty Limited | | Australia | | 50.0 | | Investment company |
Cook Cove Investment Trust | | Australia | | 50.0 | | Investment fund |
Cook Cove Pty Limited and its controlled entities | | Australia | | 50.0 | | Investment company |
H3 Global Advisors Pty Limited | | Australia | | 43.9 | | Funds management |
Helix Partners Limited | | Australia | | 46.0 | | Funds management |
Paymark Limited | | New Zealand | | 25.0 | | Electronic payments processing |
Regal Funds Management Asia Limited | | Singapore | | 30.0 | | Funds management |
Regal Funds Management Pty Limited | | Australia | | 30.0 | | Funds management |
Rhodes Contracting Pty Limited | | Australia | | 25.5 | | Services to mining |
St Hilliers Enhanced Property Fund No.2 | | Australia | | 15.0 | | Property fund |
Sydney Harbour Bridge Holdings Pty Limited | | Australia | | 49.0 | | Intellectual property |
Vipro Pty Limited | | Australia | | 33.3 | | Voucher processing |
Westpac Employee Assistance Foundation Pty Limited | | Australia | | 50.0 | | Corporate trustee |
Westpac Essential Services Trust I and II and their controlled and non-controlled entities | | Australia | | 36.8 | | Asset management |
Westpac Staff Superannuation Plan Pty Limited | | Australia | | 50.0 | | Corporate trustee |
The total carrying amount of the Group’s significant non-controlling shareholding was $208 million (2011: $206 million).
In terms of the contribution to the results of the Group, the above investments are not material either individually or in aggregate.
| | |
| 2012 WESTPAC GROUP ANNUAL REPORT | 279 |
NOTE 40. RELATED PARTY DISCLOSURES
Directors’ interests in contracts
As required by the Corporations Act, some Directors have given notice that they hold office in specified companies and as such are to be regarded as having an interest in any contract or proposed contract which may be made between Westpac and those companies.
Unless otherwise noted all other transactions with Directors, Director-related entities and other related parties are conducted on an arm’s length basis in the normal course of business and on commercial terms and conditions. These transactions consist principally of normal personal banking and financial investment services.
Ultimate parent
Westpac Banking Corporation is the ultimate parent company of the Group.
Subsidiaries
Transactions between Westpac and its subsidiaries during 2012 have included the provision of a wide range of banking and other financial facilities, some of which have been on commercial terms and conditions; others have been on terms and conditions which represented a concession to the subsidiaries. Details of amounts paid to or received from related parties, in the form of dividends or interest, are set out in Note 2 and Note 3.
Other intragroup transactions, which may or may not be on commercial terms, include the provision of management and administration services, staff training, data processing facilities, transfer of tax losses, and the leasing of property, plant and equipment. Similar transactions between Group entities and other related parties have been almost invariably on commercial terms and conditions as agreed between the parties. Such transactions are not considered to be material, either individually or in aggregate.
NOTE 41. DIRECTOR AND OTHER KEY MANAGEMENT PERSONNEL DISCLOSURES
Directors of Westpac during the year ended 30 September 2012 were:
Name | | Position |
Lindsay Maxsted | | Chairman |
Ted Evans1 | | Former Chairman |
Gail Kelly | | Managing Director & Chief Executive Officer |
John Curtis | | Deputy Chairman |
Elizabeth Bryan | | Director |
Gordon Cairns | | Director |
Robert Elstone2 | | Director |
Peter Hawkins | | Director |
Carolyn Hewson3 | | Director |
Ann Pickard4 | | Director |
Graham Reaney5 | | Director |
Peter Wilson | | Director |
1 Retired 14 December 2011.
2 Appointed 1 February 2012.
3 Retired 30 June 2012.
4 Appointed 1 December 2011.
5 Retired 14 December 2011.
| | |
280 | 2012 WESTPAC GROUP ANNUAL REPORT | |
NOTES TO THE FINANCIAL STATEMENTS
NOTE 41. DIRECTOR AND OTHER KEY MANAGEMENT PERSONNEL DISCLOSURES (CONTINUED)
Other key management personnel with the greatest authority for strategic direction and management during the year ended 30 September 2012 were:
Name | | Position |
Senior Executives | | |
John Arthur1 | | Chief Operating Officer |
Peter Clare2 | | Chief Executive Officer, Westpac New Zealand Limited |
Philip Coffey | | Chief Financial Officer |
Brad Cooper | | Group Executive Officer, BT Financial Group (Australia) |
George Frazis3 | | Chief Executive Officer, St.George Banking Group |
Peter Hanlon4 | | Chief Executive, Australian Financial Services |
Brian Hartzer | | Chief Executive, Australian Financial Services |
Christine Parker | | Group Executive, Human Resources & Corporate Affairs |
Greg Targett | | Chief Risk Officer |
Rob Whitfield | | Group Executive, Westpac Institutional Bank |
Jason Yetton | | Group Executive, Westpac Retail & Business Banking |
Former Senior Executives | | |
Rob Chapman | | Chief Executive, St.George Banking Group |
Rob Coombe | | Group Executive, Westpac Retail & Business Banking |
1 John Arthur was the Group Executive Counsel & Secretariat prior to his appointment to the new role of Chief Operating Officer on 24 November 2011.
2 Peter Clare was the Group Executive, Product and Operations until his appointment as the Chief Operating Officer, Australian Financial Services on 24 November 2011. He was subsequently appointed to the role of Chief Executive Officer Westpac New Zealand Limited on 1 April 2012.
3 George Frazis was the CEO of Westpac New Zealand Limited prior to his appointment to the role of Chief Executive Officer St.George Banking Group on 1 April 2012.
4 Peter Hanlon has been disclosed for the full year given his contribution in key roles during the period.
Key management personnel were all employed by Westpac as at 30 September 2012 except for Peter Clare (WNZL).
Total compensation of all key management personnel, including Non-executive Directors, the CEO and other key management personnel:
| | Short-term
Benefits | | Post Employment
Benefits | | Termination
Benefits | | Share-based
Payments | | Total | |
| | $ | | $ | | $ | | $ | | $ | |
Consolidated | | | | | | | | | | | |
2012 | | 31,613,929 | | 701,351 | | 2,182,500 | | 17,872,746 | | 52,370,526 | |
2011 | | 33,325,654 | | 720,498 | | - | | 13,172,492 | | 47,218,644 | |
| | | | | | | | | | | |
Parent Entity | | | | | | | | | | | |
2012 | | 29,574,544 | | 689,910 | | 2,182,500 | | 16,714,407 | | 49,161,361 | |
2011 | | 31,103,076 | | 702,174 | | - | | 11,873,178 | | 43,678,428 | |
Detailed remuneration disclosures of Non-executive Directors, CEO and other key management personnel are included in the Remuneration report.
| | |
| 2012 WESTPAC GROUP ANNUAL REPORT | 281 |
NOTE 41. DIRECTOR AND OTHER KEY MANAGEMENT PERSONNEL DISCLOSURES (CONTINUED)
Options and share rights holdings
The following table sets out details of performance options, performance share rights and share rights held by the CEO and other key management personnel (including their related parties) for the year ended 30 September 2012:
| | Type of Equity-Based
Instrument | | Number
Held at
Start of Year | | Number
Granted During
the Year as
Remuneration | | Number
Exercised
During
the Year | | Number
Lapsed
During
the Year | | Number
Held at
End of Year | | Number
Vested and
Exercisable
at End of Year | |
Senior Executives | | | | | | | | | | | | | | | |
Gail Kelly | | | | | | | | | | | | | | | |
| | Performance option | | 720,556 | | - | | 320,513 | | - | | 400,043 | | 364,431 | |
| | Performance share right | | 486,545 | | 272,929 | | 132,445 | | - | | 627,029 | | - | |
John Arthur | | | | | | | | | | | | | | | |
| | Performance share right | | 58,311 | | 40,433 | | - | | - | | 98,744 | | - | |
Peter Clare | | | | | | | | | | | | | | | |
| | Performance option | | 81,799 | | - | | - | | - | | 81,799 | | 73,619 | |
| | Performance share right | | 55,769 | | 50,542 | | - | | - | | 106,311 | | - | |
Philip Coffey | | | | | | | | | | | | | | | |
| | Performance option | | 676,257 | | - | | 127,308 | | - | | 548,949 | | 538,469 | |
| | Performance share right | | 75,087 | | 66,715 | | - | | - | | 141,802 | | - | |
Brad Cooper | | | | | | | | | | | | | | | |
| | Performance option | | 196,785 | | - | | - | | - | | 196,785 | | 187,583 | |
| | Performance share right | | 80,378 | | 75,813 | | - | | - | | 156,191 | | - | |
George Frazis | | | | | | | | | | | | | | | |
| | Performance option | | 260,869 | | - | | 260,869 | | - | | - | | n/a | |
| | Performance share right | | 62,573 | | 55,596 | | - | | - | | 118,169 | | - | |
| | Unhurdled share right | | 30,698 | | - | | 9,995 | | - | | 20,703 | | - | |
Peter Hanlon | | | | | | | | | | | | | | | |
| | Performance option | | 202,391 | | - | | - | | - | | 202,391 | | 194,569 | |
| | Performance share right | | 55,769 | | 50,542 | | - | | - | | 106,311 | | - | |
Brian Hartzer1 | | | | n/a | | | | | | | | | | | |
Christine Parker2 | | | | | | | | | | | | | | | |
| | Performance option | | n/a | | - | | - | | - | | 25,036 | | 23,816 | |
| | Performance share right | | n/a | | 11,927 | | - | | - | | 22,813 | | - | |
| | Unhurdled share right | | n/a | | - | | - | | - | | 2,838 | | 2,838 | |
Greg Targett | | | | | | | | | | | | | | | |
| | Performance share right | | 72,719 | | 60,650 | | 4,822 | | - | | 128,547 | | - | |
Rob Whitfield | | | | | | | | | | | | | | | |
| | Performance option | | 559,597 | | - | | - | | - | | 559,597 | | 553,462 | |
| | Performance share right | | 141,672 | | 60,650 | | - | | - | | 202,322 | | 66,585 | |
Jason Yetton2 | | | | | | | | | | | | | | | |
| | Performance option | | n/a | | - | | - | | - | | 196,989 | | 193,717 | |
| | Performance share right | | n/a | | 17,689 | | - | | - | | 87,192 | | 49,480 | |
Former Senior Executives2 | | | | | | | | | | | | | |
Rob Chapman | | | | | | | | | | | | | | | |
| | Performance share right | | 29,039 | | 42,960 | | - | | - | | n/a | | n/a | |
Rob Coombe | | | | | | | | | | | | | | | |
| | Performance option | | 362,240 | | - | | - | | - | | n/a | | n/a | |
| | Performance share right | | 96,909 | | - | | - | | - | | n/a | | n/a | |
| | | | | | | | | | | | | | | |
1 Brian Hartzer received an allocation of restricted shares on commencement of employment. He has not yet been awarded any options or share rights.
2 This information relates to the period that these individuals were key management personnel during the year.
| | |
282 | 2012 WESTPAC GROUP ANNUAL REPORT | |
NOTES TO THE FINANCIAL STATEMENTS
NOTE 41. DIRECTOR AND OTHER KEY MANAGEMENT PERSONNEL DISCLOSURES (CONTINUED)
The following table sets out details of performance options, performance share rights and share rights held by the CEO and other key management personnel (including their related parties) for the year ended 30 September 2011:
| | Type of Equity-Based
Instrument | | Number
Held at
Start of Year | | Number
Granted During
the Year as
Remuneration | | Number
Exercised
During
the Year | | Number
Lapsed
During
the Year | | Number
Held at
End of Year | | Number
Vested and
Exercisable
at End of Year | |
| | | | | | | | | | | | | | | |
Gail Kelly | | | | | | | | | | | | | | | |
| | Performance option | | 720,556 | | - | | - | | - | | 720,556 | | 255,102 | |
| | Performance share right | | 368,023 | | 176,125 | | 57,603 | | - | | 486,545 | | - | |
| | | | | | | | | | | | | | | |
John Arthur | | | | | | | | | | | | | | | |
| | Performance share right | | 19,173 | | 39,138 | | - | | - | | 58,311 | | - | |
| | | | | | | | | | | | | | | |
Rob Chapman | | | | | | | | | | | | | | | |
| | Performance share right | | 19,138 | | 12,263 | | - | | 2,362 | | 29,039 | | 5,512 | |
| | | | | | | | | | | | | | | |
Peter Clare | | | | | | | | | | | | | | | |
| | Performance option | | 81,799 | | - | | - | | - | | 81,799 | | - | |
| | Performance share right | | 25,763 | | 30,006 | | - | | - | | 55,769 | | - | |
| | | | | | | | | | | | | | | |
Philip Coffey | | | | | | | | | | | | | | | |
| | Performance option | | 676,257 | | - | | - | | - | | 676,257 | | 571,452 | |
| | Performance share right | | 35,949 | | 39,138 | | - | | - | | 75,087 | | - | |
| | | | | | | | | | | | | | | |
Rob Coombe | | | | | | | | | | | | | | | |
| | Performance option | | 362,240 | | - | | - | | - | | 362,240 | | 252,016 | |
| | Performance share right | | 60,380 | | 36,529 | | - | | - | | 96,909 | | 26,827 | |
| | | | | | | | | | | | | | | |
Brad Cooper | | | | | | | | | | | | | | | |
| | Performance option | | 196,785 | | - | | - | | - | | 196,785 | | 104,761 | |
| | Performance share right | | 31,455 | | 48,923 | | - | | - | | 80,378 | | - | |
| | Share right | | 22,045 | | - | | 22,045 | | - | | - | | - | |
| | | | | | | | | | | | | | | |
George Frazis | | | | | | | | | | | | | | | |
| | Performance option | | 260,869 | | - | | - | | - | | 260,869 | | - | |
| | Performance share right | | 29,958 | | 32,615 | | - | | - | | 62,573 | | - | |
| | Share right | | 92,018 | | 20,703 | | 82,023 | | - | | 30,698 | | - | |
| | | | | | | | | | | | | | | |
Peter Hanlon | | | | | | | | | | | | | | | |
| | Performance option | | 202,391 | | - | | - | | - | | 202,391 | | 124,171 | |
| | Performance share right | | 25,763 | | 30,006 | | - | | - | | 55,769 | | - | |
| | | | | | | | | | | | | | | |
Bob McKinnon | | | | | | | | | | | | | | | |
| | Cash settled share right | | 67,500 | | - | | - | | - | | 67,500 | | - | |
| | | | | | | | | | | | | | | |
Greg Targett | | | | | | | | | | | | | | | |
| | Performance share right | | 35,648 | | 39,138 | | - | | 2,067 | | 72,719 | | 4,822 | |
| | | | | | | | | | | | | | | |
Rob Whitfield | | | | | | | | | | | | | | | |
| | Performance option | | 559,597 | | - | | - | | - | | 559,597 | | 498,248 | |
| | Performance share right | | 102,534 | | 39,138 | | - | | - | | 141,672 | | 66,585 | |
| | |
| 2012 WESTPAC GROUP ANNUAL REPORT | 283 |
NOTE 41. DIRECTOR AND OTHER KEY MANAGEMENT PERSONNEL DISCLOSURES (CONTINUED)
Shareholdings
The following table sets out details of relevant interests in Westpac ordinary shares held by the Non-executive Directors (including their related parties) during the year ended 30 September 20121.
| | Number Held at
Start of Year | | Other Changes
During the Year | | Number Held at
End of Year | |
Current Directors | | | | | | | |
Lindsay Maxsted | | | | | | | |
2012 | | 15,360 | | 679 | | 16,039 | |
2011 | | 10,310 | | 5,050 | | 15,360 | |
| | | | | | | |
John Curtis | | | | | | | |
2012 | | 80,787 | | (39,834 | ) | 40,953 | |
2011 | | 80,787 | | - | | 80,787 | |
| | | | | | | |
Elizabeth Bryan | | | | | | | |
2012 | | 21,954 | | 1,783 | | 23,737 | |
2011 | | 20,510 | | 1,444 | | 21,954 | |
| | | | | | | |
Gordon Cairns | | | | | | | |
2012 | | 17,038 | | - | | 17,038 | |
2011 | | 17,038 | | - | | 17,038 | |
| | | | | | | |
Robert Elstone2 | | | | | | | |
2012 | | n/a | | - | | 10,000 | |
| | | | | | | |
Peter Hawkins | | | | | | | |
2012 | | 15,218 | | - | | 15,218 | |
2011 | | 15,218 | | - | | 15,218 | |
| | | | | | | |
Ann Pickard2 | | | | | | | |
2012 | | n/a | | 9,800 | | 9,800 | |
| | | | | | | |
Peter Wilson | | | | | | | |
2012 | | 16,087 | | 511 | | 16,598 | |
2011 | | 14,343 | | 1,744 | | 16,087 | |
| | | | | | | |
Former Directors2 | | | | | | | |
Ted Evans | | | | | | | |
2012 | | 24,408 | | - | | n/a | |
2011 | | 19,673 | | 4,735 | | 24,408 | |
| | | | | | | |
Carolyn Hewson | | | | | | | |
2012 | | 16,348 | | - | | n/a | |
2011 | | 16,348 | | - | | 16,348 | |
| | | | | | | |
Graham Reaney | | | | | | | |
2012 | | 75,361 | | - | | n/a | |
2011 | | 75,361 | | - | | 75,361 | |
1 None of these shares include non-beneficially held shares.
2 This information relates to the period that these individuals were key management personnel during the year.
| | |
284 | 2012 WESTPAC GROUP ANNUAL REPORT | |
NOTES TO THE FINANCIAL STATEMENTS
NOTE 41. DIRECTOR AND OTHER KEY MANAGEMENT PERSONNEL DISCLOSURES (CONTINUED)
The following table sets out details of Westpac ordinary shares held by the CEO and other key management personnel (including their related parties) for the year ended 30 September 2012:
| | Total Number Held
at Start of Year | | RSP Shares
Granted as
Compensation | | Number Received on
Exercise of Equity
Instruments | | Other Changes
During the Year | | RSP Shares Held
at End of Year | | Total Number
Held at End of
Year1 | |
Senior Executives | | | | | | | | | | | | | |
Gail Kelly | | | | | | | | | | | | | |
2012 | | 1,459,214 | | 77,799 | | 452,958 | | (150,000 | ) | 118,850 | | 1,839,971 | |
2011 | | 1,319,509 | | 82,102 | | 57,603 | | - | | 119,415 | | 1,459,214 | |
| | | | | | | | | | | | | |
John Arthur | | | | | | | | | | | | | |
2012 | | 65,627 | | 25,933 | | - | | 6,300 | | 40,051 | | 97,860 | |
2011 | | 47,937 | | 14,118 | | - | | 3,572 | | 22,007 | | 65,627 | |
| | | | | | | | | | | | | |
Peter Clare | | | | | | | | | | | | | |
2012 | | 40,986 | | 32,416 | | - | | (23,067 | ) | 50,335 | | 50,335 | |
2011 | | 23,067 | | 17,919 | | - | | - | | 40,962 | | 40,986 | |
| | | | | | | | | | | | | |
Philip Coffey | | | | | | | | | | | | | |
2012 | | 295,581 | | 44,204 | | 127,308 | | (165,620 | ) | 123,918 | | 301,473 | |
2011 | | 320,377 | | 26,064 | | - | | (50,860 | ) | 103,701 | | 295,581 | |
| | | | | | | | | | | | | |
Brad Cooper | | | | | | | | | | | | | |
2012 | | 133,478 | | 43,222 | | - | | (30,325 | ) | 64,942 | | 146,375 | |
2011 | | 89,713 | | 21,720 | | 22,045 | | - | | 36,112 | | 133,478 | |
| | | | | | | | | | | | | |
George Frazis | | | | | | | | | | | | | |
2012 | | 140,200 | | 39,292 | | 270,864 | | (410,864 | ) | 39,292 | | 39,492 | |
2011 | | 58,177 | | - | | 82,023 | | - | | - | | 140,200 | |
| | | | | | | | | | | | | |
Peter Hanlon | | | | | | | | | | | | | |
2012 | | 88,893 | | 34,774 | | - | | 14 | | 81,509 | | 123,681 | |
2011 | | 70,962 | | 17,919 | | - | | 12 | | 60,594 | | 88,893 | |
| | | | | | | | | | | | | |
Brian Hartzer2 | | | | | | | | | | | | | |
2012 | | n/a | | 331,906 | | - | | - | | 279,600 | | 331,906 | |
| | | | | | | | | | | | | |
Christine Parker | | | | | | | | | | | | | |
2012 | | 8,932 | | 17,015 | | - | | - | | 22,607 | | 25,947 | |
| | | | | | | | | | | | | |
Greg Targett | | | | | | | | | | | | | |
2012 | | 119,102 | | 27,111 | | 4,822 | | - | | 46,085 | | 151,035 | |
2011 | | 100,128 | | 18,974 | | - | | - | | 25,178 | | 119,102 | |
| | | | | | | | | | | | | |
Rob Whitfield | | | | | | | | | | | | | |
2012 | | 275,734 | | 36,149 | | - | | - | | 142,097 | | 311,883 | |
2011 | | 253,145 | | 22,589 | | - | | - | | 125,734 | | 275,734 | |
| | | | | | | | | | | | | |
Jason Yetton2 | | | | | | | | | | | | | |
2012 | | n/a | | 21,990 | | - | | 5,997 | | 60,466 | | 90,955 | |
| | | | | | | | | | | | | |
Former Senior Executives | | | | | | | | | | | |
Rob Chapman2 | | | | | | | | | | | | | |
2012 | | 147,206 | | 24,047 | | - | | (98,317 | ) | - | | n/a | |
2011 | | n/a | | 10,860 | | - | | 35 | | 18,877 | | 147,206 | |
| | | | | | | | | | | | | |
Rob Coombe2 | | | | | | | | | | | | | |
2012 | | 140,571 | | - | | - | | - | | - | | n/a | |
2011 | | 118,851 | | 21,720 | | - | | - | | 77,530 | | 140,571 | |
| | | | | | | | | | | | | |
Bob McKinnon | | | | | | | | | | | | | |
2011 | | 12,834 | | 16,290 | | - | | - | | 29,083 | | 29,124 | |
1 The highest number of shares held by an individual in the above tables is 0.06% of total Westpac ordinary shares outstanding at 30 September 2012.
2 This information relates to the period that these individuals were key management personnel during the year.
| | |
| 2012 WESTPAC GROUP ANNUAL REPORT | 285 |
NOTE 41. DIRECTOR AND OTHER KEY MANAGEMENT PERSONNEL DISCLOSURES (CONTINUED)
The following table sets out the details of the performance options, performance share rights and unhurdled share rights held at 30 September 2012 by the CEO and other key management personnel (including their related parties):
| | Latest Date | | Number of | | Number of | | Exercise Price | |
| | for Exercise | | Share Rights | | Options | | of Options | |
Gail Kelly | | 1 Feb 2018 | | - | | 364,431 | | $25.89 | |
| | 1 Dec 2018 | | 11,973 | | 35,612 | | $16.80 | |
| | 21 Dec 2019 | | 166,002 | | - | | n/a | |
| | 1 Oct 2020 | | 176,125 | | - | | n/a | |
| | 1 Oct 2021 | | 272,929 | | - | | n/a | |
| | | | | | | | | |
John Arthur | | 1 Oct 2019 | | 19,173 | | - | | n/a | |
| | 1 Oct 2020 | | 39,138 | | - | | n/a | |
| | 1 Oct 2021 | | 40,433 | | - | | n/a | |
| | | | | | | | | |
Peter Clare | | 1 Oct 2018 | | - | | 81,799 | | $23.40 | |
| | 1 Oct 2019 | | 25,763 | | - | | n/a | |
| | 1 Oct 2020 | | 30,006 | | - | | n/a | |
| | 1 Oct 2021 | | 50,542 | | - | | n/a | |
| | | | | | | | | |
Philip Coffey | | 20 Jan 2015 | | - | | 179,791 | | $18.98 | |
| | 15 Dec 2016 | | - | | 149,567 | | $23.98 | |
| | 17 Dec 2017 | | - | | 114,786 | | $30.10 | |
| | 1 Oct 2018 | | - | | 104,805 | | $23.40 | |
| | 1 Oct 2019 | | 35,949 | | - | | n/a | |
| | 1 Oct 2020 | | 39,138 | | - | | n/a | |
| | 1 Oct 2021 | | 66,715 | | - | | n/a | |
| | | | | | | | | |
Brad Cooper | | 17 Dec 2017 | | - | | 104,761 | | $30.10 | |
| | 1 Oct 2018 | | - | | 92,024 | | $23.40 | |
| | 1 Oct 2019 | | 31,455 | | - | | n/a | |
| | 1 Oct 2020 | | 48,923 | | - | | n/a | |
| | 1 Oct 2021 | | 75,813 | | - | | n/a | |
| | | | | | | | | |
George Frazis | | 1 Oct 2019 | | 29,958 | | - | | n/a | |
| | 1 Oct 2020 | | 53,318 | | - | | n/a | |
| | 1 Oct 2021 | | 55,596 | | - | | n/a | |
| | | | | | | | | |
Peter Hanlon | | 15 Dec 2016 | | - | | 55,249 | | $23.98 | |
| | 17 Dec 2017 | | - | | 68,922 | | $30.10 | |
| | 1 Oct 2018 | | - | | 78,220 | | $23.40 | |
| | 1 Oct 2019 | | 25,763 | | - | | n/a | |
| | 1 Oct 2020 | | 30,006 | | - | | n/a | |
| | 1 Oct 2021 | | 50,542 | | - | | n/a | |
| | | | | | | | | |
Brian Hartzer1 | | | | | | | | | |
| | | | | | | | | |
Christine Parker | | 17 Dec 2017 | | - | | 12,832 | | $30.10 | |
| | 1 Oct 2018 | | - | | 12,204 | | $23.40 | |
| | 1 Oct 2019 | | 6,223 | | - | | n/a | |
| | 1 Oct 2020 | | 7,501 | | - | | n/a | |
| | 1 Oct 2021 | | 11,927 | | - | | n/a | |
| | | | | | | | | |
Greg Targett | | 1 Oct 2019 | | 28,759 | | - | | n/a | |
| | 1 Oct 2020 | | 39,138 | | - | | n/a | |
| | 1 Oct 2021 | | 60,650 | | - | | n/a | |
1 Brian Hartzer received an allocation of restricted shares on commencement of employment. He has not yet been awarded any options or share rights.
| | |
286 | 2012 WESTPAC GROUP ANNUAL REPORT | |
NOTES TO THE FINANCIAL STATEMENTS
NOTE 41. DIRECTOR AND OTHER KEY MANAGEMENT PERSONNEL DISCLOSURES (CONTINUED)
| | Latest Date | | Number of | | Number of | | Exercise Price | |
| | for Exercise | | Share Rights | | Options | | of Options | |
Rob Whitfield | | 21 Jan 2014 | | 22,537 | | 81,319 | | $16.34 | |
| | 20 Jan 2015 | | 19,162 | | 74,913 | | $18.98 | |
| | 20 Dec 2015 | | - | | 125,436 | | $20.53 | |
| | 15 Dec 2016 | | 24,886 | | 122,596 | | $23.98 | |
| | 17 Dec 2017 | | - | | 93,984 | | $30.10 | |
| | 1 Oct 2018 | | - | | 61,349 | | $23.40 | |
| | 1 Oct 2019 | | 35,949 | | - | | n/a | |
| | 1 Oct 2020 | | 39,138 | | - | | n/a | |
| | 1 Oct 2021 | | 60,650 | | - | | n/a | |
| | | | | | | | | |
Jason Yetton | | 20 Jan 2013 | | 6,723 | | - | | n/a | |
| | 21 Jan 2014 | | 15,277 | | - | | n/a | |
| | 20 Jan 2015 | | 7,664 | | 29,965 | | $18.98 | |
| | 20 Dec 2015 | | 9,862 | | 50,174 | | $20.53 | |
| | 15 Dec 2016 | | 9,954 | | 46,538 | | $23.98 | |
| | 17 Dec 2017 | | - | | 37,593 | | $30.10 | |
| | 1 Oct 2018 | | - | | 32,719 | | $23.40 | |
| | 1 Oct 2019 | | 9,586 | | - | | n/a | |
| | 1 Oct 2020 | | 10,437 | | - | | n/a | |
| | 1 Oct 2021 | | 17,689 | | - | | n/a | |
| | |
| 2012 WESTPAC GROUP ANNUAL REPORT | 287 |
NOTE 41. DIRECTOR AND OTHER KEY MANAGEMENT PERSONNEL DISCLOSURES (CONTINUED)
Loans to Directors and other key management personnel disclosures
All financial instrument transactions that have occurred during the financial year between the directors and the Westpac Group were conducted on an arm’s length basis in the ordinary course of business and on commercial terms and conditions. These transactions consisted principally of normal personal banking and financial investment services.
2012
Details of loans to Directors and other key management personnel (including their related parties) of the Group are:
| | Balance at
Start of Year
$ | | | Interest Paid and
Payable
for the Year
$ | | Interest Not
Charged
$ | | Balance at
End of Year
$ | | Number in Group
at End of Year | |
Directors | | 6,319,623 | | | 395,694 | | - | | 6,465,643 | | 3 | |
Other key management personnel1 | | 12,171,250 | | | 646,721 | | - | | 10,599,642 | | 8 | |
| | 18,490,873 | | | 1,042,415 | | - | | 17,065,285 | | 11 | |
1 The balance as at 30 September 2011 previously included $1,042,069 in respect of Bob McKinnon.
Individuals (including their related parties) with loans above $100,000 during the 30 September 2012 financial year were:
| | Balance at
Start of Year
$ | | | Interest Paid and
Payable
for the Year
$ | | Interest Not
Charged
$ | | Balance at
End of Year
$ | | Highest
Indebtedness
During the Year
$ | |
Directors | | | | | | | | | | | | |
Lindsay Maxsted | | 820,800 | | | 61,950 | | - | | 1,205,000 | | 1,285,000 | |
Gordon Cairns | | 1,475,386 | | | 94,062 | | - | | 1,475,386 | | 1,475,386 | |
John Curtis | | 3,540,435 | | | 232,254 | | - | | 3,785,257 | | 3,907,454 | |
Graham Reaney1 | | 391,700 | | | 7,305 | | - | | - | | 392,300 | |
| | | | | | | | | | | | |
Other key management personnel | | | | | | | | | | | | |
Robert Chapman1 | | 7,453,760 | | | 200,097 | | - | | - | | 10,909,659 | |
Peter Clare | | - | | | 12,119 | | - | | 1,071,166 | | 1,890,006 | |
Philip Coffey | | 250,000 | | | 15,935 | | - | | 250,000 | | 250,000 | |
Brad Cooper | | 3,635,836 | | | 274,834 | | - | | 4,949,857 | | 5,300,122 | |
George Frazis | | 1,056 | | | 8,159 | | - | | 366,106 | | 397,787 | |
Peter Hanlon | | 683,721 | | | 56,845 | | - | | 1,264,377 | | 1,264,377 | |
Brian Hartzer1 | | - | | | 7,323 | | - | | 396,915 | | 402,505 | |
Christine Parker1,2 | | - | | | 15,138 | | - | | 502,221 | | 956,147 | |
Greg Targett | | 148,376 | | | 1,503 | | - | | - | | 148,376 | |
Jason Yetton1 | | - | | | 52,441 | | - | | 1,799,000 | | 1,807,361 | |
1 This information relates to the period that these individuals were key management personnel during the year.
2 Christine Parker’s loan balance at 1 October 2011 was $878,947.
| | |
288 | 2012 WESTPAC GROUP ANNUAL REPORT | |
NOTES TO THE FINANCIAL STATEMENTS
NOTE 41. DIRECTOR AND OTHER KEY MANAGEMENT PERSONNEL DISCLOSURES (CONTINUED)
2011
Details of loans to Directors and other key management personnel (including their related parties) of the Group are:
| | Balance at
Start of Year
$ | | Interest Paid and
Payable
for the Year
$ | | Interest Not
Charged
$ | | Balance at
End of Year
$ | | Number in Group
at End of Year | |
Directors | | 6,018,345 | | 420,860 | | - | | 6,319,623 | | 6 | |
Other key management personnel1 | | 5,434,760 | | 678,220 | | - | | 13,213,319 | | 7 | |
| | 11,453,105 | | 1,099,080 | | - | | 19,532,942 | | 13 | |
1 The balance as at 30 September 2010 previously included $8,004,338 in respect of Greg Bartlett.
Individuals (including their related parties) with loans above $100,000 during the 30 September 2011 financial year were:
| | Balance at
Start of Year
$ | | Interest Paid and
Payable
for the Year
$ | | Interest Not
Charged
$ | | Balance at
End of Year
$ | | Highest
Indebtedness
During the Year
$ | |
Directors | | | | | | | | | | | |
Ted Evans | | 151,311 | | 1,506 | | - | | - | | 107,060 | |
Gordon Cairns | | 1,428,591 | | 102,087 | | - | | 1,475,386 | | 1,497,386 | |
John Curtis | | 3,207,462 | | 231,461 | | - | | 3,540,435 | | 3,569,911 | |
Lindsay Maxsted | | 1,022,454 | | 56,740 | | - | | 820,800 | | 1,023,692 | |
Graham Reaney | | 208,528 | | 25,838 | | - | | 391,700 | | 414,237 | |
Peter Wilson | | - | | 3,227 | | - | | 91,303 | | 308,574 | |
| | | | | | | | | | | |
Other key management personnel | | | | | | | | | | | |
Rob Chapman1 | | - | | 354,881 | | - | | 7,453,760 | | 7,909,660 | |
Peter Clare | | - | | 1,443 | | - | | - | | 103,711 | |
Philip Coffey | | 250,000 | | 17,167 | | - | | 250,000 | | 250,000 | |
Brad Cooper | | 3,911,412 | | 234,726 | | - | | 3,635,836 | | 3,993,686 | |
Peter Hanlon | | 24,472 | | - | | - | | 683,721 | | 1,543,193 | |
Bob McKinnon | | 921,701 | | 53,779 | | - | | 1,042,069 | | 1,049,111 | |
Greg Targett | | 327,175 | | 16,224 | | - | | 148,376 | | 327,175 | |
1 This information relates to the period that these individuals were key management personnel during the year. The loan balance at 30 September 2010 was $4,061,922.
| | |
| 2012 WESTPAC GROUP ANNUAL REPORT | 289 |
|
NOTE 42. NOTES TO THE CASH FLOW STATEMENTS |
Cash and balances with central banks |
| | | Consolidated | | Parent Entity | |
| | | 2012 | | 2011 | | 2010 | | 2012 | | 2011 | |
| | | $m | | $m | | $m | | $m | | $m | |
Cash on hand | | | 11,138 | | | 14,814 | | 3,276 | | | 10,816 | | | 14,225 | |
Balance with central banks | | | 1,385 | | | 1,444 | | 1,188 | | | 177 | | | 525 | |
Total cash and balances with central banks | | | 12,523 | | | 16,258 | | 4,464 | | | 10,993 | | | 14,750 | |
Cash and cash equivalents
Reconciliation of net cash (used in)/provided by operating activities to net profit attributable to equity holders of Westpac Banking Corporation is set out below:
| | | Consolidated | | | Parent Entity | |
| | | 2012 | | 2011 | | 2010 | | | 2012 | | | 2011 | |
| | | $m | | $m | | $m | | | $m | | | $m | |
Reconciliation of net cash provided/(used in) by operating activities to net profit | | | | | | | | | | | | | | | |
Net profit | | | 6,036 | | | 7,059 | | 6,412 | | | 4,952 | | | 6,213 | |
Adjustments: | | | | | | | | | | | | | | | |
Depreciation, amortisation and impairment | | | 850 | | | 721 | | 720 | | | 747 | | | 643 | |
Increase/(decrease) in sundry provisions and other non-cash items | | | (179 | ) | | (283 | ) | (756 | ) | | 801 | | | (204 | ) |
Impairment charges on loans | | | 1,316 | | | 1,053 | | 1,506 | | | 1,088 | | | 823 | |
(Increase)/decrease in trading and fair value assets | | | 4,271 | | | (8,117 | ) | 1,819 | | | 3,112 | | | (8,996 | ) |
Increase/(decrease) in trading and fair value liabilities | | | 155 | | | 4,932 | | (5,936 | ) | | 158 | | | 4,933 | |
(Increase)/decrease in derivative financial instruments | | | 5,013 | | | (16,960 | ) | (2,418 | ) | | 4,989 | | | (16,732 | ) |
(Increase)/decrease in accrued interest receivable | | | 134 | | | (194 | ) | (357 | ) | | 189 | | | (248 | ) |
Increase/(decrease) in accrued interest payable | | | 54 | | | 236 | | 1,455 | | | 35 | | | 238 | |
(Decrease)/increase in current and deferred tax | | | 834 | | | (461 | ) | (1,977 | ) | | 235 | | | (908 | ) |
Net cash (used in)/provided by operating activities | | | 18,484 | | | (12,014 | ) | 468 | | | 16,306 | | | (14,238 | ) |
Details of assets and liabilities of controlled entities and businesses acquired | | | | | | | | | | | | | | | |
Total assets (financial and tangible) excluding cash | | | 73 | | | - | | - | | | - | | | - | |
Identifiable intangible assets | | | 120 | | | - | | - | | | - | | | - | |
Total liabilities | | | (70 | ) | | - | | - | | | - | | | - | |
Fair value of identifiable net assets acquired | | | 123 | | | - | | - | | | - | | | - | |
Goodwill | | | 214 | | | - | | - | | | - | | | - | |
Total | | | 337 | | | - | | - | | | - | | | - | |
Consideration paid | | | | | | | | | | | | | | | |
Debt and equity instruments issued | | | 45 | | | - | | - | | | - | | | - | |
Cash paid | | | 292 | | | - | | - | | | - | | | - | |
Total consideration transferred | | | 337 | | | - | | - | | | - | | | - | |
Cash paid | | | 292 | | | - | | - | | | - | | | - | |
Less cash acquired | | | (22 | ) | | - | | - | | | - | | | - | |
Cash paid (net of cash acquired) | | | 270 | | | - | | - | | | - | | | - | |
Business acquired
On 1 October 2011 BT Investment Management Limited (an entity controlled by Westpac) acquired 100% of the share capital of J O Hambro Capital Management Limited, a company incorporated in the United Kingdom.
The results for the year ended 30 September 2012 includes the financial impact of full ownership from 1 October 2011.
Equity transactions
Refer to Note 24 for details of the shares issued during the year.
NOTE 43. SUBSEQUENT EVENTS
No matter or circumstance has arisen since the year ended 30 September 2012 which is not otherwise dealt with in this report, that has significantly affected or may significantly affect the operations of the Group, the results of its operations or the state of affairs of the Group in subsequent periods.
| | |
290 | 2012 WESTPAC GROUP ANNUAL REPORT | |
DIRECTORS’ DECLARATION
In the Directors’ opinion:
a. the financial statements and notes set out in ‘Section 3 – Financial report for the year ended 30 September 2012’ are in accordance with the Corporations Act 2001, including:
(i) complying with Australian Accounting Standards, the Corporations Regulations 2001 and other mandatory professional reporting requirements; and
(ii) giving a true and fair view of Westpac Banking Corporation and the Group’s financial position as at 30 September 2012 and of their performance, as represented by the results of their operations, changes in equity and their cash flows, for the financial year ended on that date; and
b. there are reasonable grounds to believe that Westpac will be able to pay its debts as and when they become due and payable.
Note 1(a) confirms that the financial report also complies with International Financial Reporting Standards as issued by the International Accounting Standards Board.
The Directors have been given the declaration by the Chief Executive Officer and the Chief Financial Officer required by section 295A of the Corporations Act 2001.
This declaration is made in accordance with a resolution of the Directors.
For and on behalf of the Board.
 | 
|
Lindsay Maxsted
Chairman | Gail Kelly
Managing Director &
Chief Executive Officer |
Sydney
5 November 2012 | |
| | |
| 2012 WESTPAC GROUP ANNUAL REPORT | 291 |
|
MANAGEMENT’S REPORT ON INTERNAL CONTROL OVER FINANCIAL REPORTING |
The following report is required by rules of the US Securities and Exchange Commission
The management of Westpac is responsible for establishing and maintaining adequate internal control over financial reporting for Westpac as defined in Rule 13a – 15 (f) under the Securities Exchange Act of 1934, as amended. Westpac’s internal control system is a process designed to provide reasonable assurance regarding the reliability of financial reporting and the preparation of financial statements for external purposes in accordance with applicable accounting standards.
Westpac’s internal control over financial reporting includes policies and procedures that: pertain to the maintenance of records that in reasonable detail accurately reflect the transactions and dispositions of the assets of Westpac and its consolidated entities; provide reasonable assurance that transactions are recorded as necessary to permit preparation of financial statements in accordance with applicable accounting standards, and that receipts and expenditures of Westpac are being made only in accordance with authorizations of management and directors of Westpac and its consolidated entities; and provide reasonable assurance regarding prevention or timely detection of unauthorized acquisition, use or disposition of the assets of Westpac and its consolidated entities that could have a material effect on the financial statements.
Because of its inherent limitations, internal control over financial reporting may not prevent or detect misstatements. Also, projections of any evaluation of effectiveness to future periods are subject to the risk that controls may become inadequate because of changes in conditions, or that the degree of compliance with the policies or procedures may deteriorate.
Westpac management, with the participation of the CEO and CFO, assessed the effectiveness of Westpac’s internal control over financial reporting as of 30 September 2012 based on the criteria set forth by the Committee of Sponsoring Organizations of the Treadway Commission (COSO) in Internal Control-Integrated Framework. Based on this assessment, management has concluded that Westpac’s internal control over financial reporting as of 30 September 2012 was effective.
The effectiveness of Westpac’s internal control over financial reporting as of 30 September 2012 has been audited by PricewaterhouseCoopers, an independent registered public accounting firm, as stated in their report which is included herein.
| | |
292 | 2012 WESTPAC GROUP ANNUAL REPORT | |
|

|
| |
| | INDEPENDENT AUDITOR’S REPORT TO THE MEMBERS OF WESTPAC BANKING CORPORATION | |
| | | |
| | Report on the financial report We have audited the accompanying financial report of Westpac Banking Corporation (the Corporation), which comprises the balance sheets as at 30 September 2012, and the income statements, the statements of comprehensive income, the statements of changes in equity and cash flow statements for the year ended on that date, a summary of significant accounting policies, other explanatory notes and the directors’ declaration for both the Corporation and the Westpac Banking Corporation Group (the Consolidated Entity). The Consolidated Entity comprises the Corporation and the entities it controlled at the year’s end or from time to time during the financial year. | |
| | | |
| | Directors’ responsibility for the financial report | |
| | The directors of the Corporation are responsible for the preparation of the financial report that gives a true and fair view in accordance with Australian Accounting Standards and the Corporations Act 2001 and for such internal control as the directors determine is necessary to enable the preparation of the financial report that is free from material misstatement, whether due to fraud or error. In Note 1, the directors also state, in accordance with Accounting Standard AASB 101 Presentation of Financial Statements, that the financial report complies with International Financial Reporting Standards as issued by the International Accounting Standards Board. | |
| | | |
| | Auditor’s responsibility | |
| | Our responsibility is to express an opinion on the financial report based on our audit. We conducted our audit in accordance with Australian Auditing Standards. These Auditing Standards require that we comply with relevant ethical requirements relating to audit engagements and plan and perform the audit to obtain reasonable assurance whether the financial report is free from material misstatement. | |
| | | |
| | An audit involves performing procedures to obtain audit evidence about the amounts and disclosures in the financial report. The procedures selected depend on the auditor’s judgment, including the assessment of the risks of material misstatement of the financial report, whether due to fraud or error. In making those risk assessments, the auditor considers internal control relevant to the entity’s preparation and fair presentation of the financial report in order to design audit procedures that are appropriate in the circumstances, but not for the purpose of expressing an opinion on the effectiveness of the entity’s internal control. An audit also includes evaluating the appropriateness of accounting policies used and the reasonableness of accounting estimates made by the directors, as well as evaluating the overall presentation of the financial report. | |
| | | |
| | Our procedures include reading the other information in the Annual Report to determine whether it contains any material inconsistencies with the financial report. | |
| | | |
| | We believe that the audit evidence we have obtained is sufficient and appropriate to provide a basis for our audit opinions. | |
| | | |
| | Independence | |
| | In conducting our audit, we have complied with the independence requirements of the Corporations Act 2001. | |
| | | |
| | Auditor’s opinion | |
| | In our opinion: | |
| | | |
| | a. | the financial report of the Corporation is in accordance with the Corporations Act 2001, including: | |
| | | | |
| | | (i) | giving a true and fair view of the Corporation’s and the Consolidated Entity’s financial position as at 30 September 2012 and of their performance for the year ended on that date; and | |
| | | | | |
| | | (ii) | complying with Australian Accounting Standards—including the Australian Accounting Interpretations and the Corporations Regulations 2001; and | |
| | | | |
| | b. | the financial report and notes also comply with International Financial Reporting Standards as disclosed in Note 1. | |
| | | |
| | | |
| | PricewaterhouseCoopers, ABN 52 780 433 757 | |
| | Darling Park Tower 2, 201 Sussex Street, GPO BOX 2650, SYDNEY NSW 1171 | |
| | T +61 2 8266 0000, F +61 2 8266 9999, www.pwc.com.au | |
| | | |
| | | |
| | | |
| | |
| 2012 WESTPAC GROUP ANNUAL REPORT | 293 |
| |
| |
|
|
| | |
| | Report on the Remuneration Report | |
| | We have audited the Remuneration Report included in the Directors’ report in Section 1 of this Annual Report for the year ended 30 September 2012. The directors of the Corporation are responsible for the preparation and presentation of the Remuneration Report in accordance with section 300A of the Corporations Act 2001. Our responsibility is to express an opinion on the Remuneration Report, based on our audit conducted in accordance with Australian Auditing Standards. | |
| | |
| | Auditor’s opinion | |
| | In our opinion, the Remuneration Report of the Corporation for the year ended 30 September 2012, complies with section 300A of the Corporations Act 2001. | |
| | |
| | |
| | |
| | 
|
| | |
| | PricewaterhouseCoopers |
| | |
| | |
| | 
|
| | |
| | Michael Codling |
| | Partner |
| | |
| | |
| | 
|
| | |
| | Anne Loveridge |
| | Partner |
| | |
| | |
| | Sydney, Australia |
| | 5 November 2012 |
| | |
| | |
| | |
| | |
| | |
| | |
| | |
| | |
| | | |
| | |
| | PricewaterhouseCoopers, ABN 52 780 433 757 |
| | Darling Park Tower 2, 201 Sussex Street, GPO BOX 2650, SYDNEY NSW 1171 |
| | T +61 2 8266 0000, F +61 2 8266 9999, www.pwc.com.au
|
| | |
294 | 2012 WESTPAC GROUP ANNUAL REPORT | |
| | |
| | |
|
| |
| | |
| | REPORT OF INDEPENDENT REGISTERED PUBLIC ACCOUNTING FIRM | |
| | | |
| | To the Board of Directors and Shareholders of Westpac Banking Corporation: | |
| | | |
| | In our opinion, the accompanying consolidated balance sheets and the related consolidated income statements, consolidated statements of comprehensive income, consolidated statements of changes in equity and consolidated cash flow statements present fairly, in all material respects, the financial position of Westpac Banking Corporation (the ‘Corporation’) and its subsidiaries at 30 September 2012 and 30 September 2011, and the results of their operations and their cash flows for each of the three years in the period ended 30 September 2012 in conformity with International Financial Reporting Standards as issued by the International Accounting Standards Board. Also in our opinion, the Corporation maintained, in all material respects, effective internal control over financial reporting as of 30 September 2012, based on criteria established in Internal Control – Integrated Framework issued by the Committee of Sponsoring Organizations of the Treadway Commission (COSO). The Corporation’s management is responsible for these financial statements, for maintaining effective internal control over financial reporting and for its assessment of the effectiveness of internal control over financial reporting, included under the heading ‘Management’s Report on Internal Control over Financial Reporting’ in the accompanying Annual Report. Our responsibility is to express opinions on these financial statements and on the Corporation’s internal control over financial reporting based on our integrated audits. We conducted our audits in accordance with the standards of the Public Company Accounting Oversight Board (United States) and International Standards on Auditing. Those standards require that we plan and perform the audits to obtain reasonable assurance about whether the financial statements are free of material misstatement and whether effective internal control over financial reporting was maintained in all material respects. Our audits of the financial statements included examining, on a test basis, evidence supporting the amounts and disclosures in the financial statements, assessing the accounting principles used and significant estimates made by management, and evaluating the overall financial statement presentation. Our audit of internal control over financial reporting included obtaining an understanding of internal control over financial reporting, assessing the risk that a material weakness exists, and testing and evaluating the design and operating effectiveness of internal control based on the assessed risk. Our audits also included performing such other procedures as we considered necessary in the circumstances. We believe that our audits provide a reasonable basis for our opinions. | |
| | | |
| | Our audit of the consolidated financial statements of the Corporation and its subsidiaries was conducted for the purpose of forming an opinion on the consolidated financial statements taken as a whole. The Corporation has included parent entity only information on the face of the consolidated financial statements and other parent entity only disclosures in the notes to the financial statements. Such parent entity only information is presented for purposes of additional analysis and is not a required part of the consolidated financial statements presented in accordance with International Financial Reporting Standards as issued by the International Accounting Standards Board. Such information has been subjected to the auditing procedures applied in the audit of the consolidated financial statements, and, in our opinion, is fairly stated in all material respects in relation to the consolidated financial statements taken as a whole. | |
| | | |
| | A company’s internal control over financial reporting is a process designed to provide reasonable assurance regarding the reliability of financial reporting and the preparation of financial statements for external purposes in accordance with generally accepted accounting principles. A company’s internal control over financial reporting includes those policies and procedures that (i) pertain to the maintenance of records that, in reasonable detail, accurately and fairly reflect the transactions and dispositions of the assets of the company; (ii) provide reasonable assurance that transactions are recorded as necessary to permit preparation of financial statements in accordance with generally accepted accounting principles, and that receipts and expenditures of the company are being made only in accordance with authorizations of management and directors of the company; and (iii) provide reasonable assurance regarding prevention or timely detection of unauthorized acquisition, use, or disposition of the company’s assets that could have a material effect on the financial statements. | |
| | | |
| | | |
| | | |
| | | |
| | | |
| | | |
| | PricewaterhouseCoopers, ABN 52 780 433 757 | |
| | Darling Park Tower 2, 201 Sussex Street, GPO BOX 2650, SYDNEY NSW 1171 | |
| | T +61 2 8266 0000, F +61 2 8266 9999, www.pwc.com.au | |
| | | |
| | | |
| | | |
| | |
| 2012 WESTPAC GROUP ANNUAL REPORT | 295 |
| | | |
| | | |
|
| |
| | |
| | Because of its inherent limitations, internal control over financial reporting may not prevent or detect misstatements. Also, projections of any evaluation of effectiveness to future periods are subject to the risk that controls may become inadequate because of changes in conditions, or that the degree of compliance with the policies or procedures may deteriorate. | |
| | | |
| | | |
| | | |
| | 
| |
| | | | |
| | PricewaterhouseCoopers | Sydney, Australia | |
| | | 5 November 2012 | |
| | | |
| | | |
| | | |
| | | |
| | | |
| | | |
| | | |
| | | |
| | PricewaterhouseCoopers, ABN 52 780 433 757 | |
| | Darling Park Tower 2, 201 Sussex Street, GPO BOX 2650, SYDNEY NSW 1171 | |
| | T +61 2 8266 0000, F +61 2 8266 9999, www.pwc.com.au | |
| | | |
| | | |
| | | |
| | |
296 | 2012 WESTPAC GROUP ANNUAL REPORT | |
SHAREHOLDING INFORMATION
ADDITIONAL INFORMATION
INFORMATION FOR SHAREHOLDERS
GLOSSARY OF ABBREVIATIONS AND DEFINED TERMS
CONTACT US
WESTPAC ORDINARY SHARES
Top 20 ordinary shareholders as at 3 October 2012
| | Number of Fully Paid
Ordinary Shares | | % Held |
HSBC Custody Nominees (Australia) Limited | | 513,847,518 | | 16.68 |
JP Morgan Nominees Australia Limited | | 402,127,084 | | 13.06 |
National Nominees Limited | | 308,808,079 | | 10.03 |
Citicorp Nominees Pty Limited | | 132,903,000 | | 4.31 |
Cogent Nominees Pty Limited | | 82,008,771 | | 2.66 |
RBC Global Services Australia Nominees Pty Limited | | 44,441,656 | | 1.44 |
AMP Life Limited | | 28,577,859 | | 0.93 |
Australian Foundation Investment Company Limited | | 18,306,032 | | 0.59 |
UBS Private Clients Australia Nominees Pty Limited | | 15,971,362 | | 0.52 |
Bond Street Custodians Limited | | 11,524,996 | | 0.37 |
Milton Corporation Limited | | 10,419,617 | | 0.34 |
Argo Investments Limited | | 9,351,594 | | 0.30 |
Perpetual Trustee Company Limited | | 7,934,853 | | 0.26 |
UBS Nominees Pty Limited | | 6,556,519 | | 0.21 |
Navigator Australia Limited | | 6,424,459 | | 0.21 |
Bainpro Nominees Pty Limited | | 6,374,113 | | 0.21 |
Invia Custodian Pty Limited | | 6,280,394 | | 0.20 |
Queensland Investment Corporation | | 6,157,478 | | 0.20 |
Questor Financial Services Limited | | 4,602,691 | | 0.15 |
Nulis Nominees (Australia) Limited | | 4,481,474 | | 0.15 |
Total of Top 20 registered shareholders | | 1,627,099,549 | | 52.82 |
As at 3 October 2012 there were 563,072 holders of our ordinary shares compared to 572,106 in 2011 and 561,023 in 2010. Ordinary shareholders with a registered address in Australia held approximately 98% of our fully paid share capital at 3 October 2012 (approximately 98% in 2011 and 98% in 2010).
Substantial shareholders as at 3 October 2012
As at 3 October 2012 there were no shareholders who had a ‘substantial holding’ of our shares within the meaning of the Corporations Act. A person has a substantial holding of our shares if the total votes attached to our voting shares in which they or their associates have relevant interests is 5% or more of the total number of votes attached to all our voting shares. The above table of the Top 20 ordinary shareholders includes shareholders that may hold shares for the benefit of third parties.
Significant changes in ordinary share ownership of substantial shareholders
On 15 October 2009, Barclays Group became a substantial shareholder having relevant interests in 171,119,392 ordinary shares (5.82% of total votes outstanding). They ceased to be a substantial shareholder on 16 November 2009.
On 2 December 2009, BlackRock Investment Management (Australia) Limited became a substantial shareholder having relevant interests in 159,356,967 ordinary shares (5.35% of total votes outstanding). They ceased to be a substantial shareholder on 18 May 2010.
On 17 May 2012, National Australia Bank Limited became a substantial shareholder having relevant interest in 178,904,696 ordinary shares (5.86% of total votes outstanding). They ceased to be a substantial shareholder on 18 May 2012.
Control of registrant
We are not directly or indirectly owned or controlled by any other corporation(s) or by any foreign government. Refer to the section ‘Exchange controls and other limitations affecting security holders’, which provides information on the Foreign Acquisitions and Takeovers Act 1975, Corporations Act 2001 and Financial Sector (Shareholdings) Act 1998, which impose limits on equity holdings.
At 30 September 2012, our Directors and Executive Officers owned beneficially, directly or indirectly, an aggregate of 3,660,296 (0.12%) of the fully paid ordinary shares outstanding.
| |
298 | 2012 WESTPAC GROUP ANNUAL REPORT |
Analysis by range of holdings of ordinary shares as at 3 October 2012
| | | | Number of Holders | | | | Number of | | | | Number of Holders |
| | | of Fully Paid | | | | Fully Paid | | | | of Share Options |
Number of Shares | | Ordinary Shares | | % | | Ordinary Shares | | % | | and Rights |
1 | – | 1,000 | | 308,833 | | 54.85 | | 128,774,367 | | 4.18 | | 65 |
1,001 | – | 5,000 | | 196,156 | | 34.84 | | 449,480,761 | | 14.59 | | 188 |
5,001 | – | 10,000 | | 34,595 | | 6.14 | | 243,246,066 | | 7.90 | | 56 |
10,001 | – | 100,000 | | 22,832 | | 4.05 | | 484,055,044 | | 15.72 | | 89 |
100,001 and over | | 656 | | 0.12 | | 1,774,636,656 | | 57.61 | | 27 |
Totals | | 563,072 | | 100.00 | | 3,080,192,894 | | 100.00 | | 425 |
There were 10,421 shareholders holding less than a marketable parcel ($500) based on a market price of $25.16 at the close of trading on 3 October 2012.
Voting rights of ordinary shares
Holders of our fully paid ordinary shares have, at general meetings (including special general meetings), one vote on a show of hands and, upon a poll, one vote for each fully paid ordinary share held by them.
WESTPAC STAPLED PREFERRED SECURITIES (WESTPAC SPS)
Top 20 holders of Westpac SPS as at 3 October 2012
| | Number of
Westpac SPS | | % Held |
BT Portfolio Services Limited | | 363,662 | | 3.51 |
HSBC Custody Nominees Australia Limited | | 302,011 | | 2.92 |
UBS Wealth Management Australia Nominees Limited | | 294,542 | | 2.84 |
JP Morgan Nominees Australia Limited | | 203,024 | | 1.96 |
Navigator Australia Limited | | 171,531 | | 1.66 |
Invia Custodian Pty Limited | | 166,630 | | 1.61 |
Bond Street Custodians Limited | | 132,017 | | 1.27 |
UBS Nominees Pty Limited | | 130,609 | | 1.26 |
Nulis Nominees (Australia) Limited | | 111,012 | | 1.07 |
Avanteos Investments Limited | | 105,073 | | 1.01 |
Citicorp Nominees Pty Limited | | 93,473 | | 0.90 |
Austrust Limited | | 90,921 | | 0.88 |
Netwealth Investments Limited | | 85,374 | | 0.82 |
JMB Pty Ltd | | 80,800 | | 0.78 |
Eastcote Pty Limited | | 80,000 | | 0.77 |
Wiser Equity Pty Limited | | 80,000 | | 0.77 |
Perpetual Trustee Company Limited | | 73,181 | | 0.71 |
Enterprise No 2 Pty Limited | | 70,000 | | 0.68 |
Namrog Investments Pty Limited | | 60,000 | | 0.58 |
National Nominees Limited | | 57,262 | | 0.55 |
Total of Top 20 registered holders | | 2,751,122 | | 26.55 |
Analysis by range of holdings of Westpac SPS as at 3 October 2012
| | | | Number of Holders of | | | | Number of | | |
Number of Securities | | Westpac SPS | | % | | Westpac SPS | | % |
1 | – | 1,000 | | 13,941 | | 91.88 | | 4,313,209 | | 41.62 |
1,001 | – | 5,000 | | 1,076 | | 7.09 | | 2,362,276 | | 22.80 |
5,001 | – | 10,000 | | 93 | | 0.61 | | 730,041 | | 7.05 |
10,001 | – | 100,000 | | 57 | | 0.38 | | 1,765,038 | | 17.03 |
100,001 and over | | 6 | | 0.04 | | 1,192,106 | | 11.50 |
Totals | | | | 15,173 | | 100.00 | | 10,362,670 | | 100.00 |
There were 3 security holders holding less than a marketable parcel ($500) of Westpac SPS based on a market price of $99.50 at the close of trading on 3 October 2012.
| |
| 2012 WESTPAC GROUP ANNUAL REPORT | 299 |
WESTPAC STAPLED PREFERRED SECURITIES II (WESTPAC SPS II)
Top 20 holders of Westpac SPS II as at 3 October 2012
| | Number of
Westpac SPS II | | % Held | |
BT Portfolio Services Limited | | 348,610 | | 3.84 | |
Namrog Investments Pty Limited | | 250,000 | | 2.75 | |
Invia Custodian Pty Limited | | 199,098 | | 2.19 | |
UCA Cash Management Fund Limited | | 135,101 | | 1.49 | |
UBS Wealth Management Australia Nominees Pty Limited | | 133,954 | | 1.47 | |
Questor Financial Services Limited | | 130,800 | | 1.44 | |
Navigator Australia Limited | | 129,852 | | 1.43 | |
Bond Street Custodians Limited | | 116,040 | | 1.28 | |
HSBC Custody Nominees (Australia) Limited | | 112,682 | | 1.24 | |
Avanteos Investments Limited | | 81,529 | | 0.90 | |
Amelvan Pty Limited | | 78,898 | | 0.87 | |
Perpetual Trustee Company Limited | | 76,564 | | 0.84 | |
RBC Dexia Investor Services Australia Nominees Pty Limited | | 72,493 | | 0.80 | |
Nulis Nominees (Australia) Limited | | 70,574 | | 0.78 | |
Alsop Pty Limited | | 60,000 | | 0.66 | |
Dimbulu Pty Limited | | 51,000 | | 0.56 | |
Domer Mining Co Pty Limited | | 50,000 | | 0.55 | |
Randazzo C&G Developments Pty Limited | | 50,000 | | 0.55 | |
JP Morgan Nominees Australia Limited | | 48,545 | | 0.53 | |
BKI Investment Company Limited | | 45,000 | | 0.50 | |
Total of Top 20 registered holders | | 2,240,740 | | 24.67 | |
Analysis by range of holdings of Westpac SPS II as at 3 October 2012
| | | | Number of Holders of | | | | Number of | | |
Number of Securities | | Westpac SPS II | | % | | Westpac SPS II | | % |
1 | – | 1,000 | | 12,997 | | 91.68 | | 3,832,416 | | 42.19 |
1,001 | – | 5,000 | | 1,033 | | 7.29 | | 2,283,936 | | 25.14 |
5,001 | – | 10,000 | | 94 | | 0.66 | | 762,023 | | 8.39 |
10,001 | – | 100,000 | | 47 | | 0.33 | | 1,335,855 | | 14.71 |
100,001 and over | | 6 | | 0.04 | | 869,048 | | 9.57 |
Totals | | | | 14,177 | | 100.00 | | 9,083,278 | | 100.00 |
There were 2 security holders holding less than a marketable parcel ($500) of Westpac SPS II based on a market price of $102.01 at the close of trading on 3 October 2012.
| |
300 | 2012 WESTPAC GROUP ANNUAL REPORT |
SHAREHOLDING INFORMATION
WESTPAC CONVERTIBLE PREFERENCE SHARES (WESTPAC CPS)
Top 20 holders of Westpac CPS as at 3 October 2012
| | Number of
Westpac CPS | | % Held | |
UBS Wealth Management Australia Nomines Limited | | 634,643 | | 5.34 | |
Navigator Australia Limited | | 167,102 | | 1.40 | |
UCA Cash Management Fund Limited | | 150,181 | | 1.26 | |
Questor Financial Services Limited | | 149,583 | | 1.26 | |
Nulis Nominees (Australia) Limited | | 139,386 | | 1.17 | |
HSBC Custody Nominees (Australia) Limited | | 135,169 | | 1.14 | |
BT Portfolio Services Limited | | 132,245 | | 1.11 | |
JP Morgan Nominees Australia Limited | | 127,740 | | 1.07 | |
RBC Dexia Investor Services Australia Nominees Pty Limited | | 105,199 | | 0.88 | |
Namrog Investments Pty Limited | | 100,000 | | 0.84 | |
M F Custodians Limited | | 78,445 | | 0.66 | |
Dimbulu Pty Limited | | 70,000 | | 0.59 | |
Grizzly Holdings Pty Limited | | 63,300 | | 0.53 | |
Mrs Linda Anne Van Lieshout | | 60,000 | | 0.50 | |
Eastcote Pty Limited | | 50,000 | | 0.42 | |
Finot Pty Limited | | 50,000 | | 0.42 | |
JMB Pty Limited | | 50,000 | | 0.42 | |
Mr Jason Peterson and Mrs Lisa Peterson | | 50,000 | | 0.42 | |
Randazzo C&G Developments Pty Limited | | 50,000 | | 0.42 | |
Bond Street Custodians Limited | | 48,420 | | 0.41 | |
Total of Top 20 registered holders | | 2,411,413 | | 20.26 | |
Analysis by range of holdings of Westpac CPS as at 3 October 2012
| | Number of Holders of | | | | Number of | | | |
Number of Securities | | Westpac CPS | | % | | Westpac CPS | | % | |
1 | – | 1,000 | | | 17,454 | | 93.14 | | 5,162,157 | | 43.40 | |
1,001 | – | 5,000 | | | 1,121 | | 5.98 | | 2,694,833 | | 22.66 | |
5,001 | – | 10,000 | | | 93 | | 0.50 | | 764,737 | | 6.43 | |
10,001 | – | 100,000 | | | 64 | | 0.34 | | 1,794,897 | | 15.09 | |
100,001 and over | | 7 | | 0.04 | | 1,476,981 | | 12.42 | |
Totals | | 18,739 | | 100.00 | | 11,893,605 | | 100.00 | |
There were no security holders holding less than a marketable parcel ($500) of Westpac CPS based on a market price of $99.00 at the close of trading on 3 October 2012.
Voting rights of Westpac SPS, Westpac SPS II and Westpac CPS
In accordance with the terms of issue, holders of Westpac SPS, Westpac SPS II and Westpac CPS have no right to vote at any general meeting of Westpac except in the following circumstances:
a. on a proposal:
– to reduce the share capital of Westpac;
– that affects rights attached to Westpac SPS preference shares, Westpac SPS II preference shares or Westpac CPS (as applicable);
– to wind up Westpac; or
– for the disposal of the whole of the property, business and undertaking of Westpac.
b. on a resolution to approve the terms of a share buy back agreement, other than a buy back agreement relating to Westpac SPS preference shares, Westpac SPS II preference shares or Westpac CPS (as applicable);
c. during a period in which a dividend (or part of a dividend) in respect of Westpac SPS preference shares, Westpac SPS II preference shares or Westpac CPS (as applicable) is in arrears; and
d. during the winding up of Westpac.
When entitled to vote at a general meeting of Westpac in respect of the matters listed above, holders of Westpac SPS, Westpac SPS II and Westpac CPS are entitled to exercise one vote on a show of hands and one vote for each Westpac SPS, Westpac SPS II or Westpac CPS held on a poll.
Holders of Westpac SPS, Westpac SPS II and Westpac CPS have the same rights as the holders of Westpac’s ordinary shares in relation to receiving notices, reports and financial statements, and attending and being heard at all general meetings of Westpac.
| 2012 WESTPAC GROUP ANNUAL REPORT | 301 |
Domicile of ordinary shareholders as at 3 October 2012
| | | | | | Number of | | % of | |
| | Number | | | | Issued Shares | | Issued Shares | |
| | of Holders | | % of Holdings | | and Options | | and Options | |
Australia | | 532,899 | | 94.64 | | 3,028,215,918 | | 98.08 | |
New Zealand | | 25,770 | | 4.58 | | 43,644,678 | | 1.41 | |
United Kingdom | | 1,717 | | 0.31 | | 3,906,999 | | 0.13 | |
United States | | 578 | | 0.10 | | 1,985,763 | | 0.06 | |
Other overseas | | 2,108 | | 0.37 | | 9,728,789 | | 0.32 | |
Totals | | 563,072 | | 100.00 | | 3,087,482,147 | | 100.00 | |
| | | | | | | | | |
Domicile of holders of Westpac SPS as at 3 October 2012 | | | | | | |
| | | | | | |
| | Number | | | | Number of Issued | | % of Issued | |
| | of Holders | | % of Holdings | | Westpac SPS | | Westpac SPS | |
Australia | | 15,162 | | 99.93 | | 10,354,928 | | 99.93 | |
New Zealand | | 3 | | 0.02 | | 1,165 | | 0.01 | |
United States | | 3 | | 0.02 | | 5,084 | | 0.05 | |
Other overseas | | 5 | | 0.03 | | 1,493 | | 0.01 | |
Total | | 15,173 | | 100.00 | | 10,362,670 | | 100.00 | |
| | | | | | | | | |
Domicile of holders of Westpac SPS II as at 3 October 2012 | | | | | | | |
| | | | | | | | | |
| | Number | | | | Number of Issued | | % of Issued | |
| | of Holders | | % of Holdings | | Westpac SPS II | | Westpac SPS II | |
Australia | | 14,168 | | 99.94 | | 9,081,060 | | 99.97 | |
New Zealand | | 6 | | 0.04 | | 1,600 | | 0.02 | |
United Kingdom | | 2 | | 0.01 | | 483 | | 0.01 | |
United States | | 1 | | 0.01 | | 135 | | 0.00 | |
Total | | 14,177 | | 100.00 | | 9,083,278 | | 100.00 | |
| | | | | | | | | |
Domicile of holders of Westpac CPS as at 3 October 2012 | | | | | | | |
| | | | | | | |
| | Number | | | | Number of Issued | | % of Issued | |
| | of Holders | | % of Holdings | | Westpac CPS | | Westpac CPS | |
Australia | | 18,728 | | 99.93 | | 11,886,069 | | 99.94 | |
New Zealand | | 1 | | 0.01 | | 500 | | 0.00 | |
United Kingdom | | 3 | | 0.02 | | 1,020 | | 0.01 | |
United States | | 3 | | 0.02 | | 220 | | 0.00 | |
Other overseas | | 4 | | 0.02 | | 5,796 | | 0.05 | |
Total | | 18,739 | | 100.00 | | 11,893,605 | | 100.00 | |
302 | 2012 WESTPAC GROUP ANNUAL REPORT | |
MARKET PRICE INFORMATION
The principal listing of our ordinary shares is on the ASX. American Depositary Shares (ADS), each representing five ordinary shares, are listed on the NYSE.
The tables below set forth, for the calendar periods indicated, the reported high and low market quotations for our ordinary shares on the ASX based on its daily official list and for our ADS on the NYSE.
| | Per Ordinary Share in A$1 | | Per ADS in US$1 | |
Financial year ending | | High | | Low | | High | | Low | |
September 2012 | | 24.99 | | 19.00 | | 130.63 | | 92.34 | |
September 2011 | | 25.60 | | 17.84 | | 138.40 | | 91.63 | |
September 2010 | | 28.43 | | 20.56 | | 133.15 | | 87.70 | |
September 2009 | | 26.74 | | 14.40 | | 115.44 | | 45.90 | |
September 2008 | | 31.32 | | 18.36 | | 141.98 | | 85.28 | |
| | | | | | | | | |
| | Per Ordinary Share in A$ | | Per ADS in US$ | |
Quarter ending | | High | | Low | | High | | Low | |
2012: | | | | | | | | | |
March | | 22.09 | | 19.94 | | 114.48 | | 102.92 | |
June | | 23.07 | | 20.00 | | 119.00 | | 97.71 | |
September | | 24.99 | | 21.25 | | 130.63 | | 109.53 | |
2011: | | | | | | | | | |
March | | 24.69 | | 21.77 | | 125.10 | | 108.50 | |
June | | 25.60 | | 21.05 | | 138.40 | | 111.80 | |
September | | 22.32 | | 17.84 | | 120.08 | | 91.63 | |
December | | 23.55 | | 19.00 | | 122.85 | | 92.34 | |
2010: | | | | | | | | | |
March | | 28.35 | | 26.21 | | 128.52 | | 97.80 | |
June | | 28.43 | | 20.60 | | 133.15 | | 88.26 | |
September | | 24.49 | | 20.56 | | 116.24 | | 87.70 | |
December | | 23.68 | | 21.05 | | 121.55 | | 102.05 | |
2009: | | | | | | | | | |
March | | 19.89 | | 14.40 | | 69.81 | | 47.90 | |
June | | 20.93 | | 18.27 | | 81.72 | | 68.75 | |
September | | 26.74 | | 18.76 | | 115.44 | | 73.79 | |
December | | 27.57 | | 24.67 | | 124.91 | | 102.45 | |
| | | | | | | | | |
| | Per Ordinary Share in A$ | | Per ADS in US$ | |
Month ending – 2012 | | High | | Low | | High | | Low | |
September | | 24.95 | | 23.50 | | 129.67 | | 121.70 | |
August | | 24.99 | | 23.08 | | 130.63 | | 121.30 | |
July | | 23.39 | | 21.25 | | 122.35 | | 109.53 | |
June | | 21.30 | | 20.00 | | 108.81 | | 97.71 | |
May | | 23.07 | | 20.04 | | 118.80 | | 98.45 | |
April | | 22.75 | | 21.66 | | 119.00 | | 110.99 | |
1 Australian dollar (A$) market price information is intraday high and low trading prices. US dollar (US$) market price information is closing prices.
| 2012 WESTPAC GROUP ANNUAL REPORT | 303 |
Fees and charges payable by a holder of Westpac ADS
The depositary for Westpac’s ADS program, JPMorgan Chase Bank, N.A. (the Depositary), collects fees for delivery and surrender of ADS directly from investors depositing ordinary shares or surrendering ADS for the purpose of withdrawal or from intermediaries acting for them. The Depositary may also collect fees for making distributions to investors by deducting those fees from the amounts distributed or by selling a portion of the distributable property to pay the fees.
The charges of the Depositary payable by investors are as follows:
Type of Service | | Depositary Actions | | Fee | |
| | | | | |
Depositing or substituting
the underlying shares. | | Delivery of ADS against the deposit of ordinary shares, including deposits and issuances in respect of: < share distributions, stock splits, rights, mergers; and < exchange of securities or other transactions or events or other distribution affecting the ADS or deposited securities. | | US$5.00 or less per 100 ADS (or portion thereof) evidenced by the new ADS delivered. | |
Receiving or distributing
cash dividends. | | Distribution of cash dividends. | | No fee currently payable. | |
Withdrawing an underlying ordinary share. | | Acceptance of ADS surrendered for withdrawal of deposited ordinary shares. | | US$5.00 or less for each 100 ADS (or portion thereof) evidenced by the ADS surrendered. | |
General depositary services, particularly those charged on an annual basis. | | Other services performed by the Depositary in administering the ADS program. | | No fee currently payable. | |
Expenses of the Depositary. | | Expenses incurred on behalf of Holders in connection with: < taxes and other governmental charges; < cable, telex and facsimile transmission/delivery; < transfer or registration fees, if applicable, for the registration of transfers or underlying ordinary shares; and < expenses of the Depositary in connection with the conversion of foreign currency into US dollars (which are paid out of such foreign currency). | | Expenses payable at the sole discretion of the Depositary by billing holders or by deducting charges from one or more cash dividends or other cash distributions. | |
Fees and payments made by the Depositary to Westpac
The Depositary has agreed to reimburse certain Westpac expenses related to Westpac’s ADS program and incurred by Westpac in connection with the program, subject to certain limits. In 2012, amounts were reimbursed to Westpac, or amounts paid on its behalf to third parties by the Depositary. The following table sets out the types of expenses that the Depositary has agreed to reimburse and the amounts reimbursed for 2012:
| | Reimbursed for 2012 | |
Category of Expense Reimbursed to Westpac | | US$’000s | |
Investor relations | | 44 | |
NYSE listing fees | | 37 | |
Total | | 81 | |
Under certain circumstances, including removal of the Depositary or termination of the ADS program by Westpac, Westpac is required to repay the Depositary certain amounts reimbursed and/or expenses paid to or on behalf of Westpac. The Depositary has also agreed to waive certain of its fees for standard costs associated with the maintenance and administration of the ADS program.
304 | 2012 WESTPAC GROUP ANNUAL REPORT | |
Exchange controls and other limitations affecting security holders
Australian exchange controls
Australian laws control and regulate or permit the control and regulation of a broad range of payments and transactions involving non-residents of Australia. Pursuant to a number of exemptions, authorities and approvals, there are no general restrictions from transferring funds from Australia or placing funds to the credit of non-residents of Australia. However, Australian foreign exchange controls are implemented from time to time against prescribed countries, entities and persons. At the present time, these include:
a. withholding taxes in relation to remittances or dividends (to the extent they are unfranked) and interest payments;
b. the financial sanctions administered by the Department of Foreign Affairs and Trade (DFAT) in accordance with the Autonomous Sanctions Act 2011 and the Autonomous Sanctions Regulations 2011, specifically, in relation to transactions involving the transfer of funds or payments to, by the order of, or on behalf of:
– supporters of the former Federal Republic of Yugoslavia (the Milosevic regime);
– persons or entities associated with activities that seriously undermine democracy, respect for human rights and the rule of law in Zimbabwe;
– certain entities and individuals associated with the Democratic People’s Republic of Korea;
– specified Iranian entities and persons;
– certain individuals and entities associated with the former Qadhafi regime in Libya; and
– certain individuals and entities associated with the Syrian regime,
– without the prior approval of the Minister for Foreign Affairs.
c. the United Nations Security Council (UNSC) financial sanctions administered by DFAT including:
– Terrorist Asset Freezing Regime
In accordance with the Charter of the United Nations Act 1945 and the Charter of the United Nations (Dealings with Assets) Regulations 2008, a person is prohibited from using or dealing with funds, financial assets or economic resources of persons or entities listed as terrorists by the Minister for Foreign Affairs in the Commonwealth of Australia Gazette. It is also a criminal offence to make assets available to such persons or entities.
– Country-based sanctions
Under the Charter of the United Nations Act 1945 and associated regulations, UNSC financial sanctions have been implemented. It is an offence to use or deal with funds, financial assets or economic resources of persons or entities associated with certain countries designated by the UNSC. It is also a criminal offence to make assets available to such persons or entities.
Limitations affecting security holders
The following Australian laws impose limitations on the right of non-residents or non-citizens of Australia to hold, own or vote Westpac shares. All these limitations apply to the holders of the ADRs evidencing ADS, issued by our Depositary in the United States.
Foreign Acquisitions and Takeovers Act 1975
Acquisitions of interests in shares in Australian companies by foreign interests are subject to review and approval by the Treasurer of Australia under the Australian Government’s foreign investment policy, and where required, the Foreign Acquisitions and Takeovers Act 1975 (Cth). That legislation applies to any acquisition by a foreign person, including a corporation or group of associated foreign persons, which results in ownership of 15% or more of the issued shares of an Australian company or the ability to control 15% or more of the total voting power. In addition, the legislation applies to any acquisition by a foreign person that would result in non-associated foreign persons having, together with any associate or associates of any of them, in the aggregate, 40% or more of the total voting power or ownership of an Australian company. The legislation requires any persons proposing to make any such acquisition to first notify the Treasurer of their intention to do so. Where such an acquisition has already occurred, the Treasurer has the power to order divestment.
Financial Sector (Shareholdings) Act 1998
The Financial Sector (Shareholdings) Act 1998 (Cth) imposes restrictions on shareholdings in Australian financial sector companies (which includes Westpac). Under that legislation a person (including a corporation) may not hold more than a 15% ‘stake’ in a financial sector company without prior approval from the Treasurer of Australia. A person’s stake in a financial sector company is equal to the aggregate of the person’s voting power in the company and the voting power of the person’s associates. The concept of voting power is very broadly defined. The Treasurer may approve a higher percentage stake if the Treasurer is satisfied that it is in the national interest to do so.
In addition, even if a person’s stake in a financial sector company does not exceed the 15% limit, the Treasurer has the power to declare that a person has ‘practical control’ of a financial sector company and require the person to relinquish that control or reduce their stake in that company.
| | |
| 2012 WESTPAC GROUP ANNUAL REPORT | 305 |
Corporations Act 2001
The Corporations Act 2001 (Cth) prohibits any person (including a corporation) from acquiring a relevant interest in our voting shares if, after the acquisition, that person or any other person would be entitled to exercise more than 20% of the voting power in our shares. The prohibition is subject to certain limited exceptions. In addition, under the Corporations Act, a person is required to give a notice to us and to the ASX providing certain prescribed information, including their name, address and details of their relevant interests in our voting shares if they begin to have, or cease to have, a substantial holding in us, or if they already have a substantial holding and there is a movement of at least 1% in their holding. Such notice must, generally, be provided within two business days after the person becomes aware of that information.
A person will have a substantial holding if the total votes attached to our voting shares in which they or their associates have relevant interests is 5% or more of the total number of votes attached to all our voting shares. The concepts of ‘associate’ and ‘relevant interest’ are broadly defined in the Corporations Act and investors are advised to seek their own advice on their scope. In general terms, a person will have a relevant interest in a share if they:
a. are the holder of that share;
b. have power to exercise, or control the exercise of, a right to vote attached to that share; or
c. have power to dispose of, or control the exercise of a power to dispose of, that share.
It does not matter how remote the relevant interest is or how it arises. If two or more persons can jointly exercise any one of these powers, each of them is taken to have that power. Nor does it matter that the power or control is express or implied, formal or informal, exercisable either alone or jointly with someone else.
The American Depositary Receipts agreement
The Deposit Agreement among JPMorgan Chase Bank of New York as Depositary, and us, and the record holders from time to time of all ADRs, applies all of the provisions of our Constitution to ADR holders. Record holders of ADRs are required by the Deposit Agreement to comply with our requests for information as to the capacity in which such holders own ADRs and related ordinary shares as well as to the identity of any other person interested in such ADRs and related ordinary shares and the nature of such interest.
Enforceability of foreign judgments in Australia
We are an Australian public corporation with limited liability. All of our Directors and Executive Officers reside outside the US. Substantially all or a substantial portion of the assets of all or many of such persons are located outside the US. As a result, it may not be possible for investors to effect service of process within the US upon such persons or to enforce against them judgments obtained in US courts predicated upon the civil liability provisions of the federal securities laws of the US. There may be doubt as to the enforceability in Australia, in original actions or in actions for enforcement of judgments of US courts, of civil liabilities predicated upon the federal securities laws of the US.
Taxation
Australian taxation
The following discussion is a summary of certain Australian taxation implications of the ownership and disposition of ordinary shares (including ADS) for shareholders holding their shares on capital account. This discussion is based on the laws in force at the date of the Annual Report and the Convention between the Government of Australia and the Government of the United States of America for the Avoidance of Double Taxation and The Prevention of Fiscal Evasion with respect to Taxes on Income (the Tax Treaty), and is subject to any changes in Australian law and any change in the Tax Treaty occurring after that date.
This discussion is intended only as a descriptive summary and does not purport to be a complete analysis of all the potential Australian tax implications of owning and disposing of ordinary shares. The specific tax position of each investor will determine the applicable Australian income tax implications for that investor and we recommend that investors consult their own tax advisers concerning the implications of owning and disposing of ordinary shares.
Taxation of dividends
Under the Australian dividend imputation system, Australian tax paid at the company level is imputed (or allocated) to shareholders by means of imputation credits which attach to dividends paid by the company to the shareholder. Such dividends are termed ‘franked dividends’.
When an Australian resident individual shareholder receives a franked dividend, the shareholder receives a tax offset to the extent of the franking credits, which can be offset against the Australian income tax payable by the shareholder. An Australian resident shareholder may, in certain circumstances, be entitled to a refund of excess franking.
The extent to which a dividend is franked typically depends upon a company’s available franking credits at the time of payment of the dividend. Accordingly, a dividend paid to a shareholder may be wholly or partly franked or wholly unfranked.
Fully franked dividends paid to non-resident shareholders are exempt from Australian dividend withholding tax. Dividends paid to a non-resident shareholder which are not fully franked are subject to dividend withholding tax at the rate of 30% (unless reduced by a double tax treaty) to the extent they are unfranked. In the case of residents of the US, the rate is reduced to 15% under the Tax Treaty, provided the shares are not effectively connected with a permanent establishment or a fixed base of a non-resident in Australia through which the non-resident carries on business in Australia or provides independent personal services. In the case of residents of the US that have a permanent establishment or fixed base in Australia where the shares in respect of which the dividends are paid are attributable to that permanent establishment or fixed base, there is no dividend withholding tax. Rather, such dividends will be taxed on a net assessment basis and, where the dividends are franked, entitlement to a tax offset may arise.
| | |
306 | 2012 WESTPAC GROUP ANNUAL REPORT | |
Fully franked dividends paid to non-resident shareholders and dividends that have been subject to dividend withholding tax should not be subject to any further Australian income tax.
There are circumstances where a shareholder may not be entitled to the benefit of franking credits. The application of these rules depend upon the shareholder’s own circumstances, including the period during which the shares are held and the extent to which the shareholder is ‘at risk’ in relation to their shareholding.
Gain or loss on disposition of shares
Generally, any profit made by a resident shareholder on disposal of shares will be subject to capital gains tax. However, if the shareholder is regarded as a trader or speculator, or carries on a business of investing for profit, any profits may be taxed as ordinary income.
A discount may be available on capital gains on shares held for 12 months or more by individuals, trusts or complying superannuation entities. The discount is one half for individuals and trusts, and one third for complying superannuation entities. Companies are not eligible for the capital gains tax discount. For shares acquired prior to 1 October 1999, an alternative basis of calculation of the capital gain may be available which allows the use of an indexation formula.
Normal rates of income tax would apply to capital gains so calculated. Any capital loss can only be offset against capital gains. Excess capital losses can be carried forward for offset against future capital gains.
Generally, subject to two exceptions, a non-resident disposing of shares in an Australian public company will be free from income tax in Australia. The main exceptions are:
§ shares held as part of a trade or business conducted through a permanent establishment in Australia. In such a case, any profit on disposal would be assessable to ordinary income tax. Losses would constitute an allowable deduction; and
§ shares held in public companies where the shareholder and its associates have held (for at least 12 months in the 24 months prior to disposal) a holding of 10% or more in the company and more than 50% of the company’s assets are represented by interests in Australian real property (which is unlikely to be the case for Westpac). In such a case, capital gains tax would apply.
United States taxation
The following discussion is a summary of certain US federal income tax implications of the ownership and disposition of ordinary shares (including ADS) by US holders (as defined below) that hold the ordinary shares as capital assets. This discussion is based on the US Internal Revenue Code of 1986, as amended (the Code), its legislative history, existing and proposed regulations, published rulings and court decisions, and the Tax Treaty, all as currently in effect and all of which are subject to change, possibly on a retroactive basis.
This discussion is intended only as a descriptive summary. It does not purport to be a complete analysis of all the potential US federal income tax consequences of owning and disposing of ordinary shares and does not address US federal income tax considerations that may be relevant to US holders subject to special treatment under US federal income tax law (such as banks, insurance companies, real estate investment trusts, regulated investment companies, dealers in securities, tax-exempt entities, retirement plans, certain former citizens or residents of the US, persons holding ordinary shares as part of a straddle, hedge, conversion transaction or other integrated investment, persons that have a ‘functional currency’ other than the US dollar, persons that own 10% or more (by voting power) of our stock, persons that generally mark their securities to market for US federal income tax purposes or persons that receive ordinary shares as compensation). As this is a complex area, we recommend investors consult their own tax advisers concerning the US federal, state and/or local implications of owning and disposing of ordinary shares.
For purposes of this discussion you are a US holder if you are a beneficial owner of ordinary shares and you are for US federal income tax purposes:
§ an individual that is a citizen or resident of the US;
§ a corporation created or organised in or under the laws of the US or any state thereof or the District of Columbia;
§ an estate, the income of which is subject to US federal income taxation regardless of its source; or
§ a trust, if a US court can exercise primary supervision over the trust’s administration and one or more US persons are authorised to control all substantial decisions of the trust, or certain electing trusts that were in existence on 19 August 1996 and were treated as domestic trusts on that date.
.
If an entity treated as a partnership for US federal income tax purposes owns the ordinary shares, the US federal income tax implications of the ownership and disposition of ordinary shares will generally depend upon the status and activities of such partnership and its partners. Such an entity should consult its own tax adviser concerning the US federal income tax implications to it and its partners of owning and disposing of ordinary shares.
| | |
| 2012 WESTPAC GROUP ANNUAL REPORT | 307 |
Taxation of dividends
If you are a US holder, you must include in your gross income as a dividend, the gross amount of any distributions paid by us out of our current or accumulated earnings and profits (as determined for US federal income tax purposes) without reduction for any Australian tax withheld from such distribution. If you are a non-corporate US holder, dividends paid to you in taxable years beginning on or before 31 December 2012 that constitute qualified dividend income generally will be taxable to you at a maximum tax rate of 15% so long as certain holding period and other requirements are met. Dividends we pay with respect to the ordinary shares generally will be qualified dividend income. Each non-corporate US holder should consult their own tax advisor regarding the possible applicability of the reduced tax rate and the related restrictions and special rules.
Dividends paid by us constitute ordinary income that must generally be included in income when actually or constructively received. Such dividends will not be eligible for the dividends-received deduction generally allowed to corporate shareholders with respect to dividends received from US corporations. The amount of the dividend that you must include in your income as a US holder will be the US dollar value of the Australian dollar payments made, determined at the spot Australian dollar/US dollar rate on the date the dividend distribution is included in your income, regardless of whether the payment is in fact converted into US dollars. Generally, any gain or loss resulting from currency exchange fluctuations during the period from the date you include the dividend payment in income to the date you convert the payment into US dollars will be treated as ordinary income or loss and will not be eligible for the special tax rate applicable to qualified dividend income. This gain or loss generally will be income from sources within the US for foreign tax credit limitation purposes. Distributions on an ordinary share in excess of current and accumulated earnings and profits, as determined for US federal income tax purposes, will be treated as a non-taxable return of capital to the extent of your basis in such ordinary share and thereafter as capital gain.
Subject to certain limitations, the Australian tax withheld in accordance with the Tax Treaty and paid over to Australia will be creditable against your US federal income tax liability. Special rules apply in determining the foreign tax credit limitation with respect to dividends that are subject to the maximum 15% tax rate. A US holder that does not elect to claim a US foreign tax credit for Australian income tax withheld may instead claim a deduction for such withheld tax, but only for a taxable year in which the US holder elects to do so with respect to all non-US income taxes paid or accrued in such taxable year.
Dividends we pay generally will be income from sources outside the US for foreign tax credit limitation purposes. Under the foreign tax credit rules, dividends will, depending on your circumstances, be ‘passive category’ or ‘general category’ income for purposes of computing the foreign tax credit.
The rules relating to US foreign tax credits are very complex, and each US holder should consult their own tax adviser regarding the application of such rules.
Taxation of capital gains
If you sell or otherwise dispose of your ordinary shares, you will generally recognise capital gain or loss for US federal income tax purposes equal to the difference between the US dollar value of the amount that you realise and your tax basis, determined in US dollars, in your ordinary shares. Capital gain of a non-corporate US holder is generally taxed at a reduced rate if the holder has a holding period greater than one year. The deductibility of capital losses is subject to limitations. Such capital gain or loss generally will be income from sources within the US, for foreign tax credit limitation purposes.
Passive foreign investment company considerations
We believe that we will not be treated as a passive foreign investment company (PFIC) for US federal income tax purposes, and this discussion assumes we are not a PFIC. However, the determination as to whether we are a PFIC is made annually at the end of each taxable year and therefore could change. If we were to be treated as a PFIC, a US holder of ordinary shares could be subject to certain adverse tax consequences.
Disclosure requirements for specified foreign financial assets
Individual US holders (and certain US entities specified in US Internal Revenue Service (IRS) guidance) who, during any taxable year, hold any interest in any specified foreign financial asset, generally will be required to file with their US federal income tax returns certain information on IRS Form 8938 if the aggregate value of all such assets exceeds certain specified amounts. ‘Specified foreign financial asset’ generally includes any financial account maintained with a non-US financial institution and may also include the ordinary shares if they are not held in an account maintained with a financial institution. Substantial penalties may be imposed, and the period of limitations on assessment and collection of US federal income taxes may be extended, in the event of a failure to comply. US holders should consult their own tax advisers as to the possible application to them of this filing requirement.
Information reporting and backup withholding
Under certain circumstances, information reporting and/or backup withholding may apply to US holders with respect to payments on or the proceeds from the sale, exchange or other disposition of the ordinary shares, unless an applicable exemption is satisfied. US holders that are corporations generally are excluded from information reporting and backup withholding.
Backup withholding is not an additional tax. Any amounts withheld under the backup withholding rules generally will be allowed as a refund or credit against a US holder’s US federal income tax liability if the required information is furnished by the US holder on a timely basis to the IRS.
| | |
308 | 2012 WESTPAC GROUP ANNUAL REPORT | |
OUR CONSTITUTION
Overview
We were incorporated in 1850 under the Bank of New South Wales Act, a special piece of legislation passed by the New South Wales Parliament at a time when there was no general companies’ legislation in Australia. On 23 August 2002, Westpac became registered under the Corporations Act 2001 (Cth) as a public company limited by shares.
As part of the process of becoming a company regulated under the Corporations Act, shareholders adopted a new constitution at the AGM on 15 December 2000, which came into operation on 23 August 2002 and was subsequently amended by shareholders on 15 December 2005 and 13 December 2007.
Our objects and purposes
Our constitution does not contain a statement of our objects and purposes. As a company regulated by the Corporations Act, we have the legal capacity and powers of an individual both within and outside Australia, and all the powers of a body corporate, including the power to issue and cancel shares, to issue debentures, to distribute our property among our equity holders (either in kind or otherwise), to give security by charging our uncalled capital, to grant a floating charge over our property and to do any other act permitted by any law.
Directors’ voting powers
Under clause 9.11(a) of our constitution, subject to complying with the Corporations Act regarding disclosure of and voting on matters involving material personal interests, our Directors may:
a. hold any office or place of profit in our company, except that of auditor;
b. hold any office or place of profit in any other company, body corporate, trust or entity promoted by our company or in which it has an interest of any kind;
c. enter into any contract or arrangement with our company;
d. participate in any association, institution, fund, trust or scheme for past or present employees or Directors of our company or persons dependent on or connected with them;
e. act in a professional capacity (or be a member of a firm that acts in a professional capacity) for our company, except as auditor; and
f. participate in, vote on and be counted in a quorum for any meeting, resolution or decision of the Directors and be present at any meeting where any matter is being considered by the Directors.
Under clause 9.11(b) of our constitution, a Director may do any of the above despite the fiduciary relationship of the Director’s office:
a. without any liability to account to our company for any direct or indirect benefit accruing to the Director; and
b. without affecting the validity of any contract or arrangement.
Under the Corporations Act, however, a Director who has a material personal interest in any matter to be considered at any Board meeting must not be present while the matter is being considered or vote on the matter, unless the other Directors resolve to allow that Director to be present and vote or a declaration is made by ASIC permitting that Director to participate and vote. These restrictions do not apply to a limited range of matters set out in section 191 of the Corporations Act, where the Director’s interest:
a. arises because the Director is a shareholder of the company in common with other shareholders;
b. arises in relation to the Director’s remuneration as a Director of the company;
c. relates to a contract the company is proposing to enter into that is subject to shareholder approval and will not impose obligations on the company if not approved by shareholders;
d. arises merely because the Director is a guarantor or has given an indemnity or security for all or part of a loan (or proposed loan) to the company;
e. arises merely because the Director has a right of subrogation in relation to a guarantee or indemnity referred to in (d);
f. relates to a contract that insures, or would insure, the Director against liabilities the Director incurs as an officer of the company (but only if the contract does not make the company or related body corporate the insurer);
g. relates to any payment by the company or a related body corporate in respect of certain indemnities permitted by the Corporations Act or any contract relating to such an indemnity; or
h. is in a contract or proposed contract with, or for the benefit of, or on behalf of, a related body corporate and arises merely because the Director is a Director of that related body corporate.
If there are not enough Directors to form a quorum for the board meeting because of the interest of Directors in a particular matter, a general meeting for shareholders may be called to consider the matter and interested Directors are entitled to vote on any proposal to requisition such a meeting.
Under clause 9.7 of our constitution, the maximum aggregate amount of annual remuneration to be paid to our Non-executive Directors must be approved by our shareholders. This aggregate amount is paid to the Non-executive Directors in such manner as the Board from time to time determines. Directors’ remuneration is one of the exceptions under section 191 of the Corporations Act to the prohibitions against being present and voting on any matter in which a Director has a material personal interest.
| | |
| 2012 WESTPAC GROUP ANNUAL REPORT | 309 |
Directors’ borrowing powers
Clause 10.2 of our constitution empowers our Directors, as a Board, to exercise all the powers of Westpac to borrow or raise money, to charge any property or business of Westpac or all or any of its uncalled capital and to issue debentures or give any other security for a debt, liability or obligation of Westpac or of any other person. Such powers may only be changed by amending the constitution, which requires a special resolution (that is, a resolution passed by at least 75% of the votes cast by members entitled to vote on the resolution and notice of which has been given in accordance with the Corporations Act).
Minimum number of Directors
Our constitution requires that the minimum number of Directors is determined in accordance with the Corporations Act or other regulations. Currently the Corporations Act prescribes three as a minimum number of Directors and APRA governance standards specify five as the minimum number of Directors for APRA regulated entities. Westpac’s current number of Directors is above these prescribed minimums.
Share rights
The rights attaching to our ordinary shares are set out in the Corporations Act and in our constitution, and may be summarised as follows:
a) Profits and dividends
Holders of ordinary shares are entitled to receive such dividends on those shares as may be declared by our Directors from time to time. Dividends that are paid but not claimed, may be invested by our Directors for the benefit of Westpac until required to be dealt with in accordance with any law relating to unclaimed monies.
Our constitution requires that dividends be paid out of our profits. In addition, under the Corporations Act, Westpac must not pay a dividend unless our assets exceed our liabilities immediately before the dividend is declared and the excess is sufficient for payment of the dividend. In addition, the payment must be fair and reasonable to the company’s shareholders and must not materially prejudice our ability to pay our creditors.
Subject to the Corporations Act, the constitution, the rights of persons (if any) entitled to shares with special rights to dividend and any contrary terms of issue of or applying to any shares, our Directors may determine that a dividend is payable, fix the amount and the time for payment and authorise the payment or crediting by Westpac to, or at the direction of, each shareholder entitled to that dividend.
If any dividends are returned unclaimed, we are generally obliged, under the Unclaimed Money Act 1995 (NSW), to hold those amounts as unclaimed monies for a period of six years. If at the end of that period the monies remain unclaimed by the shareholder concerned, we must remit by 31 October in each year those monies to the Office of State Revenue. Upon such payment being made, we are discharged from further liability in respect of that amount.
Our Directors may, before paying any dividend, set aside out of our profits such sums as they think proper as reserves, to be applied, at the discretion of our Directors, for any purpose for which the profits may be properly applied. Our Directors may carry forward so much of the profits remaining as they consider ought not to be distributed as dividends without transferring those profits to a reserve.
The following restrictions apply to our ability to declare and/or pay dividends:
(i) if the payment of the dividend would breach or cause a breach by us of applicable capital adequacy or other supervisory requirements of APRA. Currently, one such requirement is that a dividend should not be paid without APRA’s prior consent if payment of that dividend, after taking into account all other dividends (if any) paid on our shares and payments on more senior capital instruments, in the financial year to which they relate, would cause the aggregate of such dividend payments to exceed our after tax earnings for the financial year, as reflected in our relevant audited consolidated financial statements; and
(ii) if, under the Banking Act 1959 (Cth), we are directed by APRA not to pay a dividend; and
(iii) if the declaration or payment of the dividend would result in us becoming insolvent.
b) Voting rights
Holders of our fully paid ordinary shares have, at general meetings (including special general meetings), one vote on a show of hands and, upon a poll, one vote for each fully paid share held by them.
c) Voting and re-election of Directors
Under our constitution, at each AGM one-third of eligible Directors (or if their number is not a multiple of three, the number nearest to one-third) and any other Director who has held office for three years or more since the Director’s last election, must retire from office. In determining the number of Directors to retire, no account is to be taken of a Director who holds office in order to fill a casual vacancy or the Managing Director. A retiring Director holds office until the conclusion of the meeting at which that Director retires but is eligible for re-election at the meeting.
Under the ASX Listing Rules, no Executive or Non-executive Director of a listed entity, apart from the Managing Director, may continue to hold office, without offering himself or herself for re-election, past the third AGM following their appointment or three years, whichever is the longer.
Under the Corporations Act, the election or re-election of each Director by shareholders at a general meeting of a public company must proceed as a separate item, unless the shareholders first resolve that the elections or re-elections may be voted on collectively. A resolution to allow collective voting in relation to elections or re-elections is effective only if no votes are cast against that resolution. Any resolution electing or re-electing two or more Directors in contravention of this requirement is void.
| | |
310 | 2012 WESTPAC GROUP ANNUAL REPORT | |
d) Winding up
Subject to any preferential entitlement of holders of preference shares on issue at the relevant time, holders of our ordinary shares are entitled to share equally in any surplus assets if we are wound up.
e) Sinking fund provisions
We do not have any class of shares on issue that is subject to any sinking fund provisions.
Variation of rights attaching to our shares
Under the Corporations Act, unless otherwise provided by the terms of issue of a class of shares, the terms of issue of a class of shares in Westpac can only be varied or cancelled in any way by a special resolution of Westpac and with either the written consent of our shareholders holding at least three quarters of the votes in that class of shares or with the sanction of a special resolution passed at a separate meeting of the holders of that class of shares.
Convening general meetings
Under our constitution, our Directors may convene and arrange to hold a general meeting of Westpac whenever they think fit and must do so if required to do so under the Corporations Act and ASX Listing Rules. Under the Corporations Act, our Directors must call and arrange to hold a general meeting of Westpac if requested to do so by our shareholders who hold at least 5% of the votes that may be cast at the general meeting or 100 shareholders entitled to vote at the meeting. Shareholders who hold at least 5% of the votes that may be cast at a general meeting may also call and arrange to hold a general meeting of Westpac at their own expense.
At least 28 days notice must be given of a meeting of our shareholders. Written notice must be given to all shareholders entitled to attend and vote at the meeting. All ordinary shareholders are entitled to attend and, subject to the constitution and the Corporations Act, to vote at general meetings of Westpac.
Limitations on securities ownership
A number of limitations apply in relation to the ownership of our shares, and these are more fully described in the section ‘Limitations affecting security holders’.
Change in control restrictions
Restrictions apply under the Corporations Act, the Financial Sector (Shareholdings) Act 1998 and the Foreign Acquisitions and Takeovers Act 1975.
For more detailed descriptions of these restrictions, refer to the sections ‘Limitations affecting security holders’, Foreign Acquisitions and Takeovers Act 1975, Financial Sector (Shareholdings) Act 1998, and Corporations Act 2001.
Substantial shareholder disclosure
There is no provision in our constitution that requires a shareholder to disclose the extent of their ownership of our shares.
Under the Corporations Act, however, any person who begins or ceases to have a substantial holding of our shares must notify us within two business days after they become aware of that information. A further notice must be given to us if there is an increase or decrease of 1% in a person’s substantial holding. Copies of these notices must also be given to the ASX. A person has a substantial holding of our shares if the total votes attached to our voting shares in which they or their associates have relevant interests is 5% or more of the total number of votes attached to all our voting shares. For more details, refer to the section ‘Corporations Act 2001’.
We also have a statutory right under the Corporations Act to trace the beneficial ownership of our shares by giving a direction to a shareholder, or certain other persons, requiring disclosure to us of, among other things, their own relevant interest in our shares and the name and address of each other person who has a relevant interest in those shares, the nature and extent of that interest and the circumstances that gave rise to that other person’s interest. Such disclosure must, except in certain limited circumstances, be provided within two business days after the direction is received.
Australian Company and Business Numbers
All Australian companies have a unique nine-digit identifier, referred to as an Australian Company Number (ACN), which must be included on public documents, eligible negotiable instruments and the company’s common seal. In addition, entities can apply for registration on the Australian Business Register and be allocated a unique eleven-digit identifier known as an Australian Business Number (ABN). For Australian companies, the last nine digits of their ABN are identical to their ACN. The ABN may be quoted on documents in lieu of the ACN.
Our ACN is 007 457 141 and our ABN is 33 007 457 141.
Documents on display
We are subject to the disclosure requirements of the US Securities Exchange Act of 1934, as amended. In accordance with these requirements, we file Annual Reports with, and furnish other information to, the United States SEC. These materials and other information furnished by us, may be inspected and copied at the SEC’s Conventional and Electronic Reading Room at 100 F Street, N.E., Room 1580, Washington, D.C. 20549 at prescribed rates. The public may obtain information on the operation of the SEC’s Conventional and Electronic Reading Room by calling the SEC in the United States at 1-800-SEC-0330. The SEC also maintains a website at www.sec.gov that contains reports, proxy statements and other information regarding registrants that file electronically with the SEC. Since April 2002, we have filed our reports on Form 20-F and have furnished other information to the SEC in electronic format which may be accessed through this website.
| | |
| 2012 WESTPAC GROUP ANNUAL REPORT | 311 |
EXCHANGE RATES
For each of the years indicated, the high, low, average and year-end noon buying rates1 for Australian dollars were:
| | Year Ended 30 September | |
| | 2013² | | 2012 | | 2011 | | 2010 | | 2009 | | 2008 | |
| | (US$per A$1.00) | |
High | | 1.0397 | | 1.0806 | | 1.1026 | | 0.9714 | | 0.8824 | | 0.9797 | |
Low | | 1.0188 | | 0.9453 | | 0.9594 | | 0.8172 | | 0.6073 | | 0.7831 | |
Average3 | | n/a | | 1.0371 | | 1.0318 | | 0.9003 | | 0.7400 | | 0.9065 | |
Close (on 30 September)4 | | n/a | | 1.0388 | | 0.9744 | | 0.964 | | 0.8824 | | 0.7904 | |
For each of the months indicated, the high and low noon buying rates for Australian dollars were:
| | October | | September | | August | | July | | June | | May | |
| | 2012² | | 2012 | | 2012 | | 2012 | | 2012 | | 2012 | |
| | (US$per A$1.00) | |
High | | 1.0397 | | 1.0561 | | 1.0591 | | 1.0522 | | 1.0236 | | 1.0345 | |
Low | | 1.0188 | | 1.0195 | | 1.0301 | | 1.0131 | | 0.9688 | | 0.9709 | |
1 The noon buying rate in New York City for cable transfers in Australian dollars as certified for customs purposes by the Federal Reserve Bank of New York.
2 Through to 26 October 2012. On 26 October 2012, the noon buying rate was A$1.00 = US$1.0358.
3 The average is calculated by using the average of the exchange rates on the last day of each month during the period.
4 The noon buying rate at such date may differ from the rate used in the preparation of our consolidated financial statements at such date. Refer to Note 1(a)(vi) to the financial statements.
| |
312 | 2012 WESTPAC GROUP ANNUAL REPORT |
SIGNATURES
The registrant hereby certifies that it meets all of the requirements for filing on Form 20-F and that it has duly caused and authorised the undersigned to sign this Annual Report on its behalf.
WESTPAC BANKING CORPORATION
By: | /s/ Rebecca Lim | |
| |
| |
Rebecca Lim | |
Authorised Representative | |
Dated November 5, 2012 | |
| |
| 2012 WESTPAC GROUP ANNUAL REPORT | 313 |
INFORMATION FOR SHAREHOLDERS
Westpac ordinary shares | |
| |
Record date for final ordinary share
dividend | 15 November 20121 |
| |
Annual General Meeting | 13 December 2012 |
| |
Final ordinary share dividend payable | 20 December 2012 |
| |
Half Year end | 31 March 2013 |
| |
Interim results and ordinary share dividend announcement | 3 May 2013 |
| |
Record date for interim ordinary share dividend | 17 May 20132,3 |
| |
Interim ordinary share dividend payable | 2 July 20133 |
| |
Year end | 30 September 2013 |
| |
Final results and ordinary share
dividend announcement | 4 November 2013 |
| |
Record date for final ordinary share dividend | 14 November 20134,5 |
| |
Annual General Meeting | 13 December 20136 |
| |
Final dividend payable | 19 December 20134 |
1 Record date for 2012 final ordinary share dividend in New York – 14 November 2012.
2 Record date for 2013 interim ordinary share dividend in New York – 16 May 2013.
3 Dates will be confirmed at the time of announcing the 2013 interim results.
4 Dates will be confirmed at the time of announcing the 2013 final results.
5 Record date for 2013 final ordinary share dividend in New York – 13 November 2013.
6 Details regarding the location of this meeting and the business to be dealt with will be contained in the separate Notice of Meeting sent to shareholders in November 2013.
Westpac Convertible Preference Shares (Westpac CPS) |
| |
Record date for March 2013
semi-annual dividend | 22 March 2013 |
| |
Payment date for March 2013 | 2 April 2013 |
semi-annual dividend | |
Record date for September 2013 | 20 September 2013 |
semi-annual dividend | |
Payment date for September 2013 | 30 September 2013 |
semi-annual dividend | |
| |
Westpac SPS and Westpac SPS II |
| |
Record date for Westpac SPS and
SPS II quarterly distribution | 21 December 2012 |
| |
Payment date for Westpac SPS and
SPS II quarterly distribution | 31 December 2012 |
| |
Record date for Westpac SPS and
SPS II quarterly distribution | 22 March 2013 |
| |
Payment date for Westpac SPS and
SPS II quarterly distribution | 2 April 2013 |
| |
Record date for Westpac SPS and
SPS II quarterly distribution | 21 June 2013 |
| |
Payment date for Westpac SPS and
SPS II quarterly distribution | 1 July 2013 |
| |
Record date for Westpac SPS and
SPS II quarterly distribution | 20 September 2013 |
| |
Payment date for Westpac SPS and
SPS II quarterly distribution | 30 September 2013 |
ANNUAL GENERAL MEETING
The Westpac Annual General Meeting (AGM) will be held in the Grand Ballroom at the Hilton Sydney, 488 George Street, Sydney, on Thursday, 13 December 2012, commencing at 10:00am.
The AGM will be webcast live on the internet at www.westpac.com.au/investorcentre and an archived version of the webcast will be placed on the website to enable the AGM proceedings to be viewed at a later time.
| |
314 | 2012 WESTPAC GROUP ANNUAL REPORT |
INFORMATION FOR SHAREHOLDERS
USEFUL INFORMATION | | |
Key sources of information for shareholders | | Westpac Investor Relations |
We report to shareholders each year, in late October or early November, in two forms: an Annual Review and Sustainability Report, and an Annual Report. We also report half-yearly to shareholders via a newsletter, in conjunction with the dividend payments in July and December. Electronic communications Shareholders can elect to receive the following communications electronically: § Annual Review and Annual Report; § Dividend statements when paid by direct credit or via Westpac’s Dividend Reinvestment Plan (DRP); § Notices of Meetings and proxy forms; and § Shareholder Newsletters and major company announcements. Shareholders who wish to register their email address should go to www.westpac.com.au/investorcentre and click on ‘Register your email’ under ‘Shareholder News’, or contact the Westpac share Registrar. For Registrar contact details see opposite. Australia Westpac’s internet site www.westpac.com.au provides information for shareholders and customers, including: § access to internet banking and online investing services; § details on Westpac’s products and services; § company history, results, economic updates, market releases and news; and § corporate responsibility and Westpac in the community activities. Investors can short cut to the Investor Centre at www.westpac.com.au/investorcentre. The Centre includes the current Westpac share price and charting, and links to the latest ASX announcements and Westpac’s share Registrars. New Zealand Westpac’s New Zealand internet site www.westpac.co.nz provides: § access to internet banking services; § details on products and services, including a comprehensive home buying guide; § economic updates, news and information, key financial results; and § sponsorships and other community activities. Westpac ordinary shares are listed on: § Australian Securities Exchange, (code WBC); § New York Stock Exchange (NYSE), as American Depositary Shares, (code WBK); and § New Zealand Exchange Limited, (code WBC). | | Information other than that relating to your shareholding can be obtained from: Westpac Investor Relations
Level 20, 275 Kent Streett
Sydney NSW 2000 Australia
Telephone: +61 2 8253 3143
Facsimile: +61 2 8253 1207
Email: investorrelations@westpac.com.au For information about your shareholding or to notify a change of address etc., you should contact the appropriate share Registrar. Please note that, in Australia, broker sponsored holders are required to contact their broker to amend their address. Australia – Ordinary shares on the main register, and Westpac SPS and Westpac SPS II Link Market Services Limited
Level 12, 680 George Street
Sydney NSW 2000
Postal address: Locked Bag A6015,
Sydney South NSW 1235
Website: www.linkmarketservices.com.au Shareholder enquiries:
Telephone: 1800 804 255 (toll free in Australia)
International: +61 2 8280 7070
Facsimile: +61 2 9287 0303
Email: westpac@linkmarketservices.com.au New Zealand – Ordinary shares on the New Zealand branch register Link Market Services Limited
Level 16, Brookfields House
19 Victoria Street West
Auckland 1142, New Zealand
Postal address: P.O. Box 91976, Auckland 1030, New Zealand
Website: www.linkmarketservices.co.nz Shareholder enquiries:
Telephone: 0800 002 727 (toll free in New Zealand)
International: +64 9 375 5998
Facsimile: +64 9 375 5990
Email: lmsenquiries@linkmarketservices.com Depositary in USA for American Depositary Shares (ADS) 1 Listed on New York Stock Exchange
(code WBK - CUSIP 961214301) JPMorgan Chase Bank, N.A.
PO Box 64504, St Paul
MN 55164-0504, USA ADS holder enquiries:
Telephone: 1 800 990 1135
(toll free: non-US callers will be charged IDD)
Telephone: +1 651 453 2128
(Hearing impaired: +1 866 700 1652)
Email: jpmorgan.adr@wellsfargo.com
Website: www.adr.com 1 Each ADS is comprised of five fully paid ordinary shares. |
| |
2012 WESTPAC GROUP ANNUAL REPORT | 315 |
| | |
GLOSSARY OF ABBREVIATIONS AND DEFINED TERMS |
|
| |
AASB
|
Australian Accounting Standards Board
|
| |
ABN | Australian Business Number |
| |
ABS | Asset-backed securities |
| |
ACCC | Australian Competition and Consumer Commission |
| |
ACN | Australian Company Number |
| |
ADI | Authorised Deposit-taking Institution |
| |
ADRs | American Depositary Receipts |
| |
ADS | American Depositary Shares |
| |
AFS | Australian Financial Services |
| |
AGAAP | Australian Generally Accepted Accounting Principles |
| |
AGM | Annual general meeting |
| |
A-IFRS | Australian Accounting Standards |
| |
AIRB | Advanced Internal Ratings Based |
| |
ALCO | Westpac Group Asset & Liability Committee |
| |
ALM | Asset and Liability Management |
| |
AMA | Advanced Measurement Approach |
| |
ANZSIC | Australian and New Zealand Standard Industrial Classification |
| |
APRA | Australian Prudential Regulation Authority |
| |
APS | Australian Prudential Standard |
| |
ASIC | Australian Securities and Investments Commission |
| |
ASX | Australian Securities Exchange |
| |
ASXCGC | ASX Limited’s Corporate Governance Council |
| |
ATMs | Automatic teller machines |
| |
ATO | Australian Taxation Office |
| |
AUSTRAC | Australian Transaction Reports and Analysis Centre |
| |
AUD | Australian dollar |
| |
BAC | Board Audit Committee |
| |
BBSW | Bank Bills Swap reset Rate |
| |
BCBS | Basel Committee on Banking Supervision |
| |
BankSA | Bank of South Australia |
| |
BRMC | Board Risk Management Committee |
| |
BTFG | BT Financial Group Australia |
| |
BTIM | BT Investment Management Limited |
| |
CAD | Canadian dollar |
| |
CAPs | Collectively assessed provisions |
| |
Capital Trust III | Westpac Capital Trust III |
| |
Capital Trust IV | Westpac Capital Trust IV |
| |
Cash EPS | Cash Earnings per share |
| |
Cash EPS CAGR | Compound Annual Growth in Cash EPS |
| |
CCCFA | Credit Contracts and Consumer Finance Act 2003 |
| |
CCE | Commodity, Carbon and Energy trading |
| |
CDO | Collateralised debt obligations |
| |
CDS | Credit default swap |
| |
CEO | Chief Executive Officer |
| |
CEOPP | Chief Executive Officer Performance Plan |
| |
CEO RSP | Chief Executive Officer Restricted Share Plan |
| |
CFO | Chief Financial Officer |
| |
CGU | Cash-generating unit |
| |
CHF | Swiss franc |
| |
CIR | Commissioner of Inland Revenue |
| |
CLO | Collateralised loan obligations |
Corporations Act
| Australian Corporations Act 2001 |
| |
COSO | Committee of Sponsoring Organizations of the Treadway Commission |
| |
CPM | Credit Portfolio Management |
| |
CPS | Convertible Preference Shares |
| |
CREDCO | Westpac Group Credit Risk Committee |
| |
CRG | Customer Risk Grade |
| |
CRO | Chief Risk Officer |
| |
CVA | Credit valuation adjustment |
| |
DFAT | Department of Foreign Affairs and Trade |
| |
Dodd-Frank Act | Dodd-Frank Wall Street Reform and Consumer Protection Act |
| |
DRP | Dividend Reinvestment Plan |
| |
D-SIBs | Domestic Systematically Important Banks |
| |
DVA | Debit valuation adjustment |
| |
EAA | NSW Energy Administration Amendment (Water & Savings) Act 2005 |
| |
EAD | Exposure at Default |
| |
EEO Act | Energy Efficiency Opportunities Act 2006 (Cth) |
| |
EFTPOS | Electronic Funds Transfer Point Of Sale |
| |
EPS | Earnings per share |
| |
ESG | Environmental, Social and Governance |
| |
ESP | Employee Share Plan |
| |
EUR | European Union euro |
| |
FATCA | Foreign Account Taxation Compliance Act |
| |
FFIs | Foreign Financial Institutions |
| |
FMCB | Financial Markets Conduct Bill |
| |
FMTR | Financial Markets and Treasury Risk |
| |
FOFA | Future of Financial Advice |
| |
FSB | Financial Stability Board |
| |
FTE | Full time equivalent employees |
| |
FUA | Funds under administration |
| |
FUM | Funds under management |
| |
Funding Trust III | Tavarua Funding Trust III |
| |
Funding Trust IV | Tavarua Funding Trust IV |
| |
FX | Foreign Exchange |
| |
GBP | British pound |
| |
GHG | Greenhouse gas |
| |
G-SIBs | Global Systemically Important Banks |
| |
G-SIFI | Global systemically important financial institution |
| |
Hastings | Hastings Funds Management Limited |
| |
Henry Review | Australia’s Future Tax System Review |
| |
HKD | Hong Kong dollar |
| |
HS&W | Health, Safety and Wellbeing |
| |
IAPs | Individually Assessed Provisions |
| |
IASB | International Accounting Standards Board |
| |
IBA | US International Banking Act of 1978 |
| |
ICAA | Institute of Chartered Accountants in Australia |
| |
ICAAP | Internal Capital Adequacy Assessment Process |
| |
IFRS | International Financial Reporting Standards |
| |
IGA | Intergovernmental Agreement |
| |
IRRBB | Interest Rate Risk in the Banking Book |
| |
IRS | Internal Revenue Service |
| |
ISDA | International Swaps and Derivatives Association |
| |
| |
| | |
316 | 2012 WESTPAC GROUP ANNUAL REPORT | |
GLOSSARY OF ABBREVIATIONS AND DEFINED TERMS |
|
JPY | Japanese Yen |
| |
KMP | Key management personnel |
| |
LCR | Liquidity Coverage Ratio |
| |
LGD | Loss Given Default |
| |
LIASB | Life Insurance Actuarial Standard Board |
| |
LIBOR | London InterBank Offer Rate |
| |
LTI | Long-term incentive |
| |
LTIFR | Lost time injury frequency rate |
| |
LVR | Loan to value ratio |
| |
MARCO | Westpac Group Market Risk Committee |
| |
MRM | Market Risk Management |
| |
Moody’s | Moody’s Investors Service |
| |
NaR | Net interest income-at-risk |
| |
NII | Net interest income |
| |
NOK | Norwegian krone |
| |
NPS | Net Promoter Score |
| |
NSFR | Net Stable Funding Ratio |
| |
NYSE | New York Stock Exchange |
| |
NZ | New Zealand |
| |
NZD | New Zealand dollar |
| |
NZ ETS | New Zealand Emissions Trading Scheme |
| |
NZSX | New Zealand Stock Exchange |
| |
NZX | New Zealand Exchange |
| |
OBR | Open Bank Resolution |
| |
OHS | Occupational Health and Safety |
| |
OPCO | Westpac Group Operational Risk and Compliance Committee |
| |
OTC | Over the Counter |
| |
PD | Probability of Default |
| |
PFIC | Passive foreign investment company |
| |
PPSA | Personal Property Securities Act |
| |
PwC | PricewaterhouseCoopers |
| |
QFEs | Qualifying financial entities |
| |
RAMS | RAMS Home Loans |
| |
RBA | Reserve Bank of Australia |
| |
RBNZ | Reserve Bank of New Zealand |
| |
RECs | Renewable energy certificates |
| |
RMBS | Residential Mortgage Backed Securities |
| |
ROC | Westpac Group Remuneration Oversight Committee |
| |
RSP | Restricted Share Plan |
| |
S&P | Standard & Poor’s |
| |
SCG | Specialised Capital Group |
| |
SEC | US Securities and Exchange Commission |
| |
SGD | Singapore dollar |
| |
SGPSF | St.George Staff sub-plan of the Plum Superannuation Fund |
| |
SIFI | Systematically important financial institution |
| |
SIPs | Strategic Investment Priorities, an investment portfolio of 15 major strategic programs aimed at delivering business and technology capabilities across the Group to improve the customer experience |
| |
SME | Small to medium enterprises |
| |
SOSPS | Senior Officers’ Share Purchase Scheme |
| |
SOX | Sarbanes Oxley Act 2002 |
| |
SPS | Stapled Preferred Securities |
SPVs | Special purpose vehicles |
| |
SRAs | Settlement Residue Auctions |
| |
SSCM | Sustainable and Supply Chain Management |
| |
St.George | St.George Bank Limited and its subsidiaries, unless context clearly means just St.George Bank Limited |
| |
STI | Short-term incentive |
| |
TCE | Total committed exposures |
| |
The Group | Westpac Banking Corporation Group |
| |
TOFA | Taxation of financial arrangements rules contained in the Tax Laws Amendment (Taxation of Financial Arrangements) Act 2009 |
| |
2003 TPS | Trust Preferred Securities 2003 |
| |
2004 TPS | Trust Preferred Securities 2004 |
| |
2006 TPS | Trust Preferred Securities 2006 |
| |
TSR | Total Shareholder Return |
| |
UKSS | UK Staff Superannuation Scheme |
| |
UN PRI | United Nations Principles for Responsible Investment |
| |
UNSC | United Nations Security Council |
| |
US | United States |
| |
USD | American dollar |
| |
US Federal Reserve | US Federal Reserve System |
| |
VaR | Value at Risk |
| |
WAL | Weighted average life |
| |
WBC | Westpac Banking Corporation |
| |
Westpac CPS | Westpac Convertible Preference Shares |
| |
WGP | Westpac Group Plan |
| |
Westpac RBB | Westpac Retail & Business Banking |
| |
WIB | Westpac Institutional Bank |
| |
WNZL | Westpac New Zealand Limited |
| |
WNZS | Westpac New Zealand Superannuation Scheme |
| |
WPP | Westpac Performance Plan |
| |
WRP | Westpac Reward Plan |
| |
WSNZL | Westpac Securities NZ Limited |
| |
WSSP | Westpac Staff Superannuation Plan |
| |
WNZSHL | Westpac NZ Securitisation Holdings Limited |
| |
WNZSL | Westpac NZ Securitisation Limited |
| |
ZAR | South African rand |
| |
| |
| |
| |
| |
| |
| |
| |
| |
| |
| |
| |
| |
| |
| |
| |
| |
| |
| |
| |
| |
| |
| |
| |
| |
| |
| |
| |
| |
| |
| |
| |
| |
| | |
| 2012 WESTPAC GROUP ANNUAL REPORT | 317 |
| | |
318 | 2012 WESTPAC GROUP ANNUAL REPORT | |
| | Item 19. Exhibits Index |
| | |
1. | | Constitution (as amended) incorporated by reference to our Form 6-K/A filed on 20 December 2007. |
| | |
4(c).1 | | Access and Indemnity Deed between Westpac Banking Corporation and Elizabeth Bryan dated 30 November 2006, incorporated by reference to our Annual Report on Form 20-F for the year ended 30 September 2007. |
| | |
4(c).2 | | Form of Access and Indemnity Deed between Westpac Banking Corporation and Director, incorporated by reference to our Annual Report on Form 20-F for the year ended 30 September 2008. |
| | |
4(c).3 | | Indemnity Deed Poll dated 10 September 2009, of Westpac Banking Corporation, incorporated by reference to our Annual Report on Form 20-F for the year ended 30 September 2009. |
| | |
4(c).4 | | Westpac General Management Share Option Plan Rules, incorporated by reference to our Annual Report on Form 20-F for the year ended 30 September 2006. |
| | |
4(c).5 | | Westpac Employee Share Plan (WESP) – Stage One Regulations and Rules for Participation amended on 11 December 2002, incorporated by reference to our Annual Report on Form 20-F for the year ended 30 September 2006. |
| | |
4(c).6 | | Senior Officers’ Share Purchase Scheme Rules, incorporated by reference to our Annual Report on Form 20-F for the year ended 30 September 2006. |
| | |
7. | | Computation of ratios of earnings to fixed charges. |
| | |
8. | | List of controlled entities – refer note 38 to the financial statements in this Annual Report. |
| | |
11. | | Code of Accounting Practice and Financial Reporting |
| | |
12. | | Certifications pursuant to Rule 13a-14(a)/15d-14(a) of the Securities Exchange Act of 1934. |
| | |
13. | | Certifications pursuant to 18 U.S.C. Section 1350. |
| | |
15. | | Auditor consent dated 5 November 2012. |
| | |
| | Copies of any instrument relating to the long-term debt of Westpac Banking Corporation that is not being attached as an exhibit to this Annual Report on Form 20-F and which does not exceed 10% of the total consolidated assets of Westpac Banking Corporation will be furnished to the SEC upon request. |