UNITED STATES
SECURITIES AND EXCHANGE COMMISSION
Washington, D.C. 20549
FORM 20-F
o | | REGISTRATION STATEMENT PURSUANT TO SECTION 12(b) OR (g) OF THE SECURITIES EXCHANGE ACT OF 1934 |
|
Or |
|
x | | ANNUAL REPORT PURSUANT TO SECTION 13 OR 15(d) OF THE SECURITIES EXCHANGE ACT OF 1934 |
|
For the fiscal year ended September 30, 2019 |
|
Or |
|
o | | TRANSITION REPORT PURSUANT TO SECTION 13 OR 15(d) OF THE SECURITIES EXCHANGE ACT OF 1934 |
|
Or |
|
o | | SHELL COMPANY REPORT PURSUANT TO SECTION 13 OR 15(d) OF THE SECURITIES EXCHANGE ACT OF 1934 |
Commission File Number: 1-10167
WESTPAC BANKING CORPORATION
Australian Business Number 33 007 457 141
(Exact name of Registrant as specified in its charter)
New South Wales, Australia
(Jurisdiction of incorporation or organization)
275 Kent Street, Sydney, NSW 2000, Australia
(Address of principal executive offices)
Westpac Banking Corporation, New York branch,
575 Fifth Avenue, 39th Floor, New York, New York 10017-2422,
Attention: Branch Manager, telephone number: (212) 551-1800
(Name, Telephone, E-mail and/or Facsimile number and Address of Company Contact Person)
Securities registered or to be registered pursuant to Section 12(b) of the Act:
Title of each class | | Name of each exchange on which registered |
Ordinary shares | | Listed on the New York Stock Exchange, not for trading, but only in connection with the registration of related American Depositary Shares, pursuant to the requirements of the New York Stock Exchange. |
American Depositary Shares, each representing the right to receive one ordinary share | | New York Stock Exchange |
Securities registered or to be registered pursuant to Section 12(g) of the Act: None
Securities for which there is a reporting obligation pursuant to Section 15(d) of the Act: 4.875% Notes due November 19, 2019, 2.150% Notes due March 6, 2020, Floating Rate Notes due March 6, 2020, 3.050% Notes due May 15, 2020, Floating Rate Notes due May 15, 2020, 2.30% Notes due May 26, 2020, 2.600% Notes due November 23, 2020, 2.650% Notes due January 25, 2021, Floating Rate Notes due January 25, 2021, 2.100% Notes due May 13, 2021, Floating Rate Notes due May 13, 2021, 2.000% Notes due August 19, 2021, Floating Rate Notes due August 19, 2021, 2.800% Notes due January 11, 2022, Floating Rate Notes due January 11, 2022, 2.500% Notes due June 28, 2022, Floating Rate Notes due June 28, 2022, 2.750% Notes due January 11, 2023, Floating Rate Notes due January 11, 2023, 3.650% Notes due May 15, 2023, Floating Rate Notes due May 15, 2023, 3.300% Notes due February 26, 2024, Floating Rate Notes due February 26, 2024, 2.850% Notes due May 13, 2026, 2.700% Notes due August 19, 2026, 3.350% Notes due March 8, 2027, 3.400% Notes due January 25, 2028, 4.322% Subordinated Notes due November 23, 2031, 4.110% Subordinated Notes due July 24, 2034, 4.421% Subordinated Notes due July 24, 2039 and 5.000% Fixed Rate Resetting Perpetual Subordinated Contingent Convertible Securities
Indicate the number of outstanding shares of each of the issuer’s classes of capital or common stock as of the close of the period covered by the annual report.
Ordinary shares | | 3,489,928,773 fully paid |
Indicate by check mark if the registrant is a well-known seasoned issuer, as defined in Rule 405 of the Securities Act.
Yes x No o
If this report is an annual or transition report, indicate by check mark if the registrant is not required to file reports pursuant to Section 13 or 15(d) of the Securities Exchange Act of 1934.
Yes o No x
Indicate by check mark whether the registrant (1) has filed all reports required to be filed by Section 13 or 15(d) of the Securities Exchange Act of 1934 during the preceding 12 months (or for such shorter period that the registrant was required to file such reports), and (2) has been subject to such filing requirements for the past 90 days.
Yes x No o
Indicate by check mark whether the registrant has submitted electronically every Interactive Data File required to be submitted pursuant to Rule 405 of Regulation S-T during the preceding 12 months (or for such shorter period that the registrant was required to submit such files).
Yes x No o (not currently applicable to registrant)
Indicate by check mark whether the registrant is a large accelerated filer, an accelerated filer, a non-accelerated filer, or an emerging growth company. See the definitions of “large accelerated filer,” “accelerated filer,” and “emerging growth company” in Rule 12b-2 of the Exchange Act.
Large accelerated filer x | Accelerated filer o | Non-accelerated filer o | Emerging growth company o |
If an emerging growth company that prepares its financial statements in accordance with U.S. GAAP, indicate by check mark if the registrant has elected not to use the extended transition period for complying with any new or revised financial accounting standards† provided pursuant to Section 13(a) of the Exchange Act. o
† The term “new or revised financial accounting standard” refers to any update issued by the Financial Accounting Standards Board to its Accounting Standards Codification after April 5, 2012.
Indicate by check mark which basis of accounting the registrant has used to prepare the financial statements included in this filing:
U.S. GAAP o International Financial Reporting Standards as issued by the International Accounting Standards Board x
Other o
If this is an annual report, indicate by check mark whether the registrant is a shell company.
Yes o No x
| 2019 Westpac Group Annual Report | 1 |
| | |
Table of contents
Form 20-F cross-reference index | 2 |
| |
Guide 3 cross-reference index | 4 |
| |
Section 1 | 5 |
| |
Information on Westpac | 6 |
| |
Significant developments | 7 |
| |
Corporate governance | 17 |
| |
Directors’ report | 39 |
| |
Remuneration Report | 57 |
| |
Section 2 | 87 |
| |
Five year summary | 88 |
| |
Reading this report | 89 |
| |
Review of Group operations | 91 |
| |
Income statement review | 93 |
| |
Balance sheet review | 101 |
| |
Capital resources | 104 |
| |
Commitments | 107 |
| |
Divisional performance | 108 |
| |
Consumer | 111 |
| |
Business | 112 |
| |
Westpac Institutional Bank | 113 |
| |
Westpac New Zealand | 114 |
| |
Group Businesses | 116 |
| |
Risk and risk management | 120 |
| |
Risk factors | 120 |
| |
Risk management | 131 |
Credit risk | 132 |
| |
Funding and liquidity risk | 133 |
| |
Market risk | 134 |
| |
Operational risk | 134 |
| |
Conduct and compliance risk | 134 |
| |
Governance risk | 135 |
| |
Risk culture | 135 |
| |
Strategic risk | 135 |
| |
Capital adequacy | 136 |
| |
Cyber risk | 136 |
| |
Reputation risk | 136 |
| |
Sustainability risk | 136 |
| |
Westpac’s approach to sustainability | 140 |
| |
Sustainability performance | 140 |
| |
Five year non-financial summary | 149 |
| |
Other Westpac business information | 151 |
| |
Section 3 | 153 |
| |
Financial statements | 154 |
| |
Notes to the financial statements | 160 |
| |
Statutory statements | 297 |
| |
Section 4 | 305 |
| |
Shareholding information | 306 |
| |
Additional information | 319 |
| |
Information for shareholders | 323 |
| |
Glossary of abbreviations and defined terms | 326 |
In this Annual Report a reference to ‘Westpac’, ‘Group’, ‘Westpac Group’, ‘we’, ‘us’ and ‘our’ is to Westpac Banking Corporation ABN 33 007 457 141 and its subsidiaries unless it clearly means just Westpac Banking Corporation.
For certain information about the basis of preparing the financial information in this Annual Report see ‘Reading this report’ in Section 2. In addition, this Annual Report contains statements that constitute ‘forward-looking statements’ within the meaning of Section 21E of the US Securities Exchange Act of 1934. For an explanation of forward-looking statements and the risks, uncertainties and assumptions to which they are subject, see ‘Reading this report’ in Section 2.
Information contained in or accessible through the websites mentioned in this Annual Report does not form part of this report unless we specifically state that it is incorporated by reference and forms part of this report. All references in this report to websites are inactive textual references and are for information only.
2 | 2019 Westpac Group Annual Report | |
| | |
Form 20-F cross-reference index
20-F item number and description | Page |
Part I | | |
Item 1. | Identity of directors, senior management and advisers | Not applicable |
Item 2. | Offer statistics and expected timetable | Not applicable |
Item 3. | Key information | |
| Selected financial data | 88, 93, 101-102, 322 |
| Capitalisation and indebtedness | Not applicable |
| Reasons for the offer and use of proceeds | Not applicable |
| Risk factors | 120-131 |
Item 4. | Information on Westpac | |
| History and development of Westpac | 6-16, 50-51 |
| Business overview | 6-16 |
| Organisational structure | 6-7, 281-282 |
| Property, plants and equipment | 151 |
Item 4A. | Unresolved staff comments | Not applicable |
Item 5. | Operating and financial review and prospects | |
| Operating results | 91-106, 108-119 |
| Liquidity and capital resources | 104-107, 133-139 |
| Research and development, patents and licences, etc. | Not applicable |
| Trend information | 93-105, 108-119 |
| Off-balance sheet arrangements | 138 |
| Tabular disclosure of contractual obligations | 107 |
| Safe harbor | 89 |
Item 6. | Directors, senior management and employees | |
| Directors and senior management | 39-47, 53 |
| Compensation | 57-84, 290-292 |
| Board practices | 19-47 |
| Employees | 151 |
| Share ownership | 53-54, 290-293, 306 |
Item 7. | Major shareholders and related party transactions | |
| Major shareholders | 306-313 |
| Related party transactions | 152, 291-292 |
| Interests of experts and counsel | Not applicable |
Item 8. | Financial information | |
| Consolidated statements and other financial information | 153-303 |
| Significant changes | 7-14, 295 |
Item 9. | The offer and listing | |
| Offer and listing details | 313 |
| Plan of distribution | Not applicable |
| Markets | 17, 323-324 |
| Selling shareholders | Not applicable |
| Dilution | Not applicable |
| Expenses of the issue | Not applicable |
| 2019 Westpac Group Annual Report | 3 |
| | |
Form 20-F cross-reference index
20-F item number and description | Page |
Part I (continued) | | |
Item 10. | Additional information | |
| Share capital | Not applicable |
| Memorandum and articles of association | 319-321 |
| Material contracts | 152 |
| Exchange controls | 315-316 |
| Taxation | 316-318 |
| Dividends and paying agents | Not applicable |
| Statements by experts | Not applicable |
| Documents on display | 321 |
| Subsidiary information | Not applicable |
Item 11. | Quantitative and qualitative disclosures about market risk | 133-134, 251-252 |
Item 12. | Description of securities other than equity securities | |
| Debt securities | Not applicable |
| Warrants and rights | Not applicable |
| Other securities | Not applicable |
| American depositary shares | 314 |
Part II | | |
Item 13. | Defaults, dividend arrearages and delinquencies | Not applicable |
Item 14. | Material modifications to the rights of security holders and use of proceeds | Not applicable |
Item 15. | Controls and procedures | 139, 298, 299 |
Item 16A. | Audit committee financial expert | 29 |
Item 16B. | Code of ethics | 24-28 |
Item 16C. | Principal accountant fees and services | 30, 290 |
Item 16D. | Exemptions from the Listing Standards for audit committees | Not applicable |
Item 16E. | Purchases of equity securities by Westpac and affiliated purchasers | 107, 276-278 |
Item 16F. | Changes in Westpac’s certifying accountant | Not applicable |
Item 16G. | Corporate governance | 17 |
Item 16H. | Mine safety disclosure | Not applicable |
| | |
Part III | | |
Items 17. & 18. | Financial statements | 153-303 |
Item 19. | Exhibits | |
Consolidated income statements for the years ended 30 September 2019, 2018 and 2017 | 154 |
Consolidated balance sheets as at 30 September 2019 and 2018 | 156 |
Consolidated statements of comprehensive income for the years ended 30 September 2019, 2018 and 2017 | 155 |
Consolidated statements of cash flows for the years ended 30 September 2019, 2018 and 2017 | 159 |
Notes to the financial statements | 160-296 |
Management’s report on the internal control over financial reporting | 298 |
Report of independent registered public accounting firm | 299-303 |
4 | 2019 Westpac Group Annual Report | |
| | |
Guide 3 cross-reference index
| Page |
Part I Distribution of assets, liabilities and stockholders’ equity;
interest rates and interest differential | |
Average balance sheets | 101, 187-189 |
Analysis of net interest earnings | 94-95, 187-189 |
Volume and rate movement | 94, 187-189 |
Part II Investment portfolio | |
Book value of investments | 192 |
Maturity profile | 193, 249-251 |
Book value and market value > 10% of shareholders | 192 |
Part III Loan portfolio | |
Types of loans | 195-197 |
Maturities and sensitivities of loans to changes in interest rates | 198 |
Risk elements | |
Non-accrual, past due and restructured loans | 103-104, 240-244 |
Potential problem loans | 103-104 |
Foreign outstandings | 133 |
Loan concentrations | 133 |
Other interest bearing assets | 190-194 |
Part IV Summary of loan loss experience | |
Analysis of the allowance for loan losses | 199-210 |
Allocation of the allowance for loan losses | 199-210 |
Part V Deposits | 213-214 |
Part VI Return on equity and assets | 88, 102 |
Part VII Short-term borrowings | 216-217 |
| 2019 Westpac Group Annual Report | 5 |
| | |

Information on Westpac
Corporate Governance
Directors’ report
(including Remuneration Report)
6 | 2019 Westpac Group Annual Report | |
| | |
Information on Westpac
Westpac is one of the four major banking organisations in Australia and one of the largest banking organisations in New Zealand. We provide a broad range of banking and financial services in these markets, including consumer1, business and institutional banking and wealth management services.
We have branches, affiliates and controlled entities2 throughout Australia, New Zealand, Asia and in the Pacific region, and maintain branches and offices in some of the key financial centres around the world.
We were founded in 1817 and were the first bank established in Australia. In 1850, we were incorporated as the Bank of New South Wales by an Act of the New South Wales Parliament. In 1982, we changed our name to Westpac Banking Corporation following our merger with the Commercial Bank of Australia. On 23 August 2002, we were registered as a public company limited by shares under the Australian Corporations Act 2001 (Cth) (Corporations Act).
At 30 September 2019, our market capitalisation was $103 billion3 and we had total assets of $907 billion.
Organisational structure
Our business is focused in Australia and New Zealand, operating under multiple brands. The Group operates through an extensive branch and ATM network, significant online capability, and call centres supported by specialist relationship and product managers. Our operations comprise the following key divisions:
Consumer is responsible for sales and service to consumer customers in Australia. Consumer is also responsible for the Group’s insurance business which covers the manufacture and distribution of life, general and lenders mortgage insurances. The division also uses a third party to manufacture certain general insurance products. Banking products are provided under the Westpac, St.George, BankSA, Bank of Melbourne, and RAMS brands, while insurance products are provided under Westpac and BT brands. Consumer works with Business and WIB in the sales, service, and referral of certain financial services and products including superannuation, platforms, auto lending and foreign exchange. The revenue from these products is mostly retained by the product originators.
Business provides business banking and wealth facilities and products for customers across Australia. Business is responsible for manufacturing and distributing facilities to SME and Commercial business customers (including Agribusiness) generally for up to $150 million in exposure. SME customers include relationship managed and non-relationship managed SME customers (generally between $100k-$250k facilities). The division offers a wide range of banking products and services to support their borrowing, payments and transaction needs. In addition, specialist services are provided for cash flow finance, trade finance, automotive and equipment finance and property finance. The division is also responsible for Private Wealth and the manufacture and distribution of investments (including margin lending and equities broking), superannuation and
1. A consumer is defined as a person who uses our products and services. It does not include business entities.
2. Refer to Note 31 to the financial statements for a list of our material controlled entities as at 30 September 2019.
3. Based on the closing share price of our ordinary shares on the ASX as at 30 September 2019.
retirement products as well as wealth administration platforms. Business operates under the Westpac, St.George, BankSA, Bank of Melbourne, and BT brands. Business works with Consumer and WIB in the sale, referral and service of select financial services and risk management products (including corporate superannuation, foreign exchange and interest rate hedging). The revenue from these products is mostly retained by the product originators.
Westpac Institutional Bank (WIB) delivers a broad range of financial products and services to commercial, corporate, institutional and government customers operating in, or with connections to Australia and New Zealand. WIB operates through dedicated industry relationship and specialist product teams, with expert knowledge in transactional banking, and financial and debt capital markets. Customers are supported throughout Australia and via branches and subsidiaries located in New Zealand, the US, UK and Asia. WIB is also responsible for Westpac Pacific providing a full range of banking services in Fiji and PNG. WIB works with all the Group’s divisions in the provision of markets related financial needs including foreign exchange and fixed interest solutions.
Westpac New Zealand is responsible for sales and service of banking, wealth and insurance products for consumer, business and institutional customers in New Zealand. Westpac conducts its New Zealand banking business through two banks: Westpac New Zealand Limited, which is incorporated in New Zealand and Westpac Banking Corporation (New Zealand Branch), which is incorporated in Australia. Westpac New Zealand operates via an extensive network of branches and ATMs across both the North and South Islands. Business and institutional customers are also served through relationship and specialist product teams. Banking products are provided under the Westpac brand while insurance and wealth products are provided under Westpac Life and BT brands, respectively. New Zealand also maintains its own infrastructure, including technology, operations and treasury.
Group Businesses include:
· Treasury, which is responsible for the management of the Group’s balance sheet including wholesale funding, capital and the management of liquidity. Treasury also manages the interest rate risk and foreign exchange risks inherent in the balance sheet, including managing the mismatch between Group assets and liabilities. Treasury’s earnings are primarily sourced from managing the Group’s balance sheet and interest rate risk, (excluding Westpac New Zealand) within set risk limits;
· Group Technology, which is responsible for technology strategy and architecture, infrastructure and operations, applications development and business integration in Australia;
· Core Support, which comprises functions performed centrally, including Australian banking operations, property services, strategy, finance, risk, compliance, legal, human resources, and customer and corporate relations; and
· Following the Group’s decision to restructure its wealth operations and exit its Advice business in March 2019, the residual Advice operations (including associated remediation) and certain support functions of BTFG Australia have been transferred to Group Businesses.
| 2019 Westpac Group Annual Report | 7 |
| | |
Information on Westpac
Group Technology costs are fully allocated to other divisions in the Group. Core Support costs are partially allocated to other divisions, while Group Head Office costs are retained in Group Businesses. Group Businesses also includes earnings on capital not allocated to divisions, certain intra-group transactions that facilitate the presentation of the performance of the Group’s divisions, gains/losses from most asset sales, earnings and costs associated with the Group’s Fintech investments, and certain other head office items such as centrally raised provisions.
Significant developments
Westpac significant developments
Customer remediation
Through the Group’s ‘get it right, put it right’ initiative we have continued to review products, processes and policies to identify where we may not have got it right for our customers. Where problems have been identified, the Group has committed to fix them and refund customers. These initiatives identified a number of issues that require ongoing remediation.
The Group has undertaken steps designed to accelerate the processing of customer refunds and centralise oversight of certain remediation under the Chief Operating Officer.
Further information in relation to compliance, reputation and remediation provisions is included in Note 27 to the financial statements.
Changes to wealth strategy
During the course of the year, Westpac reset its wealth strategy and made a number of changes to its wealth business. This resulted in the realignment of our major BT Financial Group businesses into the Consumer and Business divisions from 1 April 2019.
During the financial year ended 30 September 2019, Westpac also completed the exit of its personal financial advice business, which included completing a sale with Viridian Advisory on 1 July 2019 and moving to a referral model for financial advisers utilising a panel of adviser firms.
First strike against remuneration report
On 12 December 2018 at Westpac’s Annual General Meeting of shareholders, Westpac incurred a first strike against its remuneration report. A strike occurs where a company’s remuneration report receives a ‘no’ vote of 25% or more. If Westpac receives a second strike at its 2019 Annual General Meeting, a spill resolution will be put to shareholders. If 50% or more of votes cast are in favour of that spill resolution, a spill meeting is required to be held within 90 days. At that spill meeting, certain directors will be required to stand for re-election.
In response to the first strike and other feedback received Westpac has made changes to both the structure of remuneration and outcomes. Further detail is included in the Remuneration Report included in the Directors’ Report.
Financial crime
In an environment of ongoing legislative reform, regulatory change and increased industry focus, Westpac continues to progress a program of work to improve its management of financial crime risks (including Anti-Money Laundering and Counter-Terrorism Financing (AML/CTF), sanctions, Anti-Bribery and Corruption, FATCA and Common Reporting Standards). This work includes a review of our AML/CTF policies, the completeness of data feeding into our AML/CTF systems and our AML/CTF processes and controls. Westpac has been regularly updating AUSTRAC on progress and continues to implement a number of improvements to its AML/CTF Program, governance, policies, systems and controls together with related remediation work in respect of certain controls and reporting practices. These efforts relate to matters such as customer on-boarding, customer and payment screening; ongoing customer due diligence, transaction monitoring and regulatory reporting (including in relation to International Funds Transfer Instructions (IFTIs), Suspicious Matter Reports and Threshold Transaction Reports).
As reported in the Group’s 2018 Annual Report, the Group self-reported to AUSTRAC a failure to report a large number of IFTIs (as required under Australia’s AML/CTF Act). Under the Act, the ‘sender’ financial institution of an IFTI transmitted out of Australia, or the ‘recipient’ financial institution of an IFTI transmitted into Australia, is required to report the IFTI to AUSTRAC within 10 business days of the instruction being sent or received. The majority of the IFTIs which are the subject of the Group’s engagement with AUSTRAC, concern batch instructions received by Westpac through one WIB product between 2009 and 2018 from a small number of correspondent banks for payments made predominantly to beneficiaries living in Australia in Australian dollars, on behalf of clients of those correspondent banks. The majority of the payments were low value, recurring and made by foreign government pension funds and corporates.
AUSTRAC has issued a number of detailed statutory notices over the last year requiring information relating to the Group’s processes, procedures and oversight. These notices relate to a range of matters including these IFTI reporting failures and associated potential failings related to record keeping and obligations to obtain and pass on certain data in funds transfer instructions, as well as correspondent banking due diligence, risk assessments and transaction monitoring. Westpac has not yet received an indication from AUSTRAC about the nature of any enforcement action it may take. The Group is continuing to work with AUSTRAC in relation to these matters.
Any enforcement action against Westpac may include civil penalty proceedings and result in the payment of a significant financial penalty, which Westpac is currently unable to reliably estimate. Previous enforcement action by AUSTRAC against other institutions has resulted in a range of outcomes, depending on the nature and severity of the relevant conduct and its consequences.
Further information about these matters is set out in Note 27 to the financial statements. Details about the consequences of failing to comply with financial crime obligations is set out in ‘Risk Factors’ in section 2.
8 | 2019 Westpac Group Annual Report | |
| | |
Information on Westpac
Regulatory and Government focus
Royal Commission into the banking, superannuation and financial services industries
On 14 December 2017, the Australian Government established a Royal Commission into potential misconduct in Australia’s banks and other financial services entities. The Royal Commission’s Final Report was released on 4 February 2019 and contained 76 express recommendations. In light of Westpac’s wealth strategy reset and the Government’s signalled approach to implementation, 49 of those recommendations presently apply to Westpac. Of these 49 recommendations, 11 recommendations have now been implemented, with Westpac either establishing new practices and procedures to meet the recommendations or having existing practices consistent with the recommendation, and a further 11 recommendations are in the process of being implemented. Some of these recommendations will require legislative or regulatory action before implementation can be completed.
The remaining 27 recommendations require legislative or regulatory action before implementation work can commence. Westpac is undertaking preparatory work where possible, including through participation in Government consultation.
The recommendations are broadly aimed at protecting consumers against misconduct, providing adequate redress and addressing asymmetries of power and information between financial services entities and their customers. Implementation of the recommendations is likely to continue to have a significant impact on banking and financial services entities and their regulators. Some of the most significant recommendations include those concerning the regulation of mortgage brokers, the prohibition of unsolicited sales of insurance and superannuation products and removal of grandfathered commissions.
The Government has stated that it will take action on all of the recommendations contained within the Final Report. On 19 August 2019, the Government released its Royal Commission implementation roadmap which sets out a timeline for consultation and the introduction of legislation which will implement the recommendations. The implementation roadmap foreshadows that a large number of legislative changes will be enacted into law or introduced before Parliament by mid-2020.
Other impacts arising from the Royal Commission include a number of claims being brought against financial institutions in relation to certain matters considered during the Royal Commission, and the referral of several cases of misconduct to the financial regulators by Commissioner Hayne.
APRA self-assessment
On 29 November 2018, Westpac submitted to APRA its self-assessment on its frameworks and practices in relation to governance, culture and accountability. A copy of Westpac’s self-assessment is available on our website.
On 22 May 2019, APRA released a report analysing self-assessments carried out by 36 banks, insurers and superannuation licensees. APRA noted a wide variation in the quality of the self-assessments, however consistent findings in the self-assessments included:
· non-financial risk management requires improvement;
· accountabilities are not always clear, cascaded and effectively enforced;
· acknowledged weaknesses are well-known and some have been long-standing; and
· risk culture is not well understood, and therefore may not be reinforcing the desired behaviours.
Westpac has a program of work underway to address the recommendations identified in the self-assessment report which has oversight of the Westpac Board. Westpac has implemented 40% of the recommendations identified in the self-assessment and expects to complete its program of work by March 2021.
Regulatory reviews and inquiries
Provision of credit - reviews by and engagement with regulators
The provision and availability of credit for residential mortgage holders, property investors and businesses has continued to be a key area of Government, regulator and industry focus throughout the financial year ended 30 September 2019. Regulatory focus on credit from APRA has primarily been related to serviceability at an industry level, while ASIC has continued to consult on proposed changes to its regulatory guide on responsible lending. Judicial guidance on the extent of responsible lending obligations was also obtained from the Federal Court in its judgment in ASIC’s responsible lending test case against Westpac (with the judgment currently under appeal). More information on these proceedings is set out in this section below.
APRA has also been engaging with Westpac on the adequacy of our credit risk management framework including our controls, policies and operating systems. Following feedback from APRA, the Group is making a number of changes to its systems and controls to improve its end-to-end approach in relation to its mortgage and business lending portfolios, as well as other key processes. This includes enhancing portfolio management practices, systems upgrades (including data collection and rationalisation), strengthening collateral management processes and improving assurance and oversight over our credit management frameworks. This program of work also addresses issues identified by Westpac’s internal assurance and audit teams.
Westpac will continue its work to improve its end to end credit processes and expects engagement with APRA in this regard to continue throughout Full Year 2020.
| 2019 Westpac Group Annual Report | 9 |
| | |
Information on Westpac
Australian Competition and Consumer Commission (ACCC) inquiry into home loan pricing
On 14 October 2019, the ACCC was directed by the Treasurer of Australia to conduct an inquiry into home loan pricing since 1 January 2019. The inquiry has been established to:
· investigate the prices charged for home loans across the sector;
· consider how banks make pricing decisions, including their approach to passing on movements in the official cash rate;
· examine differences in the prices paid by new and existing customers;
· examine differences between the interest rates published by suppliers and the interest rates paid by customers; and
· investigate barriers that may prevent consumers from switching lenders.
An interim report is due by 30 March 2020 and a final report is due by 30 September 2020.
ACCC residential mortgage products price inquiry in relation to the Bank Levy
The ACCC undertook a specific inquiry into the pricing of residential mortgages by those banks affected by the Bank Levy (including Westpac), which included monitoring the extent to which the Bank Levy was passed on to customers. The final report was published in December 2018 and made a number of findings about the pricing or residential mortgages, including that the banks that were the subject of the inquiry did not change residential mortgage prices specifically to recover the costs of the Bank Levy.
AFCA look back review
On 4 February 2019, the Australian Government announced that, in response to the recommendations contained in the Royal Commission’s Final Report, it would expand the remit of the Australian Financial Complaints Authority (AFCA) for 12 months so that it can consider customer claims dating back to 1 January 2008 and award compensation where appropriate. AFCA has expanded its jurisdiction to consider these legacy complaints for an additional 12 month period to 30 June 2020.
Increased regulatory powers and oversight
Australian Securities and Investments Commission (ASIC) Enforcement Review Taskforce
On 16 April 2018, the Australian Government agreed to implement all of the recommendations made by the ASIC Enforcement Review Taskforce in its review of the suitability of ASIC’s existing regulatory tools.
Progress continues to be made in implementing these recommendations, including:
· the Australian Treasury releasing five draft Bills on 11 September 2019 for consultation which, if enacted, would further strengthen ASIC’s enforcement and supervision powers by implementing certain recommendations relating to search warrants, access to telecommunications interception information, licensing and banning orders; and
· the Taskforce releasing a report on 2 October 2019. The report sets out ASIC’s observations on director and officer oversight of non-financial risk, how directors and officers of large and complex financial services companies are discharging their duties in relation to oversight and monitoring of non-financial risk, and ways that governance practices could be improved.
Enhanced penalties for corporate and financial sector misconduct
On 12 March 2019, the Treasury Laws Amendment (Strengthening Corporate and Financial Sector Penalties) Act 2019 (Cth) received royal assent. The Act strengthens penalties for corporate and financial sector misconduct consistent with the ASIC Enforcement Review Taskforce recommendations.
Key aspects of the Act are to:
· update the penalties for certain criminal offences in legislation administered by ASIC, including tripling the maximum imprisonment penalties for certain criminal offences (from 5 to 15 years), introducing a formula to calculate financial penalties for contraventions of civil penalty provisions by individuals and companies, and removing imprisonment as a penalty but increasing the financial penalties for all strict and absolute liability offences;
· introduce ordinary criminal offences that sit alongside strict and absolute liability offences;
· expand the civil penalty regime by making a wider range of offences subject to civil penalties, such as failures by Australian financial services licensees to act efficiently, fairly and honestly, and failures to report significant breaches within 10 days of becoming aware of the breach or of circumstances where they are likely to breach;
· introduce a new test that applies to all dishonesty offences under the Corporations Act 2001 (Cth); and
· ensure the Courts prioritise compensating victims over ordering the payment of financial penalties.
ASIC’s close and continuous monitoring program
ASIC has continued to use a supervisory approach in which ASIC officers are embedded in major financial institutions, including Westpac, in order to actively limit future financial harm to consumers, investors and markets and to catalyse positive, consumer oriented, behavioural change.
To date, the model adopted by ASIC is for officers to make extended onsite visits to major financial institutions. ASIC’s program is examining culture and processes in major financial institutions through three streams: Breach Reporting, Corporate Governance and Internal Dispute Resolution (IDR). ASIC’s onsite on Breach Reporting and engagement on Corporate Governance is now complete. The IDR onsite for Westpac commenced on 15 October 2019.
10 | 2019 Westpac Group Annual Report | |
| | |
Information on Westpac
Product design and distribution obligations and product intervention power
On 5 April 2019, the Treasury Laws Amendment (Design and Distribution Obligations and Product Intervention Powers) Act 2019 (Cth) received royal assent. The Act amends the Corporations Act 2001 (Cth) and the National Consumer Credit Protection Act 2009 (Cth) and grants ASIC a product intervention power and introduces a new ‘principles-based’ product design and distribution obligation on issuers and distributors.
Regulatory enforcement approach
On 15 April 2019, APRA released its Enforcement Approach with immediate effect. The new Enforcement Approach follows the results of its Enforcement Review, released on the same day. The Enforcement Review made seven recommendations which were designed to help APRA better leverage its enforcement powers to achieve prudential outcomes.
In response to the Enforcement Review, APRA stated it would implement all recommendations including increasing APRA’s enforcement appetite from a ‘last resort’ to a ‘constructively tough’ approach. The new enforcement approach sets out how APRA will use its enforcement powers to prevent and address serious prudential risks, and to hold entities and individuals to account. APRA’s approach states that it may do this well before the risks (whether financial, operational or behavioural) present an immediate threat to financial viability. Further, where entities or individuals are failing to meet prudential obligations, APRA will act quickly and forcefully, and will be willing to set public examples to deter unacceptable practices from occurring in the future.
On 26 February 2019, the ACCC outlined its compliance and enforcement priorities in its annual Compliance and Enforcement Policy refresh. The ACCC’s competition enforcement approach and objectives are supported by increased budget support from the Government announced at the end of 2018.
In October 2018, ASIC committed to accelerating enforcement activities, conducting more civil and criminal enforcement actions against large financial institutions and adopting a ‘why not litigate?’ enforcement stance. Following the release of the Royal Commission’s Final Report, ASIC has established a separate Office of Enforcement within ASIC.
Review into corporate criminal responsibility regime
On 10 April 2019, the Australian Government commissioned the Australian Law Reform Commission (ALRC) to undertake a comprehensive review of the corporate criminal responsibility regime. The review is to consider reforms to the Criminal Code and other relevant legislation to provide a simpler, stronger and more cohesive regime for corporate criminal responsibility. The ALRC’s report is to be provided to the Australian Government by 30 April 2020.
General regulatory changes affecting our business
Banking Code of Practice
On 31 July 2018, ASIC approved the Banking Code of Practice (the Code) with an implementation date of 1 July 2019 for each bank that has adopted the Code (including Westpac). The Code introduces a range of new measures including a commitment to take extra
care with vulnerable customers and train staff to help, simplified loan contracts for small business written in plain English, better protection for guarantors and stronger enforcement of the Code.
The Code will be further updated with key amendments in response to the recommendations contained in the Royal Commission’s Final Report, which recommended changes in relation to the protection of small businesses and having a greater focus on customers in remote areas and those with limited English. These changes include banning informal overdrafts on basic accounts without prior express agreement with the customer, abolishing dishonour fees on basic bank accounts and following AUSTRAC’s guidance on the identification and verification of persons of Aboriginal or Torres Strait Islander heritage. Subject to regulatory approvals, it is expected that these updates will be effective from 1 March 2020.
Open banking regime
The Treasury Laws Amendment (Consumer Data Right) Act 2019 (Cth) (CDR Act) received royal assent on 12 August 2019. The CDR Act amends the Competition and Consumer Act 2010 (Cth), the Privacy Act 1988 (Cth) and the Australian Information Commissioner Act 2010 (Cth) to introduce a consumer data right. The banking sector is the first sector to which the consumer data right will apply.
The introduction of a consumer data right in the Australian economy signifies a shift in how data is regulated. It will give customers in Australia a right to direct that their data (starting with banking data) be shared with accredited third parties and follows a growing global trend to give consumers control over their data. Data sharing is expected to facilitate competition through easier product comparison and switching. This will have significant implications for consumers and banks.
On 2 September 2019, the ACCC released the final Competition and Consumer (Consumer Data Right) Rules 2019 (CDR Rules). The CDR Rules outline how the consumer data right is to be implemented in the banking sector. A revised timetable for the introduction of open banking was included as part of the CDR Rules.
Both the CDR Act and CDR Rules contain new, detailed privacy protections under 13 Privacy Safeguards. The Privacy Safeguards deal with the disclosure, collection, use, accuracy, storage, security and deletion of consumer data right data. There are also 58 civil penalty provisions under the CDR Rules. A breach of the Privacy Safeguards or the CDR Rules could attract civil penalties of up to the greater of $10 million, 3 times any benefit obtained or 10% of 12 month annual turnover for corporations.
Comprehensive Credit Reporting (CCR)
On 15 August 2019, an updated version of the National Consumer Credit Protection Amendment (Mandatory Comprehensive Credit Reporting) Bill 2018 (Cth) was released for consultation by the Australian Treasury, following the prior introduction of the Bill into the House of Representatives in March 2018. It is expected that this updated Bill will be introduced into Parliament in late 2019.
| 2019 Westpac Group Annual Report | 11 |
| | |
Information on Westpac
Litigation
ASIC’s responsible lending litigation against Westpac
On 1 March 2017, ASIC commenced Federal Court proceedings against Westpac in relation to certain home loans entered into between December 2011 and March 2015, which were automatically approved by Westpac’s systems as part of its broader processes. The proceedings were heard in May 2019. On 13 August 2019, the Court handed down its judgment in the proceedings, and dismissed ASIC’s case. On 10 September 2019 ASIC filed an appeal in relation to the decision.
Outbound scaled advice division proceedings
On 22 December 2016, ASIC commenced Federal Court proceedings against BT Funds Management Limited (BTFM) and Westpac Securities Administration Limited (WSAL) in relation to a number of superannuation account consolidation campaigns conducted between 2013 and 2016. ASIC has alleged that in the course of some of these campaigns, customers were provided with personal advice in contravention of a number of Corporations Act 2001 (Cth) provisions, and selected 15 specific customers as the focus of their claim. In December 2018 the primary Court handed down a judgment in which it held that no personal advice had been provided and that BTFM and WSAL did not contravene the relevant personal advice provisions although it did make a finding that BTFM and WSAL had each contravened section 912A(1)(a) of the Corporations Act. In February 2019, ASIC filed an appeal against this decision. On 28 October 2019, the Full Federal Court handed down its decision in ASIC’s favour and made findings that BTFM and WSAL each provided personal advice on the relevant calls. Once formal declarations of contravention are made, the matter will be remitted for penalty.
ASIC’s proceedings against Westpac for poor financial advice by a financial planner
On 14 June 2018, ASIC commenced proceedings in the Federal Court against Westpac in relation to alleged poor financial advice provided by a former financial planner, Mr Sudhir Sinha. Mr Sinha was dismissed by Westpac in November 2014 and subsequently banned by ASIC. Westpac has proactively initiated remediation to identify and compensate affected customers and has completed remediation activities. ASIC’s proceedings relate to advice provided by Mr Sinha in respect of four specific customer files. The matter was heard by the Court on 15 April 2019 and judgment has been reserved.
Class action against Westpac Banking Corporation and Westpac Life Insurance Services Limited
On 12 October 2017, a class action was filed in the Federal Court of Australia on behalf of customers who, since February 2011, obtained insurance issued by Westpac Life Insurance Services Limited (WLIS) on the recommendation of financial advisers employed within the Westpac Group. The plaintiffs have alleged that aspects of the financial advice provided by those advisers breached fiduciary and statutory duties owed to the advisers’ clients, including the duty to act in the best interests of the client, and that WLIS was knowingly involved in those alleged breaches. Westpac and WLIS are defending the proceedings.
These proceedings are currently stayed by order of the Court, pending the outcome of an appeal concerning a procedural issue unrelated to the substantive claims made in the class action.
BBSW proceedings
Following ASIC’s investigations into the interbank short-term money market and its impact on the setting of the bank bill swap reference rate (BBSW), on 5 April 2016, ASIC commenced civil proceedings against Westpac in the Federal Court of Australia, alleging certain misconduct, including market manipulation and unconscionable conduct. On 24 May 2018, Justice Beach found that Westpac had not engaged in market manipulation or misleading or deceptive conduct under the Corporations Act 2001 (Cth). His Honour also found that there was no ‘trading practice’ of manipulating the BBSW rate. However, the Court found that Westpac engaged in unconscionable conduct on 4 occasions and that Westpac breached certain of its duties as a financial services licensee. On 9 November 2018, the Court ordered Westpac to pay a penalty of $3.3 million and 50% of ASIC’s costs, and have an independent expert review particular aspects of Westpac’s compliance arrangements. Westpac has complied with these orders. The amount of costs recoverable by ASIC is still in the process of being determined.
In August 2016, a class action was filed in the United States District Court for the Southern District of New York against Westpac and large number of Australian and international banks alleging misconduct in relation to the bank bill swap reference rate. In April 2019, an amended claim was filed by the Plaintiffs. Westpac is defending the proceedings with a Motion to Dismiss filed in May 2019.
Responsible lending class action
On 21 February 2019, a class action against Westpac was filed in the Federal Court of Australia. As directed by the Court, the Plaintiffs filed a Statement of Claim on 22 May 2019 and an amended statement of claim on 18 October 2019. The claims allege that Westpac did not comply with its responsible lending obligations and entered into certain home loans that it should otherwise have assessed as unsuitable. The allegations include that, during the period from 1 January 2011 to 17 February 2018, Westpac failed to: conduct reasonable inquiries about the customers’ financial situation, requirements and objectives; verify customer’s financial situation; conduct assessments of suitability; and act efficiently and fairly. Westpac is defending the proceedings.
Cash in super class action
On 5 September 2019, a class action against BT Funds Management Limited (BTFM) and Westpac Life Insurance Services Limited (WLIS) was commenced in relation to aspects of BTFM’s BT Super for Life cash investment option. The claim follows other industry class actions as part of Slater and Gordon’s ‘Get your super back’ campaign.
It is alleged in the proceedings that BTFM failed to adhere to a number of obligations under the general law, the relevant trust deed and the Superannuation Industry (Supervision) Act 1993 (Cth), and that WLIS was knowingly concerned with BTFM’s alleged contraventions. The damages sought by the claim are unspecified. BTFM and WLIS are defending the proceedings.
12 | 2019 Westpac Group Annual Report | |
| | |
Information on Westpac
Regulatory capital transactions
Capital raising
On 4 November 2019, Westpac announced that it will be undertaking an underwritten placement of fully paid ordinary shares in Westpac to institutional investors to raise $2 billion. As further announced, following the placement, Westpac will make a share purchase plan available to shareholders to raise approximately $500 million, subject to scaleback, and with the ability to raise less or more.
Issue of Westpac Capital Notes 6
On 18 December 2018, Westpac issued approximately $1.42 billion of securities known as Westpac Capital Notes 6 which qualify as Additional Tier 1 capital under APRA’s capital adequacy framework.
Transfer and redemption of Westpac Capital Notes
On 18 December 2018, approximately $722 million of Westpac Capital Notes were transferred to the Westpac Capital Notes nominated party for $100 each pursuant to the Westpac Capital Notes 6 reinvestment offer. Those Westpac Capital Notes were subsequently redeemed by Westpac.
On 8 March 2019, being the optional redemption/transfer date of the Westpac Capital Notes, the remaining $662 million of Westpac Capital Notes were transferred to the Westpac Capital Notes nominated party for $100 each. Those Westpac Capital Notes were subsequently redeemed by Westpac.
Adoption of new accounting standards
Adoption of AASB 9 and AASB 15
The Group adopted the classification and measurement, and impairment requirements of AASB 9: Financial Instruments (AASB 9) on 1 October 2018. AASB 9 includes a forward looking ‘expected credit loss’ impairment model, revised classification and measurement model and modifies the approach to hedge accounting.
The adoption of AASB 9 reduced the Group’s retained earnings at 1 October 2018 by $722 million (net of tax) primarily due to the increase in impairment provisions under the new standard.
The Group also adopted AASB 15: Revenue from Contracts with Customers (AASB 15) on 1 October 2018. AASB 15 provides a systematic approach to revenue recognition by introducing a five-step model governing revenue measurement and recognition. The adoption of AASB 15 reduced the Group’s retained earnings at 1 October 2018 by $5 million (net of tax).
Further details of the changes from the adoption of AASB 9 and AASB 15 as well as details of accounting standards that have been issued but are not yet effective for the Group are included in Note 1 to the financial statements.
Transition to AASB 16
AASB 16: Leases (AASB 16) replaced AASB 117: Leases from 1 October 2019. AASB 16 requires all leases of greater than 12 months duration to be presented on balance sheet by the lessee as a right-of-use asset and a lease liability. The application of AASB 16 is expected to result in the recognition of a right-of-use asset of $3.4 billion with a corresponding lease liability, with no impact on retained earnings.
Further details of the changes under the new standard are included in Note 1 to the financial statements.
APRA regulatory changes
APRA’s proposed changes to capital standards
On 19 July 2017, APRA released an Information Paper titled ‘Strengthening Banking System Resilience - Establishing Unquestionably Strong Capital Ratios’. In its release, APRA concluded that the four major Australian banks, including Westpac, need to have a common equity tier 1 (CET1) capital ratio of at least 10.5%, as measured under the existing capital framework, to be considered ‘unquestionably strong’. Banks are expected to meet this new benchmark by 1 January 2020.
APRA has commenced consultation on revisions to the capital framework which includes proposals on changes to risk weighted assets, including in relation to residential mortgages as well as improving the transparency, comparability and flexibility of the framework.
As part of the proposals, APRA has proposed a minimum Leverage Ratio requirement of 3.5% for ADIs, such as Westpac, that use the internal ratings-based approach to determine capital adequacy.
APRA has indicated that it expects to finalise the suite of prudential standards to give effect to the ‘unquestionably strong’ benchmark in 2020-21, with the revised prudential standards likely to come into effect from 1 January 2022. In regards to the proposed revisions to the capital treatment of operational risk, APRA has proposed an earlier implementation date of 1 January 2021 for advanced IRB banks, such as Westpac.
APRA has announced that its revisions to the capital framework are not intended to necessitate further capital increases for the industry above the 10.5% benchmark. However, given the proposals include higher risk weights for certain mortgage products, such as interest only loans and loans for investment purposes, the impact on individual banks may vary. The proposals are currently under consultation and final details remain unclear, and it is therefore too soon to determine the impact on Westpac.
APRA’s additional capital requirements
On 11 July 2019, Westpac received APRA’s response to its self-assessment. In its response, APRA decided to apply an additional $500 million to Westpac’s operational risk capital requirement. This follows APRA concluding that Westpac was required to improve its management and oversight of non-financial risk. The additional capital requirement will remain in place until APRA is satisfied that Westpac has completed its action plan.
The $500 million requirement, applied through an increase in risk weighted assets, took effect from 30 September 2019. The change reduced Westpac’s Level 2 CET1 capital ratio by 16 basis points. Westpac’s CET1 capital ratio at 30 September 2019 was 10.67%.
| 2019 Westpac Group Annual Report | 13 |
| | |
Information on Westpac
APRA’s proposed revisions to subsidiary capital investment treatment
On 15 October 2019, APRA released a discussion paper on proposed changes to APS 111 Capital Adequacy: Measurement of Capital. The key proposal is in relation to a parent ADI’s treatment of its equity investments in banking and insurance subsidiaries (Level 1). Westpac’s largest investment in banking and insurance subsidiaries is Westpac New Zealand Limited (WNZL). There is no impact from this proposal on the calculation of the Group’s reported regulatory capital ratios on a Level 2 basis. On a Level 1 basis, on a proforma basis as at 30 September 2019, it is estimated that applying APRA’s proposed approach would reduce Westpac’s Level 1 CET1 ratio by approximately 40bps ($1.6 billion). APRA has indicated that the updated standard will come into effect from 1 January 2021.
Associations with Related Entities
On 20 August 2019, APRA released the finalised prudential standard APS 222: Associations with Related Entities. The revised standard is intended to strengthen the ability of ADIs to monitor, limit and control risks arising from transactions and other associations with related entities. Key changes include revisions to the limit for exposure to ADIs from 50% of Total Capital to 25% of Tier 1 capital. The revised standard is effective from 1 January 2021.
Westpac’s largest exposure to a related entity is WNZL. As at 30 September 2019, Westpac would remain within the revised limits based on the current level of exposure to WNZL.
Additional loss absorbing capacity
In response to the Financial System Inquiry recommendations, the Australian Government agreed to further reforms regarding crisis management and establishing a framework for minimum loss-absorbing and recapitalisation capacity.
On 9 July 2019, APRA announced a requirement for the Australian major banks (including Westpac) to increase their total capital requirements by three percentage points of risk weighted assets (RWA) as measured under the current capital adequacy framework. This increase in total capital will take full effect from 1 January 2024.
Based on Westpac’s RWA of $429 billion at 30 September 2019, this represents around $13 billion of additional capital over the four year transition period. The additional capital is expected to be raised through Tier 2 Capital and is likely to be offset by a decrease in other forms of long term wholesale funding. Westpac has commenced progress towards the new requirements and in the financial year ended 30 September 2019 issued a total of $4.2 billion in Tier 2 capital.
APRA is still targeting an additional four to five percentage points of loss-absorbing capacity. Over the next four years, APRA will consider feasible alternative methods for raising the remaining 1-2 percentage points.
APRA intends to consult on a prudential framework covering both recovery and resolution planning in 2020.
APRA’s proposed amendment to guidance on mortgage lending
On 5 July 2019, APRA announced that it no longer required ADIs to assess home loan applications using a minimum interest rate of at least 7%. Instead, ADIs are permitted to review and set their own minimum interest rate floor for use in serviceability assessments and utilise a revised interest rate buffer of at least 2.5% over the loan’s interest rate. Also on 5 July 2019, APRA also released its final version of Prudential Practice Guide APG 223 – Residential Mortgage Lending.
APRA Prudential Standard CPS 234: Information Security Management
On 1 July 2019, APRA’s Prudential Standard CPS 234: Information Security came into effect, except for information assets managed by a third party which will come into effect from the earlier of the next contract renewal date or 1 July 2020. The standard is aimed at improving the ability of APRA-regulated entities to detect cyber adversaries, ensure appropriate security capabilities are in place commensurate to the risk of the information assets including responding swiftly and effectively in the event of an information security incident. Westpac continues to enhance its systems and processes to further mitigate cybersecurity risks.
APRA Prudential Standard CPS 511: Remuneration
On 23 July 2019, APRA released for consultation a new draft prudential standard and supporting discussion paper on remuneration. It is aimed at clarifying and strengthening remuneration arrangements in APRA-regulated entities. The new standard will replace existing remuneration requirements under CPS/SPS 510 Governance with a proposed implementation date of 1 July 2021.
International developments affecting Westpac
Brexit
There continues to be uncertainty on the timing and process for the United Kingdom’s (UK) withdrawal from the European Union (EU).
As Westpac’s business and operations are based predominantly in Australia and New Zealand, Westpac expects that the direct impact of the UK’s departure from the EU is unlikely to be material to Westpac. However, it remains difficult to predict the impact that Brexit may have on financial markets, the global economy and the global financial services industry. Westpac has contingency planning in place and has been active in dialogue with affected customers.
OTC derivatives reform
International regulatory reforms relating to over-the-counter (OTC) derivatives continue to be implemented across the globe, with a current focus on initial margin and risk mitigation practices for non-centrally cleared derivatives.
As of 1 September 2019, Westpac is required to post and collect collateral on a gross basis, held at third party custodians. Global initial margin requirements will continue to be introduced in phases until 1 September 2021.
14 | 2019 Westpac Group Annual Report | |
| | |
Information on Westpac
New Zealand
Reserve Bank of New Zealand (RBNZ) - Revised Outsourcing Policy
As at 30 September 2019, WNZL is compliant with the requirement in the RBNZ’s revised Outsourcing Policy (BS11) (Revised Outsourcing Policy) to maintain a compendium of outsourcing arrangements and work is underway to comply with the other aspects of the Revised Outsourcing Policy by 30 September 2022 in line with the regulatory timeline.
As a result of complying with the Revised Outsourcing Policy, the ongoing cost of operating the WNZL business will increase, in addition to the costs of implementing the changes.
RBNZ Capital Review
On 14 December 2018, the RBNZ released a consultation paper to seek the public’s view on a proposal to set a Tier 1 capital requirement equal to 16% of risk weighted assets for banks deemed systemically important, such as WNZL. The proposal of a Tier 1 ratio of 6% of risk weighted assets as a regulatory minimum is unchanged, and of this no more than 1.5% of risk weighted assets can be contributed by Additional Tier 1 capital or redeemable preference shares. The RBNZ has also proposed changes to risk weighted asset measurements. The RBNZ has proposed a five year transition period.
The proposed changes aim to further strengthen the New Zealand banking system to protect the economy and depositors from bank failure. WNZL would be required to hold a further estimated NZ$2.3 – 2.9 billion of Tier 1 capital (assuming a WNZL Tier 1 capital ratio of 16-17%) if the proposals were applied at 30 September 2019. WNZL is already strongly capitalised with a Tier 1 capital ratio of 13.9% at 30 September 2019.
On a pro-forma basis this change would also increase Westpac’s Level 1 capital requirements by NZ$1.2-$1.8 billion if the proposals were applied at 30 September 2019, assuming that some of WNZL’s supplementary capital can be issued externally over time and that APRA’s proposed revisions to subsidiary capital investment treatment are implemented (more information on these proposed revisions is set out above). Further clarity on the proposals is expected from the RBNZ in December 2019 with implementation of any new rules starting from April 2020.
RBNZ - Review under section 95 of the Reserve Bank of New Zealand Act 1989
In June 2019, in response to a review under section 95 of the Reserve Bank of New Zealand Act 1989 of WNZL’s compliance with advanced internal rating based aspects of the RBNZ’s ‘Capital Adequacy Framework (Internal Models Based Approach)’ (BS2B), WNZL presented the RBNZ with a submission providing an overview of its credit risk rating system and activities undertaken to address compliance issues and enhance risk management practices.
On 30 October 2019, the RBNZ informed WNZL that it had accepted the submission and measures undertaken by WNZL to achieve satisfactory compliance with BS2B, and that WNZL would retain its accreditation to use internal models for credit risk in the calculation of its regulatory capital requirements. It also advised WNZL that, with effect from 31 December 2019, the RBNZ will remove the requirement imposed on WNZL since 31 December 2017 to maintain minimum regulatory capital ratios which are two percentage points higher than the ratios applying to other locally incorporated banks.
Review of the Reserve Bank of New Zealand Act
In November 2017, the New Zealand Government announced it would undertake a review of the Reserve Bank of New Zealand Act 1989 (RBNZ Review). The RBNZ Review will consist of two phases. The legislation for the recommended Phase 1 related changes to New Zealand’s monetary policy framework received royal assent on 20 December 2018, and came into force on 1 April 2019.
The terms of reference for Phase 2 were released in June 2018 and will consider the overarching objectives of the RBNZ’s institutional governance and decision-making, the macro-prudential framework, the current prudential supervision model, trans-Tasman coordination, supervision and enforcement and resolution and crisis management. Final policy decisions on all components of the review are expected to be made in 2020.
RBNZ/Financial Markets Authority (FMA) - Financial Services Conduct & Culture Review
In May 2018, the RBNZ and FMA commenced a review in respect of New Zealand’s 10 major banks and 15 life insurers, including WNZL and Westpac Life-NZ-Limited, to explain why conduct issues highlighted by the Australian Royal Commission are not present in New Zealand. An industry thematic review report for the banks was released on 5 November 2018. WNZL submitted a plan responding to recommendations in the review report and in WNZL’s individual feedback letters to the regulators on 29 March 2019.
The industry thematic review report into life insurers, including Westpac Life-NZ-Limited, was released on 29 January 2019. The report identified extensive weaknesses in life insurers’ systems and controls, governance and management of conduct risks. Westpac Life-NZ-Limited provided its plan to address the findings to the regulators in June 2019.
Conduct of Financial Institutions Review
Following the developments and findings of the Financial Services Conduct and Culture Review and the Australian Royal Commission, the Minister of Commerce announced a proposal to introduce a conduct licensing regime for banks, insurers and non-bank deposit takers in respect of their conduct in relation to retail customers. The regime will require licensed institutions to meet a fair treatment standard, and implement effective policies, processes, systems and controls to meet this standard. The regime will also create obligations relating to remuneration and sales incentives. Legislation is expected to be introduced to parliament by the end of 2019.
Reform of Credit Contracts and Consumer Finance Legislation
In April 2019, the Credit Contracts Legislation Amendment Bill was introduced to parliament and is currently before the select committee. The Bill introduces a number of changes to the Credit Contracts and Consumer Finance Act, including new duties for directors and senior managers and increased penalties and statutory damages. The Bill also introduces stricter requirements around suitability and affordability assessments as well as a cap for interest and fees of ‘high cost’ loans (being loans with annualised interest exceeding 50%). The intention is that the Bill will come into effect in March 2020.
| 2019 Westpac Group Annual Report | 15 |
| | |
Information on Westpac
Supervision and regulation
Australia
Within Australia, we are subject to supervision and regulation by six principal agencies and bodies: the Australian Prudential Regulation Authority (APRA); the Reserve Bank of Australia (RBA); the Australian Securities and Investments Commission (ASIC); the Australian Securities Exchange (ASX); the Australian Competition and Consumer Commission (ACCC); and the Australian Transaction Reports and Analysis Centre (AUSTRAC).
APRA is the prudential regulator of the Australian financial services industry. It oversees banks, credit unions, building societies, general insurance, re-insurance, life insurance and private health insurance companies, friendly societies and most of the superannuation (pension) industry. APRA’s role includes establishing and enforcing prudential standards and practices designed to ensure that, under all reasonable circumstances, financial promises made by the institutions it supervises are met within a stable, efficient and competitive financial system. APRA has recently received new and strengthened powers under the Banking Executive Accountability Regime.
As an ADI, we report prudential information to APRA, including information in relation to capital adequacy, large exposures, credit quality and liquidity. Our controlled entities in Australia that are authorised insurers and trustees of superannuation funds are also subject to the APRA regulatory regime. Reporting is supplemented by consultations, on-site inspections and targeted reviews. Our external auditor also has an obligation to report on compliance with certain statutory and regulatory banking requirements and on any matters that in their opinion may have the potential to materially prejudice the interests of depositors and other stakeholders.
Australia’s risk-based capital adequacy guidelines are based on the approach agreed upon by the BCBS. National discretion is then applied to that approach, which has resulted in Australia’s capital requirements being more stringent. Refer to ‘Capital resources – Basel Capital Accord’ in Section 2.
The RBA is responsible for monetary policy, maintaining financial system stability and promoting the safety and efficiency of the payments system. The RBA is an active participant in the financial markets, manages Australia’s foreign reserves, issues Australian currency notes and serves as banker to the Australian Government.
ASIC is the national regulator of Australian companies and consumer protection within the financial sector. Its primary responsibility is to regulate and enforce company, consumer credit, financial markets and financial products and services laws that protect consumers, investors and creditors. With respect to financial services, it promotes fairness and transparency by providing consumer protection, using regulatory powers to enforce laws relating to deposit-taking activities, general insurance, life insurance, superannuation, retirement savings accounts, securities (such as shares, debentures and managed investments) and futures contracts and financial advice. ASIC has responsibility for supervising trading on Australia’s domestic licensed markets and of trading participants. ASIC has recently had its existing powers strengthened to provide ASIC with a product intervention power. For further information, refer to ‘Significant developments’ above.
The ASX operates Australia’s primary national market for trading of securities issued by listed companies. Some of our securities (including our ordinary shares) are listed on the ASX and we therefore have obligations to comply with the ASX Listing Rules, which have statutory backing under the Corporations Act 2001 (Cth). The ASX has responsibility for the oversight of listed entities under the ASX Listing Rules and for monitoring and enforcing compliance with the ASX Operating Rules by its market, clearing and settlement participants. ASX is now also the benchmark administrator of BBSW.
The ACCC is the regulator responsible for the regulation and prohibition of anti-competitive and unfair market practices and mergers and acquisitions in Australia. Its broad objective is to administer the Competition and Consumer Act 2010 (Cth) and related legislation to bring greater competitiveness, fair trading, consumer protection and product safety to the Australian economy. The ACCC’s role in consumer protection complements that of ASIC (for financial services) and Australian state and territory consumer affairs agencies that administer the unfair trading legislation of their jurisdictions.
The Australian Government’s present policy, known as the ‘four pillars policy’, is that there should be no fewer than four major banks to maintain appropriate levels of competition in the banking sector. Under the Financial Sector (Shareholdings) Act 1998 (Cth), the Australian Government’s Treasurer must approve an entity acquiring a stake of more than 15% in a particular financial sector company.
Proposals for foreign acquisitions of a stake in Australian banks are subject to the Australian Government’s foreign investment policy and, where required, approval by the Australian Government under the Australian Foreign Acquisitions and Takeovers Act 1975 (Cth). For further details refer to ‘Limitations affecting security holders’ in Section 4.
AUSTRAC oversees the compliance of Australian reporting entities (including Westpac) with the requirements under the Anti-Money Laundering and Counter-Terrorism Financing Act 2006 (Cth) and the Financial Transaction Reports Act 1988 (Cth). These requirements include:
· implementing programs for identifying and monitoring customers, and for managing the risks of money laundering and terrorism financing;
· reporting suspicious matters, threshold transactions and international funds transfer instructions; and
· submitting an annual compliance report.
AUSTRAC provides financial information to Australian federal law enforcement, national security, human services and revenue agencies, and certain international counterparts.
New Zealand
The Reserve Bank of New Zealand (RBNZ) is responsible for supervising New Zealand registered banks and protects the financial stability of New Zealand through the application of minimum prudential obligations. The New Zealand prudential supervision regime requires that registered banks publish disclosure statements, which contain information on financial performance and risk positions as well as attestations by the directors about the bank’s compliance with its conditions of registration and certain other matters.
16 | 2019 Westpac Group Annual Report | |
| | |
Information on Westpac
The Financial Markets Authority (FMA) and the New Zealand Commerce Commission (NZCC) are the two primary conduct and enforcement regulators. The FMA and NZCC are responsible for ensuring that markets are fair and transparent and are supported by confident and informed investors and consumers. Regulation of markets and their participants is undertaken through a combination of market supervision, corporate governance and licensing approvals.
In New Zealand, other relevant regulator mandates include those relating to taxation, privacy and foreign affairs and trade.
Banks in New Zealand are also subject to a number of self- regulatory regimes. Examples include Payments NZ, the New Zealand Bankers’ Association and the Financial Services Council (FSC). Examples of industry agreed codes include the New Zealand Bankers’ Association’s Code of Banking Practice and FSC’s Code of Conduct.
United States
Our New York branch is a US federally licensed branch and therefore is subject to supervision, examination and regulation by the US Office of the Comptroller of the Currency and the Board of Governors of the Federal Reserve System (the US Federal Reserve) under the US International Banking Act of 1978 (IBA) and related regulations.
A US federal branch must maintain, with a US Federal Reserve member bank, a capital equivalency deposit as prescribed by the US Comptroller of the Currency, which is at least equal to 5% of its total liabilities (including acceptances, but excluding accrued expenses, and amounts due and other liabilities to other branches, agencies and subsidiaries of the foreign bank).
In addition, a US federal branch is subject to periodic onsite examination by the US Comptroller of the Currency. Such examination may address risk management, operations, asset quality, compliance with the record-keeping and reporting, and any additional requirements prescribed by the US Comptroller of the Currency from time to time.
A US federal branch of a foreign bank is, by virtue of the IBA, subject to the receivership powers exercisable by the US Comptroller of the Currency.
As of 22 June 2016, we elected to be treated as a financial holding company in the US pursuant to the Bank Holding Company Act of 1956 and Federal Reserve Board Regulation Y. Our election will remain effective so long as we meet certain capital and management standards prescribed by the US Federal Reserve.
Westpac and some of its affiliates are engaged in various activities that are subject to regulation by other US federal regulatory agencies, including the US Securities and Exchange Commission, the US Commodity Futures Trading Commission and the National Futures Association.
Anti-money laundering regulation and related requirements
Australia
Westpac has a Group-wide program to manage its obligations under the Anti-Money Laundering and Counter- Terrorism Financing Act 2006 (Cth). We continue to actively engage with the regulator, AUSTRAC, on our activities.
Our Anti-Money Laundering and Counter-Terrorism Financing Policy (AML/CTF Policy) sets out how the Westpac Group complies with its legislative obligations.
The AML/CTF Policy applies to all business divisions and employees (permanent, temporary and third party providers) working in Australia, New Zealand and overseas.
United States
The USA PATRIOT Act of 2001 requires US financial institutions, including the US branches of foreign banks, to take certain steps to prevent, detect and report individuals and entities involved in international money laundering and the financing of terrorism. The required actions include verifying the identity of financial institutions and other customers and counterparties, terminating correspondent accounts for foreign ‘shell banks’ and obtaining information about the owners of foreign bank clients and the identity of the foreign bank’s agent for service of process in the US. The anti-money laundering compliance requirements of the USA PATRIOT Act include requirements to adopt and implement an effective anti-money laundering program, report suspicious transactions or activities, and implement due diligence procedures for correspondent and other customer accounts. Westpac’s New York branch and Westpac Capital Markets LLC maintain an anti-money laundering compliance program designed to address US legal requirements.
US economic and trade sanctions, as administered by the Office of Foreign Assets Control (OFAC), prohibit or significantly restrict US financial institutions, including the US branches and operations of foreign banks, and other US persons from doing business with certain persons, entities and jurisdictions. Westpac’s New York branch and Westpac Capital Markets LLC maintain compliance programs designed to comply with OFAC sanctions programs, and Westpac has a Group-wide program to ensure adequate compliance.
Legal proceedings
Our entities are defendants from time to time in legal proceedings arising from the conduct of our business. Material legal proceedings, if any, are described in Note 27 to the financial statements and under ‘Significant developments’ above. Where appropriate as required by the accounting standards, a provision has been raised in respect of these proceedings and disclosed in the financial statements.
Principal office
Our principal office is located at 275 Kent Street, Sydney, New South Wales, 2000, Australia. Our telephone number for calls within Australia is (+61) 2 9155 7713 and our international telephone number is (+61) 2 9155 7700.
| 2019 Westpac Group Annual Report | 17 |
| | |
Corporate governance
Introduction
This Corporate Governance Statement, which has been approved by the Board, describes our corporate governance framework, policies and practices as at 4 November 2019.
Framework and our approach to governance
Corporate governance is the framework of systems, policies and processes by which we operate, make decisions and hold people to account. The framework establishes the roles and responsibilities of Westpac’s Board and management. It also establishes the systems, policies and processes for monitoring and evaluating Board and management performance and the practices for corporate reporting, disclosure, remuneration, risk management and engagement of security holders.
Our approach to corporate governance is based on a set of values and behaviours that underpin our day-to-day activities, provide transparency and fair dealing and seek to protect stakeholder interests. It includes a commitment to maintaining the highest standards of corporate governance, which Westpac sees as fundamental to the sustainability of our business and our performance.
We regularly review local and global developments in corporate governance to assess their implications and to respond to changes in the operating environment. We also improve our systems, processes and policies and look to strengthen our frameworks to reflect changing expectations where appropriate.
We have equity securities quoted on securities exchanges in Australia, New Zealand and the United States.
Australia
The principal listing of Westpac ordinary shares is on the ASX, trading under the code WBC. Westpac also has hybrid securities, capital notes, senior notes and subordinated notes listed on the ASX.
We comply with the ASX Corporate Governance Principles and Recommendations (third edition) (ASXCGC Recommendations) published by the ASX Limited’s Corporate Governance Council (ASXCGC). In addition, we already comply with a number of the recommendations contained in the fourth edition of the ASX Corporate Governance Principles and Recommendations.
We must also comply with the Corporations Act, the Banking Act, including Part IIAA – The Banking Executive Accountability Regime amongst other laws, and, as an Authorised Deposit-taking Institution, with governance requirements prescribed by APRA under Prudential Standard CPS 510 Governance.
This Corporate Governance Statement addresses each of the ASXCGC Recommendations with an explanation of our corporate governance practices, demonstrating our compliance with each Recommendation.
Further details about the ASXCGC Recommendations can be found on the ASX website www.asx.com.au.
New Zealand
Westpac’s ordinary shares are also quoted on the NZX, which is the main board equity security market operated by NZX Limited. Westpac also has subordinated notes quoted on the NZX Debt Market. As an overseas listed issuer in New Zealand, we are deemed to satisfy and comply with the NZX Listing Rules, provided that we remain listed on the ASX and comply with the ASX Listing Rules.
The ASX, through the ASXCGC Recommendations and the NZX, through the NZX Corporate Governance Code, have adopted similar ‘comply or explain’ approaches to corporate governance. The ASXCGC Recommendations may, however, materially differ from the corporate governance rules and the principles of NZX’s Corporate Governance Code.
18 | 2019 Westpac Group Annual Report | |
| | |
Corporate governance
United States
Westpac has American Depositary Shares (ADS) representing its ordinary shares quoted on the New York Stock Exchange (NYSE), trading under the symbol WBK. Under the NYSE Listing Rules, foreign private issuers (like Westpac) are permitted to follow home country practice in respect of corporate governance in lieu of the NYSE Listing Rules. However, we are still required to comply with certain audit committee and additional notification requirements.
We comply in all material respects with all NYSE Listing Rules applicable to us.
Under the NYSE Listing Rules, foreign private issuers are required to disclose any significant ways in which their corporate governance practices differ from those followed by domestic US companies. We have compared our corporate governance practices to the corporate governance requirements of the NYSE Listing Rules and note the significant differences below.
The NYSE Listing Rules require that, subject to limited exceptions, shareholders be given the opportunity to vote on equity compensation plans and material revisions to those plans. In Australia, there are no laws or ASX Listing Rules that require shareholder approval of equity based incentive plans or individual grants under those plans (other than for Directors, including the Chief Executive Officer (CEO)).
Westpac’s employee equity plans have been disclosed in the Remuneration Report in Section 10 of the Directors’ report, which is subject to a non-binding shareholder vote at the Annual General Meeting (AGM) and grants to our CEO are approved by shareholders. The details of grants under our equity-based incentive plans have been disclosed in Note 33 of our financial statements for the year ended 30 September 2019.
The NYSE Listing Rules set out specific requirements for determining whether a director will be regarded as independent. While these requirements are broadly consistent with Westpac’s criteria for independence (described below under ‘Board, Committees and oversight of management’), under Australian independence requirements, the Board is able to apply discretion in its determination of a director’s independence that differs from the NYSE Listing Rules.
The NYSE Listing Rules also provide that the Board Nominations Committee’s responsibilities should include selecting, or recommending that the Board select, the Director nominees for the next annual meeting for shareholders, and overseeing the evaluation of the Board. The Board, rather than the Board Nominations Committee, reviews and recommends the Director nominees for election at the AGM and undertakes an annual review of its performance.
Board and Board Committee Structure
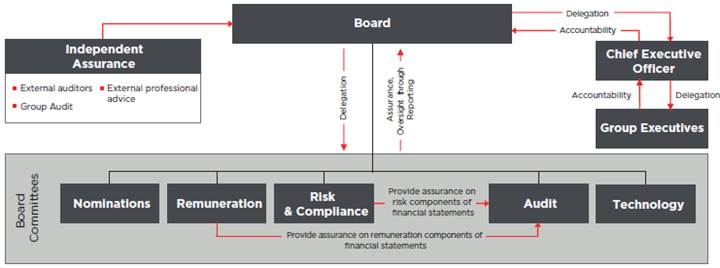
The diagram above shows Westpac’s Board and current Board Committee structure. The structure comprises a Board with five Board Committees that oversee Westpac’s business. The Board’s responsibilities include approving and overseeing the implementation of Westpac’s strategy, approving the Group’s risk management framework, risk management strategy and risk appetite statement, and overseeing the three lines of defence model.
From time to time, the Board may form other Committees or request Directors to undertake specific extra duties. In addition, from time to time, the Board participates (either directly or through representatives) in due diligence committees in relation to strategic decisions and capital and funding activities.
The Board has delegated to the CEO, and through the CEO to the Executive Team, responsibility for the day-to-day management of Westpac’s business.
The key functions of the Board and each of the Board Committees are outlined in this Corporate Governance Statement. All Board Committee Charters are available on our website at www.westpac.com.au/corpgov.
| 2019 Westpac Group Annual Report | 19 |
| | |
Corporate governance
How the Board and Committees work including oversight of management
Board of Directors
Roles and responsibilities
The role of the Board is to provide leadership and strategic guidance for Westpac and its related bodies corporate.
The Board Charter outlines the roles and responsibilities of the Board. Key responsibilities are:
· approving, and overseeing management’s implementation of, the strategic direction of Westpac Group, its business plan and significant corporate strategic initiatives;
· evaluating Board performance and determining Board size and composition;
· approving the Westpac Board Renewal Policy and the Westpac Group Remuneration Policy;
· selecting, appointing and determining the duration, remuneration and other terms of appointment of the CEO and Chief Financial Officer (CFO);
· approving individual remuneration levels for Group Executives, other executives who report directly to the CEO, any other accountable persons under the Banking Executive Accountability Regime, and any other person the Board determines;
· evaluating the performance of the CEO;
· succession planning for the CEO and Group Executives;
· approving the appointment of Group Executives and the General Manager Group Audit and monitoring the performance of Group Executives;
· approving the annual targets and financial statements and monitoring performance against forecast and prior periods;
· determining our dividend policy;
· considering and approving our overall risk management framework, approving our Group Risk Management Strategy and Group Risk Appetite Statement and monitoring the effectiveness of risk management by the Group;
· forming a view of our risk culture and identifying any desirable changes;
· considering the social, ethical and environmental impact of our activities and monitoring compliance with our sustainability policies and practices;
· overseeing and monitoring Workplace Health and Safety (WHS) issues in the Group and considering appropriate WHS reports and information;
· maintaining an ongoing dialogue with Westpac’s external auditor and, where appropriate, principal regulators;
· overseeing internal governance, including delegated authorities and approving policies for appointments to our controlled entity boards; and
· overseeing and monitoring customer complaints.
Governance and conduct focus areas
In addition to the roles and responsibilities outlined in the Board Charter, this year the Board has also focused on addressing the recommendations, observations and findings of Westpac’s Culture, Governance and Accountability (CGA) self-assessment and the Royal Commission into Misconduct in the Banking, Superannuation and Financial Services Industry (Royal Commission). These areas of focus include Board and executive governance, risk and compliance, customer experience, remuneration and accountability and culture.
The Board has continuing oversight over the implementation of both Westpac’s Royal Commission and CGA response plans.
The Board also met with representatives from the Australian Securities and Investments Commission, Australian Prudential Regulation Authority, Australian Transaction Reports and Analysis Centre and the Australian Financial Complaints Authority during the course of the year.
Delegated authority
The Constitution and the Board Charter enable the Board to delegate to Committees and management.
The roles and responsibilities delegated to the Board Committees are captured in the Charters of each of the five established Committees, namely:
· Audit;
· Risk & Compliance;
· Nominations;
· Remuneration; and
· Technology.
The Board Charter, Board Committee Charters and the Constitution are available on our website at www.westpac.com.au/corpgov.
The Delegated Authority Policy Framework outlines principles to govern decision-making within the Westpac Group, including appropriate escalation and reporting to the Board. The scope of, and limitations to, authority delegated by the Board to the CEO and through the CEO to other Group Executives, is clearly documented and covers areas such as operating and capital expenditure, funding and securitisation, and lending. These delegations balance effective oversight with appropriate empowerment and accountability of management. Any matters or transactions outside the delegations of authority given to management are required to be referred to the appropriate Board or relevant Board Committee for approval.
The Executive team, Disclosure Committee and Executive Risk Committee are not Board Committees (that is, they have no delegation of authority from the Board) but sit beneath the CEO and the Board Committees to implement Board-approved strategies, policies and manage risk across the Group.
20 | 2019 Westpac Group Annual Report | |
| | |
Corporate governance
Independence
Together, the Board members have a broad range of relevant financial and other skills and knowledge, combined with the extensive experience necessary to guide our business. Details are set out in Section 1 of the Directors’ report. A skills matrix for the Board appears in this statement.
All of our Non-executive Directors satisfy our criteria for independence, which align with the guidance provided in the ASXCGC Recommendations and the criteria applied by the NYSE and the US Securities and Exchange Commission (SEC).
The Board assesses the independence of our Directors on appointment and annually. Each Director provides an annual attestation of his or her interests and independence.
Directors are considered independent if they are independent of management and free from any business or other relationship that could materially interfere with, or reasonably be perceived to materially interfere with, the exercise of their unfettered and independent judgement. Materiality is assessed on a case by case basis by reference to each Director’s individual circumstances rather than by applying general materiality thresholds.
Each Director is expected to disclose any business or other relationship that he or she has directly, or as a partner, shareholder or officer of a company or other entity that has an interest in Westpac or a related entity. The Board considers information about any such interests or relationships, including any related financial or other details, when it assesses the Director’s independence.
Size and membership of Board Committees as at 30 September 2019
Committee Composition1 | | | | | | |
Name of Committee | | Board Audit
Committee | Board Risk &
Compliance
Committee | Board Nominations
Committee | Board Remuneration
Committee | Board Technology
Committee |
Number of Members | | Minimum three
members | Minimum three
members | Composed of all
Board Committee
Chairs, Board
Chairman and such
other members as
determined by the
Board | Minimum three
members | Minimum three
members |
Composition | | All members are
Independent Non-
executive Directors | All members are
Non-executive
Directors Majority of members
are Independent
Non-executive
Directors | All members are
Independent Non-
executive Directors | All members are
Independent Non-
executive Directors | Maximum one
Executive Director All other members
are Independent
Non-executive
Directors |
Committee Chair | | Chair is Independent
Non-executive
Director, who is not
the Board Chairman | Chair is Independent
Director, who is not
the Board Chairman | Chair determined by
the Board | Chair determined by
the Board | Chair determined by
the Board |
Lindsay Maxsted | Chairman, | | | | | |
Non-executive, | | | Chair | | |
Independent | ü | ü | ü | | |
Brian Hartzer | CEO, | | | | | |
Executive | | | | | ü |
Nerida Caesar | Non-executive, | | | | | |
Independent | | ü | | | ü |
Ewen Crouch | Non-executive, | | Chair | | | |
Independent | ü | ü | ü | ü | |
Alison Deans | Non-executive, | | | | | Chair |
Independent | | ü | ü | ü | ü |
Craig Dunn | Non-executive, | | | | Chair | |
Independent | | ü | ü | ü | |
Anita Fung | Non-executive, | | | | | |
Independent | | ü | | | |
Steven Harker2 | Non-executive, | | | | | |
Independent | | ü | | | |
Peter Marriott | Non-executive, | Chair | | | | |
Independent | ü | ü | ü | | ü |
Peter Nash | Non-executive, | | | | | |
Independent | ü | ü | | | |
Margaret Seale3 | Non-executive, | | | | | |
Independent | | ü | | | |
1. Composition requirements for each Committee are set out in the relevant Committee Charter.
2. Steven Harker was appointed as a Member of the Board Audit Committee effective from 1 October 2019.
3. Margaret Seale was appointed as a Member of the Board Remuneration Committee effective from 1 October 2019.
| 2019 Westpac Group Annual Report | 21 |
| | |
Corporate governance
Chairman
The Board elects one of the independent Non-executive Directors as Chairman. Our Chairman is Lindsay Maxsted, who became Chairman on 14 December 2011. The Chairman’s role includes:
· providing effective leadership to the Board in relation to all Board matters;
· guiding the agenda and conducting all Board meetings to facilitate discussions, challenge and decision-making;
· in conjunction with the Company Secretaries, arranging regular Board meetings throughout the year, confirming that minutes of meetings accurately record decisions taken and, where appropriate, the views of individual Directors;
· overseeing the process for appraising Directors and the Board as a whole;
· overseeing Board succession;
· acting as a conduit between management and the Board, and being the primary point of communication between the Board and CEO;
· representing the views of the Board to the public; and
· taking a leading role in creating and maintaining an effective corporate governance system.
CEO
Our CEO is Brian Hartzer. The CEO’s role includes:
· leadership of the management team;
· developing strategic objectives for the business and achievement of planned results; and
· the day-to-day management of the Westpac Group’s operations, subject to the specified delegations of authority approved by the Board.
Board meetings
The Board had 11 scheduled meetings for the financial year ended 30 September 2019, with additional meetings held as required. In addition to the Board considering strategic matters at each Board meeting, the Board also discusses our strategic plan and approves our overall strategic direction on an annual basis. The Board also conducts a half year review of our strategy. The Board conducts workshops on specific subjects relevant to our business and the Board throughout the year. Board meetings are characterised by robust exchanges of views between Board and management, with Directors bringing their experience and independent judgement to bear on the issues and decisions.
Non-executive Directors regularly meet without management present, so that they can discuss issues appropriate to such a forum. In all other respects, senior executives are invited, where considered appropriate, to participate in Board meetings. They are also available to be contacted by Directors between meetings.
Meetings attended by Directors for the financial year ended 30 September 2019 are reported in Section 9 of the Directors’ report.
Nomination and appointment
As set out in its Charter, key responsibilities of the Board Nominations Committee are:
· assessing the skills required to discharge competently the Board’s duties having regard to Westpac’s performance, financial position and strategic direction;
· developing, reviewing, assessing and recommending to the Board policies on Director tenure, Board composition and size;
· reviewing and making recommendations to the Board annually on diversity generally within the Group, measurable objectives for achieving diversity and progress in achieving those objectives;
· developing and implementing succession planning for Non-executive Directors;
· reviewing the process for the orientation and education of new Directors and any continuing education for existing Directors;
· reviewing eligibility criteria for appointing Directors;
· considering and recommending candidates for appointment as Directors to the Board and determining the terms and conditions (excluding remuneration) on which Non-executive Directors are appointed and hold office;
· considering and recommending candidates for appointment to the Boards of significant subsidiaries (including Westpac New Zealand Limited and our insurance and superannuation businesses); and
· reviewing and where necessary, developing the Group’s corporate governance policies to provide reasonable assurance that they meet international corporate governance standards.
Board skills, experience and attributes
Westpac seeks to maintain a Board of Directors with a broad range of financial and other skills, experience and knowledge necessary to guide the business of the Group. In addition, Westpac seeks to maintain a diverse Board, which at a minimum, collectively has the skills and experience detailed in Figure 1 overleaf. Figure 1 also illustrates Board tenure and gender diversity.
22 | 2019 Westpac Group Annual Report | |
| | |
Corporate governance
Figure 1 – Board skills, experience and attributes as at 30 September 2019
| | | |
| | Number of Directors | |
STRATEGIC AND COMMERCIAL ACUMEN | | 11 out of 11 | |
An ability to define strategic objectives, constructively question business plans and implement strategy using commercial judgement | | |
| | | |
| | | |
| | | |
FINANCIAL SERVICES EXPERIENCE | | 9 out of 11 | | |
Experience working in, or advising the banking and financial services industry (including wealth management), with strong knowledge of its economic drivers and global business perspectives | | |
| | | |
| | | |
| | | |
FINANCIAL ACUMEN | | 9 out of 11 | | |
Highly proficient in accounting or related financial management and reporting for businesses of significant size | | |
| | | |
| | | |
| | | |
RISK | | 9 out of 11 | | |
Experience in anticipating, recognising and managing risks, including regulatory, financial and non-financial risks, and monitoring risk management frameworks and controls | | |
| | | |
| | | |
| | | |
TECHNOLOGY | | 7 out of 11 | | |
Experience in developing or overseeing the application of technology in large complex businesses, with particular reference to innovation and the Group’s digital transformation strategic priority | | |
| | | |
| | | |
| | | |
GOVERNANCE | | 11 out of 11 | |
Commitment to, and knowledge of, governance, environmental and social issues, with particular reference to the legal, compliance, regulatory and voluntary frameworks applicable to listed entities and highly regulated industries | | |
| | | |
| | | |
| | | |
PEOPLE, CULTURE AND CONDUCT | | 10 out of 11 | | |
Experience in people matters including workplace cultures, morale, management development, succession and remuneration, with particular reference to the Group’s talent retention and development initiatives and the ability to consider and respond to matters relating to inclusion and diversity | | |
| | | |
| | | |
| | | |
EXECUTIVE LEADERSHIP | | 10 out of 11 | | |
Being appointed as CEO or a similar senior leadership role in a large complex organisation, and having experience in that position in managing the business through periods of significant change | | |
| | | |
| | | |
| | | |
LISTED COMPANY EXPERIENCE | | 8 out of 11 | | |
Held two or more Non-executive Directorships on Australian or international listed companies | | |
| | | |
| | | |
| | | |
INTERNATIONAL | | 7 out of 11 | | |
Senior leadership experience involving responsibility for operations across borders, and exposure to a range of political, cultural, regulatory and business environments in that position | | |
| | | |
| | | |
| | | |
CUSTOMER FOCUS | | 7 out of 11 | | |
Experience in developing and overseeing the embedding of a strong customer-focused culture in large complex organisations, and a demonstrable commitment to achieving customer outcomes | | |
| | | |
| | | | | | | |
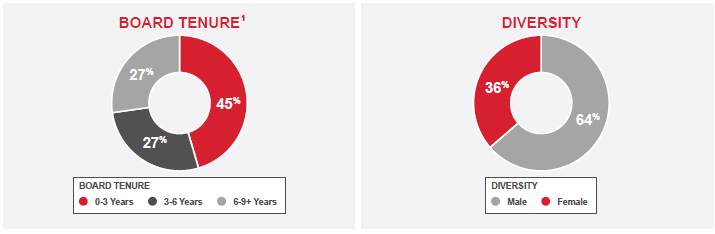
1. Chart does not add to 100% due to rounding.
| 2019 Westpac Group Annual Report | 23 |
| | |
Corporate governance
The Board Nominations Committee considers and makes recommendations to the Board on candidates for appointment as Directors. Such recommendations pay particular attention to the mix of skills, experience, expertise, diversity, independence and other qualities of existing Directors, and how the candidate’s attributes will balance and complement those qualities and address any potential skills gaps in relation to the current composition of the Board. External consultants are used to access a wide base of potential Directors.
Board appointments are also made with regard to the Group’s Service Revolution vision and three strategic priorities of:
· building our customer franchise;
· digital transformation; and
· strengthening performance disciplines.1
Prior to a Director’s appointment or consideration for election or re-election by shareholders, Westpac conducts due diligence and provides shareholders with all material information relevant to a decision on whether or not to elect or re-elect a Director.
New Directors receive an induction pack which includes a letter of appointment setting out the expectations of the role, conditions of appointment including the expected term of appointment, and remuneration. This letter conforms to the ASXCGC Recommendations.
Term of office
The Board may appoint a new Director, either to fill a casual vacancy or as an addition to the existing Directors, provided the total number of Directors does not exceed fifteen Non-executive Directors and three Executive Directors. Except for the CEO, a Director appointed by the Board holds office only until the close of the next AGM but is eligible for election by shareholders at that meeting.
Our Constitution states that at each AGM, one-third of eligible Directors, and any other Director who has held office for three or more years since their last election, must retire. In determining the number of Directors to retire by rotation, no account is to be taken of Directors holding casual vacancy positions or of the CEO. The Directors to retire by rotation are those who have been the longest in office. A retiring Director holds office until the conclusion of the meeting at which he or she retires but is eligible for re-election by shareholders at that meeting. The Board makes recommendations concerning the election or re-election of any Director by shareholders. In considering whether to support a candidate, the Board takes into account the results of the Board performance evaluation conducted during the year.
The Westpac Board Renewal Policy limits the maximum tenure of office that any Non-executive Director other than the Chairman may serve to nine years, from the date of first election by shareholders. The maximum tenure for the Chairman is twelve years (inclusive of any term as a Director prior to being elected as Chairman), from the date of first election by shareholders. The Board, on its initiative and on an exceptional basis, may exercise discretion to extend the maximum terms specified above where it considers that such an
extension would benefit the Group. Such discretion will be exercised on an annual basis and the Director concerned will be required to stand for re-election annually.
Director induction and continuing education
All new Directors participate in an induction program to familiarise themselves with our business and strategy, culture and values and any current issues before the Board. The induction program includes meetings with the Chairman, the CEO, the Board Committee Chairs and each Group Executive.
The Board encourages Directors to undertake continuing education and training to develop and maintain the skills and knowledge needed to perform their role as Directors effectively, including by participating in workshops held throughout the year, attending relevant site visits and undertaking relevant external education.
Access to information and advice
All Directors have unrestricted access to company records and information, and receive regular detailed financial and operational reports from senior management. Each Director also enters into an access and indemnity agreement, which among other things, provides for access to documents for up to seven years after his or her retirement as a Director.
The Chairman and other Non-executive Directors regularly consult with the CEO, CFO and other senior executives, and may consult with, and request additional information from, any of our employees.
All Directors have access to advice from senior internal legal advisors including the Group Executive, Legal & Secretariat.
In addition, the Board collectively, and all Directors individually, have the right to seek independent professional advice, at our expense, to help them carry out their responsibilities. While the Chairman’s prior approval is needed, it may not be unreasonably withheld.
Company Secretaries
Westpac has two Company Secretaries:
· The Senior Company Secretary is our Group Executive, Legal & Secretariat. The Senior Company Secretary attends Board and Board Committee meetings and is responsible for providing Directors with advice on legal and corporate governance issues.
· The Group Company Secretary also attends Board and Board Committee meetings and is responsible for the operation of the secretariat function, including advising the Board on governance and, in conjunction with management, giving practical effect to the Board’s decisions. The Group Company Secretary is accountable to the Board, through the Chairman, on all matters to do with the proper functioning of the Board.
Profiles of our Company Secretaries for the financial year ended 30 September 2019 are set out in Section 1 of the Directors’ report.
1. For further information about the Service Revolution and our strategic priorities please refer to Section 3 in the Directors’ Report.
24 | 2019 Westpac Group Annual Report | |
| | |
Corporate governance
Board Committees
Composition and independence
Board Committee members are chosen for the skills and experience they can contribute to the respective Board Committees and their qualifications are set out in Section 1 of the Directors’ report. The membership of each Board Committee is set out in the table entitled ‘Size and membership of Board Committees as at 30 September 2019’ in this Corporate Governance Statement. All of the Board Committees are comprised of independent Non-executive Directors, except for the Board Technology Committee, of which the CEO is a member.
Operation and reporting
Scheduled meetings of the Board Committees occur at least quarterly. Each member’s attendance at Board Committee meetings held during the financial year ended 30 September 2019 is reported in Section 9 of the Directors’ report. All Board Committees are able to meet more frequently as necessary. Each Board Committee is entitled to the resources and information it requires and has direct access to our employees and advisers. The CEO attends all Board Committee meetings, except where he has a material personal interest in a matter being considered. Senior executives and other selected employees are invited to attend Board Committee meetings as required. All Directors can receive all Board Committee papers and can attend any Board Committee meeting, provided there is no conflict of interest.
Performance
Board, Board Committees and Directors
The Board undertakes ongoing self-assessment as well as commissioning an annual performance review by an independent consultant.
The review process conducted in 2019 included an assessment of the performance of the Board, the Board Committees and each Director, with outputs collected, analysed and presented to the Board. The Board discussed the results and agreed follow up actions on matters relating to Board composition, process, priorities and continuing education.
The Chairman also discusses the results with individual Directors and Board Committee Chairs. The full Board (excluding the Chairman) reviews the results of the performance review of the Chairman and results are then privately discussed by the Chairman of the Board Risk & Compliance Committee with the Chairman.
Management
The Board, in conjunction with its Board Remuneration Committee, is responsible for:
· determining the goals and objectives relevant to the remuneration of the CEO, and the performance of the CEO in light of these goals and objectives; and
· approving individual remuneration for Group Executives, other executives who report directly to the CEO, any other accountable persons under the Banking Executive Accountability Regime, and any other person the Board determines.
The Board Risk & Compliance Committee and the Board Audit Committee also refer to the Board Remuneration Committee any matters that come to their attention that are relevant, including with respect to risk adjusted remuneration.
Management performance evaluations for the financial year ended 30 September 2019 were conducted following the end of the financial year.
There is a further discussion on performance objectives and performance achieved in the Remuneration Report in Section 10 of the Directors’ report.
All new senior executives receive a letter of appointment setting out the conditions and expectations of the role, together with an extensive briefing on our strategies and operations and the respective roles and responsibilities of the Board and senior management.
Advisory Boards
Westpac has established Advisory Boards for its operations in Asia, the Pacific, Victoria and for BankSA, to advise management on the strategies and initiatives of those businesses within the overall Group strategy.
Responsibilities of the Advisory Boards include:
· providing advice to management on management’s strategies and initiatives to continue to strengthen the position and identity of the business;
· providing advice to management of the relevant business so as to promote and preserve its distinct position and identity and align business values with those of the relevant communities served;
· considering and assessing reports provided by management on the health of the relevant business;
· acting as ambassadors for the business, including by supporting community and major corporate promotional events to assist in building relationships with the bank’s customers, local communities and the business and government sector, and advising senior management on community matters relevant to the provision of financial services in the community it serves; and
· alerting management to local market opportunities and issues of which Advisory Board members are aware that would enhance the provision of services to customers and potential customers and the position of the bank in its local communities.
Ethical and responsible decision-making
At Westpac, our vision is to become one of the world’s great service companies, helping our customers, communities and people to prosper and grow. One of the ways we seek to achieve this vision is through our core values.
Westpac is also focused on the impact of its organisational culture on the Group’s operations, including its management of risk. We take an integrated approach to sustainably embedding a strong risk culture, including through leadership and communication, risk appetite and governance, risk awareness and transparency, accountability and reinforcement, and behaviours and relationships.
| 2019 Westpac Group Annual Report | 25 |
| | |
Corporate governance
Our Values
Our Values support our customer-focused strategy and are embedded in our culture. These are:
· integrity – we earn trust by demonstrating the highest standards of honesty and ethical behaviour;
· service – we are here to help and delight our customers;
· one team – we collaborate to deliver the best outcomes for our customers and the company overall;
· courage – we challenge the status quo and find a way to make things better; and
· achievement – we strive for excellence and deliver results.
Our values guide our behaviour and reflect our commitment to our customers, communities and each other.
Our Compass
Our Compass helps us navigate the world of banking, capturing Our Vision, Values, Behaviours and the non- negotiables of our Code of Conduct, to consistently guide us in everything we do.
Together the four points of the Compass provide direction and support by guiding our behaviour and outlining where to turn if we need help:
· Our Vision – why we are here
· Our Values – how we behave
· Our Service Promise – how we serve
· Our Code of Conduct – how we deliver
Code of Conduct and Principles for Doing Business
Our Code of Conduct (Code) describes the standards of conduct expected of our people, both employees and contractors. The seven principles making up the Code are:
· we act with honesty, integrity, and due skill, care and diligence;
· we comply with laws and with our policies;
· we do the right thing by our customers;
· we respect confidentiality and do not misuse information;
· we value and maintain our professionalism;
· we work as a team; and
· we manage conflicts of interest responsibly.
The Code’s guiding principles help us make the right decisions, ensuring we uphold the reputation of the Group. As employees of the banking and finance industry, we are also committed to creating greater accountability, transparency and trust with our customers and the broader community. With that in mind, the principles within our Code also reflect the community’s expectations of us, such as those outlined in the Banking and Finance Oath. The Code has the full support of the Board and the Executive Team and we take compliance with the Code very seriously.
Our commitment to sustainable business practice and behaviours against which we expect to be judged in pursuit of our vision to be one of the world’s great service companies, helping our customers, communities and people to prosper and grow, is set out in our Principles for Doing Business (Principles).
The Principles apply to all Directors, employees and contractors.
We also have the frameworks in place which apply to support both our Code and Principles, internally and externally across our value chain, including:
· a range of internal guidelines, policies, frameworks, communications and training processes and tools, including an online learning module entitled ‘Doing the Right Thing’; and
· a range of externally-facing codes, frameworks, operating principles, policies, and position statements, addressing issues such as human rights, climate change and the environment.
The Principles are available on our website.
Key policies
We have a number of key policies to manage our regulatory compliance and human resource requirements. We also subscribe to a range of external industry codes, such as the Banking Code of Practice and the ePayments Code.
Code of Ethics for Senior Finance Officers
The Code of Accounting Practice and Financial Reporting complements our own Code. The Code of Accounting Practice and Financial Reporting is designed to assist our CEO, CFO and other principal financial officers in applying the highest ethical standards to the performance of their duties and responsibilities with respect to accounting practice and financial reporting by requiring those officers to:
· act honestly and ethically, particularly with respect to conflicts of interest;
· provide full, fair, accurate and timely disclosure in reporting and other communications;
· comply with applicable laws, rules and regulations;
· promptly report violations of the Code of Accounting Practice and Financial Reporting; and
· be accountable for adherence to the Code of Accounting Practice and Financial Reporting.
The Code of Accounting Practice and Financial Reporting is available on our website at www.westpac.com.au/corpgov.
Conflicts of interest
The Group has a detailed conflicts of interest framework, which includes a Group policy supported by specific divisional policies and guidelines aimed at identifying and managing actual, potential or apparent conflicts of interest.
The conflicts of interest framework includes a separate Westpac Group Gifts and Hospitality Policy. This Policy provides employees with guidance to manage their obligations relating to the giving and receiving of gifts or hospitality.
The Board
All Directors are required to disclose any actual, potential or apparent conflicts of interest upon appointment and are required to keep these disclosures to the Board up to date.
Any Director with a material personal interest in a matter being considered by the Board must declare their interest and, unless the Board resolves otherwise, may not be present during the boardroom discussions or vote on the relevant matter.
26 | 2019 Westpac Group Annual Report | |
| | |
Corporate governance
Our employees and contractors
We expect our employees and contractors to:
· have in place adequate arrangements for the management of actual, potential or apparent conflicts of interest;
· obtain consent from senior management before accepting a directorship on the board of a non-Westpac Group company;
· disclose any material interests they have with our customers or suppliers to their manager and not be involved with customer relationships where they have such an interest;
· not participate in business activities outside their employment with us (whether as a principal, partner, director, agent, guarantor, investor or employee) without approval or when it could adversely affect their ability to carry out their duties and responsibilities; and
· not solicit, provide facilitation payments, accept or offer money, gifts, favours or entertainment that might influence, or might appear to influence, their business judgement.
Fit and Proper Person assessments
We have a Board-approved Westpac Group Fit and Proper Policy that meets the requirements of the related APRA Prudential Standards and covers the requirements of Part IIAA of the Banking Act 1959 – The Banking Executive Accountability Regime, which applies to ADIs and their subsidiaries. In accordance with that Policy, we assess the fitness and propriety of our Directors and also of individuals who perform specified statutory roles required by APRA Prudential Standards or ASIC licensing requirements. The Chairman of the Board (and in the case of the Chairman, the Board) is responsible for assessing the Directors and Non- executive Directors of the Westpac and subsidiary Boards, Group Executives, external auditors and actuaries. A Fit and Proper Committee is responsible under delegated authority of the Westpac Board for undertaking fit and proper assessments of all other employees who hold statutory roles. In all cases, the individual is asked to provide a detailed declaration and background checks are completed.
Concern reporting and whistleblower protection
Under the Westpac Group Speaking Up Policy, we encourage our employees, contractors, secondees, former employees, brokers, service providers (such as auditors, accountants and consultants) and our suppliers to raise any concerns about our activities or behaviours that may be unlawful or unethical. Our attitude is ‘when in doubt report’ and our senior management are committed to protecting the dignity, well-being, career and good name of anyone reporting wrongdoing, as well as providing them with the necessary support. Westpac does not tolerate retaliation or adverse action related to a whistleblowing disclosure.
The Speaking Up Policy sets out how someone can raise a concern using the whistleblowing channels, including our concern reporting system ‘Concern Online’ and our Whistleblower Hotline. Both channels enable reporting on an anonymous basis. Concerns may include suspected breaches of our Code, Westpac policies or regulatory requirements.
When a whistleblower raises a concern they may choose to involve the Whistleblower Protection Officer, who is responsible for protecting the whistleblower against personal disadvantage as a result of making a report.
We investigate reported concerns in a manner that is confidential, fair and objective. If the investigation shows that wrongdoing has occurred, we are committed to changing our processes and taking action in relation to those parties who have behaved incorrectly. Outcomes may also involve reporting the matter to relevant authorities and regulators.
Relevant Board Committees are charged with overseeing Westpac’s whistleblower program and the Westpac Group Executive Risk Committee is provided with quarterly reporting on whistleblowing. These reports include a number of metrics, including statistics about concerns raised.
Westpac’s Speaking Up Policy is available on our website at https://www.westpac.com.au/about- westpac/westpac-group/corporate-governance/ principles-policies/.
Securities trading
Under the Westpac Group Securities Trading Policy, Directors, employees, secondees and contractors are prohibited from dealing in any securities and other financial products if they possess inside information. They are also prohibited from passing on inside information to others who may use that information to trade in securities. In addition, Directors and any employees, secondees or contractors (and their ‘associates’) who, because of their seniority or the nature of their position, may have access to material non-public information about Westpac (known as Prescribed Employees) are subject to further restrictions, including prohibitions on trading prior to and immediately following annual and half year results announcements.
We manage and monitor these obligations through:
· the insider trading provisions of our Policy, which prohibit any dealing in any securities where a Director or employee has access to inside information that may affect the price of those securities;
· restrictions limiting the periods in which the Directors and Prescribed Employees can trade in Westpac securities and other Westpac financial products (Blackout Periods);
· a prohibition on short-selling Westpac securities by Directors and Prescribed Employees;
· requiring Directors and Prescribed Employees to either obtain approval or notify their intention to trade outside Blackout Periods and confirm that they have no inside information;
· monitoring the trading of Westpac securities by Directors and Prescribed Employees;
· maintaining a register of Prescribed Employees, which is regularly updated;
· notifying ASX of trades of Westpac securities by Directors of Westpac as required under the ASX Listing Rules; and
· forbidding employees from entering into hedging arrangements in relation to their unvested employee shares or securities, whether directly or indirectly.
The Westpac Group Securities Trading Policy is available in the Corporate Governance section of our website.
| 2019 Westpac Group Annual Report | 27 |
| | |
Corporate governance
Customer Advocate
Westpac’s Customer Advocate provides an avenue of escalated review for complaints outcomes in relation to personal and small business customers, which is separate to our standard internal dispute resolution processes. The Customer Advocate has the power to review and make independent and binding decisions about these complaints, where customers are not satisfied with the outcome of the internal dispute resolution process.
Further details on our Customer Advocate are available on our website.
Anti-Bribery and Corruption
The Westpac Group has an Anti-Bribery and Corruption (ABC) Policy, an ABC Standard, and bribery prevention procedures and systems. They comprise the Westpac ABC Framework.
Westpac has zero tolerance for any form of bribery and corruption. This includes a ban on facilitation payments.
Westpac is committed to preventing, detecting and deterring bribery and corruption by managing its bribery and corruption risk and complying with relevant ABC legislation in all jurisdictions in which it operates, not simply because it is required to, but it is the right thing to do. This includes compliance with the Australian Criminal Code Act 1995, the UK Bribery Act 2010 and the US Foreign Corrupt Practices Act 1977.
Under the ABC Policy, Westpac expects that its officers, employees, agents, contractors, subsidiaries and third parties acting for or on behalf of Westpac will comply with all applicable ABC laws and will not offer, provide, authorise, request or receive a bribe or anything which may be viewed as a bribe.
Westpac is also required to design and maintain a system of internal controls, keep accurate books and records and put in place adequate procedures to prevent bribery, which are set out in the Westpac ABC Framework.
Slavery and Human Trafficking
Westpac publishes its Slavery and Human Trafficking Statement in accordance with the Transparency in Supply Chains provision (section 54) of the UK’s Modern Slavery Act 2015 on an annual basis. The statement outlines the Group’s commitment to sustainable business practices and advancing human rights, and the steps we have taken to prevent modern slavery in our business and supply chains globally during the financial year.
The statement is available on our website.
Diversity
Westpac has an Inclusion & Diversity Policy that sets out the inclusion and diversity initiatives for the Group. This is coupled with a comprehensive Inclusion & Diversity strategy to help deliver on our key priorities and actions. In this context, diversity covers both the visible and invisible differences that make our employees unique, whether that be gender, gender identity, age, ethnicity, accessibility requirements, cultural background, sexual orientation or religious beliefs, or the differences we have based on our experiences, insights and perspectives.
The objectives of the policy and the 2018-20 Inclusion & Diversity strategy are to ensure that the Group:
· has a workforce profile that delivers competitive advantage through the ability to garner a deep understanding of customer needs;
· has a truly inclusive workplace where every individual can shine regardless of gender, cultural identity, age, work style or approach; and
· leverages the value of diversity for all our stakeholders to deliver the best customer experience, improved financial performance and a stronger corporate reputation.
To achieve these objectives, the Group:
· has set Board-determined, measurable objectives for achieving gender diversity. The Board assesses annually both the objectives and progress in achieving them;
· assesses pay equity on an annual basis;
· encourages and supports the application of flexibility policies across the business;
· is committed to proactively assisting Aboriginal and Torres Strait Islander Australians wishing to access employment across our brands;
· implements our Accessibility Action Plan for employees and customers with accessibility requirements, including ensuring employment opportunities are accessible for people with a disability; and
· actively promotes an environment of inclusion for lesbian, gay, bisexual, transgender, intersex and queer (LGBTIQ+) employees.
The implementation of these objectives is overseen by the Westpac Group Inclusion & Diversity Council, which is chaired by the CEO and meets bi-annually.
The Board, or an appropriate Board Committee, receives regular updates from the Inclusion & Diversity Council on inclusion and diversity initiatives.
The creation of the Inclusion & Diversity Governance Framework has resulted in the establishment of:
· Inclusion & Diversity Business Unit Councils, chaired by the relevant Group Executive of that business unit; and
· the Inclusion & Diversity Working Group, consisting of appointed general manager representatives across each business unit and chaired by the Head of Inclusion & Diversity.
We continue to listen to the needs of our employees through our employee action groups and our periodic employee survey (which includes questions that constitute an ‘Inclusion Index’).
Our Inclusive Leadership program ensures we are investing in the right capabilities for an inclusive culture. The majority of senior leaders and Group Executives have already completed the program and our focus is now on completion by our broader people leader group.
In October 2010, the Board set an objective to increase the proportion of women in leadership roles (over 5,000 leaders from our Executive Team through to our bank managers) from 33% to 40% by 2014, which was achieved in September 2012, two years ahead of schedule. Since November 2017, Westpac has maintained 50% women in leadership roles. We continue focussing our efforts on maintaining this equality.
28 | 2019 Westpac Group Annual Report | |
| | |
Corporate governance
At 30 September 2019, the proportion of women employed by the Group was as follows:
· Board of Directors: 36%;
· leadership1 roles: 50%; and
· total Westpac workforce: 58%.
In addition to the Group’s commitment to achieving its targets, in 2015 our CEO signed up as a Pay Equity Ambassador through the Workplace Gender Equality Agency.
Westpac offers a range of flexible working options for our people based on their needs, work preferences and the needs of the business. These include:
· flexible work hours;
· mobile working;
· working part-time; and
· job sharing.
In addition, Westpac offers a variety of leave options that support flexibility, including parental leave, wellbeing and lifestyle leave and domestic violence support leave. In 2018 Westpac introduced new policies on Gender Transition leave, ‘Sorry Business’ Indigenous bereavement leave and extended Domestic and Family Violence leave.
Sustainability
We view sustainable and responsible business practices as important for our business and shareholder value. Sustainability is about managing risks and opportunities in a way that best balances the long term needs of all our stakeholders – our customers, employees, suppliers, investors and community partners – as well as the wider community and the environment at large.
Our management of sustainability aims to address the matters that we believe are the most material for our business and stakeholders, now and in the future. We also understand that this is an evolving agenda and seek to progressively embed the management of sustainability matters into business practice, while also anticipating and shaping emerging social issues where we have the skills and experience to make a meaningful difference and drive business value.
Reporting
We report on the most material sustainability matters to Westpac, details of how we manage the associated risks and opportunities and our performance against our sustainability strategy in the Annual Review and Sustainability Report, this Annual Report, the Sustainability Performance Report and the full year and half year ASX results.
Our sustainability reporting is subject to independent limited assurance, performed in accordance with the Australian Standard on Assurance Engagements 3000 Assurance Engagements Other Than Audits or Reviews of Historical Financial Information (Revised) (‘ASAE 3000’). The assurance provider also assesses whether our sustainability reporting is prepared in accordance with AA1000 AccountAbility Principles Standard (2008) and the GRI Standards.
Financial reporting
Approach to financial reporting
Our approach to financial reporting reflects three core principles:
· that our financial reports present a true and fair view;
· that our accounting methods comply with applicable accounting standards and policies; and
· that our external auditor is independent and serves security holders’ interests.
The Board, through the Board Audit Committee, monitors Australian and international developments relevant to these principles, and reviews our practices accordingly.
The Board delegates oversight responsibility for the integrity of financial statements and financial reporting systems to the Board Audit Committee. The Board Risk & Compliance Committee provide periodic assurances and reports (as appropriate) to the Board Audit Committee. Similarly, the Board delegates oversight responsibility for the preparation of remuneration reports and disclosures to the Board Remuneration Committee, who recommend and provide relevant assurances through the Board Audit Committee to the Board for approval.
Board Audit Committee
As set out in its charter, key responsibilities of the Board Audit Committee are:
· overseeing the integrity of the financial statements and financial reporting systems of Westpac and its related bodies corporate;
· overseeing the external audit engagement, including the external auditor’s qualifications, performance, independence and fees;
· overseeing the performance of the internal audit function;
· overseeing the integrity of the Group’s corporate reporting, including the Group’s financial reporting and compliance with prudential regulatory reporting and professional accounting requirements; and
· reviewing and approving policies and procedures for the receipt, retention and treatment of information submitted confidentially by employees and third parties about accounting, internal control, compliance, audit or other matters about which an employee has concerns, and monitoring employee awareness of these policies and procedures.
The Board Audit Committee reviews, discusses with management and the external auditor, and assesses:
· any significant financial reporting issues and judgements made in connection with the preparation of the financial reports;
· the processes used to monitor and comply with laws and regulations over financial information, reporting and disclosure; and
· the process surrounding the disclosures made by the CEO and CFO in connection with their personal certifications of the Group’s half year and full year financial statements.
1. Women in Leadership refers to the proportion of women (permanent and maximum term) in leadership roles across the Group. It includes the CEO, Group Executives, General Managers, senior leaders with significant influence on business outcomes (direct reports to General Managers and their direct reports), large (3+) team people leaders three levels below General Manager, and Bank and Assistant Bank Managers.
| 2019 Westpac Group Annual Report | 29 |
| | |
Corporate governance
In addition, the Board Audit Committee maintains an ongoing dialogue with management, the external auditor and Group Audit, including regarding those matters that are likely to be designated as Critical Audit Matters in the external auditor’s report. Critical Audit Matters are those matters which, in the opinion of the external auditor, are of the most significance in their audit of the financial report.
As part of its oversight responsibilities, the Board Audit Committee also conducts discussions with a wide range of internal and external stakeholders including:
· the external auditor, about our major financial reporting risk exposures and the steps management has taken to monitor and control such exposures;
· Group Audit and the external auditor concerning their audits and any significant findings, and the adequacy of management’s responses;
· management and the external auditor concerning the half year and full year financial statements;
· management and the external auditor regarding any correspondence with regulators or government agencies, and any published reports which raise material issues or could impact on matters regarding the Westpac Group’s financial statements or accounting policies; and
· the Group Executive, Legal & Secretariat regarding any legal matters that may have a material impact on, or require disclosure in, the financial statements.
Periodically, the Board Audit Committee consults with the external auditor without the presence of management about internal controls over financial information, reporting and disclosure and the fullness and accuracy of the Group’s financial statements. The Board Audit Committee also meets with the General Manager Group Audit without other members of management being present.
The Board Audit Committee also refers to the Board or any other Board Committees any matters that come to the attention of the Board Audit Committee that are relevant for the Board or the respective Board Committees.
Financial knowledge
The Board Audit Committee comprises five independent, Non-executive Directors and is chaired by Peter Marriott.
All Board Audit Committee members have appropriate financial experience, an understanding of the financial services industry and satisfy the independence requirements under the ASXCGC Recommendations, the United States Securities Exchange Act of 1934 (as amended) and its related rules, and the NYSE Listing Rules.
The Board has determined that Mr Marriott is an ‘audit committee financial expert’ and independent in accordance with US securities law.
The designation of Mr Marriott as an audit committee financial expert does not impose duties, obligations or liability on him that are greater than those imposed on him as a Board Audit Committee member, and does not affect the duties, obligations or liability of any other Board Audit Committee member or Board member.
Audit committee financial experts are not deemed as an ‘expert’ for any other purpose.
CEO and CFO assurance
The Board receives regular reports from management about our financial condition and operational results, as well as that of our controlled entities. Before the Board approves the financial statements for a financial period, the CEO and the CFO provide formal statements to the Board, and have done so for the financial year ended 30 September 2019, that state that in all material respects:
· Westpac’s financial records have been properly maintained in that they:
– correctly record and explain its transactions, and financial position and performance;
– enable true and fair financial statements to be prepared and audited; and
– are retained for seven years after the transactions covered by the records are completed;
· the financial statements and notes comply with the appropriate accounting standards;
· the financial statements and notes give a true and fair view of Westpac’s and its consolidated entities’ financial position and of their performance;
· any other matters that are prescribed by the Corporations Act and regulations as they relate to the financial statements and notes are satisfied; and
· the declarations provided in accordance with section 295A of the Corporations Act are founded on a sound system of risk management and internal control, and that the system is operating effectively in all material respects in relation to financial reporting risks.
External auditor
The role of the external auditor is to provide an independent opinion that our financial reports are true and fair, and comply with applicable regulations.
Our external auditor is PricewaterhouseCoopers (PwC), appointed by shareholders at the 2002 Annual General Meeting (AGM). Prior to 2002, individuals who were partners of PwC or its antecedent Firms were our external auditors from 1968. Our PwC lead audit partner is Lona Mathis and the quality review partner is Wayne Andrews. Ms Mathis and Mr Andrews assumed responsibility for these roles in June 2017 and January 2015, respectively.
The external auditor receives all Board Audit Committee, Board Risk & Compliance Committee and Board Technology Committee papers, attends all meetings of these committees and is available to Committee members at any time. The external auditor also attends the AGM to answer questions from shareholders regarding the conduct of its audit, the audit report and financial statements and its independence.
As our external auditor, PwC is required to confirm its independence and compliance with specified independence standards on a semi-annual basis (at half and full year), however in practice it confirms its independence on a quarterly basis.
We strictly govern our relationship with the external auditor, including restrictions on employment, business relationships, financial interests and use of our financial products by the external auditor.
30 | 2019 Westpac Group Annual Report | |
| | |
Corporate governance
Engagement of the external auditor
To avoid possible independence or conflict issues, the external auditor is not permitted to carry out certain types of non-audit services for Westpac and may be limited as to the extent to which it can perform other non-audit services as specified in our ‘Pre-approval of engagement of PwC for audit and non-audit services’ (Guidelines). Use of the external audit firm for any non-audit services must be assessed and approved in accordance with the pre-approval process determined by the Board Audit Committee and set out in the Guidelines.
The breakdown of the aggregate fees billed by the external auditor in respect of each of the two most recent financial years for audit, audit-related, tax and other services is provided in Note 35 to our financial statements for the year ended 30 September 2019. A declaration regarding the Board’s satisfaction that the provision of non-audit services by PwC is compatible with the general standards of auditor independence is provided in Section 11 of the Directors’ report.
Group Audit (internal audit)
Group Audit is Westpac’s internal third line assurance function that provides the Board and Senior Executives with independent and objective evaluation of the adequacy and effectiveness of the Group’s governance, risk management and internal controls for the Westpac consolidated group.
Group Audit is governed by a charter approved by the Board Audit Committee that sets out the purpose, role, scope and high level standards for the function. The General Manager Group Audit has a direct reporting line to the Chairman of the Board Audit Committee and an administrative line to the Chief Financial Officer. Group Audit also has unrestricted and private access to the Chief Executive Officer.
Group Audit’s responsibilities include regularly reporting to the Board.
Market disclosure
We maintain a level of disclosure that seeks to provide all investors with equal, timely, balanced and meaningful information. Consistent with these standards, the Group maintains a Board-approved Market Disclosure Policy, which governs how we communicate with our shareholders and the investment community.
The policy reflects the requirements of the ASX, NZX and other offshore stock exchanges where we have disclosure obligations, as well as relevant securities and corporations legislation. Under our policy, information that a reasonable person would expect to have a material effect on the price or value of our securities must first be disclosed via the ASX unless an exception applies under regulatory requirements.
Our Disclosure Committee is responsible for determining what information should be disclosed publicly under the policy, and for assisting employees in understanding what information may require disclosure to the market on the basis that it is price sensitive. The Disclosure Committee is comprised of the CEO and the Executive Team.
The Group Executive, Legal & Secretariat is the Disclosure Officer. The Disclosure Officer is ultimately responsible for all communication with relevant stock exchanges and notifying regulators in any jurisdiction as a result of market disclosure.
Once relevant information is disclosed to the market and available to investors, it is also published on our website. This includes investor discussion packs, presentations on and explanations about our financial results. Our website information also includes Annual Review and Sustainability Reports, Annual Reports, results announcements, CEO and executive briefings (including webcasts, recordings or transcripts of all major events), notices of meetings and key media releases.
Shareholder communication and participation
We seek to keep shareholders fully informed about our strategy, business operations, performance and governance. As part of our investor relations program, we continually review our communications approach, seeking to maintain best practice and effective two-way communication with shareholders. This includes:
· Designing and maintaining the Investor Centre on the Group’s website to make all relevant company information available and to structure that information in a way that makes it easy to find and access;
· Responding to shareholder queries directly via phone, email and mail;
· Preparing company presentations that seek to respond to the questions frequently asked by shareholders along with major industry and company topics of interest; and
· Ensuring appropriate access to all major market briefings and shareholder meetings, including via webcasts and maintaining that information on our website.
Shareholders can access our financial calendar which lists all major market briefings and shareholder meetings. Announcements on these events may also be made through ASX announcements.
Shareholders are given the option to receive information in print or electronic format from both Westpac and its share registry.
Our Annual General Meeting (AGM) is an important opportunity for engaging and communicating with shareholders, and we typically rotate the location of our AGM throughout capital cities to ensure we reach a broad range of shareholders over time. While shareholders are encouraged to attend and actively participate, the AGM is webcast and can also be viewed at a later time from our website. Shareholders who are unable to attend the AGM are able to lodge a direct vote or appoint their proxies through a number of channels, including online. At the time of receiving the Notice of Meeting, shareholders are also invited to put forward questions they would like addressed at the AGM.
| 2019 Westpac Group Annual Report | 31 |
| | |
Corporate governance
Risk management
Roles and responsibilities
The Board is responsible for approving the Group’s overall risk management framework, the Westpac annual Group Risk Management Strategy and the Westpac Group Risk Appetite Statement and for monitoring the effectiveness of risk management by the Westpac Group. The Board has delegated to the Board Risk & Compliance Committee responsibility to: establish a view of the Group’s current and future risk position relative to its risk appetite and capital strength; review and approve frameworks, policies and processes for managing risk; and review and, where appropriate, approve risks beyond the approval discretion provided to management.
The Westpac Group Risk Management Framework, Risk Management Strategy, Risk Taxonomy and Risk Appetite Statement were reviewed by the Board Risk & Compliance Committee and were approved by the Board during the financial year ended 30 September 2019.
The Board Risk & Compliance Committee reviews and monitors the risk profile and controls of the Group for consistency with the Group Risk Appetite Statement and reviews and monitors capital levels for consistency with the Group’s risk appetite. The Board Risk & Compliance Committee receives regular reports from management on the effectiveness of our management of Westpac’s material risks. More detail about the role of the Board Risk & Compliance Committee is set out later in this section under ‘Board Risk & Compliance Committee’.
The CEO and Executive Team are responsible for implementing our risk management framework and risk management strategy, and for developing frameworks, policies, controls, processes and procedures for identifying and managing risk in all of Westpac’s activities.
We have adopted a Three Lines of Defence model to aid in holistic end-to-end management of risk, within which all employees play an active role. This necessitates co-operation between businesses and functions, such that there are no gaps in risk coverage. Effective risk management enables us to:
· accurately measure our risk profile and to balance risk and reward within our risk appetite, optimising financial growth opportunities and mitigating potential loss or damage;
· protect Westpac Group’s depositors, policyholders, investors and counterparts by maintaining a balance sheet with sound credit quality and buffers over regulatory minimums;
· deliver suitable, fair and clear or transparent outcomes for our customers that support market integrity;
· embed adequate controls to guard against excessive risk or undue risk concentration; and
· meet our regulatory and compliance obligations.
The 1st Line of Defence – Business and Support: manages the risk they originate
The 1st Line proactively identifies, evaluates, owns and manages the risks in their business/domain. It also ensures that business activities are within approved risk appetite and policies. The 1st Line of defence is accountable for ‘self-certification’.
In managing its risk, the 1st Line is required to establish and maintain appropriate governance structures, controls, resources and self-assessment processes, including issue identification recording and escalation procedures.
The 2nd Line of Defence – Risk: provides oversight, insight and control of First Line activities
The 2nd Line sets frameworks, policies, limits and standards for use across the Group.
Risk reviews and challenges 1st Line activities and decisions that may materiality affect Westpac’s risk position, and independently evaluates the effectiveness of the 1st Line’s controls, monitoring, compliance, and monitors progress towards mitigating risks. In addition, the 2nd Line provides insight to the 1st Line, assisting in developing, maintaining and enhancing the business’ approach to risk management.
The 2nd Line analyses and reports on the aggregated risk profile of the Group to ensure end-to-end oversight of risk, and can accept risks outside of the business’ risk appetite.
The 3rd Line of Defence – Provides Independent audit
Group Audit is an independent assurance function that evaluates and opines on the adequacy and effectiveness of both 1st and 2nd Line risk management approaches and tracks remediation progress, with the aim of providing the Board, and Senior Executives, with comfort that the Group’s governance, risk management and internal controls are operating effectively.
Our overall risk management governance structure is set out in more detail in the table ‘Risk Management Governance Structure’ included in this Corporate Governance Statement.
Westpac distinguishes between different types of risk:
· governance risk – the risk that the right information does not get to the right people or governance fora in the right format and timeframe to empower decision making. It is driven by organisational structures and relationships including between the Board, management, its shareholders and other stakeholders, which leads to deficient decision making, poor accountability and ineffective structures and processes;
· risk culture – is the risk that our culture doesn’t promote and reinforce behavioural expectations or structures to identify, understand, discuss and act on risks. This leads to ineffective risk management, poor risk awareness, risk-taking outside of risk appetite that is tolerated and a culture where key learnings are not integrated into Group-wide and customer outcomes, impeding continuous improvement;
32 | 2019 Westpac Group Annual Report | |
| | |
Corporate governance
· strategic risk – the risks arising from key elements of the strategic objectives and business plans;
· capital adequacy risk – the risk that the firm has an insufficient level or composition of capital to support its normal business activities and to meet its regulatory capital requirements under normal operating environments or stressed conditions (both actual and as defined for internal planning or regulatory testing purposes). This includes the risk from the Group’s pension plans;
· credit risk – the risk of financial loss where a customer or counterparty fails to meet their financial obligations to Westpac;
· funding and liquidity risk – the risk that the Group cannot meet its payment obligations or that it does not have the appropriate amount, tenor or composition of funding and liquidity to support its assets;
· market risk – the risk of an adverse impact on earnings resulting from changes in market factors, such as foreign exchange rates, interest rates, commodity prices or equity prices. This includes interest rate risk in the banking book - the risk to interest income from a mismatch between the duration of assets and liabilities that arises in the normal course of business activities;
· conduct and compliance risk – the risk of failing to abide by compliance obligations required of us or otherwise failing to have behaviours and practices that deliver suitable, fair and clear outcomes for our customers and that support market integrity;
· operational risk – the risk of loss resulting from inadequate or failed internal processes, people and systems or from external events. This definition includes legal and regulatory risk but excludes strategic risk;
· cyber risk – The potential for loss or harm to the business and stakeholders related to the use of technology;
· reputational risk – the risk that an action, inaction, transaction, investment or event will reduce trust in the Group’s integrity and competence by clients, counterparties, investors, regulators, employees or the public; and
· sustainability risk – the risk of reputation or financial loss due to failure to recognise or address material existing or emerging sustainability related environmental, social or governance issues. This includes climate change related risks.
Westpac has received advanced accreditation from APRA and the RBNZ under the Basel II capital framework, and uses the Advanced Internal Ratings Based (Advanced IRB) approach for credit risk and the Advanced Measurement Approach (AMA) for operational risk when calculating regulatory capital.
Material exposure to economic, environmental and social sustainability risks
Westpac’s material exposures to economic, environmental and social sustainability risks are managed in accordance with our risk management strategy and frameworks.
Board Risk & Compliance Committee
The Board Risk & Compliance Committee comprises all of Westpac’s independent, Non-executive Directors and is chaired by Ewen Crouch.
As set out in its charter, the Board Risk & Compliance Committee:
· assists the Board to consider and approve the Group’s overall risk framework for managing risk;
· reviews and recommends the Risk Management Strategy and Westpac Group Risk Appetite Statement to the Board for approval;
· reviews and monitors the risk profile and controls of the Group consistent with the Westpac Group Risk Appetite Statement;
· reviews and approves the frameworks, policies and processes for managing risk;
· reviews and approves the limits and conditions that apply to credit risk approval authority delegated to the CEO, CFO and CRO and any other officers of the Westpac Group to whom the Board has delegated credit approval authority;
· monitors changes anticipated for the economic and business environment including consideration of emerging risks and other factors considered relevant to our risk profile and risk appetite;
· assists the Board to make its annual declaration to APRA on risk management under APRA prudential standard CPS 220 Risk Management;
· reviews and where appropriate approves risks beyond the approval discretion provided to management; and
· assists the Board to oversee compliance management within the Group.
From the perspective of specific types of risk, the Board Risk & Compliance Committee’s role as set out in the current Committee charter has included:
· credit risk – approving key policies and limits supporting the Credit Risk Management Framework, and monitoring the risk profile, performance and management of our credit portfolio;
· liquidity risk – approving key policies and limits supporting the Liquidity Risk Management Framework, including our annual funding strategy, recovery and resolutions plans and monitoring the liquidity position and requirements;
· market risk – approving key policies and limits supporting the Market Risk Management Framework, and monitoring the market risk profile;
· conduct risk – reviewing and approving the Westpac Group Conduct Framework and reviewing and monitoring the performance of conduct risk management and controls;
· operational risk – approving key policies supporting the Operational Risk Management Framework and monitoring the performance of operational risk management and controls;
| 2019 Westpac Group Annual Report | 33 |
| | |
Corporate governance
· compliance risk – reviewing and approving the Westpac Group Compliance Management Framework and Financial Crime Risk Management Framework, supporting policies and standards and monitoring the performance of compliance and financial crime risk management and controls;
· reputation risk – reviewing and approving the Reputation Risk Management Framework and reviewing and monitoring the performance of reputation risk management and controls; and
· sustainability risk – reviewing and approving the Sustainability Risk Management Framework.
The Board Risk & Compliance Committee also:
· oversees and approves the Internal Capital Adequacy Assessment Process and in doing so reviews the outcomes of Westpac Group stress testing, sets the target capital ranges for regulatory capital and reviews and monitors capital levels for consistency with the Westpac Group’s risk appetite;
· provides relevant periodic assurances and reports (as appropriate) to the Board Audit Committee;
· reviews and approves other risk management frameworks and/or the monitoring of performance under those frameworks (as appropriate);
· forms a view of Westpac’s risk culture and oversees the identification of, and steps taken to address, any desirable changes to risk culture and periodically reports to the Board;
· refers to the Board or any other Board Committees any relevant matters that come to the attention of the Board Risk & Compliance Committee; and
· in its capacity as the Westpac Group’s US Risk Committee, oversees the key risks, risk management framework and policies of the Group’s US operations.
Compliance Management Framework
The Compliance Management Framework sets out our approach to managing compliance with our obligations and mitigating compliance risk. It is an integral part of the broader risk management strategy and is regularly assessed and enhanced as appropriate to ensure it responds to the internal and external environment and supports our strategic compliance direction.
To proactively manage our compliance risks, our compliance objective is to:
· comply with our legal obligations, regulatory requirements, voluntary codes of practice to which we subscribe, and Group policies, including the Westpac Code of Conduct;
· establish frameworks, policies and processes designed to manage, monitor and report compliance and to minimise the potential for breaches, fines or penalties, or loss of regulatory accreditations; and
· ensure that appropriate remedial action is taken to address instances of non-compliance.
Remuneration
The Board Remuneration Committee assists the Board by ensuring that Westpac has coherent remuneration policies and practices that fairly and responsibly reward individuals having regard to performance and that reflect Westpac’s risk management framework, the law and the highest standards of governance.
The Board Remuneration Committee has been in place for the whole of the financial year and is comprised of four independent Non-executive Directors and is chaired by Craig Dunn. All members of the Board Remuneration Committee are also members of the Board Risk & Compliance Committee, which assists in the integration of effective risk management into the remuneration framework.
As set out in its charter, the Board Remuneration Committee:
· reviews and makes recommendations to the Board in relation to the Westpac Group Remuneration Policy (Group Remuneration Policy) and assesses the Group Remuneration Policy’s effectiveness and its compliance with laws, regulations and prudential standards;
· reviews and makes recommendations to the Board in relation to the individual remuneration levels of the CEO, Non-executive Directors, Group Executives, other Executives who report directly to the CEO, any other Accountable Persons under the Banking Executive Accountability Regime, other persons whose activities in the Board Remuneration Committee’s opinion affect the financial soundness of Westpac, any person specified by APRA, and any other person the Board determines;
· reviews and makes recommendations to the Board in relation to the remuneration structures for each category of persons covered by the Group Remuneration Policy;
· reviews and makes recommendations to the Board on corporate goals and objectives relevant to the remuneration of the CEO, and the performance of the CEO in light of these objectives;
· reviews and makes recommendations to the Board on the short and long-term variable reward plans for Group Executives and any other Accountable Person under the Banking Executive Accountability Regime;
· reviews and makes recommendations to the Board in relation to approving equity based remuneration plans; and
· oversees general remuneration practices across the Group.
34 | 2019 Westpac Group Annual Report | |
| | |
Corporate governance
The Board Remuneration Committee reviews and recommends to the Board the size of variable reward pools each year based on consideration of pre-determined business performance indicators and the financial soundness of Westpac. The Board Remuneration Committee also approves remuneration arrangements outside of the Group Remuneration Policy relating to individuals or groups of individuals which are significant because of their sensitivity, precedent or disclosure implications. In addition, the Board Remuneration Committee considers and evaluates the performance of senior executives when making remuneration determinations and otherwise as required.
The Board Remuneration Committee also reviews and makes recommendations to the Board for the reduction of variable reward (including to zero) where:
· subsequent information or circumstances indicate that all or part of the grant was not justified; or
· the Board Remuneration Committee determines that an adjustment should be made as a result of risk or compliance failures, poor customer outcomes, where an Accountable Person under the Banking Executive Accountability Regime has failed to comply with their accountability obligations or any other matter it considers relevant.
Independent remuneration consultants are engaged by the Board Remuneration Committee to provide information across a range of issues, including remuneration benchmarking, market practices and emerging trends and regulatory reforms.
The Board Remuneration Committee seeks feedback from and considers matters raised by the Board Risk & Compliance Committee and Board Audit Committee, including with respect to remuneration outcomes, adjustments to remuneration and alignment of remuneration with the risk management framework.
The Board Remuneration Committee refers to the Board and any other Board Committee any matters that come to its attention that are relevant for the Board or the respective Board Committee.
Further details of our remuneration framework are included in the Remuneration Report in Section 10 of the Directors’ report. The Board Remuneration Committee reviews and recommends the Remuneration Report through the Board Audit Committee to the Board for approval.
| 2019 Westpac Group Annual Report | 35 |
| | |
Corporate governance
Risk Management Governance Structure
Westpac’s risk management governance structure is set out in the table below:
Board |
· | approves our overall risk management framework, the Westpac Group Risk Management Strategy and the Westpac Group Risk Appetite Statement; and |
· | makes an annual declaration to APRA on risk management. |
Board Risk & Compliance Committee (BRCC) |
· | assists the Board to consider and approve the Group’s overall risk framework for managing risk; |
· | reviews and recommends the Westpac Group Risk Management Strategy and Westpac Group Risk Appetite Statement to the Board for approval; |
· | reviews and monitors the risk profile and controls of the Group consistent with the Westpac Group Risk Appetite Statement; |
· | reviews and approves material frameworks, policies and processes for managing risk; |
· | reviews and approves the limits and conditions that apply to credit risk approval authority delegated to the CEO, CFO, CRO and any other officers of the Westpac Group to whom the Board has delegated credit approval authority; |
· | monitors changes anticipated for the economic and business environment including consideration of emerging risks and other factors considered relevant to our risk profile and risk appetite; |
· | assists the Board to make its annual declaration to APRA on risk management under APRA prudential standard CPS220 Risk Management; |
· | reviews and where appropriate approves risks beyond the approval discretion provided to management; and |
· | assists the Board to oversee compliance management within the Group. |
Other Board Committees with a risk focus |
Board Audit Committee |
· | oversees the integrity of financial statements and financial reporting systems, and matters relating to taxation risks. |
Board Remuneration Committee |
· | oversees remuneration policies and practices of the Westpac Group in the context that these policies and practices reflect Westpac’s risk management framework, including making recommendations to the Board for the reduction or lapsing of incentive-based equity grants to employees as a result of risk or compliance failures. |
Board Technology Committee |
· | oversees the implementation of the Westpac Group’s technology strategy, including risks associated with major technology programs. |
Executive Team |
· | executes the Board-approved strategy; |
· | delivers the Westpac Group’s various strategic and performance goals within the approved risk appetite; |
· | approves the position statements that guide the Westpac Group’s response to sustainability issues; and |
· | monitors key risks within each business unit, capital adequacy and the Westpac Group’s reputation. |
36 | 2019 Westpac Group Annual Report | |
| | |
Corporate governance
Executive risk committees |
Westpac Group Executive Risk Committee |
· | leads the management and oversight of material risks across the Westpac Group within the context of the risk appetite approved by the Board; |
· | oversees the effectiveness of the Risk Management Framework and the execution of the Risk Management Strategy; |
· | monitors and reviews the Group’s risk profile for all identified material risks; |
· | shapes and promotes a strong risk culture; and |
· | oversees emerging risks and allocates responsibility for assessing impacts and implementing appropriate actions to address these. |
Westpac Group Asset & Liability Committee |
· | leads the optimisation of funding and liquidity risk-reward across the Group; |
· | reviews the level and quality of capital to ensure that it is commensurate with the Group’s risk profile, business strategy and risk appetite; |
· | oversees the Liquidity Risk Management Framework and key policies; |
· | oversees the funding and liquidity risk profile and balance sheet risk profile; and |
· | identifies emerging funding and liquidity risks and appropriate actions to address these. |
Westpac Group Credit Risk Committee |
· | reviews and oversees the Credit Risk Management Framework and key supporting policies; |
· | oversees Westpac’s credit risk profile; and |
· | identifies emerging credit risks, allocates responsibility for assessing impacts, and responds as appropriate. |
Westpac Group Market Risk Committee |
· | reviews and oversees the Market Risk, Equity Risk and Insurance Risk Management Frameworks and key market risk management policies; |
· | reviews policies and limits for managing traded and non-traded market risk; and |
· | reviews and overseas the market risk, equity risk and insurance risk profile. |
Westpac Group Operational Risk Committee |
· | reviews and oversees the Operational Risk Management Frameworks and key supporting policies; |
· | oversees Westpac’s operational risk profile; and |
· | identifies emerging operational risks, and appropriate actions to address these. |
Westpac Group Remuneration Oversight Committee |
Some of the key responsibilities of the Westpac Group Remuneration Oversight Committee include: |
· | supporting the CEO, Board Remuneration Committee and the Board by reviewing and approving remuneration frameworks, guidelines and short term variable reward plans underpinning the Board-approved Westpac Group Remuneration Policy from a Human Resources, Risk (including Compliance), Finance and Legal perspective and in line with external requirements; |
· | assisting the Board Remuneration Committee and the Board in fulfilling its responsibility to oversee remuneration policies and practices of the Group in the context that these policies and practices fairly and responsibly reward individuals having regard to customer and shareholder interests, long term financial soundness and prudent risk management; |
· | recommending to the CEO for recommendation to the Board Remuneration Committee remuneration arrangements for Responsible Persons, risk and financial control employees, Material Risk Takers and other individuals whose activities may impact the financial soundness of Westpac below the Group Executive level; and |
· | recommending to the CEO for recommendation to the Board Remuneration Committee the criteria and rationale for determining the total quantum of the Group variable reward pool. |
Prudential Reporting and Compliance Committee |
· | oversees from a Group-wide perspective, the Group’s compliance with prudential requirements and regulatory reporting; |
· | oversees the effective management of prudential compliance breaches, incidents and issues including remediation actions; and |
· | monitors and reviews ongoing prudential governance activities, including changes to prudential standards. |
Reputational Risk Committee |
· | reviews issues with material reputation risk that arise in the operations of Westpac’ business to mitigate reputation risk and detrimental customer impacts. |
Westpac Group Financial Crime Risk Committee |
· | oversees Anti-Money Laundering and Counter-Terrorism Financing, Anti-Bribery and Corruption, Sanctions and Tax Transparency within the context of the risk appetite approved by the Board; |
· | reviews and oversees the Financial Crime Management Framework, key supporting policies, programs and standards; |
· | monitors and oversees Westpac’s financial crime risk profile; and |
· | identifies emerging financial crime risks, and appropriate actions to address these. |
| 2019 Westpac Group Annual Report | 37 |
| | |
Corporate governance
Risk function |
Risk Function |
· | promotes a strong risk culture; |
· | owns the design and content of the Risk Management Framework; |
· | defines the structure and coverage of risk appetite; |
· | defines the annual risk strategy to execute the Risk Management Framework ensuring the management of risks in alignment with risk appetite and business strategy; |
· | establishes risk policies, procedures and limits; |
· | measures and reports on risk levels; and |
· | provides oversight of and direction on the management of risks. |
Independent internal review |
Group Audit |
· | reviews the adequacy and effectiveness of management controls over risk. |
Divisional business units and functions |
Business Units and Functions |
· | responsible for identifying, evaluating and managing the risks that they originate within approved risk appetite and policies; and |
· | establish and maintain appropriate risk management and compliance controls, resources and self-assessment processes. |
38 | 2019 Westpac Group Annual Report | |
| | |
This page has been intentionally left blank.
| 2019 Westpac Group Annual Report | 39 |
| | |
Directors’ report
Our Directors present their report together with the financial statements of the Group for the financial year ended 30 September 2019. 1. Directors The names of the persons who have been Directors, or appointed as Directors, during the period since 1 October 2018 and up to the date of this report are: Lindsay Philip Maxsted, Brian Charles Hartzer, Nerida Frances Caesar, Ewen Graham Wolseley Crouch, Catriona Alison Deans (Alison Deans), Craig William Dunn, Yuen Mei Anita Fung (Anita Fung), Steven John Harker (Director from 1 March 2019), Peter John Oswin Hawkins (retired as a Director on 12 December 2018), Peter Ralph Marriott, Peter Stanley Nash and Margaret Leone Seale (Director from 1 March 2019). Particulars of the skills, experience, expertise and responsibilities of the Directors at the date of this report, including all directorships of other listed companies held by a Director at any time in the three years immediately before 30 September 2019 and the period for which each directorship has been held, are set out in the following pages. | | 
Name: Lindsay Maxsted, DipBus (Gordon), FCA, FAICD Age: 65 Term of office: Director since March 2008 and Chairman since December 2011. Date of next scheduled re-election: December 2020. Independent: Yes. Current directorships of listed entities and dates of office: Transurban Group (since March 2008 and Chairman since August 2010), BHP Group Limited (since March 2011) and BHP Group plc (since March 2011). Other principal directorships: Managing Director of Align Capital Pty Ltd and Director of Baker Heart and Diabetes Institute. Other interests: Nil. Other Westpac related entities directorships and dates of office: Nil. Skills, experience and expertise: Lindsay was formerly a partner at KPMG and was the CEO of that firm from 2001 to 2007. His principal area of practice prior to his becoming CEO was in the corporate recovery field managing a number of Australia’s largest insolvency/workout/turnaround engagements including Linter Textiles (companies associated with Abraham Goldberg), Bell Publishing Group, Bond Brewing, McEwans Hardware and Brashs. He is also a former Director and Chairman of the Victorian Public Transport Corporation. Westpac Board Committee membership: Chairman of the Board Nominations Committee. Member of each of the Board Audit and Board Risk & Compliance Committees. Directorships of other listed entities over the past three years and dates of office: Nil. | | 
Name: Brian Hartzer, BA, CFA Age: 52 Term of office: Managing Director & Chief Executive Officer since February 2015. Date of next scheduled re-election: Not applicable. Independent: No. Current directorships of listed entities and dates of office: Nil. Other principal directorships: The Australian National University Business and Industry Advisory Board (Chairman since March 2017), the Financial Markets Foundation for Children and Australian Banking Association Incorporated. Other interests: Nil. Other Westpac related entities directorships and dates of office: Nil. Skills, experience and expertise: Brian was appointed Managing Director & Chief Executive Officer in February 2015. Brian joined Westpac as Chief Executive, Australian Financial Services in June 2012, encompassing Westpac Retail & Business Banking, St.George Banking Group and BT Financial Group. Prior to joining Westpac, Brian spent three years in the UK as CEO for Retail, Wealth and Ulster Bank at the Royal Bank of Scotland Group. Prior to that, he spent ten years with Australia and New Zealand Banking Group Limited (ANZ) in Australia in a variety of roles, including his final role as CEO, Australia and Global Segment Lead for Retail and Wealth. Before joining ANZ, Brian spent ten years as a financial services consultant in New York, San Francisco and Melbourne. Westpac Board Committee membership: Member of the Board Technology Committee. Directorships of other listed entities over the past three years and dates of office: Nil. |
40 | 2019 Westpac Group Annual Report | |
| | |
Directors’ report

Name: Nerida Caesar, BCom, MBA, GAICD Age: 55 Term of office: Director since September 2017. Date of next scheduled re-election: December 2019. Independent: Yes. Current directorships of listed entities and dates of office: Nil. Other principal directorships: Workplace Giving Australia Limited (Chairman since June 2019) and Spark Investment Holdco Pty Ltd. Other interests: Member of the Advisory Board of IXUP Limited. Advisor to Equifax Australia and New Zealand. Other Westpac related entities directorships and dates of office: Nil. Skills, experience and expertise: Nerida has over 30 years of broad- ranging commercial and business management experience. She was Group Managing Director and Chief Executive Officer, Australia and New Zealand, of Equifax (formerly Veda Group Limited) from February 2011 to June 2017. Nerida is also a former director of Genome.One Pty Ltd and Stone and Chalk Limited. Ms Caesar was formerly Group Managing Director, Telstra Enterprise and Government, responsible for Telstra’s corporate, government and large business customers in Australia as well as the international sales division. Nerida also worked as Group Managing Director, Telstra Wholesale, and, prior to that, held the position of Executive Director Enterprise & Government, where she was responsible for managing products, services, and customer relationships throughout Australia. Nerida also held several senior management and sales positions with IBM within Australia and internationally over a 20-year period, including as Vice President of IBM’s Intel Server Division for the Asia Pacific region. Westpac Board Committee membership: Member of each of the Board Risk & Compliance and Board Technology Committees. Directorships of other listed entities over the past three years and dates of office: Nil. | | 
Name: Ewen Crouch AM, BEc (Hons.), LLB, FAICD Age: 63 Term of office: Director since February 2013. Date of next scheduled re-election: December 2019. Independent: Yes. Current directorships of listed entities and dates of office: Corporate Travel Management Limited (Chairman since March 2019) and BlueScope Steel Limited (since March 2013). Other principal directorships: Sydney Symphony Orchestra Holdings Pty Limited and Jawun. Other interests: Member of the Commonwealth Remuneration Tribunal, Law Committee of the Australian Institute of Company Directors, Corporations Committee of the Law Council of Australia and ASIC’s Director Advisory Panel. Other Westpac related entities directorships and dates of office: Nil. Skills, experience and expertise: Ewen was a Partner at Allens from 1988 to 2013, where he was one of Australia’s most accomplished mergers and acquisitions lawyers. He served as a member of the firm’s board for 11 years, including four years as Chairman of Partners. His other roles at Allens included Co-Head Mergers and Acquisitions and Equity Capital Markets, Executive Partner, Asian offices and Deputy Managing Partner. Ewen served as a director of Mission Australia from 1995 and as Chairman from 2009, before retiring in November 2016. From 2010 to 2015, Ewen was a member of the Takeovers Panel. In 2013, Ewen was awarded an Order of Australia in recognition of his significant service to the law as a contributor to legal professional organisations and to the community. Westpac Board Committee membership: Chairman of the Board Risk & Compliance Committee. Member of each of the Board Audit, Board Nominations and Board Remuneration Committees. Directorships of other listed entities over the past three years and dates of office: Nil. | | 
Name: Alison Deans, BA, MBA, GAICD Age: 51 Term of office: Director since April 2014. Date of next scheduled re-election: December 2020. Independent: Yes. Current directorships of listed entities and dates of office: Cochlear Limited (since January 2015) and Ramsay Health Care Limited (since November 2018). Other principal directorships: SCEGGS Darlinghurst Limited, The Observership Program Limited and Deputy Group Pty Ltd. Other interests: Senior Advisor, McKinsey & Company and Investment Committee member of the CSIRO Innovation Fund (Main Sequence Ventures). Other Westpac related entities directorships and dates of office: Nil. Skills, experience and expertise: Alison has more than 20 years’ experience in senior executive roles focused on building digital businesses and digital transformation across e-commerce, media and financial services. During this time, Alison served as the CEO of eCorp Limited, CEO of Hoyts Cinemas and CEO of eBay, Australia and New Zealand. She was the CEO of a technology-based investment company netus Pty Ltd. Alison was an Independent Director of Social Ventures Australia from September 2007 to April 2013 and a director of kikki.K Holdings Pty Ltd from October 2014 to June 2018. Westpac Board Committee membership: Chairman of the Board Technology Committee. Member of each of the Board Nominations, Board Remuneration and Board Risk & Compliance Committees. Directorships of other listed entities over the past three years and dates of office: Insurance Australia Group Limited (February 2013 – October 2017). |
| 2019 Westpac Group Annual Report | 41 |
| | |
Directors’ report

Name: Craig Dunn, BCom, FCA Age: 56 Term of office: Director since June 2015. Date of next scheduled re-election: December 2021. Independent: Yes. Current directorships of listed entities and dates of office: Telstra Corporation Limited (since April 2016). Other principal directorships: Chairman of The Australian Ballet. Other interests: Chairman of the International Standards Technical Committee on Blockchain and Distributed Ledger Technologies (ISO/ TC 307) and consultant to King & Wood Mallesons. Other Westpac related entities directorships and dates of office: Nil. Skills, experience and expertise: Craig has more than 20 years’ experience in financial services, including as CEO of AMP Limited from 2008 to 2013. Craig was previously a director of Financial Literacy Australia Limited, a Board member of each of the Australian Japanese Business Cooperation Committee, Jobs for New South Wales, and the New South Wales Government’s Financial Services Knowledge Hub. He is the former Chairman of Stone and Chalk Limited and of the Investment and Financial Services Association (now the Financial Services Council). Craig was also a member of the Financial Services Advisory Committee, the Australian Financial Centre Forum, the Consumer and Financial Literacy Taskforce and a Panel member of the Australian Government’s Financial System Inquiry. Westpac Board Committee membership: Chairman of the Board Remuneration Committee. Member of each of the Board Nominations and Board Risk & Compliance Committees. Directorships of other listed entities over the past three years and dates of office: Nil. | | 
Name: Anita Fung, BSocSc, MAppFin Age: 58 Term of office: Director since October 2018. Date of next scheduled re-election: December 2021. Independent: Yes. Current directorships of listed entities and dates of office: Hong Kong Exchanges and Clearing Limited (since April 2015, Hong Kong listed), China Construction Bank Corporation (since October 2016, Hong Kong Listed) and Hang Lung Properties Limited (since May 2015, Hong Kong listed). Other principal directorships: Board member of the Airport Authority Hong Kong. Other interests: Member of the Hong Kong Museum Advisory Committee. Other Westpac related entities directorships and dates of office: Member of Westpac’s Asia Advisory Board since October 2018. Skills, experience and expertise: Anita’s career in the banking industry spans over 30 years, including 19 years at HSBC. During her time at HSBC, Anita held a number of senior management roles including Group General Manager, HSBC Group and most recently as Chief Executive Officer, Hong Kong from 2011 to 2015. Prior to joining HSBC, Anita held various positions at Standard Chartered Bank in its Treasury and Capital markets business. Westpac Board Committee membership: Member of the Board Risk & Compliance Committee. Directorships of other listed entities over the past three years and dates of office: Nil. | | 
Name: Steven Harker, BEc (Hons.), LLB Age: 64 Term of office: Director since March 2019. Date of next scheduled re-election: December 2019. Independent: Yes. Current directorships of listed entities and dates of office: Nil. Other principal directorships: The Banking and Finance Oath Limited, The Hunger Project Australia, ASX Refinitiv Charity Foundation, New South Wales Golf Club Foundation Limited and Ascham School Ltd. Other interests: Honorary Treasurer of Ascham School. Other Westpac related entities directorships and dates of office: Nil. Skills, experience and expertise: Steve has over 35 years of experience in investment banking. Steve was formerly Managing Director and Chief Executive Officer of Morgan Stanley Australia from 1998 to 2016 and then Vice Chairman until February 2019. Prior to joining Morgan Stanley, he spent fifteen years with Barclays de Zoete Wedd (BZW, now Barclays Investment Bank). Steve is a former Chairman and Director of Australian Financial Markets Association Limited and a former Director of Investa Property Group. Steve also previously served on the board of the Centre for International Finance and Regulation. He is also a former Guardian of the Future Fund of Australia. Westpac Board Committee membership: Member of each of the Board Audit and Board Risk & Compliance Committees. Directorships of other listed entities over the past three years and dates of office: Nil. |
42 | 2019 Westpac Group Annual Report | |
| | |
Directors’ report

Name: Peter Marriott, BEc (Hons.), FCA Age: 62 Term of office: Director since June 2013. Date of next scheduled re-election: December 2019. Independent: Yes. Current directorships of listed entities and dates of office: ASX Limited (since July 2009). Other principal directorships: ASX Clearing Corporation Limited, ASX Settlement Corporation Limited and Austraclear Limited. Other interests: Member of Monash University Council and Chairman of the Monash University Council’s Resources and Finance Committee. Other Westpac related entities directorships and dates of office: Nil. Skills, experience and expertise: Peter has over 30 years’ experience in senior management roles in the finance industry, encompassing international banking, finance and auditing. Peter joined Australia and New Zealand Banking Group Limited (ANZ) in 1993 and held the role of Chief Financial Officer from July 1997 to May 2012. Prior to his career at ANZ, Peter was a banking and finance, audit and consulting partner at KPMG Peat Marwick. Peter was formerly a Director of ANZ National Bank Limited in New Zealand and various ANZ subsidiaries. Westpac Board Committee membership: Chairman of the Board Audit Committee. Member of each of the Board Nominations, Board Technology and Board Risk & Compliance Committees. Directorships of other listed entities over the past three years and dates of office: Nil. | | 
Name: Peter Nash, BCom, FCA, F Fin Age: 57 Term of office: Director since March 2018. Date of next scheduled re-election: December 2021. Independent: Yes. Current directorships of listed entities and dates of office: Johns Lyng Group Limited (Chairman since October 2017), Mirvac Group (since November 2018) and ASX Limited (since June 2019). Other principal directorships: Reconciliation Australia Limited and Golf Victoria Limited. Other interests: Board member of the Koorie Heritage Trust and Migration Council Australia. Member of the University of Melbourne Centre for Contemporary Chinese Studies Advisory Board. Other Westpac related entities directorships and dates of office: Nil. Skills, experience and expertise: Peter was formerly a Senior Partner with KPMG until September 2017, having been admitted to the partnership of KPMG Australia in 1993. He most recently served as the National Chairman of KPMG Australia from 2011 until August 2017, where he was responsible for the overall governance and strategic positioning of KPMG in Australia. In this role, Peter also served as a member of KPMG’s Global and Regional Boards. Peter has experience providing advice on a range of topics including business strategy, risk management, internal controls, business processes and regulatory change. He has also provided both financial and commercial advice to many Government businesses at both a Federal and State level. Peter is a former member of the Business Council of Australia and its Economic and Regulatory Committee. Westpac Board Committee membership: Member of each of the Board Audit and Board Risk & Compliance Committees. Directorships of other listed entities over the past three years and dates of office: Nil. | | 
Name: Margaret (Margie) Seale, BA, FAICD Age: 59 Term of office: Director since March 2019. Date of next scheduled re-election: December 2019. Independent: Yes. Current directorships of listed entities and dates of office: Telstra Corporation Limited (since May 2012) and Scentre Group Limited (since February 2016). Other principal directorships: Australian Pacific (Holdings) Pty Limited. Other interests: Member of the Australian Public Service Commission Centre for Learning and Leadership Advisory Board. Other Westpac related entities directorships and dates of office: Nil. Skills, experience and expertise: Margie has more than 25 years’ experience in senior executive roles in Australia and overseas, including in consumer goods, global publishing, sales and marketing, and the successful transition of traditional business models to digital environments. Prior to her non-executive career, Margie was the Managing Director of Random House Australia and New Zealand and President, Asia Development for Random House Inc. Margie is a former Director and then Chair of Penguin Random House Australia Pty Limited, and a former Director of Ramsay Health Care Limited, Bank of Queensland Limited and the Australian Publishers’ Association. She also previously served on the boards of Chief Executive Women (chairing its Scholarship Committee), the Powerhouse Museum, and the Sydney Writers Festival. Westpac Board Committee membership: Member of each of the Board Remuneration and Board Risk & Compliance Committees. Directorships of other listed entities over the past three years and dates of office: Ramsay Health Care Limited (April 2015 to October 2018) and Bank of Queensland Limited (January 2014 to June 2018). |
| 2019 Westpac Group Annual Report | 43 |
| | |
Directors’ report
Company Secretary
Our Company Secretaries as at 30 September 2019 were Rebecca Lim and Tim Hartin.
Rebecca Lim (B Econ, LLB (Hons.)) was appointed Group Executive, Compliance, Legal & Secretariat1 and Company Secretary in October 2016. Rebecca joined Westpac in 2002 and has held a variety of senior leadership roles including General Manager, Human Resources for St.George Bank and General Manager, St.George Private Clients. She was appointed Group General Counsel in November 2011 and Chief Compliance Officer from 2013 to 2017. Rebecca held an in-house role in investment banking at Goldman Sachs in London before returning to Australia and joining Westpac. Rebecca was previously with US firm Skadden Arps where she worked in the Corporate Finance area in both New York and London. Prior to that she worked at Blake Dawson Waldron (now Ashurst) as a solicitor.
Tim Hartin (LLB (Hons.)) was appointed Group Company Secretary in November 2011. Before that appointment, Tim was Head of Legal - Risk Management & Workouts, Counsel & Secretariat and prior to that, he was Counsel, Corporate Core. Before joining Westpac in 2006, Tim was a Consultant with Gilbert + Tobin, where he provided corporate advisory services to ASX listed companies. Tim was previously a lawyer at Henderson Boyd Jackson W.S. in Scotland and in London in Herbert Smith’s corporate and corporate finance division.
2. Executive Team
As at 30 September 2019 our Executive Team was:
| | | |
Name | Position | Year Joined
Group | Year
Appointed
to Position |
Brian Hartzer | Managing Director & Chief Executive Officer | 2012 | 2015 |
Craig Bright | Chief Information Officer | 2018 | 2018 |
Lyn Cobley | Chief Executive, Westpac Institutional Bank | 2015 | 2015 |
Peter King | Chief Financial Officer | 1994 | 2014 |
Rebecca Lim | Group Executive, Legal & Secretariat | 2002 | 2016 |
David Lindberg | Chief Executive, Consumer | 2012 | 2019 |
Carolyn McCann | Group Executive, Customer & Corporate Relations | 2013 | 2018 |
David McLean | Chief Executive Officer, Westpac New Zealand | 1999 | 2015 |
Christine Parker | Group Executive, Human Resources | 2007 | 2011 |
David Stephen | Chief Risk Officer | 2018 | 2018 |
Gary Thursby | Chief Operating Officer | 2008 | 2019 |
Alastair Welsh | Acting Chief Executive, Business | 1992 | 2019 |
There are no family relationships between or among any of our Directors or Executive Team members.
1. From 1 October 2018, Rebecca Lim’s role and title has been Group Executive, Legal & Secretariat.
44 | 2019 Westpac Group Annual Report | |
| | |
Directors’ report

Brian Hartzer BA, CFA. Age: 52 Managing Director & Chief Executive Officer Brian was appointed Managing Director & Chief Executive Officer in February 2015. Brian joined Westpac as Chief Executive, Australian Financial Services in June 2012, encompassing Westpac Retail & Business Banking, St.George Banking Group and BT Financial Group. Brian is a Director of the Australian Banking Association and was formerly the Chairman until December 2015. Prior to joining Westpac, Brian spent three years in the UK as CEO for Retail, Wealth and Ulster Bank at the Royal Bank of Scotland Group. Prior to that, he spent ten years with Australia and New Zealand Banking Group Limited (ANZ) in Australia in a variety of roles, including his final role as CEO, Australia and Global Segment Lead for Retail and Wealth. Before joining ANZ, Brian spent ten years as a financial services consultant in New York, San Francisco and Melbourne. Brian graduated from Princeton University with a degree in European History and is a Chartered Financial Analyst. | | 
Craig Bright B.Comp. Age: 54 Chief Information Officer Craig was appointed Group Chief Information Officer in December 2018. Craig has more than 30 years’ experience in technology and financial services. He has held divisional CIO roles in retail banking, business banking and investment banking and led complex global scale technology operations. Prior to joining Westpac, Craig was Chief Technology Officer, Global Consumer Bank at Citigroup. He led a division of technology employees executing a cloud and mobile first strategy supporting digital channels and a mix of Citi Smart Banking formats worldwide. Craig has also held senior roles at Barclays in London, National Australia Bank and Ernst & Young. Craig has a Bachelor of Computing from Monash University and a Computer Field Service Certificate from Royal Melbourne Institute of Technology. | | 
Lyn Cobley BEc, SF FIN, GAICD. Age: 56 Chief Executive, Westpac Institutional Bank Lyn was appointed Chief Executive, Westpac Institutional Bank in September 2015. She has responsibility for Westpac’s global relationships with corporate, institutional and government clients as well as all products across financial and capital markets, transactional banking, structured finance and working capital payments. In addition, Lyn oversees Westpac’s International and Pacific Island businesses. Lyn has over 27 years’ experience in financial services. Prior to joining Westpac, Lyn held a variety of senior positions at the Commonwealth Bank of Australia, including serving as Group Treasurer from 2007 to 2013 and most recently as Executive General Manager, Retail Products & Third Party Banking. She also held senior roles at Barclays Capital in Australia and Citibank in Australia and Asia Pacific, and was CEO of Trading Room (a joint venture between Macquarie Bank and Fairfax). Lyn is a Board member of the Australian Financial Markets Association (AFMA), the Banking & Finance Oath and the Westpac Foundation. She is Chairman of Westpac’s Asia Advisory Board and is also a member of Chief Executive Women. Lyn has a Bachelor of Economics from Macquarie University, is a Senior Fellow of the Financial Services Institute of Australia and is a graduate of the Australian Institute of Company Directors. |
| 2019 Westpac Group Annual Report | 45 |
| | |
Directors’ report

Peter King BEc, FCA. Age: 49 Chief Financial Officer Peter was appointed Chief Financial Officer in April 2014. Peter has responsibility for Westpac’s Finance, Tax, Treasury and Investor Relations functions. Prior to this appointment, Peter was the Deputy Chief Financial Officer for three years and has held other senior finance positions across the Group, including in Group Finance, Business and Consumer Banking, Business and Technology Services, Treasury and Financial Markets. Peter commenced his career at Deloitte Touche Tohmatsu. He has a Bachelor of Economics from Sydney University and completed the Advanced Management Programme at INSEAD. He is a Fellow of the Institute of Chartered Accountants. | | 
Rebecca Lim B Econ, LLB (Hons). Age: 47 Group Executive, Legal & Secretariat Rebecca was appointed as a Westpac Group Executive in October 2016 and is responsible for legal and secretariat functions globally. She was appointed Group General Counsel in November 2011 and was Chief Compliance Officer from 2013 to 2017. Rebecca joined Westpac in 2002 and has held a variety of other senior leadership roles including General Manager, Human Resources for St.George Bank and General Manager, St.George Private Clients. Rebecca began her career at Blake Dawson Waldron (now Ashurst) before joining the US firm Skadden Arps where she worked in both New York and London. Rebecca then moved into an in-house role in investment banking at Goldman Sachs in London before returning to Australia and joining Westpac. Rebecca is Deputy Chair of the GC100 Executive Committee and a member of Chief Executive Women. | | 
David Lindberg HBA (Hons. Economics). Age: 44 Chief Executive, Consumer David was appointed Chief Executive, Consumer in April 2019, responsible for the end to end relationships with consumer customers. This includes all consumer distribution, digital, marketing, banking and insurance products and services under the Westpac, St.George, BankSA, Bank of Melbourne, BT, and RAMS brands. Prior to this appointment, David was Chief Executive, Business Bank from June 2015, managing relationships with business customers for the Westpac, St.George, BankSA and Bank of Melbourne brands. Before this David was Chief Product Officer for the Group’s retail and business products, as well as overseeing the Group’s digital activities. Before joining Westpac in 2012, David was Executive General Manager, Cards, Payments & Retail Strategy at the Commonwealth Bank of Australia. David was also formerly Managing Director, Strategy, Marketing & Customer Segmentation at Australia and New Zealand Banking Group Limited and Vice President and Head of Australia for First Manhattan. |
46 | 2019 Westpac Group Annual Report | |
| | |
Directors’ report

Carolyn McCann BBus (Com), BA, GradDipAppFin, GAICD. Age: 47 Group Executive, Customer & Corporate Relations Carolyn was appointed as Westpac’s Group Executive, Customer & Corporate Relations in June 2018. This division brings together management of the Group’s customer resolution and reporting, alongside our corporate affairs, communications and sustainability functions, recognising the importance of setting high service standards and quickly resolving customer issues in managing the Group’s relationship with its customers. Carolyn joined the Westpac Group in 2013, as General Manager, Corporate Affairs & Sustainability, during which time she played an instrumental role in leading the Group’s bicentenary program, including the launch of the $100 million Westpac Scholars Trust (formerly known as the Westpac Bicentennial Foundation). Prior to joining Westpac, Carolyn spent 13 years at Insurance Australia Group in various positions, including Group General Manager, Corporate Affairs & Investor Relations. Carolyn began her career in consulting and has extensive experience in financial services. | | 
David McLean LLB (Hons.). Age: 61 Chief Executive Officer, Westpac New Zealand David was appointed Chief Executive Officer, Westpac New Zealand in February 2015. Since joining Westpac in February 1999, David has held a number of senior roles, including Head of Debt Capital Markets New Zealand, General Manager, Private, Wealth and Insurance New Zealand and Head of Westpac Institutional Bank New Zealand, and most recently, Managing Director of the Westpac New York branch. Before joining Westpac, David was Director, Capital Markets at Deutsche Morgan Grenfell from 1994. He also established the New Zealand branch of Deutsche Bank and was New Zealand Resident Branch Manager. In 1988, David joined Southpac/National Bank as a Capital Markets Executive. Prior to this, David worked as a lawyer in private practice and also served as in-house counsel for NatWest NZ from 1985. | | 
Christine Parker BGDipBus (HRM). Age: 59 Group Executive, Human Resources Christine was appointed to Westpac Group’s Executive Team in October 2011. As Group Executive, Human Resources, Christine leads the HR function for the Group, responsible for strengthening our service oriented and inclusive culture, attracting and retaining the best talent, developing and helping our workforce to grow skills for the future, rewarding and recognising our people and ensuring the health and wellbeing of our people. Christine also oversees the Group’s Customer Advocate function, corporate communications, and supports the CEO and Board on culture and conduct. Christine also has responsibility for Office of the Banking Executive Accountability Regime. Since joining Westpac in 2007, Christine has held a variety of senior leadership roles including Group General Manager, Human Resources and General Manager, Human Resources for Westpac New Zealand Limited. Before joining Westpac, Christine held senior HR roles in a number of high profile organisations and across a range of industries, including Carter Holt Harvey and Restaurant Brands New Zealand. Christine was previously a Director of Women’s Community Shelters and is a current member of Chief Executive Women, Governor of St.George Foundation and member of the Veterans’ Employment Industry Advisory Committee. |
| 2019 Westpac Group Annual Report | 47 |
| | |
Directors’ report

David Stephen BBus. Age: 55 Chief Risk Officer David was appointed Chief Risk Officer in October 2018, with responsibility for risk management and compliance activities across the Group. Prior to this, David was the Chief Risk Officer for Royal Bank of Scotland (RBS) from 2013, having first joined RBS in 2010 as the Deputy Chief Risk Officer. David has also previously held other senior roles at both retail and investment banks in the UK, USA, Hong Kong and Australia, including serving as Chief Risk Officer at ANZ and Chief Credit Officer at Credit Suisse Financial Products. David has a Bachelor of Business in Banking and Finance from Monash University and is a Board member of both the International Financial Risk Institute and the Financial Services Institute of Australia (FINSIA). | | 
Gary Thursby BEc, DipAcc, FCA. Age: 56 Chief Operating Officer Gary was appointed Chief Operating Officer in April 2019, having previously been in the role of Group Executive, Strategy & Enterprise Services since October 2016. In addition to leading the Group’s strategy function, his role is designed to support delivery of the Group’s Service Revolution and provide services to support the Group’s operating businesses. Gary’s responsibilities also include banking operations, advice remediation, procurement, property, analytics and enterprise investments. In addition, Gary oversees the Group’s corporate and business development portfolios. Before joining Westpac in 2008, Gary held a number of senior finance roles at Commonwealth Bank of Australia including Deputy CFO and CFO Retail Bank. Gary has over 20 years’ experience in financial services, covering finance, M&A and large scale program delivery. He commenced his career at Deloitte Touche Tohmatsu. Gary has a Bachelor of Economics and a Post Graduate Diploma in Accounting from Flinders University of South Australia and is a Fellow of the Institute of Chartered Accountants. | | 
Alastair Welsh MBA, BCA, CA. Age: 54 Acting Chief Executive, Business Alastair was appointed Acting Chief Executive, Business in April 2019. The Business division leads relationships with Australia’s small, commercial, corporate and agri businesses providing a wide range of banking services and support across Westpac, St George, BankSA, Bank of Melbourne and Capital Finance brands. The division also supports customers’ wealth and investment needs including Private Wealth, Superannuation, Platforms, Investments and Operations businesses through all of our brands. Alastair holds more than 30 years’ experience in banking in the UK, New Zealand and Australia. Since joining Westpac NZ in 1992, he has held a variety of roles from relationship management through to leadership positions for Small Business Banking, BT Financial Group and Group Customer Transformation. Prior to this appointment, Alastair was General Manager for the Westpac Commercial Business Bank. |
48 | 2019 Westpac Group Annual Report | |
| | |
Directors’ report
3. Report on the business
a) Principal activities
The principal activities of the Group during the financial year ended 30 September 2019 were the provision of financial services including lending, deposit taking, payments services, investment platforms, superannuation and funds management, insurance services, leasing finance, general finance, interest rate risk management and foreign exchange services.
From 30 June 2019 and 30 September 2019 respectively, Westpac ceased to provide personal financial advice through its salaried BT Financial Group planners or its authorised representatives. Other than this change, there have been no significant changes in the nature of the principal activities of the Group during 2019.
b) Operating and financial review
The net profit attributable to owners of Westpac Banking Corporation for 2019 was $6,784 million, a decrease of $1,311 million or 16% compared to 2018. Key features of this result were:
· Net interest income increased $402 million or 2% compared to 2018 driven by an increase of $686 million due to the reclassification of line fees from net fee income to interest income, partly offset by $239 million increase in provisions for estimated customer refunds, payments, associated costs, and litigation. Excluding the impact of these items, net interest income was flat compared to 2018. Average interest earning assets grew 3% primarily from Australian and New Zealand housing, broadly offset by a lower margin. Reported net interest margin decreased 1 basis point to 2.12%.
· Net fee income decreased $769 million or 32% compared to 2018 primarily due to the reclassification of line fees to net interest income ($667 million in 2018) and $126 million increase in provisions for estimated customer refunds, payments, associated costs and litigation.
· Net wealth management and insurance income decreased $1,032 million or 50% compared to 2018 primarily due to additional provisions for estimated customer refunds, payments, associated costs, and litigation of $531 million, higher general insurance claims from severe weather events $69 million, cessation of grandfathered advice commissions $42 million, lower wealth management income due to changes in platform pricing structure, and exit of the Hastings business in 2018.
· Trading income decreased $16 million or 2% compared to 2018. The decline mainly relates to a change in methodology in derivative valuation adjustments partially offset by higher non-customer income.
· Other income is up $57 million or 79% compared to 2018, primarily due to the non-repeat of a 2018 impairment charge on an equity holding of $104 million.
· Operating expenses increased $540 million or 6% compared to 2018. The increase was mainly due to a $349 million increase in provisions for estimated customer refunds, payments, associated costs, and litigation, higher technology expenses of $174 million, a rise in regulatory, compliance and investment related spend of $170 million, partially offset by the exit of the Hastings business in 2018 of $158 million and a net productivity benefit.
· Impairment charges were $84 million or 12% higher compared to 2018. Asset quality remained sound, with stressed exposures as a percentage of total committed exposures at 1.20%, up 12 basis points over the year.
A review of the operations of the Group and its divisions and their results for the financial year ended 30 September 2019 is set out in Section 2 of the Annual Report under the sections ‘Review of Group operations’ (see pages 91 to 107), ‘Divisional performance’ (see pages 108 to 119) and ‘Risk and risk management’ (see pages 120 to 139), which form part of this report.
Further information about our financial position and financial results is included in the financial statements in Section 3 of this Annual Report (see pages 153 to 303), which form part of this report.
c) Dividends
Since 30 September 2019, Westpac has announced a final ordinary dividend of 80 cents per Westpac ordinary share, totalling approximately $2,791 million for the year ended 30 September 2019 (2018 final ordinary dividend of 94 cents per Westpac ordinary share, totalling $3,227 million). The dividend will be fully franked and will be paid on 20 December 2019.
An interim ordinary dividend for the current financial year of 94 cents per Westpac ordinary share for the half year ended 31 March 2019, totalling $3,239 million, was paid as a fully franked dividend on 24 June 2019 (2018 interim ordinary dividend of 94 cents per Westpac ordinary share, totalling $3,213 million). The payment comprised direct cash disbursements of $2,080 million with $1,159 million being reinvested by participants through the DRP.
Further, in respect of the year ended 30 September 2018, a fully franked final dividend of 94 cents per ordinary share totalling $3,227 million was paid on 20 December 2018. The payment comprised direct cash disbursements of $2,897 million with $330 million, being reinvested by participants through the DRP.
New shares were issued under the DRP for each of the 2018 final ordinary dividend and the 2019 interim ordinary dividend.
| 2019 Westpac Group Annual Report | 49 |
| | |
Directors’ report
d) Significant changes in state of affairs and events during and since the end of the 2019 financial year
Throughout the financial year ended 30 September
2019, the Group has operated in a challenging external environment, which has included ongoing and heightened scrutiny across the industry (including as a result of the Royal Commission into Misconduct in the Banking, Superannuation and Financial Services Industry and self-assessments into governance, culture and accountability), as well as challenging economic conditions (refer to the section ‘External environment’ for more details).
In this environment, significant changes in the state of affairs of the Group were:
· changes to Westpac’s wealth strategy, which resulted in major BT Financial Group businesses being realigned into the Consumer and Business divisions and exiting the provision of personal financial advice by Westpac Group salaried financial advisers and authorised representatives;
· compliance, reputation and remediation provisions;
· APRA applying an additional $500 million to Westpac’s operational risk capital requirement as a result of Westpac’s self-assessment into its culture, governance and accountability;
· the issuance of approximately A$1.42 billion AT1 securities, known as Westpac Capital Notes 6, which qualify as Additional Tier 1 capital under APRA’s capital adequacy framework, as well as the transfer and redemption of approximately A$1.38 billion Westpac Capital Notes; and
· ongoing regulatory changes and developments, which have included changes relating to financial services, the expansion of penalties for financial sector misconduct, the provision of new powers to regulators, accounting standards, access to data, information security and other regulatory requirements.
For a discussion of these matters, please refer to ‘Significant developments’ in Section 1 of the Annual Report, which forms part of this report (see pages 7 to 14).
On 4 November 2019, Westpac announced that it will be undertaking an underwritten placement of fully paid ordinary shares in Westpac to sophisticated and institutional investors to raise $2 billion. As further announced, following the placement, Westpac will make a share purchase plan available to eligible shareholders and is targeting to raise approximately $500 million.
The proceeds received under the placement and share purchase plan will be used to strengthen Westpac’s regulatory capital position.
Other than set out above, the Directors are not aware of any other matter or circumstance that has occurred since 30 September 2019 that has significantly affected or may significantly affect the operations of the Group, the results of these operations or the state of affairs of the Group in subsequent financial years.
e) Business strategies, developments and expected results
Our business strategies, prospects and likely major developments in the Group’s operations in future financial years and the expected results of those operations are discussed below and in ‘Significant developments’ in Section 1 of the Annual Report (see pages 7 to 14), which forms part of this report.
External environment
2019 has been another challenging period for financial services companies, including Westpac. In particular, the Royal Commission into Misconduct in the Banking, Superannuation and Financial Services Industry, combined with self-assessments into governance, culture and accountability conducted across the industry have brought to light examples of poor behaviour affecting customers, shortcomings in the management of non-financial risks, and weak risk cultures. These have added to the erosion of public sentiment and trust in the financial services industry. Westpac has taken these developments very seriously and is now working to respond to the findings of the Royal Commission’s final report (released 1 February 2019) and its own CGA self-assessment. At the same time, the Group has been focused on identifying where we got it wrong for customers and putting things right. These efforts aim to strengthen the Group’s focus on leadership, governance and culture, and create better outcomes for customers and shareholders.
These issues for Westpac, and the sector, have been accompanied by a weakening in the economic environment with lower GDP growth, continued weak wages growth and subdued business and consumer sentiment. At the same time, interest rates have fallen to unprecedented lows. For financial services, this has contributed to more cautious demand for lending, a decline in deposit growth, lower house prices, and structural pressures on net interest margins. While credit growth has slowed, competition has remained intense across the sector including from domestic and international banks, and from non-banks.
Business Strategy
The changing environment in which we operate has reinforced the need to deliver better customer outcomes and experiences, and underlined the importance of continuing to deliver on our vision and strategy, including the Service Revolution.
Westpac’s vision is ‘To be one of the world’s great service companies, helping our customers, communities and people to prosper and grow’.
In delivering on our strategy, we are focused on our core markets, including Australia and New Zealand, where we provide a comprehensive range of financial products and services that we believe assist us in meeting the financial services needs of customers.
With over 14 million customers1, our focus is on organic growth, growing customer numbers in our chosen segments and building stronger and deeper customer relationships.
1. All customers with an active relationship (excludes channel only and potential relationships) as at 30 September 2019.
50 | 2019 Westpac Group Annual Report | |
| | |
Directors’ report
A key element of this approach is our portfolio of financial services brands, which we believe enables us to appeal to a broader range of customers and provides us with the flexibility to offer solutions that better meet individual customer needs.
As we continue to build the business, the financial services environment remains challenging and has required us to maintain focus on our financial position. This has involved:
· maintaining the high level and quality of our capital;
· continuing to improve our funding and liquidity position; and
· seeking to maintain a high level of asset quality and appropriate provisioning.
We continue to focus on ways to simplify our business to make it easier for customers to do business with us and to make work better for our people. We believe these improvement efforts deliver better customer outcomes while also creating capacity for investment.
Throughout 2019 we continued our focus on seeking to deliver positive outcomes for our customers and shareholders through our Service Revolution transformation.
The Service Revolution is seeking to:
· provide a truly personal service for customers while better anticipating their needs;
· put customers in control of their finances;
· respond to the increased pace of innovation, disruption and changing customer behaviours through digitisation and increasing our capacity for innovation; and
· innovate and simplify to reinvent the customer experience.
As part of our delivery of the Service Revolution, we have developed an integrated, multi-year plan that will be executed across the Group. In 2019, we continued to deliver outcomes and milestones on a number of our transformation programs focused on the digitisation of the company through the design and development of a single bank technology infrastructure. We expect this will transform customer experiences and drive operational efficiency. At the same time, we believe our divisional transformation programs continue to deliver market-leading customer services, while lowering the cost to serve.
Over the year, substantial work has also continued on conduct and culture, with work focused on continuing to strengthen our conduct management across the Group. Much of the effort this year has been focused on improving customer outcomes and on our product reviews, as well as working to ensure we meet customer and community expectations. We are continuing to make adjustments and improvements to our business. In addition, work continues on ensuring that we are responding to the changing regulatory and industry landscape.
Sustainability is part of our strategy of seeking to anticipate and shape the most pressing emerging social issues where we have the skills and experience to make a meaningful difference and drive business value. Our approach makes sustainability part of the way we do business, embedded in our strategy, values, culture and processes.
Supporting our customer-focused strategy is a strong set of company-wide values, which are embedded in our culture. These are:
· integrity;
· service;
· one team;
· courage; and
· achievement.
In delivering our strategy, we have a set of strategic priorities that help guide our activities:
Customer Franchise
· Deliver great customer outcomes;
· Create best-in-class service experience;
· Enable channels to work together seamlessly; and
· Maintain strong and differentiated brand portfolio.
Digital transformation
· Build out data infrastructure and capabilities;
· Transform our platforms;
· Strengthen partnerships to efficiently close capability gaps; and
· Create new digital experiences for customers.
Performance discipline
· Uplift risk management capability;
· Get it right;
· Enhance execution proficiency; and
· Drive structural cost reduction.
Competition
The Group operates in a highly competitive environment.
We serve the banking, wealth and risk management needs of customer segments from consumers and small businesses through to large corporate and institutional clients. The Group competes with other financial services providers in every segment and every product or service. Our competitors include financial services and advisory companies such as banks (both domestic and global), investment banks, credit unions, building societies, mortgage originators, credit card issuers, brokerage firms, fund and asset management companies, insurance companies, online financial services providers, and technology companies large and small.
Like other financial services providers, our competitive position across customer segments, products and geographies is determined by a variety of factors. These include:
· the quality, range, innovation and pricing of products and services offered;
· digital and technology solutions;
· customer service quality and convenience;
· the effectiveness of, and access to, distribution channels;
· brand reputation and preference;
· the types of customers served; and
· the talent and experience of our employees.
| 2019 Westpac Group Annual Report | 51 |
| | |
Directors’ report
We also operate in an environment where digital innovation is changing the competitive landscape. We compete on our ability to offer new products and services that align to evolving customer preferences. The competitive nature of the industry means that if we are not successful in developing or introducing new products and services, or in responding or adapting to changes in customer preferences and habits, we could lose customers to our competitors.
Competition within Australia’s financial system is evidenced by both the significant number of providers and the range of products and services available to customers. In Australia, competition for both deposits and lending continues to be fierce, both from established banks as well as new entrants, including technology firms. Slowing growth in some sectors has heightened competitive intensity as financial institutions work to win new customers and retain existing ones.
In our wealth businesses, we expect the broader competitive landscape to continue to undergo significant change with ongoing consolidation in life insurance, increased overseas interest and participation in superannuation.
In New Zealand, the Group is experiencing strong competition as banks vie for new customers and seek to retain existing ones. Competition for deposits and lending remains intense.
Outlook1
The Australian economy had a below-trend year with annual growth to the June quarter 2019 at only 1.4% which was below population growth of 1.6%.
Growth has been uneven as private spending contracted over the year while government spending and exports accounted for all of Australia’s growth. Weakness in the private sector largely reflects a contraction in building activity, particularly centred around residential property, and continuing weakness in wages which is constraining consumer spending. The softer Australian growth combined with the slowdown in the world economy is also impacting business confidence and investment plans.
Progress in dealing with the shocks to the global outlook from the trade disputes, particularly between the US and China, will be important for the outlook for the global economy and the flow-on effect on business confidence and investment plans in Australia.
Looking ahead, the Group expects GDP growth to lift somewhat through the remainder of 2019 and into 2020. This scenario is expected to be supported by interest rate cuts, the lower Australian dollar, targeted income tax cuts, and a recovery in housing sentiment.
Nevertheless, GDP growth is likely to remain below longer term averages (of closer to 2.75%) at 2.3% for calendar year 2019 and 2.4% for calendar year 2020. Weakness in wage growth is likely to persist while the contraction in the residential construction cycle will extend well into 2020. The Group expects the recent recovery in house prices, particularly in Sydney and Melbourne, to extend into 2020, providing some boost to households who, nevertheless, are likely to remain cautious on further increasing debt levels.
With the Commonwealth budget expected to return to surplus in 2019/20, the Commonwealth government may initiate additional stimulus in 2020 to assist the recovery as further stimulus from monetary policy appears to be limited.
With the RBA cash rate having been reduced from 1.5% to 0.75% over the course of 2019, one more rate cut is expected in early 2020 to 0.5%. Following that move, if further stimulus is required, the RBA may adopt unconventional monetary policies which may include asset purchases or long term funding for financial institutions.
Credit growth for the Australian financial system slowed to 2.7% in the year to September 2019, down from 4.5% a year earlier. That included a slowdown in housing credit to 3.1% from 5.4% and business to 3.3% from 3.8% with personal credit contracting by 4.4% after declining by 1% a year earlier.
For the year ending 30 September 2020, total system credit growth is expected to lift to 3%, with housing credit growth rising to 3.5%. The lift in housing credit growth is expected to reflect the improving conditions in major housing markets, particularly following the more recent rise in lending approvals. Business credit growth is likely to expand by 3% in the year to 30 September 2020 while other personal credit is expected to contract by a further 2%.
Economic conditions in New Zealand have also softened over the year; in part due to the deterioration in the global back drop which has dampened conditions in export sectors. Domestic New Zealand conditions have also softened with sluggish consumer spending and weak business confidence. Conditions in New Zealand are likely to remain muted for the remainder of 2019 followed by an expected improvement in 2020 supported by lower interest rates, some fiscal stimulus, and the competitive (lower) New Zealand dollar.
The environment for financial services companies is expected to continue to be impacted by the actions flowing from the Royal Commission into Misconduct in the Banking, Superannuation and Financial Services Industry that released its final report in February 2019. The sector will remain focused on implementing the recommendations of the Royal Commission and other company specific reviews. At the same time, regulators have indicated that they will be taking a more active position in prosecuting cases of misconduct as well as stepping up supervisory actions. This will likely see associated costs remain high for the sector in the period ahead.
In addition, regulators in Australia and New Zealand have a number of reviews underway, in many areas including mortgage pricing, remuneration, and capital/ risk weighted asset methodologies across the sector. Further clarity on these reviews is expected in the year ahead.
1. All data and opinions under ‘Outlook’ are generated by our internal economists and management.
52 | 2019 Westpac Group Annual Report | |
| | |
Directors’ report
Westpac Group remains focused on executing our vision of being one of the world’s great service companies, with three strategic priorities assisting this transformation. These are:
· Customer franchise - continuing to build the Group’s customer base while also increasing the depth of customer relationships. The Group seeks to do this via superior service, as measured by NPS, and by expanding our share of customers that call us their main financial institution. The priority will be supported by our strong portfolio of brands and also recognises that leading in services requires a high quality, diverse and engaged workforce;
· Digital transformation - utilising technology to materially improve efficiency and reduce the Group’s cost to income ratio to below 40% in the medium term. This will include completing the modernisation of the Group’s technology platforms, and migrating more activity to digital that will assist in the continued restructuring of the Group’s distribution network and create new experiences for customers. At the same time we’ve developed some unique fintech partnerships that will provide new services and close capability gaps; and
· Performance discipline – continuing to be prudent in the management of capital, funding and liquidity; managing returns effectively seeking to achieve a superior ROE to the peer average and remaining disciplined and targeted on asset growth. At the same time the group is focused on improving its ability to execute on its plans with a focus on leadership.
In the period ahead, a key focus will be to resolve outstanding issues, including our response to the findings of the Royal Commission and our own CGA self-assessment. At the same time we are looking to enhance our processes and controls in areas such as financial crime, end-to-end lending, compliance, and risk management. As a result, investment across these areas, is expected to lead to higher costs in 2020.
At the same time, we have already provided for customer payments and refunds where we may not have, or have not been able to sufficiently demonstrate that we have, done the right thing for customers. Our review of historical practices will continue into 2020 and further provisions may be required. We will also focus on refunding customers as quickly as practical where needed.
The low interest rate environment also has an impact on bank earnings and should interest rates be reduced further it is likely to place additional pressure on earnings and returns, as the ability to fully reprice lending and deposits to account for even lower interest rates is limited.
Our lending growth is expected to be modest in the year ahead, partly reflecting the low system growth but also due to our decision to remain disciplined on margins and from low mortgage growth. Mortgage volume declined late in FY19 and are expected to ease further in the early part of FY20. Growth should then recover through the year as the resolution of some process issues gradually sees new applications improve and outflows slow.
Wealth management income is also expected to be lower over the year, from our decisions to exit financial planning, eliminate grandfathered commission payments and change pricing on our wealth administration platforms. The impact of regulatory change may also reduce wealth and insurance income in the year ahead.
On capital, our current capital raising will further lift the Group’s CET1 capital ratio and, based on the current outlook and our capital settings, the Group will increase its buffer over APRA’s unquestionably strong benchmark for CET1 capital ratio of over 10.5%.
Given the strength of our customer franchise, and our balance sheet, we believe we are well placed to respond to any changes in the operating environment or regulatory requirements.
Looking ahead, with our strong positioning, disciplined growth, solid portfolio of businesses, and good progress on our strategic priorities, Westpac believes it is well positioned to continue delivering sound outcomes for shareholders and customers.
Further information on our business strategies and prospects for future financial years and likely developments in our operations and the expected results of operations have not been included in this report because the Directors believe it would be likely to result in unreasonable prejudice to us.
f) Risks to our financial performance, position and our operations
Our financial position, our future financial results, our operations and the success of our strategy are subject to a range of risks. These risks are set out and discussed in Section 2 of this Annual Report under the section ‘Risk and risk management’, which forms part of this report (see pages 120 to 139).
| 2019 Westpac Group Annual Report | 53 |
| | |
Directors’ report
4. Directors’ interests
a) Directors’ interests in securities
The following particulars for each Director are set out in the Remuneration Report in Section 10 of the Directors’ report for the year ended 30 September 2019 and in the tables below:
· their relevant interests in our shares or the shares of any of our related bodies corporate;
· their relevant interests in debentures of, or interests in, any registered managed investment scheme made available by us or any of our related bodies corporate;
· their rights or options over shares in, debentures of, or interests in, any registered managed investment scheme made available by us or any of our related bodies corporate; and
· any contracts:
– to which the Director is a party or under which they are entitled to a benefit; and
– that confer a right to call for or deliver shares in, debentures of, or interests in, any registered managed investment scheme made available by us or any of our related bodies corporate.
Directors’ interests in Westpac and related bodies corporate as at 4 November 2019
| Number of Relevant Interests in Westpac Ordinary Shares | Number of Westpac Share Rights |
Westpac Banking Corporation | | |
Current Directors | | |
Lindsay Maxsted | 23,602 | - |
Brian Hartzer | 151,4781 | 636,5402 |
Nerida Caesar | 13,583 | - |
Ewen Crouch | 78,4503 | - |
Alison Deans | 14,392 | - |
Craig Dunn | 8,869 | - |
Anita Fung | - | - |
Steven Harker | 10,365 | |
Peter Marriott | 20,870 | - |
Peter Nash | 8,020 | - |
Margaret Seale | 21,7194 | |
Former Directors | | |
Peter Hawkins | 15,8805 | - |
1. Brian Hartzer’s interest in Westpac ordinary shares includes 20,933 restricted shares held under the CEO Restricted Share Plan.
2. Share rights issued under the CEO Long Term Variable Plan.
3. Ewen Crouch and his related bodies corporate also hold relevant interests in 250 Westpac Capital Notes 2.
4. Margaret Seale and her related bodies corporate also hold relevant interests in 3,220 Westpac Capital Notes 2.
5. Figure displayed is as at Peter Hawkins’s retirement date of 12 December 2018, at which point Peter Hawkins and his related bodies corporate also held relevant interests in 850 Capital Notes 3, 882 Westpac Capital Notes 4 and 1,370 Westpac Capital Notes 5.
Note: Certain subsidiaries of Westpac offer a range of registered schemes. The Directors from time to time invest in these schemes and are required to provide a statement to the ASX when any of their interests in these schemes change. ASIC has exempted each Director from the obligation to notify the ASX of a relevant interest in a security that is an interest in BT Cash Management Trust (ARSN 087 531 539), BT Premium Cash Fund (ARSN 089 299 730), Westpac Cash Management Trust (ARSN 088 187 928) or Advance Cash Multi-Blend Fund (ARSN 094 113 050).
54 | 2019 Westpac Group Annual Report | |
| | |
Directors’ report
b) Indemnities and insurance
Under the Westpac Constitution, unless prohibited by statute, we indemnify each of the Directors and Company Secretaries of Westpac and of each of our related bodies corporate (except related bodies corporate listed on a recognised stock exchange), each employee of Westpac or our subsidiaries (except subsidiaries listed on a recognised stock exchange), and each person acting as a responsible manager under an Australian Financial Services Licence of any of Westpac’s wholly-owned subsidiaries against every liability (other than a liability for legal costs) incurred by each such person in their capacity as director, company secretary, employee or responsible manager, as the case may be; and all legal costs incurred in defending or resisting (or otherwise in connection with) proceedings, whether civil or criminal or of an administrative or investigatory nature, in which the person becomes involved because of that capacity.
Each of the Directors named in this Directors’ report and each of the Company Secretaries of Westpac has the benefit of this indemnity.
Consistent with shareholder approval at the 2000 Annual General Meeting, Westpac has entered into a Deed of Access and Indemnity with each of the Directors, which includes indemnification in identical terms to that provided in the Westpac Constitution.
Westpac also executed a deed poll in September 2009 providing indemnification equivalent to that provided under the Westpac Constitution to individuals acting as:
· statutory officers (other than as a director) of Westpac;
· directors and other statutory officers of wholly-owned subsidiaries of Westpac; and
· directors and statutory officers of other nominated companies as approved by Westpac in accordance with the terms of the deed poll and Westpac’s Contractual Indemnity Policy.
Some employees of Westpac’s related bodies corporate and responsible managers of Westpac and its related bodies corporate are also currently covered by a deed poll that was executed in November 2004, which is on similar terms to the September 2009 deed poll.
The Westpac Constitution also permits us, to the extent permitted by law, to pay or agree to pay premiums for contracts insuring any person who is or has been a Director or Company Secretary of Westpac or any of its related bodies corporate against liability incurred by that person in that capacity, including a liability for legal costs, unless:
· we are forbidden by statute to pay or agree to pay the premium; or
· the contract would, if we paid the premium, be made void by statute.
Under the September 2009 deed poll, Westpac also agrees to provide directors’ and officers’ liability insurance to Directors of Westpac and Directors of Westpac’s wholly-owned subsidiaries.
For the year ended 30 September 2019, the Group has insurance cover which, in certain circumstances, will provide reimbursement for amounts which we have to pay under the indemnities set out above. That cover is subject to the terms and conditions of the relevant insurance, including but not limited to the limit of indemnity provided by the insurance. The insurance policies prohibit disclosure of the premium payable and the nature of the liabilities covered.
c) Share rights outstanding
As at the date of this report there are 4,225,250 share rights outstanding in relation to Westpac ordinary shares. The latest dates for exercise of the share rights range between 1 October 2020 and 1 July 2034.
Holders of outstanding share rights in relation to Westpac ordinary shares do not have any rights under the share rights to participate in any share issue or interest of Westpac or any other body corporate.
d) Proceedings on behalf of Westpac
No application has been made and no proceedings have been brought or intervened in, on behalf of Westpac under section 237 of the Corporations Act.
| 2019 Westpac Group Annual Report | 55 |
| | |
Directors’ report
5. Environmental disclosure
As part of our 2019 Sustainability Strategy, we have set targets for our environmental performance to 2020.
The Westpac Group’s environmental framework starts with ‘Our Principles for Doing Business’, which outline our broad environmental principles. This framework includes:
· our Westpac Group Environment Policy, which has been in place since 1992;
· our Sustainability Risk Management Framework;
· our Climate Change Position Statement and 2020 Action Plan;
· our Responsible Sourcing Code of Conduct; and
· public reporting of our environmental performance.
We also participate in a number of voluntary initiatives including the Dow Jones Sustainability Index (#9 in global banking group and above our Australian peers), CDP1, the Equator Principles, the Principles for Responsible Banking, the Principles for Responsible Investment and the United Nations Global Compact.
The National Greenhouse and Energy Reporting Act 2007 (Cth) (NGER) came into effect in July 2008. The Group reports on greenhouse gas emissions, energy consumption and production under the NGER for the period 1 July through 30 June each year.
Our operations are not subject to any other significant environmental regulation under any law of the Commonwealth of Australia or of any state or territory of Australia. We may, however, become subject to environmental regulation as a result of our lending activities in the ordinary course of business and we have policies in place to ensure that this potential risk is addressed as part of our normal processes.
We have not incurred any liability (including for rectification costs) under any environmental legislation.
Westpac has reported its performance against the recommendations of the Task Force on Climate-related Financial Disclosures (TCFD) in Section 2 of this Annual Report under the sections titled ‘Risk and risk management – climate change risk’ (see pages 136 to 138); and ‘Climate-related financial disclosures (see page 146). Further information about Westpac’s sustainability performance and approach is also included in Section 2 of this Annual Report under the sections ‘Risk and Risk Management’ (see pages 120 to 139) and ‘Westpac’s approach to sustainability’ (see pages 140 to 150).
6. Human rights supply chain disclosure
Westpac’s overall approach to human rights is set out in our Westpac Group Human Rights Position Statement, and this references our Responsible Sourcing Code of Conduct as the primary framework for managing human rights in our supply chain.
The Group is subject to the United Kingdom’s Transparency in Supply Chains provisions under the Modern Slavery Act 2015, which came into effect in March 2015. Westpac releases an annual statement each year for the period ended 30 September to disclose the steps taken during the year to help prevent modern slavery from occurring within the Group’s operations and supply chain.
The Group is subject to the Commonwealth of Australia’s Modern Slavery Act 2018 (Cth), with the first reporting year being 2020 and the first report being due six months from the end of 30 September 2020.
7. Rounding of amounts
Westpac is an entity to which ASIC Corporations Instrument 2016/191 dated 24 March 2016, relating to the rounding of amounts in directors’ reports and financial reports, applies. Pursuant to this Instrument, amounts in this Directors’ report and the accompanying financial report have been rounded to the nearest million dollars, unless indicated to the contrary.
8. Political engagement
In line with Westpac policy, no cash donations were made to political parties during the financial year ended 30 September 2019.
In Australia, political expenditure for the financial year ended 30 September 2019 was $166,650. This relates to payment for participation in legitimate political activities where they were assessed to be of direct business relevance to Westpac. Such activities include business observer programs attached to annual party conferences, policy dialogue forums and other political functions, such as speeches and events with industry participants.
In New Zealand, political expenditure for the financial year ended 30 September 2019 was NZD$20,170.
1. Formerly known as the Carbon Disclosure Project.
56 | 2019 Westpac Group Annual Report | |
| | |
Directors’ report
9. Directors’ meetings
Each Director attended the following meetings of the Board and Committees of the Board during the financial year ended 30 September 2019:
| Notes | Board | Audit Committee | Risk & Compliance Committee | Nominations Committee | Remuneration Committee | Technology Committee |
Number of meetings | | | | | | | | | | | | | |
held during the year | | | | | | | | | | | | | |
Director | | A | B | A | B | A | B | A | B | A | B | A | B |
Lindsay Maxsted | 1 | 11 | 11 | 6 | 6 | 5 | 5 | 4 | 4 | n/a | n/a | n/a | n/a |
Brian Hartzer | 2 | 11 | 11 | n/a | n/a | n/a | n/a | n/a | n/a | n/a | n/a | 4 | 4 |
Nerida Caesar | 3 | 11 | 11 | n/a | n/a | 5 | 5 | n/a | n/a | n/a | n/a | 4 | 4 |
Ewen Crouch | 4 | 11 | 11 | 4 | 4 | 5 | 5 | 4 | 4 | 6 | 6 | n/a | n/a |
Alison Deans | 5 | 11 | 11 | n/a | n/a | 5 | 5 | 4 | 4 | 6 | 6 | 4 | 4 |
Craig Dunn | 6 | 11 | 11 | n/a | n/a | 5 | 5 | 4 | 4 | 6 | 6 | n/a | n/a |
Anita Fung | 7 | 11 | 11 | n/a | n/a | 5 | 5 | n/a | n/a | n/a | n/a | n/a | n/a |
Steven Harker | 8 | 7 | 7 | n/a | n/a | 3 | 3 | n/a | n/a | n/a | n/a | n/a | n/a |
Peter Hawkins | 9 | 3 | 3 | 2 | 2 | 1 | 1 | n/a | n/a | n/a | n/a | 1 | 1 |
Peter Marriott | 10 | 11 | 11 | 6 | 6 | 5 | 5 | 4 | 4 | n/a | n/a | 4 | 4 |
Peter Nash | 11 | 11 | 11 | 6 | 6 | 5 | 5 | n/a | n/a | n/a | n/a | n/a | n/a |
Margaret Seale | 12 | 7 | 7 | n/a | n/a | 3 | 3 | n/a | n/a | n/a | n/a | n/a | n/a |
This table shows membership of standing Committees of the Board. From time to time the Board may form other committees or request Directors to undertake specific extra duties.
A – Meetings eligible to attend as a member B – Meetings attended as a member
Unless otherwise stated, each Director has been a member, or the Chairman, of the relevant Committee for the whole of the period from 1 October 2018.
1. Chairman of the Board Nominations Committee. Member of the Board Audit Committee and the Board Risk & Compliance Committee.
2. Member of the Board Technology Committee.
3. Member of the Board Risk & Compliance Committee and Board Technology Committee.
4. Chairman of the Board Risk & Compliance Committee. Member of the Board Nominations Committee and the Board Remuneration Committee, and from 1 January 2019, a member of the Board Audit Committee.
5. Chairman of the Board Technology Committee. Member of the Board Nominations Committee, Board Remuneration Committee and Board Risk & Compliance Committee.
6. Chairman of the Board Remuneration Committee. Member of the Board Risk & Compliance Committee and the Board Nominations Committee.
7. Member of the Board Risk & Compliance Committee.
8. Steven Harker was appointed as a Director and member of the Board Risk & Compliance Committee on 1 March 2019.
9. Peter Hawkins retired from the Board and its Committees on 12 December 2018.
10. Chairman of the Board Audit Committee. Member of the Board Nominations Committee, Board Risk & Compliance Committee and the Board Technology Committee.
11. Member of the Board Audit Committee and Board Risk & Compliance Committee.
12. Margaret Seale was appointed as a Director and member of the Board Risk & Compliance Committee on 1 March 2019.
| 2019 Westpac Group Annual Report | 57 |
| | |
Directors’ report
10. Remuneration Report
Introduction from the Chairman of the Board Remuneration Committee

| | 2019 was
a year of reflection
for the Company
and the Board |
| Craig Dunn, Chairman Board Remuneration Committee |
Dear shareholders,
On behalf of the Board, I am pleased to present Westpac’s 2019 Remuneration Report.
2019 Group performance
As outlined in the Chairman’s report and the CEO’s annual letter, 2019 has been another challenging period for financial services companies, including Westpac.
Examples of poor behaviour affecting customers, shortcomings in the management of non-financial risks and poor risk cultures have been at the heart of challenges faced by the industry.
These issues have been accompanied by slowing economic activity, further falls in interest rates, a decline in house prices and weak business and consumer confidence. These operating conditions have contributed to more cautious demand for lending, a decline in deposit growth and intense competition as more lenders target a smaller pool of new lending.
With this backdrop, Westpac reported cash earnings of $6,849 million in 2019, a reduction of 15% compared to the prior year. Our performance in 2019 was impacted by estimated customer refunds, payments, associated costs, and litigation, as well as costs incurred with the restructuring of the Wealth business. Excluding these items, cash earnings in 2019 were $7,979 million, down 4% relative to 2018.
While earnings were lower, our common equity tier 1 ratio was 10.67% at 30 September 2019 and our liquidity ratios were well above regulatory minimums. Asset quality has remained sound and the overall level of stressed assets remained at low levels over the year.
Recognising that much work has commenced on improving our approach to non-financial risks, progress in resolving risk and compliance matters has fallen short of our expectations. Resolution of these matters and continued investment in non-financial risk management remain a focus.
Through the year we have continued to improve service for customers, particularly via new digital self-serve options and an enhanced approach to capturing and responding to complaints. Investments in our technology infrastructure have improved the stability and speed of our systems and improved availability for customers.
2019 remuneration outcomes
Westpac’s short term variable reward (STVR) is designed to ensure a significant portion of remuneration is variable, at-risk and linked to the delivery of agreed plan targets for financial and non-financial measures.
The STVR outcome can range from 0% to 100% depending on performance relative to targets agreed at the beginning of the year, or exceed 100% when exceptional performance is achieved.
The targets for STVR sign-post those areas of focus that the Board regards as most critical for management and which encourage the achievement of stretch performance while operating within appropriate risk settings. Long term variable reward (LTVR) is designed to further align the interests of executives with those of shareholders by rewarding the delivery of sustained Group performance over the long term.
Key remuneration outcomes for 2019 include:
· The CEO’s STVR award was zero;
· The average 2019 STVR outcome for Group Executives was 56% of the target opportunity, down from 87% in 2018;
· The 2016 LTVR lapsed in full;
· The 2020 total target remuneration has been reduced by 23% and 12.5% for the CEO and Group Executives, respectively reflecting changes made to LTVR; and
· Board fees were reduced by 20% as a one-off measure.
Further detail regarding the key remuneration outcomes for the CEO, Group Executives and Non-executive Directors is provided on the following page, and in sections 3, 6 and 7 of the Remuneration Report.
58 | 2019 Westpac Group Annual Report | |
| | |
Directors’ report
| Chief Executive Officer | | · | The CEO recommended to the Board that he forego his STVR for this year. The Board separately considered the matter and determined that a zero STVR outcome for 2019 for the CEO was appropriate to reflect accountability for poor non-financial risk and financial outcomes, as well as some poor customer outcomes, including those highlighted at the Royal Commission. |
| | |
| · | The 2016 LTVR lapsed in full because the relative TSR and cash EPS performance hurdles were not achieved. The CEO has not received a share-based payment under the LTVR for four consecutive years, equating to $15.96 million worth of lapsed performance share rights over that period. This result is aligned with shareholder outcomes over the period. |
| | |
| · | In 2019, the CEO received $2.69 million in fixed remuneration and $1.33 million in deferred STVR awarded in prior years that vested during the year, equalling $4.02 million in total realised remuneration (i.e. take-home pay). This outcome is 33% of the maximum remuneration he could have received for the year. |
| | |
| · | For 2020, the CEO’s total target remuneration (comprising fixed remuneration, target STVR and LTVR opportunity at face value) has been reduced by 23% as a result of changes made to LTVR, as outlined below. |
| | |
| · | The CEO has not received a total target remuneration increase since his appointment in 2015. |
| | | | |
| Group Executives | | · | Group Executives received between 0% and 83% of their 2019 STVR target opportunity. The average 2019 STVR outcome for Group Executives was 56% of the target opportunity, down from 87% in 2018. |
| · | The 2019 STVR scorecard outcome for non-financial risk measures was reduced to zero for Group Executives. In addition, downward remuneration adjustments were applied to two Group Executives and two former Group Executives in response to material risk and compliance matters that impacted the Group, in some instances reducing 2019 STVR outcomes to zero. Many of these adjustments related to events from prior periods which have continued to develop and, in some cases, for which material remediation costs were accounted for in 2019. |
| · | The Board exercised its discretion to apply downward adjustments to a portion of deferred STVR awarded in prior years for two former Group Executives. |
| · | The 2016 LTVR lapsed in full because the relative TSR and cash EPS performance hurdles were not achieved. |
| · | For 2020, the total target remuneration for Group Executives has been reduced by 12.5%, as a result of changes made to LTVR. |
| · | Given the above remuneration adjustments to current year and deferred STVR, together with changes made to the LTVR from 2020, the Board determined that further adjustments to the quantum of 2020 LTVR were not required. |
| · | David McLean (Chief Executive Officer, Westpac New Zealand) and Gary Thursby (Chief Operating Officer) received total target remuneration increases in 2019 of 10.3% and 10.4% respectively to align their remuneration with the market. David Lindberg received a total target remuneration increase in 2019 of 6% given the increased size and scale of his role on appointment as the Group Executive, Consumer. No other Group Executives received total target remuneration increases during 2019. |
| · | David Stephen (Chief Risk Officer) and Craig Bright (Chief Information Officer) were appointed as Group Executives in 2019. To attract the best international talent, the Board approved remuneration packages which are higher than those of their predecessors. The Board also approved buyout awards to compensate these executives for awards forfeited on resignation from their previous employer. |
| | | | |
| All employees | | · | The 2019 Group variable reward pool for all employees was reduced by $126 million from 2018 to align with Group performance. |
| · | In addition to the remuneration adjustments for Group Executives, downward remuneration adjustments were approved for 13 General Managers in response to material risk and compliance matters impacting the Group, ranging from 10% to 100%. |
| · | The Group managed 1,134 employee conduct matters in Australia in 2019, of which 163 employees exited the business and 545 employees were subject to formal disciplinary outcomes. A range of remuneration consequences were also applied for these matters, including ineligibility for STVR and remuneration adjustments to STVR. |
| | | | |
| Non- executive Directors | | · | The Chairman and other Non-executive Director base fees for 2019 were reduced by 20% as a one- off measure, which equated to a $162,000 reduction for the Chairman. The reduction was applied to all current Non-executive Directors in recognition of our collective accountability as the Board of Westpac for customer outcomes highlighted by the Royal Commission, shareholder sentiment leading to the first strike at the 2018 Annual General Meeting and significant non-financial risk matters. |
| 2019 Westpac Group Annual Report | 59 |
| | |
Directors’ report
First strike
Westpac received a first strike at the 2018 Annual General Meeting, with 64% of votes cast against the adoption of the 2018 Remuneration Report. This was a disappointing outcome.
In 2019, we significantly increased our engagement across different shareholder and shareholder advisory groups to better understand their concerns. In addition to ongoing meetings with shareholder advisory groups and feedback from shareholders in the normal course, we had individual and group meetings with many of our institutional shareholders and roundtable meetings with representative retail shareholders co-facilitated with the Australian Shareholders’ Association.
It is clear that our executive remuneration outcomes in 2018 were not in line with shareholder expectations. Based on the feedback from the 2018 Annual General Meeting and our more extensive consultations, the key concerns that led to the first strike included:
(1) 2018 STVR outcomes were not considered reflective of performance. Shareholders felt that the scorecard results did not reflect performance in some areas, in particular non-financial risk, and the Board did not apply enough downward discretion to the outcomes.
(2) Remuneration was considered too high, particularly for the CEO. LTVR granted to the CEO and Group Executives in 2018 was viewed as high relative to that of peers, which was partially driven by the use of fair value to determine the number of performance share rights to grant for LTVR.
(3) There was insufficient transparency in our communication with shareholders. Shareholders believed that further information was required to explain how STVR outcomes were determined.
The Board and management value these insights and appreciate your feedback and willingness to engage constructively.
Changes to remuneration
We spent significant time in 2019 reflecting on your feedback.
We completed a comprehensive review of executive remuneration including the remuneration strategy, frameworks, governance, decision-making processes, and our approach to communication.
A key objective of our review was to identify opportunities for improvement and to develop balanced solutions that consider the expectations of shareholders, shareholder advisory groups, regulators, customers and the broader community.
As a result, we have:
· Changed the LTVR allocation approach from 2020. The number of performance share rights granted to executives is now determined by the face value of shares at the grant date, instead of the fair value. We believe this approach improves transparency and is in line with changes in market practice.
· Reduced total target and maximum remuneration for executives from 2020. The Board reduced the face value of 2020 LTVR opportunities by 43% for the CEO and 23% to 25% for Group Executives. As a result, the 2020 total target remuneration has been reduced by 23% for the CEO and 12.5% for Group Executives. This means the CEO’s total target remuneration becomes comparable to that of other Australian major bank CEOs.
CEO target remuneration package ($’000)

· Reduced fees paid to Non-executive Directors for 2019. The Chairman and other current Non-executive Director base fees for 2019 were reduced by 20% as a one-off measure to recognise collective accountability as the Board of Westpac for customer outcomes highlighted by the Royal Commission, shareholder sentiment leading to the first strike at the 2018 Annual General Meeting and significant non-financial risk matters.
· Updated the CEO’s 2019 STVR scorecard. The balanced scorecard was updated to place a greater emphasis on non-financial risk management and customer outcomes.
· Improved our remuneration governance and decision-making frameworks. We further improved our approach to the assessment of material risk and compliance matters and the flow of information between Board Committees including to support the Board in determining possible remuneration adjustments.
· Enhanced our remuneration adjustment guidelines to strengthen consequence management. The guidelines build on existing policies and practices to provide greater clarity and consistency in the management of employee conduct and the application of remuneration consequences.
· Introduced clawback as an additional remuneration adjustment tool. Clawback has been introduced to enable the Board to recover deferred variable remuneration after it has vested (to the extent legally permissible) in circumstances such as serious misconduct or other conduct that may have a serious adverse impact on Westpac or its reputation, customers or people which has resulted in, or would justify, termination of employment or where otherwise required by law. Clawback will apply to variable remuneration awarded in respect of performance periods commencing on or after 1 October 2019 where conduct warranting clawback occurs after this date.
· Improved disclosure in the Remuneration Report. The Remuneration Report provides greater transparency around the rationale for remuneration decisions, seeks to clearly demonstrate the link between performance and remuneration and provides further detail in relation to Westpac’s minimum shareholding requirement in section 5.
60 | 2019 Westpac Group Annual Report | |
| | |
Directors’ report
Other changes for 2020
In addition, the Board has selected relative TSR as the performance hurdle for the 2020 LTVR plan as it believes this measure best aligns executive remuneration outcomes with long-term shareholder value creation. In recent years, cash ROE has been used as a LTVR performance hurdle in conjunction with relative TSR. The Board considers that setting an absolute cash ROE range over a three year period has become increasingly difficult in light of current uncertainties surrounding future regulatory capital requirements and interest rates, which are at historically low levels. The Board will review the 2021 LTVR plan following the release of APRA’s final regulatory framework for remuneration.
Regulatory developments
APRA is currently consulting on changes to the regulatory framework for remuneration. The Board recently provided a submission to APRA on the proposed changes which sets out Westpac’s overall support for a stronger, clearer and more consistent set of requirements. Our submission also recommends alternatives for consideration by the regulator in relation to some material aspects of the draft changes, including in relation to the proposed maximum weighting of financial performance measures used to determine variable remuneration. If enacted, some of the proposed changes would require substantial amendment to our remuneration arrangements for executives and employees. The Board will continue to review the remuneration design in 2020 following the release of APRA’s final regulatory framework.
On behalf of the Board, I invite you to read our Remuneration Report and welcome your feedback.

Craig Dunn, Chairman
Board Remuneration Committee
In this Report | |
| |
1. | Key Management Personnel | 61 |
| | |
2. | Summary of the 2019 executive reward framework | 62 |
| | |
3. | 2019 remuneration outcomes and alignment to performance | 64 |
| | |
4. | Further detail on the executive variable reward structure | 71 |
| | |
5. | Remuneration governance | 74 |
| | |
6. | Non-executive Director remuneration | 76 |
| | |
7. | Statutory remuneration details | 78 |
| 2019 Westpac Group Annual Report | 61 |
| | |
Directors’ report
1. Key Management Personnel
The remuneration of Key Management Personnel (KMP) for the Group is disclosed in the Report. In 2019, KMP comprised the CEO, Group Executives and Non-executive Directors as set out in the table below. KMP is defined as those persons having authority and responsibility for planning, directing and controlling the activities of an entity, directly or indirectly, including any director (whether executive or otherwise) of that entity.
Name | Position | Term as KMP |
Managing Director & Chief Executive Officer |
Brian Hartzer | Managing Director & Chief Executive Officer | Full Year |
Current Group Executives |
Craig Bright | Chief Information Officer | Commenced in KMP role on 4 December 2018 |
Lyn Cobley | Chief Executive, Westpac Institutional Bank | Full Year |
Peter King | Chief Financial Officer | Full Year |
Rebecca Lim | Group Executive, Legal & Secretariat | Full Year |
David Lindberg1 | Chief Executive, Consumer | Full Year |
Carolyn McCann | Group Executive, Customer & Corporate Relations | Full Year |
David McLean | Chief Executive Officer, Westpac New Zealand | Full Year |
Christine Parker | Group Executive, Human Resources | Full Year |
David Stephen | Chief Risk Officer | Full Year |
Gary Thursby2 | Chief Operating Officer | Full Year |
Alastair Welsh3 | Acting Chief Executive, Business | Commenced in KMP role on 1 April 2019 |
Former Group Executives |
Brad Cooper | Chief Executive Officer, BT Financial Group | Ceased in KMP role on 1 April 2019 |
Dave Curran | Chief Information Officer | Ceased in KMP role on 4 December 2018 |
George Frazis | Chief Executive, Consumer Bank | Ceased in KMP role on 1 April 2019 |
Current Non-executive Directors |
Lindsay Maxsted | Chairman | Full Year |
Nerida Caesar | Director | Full Year |
Ewen Crouch | Director | Full Year |
Alison Deans | Director | Full Year |
Craig Dunn | Director | Full Year |
Anita Fung | Director | Full Year |
Steven Harker | Director | Commenced in KMP role on 1 March 2019 |
Peter Marriott | Director | Full Year |
Peter Nash | Director | Full Year |
Margaret Seale | Director | Commenced in KMP role on 1 March 2019 |
Former Non-executive Director |
Peter Hawkins | Director | Retired on 12 December 2018 following the completion of the 2018 Annual General Meeting |
1. David Lindberg was the Chief Executive, Business Bank until 1 April 2019 when he was appointed as the Chief Executive, Consumer.
2. Gary Thursby’s role and title changed from Group Executive, Strategy & Enterprise Services to Chief Operating Officer on 1 April 2019.
3. Alastair Welsh was the General Manager, Commercial Banking until 1 April 2019 when he was appointed as the Acting Chief Executive, Business.
62 | 2019 Westpac Group Annual Report | |
| | |
Directors’ report
2. Summary of the 2019 executive reward framework
The delivery of our vision and strategy is supported by our remuneration strategy, principles and frameworks.
| | Westpac’s vision and strategy Westpac’s vision is to be one of the world’s great service companies, helping our customers, communities and people to prosper and grow. Our strategy seeks to deliver on our vision by building deep and enduring customer relationships, being a leader in the community, being a place where the best people want to work and, in so doing, delivering sustainable returns for shareholders. |
| | |
| | Remuneration strategy Westpac’s remuneration strategy is designed to attract and retain talented employees by rewarding them for achieving high performance and delivering superior long-term results for our customers and shareholders, while adhering to sound risk management and governance principles. |
| | |
| | Remuneration principles The remuneration strategy is underpinned by the following principles: · Align remuneration with customer and shareholder interests. · Support an appropriate risk culture and employee conduct. · Differentiate pay for behaviour and performance in line with our vision and strategy. · Provide market competitive and fair remuneration. · Enable recruitment and retention of talented employees. · Provide the ability to risk-adjust remuneration. · Be simple, flexible and transparent. |
Executive reward components
Fixed remuneration | | STVR | | LTVR |
Purpose | | | | |
Attract and retain high quality executives through market competitive and fair remuneration. | | Ensure a portion of remuneration is variable, at-risk and linked to the delivery of agreed plan targets for financial and non-financial measures that support Westpac’s strategic priorities. The STVR outcome can range from 0% to 100% of target depending on performance relative to targets agreed at the beginning of the year, or exceed 100% (up to a maximum of 150% of target) when exceptional performance is achieved. | | Align executive accountability and remuneration with the long-term interests of shareholders by rewarding the delivery of sustained Group performance over the long-term. |
Delivery | | | | |
Comprises cash salary, salary sacrificed items and superannuation contributions. | | Awarded in cash (50%) and restricted shares1 (50%) based on an assessment of performance over the preceding year. Restricted shares vest in equal portions after one and two years following grant subject to continued service and adjustment. | | Awarded in performance share rights which vest after four years subject to the achievement of relative TSR and cash ROE performance hurdles, continued service and adjustment. |
Alignment to performance | | | | |
Set with reference to market benchmarks in the financial services industry in Australia and globally as well as the size, responsibilities and complexity of the role, and the skills and experience of the executive. Individual performance impacts fixed remuneration adjustments. | | Performance is assessed using a balanced scorecard comprising: · financial and non-financial measures linked to Westpac’s key strategic priorities; and · a modifier to support the adjustment of the outcome, upwards or downwards (including to zero), for behaviour, risk and reputation matters, people management matters, and any other matters as determined by the Board. | | Performance is assessed against: · Relative TSR2 (50%) which is a comparative measure of Westpac’s performance relative to peers (measured over four years); and · Cash ROE3 (50%) which aims to reward the achievement of returns above the cost of capital while generating shareholder value (measured over a three year period with an additional one year holding lock). |
Alignment to shareholders | | | | |
Minimum shareholding requirements equivalent to five times annual fixed remuneration excluding superannuation for the CEO and $1.2 million for Group Executives. These requirements must be satisfied within five years of appointment as the CEO or as a Group Executive. | | Half of the STVR award is deferred into equity for a period of up to two years to support alignment with shareholders over the medium term. | | The LTVR is fully delivered in equity and the relative TSR and cash ROE performance hurdles are aligned to long-term shareholder returns and value creation. |
1. The Group Executive outside Australia receives deferred STVR as unhurdled share rights.
2. For the 2020 LTVR plan, the performance hurdle will be relative TSR.
3. Cash ROE is return on equity on a cash earnings basis. Cash earnings are not prepared in accordance with AAS and have not been subject to audit. Refer to Note 2 to the Financial Statements for a description of cash earnings.
| 2019 Westpac Group Annual Report | 63 |
| | |
Directors’ report
2.1. Risk
Westpac’s remuneration arrangements are designed and managed to support effective risk management, the generation of appropriate risk-based returns and the risk profile associated with our businesses which incorporate products with varying complexity and maturity profiles.
· Remuneration outcomes: The performance of the Group and each division is reviewed and measured with reference to how risk is managed in line with Westpac’s Risk Appetite Statement and the results of this review and measurement influence remuneration outcomes. The key risks that are considered include capital, credit, market, equity, liquidity, insurance, risk culture, reputation and sustainability, conduct, operational and compliance risk and financial crime. In addition, STVR outcomes are influenced by relevant risk-related matters through the Board’s application of the scorecard modifier, which is partly informed by individual risk assessments for the CEO and each Group Executive.
· Variable reward pool: Each year, the Board determines the size of the variable reward pool which funds outcomes across the Group. This is based on the Group’s performance for the year and an assessment of how profit should be shared between shareholders and employees while retaining sufficient capital for growth. The Group variable reward pool reflects financial performance including financial risk outcomes. A broad range of financial and non-financial risk measures and customer outcomes may also be taken into account when allocating the Group variable reward pool.
· Mandatory risk and compliance requirements: Individuals are only eligible to receive a fixed remuneration adjustment, STVR and LTVR where an individual has satisfied minimum requirement gates which require that behaviours are in line with Westpac’s Values and Code of Conduct and that the individual has met the risk and compliance requirements for their role and business.
· Remuneration adjustments for prior period matters: The Board may adjust all forms of unvested deferred variable reward downward, including to zero, for matters arising in a prior period if circumstances or information come to light which mean that in the Board’s view all or part of the award was not appropriate. Having decided that a downward adjustment is appropriate and determined the amount of any adjustment, typically the Board will first apply that adjustment against the STVR for the current performance period. In instances where an adjustment to current year STVR is insufficient or unavailable, the Board may apply the adjustment to unvested deferred variable reward. Clawback provides an additional mechanism to recover vested deferred variable reward in certain limited circumstances for awards made in respect of performance periods commencing on or after 1 October 2019. It is the Board’s current intention that clawback will only be considered for relevant conduct that occurred on or after 1 October 2019.
2.2. 2019 remuneration mix1
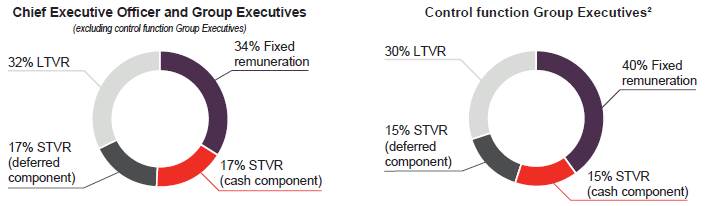
1. Based on a fair value methodology for LTVR.
2. Includes the Chief Risk Officer, the Group Executive, Legal & Secretariat, the Group Executive, Customer & Corporate Relations and the Chief Financial Officer.
2.3. Timeline of potential remuneration
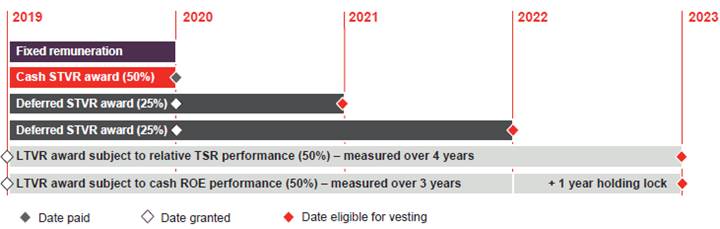
64 | 2019 Westpac Group Annual Report | |
| | |
Directors’ report
3. 2019 remuneration outcomes and alignment to performance
3.1. Snapshot of 2019 remuneration outcomes
| Short term variable reward | The assessment of performance against the CEO’s 2019 scorecard focus areas resulted in an outcome of 60% of target (40% of maximum) reflecting Group performance. This includes a zero outcome for non-financial risk measures in the scorecard. Notwithstanding this assessment, the CEO recommended to the Board that he forego his STVR for this year. The Board separately considered the matter and determined that a zero STVR outcome for 2019 was appropriate to reflect accountability for poor non-financial risk and financial outcomes, as well as some poor customer outcomes, including those highlighted at the Royal Commission. The Board adjusted the CEO’s STVR award through the modifier, as outlined in section 3.5. Westpac’s strategic priorities are cascaded from the CEO to Group Executives in combination with other relevant divisional or functional measures. STVR outcomes for Group Executives ranged from 0% to 83% of their 2019 STVR target opportunity. The 2019 scorecard outcome for non-financial risk measures was also reduced to zero for Group Executives. In addition, downward remuneration adjustments were applied to two Group Executives and two former Group Executives in response to material risk and compliance matters impacting the Group, in some instances reducing 2019 STVR outcomes to zero. 50% of the 2019 STVR awards remain subject to continued service and adjustment over a two year period. In addition, the Board exercised its discretion to apply downward adjustments to a portion of deferred STVR awarded in prior years for two former Group Executives. |
| | |
| Long term variable reward | The relative TSR and cash EPS1 performance hurdles for the 2016 LTVR were not met and therefore no LTVR vested during 2019. The Board considered that this outcome was appropriate given the Group’s performance over the relevant period. This is the fourth consecutive year where LTVR has not vested. The table below shows the vesting outcome for the 2016 LTVR award to the CEO and Group Executives that reached the end of its performance period in 2019. |
| | | | | | | | |
| | | | Performance range | | | |
| Performance
hurdle | Performance
start date | Test date | Threshold | Maximum | Outcome | % Vested | % Lapsed |
| TSR 50% of award | 1-Oct-15 | 1-Oct-19 | Equal to composite TSR index | Exceeds composite TSR index by 21.55 (i.e. 5% CAGR2) | Westpac: 14.508 Index: 17.549 | 0 | 100 |
| | | | | | | | |
| EPS 50% of award | 1-Oct-15 | 1-Oct-183 | 4.0% CAGR | 6.0% CAGR | (1.6%) CAGR | 0 | 100 |
| | | | | | | | | |
1. Cash EPS is cash earnings per share. Cash earnings are not prepared in accordance with AAS and have not been subject to audit. Refer to Note 2 to the Financial Statements for a description of cash earnings.
2. Compound annual growth rate.
3. The cash EPS hurdled performance share rights reached the end of their performance period on 30 September 2018 and were subject to an additional one year holding lock through to 30 September 2019.
3.2. Group performance
The table below summarises the key performance indicators for the Group and variable reward outcomes over the last five years.
| | Years ended 30 September | |
| 2019 | 2018 | 2017 | 2016 | 2015 |
CEO STVR award (% of target) | 0% | 77.50% | 111% | 97% | 108% |
Average Group Executive STVR (% of target) | 56% | 87% | 109% | 95% | 106% |
LTVR award (% vested) | 0% | 0% | 0% | 0% | 36% |
Cash earnings1 ($m) | 6,849 | 8,065 | 8,062 | 7,822 | 7,820 |
Statutory earnings ($m) | 6,784 | 8,095 | 7,990 | 7,445 | 8,012 |
Economic profit2 ($m) | 1,619 | 3,444 | 3,774 | 3,774 | 4,418 |
Cash ROE | 10.75% | 13.00% | 13.77% | 13.99% | 15.84% |
TSR – three years | 15.33% | 8.27% | 11.79% | 15.24% | 62.30% |
TSR – five years | 14.58% | 25.67% | 81.32% | 100.72% | 92.78% |
Dividends per Westpac share (cents) | 174 | 188 | 188 | 188 | 187 |
Cash earnings per Westpac share | $1.98 | $2.36 | $2.40 | $2.35 | $2.48 |
Share price – high | $30.05 | $33.68 | $35.39 | $33.74 | $40.07 |
Share price – low | $23.30 | $27.24 | $28.92 | $27.57 | $29.10 |
Share price – close | $29.64 | $27.93 | $31.92 | $29.51 | $29.70 |
1. Cash earnings are not prepared in accordance with AAS and have not been subject to audit. Refer to Note 2 to the Financial Statements for a description of cash earnings.
2. Economic profit is derived from cash earnings.
| 2019 Westpac Group Annual Report | 65 |
| | |
Directors’ report
Return on equity and LTVR vesting (2015 to 2019)

Total shareholder return (from 1 October 2014)
Cash earnings and CEO STVR award (2015 to 2019)

66 | 2019 Westpac Group Annual Report | |
| | |
Directors’ report
3.3. Total realised remuneration – Chief Executive Officer and Group Executives (unaudited)
The charts below summarise the actual remuneration paid and the equity vested1 to the CEO and Group Executives relative to the maximum remuneration that could have been received in 2019 and 2018, including:
· fixed remuneration earned during the year;
· cash STVR awarded in respect of the year;
· deferred STVR awarded in prior years that vested during the year; and
· LTVR awarded in prior years that vested during the year.
The charts below also reference the maximum value of remuneration foregone in 2019, including cash STVR not awarded in respect of the year (based on the maximum STVR opportunity) and deferred STVR and LTVR awarded in prior years that was forfeited, adjusted or lapsed during the year.
The value of deferred STVR and LTVR is based on the number of restricted shares or share rights multiplied by the five day volume weighted average share price (VWAP) up to and including the date of vesting. The value of equity differs from the disclosure in section 7.
Total realised remuneration ($’000)
 Fixed remuneration Fixed remuneration
|  Cash STVR payment Cash STVR payment
|  Vesting of prior year deferred STVR awards Vesting of prior year deferred STVR awards
|
| | |
 Vesting of prior year LTVR awards Vesting of prior year LTVR awards
|  2019 maximum realisable remuneration 2019 maximum realisable remuneration
| |
1. Equity that vested on 1 October 2019 is included in the 2019 figures. Equity that vested on 1 October 2018 is included in the 2018 figures.
2. The information relates to the period the individual was a KMP. Refer to section 1 for further details.
| 2019 Westpac Group Annual Report | 67 |
| | |
Directors’ report
3.4. Other payments made and equity vested during 2019
Craig Bright had 39,827 restricted shares granted under the Restricted Share Plan which vested in August 2019. David Stephen had 15,727 restricted shares granted under the Restricted Share Plan which vested in March 2019. The restricted shares were allocated in respect of equity forfeited from their previous employers on joining Westpac. In addition, Craig Bright received a one-off cash payment of $1,050,000 in lieu of variable reward forfeited from his previous employer on joining Westpac.
68 | 2019 Westpac Group Annual Report | |
| | |
Directors’ report
3.5. 2019 CEO and Group Executive short term variable reward outcomes
2019 CEO short term variable reward scorecard
The graphic below illustrates the CEO’s 2019 scorecard outcomes reflecting Group and individual performance.
 Target
  Maximum
  Outcome
| | |
Group financial performance (40%) | | |
Primary measures of performance include cash earnings and cash ROE against plan, having regard to cost and margin outcomes. · Cash earnings were $6,849 million, down $1,216 million (or 15%) compared to 2018 and 81% of the target of $8,411 million, resulting in a zero outcome for the cash earnings score. Group financial performance was negatively impacted by increased lending and deposit competition, economy wide slowing of credit growth and higher regulatory and compliance costs. · Cash earnings were also impacted by provisions for estimated customer refunds, payments, associated costs, and litigation, as well as costs associated with the restructuring of the Wealth business. Excluding the impact of these items, Westpac’s cash earnings were $7,979 million, down $367 million (or 4%) compared to 2018. · Impairment charges were slightly lower as asset quality remained sound. Excluding the items outlined above, expenses were a little lower, down $16m on 2018, and margin compression was limited to 4bps with the Group margin (excluding Treasury & Markets) of 2.08%, resulting in a positive outcome for this focus area of the scorecard. · Delivered cash ROE of 10.75%, which is down from 13.00% in 2018 and lower than the 13.15% target, resulting in a zero outcome for the cash ROE score. | | 
21% of target Weighted outcome: 8% of target (6% of maximum) |
| | |
Risk management (15%) | | |
Financial risk management: Performance measurement is based on operating performance relative to Westpac’s Risk Appetite Statement as measured by Capital, Funding and Liquidity Management and Credit Quality. · Our common equity tier 1 ratio was 10.67%, Net Stable Funding Ratio was 112% and the Liquidity Coverage Ratio was 127%. · Maintained sound credit quality across the portfolio, with ratio of stressed assets to total committed exposures at 1.20%. Non-financial risk management: Performance measurement is based on operating performance relative to Westpac’s Risk Appetite Statement, improvements to the control environment and audit and compliance issue resolution. · Increased investment to improve non-financial risk management capability over the year including through targeted hiring in critical roles. · Notwithstanding this improvement, progress in resolving risk and compliance matters fell short of our expectations. · Ongoing significant focus on resolving and remediating compliance, regulatory and customer issues, including enhancing risk management of sales practices, product design and maintenance and financial crime systems and processes. | | Financial 
87% of target Non-financial 
0% of target Weighted outcome (combined): 7% of target (4% of maximum) |
| | |
Customer outcomes (20%) | | |
Primary measures of performance include net promoter scores (NPS) and complaints handling. · Improved service quality for our customers resulting in solid customer growth and an improvement in NPS. The Business division achieved its target to maintain the Number 1 ranking on both Customer Satisfaction and NPS having widened the gap to Number 2. The Consumer division narrowed the gap to Number 1 on NPS and maintained the Number 2 ranking for the majority of the year. · Improved how we manage complaints across the Group, through rollout of Group- wide Complaints Management Framework, refreshed training, simplified internal processes, detailed root cause analysis and dedicated support for vulnerable customers. This resulted in a 46% reduction in the average time taken to resolve issues for customers (which exceeded the 10% target) and the closure of over 1,100 long dated complaints. | | 
99% of target Weighted outcome: 20% of target (13% of maximum) |
| 2019 Westpac Group Annual Report | 69 |
| | |
Directors’ report
| | |
Customer service transformation (15%) | | |
Primary measures of performance include delivery of strategic initiatives. · Delivered customer benefits and improved strategic capability through progress in relation to Service Revolution Transformation milestones, including the Customer Service Hub and Panorama. · Significant investment in technology simplification and foundational platforms improving stability, functionality and efficiency of the technology environment. · Number of digitally active consumers up 4% and an increase in digital sales in the Consumer and Business divisions. · Achieved the target structural productivity of $405 million, a 33% uplift from 2018 and a net ~5% reduction in FTE over the year. · Execution of the ‘Wealth Reset’ (including the exit of advice business), helping to deliver a better and more integrated experience for customers and reducing structural costs. | | 
100% of target Weighted outcome: 15% of target (10% of maximum) |
| | |
Culture and capability (10%) | | |
Performance is measured based on delivery of key people initiatives that further drive the organisation’s change agenda. · Delivered key milestones as part of our people strategy within budget and on schedule, including human capital management systems and the efficiency of the organisation’s structure, for example, reducing layers between decision makers and customers. · Strengthened succession planning across our talent base following the structural shifts made in the first half of the year. · Implemented a number of recommendations stemming from the Royal Commission and our Culture, Governance and Accountability report. · Employee engagement has remained stable in a challenging industry environment. Monthly spot engagement numbers have increased during the year in line with the delivery of our strategy and remediation activity. | | 
102% of target Weighted outcome: 10% of target (7% of maximum) |
|
Modifier and final outcome The 2019 STVR outcome for the CEO was zero. 
The CEO recommended to the Board that he forego his STVR for this year. Notwithstanding the scorecard outcome of 60% of target, the Board separately considered the matter and determined that a zero STVR outcome for 2019 for the CEO was appropriate to reflect accountability for poor non-financial risk and financial outcomes, as well as some poor customer outcomes, including those highlighted at the Royal Commission. |
|
2019 Group Executive short term variable reward outcomes
The focus areas of the CEO scorecard are cascaded to Group Executives in combination with other relevant divisional or functional measures.
2019 STVR outcomes for Group Executives ranged from 0% to 83% of the target opportunity (or 0% to 55% of the maximum opportunity). The average 2019 STVR outcome for Group Executives was 56% of the target opportunity (or 37% of the maximum opportunity), down from 87% in 2018.
The average 2019 STVR outcome for functional Group Executives was 70% of the target opportunity. The average 2019 STVR outcome for Australia based Group Executives leading major divisions (including Consumer, Business, Westpac Institutional Bank and the former BT Financial Group) was 30% of the target opportunity.
The variability in outcomes reflects the lower weighting of financial and customer measures in scorecards for functional Group Executives in line with the nature of their roles and responsibilities.
In addition, individual and divisional performance impacted STVR outcomes, as well as the application of downward remuneration adjustments for material risk and compliance matters.
The 2019 STVR outcomes for the CEO and Group Executives are detailed in the following section.
70 | 2019 Westpac Group Annual Report | |
| | |
Directors’ report
3.6. Variable reward awarded in 2019 (unaudited)
The table below shows the variable reward awarded to the CEO and Group Executives in 2019, including:
· STVR outcomes for 20191 (including the cash and deferred equity components2); and
· equity granted under the 2019 LTVR plan3.
The final value of equity received by the CEO and Group Executives will depend on the share price at the time of vesting and the number of restricted shares or share rights that vest, subject to performance hurdles (where applicable), continued service and adjustment.
The value of equity differs from the disclosure in section 7 which provides the annualised accounting value for unvested equity awards prepared in accordance with the AAS.
| 2019 STVR award | 2019 LTVR award |
Name | Target
STVR
opportunity | Maximum
STVR
opportunity | STVR
award (as %
of target) | STVR
award
(as % of
maximum) | STVR
outcome2 | Maximum
STVR
foregone | Fair value3 | Face value4 |
Managing Director & Chief Executive Officer | | | | | | | | |
Brian Hartzer | 2,686,000 | 4,029,000 | 0% | 0% | 0 | 4,029,000 | 2,528,000 | 5,616,534 |
Current Group Executives | | | | | | | | |
Craig Bright5 | | | | | | | | |
Chief Information Officer | 918,000 | 1,377,000 | 83% | 55% | 762,000 | 615,000 | 864,000 | 2,082,651 |
Lyn Cobley | | | | | | | | |
Chief Executive, | | | | | | | | |
Westpac Institutional Bank | 1,122,000 | 1,683,000 | 60% | 40% | 677,000 | 1,006,000 | 1,056,000 | 2,346,148 |
Peter King | | | | | | | | |
Chief Financial Officer | 1,088,000 | 1,632,000 | 60% | 40% | 653,000 | 979,000 | 1,024,000 | 2,275,045 |
Rebecca Lim | | | | | | | | |
Group Executive, | | | | | | | | |
Legal & Secretariat | 750,000 | 1,125,000 | 70% | 47% | 525,000 | 600,000 | 700,000 | 1,555,172 |
David Lindberg | | | | | | | | |
Chief Executive, | | | | | | | | |
Consumer | 1,124,000 | 1,686,000 | 22% | 15% | 250,000 | 1,436,000 | 1,052,000 | 2,344,576 |
Carolyn McCann | | | | | | | | |
Group Executive, | | | | | | | | |
Customer & Corporate Relations | 555,000 | 832,500 | 70% | 47% | 389,000 | 443,500 | 555,000 | 1,233,059 |
David McLean | | | | | | | | |
Chief Executive Officer, | | | | | | | | |
Westpac New Zealand | 1,028,900 | 1,543,350 | 83% | 55% | 853,949 | 689,401 | 941,090 | 2,090,840 |
Christine Parker | | | | | | | | |
Group Executive, | | | | | | | | |
Human Resources | 900,000 | 1,350,000 | 70% | 47% | 630,000 | 720,000 | 816,000 | 1,812,901 |
David Stephen | | | | | | | | |
Chief Risk Officer | 1,350,000 | 2,025,000 | 69% | 46% | 932,000 | 1,093,000 | 1,012,500 | 2,516,258 |
Gary Thursby | | | | | | | | |
Chief Operating Officer | 900,000 | 1,350,000 | 70% | 47% | 630,000 | 720,000 | 850,000 | 1,888,451 |
Alastair Welsh5 | | | | | | | | |
Acting Chief Executive, Business | 400,000 | 600,000 | 68% | 45% | 270,000 | 330,000 | - | - |
Former Group Executives | | | | | | | | |
Brad Cooper5 | | | | | | | | |
Chief Executive Officer, | | | | | | | | |
BT Financial Group | 800,000 | 1,200,000 | 0% | 0% | 0 | 1,200,000 | 1,050,000 | 2,332,807 |
Dave Curran5,6 | | | | | | | | |
Chief Information Officer | - | - | - | - | - | - | - | - |
George Frazis5 | | | | | | | | |
Chief Executive, Consumer Bank | 800,000 | 1,200,000 | 0% | 0% | 0 | 1,200,000 | 1,000,000 | 2,221,730 |
Average Group Executive STVR award (%) | | | 56% | 37% | | | | |
1. The target STVR opportunity and STVR award have been apportioned for part year KMP to reflect their time as KMP.
2. The deferred STVR (granted as restricted shares or unhurdled share rights) is 50% of the total STVR award for the year. The number of restricted shares granted is determined by reference to the five day VWAP up to and including the day before the grant date. This is adjusted for non-payment of dividends over the vesting period for unhurdled share rights. The five day VWAP for the 2018 award was $24.86.
3. The fair value of the performance share rights is shown as at the commencement of the performance period and is determined by an independent valuer using a Monte Carlo simulation pricing model, taking into consideration the life of the awards, the performance hurdles and likelihood of vesting, non-payment of dividends prior to vesting and appropriate discount rates. The Board Remuneration Committee caps the valuation at a maximum discount of 60% of the share price. The fair value of the 2019 award was capped at $11.12.
4. The face value of the performance share rights is calculated by multiplying the number of performance share rights granted during the year by the five day VWAP up to and including the grant date. For the 2019 awards, the five day VWAP was $24.71 except for Craig Bright and David Stephen where the five day VWAP was $26.81 and $27.64 respectively.
5. The information relates to the period the individual was a KMP. Refer to section 1 for further details.
6. Dave Curran was not eligible to receive a 2019 STVR or 2019 LTVR award.
| 2019 Westpac Group Annual Report | 71 |
| | |
Directors’ report
4. Further detail on the executive variable reward structure
This section provides further details of the 2019 STVR and LTVR plans and changes for 2020.
4.1. Short term variable reward
The table below sets out the key design features of the 2019 STVR plan and changes for the 2020 STVR plan.
Short term variable reward plan |
Plan structure | 50% of STVR is awarded in cash and 50% is deferred into equity in the form of restricted shares (or unhurdled share rights for the Group Executive based outside Australia). |
| One unhurdled share right entitles the holder to one ordinary share at the time of vesting with no exercise cost. |
| One restricted share provides the holder with one ordinary share at no cost subject to trading restrictions until the time of vesting. |
| Dividends are paid on restricted shares from the grant date. |
Target and maximum opportunity | The target opportunity for the CEO and Group Executives is expressed as a percentage of fixed remuneration. The target opportunity is set by the Board following recommendation from the Board Remuneration Committee which considers a range of factors including market competitiveness and the nature of the role. |
| Target STVR (100% of fixed remuneration for the CEO and between 75% and 145% of fixed remuneration for Group Executives | Maximum STVR (150% of target STVR) | |
| 0% | 100% | 150% | |
| | | | |
| Remuneration at-risk | Reward for exceptional performance | |
| Westpac’s STVR is designed to award the target opportunity on delivery of agreed plan targets for financial and non-financial measures that support Westpac’s strategic priorities. It is possible for the outcome to fall below the target amount depending on performance relative to targets agreed at the beginning of the year. | There is the possibility to award up to a maximum of 150% of the STVR target in circumstances where exceptional outcomes are achieved that are also in line with the Group’s risk appetite and where an individual has acted in a manner that exemplifies the encouraged behaviours. | |
|
Performance measures | STVR awards are determined based on performance against a balanced scorecard which is designed to align with shareholder interests by setting challenging measures and seeks to ensure that our customers’ and employees’ needs are met and appropriate risk settings are maintained. |
| The scorecard is split into two sections: |
| · Focus areas: Performance is assessed against a balance of financial and non-financial metrics that are imperative to supporting the effective execution of Westpac’s strategy; and |
| · Modifier: The Board and Board Remuneration Committee recognise that performance metrics may not always appropriately reflect overall performance of the Group. The modifier supports adjustment of the outcome, upwards or downwards (including to zero), for behaviour, risk and reputation matters, people management matters, and any other matters that the Board feels are not fully reflected in the focus areas. |
| Further information on focus areas and application of the modifier for the 2019 scorecard is provided in section 3. |
| Deferred STVR awards recognise past performance and are subject to continued service and adjustment. |
Deferral period | 50% of STVR is deferred into equity for a period of up to two years, which aligns executive remuneration with shareholder interests and acts as a retention mechanism. The deferral period also allows the Board to apply discretion to reduce deferred components where necessary. |
| Deferred STVR vests in equal portions one and two years after the grant date, subject to continued service and adjustment. |
Delayed vesting | The Board also has discretion (subject to law) to delay vesting of equity-based awards if the individual is under investigation for misconduct, the subject of or implicated in legal or regulatory proceedings, if the Board is considering an adjustment or if otherwise required by law. |
Remuneration adjustments for prior period matters | The Board has discretion to adjust current year STVR. |
The Board may also adjust unvested deferred STVR downwards, including to zero, if circumstances or information come to light which mean that in the Board’s view all or part of the award was not appropriate. |
| The Board will typically apply the adjustment to unvested STVR where an adjustment to current year STVR is considered insufficient or unavailable. |
Changes for 2020 | Clawback will apply, to the extent legally permissible and practicable, to deferred STVR awarded in respect of performance periods commencing on or after 1 October 2019 for up to seven years from the date of grant. Clawback may occur in circumstances of serious or gross misconduct, fraud, bribery, severe reputational damage, and any other deliberate, reckless or unlawful conduct that may have a serious adverse impact on Westpac, its customers or its people which has resulted in dismissal or the Board considers at its discretion would have justified the dismissal of the relevant executive or where otherwise required by law. It is the Board’s current intention that clawback will only be considered for relevant conduct that occurred on or after 1 October 2019. |
72 | 2019 Westpac Group Annual Report | |
| | |
Directors’ report
4.2. Long Term Variable Reward
The table below sets out the key design features of the 2019 LTVR Plan awarded in December 2018 and changes for the 2020 LTVR plan.
Long term variable reward plan |
Plan structure | LTVR is awarded in performance share rights which vest after four years subject to the achievement of performance hurdles, continued service and adjustment. |
| One performance share right entitles the holder to one ordinary share at the time of vesting with no exercise cost. Dividends are not accumulated on performance share rights. |
Award opportunity | The value of LTVR awarded to the CEO and Group Executives is expressed as a percentage of fixed remuneration. The value of LTVR is set by the Board following recommendation from the Board Remuneration Committee which considers a range of factors including market competitiveness and the nature of the role. |
| The face value of the LTVR opportunity for the CEO for 2019 is 235% of fixed remuneration, and the face value of LTVR opportunities for the Group Executives (excluding acting Group Executives) range between 185% and 240% of fixed remuneration. |
| Refer below for changes to apply for the 2020 LTVR award. |
Allocation methodology | In 2019 and prior years, the number of performance share rights each executive received was determined by dividing the dollar value of the LTVR award by the fair value of the share right at the beginning of the performance period. This is valued by an independent valuer using a Monte Carlo simulation pricing model, taking into consideration the life of the awards, the performance hurdles and likelihood of vesting, non-payment of dividends prior to vesting and appropriate discount rates. The Board Remuneration Committee caps the valuation at a maximum discount of 60% of the share price. The value of a relative TSR hurdled performance share right may be different to the value of a cash ROE hurdled performance share right. |
| Refer below for changes to apply for the 2020 LTVR award. |
Performance hurdles | LTVR performance hurdles represent a balance of internal and external measures that aims to achieve long-term growth in shareholders’ value and support alignment between executive reward and shareholder interests. |
| |
| Relative Total Shareholder Return | Cash return on equity |
| 50% of the award | 50% of the award |
| | |
| Relative TSR hurdled performance share rights only vest where Westpac’s TSR exceeds that of key competitors. Relative TSR is a measure of the total return delivered to shareholders over the performance period assuming dividends are reinvested, relative to peers. The performance hurdle measures Westpac’s TSR performance over a four year period against a composite index. The composite index is comprised of a group of 10 peers with more weight placed on the three other major Australian banks. At the end of the performance period, TSR performance of each index company is multiplied by its index weighting, and the total of the 10 scores determines the composite TSR index. 50% will vest if Westpac’s TSR performance equals the composite TSR index. For 100% to vest, Westpac’s TSR outcome must exceed the index by 21.55 (i.e. 5% compound annual growth over the four year performance period) as illustrated below. | The performance hurdle measures the average cash return on average ordinary equity over a three year performance period (with an additional one year holding lock). The performance hurdle aims to reward the achievement of returns above Westpac’s cost of capital while generating shareholder value and improving how efficiently the Group uses capital resources within its risk appetite. The performance period for cash ROE differs to the TSR performance period because TSR is an external measure that can be calculated on an ongoing basis whereas cash ROE is an internal measure where the hurdle reflects the time horizon of our financial forecasting. The graph below shows the performance levels required for the cash ROE performance share rights to vest. |
| | |
| Relative Total Shareholder Return vesting | Cash return on equity vesting |
| | |
| 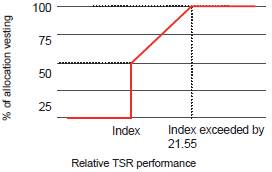
| 
|
| | |
| The companies in the 2019 composite TSR index and their relative weightings are: | |
| ANZ Banking Group | 16.67% | Bendigo and Adelaide Bank | 7.14% |
| Commonwealth Bank | 16.67% | Challenger | 7.14% |
| National Australia Bank | 16.67% | Macquarie Group | 7.14% |
| AMP | 7.14% | Perpetual | 7.14% |
| Bank of Queensland | 7.14% | Suncorp Group | 7.14% |
| Refer below for changes to apply for the 2020 LTVR award. | |
| 2019 Westpac Group Annual Report | 73 |
| | |
Directors’ report
| Long term variable reward plan |
Assessment of performance outcomes | Relative Total Shareholder Return | Cash return on equity |
The relative TSR result is calculated independently to ensure objectivity and external validation before being provided to the Board to determine the vesting outcome. The Board may exercise discretion in determining the final vesting outcome, for example where relative TSR performance hurdles have been met but the absolute TSR outcome is negative. Performance share rights subject to relative TSR performance will be tested against the performance hurdle on 30 September 2022. | The cash ROE outcome is determined by the Board based on cash ROE disclosed in the Group’s results over the performance period. The Board may exercise discretion in determining the final vesting outcome. Performance share rights subject to cash ROE performance will be tested against the performance hurdle on 30 September 2021 and will be subject to an additional one year holding lock through to 30 September 2022. |
| | | | |
No re-testing | There is no re-testing. Awards that have not vested after the measurement period lapse immediately. |
Early vesting | Unvested awards may vest before a test date if the executive is no longer employed by the Group due to death or disability (subject to law). In these cases, vesting is generally not subject to the performance hurdles being met. |
Delayed vesting | The Board also has discretion (subject to law) to delay vesting of equity-based awards if the individual is under investigation for misconduct, the subject of or implicated in legal or regulatory proceedings, if the Board is considering an adjustment or if otherwise required by law. |
Treatment of awards on cessation of employment | The Board has the discretion to determine the treatment of unvested performance share rights where the CEO or a Group Executive resigns, retires or otherwise leaves the Group before vesting occurs. |
| The Board may choose to accelerate the vesting of performance share rights or leave the awards on foot for the remainder of the performance period. |
| In exercising its discretion, the Board will consider relevant circumstances including those relating to the departure. |
| The Board also has the ability to adjust the number of performance share rights downwards (including to zero) in the event of misconduct resulting in significant financial and/or reputational impact to the Group and in other circumstances considered appropriate. | |
| Where an executive acts fraudulently or dishonestly, or is in material breach of their obligations under the relevant equity plan, unexercised performance share rights (whether vested or unvested) will be forfeited unless the Board determines otherwise. |
Remuneration adjustments for prior period matters | The Board has discretion to adjust LTVR which is awarded on a prospective basis. |
The Board may also adjust unvested LTVR downwards, including to zero, if circumstances or information come to light which mean that in the Board’s view all or part of the award was not appropriate. |
| The Board will typically apply the adjustment to unvested LTVR where an adjustment to current and deferred STVR is considered insufficient or unavailable. |
Changes for 2020 | Allocation methodology: From the 2020 LTVR plan onwards, the number of performance share rights each executive receives will be determined by dividing the dollar value of the LTVR award by the face value of performance share rights. The face value is the five day VWAP up to the commencement of the performance period (which is 1 October 2019 for the 2020 LTVR grant). |
| Award opportunity: The Board reduced the face value of 2020 LTVR opportunities by 43% for the CEO and 23% to 25% for Group Executives (excluding acting Group Executives). When setting LTVR opportunities for the CEO and Group Executives, the Board took into account that no dividends are payable on LTVR performance share rights, the minimum variable remuneration deferrals required by Banking Executive Accountability Regime (BEAR) and the overall market positioning of the executives’ remuneration (including adjusting from a fair value to face value allocation methodology). The face value of the 2020 LTVR opportunity for the CEO is 133% of fixed remuneration, and the 2020 LTVR opportunities for Group Executives (excluding acting Group Executives) range between 140% and 180% of fixed remuneration. The Board intends the same percentages of fixed remuneration to apply to the determination of LTVR grants at face value in future years, subject to market benchmarking and any changes that may flow from the release of APRA’s final regulatory framework for remuneration. |
| Performance hurdle: Relative TSR has been selected as the performance hurdle for the 2020 LTVR plan as the Board believes this measure best aligns executive remuneration outcomes with long-term shareholder value creation. The Board considers that setting an absolute cash ROE range over a three year period has become increasingly difficult in light of current uncertainties surrounding future regulatory capital requirements and interest rates, which are at historically low levels. The Board will review the 2021 LTVR plan following the release of APRA’s final regulatory framework for remuneration. |
| Clawback: Clawback will apply, to the extent legally permissible and practicable, to LTVR awarded in respect of performance periods commencing on or after 1 October 2019 for up to seven years from the date of grant. Clawback may occur in circumstances of serious or gross misconduct, fraud, bribery, severe reputational damage, and any other deliberate, reckless or unlawful conduct that may have a serious adverse impact on Westpac, its customers or its people which has resulted in dismissal or the Board considers at its discretion would have justified the dismissal of the relevant executive or where otherwise required by law. It is the Board’s current intention that clawback will only be considered for relevant conduct that occurred on or after 1 October 2019. |
| | | |
The table below details other LTVR awards currently on foot. |
| | | | |
| Vesting date | Performance hurdles | Further detail | |
2017 LTVR award | 30 September 2020 | · Relative TSR performance against a weighted composite index of comparator companies (50%) | Refer to the 2017 Annual Report | |
| | · Average cash ROE performance (50%) | | |
2018 LTVR award | 30 September 2021 | · Relative TSR performance against a weighted composite index of comparator companies (50%) | Refer to the 2018 Annual Report | |
| | · Average cash ROE performance (50%) | | |
| | | | | | | |
74 | 2019 Westpac Group Annual Report | |
| | |
Directors’ report
5. Remuneration governance
5.1. Remuneration policy and governance oversight
Westpac’s remuneration policy sets out the mandatory requirements to be reflected in the design and management of remuneration arrangements across Westpac.
The policy supports Westpac’s vision by requiring the design and management of remuneration to align with stakeholder interests, support long-term financial soundness and encourage prudent risk management.
The policy is supported by an established governance structure, plans and frameworks, that are designed to support remuneration decision-making across the Group.
Board |
The Board provides strategic guidance for the Group and has oversight of management. The Board has overall accountability for reviewing and approving executive remuneration as well as Non-executive Director Board and Committee fees (subject to the Board fee pool approved by shareholders). Without limiting its role, the Board approves (following recommendation from the Board Remuneration Committee) performance targets for the CEO, the size of variable reward pools, remuneration (including variable reward targets and performance outcomes) for the CEO, Group Executives, any other accountable persons under the BEAR, other persons whose activities in the Board’s opinion affect the financial soundness of the Group, any other person specified by APRA and any other person the Board determines. The Board has the discretion to defer, adjust or withdraw aggregate and individual variable reward. Further detail is contained in the Board and Committee Charters which are available on Westpac’s website. |
Board Remuneration Committee |
The Board Remuneration Committee assists the Board to fulfil its remuneration responsibilities to shareholders by monitoring the remuneration policies and practices of the Group and their effectiveness, external remuneration practices, market expectations and regulatory requirements in Australia and globally. The Board Remuneration Committee reviews and makes recommendations to the Board in relation to the individual remuneration levels of individuals outlined above, STVR and LTVR plans and outcomes for the Group Executives and any other Accountable Persons under the BEAR as well as performance goals and objectives relevant to the remuneration of the CEO and any and all equity based plans. In carrying out its duties, the Board Remuneration Committee accesses risk and financial control personnel and engages external advisers who are independent of management. Members of the Board Remuneration Committee are independent Non-executive Directors. Further detail is contained in the Board Remuneration Committee Charter which is available on Westpac’s website. |
Interaction with other Board Committees | Management remuneration oversight committees |
The Chairman of the Board Risk & Compliance Committee is also a member of the Board Remuneration Committee. Members of the Board Remuneration Committee are all members of the Board Risk & Compliance Committee. The cross membership of both Committees supports alignment between risk and reward. The Board Remuneration Committee seeks feedback from and considers matters raised by the Board Risk & Compliance Committee and Board Audit Committee with respect to remuneration outcomes, adjustments to remuneration in light of relevant matters and alignment of remuneration with the risk management framework. | Divisional remuneration oversight committees consider areas of risk within the divisions and consider potential implications for remuneration. These committees report to the Group Remuneration Oversight Committee which in turn considers consistency of remuneration across the Group and provides information to the Board Remuneration Committee and Board for review and decision-making as appropriate. During the financial year, remuneration governance arrangements were reviewed and changes were made to the Terms of Reference for the Group Remuneration Oversight Committee. This included an added responsibility for the Group Remuneration Oversight Committee to review the design and implementation of remuneration systems for front line staff, annually, in line with Recommendation 5.4 from the Royal Commission. |
Remuneration consultants |
In 2019, the Board retained Guerdon Associates as its independent consultant to provide specialist information on executive remuneration and other remuneration matters. The services were provided directly to the Board Remuneration Committee independent of management. The Chairman of the Board Remuneration Committee oversees the engagement and associated costs. Work undertaken by Guerdon Associates during 2019 included the provision of information relating to the benchmarking of Non-executive Director, CEO and Group Executive remuneration. In 2019, no remuneration recommendations, as prescribed under the Corporations Act, were made by Guerdon Associates. |
| 2019 Westpac Group Annual Report | 75 |
| | |
Directors’ report
5.2. Executive minimum shareholding requirements and current compliance
The CEO and Group Executives are required to build and maintain a significant Westpac shareholding within five years of their appointment to strengthen alignment with shareholder interests.
At 30 September 2019, the CEO and all Group Executives comply with the requirement. The table below sets out the minimum shareholding requirement for the CEO and Group Executives.
| Minimum shareholding requirement |
Chief Executive Officer | Five times annual fixed remuneration excluding superannuation, equivalent to $12.26 million |
Group Executives | Equivalent to $1.2 million |
The multiple for the CEO’s shareholding requirement is higher than that of his peers and reflects Westpac’s approach to calculating the minimum shareholding requirement.
Since 2006, the following has been included for the purpose of calculating the minimum shareholding requirement:
· shares held outright in the individual’s name either solely or jointly with another person;
· shares held in an employee share plan (including deferred STVR); and
· 50% of any unvested performance share rights (including LTVR).
The assessment approach has included shares held in a family trust or self-managed super fund since 2012.
The minimum shareholding requirement will be reviewed in 2020 following the release of APRA’s final regulatory framework for remuneration.
5.3. Hedging policy
Participants in Westpac’s equity plans are forbidden from entering, either directly or indirectly, into hedging arrangements for unvested awards in the STVR and LTVR plans. No financial products may be used to mitigate the risk associated with these awards. Any attempt to hedge awards will result in forfeiture and the Board may consider other disciplinary action. These restrictions satisfy the requirements of the Corporations Act which prohibits hedging of unvested awards.
5.4. Employment agreements
The remuneration and other terms of employment for the CEO and Group Executives are formalised in their employment agreements. Each agreement provides for the payment of fixed and variable reward, employer superannuation contributions and other benefits such as death and disablement insurance cover.
The table below details the key terms including termination provisions of the employment agreements for the CEO and Group Executives in 2019.
Term | Who | Conditions |
Duration of agreement | CEO and Group Executives | · Ongoing until notice given by either party |
Notice (by the executive or the Group) to terminate employment | CEO and Group Executives | · 12 months1 |
Termination payments on termination without cause2 | CEO and Group Executives | · Deferred STVR and LTVR awards vest according to the applicable equity plan rules |
Termination for cause | CEO and Group Executives (excluding | · Immediately for misconduct |
| Brad Cooper) | · 3 months’ notice for poor performance |
| Brad Cooper3 | · Immediately for misconduct |
| | · Contractual notice period for poor performance |
Post-employment restraints | CEO and Group Executives | · 12 month non-solicitation restraint |
1. Payment in lieu of notice may in certain circumstances be approved by the Board for some or all of the notice period.
2. The maximum liability for termination benefits for the CEO and Group Executives at 30 September 2019 was $16.0 million (2018: $14.1 million).
3. Brad Cooper ceased in his KMP role as the Chief Executive Officer, BT Financial Group on 1 April 2019.
76 | 2019 Westpac Group Annual Report | |
| | |
Directors’ report
6. Non-executive Director remuneration
6.1. Structure and policy
Westpac’s Non-executive Director remuneration strategy is designed to attract and retain experienced, qualified Board members and provide appropriate remuneration for their time and expertise.
Non-executive Director fees are not related to Westpac’s results. All fees are paid in cash and no discretionary payments are made for performance. Non-executive Directors are required to build and maintain a minimum shareholding to align their interests with those of shareholders (refer to section 6.4 for further details).
The table below sets out the components of Non-executive Director remuneration.
| Non-executive Director remuneration |
Base fee | Relates to service on the Westpac Banking Corporation Board. The base fee for the Chairman covers all responsibilities, including for Board Committees. |
Committee fees | Additional fees are paid to Non-executive Directors (other than the Board Chairman) for chairing or participating in Board Committees other than the Board Nominations Committee. |
Employer superannuation contributions | Reflects statutory superannuation contributions which are capped at the superannuation maximum contributions base as prescribed under the Superannuation Guarantee legislation. |
Subsidiary Board and Advisory Board fees | Relates to service on Subsidiary Boards and Advisory Boards and are paid by the relevant subsidiary. |
6.2. Non-executive Director remuneration in 2019
The base fees payable to the Chairman and other Non-executive Directors were reduced by 20% for 2019 as a one-off measure. The reduction was applied to all current Non-executive Directors in recognition of the collective accountability as the Board of Westpac for customer outcomes highlighted by the Royal Commission, shareholder sentiment leading to the first strike at the 2018 Annual General Meeting and significant non-financial risk matters. In addition, the Board Risk & Compliance Committee Chairman fee was increased from $70,400 to $90,000 effective 1 October 2018 to reflect the significant increase in the workload of the Committee Chairman. The table below sets out the annual Board and standing Committee fees and the changes for 2019.
The Non-executive Director fee pool of $4.5 million per annum was approved by shareholders at the 2008 Annual General Meeting. For 2019, $3.11 million (69%) of the fee pool was used. The fee pool includes employer superannuation contributions.
Base and Committee fees | Annual fee
$ | Changes for 2019 |
Chairman | 810,000 | | One-off reduction of $162,000 to $648,000 |
Other Non-executive Directors | 225,000 | | One-off reduction of $45,000 to $180,000 |
Committee Chairman fees | | | |
Board Audit Committee | 70,400 | | No change |
Board Risk & Compliance Committee | 90,000 | | Fee increase to $90,000 (from $70,400) effective 1 October 2018 |
Board Remuneration Committee | 63,800 | | No change |
Board Technology Committee | 35,200 | | No change |
Committee membership fees | | | |
Board Audit Committee | 32,000 | | No change |
Board Risk & Compliance Committee | 32,000 | | No change |
Board Remuneration Committee | 29,000 | | No change |
Board Technology Committee | 20,000 | | No change |
Subsidiary Board and Advisory Board fees
During the reporting period, additional fees of $7,241 were paid to Peter Hawkins as a member of the Westpac Group Victoria Advisory Board (formerly Bank of Melbourne Advisory Board) (during the period in which he was a KMP) and additional fees of $83,146 were paid to Anita Fung as a member of the Westpac Asia Advisory Board.
| 2019 Westpac Group Annual Report | 77 |
| | |
Directors’ report
6.3. Changes to Board and Committee composition
The table below outlines the changes that were made to the Board and Committee composition during the year ended 30 September 2019.
Name of Non-executive Director | Change in position | Effective date |
Anita Fung | · Appointed Non-executive Director · Appointed member of the Board Risk & Compliance Committee | 1 October 2018 |
Peter Hawkins | · Retired from the Board | 12 December 2018 following the completion of the 2018 Annual General Meeting |
Ewen Crouch | · Appointed member of the Board Audit Committee | 1 January 2019 |
Steven Harker | · Appointed Non-executive Director · Appointed member of the Board Risk & Compliance Committee | 1 March 2019 |
Margaret Seale | · Appointed Non-executive Director · Appointed member of the Board Risk & Compliance Committee | 1 March 2019 |
6.4. Non-executive Director minimum shareholding requirement
Non-executive Directors are required to build and maintain a holding in Westpac ordinary shares to align their interests with those of shareholders. Each Non-executive Director is required to hold an interest in shares in Westpac with a market value not less than the Board base fee, within five years of appointment to the Board.
At 30 September 2019, all Non-executive Directors comply with the requirement.
78 | 2019 Westpac Group Annual Report | |
| | |
Directors’ report
7. Statutory remuneration details
7.1. Details of Non-executive Director remuneration
The table below details Non-executive Director remuneration.
| Short-term benefits | Post-employment
benefits | |
| Westpac Banking
Corporation Board
fees1 | Subsidiary and
Advisory Board
fees | Non-
monetary
benefits3 | Superannuation | Total |
Name | $ | $ | $ | $ | $ |
Current Non-executive Directors | | | | | |
Lindsay Maxsted, Chairman | | | | | |
2019 | 648,000 | - | - | 20,658 | 668,658 |
2018 | 810,000 | - | - | 20,181 | 830,181 |
Nerida Caesar | | | | | |
2019 | 232,000 | - | - | 20,658 | 252,658 |
2018 | 277,000 | - | - | 20,181 | 297,181 |
Ewen Crouch | | | | | |
2019 | 323,000 | - | - | 20,658 | 343,658 |
2018 | 324,400 | - | - | 20,181 | 344,581 |
Alison Deans | | | | | |
2019 | 276,200 | - | - | 20,658 | 296,858 |
2018 | 312,965 | - | - | 20,181 | 333,146 |
Craig Dunn | | | | | |
2019 | 275,800 | - | - | 20,658 | 296,458 |
2018 | 320,800 | - | - | 20,181 | 340,981 |
Anita Fung | | | | | |
2019 | 212,000 | 83,146 | 6,300 | 20,658 | 322,104 |
2018 | ---------------------------------- Not a KMP in 2018---------------------------------- |
Steven Harker2 | | | | | |
2019 | 123,667 | - | - | 11,972 | 135,639 |
2018 | ---------------------------------- Not a KMP in 2018---------------------------------- |
Peter Marriott | | | | | |
2019 | 302,400 | - | - | 20,658 | 323,058 |
2018 | 347,400 | - | - | 20,181 | 367,581 |
Peter Nash | | | | | |
2019 | 244,000 | - | - | 20,658 | 264,658 |
2018 | 164,690 | - | - | 11,744 | 176,434 |
Margaret Seale2 | | | | | |
2019 | 123,667 | - | - | 11,972 | 135,639 |
2018 | ---------------------------------- Not a KMP in 2018---------------------------------- |
Former Non-executive Director | | | | | |
Peter Hawkins2 | | | | | |
2019 | 64,375 | 7,241 | - | 4,248 | 75,864 |
2018 | 311,832 | 35,000 | - | 20,103 | 366,935 |
Total fees | | | | | |
2019 | 2,825,109 | 90,387 | 6,300 | 193,456 | 3,115,252 |
2018 | 2,869,088 | 35,000 | - | 152,931 | 3,057,020 |
1. Includes fees paid to the Chairman and members of Board Committees.
2. The information relates to the period the individual was a KMP. Refer to section 1 for further details.
3. Non-monetary benefits are determined on the basis of the cost to the Group (including associated fringe benefits tax (FBT), where applicable) and include provision of taxation advice.
| 2019 Westpac Group Annual Report | 79 |
| | |
Directors’ report
7.2. Remuneration details – Chief Executive Officer and Group Executives
The table below sets out details of remuneration for the CEO and Group Executives calculated in accordance with the AAS.
| | | | | Post- | Other | | | |
| | employment | long-term | | | |
| Short-term benefits | benefits | benefits | Share-based payments | |
| | Cash | Non- | Other | | Long | | | |
| Fixed | STVR | monetary | short-term | Superannuation | service | Restricted | Share | |
| remuneration1 | award2 | benefits3 | benefits4 | benefits5 | leave | shares6 | rights7,8 | Total9 |
| $ | $ | $ | $ | $ | $ | $ | $ | $ |
Managing Director & Chief Executive Officer | |
Brian Hartzer | | | | | | | | | |
2019 | 2,608,424 | - | 21,966 | - | 44,320 | 40,660 | 1,169,581 | 1,168,040 | 5,052,991 |
2018 | 2,730,714 | 1,040,825 | 20,618 | - | 42,235 | 40,697 | 1,449,964 | 1,247,127 | 6,572,180 |
Current Group Executives | |
Craig Bright, Chief Information Officer10,11 | |
2019 | 1,022,829 | 381,000 | 309,495 | 1,050,000 | 23,818 | 15,137 | 2,075,911 | 170,797 | 5,048,987 |
2018 | ---------------------------------------------------------------------- Not a KMP in 2018 ---------------------------------------------------------------------- |
Lyn Cobley, Chief Executive, Westpac Institutional Bank | |
2019 | 1,108,830 | 338,500 | 4,948 | - | 30,611 | 16,995 | 516,242 | 508,437 | 2,524,563 |
2018 | 1,085,585 | 465,500 | 4,039 | - | 29,993 | 17,000 | 749,930 | 394,975 | 2,747,022 |
Peter King, Chief Financial Officer | |
2019 | 1,222,006 | 326,500 | 4,238 | - | 36,803 | 19,492 | 549,189 | 483,692 | 2,641,920 |
2018 | 1,232,059 | 517,000 | 2,924 | - | 34,957 | 90,204 | 597,487 | 512,401 | 2,987,032 |
Rebecca Lim, Group Executive, Legal & Secretariat |
2019 | 950,128 | 262,500 | 4,981 | - | 31,718 | 14,390 | 422,793 | 260,108 | 1,946,618 |
2018 | 903,728 | 356,500 | 2,924 | - | 29,912 | 55,507 | 512,169 | 348,768 | 2,209,508 |
David Lindberg, Chief Executive, Consumer |
2019 | 1,129,075 | 125,000 | 6,592 | - | 30,434 | 23,822 | 470,092 | 475,368 | 2,260,383 |
2018 | 1,049,010 | 440,500 | 4,014 | - | 28,365 | 25,006 | 518,657 | 435,208 | 2,500,760 |
Carolyn McCann, Group Executive, Customer & Corporate Relations |
2019 | 731,367 | 194,500 | 4,828 | - | 21,579 | 11,198 | 445,723 | 186,563 | 1,595,758 |
2018 | 241,365 | 74,500 | 1,915 | - | 5,579 | 12,665 | 144,344 | 25,395 | 505,763 |
David McLean, Chief Executive Officer, Westpac New Zealand |
2019 | 861,551 | 426,975 | 1,194 | - | 87,710 | - | - | 907,580 | 2,285,010 |
2018 | 849,488 | 498,439 | 55,885 | - | 81,444 | - | - | 785,206 | 2,270,462 |
Christine Parker, Group Executive, Human Resources |
2019 | 875,430 | 315,000 | 3,123 | - | 27,420 | (33,023) | 456,373 | 384,005 | 2,028,328 |
2018 | 865,802 | 427,500 | 2,924 | - | 26,848 | (8,854) | 500,697 | 399,535 | 2,214,452 |
David Stephen, Chief Risk Officer |
2019 | 1,816,090 | 466,000 | 263,844 | - | 25,900 | 27,265 | 2,023,326 | 732,611 | 5,355,036 |
2018 | ---------------------------------------------------------------------- Not a KMP in 2018 ---------------------------------------------------------------------- |
Gary Thursby, Chief Operating Officer |
2019 | 881,655 | 315,000 | 3,123 | - | 29,605 | 23,294 | 423,765 | 306,672 | 1,983,114 |
2018 | 794,889 | 395,500 | 2,924 | - | 28,616 | 12,693 | 453,951 | 344,305 | 2,032,878 |
Alastair Welsh, Acting Chief Executive, Business10 |
2019 | 369,151 | 135,000 | 438 | - | 11,861 | 6,557 | 207,066 | 13,321 | 743,394 |
2018 | ---------------------------------------------------------------------- Not a KMP in 2018 ---------------------------------------------------------------------- |
Former Group Executives |
Brad Cooper, Chief Executive Officer, BT Financial Group10,12,14 |
2019 | 1,553,160 | - | 27,860 | - | 95,640 | 14,402 | 608,215 | 1,826,972 | 4,126,249 |
2018 | 1,136,073 | 400,000 | 17,861 | - | 29,366 | 16,700 | 778,096 | 538,531 | 2,916,627 |
Dave Curran, Chief Information Officer10,14,15 |
2019 | 173,917 | - | 1,115 | 36,475 | 6,019 | (45,839) | 140,129 | 1,309,046 | 1,620,862 |
2018 | 1,021,322 | 485,000 | 2,924 | - | 28,806 | 20,703 | 531,367 | 480,835 | 2,570,957 |
George Frazis, Chief Executive, Consumer Bank10,13,14 |
2019 | 557,789 | - | 28,279 | 522,509 | 15,989 | (97,778) | 709,940 | 1,739,923 | 3,476,651 |
2018 | 1,109,913 | 480,000 | 16,771 | - | 38,132 | 17,425 | 858,110 | 489,032 | 3,009,383 |
80 | 2019 Westpac Group Annual Report | |
| | |
Directors’ report
1. Fixed remuneration is the total cost of salary, salary sacrificed benefits (including motor vehicles, parking and associated FBT) and an accrual for annual leave entitlements.
2. 2019 STVR awards reflect annual cash performance awards accrued but not yet paid in respect of the year ended 30 September 2019. STVR awards are paid in December.
3. Non-monetary benefits are determined on the basis of the cost to the Group (including associated FBT, where applicable) and include annual health checks, provision of taxation advice, bank funded car parking, relocation costs, living away from home expenses and allowances. In the 2018 and 2017 Remuneration Reports, non-monetary benefits were understated and 2018 values for two individuals have been amended in the table above. For 2017, a total of $27,694 was understated reflecting additional car parking benefits.
4. Includes payments on cessation of employment or other contracted amounts.
5. The CEO and Group Executives are provided with life insurance cover under the Westpac Group Plan at no cost. Superannuation benefits have been calculated consistent with AASB 119 Employee Benefits.
6. The value of restricted shares is amortised over the applicable vesting period and the amount shown is the amortisation relating to 2019 (and 2018 for comparison). The restricted shares held by Craig Bright and David Stephen represent an allocation made in substitution for forgone unvested equity on joining the Westpac Group. The restricted shares replicate the vesting periods of the equity forgone.
7. Equity-settled remuneration is based on the amortisation over the vesting period (normally one, two or four years) of the fair value at grant date of hurdled and unhurdled options and share rights that were granted during the four years ended 30 September 2019. Details of prior year grants are disclosed in previous Annual Reports. The 2019 value for David McLean includes 53% attributed to deferred STVR awards. The 2019 value for David Stephen includes an allocation of hurdled share rights made in substitution for unvested equity foregone on joining the Westpac Group, and is subject to Westpac’s 2018 LTVR performance hurdles and vesting criteria.
8. The expensed value of the 2017 LTVR cash ROE hurdled performance share rights has been reduced to zero. The expensed value of the 2018 and 2019 LTVR cash ROE hurdled performance share rights have been reduced by 50%. This reflects the current assessment of the probability of vesting.
9. The percentage of the total remuneration which is performance-related (i.e. cash STVR award plus share-based payments) was: Brian Hartzer 46%, Craig Bright 52%, Lyn Cobley 54%, Peter King 51%, Rebecca Lim 49%, David Lindberg 47%, Carolyn McCann 52%, David McLean 58%, Christine Parker 57%, David Stephen 60%, Gary Thursby 53%, Alastair Welsh 48%, Brad Cooper 59%, Dave Curran 89% and George Frazis 70%. The percentage of total remuneration delivered in the form of options (including share rights) was: Brian Hartzer 23%, Craig Bright 3%, Lyn Cobley 20%, Peter King 18%, Rebecca Lim 13%, David Lindberg 21%, Carolyn McCann 12%, David McLean 40%, Christine Parker 19%, David Stephen 14%, Gary Thursby 15%, Alastair Welsh 2%, Brad Cooper 44%, Dave Curran 81% and George Frazis 50%.
10. The information relates to the period the individual was a KMP. Refer to section 1 for further details.
11. Craig Bright received a one-off cash payment of $1,050,000 in lieu of variable reward forfeited from his previous employer on joining the Westpac Group.
12. The information relates to Brad Cooper’s KMP role. This includes payments made or to be made during his 12 month notice period from 1 August 2019 to 31 July 2020, where Brad continues to receive fixed remuneration and superannuation. From 1 April 2019 to 31 July 2019, Brad acted as an advisor to the Group and received fixed remuneration of $371,730 (including superannuation), which has been excluded from the table on the basis that it did not relate to his KMP role.
13. The information relates to George Frazis’ KMP role. From 1 April 2019 to 31 August 2019, George acted as an advisor to the Group and received fixed remuneration of $480,709 (including superannuation), which has been excluded from the table on the basis that it did not relate to his KMP role. The value of other short-term benefits relates to payments on cessation of employment, including 4 months’ pay in lieu of notice ($383,333) and annual leave and long service leave entitlements ($139,176).
14. The share based payment values for Brad Cooper, Dave Curran and George Frazis reflect the accruals for all unvested equity up to the end of each performance period. For example, the 2019 LTVR will include the accrual for four years until the vesting date in lieu of a single year accrual value for 2018. While the full value is being accrued for all unvested equity, the awards may or may not vest subject to the relevant performance hurdles.
15. Dave Curran was not eligible to receive a 2019 STVR or 2019 LTVR award.
| 2019 Westpac Group Annual Report | 81 |
| | |
Directors’ report
7.3. Movement in equity-settled instruments during the year
The table shows the movements in the number and value of equity instruments for the CEO and Group Executives under the relevant plan during 2019.
Name | Type of equity-based instrument | Number
granted1 | Number
vested2 | Number
exercised3 | Value
granted4
$ | Value
exercised5
$ | Value
forfeited or
lapsed5
$ |
Managing Director & Chief Executive Officer | | | | | |
Brian Hartzer | CEO Performance share rights | 227,338 | - | - | 3,350,962 | - | 3,176,443 |
| Performance share rights | - | - | - | - | - | 910,932 |
| Shares under the CEO Restricted Share Plan | 41,867 | 43,914 | - | 1,034,352 | - | - |
Current Group Executives | | | | | | |
Craig Bright6 | Performance share rights | 77,696 | - | - | 1,224,953 | - | - |
| Shares under Restricted Share Plan | 132,151 | 39,827 | - | 3,542,324 | - | - |
Lyn Cobley | Performance share rights | 94,964 | - | - | 1,399,769 | - | - |
| Shares under Restricted Share Plan | 18,724 | 17,817 | - | 462,589 | - | - |
Peter King | Performance share rights | 92,086 | - | - | 1,357,348 | - | 1,749,043 |
| Shares under Restricted Share Plan | 20,796 | 18,234 | - | 513,779 | - | - |
Rebecca Lim | Performance share rights | 62,948 | - | - | 927,854 | - | 367,504 |
| Shares under Restricted Share Plan | 14,340 | 17,343 | - | 354,279 | - | - |
David Lindberg | Performance share rights | 94,602 | - | - | 1,398,440 | - | 784,008 |
| Shares under Restricted Share Plan | 17,719 | 15,875 | - | 437,760 | - | - |
Carolyn McCann | Performance share rights | 49,910 | - | - | 735,673 | - | 376,943 |
| Shares under Restricted Share Plan | 9,818 | 10,541 | - | 242,560 | - | - |
David McLean | Performance share rights | 84,630 | - | - | 1,247,446 | - | 948,126 |
| Unhurdled share rights | 22,059 | 13,351 | - | 502,783 | - | - |
Christine Parker | Performance share rights | 73,380 | - | - | 1,081,621 | - | 1,413,548 |
| Shares under Restricted Share Plan | 17,196 | 15,210 | - | 424,838 | - | - |
David Stephen | Performance share rights | 278,698 | - | - | 4,461,892 | - | - |
| Shares under Restricted Share Plan | 135,929 | 15,727 | - | 3,644,447 | - | - |
Gary Thursby | Performance share rights | 76,438 | - | - | 1,126,696 | - | 452,315 |
| Shares under Restricted Share Plan | 15,909 | 13,296 | - | 393,042 | - | - |
Alastair Welsh6 | Performance share rights | - | - | - | - | - | - |
| Shares under Restricted Share Plan | 4,223 | - | - | 116,704 | - | - |
Former Group Executive | | | | | | |
Brad Cooper6 | Performance share rights | 94,424 | - | - | 1,391,810 | - | 1,978,989 |
| Shares under Restricted Share Plan | 16,090 | 24,004 | - | 397,514 | - | - |
Dave Curran6 | Performance share rights | - | - | - | - | - | 1,688,745 |
| Shares under Restricted Share Plan | - | 16,038 | - | - | - | - |
George Frazis6 | Performance share rights | 89,928 | - | - | 1,325,539 | - | 1,548,156 |
| Shares under Restricted Share Plan | 19,308 | 26,518 | - | 477,017 | - | - |
1. No performance options were granted in 2019. Deferred STVR awards in the form of restricted shares or unhurdled share rights (for David McLean based in New Zealand) are awarded in December. David McLean’s unhurdled share rights were granted on 19 December 2018 at a fair value of $23.37 (unhurdled share rights which vested on 1 October 2019) and $21.88 (unhurdled rights vesting on 1 October 2020).
2. No hurdled share rights granted in 2014 vested in October 2018 when assessed against the relative TSR and cash EPS performance hurdles.
3. Vested options and share rights that were awarded prior to October 2009 can be exercised up to a maximum of 10 years from their commencement date. Vested share rights awarded between October 2009 and July 2015 are automatically exercised at vesting. Vested share rights granted after July 2015 may be exercised at will up to a maximum of 15 years from their commencement date. For each vested share right and each performance option exercised during the year, the relevant executive received one fully paid Westpac ordinary share. The exercise price for share rights is zero.
4. For performance share rights, the value granted represents the number of securities granted multiplied by the fair value per instrument as set out in the table in the sub-section titled ‘Fair value of Long Term Variable Reward awards made during the year’ below. For restricted shares, the value granted represents the number of ordinary shares granted multiplied by the five day VWAP of a Westpac ordinary share on the date the shares were granted. These values, which represent the full value of the equity-based awards made to the CEO and Group Executives in 2019, do not reconcile with the amount shown in the table in section 7.2 which shows the amount amortised in the current year of equity awards over their vesting period. The minimum total value of the grants for future financial years is zero and an estimate of the maximum possible total value in future financial years is the fair value, as shown above.
5. The value of each option or share right exercised, forfeited or lapsed is calculated based on the five day VWAP of Westpac ordinary shares on the date of exercise (or forfeiture or lapse), less the relevant exercise price (if any). Where the exercise price is greater than the five day VWAP of Westpac ordinary shares, the value has been calculated as zero.
6. The information relates to the period the individual was a KMP. Refer to section 1 for further details.
82 | 2019 Westpac Group Annual Report | |
| | |
Directors’ report
Fair value of Long Term Variable Reward awards made during the year
The table below provides a summary of the fair value of LTVR awards granted to the CEO and Group Executives during 2019 calculated in accordance with AASB 2 Share-based Payment and is used for accounting purposes only. LTVR awards will only vest if performance hurdles are achieved and service conditions are met in future years.
Plan name | Granted to | Performance
hurdle | Grant date | Commencement
date1 | Test date | Expiry | Fair value2 per
instrument |
CEO Long Term
Variable Reward Plan | Brian Hartzer | Relative TSR | 12 December 2018 | 1 October 2018 | 1 October 2022 | 1 October 2033 | $10.45 |
| | | | | | | |
| | Cash ROE | 12 December 2018 | 1 October 2018 | 1 October 2021 | 1 October 2033 | $19.03 |
| | | | | | | |
Westpac Long Term | Group | Relative TSR | 12 December 2018 | 1 October 2018 | 1 October 2022 | 1 October 2033 | $10.45 |
| | | | | | | |
Variable Reward Plan | Executives | | | | | | |
| | | | | | | |
| | Cash ROE | 12 December 2018 | 1 October 2018 | 1 October 2021 | 1 October 2033 | $19.03 |
7.4. Details of Westpac equity holdings of Non-executive Directors
The table below sets out details of relevant interests in Westpac ordinary shares held by Non-executive Directors (including their related parties) during the year ended 30 September 20193.
Name | Number held at
start of the year | Changes
during the year | Number held at
end of the year |
Current Non-executive Directors | | | |
Lindsay Maxsted | 22,095 | 1,585 | 23,680 |
Nerida Caesar | 9,985 | 3,598 | 13,583 |
Ewen Crouch4 | 82,264 | - | 82,264 |
Alison Deans | 14,392 | - | 14,392 |
Craig Dunn | 8,869 | - | 8,869 |
Anita Fung | - | - | - |
Steven Harker5 | n/a | 10,365 | 11,930 |
Peter Marriott6 | 41,072 | (2,001) | 39,071 |
Peter Nash | 8,020 | - | 8,020 |
Margaret Seale5,7 | n/a | 1,068 | 37,439 |
Former Non-executive Director | | | |
Peter Hawkins5 | 15,880 | - | n/a |
1. The commencement date is the start of the performance period.
2. The fair values of performance share rights granted during the year have been independently calculated at their respective grant dates based on the requirements of AASB 2 Share-based Payment. The fair value of performance share rights with cash ROE hurdles has been assessed with reference to the share price at grant date and a discount rate reflecting the expected dividend yield over their vesting periods which for the performance share rights valued at $19.03 is four years to the 1 October 2022 vesting date. For the purpose of allocating performance share rights with cash ROE hurdles, the valuation also takes into account the average cash ROE outcome using a Monte Carlo pricing simulation model. The fair value of performance share rights with hurdles based on TSR performance relative to that of a group of comparator companies also takes into account the average TSR outcome determined using a Monte Carlo simulation pricing model.
3. Other than as disclosed below, no share interests include non-beneficially held shares.
4. Ewen Crouch holds 42,000 ordinary shares following the grant of probate in a deceased estate for which he is one of the executors. In addition to holdings of ordinary shares, Ewen Crouch and his related parties held interests in 250 Westpac Capital Notes 2 at year end.
5. The information relates to the period the individual was a KMP. Refer to section 1 for further details.
6. Peter Marriott’s related party ceased to hold an interest in 2,001 ordinary shares following the realisation of assets in a deceased estate. In addition to holdings of ordinary shares, Peter Marriott and his related parties held interests in 563 Westpac Capital Notes 2 at year end.
7. In addition to holding shares, Margaret Seale and her related parties held interests in 3,220 Westpac Capital Notes 2 at year end.
| 2019 Westpac Group Annual Report | 83 |
| | |
Directors’ report
7.5. Details of Westpac equity holdings of Executive Key Management Personnel
The table below details Westpac equity held (and movement in that equity) by the CEO and Group Executives (including their related parties) for the year ended 30 September 20191.
Name | Type of equity-based
instrument | Number
held at
start of
the year | Number
granted
during the
year as
remuneration | Received
on exercise
and/or
exercised
during the
year | Number
forfeited
or lapsed
during the
year | Other
changes
during the
year | Number
held at end
of the year | Number
vested and
exercisable
at end of
the year |
Managing Director & Chief Executive Officer | | | | | | |
Brian Hartzer | Ordinary shares | 109,611 | 41,867 | - | - | - | 151,478 | - |
| CEO Performance share rights | 732,817 | 227,338 | - | (119,476) | - | 840,679 | - |
| Performance share rights | 34,263 | - | - | (34,263) | - | - | - |
Current Group Executives | | | | | | | |
Craig Bright2 | Ordinary shares | n/a | 132,151 | - | - | - | 132,151 | - |
| Performance share rights | n/a | 77,696 | - | - | - | 77,696 | - |
Lyn Cobley | Ordinary shares | 91,993 | 18,724 | - | - | - | 110,717 | - |
| Performance share rights | 261,846 | 94,964 | - | - | - | 356,810 | - |
Peter King | Ordinary shares | 97,791 | 20,796 | - | - | - | 118,587 | - |
| Performance share rights | 314,259 | 92,086 | - | (65,787) | - | 340,558 | - |
Rebecca Lim | Ordinary shares | 30,876 | 14,340 | - | - | - | 45,216 | - |
| Performance share rights | 144,092 | 62,948 | - | (13,823) | - | 193,217 | - |
David Lindberg | Ordinary shares | 64,952 | 17,719 | - | - | - | 82,671 | - |
| Performance share rights | 254,369 | 94,602 | - | (29,489) | - | 319,482 | - |
Carolyn McCann | Ordinary shares | 49,435 | 9,818 | - | - | - | 59,253 | - |
| Performance share rights | 42,816 | 49,910 | - | (14,178) | - | 78,548 | - |
David McLean | Ordinary shares | 9,613 | - | - | - | - | 9,613 | - |
| Performance share rights | 237,918 | 84,630 | - | (35,662) | - | 286,886 | 2,148 |
| Unhurdled share rights | 57,218 | 22,059 | - | - | - | 79,277 | 49,831 |
Christine Parker | Ordinary shares | 27,431 | 17,196 | - | - | (15,000) | 29,627 | - |
| Performance share rights | 240,311 | 73,380 | - | (53,168) | - | 260,523 | - |
David Stephen | Ordinary shares | - | 135,929 | - | - | - | 135,929 | - |
| Performance share rights | - | 278,698 | - | - | - | 278,698 | - |
Gary Thursby | Ordinary shares | 92,445 | 15,909 | - | - | - | 108,354 | - |
| Performance share rights | 154,553 | 76,438 | - | (17,013) | - | 213,978 | - |
Alastair Welsh2 | Ordinary shares | n/a | 4,223 | - | - | (20,802) | 37,256 | - |
| Performance share rights | n/a | - | - | - | - | 14,944 | - |
Former Group Executives | | | | | | | |
Brad Cooper2 | Ordinary shares | 131,982 | 16,090 | - | - | - | n/a | - |
| Performance share rights | 329,216 | 94,424 | - | (74,436) | - | n/a | - |
Dave Curran2 | Ordinary shares | 49,425 | - | - | - | - | n/a | - |
| Performance share rights | 288,436 | - | - | (63,519) | - | n/a | - |
George Frazis2 | Ordinary shares | 81,302 | 19,308 | - | - | (10,000) | n/a | - |
| Performance share rights | 300,880 | 89,928 | - | (58,231) | - | n/a | - |
1. The highest number of shares held by an individual in the table is 0.0043% of total Westpac ordinary shares outstanding as at 30 September 2019.
2. The information relates to the period the individual was a KMP. Refer to section 1 for further details.
84 | 2019 Westpac Group Annual Report | |
| | |
Directors’ report
7.6. Loans to Non-executive Directors and Executive Key Management Personnel disclosures
Financial instrument transactions that occurred during the financial year between Directors, the CEO or Group Executives and the Group are in the ordinary course of business on terms and conditions (including interest and collateral) as they apply to other employees and certain customers. These transactions consisted principally of normal personal banking and financial investment services.
The table below details loans to Non-executive Directors, the CEO and Group Executives (including their related parties) of the Group.
| Balance at start of
the year
$ | Interest paid and
payable for the year $ | Interest not charged
during the year
$ | Balance at end of
the year
$ | Number in Group at
end of the year |
Non-executive Directors | 3,544,610 | 306,091 | - | 19,785,162 | 4 |
CEO and Group Executives | 9,519,382 | 366,076 | - | 11,932,845 | 10 |
| 13,063,992 | 672,167 | - | 31,718,007 | 14 |
The table below details KMP (including their related parties) with loans above $100,000 during 2019.
| Balance at start of | Interest paid and | Interest not charged | Balance at end of | Highest
indebtedness during |
| the year $ | payable for the year $ | during the year $ | the year
$ | the year
$ |
Directors | | | | | |
Lindsay Maxsted | 1,572,889 | 71,630 | - | 2,666,979 | 2,666,979 |
Ewen Crouch | 979,947 | 39,833 | - | 928,781 | 1,479,947 |
Steven Harker1 | n/a | 158,722 | - | 15,000,000 | 15,000,000 |
Peter Nash | 991,774 | 35,906 | - | 1,189,402 | 1,498,923 |
CEO and Group Executives | | | | | |
Brian Hartzer | 9,847 | 15,572 | - | 806,470 | 814,285 |
Lyn Cobley | 2,000,000 | 85,800 | - | 2,000,000 | 2,007,287 |
Brad Cooper1 | 2,791,360 | 73,973 | - | n/a | 3,097,569 |
Rebecca Lim | 732,845 | 13,081 | - | 600,000 | 778,035 |
Carolyn McCann | 145,000 | 4,788 | - | 307,697 | 440,001 |
David McLean | 620,841 | 30,059 | - | 625,816 | 672,004 |
Christine Parker | 1,308,486 | 46,955 | - | 5,001,866 | 5,436,523 |
David Stephen | - | 3,112 | - | - | 672,755 |
Gary Thursby | 1,911,003 | 73,462 | - | 1,864,791 | 2,034,797 |
Alastair Welsh1 | n/a | 19,274 | - | 726,205 | 726,205 |
1. The information relates to the period the individual was a KMP. Refer to section 1 for further details.
| 2019 Westpac Group Annual Report | 85 |
| | |
Directors’ report
11. Auditor
a) Non-audit services
We may decide to engage PwC on assignments additional to their statutory audit duties where their expertise or experience with Westpac or a controlled entity is important.
Details of the non-audit service amounts paid or payable to PwC for non-audit services provided during the 2018 and 2019 financial years are set out in Note 39 and Note 35 to the respective financial statements.
PwC also provides audit and non-audit services to non-consolidated entities, non-consolidated trusts of which a Westpac Group entity is trustee, manager or responsible entity and non-consolidated superannuation funds or pension funds. The fees in respect of these services were approximately $7.5 million in total (2018: $7.5 million). PwC may also provide audit and non-audit services to other entities in which Westpac holds a minority interest and which are not consolidated. Westpac is not aware of the amount of any fees paid to PwC by those entities.
Westpac has a policy on engaging PwC, details of which are set out in the ‘Corporate governance’ section, including the subsection entitled ‘Engagement of the external auditor’, which forms part of this Directors’ report.
The Board has considered the position and, in accordance with the advice received from the Board Audit Committee, is satisfied that the provision of the non-audit services during 2019 by PwC is compatible with the general standard of independence for auditors imposed by the Corporations Act. The Directors are satisfied, in accordance with advice received from the Board Audit Committee, that the provision of non-audit services by PwC, as set out above, did not compromise the auditor independence requirements of the Corporations Act for the following reasons:
· all non-audit services provided by PwC for the year have been reviewed by the Board Audit Committee, which is of the view that they do not impact the impartiality and objectivity of PwC; and
· based on Board quarterly independence declarations made by PwC to the Board Audit Committee during the year, none of the services undermine the general principles relating to auditor independence including reviewing or auditing PwC’s own work, acting in a management or a decision-making capacity for the company, acting as advocate for the company or jointly sharing economic risk and rewards.
Signed in accordance with a resolution of the Board.

| 
|
Lindsay Maxsted | Brian Hartzer |
| |
Chairman | Managing Director & Chief Executive Officer |
| |
4 November 2019 | 4 November 2019 |
86 | 2019 Westpac Group Annual Report | |
| | |
This page has been intentionally left blank
| 2019 Westpac Group Annual Report | 87 |
| | |

Five year summary
Reading this report
Review of Group operations
Divisional performance
Risk and risk management
Westpac’s approach to sustainability
Other Westpac business information
88 | 2019 Westpac Group Annual Report | |
| | |
Five year summary1
(in $m unless otherwise indicated) | 2019 | 2018 | 2017 | 2016 | 2015 |
Income statements for the years ended 30 September2 | | | | | |
Net interest income | 16,907 | 16,505 | 15,516 | 15,148 | 14,267 |
Net fee income | 1,655 | 2,424 | 2,603 | 2,611 | 2,808 |
Net wealth management and insurance income | 1,029 | 2,061 | 1,800 | 1,899 | 2,228 |
Trading income | 929 | 945 | 1,202 | 1,124 | 964 |
Other income | 129 | 72 | 529 | 59 | 1,241 |
Net operating income before operating expenses and impairment charges | 20,649 | 22,007 | 21,650 | 20,841 | 21,508 |
Operating expenses | (10,106) | (9,566) | (9,282) | (9,073) | (9,339) |
Impairment charges | (794) | (710) | (853) | (1,124) | (753) |
Profit before income tax | 9,749 | 11,731 | 11,515 | 10,644 | 11,416 |
Income tax expense | (2,959) | (3,632) | (3,518) | (3,184) | (3,348) |
Profit attributable to non-controlling interests | (6) | (4) | (7) | (15) | (56) |
Net profit attributable to owners of Westpac Banking Corporation | 6,784 | 8,095 | 7,990 | 7,445 | 8,012 |
Balance sheet as at 30 September2 | | | | | |
Loans | 714,770 | 709,690 | 684,919 | 661,926 | 623,316 |
Other assets | 191,856 | 169,902 | 166,956 | 177,276 | 188,840 |
Total assets | 906,626 | 879,592 | 851,875 | 839,202 | 812,156 |
Deposits and other borrowings | 563,247 | 559,285 | 533,591 | 513,071 | 475,328 |
Debt issues | 181,457 | 172,596 | 168,356 | 169,902 | 171,054 |
Loan capital | 21,826 | 17,265 | 17,666 | 15,805 | 13,840 |
Other liabilities | 74,589 | 65,873 | 70,920 | 82,243 | 98,019 |
Total liabilities | 841,119 | 815,019 | 790,533 | 781,021 | 758,241 |
Total shareholders’ equity and non-controlling interests | 65,507 | 64,573 | 61,342 | 58,181 | 53,915 |
Key financial ratios | | | | | |
Shareholder value | | | | | |
Dividends per ordinary share (cents) | 174 | 188 | 188 | 188 | 187 |
Dividend payout ratio (%)3 | 88.83 | 79.52 | 79.28 | 84.19 | 73.39 |
Return on average ordinary equity (%) | 10.65 | 13.05 | 13.65 | 13.32 | 16.23 |
Basic earnings per share (cents) | 196.5 | 237.5 | 238.0 | 224.6 | 255.0 |
Net tangible assets per ordinary share ($)4 | 15.36 | 15.39 | 14.66 | 13.90 | 13.02 |
Share price ($): | | | | | |
High | 30.05 | 33.68 | 35.39 | 33.74 | 40.07 |
Low | 23.30 | 27.24 | 28.92 | 27.57 | 29.10 |
Close | 29.64 | 27.93 | 31.92 | 29.51 | 29.70 |
Business performance | | | | | |
Operating expenses to operating income ratio (%) | 48.94 | 43.47 | 42.87 | 43.53 | 43.42 |
Net interest margin (%) | 2.12 | 2.13 | 2.06 | 2.10 | 2.09 |
Capital adequacy | | | | | |
Total equity to total assets (%) | 7.2 | 7.3 | 7.2 | 6.9 | 6.6 |
Total equity to total average assets (%) | 7.3 | 7.4 | 7.2 | 7.0 | 6.8 |
APRA Basel III: | | | | | |
Common equity Tier 1 (%) | 10.67 | 10.63 | 10.56 | 9.48 | 9.50 |
Tier 1 ratio (%) | 12.84 | 12.78 | 12.66 | 11.17 | 11.38 |
Total capital ratio (%) | 15.63 | 14.74 | 14.82 | 13.11 | 13.26 |
Credit quality | | | | | |
Net impaired assets to equity and collectively assessed provisions (%) | 1.41 | 1.14 | 1.29 | 1.79 | 1.80 |
Total provisions for expected credit losses/impairment on loans and credit commitments to total loans (basis points)5 | 54 | 43 | 45 | 54 | 53 |
Other information | | | | | |
Full time equivalent employees (number at financial year end)6 | 33,288 | 35,029 | 35,096 | 35,580 | 35,484 |
1. Where accounting classifications have changed or where changes in accounting policy are adopted retrospectively, comparatives have been restated and may differ from results previously reported.
2. The above income statement extracts for 2019, 2018 and 2017 and balance sheet extracts for 2019 and 2018 are derived from the consolidated financial statements included in this Annual Report. The above income statement extracts for 2016 and 2015 and balance sheet extracts for 2017, 2016 and 2015 are derived from financial statements previously published.
3. Adjusted for Treasury shares.
4. Total equity attributable to owners of Westpac Banking Corporation, after deducting intangible assets divided by the number of ordinary shares outstanding, less Treasury shares held.
5. Provisions for expected credit losses (ECL) for the 30 September 2019 year end have been determined based on AASB 9 Financial Instruments (December 2014) (AASB 9). Comparatives based on AASB 139 Financial Instruments: Recognition and Measurement (AASB 139) have not been restated. Refer to Note 1 and Note 13 to the financial statements for further details.
6. Full-time equivalent employees include full-time, pro-rata part-time, overtime, temporary and contract staff.
| 2019 Westpac Group Annual Report | 89 |
| | |
Reading this report
Disclosure regarding forward-looking statements
This Annual Report contains statements that constitute ‘forward-looking statements’ within the meaning of Section 21E of the US Securities Exchange Act of 1934.
Forward-looking statements are statements about matters that are not historical facts. Forward-looking statements appear in a number of places in this Annual Report and include statements regarding Westpac’s intent, belief or current expectations with respect to its business and operations, market conditions, results of operations and financial condition, including, without limitation, future loan loss provisions and financial support to certain borrowers. Words such as ‘will’, ‘may’, ‘expect’, ‘intend’, ‘seek’, ‘would’, ‘should’, ‘could’, ‘continue’, ‘plan’, ‘estimate’, ‘anticipate’, ‘believe’, ‘probability’, ‘risk’, ‘aim’ or other similar words are used to identify forward-looking statements. These forward-looking statements reflect Westpac’s current views with respect to future events and are subject to change, certain risks, uncertainties and assumptions which are, in many instances, beyond Westpac’s control, and have been made based upon management’s expectations and beliefs concerning future developments and their potential effect upon Westpac. There can be no assurance that future developments will be in accordance with Westpac’s expectations or that the effect of future developments on Westpac will be those anticipated. Actual results could differ materially from those expected, depending on the outcome of various factors, including, but not limited to:
· the effect of, and changes in, laws, regulations, taxation or accounting standards or practices and government policy, particularly changes to liquidity, leverage and capital requirements;
· regulatory investigations and other actions, inquiries, litigation, fines, penalties, restrictions or other regulator imposed conditions, including as a result of our actual or alleged failure to comply with laws (such as financial crime laws), regulations or regulatory policy;
· internal and external events which may adversely impact Westpac’s reputation;
· information security breaches, including cyberattacks;
· reliability and security of Westpac’s technology and risks associated with changes to technology systems;
· the stability of Australian and international financial systems and disruptions to financial markets and any losses or business impacts Westpac or its customers or counterparties may experience as a result;
· market volatility, including uncertain conditions in funding, equity and asset markets;
· adverse asset, credit or capital market conditions;
· an increase in defaults in credit exposures because of a deterioration in economic conditions;
· the conduct, behaviour or practices of Westpac or its staff;
· changes to Westpac’s credit ratings or the methodology used by credit rating agencies;
· levels of inflation, interest rates (including low or negative rates), exchange rates and market and monetary fluctuations;
· market liquidity and investor confidence;
· changes in economic conditions, consumer spending, saving and borrowing habits in Australia, New Zealand and other countries (including as a result of tariffs and protectionist trade measures) in which Westpac or its customers or counterparties conduct their operations and Westpac’s ability to maintain or to increase market share, margins and fees, and control expenses;
· the effects of competition, including from established providers of financial services and from non-financial services entities, in the geographic and business areas in which Westpac conducts its operations;
· the timely development and acceptance of new products and services and the perceived overall value of these products and services by customers;
· the effectiveness of Westpac’s risk management policies, including internal processes, systems and employees;
· the incidence or severity of Westpac-insured events;
· the occurrence of environmental change (including as a result of climate change) or external events in countries in which Westpac or its customers or counterparties conduct their operations;
· changes to the value of Westpac’s intangible assets;
· changes in political, social or economic conditions in any of the major markets in which Westpac or its customers or counterparties operate;
· the success of strategic decisions involving diversification or innovation, in addition to business expansion activity, business acquisitions and the integration of new businesses; and
· various other factors beyond Westpac’s control.
The above list is not exhaustive. For certain other factors that may impact on forward-looking statements made by Westpac, refer to ‘Risk factors’ under the section ‘Risk and risk management’. When relying on forward-looking statements to make decisions with respect to Westpac, investors and others should carefully consider the foregoing factors and other uncertainties and events.
Westpac is under no obligation to update any forward-looking statements contained in this Annual Report, whether as a result of new information, future events or otherwise, after the date of this Annual Report.
90 | 2019 Westpac Group Annual Report | |
| | |
Reading this report
Significant developments
For a discussion of significant developments impacting the Group, refer to ‘Significant developments’ under ‘Information on Westpac’ in Section 1.
Currency of presentation, exchange rates and certain definitions
In this Annual Report, ‘financial statements’ means our audited consolidated balance sheets as at 30 September 2019 and 30 September 2018 and income statements, statements of comprehensive income, changes in equity and cash flows for each of the years ended 30 September 2019, 2018 and 2017 together with accompanying notes which are included in this Annual Report.
Our financial year ends on 30 September. As used throughout this Annual Report, the financial year ended 30 September 2019 is referred to as 2019 and other financial years are referred to in a corresponding manner.
We publish our consolidated financial statements in Australian dollars. In this Annual Report, unless otherwise stated or the context otherwise requires, references to ‘dollars’, ‘dollar amounts’, ‘$’, ‘AUD’ or ‘A$’ are to Australian dollars, references to ‘US$’, ‘USD’ or ‘US dollars’ are to United States dollars and references to ‘NZ$’, ‘NZD’ or ‘NZ dollars’ are to New Zealand dollars. Solely for the convenience of the reader, certain Australian dollar amounts have been translated into US dollars at a specified rate. These translations should not be construed as representations that the Australian dollar amounts actually represent such US dollar amounts or have been or could be converted into US dollars at the rate indicated. Unless otherwise stated, the translations of Australian dollars into US dollars have been made at the rate of A$1.00 = US$0.6746, the noon buying rate in New York City for cable transfers in Australian dollars as certified for customs purposes by the Federal Reserve Bank of New York (the ‘noon buying rate’) as of Monday, 30 September 2019. The Australian dollar equivalent of New Zealand dollars at 30 September 2019 was A$1.00 = NZ$1.0790, being the closing spot exchange rate on that date. Refer to ‘Exchange rates’ in Section 4 for information regarding the rates of exchange between the Australian dollar and the US dollar for the financial years ended 30 September 2015 to 30 September 2019.
Any discrepancies between totals and sums of components in tables contained in this Annual Report are due to rounding.
| 2019 Westpac Group Annual Report | 91 |
| | |
Review of Group operations
Selected consolidated financial and operating data
We have derived the following selected financial information as of, and for the financial years ended, 30 September 2019, 2018, 2017, 2016 and 2015 from our audited consolidated financial statements and related notes.
This information should be read together with our audited consolidated financial statements and the accompanying notes included elsewhere in this Annual Report.
Accounting standards
The financial statements and other financial information included elsewhere in this Annual Report, unless otherwise indicated, have been prepared and presented in accordance with Australian Accounting Standards (AAS). Compliance with AAS ensures that the financial statements also comply with International Financial Reporting Standards (IFRS) as issued by the International Accounting Standards Board (IASB).
The financial statements have been prepared in accordance with the accounting policies described in the Notes to the financial statements.
Recent accounting developments
For a discussion of recent accounting developments refer to Note 1 to the financial statements.
Critical accounting estimates
Our reported results are sensitive to the accounting policies, assumptions and estimates that underlie the preparation of the income statement and the balance sheet. Note 1(b) includes details of the areas of our critical accounting assumptions and estimates and a reference to the relevant note in the financial statements providing further information. Each of the assumptions and estimates have been discussed at our Board Audit Committee (BAC). The following is a summary of the areas involving our most critical accounting estimates.
Provisions (other than loan impairment charges)
Provisions are held in respect of a range of obligations such as employee entitlements, litigation and non-lending losses, impairment charges on credit commitments, surplus lease space, restructuring costs and compliance, regulation and remediation provisions. Some of the provisions involve significant judgement about the likely outcome of various events and estimated future cash flows. Refer to Note 27.
Provisions for expected credit losses (ECL)/impairment charges on loans
Provisions for ECL are a probability-weighted estimate of the cash shortfalls expected to result from defaults over the relevant timeframe. They are determined by evaluating a range of possible outcomes and taking into account the time value of money, past events, current conditions and forecasts of future economic conditions.
The models use three main components to determine the ECL (as well as the time value of money) including:
· Probability of default (PD): the probability that a counterparty will default;
· Loss given default (LGD): the loss that is expected to arise in the event of a default; and
· Exposure at default (EAD): the estimated outstanding amount of credit exposure at the time of the default.
The provisions for ECL are determined based on three stages as follows:
Stage 1: 12 months ECL - performing
For financial assets where there has been no significant increase in credit risk since origination a provision for 12 months ECL is recognised.
Stage 2: Lifetime ECL - performing
For financial assets where there has been a significant increase in credit risk since origination but where the asset is still performing a provision for lifetime ECL is recognised.
Stage 3: Lifetime ECL – non-performing
For financial assets that are non-performing a provision for lifetime ECL is recognised. Indicators include a breach of contract with the Group such as a default on interest or principal payments, a borrower experiencing significant financial difficulties or observable economic conditions that correlate to defaults on a group of loans.
Determining when a financial asset has experienced a significant increase in credit risk since origination is a critical accounting judgement which is primarily based on changes in internal customer risk grades since origination of the facility. The change in the internal customer risk grade that the Group uses to represent a significant increase in credit risk is based on a sliding scale. This means that a higher credit quality exposure at origination would require a more significant downgrade compared to a lower credit quality exposure before it is considered to have experienced a significant increase in credit risk.
Interest income is calculated based on the gross carrying amount of financial assets in stages 1 and 2 of the Group’s ECL model and on the carrying amount net of the provision for ECL for financial assets in stage 3.
The measurement of ECL for each stage and the assessment of significant increase in credit risk consider information about past events and current conditions as well as reasonable and supportable projections of future events and economic conditions. The estimation of forward looking information is a critical accounting judgement. The Group considers three future macroeconomic scenarios including a base case scenario along with upside and downside scenarios.
92 | 2019 Westpac Group Annual Report | |
| | |
Review of Group operations
The macroeconomic variables used in these scenarios, based on current economic forecasts, include (but are not limited to) unemployment rates, real gross domestic product growth rates and residential and commercial property price indices.
The macroeconomic scenarios are weighted based on the Group’s best estimate of the relative likelihood of each scenario. The weighting applied to each of the three macroeconomic scenarios takes into account historical frequency, current trends, and forward looking conditions.
As at 30 September 2019, gross loans to customers were $718,378 million (2018: $712,504 million) and the provision for ECL/impairment charges on loans was $3,608 million (2018: $2,814 million)1.
Fair value of financial instruments
Financial instruments classified as held-for-trading (including derivatives) are measured at fair value through income statement. Investment securities measured at fair value through other comprehensive income (AASB 9)/available-for-sale (AASB 139)2 are also recognised in the financial statements at fair value. As much as possible, financial instruments are valued with reference to quoted, observable market prices or by using models which employ observable valuation parameters. Where valuation models rely on parameters for which inputs are not observable, judgements and estimation may be required.
As at 30 September 2019, the fair value of trading securities and financial assets measured at fair value through profit or loss, investment securities measured at fair value through other comprehensive income (2019) / available-for-sale securities (2018), loans designated at fair value and life insurance assets was $113,989 million (2018: $94,247 million). The fair value of deposits and other borrowings at fair value, other financial liabilities at fair value, debt issues at fair value and life insurance liabilities was $56,979 million (2018: $56,427 million). The fair value of outstanding derivatives was a net asset of $763 million (2018: $306 million net liability). The fair value of financial assets and financial liabilities determined by valuation models that use unobservable market prices was $399 million (2018: $964 million) and $29 million (2018: $6 million), respectively. The fair value of financial assets and financial liabilities, including derivatives, is largely determined based on valuation models using observable market prices and rates. Where observable market inputs are not available, day one profits or losses are not recognised.
We believe that the judgements and estimates used are reasonable in the current market. However, a change in these judgements and estimates would lead to different results as future market conditions can vary from those expected.
Goodwill
Goodwill represents the excess of purchase consideration, the amount of any non-controlling interest in the acquiree and the acquisition date fair value of any previous equity interest in the acquiree, over the fair value of the identified net assets of acquired businesses. The determination of the fair value of the assets and liabilities of acquired businesses requires the exercise of management judgement. Different fair values would result in changes to the goodwill and to the post-acquisition performance of the acquisitions.
Goodwill is tested for impairment annually by determining if the carrying value of the cash-generating unit (CGU) that it has been allocated to is recoverable. The recoverable amount is the higher of the CGU’s fair value less costs to sell and its value-in-use. Determination of appropriate cash flows and discount rates for the calculation of the value in use is subjective. As at 30 September 2019, the carrying value of goodwill was $8,895 million (2018: $8,890 million).
Superannuation obligations
The actuarial valuation of our defined benefit plan obligations are dependent upon a series of assumptions, the key ones being price inflation, salary growth, mortality, morbidity, discount rate and investment returns. Different assumptions could significantly alter the amount of the difference between plan assets and defined benefit obligations and the amount recognised directly in retained profits.
The net superannuation deficit across all our plans as at 30 September 2019 was $335 million (2018: net superannuation surplus of $64 million). As at 30 September 2019, one superannuation plan was in surplus of $73 million (2018: two plans in surplus of $89 million) and three superannuation plans were in deficit of $408 million (2018: two plans in deficit of $25 million).
Income taxes
The Group is subject to income taxes in Australia and jurisdictions where it has foreign operations. All our businesses predominantly operate in jurisdictions with similar tax rates to the Australian corporate tax rate. Significant judgement is required in determining the worldwide provision for income taxes. There are many transactions and calculations undertaken during the ordinary course of business for which the ultimate tax determination is uncertain. For these circumstances, we hold appropriate provisions. Where the final outcome of these matters is different from the amounts that were initially recorded, such differences will impact the current and deferred tax provisions in the period where such determination is made.
Life insurance contract liabilities
The actuarial valuation of life insurance contract liabilities and associated deferred policy acquisition costs are dependent upon a number of assumptions. The key factors impacting the valuation of these liabilities and related assets are the cost of providing benefits and administering the contracts, mortality and morbidity experience, discontinuance experience and the rate at which projected future cash flows are discounted.
1. The provision for ECL on loans relates to the 30 September 2019 year end balance determined under AASB 9. The provision for impairment charges on loans related to the 2018 year end balance determined under AASB 139.
2. On adoption of AASB 9, the majority of available-for-sale securities were reclassified to Investment securities measured at fair value through other comprehensive income (FVOCI). Refer to Note 1 to the financial statements for more details.
| 2019 Westpac Group Annual Report | 93 |
| | |
Review of Group operations
Income statement review
Consolidated income statement1
For the years ending 30 September | 2019 | 2019 | 2018 | 2017 | 2016 | 2015 |
(in $m unless otherwise indicated) | US$2 | A$ | A$ | A$ | A$ | A$ |
Interest income | 22,412 | 33,222 | 32,571 | 31,232 | 31,822 | 32,295 |
Interest expense | (11,007) | (16,315) | (16,066) | (15,716) | (16,674) | (18,028) |
Net interest income | 11,405 | 16,907 | 16,505 | 15,516 | 15,148 | 14,267 |
Net fee income | 1,116 | 1,655 | 2,424 | 2,603 | 2,611 | 2,808 |
Net wealth management and insurance income | 694 | 1,029 | 2,061 | 1,800 | 1,899 | 2,228 |
Trading income | 627 | 929 | 945 | 1,202 | 1,124 | 964 |
Other income | 88 | 129 | 72 | 529 | 59 | 1,241 |
Net operating income before operating expenses and impairment charges | 13,930 | 20,649 | 22,007 | 21,650 | 20,841 | 21,508 |
Operating expenses | (6,817) | (10,106) | (9,566) | (9,282) | (9,073) | (9,339) |
Impairment charges | (536) | (794) | (710) | (853) | (1,124) | (753) |
Profit before income tax | 6,577 | 9,749 | 11,731 | 11,515 | 10,644 | 11,416 |
Income tax expense | (1,996) | (2,959) | (3,632) | (3,518) | (3,184) | (3,348) |
Net profit for the year | 4,581 | 6,790 | 8,099 | 7,997 | 7,460 | 8,068 |
Net profit attributable to non-controlling interests | (5) | (6) | (4) | (7) | (15) | (56) |
Net profit attributable to owners of Westpac Banking Corporation | 4,576 | 6,784 | 8,095 | 7,990 | 7,445 | 8,012 |
Weighted average number of ordinary shares (millions) | 3,450 | 3,450 | 3,406 | 3,355 | 3,313 | 3,140 |
Basic earnings per ordinary share (cents) | 132.6 | 196.5 | 237.5 | 238.0 | 224.6 | 255.0 |
Diluted earnings per share (cents)3 | 127.8 | 189.5 | 230.1 | 229.3 | 217.8 | 248.2 |
Dividends per ordinary share (cents) | 117 | 174 | 188 | 188 | 188 | 187 |
Dividend payout ratio (%)4 | 88.83 | 88.83 | 79.52 | 79.28 | 84.19 | 73.39 |
Overview of performance – 2019 v 2018
During 2019, Westpac adopted AASB 9 Financial Instruments (AASB 9) and AASB 15 Revenue from Contracts with Customers (AASB 15). As the Group chose to apply the standards prospectively, comparatives have not been restated.
Adopting the new standards has resulted in measurement and classification differences between 2019 and prior years. The significant differences are:
· the measurement of credit loss provision and impairment charges are now on an expected loss basis;
· line fees (mainly in Business) are now recognised in net interest income, previously most was recognised in net fee income;
· interest on performing loans is now measured on the gross loan value. Previously, interest was recognised on the loan balance net of impairment provision; and
· certain items previously netted are now presented on a gross basis, including payments from credit card schemes which were previously netted against related expenditure.
The changes have little impact on net profit but a more significant impact on individual line items. As these changes have only been applied from 1 October 2018, it is difficult to compare some line items across years. These changes are discussed further in Section 3, Note 1.
Net profit attributable to owners of Westpac Banking Corporation for 2019 was $6,784 million, a decrease of $1,311 million or 16% compared to 2018. 2019 included significant increases in provisions for estimated customer refunds, payments, associated costs, and litigation, along with costs associated with restructuring of the wealth business, which together reduced net profit after tax by $1,130 million. These items are discussed further in Note 27 to the financial statements. A summary of the impact of provisions for estimated customer refunds, payments, associated costs, and litigation and wealth restructuring costs split across income statement line items is shown in the ‘Divisional performance’ section.
Net interest income increased $402 million or 2% compared to 2018 driven by an increase of $686 million due to the reclassification of line fees from net fee income to interest income, partly offset by $239 million increase in provisions for estimated customer refunds, payments, associated costs, and litigation. Excluding the impact of these items, net interest income was flat compared to 2018. Average interest earning assets grew 3% primarily from Australian and New Zealand housing, offset by a lower margin. Reported net interest margin decreased 1 basis point to 2.12%.
1. Where accounting classifications have changed or where changes in accounting policy are adopted retrospectively, comparatives have been restated and may differ from results previously reported.
2. Australian dollar amounts have been translated into US dollars solely for the convenience of the reader at the rate of A$1.00 = US$0.6746 (refer to ‘Reading this report’ section).
3. Based on basic earnings per share, with the weighted average number of fully paid ordinary shares outstanding adjusted for the conversion of dilutive potential ordinary shares, issued for no consideration, and after adjusting earnings for distributions on dilutive potential ordinary shares.
4. Adjusted for Treasury shares.
94 | 2019 Westpac Group Annual Report | |
| | |
Review of Group operations
Net fee income decreased $769 million or 32% compared to 2018 primarily due to the reclassification of line fees to net interest income ($667 million in 2018) and $126 million increase in provisions for estimated customer refunds, payments, associated costs and litigation.
Net wealth management and insurance income decreased $1,032 million or 50% compared to 2018 primarily due to additional provisions for estimated customer refunds, payments, associated costs, and litigation of $531 million, higher general insurance claims from severe weather events $69 million, cessation of grandfathered advice commissions $42 million, lower wealth management income due to changes in platform pricing structure, and exit of the Hastings business in 2018.
Trading income decreased $16 million or 2% compared to 2018. The decline mainly relates to a change in methodology in derivative valuation adjustments partially offset by higher non-customer income.
Other income is up $57 million or 79% compared to 2018, primarily due to the non-repeat of a 2018 impairment charge on an equity holding of $104 million.
Operating expenses increased $540 million or 6% compared to 2018. The increase was mainly due to a $349 million increase in provisions for estimated customer refunds, payments, associated costs, and litigation and wealth reset, higher technology expenses of $174 million, a rise in regulatory, compliance and investment related spend of $170 million, partially offset by the exit of the Hastings business in 2018 of $158 million and a net productivity benefit.
Impairment charges were $84 million or 12% higher compared to 2018. Asset quality remained sound, with stressed exposures as a percentage of total committed exposures at 1.20%, up 12 basis points over the year.
The effective tax rate of 30.4% in 2019 was lower than the 2018 effective tax rate of 31.0%. The lower effective tax rate in 2019 reflects a decrease in non-deductible expenses from the non-repeat of the 2018 goodwill write-off associated with the exit of Hastings.
The Board has determined a final dividend of 80 cents per ordinary share. The full year ordinary dividends of 174 cents is lower than the ordinary dividends declared in 2018 and represents a pay-out ratio of 88.83%. The full year ordinary dividend is fully franked.
Income statement review – 2019 v 2018
Net interest income – 2019 v 2018
$m | 2019 | 2018 | 2017 |
Interest income | 33,222 | 32,571 | 31,232 |
Interest expense | (16,315) | (16,066) | (15,716) |
Net interest income | 16,907 | 16,505 | 15,516 |
Increase/(decrease) in net interest income | | | |
Due to change in volume | 397 | 648 | 855 |
Due to change in rate | 5 | 341 | (487) |
Change in net interest income | 402 | 989 | 368 |
Net interest income increased $402 million or 2% compared to 2018. Key features include:
· 3% growth in average interest-earning assets, primarily from Australian and New Zealand housing and higher third party liquids;
· Group net interest margin decreased 1 basis point to 2.12%. Refer to Interest spread and margin – 2019 v 2018 for primary drivers of margin movement.
| 2019 Westpac Group Annual Report | 95 |
| | |
Review of Group operations
Loans increased $5.1 billion or 1% compared to 2018. Excluding foreign currency translation impacts, loans increased $2.9 billion.
Key features of loan growth were:
· Australian housing loans increased $4.5 billion or 1% with $60.6 billion of new lending partially offset by $56.1 billion of run off. Owner occupied balances grew 3% and comprised 58% of the portfolio, while investor property lending decreased 1%;
· Australian personal loans decreased $1.8 billion or 8%, across personal lending, credit cards and auto finance. Demand for unsecured lending continued to decline in 2019 with our experience in line with the market;
· Australian business and institutional loans decreased $2.0 billion or 1%, mostly due to lower institutional property lending as divisions prioritised returns over growth, partially offset by growth in agricultural lending;
· Australian provision balances increased $0.8 billion or 32% at the start of the year mostly from the implementation of AASB 9 on 1 October 2018 , which calculates credit loss provisioning on an expected loss basis; and
· New Zealand lending increased A$4.4 billion or 6%. Housing loans grew 7%, mostly in fixed rate products and business lending increased 6%, supported by growth in agricultural, and property lending. This was partially offset by a decline personal lending and credit cards.
Deposits and other borrowings excluding certificates of deposit increased $6.8 billion or 1% compared to 2018. Excluding foreign currency translation impacts, deposits and other borrowings excluding certificates of deposit increased $4.7 billion.
Key features of deposits and other borrowings excluding certificates of deposit growth were:
· Australian deposits and other borrowings excluding certificates of deposit increased $2.4 billion or 1%, mostly from an increase in savings and transactional deposits, partially offset by a reduction in term deposits. Non- interest bearing deposits were up 4% from increased mortgage offset balances; and
· New Zealand deposits and other borrowings excluding certificates of deposit increased A$3.1 billion or 5%, as term deposits were up 4% and interest bearing transactional deposits were up 12%. Non-interest bearing deposits increased 18%, from growth in business and consumer transactional deposits.
Certificates of deposit decreased $2.8 billion or 7%, reflecting reduced short-term wholesale funding issuance in this form.
Interest spread and margin – 2019 v 2018
$m | 2019 | 2018 | 2017 |
Group | | | |
Net interest income | 16,907 | 16,505 | 15,516 |
Average interest earning assets | 798,924 | 774,944 | 752,294 |
Average interest bearing liabilities | 734,282 | 715,509 | 694,924 |
Average net non-interest bearing assets, liabilities and equity | 64,642 | 59,435 | 57,370 |
Interest spread1 | 1.94% | 1.95% | 1.89% |
Benefit of net non-interest bearing assets, liabilities and equity2 | 0.18% | 0.18% | 0.17% |
Net interest margin3 | 2.12% | 2.13% | 2.06% |
Group net interest margin of 2.12% decreased 1 basis point from 2018. Key features include:
· Provisions for estimated customer refunds, payments, associated costs, and litigation contributed to a reduction in margin of 3 basis points;
· 11 basis points increase from the adoption of AASB 15 and AASB 9 primarily related to the reclassification of line fees from net fee income to net interest income and the measurement of interest on performing loans based on the gross loan value; and
· Except for these items, net interest margin decreased 9 basis points driven by:
· Changes in short term wholesale funding rates having little impact with the average cost being similar in 2018 and 2019 despite the sharp reduction in bank bill swap rate (BBSW) in the second half of 2019;
· Loan spreads were little changed, with the impact from changes to pricing of Australian variable mortgages being offset by competition, retention pricing and changes in the mix of the mortgage portfolio with customers switching from interest only to principal and interest;
· 2 basis point decrease from lower customer deposit spreads due to broad based competition and the impact from lower interest rates, particularly in the second half of 2019; and
· 2 basis point decrease from liquidity primarily due to increased balances of third party liquid assets.
· Treasury & Markets contribution decreased 5 basis points due to lower Treasury revenue from interest rate risk management (3 basis points), and fair value adjustments (2 basis points).
1. Interest spread is the difference between the average yield on all interest earning assets and the average yield on all interest bearing liabilities.
2. The benefit of net non-interest bearing assets, liabilities and equity is determined by applying the average yield paid on all interest bearing liabilities to the average level of net non-interest bearing funds as a percentage of average interest earning assets.
3. Net interest margin is calculated by dividing net interest income by average interest earning assets.
96 | 2019 Westpac Group Annual Report | |
| | |
Review of Group operations
Non-interest income - 2019 v 2018
$m | 2019 | 2018 | 2017 |
Net fee income | 1,655 | 2,424 | 2,603 |
Net wealth management and insurance income | 1,029 | 2,061 | 1,800 |
Trading income | 929 | 945 | 1,202 |
Other income | 129 | 72 | 529 |
Non-interest income | 3,742 | 5,502 | 6,134 |
Non-interest income decreased $1,760 million or 32% compared to 2018. Key features include:
· $657 million decrease from provisions for estimated customer refunds, payments, associated costs, and litigation;
· $508 million decrease from the adoption of AASB 15 primarily related to the reclassification of line fees from net fee income to net interest income ($667 million) and reclassification of certain items previously netted that are now presented on a gross basis (up $159 million);
· Exit of Hastings business in 2018 ($203 million); and
· Except for these items, non-interest income decreased by $392 million due to reduced net wealth management and insurance income and lower trading income.
Net fee income decreased $769 million or 32%, including $126 million additional provisions for estimated customer refunds, payments, associated costs, and litigation mostly related to financial planning, reclassification of line fees from non-interest income to net interest income as a result of the adoption of AASB 15 to more appropriately reflect the relationship with drawn lines of credit (down $667 million) and the reclassification of certain items previously netted that are now presented on a gross basis including card scheme support payments (up $153 million).
Except for these items, net fee income decreased $129 million or 6% mainly from:
· Lower advice income following the exit of financial planning (down $76 million);
· Lower revenue from payments and transaction fees (down $34 million) driven by increased merchant costs and lower account based fees in New Zealand following the decision to simplify certain consumer fees; and
· A decrease in business lending and mortgage fees largely due to reduced new lending volumes (down $27 million); partly offset by
· Higher corporate and institutional lending fees largely from syndication fees generated in the first half of 2019 (up $10 million).
Net wealth management and insurance income decreased $1,032 million or 50% compared to 2018, including additional provisions for estimated customer refunds, payments, associated costs, and litigation (mostly related to financial planning) of $531 million. Additionally, there was no contribution from Hastings, following the exit of the business in 2018 (down $203 million).
Except for these items, net wealth management and insurance income decreased $298 million, mainly from:
· Insurance income decreased $139 million from:
– A reduction in general insurance income (down $69 million) from higher claims, including the New South Wales hailstorm and Queensland floods;
– A reduction in life insurance income (down $39 million) following the implementation of regulatory reforms (“Protect Your Super”) and higher claims and movement in policyholder tax recoveries (down $23 million); and
– Lower LMI income (down $8 million) primarily from a reduction in loans written at higher LVR bands.
· Lower Platforms and Superannuation income (down $98 million) primarily driven by margin compression from full year impact of platform repricing, implementation of regulatory reforms (‘Protect your Super’), product mix changes and outflows in legacy platforms. This has been partly offset by an 89% increase in BT Panorama funds to $23 billion due to inflows and higher asset markets; and
· Cessation of grandfathered commission payments (down $42 million).
Trading income decreased $16 million or 2% compared to 2018, primarily driven by the derivative valuation adjustment (down $78 million) partially offset by higher non-customer income.
Other income increased $57 million or 79% compared to 2018, reflecting the impairment loss on the remaining Pendal shares in 2018 that did not repeat ($104 million), higher gains from asset sales and revaluation of a Fintech investment ($98 million), partially offset by loss on financial instruments measured at fair value ($100 million), lower rental income from operating leases ($35 million) and the impact of hedging future earnings (down $19 million).
| 2019 Westpac Group Annual Report | 97 |
| | |
Review of Group operations
Operating expenses – 2019 v 2018
$m | 2019 | 2018 | 2017 |
Staff expenses | 5,038 | 4,887 | 4,701 |
Occupancy expenses | 1,023 | 1,033 | 1,073 |
Technology expenses | 2,319 | 2,110 | 2,008 |
Other expenses | 1,726 | 1,536 | 1,500 |
Total operating expenses | 10,106 | 9,566 | 9,282 |
Total operating expenses to net operating income ratio | 48.94% | 43.47% | 42.87% |
Operating expenses increased $540 million or 6% compared to 2018. Key features include:
· increased costs associated with the Wealth Reset ($241 million higher);
· estimated costs associated with implementing customer refunds and payments and litigation ($108 million higher);
· an increase due to the reclassification of $238 million predominantly related to merchant and card schemes from non-interest income to operating expenses; and
· reduced costs from the exit of the Hastings business ($158 million).
Except for these items, operating expenses increased $111 million, primarily driven by regulatory and compliance costs ($99 million higher) and investment related spend ($71 million higher) with productivity offsetting underlying cost growth.
Staff expenses increased $151 million or 3% compared to 2018. This was due to costs associated with the Wealth Reset and estimated costs associated with implementing customer refunds and payments and litigation ($231 million higher). Except for these items, staff expenses decreased $80 million primarily due to a 5% decrease in FTE from productivity initiatives related to organisation simplification and channel optimisation along with lower variable reward. This was partly offset by annual salary increases and the Group’s investment programs having a higher proportion of spend expensed during the year.
Occupancy expenses decreased $10 million or 1% compared to 2018, driven by the reduction in branch numbers (down 61), the exit of 4 corporate sites and the removal of 375 ATMs. This was partly offset by annual rental increases and costs associated with branch and ATM rationalisation.
Technology expenses increased $209 million or 10%. This was due to costs associated with the Wealth Reset and estimated costs associated with implementing customer refunds and payments and litigation ($35 million higher). Except for these items, technology expenses increased $174 million largely due to higher amortisation of software assets ($91 million higher) as key platforms became operational, including the Customer Service Hub, New Payments Platform and Panorama.
Other expenses increased $190 million or 12%. This was due to costs associated with the Wealth Reset and estimated costs associated with implementing customer refunds and payments and litigation ($83 million higher). Except for these items, expenses increased $107 million from increased professional services costs primarily related to regulatory and compliance activity on Financial Crime, data privacy, product and system simplification and risk management, and higher marketing expenses, partly offset by lower costs associated with the exit of Hastings business ($111 million lower) and the Royal Commission
Impairment charges – 2019 v 2018
$m | 2019 | 2018 | 2017 |
Impairment charges | 794 | 710 | 853 |
Impairment charges to average gross loans (basis points) | 11 | 10 | 13 |
Asset quality remained sound through 2019 with stressed exposures to total committed exposures increasing by 12 basis points to 1.20%. The increase in stressed exposures was due to higher impaired and higher 90+ days but not impaired facilities. Emerging stress is mostly from an increase in mortgage delinquencies due to the softening of economic activity and falling house prices.
Given modest change in asset quality, impairment charges have remained low at $794 million in 2019, equal to 11 basis points of gross loans.
Impairment charges for 2019 of $794 million were up $84 million when compared to 2018.
Key movements included:
· The introduction of AASB9 required the removal of the recognition of the time value of money on performing collective provisions which contributed $115 million increase in impairment charges; and
· Write-offs, included in non-performing provisions, were $95 million higher principally in Australian unsecured lending portfolios including Auto finance and from increases in customers utilising hardship; partially offset by
· Non performing provisions relating to new individually assessed provisions (IAPs) were $28 million lower due to lower provisions required in the Business division and New Zealand, partially offset by an increase in WIB; and
· A higher economic overlay release of $96 million 2019 (2018: $22 million). Refer to Note 13.
98 | 2019 Westpac Group Annual Report | |
| | |
Review of Group operations
Income tax expense – 2019 v 2018
$m | 2019 | 2018 | 2017 |
Income tax expense | 2,959 | 3,632 | 3,518 |
Tax as a percentage of profit before income tax expense (effective tax rate) | 30.35% | 30.96% | 30.55% |
The effective tax rate of 30.4% in 2019 was lower than the 2018 effective tax rate of 31.0%. The lower effective tax rate in 2019 reflects a decrease in non-deductible expenses which included penalties and the non-repeat of the 2018 write-off of the Hastings goodwill associated with the exit of that business which was non-deductible. The effective tax rate above the Australian corporate tax rate of 30% reflects several Tier 1 Instruments whose distributions are not deductible for Australian taxation purposes.
Overview of performance – 2018 v 2017
Net profit attributable to owners of Westpac Banking Corporation for 2018 was $8,095 million, an increase of $105 million or 1% compared to 2017. Features of this result included a $357 million or 2% increase in net operating income before operating expenses and impairment charges, a $284 million or 3% increase in operating expenses and a $143 million or 17% decrease in impairment charges.
Net interest income increased $989 million or 6% compared to 2017, with total loan growth of 4%, mostly from Australian housing which grew 4%. Net interest margin increased 7 basis points to 2.13% reflecting increased spreads on certain Australian mortgages, a rise in Treasury income and contribution from fair value gains on economic hedges and higher deposit spreads. These increases were partly offset by the full period impact of the Bank Levy which was effective from July 2017. Wholesale funding costs were little changed, as short term funding costs increased while long term funding costs decreased.
Non-interest income decreased $632 million or 10% compared to 2017 primarily due to a decrease in trading income of $257 million, the non-repeat of a large gain of $279 million on disposal of an associate (Pendal) in 2017, an impairment loss of $104 million on the Pendal investment in 2018, and additional provisions for estimated customer refunds, payments, associated costs and litigation recorded as negative income. These items were partly offset by income related to the exit of the Hastings business ($135 million).
Operating expenses increased $284 million or 3% compared to 2017. The rise included annual salary increases, higher technology expenses related to the Group’s investment program, an increase in regulatory and compliance costs and costs associated with the exit of the Hastings business. These increases were partly offset by productivity benefits and lower amortisation of intangibles.
Impairment charges were $143 million or 17% lower compared to 2017. Asset quality remained sound, with stressed exposures as a percentage of total committed exposures (TCE) at 1.08%, up 3 basis points over the year. The decrease in impairment charges was primarily due to reduced individual provisions for larger facilities.
The effective tax rate of 31.0% was higher than the 2017 effective tax rate of 30.6% mostly related to an increase in non-deductible expenses.
2018 basic earnings per share were 237.5 cents per share compared to 238.0 cents per share in 2017.
The full year ordinary dividends of 188 cents was unchanged over ordinary dividends declared in 2017 and represented a pay-out ratio of 79.52%. The full year ordinary dividend was fully franked.
Income statement review – 2018 v 2017
Net interest income – 2018 v 2017
Net interest income increased $989 million or 6% compared to 2017. Key features include:
· A 3% growth in average interest-earning assets, primarily from Australian housing which grew 4%;
· Group net interest margin increased 7 basis points. The full period impact of pricing changes for certain Australian mortgages in 2017, including investor lending and interest only loans, higher New Zealand mortgage spreads and higher term deposits spreads, were partly offset by the full period impact of the Bank Levy. Wholesale funding costs were little changed, as short term costs increased and long term costs reduced. In addition, Treasury and Markets income was higher in 2018 primarily due to increased revenue from interest risk management and a rise in contributions from fair value gains on economic hedges.
Total net loans increased $24.8 billion or 4% compared to 2017. Excluding foreign currency translation impacts, total net loans increased $24.0 billion or 3%.
Key features of total loan growth were:
· Australian housing loans increased $17.6 billion or 4% (slightly below system growth1). Owner occupied loans increased 6% over the year, while the Group’s investor property lending grew by 2%. Principal and interest loan flows represented 77% of all new flows and now comprise 61% of the portfolio (2017: 50%);
· Australian business loans increased $3.8 billion or 3% from broad based growth in Business including SME, agriculture, manufacturing and property;
· New Zealand lending increased NZ$3.2 billion or 4%. Housing loans grew at 4% mostly in fixed rate products, while business lending increased 4% supported by growth across agriculture, property and corporate lending; and
· Other overseas lending increased $1.7 billion or 12%, across trade finance and institutional lending in Asia.
1. Source: Reserve Bank of Australia.
| 2019 Westpac Group Annual Report | 99 |
| | |
Review of Group operations
Total deposits and other borrowings excluding certificates of deposits increased $31.1 billion or 6% compared to 2017, with the increase more than fully funding loan growth in the year. Excluding foreign currency translation impacts, deposits and other borrowings excluding certificates of deposits increased $29.5 billion or 6%.
Key features of total deposits and other borrowings excluding certificates of deposits growth were:
· Australian deposits and other borrowings excluding certificates of deposits increased $25.8 billion or 6%, particularly across term deposits (up 10%). Household deposits growth was in line with system1 and non- financial corporation deposits grew above system1. Customers continued to direct funds to mortgage offset accounts, supporting 4% growth in Australian non-interest bearing deposits;
· New Zealand deposits and other borrowings excluding certificates of deposits increased NZ$3.5 billion or 6%, with the increase fully funding loan growth during the year. Term deposits grew 9%, particularly across household and institutional segments. Non-interest bearing deposits increased 12% from growth in business and consumer transaction deposits, including growth in mortgage offset accounts; and
· Other overseas deposits and other borrowings excluding certificates of deposits increased $2.3 billion or 19% due to growth in deposits across Asia.
Certificates of deposits decreased $5.4 billion or 11%, reflecting reduced short-term wholesale funding issuance in this form.
Interest spread and margin – 2018 v 2017
Net interest margin was 2.13% in 2018, up 7 basis points compared to 2017. Key drivers of the margin increase were:
· 2 basis points increase from loan spreads. This reflected the full period impact of pricing changes for certain Australian mortgages in late 2017, including interest only and investor lending, along with higher spreads on New Zealand mortgages. These gains were partly offset by the impact of customers switching from interest only to principal and interest loans, retention pricing, customer preference for lower spread basic products and competition across loan markets;
· 2 basis points increase related to customer deposit spreads, mainly from term deposits, partly offset by the impact of lower rates on the hedging of transaction deposits;
· 2 basis points decrease from a rise in short term wholesale funding costs, particularly in the second half of 2018;
· 2 basis points increase from term wholesale funding as pricing for new term issuance was lower than the portfolio average;
· 4 basis points decrease from the full period impact of the Bank Levy, which was introduced on 1 July 2017;
· 1 basis point increase in capital and other largely from the positive effect of higher capital balances, partly offset by the impact of lower interest rates; and
· 6 basis points increase from Treasury and Markets, due to increased Treasury revenue from interest rate risk management and a rise in contributions from fair value gains on economic hedges.
Non-interest income – 2018 v 2017
Non-interest income decreased $632 million or 10% over the year. 2018 was impacted by a number of items, including income related to the exit of the Hastings business ($135 million) partly offset by an increase in provisions for estimated customer refunds, payments, associated costs and litigation (up $52 million from $111 million in 2017 to $163 million in 2018).
Excluding the impact of these items and the partial sale of Pendal shares of $279 million in 2017, non-interest income was $436 million or 7% lower, primarily due to reduced markets income and lower banking fee income from the full period impact of regulatory changes to Australian credit card interchange fees and removal of ATM withdrawal fees.
Fees and commissions decreased $179 million or 7% compared to 2017, largely due to:
· additional provisions for estimated customer refunds, payments, associated costs and litigation ($101 million), related to Advice and retail banking products;
· lower revenue from the removal of ATM withdrawal fees and changes to transaction fees ($64 million);
· lower credit card income ($49 million) from the full period impact of regulatory changes to Australian interchange rates from 1 July 2017 and lower rewards redemptions; and
· lower corporate and institutional lending fees ($23 million) from a reduction in unused customer limits; partly offset by
· higher business lending fees ($40 million) primarily driven by portfolio growth; and
· lower credit card loyalty program costs down ($26 million) from changes to reward programs.
1. Source: Australian Prudential Regulation Authority.
100 | 2019 Westpac Group Annual Report | |
| | |
Review of Group operations
Wealth management and insurance income increased $261 million or 15% compared to 2017, reflecting:
· a rise in Hastings revenue which included fees of $144 million related to the exit of the business, the associated costs can be seen in other expenses;
· a fall in provisions for estimated customer refunds and payments for wealth products ($49 million);
· higher revenue from investments in boutique funds ($43 million); and
· higher insurance income ($41 million) reflecting:
– increase in general insurance income ($24 million) from lower claims, with the prior year impacted by Cyclone Debbie, and a 2% increase in net earned premiums;
– increase in life insurance income ($34 million) from movements in policyholder tax recoveries and a 17% increase to earned premiums, primarily due to BTFG commencing the management of Group Insurance for BTFG Corporate Super in 2018. This was partly offset by a rise in claims; and
– lower LMI contribution ($17 million) due to a reduction in loans written at higher LVR bands; partly offset by
· lower platforms income ($14 million), impacted by margin compression and pricing changes to BT Panorama in July 2018. This was partly offset by the benefit of higher asset markets.
Trading income decreased $257 million or 21% compared to 2017. The majority of the reduction was due to a lower fixed income trading result.
Other income decreased $457 million or 86% compared to 2017 reflecting the partial sale of Pendal shares ($279 million) in 2017 that did not repeat, impairment loss on the remaining Pendal shares ($104 million), the impact of hedging future earnings (down $44 million) and lower rental income ($36 million).
Operating expenses – 2018 v 2017
Operating expenses increased $284 million or 3% compared to 2017. The key factors of the result were:
· higher costs related to exit of the Hastings business ($121 million), costs associated with implementing customer refunds and payments ($62 million) and provisions for litigation ($50 million);
· growth in regulation and compliance expenses of $184 million, including expenses related to the Royal Commission of $62 million;
· higher investment related expenses of $125 million largely across our banking and wealth platforms; and
· growth in other operating costs of $204 million; partly offset by
· lower intangible asset amortisation of $158 million; and
· productivity benefits of $304 million.
Staff expenses increased $186 million or 4% compared to 2017 from the full period impact of annual salary increases, higher restructuring costs (up $39 million) and additional FTE for regulatory and compliance activities and the Group’s investment program. This was partly offset by lower bonuses and productivity benefits largely related to simplifying the organisation and digitising processes across the branch network and operations.
Occupancy expenses decreased $40 million or 4% from lower depreciation on operating leases (down $30 million) and benefits from retail property consolidation (branch numbers down by 47 across the Group), partly offset by higher energy costs.
Technology expenses increased $102 million or 5% compared to 2017, primarily due to the Group’s investment program. Higher technology services costs (up $82 million) and software maintenance and licensing costs (up $29 million) were driven by continued investment spend, increased volumes and new software licences following upgraded capability. This was partly offset by lower IT equipment depreciation (down $17 million) as prior investment in data centres was fully depreciated.
Other expenses increased $36 million or 2% during the year and contained a number of items, including the write- off of Hastings goodwill ($105 million) following the exit of that business, provisions for litigation ($50 million) and costs associated with implementing customer refunds and payments ($25 million). Excluding these items, expenses reduced by $144 million primarily due to lower amortisation of intangible assets (down $158 million) as a number of intangible assets were fully amortised during the year; postage and stationery costs decreased ($35 million) as customers migrated to electronic statements; and benefits from disciplined cost management. These were partly offset by costs associated with the Royal Commission.
Impairment charges – 2018 v 2017
Asset quality remained sound through 2018 with stressed assets to total committed exposures increasing by 3 basis points to 1.08%. The increase in stress mostly reflects higher mortgage delinquencies and a small rise in stressed exposures in Business. Impaired assets were lower, with gross impaired assets to gross loans 2 basis points lower at 0.20% compared to 30 September 2017.
Provisioning levels at 30 September 2018 of $3,053 million were $66 million lower compared to 30 September 2017. IAPs were $58 million lower in line with the decline in impaired facilities while CAPs were $8 million lower. Within CAPs the overlay was down $22 million to $301 million at 30 September 2018.
Impairment charges for 2018 of $710 million are equivalent to 10 basis points of average loans and were down $143 million when compared to 2017.
| 2019 Westpac Group Annual Report | 101 |
| | |
Review of Group operations
Key movements included:
· total new IAPs less write-backs and recoveries were $112 million lower than 2017. This was due to lower new IAPs (down $239 million) partially offset by lower write-backs. The reduction in new IAPs was due to a small number of large impairments in WIB in 2017 while in 2018 no new large impaired loans (greater than $50 million) emerged during the year. New IAPs in Business were also lower. This was partially offset by higher new IAPs in New Zealand; and
· total new CAPs were $31 million lower due to a $110 million reduction in write-offs partially offset by a $79 million fall in the benefit from other changes in CAPs. Write-offs were lower, principally in Consumer from the credit card portfolio and in Business related to the auto finance and commercial portfolios. The overlay was $22 million lower in 2018 compared to a $66 million reduction in 2017.
Income tax expense – 2018 v 2017
The effective tax rate of 31.0% in 2018 was higher than the 2017 effective tax rate of 30.6%. The effective tax rate was higher than the Australian corporate tax rate of 30% due to the non-deductibility of certain expenses, including penalties and the write-off of Hastings goodwill associated with the exit of that business.
Balance sheet review
Selected consolidated balance sheet data1
The detailed components of the balance sheet are set out in the notes to the financial statements.
| 2019 | 2019 | 2018 | 2017 | 2016 | 2015 |
As at 30 September | US$m2 | A$m | A$m | A$m | A$m | A$m |
Cash and balances with central banks | 13,532 | 20,059 | 26,788 | 18,786 | 17,397 | 15,135 |
Collateral paid | 4,000 | 5,930 | 4,787 | 5,716 | 8,205 | 8,137 |
Trading securities and financial assets measured at | | | | | | |
fair value through income statement and investment | | | | | | |
securities/available-for-sale securities | 70,956 | 105,182 | 84,251 | 86,693 | 82,841 | 83,231 |
Derivative financial instruments | 20,143 | 29,859 | 24,101 | 24,033 | 32,227 | 48,173 |
Loans | 482,184 | 714,770 | 709,690 | 684,919 | 661,926 | 623,316 |
Life insurance assets | 6,319 | 9,367 | 9,450 | 10,643 | 14,192 | 13,125 |
All other assets | 14,476 | 21,459 | 20,525 | 21,085 | 22,414 | 21,039 |
Total assets | 611,610 | 906,626 | 879,592 | 851,875 | 839,202 | 812,156 |
Collaterial received | 2,217 | 3,287 | 2,184 | 2,477 | 1,784 | 4,045 |
Deposits and other borrowings | 379,966 | 563,247 | 559,285 | 533,591 | 513,071 | 475,328 |
Other financial liabilities | 19,708 | 29,215 | 28,105 | 30,799 | 28,704 | 30,671 |
Derivative financial instruments | 19,628 | 29,096 | 24,407 | 25,375 | 36,076 | 48,304 |
Debt issues | 122,411 | 181,457 | 172,596 | 168,356 | 169,902 | 171,054 |
Life insurance liabilities | 4,977 | 7,377 | 7,597 | 9,019 | 12,361 | 11,559 |
All other liabilities | 3,788 | 5,614 | 3,580 | 3,250 | 3,318 | 3,440 |
Total liabilities excluding loan capital | 552,695 | 819,293 | 797,754 | 772,867 | 765,216 | 744,401 |
Loan capital | 14,724 | 21,826 | 17,265 | 17,666 | 15,805 | 13,840 |
Total liabilities | 567,419 | 841,119 | 815,019 | 790,533 | 781,021 | 758,241 |
Net assets | 44,191 | 65,507 | 64,573 | 61,342 | 58,181 | 53,915 |
Total equity attributable to owners of Westpac Banking Corporation | 44,155 | 65,454 | 64,521 | 61,288 | 58,120 | 53,098 |
Non-controlling interests | 36 | 53 | 52 | 54 | 61 | 817 |
Total shareholders’ equity and non-controlling interests | 44,191 | 65,507 | 64,573 | 61,342 | 58,181 | 53,915 |
Average balances | | | | | | |
Total assets | 603,581 | 894,724 | 873,310 | 854,058 | 831,439 | 791,719 |
Loans and other receivables3 | 469,009 | 695,240 | 681,201 | 657,628 | 631,266 | 596,378 |
Total equity attributable to owners of Westpac | | | | | | |
Banking Corporation | 42,981 | 63,714 | 62,017 | 58,556 | 55,896 | 49,361 |
Non-controlling interests | 34 | 50 | 31 | 20 | 575 | 854 |
1. Where accounting classifications have changed or where changes in accounting policy are adopted retrospectively, comparatives have been restated and may differ from results previously reported.
2. Australian dollar amounts have been translated into US dollars solely for the convenience of the reader at the rate of A$1.00 = US$0.6746 (refer to ‘Reading this report’ section).
3. Includes interest earning balances. Effective from 1 October 2018, loans and other receivables are net of Stage 3 provisions to reflect the adoption of AASB 9. For prior years, loans and receivables are net of provisions for impairment charges on loans (refer to Note 9 of the financial statements). Other receivables include cash and balances with central banks and other interest earning assets.
102 | 2019 Westpac Group Annual Report | |
| | |
Review of Group operations
Summary of consolidated ratios
As at 30 September | 2019 | 2019 | 2018 | 2017 | 2016 | 2015 |
(in $m unless otherwise indicated) | US$1 | A$ | A$ | A$ | A$ | A$ |
Profitability ratios (%) | | | | | | |
Net interest margin2 | 2.12 | 2.12 | 2.13 | 2.06 | 2.10 | 2.09 |
Return on average assets3 | 0.76 | 0.76 | 0.93 | 0.94 | 0.90 | 1.01 |
Return on average ordinary equity4 | 10.65 | 10.65 | 13.05 | 13.65 | 13.32 | 16.23 |
Return on average total equity5 | 10.64 | 10.64 | 13.05 | 13.64 | 13.18 | 15.96 |
Capital ratios (%) | | | | | | |
Average total equity to average total assets | 7.13 | 7.13 | 7.10 | 6.86 | 6.79 | 6.34 |
Common equity Tier 1 | 10.67 | 10.67 | 10.63 | 10.56 | 9.48 | 9.50 |
Tier 1 ratio | 12.84 | 12.84 | 12.78 | 12.66 | 11.17 | 11.38 |
Total capital ratio | 15.63 | 15.63 | 14.74 | 14.82 | 13.11 | 13.26 |
Earning ratios | | | | | | |
Basic earnings per ordinary share (cents)6 | 132.6 | 196.5 | 237.5 | 238.0 | 224.6 | 255.0 |
Diluted earnings per ordinary share (cents)7 | 127.8 | 189.5 | 230.1 | 229.3 | 217.8 | 248.2 |
Dividends per ordinary share (cents) | 117 | 174.0 | 188 | 188 | 188 | 187 |
Dividend payout ratio (%) | 88.83 | 88.83 | 79.52 | 79.28 | 84.19 | 73.39 |
Credit quality ratios | | | | | | |
Loans written off (net of recoveries) | 662 | 982 | 948 | 1,488 | 1,052 | 1,107 |
Loans written off (net of recoveries) to average loans (bps) | 14 | 14 | 14 | 22 | 16 | 18 |
Balance sheet review
Assets – 2019 v 2018
Total assets as at 30 September 2019 were $906.6 billion, an increase of $27.0 billion or 3% compared to 30 September 2018. Significant movements during the year included:
· cash and balances with central banks decreased $6.7 billion or 25% reflecting lower liquid assets held in this form;
· collateral paid increased $1.1 billion or 24% mainly due to an increase in collateralised derivative liabilities;
· trading securities and financial assets measured at fair value through income statement (FVIS), available-for- sale securities and investment securities increased $20.9 billion or 25% reflecting higher liquid assets held in this form;
· derivative assets increased $5.8 billion or 24% mainly driven by movements in cross currency swaps, foreign currency forward contracts and interest rate swaps; and
· loans grew $5.1 billion or 1%. Refer to loan quality – 2019 v 2018 below for further information.
Liabilities and equity – 2019 v 2018
Total liabilities as at 30 September 2019 were $841.1 billion, an increase of $26.1 billion or 3% compared to 30 September 2018. Significant movements during the year included:
· collateral received increased $1.1 billion or 51% due to an increase in collateralised derivative assets;
· deposits and other borrowings increased $4.0 billion or 1%;
· other financial liabilities increased $1.1 billion or 4% mainly driven by securities sold under agreements to repurchase and interbank deposits, partially offset by decreases in accrued interest payable and other financial liabilities;
· derivative liabilities increased $4.7 billion or 19% driven by movements in cross currency swaps and interest rate swaps;
· debt issues increased $8.9 billion or 5% ($1.8 billion or 1% decrease excluding foreign currency translation impacts, fair value and hedge accounting adjustments); and
· loan capital increased $4.6 billion or 26% mainly due to $3.2 billion net issuance of Tier 2 capital instruments in response to APRA’s Total Loss Absorbing Capital announcement and $1.3 billion impact of hedging and foreign currency translation.
1. Australian dollar amounts have been translated into US dollars solely for the convenience of the reader at the rate of A$1.00 = US$0.6746 (refer to ‘Reading this report’ section).
2. Calculated by dividing net interest income by average interest earning assets.
3. Calculated by dividing net profit attributable to owners of Westpac Banking Corporation by average total assets.
4. Calculated by dividing net profit attributable to owners of Westpac Banking Corporation by average ordinary equity.
5. Calculated by dividing net profit attributable to owners of Westpac Banking Corporation by average ordinary equity and non-controlling interests.
6. Based on the weighted average number of fully paid ordinary shares.
7. Based on basic earnings per share, with the weighted average number of fully paid ordinary shares outstanding adjusted for the conversion of dilutive potential ordinary shares, issued for no consideration, and after adjusting earnings for distributions on dilutive potential ordinary shares.
| 2019 Westpac Group Annual Report | 103 |
| | |
Review of Group operations
Equity attributable to owners of Westpac Banking Corporation increased $0.9 billion or 1% reflecting retained profits and shares issued under the 2019 interim dividend reinvestment plan (DRP) and 2018 final DRP, partially offset by $0.7 billion opening retained earnings adjustment due to the adoption of new accounting standards and dividends paid during the year.
Loan quality – 2019 v 20181
| As at 30 September |
$m | 2019 | 2018 | 2017 |
Total gross loans1 | 718,378 | 712,504 | 687,785 |
Average gross loans | | | |
Australia | 622,241 | 611,398 | 588,920 |
New Zealand | 78,065 | 73,000 | 72,269 |
Other overseas | 16,615 | 16,228 | 12,837 |
Total average gross loans | 716,921 | 700,626 | 674,026 |
Total gross loans represented 79% of the total assets of the Group as at 30 September 2019, 2% lower compared with 30 September 2018. The decrease was mainly due to greater holdings of liquid assets and movements in cross currency swaps and interest rate swaps.
Australian average gross loans were $622.2 billion in 2019, an increase of $10.8 billion or 2% from $611.4 billion in 2018. This increase was primarily due to growth in housing loans.
New Zealand average gross loans were A$78.1 billion in 2019, an increase of A$5.1 billion or 7% from A$73.0 billion in 2018. Excluding foreign currency translation impacts, New Zealand average gross loans grew A$2.7 billion or 4%. The growth was mostly from fixed rate housing loans and business lending, partially offset by lower personal lending and credit cards.
Other overseas average loans were $16.6 billion in 2019, an increase of $0.4 billion or 2% from $16.2 billion in 2018. This was primarily due to the depreciation of AUD against USD.
Approximately 14% of the loans at 30 September 2019 mature within one year and 17% mature between one year and five years. Retail lending comprises the majority of the loan portfolio maturing after five years.
Housing and personal loans that were past due, can be disaggregated based on days overdue at 30 September 2019 as follows:
Consolidated | | 2019 | | | 2018 | |
$m | 30-89 days | 90+ days | Total | 30-89 days | 90+ days | Total |
Loans | | | | | | |
Loans - housing | 3,574 | 4,063 | 7,637 | 3,133 | 3,271 | 6,404 |
Loans - personal | 395 | 356 | 751 | 427 | 371 | 798 |
Total | 3,969 | 4,419 | 8,388 | 3,560 | 3,642 | 7,202 |
Impaired exposures2,3
| As at 30 September |
$m | 2019 | 2018 | 2017 | 2016 | 2015 |
Impaired exposures | | | | | |
Housing and business loans: | | | | | |
Gross | 1,327 | 1,019 | 1,142 | 1,851 | 1,593 |
Provisions | (534) | (458) | (507) | (885) | (689) |
Net | 793 | 561 | 635 | 966 | 904 |
Personal loans greater than 90 days past due: | | | | | |
Gross | 405 | 371 | 373 | 277 | 263 |
Provisions | (248) | (189) | (195) | (166) | (172) |
Net | 157 | 182 | 178 | 111 | 91 |
Restructured: | | | | | |
Gross | 31 | 26 | 27 | 31 | 39 |
Provisions | (10) | (6) | (12) | (16) | (16) |
Net | 21 | 20 | 15 | 15 | 23 |
Net impaired exposures | 971 | 763 | 828 | 1,092 | 1,018 |
Provisions for ECL/impairment on loans and credit commitments | | | | | |
Individually assessed provisions | 412 | 422 | 480 | 869 | 669 |
Collectively assessed provisions | 3,501 | 2,631 | 2,639 | 2,733 | 2,663 |
Total provisions for ECL/impairment on loans and credit commitments | 3,913 | 3,053 | 3,119 | 3,602 | 3,332 |
Loan quality | | | | | |
Total provisions for ECL/impairment charges on impaired exposures to total impaired exposures3 | 44.92% | 46.12% | 46.30% | 49.42% | 46.28% |
Gross impaired exposures to total gross loans | 0.25% | 0.20% | 0.22% | 0.32% | 0.30% |
Total provisions for ECL/impairment on loans and credit commitments to gross loans | 0.54% | 0.43% | 0.45% | 0.54% | 0.53% |
Total provisions for ECL/impairment on loans and credit commitments to gross impaired exposures | 222.0% | 215.6% | 202.3% | 166.8% | 175.8% |
1. Gross loans are stated before related provision for ECL/impairment charges on loans and credit commitments.
2. The Group has adopted AASB9 and AASB15 from 1 October 2018. Comparatives have not been restated. Refer to Note 1 for further detail.
3. Impaired provisions relating to impaired loans include IAP plus the proportion of the CAP that relates to impaired loans. The proportion of the CAP that relates to impaired loans was $380 million as at 30 September 2019 (2018: $231 million, 2017: $234 million, 2016: $198 million, 2015: $208 million). This sum is compared to the total gross impaired loans to determine this ratio.
104 | 2019 Westpac Group Annual Report | |
| | |
Review of Group operations
The credit quality remained sound over 2019, with total stressed exposures to TCE increasing by 12 basis points to 1.20%. Total impaired exposures as a percentage of total gross loans were 0.25% at 30 September 2019, an increase of 0.05% from 0.20% at 30 September 2018.
At 30 September 2019, we had one impaired counterparty with exposure greater than $50 million, accounting for 4% of total impaired loans. This compares to one impaired counterparty with exposure greater than $50 million in 2018 accounting for 4% of total impaired loans. There was one impaired counterparty at 30 September 2019 that was less than $50 million and greater than $20 million (2018: two impaired counterparties).
At 30 September 2019, 79% of our exposure was to either investment grade or secured consumer mortgage segment (2018: 79%, 2017: 78%, 2016: 78%, 2015: 77%) and 96% of our exposure as at 30 September 2019 was in Australia, New Zealand and the Pacific region (2018: 95%, 2017: 96%, 2016: 96%, 2015: 95%).
We believe that Westpac remains appropriately provisioned. Total impairment provisions for impaired exposure to total impaired exposure coverage at 44.9% at 30 September 2019 compared to 46.1% at 30 September 2018. Total provisions for ECL on loans and credit commitments to total impaired exposures represented 222.0% of total impaired loans as at 30 September 2019, up from 215.6%1 at 30 September 2018. Total provisions for ECL on loans and credit commitments to total loans were 0.54% at 30 September 2019, up from 0.43%1 at 30 September 2018 (2017: 0.45%)1.
Group mortgage loans 90 days past due at 30 September 2019 were 0.82% of outstandings, up from 0.67% of outstandings at 30 September 2018 (2017: 0.62%).
Group other consumer loan delinquencies (including credit card and personal loan products) were 1.69% of outstandings as at 30 September 2019, up from 1.64% of outstandings as at 30 September 2018 (2017: 1.57%).
Potential problem loans as at 30 September 2019 amounted to $1,297 million, a decrease of 23% from $1,691 million at 30 September 2018. The decrease in potential problem loans was mainly due to the downgrade of a Institutional counterparty to impaired over the year.
Potential problem loans are facilities that are performing and no loss is expected, but the customer demonstrates significant weakness in debt servicing or security cover that could jeopardise repayment of debt on current terms if not rectified. Potential problem loans are identified using established credit frameworks and policies, which include the ongoing monitoring of facilities through the use of watchlists.
Capital resources
APRA measures an ADI’s regulatory capital using three measures:
· Common Equity Tier 1 Capital (CET1) comprises the highest quality components of capital that consists of paid-up share capital, retained profits and certain reserves, less certain intangible assets, capitalised expenses and software, and investments and retained profits in insurance and funds management subsidiaries that are not consolidated for capital adequacy purposes;
· Tier 1 Capital being the sum of CET1 and Additional Tier 1 Capital. Additional Tier 1 Capital comprises high quality components of capital that consist of certain securities not included in CET1, but which include loss absorbing characteristics; and
· Total Regulatory Capital being the sum of Tier 1 Capital and Tier 2 Capital. Tier 2 Capital includes subordinated instruments and other components of capital that, to varying degrees, do not meet the criteria for Tier 1 Capital, but nonetheless contribute to the overall strength of an ADI and its capacity to absorb losses.
Under APRA’s Prudential Standards, Australian ADIs, including Westpac, are required to maintain a minimum CET1 ratio of at least 4.5%, Tier 1 Capital ratio of at least 6.0% and Total Regulatory Capital ratio of at least 8.0%. APRA may also require ADIs, including Westpac, to meet Prudential Capital Requirements (PCRs) above the minimum capital ratios. APRA does not allow the PCRs for individual ADIs to be disclosed.
APRA also requires ADIs to hold additional CET1 buffers comprising of:
· a capital conservation buffer (CCB) of 3.5% for ADIs designated by APRA as domestic systemically important banks (D-SIBs) unless otherwise determined by APRA, which includes a 1.0% surcharge for D-SIBs. APRA has determined that Westpac is a D-SIB; and
· a countercyclical capital buffer. The countercyclical buffer is set on a jurisdictional basis and APRA is responsible for setting the requirement in Australia. The countercyclical buffer requirement is currently set to zero for Australia and New Zealand.
Collectively, the above buffers are referred to as the “Capital Buffer” (CB). Should the CET1 capital ratio fall within the capital buffer range restrictions on the distributions of earnings will apply. This includes restrictions on the amount of earnings that can be distributed through dividends, Additional Tier 1 Capital distributions and discretionary staff bonuses.
1. The provisions for impairment charges on loans and credit commitments were determined under AASB139.
| 2019 Westpac Group Annual Report | 105 |
| | |
Review of Group operations
Capital actions
While Westpac’s CET1 capital ratio is above APRA’s ‘unquestionably strong’ benchmark of 10.5%, the Group’s lower cash earnings, new operational risk capital overlays and changes in the calculation of risk weighted assets has impacted the Group’s capital generation over the year. Given our priority for balance sheet strength and our goal to support customer growth, we are seeking to raise approximately $2.5 billion in capital to provide an increased buffer above APRA’s unquestionably strong benchmark. The raising also creates flexibility for changes in capital rules and potential litigation or regulatory action. The raising is expected to lift the Group’s CET1 ratios by around 46-581 basis points.
Capital management strategy
Westpac’s approach to capital management seeks to ensure that it is adequately capitalised as an ADI. Westpac evaluates its approach to capital management through an Internal Capital Adequacy Assessment Process (ICAAP), the key features of which include:
· the development of a capital management strategy, including consideration of regulatory minimums, capital buffers and contingency plans;
· consideration of both economic and regulatory capital requirements;
· a stress testing framework that challenges the capital measures, coverage and requirements including the impact of adverse economic scenarios; and
· consideration of the perspectives of external stakeholders, including rating agencies and equity and debt investors.
In light of APRA’s ‘unquestionably strong’ capital benchmarks, Westpac will seek to operate with a CET1 capital ratio above 10.5% in March and September as measured under the existing capital framework. Additional buffers may also be held to reflect challenging or uncertain environments. This also takes into consideration:
· Current regulatory capital minimums and the capital conservation buffer (CCB), which together are the total CET1 requirement2;
· Stress testing to calibrate an appropriate buffer against a downturn; and
· Quarterly volatility of capital ratios due to the half yearly cycle of ordinary dividend payments.
Westpac will revise its target capital level once APRA finalises its review of the capital adequacy framework.
Total regulatory capital developments
On 9 July 2019 APRA announced that it will require the major banks (including Westpac) to lift Total Regulatory Capital by three percentage points of RWA by 1 January 2024 in order to boost loss absorbing capacity and support orderly resolution. APRA also confirmed that its overall long term target of an additional four to five percentage points of loss absorbing capacity remains unchanged, and that it will consider the most feasible alternative method of sourcing the remaining one to two percentage points, taking into account the particular characteristics of the Australian financial system.
Further details of APRA’s regulatory changes are set out in the Significant Developments section of the 2019 Annual Report.
1. Based on risk weighted assets as at 30 September 2019, a 46 basis point increase reflects the impact of the placement only of $2 billion, while a 58 basis point increase reflects the impact of both the placement and the share purchase plan, assuming the share purchase plan raises $500 million (the basis point impacts are net of issue costs).
2. Noting that APRA may apply higher CET1 requirements for an individual ADI.
106 | 2019 Westpac Group Annual Report | |
| | |
Review of Group operations
Basel Capital Accord
APRA’s Prudential Standards are generally consistent with the International Regulatory Framework for Banks, also known as Basel III, issued by the Basel Committee on Banking Supervision (BCBS), except where APRA has exercised certain discretions. On balance, the application of these discretions acts to reduce capital ratios reported under APRA’s Prudential Standards relative to the BCBS approach and to those reported in some other jurisdictions.
Westpac is accredited by APRA to apply advanced models permitted by the Basel III global capital adequacy regime to the measurement of its regulatory capital requirements. Westpac uses the Advanced Internal Ratings Based approach for credit risk, the Advanced Measurement Approach (AMA) for operational risk and the internal model approach for Interest Rate Risk in the Banking Book (IRRBB).
Westpac’s Level 2 regulatory capital ratios as at 30 September are summarised in the table below. As the table summarises Westpac’s Level 2 regulatory capital structure, the capital amounts shown are not the same as the Westpac Group’s consolidated financial statements. Westpac’s Pillar 3 Report provides further details regarding Westpac’s capital structure.
Westpac’s Level 2 regulatory capital ratios as at 30 September are summarised in the table below. Westpac’s Pillar 3 Report provides further details regarding Westpac’s capital structure.
$m | 2019 | 2018 |
Common equity | 64,320 | 63,576 |
Deductions from common equity | (18,568) | (18,337) |
Total common equity after deductions | 45,752 | 45,239 |
Additional Tier 1 capital | 9,299 | 9,144 |
Net Tier 1 regulatory capital | 55,051 | 54,383 |
Tier 2 capital | 12,226 | 8,565 |
Deductions from Tier 2 capital | (255) | (233) |
Total Tier 2 capital after deductions | 11,971 | 8,332 |
Total regulatory capital | 67,022 | 62,715 |
Credit risk | 367,864 | 362,749 |
Market risk | 9,350 | 6,723 |
Operational risk | 47,680 | 39,113 |
Interest rate risk in the banking book | 530 | 12,989 |
Other assets | 3,370 | 3,810 |
Total risk weighted assets | 428,794 | 425,384 |
Common Equity Tier 1 capital ratio | 10.67% | 10.63% |
Additional Tier 1 capital ratio | 2.17% | 2.15% |
Tier 1 capital ratio | 12.84% | 12.78% |
Tier 2 capital ratio | 2.79% | 1.96% |
Total regulatory capital ratio | 15.63% | 14.74% |
| 2019 Westpac Group Annual Report | 107 |
| | |
Review of Group operations
Purchase of equity securities
The following table details share repurchase activity for the year ended 30 September 2019:
| | | | Maximum Number |
| | | Total Number of | (or Approximate $ Value) |
| | | Ordinary Shares | of Ordinary Shares that |
| Total Number of | Average Price Paid | Purchased as | May Yet Be Purchased |
| Ordinary Shares | per Ordinary Share | Part of a Publicly | Under the Plans or |
| Purchased | $ | Announced Program | Programs |
Month | | | | |
October (2018) | 86,722 | 27.33 | – | n/a |
November (2018) | 1,142,256 | 25.41 | – | n/a |
December (2018) | 2,446,726 | 25.38 | – | n/a |
January (2019) | – | – | – | n/a |
February (2019) | 831 | 26.84 | – | n/a |
March (2019) | 129,335 | 26.32 | – | n/a |
April (2019) | 3,538 | 26.26 | – | n/a |
May (2019) | 72,970 | 26.45 | – | n/a |
June (2019) | 35,684 | 27.38 | – | n/a |
July (2019) | 63,512 | 28.02 | – | n/a |
August (2019) | 856 | 28.32 | – | n/a |
September (2019) | 8,817 | 28.63 | – | n/a |
Total | 3,991,247 | 25.55 | – | – |
Purchases of ordinary shares during the year were made on market and relate to the following:
· to deliver to eligible employees under the Employee Share Plan (ESP): 1,061,442 ordinary shares;
· to deliver to employees upon the exercise of options and performance share rights: 221,874 ordinary shares;
· Treasury shares held by statutory life funds and managed investment schemes and ordinary shares held by Westpac in respect of equity derivatives sold to customers: nil ordinary shares; and
· to allocate to eligible employees under the Restricted Share Plan (RSP): 2,707,931 ordinary shares.
Refer to Note 28 to the financial statements for a discussion of Treasury share purchases.
Commitments
Contractual obligations and commitments
In connection with our operating activities we enter into certain contractual obligations and commitments. The following table shows our significant contractual obligations as at 30 September 2019:
$m | Up to
1 Year | Over
1 to 3 Years | Over
3 to 5 Years | Over
5 Years | Total |
On balance sheet long-term debt1 | 31,090 | 35,806 | 50,674 | 38,049 | 155,619 |
Operating leases2 | 608 | 980 | 736 | 1,421 | 3,745 |
Total contractual cash obligations | 31,698 | 36,786 | 51,410 | 39,470 | 159,364 |
The above table excludes deposits and other liabilities taken in the normal course of banking business and short-term and undated liabilities.
Commercial commitments3
The following table shows our significant commercial commitments as at 30 September 2019:
$m | Up to
1 Year | Over
1 to 3 Years | Over
3 to 5 Years | Over
5 Years | Total |
Letters of credit and guarantees | 7,334 | 4,639 | 719 | 2,458 | 15,150 |
Commitments to extend credit | 41,488 | 58,402 | 12,917 | 63,195 | 176,002 |
Other | 125 | - | – | 63 | 188 |
Total commercial commitments | 48,947 | 63,041 | 13,636 | 65,716 | 191,340 |
1. Refer to Note 18 to the financial statements for details of on balance sheet long-term debt.
2. Refer to Note 26 to the financial statements for details of operating leases.
3. The numbers in this table are notional amounts (refer to Note 27 to the financial statements).
108 | 2019 Westpac Group Annual Report | |
| | |
Divisional performance
Divisional performance – 2019 v 2018
On 19 March 2019, the Group announced changes to the way it supports customer’s wealth and insurance needs, realigning its BT Financial Group (BTFG) businesses into expanded Consumer and Business divisions and exiting the provision of personal financial advice by Westpac Group salaried financial advisers and authorised representatives. As a result, the insurance business was transferred to Consumer, the funds management business was transferred to Business , and the Advice business and certain support functions were transferred to Group Businesses. Changes to the Group’s organisation structure were effective from 1 April 2019 and the results of the operating segments for 2018 and 2017 have been restated.
Westpac reports under the following four primary customer-facing business divisions:
· Consumer:
– is responsible for sales and service of banking and financial products and services to consumer customers in Australia;
– responsible for the Group’s Australian insurance business, which covers the manufacture and distribution of life, general and lenders mortgage insurance; and
– operates under the Westpac, St.George, BankSA, Bank of Melbourne, RAMS and BT brands.
· Business:
– is responsible for sales and service of banking and financial products and services for SME and commercial business customers in Australia. SME and Commercial business customers typically have facilities up to approximately $150 million;
– is responsible for Private Wealth, serving the banking needs of high net worth customers across the banking brands;
– is responsible for the manufacture and distribution of investments (including margin lending and equities broking), superannuation and retirement products as well as wealth administration platforms; and
– operates under the Westpac, St.George, BankSA, Bank of Melbourne and BT brands.
· Westpac Institutional Bank:
– is responsible for delivering a broad range of financial products and services to commercial, corporate, institutional and government customers with connections to Australia and New Zealand;
– services include financing, transactional banking, financial and debt capital markets;
– customers are supported throughout Australia, as well as via branches and subsidiaries located in New Zealand, US, UK and Asia; and
– also responsible for Westpac Pacific, providing a range of banking services in Fiji and Papua New Guinea.
· Westpac New Zealand:
– responsible for sales and service of banking, wealth and insurance products to customers in New Zealand;
– customer base includes consumers, business and institutional customers; and
– operates under the Westpac brand for banking products, the Westpac Life brand for life insurance products and the BT brand for wealth products.
· Group Businesses include:
– Treasury, which is responsible for the management of the Group’s balance sheet including wholesale funding, capital and management of liquidity. Treasury also manages the interest rate risk and foreign exchange risks inherent in the balance sheet, including managing the mismatch between Group assets and liabilities. Treasury’s earnings are primarily sourced from managing the Group’s balance sheet and interest rate risk, (excluding Westpac New Zealand) within set risk limits;
– Group Technology, which comprises functions for the Australian businesses, is responsible for technology strategy and architecture, infrastructure and operations, applications development and business integration;
– Core Support, which comprises functions performed centrally, including Australian banking operations, property services, strategy, finance, risk, compliance, legal, human resources, and customer and corporate relations;
– Following the Group’s decision to restructure the Wealth operating segment and to exit of the Advice business in March 2019, the remaining Advice activities (including associated remediation) and certain support functions have been transferred to Group Businesses; and
– Group Businesses also includes earnings on capital not allocated to divisions, certain intra-group transactions that facilitate presentation of performance of the Group’s operating segments, earnings from non-core asset sales, earnings and costs associated with the Group’s Fintech investments, and certain other head office items such as centrally held provisions.
The accounting standard AASB 8 Operating Segments requires segment results to be presented on a basis that is consistent with information provided internally to Westpac’s key decision makers. In assessing financial performance, including divisional results, Westpac Group uses a measure of performance referred to as ‘cash earnings’. Cash earnings is viewed as a measure of the level of profit that is generated by ongoing operations and is therefore considered in assessing distributions, including dividends. Cash earnings is neither a measure of cash flow nor net profit determined on a cash accounting basis, as it includes both cash and non-cash adjustments to net profit attributable to owners of Westpac Banking Corporation. Management believes this allows the Group to more effectively assess performance for the current period against prior periods and to compare performance across business divisions and across peer companies.
| 2019 Westpac Group Annual Report | 109 |
| | |
Divisional performance
A reconciliation of cash earnings to net profit attributable to owners of Westpac Banking Corporation for each business division is set out in Note 2 of the Financial Statements.
To determine cash earnings, three categories of adjustments are made to statutory results:
· material items that key decision makers at the Westpac Group believe do not reflect operating performance;
· items that are not considered when dividends are recommended, such as the amortisation of intangibles, impact of Treasury shares and economic hedging; and
· accounting reclassifications between individual line items that do not impact statutory results.
The discussion of our divisional performance in this section is presented on a cash earnings basis unless otherwise stated. Cash earnings is not directly comparable to statutory results presented in other parts of this Annual Report.
Outlined below are the cash earnings adjustments to the reported result:
· amortisation of intangible assets: Identifiable intangible assets arising from business acquisitions are amortised over their useful lives, ranging between four and twenty years. This amortisation (excluding capitalised software) is a cash earnings adjustment because it is a non-cash flow item and does not affect cash distributions available to shareholders. The last of these intangible assets were fully amortised in December 2017;
· fair value (gain)/loss on economic hedges (which do not qualify for hedge accounting under AAS) comprise:
– the unrealised fair value (gain)/loss on foreign exchange hedges of future New Zealand earnings impacting non-interest income is reversed in deriving cash earnings as they may create a material timing difference on reported results but do not affect the Group’s cash earnings over the life of the hedge; and
– the unrealised fair value (gain)/loss on hedges of accrual accounted term funding transactions are reversed in deriving cash earnings as they may create a material timing difference on reported results but do not affect the Group’s cash earnings over the life of the hedge;
· ineffective hedges: The unrealised (gain)/loss on ineffective hedges is reversed in deriving cash earnings because the gain or loss arising from the fair value movement in these hedges reverses over time and does not affect the Group’s profits over time;
· adjustment related to Pendal (previously BTIM): Consistent with prior years’ treatment, this item have been treated as a cash earnings adjustment given their size and that it does not reflect ongoing operations. The Group has indicated that it may sell the remaining 10% shareholding in Pendal at some future date. From September 2018, this adjustment relates to the mark to market of the shares and separation costs related to the original sell down. Any future gain or loss on this shareholding will similarly be excluded from the calculation of cash earnings;
· Treasury shares: Under AAS, Westpac shares held by the Group in the managed funds and life businesses are deemed to be Treasury shares and the results of holding these shares cannot be recognised in the reported results. In deriving cash earnings, these results are included to ensure there is no asymmetrical impact on the Group’s profits because the Treasury shares support policyholder liabilities and equity derivative transactions which are re-valued in determining income; and
· accounting reclassifications between individual line items that do not impact reported results comprise:
– policyholder tax recoveries: Income and tax amounts that are grossed up to comply with the AAS covering Life Insurance Business (policyholder tax recoveries) are reversed in deriving income and taxation expense on a cash earnings basis; and
– operating leases: Under AAS rental income on operating leases is presented gross of the depreciation of the assets subject to the lease. These amounts are offset in deriving non-interest income and operating expenses on a cash earnings basis.
· for Westpac, AASB 9 and AASB 15 were adopted on 1 October 2018 and as comparatives were not restated, line item movements in our reported results are not directly comparable across periods. In order to provide the operational trends in business, we have revised the 2018 and 2017 cash earnings comparatives as if the standards applied on 1 October 2017, except for expected credit loss provisioning which is not feasible. These adjustments do not impact 2018 and 2017 cash earnings but affect individual line items. These adjustments are comprised of:
– line fees: The Group has reclassified line fees (mostly Business) from non-interest income to net interest income to more appropriately reflect the relationship with drawn lines of credit;
– card scheme: Support payments received from Mastercard and Visa have been reclassified to non-interest income and related expenses have been reclassified to operating expenses;
– interest carrying adjustment: Interest on performing loans (stage 1 and stage 2 loans) is now measured on the gross loan value. Previously, interest on performing loans was recognised on the loan balance net of provisions. This adjustment increases interest income and impairment charges;
– other fees and expenses: The Group has restated the classification of a number of fees and expenses. This has resulted in the grossing up of net interest income, non-interest income, impairment charges and operating expenses; and
– merchant terminal costs: Some variable costs related to Westpac’s merchant terminal business have been reclassified between non-interest income and operating expenses.
110 | 2019 Westpac Group Annual Report | |
| | |
Divisional performance
The guidance provided in Australian Securities and Investments Commission (ASIC) Regulatory Guide 230 has been followed when presenting this information.
Comparatives have also been restated for:
· recent customer migration between divisions. This includes restatements to divisional income statements and balance sheets;
· refinement in expense allocations; and
· changes to the Group’s organisation structure following the realignment of the BTFG businesses into Consumer, Business and Group Businesses.
Cash earnings by division
The following tables present, for each of the key divisions of our business, the cash earnings and total assets at the end of the financial years ended 30 September 2019, 2018 and 2017. Refer to Note 2 to the financial statements for the disclosure of our geographic and business segments and the reconciliation to net profit attributable to owners of Westpac Banking Corporation.
$m | 2019 | 2018 | 2017 |
Consumer | 3,288 | 3,423 | 3,452 |
Business | 2,431 | 2,756 | 2,554 |
Westpac Institutional Bank | 1,014 | 1,093 | 1,163 |
Westpac New Zealand | 985 | 934 | 917 |
Group Businesses | (869) | (141) | (24) |
Total cash earnings | 6,849 | 8,065 | 8,062 |
In presenting divisional results on a management reporting basis, internal charges and transfer pricing adjustments are included in the performance of each division reflecting the management structure rather than the legal entity (these results cannot be compared to results for individual legal entities). Where management reporting structures or accounting classifications have changed, financial results for comparative periods have been revised and may differ from results previously reported.
Our internal transfer pricing frameworks facilitate risk transfer, profitability measurement, capital allocation and business unit alignment, tailored to the jurisdictions in which we operate. Transfer pricing allows us to measure the relative contribution of our products and divisions to the Group’s interest margin and other dimensions of performance. Key components of our transfer pricing frameworks are funds transfer pricing for interest rate and liquidity risk and allocation of basis and contingent liquidity costs, including capital allocation.
Additional provisions
Net profit for 2019 was impacted by additional provisions after tax of $1,130 million for:
· Estimated customer refunds and payments, associated costs, and litigation of $958 million; and
· Restructuring costs associated with the restructuring of the Wealth business of $172 million.
The tables below show the impact of the estimated customer refunds, payments, associated costs, litigation, and restructuring costs on the divisions for 2019 and 2018. Restructuring costs associated with the restructuring of the wealth business is only reflected in Group Business and were only incurred in 2019.
2019 $m | Consumer | Business | Westpac Institutional Bank | Westpac New Zealand ($A) | Group Businesses | Group |
Net interest income | (85) | (246) | – | (13) | – | (344) |
Non-interest income | (2) | (55) | – | (4) | (759) | (820) |
Benefits/(expenses) | 25 | (87) | – | (15) | (384) | (461) |
Core earnings | (62) | (388) | – | (32) | (1,143) | (1,625) |
Tax and non-controlling interests | 29 | 118 | – | 9 | 339 | 495 |
Cash earnings | (33) | (270) | – | (23) | (804) | (1,130) |
2018 $m | Consumer | Business | Westpac Institutional Bank | Westpac New Zealand ($A) | Group Businesses | Group |
Net interest income | (99) | – | – | (2) | (4) | (105) |
Non-interest income | (12) | – | – | (11) | (140) | (163) |
Expenses | (39) | (5) | – | (3) | (65) | (112) |
Core earnings | (150) | (5) | – | (16) | (209) | (380) |
Tax and non-controlling interests | 36 | – | – | 4 | 59 | 99 |
Cash earnings | (114) | (5) | – | (12) | (150) | (281) |
| 2019 Westpac Group Annual Report | 111 |
| | |
Divisional performance
Consumer
Consumer is responsible for sales and service to consumer customers in Australia. Consumer is also responsible for the Group’s insurance business which covers the manufacture and distribution of life, general and lenders mortgage insurances. The division also uses a third party to manufacture certain general insurance products. Banking products are provided under the Westpac, St.George, BankSA, Bank of Melbourne, and RAMS brands, while insurance products are provided under Westpac and BT brands. Consumer works with Business and WIB in the sales, service, and referral of certain financial services and products including superannuation, platforms, auto lending and foreign exchange. The revenue from these products is mostly retained by the product originators.
Financial performance
$m | 2019 | 2018 | 2017 |
Net interest income | 7,942 | 7,850 | 7,733 |
Non-interest income | 1,141 | 1,311 | 1,351 |
Net operating income before operating expenses and impairment charges | 9,083 | 9,161 | 9,084 |
Operating expenses | (3,817) | (3,774) | (3,548) |
Impairment charges | (581) | (486) | (600) |
Profit before income tax | 4,685 | 4,901 | 4,936 |
Income tax expense | (1,397) | (1,478) | (1,484) |
Cash earnings for the year | 3,288 | 3,423 | 3,452 |
Net cash earnings adjustments | – | (15) | (116) |
Net profit attributable to owners of Westpac Banking Corporation | 3,288 | 3,408 | 3,336 |
| $bn | $bn | $bn |
Deposits and other borrowings | 209.3 | 206.2 | 196.2 |
Net loans | 388.5 | 385.4 | 370.3 |
Total assets | 399.2 | 395.6 | 381.8 |
Total operating expenses to net operating income ratio | 42.02% | 41.20% | 39.06% |
2019 v 2018
Cash earnings were 4% lower from a decline in non-interest income mainly reflecting weather related general insurance claims, and an increased impairment charge. Cash earnings also benefited from a reduction in provisions for estimated customer refunds, payments, associated costs and litigation.
Net interest income up $92 million, 1% | · Lending increased 1% with growth in mortgages, partly offset by a decline in other personal lending and higher provisions associated with the adoption of AASB 9. The decline in personal lending was due to a 6% reduction in cards and lower personal loans; · A 4% rise in transaction accounts, and 5% increase in savings accounts supported the 2% rise in deposits. Term deposits were 6% lower; and · Net interest margin was down 3 basis points. The decline was due to lower mortgage spreads from increased competition and changes in mortgage mix with less interest only lending. The decline was partly offset by mortgage repricing late in 2018. |
Non-interest income down $170 million, 13% | · The decline was mostly due to lower insurance income down ($116 million), from higher weather related claims ($70 million), and lower life insurance income related to the impact of the Protecting Your Super legislation and from higher claims; and · Lower fee income from a contraction in net interchange fees and reduced transaction volumes across banking products. |
Operating expenses up $43 million, 1% | · Operating expenses benefited from the reversal of provisions raised for estimated associated costs and litigation in respect to customer refunds and payments, a benefit of $25 million, compared to a charge of $39 million in 2018. Excluding the benefit of this turnaround, operating expenses were up 3%; · The rise was due to higher investment related costs including for the customer service hub, and costs associated with regulatory change projects; and · Higher costs from annual salary reviews and inflation based increases were more than offset by productivity gains of $125 million mostly from organisational redesign, rationalisation of 57 branches and 349 ATMs, and further use of digital channels, all of which contributed to a reduction in FTE. Lower variable remuneration also contributed. |
Impairment charges up $95 million, 20% | · Credit quality remains sound, although stress was higher with stressed exposures to TCE at 0.81% up 16 basis points consistent with the deterioration in the operating environment; · Mortgage 90+ day delinquencies were up 16 basis points to 0.90% while other consumer 90+ day delinquencies were up 25 basis points; and · Impairment charges were higher driven by the rise in delinquencies. |
112 | 2019 Westpac Group Annual Report | |
| | |
Divisional performance
Business
Business provides business banking and wealth facilities and products for customers across Australia. Business is responsible for manufacturing and distributing facilities to SME and Commercial business customers (including Agribusiness) generally for up to $150 million in exposure. SME customers include relationship managed and non-relationship managed SME customers (generally between $100k-$250k facilities). The division offers a wide range of banking products and services to support their borrowing, payments and transaction needs. In addition, specialist services are provided for cash flow finance, trade finance, automotive and equipment finance and property finance. The division is also responsible for Private Wealth and the manufacture and distribution of investments (including margin lending and equities broking), superannuation and retirement products as well as wealth administration platforms. Business operates under the Westpac, St.George, BankSA, Bank of Melbourne, and BT brands. Business works with Consumer and WIB in the sale, referral and service of select financial services and risk management products (including corporate superannuation, foreign exchange and interest rate hedging). The revenue from these products is mostly retained by the product originators.
Financial performance
$m | 2019 | 2018 | 2017 |
Net interest income | 5,092 | 5,284 | 4,950 |
Non-interest income | 1,464 | 1,640 | 1,617 |
Net operating income before operating expenses and impairment charges | 6,556 | 6,924 | 6,567 |
Operating expenses | (2,805) | (2,651) | (2,548) |
Impairment charges | (272) | (321) | (369) |
Profit before income tax | 3,479 | 3,952 | 3,650 |
Income tax expense | (1,048) | (1,196) | (1,096) |
Cash earnings for the year | 2,431 | 2,756 | 2,554 |
Net cash earnings adjustments | (45) | (76) | 150 |
Net profit attributable to owners of Westpac Banking Corporation | 2,386 | 2,680 | 2,704 |
| $bn | $bn | $bn |
Deposits and other borrowings | 147.8 | 143.8 | 137.9 |
Net loans | 173.0 | 173.6 | 169.4 |
Total assets | 187.4 | 188.2 | 183.7 |
Total operating expenses to net operating income ratio | 42.79% | 38.29% | 38.80% |
2019 v 2018
Cash earnings of $2,431 million were $325 million (or 12%) lower than 2018 with performance impacted by provisions for estimated customer refunds and payments and associated costs of $270 million after tax. Excluding these provisions, cash earnings were $60 million or 2% lower from a reduction in non-interest income and increased regulatory expenditure, partially offset by an increase in net interest margin and a reduction in impairment charges.
Net interest income down $192 million, 4% | · Lending was largely flat with growth in business lending offset by slower new auto lending; · Deposits increased 3% mostly in transaction and at call balances. These gains were partly offset by a 4% decline in term deposits; and · Net interest margin declined 12 basis points with provisions for customer refunds and payments ($246 million) contributing 15 basis points to the decline. Excluding this impact, the net interest margin was up 3 basis points from loan repricing, partly offset by lower deposit spreads and a shift in the mortgage mix from interest only to principal and interest. |
Non-interest income down $176 million, 11% | · Provisions for estimated customer refunds and payments of $55 million contributed to a decrease in non-interest income. Excluding these provisions, non-interest income was down $121 million or 7% mostly due to: – A reduction in merchant income due to changes in scheme charges; and – Lower wealth income ($85 million) from platform margin compression due to new platform pricing, product mix changes, the cessation of grandfathered commission payments and implementation of Protecting Your Super reforms. |
Operating expenses up $154 million, 6% | · Provisions for estimated costs of $87 million, to implement the division’s remediation program, was one of the main drivers increasing expenses. Excluding these costs, expenses were up 3% due to; – Higher regulatory and compliance costs as well as increased amortisation of investments and wealth project costs; and – Other cost increases, mostly salary rises, were largely offset by lower variable reward and productivity benefits including operating model simplification and continued digitisation and product simplification. |
Impairment charges down $49 million, 15% | · The level of stressed exposures increased 24 basis points from increased Commercial stressed exposures across a broad number of industries; and · Impairment charges decreased from lower individual and collective provisions. |
| 2019 Westpac Group Annual Report | 113 |
| | |
Divisional performance
Westpac Institutional Bank
Westpac Institutional Bank (WIB) delivers a broad range of financial products and services to commercial, corporate, institutional and government customers operating in, or with connections to Australia and New Zealand. WIB operates through dedicated industry relationship and specialist product teams, with expert knowledge in financing, transactional banking, and financial and debt capital markets. Customers are supported throughout Australia and via branches and subsidiaries located in New Zealand, the US, UK and Asia. WIB is also responsible for Westpac Pacific providing a full range of banking services in Fiji and PNG. WIB works with all the Group’s divisions in the provision of markets related financial needs including foreign exchange and fixed interest solutions.
Financial performance
$m | 2019 | 2018 | 2017 |
Net interest income | 1,443 | 1,442 | 1,354 |
Non-interest income | 1,292 | 1,565 | 1,716 |
Net operating income before operating expenses and impairment charges | 2,735 | 3,007 | 3,070 |
Operating expenses | (1,284) | (1,449) | (1,358) |
Impairment (charges)/benefits | (46) | 16 | (79) |
Profit before income tax | 1,405 | 1,574 | 1,633 |
Income tax expense | (386) | (476) | (463) |
Profit attributable to non-controlling interests | (5) | (5) | (7) |
Cash earnings for the year | 1,014 | 1,093 | 1,163 |
Net cash earnings adjustments | – | – | – |
Net profit attributable to owners of Westpac Banking Corporation | 1,014 | 1,093 | 1,163 |
| $bn | $bn | $bn |
Deposits and other borrowings | 101.3 | 104.9 | 92.2 |
Net loans | 75.4 | 77.4 | 74.8 |
Total assets | 98.0 | 102.5 | 103.3 |
Total operating expenses to net operating income ratio | 46.95% | 48.19% | 44.23% |
2019 v 2018
Cash earnings of $1,014 million was $79 million (or 7%) lower compared to 2018, primarily from a $78 million movement in derivative valuation adjustments, no contribution from Hastings and a $62 million increase in impairment charges. The exit of Hastings in 2018 had a $17 million impact on cash earnings but had a more significant impact on the movements in individual line items. In 2018 Hastings added $203 million to non-interest income, $158 million to expenses and $29 million to tax.
Net interest income up $1 million, flat | · Net loans were 3% lower reflecting a focus on return. This included a decline in property lending; · Deposits were 3% lower, mostly from a reduction in government balances; and · Net interest margin down 1 basis point from lower deposits spreads and a change in funding mix, partly offset by higher loan spreads consistent with the return focus. |
Non-interest income down $273 million, 17% | · Excluding Hastings (2018 $203 million; 2019 nil), non-interest income was down $70 million, or 5%, from: – A $78 million movement in derivative valuation adjustment (a $14 million benefit in 2018 to a $64 million charge in 2019); and – Partly offset by increase in syndication fees from some large transactions in 2019. |
Operating expenses down $165 million, 11% | · Excluding Hastings (2018 $158 million; 2019 nil), expenses were down $7 million, or 1%, from – Productivity benefits from organisation redesign (FTE down 8%) and lower variable reward costs; and – Partly offset by higher regulatory, risk and compliance costs, particularly related to updated requirements for the new Banking Code of Practice and responding to regulator requests. |
Impairment charge of $46 million (compared to a benefit of $16 million in FY18) | · Credit quality remains sound with stressed exposures to TCE of 0.68%. This was up 2 basis point over the year but remains low in historical terms; and · Impairment charges were higher due to provisions associated with the migration of two long standing stressed exposures into impaired. |
114 | 2019 Westpac Group Annual Report | |
| | |
Divisional performance
Westpac New Zealand
Westpac New Zealand is responsible for sales and service of banking, wealth and insurance products for consumers, business and institutional customers in New Zealand. Westpac conducts its New Zealand banking business through two banks in New Zealand: Westpac New Zealand Limited, which is incorporated in New Zealand and Westpac Banking Corporation (New Zealand Branch), which is incorporated in Australia. Westpac New Zealand operates via an extensive network of branches and ATMs across both the North and South Islands. Business and institutional customers are also served through relationship and specialist product teams. Banking products are provided under the Westpac brand while insurance and wealth products are provided under Westpac Life and BT brands, respectively. New Zealand also maintains its own infrastructure, including technology, operations and treasury.
Financial performance
NZ$m | 2019 | 2018 | 2017 |
Net interest income | 1,967 | 1,958 | 1,819 |
Non-interest income | 448 | 406 | 438 |
Net operating income before operating expenses and impairment charges | 2,415 | 2,364 | 2,257 |
Operating expenses | (993) | (930) | (949) |
Impairment (charges)/benefits | 10 | (25) | 55 |
Profit before income tax | 1,432 | 1,409 | 1,363 |
Income tax expense | (390) | (393) | (392) |
Profit attributable to non-controlling interests | – | – | – |
Cash earnings for the year | 1,042 | 1,016 | 971 |
Net cash earnings adjustments | (1) | 14 | (15) |
Net profit attributable to owners of Westpac Banking Corporation | 1,041 | 1,030 | 956 |
| $bn | $bn | $bn |
Deposits and other borrowings1 | 64.5 | 61.9 | 58.4 |
Net loans | 84.2 | 80.4 | 77.3 |
Total assets | 97.1 | 90.0 | 88.3 |
Total funds | 11.5 | 10.7 | 10.1 |
Total operating expenses to net operating income ratio | 41.12% | 39.34% | 42.05% |
2019 v 2018
Cash earnings increased 3% over 2018. The increase in cash earnings was supported by a NZ$40 million gain on the sale of Paymark, and a NZ$10 million impairment benefit partly offset by higher risk management and regulatory costs.
Net interest income up NZ$9 million, Flat | · Loans increased 5%, or NZ$3.8 billion. Mortgages increased NZ$2.6 billion, with the majority of mortgage growth in fixed rate products. Business growth (up NZ$1.3 billion) was distributed across a range of sectors; · Deposits increased 4% with a NZ$1.7 billion rise in non-interest bearing and at call accounts and a NZ$0.9 billion rise in term deposits; and · Net interest margin declined 8 basis points. Most of the decline (5 basis points) was due to mix from the increase in lower spread products, particularly fixed rate mortgages. A fall in deposit spreads from lower interest rates also contributed to the decline in margin. |
Non-interest income up NZ$42 million, 10% | · The gain on sale of Paymark contributed most (NZ$40 million) of the increase in non-interest income; · Higher investment income from a 7% increase in fund balances, higher business fees, and a reduction in provisions for customer refunds and payments, also contributed to the increase; and · This was partly offset by lower fee income following the decision to simplify certain consumer fees. |
Operating expenses up NZ$63 million, 7% | · Most of the increase was driven by further investment in risk management and regulatory programs. · Provisions for estimated costs of NZ$16 million, to implement the division’s remediation program also contributed to the increase; and · Excluding investment and the above provisions, costs were broadly unchanged with increases in salaries and other inflation linked costs offset by productivity savings from increased digitisation of activities, with FTE down 1% and lower variable remuneration. |
Impairment benefit of NZ$10 million (compared to an impairment charge of NZ$25 million in FY18) | · Credit quality remains sound, with stressed exposures to TCE of 1.66%, 9 basis points higher than September 2018 with most of the increase in stress in exposures that are well secured. Other consumer 90+ day delinquencies increased 20 basis points to 82 basis points, with much of the rise due to the decline in the portfolio; and · Impairment benefit mostly from write-back of collectively assessed provision. |
1. Refers to total customer deposits in this table.
| 2019 Westpac Group Annual Report | 115 |
| | |
Divisional performance
AUD$m | 2019 | 2018 | 2017 |
Net interest income | 1,860 | 1,799 | 1,706 |
Non-interest income | 423 | 373 | 410 |
Net operating income before operating expenses and impairment charges | 2,283 | 2,172 | 2,116 |
Operating expenses | (939) | (855) | (890) |
Impairment (charges)/benefits | 10 | (22) | 51 |
Profit before income tax | 1,354 | 1,295 | 1,277 |
Income tax expense | (369) | (361) | (360) |
Profit attributable to non-controlling interests | - | - | - |
Cash earnings for the year | 985 | 934 | 917 |
Net cash earnings adjustments | (1) | 13 | (14) |
Net profit attributable to owners of Westpac Banking Corporation | 984 | 947 | 903 |
| | | |
| $bn | $bn | $bn |
Deposits and other borrowings | 59.7 | 56.7 | 53.7 |
Net loans | 78.0 | 73.6 | 71.1 |
Total assets | 90.0 | 82.4 | 81.3 |
Total funds | 10.7 | 9.8 | 9.3 |
Total operating expenses to net operating income ratio1 | 41.12% | 39.34% | 42.05% |
1. Ratios calculated using NZ$.
116 | 2019 Westpac Group Annual Report | |
| | |
Divisional performance
Group Businesses
This segment comprises:
· Treasury, which is responsible for the management of the Group’s balance sheet including wholesale funding, capital and the management of liquidity. Treasury also manages the interest rate risk and foreign exchange risks inherent in the balance sheet, including managing the mismatch between Group assets and liabilities. Treasury’s earnings are primarily sourced from managing the Group’s balance sheet and interest rate risk, (excluding Westpac New Zealand) within set risk limits;
· Group Technology1, which is responsible for technology strategy and architecture, infrastructure and operations, applications development and business integration in Australia;
· Core Support2, which comprises functions performed centrally, including Australian banking operations, property services, strategy, finance, risk, compliance, legal, human resources, and customer and corporate relations; and
· Following the Group’s decision to restructure its wealth operations and exit its Advice business in March 2019, the residual Advice operations (including associated remediation) and certain support functions of BTFG Australia have been transferred to Group Businesses.
Group Technology costs are fully allocated to other divisions in the Group. Core Support costs are partially allocated to other divisions, while Group Head Office costs are retained in Group Businesses.
Group Businesses also includes earnings on capital not allocated to divisions, certain intra-group transactions that facilitate the presentation of the performance of the Group’s divisions, gains/losses from most asset sales, earnings and costs associated with the Group’s Fintech investments, and certain other head office items such as centrally raised provisions.
Financial performance
$m | | 2019 | | 2018 | | 2017 | |
Net interest income | | 616 | | 812 | | 712 | |
Non-interest income | | (618 | ) | 89 | | 181 | |
Net operating income before operating expenses and impairment charges | | (2 | ) | 901 | | 893 | |
Operating expenses | | (1,186 | ) | (969 | ) | (834 | ) |
Impairment benefits | | 95 | | 1 | | 43 | |
Profit before income tax | | (1,093 | ) | (67 | ) | 102 | |
Income tax (expense)/benefit | | 225 | | (75 | ) | (126 | ) |
Profit attributable to non-controlling interests | | (1 | ) | 1 | | — | |
Cash earnings for the year | | (869 | ) | (141 | ) | (24 | ) |
Net cash earnings adjustments | | (19 | ) | 108 | | (92 | ) |
Net profit attributable to owners of Westpac Banking Corporation | | (888 | ) | (33 | ) | (116 | ) |
2019 v 2018
Provisions for estimated customer refunds, payments, associated costs, and litigation of $632 million and costs associated with the Wealth Reset of $172 million incurred during the year was the key driver of the cash earnings loss of $869 million in 2019. Excluding provisions for estimated customer refunds, payments, associated costs, and litigation and costs associated with the Wealth Reset, Group Businesses cash earnings was $74 million lower as the division recorded a loss of $65 million in 2019 compared to cash earnings of $9 million in 2018. The result was driven by a lower contribution from Treasury partially offset by a higher impairment benefit.
Net operating income down $903 million, large | · Net operating income was lower primarily from: – an increased charge for estimated customer refunds and payments ($619 million) related to Advice; – a reduced contribution from Treasury related to interest rate risk management (down $230 million) and lower Advice income; partly offset by – a gain on asset sales and revaluation gains on a fintech investment ($24 million). |
| |
Operating expenses up $217 million, large | · Estimated costs associated with implementing customer refunds and payments, the Wealth Reset and litigation were $319 million higher; and · Lower costs associated with the Royal Commission ($62 million) and lower variable reward. |
| |
Impairment benefit $95 million, a $94 million increase | · An impairment benefit of $95 million reflect a reduction in centrally held overlays in 2019, principally for the mining sector, partially offset by the introduction of an overlay for areas in Australia impacted by persistent drought conditions, compared to a $1 million benefit in 2018. |
1. Costs are fully allocated to other divisions in the Group.
2. Costs are partially allocated to other divisions in the Group, with costs attributed to enterprise activity retained in Group Businesses.
| 2019 Westpac Group Annual Report | 117 |
| | |
Divisional performance
Divisional performance – 2018 v 2017
Consumer
2018 v 2017
Cash earnings of $3,423 million was down $29 million, or 1%, over the year. A decline in net interest margin, the removal of certain ATM fees, changes in card interchange fees and increased regulatory and compliance costs, was partly offset by an $114 million decline in impairment charges.
Net interest income up $117 million, 2% | · Lending increased 4% mostly in mortgages. Other lending decreased 4% mostly due to a 3% decline in credit cards, which was in line with the decline in the overall system; · A 10% increase in term deposits, and a 5% rise in transaction accounts (including mortgage offsets) supported the 5% rise in deposits; and · Net interest margin was down 7 basis points. The decline was due to higher short term wholesale funding costs, the full period impact of the Bank Levy, and higher provisions for estimated customer refunds and payments. The decline was partly offset by higher deposit spreads. |
| |
Non-interest income down $40 million, 3% | · The decline was mostly due to the removal of certain ATM fees and changes to account keeping fees announced in 2017. Lower credit card income, mostly from changes in interchange fees, also contributed to the fall; and · This was partly offset by a $13 million increase in insurance income mostly from lower claims for major weather events. |
| |
Operating expenses up $226 million, 6% | · Most of the expense increase was due to: – Provisions for costs associated with implementing customer refunds and payments and estimated litigation; – Compliance costs and investment related costs; and – Investment to improve financial crime systems and processes, cyber security and complaints management. · Other cost increases including annual salary reviews and inflationary rises were more than offset by productivity benefits from: – Digital capabilities increasing customer self-service including take-up of e-statements; – Full period benefit of 45 branches closed in 2017 and 40 branches closed in 2018; and – Benefits from organisation redesign. |
| |
Impairment charges down $114 million, 19% | · Impairment charges were lower from reduced write-offs due to improved collection processes and higher recoveries from the maturing of hardship changes |
118 | 2019 Westpac Group Annual Report | |
| | |
Divisional performance
Business
2018 v 2017
Cash earnings of $2,756 million was $202 million, or 8% higher than 2017 from net operating income before operating expenses and impairment charges growth of 5% and a 13% decline in impairment charges. The result was supported by increased fee income, balance sheet growth and productivity gains.
Net interest income up $334 million, 7% | · Lending growth of 2% was supported by diversified growth across industries including property, agriculture and manufacturing and in equipment finance; · The 9% increase in term deposits supported the 4% increase in deposits; and · Net interest margin was up 10 basis points from repricing of certain mortgages types in the second half of 2017 and higher deposits spreads. These were partly offset by the full period impact of the Bank Levy. |
| |
Non-interest income up $23 million, 1% | · 2017 included provisions for customer refunds and payments which were not repeated · Reduced revaluation loss from investments in boutique funds and higher seed pool performance; and · Funds related revenue was higher from a 7% growth in funds, partly offset by a lower margins from repricing and product mix changes. |
| |
Operating expenses up $103 million, 4% | Most of the increase was due to higher investment related costs (including costs associated with Panorama) and higher regulatory and compliance costs; and · Increases from other costs were largely offset by productivity benefits from: – Improved banker coverage and support structures; – Better alignment of customers to bankers across SME and industries; and – Process improvements from the extension of LOLA, improved online functionality and standardising risk reviews. |
| |
Impairment charges down $48 million, 13% | · Impairment charges benefited from lower credit card and auto write-offs over the year. |
Westpac Institutional Bank
2018 v 2017
Cash earnings were $70 million or 6% lower than 2017 mostly due to lower markets revenue. The decline was partially offset by higher margins and an impairment benefit. In 2018 the division exited the Hastings business which lifted both revenues and expenses (and contributed to a higher tax rate) but had little impact on cash earnings.
Net interest income up $88 million, 6% | · Lending was up 3%, from increased utilisation of mortgage warehouse facilities and a fall in the A$ lifting Asia trade finance and loan balances; · Deposits increased 14% from higher Australian transaction balances and term deposits. Asia term deposits also increased due to foreign exchange translation impacts and to support lending in that region; and · Net interest margin was up 6 basis points, from higher transaction deposit margins and reduced wholesale funding costs. This was partially offset by the full period impact of the Bank Levy (5 basis points). |
| |
Non-interest income down $151 million, 9% | · Hastings contribution up $110 million, mainly from income associated with the exit of Hastings business; · Excluding Hastings, non-interest income was down $261 million, or 15%, primarily from the non-repeat of several large infrastructure transactions and lower markets revenue in fixed income sales and trading; and · Fee income was also lower from increased utilisation of existing credit limits. |
| |
Operating expenses up $91 million, 7% | · Hastings expenses up $87 million, from goodwill write-off and restructuring costs associated with the exit of the business; and · Excluding Hastings, operating expenses were up $4 million, due to higher technology, regulatory and compliance expenses. |
| |
Impairment charge positive movement of $95 million | · Stressed and impaired assets to TCE decreased over the year to near historical lows; and · The movement in impairment charges was due to the absence in write-backs and the absence of any large downgrade over the year. |
| 2019 Westpac Group Annual Report | 119 |
| | |
Divisional performance
Westpac New Zealand
2018 v 2017
Cash earnings increased 5% over the year supported by a 13 basis point increase in net interest margin, and a 2% decline in expenses, partly offset by lower non-interest income. 2018 recorded an impairment charge of NZ$25 million compared to an impairment benefit in 2017.
Net interest income up NZ$139 million, 8% | · Loans increased NZ$3.1 billion (4%), with the majority (NZ$2.0 billion) in mortgages. Business growth of NZ$1.2 billion, was across a broad range of sectors. Overall consumer lending was below system as the division balanced return with growth; · Deposits increased NZ$3.5 billion, more than funding loan growth over the year, and resulting in the deposit to loan ratio increasing 144 basis points to 77.0%. Most deposit growth was in term products as customers sought higher yields; and · Net interest margin was 13 basis points higher from increased mortgage and business lending spreads, partly offset by lower deposit spreads. |
| |
Non-interest income down NZ$32 million, 7% | · Decline was driven by lower cards income, product simplification (reducing some fees on existing accounts) and customer migration to lower/no fee digital channels; and · Higher investment income from a 6% rise in funds and higher merchant and business lending fees, partly offset these declines. |
| |
Operating expenses down NZ$19 million, 2% | · Benefits from the transformation program include a reduction in branch numbers (down 6 over the year), lower FTE, and increased self-service from digitisation; · Project costs associated with the transformation program were also lower; and · Partly offsetting these benefits were increased risk management and regulatory costs and higher costs from annual salary reviews and inflation. |
| |
Impairment charge of NZ$25 million compared to a NZ$55 million impairment benefit | · Credit quality improved with stressed assets to TCE reducing 49 basis points to 1.57%. The decline was mostly due to the continued improvement in the dairy sector. Consumer 90+ day delinquencies remain near historic lows; and · Impairment charges were higher due to the non-repeat of write-backs of some large facilities and improvement in the dairy industry across 2017. |
Group Businesses
2018 v 2017
Group Businesses resulted in a cash earnings loss of $141 million in 2018, compared to a cash earnings loss of $24 million in 2017. The Group Businesses result in 2018 was impacted by from provisions for estimated customer refunds and payments, associated costs and litigation ($150 million). This was partly offset by higher Treasury revenue and earnings on capital.
Net interest income up $100 million, 14% | · Net interest income increased $100 million primarily from Treasury revenue related to Australian interest rate risk management and increased earnings from centrally held capital. |
| |
Non-interest income down $92 million, 51% | · Non-interest income decline mostly reflects an $85 million increase in provisions for customer refunds and payments in respect to Advice; · A lower contribution from Advice; partly offset by · A $63 million benefit from the New Zealand earnings hedges and a $10 million gain on asset sales. |
| |
Operating expenses up $135 million, 16% | · Estimated costs associated with implementing customer refunds and payments and litigation increased operating expenses by $65 million; · Higher regulatory and compliance costs, including costs associated with the Royal Commission; · Higher restructuring costs; and · Expenses associated with the Group’s fintech investments. |
| |
Impairment benefit down $42 million | · Movements in impairments reflect a $1 million benefit from a reduction to centrally held overlays during 2018 compared to a $43 million benefit in 2017. |
| |
Tax and non- controlling interests down $52 million, 41% | · Tax and non-controlling interests decreased $52 million, reflecting lower profit before tax and the impact of non-deductible expenses. |
120 | 2019 Westpac Group Annual Report | |
| | |
Risk and risk management
Risk factors
Our business is subject to risks that can adversely impact our financial performance, financial condition and future performance. If any of the following risks occur, our business, prospects, reputation, financial performance or financial condition could be materially adversely affected, with the result that the trading price of our securities could decline and as a security holder you could lose all, or part, of your investment. You should carefully consider the risks described and the other information in this Annual Report before investing in our securities. The risks and uncertainties described below are not the only ones we face. Additional risks and uncertainties that we are unaware of, or that we currently deem to be immaterial, may also become important factors that affect us.
Risks relating to our business
Our businesses are highly regulated and we have been and could be adversely affected by changes in laws, regulations or regulatory policy
As a financial institution, we are subject to detailed laws and regulations in each of the jurisdictions in which we operate or obtain funding, including Australia, New Zealand, the United Kingdom, the United States and various jurisdictions in Asia and the Pacific. We are also supervised by a number of different regulatory and supervisory authorities which have broad administrative powers over our businesses.
The Group’s business, prospects, reputation, financial performance and financial condition could all be affected by changes to law and regulation, changes to policies and changes in the supervisory activities and expectations of our regulators. The Group is currently operating in an environment where there is increased scrutiny of the financial services sector and specifically, increased scrutiny of financial services providers by regulators. In this environment, the Group faces increasing supervision and regulation in the jurisdictions in which we operate or obtain funding. This environment has also served to increase the pace and scope of regulatory change.
Regulatory change could directly and adversely affect the Group’s financial condition and financial position. In recent years, new laws have required Westpac to maintain increased levels of liquidity and hold higher levels of, and better quality, capital and funding. Regulatory change may continue in this area. Regulation also affects the way we operate our business. New regulation could require us to change our existing business models (including by imposing restrictions on the types of businesses we can conduct) or amend our corporate structure.
Recently, policy makers and regulators have developed and implemented a range of regulations that affect how we provide products and services to our customers. New laws have been introduced that further regulate our ability to provide products and services to certain customers and that require us to alter our product and service offerings. Our ability to set prices for certain products and services may also be impacted by future regulation. The competitive landscape may also be altered by new laws affecting banks and financial services companies, or our agents, authorised representatives and external service providers. The phasing in of Open Banking is one example of new laws that are likely to affect competition amongst banks and other financial services providers in Australia.
Regulatory changes of this type could adversely affect one or more of our businesses, restrict our flexibility, require us to incur substantial costs, impact the profitability of one or more of our business lines, result in the Group being unable to increase or maintain market share and/or create pressure on our margins and fees, any of which could adversely affect our business, prospects, financial performance or financial condition.
There are numerous sources of regulatory change that could affect our business. In some cases, changes to regulation are driven by international bodies, such as the Basel Committee on Banking Supervision (BCBS). Regulatory change may also flow from reviews and inquiries commissioned by Governments or regulators. These reviews and commissions of inquiry may lead to, and in some cases already have led to, substantial regulatory change or investigations, which could have a material impact on our business, prospects, reputation, financial performance or financial condition.
It is also possible that governments or regulators in jurisdictions in which we operate or obtain funding might revise their application of existing regulatory policies that apply to, or impact, our business (including by instituting macro-prudential limits on lending). Regulators or governments may take this action for a variety of reasons, including for reasons relating to national interest and/or systemic stability.
Regulatory changes and the timing of their introduction continue to evolve and we manage our businesses in the context of regulatory uncertainty and complexity. The nature and impact of future changes are not predictable and are beyond our control. Regulatory compliance and the management of regulatory change are an important part of our planning processes. We expect that we will continue to invest significantly in compliance and the management and implementation of regulatory change and, at the same time, significant management attention and resources will be required to update existing or implement new processes to comply with new regulations (such as obligations to provide certain data and information to regulators) or new interpretations of existing laws or regulations. The failure of the Group to appropriately manage and implement regulatory change, including by failing to implement effective processes to comply with new regulations, has, in some instances, resulted in, and could in the future result in, the Group failing to meet a compliance obligation. Further information about the consequences of failing to meet a compliance obligation is set out in the section titled ‘Our businesses are highly regulated and we have been or could be adversely affected by failing to comply with laws, regulations or regulatory policy’ below.
Another consideration in managing regulatory change arises when regulation is introduced in one jurisdiction in which we operate that conflicts with the way it is introduced in other jurisdictions in which we operate.
For further information about regulatory changes affecting the Group, refer to ‘Significant developments’ in Section 1 and the sections ‘Critical accounting assumptions and estimates’ and ‘Future developments’ in Note 1 to the financial statements.
| 2019 Westpac Group Annual Report | 121 |
| | |
Risk and risk management
Our businesses are highly regulated and we have been or could be adversely affected by failing to comply with laws, regulations or regulatory policy
We are responsible for ensuring that we comply with all applicable legal and regulatory requirements and industry codes of practice in the jurisdictions in which we operate or obtain funding, as well as meeting our ethical standards.
The Group is subject to compliance risk, which is the risk of legal or regulatory sanction or financial or reputational loss, arising from our failure to abide by the compliance obligations required of us. This risk is exacerbated by the increasing complexity and volume of regulation and can also arise where we interpret our obligations and rights differently to our regulators or a Court. The potential for this to occur may be heightened in circumstances where regulation is untested and/or not accompanied by extensive regulatory guidance.
The Group employs a compliance management system which is designed to identify, assess and manage compliance risk. While this system is currently in place, it may not always have been or continue to be effective. Breakdowns may occur in this system due, for example, to flaws in the design of controls or processes. This has resulted in, and may in the future result in, potential breaches of our compliance obligations, as well as poor customer outcomes.
The Group also depends on its employees, contractors, agents, authorised representatives and external service providers to ‘do the right thing’ for it to meet its compliance obligations. Inappropriate conduct by these individuals, such as neglecting to follow a policy or engaging in misconduct, could result in poor customer outcomes and a failure by the Group to comply with compliance obligations.
The Group’s failure, or suspected failure, to comply with a compliance obligation could lead to a regulator commencing surveillance or an investigation into the Group. This may, depending on the circumstances, result in the regulator taking administrative or enforcement action against the Group and/or its representatives. Regulators could seek to pursue civil or criminal proceedings, seeking substantial fines, civil penalties or other enforcement outcomes. In addition, the failure or alleged failure of our competitors to comply with their obligations could lead to increased regulatory scrutiny across the financial services sector.
In many cases, our regulators have broad powers. For example, under the Banking Act 1959 (Cth), APRA can, in certain circumstances, issue a direction to us (such as a direction to comply with a prudential requirement, to conduct an audit, to remove a Director, executive officer or employee, to take remedial action or not to undertake transactions) or disqualify an ‘Accountable Person’ under the Banking and Executive Accountability Regime.
APRA also has the power to require us to hold additional capital, which they exercised earlier this year by applying a $500 million overlay to our operational risk capital requirement following the completion of our self-assessment into our frameworks and practices in relation to governance, culture and accountability. If the Group incurs additional capital overlays in the future it may need to raise additional capital which could have an adverse impact on our business, prospects, financial performance and financial condition.
The current political and regulatory environment that the Group is operating in has also seen (and may in the future see) our regulators receive new powers. Recently, legislation was passed by the Australian Parliament that provided ASIC with a product intervention power which enables ASIC to make orders that prevent issuers of financial products from engaging in certain conduct.
In addition, legislation has been passed that materially increases the penalties that can be imposed for corporate and financial sector misconduct. In particular, ASIC can commence civil penalty proceedings and seek significant civil penalties against an Australian Financial Services licensee (such as Westpac) for failing to do all things necessary to ensure that financial services provided under the licence are provided efficiently, honestly and fairly. The Group may also face significant penalties for failing to comply with other obligations, such as those provided for under the recently legislated Consumer Data Right. This trend towards increasingly severe penalties for failing to meet compliance obligations could continue in the future and be expanded into other areas of regulation that the Group is subject to.
Changes may also occur in the oversight approach of regulators, which could result in a regulator preferring its enforcement powers over a more consultative approach. In recent years, there have been significant increases in the nature and scale of regulatory investigations, enforcement actions and the quantum of fines issued by global regulators.
This dynamic is apparent, with ASIC committing to conducting more enforcement actions against large financial institutions and adopting a ‘why not litigate?’ enforcement stance. ASIC has also continued to implement its ‘Close and Continuous Monitoring’ program, which has seen ASIC staff embedded within the institutions they supervise, including Westpac.
APRA has publicly committed to a revised approach to enforcement as well. APRA has indicated that it will use enforcement where appropriate to prevent and address serious prudential risks and hold entities and individuals to account.
The current environment may see a shift in the nature of enforcement proceedings commenced by regulators. As well as conducting more civil penalty proceedings, our regulators may be more likely to bring criminal proceedings against institutions and/or their representatives in the future. Alternatively, regulators may elect to make criminal referrals to the Commonwealth Department of Public Prosecutions or other prosecutorial bodies.
The provision of new powers to regulators, coupled with the increasingly active supervisory and enforcement approaches adopted by them, increases the prospect of adverse regulatory action being brought against the Group. Further, the severity and consequences of that action are now greater, given the expansion of penalties for corporate and financial sector misconduct.
122 | 2019 Westpac Group Annual Report | |
| | |
Risk and risk management
Regulatory action brought against the Group may expose the Group to an increased risk of litigation brought by third parties (including through class action proceedings), which may require the Group to pay compensation to third parties and/or undertake further remediation activities.
Regulatory investigations, inquiries, litigation, fines, penalties, infringement notices, revocation, suspension or variation of conditions of relevant regulatory licences or other enforcement or administrative action or agreements (such as enforceable undertakings) could, either individually or in aggregate with other regulatory action, adversely affect our business, prospects, reputation, financial performance or financial condition. For further details about regulatory matters that may affect the Group, refer to ‘Significant Developments’ in Section 1.
The failure to comply with financial crime obligations could have an adverse effect on our business and reputation
The Group is subject to anti-money laundering and counter-terrorism financing (AML/CTF) laws, anti-bribery and corruption laws, economic and trade sanctions laws and tax transparency laws in the jurisdictions in which it operates. These laws can be complex and, in some circumstances, impose a diverse range of obligations. For example, AML/CTF laws require Westpac and other regulated institutions to (amongst other things) undertake customer identification and verification, conduct ongoing due diligence on customers, maintain and comply with an AML/CTF program and undertake ongoing risk assessments. AML/CTF laws also require Westpac to report certain matters and transactions to regulators (including in relation to International Funds Transfer Instructions, Threshold Transaction Reports and Suspicious Matter Reports) and ensure that certain information is not disclosed to third parties in a way that would contravene the ‘tipping off’ provisions in AML/CTF legislation.
In recent years there has been increased focus on compliance with financial crime obligations, with regulators around the globe commencing large-scale investigations and taking enforcement action where they have identified non-compliance (often seeking significant monetary penalties). Further, due to the large volume of transactions that the Group processes, the undetected failure or the ineffective implementation, monitoring or remediation of a system, policy, process or control (including in relation to a regulatory reporting obligation) has in some instances, and could in the future result in, a significant number of breaches of AML/CTF obligations. This in turn could lead to significant monetary penalties.
While the Group has systems, policies, processes and controls in place that are designed to manage its financial crime obligations (including its reporting obligations), these have not always been, and may not in the future always be effective. The Group is currently undertaking a multi-year program designed to address areas of control weaknesses in its financial crime management framework and improve the management of this risk class.
If we fail, or where we have failed, to comply with these obligations, we could face regulatory enforcement action such as litigation, significant fines, penalties and the revocation, suspension or variation of licence conditions. As reported in the Group’s 2018 Annual Report, the Group self-reported to AUSTRAC a failure to report a large number of ITFIs (as required under Australia’s AML/CTF Act). AUSTRAC has issued a number of detailed statutory notices over the last year requiring information relating to the Group’s processes, procedures and oversight. These notices relate to a range of matters including these IFTI reporting failures and associated potential failings related to record keeping and obligations to obtain and pass on certain data in funds transfer instructions, as well as correspondent banking due diligence, risk assessments and transaction monitoring. Further information is set out in ‘Significant Developments’ in section 1 and in Note 27 to the financial statements.
Non-compliance with financial crime obligations could also lead to litigation commenced by third parties (including class action proceedings) and cause reputational damage. These actions could, either individually or in aggregate, adversely affect our business, prospects, reputation, financial performance or financial condition.
Reputational damage could harm our business and prospects
Our ability to attract and retain customers and our prospects could be adversely affected if our reputation is damaged.
Reputation risk is the risk of loss of reputation, stakeholder confidence or public trust and standing. It arises where there are differences between stakeholders’ current and emerging perceptions, beliefs and expectations and our past, current and planned activities, processes, performance and behaviours.
There are various potential sources of reputational damage. Westpac’s reputation may be damaged where any of its policies, processes, practices or behaviours result in a negative outcome for a customer or a class of customers. Other potential sources of reputational damage include the failure to effectively manage risks in accordance with our risk management frameworks , failure to comply with legal and regulatory requirements, adverse findings from regulatory reviews (including Westpac-specific and industry-wide reviews), environmental, social and ethical issues, failure of information security systems, technology failures, security breaches and inadequate record keeping which may prevent Westpac from demonstrating that a past decision was appropriate at the time it was made.
Westpac may suffer reputational damage where its conduct, practices, behaviours or business activities do not align with the evolving standards and expectations of the community, our regulators and other stakeholders. As these expectations may exceed the standard required in order to comply with the law, Westpac may incur reputational damage even where it has met its legal obligations. Our reputation could also be adversely affected by the actions of the financial services industry in general or from the actions of our competitors, customers, suppliers, joint-venture partners, strategic partners and other counterparties.
Furthermore, the risk of reputational damage may be heightened by factors such as the increasing use of social media or the increasing prevalence of groups which seek to publicly challenge the Group’s strategy or approach to aspects of its business.
| 2019 Westpac Group Annual Report | 123 |
| | |
Risk and risk management
Failure, or perceived failure, to appropriately address issues that could or do give rise to reputational risk could also impact the regulatory change agenda, give rise to additional legal risk, subject us to regulatory investigations, regulatory enforcement actions, fines and penalties or litigation brought by third parties (including class actions), require us to remediate and compensate customers and incur remediation costs or harm our reputation among customers, investors and the marketplace. This could lead to loss of business which could adversely affect our business, prospects, financial performance or financial condition.
The Royal Commission has led to, and may continue to lead to, regulatory enforcement activity, litigation and changes in laws, regulations or regulatory policy, and has resulted in, and may continue to result in, ongoing reputational damage to the Group, all of which has and may continue to have an adverse effect on our business and prospects
The Royal Commission into Misconduct in the Banking, Superannuation and Financial Services Industry investigated (amongst other things) whether any conduct, practices, behaviours or business activities engaged in by financial services entities amounted to potential misconduct, or fell below community standards and expectations.
These investigations (including the public hearings, submissions, evidence and findings of the Royal Commission) had, and may continue to have, an adverse impact on the Group’s reputation and potentially the financial performance of the Group’s businesses. In addition, the Royal Commission’s findings have led to, and may continue to lead in the future to, regulators commencing investigations and/or enforcement action against financial institutions (including the Group). This environment has also resulted in an increase in class actions or other litigation being commenced by the Group’s customers, including in relation to matters raised at the Royal Commission. For further information about this risk, refer to the section titled ‘We have and could suffer losses due to litigation (including class action proceedings)’ below.
In addition, the recommendations made in the Final Report of the Commission (which was publicly released on 4 February 2019) have resulted and will, depending on how its recommendations are implemented, result in further changes to legislation, and further influence the policies and practices of our regulators. In some instances, this has already had, and may continue to have in the future, an adverse effect on our business, prospects, financial performance or financial condition.
The Royal Commission has also led to increased political or regulatory scrutiny of the financial industry in New Zealand, and may continue to do so.
We have and could suffer losses due to litigation (including class action proceedings)
The Group (and individual entities within the Group) may, from time to time, be involved in legal proceedings, regulatory actions or arbitration arising from the conduct of their business and the performance of their legal and regulatory obligations. Proceedings could be commenced against the Group by a range of potential plaintiffs, such as our customers, shareholders, suppliers and counterparties. These plaintiffs may commence proceedings individually or they may commence class action proceedings.
In recent years, there has been an increase in the number of class action proceedings brought against financial services companies (and other organisations more broadly), many of which have resulted in significant monetary settlements. The risk of class action proceedings being commenced is heightened by findings from regulatory investigations or inquiries (such as the Royal Commission into Misconduct in the Financial Services Industry), adverse media, an adverse judgment or the settlement of proceedings brought by a regulator. Furthermore, there is a risk that class action proceedings commenced against a competitor could lead to similar class action proceedings being commenced against the Group.
The growth in third party litigation funding in Australia has also contributed to a recent increase in the number of class actions being commenced in Australia. This trend may continue in light of recent court judgments which have clarified the courts’ approach to liability and loss on certain types of class action claims. This clarification may encourage plaintiffs, law firms and funders to bring and maintain class action proceedings, as well as potentially improve the ability of plaintiffs to establish certain types of class action claims.
From time to time, class action proceedings are commenced against the Group. For further information about class action proceedings that the Group is currently involved in, refer to Note 27 in the financial statements.
Litigation (including class action proceedings) may, either individually or in aggregate, adversely affect the Group’s business, operations, prospects, reputation or financial condition. This risk is heightened by the recent increases in the severity of penalties for certain breaches of the law. Such matters are subject to many uncertainties (for example, the outcome may not be able to be predicted accurately). Furthermore, the Group’s ability to respond to and defend litigation may be adversely affected by inadequate record keeping.
Depending on the outcome of any litigation, the Group may be required to comply with broad court orders, including compliance orders, enforcement orders or otherwise pay money such as damages, fines, penalties or legal costs.
The Group’s material contingent liabilities are described in Note 27 to the financial statements. There is a risk that these contingent liabilities may be larger than anticipated or that additional litigation or other contingent liabilities may arise, which could adversely affect our business, prospects, reputation, financial performance or financial condition.
We have suffered and could in the future suffer information security risks, including cyberattacks
The proliferation of new technologies, the increasing use of the internet and telecommunications to conduct financial transactions and the growing sophistication and activities of attackers (including organised crime and state-sponsored actors) have resulted in increased information security risks for major financial institutions such as Westpac and our external service providers.
124 | 2019 Westpac Group Annual Report | |
| | |
Risk and risk management
While Westpac has systems in place to protect against, detect and respond to cyberattacks, these systems have not always been, and may not in the future always be effective. There can be no assurance that we will not suffer losses from cyberattacks or other information security breaches. The Group may not be able to anticipate and prevent a cyberattack, or it may not be able to implement effective measures to respond to a cyberattack in progress. Further, there is a risk that the Group will not be able to rectify or minimise the damage resulting from a cyberattack.
If the Group incurs a successful cyberattack, technology systems might fail to operate properly or become disabled and it could result in the unauthorised release, gathering, monitoring, misuse, loss or destruction of confidential, proprietary and other information of the Group, its employees, customers or third parties or otherwise adversely impact network access, business operations or availability of services.
In addition, as cyber threats continue to evolve, we may be required to expend significant additional resources to modify or enhance our systems or to investigate and remediate any vulnerabilities or incidents.
Our operations rely on the secure processing, storage and transmission of information on our computer systems and networks, and the systems and networks of external suppliers. Although we implement measures to protect the security, integrity and confidentiality of our information, there is a risk that the computer systems, software and networks on which we rely may be subject to security breaches, unauthorised access, malicious software, external attacks or internal breaches that could have an adverse impact on our confidential information or that of our customers and counterparties.
Major banks in other jurisdictions have suffered security breaches from sophisticated cyberattacks. Our external service providers, other parties that facilitate our business activities and financial platforms and infrastructure (such as clearing houses, payment systems and exchanges) are also subject to the risk of cyberattacks. Any such security breach could result in the loss of customers and business opportunities, significant disruption to Westpac’s operations, misappropriation of Westpac’s confidential information and/or that of our customers and damage to Westpac’s computers or systems and/or those of our customers. Such a security breach could also result in reputational damage, claims for compensation and regulatory investigations and penalties, which could adversely affect our business, prospects, financial performance or financial condition.
Our risk and exposure to such threats remains heightened because of the evolving nature of technology, Westpac’s prominence within the financial services industry, the prominence of our customers (including those in the government, mining and health sectors), increasing obligations to make data and information available to external third parties and our plans to continue to improve and expand our internet and mobile banking infrastructure.
We could suffer losses due to technology failures or our inability to appropriately manage and upgrade our technology
The reliability, integrity and security of our information and technology is crucial in supporting our customers’ banking requirements and meeting our compliance obligations and our regulators’ expectations.
While the Group has a number of processes in place to provide for and monitor the availability and recovery of our systems, there is a risk that our information and technology systems might fail to operate properly or become disabled, including as a result of events that are wholly or partially beyond our control.
If we incur a technology failure we may fail to meet a compliance obligation (such as the obligation to retain records and data for requisite periods of time), or our customers may be adversely affected. This could potentially result in reputational damage, remediation costs and a regulator commencing an investigation and/or taking administrative or enforcement action against us. The overuse or overreliance on legacy or outdated systems may heighten the risk of a technology failure occurring.
Further, in order to continue to deliver new products and services to customers, comply with our regulatory obligations (such as obligations to report certain data and information to regulators) and meet the ongoing expectations of our regulators and our customers, we need to regularly renew and enhance our technology. We are constantly managing technology projects including projects to consolidate technology platforms, simplify and enhance our technology and operations environment, assist us to comply with legal obligations, improve productivity and provide for a better customer experience. Failure to implement these projects or manage associated change effectively could result in cost overruns, unrealised productivity, operational instability, failure to meet compliance obligations, reputational damage and/or result in the loss of market share to competitors. In turn, this could place us at a competitive disadvantage and adversely affect our financial performance.
Adverse credit and capital market conditions or depositor preferences may significantly affect our ability to meet funding and liquidity needs and may increase our cost of funding
We rely on deposits, and credit and capital markets, to fund our business and as a source of liquidity. Our liquidity and costs of obtaining funding are related to credit and capital market conditions.
Global credit and capital markets can experience periods of extreme volatility, disruption and decreased liquidity as was demonstrated during the Global Financial Crisis. While there have now been extended periods of stability in these markets, the environment remains unpredictable. The main risks we face are damage to market confidence, changes to the access and cost of funding and a slowing in global activity or other impacts on entities with whom we do business.
As of 30 September 2019, approximately 30% of our total funding originated from domestic and international wholesale markets. Of this, around 65% was sourced outside Australia and New Zealand. Customer deposits provide around 63% of total funding. Customer deposits held by Westpac are comprised of both term deposits which can be withdrawn after a certain period of time and at call deposits which can be withdrawn at any time.
| 2019 Westpac Group Annual Report | 125 |
| | |
Risk and risk management
A shift in investment preferences could result in deposit withdrawals by customers which could increase our need for funding from other, potentially less stable, or more expensive, forms of funding.
If market conditions deteriorate due to economic, financial, political or other reasons, there may also be a loss of confidence in bank deposits and we could experience unexpected deposit withdrawals. In this situation our funding costs may be adversely affected and our liquidity and our funding and lending activities may be constrained.
If our current sources of funding prove to be insufficient, we may be forced to seek alternative financing. The availability of such alternative financing, and the terms on which it may be available, will depend on a variety of factors, including prevailing market conditions, the availability of credit, our credit ratings and credit market capacity. Even if available, these alternatives may be more expensive or on unfavourable terms, which could adversely affect our financial performance, liquidity, capital resources or financial condition. There is no assurance that we will be able to obtain adequate funding, do so at acceptable prices, or that we will be able to recover any additional costs.
If Westpac is unable to source appropriate funding, we may also be forced to reduce our lending or begin selling liquid securities. Such actions may adversely impact our business, prospects, liquidity, capital resources, financial performance or financial condition. If Westpac is unable to source appropriate funding for an extended period, or if it can no longer sell liquid securities, there is a risk that Westpac will be unable to pay its debts as and when they become due and payable.
Westpac enters into collateralised derivative obligations, which may require Westpac to post additional collateral based on movements in market rates, which has the potential to adversely affect Westpac’s liquidity or ability to use derivative obligations to hedge its interest rate, currency and other financial instrument risks.
For a more detailed description of liquidity risk, refer to ‘Funding and liquidity risk’ in Note 21 to the financial statements.
Sovereign risk may destabilise financial markets adversely
Sovereign risk is the risk that governments will default on their debt obligations, will be unable to refinance their debts as they fall due or will nationalise parts of their economy including assets of financial institutions such as Westpac. Sovereign defaults could negatively impact the value of our holdings of high quality liquid assets. There may also be a cascading effect to other markets and countries, the consequences of which, while difficult to predict, may be similar to or worse than those experienced during the Global Financial Crisis. Such an event could destabilise global financial markets, adversely affecting our liquidity, financial performance or financial condition.
Failure to maintain credit ratings could adversely affect our cost of funds, liquidity, competitive position and access to capital markets
Credit ratings are independent opinions on our creditworthiness. Our credit ratings can affect the cost and availability of our funding from capital markets and other funding sources and they may be important to customers or counterparties when evaluating our products and services. Therefore, maintaining high credit ratings is important.
The credit ratings assigned to us by rating agencies are based on an evaluation of a number of factors, including our financial strength, the quality of our governance, structural considerations regarding the Australian financial system and the credit rating of the Australian Government. A credit rating downgrade could be driven by a downgrade of the Australian Government, the occurrence of one or more of the other risks identified in this section or by other events including changes to the methodologies used by the rating agencies to determine ratings.
A downgrade or series of downgrades to our credit ratings could have an adverse effect on our cost of funds and related margins, collateral requirements, liquidity, competitive position and our access to capital markets. The extent and nature of these impacts would depend on various factors, including the extent of any ratings change, whether our ratings differ among agencies (split ratings) and whether any ratings changes also impact our competitors or the sector.
A systemic shock in relation to the Australian, New Zealand or other financial systems could have adverse consequences for Westpac or its customers or counterparties that would be difficult to predict and respond to
There is a risk that a major systemic shock could occur that causes an adverse impact on the Australian, New Zealand or other financial systems.
As outlined above, during the past decade the financial services industry and capital markets have been, and may continue to be, adversely affected by market volatility, global economic conditions, geopolitical instability (such as threats of or actual conflict occurring around the world) and political developments. In particular, there are significant and ongoing global political developments that have the potential to impact major global economies, including Brexit and the introduction of tariffs and other protectionist measures by various countries, such as the US and China. A shock to one of the major global economies could again result in currency and interest rate fluctuations and operational disruptions that negatively impact the Group.
Any such market and economic disruptions could adversely affect financial institutions such as Westpac because consumer and business spending may decrease, unemployment may rise and demand for the products and services we provide may decline, thereby reducing our earnings. These conditions may also affect the ability of our borrowers to repay their loans or our counterparties to meet their obligations, causing us to incur higher credit losses and affect investors’ willingness to invest in the Group. These events could also result in the undermining of confidence in the financial system, reducing liquidity, impairing our access to funding and impairing our customers and counterparties and their businesses. If this were to occur, our business, prospects, financial performance or financial condition could be adversely affected.
126 | 2019 Westpac Group Annual Report | |
| | |
Risk and risk management
The nature and consequences of any such event are difficult to predict and there can be no certainty that we could respond effectively to any such event.
Declines in asset markets could adversely affect our operations or profitability
Declines in Australian, New Zealand or other asset markets, including equity, residential and commercial property and other asset markets, could adversely affect our operations and profitability.
Declining asset prices also impact our wealth management business. Earnings in our wealth management business are, in part, dependent on asset values because we typically receive fees based on the value of securities and/or assets held or managed. A decline in asset prices could negatively impact the earnings of this business.
Declining asset prices could also impact customers and counterparties and the value of security (including residential and commercial property) we hold against loans and derivatives. This may impact our ability to recover amounts owing to us if customers or counterparties were to default. It may also affect our level of provisioning which in turn impacts our profitability and financial condition.
Our business is substantially dependent on the Australian and New Zealand economies
Our revenues and earnings are dependent on economic activity and the level of financial services our customers require. In particular, lending is dependent on various factors including economic growth, business investment, business and consumer sentiment, levels of employment, interest rates, asset prices and trade flows in the countries in which we operate.
We conduct the majority of our business in Australia and New Zealand and, consequently, our performance is influenced by the level and cyclical nature of lending in these countries. These factors are in turn impacted by both domestic and international economic conditions, natural disasters and political events. A significant decrease in Australian and New Zealand housing valuations could adversely impact our home lending activities because borrowers with loans in excess of their property value show a higher propensity to default. In the event of defaults our security may be eroded, causing us to incur higher credit losses. The demand for our home lending products may also decline due to adverse changes in tax legislation (such as changes to tax rates, concessions or deductions), regulatory requirements or other buyer concerns about decreases in values.
Adverse changes to economic and business conditions in Australia and New Zealand and other countries such as China, India, Japan and the US could also adversely affect the Australian economy and our customers. In particular, due to the current economic relationship between Australia and China, particularly in the mining and resources sectors, a slowdown in China’s economic growth, including as the result of the implementation of tariffs or other protectionist trade measures, could negatively impact the Australian economy. Changes in commodity prices, Chinese government policies and broader economic conditions could, in turn, result in reduced demand for our products and services and affect the ability of our borrowers to repay their loans. If this were to occur, it could negatively impact our business, prospects, financial performance or financial condition.
Monetary policy can also significantly affect the Group. Interest rate settings (including low or negative rates), as well as other actions taken by central banks (such as quantitative easing), may adversely affect our cost of funds, the value of our lending and investments and our margins. Monetary policies also impact the broader economic conditions of the various jurisdictions that the Group operates or obtains funding in. These policies could affect demand for our products and services and/or have a negative impact on the Group’s customers and counterparties, potentially increasing the risk that they will default on their obligations to the Group. All of these factors could adversely affect our business, prospects, financial performance or financial condition.
An increase in defaults in credit exposures could adversely affect our liquidity, capital resources, financial performance or financial condition
Credit risk is the risk of financial loss where a customer or counterparty fails to meet their financial obligations to Westpac. It is a significant risk and arises primarily from our lending activities.
We establish provisions for credit impairment based on current information and our expectations. If economic conditions deteriorate outside of our expectations, some customers and/or counterparties could experience higher levels of financial stress and we may experience a significant increase in defaults and write-offs, and be required to increase our provisioning. Such events would diminish available capital and could adversely affect our liquidity, capital resources, financial performance or financial condition.
Credit risk also arises from certain derivative, clearing and settlement contracts we enter into, and from our dealings with, and holdings of, debt securities issued by other banks, financial institutions, companies, clearing houses, governments and government bodies, the financial conditions of which may be affected to varying degrees by economic conditions in global financial markets.
For a discussion of our risk management procedures, including the management of credit risk, refer to the ‘Risk management’ section and Note 21 in the financial statements.
We face intense competition in all aspects of our business
The financial services industry is highly competitive. We compete, both domestically and internationally, with a range of firms, including retail and commercial banks, asset managers, investment banking firms, brokerage firms, other financial service firms and businesses in other industries with emerging financial services aspirations. This includes specialist competitors that may not be subject to the same capital and regulatory requirements and therefore may be able to operate more efficiently. Digital technologies are changing consumer behaviour and the competitive environment. The use of digital channels by customers to conduct their banking continues to rise and emerging competitors are increasingly utilising new technologies and seeking to disrupt existing business models,
| 2019 Westpac Group Annual Report | 127 |
| | |
Risk and risk management
including in relation to digital payment services. The Group faces competition from established providers of financial services as well as from banking businesses developed by non-financial services companies.
The competitive environment may also change as a result of legislative reforms.
If we are unable to compete effectively in the increasingly competitive environment in which our various businesses operate, our market share may decline. This may adversely affect us by diverting business to our competitors or creating pressure to lower margins and fees.
Increased competition for deposits could also increase our cost of funding and lead us to seek access to other types of funding or reduce lending. We rely on bank deposits to fund a significant portion of our balance sheet and deposits have been a relatively stable source of funding. We compete with banks and other financial services firms for such deposits. To the extent that we are not able to successfully compete for deposits, we would be forced to rely more heavily on other, potentially less stable or more expensive forms of funding, or reduce lending.
We are also dependent on our ability to offer products and services that match evolving customer preferences. If we are not successful in developing or introducing new products and services or responding or adapting to changes in customer preferences and habits, we may lose customers to our competitors. This could adversely affect our business, prospects, financial performance or financial condition.
For more detail on how we address competitive pressures refer to the section titled Competition in the Directors’ Report in Section 1.
We could suffer losses due to market volatility
We are exposed to market risk as a consequence of our trading activities in financial markets, our defined benefit plan and through the asset and liability management of our financial position. This is the risk of an adverse impact on earnings resulting from changes in market factors, such as foreign exchange rates, commodity prices, equity prices, and interest rates including the potential for low or negative interest rates. This includes interest rate risk in the banking book, such as the risk to interest income from a mismatch between the duration of assets and liabilities that arises in the normal course of business activities.
Changes in market factors could be driven by a number of developments. As an example, in July 2017, the FCA which regulates the London Interbank Offered Rate (“LIBOR”), announced that it would not require panel banks to continue to submit rates for the calculation of the LIBOR benchmark after 2021. Accordingly, the continuation of LIBOR in its current form will not be guaranteed after 2021, and it appears likely that LIBOR will be discontinued or modified by 2021. Any such developments or future changes in the administration of LIBOR or any other benchmarks could result in adverse consequences to the return on, value of and market for securities and other instruments whose returns are linked to any such benchmark, including those securities or other instruments issued by the Group.
If we were to suffer substantial losses due to any market volatility (including changes in the return on, value of or market for, securities or other instruments) it may adversely affect our business, prospects, liquidity, capital resources, financial performance or financial condition. For a discussion of our risk management procedures, including the management of market risk, refer to the ‘Risk management’ section.
We have and could suffer losses due to operational risks
Operational risk is the risk of loss resulting from inadequate or failed internal processes, people and systems or from external events. It also includes, among other things, reputational risk, technology risk, model risk and outsourcing risk, as well as the risk of business disruption due to external events such as natural disasters, environmental hazard, damage to critical utilities, and targeted activism and protest activity. While we have policies, processes and controls in place to manage these risks, these may not always have been, or continue to be effective.
Ineffective processes and controls have resulted in, and could in the future result in an adverse outcome for Westpac’s customers. For example, a process breakdown could result in a customer not receiving a product on the terms and conditions, or at the pricing, they agreed to. In addition, inadequate record keeping may prevent Westpac from demonstrating that a past decision was appropriate at the time it was made or that a particular action or activity was undertaken. If this was to occur, Westpac may incur significant costs in paying refunds and compensation to customers, as well as remediating any underlying process breakdown. Failed processes could also result in Westpac incurring losses because it is not able to enforce its contractual rights. This could arise in circumstances where Westpac did not correctly document its rights or failed to perfect a security interest. These types of operational failures, may also result in increased regulatory scrutiny and depending on the nature of the failure and its impact, result in a regulator potentially commencing an investigation and/or taking other enforcement, administrative or supervisory action.
We could incur losses from fraudulent applications for loans or from incorrect or fraudulent payments and settlements, particularly real-time payments. Fraudulent conduct can also emerge from external parties seeking to access the bank’s systems and customers’ accounts. If systems, procedures and protocols for managing fraud fail, or are ineffective, they could lead to losses which could adversely affect our customers, as well as our business, prospects, reputation, financial performance or financial condition.
Accurate and complete data is critical to ensure that Westpac’s systems (both customer facing and back-office) and financial reporting processes operate effectively. In some areas of its business and operations, Westpac is
128 | 2019 Westpac Group Annual Report | |
| | |
Risk and risk management
affected by poor data quality. This has arisen and could in the future arise in a number of ways, including through inadequacies in systems, processes and policies. This could lead to deficiencies or failings in customer service, risk management, financial reporting (including in the calculation of risk weighted assets), credit systems and processes, compliance with legal obligations (including obligations to provide data to regulators) and also result in poor decision making, including in relation to the provision of credit and the terms on which it is provided. Poor data quality could affect the ability of Westpac to improve systems and processes. Westpac is also exposed to model risk, being the risk of loss arising from errors or inadequacies in data or a model, or in the control and use of a model.
Westpac is required to retain and access data and documentation for specific retention periods in order to satisfy its compliance obligations. In some cases, Westpac also retains data to enable it to demonstrate that a past decision was appropriate at the time it was made. Failings in systems, processes and policies could all adversely affect Westpac’s ability to retain and access data.
In recent times, financial services entities have been increasingly sharing data with third parties, such as suppliers and regulators (both domestic and offshore), in order to conduct their business activities and meet regulatory obligations. A breakdown in a process or control related to the transfer, storage or protection of data transferred to a third party, or the failure of a third party to use and handle this data correctly, could result in the Group failing to meet a compliance obligation (including any relevant privacy obligations) and/or have an adverse impact on our customers and the Group.
Westpac also relies on a number of suppliers, both in Australia and overseas, to provide services to it and its customers. Failure by these suppliers to deliver services as required could disrupt services and adversely impact Westpac’s operations, profitability or reputation. The Group could also be adversely affected by events that cause disruption within the banking and financial services industry. For example, there is a risk that if central banks adopt negative interest rates in the future, the technology systems used by the Group, its counterparties and/or financial infrastructure providers may fail to operate correctly and this may cause loss or damage to the Group and/or its counterparties.
Operational risks can impact our reputation and result in financial losses (including through decreased demand for our products and services) which would adversely affect our financial performance or financial condition.
For a discussion of our risk management procedures, including the management of operational risk, refer to the ‘Risk management’ section.
Operational risk, technology risk, conduct risk or compliance risk events have required, and could in the future require, Westpac to undertake customer remediation activity
Westpac relies on a large number of policies, processes, procedures, systems and people to conduct its business. Breakdowns or deficiencies in one of these areas (arising from one or more operational risk, technology risk, conduct risk or compliance risk events) have resulted, and could in the future result in, adverse outcomes for customers which Westpac is required to remediate.
These events could require the Group to incur significant remediation costs (which may include compensation payments to customers and costs associated with correcting the underlying issue) and result in reputational damage.
There are significant challenges and risks involved in customer remediation activities. Westpac’s ability to investigate an adverse customer outcome that may require remediation could be impeded if the issue is a legacy matter spanning beyond our record retention period, or if our record keeping is otherwise inadequate. Depending on the nature of the issue, it may be difficult to quantify and scope the remediation activity.
Determining how to properly and fairly compensate customers can also be a complicated exercise involving numerous stakeholders, such as the affected customers, regulators and industry bodies. The Group’s proposed approach to a remediation may be affected by a number of events, such as a group of affected customers commencing class action proceedings on behalf of the broader population of affected customers, or a regulator exercising their powers to require that a particular approach to remediation be taken. These factors could impact the timeframe for completing the remediation activity, potentially resulting in Westpac failing to execute the remediation in a timely manner. A failure of this type could lead to a regulator commencing enforcement action against the Group. The ineffective or slow completion of a remediation also exposes the Group to reputational damage, with the Group potentially being criticised by regulators, affected customers, the media and other stakeholders, resulting in reputational damage.
The significant challenges and risks involved in scoping and executing remediations in a timely way also create the potential for remediation costs actually incurred to be higher than those initially estimated by the Group.
If the Group cannot effectively scope, quantify or implement a remediation activity in a timely way, there could be a negative impact on our business, prospects, reputation, financial performance or financial condition.
We have and could suffer losses due to conduct risk
Conduct risk is the risk that our provision of services and products results in unsuitable or unfair outcomes for our stakeholders or undermines market integrity. Conduct risk could occur through the provision of products and services to our customers that do not meet their needs or do not support market integrity, as well as the poor conduct of our employees, contractors, agents, authorised representatives and external service providers, which could include deliberate attempts by such individuals to circumvent Westpac’s controls, processes and procedures. This could occur through a failure to meet professional obligations to specific clients (including fiduciary and suitability requirements), poor product design and implementation, failure to adequately consider customer needs
| 2019 Westpac Group Annual Report | 129 |
| | |
Risk and risk management
or selling products and services outside of customer target markets. Conduct risk may also arise where there has been a failure to adequately provide a product or services that we had agreed to provide a customer.
While we have frameworks, policies, processes and controls that are designed to manage poor conduct outcomes, these policies and processes may not always have been or continue to be effective. The failure of these policies and processes could result in financial losses and reputational damage and this could adversely affect our business, prospects, financial performance or financial condition.
We could suffer losses and our business has been and could be adversely affected by the failure to adopt and implement effective risk management
We have implemented risk management strategies, policies and internal controls involving processes and procedures intended to identify, monitor and manage risks facing the Group. However, our risk management framework has not always been, or may not in the future prove to be, effective.
This could be because the design of the framework may be inadequate, which could result in key information not being provided to decision-makers in the right form and in a timely manner, or because of weaknesses in underlying data. There is also the possibility that key risk management policies, controls and processes may be ineffective, either due to inadequacies in their design, or because of the poor implementation of these policies, controls and processes.
There are also inherent limitations with any risk management framework as there may exist, or emerge in the future, risks that we have not anticipated or identified and our controls may not be effective.
Risk management frameworks may also prove ineffective because of weaknesses in risk culture, which may result in risks and control weaknesses not being identified, escalated and acted upon. Further, while the development of appropriate remuneration structures can play an important role in supporting a sound risk culture, a deficiency in the design or operation of our remuneration structures could have a negative effect, potentially resulting in staff engaging in excessive risk taking behaviours.
Risk management failings of the type outlined above could adversely the Group in numerous ways, with the Group potentially being exposed to higher levels of risk than expected, which may result in the Group incurring unexpected losses, breaches of compliance obligations and reputational damage.
As part of the Group’s risk management framework, the Group measures and monitors risks against its risk appetite. Where the Group identifies a risk as being out-of-appetite, the Group needs to take steps to bring this risk back into appetite in a timely way. However, the Group may not always be able to achieve this within proposed timeframes. This may occur because, for example, the Group experiences delays in enhancing its information technology systems to better manage the out-of-appetite risk, or in recruiting sufficient numbers of appropriately trained staff to undertake required activities. It is also possible that, because of external factors beyond the Group’s control, certain risks may be inherently outside of appetite for periods of time. In addition, the Group is required to periodically review its risk management framework to determine whether it remains appropriate.
If the Group is unable to bring risks back into appetite, or if it is determined that the Group’s risk management framework is no longer appropriate, the Group may incur unexpected losses and be required to undertake considerable remedial work. The failure to remedy this situation could result in increased scrutiny from regulators, who could take supervisory action such as requiring the Group to hold additional capital or directing the Group to spend money to enhance its’ risk management systems and controls. The Group has been adversely affected by weaknesses in risk management systems and controls in the recent past, with APRA requiring Westpac to hold additional capital following the completion of its Compliance, Governance and Accountability self-assessment. Inadequacies in addressing risks or in the Group’s risk management framework could also result in the Group failing to meet a compliance obligation and/or financial losses.
If any of our governance or risk management processes and procedures prove ineffective or inadequate or are otherwise not appropriately implemented, we could suffer unexpected losses and reputational damage which could adversely affect our business, prospects, financial performance or financial condition.
For a discussion of our risk management procedures, refer to the ‘Risk management’ section.
The Group’s failure to recruit and retain key executives, employees and Directors may have adverse effects on our business
Key executives, employees and Directors play an integral role in the operation of Westpac’s business and its pursuit of its strategic objectives. The unexpected departure of an individual in a key role, or the Group’s failure to recruit and retain appropriately skilled and qualified persons into these roles, could each have an adverse effect on our business, prospects, reputation, financial performance or financial condition.
Climate change may have adverse effects on our business
We, our customers and external suppliers, may be adversely affected by the physical risks of climate change, including increases in temperatures, sea levels, and the frequency and severity of adverse climatic events including fires, storms, floods and droughts. These effects, whether acute or chronic in nature, may directly impact us and our customers through reputational damage, environmental factors, insurance risk and business disruption and may have an adverse impact on financial performance (including through an increase in defaults in credit exposures).
Initiatives to mitigate or respond to adverse impacts of climate change may impact market and asset prices, economic activity, and customer behaviour, particularly in geographic locations and industry sectors adversely affected by these changes. Failure to effectively manage these transition risks could adversely affect our business, prospects, reputation, financial performance or financial condition.
130 | 2019 Westpac Group Annual Report | |
| | |
Risk and risk management
We could suffer losses due to environmental factors
We and our customers operate businesses and hold assets in a diverse range of geographic locations. Any significant environmental change or external event (including fire, storm, flood, earthquake, pandemic, civil unrest or terrorism) in any of these locations has the potential to disrupt business activities, impact on our operations, damage property and otherwise affect the value of assets held in the affected locations and our ability to recover amounts owing to us. In addition, such an event could have an adverse impact on economic activity, consumer and investor confidence, or the levels of volatility in financial markets, all of which could adversely affect our business, prospects, financial performance or financial condition.
We could suffer losses due to insurance risk
We have exposure to insurance risk in our life insurance, general insurance and lenders mortgage insurance businesses, which may adversely affect our business, operations or financial condition.
Insurance risk is the risk in our licensed regulated insurance entities of lapses being greater than expected, or the costs of claims being greater than expected due to a failure in product design, underwriting, reinsurance arrangements or an increase in the severity and/or frequency of insured events.
In the life insurance business, risk arises primarily through mortality (death) and morbidity (illness and injury) risks, the costs of claims relating to those risks being greater than was anticipated when pricing those risks and policy lapses (including through an unexpected or sustained increase in the rate of policy lapses).
In the general insurance business, insurance risk arises mainly through environmental factors (including storms, floods and bushfires) and other calamities, such as earthquakes, tsunamis and volcanic activity, as well as general variability in home and contents insurance claim amounts. The frequency and severity of external events such as natural disasters is difficult to predict and it is possible that the amounts we reserve for potential losses from existing events, such as those arising from natural disaster events, may not be adequate to cover actual claims that may arise.
In the lenders mortgage insurance business, insurance risk arises primarily from unexpected downturns in economic conditions leading to higher levels of mortgage defaults from unemployment or other economic factors.
If our reinsurance arrangements are ineffective, this could lead to greater risk, and more losses than anticipated. There is also a risk that we will not be able to renew an expiring reinsurance arrangement on similar terms, including in relation to the cost, duration and amount of reinsurance cover provided under that arrangement.
Changes in critical accounting estimates and judgements could expose the Group to losses
The Group is required to make estimates, assumptions and judgements when applying accounting policies and preparing its financial statements, particularly in connection with the calculation of provisions (including those related to remediations or credit losses) and the determination of the fair value of financial instruments. A change in a critical accounting estimate, assumption and/or judgement resulting from new information or from changes in circumstances or experience could result in the Group incurring losses greater than those anticipated or provided for. This may have an adverse effect on the Group’s financial performance, financial condition and reputation. The Group’s financial performance and financial condition may also be impacted by changes to accounting standards or to generally accepted accounting principles.
We could suffer losses due to impairment of capitalised software, goodwill and other intangible assets that may adversely affect our business, operations or financial condition
In certain circumstances Westpac may be exposed to a reduction in the value of intangible assets. As at 30 September 2019, Westpac carried goodwill principally related to its investments in Australia, other intangible assets principally relating to assets recognised on acquisition of subsidiaries and capitalised software balances.
Westpac is required to assess the recoverability of the goodwill and other intangible asset balances on at least an annual basis or wherever an indicator of impairment exists. For this purpose, Westpac uses a discounted cash flow calculation. Changes in the methodology or assumptions upon which the calculation is based, together with changes in expected future cash flows, could materially impact this assessment, resulting in the potential write-off of part or all of the intangible assets.
In the event that an asset is no longer in use, or its value has been reduced or that its estimated useful life has declined, an impairment will be recorded, adversely impacting the Group’s financial condition. The estimates and assumptions used in assessing the useful life of an asset can be affected by a range of factors including changes in strategy and the rate of external changes in technology and regulatory requirements.
We could suffer losses if we fail to syndicate or sell down underwritten securities
As a financial intermediary, we underwrite listed and unlisted debt and equity securities. Underwriting activities include the development of solutions for corporate and institutional customers who need capital and investor customers who have an appetite for certain investment products. We may guarantee the pricing and placement of these facilities. We could suffer losses if we fail to syndicate or sell down our risk to other market participants. This risk is more pronounced in times of heightened market volatility.
Certain strategic decisions may have adverse effects on our business
Westpac, at times, evaluates and may implement strategic decisions and objectives including diversification, innovation, divestment or business expansion initiatives.
| 2019 Westpac Group Annual Report | 131 |
| | |
Risk and risk management
The expansion or integration of a new business, or entry into a new business, can be complex and costly and may require Westpac to comply with additional local or foreign regulatory requirements which may carry additional risks.
Westpac also acquires and invests in businesses owned and operated by external parties. These transactions involve a number of risks for the Group. For example, Westpac may incur financial losses if a business it invests in does not perform as anticipated or subsequently proves to be overvalued at the time that the transaction was entered into.
In addition, we may be unable to successfully divest businesses or assets. These activities may, for a variety of reasons, not deliver the anticipated positive business results and could have a negative impact on our business, prospects, reputation, engagement with regulators, financial performance or financial condition.
Electing not to pursue a course of action can have an adverse effect on the Group. If Westpac fails to appropriately respond to changes in the business environment it operates in (including changes related to economic, geopolitical, regulatory, technological, social and competitive factors) this could have a range of adverse effects on the Group’s business, such as being unable to increase or maintain market share as well as creating pressure on margins and fees, any of which could have a negative impact on the Group’s business, prospects, financial performance or financial condition.
Limitation on Independent Registered Public Accounting Firm’s Liability
The liability of PricewaterhouseCoopers (an Australian partnership which we refer to as PwC Australia), with respect to claims arising out of its audit report included in this Annual Report, is subject to the limitations set forth in the Professional Standards Act 1994 of New South Wales, Australia, as amended (the Professional Standards Act) and Chartered Accountants Australia and New Zealand (NSW) scheme adopted by Chartered Accountants Australia and New Zealand and approved by the New South Wales Professional Standards Council pursuant to the Professional Standards Act (the NSW Accountants Scheme). For matters occurring on or prior to 8 October 2019, the liability of PwC Australia may be subject to the limitations set forth in predecessor schemes. The current NSW Accountants Scheme expires on 7 October 2024 unless further extended or replaced.
The Professional Standards Act and the NSW Accountants Scheme may limit the liability of PwC Australia for damages with respect to certain civil claims arising in, or governed by the laws of, New South Wales directly or vicariously from anything done or omitted to be done in the performance of its professional services for us, including, without limitation, its audits of our financial statements.
The extent of the limitation depends on the timing of the relevant matter and is:
· in relation to matters occurring on or after 8 October 2013, a maximum liability for audit work of A$75 million; or
· in relation to matters occurring on or prior to 7 October 2013, the lesser of (in the case of audit services) ten times the reasonable charge for the service provided and a maximum liability for audit work of A$75 million.
The limitations do not apply to claims for breach of trust, fraud or dishonesty.
In addition, there is equivalent professional standards legislation in place in other states and territories in Australia and amendments have been made to a number of Australian federal statutes to limit liability under those statutes to the same extent as liability is limited under state and territory laws by professional standards legislation. Accordingly, liability for acts or omissions by PwC Australia in Australian states or territories other than New South Wales may be limited in a manner similar to that in New South Wales.
These limitations of liability may limit recovery upon the enforcement in Australian courts of any judgment under US or other foreign laws rendered against PwC Australia based on or related to its audit report on our financial statements. Substantially all of PwC Australia’s assets are located in Australia. However, the Professional Standards Act and the NSW Accountants Scheme have not been subject to extensive judicial consideration and therefore how the limitation might be applied by the courts and the effect of the limitation remain untested in a number of respects, including its effect in respect of the enforcement of foreign judgments.
Risk management
At Westpac, our risk management framework is designed to help achieve our vision to be one of the world’s great service companies, helping our customers, communities and people to prosper and grow, sustainably and within risk appetite. Our risk management strategy is to deliver effective risk management outcomes through the robust execution of our risk management framework.
Effective risk management outcomes mean that we:
· deliver suitable, fair and clear outcomes for our customers that support market integrity;
· protect Westpac Group’s depositors, policyholders and investors by maintaining a balance sheet with sound credit quality and buffers over regulatory minimums; and
· meet our regulatory and statutory obligations.
The Risk Management Framework (RMF) and Risk Management Strategy (RMS) is approved by the Board following review and recommended by the Board Risk and Compliance Committee (BRCC) on an annual basis or more frequently where required by a material business or strategy change or a material change to the Group’s risk profile.
For further information regarding the roles and responsibilities of the BRCC and other Board committees in managing risk, refer to Westpac’s Corporate Governance Statement in Section 1.
132 | 2019 Westpac Group Annual Report | |
| | |
Risk and risk management
The Westpac Board (the Board) is ultimately responsible for our risk management framework and the oversight of its operation by management. The Board has delegated the oversight of the RMF and its implementation to the Chief Risk Officer (CRO) as the Accountable Executive.
The Chief Executive Officer (CEO) is the Accountable Executive for the RMS and oversees its implementation by business units and functions, including in relation to customers, shareholders and Westpac employees and contractors.
We adopt a Three Lines of Defence model to ensure we practice end-to-end management of risk, within which all employees play an active role. This necessitates co-operation between businesses and functions, such that there are no gaps in risk coverage.
Following the conclusion of the Culture, Governance and Accountability review conducted at the request of APRA, Westpac is conducting a review of, and upgrades to, its end to end risk management capabilities. This is part of an ongoing program of work that spans both financial and non-financial risk. Two of the key steps under this complex, multi-year initiative are a renewed focus on the implementation of our three lines of defence model and the implementation of a new Risk Management Framework, both of which are underway.
Westpac believes that investing in and enhancing end to end risk management capabilities are essential imperatives. Recent reviews have identified various policies, systems, data, and risk capabilities which require improvement. A detailed implementation plan is being designed to facilitate these improvements as soon as possible, including hiring additional experts in areas such as operational risk, stress testing, modelling, financial crime, risk systems and data management.
For a discussion of the risks to which Westpac is exposed, and its policies to manage these risks, refer to Westpac’s Corporate Governance Statement and Note 21 to the financial statements.
Credit risk
Credit risk is the risk of financial loss where a customer or counterparty fails to meet their financial obligations to Westpac.
We have a framework and supporting policies for managing the credit risk associated with lending across our business divisions. The framework and policies encompass all stages of the credit cycle – origination, evaluation, approval, documentation, settlement, ongoing administration and problem management. For example, we have established product-based standards for lending to individuals, with key controls including minimum serviceability standards and maximum loan to security value ratios. We offer residential property loans to both owner-occupiers and investors at both fixed and variable rates, secured by a mortgage over the property or other acceptable collateral. Where we lend to higher loan to value ratios, we typically also require lenders mortgage insurance. Similarly, we have established criteria for business, commercial, corporate and institutional lending, which can vary by industry segment. In this area we focus on the performance of key financial risk ratios, including interest coverage, debt serviceability and balance sheet structure. When providing finance to smaller business, commercial and corporate borrowers we typically obtain security, such as a mortgage over property and/or a general security agreement over business assets. For larger corporates and institutions, we typically also require compliance with selected financial ratios and undertakings and may hold security. In respect of commercial property lending, we maintain loan origination and ongoing risk management standards, including specialised management for higher value loans. We consider factors such as the nature, location, quality and expected demand for the asset, tenancy profile and experience and quality of management. We actively monitor the Australian and New Zealand property markets and the composition of our commercial property loan book across the Group.
The extension of credit is underpinned by the Group’s Principles of Responsible Lending. This is reflected in our commitment to comply with all local legislation, codes of practice and relevant guidelines and obligations to market our products responsibly and stay in touch with the expectations of customers and the community.
Refer to Note 21 to the financial statements for details of our credit risk management policies.
Provisions for expected credit losses/impairment charges on loans
For information on the basis for determining the provision for expected credit losses/impairment charges on loans refer to ‘Critical accounting assumptions and estimates’ in Note 13 to the financial statements.
Credit risk concentrations
We monitor our credit portfolio to manage risk concentrations. At 30 September 2019, our exposure to consumers comprised 72% (2018: 72%, 2017: 72%) of our on-balance sheet loans and 59% (2018: 59%, 2017: 59%) of total credit commitments. At 30 September 2019, 92% (2018: 92%, 2017: 92%) of our exposure to consumers was supported by residential real estate mortgages. The consumer category includes owner-occupier and investment property loans to individuals, credit cards, personal loans, overdrafts and lines of credit. Our consumer credit risks are diversified, with substantial consumer market share in every state and territory in Australia, New Zealand and the Pacific region. Moreover, these customers service their debts with incomes derived from a wide range of occupations, in city as well as country areas.
Exposures to businesses, government and other financial institutions are classified into a number of industry clusters based on groupings of related Australian and New Zealand Standard Industrial Classification (ANZSIC) codes and are monitored against industry risk limits. The level of industry risk is measured and monitored on a dynamic basis. We also control the concentration risks that can arise from large exposures to individual borrowers
| 2019 Westpac Group Annual Report | 133 |
| | |
Risk and risk management
Cross-border outstandings
Cross-border outstandings are loans, placements with banks, interest earning investments and monetary assets denominated in currencies other than the borrower’s or guarantor’s local currency, or the local currency of the Westpac branch or subsidiary holding the asset. They are grouped based on the country of domicile of the borrower or the ultimate guarantor of the risk. The table below excludes irrevocable letters of credit, amounts of which are immaterial. The relevant foreign denominated currencies have been converted at the closing spot exchange rate used in the financial statements.
Our cross-border outstandings to borrowers in countries that individually represented in excess of 0.75% of Group total assets as at 30 September in each of the past three years were as follows:
| Governments | Banks
and Other | Other
(Primarily | | % |
(in $millions unless otherwise indicated)1 | and Official
Institutions | Financial
Institutions | Commercial
and Industrial) | Total | of Total
Assets |
2019 | | | | | |
United States | 9,725 | 3,554 | 1,893 | 15,172 | 1.7% |
2018 | | | | | |
United States | 3,879 | 3,138 | 1,674 | 8,691 | 1.0% |
2017 | | | | | |
United States | 8,106 | 2,497 | 947 | 11,550 | 1.4% |
Impaired assets among cross-border outstandings were $4 million as at 30 September 2019 (2018: $1 million, 2017: $12 million).
Funding and liquidity risk
Funding and liquidity risk is the risk that Westpac cannot meet its payment obligations or that it does not have the appropriate amount, tenor and composition of funding and liquidity to support its assets. Westpac has a Liquidity Risk Management Framework which sets out Westpac’s funding and liquidity risk appetite, roles and responsibilities of key people managing funding and liquidity risk within Westpac, risk reporting and control processes and limits and targets used to manage Westpac’s balance sheet.
Refer to Note 21 to the financial statements for a more detailed discussion of our liquidity risk management policies.
Westpac debt programs and issuing shelves
Access in a timely and flexible manner to a diverse range of debt markets and investors is provided by the following programs and issuing shelves as at 30 September 2019:
Program Limit | Issuer(s) | Program/Issuing Shelf Type |
Australia | | |
No limit | WBC | Debt Issuance Program |
| | |
Euro Market | | |
USD 2.5 billion | WBC | Euro Transferable Certificate of Deposit Program |
USD 20 billion | WBC/WSNZL2 | Euro Commercial Paper and Certificate of Deposit Program |
USD 70 billion | WBC | Euro Medium Term Note Program |
USD 10 billion | WSNZL2 | Euro Medium Term Note Program |
USD 40 billion | WBC3 | Global Covered Bond Program |
EUR 5 billion | WSNZL4 | Global Covered Bond Program |
| | |
Japan | | |
| | |
JPY 750 billion | WBC | Samurai shelf |
JPY 750 billion | WBC | Uridashi shelf |
| | |
United States | | |
| | |
USD 45 billion | WBC | US Commercial Paper Program |
USD 10 billion | WSNZL2 | US Commercial Paper Program |
USD 35 billion | WBC | US Medium Term Note Program |
1. At face value.
2. Notes issued under this program by Westpac Securities NZ Limited, London branch are guaranteed by Westpac New Zealand Limited, its parent company.
3. Notes issued under this program are guaranteed by BNY Trust Company of Australia Limited as trustee of the Westpac Covered Bond Trust.
4. Notes issued under this program by Westpac Securities NZ Limited, London branch are guaranteed by Westpac New Zealand Limited, its parent company, and Westpac NZ Covered Bond Limited.
134 | 2019 Westpac Group Annual Report | |
| | |
Risk and risk management
Program Limit | Issuer(s) | Program/Issuing Shelf Type |
USD 15 billion | WBC (NY Branch) | US Medium Term Deposit Note Program |
No limit | WBC (NY Branch) | Certificate of Deposit Program |
No limit | WBC | US Securities and Exchange Commission registered shelves |
New Zealand | | |
No limit | WNZL | Medium Term Note and Registered Certificate of Deposit Program |
Market risk
Market risk is the risk of an adverse impact on earnings resulting from changes in market factors, such as foreign exchange rates, interest rates, commodity prices or equity prices. This includes interest rate risk in the banking book – the risk to interest income from a mismatch between the duration of assets and liabilities that arises in the normal course of business activities. Market risk arises in both trading and banking book activities.
Our trading activities are conducted in our Financial Markets and Treasury businesses. Financial Markets trading book activity represents dealings that encompass book running and distribution activity. Treasury’s trading activity represents dealings that include the management of interest rate, foreign exchange (FX) and credit spread risk associated with wholesale funding, liquid asset portfolios and hedging of foreign currency earnings and capital deployed offshore.
Refer to Note 21 to the financial statements for a more detailed discussion of our market risk management policies.
The table below depicts the aggregate Value at Risk (VaR), by risk type, for traded risk for the respective year ended 30 September:1,2
Consolidated and Parent Entity | | 2019 | | | 2018 | | | 2017 | |
$m | High | Low | Average | High | Low | Average | High | Low | Average |
Interest rate risk | 14.9 | 6.6 | 10.9 | 15.6 | 5.1 | 8.6 | 16.0 | 4.6 | 8.5 |
Foreign exchange risk | 8.6 | 0.8 | 4.1 | 6.9 | 0.7 | 3.0 | 9.4 | 0.6 | 3.1 |
Equity risk | 0.2 | 0.0 | 0.0 | 1.0 | 0.0 | 0.1 | 0.4 | 0.0 | 0.1 |
Commodity risk1 | 42.0 | 1.7 | 8.2 | 24.3 | 1.7 | 6.5 | 14.1 | 3.3 | 6.6 |
Other market risks2 | 5.5 | 2.0 | 3.5 | 5.8 | 1.4 | 3.8 | 5.1 | 3.5 | 4.2 |
Diversification effect | n/a | n/a | (12.3) | n/a | n/a | (8.6) | n/a | n/a | (8.6) |
Net market risk | 45.3 | 7.9 | 14.4 | 28.1 | 6.7 | 13.4 | 22.9 | 9.7 | 13.9 |
Operational risk
Operational risk is defined as the risk of loss resulting from inadequate or failed internal processes, people and systems or from external events. This definition includes legal and regulatory risk but excludes strategic risk. Westpac’s operational risk definition is aligned to APS115 Capital Adequacy: Advanced Measurement Approaches to Operational Risk (AMA). The way operational risk is managed has the potential to positively or negatively impact our customers, our employees, our financial performance and our reputation.
The Operational Risk Management Framework outlines Westpac’s approach to the:
· identification, measurement and management of operational risks that may impede Westpac’s ability to achieve its strategic objectives and vision;
· identification and escalation of operational risk incidents in order to mitigate potential financial loss, regulatory impacts and reputational damage that may impact shareholders, the community, and employees; and
· calculation of operational risk capital.
The Operational Risk Management Framework is further supported by a number of key Group-wide operational risk policies.
Conduct and Compliance risk
Conduct Risk
The risk that our provision of services and products results in unsuitable or unfair outcomes for our stakeholders or undermines market integrity.
The Westpac Group Conduct Framework sets out our approach to Conduct and Conduct Risk Management. We establish an umbrella view of Conduct Risk by leveraging existing risk frameworks, in particular Operational, Compliance, Reputation and Sustainability risk to improve customer outcomes. Conduct also underpins Our Compass, which brings together our Vision, Values, Code of Conduct and Service Promise to provide our people with a consistent understanding of what it means to ‘Do the Right Thing’.
1. Includes electricity risk.
2. Includes prepayment risk and credit spend risk (exposure to movements in generic credit rating brands).
| 2019 Westpac Group Annual Report | 135 |
| | |
Risk and risk management
Compliance risk
Compliance risk is the risk of legal or regulatory sanction, financial or reputational loss, arising from our failure to adhere to the compliance obligations required of the Group.
Compliance is focused on meeting our legal and regulatory obligations in each of the jurisdictions in which we operate by proactively managing compliance risk. Refer to Westpac’s Corporate Governance Statement in Section 1 for information on our management of operational and compliance risk.
Governance risk
The risk that the right information does not get to the right people or governance fora in the right format and timeframe to empower decision making. It is driven by organisational structures and relationships including between the Board, management, its shareholders and other stakeholders, which leads to deficient decision making, poor accountability and ineffective structures and processes.
We have a formal risk governance structure to support our Risk Management Framework which supports having the right people making the right decisions in the right format and in the right timeframe. This structure consists of the Board, BRCC and management committees.
Our risk governance structure includes documented approval authorities and delegations to committees and individuals, formal reporting structures, escalation processes and oversight for the management of risks, transparent and regular reporting, and evidencing of discussion and decision making by committees and individuals. We also apply standard protocols to communicate with regulators and critical stakeholders.
Risk Culture
Risk culture is the shared beliefs, attitudes, and norms that determine the way our people consider, identify, understand, discuss and manage current and emerging risks the Group is exposed to. A strong risk culture is essential for effective risk management as it promotes individual and organisational risk awareness, shaping behaviours and judgements around sound risk-taking. At Westpac, all employees are responsible for strengthening Westpac’s risk culture through fulfilling their risk-related obligations to allow Westpac to operate within risk appetite.
A strong risk culture continuously improves risk practices, so that key learnings and experiences are integrated into Group-wide and customer outcomes. Having a strong risk culture also assists emerging risks and risk-related behaviours being within risk appetite and those risks that are outside of appetite being recognised, assessed, escalated and addressed to return within appetite in a proactive and responsive way.
Westpac’s Foundations of Strong Risk Culture outline the key structural mechanisms (systems, policies and processes) and behavioural characteristics (responsiveness, speaking up) that shape and influence our risk culture. We use these foundations to monitor and assess Westpac’s risk culture through a suite of diagnostic approaches, including:
· a Risk Culture Dashboard to monitor trends and identify areas for management focus, supported by a database of risk culture and conduct metrics;
· a Risk Culture Insights Program, which enables a deep dive into a specific business area to identify key risk culture strengths and opportunities for improvement; and
· a Risk Culture Maturity assessment methodology that enables us to determine our current risk culture maturity relative to our target state.
Strategic risk
The risks arising from key elements of the strategic objectives and business plans. Strategic risk is the potential for financial loss or reputational damage arising from choosing the wrong strategy, poorly executing on the right strategy, or choosing not to pursue certain strategies.
Strategic risk may result from a lack of responsiveness to changes in the business environment within which Westpac operates – including economic, geopolitical, regulatory, technological, environmental, social and competitive factors. While these external factors cannot be controlled, their impact can be understood and limited through an effective strategic risk management framework, including scenario analysis and stress testing.
Group Strategy supports the management of strategic risk through the ongoing business strategy planning cycle, ensuring alignment across our business, financial, capital and risk planning. Key elements of this are the annual Board Strategy Review (BSR), annual Financial Target setting, and project investment approval processes which enable the identification, monitoring and mitigation of strategic risk throughout the Group.
Risk provides oversight of strategic risk by providing independent review of these processes and independently monitoring and reporting on the level of risk established against our risk appetite metrics. They also consider the impact on the current and emerging risk landscape, stress testing outcomes of our business plans through different scenarios and our risk infrastructure.
136 | 2019 Westpac Group Annual Report | |
| | |
Risk and risk management
Capital Adequacy
The risk that the firm has an insufficient level or composition of capital to support its normal business activities and to meet its regulatory capital requirements under normal operating environments or stressed conditions (both actual and as defined for internal planning or regulatory testing purposes). This includes the risk from the Westpac’s pension plans.
Our approach to capital management seeks to ensure that it is adequately Capitalised as an ADI.
Westpac evaluates its approach to Capital management through an Internal Capital Adequacy Assessment Process (ICAAP), the key features of which include:
· the development of a capital management strategy, including consideration of regulatory minimums, capital buffers and contingency plans;
· consideration of both economic and regulatory capital requirements;
· a stress testing framework that challenges the capital measures, coverage and requirements including the impact of adverse economic scenarios; and
· consideration of the perspectives of external stakeholders including rating agencies and equity and debt investors.
Cyber risk
The potential for loss or harm to the business and stakeholders related to the use of technology.
Our cyber risk management approach focuses on having an ‘end to end’ view of the Westpac Group Cyber ecosystem and whether policies, processes, systems and structures support the management of cyber risk. It is based on the Operational Risk Management Framework (ORMF) and Risk Management Strategy (RMS) across the Three Lines of Defence, and benchmarked against cyber risk management approaches considered by Australian and international regulations, international frameworks, current and emerging approaches within financial services, consulting firms and insurance.
Reputation risk
Reputation risk is the risk that an action, inaction, transaction, investment or event will reduce trust in Westpac’s integrity and competence by clients, counterparties, investors, regulators, employees or the public.
Reputation risk arises where there are differences between these stakeholders’ current and emerging perceptions, beliefs and expectations relative to our current and planned activities, performance and behaviours.
We have a Reputation Risk Management Framework and key supporting policies in place covering the way we manage reputation risk as one of our key risks across the Group, including the setting of risk appetite and roles and responsibilities for risk identification, measurement and management, monitoring and reporting. The Reputation Risk Management Framework was reviewed and updated in 2019.
Sustainability risk
The risk of reputation or financial loss due to failure to recognise or address material existing or emerging sustainability related environmental, social or governance issues.
The Group has in place a Board-approved Sustainability Risk Management Framework (Framework) that is supported by a suite of key policies and position statements. These include Our Principles for Doing Business, Responsible Investment Position Statement, Environmental, Social and Governance (ESG) Credit Risk Policy, Climate Change Position Statement and 2020 Action Plan, Human Rights Position Statement and 2020 Action Plan, sensitive sector position statements and Responsible Sourcing Code of Conduct, many of which are publicly available. The Sustainability Risk Management Framework was reviewed and updated in 2019.
Westpac is also a signatory to several voluntary principles-based frameworks that guide the integration of ESG- related issues to banking, lending and investment analysis. These include the Equator Principles, the United Nations Environment Programme Finance Initiative’s Principles for Responsible Banking, the Principles for Responsible Investment, and the Task Force on Climate-related Financial Disclosures (TCFD).
Climate change risk
Within the Sustainability Risk Management Framework climate change-related risks are managed by the Group in the same way as other transformational issues facing the economy. The Group examines the policy, regulatory, technology and market changes related to climate change (‘transition risks’), and the impacts of changes in climate patterns and extreme weather events (‘physical risks’). The Group seeks to understand the potential for these changes to impact its business, in particular the possible impact on credit risk, regulatory and reporting obligations, and its reputation.
Through its Climate Change Position Statement and 2020 Action Plan (CCPS), Westpac has an enhanced approach to lending to emissions-intensive sectors, supporting customers that are in or reliant on these sectors and who assess the financial implications of climate change on their business, including how their strategies are likely to perform under various forward-looking scenarios, and demonstrate a rigorous approach to governance, strategy setting, risk management and reporting.
| 2019 Westpac Group Annual Report | 137 |
| | |
Risk and risk management
Westpac uses scenario analysis to inform its assessment of climate-related risks over short, medium and long-term horizons. The findings from scenario analysis conducted in 2016 were reflected in Westpac’s current CCPS which outlined enhanced lending standards for the thermal coal mining and energy sectors. These lending parameters have been included in the Group’s risk framework and, where appropriate, are applied at the portfolio, customer and transaction level.
In 2019 the Group undertook scenario analysis to assess the resilience of Westpac’s Australian Business and Institutional lending1 to transition risks brought about by rapid decarbonisation of the Australian economy under a 1.5-degree scenario.
Westpac also continued to assess:
· The resilience of its Business and Institutional lending to transition risks under a 2-degree scenario (based on scenarios from work undertaken in 2018); and
· The potential impact of climate-related physical risks on the Australian mortgage portfolio2 arising from global warming scenarios of both 2 and 4-degrees.
The approach and results are summarised below. Further detail can be found in the Westpac Sustainability Performance Report.
Scenario analysis - transition risk
Approach3
To assess the possible implications of climate-related transition risks, the Group used scenario analysis to study how the Australian economy, electricity market and other industry sectors might perform when emissions are constrained in line with 2-degree and 1.5-degree transition pathways.
· The emission constraints used in the modelling were informed by the International Energy Agency’s Sustainable Development Scenario, the International Renewable Energy Agency’s Renewable Energy Roadmap and the Intergovernmental Panel on Climate Change (IPCC) Special Report on Global Warming of 1.5 Degrees;
· Each sector’s performance under the two pathways was analysed and categorised according to risk profile;
· Sectors whose medium (2030) and long-term (2050) performance under a scenario deviated significantly4 from average GDP growth, were classified as ‘higher risk’; and
· These results were applied to the Australian Business and Institutional lending portfolio to assess the extent of current exposure to these higher risk sectors.
Results
· 1.5-degrees: Westpac’s current exposure to sectors that by 2030 may face growth constraints under a 1.5-degree scenario is approximately 2.5% of its Business and Institutional lending; and
· 2-degrees: Westpac’s current exposure to sectors that by 2030 may face growth constraints under a 2-degree scenario is approximately 0.9% of its Business and Institutional lending.
Westpac continues to assess the resilience of its Business and Institutional lending portfolio to transition risks. Lending to higher risk sectors may be subject to enhanced due diligence or restrictions under the parameters laid out in the CCPS. The Group reviews its CCPS every three years.
Scenario analysis - physical risk
Approach
· To assess the possible implications of climate-related physical risks, the Group studied the potential impact of natural perils on its Australian mortgage portfolio under a 4-degree scenario:
· The selected perils were inundation, soil contraction, floods, wind and cyclones, and bushfires;
· The core scenario is based on the IPCC’s RCP8.5 scenario and a series of conservative assumptions about the vulnerability of Australian homes to natural perils;
· Changes under the scenario in average annual costs as a result of climate change were estimated to 2050;
· A set of ‘higher risk’ postcodes were defined where the net present value of changes in these costs was greater than an interest rate increase above a defined threshold - consistent with our typical stress testing parameters; and
· We applied these results to the Australian mortgage portfolio to assess the extent of the Group’s current exposure to these postcodes.
Results
· 4-degrees: Approximately 1.6% of the Australian mortgage portfolio is exposed to postcodes that may experience higher physical risk at 2050.
1. Excludes retail, sovereign, and bank exposures.
2. Excludes RAMS.
3. Updated transition risk methodology applied from 1H19.
4. Greater than one standard deviation.
138 | 2019 Westpac Group Annual Report | |
| | |
Risk and risk management
Westpac continues to assess the resilience of its Australian mortgage portfolio to physical risks. The Group understands the importance of both climate mitigation and adaptation efforts, including government planning measures, and the benefits of climate-resilient building characteristics to reduce property damage and impacts on customers and communities. Along with the Group’s broader commitment to the Paris Agreement, Westpac expects to continue to help individual customers respond to climate change, and to continue to advocate for more research and investment into helping communities adapt and become resilient to climate-related impacts.
Structured entities
We are associated with a number of structured entities in the ordinary course of business, primarily to provide funding and financial services products to our customers.
Structured entities are typically set up for a single, pre-defined purpose, have a limited life, generally are not operating entities and do not have employees. The most common form of structured entity involves the acquisition of financial assets by the structured entity that is funded by the issuance of securities to external investors (securitisation). Repayment of the securities is determined by the performance of the assets acquired by the structured entity.
Under AAS, a structured entity is consolidated and reported as part of the Group if it is controlled by the parent entity in line with AASB 10 Consolidated Financial Statements. The definition of control is based on the substance rather than the legal form. Refer to Note 32 to the financial statements for a description of how we apply the requirements to evaluate whether to consolidate structured entities and for information on both consolidated and unconsolidated structured entities.
In the ordinary course of business, we have established or sponsored the establishment of structured entities in relation to securitisation, as detailed below.
Covered bond guarantors
Through our covered bond programs we assign our equitable interests in residential mortgage loans to a structured entity covered bond guarantor which guarantees the obligations of our covered bonds. We provide arm’s length swaps to the covered bond guarantor in accordance with relevant prudential guidelines. We have no obligation to repurchase any assets from the covered bond guarantor, other than in certain circumstances where there is a breach of representation or warranty. We may repurchase loans from the covered bond guarantor at our discretion, subject to the conditions set out in the transaction documents.
As at 30 September 2019, the carrying value of assets pledged for the covered bond programs for the Group was $44.7 billion (2018: $43.1 billion).
Refer to Note 24 to the financial statements for further details.
Securitisation structured entities
Through our securitisation programs we assign our equitable interests in assets (in respect of RMBS, principally residential mortgage loans, and in respect of ABS, principally auto receivables) to structured entities, which issue securities to investors. We provide arm’s length interest rate swaps and liquidity facilities to the structured entities in accordance with relevant prudential guidelines. We have no obligation to repurchase any securitisation securities, unless there is a breach of representation or warranty within 120 days of the initial sale (except in respect of our program in New Zealand, which imposes no such time limitation). We may remove assets from the program where they cease to conform with the terms and conditions of the securitisation programs or through a program’s clean-up features.
As at 30 September 2019, our assets securitised through a combination of privately or publicly placed issuances to a combination of domestic and offshore investors were $8.2 billion (2018: $7.6 billion).
Under AAS, all of the structured entities involved in our loan securitisation programs are consolidated by the Group.
Refer to Note 24 to the financial statements for further details.
Structured finance transactions
We have entered into transactions with structured entities to provide financing to customers or to provide financing to the Group. Any financing arrangements to customers are entered into under normal lending criteria and are subject to our normal credit approval processes. The assets arising from these financing activities are generally included in loans or Investment securities (2019)/available-for-sale securities (2018). The liabilities arising from these financing activities are generally included in debt issues or other financial liabilities. Exposures in the form of guarantees or undrawn credit lines are included within contingent liabilities and credit-related commitments.
Other off-balance sheet arrangements
Refer to Note 34 to the financial statements for details of our superannuation plans and Note 27 for details of our contingent liabilities, contingent assets and credit commitments.
| 2019 Westpac Group Annual Report | 139 |
| | |
Risk and risk management
Financial reporting
Internal control over financial reporting
The US Congress passed the Public Company Accounting Reform and Investor Protection Act in July 2002, which is commonly known as the Sarbanes-Oxley Act of 2002 (SOx). SOx is a wide ranging piece of US legislation concerned largely with financial reporting and corporate governance. We are obligated to comply with SOx by virtue of being a foreign registrant with the SEC and we have established procedures designed to comply with all applicable requirements of SOx.
Disclosure controls and procedures
Our management, with the participation of our CEO and CFO, evaluated the effectiveness of the design and operation of our disclosure controls and procedures (as defined in Rule 13a-15(e) under the US Securities Exchange Act of 1934) as of 30 September 2019.
Based upon this evaluation, our CEO and CFO have concluded that the design and operation of our disclosure controls and procedures were effective as of 30 September 2019.
Management’s Report on internal control over financial reporting
Rule 13a-15(a) under the US Securities Exchange Act of 1934 requires us to maintain an effective system of internal control over financial reporting. Refer to the sections headed ‘Management’s report on internal control over financial reporting’ and ‘Report of independent registered public accounting firm’ in Section 3 for those reports.
Changes in our internal control over financial reporting
There has been no change in our internal control over financial reporting (as defined in Rule 13a-15(f) of the US Securities Exchange Act of 1934) for the year ended 30 September 2019 that has been identified and that has materially affected, or is reasonably likely to materially affect, our internal control over financial reporting. Westpac adopted AASB9 on 1 October 2018 and has added, updated and modified controls over financial reporting as a result of the new accounting standard, embedding them into our existing control environment.
140 | 2019 Westpac Group Annual Report | |
| | |
Westpac's approach to sustainability
Sustainability performance
Westpac’s approach to sustainability
The Group’s approach to operating sustainably is designed to anticipate, respond to and shape the most pressing emerging topics (issues and opportunities) that have the potential to materially impact customers, employees, suppliers, shareholders and communities.
As one of Australia’s largest companies, Westpac Group plays a role in helping to create positive social, economic and environmental impact, for the benefit of all.
Our approach to sustainability is embedded within the Group’s business activities and aligns with the priorities set out in the Group’s strategy. We are aligned with the Paris Climate Agreement and contribute to the United Nations Sustainable Development Goals.
Guiding our approach
Accountability for the Group’s Sustainability Strategy starts with the Board, which has responsibility for considering the social, ethical and environmental impact of the Group’s activities, setting standards and monitoring compliance with sustainability policies and practices. The Westpac Sustainability Council comprising senior leaders from across the business, meets at least four times a year and oversees strategic progress and guides the Group’s approach.
Progress against the Sustainability Strategy is reported to and discussed with the Executive Team and Board twice each year, with other items discussed as needed.
Our approach is aligned to the widely accepted global standard for corporate responsibility and sustainable development, the AA1000 AccountAbility Principles Standard (2008), and its three key principles of Inclusivity, Materiality and Responsiveness.
Westpac’s sustainability performance is regularly benchmarked by a number of third-party ratings and awards, including the Dow Jones Sustainability Indices (DJSI), where the Group has been recognised as a global leader as a member of DJSI World for 18 years in a row. In 2019, Westpac ranked number one bank in Australia and ninth globally.
Frameworks and policies
Westpac responds to enduring and emerging material topics through frameworks and policies that are complementary to its business strategy and form part of the Group’s approach to governance and risk management. Collectively, they help to guide decisions, manage risk and drive action. Key frameworks and policies include:
· Principles for Doing Business, which set out the behaviours the Group expects to be judged against in pursuit of its vision, and the framework to embed sustainable practices throughout the business in the areas of governance and ethics, customer practices, employee practices, care for the environment, community involvement and supply chain management;
· Sustainability Risk Management Framework, which sets out how the Group manages sustainability risks in operations, lending and investment decisions, and the supply chain, providing a guide for roles and responsibilities within the organisation, reflecting the Group’s ‘three lines of defence’ risk management approach; and
· A suite of policies that embed the principles and management requirements in day-to-day operations, including our Code of Conduct, divisional ESG policies, and position statements on sensitive sectors and issues including climate change and human rights.
| 2019 Westpac Group Annual Report | 141 |
| | |
Westpac's approach to sustainability
Material sustainability topics
Informed by engagement with internal and external stakeholders, including the Group’s Stakeholder Advisory Council, review of policies, industry trends, peer analysis and regulatory and non-regulatory requirements, Westpac’s materiality process is aligned with the Global Reporting Initiative Standards (2016) and the AA1000 AccountAbility Principles Standard (2008). Prioritisation of material topics is subject to annual independent external assurance. Westpac’s top ten material topics are outlined below.
Material sustainability topic | | | | |
Conduct and culture | | Instances of poor conduct have eroded public trust in the financial services sector, driving an increased focus on corporate culture and improved outcomes for customers | | Changing regulatory landscape | | Supervision and regulation in jurisdictions that the Group operates in continue to evolve, creating uncertainty in the operating environment |
Customer satisfaction and experience | | Customers’ needs are becoming more complex, and at the same time their expectations around how they want to engage with us are evolving | | Digital product and service transformation | | Digitisation offers opportunities to improve efficiency and deliver new and better customer experiences when, how and where customers choose to engage with us |
Governance and risk | | Clear governance practices, active management of risk, commitment to compliance, and fair remuneration in our operations, supplier and partner relationships are critical to the longevity and financial wellbeing of the Group | | Customer vulnerability and hardship | | Our ability to support customers in times of financial hardship and anticipating times when they can become vulnerable allows us to help when it matters most |
Information security and data privacy | | Maintaining customer confidentiality and the security of our systems is paramount to maintaining trust and confidence | | Executive remuneration | | Appropriate remuneration structures align executive remuneration and accountability with stakeholder interests over the long term, and play an important role in effective corporate governance |
Financial and economic performance | | Maintaining a healthy financial performance and strong balance sheet is vital to the Group’s long-term sustainability | | Climate change risks and opportunities | | As a major financial institution, we have an important role to play in managing the risks and opportunities of climate change, and supporting collaborative efforts to limit global warming, while also taking steps to help the economy and communities become more resilient to the expected effects |
142 | 2019 Westpac Group Annual Report | |
| | |
Westpac's approach to sustainability
Sustainability goals
Westpac Group’s 2018-2020 Sustainability Strategy outlines the Group’s commitment to building a sustainable future. This includes taking action in the areas where the Group can have the greatest impact and create sustainable, long-term value for customers, communities and the nation by:
· helping people make better financial decisions;
· helping people by being there when it matters most to them; and
· helping people create a prosperous nation.
Underpinning these three priority areas is a commitment to fostering a culture of care and doing the right thing and continuing to lead on the sustainability fundamentals – policies, action plans, frameworks and metrics reporting. We continue to progress on our climate change, human rights and reconciliation action plans.
Westpac is committed to regular reporting to enable a comparison of performance over time. The table below summarises progress against the goals set out in the Group’s Sustainability Strategy with a focus on activity in the past 12 months.
Performance against sustainability goals
Priority areas | | Goals | | 2019 performance |
Helping people make better financial decisions | | Help more people better understand their financial position, improving their financial confidence | | · Continued to offer financial health check programs for superannuation members, including the digital Wealth Review tool and My Wellbeing online portal; · Delivered a range of financial literacy programs to individuals, businesses, not-for-profit organisations and community groups through Westpac’s Davidson Institute in Australia and the Managing Your Money program in New Zealand; and · Delivered financial capability communications for different demographic segments including for young Australians, in partnership with 26 universities and TAFE NSW (900,000 interactions); women, via Ruby Connection (724,000 interactions); and older Australians, via Starts at 60 (over 3 million interactions). |
| | Help people recover from financial hardship | | · Helped customers experiencing financial hardship, issuing over 52,000 financial assistance packages during the year. |
Helping people by being there when it matters most to them | | Help people lift out of a difficult time and recover stronger | | · Extended the $100 million drought relief fund launched last year to support Australian farmers; · Committed $50 million to a flood relief fund dedicated to helping farmers in North Queensland; · Delivered a portable ‘Bank in a Box’ branch to Townsville to help those affected by floods; · Provided over 500 relief packages for customers impacted by natural disasters across Australia; · Donated $150,000 to the Salvation Army and a further $100,000 to the Foundation for Rural & Regional Renewal (FRRR) to support disaster recovery and programs to build local community resilience; · Joined the Government-led Drought Finance Taskforce to both share information with the government on the impact of drought on our customers and advise on measures to help alleviate the impact; and · Continued work with the Australian Business Roundtable for Disaster Resilience and Safer Communities to define approaches to assist government, business and communities mitigate and respond to natural disasters. |
| | Helping our most vulnerable customers | | · Published the 2020 Customer Vulnerability Action Plan outlining the Group’s principles for engaging with customers experiencing vulnerability, including providing guidance, help and support for customers experiencing domestic and family violence and financial abuse; · Assisted more than 900 customers since launching the Priority Assist 1800 telephone line to support customers experiencing domestic and family violence and financial abuse; · Established specialist teams to support bankers with complex customer queries; · Established a dedicated 24/7 Scams Assist team to protect customers who may be victims of fraud or scams; · Launched a series of Life Moments tools and resources to assist customers and their families going through challenging circumstances such as the loss of a loved one, divorce or separation; and · Supported over 3,000 Indigenous Australians through a dedicated customer care team established this year to support remote Indigenous communities. |
| 2019 Westpac Group Annual Report | 143 |
| | |
Westpac's approach to sustainability
Priority areas | | Goals | | 2019 performance |
| | Build the workforce of the future | | · Identified 10 core capabilities to enable our people to prepare for the future of work and built curricula to support their growth in these areas; and · Updated our Science, Technology, Engineering and Mathematics (STEM) Commitment, reflecting a wide range of interventions and initiatives to help build a STEM-confident nation that is diverse and future ready. |
| | Invest and back the people and ideas shaping Australia | | · Awarded $4.3 million in educational scholarships, through Westpac Scholars Trust, to the next 102 Westpac Scholars, bringing the total cohort to 416; · Helped to create over 700 jobs1 for vulnerable Australians through Westpac Foundation job creation grants to social enterprises; · Westpac Foundation awarded 100 Community Grants to the total of $1 million, to support approximately 12,000 people; · Supported the establishment of 359 businesses through our Many Rivers partnership; the partnership has created jobs1 for more than 2,300 people, with 829 identifying as Indigenous; · Maintained a portfolio of direct investment in nine early stage companies; and · Maintained our commitment to Reinventure - $150 million across three funds, supporting Reinventure’s investment in 27 early stage companies. |
Helping people create a prosperous nation | | Back the growth of climate change solutions | | · Increased lending to climate change solutions, taking total committed exposure to $9.3 billion, progressing towards our 2020 target of $10 billion; · Facilitated $3.6 billion in funding for climate change solutions, exceeding our 2020 target of $3 billion; and · Analysed climate change risks under 1.5, 2 and 4-degree scenarios. |
| | Back the growth of housing affordability solutions | | · Undertook research with Indigenous consultancy firm Origin Communications to consider how Westpac can support more Indigenous Australians to own their own home – with insights informing further exploration, such as intergenerational home ownership; · Westpac New Zealand launched a dedicated home loan solution - ‘Westpac Prebuilt’ - offering a simple and streamlined process to help customers into prefabricated homes, the first bank in New Zealand to do so; and · Extended our support to Head Start Homes (HSH) – a charity that helps people move out of social housing into their own homes. |
| | Bring together partners and harness the Group capacity to tackle pressing social issues that matter most to the nation | | · A founding bank and signatory to the Principles for Responsible Banking, developed as an initiative of the United Nations Environment Programme Finance Initiative (UNEP FI); · Joined other Australian banks, insurers, super funds, investors and industry groups to form the Australian Sustainable Finance Initiative; and · Joined an Expert Advisory Council, through WEConnect International, focusing on best-in-class approaches to supply chain, supplier diversity and access to capital for women-owned businesses. |
1. All results for the year ended 30 September except jobs created through the Westpac Foundation job creation grants to social enterprises and Many Rivers job creation which are for the year ended June.
144 | 2019 Westpac Group Annual Report | |
| | |
Westpac's approach to sustainability
Priority areas | | Goals | | 2019 performance |
| | A culture of doing the right thing | | · Continued programs to rebuild trust, strengthen governance and deliver more consistent customer outcomes, including our Royal Commission response plan and our Culture, Governance, Accountability Self-Assessment action plan; · Maintained ongoing Navigate training to reinforce Our Compass – a framework which brings together our vision, service promise, values and Code of Conduct – with smaller sessions facilitated by team leaders to continue the conversation locally; and · Continued to assess employee performance through the ‘Motivate’ framework – a behaviours-first approach to people management. |
A culture that is caring, inclusive and innovative | | Promote an inclusive society, where our workforce reflects our customers | | · Maintained 50% women in leadership1 roles; · 36% women on the Westpac Board; · 161 new-to-bank Aboriginal or Torres Strait Islander hires; · Introduced a leadership shadowing program for culturally and linguistically diverse employees to build exposure to new networks and career pathways; and · Updated leave entitlements to include 20 days paid leave for employees undergoing a gender transition, three days Sorry Business leave for Aboriginal and Torres Strait Islander employees, increased paid leave for employees experiencing domestic and family violence to 20 days, and increased paid parental leave for support carers to three weeks. |
| | Increase channels where customers can provide feedback | | · Established a new complaints strategy centred on customer connection, service excellence, priority support for vulnerable customers and root cause and complaints prevention; · Embedded a Customer Outcome Committee to work through complex cases; · Reduced non-external dispute resolution average time to close for complaints from 13 days to seven days; · Commenced tracking customer satisfaction of the complaint resolution experience; · Launched our ‘FAIRGO’ decision principles that set out our approach to resolving complaints; · Launched the “Spot it, Log it, Own it” internal campaign, promoting an improved culture of complaints handling; and · 97% of Australia-based employees completed the “Why Complaints Matter” training. |
1. Women in Leadership refers to the proportion of women (permanent and maximum term) in leadership roles across the Group. It includes the CEO, Group Executives, General Managers, senior leaders with significant influence on business outcomes (direct reports to General Managers and their direct reports) large (3+) team people leaders three levels below General Manager, and Bank and Assistant Bank Managers.
| 2019 Westpac Group Annual Report | 145 |
| | |
Westpac's approach to sustainability
Priority areas | | Goals | | 2019 performance |
| | Employees | | · Implemented the recommendations of the Sedgwick Review for employees effective from 1 October 2018, two years ahead of schedule; · Embedded a Group Consequence Management Framework which sets out the standards expected of our employees and ensures greater consistency and transparency in the management of employee conduct matters; · Achieved total recordable injury frequency rate (TRIFR) of 3.1, a 20% reduction from 2018, and lost time injury frequency rate (LTIFR) of 0.4; · Improved Employee Assistance Program utilisation from 9.0% in 2018 to 10.2%; and · Continued commitment to supporting workplace wellbeing, appointing a Chief Mental Health Officer to drive a range of activities focused on improving the psychological health and safety of our workforce. |
| | Human rights | | · Identified key categories of products and services that are supplied to the Group that have a higher likelihood of modern slavery risk; · Commenced work to meet the requirements of the Australian Modern Slavery Act (2018) ahead of our 2021 reporting obligations; · Became the first bank to be accredited as a Living Wage employer in New Zealand; and · The only Australian bank to contribute to the Liechtenstein Initiative for a Financial Sector Commission on Modern Slavery and Human Trafficking - a public-private partnership that aims to put the financial sector at the heart of global efforts to end modern slavery and human trafficking - with the outcomes now published the Finance Against Slavery and Trafficking Blueprint. |
Continuing to lead on the Sustainability Fundamentals | | Sustainable lending and investment | | · Launched the world’s first Green Tailored Deposit to be certified by internationally recognised Climate Bonds Initiative (CBI); · Delivered several sustainability-linked loans designed to incentivise and reward customers for meeting pre-determined sustainability targets; · Undertook an extensive review of our Sustainability Risk Management Framework focusing on improvements to risk identification, governance and reporting; · Updated our position statement on Financing Agribusiness and continued our work to embed the management of key climate change and human rights-related risks across our business; and · Updated our BT climate-related financial disclosures (superannuation and investments), in line with the recommendations of the Task Force on Climate-related Financial Disclosures (TCFD). |
| | Environment1 | | · Maintained carbon neutral status; · Achieved a 5.6% reduction in greenhouse gas emissions (‘emissions’) compared to 2018 and 17.9% compared to our 2016 baseline; · Achieved a 15.7% reduction in Group paper consumption compared to 2018 and 45.3% reduction against our 2016 baseline; · Achieved a 3.9% reduction in water consumption in our Australian workplaces2 compared to 2018 and 23.7% reduction against our 2016 baseline; · Achieved a 75% diversion of waste from landfill in our main Australian offices3; and · Committed to source 100% of global electricity consumption through renewable energy sources by 2025 and joined RE100. |
| | Responsible Sourcing | | · Sourced $18.6 million from diverse suppliers, including $3.6 million from Indigenous suppliers; and · Joined ‘Raising the Bar’ as one of 16 inaugural signatories – a joint initiative of the Business Council of Australia and Indigenous business advocate Supply Nation, and committed to spend $21 million with Indigenous businesses by 2024. |
| | Community and social impact | | · Contributed over $130 million to community investment excluding commercial sponsorships across the Group; and · 13% employees participated in our volunteering programs, with more than 500 Westpac employees contributing more than 24,000 hours of skilled volunteering support to community partners and social enterprises to build their financial sustainability and social impact. |
1. All results for the year ended 30 September except environmental footprint which is for the year ended 30 June.
2. Australian workplaces include commercial offices, retail branches, data centres and subsidiaries sites.
3. Our main Australian offices are Sydney based Westpac buildings located at Kent Street, Barangaroo and Kogarah.
146 | 2019 Westpac Group Annual Report | |
| | |
Westpac's approach to sustainability
Climate-related financial disclosures
The Group has long recognised that climate change is one of the most significant issues that will impact the long-term prosperity of our economy and way of life. Westpac was the first Australian bank to recognise the importance of limiting global warming to less than two degrees and that to do this, global emissions need to reach net zero in the second half of this century.
Westpac continues to integrate the consideration of climate-related risks and opportunities into its business operations. This includes alignment with the recommendations of the Task Force on Climate-related Financial Disclosures (TCFD), which the Group has publicly committed to support. Westpac Group’s performance against the recommendations of the TCFD is summarised below.
Governance
The Board has oversight of Westpac Group’s response to climate change. The Group’s third Climate Change Position Statement and 2020 Action Plan (CCPS) was approved by the Executive Team and the Board in 2017. It covers the management of the Group’s climate change risks and opportunities, including lending to climate solutions, the Group’s approach to financing emissions-intensive sectors, commitment to reporting and transparency, direct carbon footprint management, and incorporation of climate change considerations into the Group’s Sustainability Risk Management Framework1. The Board Risk and Compliance Committee reviews and approves updates to the Sustainability Risk Management Framework (which includes climate change risks) every two years.
Management of climate change is delegated to the Executive Team. The Sustainability Council (Council), formed in 2008 and sponsored by the Group Executive, Customer and Corporate Relations, brings together senior leaders from across the Group with the explicit responsibility for managing Westpac’s sustainability agenda, including climate change. The Council meets at least quarterly and has climate change as a fixed agenda item. The Council reports to the Executive Team and Board through twice-yearly updates.
The Council has oversight of committees established to oversee aspects of the Group’s CCPS. This includes:
· The Climate Change Solutions Committee which meets at least quarterly and oversees initiatives to achieve Westpac’s targets for lending to and facilitating climate change solutions;
· The Climate Change Risk Committee which oversees initiatives to address credit, regulatory and legal risks of climate change, including scenario analysis. Reports on climate change-related risks are provided to the Council on a quarterly basis; and
· The Environment Management Committee which oversees strategies and initiatives to reduce the Group’s direct environmental footprint, particularly targets around energy and emissions, and reports to the Council on a quarterly basis.
In addition, the Sustainable Bonds Committee provides risk governance and oversight of Climate Bonds and other sustainable funding programs to ensure compliance with relevant standards. It reports to the Treasury Risk and Compliance Committee.
Strategy
The Group’s 2018-2020 Sustainability Strategy and CCPS describe Westpac’s climate change strategy. The strategy is underpinned by principles which recognise that:
· A transition to a net zero emissions economy is required;
· Economic growth and emissions reductions are complementary goals;
· Addressing climate change creates financial opportunities;
· Climate-related risk is a financial risk; and
· Transparency and disclosure matters.
To address climate change risk and opportunities the CCPS identifies five focus areas where the Group is expected to direct its attention over the short, medium and long term2:
· Provide finance to back climate change solutions;
· Support businesses that manage their climate-related risks;
· Help individual customers respond to climate change;
· Improve and disclose our climate change performance; and
· Advocate for policies that stimulate investment in climate change solutions.
Westpac uses scenario analysis to guide its climate change strategy and to analyse the implications of climate-related factors to its business. Westpac expects to be well positioned to capitalise on opportunities arising out of growth in sectors benefiting from a transition to a low carbon economy over the short and medium term.
The Group has lending targets to climate change solutions of $10 billion by 2020 and $25 billion by 2030.
1. Westpac’s Climate Change Position Statement and 2020 Action Plan does not apply to investments made where a Westpac Group entity is acting as a trustee (for example Responsible Super Entity licensee or Responsible Entity) or insurer. The governance and strategies for ESG risk in these portfolios (including climate change) are the responsibility of the relevant board and management of these entities.
2. See: Westpac Group’s Climate Change Position Statement and 2020 Action Plan.
| 2019 Westpac Group Annual Report | 147 |
| | |
Westpac's approach to sustainability
Risk management and scenario analysis
Further details about Westpac’s approach to climate related risks and its use of scenario analysis to analyse the implications of climate-related factors to its business are set out in the ‘Risk and risk management’ section.
Metrics and targets
Metrics | | 2019 performance |
Support for climate solutions | | |
· Total committed exposure (TCE) to climate solutions · Facilitation of climate solutions | | · $9.3 billion vs 2020 target - $10 billion · $3.6 billion climate-related bonds vs 2020 target - $3 billion |
Energy generation | | |
· Emission intensity of electricity generation portfolio · Energy mix of electricity generation exposure (WIB only) | | · 0.26 (tCO2e/MWh) vs 2020 target 0.30 (tCO2e/MWh) · 75% renewable versus 25% non-renewables. |
Coal mining and coal exposure | | |
· Lending to all mining (TCE) · Lending to coal mining (metallurgical and thermal) (TCE) · Thermal coal mining portfolio quality thresholds | | · $10.5 billion mining exposure representing 1% of Group TCE · $0.8 billion lending to coal mining representing 0.07% of Group TCE · Coal quality – Existing projects > 5,700 kCal/kg – Compliant – New projects > 6,300 kCal/Kg - Compliant |
Direct footprint | | |
· Total Scope 1 and 2 emissions (tCO2e) · Total Scope 3 emissions (tCO2e) · Carbon neutral operations · Commitment to 100% renewable energy | | · 121,168 tCO2e1 - an annual reduction of 5.6% towards 2020 target of 9% (2016 baseline) · 62,242 tCO2e2 · Carbon neutrality maintained · Committed to source 100% global electricity consumption through renewable energy sources by 2025 |
Climate change portfolio resilience | | |
· Transition risk – 1.5-degree scenario · Transition risk – 2-degree scenario · Physical risk – 4-degree scenario | | · Approximately 2.5% of current business lending exposed to sectors which by 2030 may experience higher risk in a transition to a 1.5-degree economy · Approximately 0.9% of current business lending exposed to sectors which by 2030 may experience higher risk in a transition to a 2-degree economy · Approximately 1.6% of current Australian mortgage portfolio in postcodes which by 2050 may be exposed to higher physical risks under a 4-degrees scenario |
Further Information
Further details on Westpac’s climate change reporting can be found across the Group’s annual reporting suite:
TCFD recommendation | | Location |
Governance | | · Annual Report Climate-related financial disclosures · Sustainability Performance Report – Climate Change · Climate Change Position Statement and 2020 Action Plan |
Strategy | | · Annual Report – Climate-related financial disclosures · Sustainability Performance Report – Climate Change · Climate Change Position Statement and 2020 Action Plan |
Risk Management including scenario analysis | | · Annual Report – Risk and risk management · Sustainability Performance Report – Climate Change · Climate Change Position Statement and 2020 Action Plan |
Metrics and Targets | | · Annual Report - Climate-related financial disclosures Sustainability Performance Report – Climate Change; Performance Metrics · ESG Dashboard – Westpac website |
1. Total Scope 1 and 2 emissions are for the year ended 30 June.
2. Total Scope 3 emissions are for the year ended 30 June.
148 | 2019 Westpac Group Annual Report | |
| | |
Westpac's approach to sustainability
Westpac’s commitment to human rights
Westpac recognises that respecting and advancing human rights helps us to achieve our vision to help our customers, communities and employees to prosper and grow. Westpac is a signatory of the United Nations Global Compact and supporter of the UN’s ‘Protect, Respect, Remedy’ framework. The Group’s implementation of the framework is guided by the UN Guiding Principles on Business and Human Rights (UNGP).
The Group’s Human Rights Position Statement and 2020 Action Plan (Statement) outlines Westpac’s approach to human rights-related commitments, principles, focus, approach, governance and related policies, statements, frameworks and action plans; considering its role as an employer, a customer services provider, a purchaser of goods and services, a financial services provider, a supporter of communities and a responsible business.
Governance and oversight
The Board has oversight of Westpac Group’s approach to human rights. The Statement was approved by the Group Executive and the Board in 2017. Management of human rights is delegated to Group Executives and the Sustainability Council brings together senior leaders from across the Group with explicit responsibility for managing Westpac’s sustainability agenda including human rights. The Council meets at least quarterly and has human rights as a fixed agenda item. The Council reports to the Board through twice-yearly updates. The Council has oversight of the Human Rights Working Group which meets quarterly to implement the consideration of human rights into day-to-day decision-making with a focus on the Group’s salient human rights issues.
Salient human rights issues
The Group has determined the following salient human rights issues – the human rights at risk of the most severe negative impact through a company’s activities and business relations.
Salient issue | Stakeholders at risk of being impacted | Potential impacts |
Managing and protecting the privacy rights of individuals | Retail and business customers, employees, contractors, suppliers | Abuse, loss and breach of personal data and privacy |
Customer vulnerability | Customers and wider customer value chain | Economic and social disadvantage of customers |
Individual exclusion and discrimination in employment | Current and prospective employees and contractors | Inability to full and equal participation in employment |
Unfair wages and conditions for workers in the value chain | Contractors, suppliers, third-party service providers | Impact to an individual’s prosperity, security and standard of living |
Management of human rights issues
A range of policies and strategies outlined in the Human Rights Position Statement and 2020 Action Plan guide Westpac’s response to human rights issues. Westpac’s approach to engagement with stakeholders is set out in the Group’s Stakeholder Engagement Framework and aligned to the AA1000 Stakeholder Engagement Standard. The Group has a range of mechanisms in place to enable effective engagement with stakeholders such as its Whistleblower hotline, Office of the Customer Advocate, feedback and complaints webpages and phonelines.
Where appropriate these mechanisms are also equipped to remediate human rights issues.
This year the Group engaged with stakeholders in several ways to manage and advance its approach to human rights issues, including:
· The Group’s Stakeholder Advisory Council on the role of banks and modern slavery;
· Customers and the management of human rights risks arising in different industry sectors;
· Suppliers and the integration of human rights risk assessments in contracts;
· Civil society and evolving expectations on corporate approaches to human rights risk management;
· Specialist advisors and best practice in human rights risk management for companies; and
· Peers, government and industry groups to support collective efforts to address modern slavery.
Australian Modern Slavery Act 2018
With the introduction of the Modern Slavery Act in Australia, Westpac has begun work to embed its requirements into its procurement practices.
Westpac will publish its first Australian Slavery and Human Trafficking Statement in 2021, reporting on its activities for the FY20 period. The Group reports further detail on its human rights performance in its Sustainability Performance Report. It also produces a slavery and human trafficking statement in line with its obligations under the United Kingdom’s Modern Slavery Act.
| 2019 Westpac Group Annual Report | 149 |
| | |
Westpac's approach to sustainability
Five year non-financial summary1
Key trends across a range of non-financial areas of performance are provided in the following five year non-financial summary.
| 2019 | 2018 | 2017 | 2016 | 2015 |
Customer | | | | | |
Total customers (millions)2 | 14.2 | 14.2 | 13.9 | 13.4 | 13.2 |
Digitally active customers (millions)3 | 5.8 | 5.6 | 5.3 | 4.9 | 4.9 |
Branches4 | 1,143 | 1,204 | 1,251 | 1,310 | 1,429 |
Branches with 24/7 capability (%)5 | 35 | 33 | 29 | 27 | 22 |
ATMs | 2,847 | 3,222 | 3,665 | 3,757 | 3,850 |
Smart ATMs (%)6 | 54 | 47 | 44 | 37 | 31 |
Change in consumer complaints (%) - Australia7 | 94 | 12 | (18) | (31) | (28) |
Change in consumer complaints (%) - NZ | 2 | (16) | (21) | (7) | (18) |
Employees | | | | | |
Total employees (full-time equivalent)8 | 33,288 | 35,029 | 35,096 | 35,580 | 35,484 |
Employee voluntary attrition (%)9 | 10.3 | 10.0 | 9.6 | 10.6 | 10.6 |
New starter retention (%)10 | 84.5 | 84.1 | 84.7 | 85.5 | 85.3 |
Employee Commitment Index (%)11 | 71 | 73 | 76 | - | - |
Lost Time Injury Frequency Rate (LTIFR)12 | 0.4 | 0.4 | 0.6 | 0.8 | 0.8 |
Women as percentage of the total workforce (%) | 58 | 57 | 58 | 58 | 59 |
Women in leadership (%)13 | 50 | 50 | 50 | 48 | 46 |
Environment | | | | | |
Total Scope 1 and 2 emissions - (tonnes CO2-e)14 | 121,168 | 128,339 | 134,237 | 156,701 | 1175,806 |
Total Scope 3 emissions - (tonnes CO2-e)15 | 62,242 | 65,783 | 68,830 | 63,347 | 68,484 |
Paper consumption - Aust and NZ (tonnes)16 | 1,812 | 2,161 | 2,706 | 3,304 | 4,857 |
Sustainable lending and investment | | | | | |
Climate change solutions attributable financing - Aust and NZ ($m) | 9,263 | 9,113 | 6,979 | 6,193 | 6,054 |
Proportion of electricity generation financing in renewables including hydro - Aust and NZ (%)17 | 75 | 71 | 65 | 59 | 61 |
Electricity generation portfolio emissions intensity (tonnes CO2-e/MWh)18 | 0.26 | 0.28 | 0.36 | 0.38 | 0.38 |
Finance assessed under the Equator Principles - Group ($m)19 | 454 | 773 | 891 | 617 | 1,065 |
Social impact | | | | | |
Community investment excluding commercial sponsorship ($m)20 | 130 | 128 | 164 | 148 | 149 |
Community investment as a percentage of pre-tax profits - Group (%)20 | 1.33 | 1.09 | 1.42 | 1.39 | 1.30 |
Community investment as a percentage of pre-tax operating profit (cash earnings basis)20 | 1.32 | 1.10 | 1.41 | 1.32 | 1.33 |
Financial education (participants)21 | 619,995 | 133,844 | 112,263 | 59,596 | 65,538 |
Supply chain | | | | | |
Number of suppliers assessed against Responsible Sourcing Code of Conduct | 98 | 100 | 31 | - | - |
Spend with Indigenous Australian suppliers - Australia ($m)22 | 3.6 | 3.8 | 2.8 | 1.7 | 1.2 |
1. All data represents Group performance as at 30 September unless otherwise stated.
2. All customers with an active relationship (exclude channel only and potential relationships).
3. Unique customers who have successfully authenticated (including Quickzone) into the digital banking platforms within 90 days. Figures prior to 2016 are not comparable.
4. Include six advisory centres and one community banking centre.
5. Branches that allow customers to self-serve 24/7 via a range of devices that allow them to withdraw and deposit cash, coin exchange etc. (not all these services would be available at every 24/7 zone). Access determined by individual location (i.e. shopping centre opening hours may prevent 24/7 access).
6. ATMs with deposit taking functionality. Excludes old style envelope deposit machines.
7. Change in trend reflects updates to our complaints policy and standard which now requires people to log all complaints, even if they are resolved within 5 days.
8. Full-time equivalent employees include permanent (full-time and pro-rata part-time staff) employees, and temporary (overtime, temporary and contract staff) employees.
9. Employee voluntary attrition refers to the total voluntary separation of permanent employees over the 12 months average total permanent headcount for the period (includes full time, part time and maximum term employees).
10. New starter retention over the 12 months rolling new starter headcount for the period (includes full time and part time permanent employees).
11. New monthly employee survey conducted from 2017. Six month rolling average results reported and prior data not included due to change in survey methodology.
150 | 2019 Westpac Group Annual Report | |
| | |
Westpac's approach to sustainability
12. Lost Time Injury Frequency Rate (LTIFR) measures the number of Lost Time Injuries, defined as injuries or illnesses (based on workers compensation claims accepted) resulting in an employee being unable to work for a full scheduled day (or shift) other than the day (or shift) on which the injury occurred where work was a significant contributing factor, per one million hours worked in the rolling 12 months reported. Westpac Pacific figures included since FY16.
13. Women in Leadership refers to the proportion of women (permanent and maximum term) in leadership roles across the Group. It includes the CEO, Group Executives, General Managers, senior leaders with significant influence on business outcomes (direct reports to General Managers and their direct reports) large (3+) team people leaders three levels below General Manager, and Bank and Assistant Bank Managers.
14. Scope 1 emissions are the release of greenhouse gases into the atmosphere as a direct result of the Westpac Group banking operations. Scope 2 emissions are indirect greenhouse gas emissions from consumption of purchased electricity from the Westpacing operations. Australian data is prepared in accordance with the NGER Act 2007. New Zealand data is prepared in accordance with the guidance for Voluntary Corporate Greenhouse Gas Reporting published by the New Zealand Ministry for the Environment. These definitions also align with the GHG protocol and ISO 14064- 1 standard and are reported for the period 1 July to 30 June. Prior comparison periods adjusted to reflect Group numbers.
15. Scope 3 emissions are greenhouse gases emitted as a consequence of Westpac Group banking operations but by another facility. Australian data is prepared in accordance with the National Carbon Offset Standard. New Zealand data is prepared in accordance with the New Zealand Ministry for the Environment for GHG reporting. These definitions also align with the GHG protocol and ISO 14064-1 standard and are reported for the period 1 July to 30 June. Prior comparison periods adjusted to reflect Group numbers.
16. Total office paper and paper products purchased (in tonnes) by Westpac Group as reported by key suppliers. Includes office copy paper, paper products and printed materials, including direct mail and marketing documents (e.g. office stationery, marketing brochures, customer statements) and are reported for the period 1 July to 30 June.
17. Measured as the percentage of indirect and direct financing (total committed exposure) to energy generation assets in the Australian and New Zealand electricity markets.
18. Data is based on the reported exposures to energy generation (AUD lending only). The average financed emissions intensity is calculated by weighting each loan (total committed exposures) by the emissions intensity of each company.
19. The Equator Principles is a voluntary set of standards for determining, assessing and managing social and environmental risk in project financing.
20. Indicator name changed from ‘Community investment ($m)’ to ‘Community investment excluding commercial sponsorships ($m)’ in 2018. 2017 figures were restated to be comparable with 2018. 2018 and 2017 figures include monetary contributions, time contributions, management costs and in-kind contributions comprising gifts and foregone fee revenue. 2016 and prior periods were not restated, and also include commercial sponsorships.
21. Total number of interactions by employees, customers and general public with financial education materials offered by the Westpac Group during the year, delivered through face to face and online platforms. Uplift in 2019 number of participants driven by the inclusion of our Life Moments and Help for your Business Education pages.
22. Annual spend with businesses that are 50% or more owned and operated by an Aboriginal or Torres Strait Islander person and certified with a relevant member organisation. Include Tiers 1 and 2 spend with Indigenous Australians suppliers. Prior periods restated to reflect inclusion of Tier 2 spend, first reported in 2018.
| 2019 Westpac Group Annual Report | 151 |
| | |
Other Westpac business information
Employees
The number of employees in each area of business as at 30 September:
| 2019 | 2018 | 2017 |
Consumer | 10,510 | 11,015 | 10,855 |
Business | 5,081 | 5,103 | 5,258 |
Westpac Institutional Bank | 2,434 | 2,646 | 2,725 |
Westpac New Zealand | 4,140 | 4,182 | 4,328 |
Group Businesses | 11,123 | 12,083 | 11,930 |
Total Group1 | 33,288 | 35,029 | 35,096 |
2019 v 2018
FTE decreased 1,741 or 5% compared to 2018. Delivery of productivity initiatives including organisation simplification and channel optimisation, the exit of the Advice business more than offset additional resources required for regulatory, compliance and customer remediation related activities.
2018 v 2017
FTE decreased 67 over the year. Delivery of productivity initiatives accelerated in the last quarter, more than offsetting the additional resources required for regulatory and compliance related activities and the Group’s investment programs across the year.
Property
We occupy premises primarily in Australia and New Zealand including 1,143 branches (2018: 1,204) as at 30 September 2019. As at 30 September 2019, we owned approximately 0.7% (2018: 1.5%) of the premises we occupied in Australia and none (2018: none) in New Zealand. The remainder of premises are held under commercial lease with terms generally averaging three to five years. As at 30 September 2019, the carrying value of our directly owned premises and sites was $78 million (2018: $89 million).
Westpac Place in the Sydney CBD is the Group’s head office. In December 2015, an Agreement for Lease was executed for 275 Kent Street, allowing for Westpac’s continued occupation of levels 1-23 until 2030 and levels 24-32 until 2024. This site is currently undergoing a refurbishment program and will have the capacity for over 6,000 staff in an agile environment upon its completion.
Westpac also occupies levels 1-28 of T2 in International Towers Sydney with a lease running until 2030. This site has a capacity for over 6,000 personnel in an agile environment.
We continue a corporate presence in Kogarah, in the Sydney metro area, which is a key corporate office of St.George, with a 2,400 seat capacity. A lease commitment at this site extends to 2034 with options to extend.
In Melbourne, Westpac has occupied the majority of 150 Collins Street since October 2015 with a lease term that extends to 2026. This was Westpac’s first fully agile workspace environment with over 1,000 staff now occupying our new Melbourne Head Office.
Westpac on Takutai Square is Westpac New Zealand’s head office, located at the eastern end of Britomart Precinct near Customs Street in Auckland, contains 21,903 square metres of office space across two buildings. Lease commitment at this site extends to 2031, with two six-year options to extend on each lease.
1. Total employees include full-time, pro-rata part time, overtime, temporary and contract staff.
152 | 2019 Westpac Group Annual Report | |
| | |
Other Westpac business information
Significant long term agreements
Westpac has no individual contracts, other than contracts entered into in the ordinary course of business, that would constitute a material contract.
Related party disclosures
Details of our related party disclosures are set out in Note 36 to the financial statements and details of Directors’ interests in securities are set out in the Remuneration Report included in the Directors’ Report.
Other than as disclosed in Note 36 to the financial statements and the Remuneration Report, if applicable, loans made to parties related to Directors and other key management personnel of Westpac are made in the ordinary course of business on normal terms and conditions (including interest rates and collateral). Loans are made on the same terms and conditions (including interest rates and collateral) as they apply to other employees and certain customers in accordance with established policy. These loans do not involve more than the normal risk of collectability or present any other unfavourable features.
Auditor’s remuneration
Auditor’s remuneration, including goods and services tax, to the external auditor for the years ended 30 September 2019 and 2018 is provided in Note 35 to the financial statements.
Audit related services
Westpac Group Secretariat monitors the application of the pre-approval process in respect of audit, audit-related and non-audit services provided by PricewaterhouseCoopers (PwC) and promptly brings to the attention of the BAC any exceptions that need to be approved pursuant to paragraph (c)(7)(i)(C) of Rule 2-01 of Regulation S-X. The pre-approval guidelines are communicated to Westpac’s divisions through publication on the Westpac intranet.
During the year ended 30 September 2019, there were no fees paid by Westpac to PwC that required approval by the BAC pursuant to paragraph (c)(7)(i)(C) of Rule 2-01 of Regulation S-X.
| 2019 Westpac Group Annual Report | 153 |
| | |
Financial statements | |
Income statements | |
Statements of comprehensive income Balance sheets | |
Statements of changes in equity Cash flow statements | |
| | |
Note 1 | Financial statements preparation | |
| | |
Financial performance | |
Note 2 | Segment reporting | |
Note 3 | Net interest income | |
Note 4 | Non-interest income | |
Note 5 | Operating expenses | |
Note 6 | Impairment charges | |
Note 7 | Income tax | |
Note 8 | Earnings per share | |
Note 9 | Average balance sheet and interest rates | |
| | |
Financial assets and financial liabilities | |
Note 10 | Trading securities and financial assets measured at fair value through income statement | |
Note 11 | Available-for-sale securities / Investment securities | |
Note 12 | Loans | |
Note 13 | Provisions for expected credit losses / impairment charges | |
Note 14 | Other financial assets | |
Note 15 | Life insurance assets and life insurance liabilities | |
Note 16 | Deposits and other borrowings | |
Note 17 | Other financial liabilities | |
Note 18 | Debt issues | |
Note 19 | Loan capital | |
Note 20 | Derivative financial instruments | |
Note 21 | Financial risk | |
Note 22 | Fair values of financial assets and financial liabilities | |
Note 23 | Offsetting financial assets and financial liabilities | |
Note 24 | Securitisation, covered bonds and other transferred assets | |
| | |
| | |
| | |
Intangible assets, provisions, commitments and contingencies | |
Note 25 | Intangible assets | |
Note 26 | Operating lease commitments | |
Note 27 | Provisions, contingent liabilities, contingent assets and credit commitments | |
| | |
Capital and dividends | |
Note 28 | Shareholders’ equity | |
Note 29 | Capital adequacy | |
Note 30 | Dividends | |
| | |
Group structure | |
Note 31 | Investments in subsidiaries and associates | |
Note 32 | Structured entities | |
| | |
Other | |
Note 33 | Share-based payments | |
Note 34 | Superannuation commitments | |
Note 35 | Auditor’s remuneration | |
Note 36 | Related party disclosures | |
Note 37 | Notes to the cash flow statements | |
Note 38 | Subsequent events | |
Note 39 | Accounting policies relating to prior years | |
| | |
Statutory statements | |
Directors’ declaration | |
Management’s report on internal control over financial reporting Independent auditor’s report to the members of Westpac Banking Corporation | |
Report of independent registered public accounting firm | |
154 | 2019 Westpac Group Annual Report | |
| | |
Financial statements
Income statements1 for the years ended 30 September
Westpac Banking Corporation
| | | | Consolidated | | Parent Entity | |
$m | | Note | | 2019 | | 2018 | | 2017 | | 2019 | | 2018 | |
Interest income: | | | | | | | | | | | | | |
Calculated using the effective interest rate method | | 3 | | 32,518 | | 31,987 | | 30,614 | | 32,736 | | 32,190 | |
Other | | 3 | | 704 | | 584 | | 618 | | 776 | | 640 | |
Total interest income | | | | 33,222 | | 32,571 | | 31,232 | | 33,512 | | 32,830 | |
Interest expense | | 3 | | (16,315 | ) | (16,066 | ) | (15,716 | ) | (19,295 | ) | (18,977 | ) |
Net interest income | | | | 16,907 | | 16,505 | | 15,516 | | 14,217 | | 13,853 | |
Net fee income | | 4 | | 1,655 | | 2,424 | | 2,603 | | 922 | | 2,172 | |
Net wealth management and insurance income | | 4 | | 1,029 | | 2,061 | | 1,800 | | - | | - | |
Trading income | | 4 | | 929 | | 945 | | 1,202 | | 956 | | 919 | |
Other income | | 4 | | 129 | | 72 | | 529 | | 2,684 | | 2,633 | |
Net operating income before operating expenses and impairment charges | | | | 20,649 | | 22,007 | | 21,650 | | 18,779 | | 19,577 | |
Operating expenses | | 5 | | (10,106 | ) | (9,566 | ) | (9,282 | ) | (8,631 | ) | (8,000 | ) |
Impairment charges | | 6 | | (794 | ) | (710 | ) | (853 | ) | (750 | ) | (682 | ) |
Profit before income tax | | | | 9,749 | | 11,731 | | 11,515 | | 9,398 | | 10,895 | |
Income tax expense | | 7 | | (2,959 | ) | (3,632 | ) | (3,518 | ) | (2,277 | ) | (2,751 | ) |
Net profit for the year | | | | 6,790 | | 8,099 | | 7,997 | | 7,121 | | 8,144 | |
Net profit attributable to non-controlling interests | | | | (6 | ) | (4 | ) | (7 | ) | - | | - | |
Net profit attributable to owners of Westpac Banking Corporation | | | | 6,784 | | 8,095 | | 7,990 | | 7,121 | | 8,144 | |
Earnings per share (cents) | | | | | | | | | | | | | |
Basic | | 8 | | 196.5 | | 237.5 | | 238.0 | | | | | |
Diluted | | 8 | | 189.5 | | 230.1 | | 229.3 | | | | | |
The above income statements should be read in conjunction with the accompanying notes.
1. The Group has adopted AASB 9 and AASB 15 from 1 October 2018. Comparatives have not been restated. In addition, the Group has made a number of presentational changes to the Balance Sheet and Income Statement. Comparatives have been restated. Refer to Note 1 for further detail.
| 2019 Westpac Group Annual Report | 155 |
| | |
Financial statements
Statements of comprehensive income1 for the years ended 30 September
Westpac Banking Corporation
| | Consolidated | | Parent Entity | |
$m | | 2019 | | 2018 | | 2017 | | 2019 | | 2018 | |
Net profit for the year | | 6,790 | | 8,099 | | 7,997 | | 7,121 | | 8,144 | |
Other comprehensive income | | | | | | | | | | | |
Items that may be reclassified subsequently to profit or loss | | | | | | | | | | | |
Gains/(losses) recognised in equity on: | | | | | | | | | | | |
Available-for-sale securities | | - | | (102 | ) | 75 | | - | | (32 | ) |
Debt securities measured at fair value through other comprehensive income (FVOCI) | | (46 | ) | - | | - | | (39 | ) | - | |
Cash flow hedging instruments | | (203 | ) | (161 | ) | (91 | ) | (121 | ) | (125 | ) |
Share of associates’ other comprehensive income (net of tax) | | - | | - | | 3 | | - | | - | |
Transferred to income statements: | | | | | | | | | | | |
Available-for-sale securities | | - | | 66 | | (3 | ) | - | | (33 | ) |
Debt securities measured at FVOCI | | (29 | ) | - | | - | | (29 | ) | - | |
Cash flow hedging instruments | | 197 | | 203 | | 115 | | 128 | | 160 | |
Foreign currency translation reserve | | (10 | ) | (3 | ) | - | | - | | - | |
Share of associates’ other comprehensive income (net of tax) | | - | | - | | 9 | | - | | - | |
Exchange differences on translation of foreign operations (net of associated hedges) | | 182 | | 181 | | (116 | ) | 162 | | 174 | |
Income tax on items taken to or transferred from equity: | | | | | | | | | | | |
Available-for-sale securities reserve | | - | | 9 | | (18 | ) | - | | 19 | |
Debt instruments measured at FVOCI | | 20 | | - | | - | | 18 | | - | |
Cash flow hedge reserve | | 2 | | (13 | ) | (6 | ) | (3 | ) | (10 | ) |
Items that will not be reclassified subsequently to profit or loss | | | | | | | | | | | |
Gains/(losses) on equity instruments measured at FVOCI | | 11 | | - | | - | | (2 | ) | - | |
Own credit adjustment on financial liabilities measured at fair value (net of tax) | | (10 | ) | 43 | | (164 | ) | (10 | ) | 43 | |
Remeasurement of defined benefit obligation | | (276 | ) | 45 | | 190 | | (268 | ) | 47 | |
Other comprehensive income for the year (net of tax) | | (162 | ) | 268 | | (6 | ) | (164 | ) | 243 | |
Total comprehensive income for the year | | 6,628 | | 8,367 | | 7,991 | | 6,957 | | 8,387 | |
Attributable to: | | | | | | | | | | | |
Owners of Westpac Banking Corporation | | 6,620 | | 8,363 | | 7,984 | | 6,957 | | 8,387 | |
Non-controlling interests | | 8 | | 4 | | 7 | | - | | - | |
Total comprehensive income for the year | | 6,628 | | 8,367 | | 7,991 | | 6,957 | | 8,387 | |
The above statements of comprehensive income should be read in conjunction with the accompanying notes.
1. The Group has adopted AASB 9 and AASB 15 from 1 October 2018. Comparatives have not been restated. In addition, the Group has made a number of presentational changes to the Balance Sheet and Income Statement. Comparatives have been restated. Refer to Note 1 for further detail.
156 | 2019 Westpac Group Annual Report | |
| | |
Financial statements
Balance Sheets1 as at 30 September
Westpac Banking Corporation
| | | | Consolidated | | Parent Entity | |
$m | | Note | | 2019 | | 2018 | | 2019 | | 2018 | |
Assets | | | | | | | | | | | |
Cash and balances with central banks | | | | 20,059 | | 26,788 | | 17,692 | | 24,976 | |
Collateral paid | | | | 5,930 | | 4,787 | | 5,773 | | 4,722 | |
Trading securities and financial assets measured at fair value through income statement (FVIS) | | 10 | | 31,781 | | 23,132 | | 29,565 | | 21,415 | |
Derivative financial instruments | | 20 | | 29,859 | | 24,101 | | 29,283 | | 23,562 | |
Available-for-sale securities | | 11 | | - | | 61,119 | | - | | 56,513 | |
Investment securities | | 11 | | 73,401 | | - | | 68,398 | | - | |
Loans | | 12 | | 714,770 | | 709,690 | | 631,936 | | 630,168 | |
Other financial assets | | 14 | | 5,367 | | 5,517 | | 4,615 | | 4,666 | |
Life insurance assets | | 15 | | 9,367 | | 9,450 | | - | | - | |
Due from subsidiaries | | | | - | | - | | 142,961 | | 140,597 | |
Investment in subsidiaries | | | | - | | - | | 6,436 | | 4,508 | |
Investment in associates | | 31 | | 129 | | 115 | | 100 | | 76 | |
Property and equipment | | | | 1,155 | | 1,329 | | 948 | | 1,120 | |
Deferred tax assets | | 7 | | 2,048 | | 1,180 | | 1,925 | | 1,102 | |
Intangible assets | | 25 | | 11,953 | | 11,763 | | 9,687 | | 9,494 | |
Other assets | | | | 807 | | 621 | | 420 | | 311 | |
Total assets | | | | 906,626 | | 879,592 | | 949,739 | | 923,230 | |
Liabilities | | | | | | | | | | | |
Collateral received | | | | 3,287 | | 2,184 | | 2,849 | | 1,748 | |
Deposits and other borrowings | | 16 | | 563,247 | | 559,285 | | 501,430 | | 500,468 | |
Other financial liabilities | | 17 | | 29,215 | | 28,105 | | 28,516 | | 27,266 | |
Derivative financial instruments | | 20 | | 29,096 | | 24,407 | | 28,867 | | 24,229 | |
Debt issues | | 18 | | 181,457 | | 172,596 | | 156,674 | | 152,288 | |
Current tax liabilities | | | | 163 | | 296 | | 88 | | 184 | |
Life insurance liabilities | | 15 | | 7,377 | | 7,597 | | - | | - | |
Due to subsidiaries | | | | - | | - | | 148,607 | | 142,400 | |
Provisions | | 27 | | 3,169 | | 1,928 | | 2,980 | | 1,766 | |
Deferred tax liabilities | | 7 | | 44 | | 18 | | - | | 3 | |
Other liabilities | | | | 2,238 | | 1,338 | | 1,064 | | 257 | |
Total liabilities excluding loan capital | | | | 819,293 | | 797,754 | | 871,075 | | 850,609 | |
Loan capital | | 19 | | 21,826 | | 17,265 | | 21,826 | | 17,265 | |
Total liabilities | | | | 841,119 | | 815,019 | | 892,901 | | 867,874 | |
Net assets | | | | 65,507 | | 64,573 | | 56,838 | | 55,356 | |
Shareholders’ equity | | | | | | | | | | | |
Share capital: | | | | | | | | | | | |
Ordinary share capital | | 28 | | 37,508 | | 36,054 | | 37,508 | | 36,054 | |
Treasury shares and Restricted Share Plan (RSP) treasury shares | | 28 | | (553 | ) | (493 | ) | (575 | ) | (508 | ) |
Reserves | | 28 | | 1,311 | | 1,077 | | 1,338 | | 1,114 | |
Retained profits | | | | 27,188 | | 27,883 | | 18,567 | | 18,696 | |
Total equity attributable to owners of Westpac Banking Corporation | | | | 65,454 | | 64,521 | | 56,838 | | 55,356 | |
Non-controlling interests | | 28 | | 53 | | 52 | | - | | - | |
Total shareholders’ equity and non-controlling interests | | | | 65,507 | | 64,573 | | 56,838 | | 55,356 | |
The above balance sheets should be read in conjunction with the accompanying notes.
1. The Group has adopted AASB 9 and AASB 15 from 1 October 2018. Comparatives have not been restated. In addition, the Group has made a number of presentational changes to the Balance Sheet and Income Statement. Comparatives have been restated. Refer to Note 1 for further detail.
| 2019 Westpac Group Annual Report | 157 |
| | |
Financial statements
Statements of changes in equity1 for the years ended 30 September
Westpac Banking Corporation
Consolidated
$m | | Share capital
(Note 28) | | Reserves
(Note 28) | | Retained
profits | | Total equity
attributable
to owners
of Westpac
Banking
Corporation | | Non-
controlling
interests
(Note 28) | | Total
shareholders’
equity
and non-
controlling
interests | |
Balance at 1 October 2016 | | 33,014 | | 727 | | 24,379 | | 58,120 | | 61 | | 58,181 | |
Net profit for the year | | - | | - | | 7,990 | | 7,990 | | 7 | | 7,997 | |
Net other comprehensive income for the year | | - | | (32 | ) | 26 | | (6 | ) | - | | (6 | ) |
Total comprehensive income for the year | | - | | (32 | ) | 8,016 | | 7,984 | | 7 | | 7,991 | |
Transactions in capacity as equity holders | | | | | | | | | | | | | |
Dividends on ordinary shares2 | | - | | - | | (6,291 | ) | (6,291 | ) | - | | (6,291 | ) |
Dividend reinvestment plan | | 1,452 | | - | | - | | 1,452 | | - | | 1,452 | |
Other equity movements | | | | | | | | | | | | | |
Share-based payment arrangements | | - | | 98 | | - | | 98 | | - | | 98 | |
Exercise of employee share options and rights | | 11 | | - | | - | | 11 | | - | | 11 | |
Purchase of shares (net of issue costs) | | (43 | ) | - | | - | | (43 | ) | - | | (43 | ) |
Net (acquisition)/disposal of treasury shares | | (40 | ) | - | | - | | (40 | ) | - | | (40 | ) |
Other | | - | | 1 | | (4 | ) | (3 | ) | (14 | ) | (17 | ) |
Total contributions and distributions | | 1,380 | | 99 | | (6,295 | ) | (4,816 | ) | (14 | ) | (4,830 | ) |
Balance at 30 September 2017 | | 34,394 | | 794 | | 26,100 | | 61,288 | | 54 | | 61,342 | |
Net profit for the year | | - | | - | | 8,095 | | 8,095 | | 4 | | 8,099 | |
Net other comprehensive income for the year | | - | | 180 | | 88 | | 268 | | - | | 268 | |
Total comprehensive income for the year | | - | | 180 | | 8,183 | | 8,363 | | 4 | | 8,367 | |
Transactions in capacity as equity holders | | | | | | | | | | | | | |
Dividends on ordinary shares2 | | - | | - | | (6,400 | ) | (6,400 | ) | - | | (6,400 | ) |
Dividend reinvestment plan | | 631 | | - | | - | | 631 | | - | | 631 | |
Conversion of Convertible Preference Shares | | 566 | | - | | - | | 566 | | - | | 566 | |
Other equity movements | | | | | | | | | | | | | |
Share-based payment arrangements | | - | | 103 | | - | | 103 | | - | | 103 | |
Exercise of employee share options and rights | | 3 | | - | | - | | 3 | | - | | 3 | |
Purchase of shares (net of issue costs) | | (35 | ) | - | | - | | (35 | ) | - | | (35 | ) |
Net (acquisition)/disposal of treasury shares | | 2 | | - | | - | | 2 | | - | | 2 | |
Other | | - | | - | | - | | - | | (6 | ) | (6 | ) |
Total contributions and distributions | | 1,167 | | 103 | | (6,400 | ) | (5,130 | ) | (6 | ) | (5,136 | ) |
Balance at 30 September 2018 | | 35,561 | | 1,077 | | 27,883 | | 64,521 | | 52 | | 64,573 | |
Impact on adoption of new accounting standards1 | | - | | 2 | | (727 | ) | (725 | ) | - | | (725 | ) |
Restated opening balance | | 35,561 | | 1,079 | | 27,156 | | 63,796 | | 52 | | 63,848 | |
Net profit for the year | | - | | - | | 6,784 | | 6,784 | | 6 | | 6,790 | |
Net other comprehensive income for the year | | - | | 122 | | (286 | ) | (164 | ) | 2 | | (162 | ) |
Total comprehensive income for the year | | - | | 122 | | 6,498 | | 6,620 | | 8 | | 6,628 | |
Transactions in capacity as equity holders | | | | | | | | | | | | | |
Dividends on ordinary shares2 | | - | | - | | (6,466 | ) | (6,466 | ) | - | | (6,466 | ) |
Dividend reinvestment plan | | 1,489 | | - | | - | | 1,489 | | - | | 1,489 | |
Other equity movements | | | | | | | | | | | | | |
Share-based payment arrangements | | - | | 108 | | - | | 108 | | - | | 108 | |
Purchase of shares (net of issue costs) | | (33 | ) | - | | - | | (33 | ) | - | | (33 | ) |
Net (acquisition)/disposal of treasury shares | | (62 | ) | - | | - | | (62 | ) | - | | (62 | ) |
Other | | - | | 2 | | - | | 2 | | (7 | ) | (5 | ) |
Total contributions and distributions | | 1,394 | | 110 | | (6,466 | ) | (4,962 | ) | (7 | ) | (4,969 | ) |
Balance at 30 September 2019 | | 36,955 | | 1,311 | | 27,188 | | 65,454 | | 53 | | 65,507 | |
The above statements of changes in equity should be read in conjunction with the accompanying notes.
1. The Group has adopted AASB 9 and AASB 15 from 1 October 2018. Comparatives have not been restated. In addition, the Group has made a number of presentational changes to the Balance Sheet and Income Statement. Comparatives have been restated. Refer to Note 1 for further detail.
2. 2019 comprises 2019 interim dividend 94 cents per share ($3,239 million) and 2018 final dividend 94 cents per share ($3,227 million) (2018: 2018 interim dividend 94 cents per share ($3,213 million) and 2017 final dividend 94 cents per share ($3,187 million), 2017: 2017 interim dividend 94 cents per share ($3,150 million) and 2016 final dividend 94 cents per share ($3,141 million)), all fully franked at 30%.
158 | 2019 Westpac Group Annual Report | |
| | |
Financial statements
Statements of changes in equity1 for the years ended 30 September (continued)
Westpac Banking Corporation
Parent Entity
$m | | Share
capital
(Note 28) | | Reserves
(Note 28) | | Retained
profits | | Total equity
attributable
to owners
of Westpac
Banking
Corporation | |
Balance at 1 October 2017 | | 34,452 | | 858 | | 16,871 | | 52,181 | |
Net profit for the year | | - | | - | | 8,144 | | 8,144 | |
Net other comprehensive income for the year | | - | | 153 | | 90 | | 243 | |
Total comprehensive income for the year | | - | | 153 | | 8,234 | | 8,387 | |
Transactions in capacity as equity holders | | | | | | | | | |
Dividends on ordinary shares2 | | - | | - | | (6,409 | ) | (6,409 | ) |
Dividend reinvestment plan | | 631 | | - | | - | | 631 | |
Conversion of Convertible Preference Shares | | 566 | | - | | - | | 566 | |
Other equity movements | | | | | | | | | |
Share-based payment arrangements | | - | | 103 | | - | | 103 | |
Exercise of employee share options and rights | | 3 | | - | | - | | 3 | |
Purchase of shares (net of issue costs) | | (35 | ) | - | | - | | (35 | ) |
Net (acquisition)/disposal of treasury shares | | (71 | ) | - | | - | | (71 | ) |
Total contributions and distributions | | 1,094 | | 103 | | (6,409 | ) | (5,212 | ) |
Balance at 30 September 2018 | | 35,546 | | 1,114 | | 18,696 | | 55,356 | |
Impact on adoption of new accounting standards | | - | | 2 | | (502 | ) | (500 | ) |
Restated opening balance | | 35,546 | | 1,116 | | 18,194 | | 54,856 | |
Net profit for the year | | - | | - | | 7,121 | | 7,121 | |
Net other comprehensive income for the year | | - | | 114 | | (278 | ) | (164 | ) |
Total comprehensive income for the year | | - | | 114 | | 6,843 | | 6,957 | |
Transactions in capacity as equity holders | | | | | | | | | |
Dividends on ordinary shares2 | | - | | - | | (6,470 | ) | (6,470 | ) |
Dividend reinvestment plan | | 1,489 | | - | | - | | 1,489 | |
Other equity movements | | | | | | | | | |
Share based payment arrangements | | - | | 108 | | - | | 108 | |
Purchase of shares (net of issue costs) | | (33 | ) | - | | - | | (33 | ) |
Net (acquisition)/disposal of treasury shares | | (69 | ) | - | | - | | (69 | ) |
Total contributions and distributions | | 1,387 | | 108 | | (6,470 | ) | (4,975 | ) |
Balance at 30 September 2019 | | 36,933 | | 1,338 | | 18,567 | | 56,838 | |
The above statements of changes in equity should be read in conjunction with the accompanying notes.
1. The Group has adopted AASB 9 and AASB 15 from 1 October 2018. Comparatives have not been restated. In addition, the Group has made a number of presentational changes to the Balance Sheet and Income Statement. Comparatives have been restated. Refer to Note 1 for further detail.
2. 2019 comprises 2019 interim dividend 94 cents per share ($3,241 million) and 2018 final dividend 94 cents per share ($3,229 million) (2018: 2018 interim dividend 94 cents per share ($3,218 million) and 2017 final dividend 94 cents per share ($3,191 million)), all fully franked at 30%.
| 2019 Westpac Group Annual Report | 159 |
| | |
Financial statements
Cash flow statements1 for the years ended 30 September
Westpac Banking Corporation
| | | | Consolidated | | Parent Entity | |
$m | | Note | | 2019 | | 2018 | | 2017 | | 2019 | | 2018 | |
Cash flows from operating activities | | | | | | | | | | | | | |
Interest received | | | | 33,093 | | 32,639 | | 31,133 | | 33,770 | | 32,947 | |
Interest paid | | | | (16,486 | ) | (15,789 | ) | (15,415 | ) | (19,444 | ) | (18,728 | ) |
Dividends received excluding life business | | | | 6 | | 9 | | 27 | | 2,218 | | 2,016 | |
Other non-interest income received | | | | 3,865 | | 4,995 | | 4,926 | | 2,982 | | 3,832 | |
Operating expenses paid | | | | (9,080 | ) | (7,889 | ) | (7,828 | ) | (7,491 | ) | (6,543 | ) |
Income tax paid excluding life business | | | | (3,406 | ) | (3,585 | ) | (3,388 | ) | (3,081 | ) | (3,349 | ) |
Life business: | | | | | | | | | | | | | |
Receipts from policyholders and customers | | | | 2,189 | | 2,008 | | 2,239 | | - | | - | |
Interest and other items of similar nature | | | | 6 | | 17 | | 24 | | - | | - | |
Dividends received | | | | 553 | | 642 | | 433 | | - | | - | |
Payments to policyholders and suppliers | | | | (2,250 | ) | (2,089 | ) | (1,861 | ) | - | | - | |
Income tax paid | | | | (94 | ) | (143 | ) | (164 | ) | - | | - | |
Cash flows from operating activities before changes in operating assets and liabilities | | | | 8,396 | | 10,815 | | 10,126 | | 8,954 | | 10,175 | |
Net (increase)/decrease in: | | | | | | | | | | | | | |
Collateral paid | | | | (847 | ) | 969 | | 2,320 | | (755 | ) | 662 | |
Trading securities and financial assets measured at FVIS | | | | (7,629 | ) | 3,492 | | (4,729 | ) | (7,358 | ) | 2,815 | |
Derivative financial instruments | | | | 7,605 | | 8,584 | | (5,042 | ) | 6,581 | | 8,263 | |
Loans | | | | (4,188 | ) | (24,740 | ) | (26,815 | ) | (3,312 | ) | (23,661 | ) |
Other financial assets | | | | 336 | | 859 | | 466 | | 324 | | 502 | |
Life insurance assets and liabilities | | | | (134 | ) | (230 | ) | 219 | | - | | - | |
Other assets | | | | (13 | ) | 10 | | 67 | | (41 | ) | 33 | |
Net increase/(decrease) in: | | | | | | | | | | | | | |
Collateral received | | | | 1,007 | | (295 | ) | 739 | | 1,004 | | (606 | ) |
Deposits and other borrowings | | | | 1,113 | | 23,928 | | 23,062 | | 963 | | 20,783 | |
Other financial liabilities | | | | 1,463 | | (3,632 | ) | 2,506 | | 1,555 | | (3,742 | ) |
Other liabilities | | | | (5 | ) | 10 | | (82 | ) | (24 | ) | 17 | |
Net cash provided by/(used in) operating activities | | 37 | | 7,104 | | 19,770 | | 2,837 | | 7,891 | | 15,241 | |
Cash flows from investing activities | | | | | | | | | | | | | |
Proceeds from available-for-sale securities | | | | - | | 23,878 | | 25,717 | | - | | 21,525 | |
Purchase of available-for-sale securities | | | | - | | (24,376 | ) | (27,028 | ) | - | | (22,230 | ) |
Proceeds from investment securities | | | | 19,768 | | - | | - | | 16,483 | | - | |
Purchase of investment securities | | | | (29,527 | ) | - | | - | | (25,719 | ) | - | |
Net movement in amounts due to/from controlled entities | | | | - | | - | | - | | 2,110 | | 923 | |
Proceeds/(payments) from disposal of controlled entities, net of cash disposed | | 37 | | (1 | ) | 9 | | - | | - | | - | |
Net (increase)/decrease in investments in controlled entities | | | | - | | - | | - | | 94 | | (577 | ) |
Proceeds from disposal of associates | | | | 45 | | - | | 630 | | - | | - | |
Purchase of associates | | | | (25 | ) | (30 | ) | (52 | ) | (24 | ) | (30 | ) |
Proceeds from disposal of property and equipment | | | | 157 | | 91 | | 65 | | 143 | | 62 | |
Purchase of property and equipment | | | | (280 | ) | (310 | ) | (264 | ) | (209 | ) | (251 | ) |
Purchase of intangible assets | | | | (906 | ) | (882 | ) | (766 | ) | (846 | ) | (823 | ) |
Net cash provided by/(used in) investing activities | | | | (10,769 | ) | (1,620 | ) | (1,698 | ) | (7,968 | ) | (1,401 | ) |
Cash flows from financing activities | | | | | | | | | | | | | |
Proceeds from debt issues (net of issue costs) | | | | 61,484 | | 59,456 | | 72,368 | | 50,375 | | 57,440 | |
Redemption of debt issues | | | | (63,313 | ) | (64,698 | ) | (69,119 | ) | (56,347 | ) | (58,005 | ) |
Issue of loan capital (net of issue costs) | | | | 4,935 | | 2,342 | | 4,437 | | 4,935 | | 2,342 | |
Redemption of loan capital | | | | (1,662 | ) | (2,387 | ) | (2,188 | ) | (1,662 | ) | (2,387 | ) |
Proceeds from exercise of employee options | | | | - | | 3 | | 11 | | - | | 3 | |
Purchase of shares on exercise of employee options and rights | | | | (6 | ) | (8 | ) | (17 | ) | (6 | ) | (8 | ) |
Shares purchased for delivery of employee share plan | | | | (27 | ) | (27 | ) | (27 | ) | (27 | ) | (27 | ) |
Purchase of RSP treasury shares | | | | (69 | ) | (71 | ) | (68 | ) | (69 | ) | (71 | ) |
Net sale/(purchase) of other treasury shares | | | | 7 | | 73 | | 7 | | - | | - | |
Payment of dividends | | | | (4,977 | ) | (5,769 | ) | (4,839 | ) | (4,981 | ) | (5,778 | ) |
Payment of distributions to non-controlling interests | | | | (5 | ) | (6 | ) | (13 | ) | - | | - | |
Net cash provided by/(used in) financing activities | | | | (3,633 | ) | (11,092 | ) | 552 | | (7,782 | ) | (6,491 | ) |
Net increase/(decrease) in cash and balances with central banks | | | | (7,298 | ) | 7,058 | | 1,691 | | (7,859 | ) | 7,349 | |
Effect of exchange rate changes on cash and balances with central banks | | | | 569 | | 944 | | (302 | ) | 575 | | 936 | |
Cash and balances with central banks as at the beginning of the year | | | | 26,788 | | 18,786 | | 17,397 | | 24,976 | | 16,691 | |
Cash and balances with central banks as at the end of the year | | | | 20,059 | | 26,788 | | 18,786 | | 17,692 | | 24,976 | |
The above cash flow statements should be read in conjunction with the accompanying notes.
1. The Group has adopted AASB 9 and AASB 15 from 1 October 2018. Comparatives have not been restated. In addition, the Group has made a number of presentational changes to the Balance Sheet and Income Statement. Comparatives have been restated. Refer to Note 1 for further detail.
160 | 2019 Westpac Group Annual Report | |
| | |
Notes to the financial statements
Note 1. Financial statements preparation
This financial report of Westpac Banking Corporation (the Parent Entity), together with its controlled entities (the Group or Westpac), for the year ended 30 September 2019, was authorised for issue by the Board of Directors on 4 November 2019. The Directors have the power to amend and reissue the financial report.
The principal accounting policies are set out below and in the relevant notes to the financial statements. The accounting policy for the recognition and derecognition of financial assets and financial liabilities precedes Note 10. These accounting policies provide details of the accounting treatments adopted for complex balances and where accounting standards provide policy choices. These policies have been consistently applied to all the years presented, unless otherwise stated.
a. Basis of preparation
(i) Basis of accounting
This financial report is a general purpose financial report prepared in accordance with:
· the requirements for an authorised deposit-taking institution under the Banking Act 1959 (as amended);
· Australian Accounting Standards (AAS) and Interpretations as issued by the Australian Accounting Standards Board (AASB); and
· the Corporations Act 2001.
Westpac Banking Corporation is a for-profit entity for the purposes of preparing this financial report.
The financial report also complies with International Financial Reporting Standards (IFRS) as issued by the International Accounting Standards Board (IASB) and Interpretations as issued by the IFRS Interpretations Committee (IFRIC). It also includes additional disclosures required for foreign registrants by the United States Securities and Exchange Commission (US SEC).
All amounts have been rounded in accordance with ASIC Corporations (Rounding in Financial/Directors’ Reports) Instrument 2016/191, to the nearest million dollars, unless otherwise stated.
(ii) Historical cost convention
The financial report has been prepared under the historical cost convention, as modified by applying fair value accounting to financial assets and financial liabilities (including derivative instruments) measured at fair value through income statement (FVIS) or in other comprehensive income (OCI).
(iii) Changes in accounting policies
Balance sheet
The following voluntary presentation changes to the balance sheet (and related notes) have been made to improve consistency and provide more relevant information to the users of the financial statements by reporting balances of a similar nature together in the same place in the balance sheet. These changes have no effect on the measurement of these items and therefore had no impact on retained earnings or net profit. These changes are:
· the addition of new balance sheet lines for ‘collateral paid’, ‘other financial assets’, ‘collateral received’ and ‘other financial liabilities’;
· removal of the balance sheet line ‘receivables due from other financial institutions’ and reclassification to ‘collateral paid’ and ‘other financial assets’;
· removal of the balance sheet line ‘regulatory deposits with central banks overseas’ and reclassification to ‘cash and balances with central banks’ and ‘trading securities and financial assets measured at FVIS;
· removal of the balance sheet line ‘payables due to other financial institutions’ and reclassification to ‘collateral received’ and ‘other financial liabilities’;
· reclassification of collateral balances with non-financial institutions from ‘other assets’ and ‘other liabilities’ to ‘collateral paid’ and ‘collateral received’ respectively;
· reclassification of financial assets or financial liabilities included in other assets or other liabilities respectively to other financial assets and other financial liabilities respectively; and
· reclassification of other financial liabilities at FVIS to other financial liabilities.
| 2019 Westpac Group Annual Report | 161 |
| | |
Notes to the financial statements
Note 1. Financial statements preparation (continued)
Collateral paid/collateral received includes cash provided to/received from counterparties as collateral over financial liabilities/assets arising from derivative contracts, stock borrowing arrangements and funding transactions. It includes initial and variation margin placed as security for derivative transactions.
Comparatives for 30 September 2018 have been restated for these voluntary presentation changes and are detailed as follows.
$m | | Reported | | Consolidated
Presentation
changes | | Restated | | Reported | | Parent Entity
Presentation
changes | | Restated | |
Assets | | | | | | | | | | | | | |
Cash and balances with central banks | | 26,431 | | 357 | | 26,788 | | 24,726 | | 250 | | 24,976 | |
Receivables due from other financial institutions | | 5,790 | | (5,790 | ) | - | | 5,711 | | (5,711 | ) | - | |
Collateral paid | | - | | 4,787 | | 4,787 | | - | | 4,722 | | 4,722 | |
Trading securities and financial assets | | | | | | | | | | | | | |
measured at FVIS | | 22,134 | | 998 | | 23,132 | | 20,417 | | 998 | | 21,415 | |
Regulatory deposits with central banks overseas | | 1,355 | | (1,355 | ) | - | | 1,248 | | (1,248 | ) | - | |
Other financial assets1 | | - | | 5,517 | | 5,517 | | - | | 4,666 | | 4,666 | |
Other assets | | 5,135 | | (4,514 | ) | 621 | | 3,988 | | (3,677 | ) | 311 | |
All other assets | | 818,747 | | - | | 818,747 | | 867,140 | | - | | 867,140 | |
Total assets | | 879,592 | | - | | 879,592 | | 923,230 | | - | | 923,230 | |
Liabilities | | | | | | | | | | | | | |
Payables due to other financial institutions | | 18,137 | | (18,137 | ) | - | | 17,682 | | (17,682 | ) | - | |
Collateral received | | - | | 2,184 | | 2,184 | | - | | 1,748 | | 1,748 | |
Other financial liabilities at FVIS | | 4,297 | | (4,297 | ) | - | | 4,297 | | (4,297 | ) | - | |
Other financial liabilities1 | | - | | 28,105 | | 28,105 | | - | | 27,266 | | 27,266 | |
Other liabilities | | 9,193 | | (7,855 | ) | 1,338 | | 7,292 | | (7,035 | ) | 257 | |
All other liabilities | | 783,392 | | - | | 783,392 | | 838,603 | | - | | 838,603 | |
Total liabilities | | 815,019 | | - | | 815,019 | | 867,874 | | - | | 867,874 | |
1. Refer to Note 14 and Note 17 for further information.
162 | 2019 Westpac Group Annual Report | |
| | |
Notes to the financial statements
Note 1. Financial statements preparation (continued)
Income statement
The following voluntary presentation changes to the income statement (and related notes) have been made to provide more relevant information to the users of the financial statements. These changes have no effect on the measurement of these items and therefore had no impact on retained earnings or net profit.
Net interest income
· The components of interest income and interest expense relating to the balance sheet reclassifications have been restated accordingly. Note that there was no net impact to total interest income, total interest expense or to net interest income. Comparatives have been restated for these voluntary presentation changes and are detailed in the following table.
· In addition, to comply with disclosure requirements, interest income calculated using the effective interest rate method has been presented separately from other interest income. For consistency, interest expense is presented in the same way. The details are provided in Note 3.
$m | | Reported | | Consolidated 2018
Presentation
changes | | Restated | | Reported | | Consolidated 2017
Presentation
changes | | Restated | | Reported | | Parent Entity 2018
Presentation
changes | | Restated | |
Note 3: Net interest income Interest income | | | | | | | | | | | | | | | | | | | |
Cash and balances with central banks | | 325 | | 1 | | 326 | | 241 | | 1 | | 242 | | 300 | | 1 | | 301 | |
Receivables due from other financial institutions | | 108 | | (108 | ) | - | | 110 | | (110 | ) | - | | 102 | | (102 | ) | - | |
Collateral paid | | - | | 129 | | 129 | | - | | 96 | | 96 | | - | | 126 | | 126 | |
Net ineffectiveness on qualifying hedges | | (18 | ) | - | | (18 | ) | (22 | ) | - | | (22 | ) | (22 | ) | - | | (22 | ) |
Trading securities and financial assets measured at FVIS | | 542 | | 22 | | 564 | | 558 | | 16 | | 574 | | 499 | | 22 | | 521 | |
Available-for-sale securities | | 1,914 | | - | | 1,914 | | 1,795 | | - | | 1,795 | | 1,743 | | - | | 1,743 | |
Investment securities | | - | | - | | - | | - | | - | | - | | - | | - | | - | |
Loans | | 29,621 | | - | | 29,621 | | 28,504 | | - | | 28,504 | | 25,801 | | - | | 25,801 | |
Regulatory deposits with central banks overseas | | 23 | | (23 | ) | - | | 17 | | (17 | ) | - | | 23 | | (23 | ) | - | |
Due from subsidiaries | | - | | - | | - | | - | | - | | - | | 4,328 | | - | | 4,328 | |
Other interest income | | 56 | | (21 | ) | 35 | | 29 | | 14 | | 43 | | 56 | | (24 | ) | 32 | |
Total interest income | | 32,571 | | - | | 32,571 | | 31,232 | | - | | 31,232 | | 32,830 | | - | | 32,830 | |
Interest expense | | | | | | | | | | | | | | | | | | | |
Payable due to other financial institutions | | (319 | ) | 319 | | - | | (279 | ) | 279 | | - | | (314 | ) | 314 | | - | |
Collateral received | | - | | (45 | ) | (45 | ) | - | | (19 | ) | (19 | ) | - | | (41 | ) | (41 | ) |
Deposits and other borrowings | | (9,021 | ) | - | | (9,021 | ) | (8,868 | ) | - | | (8,868 | ) | (7,817 | ) | - | | (7,817 | ) |
Trading liabilities | | (959 | ) | - | | (959 | ) | (2,065 | ) | - | | (2,065 | ) | (754 | ) | - | | (754 | ) |
Debt issues | | (4,480 | ) | - | | (4,480 | ) | (3,585 | ) | - | | (3,585 | ) | (3,958 | ) | - | | (3,958 | ) |
Due to subsidiaries | | - | | - | | - | | - | | - | | - | | (4,851 | ) | - | | (4,851 | ) |
Loan capital | | (774 | ) | - | | (774 | ) | (693 | ) | - | | (693 | ) | (774 | ) | - | | (774 | ) |
Bank levy | | (378 | ) | - | | (378 | ) | (95 | ) | - | | (95 | ) | (378 | ) | - | | (378 | ) |
Other interest expense | | (135 | ) | (274 | ) | (409 | ) | (131 | ) | (260 | ) | (391 | ) | (131 | ) | (273 | ) | (404 | ) |
Total interest expense | | (16,066 | ) | - | | (16,066 | ) | (15,716 | ) | - | | (15,716 | ) | (18,977 | ) | - | | (18,977 | ) |
Net interest income | | 16,505 | | - | | 16,505 | | 15,516 | | - | | 15,516 | | 13,853 | | - | | 13,853 | |
| 2019 Westpac Group Annual Report | 163 |
| | |
Notes to the financial statements
Note 1. Financial statements preparation (continued)
Non-interest income and operating expenses
· Disaggregating the non-interest income line on the income statement into four separate lines for net fee income, net wealth management and insurance income, trading income and other income.
· Separating net fee income in the non-interest income note into fee income and fee expenses.
· Reclassifying credit card loyalty program expense from operating expenses to the new fee expenses category in the non-interest income note.
Fee expenses include those expenses that are incremental external costs that vary directly with the provision of goods or services to customers (excluding expenses which would qualify as transaction costs relating to the issue, acquisition or disposal of a financial asset or a financial liability which are deferred and included in the effective interest rate and recognised in net interest income).
An incremental cost is one that would not have been incurred if a specific good or service had not been provided to a specific customer.
Comparatives have been restated for these voluntary presentation changes and are detailed in the following table.
$m | | Reported | | Consolidated 2018
Presentation
changes | | Restated | | Reported | | Consolidated 2017
Presentation
changes | | Restated | | Reported | | Parent Entity 2018
Presentation
changes | | Restated | |
Income statement | | | | | | | | | | | | | | | | | | | |
Net interest income | | 16,505 | | - | | 16,505 | | 15,516 | | - | | 15,516 | | 13,853 | | - | | 13,853 | |
Non-interest income | | 5,628 | | (5,628 | ) | - | | 6,286 | | (6,286 | ) | - | | 5,825 | | (5,825 | ) | - | |
Net fee income | | - | | 2,424 | | 2,424 | | - | | 2,603 | | 2,603 | | - | | 2,172 | | 2,172 | |
Net wealth management and insurance income | | - | | 2,061 | | 2,061 | | - | | 1,800 | | 1,800 | | - | | - | | - | |
Trading income | | - | | 945 | | 945 | | - | | 1,202 | | 1,202 | | - | | 919 | | 919 | |
Other income | | - | | 72 | | 72 | | - | | 529 | | 529 | | - | | 2,633 | | 2,633 | |
Net operating income before operating expenses and impairment charges | | 22,133 | | (126 | ) | 22,007 | | 21,802 | | (152 | ) | 21,650 | | 19,678 | | (101 | ) | 19,577 | |
Operating expenses | | (9,692 | ) | 126 | | (9,566 | ) | (9,434 | ) | 152 | | (9,282 | ) | (8,101 | ) | 101 | | (8,000 | ) |
Impairment charges | | (710 | ) | - | | (710 | ) | (853 | ) | - | | (853 | ) | (682 | ) | - | | (682 | ) |
Profit before income tax | | 11,731 | | - | | 11,731 | | 11,515 | | - | | 11,515 | | 10,895 | | - | | 10,895 | |
Income tax expense | | (3,632 | ) | - | | (3,632 | ) | (3,518 | ) | - | | (3,518 | ) | (2,751 | ) | - | | (2,751 | ) |
Net profit for the year | | 8,099 | | - | | 8,099 | | 7,997 | | - | | 7,997 | | 8,144 | | - | | 8,144 | |
Note 4: Non-interest income (extract) Net fee income | | | | | | | | | | | | | | | | | | | |
Facility fees | | 1,347 | | 18 | | 1,365 | | 1,333 | | 17 | | 1,350 | | 1,333 | | 18 | | 1,351 | |
Transaction fees | | 1,105 | | 77 | | 1,182 | | 1,193 | | 65 | | 1,258 | | 886 | | 53 | | 939 | |
Other non-risk fee income | | 98 | | - | | 98 | | 229 | | - | | 229 | | 54 | | - | | 54 | |
Fee income | | 2,550 | | 95 | | 2,645 | | 2,755 | | 82 | | 2,837 | | 2,273 | | 71 | | 2,344 | |
Credit card loyalty programs | | - | | (126 | ) | (126 | ) | - | | (152 | ) | (152 | ) | - | | (101 | ) | (101 | ) |
Transaction fee related expenses | | - | | (95 | ) | (95 | ) | - | | (82 | ) | (82 | ) | - | | (71 | ) | (71 | ) |
Fee expenses | | - | | (221 | ) | (221 | ) | - | | (234 | ) | (234 | ) | - | | (172 | ) | (172 | ) |
Net fee income | | 2,550 | | (126 | ) | 2,424 | | 2,755 | | (152 | ) | 2,603 | | 2,273 | | (101 | ) | 2,172 | |
Note 5: Operating expenses (extract) | | | | | | | | | | | | | | | | | | | |
Credit card loyalty programs | | 126 | | (126 | ) | - | | 152 | | (152 | ) | - | | 101 | | (101 | ) | - | |
Total other expenses | | 1,662 | | (126 | ) | 1,536 | | 1,652 | | (152 | ) | 1,500 | | 1,357 | | (101 | ) | 1,256 | |
Total operating expenses | | 9,692 | | (126 | ) | 9,566 | | 9,434 | | (152 | ) | 9,282 | | 8,101 | | (101 | ) | 8,000 | |
164 | 2019 Westpac Group Annual Report | |
| | |
Notes to the financial statements
Note 1. Financial statements preparation (continued)
(iv) Standards adopted during the year ended 30 September 2019
AASB 9 Financial Instruments (December 2014) (AASB 9)
The Group adopted AASB 9 on 1 October 2018. The adoption of AASB 9 has been applied by adjusting the opening balance sheet at 1 October 2018, with no restatement of comparatives as permitted by the standard. The adoption of AASB 9 reduced retained earnings at 1 October 2018 by $722 million (net of tax) for the Group and by $495 million (net of tax) for the Parent Entity. This was primarily due to the increase in impairment provisions under the new standard.
Impairment
AASB 9 introduces a revised impairment model which requires entities to recognise expected credit losses (ECL) based on unbiased forward looking information, replacing the incurred loss model under AASB 139 Financial instruments: Recognition and Measurement (AASB 139) which only recognised impairment if there was objective evidence that a loss had been incurred. The revised impairment model applies to all financial assets at amortised cost, lease receivables, debt securities measured at FVOCI, and credit commitments.
The accounting policy for the provision for ECL under AASB 9 is detailed in Notes 6 and 13.
Classification and measurement
AASB 9 replaced the classification and measurement model in AASB 139 with a new model that categorises financial assets based on: a) the business model within which the assets are managed and b) whether the contractual cash flows under the instrument represent solely payments of principal and interest (SPPI).
The accounting policies for the classification and measurement of financial assets and financial liabilities precede Note 10 and are also located in the relevant notes to the financial statements for financial assets and financial liabilities.
In the 2014 financial year, the Group early adopted part of AASB 9 which relates to the recognition of the changes in fair value of financial liabilities designated at fair value attributable to Westpac’s own credit risk in other comprehensive income (except where it would create an accounting mismatch, in which case all changes in fair value are recognised in the income statement). As a result, the accounting for this remains unchanged for the Group.
Hedging
AASB 9 changes hedge accounting by increasing the eligibility of both hedged items and hedging instruments and introducing a more principles-based approach to assessing hedge effectiveness. Adoption of the new hedge accounting model is optional until the IASB completes its accounting for dynamic risk management project. Until this time, current hedge accounting under AASB 139 can continue to be applied. The Group has applied the option to continue hedge accounting under AASB 139, however the Group has adopted the amended AASB 7 Financial Instruments: Disclosures (AASB 7) hedge accounting disclosures as required.
AASB 15 Revenue from Contracts with Customers (AASB 15)
The Group adopted AASB 15 on 1 October 2018. It replaced AASB 118 Revenue and related interpretations and applies to all contracts with customers, except leases, financial instruments and insurance contracts. The standard provides a systematic approach to revenue recognition by introducing a five-step model governing revenue measurement and recognition. This includes:
· identifying the contract with customer;
· identifying each of the performance obligations included in the contract;
· determining the amount of consideration in the contract;
· allocating the consideration to each of the identified performance obligations; and
· recognising revenue as each performance obligation is satisfied.
The Group has applied AASB 15 by reducing the opening balance of retained earnings at the date of initial application, 1 October 2018, by $5 million (net of tax) for the Group and by $7 million (net of tax) for the Parent Entity with no comparative restatement.
In addition, the Group identified certain income and expenses which were previously reported on a net basis primarily within fee income which are now being presented on a gross basis.
Finally, certain facility fees have been reclassified from non-interest income to interest income.
| 2019 Westpac Group Annual Report | 165 |
| | |
Notes to the financial statements
Note 1. Financial statements preparation (continued)
Transition (AASB 9 and AASB 15)
Impact of the adoption of AASB 9 – impairment
The following tables show the impact of the adoption of AASB 9 on impairment balances.
Consolidated
$m | Provisions
on loans | Provisions for
credit
commitments | Loss allowance
on debt
securities at
FVOCI1 | Provisions on debt
securities and
other financial
assets at
amortised cost | Total |
30 September 2018 - carrying amount | 2,814 | 239 | - | - | 3,053 |
ECL on amortised cost financial instruments | 882 | 98 | - | 9 | 989 |
ECL on debt securities measured at FVOCI | - | - | 2 | - | 2 |
1 October 2018 - AASB 9 carrying amount | 3,696 | 337 | 2 | 9 | 4,044 |
| | | | | |
Parent Entity
$m | Provisions
on loans | Provisions for
credit
commitments | Loss allowance
on debt
securities at
FVOCI1 | Provisions on debt
securities and
other financial
assets at
amortised cost | Total |
30 September 2018 - carrying amount | 2,407 | 206 | - | - | 2,613 |
ECL on amortised cost financial instruments | 751 | 95 | - | - | 846 |
ECL on debt securities measured at FVOCI | - | - | 2 | - | 2 |
1 October 2018 - AASB 9 carrying amount | 3,158 | 301 | 2 | - | 3,461 |
Impact of the adoption of AASB 9 – classification and measurement
Investment securities
Investment securities represent all debt and equity securities not measured at FVIS. Investment securities include debt securities at amortised cost and both debt and equity securities at FVOCI.
As a result of the adoption of AASB 9, available-for-sale debt securities of $811 million for the Group and $10 million for the Parent Entity have been reclassified to investment securities - debt securities at amortised cost as the business model for these instruments is achieved by collecting the contractual cash flows and these cash flows represent SPPI. The remaining available-for-sale debt securities of $60 billion for the Group and $56 billion for the Parent Entity have been reclassified to investment securities measured at FVOCI.
In addition, available-for-sale equity securities have been assessed on an instrument-by-instrument basis. For the Group, $275 million of available-for-sale equity securities have been reclassified to trading securities and financial assets measured at FVIS. The Group has elected to irrevocably designate the remaining $109 million of available-for-sale equity securities to continue to be measured at FVOCI. For the Parent Entity, all $67 million of available-for-sale equity securities were irrevocably designated to continue to be measured at FVOCI.
Loans
As a result of the adoption of AASB 9, for both the Group and the Parent Entity, $56 million of loans which were measured at amortised cost are measured at FVIS as the cash flows of the loan do not represent SPPI.
1. Impairment on debt securities at FVOCI is recognised in the income statement with a corresponding amount in other comprehensive income (refer to Note 28). There is no reduction of the carrying value of the debt security which remains at fair value.
166 | 2019 Westpac Group Annual Report | |
| | |
Notes to the financial statements
Note 1. Financial statements preparation (continued)
| 30 September 2018
AASB 139 measurement basis | | 1 October 2018
AASB 9 measurement basis |
Consolidated
$m | Amortised
cost | FVIS | FVOCI | Total | Change in
measurement
basis under
AASB 9 | Amortised
cost | FVIS | FVOCI | Total |
Financial assets | | | | | | | | | |
Cash and balances with central banks | 26,788 | - | - | 26,788 | No | 26,788 | - | - | 26,788 |
Collateral paid | 4,787 | - | - | 4,787 | No | 4,787 | - | - | 4,787 |
Trading securities and financial assets measured at FVIS | - | 23,132 | - | 23,132 | No | - | 23,132 | - | 23,132 |
Derivative financial instruments | - | 24,101 | - | 24,101 | No | - | 24,101 | - | 24,101 |
Available-for-sale securities | - | - | 61,119 | 61,119 | Yes | 811 | 275 | 60,033 | 61,119 |
Loans1 | 709,144 | 546 | - | 709,690 | Yes | 709,088 | 602 | - | 709,690 |
Other financial assets | 5,517 | - | - | 5,517 | No | 5,517 | - | - | 5,517 |
Life insurance assets | - | 9,450 | - | 9,450 | No | - | 9,450 | - | 9,450 |
Total financial assets | 746,236 | 57,229 | 61,119 | 864,584 | | 746,991 | 57,560 | 60,033 | 864,584 |
Financial liabilities | | | | | | | | | |
Collateral received | 2,184 | - | - | 2,184 | No | 2,184 | - | - | 2,184 |
Deposits and other borrowings | 518,107 | 41,178 | - | 559,285 | No | 518,107 | 41,178 | - | 559,285 |
Other financial liabilities | 23,808 | 4,297 | - | 28,105 | No | 23,808 | 4,297 | - | 28,105 |
Derivative financial instruments | - | 24,407 | - | 24,407 | No | - | 24,407 | - | 24,407 |
Debt issues | 169,241 | 3,355 | - | 172,596 | No | 169,241 | 3,355 | - | 172,596 |
Life insurance liabilities | - | 7,597 | - | 7,597 | No | - | 7,597 | - | 7,597 |
Loan capital | 17,265 | - | - | 17,265 | No | 17,265 | - | - | 17,265 |
Total financial liabilities | 730,605 | 80,834 | - | 811,439 | | 730,605 | 80,834 | - | 811,439 |
| | | | | | | | | |
| 30 September 2018
AASB 139 measurement basis | | 1 October 2018
AASB 9 measurement basis |
Parent Entity
$m | Amortised
cost | FVIS | FVOCI | Total | Change in
measurement basis under AASB 9 | Amortised
cost | FVIS | FVOCI | Total |
Financial assets | | | | | | | | | |
Cash and balances with central banks | 24,976 | - | - | 24,976 | No | 24,976 | - | - | 24,976 |
Collateral paid | 4,722 | - | - | 4,722 | No | 4,722 | - | - | 4,722 |
Trading securities and financial assets measured at FVIS | - | 21,415 | - | 21,415 | No | - | 21,415 | - | 21,415 |
Derivative financial instruments | - | 23,562 | - | 23,562 | No | - | 23,562 | - | 23,562 |
Available-for-sale securities | - | - | 56,513 | 56,513 | Yes | 10 | - | 56,503 | 56,513 |
Loans1 | 629,622 | 546 | - | 630,168 | Yes | 629,566 | 602 | - | 630,168 |
Other financial assets | 4,666 | - | - | 4,666 | No | 4,666 | - | - | 4,666 |
Due from subsidiaries2,3 | 133,808 | 278 | - | 134,086 | No | 133,808 | 278 | - | 134,086 |
Total financial assets | 797,794 | 45,801 | 56,513 | 900,108 | | 797,748 | 45,857 | 56,503 | 900,108 |
Financial liabilities | | | | | | | | | |
Collateral received | 1,748 | - | - | 1,748 | No | 1,748 | - | - | 1,748 |
Deposits and other borrowings | 460,406 | 40,062 | - | 500,468 | No | 460,406 | 40,062 | - | 500,468 |
Other financial liabilities | 22,969 | 4,297 | - | 27,266 | No | 22,969 | 4,297 | - | 27,266 |
Derivative financial instruments | - | 24,229 | - | 24,229 | No | - | 24,229 | - | 24,229 |
Debt issues | 149,065 | 3,223 | - | 152,288 | No | 149,065 | 3,223 | - | 152,288 |
Due to subsidiaries4 | 141,877 | 523 | - | 142,400 | No | 141,877 | 523 | - | 142,400 |
Loan capital | 17,265 | - | - | 17,265 | No | 17,265 | - | - | 17,265 |
Total financial liabilities | 793,330 | 72,334 | - | 865,664 | | 793,330 | 72,334 | - | 865,664 |
1. As at 30 September 2018, loans at amortised cost were restated from $706,440 million to $709,144 million for the Group, and from $626,918 million to $629,622 million for the Parent Entity. Loans at FVIS were also restated from $3,250 million to $546 million for both the Group and the Parent Entity.
2. Due from subsidiaries excludes $6,511 million of long-term debt instruments with equity like characteristics which are part of the total investment in subsidiaries.
3. Comparatives have been restated to reclassify $278 million from amortised cost to FVIS.
4. Comparatives have been restated to reclassify $523 million from amortised cost to FVIS.
| 2019 Westpac Group Annual Report | 167 |
| | |
Notes to the financial statements
Note 1. Financial statements preparation (continued)
Reconciliation of the opening balance sheet
The following tables reconcile the reported 30 September 2018 balance sheet to the 1 October 2018 opening balance sheet on adoption of AASB 9 and AASB 15 showing separately the impact of adjustments relating to reclassification and remeasurement including the related tax impacts.
| 30 September 2018 | 1 October 2018 |
Consolidated
$m | Restated
Carrying
Amount | AASB 9 changes | AASB 15 changes | Opening
carrying
amount |
Reclassifications | Remeasurement1 |
Assets Cash and balances with central banks | 26,788 | - | - | - | 26,788 |
Collateral paid | 4,787 | - | - | - | 4,787 |
Trading securities and financial assets measured at FVIS | 23,132 | 275 | - | - | 23,407 |
Derivative financial instruments | 24,101 | - | - | - | 24,101 |
Available-for-sale securities | 61,119 | (61,119) | - | - | - |
Investment securities | - | 60,844 | (9) | - | 60,835 |
Loans (at amortised cost) | 709,144 | (56) | (925) | - | 708,163 |
Loans (at fair value) | 546 | 56 | - | - | 602 |
Other financial assets | 5,517 | - | - | - | 5,517 |
Deferred tax assets | 1,180 | - | 300 | - | 1,480 |
All other assets | 23,278 | - | - | - | 23,278 |
Total assets | 879,592 | - | (634) | - | 878,958 |
Liabilities | | | | | |
Collateral received | 2,184 | - | - | - | 2,184 |
Deposits and other borrowings | 559,285 | - | - | - | 559,285 |
Other financial liabilities | 28,105 | - | - | (12) | 28,093 |
Derivative financial instruments | 24,407 | - | - | - | 24,407 |
Debt issues | 172,596 | - | - | - | 172,596 |
Provisions | 1,928 | - | 98 | - | 2,026 |
Loan capital | 17,265 | - | - | - | 17,265 |
All other liabilities | 9,249 | - | (12) | 17 | 9,254 |
Total liabilities | 815,019 | - | 86 | 5 | 815,110 |
Net assets | 64,573 | - | (720) | (5) | 63,848 |
Shareholders’ equity | | | | | |
Share capital: | | | | | |
Ordinary shares | 36,054 | - | - | - | 36,054 |
Treasury shares and RSP treasury shares | (493) | - | - | - | (493) |
Reserves | 1,077 | - | 2 | - | 1,079 |
Retained profits | 27,883 | - | (722) | (5) | 27,156 |
Total equity attributable to owners of Westpac Banking Corporation | 64,521 | - | (720) | (5) | 63,796 |
Non-controlling interests | 52 | - | - | - | 52 |
Total shareholder’s equity and Non-controlling interests | 64,573 | - | (720) | (5) | 63,848 |
1. The impact on adoption of expected credit loss provisioning resulted in increases in provisions on loans by $882 million, provisions for credit commitments by $98 million and loss allowance on debt securities at FVOCI by $2 million and provisions on debt securities at amortised cost by $9 million.
168 | 2019 Westpac Group Annual Report | |
| | |
Notes to the financial statements
Note 1. Financial statements preparation (continued)
| 30 September 2018 | 1 October 2018 |
Parent Entity
$m | Restated
Carrying
Amount | AASB 9 changes | AASB 15 changes | Opening
carrying
amount |
Reclassifications | Remeasurement1 |
Assets Cash and balances with central banks | 24,976 | - | - | - | 24,976 |
Collateral paid | 4,722 | - | - | - | 4,722 |
Trading securities and financial assets measured at FVIS | 21,415 | - | - | - | 21,415 |
Derivative financial instruments | 23,562 | - | - | - | 23,562 |
Available-for-sale securities | 56,513 | (56,513) | - | - | - |
Investment securities | - | 56,513 | - | - | 56,513 |
Loans (at amortised cost) | 629,622 | (56) | (786) | - | 628,780 |
Loans (at fair value) | 546 | 56 | - | - | 602 |
Other financial assets | 4,666 | - | - | - | 4,666 |
Due from subsidiaries | 140,597 | - | - | - | 140,597 |
Investment in subsidiaries | 4,508 | - | - | - | 4,508 |
Deferred tax assets | 1,102 | - | 258 | - | 1,360 |
All other assets | 11,001 | - | - | - | 11,001 |
Total assets | 923,230 | - | (528) | - | 922,702 |
Liabilities Collateral received | 1,748 | - | - | - | 1,748 |
Deposits and other borrowings | 500,468 | - | - | - | 500,468 |
Other financial liabilities | 27,266 | - | - | (9) | 27,257 |
Derivative financial instruments | 24,229 | - | - | - | 24,229 |
Debt issues | 152,288 | - | - | - | 152,288 |
Due to subsidiaries | 142,400 | - | (118) | - | 142,282 |
Provisions | 1,766 | - | 95 | - | 1,861 |
Loan capital | 17,265 | - | - | - | 17,265 |
All other liabilities | 444 | - | (12) | 16 | 448 |
Total liabilities | 867,874 | - | (35) | 7 | 867,846 |
Net assets | 55,356 | - | (493) | (7) | 54,856 |
Shareholders’ equity Share capital: | | | | | |
Ordinary shares | 36,054 | - | - | - | 36,054 |
Treasury shares and RSP treasury shares | (508) | - | - | - | (508) |
Reserves | 1,114 | - | 2 | - | 1,116 |
Retained profits | 18,696 | - | (495) | (7) | 18,194 |
Total equity attributable to owners of Westpac Banking Corporation | 55,356 | - | (493) | (7) | 54,856 |
Non-controlling interests | - | - | - | - | - |
Total shareholder’s equity and non-controlling interests | 55,356 | - | (493) | (7) | 54,856 |
As permitted by AASB 9 and AASB 15, comparatives have not been restated. Comparatives have been restated for voluntary presentation changes as detailed in the section “Changes in accounting policies” above.
1. The impact on adoption of expected credit loss provisioning resulted in increases in provisions on loans by $751 million, provisions for credit commitments by $95 million and loss allowance on debt securities measured at FVOCI by $2 million. Included in the increase in provision on loans was $118 million relating to loans which have been securitised by the Parent Entity to subsidiaries. The due to subsidiaries balance has been reduced by this amount as the relevant subsidiary records the expected credit loss on these loans and adjusts its intergroup receivable from the Parent Entity accordingly.
| 2019 Westpac Group Annual Report | 169 |
| | |
Notes to the financial statements
Note 1. Financial statements preparation (continued)
(v) Business combinations
Business combinations are accounted for using the acquisition method of accounting. Acquisition cost is measured as the aggregate of the fair value at the date of acquisition of the assets given, equity instruments issued or liabilities incurred or assumed. Acquisition-related costs are expensed as incurred (except for those costs arising on the issue of equity instruments which are recognised directly in equity).
Identifiable assets acquired and liabilities and contingent liabilities assumed in a business combination are measured at fair value on the acquisition date. Goodwill is measured as the excess of the acquisition cost, the amount of any non-controlling interest and the fair value of any previous Westpac equity interest in the acquiree, over the fair value of the identifiable net assets acquired.
(vi) Foreign currency translation
Functional and presentational currency
The consolidated financial statements are presented in Australian dollars which is the Parent Entity’s functional and presentation currency. The functional currency of offshore entities is usually the main currency of the economy it operates in.
Transactions and balances
Foreign currency transactions are translated into the functional currency of the relevant branch or subsidiary using the exchange rates prevailing at the dates of the transactions. Foreign exchange gains and losses resulting from the settlement of such transactions and from the translation at year end exchange rates of monetary assets and liabilities denominated in foreign currencies are recognised in the income statement, except when deferred in other comprehensive income for qualifying cash flow hedges and qualifying net investment hedges.
Foreign operations
Assets and liabilities of foreign branches and subsidiaries that have a functional currency other than the Australian dollar are translated at exchange rates prevailing on the balance date. Income and expenses are translated at average exchange rates prevailing during the year. Equity balances are translated at historical exchange rates. The resulting exchange differences are recognised in the foreign currency translation reserve and in other comprehensive income.
On consolidation, exchange differences arising from the translation of borrowings and other foreign currency instruments designated as hedges of the net investment in foreign operations are reflected in the foreign currency translation reserve and in other comprehensive income. When all or part of a foreign operation is disposed or borrowings that are part of the net investments are repaid, a proportionate share of such exchange differences is recognised in the income statement as part of the gain or loss on disposal or repayment of borrowing.
b. Critical accounting assumptions and estimates
Applying the Group’s accounting policies requires the use of judgement, assumptions and estimates which impact the financial information. The significant assumptions and estimates used are discussed in the relevant notes below:
· Note 7 Income tax
· Note 13 Provisions for expected credit losses/impairment charges
· Note 15 Life insurance assets and life insurance liabilities
· Note 22 Fair values of financial assets and financial liabilities
· Note 25 Intangible assets
· Note 27 Provisions, contingent liabilities, contingent assets and credit commitments
· Note 34 Superannuation commitments
170 | 2019 Westpac Group Annual Report | |
| | |
Notes to the financial statements
Note 1. Financial statements preparation (continued)
c. Future developments in accounting standards
The following new standards and interpretations which may have a material impact on the Group have been issued but are not yet effective, and unless otherwise stated, have not been early adopted by the Group:
AASB 16 Leases (AASB 16) was issued on 23 February 2016 and will be effective for the 30 September 2020 financial year. The standard will not result in significant changes for lessor accounting. The main changes under the standard are:
· all operating leases of greater than 12 months duration will be required to be presented on balance sheet by the lessee as a right-of-use (ROU) asset and lease liability. The asset and liability will initially be measured at the present value of non-cancellable lease payments and payments to be made in optional periods where it is reasonably certain that the option will be exercised; and
· all leases on balance sheet will give rise to a combination of interest expense on the lease liability and depreciation of the ROU asset.
The AASB 16 implementation and governance program is led by Finance with representatives from the impacted areas of the business with oversight from the Chief Financial Officer. The project has identified the portfolios impacted by that standard which are predominantly property leases. In addition, the project has updated finance systems and processes, established a governance framework, updated relevant policies and addressed key judgements including the transition option that will be applied in order to determine the expected impact to the Group.
The Group will adopt the standard using the simplified approach of transition with no restatement of comparative information. The expected impact on adoption of the standard will be to recognise a ROU asset of approximately $3.4 billion and an equivalent lease liability with no impact on retained earnings.
The Group has determined that it will use the incremental borrowing rate as the discount rate when determining present value. This discount rate will be based on the remaining maturity of the lease at the date of transition. The Group will also apply the practical exemptions for low-value assets and short-term leases.
AASB 17 Insurance Contracts (AASB 17) was issued on 19 July 2017 and will be effective for the 30 September 2022 year end unless early adopted. This will replace AASB 4 Insurance Contracts, AASB 1023 General Insurance Contracts and AASB 1038 Life Insurance Contracts. The main changes under the standard are:
· the scope of the standard may result in some contracts that are currently “unbundled”, i.e. accounted for separately as insurance and investment contracts being required to be “bundled” and accounted for as an insurance contract;
· portfolios of contracts (with similar risks which are managed together) will be required to be disaggregated to a more granular level by both the age of a contract and the likelihood of the contract being onerous in order to determine the recognition of profit over the contract period (i.e. the contractual service margin). The contractual service margin uses a different basis to recognise profit to the current Margin on Services approach for life insurance and therefore the pattern of profit recognition is likely to differ;
· risk adjustments, which reflect uncertainties in the amount and timing of future cash flows, are required for both general and life insurance contracts rather than just general insurance contracts under the current accounting standards;
· the contract boundary, which is the period over which profit is recognised, differs and is determined based on the ability to compel the policyholder to pay premiums or the substantive obligation to provide coverage/ services. For some general insurance contracts (e.g. some lender mortgage insurance and reinsurance contracts) this may result in the contract boundary being longer. For life insurance, in particular term renewable contracts, the contract boundary is expected to be shorter. Both will be impacted by different patterns of profit recognition compared to the current standards;
· a narrower definition of what acquisition costs may be deferred;
· an election to recognise changes in assumptions regarding discount rate in other comprehensive income rather than in profit and loss;
· an election to recognise changes in the fair value of assets supporting policy liabilities in other comprehensive income rather than through profit and loss;
· reinsurance contracts and the associated liability are to be determined separately to the gross contract liability and may have different contract boundaries; and
· additional disclosure requirements.
The standard is expected to result in a reduction in the level of deferred acquisition costs, however the quantum of this and the profit and loss impacts to the Group are not yet practicable to determine.
| 2019 Westpac Group Annual Report | 171 |
| | |
Notes to the financial statements
Note 1. Financial statements preparation (continued)
On 26 June 2019, the IASB issued an exposure draft proposing a number of amendments to the insurance contracts standard. If approved, these amendments would allow entities to:
· defer acquisition costs for anticipated renewals outside of the initial contract boundary; and
· recognise a gain in the P&L for reinsurance contracts, to offset losses from onerous contracts on initial recognition (to the extent the reinsurance contracts held covers the losses of each contract on a proportionate basis).
In addition, the effective date of the standard would be deferred by one year to be applicable to the Group for the 30 September 2023 financial year.
AASB Interpretation 23 Uncertainty over Income Tax Treatments (Interpretation 23) was issued in July 2017 and will be effective for the 30 September 2020 financial year. Interpretation 23 clarifies the recognition and measurement criteria in AASB 112 Income Taxes (AASB 112) where there is uncertainty over income tax treatments, and requires an assessment of each uncertain tax position as to whether it is probable that a taxation authority will accept the position.
Where it is not considered probable, the effect of the uncertainty will be reflected in determining the relevant taxable profit or loss, tax bases, unused tax losses and unused tax credits or tax rates. The amount will be determined as either the single most likely amount or the sum of the probability weighted amounts in a range of possible outcomes, whichever better predicts the resolution of the uncertainty. Judgements will be reassessed as and when new facts and circumstances are presented.
The interpretation is not expected to have a material impact on the Group.
A revised Conceptual Framework (Framework) was issued in May 2019. This will be effective for the Group for the 30 September 2021 financial year. The revised Framework includes new definitions and recognition criteria for assets, liabilities, income and expenses and other relevant financial reporting concepts. The changes are not expected to have a material impact on the Group.
Other amendments to existing standards that are not yet effective are not expected to have a material impact to the Group.
Interbank-offered rates (IBOR) reform
IBORs are interest rate benchmarks used in financial markets for pricing, valuing and hedging a wide variety of financial instruments such as derivatives, loans and bonds. Examples of IBOR include ‘LIBOR’ and ‘EURIBOR’.
A review of the global major IBORs is being conducted to reform or replace existing IBORs with more suitable alternative reference rates (ARRs). This IBOR reform will impact the accounting for financial instruments that reference IBORs including hedge accounting, fair value methodologies and existing financial instruments that reference IBORs at transition. This replacement process is at different stages and is progressing at different speeds in different jurisdictions. Therefore, there is uncertainty as to the basis, method, timing and implications of transition to the ARRs.
In October 2019, the AASB issued amendments to AASB 9, AASB 139 and AASB 7 which enable hedge accounting to continue for certain hedges that might otherwise need to be discontinued due to uncertainties arising from IBOR reform and requires certain disclosures. These amendments are effective for the Group for the 30 September 2021 financial year with early application permitted.
As a result of these developments, the Group has applied judgement in the current reporting period to determine that hedge relationships that include IBORs as a hedged risk continue to qualify for hedge accounting. The Group continues to monitor these developments and the expected impact.
172 | 2019 Westpac Group Annual Report | |
| | |
Notes to the financial statements
FINANCIAL PERFORMANCE
Note 2. Segment reporting
Accounting policy
Operating segments are presented on a basis consistent with information provided internally to Westpac’s key decision makers and reflects the management of the business, rather than the legal structure of the Group. Internally, Westpac uses ‘cash earnings’ in assessing the financial performance of its divisions. Management believes this allows the Group to: · more effectively assess current year performance against prior years; · compare performance across business divisions; and · compare performance across peer companies. Cash earnings is viewed as a measure of the level of profit that is generated by ongoing operations and is therefore considered in assessing distributions, including dividends. Cash earnings is neither a measure of cash flow nor net profit determined on a cash accounting basis, as it includes both cash and non-cash adjustments to statutory net profit. To determine cash earnings, three categories of adjustments are made to statutory results: · material items that key decision makers at the Westpac Group believe do not reflect ongoing operations; · items that are not considered when dividends are recommended, such as the amortisation of intangibles, impact of Treasury shares and economic hedging impacts; and · accounting reclassifications between individual line items that do not impact statutory results. Internal charges and transfer pricing adjustments have been reflected in the performance of each operating segment. Inter-segment pricing is determined on an arm’s length basis. |
Reportable operating segments
On 19 March 2019, the Group announced changes to the way it supports customer’s wealth and insurance needs, realigning its BTFG businesses into expanded Consumer and Business divisions and exiting the provision of personal financial advice. As a result, the insurance business was transferred to Consumer, the funds management business was transferred to Business, and the Advice business and certain support functions of BTFG Australia were transferred to Group Businesses. Changes to the Group’s organisational structure were effective from 1 April 2019 and the results of the operating segments for 2018 and 2017 have been restated.
The operating segments are defined by the customers they service and the services they provide:
· Consumer:
– is responsible for sales and service of banking and financial products and services to consumer customers in Australia;
– �� is also responsible for the Group’s Australian insurance business, which covers the manufacture and distribution of life, general and lenders mortgage insurance; and
– operates under the Westpac, St.George, BankSA, Bank of Melbourne, RAMS and BT brands.
· Business:
– is responsible for sales and service of banking and financial products and services for SME and commercial business customers in Australia. SME and Commercial business customers typically have facilities up to approximately $150 million;
– is responsible for Private Wealth, serving the banking needs of high net worth customers across the banking brands;
– is responsible for the manufacture and distribution of investments (including margin lending and equities broking), superannuation and retirement products as well as wealth administration platforms; and
– operates under the Westpac, St.George, BankSA, Bank of Melbourne and BT brands.
| 2019 Westpac Group Annual Report | 173 |
| | |
Notes to the financial statements
Note 2. Segment reporting (continued)
· Westpac Institutional Bank (WIB):
– is responsible for delivering a broad range of financial products and services to commercial, corporate, institutional and government customers with connections to Australia and New Zealand;
– services include financing, transactional banking, financial and debt capital markets;
– customers are supported throughout Australia, as well as via branches and subsidiaries located in New Zealand, US, UK and Asia; and
– also responsible for Westpac Pacific, providing a range of banking services in Fiji and Papua New Guinea.
· Westpac New Zealand:
– is responsible for sales and service of banking, wealth and insurance products to customers in New Zealand;
– customer base includes consumers, business and institutional customers; and
– operates under the Westpac brand for banking products, the Westpac Life brand for life insurance products and the BT brand for wealth products.
· Group Businesses include:
– Treasury, which is responsible for the management of the Group’s balance sheet including wholesale funding, capital and management of liquidity. Treasury also manages the interest rate risk and foreign exchange risks inherent in the balance sheet, including managing the mismatch between Group assets and liabilities. Treasury’s earnings are primarily sourced from managing the Group’s balance sheet and interest rate risk, (excluding Westpac New Zealand) within set risk limits;
– Group Technology1, which comprises functions for the Australian businesses, is responsible for technology strategy and architecture, infrastructure and operations, applications development and business integration;
– Core Support2, which comprises functions performed centrally, including Australian banking operations, property services, strategy, finance, risk, compliance, legal, human resources, and customer and corporate relations;
– Following the Group’s decision to restructure the Wealth operating segment and to exit the Advice business in March 2019, the remaining Advice business (including associated remediation) and support functions have been transferred to Group Business; and
– Group Businesses also includes earnings on capital not allocated to divisions, for certain intra-group transactions that facilitate presentation of performance of the Group’s operating segments, earnings from non-core asset sales, earnings and costs associated with the Group’s fintech investments, and certain other head office items such as centrally held provisions.
· For Westpac, AASB 9 and AASB 15 were adopted on 1 October 2018 and as comparatives were not restated, line item movements in our reported results are not directly comparable across periods. In order to provide the operational trends in business, we have revised the 2018 cash earnings comparatives as if the standards applied on 1 October 2017, except for expected credit loss provisioning which is not feasible. These adjustments do not impact 2018 cash earnings but do affect individual line items. These adjustments are comprised of:
– Line fees: The Group has reclassified line fees (mostly Business) from non-interest income to net interest income to more appropriately reflect the relationship with drawn lines of credit;
– Card scheme: Support payments received from Mastercard and Visa have been reclassified to non-interest income and related expenses have been reclassified to operating expenses;
– Interest carrying adjustment: Interest on performing loans (stage 1 and stage 2 loans) is now measured on the gross loan value. Previously, interest on performing loans was recognised on the loan balance net of provisions. This adjustment increases interest income and impairment charges;
– Other fees and expenses: The Group has restated the classification of a number of fees and expenses. This has resulted in the grossing up of net interest income, non-interest income, impairment charges and operating expenses; and
– Merchant terminal costs: Some variable costs related to Westpac’s merchant terminal business have been reclassified between non-interest income and operating expenses.
1. Costs are fully allocated to other divisions in the Group.
2. Costs are partially allocated to other divisions in the Group, with costs attributed to enterprise activity retained in Group Businesses.
174 | 2019 Westpac Group Annual Report | |
| | |
Notes to the financial statements
Note 2. Segment reporting (continued)
Comparatives have also been restated for:
· recent customer migration between divisions and accompanying impacts on divisional income statement and balance sheet;
· refinement in expense allocations; and
· changes to Group’s organisation structure following the realignment of the BTFG businesses into Consumer, Business and Group Businesses.
The following tables present the segment results on a cash earnings basis for the Group:1
2019
$m | Consumer | Business | Westpac
Institutional
Bank | Westpac
New
Zealand | Group
Businesses | Total | Net cash
earnings
adjustment | Income
Statement |
Net interest income | 7,942 | 5,092 | 1,443 | 1,860 | 616 | 16,953 | (46) | 16,907 |
Net fee income | 608 | 464 | 610 | 163 | (190) | 1,655 | - | 1,655 |
Net wealth management and insurance income | 425 | 899 | - | 177 | (478) | 1,023 | 6 | 1,029 |
Trading income | 93 | 106 | 695 | 37 | (24) | 907 | 22 | 929 |
Other income | 15 | (5) | (13) | 46 | 74 | 117 | 12 | 129 |
Net operating income before operating expenses and impairment charges | 9,083 | 6,556 | 2,735 | 2,283 | (2) | 20,655 | (6) | 20,649 |
Operating expenses | (3,817) | (2,805) | (1,284) | (939) | (1,186) | (10,031) | (75) | (10,106) |
Impairment (charges)/benefits | (581) | (272) | (46) | 10 | 95 | (794) | - | (794) |
Profit before income tax | 4,685 | 3,479 | 1,405 | 1,354 | (1,093) | 9,830 | (81) | 9,749 |
Income tax expense | (1,397) | (1,048) | (386) | (369) | 225 | (2,975) | 16 | (2,959) |
Net profit attributable to non-controlling interests | - | - | (5) | - | (1) | (6) | - | (6) |
Cash earnings for the year | 3,288 | 2,431 | 1,014 | 985 | (869) | 6,849 | (65) | 6,784 |
Net cash earnings adjustments | - | (45) | - | (1) | (19) | (65) | | |
Net profit attributable to owners of Westpac Banking Corporation | 3,288 | 2,386 | 1,014 | 984 | (888) | 6,784 | | |
1. The Group has adopted AASB 9 and AASB 15 from 1 October 2018. Statutory comparatives have not been restated. However, where applicable, cash earnings comparatives (excluding expected credit loss provisioning) have been restated to aid comparability. In addition, the Group has made a number of presentational changes to the Balance Sheet and Income Statement. Both statutory and cash earnings comparatives have been restated. Refer to Note 1 for further detail.
| 2019 Westpac Group Annual Report | 175 |
| | |
Notes to the financial statements
Note 2. Segment reporting1 (continued)
2018
$m | Consumer | Business | Westpac
Institutional
Bank | Westpac
New
Zealand | Group
Businesses | Total | Net cash
earnings
adjustment | Income
Statement |
Net interest income | 7,850 | 5,284 | 1,442 | 1,799 | 812 | 17,187 | (682) | 16,505 |
Net fee income | 659 | 511 | 610 | 164 | (34) | 1,910 | 514 | 2,424 |
Net wealth management and insurance income | 549 | 1,012 | 212 | 149 | 95 | 2,017 | 44 | 2,061 |
Trading income | 96 | 100 | 697 | 51 | (18) | 926 | 19 | 945 |
Other income | 7 | 17 | 46 | 9 | 46 | 125 | (53) | 72 |
Net operating income before operating expenses and impairment charges | 9,161 | 6,924 | 3,007 | 2,172 | 901 | 22,165 | (158) | 22,007 |
Operating expenses | (3,774) | (2,651) | (1,449) | (855) | (969) | (9,698) | 132 | (9,566) |
Impairment (charges)/benefits | (486) | (321) | 16 | (22) | 1 | (812) | 102 | (710) |
Profit before income tax | 4,901 | 3,952 | 1,574 | 1,295 | (67) | 11,655 | 76 | 11,731 |
Income tax expense | (1,478) | (1,196) | (476) | (361) | (75) | (3,586) | (46) | (3,632) |
Net profit attributable to non-controlling interests | - | - | (5) | - | 1 | (4) | - | (4) |
Cash earnings for the year | 3,423 | 2,756 | 1,093 | 934 | (141) | 8,065 | 30 | 8,095 |
Net cash earnings adjustments | (15) | (76) | - | 13 | 108 | 30 | | |
Net profit attributable to owners of Westpac Banking Corporation | 3,408 | 2,680 | 1,093 | 947 | (33) | 8,095 | | |
| | | | | | | | |
2017
$m | Consumer | Business | Westpac
Institutional
Bank | Westpac
New
Zealand | Group
Businesses | Total | Net cash
earnings
adjustment | Income
Statement |
Net interest income | 7,733 | 4,950 | 1,354 | 1,706 | 712 | 16,455 | (939) | 15,516 |
Net fee income | 745 | 518 | 628 | 197 | 82 | 2,170 | 433 | 2,603 |
Net wealth management and | | | | | | | | |
insurance income | 488 | 951 | 93 | 148 | 130 | 1,810 | (10) | 1,800 |
Trading income | 100 | 100 | 967 | 51 | - | 1,218 | (16) | 1,202 |
Other income | 18 | 48 | 28 | 14 | (31) | 77 | 452 | 529 |
Net operating income before operating expenses and impairment charges | 9,084 | 6,567 | 3,070 | 2,116 | 893 | 21,730 | (80) | 21,650 |
Operating expenses | (3,548) | (2,548) | (1,358) | (890) | (834) | (9,178) | (104) | (9,282) |
Impairment (charges)/benefits | (600) | (369) | (79) | 51 | 43 | (954) | 101 | (853) |
Profit before income tax | 4,936 | 3,650 | 1,633 | 1,277 | 102 | 11,598 | (83) | 11,515 |
Income tax expense | (1,484) | (1,096) | (463) | (360) | (126) | (3,529) | 11 | (3,518) |
Net profit attributable to non-controlling interests | - | - | (7) | - | - | (7) | - | (7) |
Cash earnings for the year | 3,452 | 2,554 | 1,163 | 917 | (24) | 8,062 | (72) | 7,990 |
Net cash earnings adjustments | (116) | 150 | - | (14) | (92) | (72) | | |
Net profit attributable to owners of Westpac Banking Corporation | 3,336 | 2,704 | 1,163 | 903 | (116) | 7,990 | | |
1. The Group has adopted AASB 9 and AASB 15 from 1 October 2018. Statutory comparatives have not been restated. However, where applicable, cash earnings comparatives (excluding expected credit loss provisioning) have been restated to aid comparability. In addition, the Group has made a number of presentational changes to the Balance Sheet and Income Statement. Both statutory and cash earnings comparatives have been restated. Refer to Note 1 for further detail.
176 | 2019 Westpac Group Annual Report | |
| | |
Notes to the financial statements
Note 2. Segment reporting (continued)
Reconciliation of cash earnings to net profit
$m | 2019 | 2018 | 2017 |
Cash earnings for the year | 6,849 | 8,065 | 8,062 |
Cash earning adjustments: | | | |
Amortisation of intangible assets | - | (17) | (137) |
Fair value gain/(loss) on economic hedges | (35) | 126 | (69) |
Ineffective hedges | 20 | (13) | (16) |
Adjustments relating to Pendal | (45) | (73) | 171 |
Treasury shares | (5) | 7 | (21) |
Total cash earnings adjustments | (65) | 30 | (72) |
Net profit attributable to owners of Westpac Banking Corporation | 6,784 | 8,095 | 7,990 |
Revenue from products and services
Details of revenue from external customers by product or service are disclosed in Notes 3 and 4. No single customer amounted to greater than 10% of the Group’s revenue.
Geographic segments
Geographic segments are based on the location of the office where the following items were recognised:
| | 2019 | | 2018 | | 2017 |
| $m | % | $m | % | $m | % |
Revenue | | | | | | |
Australia1 | 31,113 | 84.2 | 32,595 | 85.6 | 32,210 | 86.2 |
New Zealand1 | 4,520 | 12.2 | 4,381 | 11.5 | 4,326 | 11.6 |
Other overseas2 | 1,331 | 3.6 | 1,097 | 2.9 | 830 | 2.2 |
Total | 36,964 | 100.0 | 38,073 | 100.0 | 37,366 | 100.0 |
Non-current assets3 | | | | | | |
Australia | 12,280 | 93.7 | 12,271 | 93.7 | 12,326 | 93.8 |
New Zealand | 761 | 5.8 | 756 | 5.8 | 745 | 5.7 |
Other overseas2 | 67 | 0.5 | 65 | 0.5 | 68 | 0.5 |
Total | 13,108 | 100.0 | 13,092 | 100.0 | 13,139 | 100.0 |
1. Comparatives have been restated for consistency.
2. Other overseas included Pacific Islands, Asia, the Americas and Europe.
3. Non-current assets represent property and equipment and intangible assets.
| 2019 Westpac Group Annual Report | 177 |
| | |
Notes to the financial statements
Note 3. Net interest income1
Accounting policy
Interest income and interest expense for all interest earning financial assets and interest bearing financial liabilities at amortised cost or FVOCI, detailed within the table below, are recognised using the effective interest rate method. Net income from treasury’s interest rate and liquidity management activities and the cost of the Bank levy are included in net interest income. The effective interest rate method calculates the amortised cost of a financial instrument by discounting the financial instrument’s estimated future cash receipts or payments to their present value and allocates the interest income or interest expense, including any fees, costs, premiums or discounts integral to the instrument, over its expected life. Interest income is calculated based on the gross carrying amount of financial assets in stages 1 and 2 of the Group’s ECL model and on the carrying amount net of the provision for ECL for financial assets in stage 3. Refer to Note 13 for further details of the Group’s ECL model. |
| Consolidated | Parent Entity |
$m | 2019 | 2018 | 2017 | 2019 | 2018 |
Interest income2 | | | | | |
Calculated using the effective interest rate method | | | | | |
Cash and balances with central banks | 334 | 326 | 242 | 311 | 301 |
Collateral paid | 201 | 129 | 96 | 197 | 126 |
Available-for-sale securities | - | 1,914 | 1,795 | - | 1,743 |
Investment securities | 1,919 | - | - | 1,750 | - |
Loans | 30,029 | 29,583 | 28,438 | 26,171 | 25,763 |
Other financial assets | 35 | 35 | 43 | 33 | 32 |
Due from subsidiaries | - | - | - | 4,274 | 4,225 |
Total interest income calculated using the effective interest rate method | 32,518 | 31,987 | 30,614 | 32,736 | 32,190 |
Other | | | | | |
Net ineffectiveness on qualifying hedges | 28 | (18) | (22) | 26 | (22) |
Trading securities and financial assets measured at FVIS | 662 | 564 | 574 | 633 | 521 |
Loans | 14 | 38 | 66 | 14 | 38 |
Due from subsidiaries | - | - | - | 103 | 103 |
Total other | 704 | 584 | 618 | 776 | 640 |
Total interest income | 33,222 | 32,571 | 31,232 | 33,512 | 32,830 |
Interest expense | | | | | |
Calculated using the effective interest rate method | | | | | |
Collateral received | (57) | (45) | (19) | (51) | (41) |
Deposits and other borrowings | (7,967) | (8,141) | (8,026) | (6,745) | (6,949) |
Debt issues | (4,706) | (4,325) | (3,448) | (4,218) | (3,820) |
Due to subsidiaries | - | - | - | (4,905) | (4,840) |
Loan capital | (776) | (774) | (693) | (776) | (774) |
Other financial liabilities | (274) | (318) | (307) | (273) | (316) |
Total interest expense calculated using the effective interest rate method | (13,780) | (13,603) | (12,493) | (16,968) | (16,740) |
Other | | | | | |
Deposits and other borrowings | (978) | (880) | (842) | (961) | (868) |
Trading liabilities | (915) | (959) | (2,065) | (828) | (754) |
Debt issues | (163) | (155) | (137) | (140) | (138) |
Bank levy | (391) | (378) | (95) | (391) | (378) |
Due to subsidiaries | - | - | - | 78 | (11) |
Other interest expense | (88) | (91) | (84) | (85) | (88) |
Total other | (2,535) | (2,463) | (3,223) | (2,327) | (2,237) |
Total interest expense | (16,315) | (16,066) | (15,716) | (19,295) | (18,977) |
Net interest income | 16,907 | 16,505 | 15,516 | 14,217 | 13,853 |
1. The Group has adopted AASB 9 and AASB 15 from 1 October 2018. Statutory comparatives have not been restated. In addition, the Group has made a number of presentational changes to the Balance Sheet and Income Statement. Comparatives have been restated. Refer to Note 1 for further detail.
2. Interest income includes items relating to customer refunds recognised as a reduction in interest income of $372 million (2018: $127 million, 2017: $58 million) for the Group, and $353 million (2018: $125 million) for the Parent Entity. Refer to Note 27 for further details.
178 | 2019 Westpac Group Annual Report | |
| | |
Notes to the financial statements
Note 4. Non-interest income
Accounting policy
Non-interest income includes net fee income, net wealth management and insurance income, trading income and other income. Net fee income When another party is involved in providing goods or services to a Group customer, the Group assesses whether the nature of the arrangement with its customer is as a principal provider or an agent of another party. Where the Group is acting as an agent for another party, the income earned by the Group is the net consideration received (i.e. the gross amount received from the customer less amounts paid to a third party provider). As an agent, the net consideration represents fee income for facilitating the transaction between the customer and the third party provider with primary responsibility for fulfilling the contract. Fee income Fee income is recognised when the performance obligation is satisfied by transferring the promised good or service to the customer. Fee income includes facility fees, transaction fees and other non-risk fee income. Facility fees include certain line fees, annual credit card fees and fees for providing customer bank accounts. They are recognised over the term of the facility/period of service on a straight line basis. Transaction fees are earned for facilitating banking transactions such as foreign exchange fees, telegraphic transfers and issuing bank cheques. Fees for these one-off transactions are recognised once the transaction has been completed. Transaction fees are also recognised for credit card transactions including interchange fees net of scheme charges. These are recognised once the transaction has been completed, however, a component of interchange fees received is deferred as unearned income as the Group has a future service obligation to customers under the Group’s credit card reward programs. Other non-risk fee income includes advisory and underwriting fees which are recognised when the related service is completed. Income which forms an integral part of the effective interest rate of a financial instrument is recognised using the effective interest method and recorded in interest income (for example, loan origination fees). Fee expenses Fee expenses include incremental external costs that vary directly with the provision of goods or services to customers. An incremental cost is one that would not have been incurred if a specific good or service had not been provided to a specific customer. Fee expenses which form an integral part of the effective interest rate of a financial instrument are recognised using the effective interest method and recorded in net interest income. Fee expenses include the costs associated with credit card loyalty programs which are recognised as an expense when the services are provided on the redemption of points as well as merchant transaction costs. Net wealth management and insurance income Wealth management income Wealth management fees earned for the ongoing management of customer funds and investments are recognised when the performance obligation is satisfied which is over the period of management. Insurance premium income Insurance premium income includes premiums earned for life insurance, life investment, loan mortgage insurance and general insurance products: · life insurance premiums with a regular due date are recognised as revenue on an accrual basis; · life investment premiums include a management fee component which is recognised as income over the period the service is provided. The deposit components of life insurance and investment contracts are not revenue and are treated as movements in life insurance liabilities; · general insurance premium comprises amounts charged to policyholders, excluding taxes, and is recognised based on the likely pattern in which the insured risk is likely to emerge. The portion not yet earned based on the pattern assessment is recognised as unearned premium liability. Insurance claims expense · life and general insurance contract claims are recognised as an expense when the liability is established; · claims incurred in respect of life investment contracts represent withdrawals and are recognised as a reduction in life insurance liabilities. Trading income · realised and unrealised gains or losses from changes in the fair value of trading assets, liabilities and derivatives are recognised in the period in which they arise (except day one profits or losses which are deferred, refer to Note 22); · net income related to Treasury’s interest rate and liquidity management activities is included in net interest income. Other income - dividend income · dividends on quoted shares are recognised on the ex-dividend date; · dividends on unquoted shares are recognised when the company’s right to receive payment is established. |
| 2019 Westpac Group Annual Report | 179 |
| | |
Notes to the financial statements
Note 4. Non-interest income1 (continued)
| Consolidated | Parent Entity |
$m | 2019 | 2018 | 2017 | 2019 | 2018 |
Net fee income | | | | | |
Facility fees | 730 | 1,365 | 1,350 | 680 | 1,351 |
Transaction fees | 1,225 | 1,182 | 1,258 | 1,046 | 939 |
Other non-risk fee income2 | (76) | 98 | 229 | (638) | 54 |
Fee income | 1,879 | 2,645 | 2,837 | 1,088 | 2,344 |
Credit card loyalty programs | (121) | (126) | (152) | (90) | (101) |
Transaction fee related expenses | (103) | (95) | (82) | (76) | (71) |
Fee expenses | (224) | (221) | (234) | (166) | (172) |
Net fee income | 1,655 | 2,424 | 2,603 | 922 | 2,172 |
Net wealth management and insurance income | | | | | |
Wealth management income2 | 276 | 1,145 | 997 | - | - |
Life insurance premium income | 1,443 | 1,410 | 1,204 | - | - |
General insurance and lenders mortgage insurance (LMI) net premium earned | 482 | 472 | 451 | - | - |
Life insurance investment and other income3 | 409 | 666 | 544 | - | - |
General insurance and LMI investment and other income | 52 | 50 | 77 | - | - |
Total insurance premium, investment and other income | 2,386 | 2,598 | 2,276 | - | - |
Life insurance claims and changes in insurance liabilities | (1,266) | (1,396) | (1,155) | - | - |
General insurance and LMI claims and other expenses | (367) | (286) | (318) | - | - |
Total insurance claims, changes in liabilities and other expenses | (1,633) | (1,682) | (1,473) | - | - |
Net wealth management and insurance income | 1,029 | 2,061 | 1,800 | - | - |
Trading income | 929 | 945 | 1,202 | 956 | 919 |
Other income | | | | | |
Dividends received from subsidiaries | - | - | - | 2,215 | 2,013 |
Transactions with subsidiaries | - | - | - | 457 | 472 |
Dividends received from other entities | 6 | 3 | 2 | 3 | 3 |
Net gain on sale of associates4 | 38 | - | 279 | - | - |
Net gain on disposal of assets | 61 | 24 | 6 | 60 | - |
Net gain/(loss) on hedging overseas operations | - | - | - | (71) | 19 |
Net gain/(loss) on derivatives held for risk management purposes5 | (11) | 8 | 52 | (11) | 8 |
Net gain/(loss) on financial instruments measured at fair value | (39) | 38 | 11 | (25) | 36 |
Net gain/(loss) on disposal of controlled entities | 3 | (9) | - | - | - |
Rental income on operating leases | 72 | 107 | 143 | 50 | 77 |
Share of associates’ net profit/(loss) | (23) | (10) | 17 | - | - |
Other2,6 | 22 | (89) | 19 | 6 | 5 |
Total other income | 129 | 72 | 529 | 2,684 | 2,633 |
Total non-interest income | 3,742 | 5,502 | 6,134 | 4,562 | 5,724 |
Deferred income in relation to the credit card loyalty programs for the Group was $322 million as at 30 September 2019 (2018: $318 million) and $47 million for the Parent Entity (2018: $34 million). This will be recognised as fee income as the credit card reward points are redeemed.
There were no other material contract assets or contract liabilities for the Group or the Parent Entity.
1. The Group has adopted AASB 9 and AASB 15 from 1 October 2018. Comparatives have not been restated. In addition, the Group has made a number of presentational changes to the Balance Sheet and Income Statement. Comparatives have been restated. Refer to Note 1 for further detail.
2. Compliance, regulation and remediation provisions relating to customer refunds were recognised as a reduction of other non-risk fee income and wealth management income of $860 million (2018: $171 million; 2017: $111 million) for the Group, and $842 million (2018: $154 million) for the Parent Entity. Refer to Note 27 for further details.
3. Includes policy holder tax recoveries.
4. On 26 May 2017, the Group sold 60 million (19% of Pendal’s shares on issue) Pendal shares.
5. Income from derivatives held for risk management purposes reflects the impact of economic hedges of foreign currency capital and earnings.
6. The Group recognised $104 million of impairment on the remaining shareholdings of Pendal in 2018.
180 | 2019 Westpac Group Annual Report | |
| | |
Notes to the financial statements
Note 5. Operating expenses1,2
| Consolidated | Parent Entity |
$m | 2019 | 2018 | 2017 | 2019 | 2018 |
Staff expenses | | | | | |
Employee remuneration, entitlements and on-costs | 4,320 | 4,292 | 4,133 | 3,611 | 3,537 |
Superannuation expense3 | 378 | 386 | 380 | 313 | 315 |
Share-based payments | 108 | 95 | 113 | 101 | 97 |
Restructuring costs | 232 | 114 | 75 | 202 | 97 |
Total staff expenses | 5,038 | 4,887 | 4,701 | 4,227 | 4,046 |
Occupancy expenses | | | | | |
Operating lease rentals | 658 | 632 | 648 | 597 | 565 |
Depreciation of property and equipment | 222 | 245 | 291 | 176 | 196 |
Other | 143 | 156 | 134 | 122 | 134 |
Total occupancy expenses | 1,023 | 1,033 | 1,073 | 895 | 895 |
Technology expenses | | | | | |
Amortisation and impairment of software assets | 719 | 620 | 628 | 653 | 567 |
Depreciation and impairment of IT equipment | 129 | 141 | 158 | 117 | 124 |
Technology services | 810 | 721 | 639 | 670 | 564 |
Software maintenance and licences | 371 | 342 | 313 | 321 | 289 |
Telecommunications | 207 | 209 | 190 | 182 | 183 |
Data processing | 83 | 77 | 80 | 81 | 76 |
Total technology expenses | 2,319 | 2,110 | 2,008 | 2,024 | 1,803 |
Other expenses | | | | | |
Professional and processing services | 1,060 | 824 | 755 | 860 | 638 |
Amortisation and impairment of intangible assets and deferred expenditure | 9 | 138 | 192 | - | 21 |
Postage and stationery | 179 | 182 | 217 | 143 | 152 |
Advertising | 245 | 173 | 155 | 196 | 127 |
Non-lending losses | 58 | 133 | 73 | 43 | 112 |
Impairment on investments in subsidiaries | - | - | - | 136 | 44 |
Other | 175 | 86 | 108 | 107 | 162 |
Total other expenses | 1,726 | 1,536 | 1,500 | 1,485 | 1,256 |
Total operating expenses | 10,106 | 9,566 | 9,282 | 8,631 | 8,000 |
1. The Group has adopted AASB 9 and AASB 15 from 1 October 2018. Comparatives have not been restated. In addition, the Group has made a number of presentational changes to the Balance Sheet and Income Statement. Comparatives have been restated. Refer to Note 1 for further detail.
2. Operating expenses include costs recognised in relation to compliance, regulation and remediation provisions of $196 million (2018: $111 million; 2017: $12 million) for the Group, and $180 million (2018: $108 million) for the Parent entity. Refer to Note 27 for further details.
3. Superannuation expense includes both defined contribution and defined benefit expense. Further details of the Group’s defined benefit plans are in Note 34.
| 2019 Westpac Group Annual Report | 181 |
| | |
Notes to the financial statements
Note 6. Impairment charges
Accounting policy
|
As comparatives have not been restated upon the adoption of AASB 9 the accounting policy applied in 2019 differs to that applied in comparative periods. The accounting policy applied in comparative periods is discussed in Note 39. The accounting policy applied in 2019 is as follows. Impairment charges are based on an expected loss model which measures the difference between the current carrying amount and the present value of expected future cash flows taking into account past experience, current conditions and multiple probability-weighted macroeconomic scenarios for reasonably supportable future economic conditions. Further details of the calculation of expected credit losses and the critical accounting assumptions and estimates relating to impairment charges are included in Note 13. Impairment charges are recognised in the income statement, with a corresponding amount recognised as follows: · Loans, debt securities at amortised cost and due from subsidiaries balances: as a reduction of the carrying value of the financial asset through an offsetting provision account (refer to Note 13); · Debt securities at FVOCI: in reserves in other comprehensive income with no reduction of the carrying value of the debt security (refer to Note 28); and · Credit commitments: as a provision (refer to Note 27). Uncollectable loans A loan may become uncollectable in full or part if, after following the Group’s loan recovery procedures, the Group remains unable to collect that loan’s contractual repayments. Uncollectable amounts are written off against their related provision for expected credit losses, after all possible repayments have been received. Where loans are secured, amounts are generally written off after receiving the proceeds from the security, or in certain circumstances, where the net realisable value of the security has been determined and this indicates that there is no reasonable expectation of full recovery, write-off may be earlier. Unsecured consumer loans are generally written off after 180 days past due. The Group may subsequently be able to recover cash flows from loans written off. In the period which these recoveries are made, they are recognised in the income statement. |
|
The following table details impairment charges for year ending 30 September 2019 based on the requirements of AASB 9.
| Consolidated | Parent Entity |
$m | 2019 | 2019 |
Provisions raised/(released) | | |
Performing | (209) | (180) |
Non-performing | 1,175 | 1,073 |
Recoveries | (172) | (143) |
Impairment charges | 794 | 750 |
of which relates to: | | |
Loan and credit commitments | 794 | 750 |
Impairment charges | 794 | 750 |
As comparatives have not been restated for the adoption of AASB 9, the following table details impairment charges for comparative year ends based on the requirements of AASB 139. Once AASB 9 has been effective for all comparative year ends, this table will no longer be presented.
| | Consolidated | | Parent Entity | |
$m | | 2018 | | 2017 | | 2018 | |
Individually assessed provisions raised | | 371 | | 610 | | 341 | |
Write-backs | | (150 | ) | (288 | ) | (131 | ) |
Recoveries | | (179 | ) | (168 | ) | (138 | ) |
Collectively assessed provisions raised | | 668 | | 699 | | 610 | |
Impairment charges | | 710 | | 853 | | 682 | |
There were no impairment charges for debt securities at FVOCI, debt securities at amortised cost and due from subsidiaries balances.
182 | 2019 Westpac Group Annual Report | |
| | |
Notes to the financial statements
Note 7. Income tax
Accounting policy
|
The tax expense for the year comprises current and deferred tax. Tax is recognised in the income statement, except to the extent that it relates to items recognised directly in other comprehensive income, in which case it is recognised in the statement of comprehensive income. Current tax is the tax payable for the year using enacted or substantively enacted tax rates and laws for each jurisdiction. Current tax also includes adjustments to tax payable for previous years. Deferred tax accounts for temporary differences between the carrying amounts of assets and liabilities in the financial statements and their values for taxation purposes. Deferred tax is determined using the enacted or substantively enacted tax rates and laws for each jurisdiction which are expected to apply when the assets will be realised or the liabilities settled. Deferred tax assets and liabilities have been offset where they relate to the same taxation authority, the same taxable entity or group, and where there is a legal right and intention to settle on a net basis. Deferred tax assets are recognised to the extent that it is probable that future taxable profits will be available to utilise the assets. Deferred tax is not recognised for the following temporary differences: · the initial recognition of assets or liabilities in a transaction that is not a business combination and that affects neither the accounting nor taxable profit or loss; · the initial recognition of goodwill in a business combination; and · retained earnings in subsidiaries which the Parent Entity does not intend to distribute for the foreseeable future. The Parent Entity is the head entity of a tax consolidated group with its wholly owned, Australian subsidiaries. All entities in the tax consolidated group have entered into a tax sharing agreement which, in the opinion of the Directors, limits the joint and several liabilities in the case of a default by the Parent Entity. Current and deferred tax are recognised using a ‘group allocation basis’. As head entity, the Parent Entity recognises all current tax balances and deferred tax assets arising from unused tax losses and relevant tax credits for the tax-consolidated group. The Parent Entity fully compensates/is compensated by the other members for these balances. Critical accounting assumptions and estimates The Group operates in multiple tax jurisdictions and significant judgement is required in determining the worldwide current tax liability. There are many transactions with uncertain tax outcomes and provisions are determined based on the expected outcomes. |
|
| 2019 Westpac Group Annual Report | 183 |
| | |
Notes to the financial statements
Note 7. Income tax (continued)
Income tax expense
The income tax expense for the year reconciles to the profit before income tax as follows:
| | Consolidated | | Parent Entity | |
$m | | 2019 | | 2018 | | 2017 | | 2019 | | 2018 | |
Profit before income tax | | 9,749 | | 11,731 | | 11,515 | | 9,398 | | 10,895 | |
Tax at the Australian company tax rate of 30% | | 2,925 | | 3,519 | | 3,455 | | 2,819 | | 3,269 | |
The effect of amounts which are not deductible/(assessable) in calculating taxable income | | | | | | | | | | | |
Hybrid capital distributions | | 72 | | 69 | | 64 | | 72 | | 69 | |
Life insurance: | | | | | | | | | | | |
Tax adjustment on policyholder earnings | | 8 | | 24 | | 8 | | - | | - | |
Adjustment for life business tax rates | | (1 | ) | (1 | ) | (1 | ) | - | | - | |
Dividend adjustments | | (1 | ) | (1 | ) | (3 | ) | (664 | ) | (604 | ) |
Other non-assessable items | | (14 | ) | (5 | ) | (3 | ) | (2 | ) | (2 | ) |
Other non-deductible items | | 12 | | 64 | | 32 | | 9 | | 34 | |
Adjustment for overseas tax rates | | (32 | ) | (28 | ) | (30 | ) | (5 | ) | (3 | ) |
Income tax (over)/under provided in prior years | | (10 | ) | 9 | | 4 | | 3 | | - | |
Other items | | - | | (18 | ) | (8 | ) | 45 | | (12 | ) |
Total income tax expense | | 2,959 | | 3,632 | | 3,518 | | 2,277 | | 2,751 | |
Income tax analysis | | | | | | | | | | | |
Income tax expense comprises: | | | | | | | | | | | |
Current income tax | | 3,370 | | 3,704 | | 3,404 | | 2,711 | | 2,806 | |
Movement in deferred tax | | (401 | ) | (81 | ) | 110 | | (437 | ) | (55 | ) |
Income tax (over)/under provision in prior years | | (10 | ) | 9 | | 4 | | 3 | | - | |
Total income tax expense | | 2,959 | | 3,632 | | 3,518 | | 2,277 | | 2,751 | |
Total Australia | | 2,526 | | 3,178 | | 3,072 | | 2,215 | | 2,677 | |
Total Overseas | | 433 | | 454 | | 446 | | 62 | | 74 | |
Total income tax expense1 | | 2,959 | | 3,632 | | 3,518 | | 2,277 | | 2,751 | |
The effective tax rate was 30.35% in 2019 (2018: 30.96%, 2017: 30.55%).
1. As the Bank Levy is not a levy on income, it is not included in income tax. It is included in Note 3.
184 | 2019 Westpac Group Annual Report | |
| | |
Notes to the financial statements
Note 7. Income tax (continued)
Deferred tax assets
The balance comprises temporary differences attributable to:
| | Consolidated | | Parent Entity | |
$m | | 2019 | | 2018 | | 2019 | | 2018 | |
Amounts recognised in the income statements | | | | | | | | | |
Provisions for impairment charges on loans1 | | - | | 827 | | - | | 708 | |
Provisions for expected credit losses on loans1 | | 802 | | - | | 695 | | - | |
Provision for long service leave, annual leave and other employee benefits | | 309 | | 323 | | 286 | | 301 | |
Financial instruments | | 2 | | 5 | | 2 | | 2 | |
Property and equipment | | 195 | | 196 | | 173 | | 177 | |
Other provisions2 | | 590 | | 225 | | 561 | | 207 | |
All other liabilities2 | | 366 | | 216 | | 358 | | 204 | |
Total amounts recognised in the income statements | | 2,264 | | 1,792 | | 2,075 | | 1,599 | |
Amounts recognised directly in other comprehensive income | | | | | | | | | |
Investment securities | | 10 | | - | | 11 | | - | |
Cash flow hedges | | 52 | | 50 | | 28 | | 31 | |
Defined benefit | | 105 | | - | | 101 | | - | |
Total amounts recognised directly in other comprehensive income | | 167 | | 50 | | 140 | | 31 | |
Amount recognised in opening retained profits | | | | | | | | | |
Provision for expected credit losses on loans | | 266 | | - | | 227 | | - | |
Provision for impairment on credit commitments | | 30 | | - | | 30 | | - | |
Expected credit losses on investment securities | | 1 | | - | | 1 | | - | |
Financial instruments | | 3 | | - | | - | | - | |
Impact on adoption of AASB 91 | | 300 | | - | | 258 | | - | |
Gross deferred tax assets | | 2,731 | | 1,842 | | 2,473 | | 1,630 | |
Set-off of deferred tax assets and deferred tax liabilities | | (683 | ) | (662 | ) | (548 | ) | (528 | ) |
Net deferred tax assets | | 2,048 | | 1,180 | | 1,925 | | 1,102 | |
Movements | | | | | | | | | |
Opening balance | | 1,180 | | 1,112 | | 1,102 | | 1,053 | |
Impact on adoption of new accounting standards1 | | 300 | | - | | 258 | | - | |
Restated opening balance | | 1,480 | | 1,112 | | 1,360 | | 1,053 | |
Recognised in the income statements | | 472 | | 84 | | 476 | | 100 | |
Recognised in other comprehensive income | | 117 | | (16 | ) | 109 | | (13 | ) |
Set-off of deferred tax assets and deferred tax liabilities | | (21 | ) | - | | (20 | ) | (38 | ) |
Closing balance | | 2,048 | | 1,180 | | 1,925 | | 1,102 | |
1. The Group has adopted AASB 9 and AASB 15 from 1 October 2018. Statutory comparatives have not been restated. In addition, the Group has made a number of presentational changes to the Balance Sheet and Income Statement. Comparatives have been restated. Refer to Note 1 for further detail.
2. Comparatives has been restated for consistency.
| 2019 Westpac Group Annual Report | 185 |
| | |
Notes to the financial statements
Note 7. Income tax (continued)
Deferred tax liabilities
The balance comprises temporary differences attributable to:
| | Consolidated | | Parent Entity | |
$m | | 2019 | | 2018 | | 2019 | | 2018 | |
Amounts recognised in the income statements | | | | | | | | | |
Finance lease transactions | | 230 | | 158 | | 206 | | 161 | |
Property and equipment | | 128 | | 135 | | 129 | | 135 | |
Life insurance assets | | 57 | | 51 | | - | | - | |
All other assets | | 312 | | 312 | | 213 | | 213 | |
Total amounts recognised in the income statements | | 727 | | 656 | | 548 | | 509 | |
Amounts recognised directly in other comprehensive income | | | | | | | | | |
Available-for-sale securities | | - | | 10 | | - | | 7 | |
Defined benefit | | - | | 14 | | - | | 15 | |
Total amounts recognised directly in other comprehensive income | | - | | 24 | | - | | 22 | |
Gross deferred tax liabilities | | 727 | | 680 | | 548 | | 531 | |
Set-off of deferred tax assets and deferred tax liabilities | | (683 | ) | (662 | ) | (548 | ) | (528 | ) |
Net deferred tax liabilities | | 44 | | 18 | | - | | 3 | |
Movements | | | | | | | | | |
Opening balance | | 18 | | 10 | | 3 | | - | |
Recognised in the income statements | | 71 | | 3 | | 39 | | 45 | |
Recognised in other comprehensive income | | (24 | ) | 5 | | (22 | ) | (4 | ) |
Set-off of deferred tax assets and deferred tax liabilities | | (21 | ) | - | | (20 | ) | (38 | ) |
Closing balance | | 44 | | 18 | | - | | 3 | |
Unrecognised deferred tax balances
The following potential deferred tax balances have not been recognised. The values shown are the gross balances and not tax effected. The tax effected balances would be approximately 30% of the values shown.
| | Consolidated | | Parent Entity | |
$m | | 2019 | | 2018 | | 2019 | | 2018 | |
Unrecognised deferred tax asset Tax losses on revenue account | | 291 | | 190 | | 237 | | 151 | |
Unrecognised deferred tax liability Gross retained earnings of subsidiaries which the Parent Entity does not intend to distribute in the foreseeable future | | 51 | | 58 | | – | | – | |
186 | 2019 Westpac Group Annual Report | |
| | |
Notes to the financial statements
Note 8. Earnings per share
Accounting policy
Basic earnings per share (EPS) is calculated by dividing the net profit attributable to shareholders by the weighted average number of ordinary shares on issue during the year, adjusted for treasury shares. Diluted EPS is calculated by adjusting the basic EPS by assuming all dilutive potential ordinary shares are converted. Refer to Note 19 and Note 33 for further information on the potential dilutive instruments. |
Consolidated | | 2019 | | 2018 | | 2017 | |
$m | | Basic | | Diluted | | Basic | | Diluted | | Basic | | Diluted | |
Net profit attributable to shareholders | | 6,784 | | 6,784 | | 8,095 | | 8,095 | | 7,990 | | 7,990 | |
Adjustment for RSP dividends1 | | (6 | ) | (6 | ) | (5 | ) | - | | (6 | ) | - | |
Adjustment for potential dilution: | | | | | | | | | | | | | |
Distributions to convertible loan capital holders2 | | - | | 290 | | - | | 283 | | - | | 253 | |
Adjusted net profit attributable to shareholders | | 6,778 | | 7,068 | | 8,090 | | 8,378 | | 7,984 | | 8,243 | |
Weighted average number of ordinary shares (millions) | | | | | | | | | | | | | |
Weighted average number of ordinary shares on issue | | 3,456 | | 3,456 | | 3,414 | | 3,414 | | 3,364 | | 3,364 | |
Treasury shares (including RSP share rights)1 | | (6 | ) | (6 | ) | (8 | ) | (8 | ) | (9 | ) | (9 | ) |
Adjustment for potential dilution: | | | | | | | | | | | | | |
Share-based payments | | - | | 1 | | - | | 3 | | - | | 4 | |
Convertible loan capital2 | | - | | 278 | | - | | 232 | | - | | 236 | |
Adjusted weighted average number of ordinary shares | | 3,450 | | 3,729 | | 3,406 | | 3,641 | | 3,355 | | 3,595 | |
Earnings per ordinary share (cents) | | 196.5 | | 189.5 | | 237.5 | | 230.1 | | 238.0 | | 229.3 | |
1. RSP share rights are explained in Note 33. Some RSP share rights have not vested and are not ordinary shares but do receive dividends. These RSP dividends are deducted to show the profit attributable to ordinary shareholders. In 2019, RSP share rights were antidilutive.
2. The Group has issued convertible loan capital which may convert into ordinary shares in the future (refer to Note 19 for further details). These convertible loan capital instruments are all dilutive, and diluted EPS is therefore calculated as if the instruments had been converted at the beginning of the year or, if later, the instruments’ issue date.
| 2019 Westpac Group Annual Report | 187 |
| | |
Notes to the financial statements
Note 9. Average balance sheet and interest rates1
The daily average balances of the Group’s interest earning assets and interest bearing liabilities are shown below along with their interest income or expense.
| | 2019 | | 2018 | | 2017 | |
| | Average | | Interest | | Average | | Average | | Interest | | Average | | Average | | Interest | | Average | |
| | Balance | | Income | | Rate | | Balance | | Income | | Rate | | Balance | | Income | | Rate | |
Consolidated | | $m | | $m | | % | | $m | | $m | | % | | $m | | $m | | % | |
Assets | | | | | | | | | | | | | | | | | | | |
Interest earning assets | | | | | | | | | | | | | | | | | | | |
Collateral paid | | | | | | | | | | | | | | | | | | | |
Australia | | 8,428 | | 152 | | 1.8 | | 5,239 | | 86 | | 1.6 | | 6,926 | | 65 | | 0.9 | |
New Zealand | | 364 | | 7 | | 1.9 | | 252 | | 4 | | 1.6 | | 733 | | 5 | | 0.7 | |
Other overseas | | 2,031 | | 42 | | 2.1 | | 2,594 | | 39 | | 1.5 | | 2,042 | | 26 | | 1.3 | |
Trading securities and financial assets measured at FVIS: | | | | | | | | | | | | | | | | | | | |
Australia | | 20,691 | | 468 | | 2.3 | | 17,420 | | 423 | | 2.4 | | 18,418 | | 416 | | 2.3 | |
New Zealand | | 3,862 | | 85 | | 2.2 | | 3,538 | | 80 | | 2.3 | | 4,238 | | 96 | | 2.3 | |
Other overseas | | 4,521 | | 109 | | 2.4 | | 3,160 | | 61 | | 1.9 | | 4,101 | | 62 | | 1.5 | |
Available-for-sale securities: | | | | | | | | | | | | | | | | | | | |
Australia | | - | | - | | - | | 55,458 | | 1,692 | | 3.1 | | 52,457 | | 1,573 | | 3.0 | |
New Zealand | | - | | - | | - | | 3,304 | | 136 | | 4.1 | | 3,479 | | 147 | | 4.2 | |
Other overseas | | - | | - | | - | | 2,778 | | 86 | | 3.1 | | 2,272 | | 75 | | 3.3 | |
Investment securities | | | | | | | | | | | | | | | | | | | |
Australia | | 56,875 | | 1,691 | | 3.0 | | - | | - | | - | | - | | - | | - | |
New Zealand | | 3,850 | | 130 | | 3.4 | | - | | - | | - | | - | | - | | - | |
Other overseas | | 3,062 | | 98 | | 3.2 | | - | | - | | - | | - | | - | | - | |
Loans and other receivables2: | | | | | | | | | | | | | | | | | | | |
Australia | | 589,427 | | 25,931 | | 4.4 | | 578,679 | | 25,700 | | 4.4 | | 558,361 | | 24,789 | | 4.4 | |
New Zealand | | 79,255 | | 3,650 | | 4.6 | | 73,902 | | 3,516 | | 4.8 | | 73,055 | | 3,463 | | 4.7 | |
Other overseas | | 26,558 | | 859 | | 3.2 | | 28,620 | | 748 | | 2.6 | | 26,212 | | 515 | | 2.0 | |
Total interest earning assets and interest income | | 798,924 | | 33,222 | | 4.2 | | 774,944 | | 32,571 | | 4.2 | | 752,294 | | 31,232 | | 4.2 | |
Non-Interest earning assets | | | | | | | | | | | | | | | | | | | |
Derivative financial instruments3 | | 25,959 | | | | | | 26,443 | | | | | | 28,897 | | | | | |
Life insurance assets | | 9,610 | | | | | | 10,664 | | | | | | 12,447 | | | | | |
All other assets3 | | 60,231 | | | | | | 61,259 | | | | | | 60,420 | | | | | |
Total non-interest earning assets3 | | 95,800 | | | | | | 98,366 | | | | | | 101,764 | | | | | |
Total assets3 | | 894,724 | | | | | | 873,310 | | | | | | 854,058 | | | | | |
1. The Group has adopted AASB 9 and AASB 15 from 1 October 2018. Comparatives have not been restated. In addition, the Group has made a number of presentational changes to the Balance Sheet and Income Statement. Comparatives have been restated. Refer to Note 1 for further detail.
2. For 2019, loans and other receivables are net of Stage 3 provisions to reflect the adoption of AASB 9 where interest income is determined based on their carrying value, net of Stage 3 provisions. Stages 1 and 2 provisions were not included in the average interest earning assets balance as interest income is determined based on the gross value of loans and other receivables. For 2018 and 2017, loans and other receivables are net of provisions for impairment charges on loans as interest income is determined based on their carrying value, net of provisions for impairment charges on loans.
3. Derivative assets for the year ended 30 September 2018 were restated from $34,702 million to $26,443 million (30 September 2017: $37,673 million to $28,897 million) and all other assets were restated from $61,938 million to $61,259 million (30 September 2017: $60,111 million to $60,420 million). Accordingly, total non-interest earning assets and total assets were restated.
188 | 2019 Westpac Group Annual Report | |
| | |
Notes to the financial statements
Note 9. Average balance sheet and interest rates1 (continued)
| | 2019 | | 2018 | | 2017 | |
| | Average | | Interest | | Average | | Average | |
Interest
| | Average | | Average | | Interest | | Average | |
| | Balance | | Expense | | Rate | | Balance | | Expense | | Rate | | Balance | | Expense | | Rate | |
Consolidated | | $m | | $m | | % | | $m | | $m | | % | | $m | | $m | | % | |
Liabilities | | | | | | | | | | | | | | | | | | | |
Interest bearing liabilities | | | | | | | | | | | | | | | | | | | |
Collateral received: | | | | | | | | | | | | | | | | | | | |
Australia | | 2,039 | | 41 | | 2.0 | | 2,383 | | 37 | | 1.6 | | 1,641 | | 15 | | 0.9 | |
New Zealand | | 390 | | 8 | | 2.1 | | 342 | | 6 | | 1.8 | | 98 | | 2 | | 2.0 | |
Other overseas | | 1,188 | | 8 | | 0.7 | | 184 | | 2 | | 1.1 | | 242 | | 2 | | 0.8 | |
Deposits and other borrowings: | | | | | | | | | | | | | | | | | | | |
Australia | | 425,799 | | 7,023 | | 1.6 | | 422,006 | | 7,308 | | 1.7 | | 409,586 | | 7,344 | | 1.8 | |
New Zealand | | 54,720 | | 1,235 | | 2.3 | | 51,368 | | 1,196 | | 2.3 | | 51,042 | | 1,173 | | 2.3 | |
Other overseas | | 26,270 | | 687 | | 2.6 | | 26,599 | | 517 | | 1.9 | | 24,085 | | 351 | | 1.5 | |
Loan capital: | | | | | | | | | | | | | | | | | | | |
Australia | | 15,080 | | 632 | | 4.2 | | 15,028 | | 635 | | 4.2 | | 15,841 | | 638 | | 4.0 | |
New Zealand | | 1,777 | | 91 | | 5.1 | | 1,645 | | 84 | | 5.1 | | 43 | | 2 | | 4.7 | |
Other overseas | | 1,324 | | 53 | | 4.0 | | 1,324 | | 55 | | 4.2 | | 1,324 | | 53 | | 4.0 | |
Other interest bearing liabilities2: | | | | | | | | | | | | | | | | | | | |
Australia | | 188,736 | | 5,937 | | 3.1 | | 177,746 | | 5,594 | | 3.1 | | 171,940 | | 5,343 | | 3.1 | |
New Zealand | | 15,665 | | 575 | | 3.7 | | 15,011 | | 591 | | 3.9 | | 16,366 | | 754 | | 4.6 | |
Other overseas | | 1,294 | | 25 | | 1.9 | | 1,873 | | 41 | | 2.2 | | 2,716 | | 39 | | 1.4 | |
Total interest bearing liabilities and interest expense | | 734,282 | | 16,315 | | 2.2 | | 715,509 | | 16,066 | | 2.2 | | 694,924 | | 15,716 | | 2.3 | |
Non-interest bearing | | | | | | | | | | | | | | | | | | | |
liabilities | | | | | | | | | | | | | | | | | | | |
Deposits and other borrowings: | | | | | | | | | | | | | | | | | | | |
Australia | | 42,455 | | | | | | 41,156 | | | | | | 39,355 | | | | | |
New Zealand | | 5,996 | | | | | | 5,204 | | | | | | 4,660 | | | | | |
Other overseas | | 819 | | | | | | 817 | | | | | | 867 | | | | | |
Derivative financial instruments3 | | 26,568 | | | | | | 26,218 | | | | | | 32,488 | | | | | |
Life insurance liabilities | | 7,653 | | | | | | 8,874 | | | | | | 10,560 | | | | | |
All other liabilities3 | | 13,187 | | | | | | 13,484 | | | | | | 12,628 | | | | | |
Total non-interest bearing liabilities3 | | 96,678 | | | | | | 95,753 | | | | | | 100,558 | | | | | |
Total liabilities3 | | 830,960 | | | | | | 811,262 | | | | | | 795,482 | | | | | |
Shareholders’ equity | | 63,714 | | | | | | 62,017 | | | | | | 58,556 | | | | | |
Non-controlling interests | | 50 | | | | | | 31 | | | | | | 20 | | | | | |
Total equity | | 63,764 | | | | | | 62,048 | | | | | | 58,576 | | | | | |
Total liabilities and equity3 | | 894,724 | | | | | | 873,310 | | | | | | 854,058 | | | | | |
1. The Group has adopted AASB 9 and AASB 15 from 1 October 2018. Comparatives have not been restated. In addition, the Group has made a number of presentational changes to the Balance Sheet and Income Statement. Comparatives have been restated. Refer to Note 1 for further detail.
2. Include net impact of Treasury balance sheet management activities and the Bank Levy.
3. Derivative liabilities for the year ended 30 September 2018 were restated from $37,504 million to $26,218 million (30 September 2017: $42,780 million to $32,488 million), and all other liabilities were restated from $12,199 million to $13,484 million (30 September 2017: $11,586 million to $12,628 million). Accordingly, total non-interest bearing liabilities, total liabilities and total liabilities and equity were restated.
| 2019 Westpac Group Annual Report | 189 |
| | |
Notes to the financial statements
Note 9. Average balance sheet and interest rates1 (continued)
Net interest income may vary from year to year due to changes in the volume of, and interest rates associated with, interest earning assets and interest bearing liabilities. The table below allocates the change in net interest income between changes in volume and interest rate for those assets and liabilities.
Calculation of variances
· volume changes are determined based on the movements in average asset and liability balances;
· interest rate changes are determined based on the change in interest rate associated with those assets and liabilities.
Where variances arise due to a combination of volume and interest rate changes, the absolute dollar value of each change is allocated in proportion to their impact on the total change.
| 2019 | 2018 |
Consolidated | Change due to | Change due to |
$m | Volume | Rate | Total | Volume | Rate | Total |
Interest earning assets | | | | | | |
Collateral paid: | | | | | | |
Australia | 52 | 14 | 66 | (16) | 37 | 21 |
New Zealand | 2 | 1 | 3 | (3) | 2 | (1) |
Other overseas | (8) | 11 | 3 | 7 | 6 | 13 |
Trading securities and financial assets measured at FVIS: | | | | | | |
Australia | 79 | (34) | 45 | (23) | 30 | 7 |
New Zealand | 7 | (2) | 5 | (16) | - | (16) |
Other overseas | 26 | 22 | 48 | (13) | 12 | (1) |
Investment securities2: | | | | | | |
Australia | 43 | (44) | (1) | 90 | 29 | 119 |
New Zealand | 22 | (28) | (6) | (7) | (4) | (11) |
Other overseas | 9 | 3 | 12 | 17 | (6) | 11 |
Loans and other receivables: | | | | | | |
Australia | 477 | (246) | 231 | 952 | (41) | 911 |
New Zealand | 255 | (121) | 134 | 39 | 14 | 53 |
Other overseas | (54) | 165 | 111 | 50 | 183 | 233 |
Total change in interest income | 910 | (259) | 651 | 1,077 | 262 | 1,339 |
Interest bearing liabilities | | | | | | |
Collateral received: | | | | | | |
Australia | (5) | 9 | 4 | 7 | 15 | 22 |
New Zealand | 1 | 1 | 2 | 5 | (1) | 4 |
Other overseas | 11 | (5) | 6 | - | - | - |
Deposits and other borrowings: | | | | | | |
Australia | 66 | (351) | (285) | 223 | (259) | (36) |
New Zealand | 78 | (39) | 39 | 7 | 16 | 23 |
Other overseas | (6) | 176 | 170 | 37 | 129 | 166 |
Loan capital: | | | | | | |
Australia | 2 | (5) | (3) | (33) | 30 | (3) |
New Zealand | 7 | - | 7 | 75 | 7 | 82 |
Other overseas | - | (2) | (2) | - | 2 | 2 |
Other interest bearing liabilities: | | | | | | |
Australia | 346 | (3) | 343 | 198 | 53 | 251 |
New Zealand | 26 | (42) | (16) | (74) | (89) | (163) |
Other overseas | (13) | (3) | (16) | (16) | 18 | 2 |
Total change in interest expense | 513 | (264) | 249 | 429 | (79) | 350 |
Change in net interest income: | | | | | | |
Australia | 242 | 40 | 282 | 608 | 216 | 824 |
New Zealand | 174 | (70) | 104 | - | 79 | 79 |
Other overseas | (19) | 35 | 16 | 40 | 46 | 86 |
Total change in net interest income | 397 | 5 | 402 | 648 | 341 | 989 |
1. The Group has adopted AASB 9 and AASB 15 from 1 October 2018. Comparatives have not been restated. In addition, the Group has made a number of presentational changes to the Balance Sheet and Income Statement. Comparatives have been restated. Refer to Note 1 for further detail.
2. The volume rate calculations for 2019 Investment securities has been completed against the equivalent Available-for-sale securities.
190 | 2019 Westpac Group Annual Report | |
| | |
Notes to the financial statements
FINANCIAL ASSETS AND FINANCIAL LIABILITIES
Accounting policy
Recognition Purchases and sales by regular way of financial assets, except for loans and receivables, are recognised on trade-date, the date on which the Group commits to purchase or sell the asset. Loans and receivables are recognised on settlement date, when cash is advanced to the borrowers. Financial liabilities are recognised when an obligation arises. Derecognition Financial assets are derecognised when the rights to receive cash flows from the asset have expired, or when the Group has either transferred its rights to receive cash flows from the asset or has assumed an obligation to pay the received cash flows in full under a ‘pass through’ arrangement and transferred substantially all the risks and rewards of ownership. There may be situations where the Group has partially transferred the risks and rewards of ownership but has neither transferred nor retained substantially all the risks and rewards of ownership. In such situations, the asset continues to be recognised on the balance sheet to the extent of the Group’s continuing involvement in the asset. Financial liabilities are derecognised when the obligation is discharged, cancelled or expires. Where an existing financial liability is replaced by another from the same lender on substantially different terms, or the terms of an existing liability are substantially modified, the exchange or modification is treated as a derecognition of the original liability and the recognition of a new liability, with the difference in the respective carrying amounts recognised in the income statement. The terms are deemed to be substantially different if the discounted present value of the cashflows under the new terms (discounted using the original effective interest rate) is at least 10% different from the discounted present value of the remaining cash flows of the original financial liability. Qualitative factors such as a change in the currency the instrument is denominated in, a change in the interest rate from fixed to floating and conversion features are also considered. Classification and measurement As comparatives have not been restated upon the adoption of AASB 9 the accounting policy applied in 2019 differs to that applied in comparative periods. The accounting policy applied in comparative periods is discussed in Note 39. The accounting policy applied in 2019 is as follows. Financial assets are grouped into the following classes: cash and balances with central banks; collateral paid, trading securities and financial assets measured at FVIS, derivative financial instruments, investment securities, loans, other financial assets and life insurance assets. Financial assets Financial assets are classified based on a) the business model within which the assets are managed, and b) whether the contractual cash flows of the instrument represent solely payment of principal and interest (SPPI). The Group determines the business model at the level that reflects how groups of financial assets are managed. When assessing the business model the Group considers factors including how performance and risks are managed, evaluated and reported and the frequency and volume of, and reason for, sales in previous periods and expectations of sales in future periods. When assessing whether contractual cash flows are SPPI, interest is defined as consideration primarily for the time value of money and the credit risk of the principal outstanding. The time value of money is defined as the element of interest that provides consideration only for the passage of time and not consideration for other risks or costs associated with holding the financial asset. Terms that could change the contractual cash flows so that they may not meet the SPPI criteria include contingent and leverage features, non-recourse arrangements, and features that could modify the time value of money. Debt instruments If the debt instruments have contractual cash flows which represent SPPI on the principal balance outstanding they are classified at: · amortised cost if they are held within a business model whose objective is achieved through holding the financial asset to collect these cash flows; or · FVOCI if they are held within a business model whose objective is achieved both through collecting these cash flows or selling the financial asset; or · FVIS if they are held within a business model whose objective is achieved through selling the financial asset. Debt instruments are measured at FVIS where the contractual cash flows do not represent SPPI on the principal balance outstanding or where it is designated at FVIS to eliminate or reduce an accounting mismatch. Debt instruments at amortised cost are initially recognised at fair value and subsequently measured at amortised cost using the effective interest rate method. They are presented net of provisions for expected credit losses determined using the ECL model. Refer to Notes 6 and 13 for further details. |
| 2019 Westpac Group Annual Report | 191 |
| | |
Notes to the financial statements
FINANCIAL ASSETS AND FINANCIAL LIABILITIES (continued)
Accounting policy (continued)
Debt instruments at FVOCI are measured at fair value with unrealised gains and losses recognised in other comprehensive income except for interest income, impairment charges and foreign exchange gains and losses, which are recognised in the income statement. Impairment on debt instruments at FVOCI is determined using the ECL model and is recognised in the income statement with a corresponding amount in other comprehensive income. There is no reduction of the carrying value of the debt security which remains at fair value. The cumulative gain or loss recognised in other comprehensive income is subsequently recognised in the income statement when the instrument is derecognised. Debt instruments at FVIS are measured at fair value with subsequent changes in fair value recognised in the income statement. Equity securities Equity securities are measured at FVOCI where they: · are not held for trading; and · an irrevocable election is made by the Group. Otherwise, they are measured at FVIS. Equity securities at FVOCI are measured at fair value with unrealised gains and losses recognised in other comprehensive income, except for dividend income which is recognised in the income statement. The cumulative gain or loss recognised in other comprehensive income is not subsequently recognised in the income statement when the instrument is disposed. Equity securities at FVIS are measured at fair value with subsequent changes in fair value recognised in the income statement. Financial liabilities Financial liabilities are grouped into the following classes: collateral received, deposits and other borrowings, other financial liabilities, derivative financial instruments, debt issues and loan capital. Financial liabilities are measured at amortised cost if they are not held for trading or designated at FVIS, otherwise they are measured at FVIS. Financial assets and financial liabilities measured at fair value through income statement are recognised initially at fair value. All other financial assets and financial liabilities are recognised initially at fair value plus or minus directly attributable transaction costs respectively. Further details of the accounting policy for each category of financial asset or financial liability mentioned above is set out in the note for the relevant item. The Group’s policies for determining the fair value of financial assets and financial liabilities are set out in Note 22. |
192 | 2019 Westpac Group Annual Report | |
| | |
Notes to the financial statements
Note 10. Trading securities and financial assets measured at FVIS1
Accounting policy
Trading securities Trading securities include actively traded debt (government and other) and equity instruments and those acquired for sale in the near term. As part of its trading activities, the Group also lends and borrows securities on a collateralised basis. Securities lent remain on the Group’s balance sheet and securities borrowed are not reflected on the Group’s balance sheet, as the risk and rewards of ownership remain with the initial holder. Where cash is provided as collateral, the amount advanced to or received from third parties is recognised as a receivable in collateral paid or as a borrowing in collateral received respectively. Reverse repurchase agreements Securities purchased under these agreements are not recognised on the balance sheet, as Westpac has not obtained the risks and rewards of ownership. The cash consideration paid is recognised as a reverse repurchase agreement, which forms part of a trading portfolio that is measured at fair value. Other financial assets measured at FVIS Other financial assets measured at FVIS include: · non-trading securities managed on a fair value basis; · non-trading debt securities that do not have contractual cash flows that represent SPPI on the principal balance outstanding; or · non-trading equity securities for which we have not made irrevocable designation to be measured at FVOCI. Gains and losses on these financial assets are recognised in the income statement. Interest earned from debt securities is recognised in interest income (Note 3) while dividends on equity securities are recognised in non-interest income (Note 4). |
| | Consolidated | | Parent Entity |
$m | 2019 | 2018 | 2017 | 2019 | 2018 |
Trading securities | 22,210 | 18,777 | 16,519 | 20,719 | 17,671 |
Reverse repurchase agreements | 6,833 | 1,379 | 6,887 | 6,731 | 1,379 |
Other financial assets measured at FVIS | 2,738 | 2,976 | 2,577 | 2,115 | 2,365 |
Total trading securities and financial assets measured at FVIS | 31,781 | 23,132 | 25,983 | 29,565 | 21,415 |
Trading securities include the following:
| | Consolidated | | Parent Entity |
$m | 2019 | 2018 | 2017 | 2019 | 2018 |
Government and semi-government securities | 16,625 | 13,328 | 11,402 | 15,585 | 12,519 |
Other debt securities | 5,497 | 5,354 | 5,049 | 5,046 | 5,057 |
Equity securities | 6 | 8 | 11 | 6 | 8 |
Other | 82 | 87 | 57 | 82 | 87 |
Total trading securities | 22,210 | 18,777 | 16,519 | 20,719 | 17,671 |
Other financial assets measured at FVIS include:
| | Consolidated | | Parent Entity |
$m | 2019 | 2018 | 2017 | 2019 | 2018 |
Other debt securities | 2,394 | 2,715 | 2,259 | 2,057 | 2,302 |
Equity securities | 344 | 261 | 318 | 58 | 63 |
Total other financial assets measured at FVIS | 2,738 | 2,976 | 2,577 | 2,115 | 2,365 |
1. The Group has adopted AASB 9 and AASB 15 from 1 October 2018. Comparatives have not been restated. In addition, the Group has made a number of presentational changes to the Balance Sheet and Income Statement. Comparatives have been restated. Refer to Note 1 for further detail.
| 2019 Westpac Group Annual Report | 193 |
| | |
Notes to the financial statements
Note 11. Available-for-sale securities/Investment securities
Accounting policy
As comparatives have not been restated upon the adoption of AASB 9 the accounting policy applied in 2019 differs to that applied in comparative years. The accounting policy applied in comparative years is discussed in Note 39. The accounting policy applied in 2019 is as follows. Investment securities include debt securities (government and other) and equity securities. It includes debt and equity securities that are measured at FVOCI and debt securities measured at amortised cost. These instruments are classified based on the criteria disclosed under the heading “Financial assets and financial liabilities” prior to Note 10. Debt securities measured at FVOCI Includes debt instruments that have contractual cash flows which represent SPPI on the principal balance outstanding and they are held within a business model whose objective is achieved both through collecting these cash flows or selling the financial asset. These securities are measured at fair value with gains and losses recognised in OCI except for interest income, impairment charges and foreign exchange gains and losses which are recognised in the income statement. Impairment is measured using the same ECL model applied to financial assets measured at amortised cost. Impairment is recognised in the income statement with a corresponding amount in OCI with no reduction of the carrying value of the debt security which remains at fair value. Refer to Note 13 for further details. The cumulative gain or loss recognised in OCI is subsequently recognised in the income statement when the instrument is disposed. Debt securities measured at amortised cost Include debt instruments that have contractual cash flows which represent SPPI on the principal balance outstanding and are held within a business model whose objective is achieved through holding the financial asset to collect these cash flows. These securities are initially recognised at fair value plus directly attributable transaction costs. They are subsequently measured at amortised cost using the effective interest rate method and are presented net of any provisions for ECL. Equity securities Equity securities are measured at FVOCI where they are not held for trading, the Group does not have control or significant influence over the investee and where an irrevocable election is made to measure them at FVOCI. These securities are measured at fair value with unrealised gains and losses recognised in OCI except for dividend income which is recognised in the income statement. The cumulative gain or loss recognised in OCI is not subsequently recognised in the income statement when the instrument is disposed. |
Transition to AASB 9
The following table shows how the available-for-sale securities under AASB 139 were classified on adoption of AASB 9 and the balance sheet line items they are reflected in. Refer to Note 1 for further details.
| Investment Securities | | Trading securities
and financial assets
measured at FVIS | |
$m | Debt securities at FVOCI | Equity securities at FVOCI | Debt securities at
amortised cost | | Equity securities
at FVIS | Total |
Available-for-sale securities | | | | | | |
Consolidated 1 October 2018 | | | | | | |
Debt securities | 59,924 | - | 811 | | - | 60,735 |
Equity securities | - | 109 | - | | 275 | 384 |
Total available-for-sale securities | 59,924 | 109 | 811 | | 275 | 61,119 |
Parent Entity 1 October 2018 | | | | | | |
Debt securities | 56,436 | - | 10 | | - | 56,446 |
Equity securities | - | 67 | - | | - | 67 |
Total available-for-sale securities | 56,436 | 67 | 10 | | - | 56,513 |
194 | 2019 Westpac Group Annual Report | |
| | |
Notes to the financial statements
Note 11. Available-for-sale securities/Investment securities1 (continued)
Balances recognised under AASB 9
$m | Consolidated 2019 | Parent Entity 2019 |
Investment securities | | |
Investment securities measured at FVOCI | | |
Government and semi-government debt securities | 53,389 | 50,980 |
Other debt securities | 19,058 | 17,325 |
Equity securities | 134 | 66 |
Total investment securities measured at FVOCI | 72,581 | 68,371 |
Investment securities measured at amortised cost | | |
Government and semi-government debt securities | 736 | 23 |
Other debt securities | 93 | 4 |
Total investment securities measured at amortised cost | 829 | 27 |
Provisions for ECL on debt securities at amortised cost | (9) | - |
Total net investment securities measured at amortised cost | 820 | 27 |
Total investment securities | 73,401 | 68,398 |
The expected credit losses recognised in relation to investment securities – debt securities are detailed in Note 13.
The following table shows the maturities of the Group’s investment securities as at 30 September 2019 and their weighted average yield. There are no tax-exempt securities.
| | | Over 1 | | Over 5 | | | | | | | |
| Within 1 year | | Year to 5
years | | years to
10 years | | Over
10 years | | No specific
maturity | | Total | Weighted average |
2019 | $m | % | $m | % | $m | % | $m | % | $m | % | $m | % |
Carrying amount | | | | | | | | | | | | |
Government and semi- government debt securities | 5,691 | 4.2% | 24,137 | 2.9% | 23,040 | 2.8% | 1,248 | 2.2% | - | - | 54,116 | 3.1% |
Other debt securities | 4,040 | 2.8% | 15,060 | 2.7% | 51 | 2.8% | - | - | - | - | 19,151 | 2.7% |
Equity securities | - | - | - | - | - | - | - | - | 134 | - | 134 | - |
Total by maturity | 9,731 | | 39,197 | | 23,091 | | 1,248 | | 134 | | 73,401 | |
The maturity profile is determined based upon contractual terms for investment securities.
Investment securities include:
· US Government treasury notes of $10,398 million (2018: $5,229 million, 2017: $6,796 million); and
· total holdings of debt securities, where the aggregate book value exceeds 10% of equity attributable to Westpac’s owners:
– Queensland Treasury Corporation totalling $13,218 million;
– Australian Commonwealth Government totalling $10,191 million; and
– New South Wales Treasury Corporation totalling $6,630 million.
Balances recognised under AASB 139
| Consolidated | Parent Entity |
$m | 2018 | 2017 | 2018 |
Available-for-sale securities | | | |
Government and semi-government securities | 42,979 | 43,382 | 40,345 |
Other debt securities | 17,756 | 16,863 | 16,101 |
Equity securities | 384 | 465 | 67 |
Total available-for-sale securities | 61,119 | 60,710 | 56,513 |
1. The Group has adopted AASB 9 and AASB 15 from 1 October 2018. Statutory comparatives have not been restated. In addition, the Group has made a number of presentational changes to the Balance Sheet and Income Statement. Comparatives have been restated. Refer to Note 1 for further detail.
| 2019 Westpac Group Annual Report | 195 |
| | |
Notes to the financial statements
Note 12. Loans1
Accounting policy
As comparatives have not been restated upon the adoption of AASB 9 the accounting policy applied in 2019 differs to that applied in comparative years. The accounting policy applied in comparative years is discussed in Note 39. The accounting policy applied in 2019 is as follows. Loans are financial assets initially recognised at fair value plus directly attributable transaction costs and fees. Loans are subsequently measured at amortised cost using the effective interest rate method where they have contractual cash flows which represent SPPI on the principal balance outstanding and they are held within a business model whose objective is achieved through holding the loans to collect these cash flows. They are presented net of any provisions for ECL. Loans are subsequently measured at FVIS where they do not have cash flows which represent SPPI, are held within a business model whose objective is achieved by selling the financial asset, or are designated at FVIS to eliminate or reduce an accounting mismatch. Refer to Note 22 for balances which are measured at fair value and amortised cost. Loan products that have both mortgage and deposit facilities are presented gross on the balance sheet, segregating the asset and liability component, because they do not meet the criteria to be offset. Interest earned on these products is presented on a net basis in the income statement as this reflects how the customer is charged. |
The loan portfolio is disaggregated by location of booking office and product type, as follows:
| Consolidated | Parent Entity |
$m | 2019 | 2018 | 2019 | 2018 |
Australia | | | | |
Housing | 449,201 | 444,741 | 449,192 | 444,730 |
Personal2 | 21,247 | 22,997 | 20,848 | 22,008 |
Business | 152,360 | 154,347 | 148,850 | 150,580 |
Total Australia | 622,808 | 622,085 | 618,890 | 617,318 |
New Zealand | | | | |
Housing | 47,731 | 44,772 | - | - |
Personal2 | 1,709 | 1,869 | - | - |
Business | 29,285 | 27,701 | 411 | 376 |
Total New Zealand | 78,725 | 74,342 | 411 | 376 |
Total other overseas | 16,845 | 16,077 | 15,738 | 14,881 |
Total loans | 718,378 | 712,504 | 635,039 | 632,575 |
Provisions for ECL on loans (refer to Note 13) | (3,608) | - | (3,103) | - |
Provisions for impairment charges on loans (refer to Note 13) | - | (2,814) | - | (2,407) |
Total net loans3 | 714,770 | 709,690 | 631,936 | 630,168 |
1. The Group has adopted AASB 9 and AASB 15 from 1 October 2018. Comparatives have not been restated. In addition, the Group has made a number of presentational changes to the Balance Sheet and Income Statement. Comparatives have been restated. Refer to Note 1 for further detail.
2. Margin lending and other which were separately presented in prior years are now included in Personal loans. Comparatives have been revised for consistency.
3. Total net loans include securitised loans of $7,737 million (2018: $7,135 million) for the Group and $91,061 million (2018: $85,965 million) for the Parent Entity.
196 | 2019 Westpac Group Annual Report | |
| | |
Notes to the financial statements
Note 12. Loans1 (continued)
The following table shows loans presented based on their industry classification:
Consolidated | | | | | |
$m | 2019 | 2018 | 2017 | 2016 | 2015 |
Australia | | | | | |
Accommodation, cafes and restaurants | 8,039 | 8,297 | 8,177 | 7,536 | 7,490 |
Agriculture, forestry and fishing | 9,210 | 8,642 | 8,182 | 7,953 | 7,667 |
Construction | 7,186 | 6,751 | 6,043 | 5,797 | 5,596 |
Finance and insurance | 14,069 | 14,059 | 12,923 | 14,298 | 13,175 |
Government, administration and defence | 753 | 628 | 554 | 675 | 796 |
Manufacturing | 9,337 | 9,298 | 9,054 | 9,140 | 9,342 |
Mining | 2,869 | 3,311 | 3,025 | 3,641 | 4,415 |
Property | 44,769 | 45,471 | 43,220 | 44,785 | 44,667 |
Property services and business services | 14,035 | 13,477 | 12,050 | 11,674 | 10,703 |
Services | 12,099 | 12,158 | 12,950 | 12,362 | 10,798 |
Trade | 16,144 | 16,501 | 16,063 | 16,044 | 15,484 |
Transport and storage | 8,268 | 8,853 | 8,624 | 9,015 | 9,940 |
Utilities | 4,077 | 4,350 | 5,237 | 4,025 | 3,554 |
Retail lending | 466,550 | 463,609 | 451,315 | 429,522 | 400,441 |
Other | 5,403 | 6,680 | 4,229 | 2,777 | 1,587 |
Total Australia | 622,808 | 622,085 | 601,646 | 579,244 | 545,655 |
New Zealand | | | | | |
Accommodation, cafes and restaurants | 355 | 323 | 290 | 256 | 182 |
Agriculture, forestry and fishing | 8,553 | 8,138 | 7,772 | 7,788 | 6,860 |
Construction | 493 | 502 | 447 | 396 | 359 |
Finance and insurance | 3,009 | 2,903 | 2,478 | 2,682 | 1,725 |
Government, administration and defence | 85 | 114 | 137 | 163 | 292 |
Manufacturing | 1,913 | 2,199 | 2,090 | 2,324 | 2,110 |
Mining | 278 | 206 | 141 | 280 | 407 |
Property | 6,412 | 5,997 | 5,858 | 5,925 | 5,301 |
Property services and business services | 1,182 | 1,073 | 1,113 | 1,084 | 925 |
Services | 1,973 | 1,733 | 1,810 | 1,396 | 1,173 |
Trade | 2,344 | 2,509 | 2,163 | 2,333 | 2,003 |
Transport and storage | 1,131 | 1,029 | 1,080 | 1,257 | 1,094 |
Utilities | 1,429 | 1,003 | 1,237 | 1,600 | 1,021 |
Retail lending | 49,473 | 46,613 | 45,190 | 45,011 | 40,277 |
Other | 95 | - | - | - | - |
Total New Zealand | 78,725 | 74,342 | 71,806 | 72,495 | 63,729 |
Other overseas | | | | | |
Accommodation, cafes and restaurants | 109 | 112 | 97 | 118 | 111 |
Agriculture, forestry and fishing | 150 | 19 | 5 | 12 | 568 |
Construction | 55 | 71 | 55 | 147 | 247 |
Finance and insurance2 | 4,628 | 4,774 | 4,289 | 2,767 | 4,297 |
Government, administration and defence | 2 | 25 | 4 | 4 | 130 |
Manufacturing | 3,784 | 3,257 | 2,982 | 2,619 | 3,848 |
Mining | 468 | 322 | 349 | 535 | 778 |
Property | 492 | 467 | 491 | 479 | 409 |
Property services and business services | 1,610 | 1,684 | 540 | 526 | 403 |
Services | 243 | 205 | 205 | 99 | 182 |
Trade2 | 2,293 | 2,312 | 2,680 | 3,463 | 2,898 |
Transport and storage | 997 | 1,232 | 1,389 | 1,186 | 1,099 |
Utilities | 1,086 | 736 | 514 | 442 | 722 |
Retail lending | 863 | 683 | 657 | 1,120 | 1,191 |
Other | 65 | 178 | 76 | - | 77 |
Total other overseas | 16,845 | 16,077 | 14,333 | 13,517 | 16,960 |
Total loans | 718,378 | 712,504 | 687,785 | 665,256 | 626,344 |
Provisions for ECL on loans (refer to Note 13) | (3,608) | - | - | - | - |
Provisions for impairment charges on loans (refer to Note 13) | - | (2,814) | (2,866) | (3,330) | (3,028) |
Total net loans | 714,770 | 709,690 | 684,919 | 661,926 | 623,316 |
1. The Group has adopted AASB 9 and AASB 15 from 1 October 2018. Comparatives have not been restated. In addition, the Group has made a number of presentational changes to the Balance Sheet and Income Statement. Comparatives have been restated. Refer to Note 1 for further detail.
2. 2018 comparatives have been revised for consistency.
| 2019 Westpac Group Annual Report | 197 |
| | |
Notes to the financial statements
Note 12. Loans1 (continued)
Parent Entity | | |
$m | 2019 | 2018 |
Australia | | |
Accommodation, cafes and restaurants | 7,967 | 8,228 |
Agriculture, forestry and fishing | 9,151 | 8,584 |
Construction | 6,810 | 6,247 |
Finance and insurance | 14,005 | 14,006 |
Government, administration and defence | 746 | 620 |
Manufacturing | 9,155 | 9,072 |
Mining | 2,849 | 3,279 |
Property | 44,707 | 45,471 |
Property services and business services | 13,192 | 12,433 |
Services | 11,853 | 11,891 |
Trade | 15,961 | 16,291 |
Transport and storage | 7,961 | 8,456 |
Utilities | 4,053 | 4,324 |
Retail lending | 465,535 | 462,568 |
Other | 4,945 | 5,848 |
Total Australia | 618,890 | 617,318 |
New Zealand | | |
Accommodation, cafes and restaurants | - | - |
Agriculture, forestry and fishing | 5 | 2 |
Construction | 8 | 5 |
Finance and insurance | - | - |
Government, administration and defence | - | - |
Manufacturing | 94 | 98 |
Mining | - | - |
Property | - | - |
Property services and business services | 7 | 8 |
Services | - | - |
Trade | 297 | 263 |
Transport and storage | - | - |
Utilities | - | - |
Retail lending | - | - |
Other | - | - |
Total New Zealand | 411 | 376 |
Other overseas | | |
Accommodation, cafes and restaurants | 67 | 70 |
Agriculture, forestry and fishing | 130 | 4 |
Construction | 47 | 59 |
Finance and insurance2 | 4,624 | 4,769 |
Government, administration and defence | 2 | 24 |
Manufacturing | 3,780 | 3,253 |
Mining | 465 | 323 |
Property | 226 | 234 |
Property services and business services | 1,528 | 1,595 |
Services | 216 | 187 |
Trade2 | 2,115 | 2,126 |
Transport and storage | 886 | 1,127 |
Utilities | 1,036 | 734 |
Retail lending | 587 | 277 |
Other | 29 | 99 |
Total other overseas | 15,738 | 14,881 |
Total loans | 635,039 | 632,575 |
Provisions for ECL on loans | (3,103) | - |
Provisions for impairment charges on loans | - | (2,407) |
Total net loans | 631,936 | 630,168 |
1. The Group has adopted AASB 9 and AASB 15 from 1 October 2018. Comparatives have not been restated. In addition, the Group has made a number of presentational changes to the Balance Sheet and Income Statement. Comparatives have been restated. Refer to Note 1 for further detail.
2. 2018 comparatives have been restated for consistency.
198 | 2019 Westpac Group Annual Report | |
| | |
Notes to the financial statements
Note 12. Loans1 (continued)
The following table shows the consolidated contractual maturity distribution of all loans by industry as at 30 September 2019:
Consolidated 2019 | | | | |
$m | Up to 1 year | 1 to 5 years | Over 5 years | Total |
Loans by type of customer in Australia | | | | |
Accommodation, cafes and restaurants | 2,776 | 4,883 | 380 | 8,039 |
Agriculture, forestry and fishing | 2,676 | 5,967 | 567 | 9,210 |
Construction | 1,785 | 4,514 | 887 | 7,186 |
Finance and insurance | 6,278 | 5,054 | 2,737 | 14,069 |
Government, administration and defence | 286 | 189 | 278 | 753 |
Manufacturing | 3,420 | 5,413 | 504 | 9,337 |
Mining | 353 | 1,734 | 782 | 2,869 |
Property | 18,410 | 24,821 | 1,538 | 44,769 |
Property services and business services | 3,011 | 8,969 | 2,055 | 14,035 |
Services | 3,915 | 6,395 | 1,789 | 12,099 |
Trade | 7,314 | 7,649 | 1,181 | 16,144 |
Transport and storage | 1,603 | 5,758 | 907 | 8,268 |
Utilities | 1,009 | 2,839 | 229 | 4,077 |
Retail lending | 21,725 | 12,394 | 432,431 | 466,550 |
Other | 718 | 3,511 | 1,174 | 5,403 |
Total Australia | 75,279 | 100,090 | 447,439 | 622,808 |
Total New Zealand | 19,124 | 12,790 | 46,811 | 78,725 |
Total other overseas | 6,021 | 9,529 | 1,295 | 16,845 |
Total loans | 100,424 | 122,409 | 495,545 | 718,378 |
| 2019 | 2018 |
| Loans at | Loans at | | Loans at | Loans at | |
| variable | fixed | | variable | fixed | |
Consolidated | interest | interest | | interest | interest | |
$m | rates | rates | Total | rates | rates | Total |
Interest rate segmentation of Group loans maturing after one year | | | | | | |
By offices in Australia | 418,494 | 129,035 | 547,529 | 423,886 | 127,077 | 550,963 |
By offices in New Zealand1 | 9,102 | 50,499 | 59,601 | 10,634 | 45,852 | 56,486 |
By offices in other overseas1 | 9,881 | 943 | 10,824 | 8,182 | 927 | 9,109 |
Total loans maturing after one year | 437,477 | 180,477 | 617,954 | 442,702 | 173,856 | 616,558 |
1. The Group has adopted AASB 9 and AASB 15 from 1 October 2018. Comparatives have not been restated. In addition, the Group has made a number of presentational changes to the Balance Sheet and Income Statement. Comparatives have been restated. Refer to Note 1 for further detail.
| 2019 Westpac Group Annual Report | 199 |
| | |
Notes to the financial statements
Note 13. Provisions for expected credit losses/impairment charges
Accounting policy
As comparatives have not been restated upon the adoption of AASB 9 the accounting policy applied in 2019 differs to that applied in comparative years. The accounting policy applied in comparative years is discussed in Note 39. The accounting policy applied in 2019 is as follows. Note 6 provides details of impairment charges. Impairment under AASB 9 applies to all financial assets at amortised cost, lease receivables, debt securities measured at FVOCI and credit commitments. The ECL determined under AASB 9 is recognised as follows: · Loans (including lease receivables), debt securities at amortised cost and due from subsidiaries: as a reduction of the carrying value of the financial asset through an offsetting provision account (refer to Notes 11 and 12); · Debt securities at FVOCI: in reserves in other comprehensive income with no reduction of the carrying value of the debt security itself (refer to Notes 11 and 28); and · Credit commitments: as a provision (refer to Note 27). Measurement The Group calculates the provisions for ECL based on a three stage approach. ECL are a probability-weighted estimate of the cash shortfalls expected to result from defaults over the relevant timeframe. They are determined by evaluating a range of possible outcomes and taking into account the time value of money, past events, current conditions and forecasts of future economic conditions. The models use three main components to determine the ECL (as well as the time value of money) including: · Probability of default (PD): the probability that a counterparty will default; · Loss given default (LGD): the loss that is expected to arise in the event of a default; and · Exposure at default (EAD): the estimated outstanding amount of credit exposure at the time of the default. Model stages The three stages are as follows: Stage 1: 12 months ECL – performing For financial assets where there has been no significant increase in credit risk since origination a provision for 12 months ECL is recognised. Stage 2: Lifetime ECL – performing For financial assets where there has been a significant increase in credit risk since origination but where the asset is still performing a provision for lifetime ECL is recognised. The indicators of a significant increase in credit risk are described on the following page. Stage 3: Lifetime ECL – non-performing For financial assets that are non-performing a provision for lifetime ECL is recognised. Indicators include a breach of contract with the Group such as a default on interest or principal payments, a borrower experiencing significant financial difficulties or observable economic conditions that correlate to defaults on a group of loans. Financial assets in stage 3 are those that are in default. A default occurs when Westpac considers that the customer is unlikely to repay its credit obligations in full, irrespective of recourse by the Group to actions such as realising security, or the customer is more than 90 days past due on any material credit obligation. This definition is aligned to the APRA regulatory definition of default. Collective and individual assessment Financial assets that are in stages 1 and 2 are assessed on a collective basis as are financial assets in stage 3 below specified thresholds. Financial assets that are collectively assessed are grouped in pools of similar assets with similar credit risk characteristics including the type of product and the customer risk grade. Those financial assets in stage 3 above the specified thresholds are assessed on an individual basis. Expected life In considering the lifetime time frame for expected credit losses in stages 2 and 3, the standard generally requires use of the remaining contractual life adjusted where appropriate for prepayments, extension and other options. For certain revolving credit facilities which include both a drawn and undrawn component (e.g. credit cards and revolving lines of credit), the Group’s contractual ability to demand repayment and cancel the undrawn commitment does not limit our exposure to credit losses to the contractual notice period. For these facilities, lifetime is based on historical behaviour. |
200 | 2019 Westpac Group Annual Report | |
| | |
Notes to the financial statements
Note 13. Provisions for expected credit losses/impairment charges (continued)
Accounting policy (continued)
Movement between stages Assets may move in both directions through the stages of the impairment model. Assets previously in stage 2 may move back to stage 1 if it is no longer considered that there has been a significant increase in credit risk. Similarly, assets in stage 3 may move back to stage 1 or stage 2 if they are no longer assessed to be non-performing. Critical accounting assumptions and estimates Key judgements include when a significant increase in credit risk has occurred and estimation of forward looking macroeconomic information. Other factors which can impact the provision include the borrower’s financial situation, the realisable value of collateral, the Group’s position relative to other claimants, the reliability of customer information and the likely cost and duration of recovering the loan. Significant increase in credit risk Determining when a financial asset has experienced a significant increase in credit risk since origination is a critical accounting judgement which is primarily based on changes in internal customer risk grades since origination of the facility. A change in an internal customer risk grade is based on both quantitative and qualitative factors. The change in the internal customer risk grade that the Group uses to represent a significant increase in credit risk is based on a sliding scale. This means that a higher credit quality exposure at origination would require a more significant downgrade compared to a lower credit quality exposure before it is considered to have experienced a significant increase in credit risk. The Group does not rebut the presumption that instruments that are 30 days past due have experienced a significant increase in risk but this is used as a backstop rather than the primary indicator. In addition, retail accounts in hardship are considered to have experienced a significant increase in credit risk. The Group does not apply the low credit risk exemption which assumes investment grade facilities do not have a significant increase in credit risk. Forward looking macroeconomic information The measurement of ECL for each stage and the assessment of significant increase in credit risk consider information about past events and current conditions as well as reasonable and supportable projections of future events and economic conditions. The estimation of forward looking information is a critical accounting judgement. The Group considers three future macroeconomic scenarios including a base case scenario along with upside and downside scenarios. The macroeconomic variables used in these scenarios, based on current economic forecasts, include (but are not limited to) unemployment rates, real gross domestic product growth rates and residential and commercial property price indices. · Base case scenario This scenario utilises the internal Westpac economics forecast used for strategic decision making and forecasting. · Upside scenario This scenario represents a modest improvement on the base case scenario. · Downside scenario This scenario represents a moderate recession. The macroeconomic scenarios are weighted based on the Group’s best estimate of the relative likelihood of each scenario. The weighting applied to each of the three macroeconomic scenarios takes into account historical frequency, current trends, and forward looking conditions. The macroeconomic variables and probability weightings of the three macroeconomic scenarios are subject to the approval of the Group Chief Financial Officer and Chief Risk Officer with oversight from the Board of Directors (and its Committees). Where appropriate, adjustments will be made to modelled outcomes to reflect reasonable and supportable information not already incorporated in the models. Judgements can change with time as new information becomes available which could result in changes to the provision for expected credit losses. |
| 2019 Westpac Group Annual Report | 201 |
| | |
Notes to the financial statements
Note 13. Provisions for expected credit losses/impairment charges (continued)
Loans and credit commitments
The reconciliation of the provision for ECL tables for loans and credit commitments as at 30 September 2019 below are based on the requirements of AASB 9. They have been determined by an aggregation of monthly movements over the year. The key line items in the reconciliation represent the following:
· The transfers between stages lines represent transfers between stage 1, stage 2 and stage 3 prior to remeasurement of the provision for ECL.
· The business activity during the year line represents new accounts originated during the year net of those that were derecognised due to final repayments during the year.
· The net remeasurement of ECL line represents the impact on the provision for ECL due to changes in credit quality during the period (including transfers between stages), changes due to forward looking economic scenarios and partial repayments and additional drawdowns on existing facilities over the year.
· Write-offs represent a reduction in the provision for ECL as a result of derecognition of exposures where there is no reasonable expectation of full recovery.
202 | 2019 Westpac Group Annual Report | |
| | |
Notes to the financial statements
Note 13. Provisions for expected credit losses/impairment charges (continued)
Consolidated
$m | Performing | Non-performing | Collectively
assessed provisions | Individually
assessed provisions | Total |
Stage 1 | Stage 2 | Stage 3 |
Provision for impairment charges as at 30 September 2018 | - | - | - | 2,631 | 422 | 3,053 |
Restatement for adoption of AASB 9 | 877 | 1,884 | 1,272 | (2,631) | (422) | 980 |
Restated provision for ECL as at 1 October 2018 | 877 | 1,884 | 1,272 | - | - | 4,033 |
Transfers to Stage 1 | 1,458 | (1,404) | (54) | - | - | - |
Transfers to Stage 2 | (242) | 956 | (714) | - | - | - |
Transfers to Stage 3 | (5) | (621) | 626 | - | - | - |
Business activity during the year | 179 | (19) | (330) | - | - | (170) |
Net remeasurement of provision for ECL | (1,385) | 874 | 1,647 | - | - | 1,136 |
Write-offs | - | - | (1,154) | - | - | (1,154) |
Exchange rate and other adjustments | 2 | 4 | 62 | - | - | 68 |
Total provision for ECL on loans and credit commitments as at 30 September 2019 | 884 | 1,674 | 1,355 | - | - | 3,913 |
Presented as: | | | | | | |
Provision for ECL on credit commitments (refer to Note 27) | 121 | 178 | 6 | - | - | 305 |
Provision for ECL on loans (refer to Note 12) | 763 | 1,496 | 1,349 | - | - | 3,608 |
Total provision for ECL on loans and credit commitments as at 30 September 2019 | 884 | 1,674 | 1,355 | - | - | 3,913 |
Of which: | | | | | | |
Individually assessed provisions | - | - | 412 | - | - | 412 |
Collectively assessed provisions | 884 | 1,674 | 943 | - | - | 3,501 |
Total provision for ECL on loans and credit commitments as at 30 September 2019 | 884 | 1,674 | 1,355 | - | - | 3,913 |
The provisions for ECL on loans can be further disaggregated into the following classes:
Consolidated
Housing loans
$m | Performing | Non-performing | Collectively
assessed provisions | Individually
assessed provisions | Total |
Stage 1 | Stage 2 | Stage 3 |
Provision for impairment charges as at 30 September 2018 | - | - | - | 385 | 97 | 482 |
Restatement for adoption of AASB 9 | 130 | 351 | 501 | (385) | (97) | 500 |
Restated provision for ECL as at 1 October 2018 | 130 | 351 | 501 | - | - | 982 |
Transfers to Stage 1 | 343 | (317) | (26) | - | - | - |
Transfers to Stage 2 | (38) | 396 | (358) | - | - | - |
Transfers to Stage 3 | - | (145) | 145 | - | - | - |
Business activity during the year | 17 | (35) | (141) | - | - | (159) |
Net remeasurement of provision for ECL | (289) | 104 | 567 | - | - | 382 |
Write-offs | - | - | (119) | - | - | (119) |
Exchange rate and other adjustments | - | - | 22 | - | - | 22 |
Total provision for ECL on loans and credit commitments as at 30 September 2019 | 163 | 354 | 591 | - | - | 1,108 |
Presented as: | | | | | | |
Provision for ECL on credit commitments (refer to Note 27) | 5 | 2 | - | - | - | 7 |
Provision for ECL on loans (refer to Note 12) | 158 | 352 | 591 | - | - | 1,101 |
Total provision for ECL on loans and credit commitments as at 30 September 2019 | 163 | 354 | 591 | - | - | 1,108 |
| 2019 Westpac Group Annual Report | 203 |
| | |
Notes to the financial statements
Note 13. Provisions for expected credit losses/impairment charges (continued)
Consolidated
Personal loans
$m | Performing | Non-performing | Collectively
assessed provisions | Individually
assessed provisions | Total |
Stage 1 | Stage 2 | Stage 3 |
Provision for impairment charges as at 30 September 2018 | - | - | - | 761 | 3 | 764 |
Restatement for adoption of AASB 9 | 263 | 589 | 240 | (761) | (3) | 328 |
Restated provision for ECL as at 1 October 2018 | 263 | 589 | 240 | - | - | 1,092 |
Transfers to Stage 1 | 849 | (839) | (10) | - | - | - |
Transfers to Stage 2 | (148) | 368 | (220) | - | - | - |
Transfers to Stage 3 | (2) | (350) | 352 | - | - | - |
Business activity during the year | 62 | (18) | (160) | - | - | (116) |
Net remeasurement of provision for ECL | (757) | 708 | 838 | - | - | 789 |
Write-offs | - | - | (822) | - | - | (822) |
Exchange rate and other adjustments | 1 | 1 | 30 | - | - | 32 |
Total provision for ECL on loans and credit commitments as at 30 September 2019 | 268 | 459 | 248 | - | - | 975 |
Presented as: | | | | | | |
Provision for ECL on cedit commitments (refer to Note 27) | 36 | 35 | - | - | - | 71 |
Provision for ECL on loans (refer to Note 12) | 232 | 424 | 248 | - | - | 904 |
Total provision for ECL on loans and credit commitments as at 30 September 2019 | 268 | 459 | 248 | - | - | 975 |
Consolidated
Business loans
$m | Performing | Non-performing | Collectively
assessed provisions | Individually
assessed provisions | Total |
Stage 1 | Stage 2 | Stage 3 |
Provision for impairment charges as at 30 September 2018 | - | - | - | 1,485 | 322 | 1,807 |
Restatement for adoption of AASB 9 | 484 | 944 | 531 | (1,485) | (322) | 152 |
Restated provision for ECL as at 1 October 2018 | 484 | 944 | 531 | - | - | 1,959 |
Transfers to Stage 1 | 266 | (248) | (18) | - | - | - |
Transfers to Stage 2 | (56) | 192 | (136) | - | - | - |
Transfers to Stage 3 | (3) | (126) | 129 | - | - | - |
Business activity during the year | 100 | 34 | (29) | - | - | 105 |
Net remeasurement of provision for ECL | (339) | 62 | 242 | - | - | (35) |
Write-offs | - | - | (213) | - | - | (213) |
Exchange rate and other adjustments | 1 | 3 | 10 | - | - | 14 |
Total provision for ECL on loans and credit commitments as at 30 September 2019 | 453 | 861 | 516 | - | - | 1,830 |
Presented as: | | | | | | |
Provision for ECL on credit commitments (refer to Note 27) | 80 | 141 | 6 | - | - | 227 |
Provision for ECL on loans (refer to Note 12) | 373 | 720 | 510 | - | - | 1,603 |
Total provision for ECL on loans and credit commitments as at 30 September 2019 | 453 | 861 | 516 | - | - | 1,830 |
204 | 2019 Westpac Group Annual Report | |
| | |
Notes to the financial statements
Note 13. Provisions for expected credit losses/impairment charges (continued)
The following table reconciles the 30 September 2019 provision for ECL on loans and commitments for the Parent Entity based on the requirements of AASB 9.
Parent Entity
$m | Performing | Non-performing | Collectively
assessed provisions | Individually
assessed provisions | Total |
Stage 1 | Stage 2 | Stage 3 |
Provision for impairment charges as at 30 September 2018 | - | - | - | 2,238 | 375 | 2,613 |
Restatement for adoption of AASB 9 | 741 | 1,605 | 1,113 | (2,238) | (375) | 846 |
Restated provision for ECL as at 1 October 2018 | 741 | 1,605 | 1,113 | - | - | 3,459 |
Transfers to Stage 1 | 1,191 | (1,153) | (38) | - | - | - |
Transfers to Stage 2 | (220) | 860 | (640) | - | - | - |
Transfers to Stage 3 | (3) | (554) | 557 | - | - | - |
Business activity during the year | 168 | 7 | (358) | - | - | (183) |
Net remeasurement of provision for ECL | (1,130) | 654 | 1,552 | - | - | 1,076 |
Write-offs | - | - | (1,023) | - | - | (1,023) |
Exchange rate and other adjustments | - | 1 | 48 | - | - | 49 |
Total provision for ECL on loans and credit commitments as at 30 September 2019 | 747 | 1,420 | 1,211 | - | - | 3,378 |
Presented as: | | | | | | |
Provision for ECL on credit commitments (refer to Note 27) | 107 | 163 | 5 | - | - | 275 |
Provision for ECL on loans (refer to Note 12) | 640 | 1,257 | 1,206 | - | - | 3,103 |
Total provision for ECL on loans and credit commitments as at 30 September 2019 | 747 | 1,420 | 1,211 | - | - | 3,378 |
Of which: | | | | | | |
Individually assessed provisions | - | - | 364 | - | - | 364 |
Collectively assessed provisions | 747 | 1,420 | 847 | - | - | 3,014 |
Total provision for ECL on loans and credit commitments as at 30 September 2019 | 747 | 1,420 | 1,211 | - | - | 3,378 |
Parent Entity
Housing loans
$m | Performing | Non-performing | Collectively
assessed provisions | Individually
assessed provisions | Total |
Stage 1 | Stage 2 | Stage 3 |
Provision for impairment charges as at 30 September 2018 | - | - | - | 516 | 82 | 598 |
Restatement for adoption of AASB 9 | 105 | 334 | 402 | (516) | (82) | 243 |
Restated provision for ECL as at 1 October 2018 | 105 | 334 | 402 | - | - | 841 |
Transfers to Stage 1 | 322 | (302) | (20) | - | - | - |
Transfers to Stage 2 | (36) | 386 | (350) | - | - | - |
Transfers to Stage 3 | - | (141) | 141 | - | - | - |
Business activity during the year | 15 | (33) | (127) | - | - | (145) |
Net remeasurement of provision for ECL | (265) | 91 | 606 | - | - | 432 |
Write-offs | - | - | (115) | - | - | (115) |
Exchange rate and other adjustments | - | - | 20 | - | - | 20 |
Total provision for ECL on loans and credit commitments as at 30 September 2019 | 141 | 335 | 557 | - | - | 1,033 |
Presented as: | | | | | | |
Provision for ECL on credit commitments (refer to Note 27) | 4 | 1 | - | - | - | 5 |
Provision for ECL on loans (refer to Note 12) | 137 | 334 | 557 | - | - | 1,028 |
Total provision for ECL on loans and credit commitments as at 30 September 2019 | 141 | 335 | 557 | - | - | 1,033 |
| 2019 Westpac Group Annual Report | 205 |
| | |
Notes to the financial statements
Note 13. Provisions for expected credit losses/impairment charges (continued)
The provisions for ECL on loans can be further disaggregated into the following classes:
Parent Entity
Personal loans
$m | Performing | Non-performing | Collectively
assessed provisions | Individually
assessed provisions | Total |
Stage 1 | Stage 2 | Stage 3 |
Provision for impairment charges as at 30 September 2018 | - | - | - | 524 | 3 | 527 |
Restatement for adoption of AASB 9 | 215 | 540 | 200 | (524) | (3) | 428 |
Restated provision for ECL as at 1 October 2018 | 215 | 540 | 200 | - | - | 955 |
Transfers to Stage 1 | 635 | (633) | (2) | - | - | - |
Transfers to Stage 2 | (138) | 319 | (181) | - | - | - |
Transfers to Stage 3 | (1) | (311) | 312 | - | - | - |
Business activity during the year | 62 | (11) | (158) | - | - | (107) |
Net remeasurement of provision for ECL | (544) | 497 | 753 | - | - | 706 |
Write-offs | - | - | (733) | - | - | (733) |
Exchange rate and other adjustments | - | - | 22 | - | - | 22 |
Total provision for ECL on loans and credit commitments as at 30 September 2019 | 229 | 401 | 213 | - | - | 843 |
Presented as: | | | | | | |
Provision for ECL on credit commitments (refer to Note 27) | 29 | 32 | - | - | - | 61 |
Provision for ECL on loans (refer to Note 12) | 200 | 369 | 213 | - | - | 782 |
Total provision for ECL on loans and credit commitments as at 30 September 2019 | 229 | 401 | 213 | - | - | 843 |
Parent Entity
Business loans
$m | Performing | Non-performing | Collectively
assessed provisions | Individually
assessed provisions | Total |
Stage 1 | Stage 2 | Stage 3 |
Provision for impairment charges as at 30 September 2018 | - | - | - | 1,198 | 290 | 1,488 |
Restatement for adoption of AASB 9 | 421 | 731 | 511 | (1,198) | (290) | 175 |
Restated provision for ECL as at 1 October 2018 | 421 | 731 | 511 | - | - | 1,663 |
Transfers to Stage 1 | 234 | (218) | (16) | - | - | - |
Transfers to Stage 2 | (46) | 155 | (109) | - | - | - |
Transfers to Stage 3 | (2) | (102) | 104 | - | - | - |
Business activity during the year | 91 | 51 | (73) | - | - | 69 |
Net remeasurement of provision for ECL | (321) | 66 | 193 | - | - | (62) |
Write-offs | - | - | (175) | - | - | (175) |
Exchange rate and other adjustments | - | 1 | 6 | - | - | 7 |
Total provision for ECL on loans and credit commitments as at 30 September 2019 | 377 | 684 | 441 | - | - | 1,502 |
Presented as: | | | | | | |
Provision for ECL on credit commitments (refer to Note 27) | 74 | 130 | 5 | - | - | 209 |
Provision for ECL on loans (refer to Note 12) | 303 | 554 | 436 | - | - | 1,293 |
Total provision for ECL on loans and credit commitments as at 30 September 2019 | 377 | 684 | 441 | - | - | 1,502 |
206 | 2019 Westpac Group Annual Report | |
| | |
Notes to the financial statements
Note 13. Provisions for expected credit losses/impairment charges (continued)
Impact of changes in credit exposures on the provision for ECL
· Stage 1 exposures had a net increase of $7.6 billion for the Group and $4.1 billion for the Parent Entity driven by housing and business portfolio growth, partly offset by net transfers from Stage 1 to Stage 2 and Stage 3 and repayments. Stage 1 ECL has a marginal increase driven by the exposure growth.
· Stage 2 credit exposures reduced by $2.1 billion for both the Group and the Parent Entity mainly driven by reduction in Stage 2 balances in personal portfolio. The Stage 2 exposure decrease has been driven by lower delinquent balances in the Australian personal portfolio. Stage 2 ECL has decreased.
· Stage 3 credit exposures had a net increase of $0.9 billion for both the Group and the Parent Entity driven by net transfers to Stage 3 from Stage 1 and Stage 2 with the increase driven by housing and business portfolio. The increase in Stage 3 exposures is in line with increase in 90 days past due for the home loans portfolio. Stage 3 ECL has increased in line with the increase in Stage 3 exposures.
Sensitivity of the provision for ECL
As noted in the accounting policy, the critical accounting assumptions in determining the provision for ECL are the determination of a significant increase in credit risk and the use of probability weighted forward looking macroeconomic scenarios.
Staging sensitivity
If 1% of the stage 1 gross exposure from loans and credit commitments (calculated on a 12 month ECL) was reflected in stage 2 (calculated on a lifetime ECL) the provision for ECL would increase by $236 million for the Group and $209 million for the Parent Entity based on applying the average provision coverage ratios by stage to the movement in the gross exposure by stage.
Weighting of macroeconomic scenarios
The Group uses three macro-economic scenarios which are probability weighted based on the Group’s best estimate of the relative likelihood of each scenario.
The Group assigned a weighting of 62.5% to the base case scenario, 27.5% to the downside scenario and 10% to the upside scenario as at 30 September 2019. During September 2019 there was a 2.5% reduction in the weighting on the base case scenario from 65% and a corresponding 2.5% increase in the weighting on the downside scenario from 25%. The increase in weighting to the downside scenario was primarily driven by global economic uncertainties.
The base case scenario utilises Westpac Economics forecasts and assumes the following one-year outlook: a GDP growth of 2.5%, a reduction in the rate of growth in commercial property prices to 1.1%, a return to positive growth of 1% in residential property prices, a 50bps reduction in the cash rate to 0.50% and an increase in the unemployment rate to 5.6%.
The downside scenario represents a moderate recession. In this scenario there is negative GDP growth, declines in commercial and residential property prices and an increase in the unemployment rate.
The following table shows the reported provision for ECL based on the probability weighted scenarios and what the provisions for ECL would be assuming a 100% weighting is applied to the base case scenario and to the downside scenario (with all other assumptions held constant).
$m | Consolidated | Parent Entity |
Reported probability-weighted ECL | 3,913 | 3,378 |
100% base case ECL | 2,748 | 2,387 |
100% downside ECL | 7,065 | 6,067 |
| 2019 Westpac Group Annual Report | 207 |
| | |
Notes to the financial statements
Note 13. Provisions for expected credit losses/impairment charges (continued)
Investment Securities – debt securities
The following table reconciles the 30 September 2019 provision for ECL on debt securities based on the requirements of AASB 9.
| | | Total |
| | Debt | Investment |
| Debt | securities at | securities - |
| securities at | amortised | debt |
$m | FVOCI1 | cost | securities |
Consolidated | | | |
Provision for impairment charges as at 30 September 2018 | - | - | - |
Restatement for adoption of AASB 9 | 2 | 9 | 11 |
Restated provision for ECL as at 1 October 2018 | 2 | 9 | 11 |
Stage 1 - change in the provision during the year | - | - | - |
Total provision for ECL on investment securities - debt securities as at 30 September 2019 | 2 | 9 | 11 |
Parent Entity | | | |
Provision for impairment charges as at 30 September 2018 | - | - | - |
Restatement for adoption of AASB 9 | 2 | - | 2 |
Restated provision for ECL as at 1 October 2018 | 2 | - | 2 |
Stage 1 - change in the provision during the year | - | - | - |
Total provision for ECL on investment securities - debt securities as at 30 September 2019 | 2 | - | 2 |
As comparatives have not been restated for the adoption of AASB 9, the following table reconciles the provision for impairment charges on loans and credit commitments based on the requirements of AASB 139 for prior years.
| Consolidated | Parent Entity |
$m | 2018 | 2017 | 2018 |
Individually assessed provisions | | | |
Opening balance | 480 | 869 | 417 |
Provisions raised | 371 | 610 | 341 |
Write-backs | (150) | (288) | (131) |
Write-offs | (269) | (688) | (248) |
Interest adjustment | (11) | (16) | (11) |
Other adjustments | 1 | (7) | 7 |
Closing balance | 422 | 480 | 375 |
Collectively assessed provisions | | | |
Opening balance | 2,639 | 2,733 | 2,180 |
Provisions raised | 668 | 699 | 610 |
Write-offs | (858) | (968) | (742) |
Interest adjustment | 179 | 188 | 148 |
Other adjustments | 3 | (13) | 42 |
Closing balance | 2,631 | 2,639 | 2,238 |
Total provisions for impairment charges on loans and credit commitments | 3,053 | 3,119 | 2,613 |
Less provisions for credit commitments (refer to Note 27) | (239) | (253) | (206) |
Total provisions for impairment charges on loans | 2,814 | 2,866 | 2,407 |
There were no provisions for impairment charges in prior years under AASB 139 for the securities included in investment securities (which were previously classified as Available-for-sale securities) or for due from subsidiaries as no impairment had been incurred.
1. Impairment on debt securities at FVOCI is recognised in the income statement with a corresponding amount in other comprehensive income (refer to Note 28). There is no reduction of the carrying value of the debt securities which remain at fair value (refer to Note 11).
208 | 2019 Westpac Group Annual Report | |
| | |
Notes to the financial statements
Note 13. Provisions for expected credit losses/impairment charges (continued)
The following table presents provisions for expected credit losses (for 30 September 2019) and provisions for impairment charges (for prior years) on loans and credit commitments by industry classification for the past five years:
Consolidated | 2019 | 2018 | 2017 | 2016 | 2015 |
| $m | % | $m | % | $m | % | $m | % | $m | % |
Australia | | | | | | | | | | |
Accommodation, cafes and restaurants | 75 | 1.9 | 62 | 2.0 | 67 | 2.1 | 95 | 2.7 | 86 | 2.6 |
Agriculture, forestry and fishing | 93 | 2.4 | 69 | 2.3 | 59 | 1.9 | 74 | 2.1 | 115 | 3.4 |
Construction | 148 | 3.8 | 93 | 3.0 | 86 | 2.8 | 86 | 2.4 | 85 | 2.5 |
Finance and insurance | 55 | 1.4 | 67 | 2.2 | 53 | 1.7 | 131 | 3.7 | 124 | 3.7 |
Manufacturing | 111 | 2.8 | 196 | 6.4 | 164 | 5.3 | 278 | 7.7 | 219 | 6.6 |
Mining | 36 | 0.9 | 91 | 3.0 | 131 | 4.2 | 246 | 6.8 | 190 | 5.7 |
Property | 216 | 5.5 | 204 | 6.7 | 240 | 7.7 | 287 | 8.0 | 314 | 9.4 |
Property services and business services | 230 | 5.9 | 128 | 4.2 | 155 | 5.0 | 216 | 6.0 | 95 | 2.8 |
Services | 175 | 4.5 | 137 | 4.5 | 126 | 4.0 | 116 | 3.2 | 56 | 1.7 |
Trade | 242 | 6.2 | 199 | 6.5 | 183 | 5.9 | 213 | 5.9 | 209 | 6.3 |
Transport and storage | 109 | 2.8 | 79 | 2.6 | 92 | 2.9 | 73 | 2.0 | 142 | 4.3 |
Utilities | 17 | 0.4 | 13 | 0.4 | 15 | 0.5 | 9 | 0.2 | 27 | 0.8 |
Retail lending | 1,890 | 48.3 | 1,200 | 39.3 | 1,229 | 39.4 | 1,102 | 30.6 | 1,046 | 31.4 |
Other | 109 | 2.8 | 106 | 3.5 | 92 | 2.9 | 138 | 3.8 | 119 | 3.6 |
Total Australia1 | 3,506 | 89.6 | 2,644 | 86.6 | 2,692 | 86.3 | 3,064 | 85.1 | 2,827 | 84.8 |
New Zealand | | | | | | | | | | |
Accommodation, cafes and restaurants | 2 | 0.1 | 3 | 0.1 | 2 | 0.1 | 2 | 0.1 | 1 | - |
Agriculture, forestry and fishing | 67 | 1.7 | 77 | 2.5 | 93 | 3.0 | 120 | 3.3 | 64 | 1.9 |
Construction | 9 | 0.2 | 16 | 0.5 | 9 | 0.3 | 9 | 0.2 | 9 | 0.3 |
Finance and insurance | 2 | 0.1 | 3 | 0.1 | 3 | 0.1 | 4 | 0.1 | 3 | 0.1 |
Manufacturing | 14 | 0.4 | 26 | 0.9 | 24 | 0.8 | 53 | 1.5 | 57 | 1.7 |
Mining | - | - | 1 | - | 1 | - | 15 | 0.4 | 14 | 0.4 |
Property | 20 | 0.5 | 27 | 0.9 | 38 | 1.2 | 52 | 1.4 | 62 | 1.9 |
Property services and business services | 5 | 0.1 | 8 | 0.2 | 11 | 0.3 | 21 | 0.6 | 22 | 0.6 |
Services | 9 | 0.2 | 9 | 0.3 | 14 | 0.4 | 13 | 0.4 | 12 | 0.4 |
Trade | 15 | 0.4 | 21 | 0.7 | 17 | 0.5 | 18 | 0.5 | 25 | 0.8 |
Transport and storage | 3 | 0.1 | 5 | 0.2 | 5 | 0.2 | 7 | 0.2 | 7 | 0.2 |
Utilities | 1 | - | 2 | 0.1 | 3 | 0.1 | 4 | 0.1 | 2 | 0.1 |
Retail lending | 173 | 4.4 | 130 | 4.3 | 130 | 4.2 | 125 | 3.5 | 128 | 3.8 |
Other | 7 | 0.2 | 1 | - | - | - | 2 | 0.1 | 1 | - |
Total New Zealand1 | 327 | 8.4 | 329 | 10.8 | 350 | 11.2 | 445 | 12.4 | 407 | 12.2 |
Total other overseas | 80 | 2.0 | 80 | 2.6 | 77 | 2.5 | 93 | 2.5 | 98 | 3.0 |
Total provisions for ECL/ impairment charges on loans and credit commitments | 3,913 | 100.0 | 3,053 | 100.0 | 3,119 | 100.0 | 3,602 | 100.0 | 3,332 | 100.0 |
1. Comparatives have been restated to include industry segmentation for collectively assessed provisions.
| 2019 Westpac Group Annual Report | 209 |
| | |
Notes to the financial statements
Note 13. Provisions for expected credit losses/impairment charges (continued)
The following table shows details of loan write-offs by industry classifications for the past five years:
Consolidated | | | | | |
$m | 2019 | 2018 | 2017 | 2016 | 2015 |
Australia | | | | | |
Accommodation, cafes and restaurants | (12) | (14) | (38) | (17) | (40) |
Agriculture, forestry and fishing | (4) | (12) | (10) | (12) | (36) |
Construction | (13) | (23) | (30) | (20) | (40) |
Finance and insurance | (4) | (4) | (6) | (13) | (12) |
Manufacturing | (12) | (12) | (105) | (21) | (20) |
Mining | (1) | (14) | (46) | (18) | (17) |
Property | (31) | (39) | (76) | (44) | (104) |
Property services and business services | (24) | (44) | (203) | (43) | (70) |
Services | (7) | (24) | (97) | (36) | (18) |
Trade | (62) | (56) | (59) | (30) | (56) |
Transport and storage | (14) | (17) | (17) | (48) | (24) |
Utilities | (1) | (1) | - | (1) | (2) |
Retail lending | (903) | (793) | (898) | (803) | (658) |
Other | (10) | (5) | (17) | (13) | (13) |
Total Australia | (1,098) | (1,058) | (1,602) | (1,119) | (1,110) |
New Zealand | | | | | |
Accommodation, cafes and restaurants | - | - | - | - | - |
Agriculture, forestry and fishing | (2) | - | - | (1) | (3) |
Construction | - | (1) | (1) | (1) | - |
Finance and insurance | - | - | - | - | - |
Manufacturing | - | - | - | - | (1) |
Mining | - | - | - | - | (28) |
Property | - | (13) | (2) | (10) | (18) |
Property services and business services | - | - | - | (2) | - |
Services | - | (1) | - | - | (1) |
Trade | (2) | (1) | (1) | (1) | (4) |
Transport and storage | - | - | - | - | - |
Utilities | - | - | - | - | - |
Retail lending | (50) | (53) | (49) | (51) | (55) |
Other | - | - | - | (1) | - |
Total New Zealand | (54) | (69) | (53) | (67) | (110) |
Total other overseas | (2) | - | (1) | (3) | (18) |
Total write-offs | (1,154) | (1,127) | (1,656) | (1,189) | (1,238) |
Write-offs still under enforcement activity
The amount of current year write-offs which remain subject to enforcement activity was $1,093 million for the Group and $962 million for the Parent Entity.
210 | 2019 Westpac Group Annual Report | |
| | |
Notes to the financial statements
Note 13. Provisions for expected credit losses/impairment charges (continued)
The following table shows details of recoveries of loans by industry classifications for the past five years:
Consolidated | | | | | |
$m | 2019 | 2018 | 2017 | 2016 | 2015 |
Recoveries | | | | | |
Australia | | | | | |
Accommodation, cafes and restaurants | - | 1 | 3 | - | - |
Agriculture, forestry and fishing | - | - | - | - | - |
Construction | 1 | 1 | 2 | 1 | 4 |
Finance and insurance | - | 1 | 1 | 34 | 8 |
Manufacturing | 1 | - | 2 | 1 | 3 |
Mining | - | 1 | 1 | - | - |
Property | 8 | 7 | 10 | 3 | 15 |
Property services and business services | 1 | 1 | 3 | 2 | 2 |
Services | - | 1 | - | 2 | 1 |
Trade | 2 | 2 | 3 | 1 | 1 |
Transport and storage | 1 | 1 | 1 | 1 | - |
Utilities | - | - | - | - | - |
Retail lending | 135 | 139 | 118 | 84 | 78 |
Other | 5 | - | 5 | 2 | 1 |
Total Australia | 154 | 155 | 149 | 131 | 113 |
Total New Zealand | 18 | 24 | 19 | 6 | 18 |
Total other overseas | - | - | - | - | - |
Total recoveries | 172 | 179 | 168 | 137 | 131 |
Total write-offs | (1,154) | (1,127) | (1,656) | (1,189) | (1,238) |
Net write-offs and recoveries | (982) | (948) | (1,488) | (1,052) | (1,107) |
Note 14. Other financial assets1
| Consolidated | Parent Entity |
$m | 2019 | 2018 | 2019 | 2018 |
Accrued interest receivable | 1,144 | 1,276 | 1,005 | 1,103 |
Securities sold not delivered | 1,687 | 1,264 | 1,668 | 1,264 |
Trade debtors | 998 | 1,056 | 517 | 514 |
Interbank lending | 514 | 953 | 510 | 939 |
Clearing and settlement balances | 750 | 736 | 706 | 678 |
Accrued fees and commissions | 159 | 129 | 95 | 60 |
Other | 115 | 103 | 114 | 108 |
Total other financial assets | 5,367 | 5,517 | 4,615 | 4,666 |
1. The Group has adopted AASB 9 and AASB 15 from 1 October 2018. Comparatives have not been restated. In addition, the Group has made a number of presentational changes to the Balance Sheet and Income Statement. Comparatives have been restated. Refer to Note 1 for further detail.
| 2019 Westpac Group Annual Report | 211 |
| | |
Notes to the financial statements
Note 15. Life insurance assets and life insurance liabilities
Accounting policy
The Group conducts its life insurance business in Australia primarily through Westpac Life Insurance Services Limited and separate statutory funds registered under the Life Insurance Act 1995 (Life Act) and in New Zealand through Westpac Life-NZ-Limited which are separate statutory funds licensed under the Insurance (Prudential Supervision) Act 2010. Life insurance assets Life insurance assets, including investments in funds managed by the Group, are designated at FVIS. Changes in fair value are recognised in non-interest income. The determination of fair value of life insurance assets involves the same judgements as other financial assets, which are described in the critical accounting assumptions and estimates in Note 22. The Life Act places restrictions on life insurance assets, including that they can only be used: · to meet the liabilities and expenses of that statutory fund; · to acquire investments to further the business of the statutory fund; or · as a distribution, when the statutory fund has met its solvency and capital adequacy requirements. Life insurance liabilities Life insurance liabilities primarily consist of life investment contract liabilities and life insurance contract liabilities. Claims incurred in respect of life investment contracts are withdrawals of customer deposits, and are recognised as a reduction in life insurance liabilities. Life investment contract liabilities Life investment contract liabilities are designated at FVIS. Fair value is the higher of the valuation of life insurance assets linked to the life investment contract, or the minimum current surrender value (the minimum amount the Group would pay to a policyholder if their policy is voluntarily terminated before it matures or the insured event occurs). Changes in fair value are recognised in non-interest income. Life insurance contract liabilities The value of life insurance contract liabilities is calculated using the margin on services methodology (MoS), specified in the Prudential Standard LPS 340 Valuation of Policy Liabilities. MoS accounts for the associated risks and uncertainties of each type of life insurance contract written. At each reporting date, planned profit margins and an estimate of future liabilities are calculated. Profit margins are released to non-interest income over the period that life insurance is provided to policyholders (Note 4). The cost incurred in acquiring specific insurance contracts is deferred provided that these amounts are recoverable out of planned profit margins. The deferred amounts are recognised as a reduction in life insurance policy liabilities and are amortised to non-interest income over the same period as the planned profit margins. External unit holder liabilities of managed investment schemes The life insurance statutory funds include controlling interests in managed investment schemes which are consolidated. When the managed investment scheme is consolidated, the external unit holder liabilities are recognised as a liability and included in life insurance liabilities. They are designated at FVIS. Critical accounting assumptions and estimates The key factors that affect the estimation of life insurance liabilities and related assets are: · the cost of providing benefits and administering contracts; · mortality and morbidity experience, which includes policyholder benefits enhancements; · discontinuance rates, which affects the Group’s ability to recover the cost of acquiring new business over the life of the contracts; and · the discount rate of projected future cash flows. Regulation, competition, interest rates, taxes, securities market conditions and general economic conditions also affect the estimation of life insurance liabilities. |
212 | 2019 Westpac Group Annual Report | |
| | |
Notes to the financial statements
Note 15. Life insurance assets and life insurance liabilities (continued)
Life insurance assets
Consolidated | | | | | |
$m | | 2019 | | 2018 | |
Investments held directly and in unit trusts | | | | | |
Unit trusts | | 6,764 | | 6,545 | |
Equities | | 989 | | 1,223 | |
Debt securities | | 1,589 | | 1,622 | |
Loans and other assets | | 25 | | 60 | |
Total life insurance assets | | 9,367 | | 9,450 | |
There were no life insurance assets in the Parent Entity as at 30 September 2019 (2018: nil).
Life insurance liabilities
Consolidated
Reconciliation of movements in policy liabilities | | Life investment
contracts | | Life insurance
contracts | | Total | |
$m | | 2019 | | 2018 | | 2019 | | 2018 | | 2019 | | 2018 | |
Opening balance | | 8,438 | | 9,854 | | (841 | ) | (835 | ) | 7,597 | | 9,019 | |
Movements in policy liabilities reflected in the income statement | | 504 | | 704 | | 12 | | (6 | ) | 516 | | 698 | |
Contract contributions recognised in policy liabilities | | 898 | | 738 | | – | | – | | 898 | | 738 | |
Contract withdrawals recognised in policy liabilities | | (1,218 | ) | (1,115 | ) | – | | – | | (1,218 | ) | (1,115 | ) |
Contract fees, expenses and tax recoveries | | (73 | ) | (104 | ) | – | | – | | (73 | ) | (104 | ) |
Change in external unit holders of managed investment schemes | | (343 | ) | (1,639 | ) | – | | – | | (343 | ) | (1,639 | ) |
Closing balance | | 8,206 | | 8,438 | | (829 | ) | (841 | ) | 7,377 | | 7,597 | |
There were no life insurance liabilities in the Parent Entity as at 30 September 2019 (2018: nil).
| 2019 Westpac Group Annual Report | 213 |
| | |
Notes to the financial statements
Note 16. Deposits and other borrowings
Accounting policy
Deposits and other borrowings are initially recognised at fair value and subsequently either measured at amortised cost using the effective interest rate method or at fair value. Deposits and other borrowings are designated at fair value if they are managed on a fair value basis, reduce or eliminate an accounting mismatch or contain an embedded derivative. Where they are measured at fair value, any changes in fair value (except those due to changes in credit risk) are recognised as non-interest income. The change in the fair value that is due to changes in credit risk is recognised in other comprehensive income except where it would create an accounting mismatch, in which case it is also recognised in the income statement. Refer to Note 22 for balances measured at fair value and amortised cost. Interest expense incurred is recognised in net interest income using the effective interest rate method. |
| | Consolidated | | Parent Entity | |
$m | | 2019 | | 2018 | | 2019 | | 2018 | |
Australia | | | | | | | | | |
Certificates of deposit | | 26,259 | | 28,746 | | 26,259 | | 28,746 | |
Non-interest bearing, repayable at call | | 43,341 | | 41,783 | | 43,341 | | 41,783 | |
Other interest bearing at call | | 247,161 | | 233,052 | | 247,161 | | 233,052 | |
Other interest bearing term | | 158,564 | | 171,832 | | 158,564 | | 171,832 | |
Total Australia | | 475,325 | | 475,413 | | 475,325 | | 475,413 | |
New Zealand | | | | | | | | | |
Certificates of deposit | | 1,058 | | 1,116 | | – | | – | |
Non-interest bearing, repayable at call | | 6,368 | | 5,406 | | – | | – | |
Other interest bearing at call | | 22,291 | | 21,368 | | – | | – | |
Other interest bearing term | | 31,084 | | 29,897 | | – | | 3 | |
Total New Zealand | | 60,801 | | 57,787 | | – | | 3 | |
Other overseas | | | | | | | | | |
Certificates of deposit | | 11,414 | | 11,672 | | 11,414 | | 11,672 | |
Non-interest bearing, repayable at call | | 824 | | 830 | | 385 | | 352 | |
Other interest bearing at call | | 1,610 | | 1,638 | | 1,233 | | 1,249 | |
Other interest bearing term | | 13,273 | | 11,945 | | 13,073 | | 11,779 | |
Total other overseas | | 27,121 | | 26,085 | | 26,105 | | 25,052 | |
Total deposits and other borrowings | | 563,247 | | 559,285 | | 501,430 | | 500,468 | |
214 | 2019 Westpac Group Annual Report | |
| | |
Notes to the financial statements
Note 16. Deposits and other borrowings (continued)
The following table shows average balances and average rates in each of the past three years for major categories of deposits:
Consolidated | | 2019 | | 2018 | | 2017 | |
| | Average | | Average | | Average | | Average | | Average | | Average | |
| | balance | | rate | | Balance | | rate | | balance | | rate | |
| | $m | | % | | $m | | % | | $m | | % | |
Australia | | | | | | | | | | | | | |
Non-interest bearing | | 42,455 | | | | 41,156 | | | | 39,355 | | | |
Certificates of deposit | | 30,367 | | 2.0% | | 31,424 | | 2.0% | | 33,350 | | 2.0% | |
Other interest bearing at call | | 237,420 | | 1.1% | | 228,328 | | 1.2% | | 222,122 | | 1.1% | |
Other interest bearing term | | 158,012 | | 2.4% | | 162,254 | | 2.5% | | 154,114 | | 2.7% | |
Total Australia | | 468,254 | | | | 463,162 | | | | 448,941 | | | |
Overseas | | | | | | | | | | | | | |
Non-interest bearing | | 6,815 | | | | 6,021 | | | | 5,527 | | | |
Certificates of deposit | | 11,854 | | 2.6% | | 13,008 | | 1.9% | | 13,151 | | 1.4% | |
Other interest bearing at call | | 23,616 | | 1.1% | | 23,017 | | 1.2% | | 24,163 | | 1.3% | |
Other interest bearing term | | 45,520 | | 3.0% | | 41,942 | | 2.8% | | 37,813 | | 2.7% | |
Total overseas | | 87,805 | | | | 83,988 | | | | 80,654 | | | |
Certificates of deposit and term deposits
All certificates of deposit and majority of term deposits issued by foreign offices were greater than US$100,000.
The maturity profile of certificates of deposit and term deposits greater than US$100,000 issued by Australian operations is set out below:
Consolidated 2019
$m | | Less Than
3 Months | | Between
3 and
6 Months | | Between
6 Months
and
1 Year | | Over 1 Year | | Total | |
Certificates of deposit greater than US$100,000 | | 10,522 | | 542 | | 15,159 | | 36 | | 26,259 | |
Term deposits greater than US$100,000 | | 82,291 | | 28,166 | | 21,572 | | 6,276 | | 138,305 | |
| 2019 Westpac Group Annual Report | 215 |
| | |
Notes to the financial statements
Note 17. Other financial liabilities1
Accounting policy
Other financial liabilities include liabilities measured at amortised cost as well as liabilities which are measured at FVIS. Financial liabilities measured at FVIS include: · trading liabilities (i.e. securities sold short); and · liabilities designated at fair value through income statement (i.e. certain repurchase agreements). Refer to Note 22 for balances measured at fair value and amortised cost. Repurchase agreements Where securities are sold subject to an agreement to repurchase at a predetermined price, they remain recognised on the balance sheet in their original category (i.e. ‘Trading securities’ or ‘Investment securities’). The cash consideration received is recognised as a liability (‘Repurchase agreements’). Repurchase agreements are designated at fair value where they are managed as part of a trading portfolio, otherwise they are measured on an amortised cost basis. Where a repurchase agreement is designated at fair value, subsequent to initial recognition, these liabilities are measured at fair value with changes in fair value (except credit risk) recognised through the income statement as they arise. The change in fair value that is attributable to credit risk is recognised in other comprehensive income except where it would create an accounting mismatch, in which case it is also recognised through the income statement. |
| | Consolidated | | Parent Entity | |
$m | | 2019 | | 2018 | | 2019 | | 2018 | |
Repurchase agreements | | 10,604 | | 9,522 | | 10,604 | | 9,522 | |
Interbank placements | | 9,884 | | 8,848 | | 9,834 | | 8,829 | |
Accrued interest payable | | 2,627 | | 2,968 | | 2,312 | | 2,633 | |
Securities purchased not delivered | | 1,398 | | 1,343 | | 1,395 | | 1,343 | |
Trade creditors and other accrued expenses | | 1,154 | | 1,410 | | 927 | | 1,125 | |
Settlement and clearing balances | | 1,222 | | 1,347 | | 1,197 | | 1,333 | |
Securities sold short | | 766 | | 780 | | 766 | | 780 | |
Other | | 1,560 | | 1,887 | | 1,481 | | 1,701 | |
Total other financial liabilities | | 29,215 | | 28,105 | | 28,516 | | 27,266 | |
1. The Group has adopted AASB 9 and AASB 15 from 1 October 2018. Comparatives have not been restated. In addition, the Group has made a number of presentational changes to the Balance Sheet and Income Statement. Comparatives have been restated. Refer to Note 1 for further detail.
216 | 2019 Westpac Group Annual Report | |
| | |
Notes to the financial statements
Note 18. Debt issues
Accounting policy
Debt issues are bonds, notes, commercial paper and debentures that have been issued by entities in the Group. Debt issues are initially measured at fair value and subsequently either measured at amortised cost using the effective interest rate method or at fair value. Debt issues are designated at fair value if they reduce or eliminate an accounting mismatch or contain an embedded derivative. The change in the fair value that is due to credit risk is recognised in other comprehensive income except where it would create an accounting mismatch, in which case it is also recognised in non-interest income. Refer to Note 22 for balances measured at fair value and amortised cost. Interest expense incurred is recognised within net interest income using the effective interest rate method. |
In the table below, the distinction between short-term (12 months or less) and long-term (greater than 12 months) debt is based on the original maturity of the underlying security.
| | Consolidated | | Parent Entity | |
$m | | 2019 | | 2018 | | 2019 | | 2018 | |
Short-term debt: | | | | | | | | | |
Own issuances | | 25,838 | | 26,266 | | 23,695 | | 26,266 | |
Total short-term debt | | 25,838 | | 26,266 | | 23,695 | | 26,266 | |
Long-term debt: | | | | | | | | | |
Covered bonds | | 38,037 | | 35,434 | | 33,160 | | 30,268 | |
Senior | | 109,340 | | 103,159 | | 99,819 | | 95,754 | |
Securitisation | | 8,190 | | 7,588 | | – | | – | |
Structured notes | | 52 | | 149 | | – | | – | |
Total long-term debt | | 155,619 | | 146,330 | | 132,979 | | 126,022 | |
Total debt issues | | 181,457 | | 172,596 | | 156,674 | | 152,288 | |
| | | | | | | | | |
Movement Reconciliation ($m) | | | | | | | | | |
Opening balance | | 172,596 | | 168,356 | | 152,288 | | 144,116 | |
Issuances | | 61,484 | | 59,456 | | 50,375 | | 57,440 | |
Maturities, repayments, buy backs and reductions | | (63,313 | ) | (64,698 | ) | (56,347 | ) | (58,005 | ) |
Total cash movements | | (1,829 | ) | (5,242 | ) | (5,972 | ) | (565 | ) |
Foreign exchange translation impact | | 6,713 | | 11,022 | | 6,514 | | 10,252 | |
Fair value adjustments | | 317 | | (244 | ) | 318 | | (240 | ) |
Fair value hedge accounting adjustments | | 3,512 | | (1,313 | ) | 3,376 | | (1,288 | ) |
Other (amortisation of bond issue costs, etc.) | | 148 | | 17 | | 150 | | 13 | |
Total non-cash movements | | 10,690 | | 9,482 | | 10,358 | | 8,737 | |
Closing balance | | 181,457 | | 172,596 | | 156,674 | | 152,288 | |
| 2019 Westpac Group Annual Report | 217 |
| | |
Notes to the financial statements
Note 18. Debt issues (continued)
Consolidated | | | | | |
$m | | 2019 | | 2018 | |
Short-term debt | | | | | |
Own issuances: | | | | | |
US commercial paper | | 19,950 | | 18,675 | |
Senior debt: | | | | | |
AUD | | 100 | | 550 | |
GBP | | 5,366 | | 6,604 | |
Other | | 422 | | 437 | |
Total own issuances | | 25,838 | | 26,266 | |
Total short-term debt | | 25,838 | | 26,266 | |
Long-term debt (by currency): | | | | | |
AUD | | 43,532 | | 37,571 | |
CHF | | 3,480 | | 2,953 | |
EUR | | 37,464 | | 31,734 | |
GBP | | 5,545 | | 5,290 | |
JPY | | 2,538 | | 3,226 | |
NZD | | 3,197 | | 2,294 | |
USD | | 54,490 | | 60,336 | |
Other | | 5,373 | | 2,926 | |
Total long-term debt | | 155,619 | | 146,330 | |
Consolidated | | | | | | | |
$m | | 2019 | | 2018 | | 2017 | |
Short-term borrowings | | | | | | | |
US commercial paper | | | | | | | |
Maximum amount outstanding at any month end | | 26,879 | | 28,331 | | 27,456 | |
Approximate average amount outstanding | | 22,502 | | 23,315 | | 23,025 | |
Approximate weighted average interest rate on: | | | | | | | |
Average amount outstanding | | 2.8% | | 2.0% | | 1.3% | |
Outstanding as at end of the year | | 3.2% | | 2.5% | | 1.2% | |
The Group manages foreign exchange exposure from debt issuances as part of its hedging activities. Further details of the Group’s hedge accounting are in Note 20.
218 | 2019 Westpac Group Annual Report | |
| | |
Notes to the financial statements
Note 19. Loan capital
Accounting policy
Loan capital are instruments issued by the Group which qualify for inclusion as regulatory capital under Australian Prudential Regulation Authority (APRA) Prudential Standards. Loan capital is initially measured at fair value and subsequently measured at amortised cost using the effective interest rate method. Interest expense incurred is recognised in net interest income. |
| | Consolidated and
Parent Entity | |
$m | | 2019 | | 2018 | |
Additional Tier 1 (AT1) loan capital | | | | | |
Westpac capital notes | | 7,411 | | 7,370 | |
USD AT1 securities | | 1,913 | | 1,585 | |
Total AT1 loan capital | | 9,324 | | 8,955 | |
Tier 2 loan capital | | | | | |
Subordinated notes | | 11,981 | | 7,822 | |
Subordinated perpetual notes | | 521 | | 488 | |
Total Tier 2 loan capital | | 12,502 | | 8,310 | |
Total loan capital | | 21,826 | | 17,265 | |
| | | | | |
Movement Reconciliation ($m) | | | | | |
Opening balance | | 17,265 | | 17,666 | |
Issuances | | 4,935 | | 2,342 | |
Maturities, repayments, buy backs and reductions | | (1,662 | ) | (2,387 | ) |
Total cash movements | | 3,273 | | (45 | ) |
Foreign exchange translation impact | | 521 | | 449 | |
Fair value hedge accounting adjustments | | 748 | | (257 | ) |
Conversion of Convertible preference shares to ordinary shares | | – | | (566 | ) |
Other (amortisation of bond issue costs, etc.) | | 19 | | 18 | |
Total non-cash movements | | 1,288 | | (356 | ) |
Closing balance | | 21,826 | | 17,265 | |
| 2019 Westpac Group Annual Report | 219 |
| | |
Notes to the financial statements
Note 19. Loan capital (continued)
Additional Tier 1 loan capital
A summary of the key terms and common features of AT1 instruments are provided below1.
Consolidated and Parent Entity
$m | | Distribution interest rate | | Potential scheduled
conversion date2 | | Optional
redemption date3 | | 2019 | | 2018 | |
Westpac capital notes (WCN) | | | | | | | | | | | |
$1,384 million WCN | | (90 day bank bill rate + 3.20% p.a.) | | 8 March 2021 | | 8 March 20194 | | – | | 1,382 | |
| | x (1 - Australian corporate tax rate) | | | | | | | | | |
$1,311 million WCN2 | | (90 day bank bill rate + 3.05% p.a.) | | 23 September 2024 | | 23 September 2022 | | 1,308 | | 1,305 | |
| | x (1 - Australian corporate tax rate) | | | | | | | | | |
$1,324 million WCN3 | | (90 day bank bill rate + 4.00% p.a.) | | 22 March 2023 | | 22 March 2021 | | 1,319 | | 1,316 | |
| | x (1 - Australian corporate tax rate) | | | | | | | | | |
$1,702 million WCN4 | | (90 day bank bill rate + 4.90% p.a.) | | 20 December 2023 | | 20 December 2021 | | 1,694 | | 1,691 | |
| | x (1 - Australian corporate tax rate) | | | | | | | | | |
$1,690 million WCN5 | | (90 day bank bill rate + 3.20% p.a.) | | 22 September 2027 | | 22 September 2025 | | 1,677 | | 1,676 | |
| | x (1 - Australian corporate tax rate) | | | | | | | | | |
$1,423 million WCN6 | | (90 day bank bill rate + 3.70% p.a.) | | 31 July 2026 | | 31 July 2024 | | 1,413 | | – | |
| | x (1 - Australian corporate tax rate) | | | | | | | | | |
Total Westpac capital notes | | | | | | | | 7,411 | | 7,370 | |
USD AT1 securities | | | | | | | | | | | |
US$1,250 million securities | | 5.00% p.a. until but excluding 21 September 2027 (first reset date). If not redeemed, converted or written-off earlier, from, and including, each reset date5 to, but excluding, the next succeeding reset date, at a fixed rate p.a. equal to the prevailing 5-year USD mid-market swap rate plus 2.89% p.a. | | n/a | | 21 September 20276 | | 1,913 | | 1,585 | |
Total USD AT1 securities | | | | | | | | 1,913 | | 1,585 | |
Common features of AT1 instruments
Payment conditions
Quarterly distributions on the Westpac capital notes and semi-annual interest payments on the USD AT1 securities are discretionary and will only be paid if the payment conditions are satisfied, including that the payment will not result in a breach of Westpac’s capital requirements under APRA’s prudential standards; not result in Westpac becoming, or being likely to become, insolvent; or if APRA does not object to the payment.
Broadly, if for any reason a distribution or interest payment has not been paid in full on the relevant payment date, Westpac must not determine or pay any dividends on Westpac ordinary shares or undertake a discretionary buy back or capital reduction of Westpac ordinary shares, unless the unpaid amount is paid in full within 20 business days of the relevant payment date or in certain other circumstances.
1. A$ unless otherwise noted.
2. Conversion is subject to the satisfaction of the scheduled conversion conditions. If the conversion conditions are not satisfied on the relevant scheduled conversion date, conversion will not occur until the next distribution payment date on which the scheduled conversion conditions are satisfied.
3. Westpac may elect to redeem the relevant AT1 instrument, subject to APRA’s prior written approval.
4. On 18 December 2018, $722 million of WCN were transferred to the WCN nominated party for $100 each pursuant to the Westpac Capital Note 6 reinvestment offer. Those WCN were subsequently redeemed by Westpac. On 8 March 2019, the remaining $662 million of WCN were transferred to the WCN nominated party for $100 each. Following the transfer, those remaining WCN were redeemed by Westpac.
5. 21 September 2027 and every fifth anniversary thereafter is a reset date.
6. Westpac may elect to redeem on 21 September 2027 and every fifth anniversary thereafter.
220 | 2019 Westpac Group Annual Report | |
| | |
Notes to the financial statements
Note 19. Loan capital (continued)
The AT1 instruments convert into Westpac ordinary shares in the following circumstances:
· Scheduled Conversion
On the scheduled conversion date, provided certain conversion conditions are satisfied, it is expected that the relevant AT1 instrument1 will be converted and holders will receive a variable number of Westpac ordinary shares calculated using the formula described in the terms of the relevant AT1 instrument, subject to a maximum conversion number. The conversion number of Westpac ordinary shares will be calculated using the face value of the relevant AT1 instrument and the Westpac ordinary share price determined over the 20 business day period prior to the scheduled conversion date, including a 1% discount.
· Capital Trigger Event or Non-Viability Trigger Event
Westpac will be required to convert some or all AT1 instruments into a variable number of Westpac ordinary shares upon the occurrence of a capital trigger event or non-viability trigger event. No conversion conditions apply in these circumstances.
A capital trigger event occurs when Westpac determines, or APRA notifies Westpac in writing that it believes, Westpac’s Common Equity Tier 1 Capital ratio is equal to or less than 5.125% (on a level 1 or level 2 basis2).
A non-viability trigger event will occur when APRA notifies Westpac in writing that it believes conversion of all or some AT1 instruments (or conversion, write-off or write-down of relevant capital instruments of the Westpac Group), or public sector injection of capital (or equivalent support), in each case is necessary because without it, Westpac would become non-viable.
For each AT1 instrument converted, holders will receive a variable number of Westpac ordinary shares calculated using the formula described in the terms of the relevant AT1 instrument, subject to a maximum conversion number. The conversion number of Westpac ordinary shares is calculated using the face value or outstanding principal amount of the relevant AT1 instrument and the Westpac ordinary share price determined over the 5 business day period prior to the capital trigger event date or non-viability trigger event date and includes a 1% discount. For each AT1 instrument, the maximum conversion number is set using a Westpac ordinary share price which is broadly equivalent to 20% of the Westpac ordinary share price at the time of issue.
Following the occurrence of a capital trigger event or non-viability trigger event, if conversion of an AT1 instrument does not occur within five business days, holders’ rights in relation to the relevant AT1 instrument will be immediately and irrevocably terminated.
· Early conversion
Westpac is able to elect to convert3, or may be required to convert3, AT1 instruments early in certain circumstances. The terms of conversion and the conversion conditions are broadly similar to scheduled conversion, however the share price floor in the maximum conversion number will depend on the conversion event.
Early redemption
Westpac is able to elect to redeem the relevant AT1 instrument on the optional redemption date or for certain taxation or regulatory reasons, subject to APRA’s prior written approval.
1. Scheduled conversion does not apply to USD AT1 securities.
2. Level 1 comprises Westpac Banking Corporation and subsidiaries approved by APRA as being part of a single ‘Extended Licenced Entity’ for the purposes of measuring capital adequacy. Level 2 includes all subsidiaries except those entities specifically excluded by APRA regulations for the purposes of measuring capital adequacy.
3. Excludes USD AT1 securities.
| 2019 Westpac Group Annual Report | 221 |
| | |
Notes to the financial statements
Note 19. Loan capital (continued)
Tier 2 loan capital
A summary of the key terms and common features of Westpac’s Tier 2 instruments are provided below1:
Consolidated and Parent Entity $m | | Interest rate2 | | Maturity date | | Optional
redemption date3 | | 2019 | | 2018 | |
Subordinated notes | | | | | | | | | | | |
A$1,000 million subordinated notes | | 90 day bank bill rate + 2.05% p.a. | | 14 March 2024 | | 14 March 20194 | | – | | 999 | |
CNY1,250 million subordinated notes | | 4.85% p.a. until but excluding 9 February 2020. Thereafter, if not redeemed, a fixed rate per annum equal to the one-year CNH HIBOR reference rate plus 0.8345% p.a. | | 9 February 2025 | | 9 February 2020 | | 260 | | 252 | |
A$350 million subordinated notes | | 4.50% p.a. until but excluding 11 March 2022. Thereafter, if not redeemed, a fixed rate per annum equal to the five-year AUD semi-quarterly mid-swap reference rate plus 1.95% p.a., the sum of which will be annualised. | | 11 March 2027 | | 11 March 2022 | | 362 | | 347 | |
S$325 million subordinated notes | | 4.00% p.a. until but excluding 12 August 2022. Thereafter, if not redeemed, a fixed rate per annum equal to the five-year SGD swap offer rate plus 1.54% p.a. | | 12 August 2027 | | 12 August 2022 | | 356 | | 330 | |
A$175 million subordinated notes | | 4.80% p.a. until but excluding 14 June 2023. Thereafter, if not redeemed, a fixed rate per annum equal to the five-year AUD semi-quarterly mid-swap reference rate plus 2.65% p.a., each of which will be annualised. | | 14 June 2028 | | 14 June 2023 | | 182 | | 171 | |
US$100 million subordinated notes | | Fixed 5.00% p.a. | | 23 February 2046 | | n/a | | 161 | | 114 | |
A$700 million subordinated notes | | Floating 90 day bank bill rate + 3.10% p.a. | | 10 March 2026 | | 10 March 2021 | | 697 | | 700 | |
JPY20,000 million subordinated notes | | Fixed 1.16% p.a. | | 19 May 2026 | | n/a | | 279 | | 242 | |
JPY10,200 million subordinated notes | | Fixed 1.16% p.a. | | 2 June 2026 | | n/a | | 142 | | 123 | |
JPY10,000 million subordinated notes | | Fixed 0.76% p.a. | | 9 June 2026 | | n/a | | 139 | | 120 | |
NZ$400 million subordinated notes | | 4.6950% p.a. until but excluding 1 September 2021. Thereafter, if not redeemed, a fixed rate per annum equal to the New Zealand 5-year swap rate on 1 September 2021 plus 2.60% p.a. | | 1 September 2026 | | 1 September 2021 | | 373 | | 358 | |
JPY8,000 million subordinated notes | | 0.9225% p.a until but excluding 7 October 2021. Thereafter, if not redeemed, a fixed rate per annum equal to the five-year JPY mid-swap rate plus 1.0005% p.a. | | 7 October 2026 | | 7 October 2021 | | 110 | | 97 | |
US$1,500 million subordinated notes | | 4.322% p.a. until but excluding 23 November 2026. Thereafter, if not redeemed, a fixed rate per annum equal to the five-year USD mid-swap rate plus 2.236% p.a. | | 23 November 2031 | | 23 November 2026 | | 2,297 | | 1,922 | |
JPY12,000 million subordinated notes | | 0.87% p.a. until but excluding 6 July 2022. Thereafter, if not redeemed, a fixed rate per annum equal to the five-year JPY mid-swap rate plus 0.78% p.a. | | 6 July 2027 | | 6 July 2022 | | 166 | | 146 | |
JPY13,500 million subordinated notes | | 0.868% p.a. until but excluding 6 July 2022. Thereafter, if not redeemed, a fixed rate per annum equal to the five-year JPY mid-swap rate plus 0.778% p.a. | | 6 July 2027 | | 6 July 2022 | | 187 | | 165 | |
HKD600 million subordinated notes | | 3.15% p.a. until but excluding 14 July 2022. Thereafter, if not redeemed, a fixed rate per annum equal to the five-year HKD mid-swap rate plus 1.34% p.a. | | 14 July 2027 | | 14 July 2022 | | 114 | | 102 | |
A$350 million subordinated notes | | 4.334% p.a. until but excluding 16 August 2024. Thereafter, if not redeemed, a fixed rate per annum equal to the five-year AUD semi-quarterly mid-swap reference rate plus 1.83% p.a., each of which will be annualised. | | 16 August 2029 | | 16 August 2024 | | 349 | | 347 | |
A$185 million subordinated notes | | Fixed 5.00% p.a. | | 24 January 2048 | | n/a | | 185 | | 185 | |
A$250 million subordinated notes | | 90 day bank bill rate + 1.40% p.a. | | 16 February 2028 | | 16 February 2023 | | 250 | | 250 | |
A$130 million subordinated notes | | Fixed 5.00% p.a. | | 2 March 2048 | | n/a | | 130 | | 130 | |
A$725 million subordinated notes | | 90 day bank bill rate + 1.80% p.a. | | 22 June 2028 | | 22 June 2023 | | 724 | | 722 | |
US$1,000 million subordinated notes | | Fixed 4.421% p.a. | | 24 July 2039 | | n/a | | 1,606 | | – | |
US$1,250 million subordinated notes | | 4.110% p.a. until but excluding 24 July 2029. Thereafter, if not redeemed a fixed rate per annum equal to the five-year USD treasury rate plus 2% p.a. | | 24 July 2034 | | 24 July 2029 | | 1,921 | | – | |
A$1,000 million subordinated notes | | Floating 90 day bank bill rate + 1.98% p.a. | | 27 August 2029 | | 27 August 2024 | | 991 | | – | |
Total subordinated notes | | | | | | | | 11,981 | | 7,822 | |
1. Excludes subordinated perpetual notes.
2. Interest payments are made periodically as set out in the terms of the subordinated notes.
3. Westpac may elect to redeem the relevant Tier 2 instrument on the optional redemption date or dates, subject to APRA’s prior written approval. If not redeemed on the first optional redemption date, Westpac may elect to redeem the relevant Tier 2 instrument on any interest payment date after the first optional redemption date (except for US$1,500 million subordinated notes and US$1,250 million subordinated notes), subject to APRA’s prior written approval.
4. The subordinated notes were redeemed in full on the optional redemption date.
222 | 2019 Westpac Group Annual Report | |
| | |
Notes to the financial statements
Note 19. Loan capital (continued)
Common features of subordinated notes
Interest payments are subject to Westpac being solvent at the time of, and immediately following, the interest payment. These subordinated notes contain non-viability loss absorption requirements.
Non-viability trigger event
Westpac will be required to convert some or all subordinated notes into a variable number of Westpac ordinary shares upon the occurrence of a non-viability trigger event. A non-viability trigger event will occur on similar terms as described under AT1 loan capital.
For each subordinated note converted, holders will receive a variable number of Westpac ordinary shares calculated using the formula described in the terms of the relevant Tier 2 instrument, subject to a maximum conversion number. The conversion number of Westpac ordinary shares will be calculated in a manner similar to that described under AT1 loan capital for a non-viability trigger event. For each Tier 2 instrument, the maximum conversion number is set using a Westpac ordinary share price which is broadly equivalent to 20% of the Westpac ordinary share price at the time of issue.
Following the occurrence of a non-viability trigger event, if conversion of a Tier 2 instrument does not occur within five business days, holders’ rights in relation to the relevant Tier 2 instrument will be immediately and irrevocably terminated.
Subordinated perpetual notes
These notes have no final maturity but Westpac can choose to redeem them at par on any interest payment date falling on or after September 1991, subject to APRA approval and certain other conditions. Interest is cumulative and payable on the notes semi-annually at a rate of 6 month US$ LIBOR plus 0.15% p.a., subject to Westpac being solvent immediately after making the payment and having paid any dividend on any class of share capital of Westpac within the prior 12 month period.
These notes qualify for transitional treatment as Tier 2 capital of Westpac under APRA’s Basel III capital adequacy framework.
The rights of the noteholders and coupon holders are subordinated to the claims of all creditors (including depositors) of Westpac other than creditors whose claims against Westpac rank equally with, or junior to, these notes.
| 2019 Westpac Group Annual Report | 223 |
| | |
Notes to the financial statements
Note 20. Derivative financial instruments
Accounting policy
Derivative financial instruments are instruments whose values are derived from the value of an underlying asset, reference rate or index and include forwards, futures, swaps and options. The Group uses derivative financial instruments for meeting customers’ needs, our asset and liability risk management activities (ALM), and undertaking market making and positioning activities. Trading derivatives Derivatives which are used in our ALM activities but are not designated into a hedge accounting relationship are considered economic hedges, and are adjusted for cash earnings purposes due to the accounting mismatch between the fair value of the derivatives and the accounting treatment of the underlying exposure (refer to Note 2 for further details). These derivatives, along with derivatives used for meeting customers’ needs and undertaking market making and positioning activities, are measured at FVIS and are disclosed as trading derivatives. Hedging derivatives Hedging derivatives are those which are used in our ALM activities and have also been designated into one of three hedge accounting relationships: fair value hedge; cash flow hedge; or hedge of a net investment in a foreign operation. These derivatives are measured at fair value. These hedge designations and the associated accounting treatment are detailed below. For more details regarding the Group’s asset and liability risk management activities, refer to Note 21. Fair value hedges Fair value hedges are used to hedge the exposure to changes in the fair value of an asset or liability. Changes in the fair value of derivatives and the hedged asset or liability in fair value hedges are recognised in interest income. The carrying value of the hedged asset or liability is adjusted for the changes in fair value related to the hedged risk. If a hedge is discontinued, any fair value adjustments to the carrying value of the asset or liability are amortised to net interest income over the period to maturity. If the asset or liability is sold, any unamortised adjustment is immediately recognised in net interest income. Cash flow hedges Cash flow hedges are used to hedge the exposure to variability of cash flows attributable to an asset, liability or future forecast transaction. For effective hedges, changes in the fair value of derivatives are recognised in the cash flow hedge reserve through other comprehensive income and subsequently recognised in interest income when the cash flows attributable to the asset or liability that was hedged impact the income statement. For hedges with some ineffectiveness, the changes in the fair value of the derivatives relating to the ineffective portion are immediately recognised in interest income. If a hedge is discontinued, any cumulative gain or loss remains in other comprehensive income. It is amortised to net interest income over the period which the asset or liability that was hedged also impacts the income statement. If a hedge of a forecast transaction is no longer expected to occur, any cumulative gain or loss in other comprehensive income is immediately recognised in net interest income. Net investment hedges Net investment hedges are used to hedge foreign exchange risks arising from a net investment of a foreign operation. For effective hedges, changes in the fair value of derivatives are recognised in the foreign currency translation reserve through other comprehensive income. For hedges with some ineffectiveness, the changes in the fair value of the derivatives relating to the ineffective portion are immediately recognised in non-interest income. If a foreign operation is disposed of, any cumulative gain or loss in other comprehensive income is immediately recognised in non-interest income. |
224 | 2019 Westpac Group Annual Report | |
| | |
Notes to the financial statements
Note 20. Derivative financial instruments (continued)
Total derivatives
The carrying values of derivative instruments are set out in the tables below:
Consolidated 2019 | | Trading | | Hedging | | Total derivatives
carrying value | |
$m | | Assets | | Liabilities | | Assets | | Liabilities | | Assets | | Liabilities | |
Interest rate contracts1 | | | | | | | | | | | | | |
Forward rate agreements | | 35 | | (36 | ) | – | | – | | 35 | | (36 | ) |
Swap agreements | | 38,383 | | (37,051 | ) | 4,073 | | (7,568 | ) | 42,456 | | (44,619 | ) |
Options | | 294 | | (303 | ) | – | | – | | 294 | | (303 | ) |
Total interest rate contracts | | 38,712 | | (37,390 | ) | 4,073 | | (7,568 | ) | 42,785 | | (44,958 | ) |
Foreign exchange contracts | | | | | | | | | | | | | |
Spot and forward contracts | | 6,857 | | (6,393 | ) | 181 | | (3 | ) | 7,038 | | (6,396 | ) |
Cross currency swap agreements (principal and interest) | | 8,934 | | (12,478 | ) | 2,172 | | (69 | ) | 11,106 | | (12,547 | ) |
Options | | 200 | | (111 | ) | – | | – | | 200 | | (111 | ) |
Total foreign exchange contracts | | 15,991 | | (18,982 | ) | 2,353 | | (72 | ) | 18,344 | | (19,054 | ) |
Credit default swaps | | | | | | | | | | | | | |
Credit protection purchased | | – | | (88 | ) | – | | – | | – | | (88 | ) |
Credit protection sold | | 83 | | – | | – | | – | | 83 | | – | |
Total credit default swaps | | 83 | | (88 | ) | – | | – | | 83 | | (88 | ) |
Commodity contracts | | 251 | | (187 | ) | – | | – | | 251 | | (187 | ) |
Equities | | 1 | | (1 | ) | – | | – | | 1 | | (1 | ) |
Total of gross derivatives | | 55,038 | | (56,648 | ) | 6,426 | | (7,640 | ) | 61,464 | | (64,288 | ) |
Impact of netting arrangements | | (27,968 | ) | 28,703 | | (3,637 | ) | 6,489 | | (31,605 | ) | 35,192 | |
Total of net derivatives | | 27,070 | | (27,945 | ) | 2,789 | | (1,151 | ) | 29,859 | | (29,096 | ) |
Consolidated 2018 | | Trading | | Hedging | | Total derivatives
carrying value | |
$m | | Assets | | Liabilities | | Assets | | Liabilities | | Assets | | Liabilities | |
Interest rate contracts1 | | | | | | | | | | | | | |
Forward rate agreements | | 11 | | (12 | ) | – | | – | | 11 | | (12 | ) |
Swap agreements | | 15,626 | | (15,580 | ) | 890 | | (5,301 | ) | 16,516 | | (20,881 | ) |
Options | | 165 | | (167 | ) | – | | – | | 165 | | (167 | ) |
Total interest rate contracts | | 15,802 | | (15,759 | ) | 890 | | (5,301 | ) | 16,692 | | (21,060 | ) |
Foreign exchange contracts | | | | | | | | | | | | | |
Spot and forward contracts | | 6,741 | | (6,418 | ) | – | | (32 | ) | 6,741 | | (6,450 | ) |
Cross currency swap agreements (principal and interest) | | 6,561 | | (9,019 | ) | 2,365 | | (182 | ) | 8,926 | | (9,201 | ) |
Options | | 120 | | (184 | ) | – | | – | | 120 | | (184 | ) |
Total foreign exchange contracts | | 13,422 | | (15,621 | ) | 2,365 | | (214 | ) | 15,787 | | (15,835 | ) |
Credit default swaps | | | | | | | | | | | | | |
Credit protection purchased | | 3 | | (101 | ) | – | | – | | 3 | | (101 | ) |
Credit protection sold | | 99 | | – | | – | | – | | 99 | | – | |
Total credit default swaps | | 102 | | (101 | ) | – | | – | | 102 | | (101 | ) |
Commodity contracts | | 246 | | (300 | ) | – | | – | | 246 | | (300 | ) |
Equities | | 1 | | – | | – | | – | | 1 | | – | |
Total of gross derivatives | | 29,573 | | (31,781 | ) | 3,255 | | (5,515 | ) | 32,828 | | (37,296 | ) |
Impact of netting arrangements | | (8,222 | ) | 8,912 | | (505 | ) | 3,977 | | (8,727 | ) | 12,889 | |
Total of net derivatives | | 21,351 | | (22,869 | ) | 2,750 | | (1,538 | ) | 24,101 | | (24,407 | ) |
1. The fair value of futures contracts are settled daily with the exchange, and therefore have been excluded from this table.
| 2019 Westpac Group Annual Report | 225 |
| | |
Notes to the financial statements
Note 20. Derivative financial instruments (continued)
Parent Entity 2019 | | Trading | | Hedging | | Total derivatives
carrying value | |
$m | | Assets | | Liabilities | | Assets | | Liabilities | | Assets | | Liabilities | |
Interest rate contracts1 | | | | | | | | | | | | | |
Forward rate agreements | | 35 | | (36 | ) | – | | – | | 35 | | (36 | ) |
Swap agreements | | 38,489 | | (37,438 | ) | 3,955 | | (7,018 | ) | 42,444 | | (44,456 | ) |
Options | | 294 | | (303 | ) | – | | – | | 294 | | (303 | ) |
Total interest rate contracts | | 38,818 | | (37,777 | ) | 3,955 | | (7,018 | ) | 42,773 | | (44,795 | ) |
Foreign exchange contracts | | | | | | | | | | | | | |
Spot and forward contracts | | 6,987 | | (6,389 | ) | 46 | | (3 | ) | 7,033 | | (6,392 | ) |
Cross currency swap agreements (principal and interest) | | 8,934 | | (12,479 | ) | 1,613 | | (6 | ) | 10,547 | | (12,485 | ) |
Options | | 200 | | (111 | ) | – | | – | | 200 | | (111 | ) |
Total foreign exchange contracts | | 16,121 | | (18,979 | ) | 1,659 | | (9 | ) | 17,780 | | (18,988 | ) |
Credit default swaps | | | | | | | | | | | | | |
Credit protection purchased | | – | | (88 | ) | – | | – | | – | | (88 | ) |
Credit protection sold | | 83 | | – | | – | | – | | 83 | | – | |
Total credit default swaps | | 83 | | (88 | ) | – | | – | | 83 | | (88 | ) |
Commodity contracts | | 251 | | (187 | ) | – | | – | | 251 | | (187 | ) |
Equities | | 1 | | (1 | ) | – | | – | | 1 | | (1 | ) |
Total of gross derivatives | | 55,274 | | (57,032 | ) | 5,614 | | (7,027 | ) | 60,888 | | (64,059 | ) |
Impact of netting arrangements | | (27,968 | ) | 28,703 | | (3,637 | ) | 6,489 | | (31,605 | ) | 35,192 | |
Total of net derivatives | | 27,306 | | (28,329 | ) | 1,977 | | (538 | ) | 29,283 | | (28,867 | ) |
Parent Entity 2018 | | Trading | | Hedging | | Total derivatives
carrying value | |
$m | | Assets | | Liabilities | | Assets | | Liabilities | | Assets | | Liabilities | |
Interest rate contracts1 | | | | | | | | | | | | | |
Forward rate agreements | | 11 | | (12 | ) | – | | – | | 11 | | (12 | ) |
Swap agreements | | 15,659 | | (15,751 | ) | 841 | | (5,012 | ) | 16,500 | | (20,763 | ) |
Options | | 165 | | (167 | ) | – | | – | | 165 | | (167 | ) |
Total interest rate contracts | | 15,835 | | (15,930 | ) | 841 | | (5,012 | ) | 16,676 | | (20,942 | ) |
Foreign exchange contracts | | | | | | | | | | | | | |
Spot and forward contracts | | 6,737 | | (6,417 | ) | – | | (31 | ) | 6,737 | | (6,448 | ) |
Cross currency swap agreements (principal and interest) | | 6,562 | | (9,019 | ) | 1,845 | | (124 | ) | 8,407 | | (9,143 | ) |
Options | | 120 | | (184 | ) | – | | – | | 120 | | (184 | ) |
Total foreign exchange contracts | | 13,419 | | (15,620 | ) | 1,845 | | (155 | ) | 15,264 | | (15,775 | ) |
Credit default swaps | | | | | | | | | | | | | |
Credit protection purchased | | 3 | | (101 | ) | – | | – | | 3 | | (101 | ) |
Credit protection sold | | 99 | | – | | – | | – | | 99 | | – | |
Total credit default swaps | | 102 | | (101 | ) | – | | – | | 102 | | (101 | ) |
Commodity contracts | | 246 | | (300 | ) | – | | – | | 246 | | (300 | ) |
Equities | | 1 | | – | | – | | – | | 1 | | – | |
Total of gross derivatives | | 29,603 | | (31,951 | ) | 2,686 | | (5,167 | ) | 32,289 | | (37,118 | ) |
Impact of netting arrangements | | (8,222 | ) | 8,912 | | (505 | ) | 3,977 | | (8,727 | ) | 12,889 | |
Total of net derivatives | | 21,381 | | (23,039 | ) | 2,181 | | (1,190 | ) | 23,562 | | (24,229 | ) |
1. The fair value of futures contracts are settled daily with the exchange, and therefore have been excluded from this table.
226 | 2019 Westpac Group Annual Report | |
| | |
Notes to the financial statements
Note 20. Derivative financial instruments (continued)
Hedge accounting
The Group designates derivatives into hedge accounting relationships in order to manage the volatility in earnings and capital that would otherwise arise from interest rate risk and foreign exchange risk that may result from differences in the accounting treatment of derivatives and underlying exposures. These hedge accounting relationships and the risks they are used to hedge are described below.
The Group enters into one-to-one hedge relationships to manage specific exposures where the terms of the hedged item significantly match the terms of the hedging instrument. The Group also uses dynamic hedge accounting where the hedged items are part of a portfolio of assets and/or liabilities that frequently change. In this hedging strategy, the exposure being hedged and the hedging instruments may change frequently rather than there being a one-to-one hedge accounting relationship for a specific exposure.
Fair value hedges
Interest rate risk
The Group hedges its interest rate risk to reduce exposure to changes in fair value due to interest rate fluctuations over the hedging period. Interest rate risk arising from fixed rate debt issuances and fixed rate bonds classified as investment securities at FVOCI is hedged with single currency fixed to floating interest rate derivatives. The Group also hedges its benchmark interest rate risk from fixed rate foreign currency denominated debt issuances using cross currency swaps. In applying fair value hedge accounting the Group primarily uses one-to-one hedge accounting to manage specific exposures.
The Group also uses a dynamic hedge accounting strategy for fair value portfolio hedge accounting of some fixed rate mortgages, primarily in New Zealand to reduce exposure to changes in fair value due to interest rate fluctuations over the hedging period. These fixed rate mortgages are allocated to time buckets based on their expected repricing dates and the fixed-to-floating interest rate derivatives are designated accordingly to the capacity in the relevant time buckets.
The Group hedges the benchmark interest rate which generally represents the most significant component of the changes in fair value. The benchmark interest rate is a component of interest rate risk that is observable in the relevant financial markets, for example, BBSW for AUD interest rates, LIBOR for USD interest rates and BKBM for NZD interest rates. Ineffectiveness generally arises from timing differences on repricing between the hedged item and the derivative. For the portfolio hedge accounting ineffectiveness also arises from prepayment risk (i.e. the difference between actual and expected prepayment of loans). In order to manage the ineffectiveness from early repayments and accommodate new originations the portfolio hedges are de-designated and redesignated periodically.
Cash flow hedges
Interest rate risk
The Group’s exposure to the volatility of interest cash flows from customer deposits and loans is hedged with interest rate derivatives using a dynamic hedge accounting strategy called macro cash flow hedges. Customer deposits and loans are allocated to time buckets based on their expected repricing dates. The interest rate derivatives are designated accordingly to the gross asset or gross liability positions for the relevant time buckets. The Group hedges the benchmark interest rate which generally represents the most significant component of the changes in fair value. The benchmark interest rate is a component of interest rate risk that is observable in the relevant financial markets, for example, BBSW for AUD interest rates, LIBOR for USD interest rates and BKBM for NZD interest rates. Ineffectiveness arises from timing differences on repricing between the hedged item and the interest rate derivative. Ineffectiveness also arises if the notional values of the interest rate derivatives exceed the capacity for the relevant time buckets. The hedge accounting relationship is reviewed on a monthly basis and the hedging relationships are de-designated and redesignated if necessary.
Foreign exchange risk
The Group’s exposure to foreign currency principal and credit margin cash flows from fixed rate foreign currency debt issuances is hedged through the use of cross currency derivatives in a one-to-one hedging relationship to manage the changes between the foreign currency and AUD. In addition, for floating rate foreign currency debt issuances, the Group hedges from foreign floating to primarily AUD or NZD floating interest rates. These exposures represent the most significant components of fair value. Ineffectiveness may arise from basis risk or timing differences on repricing between the hedged item and the cross currency derivative.
| 2019 Westpac Group Annual Report | 227 |
| | |
Notes to the financial statements
Note 20. Derivative financial instruments (continued)
Net investment hedges
Foreign exchange risk
Structural foreign exchange risk results from Westpac’s capital deployed in offshore branches and subsidiaries, where it is denominated in currencies other than Australian dollars. As exchange rates move, the Australian dollar equivalent of offshore capital is subject to change that could introduce significant variability to the Bank’s reported financial results and capital ratios.
The Group uses foreign exchange forward contracts when hedging the currency translation risk arising from net investments in foreign operations. The Group currently applies hedge accounting to its net investment in New Zealand operations which is the most material offshore operation and therefore the hedged risk is the movement of the NZD against the AUD. Ineffectiveness only arises if the notional values of the foreign exchange forward contracts exceed the net investment in New Zealand operations.
Economic hedges
As part of the Group’s ALM activities, economic hedges are entered into to hedge New Zealand future earnings and long term funding transactions. These hedges do not qualify for hedge accounting and the impact on profit and loss of these hedges is treated as a cash earnings adjustment. This is due to the accounting mismatch between the fair value accounting of the derivatives used in the economic hedges when compared to the recognition of the New Zealand future earnings as they are earned and the amortised cost accounting of the borrowing respectively. Refer to Note 2 for further details.
Hedging instruments
The following tables show the carrying value of hedging instruments and a maturity analysis of the notional amounts of the hedging instruments in one-to-one hedge relationships categorised by the types of hedge relationships and the hedged risk.
Consolidated 2019 | | | | | | | | Notional amounts | | | | | | | |
| | | | | | | | Over | | | | | | | | | |
| | | | | | Within | | 1 year to | | Over | | | | Carrying value | |
$m | | Hedging instrument | | Hedged risk | | 1 year | | 5 years | | 5 years | | Total | | Assets | | Liabilities | |
One-to-one hedge relationships | | | | | | | | | | | | | | | |
Fair value hedges | | Interest rate swap | | Interest rate risk | | 16,322 | | 61,707 | | 48,271 | | 126,300 | | 2,548 | | (5,672 | ) |
| | Cross currency swap | | Interest rate risk | | 5,632 | | 12,870 | | 1,708 | | 20,210 | | 584 | | (69 | ) |
Cash flow hedges | | Cross currency swap | | Foreign exchange risk | | 5,632 | | 15,386 | | 1,708 | | 22,726 | | 1,588 | | – | |
Net investment hedges | | Forward contracts | | Foreign exchange risk | | 8,152 | | – | | – | | 8,152 | | 181 | | (3 | ) |
Total one-to-one hedge relationships | | | | 35,738 | | 89,963 | | 51,687 | | 177,388 | | 4,901 | | (5,744 | ) |
Macro hedge relationships | | | | | | | | | | | | | | | | | |
Portfolio fair value hedges | | Interest rate swap | | Interest rate risk | | n/a | | n/a | | n/a | | 18,813 | | – | | (194 | ) |
Macro cash flow hedges | | Interest rate swap | | Interest rate risk | | n/a | | n/a | | n/a | | 176,828 | | 1,525 | | (1,702 | ) |
Total macro hedge relationships | | | | n/a | | n/a | | n/a | | 195,641 | | 1,525 | | (1,896 | ) |
Total of gross hedging derivatives | | | | n/a | | n/a | | n/a | | 373,029 | | 6,426 | | (7,640 | ) |
Impact of netting arrangements | | | | | | n/a | | n/a | | n/a | | n/a | | (3,637 | ) | 6,489 | |
Total of net hedging derivatives | | | | n/a | | n/a | | n/a | | n/a | | 2,789 | | (1,151 | ) |
Parent 2019 | | | | | | | | Notional amounts | | | | | | | |
| | | | | | | | Over 1 | | | | | | | | | |
| | | | | | Within | | year to | | Over | | | | Carrying value | |
$m | | Hedging instrument | | Hedged risk | | 1 year | | 5 years | | 5 years | | Total | | Assets | | Liabilities | |
One-to-one hedge relationships | | | | | | | | | | | | | | | |
Fair value hedges | | Interest rate swap | | Interest rate risk | | 14,323 | | 59,842 | | 47,881 | | 122,046 | | 2,535 | | (5,475 | ) |
| | Cross currency swap | | Interest rate risk | | 4,473 | | 7,185 | | 1,384 | | 13,042 | | 441 | | – | |
Cash flow hedges | | Cross currency swap | | Foreign exchange risk | | 4,473 | | 7,185 | | 1,384 | | 13,042 | | 1,172 | | (6 | ) |
Net investment hedges | | Forward contracts | | Foreign exchange risk | | 2,315 | | – | | – | | 2,315 | | 46 | | (3 | ) |
Total one-to-one hedge relationships | | | | 25,584 | | 74,212 | | 50,649 | | 150,445 | | 4,194 | | (5,484 | ) |
Macro hedge relationships | | | | | | | | | | | | | | | | | |
Portfolio fair value hedges | | Interest rate swap | | Interest rate risk | | n/a | | n/a | | n/a | | – | | – | | – | |
Macro cash flow hedges | | Interest rate swap | | Interest rate risk | | n/a | | n/a | | n/a | | 166,978 | | 1,420 | | (1,543 | ) |
Total macro hedge relationships | | | | n/a | | n/a | | n/a | | 166,978 | | 1,420 | | (1,543 | ) |
Total of gross hedging derivatives | | | | n/a | | n/a | | n/a | | 317,423 | | 5,614 | | (7,027 | ) |
Impact of netting arrangements | | | | | | n/a | | n/a | | n/a | | n/a | | (3,637 | ) | 6,489 | |
Total of net hedging derivatives | | | | n/a | | n/a | | n/a | | n/a | | 1,977 | | (538 | ) |
228 | 2019 Westpac Group Annual Report | |
| | |
Notes to the financial statements
Note 20. Derivative financial instruments (continued)
The following tables show the weighted average exchange rate related to significant hedging instruments in one-to- one hedge relationships.
Consolidated 2019 $m | | Hedging instrument | | Hedged risk | | Currency/
Currency pair | | Weighted
average rate | |
Cash flow hedges | | Cross currency swap | | Foreign exchange risk | | EUR:AUD | | 0.6929 | |
| | | | | | EUR:NZD | | 0.6079 | |
| | | | | | HKD:NZD | | 4.9670 | |
Net investment hedges | | Forward contracts | | Foreign exchange risk | | NZD:AUD | | 1.0545 | |
Parent Entity 2019 $m | | Hedging instrument | | Hedged risk | | Currency/
Currency pair | | Weighted
average rate | |
Cash flow hedges | | Cross currency swap | | Foreign exchange risk | | EUR:AUD | | 0.6929 | |
| | | | | | JPY:AUD | | 81.4507 | |
| | | | | | CNH:AUD | | 4.9328 | |
Net investment hedges | | Forward contracts | | Foreign exchange risk | | NZD:AUD | | 1.0546 | |
Impact of hedge accounting on the balance sheet and reserves
The following tables show the carrying amount of hedged items in a fair value hedge relationship and the component of the carrying amount related to accumulated hedge accounting adjustments.
Consolidated 2019 $m | | Carrying amount of
hedged item | | Accumulated fair value
hedge adjustment
included in carrying
amount | |
Interest rate risk | | | | | |
Investment securities | | 53,273 | | 2,815 | |
Loans | | 19,235 | | 133 | |
Debt issues and loan capital | | (100,909 | ) | (2,818 | ) |
Parent Entity 2019 $m | | Carrying amount of
hedged item | | Accumulated fair value
hedge adjustment
included in carrying
amount | |
Interest rate risk | | | | | |
Investment securities | | 49,132 | | 2,704 | |
Loans | | 421 | | 5 | |
Debt issues and loan capital | | (93,296 | ) | (2,661 | ) |
There were no accumulated fair value hedge adjustments included in the above carrying amounts relating to hedged items that have ceased to be adjusted for hedging gains and losses.
The pre-tax impact of cash flow and net investment hedges on reserves is detailed below:
Consolidated 2019 $m | | Interest rate risk | | Foreign exchange risk | | Total | |
Cash flow hedge reserve | | | | | | | |
Balance at beginning of the year | | (87 | ) | (89 | ) | (176 | ) |
Net gains/(losses) from changes in fair value | | (158 | ) | (45 | ) | (203 | ) |
Transferred to interest income | | 146 | | 51 | | 197 | |
Balance at end of year | | (99 | ) | (83 | ) | (182 | ) |
Parent Entity 2019 $m | | Interest rate risk | | Foreign exchange risk | | Total | |
Cash flow hedge reserve | | | | | | | |
Balance at beginning of the year | | (42 | ) | (57 | ) | (99 | ) |
Net gains/(losses) from changes in fair value | | (130 | ) | 9 | | (121 | ) |
Transferred to interest income | | 102 | | 26 | | 128 | |
Balance at end of year | | (70 | ) | (22 | ) | (92 | ) |
There were no balances remaining in the cash flow hedge reserve relating to hedge relationships for which hedge accounting is no longer applied.
As disclosed in Note 28, the net losses from changes in the fair value of net investment hedges were $129 million for the Group and $52 million for the Parent Entity. Included in the foreign currency translation reserve is a loss of $210 million for the Group and $214 million for the Parent Entity relating to discontinued hedges of our net investment in USD operations. This would only be transferred to the income statement on disposal of the related USD operations.
| 2019 Westpac Group Annual Report | 229 |
| | |
Notes to the financial statements
Note 20. Derivative financial instruments (continued)
Hedge effectiveness
Hedge effectiveness is tested prospectively at inception and during the lifetime of hedge relationships. For-one- to one hedge relationships this testing uses a qualitative assessment of matched terms where the critical terms of the derivatives used as the hedging instrument match the terms of the hedged item. In addition, a quantitative effectiveness test is performed for all hedges which could include regression analysis, dollar offset and/or sensitivity analysis.
Retrospective testing is also performed to determine whether the hedge relationship remains highly effective so that hedge accounting can continue to be applied and also to determine any ineffectiveness. These tests are performed using regression analysis and the dollar offset method.
The following tables provide information regarding the determination of hedge effectiveness:
Consolidated 2019 $m | | Hedging instrument | | Hedged risk | | Change in
fair value
of hedging
instrument
used for
calculating
ineffectiveness | | Change in
value of the
hedged item
used for
calculating
ineffectiveness | | Hedge
ineffectiveness
recognised in
interest income | | Hedge
ineffectiveness
recognised in
non-interest
income | |
Fair value hedges | | Interest rate swap | | Interest rate risk | | 1,532 | | (1,512 | ) | 20 | | n/a | |
| | Cross currency swap | | Interest rate risk | | 192 | | (190 | ) | 2 | | n/a | |
Cash flow hedges | | Interest rate swap | | Interest rate risk | | (6 | ) | 12 | | 6 | | n/a | |
| | Cross currency swap | | Foreign exchange risk | | 6 | | (6 | ) | – | | n/a | |
Net investment hedges | | Forward contracts | | Foreign exchange risk | | (129 | ) | 129 | | n/a | | – | |
Total | | | | | | 1,595 | | (1,567 | ) | 28 | | – | |
Parent Entity 2019 $m | | Hedging instrument | | Hedged risk | | Change in
fair value
of hedging
instrument
used for
calculating
ineffectiveness | | Change in
value of the
hedged item
used for
calculating
ineffectiveness | | Hedge
ineffectiveness
recognised in
interest income | | Hedge
ineffectiveness
recognised in
non-interest
income | |
Fair value hedges | | Interest rate swap | | Interest rate risk | | 1,684 | | (1,664 | ) | 20 | | n/a | |
| | Cross currency swap | | Interest rate risk | | 56 | | (57 | ) | (1 | ) | n/a | |
Cash flow hedges | | Interest rate swap | | Interest rate risk | | (21 | ) | 28 | | 7 | | n/a | |
| | Cross currency swap | | Foreign exchange risk | | 35 | | (35 | ) | – | | n/a | |
Net investment hedges | | Forward contracts | | Foreign exchange risk | | (52 | ) | 52 | | n/a | | – | |
Total | | | | | | 1,702 | | (1,676 | ) | 26 | | – | |
Comparative year information under prior AASB 7 disclosure requirements
Ineffectiveness of hedge relationships
Fair value hedges | | 2018 | |
$m | | Consolidated | | Parent Entity | |
Change in fair value hedging instruments | | (1,203 | ) | (1,208 | ) |
Change in fair value hedge items attributed to hedged risk | | 1,192 | | 1,197 | |
Ineffectiveness in interest income | | (11 | ) | (11 | ) |
Cash flow hedges | | 2018 | |
$m | | Consolidated | | Parent Entity | |
Cash flow hedge ineffectiveness | | (7 | ) | (11 | ) |
Net investment hedges
For both the Group and Parent Entity, there was no ineffectiveness for net investment hedges recognised in 2018.
Hedging instruments
Gross cash inflows and outflows on derivatives designated in cash flow hedges are, as a proportion of total gross cash flows, expected to occur in the following periods:
| | Less than | | 1 month to | | 3 months | | 1 year to | | 2 years to | | 3 years to | | 4 years to | | over | |
2018 | | 1 month | | 3 months | | to 1 year | | 2 years | | 3 years | | 4 years | | 5 years | | 5 years | |
Cash inflows | | 0.3% | | 2.1% | | 21.8% | | 23.8% | | 18.9% | | 19.1% | | 4.7% | | 9.3% | |
Cash outflows | | 0.5% | | 1.8% | | 22.4% | | 23.0% | | 19.5% | | 18.0% | | 4.9% | | 9.9% | |
230 | 2019 Westpac Group Annual Report | |
| | |
Notes to the financial statements
Note 21. Financial risk
Financial instruments are fundamental to the Group’s business of providing banking and financial services. The associated financial risks (including credit risk, funding and liquidity risk and market risk) are a significant proportion of the total risks faced by the Group.
This note details the financial risk management policies, practices and quantitative information of the Group’s principal financial risk exposures.
Principal financial risks | | Note name | | Note
number | |
Overview | | Risk management frameworks | | 21.1 | |
| | | | | |
Credit risk | | Credit risk ratings system | | 21.2.1 | |
The risk of financial loss where a customer or counterparty fails to meet their financial obligations. | | Credit risk mitigation, collateral and other credit enhancements | | 21.2.2 | |
| Credit risk concentrations | | 21.2.3 | |
| | Credit quality of financial assets | | 21.2.4 | |
| | Non-performing loans and credit commitments | | 21.2.5 | |
| | Collateral held | | 21.2.6 | |
| | | | | |
Funding and liquidity risk | | Liquidity modelling | | 21.3.1 | |
The risk that Westpac cannot meet its payment obligations or that it does not have the appropriate amount, tenor and composition of funding and liquidity to support its assets. | | Sources of funding | | 21.3.2 | |
| Assets pledged as collateral | | 21.3.3 | |
| Contractual maturity of financial liabilities | | 21.3.4 | |
| | Expected maturity | | 21.3.5 | |
| | | | | |
Market risk | | Value-at-Risk (VaR) | | 21.4.1 | |
The risk of an adverse impact on earnings resulting from changes in market factors, such as foreign exchange rates, interest rates, commodity prices and equity price. | | Traded market risk | | 21.4.2 | |
| Non-traded market risk | | 21.4.3 | |
| | | | | |
21.1 Risk management frameworks
The Board is responsible for approving the Westpac Group Risk Management Framework, Westpac Group Risk Management Strategy and Westpac Group Risk Appetite Statement and for monitoring the effectiveness of risk management by the Westpac Group. The Board has delegated to the Board Risk and Compliance Committee (BRCC) responsibility to:
· review and recommend the Westpac Group Risk Management Framework, Westpac Group Risk Management Strategy and Westpac Group Risk Appetite Statement to the Board for approval;
· review and monitor the risk profile and controls of the Group consistent with Westpac Group’s Risk Appetite Statement;
· approve frameworks, policies and processes for managing risk (consistent with the Westpac Group Risk Management Strategy and Westpac Group Risk Appetite Statement); and
· review and, where appropriate, approve risks beyond the approval discretion provided to management.
| 2019 Westpac Group Annual Report | 231 |
| | |
Notes to the financial statements
Note 21. Financial risk (continued)
For each of its primary financial risks, the Group maintains risk management frameworks and a number of supporting policies that define roles and responsibilities, acceptable practices, limits and key controls:
Risk | Risk management framework and controls |
| |
Credit risk | · | The Credit Risk Management Framework describes the principles, methodologies, systems, roles and responsibilities, reports and key controls for managing credit risk. |
| · | The BRCC, Westpac Group Executive Risk Committee (RISKCO) and Westpac Group Credit Risk Committee (CREDCO) monitor the risk profile, performance and management of the Group’s credit portfolio and the development and review of key credit risk policies. |
| · | The Credit Risk Rating System Policy describes the credit risk rating system philosophy, design, key features and uses of rating outcomes. |
| · | All models materially impacting the risk rating process are periodically reviewed in accordance with Westpac’s model risk policies. |
| · | An annual review is performed of the Credit Risk Rating System by the BRCC and CREDCO. |
| · | Specific credit risk estimates (including probability of default (PD), loss given default (LGD) and exposure at default (EAD) levels) are overseen, reviewed annually and supported by the Credit Risk Estimates Committee (a subcommittee of CREDCO) prior to approval under delegated authority from the Chief Risk Officer. |
| · | In determining the provision for expected credit losses, the macroeconomic variables and the probability weightings of the forward looking scenarios as well as any adjustments made to the modelled outcomes are subject to the approval of the Group Chief Financial Officer and the Chief Risk Officer with oversight from the Board of Directors (and its Committees). |
| · | Policies for the delegation of credit approval authorities and formal limits for the extension of credit are established throughout the Group. |
| · | Credit manuals are established throughout the Group including policies governing the origination, evaluation, approval, documentation, settlement and ongoing management of credit risks. |
| · | Sector policies guide credit extension where industry-specific guidelines are considered necessary (e.g. acceptable financial ratios or permitted collateral). |
| · | The Related Entity Risk Management Framework and supporting policies govern credit exposures to related entities, to minimise the spread of credit risk between Group entities and to comply with prudential requirements prescribed by APRA. |
| | |
Funding and liquidity risk | · | Funding and liquidity risk is measured and managed in accordance with the policies and processes defined in the Board-approved Liquidity Risk Management Framework which is part of the Westpac Board-approved Risk Management Strategy. |
| · | Responsibility for managing Westpac’s liquidity and funding positions in accordance with Westpac’s Liquidity Risk Management Framework is delegated to Treasury, under the oversight of Group ALCO and Group Liquidity Risk. |
| · | Westpac’s Liquidity Risk Management Framework sets out Westpac’s funding and liquidity risk appetite, roles and responsibilities of key people managing funding and liquidity risk within Westpac, risk reporting and control processes and limits and targets used to manage Westpac’s balance sheet. |
| · | Treasury undertakes an annual funding review that outlines Westpac’s balance sheet funding strategy over a three year period. This review encompasses trends in global markets, peer analysis, wholesale funding capacity, expected funding requirements and a funding risk analysis. This strategy is continuously reviewed to take account of changing market conditions, investor sentiment and estimations of asset and liability growth rates. |
| · | Westpac monitors the composition and stability of its funding so that it remains within Westpac’s funding risk appetite. This includes compliance with both the Liquidity Coverage Ratio (LCR) and Net Stable Funding Ratio (NSFR). |
| · | Westpac holds a portfolio of liquid assets for several purposes, including as a buffer against unforeseen funding requirements. The level of liquid assets held takes into account the liquidity requirements of Westpac’s balance sheet under normal and stress conditions. |
| · | Treasury also maintains a contingent funding plan that outlines the steps that should be taken by Westpac in the event of an emerging ‘funding crisis’. The plan is aligned with Westpac’s broader Liquidity Crisis Management Policy which is approved annually by the Board. |
| · | Daily liquidity risk reports are reviewed by Treasury and the Group’s Liquidity Risk teams. Liquidity reports are presented to ALCO monthly and to the BRCC quarterly. |
| | |
232 | 2019 Westpac Group Annual Report | |
| | |
Notes to the financial statements
Note 21. Financial risk (continued)
Risk | Risk management framework and controls |
| |
Market risk | · | The Market Risk Framework describes the Group’s approach to managing traded and non-traded market risk. |
| · | Traded market risk includes interest rate, foreign exchange, commodity, equity price, credit spread and volatility risks. Non-traded market risk includes interest rate and credit spread risks. |
| · | Market risk is managed using VaR limits, Net interest income at risk (NaR) and structural risk limits (including credit spread and interest rate basis point value limits) as well as scenario analysis and stress testing. |
| · | The BRCC approves the risk appetite for traded and non-traded risks through the use of VaR, NaR and specific structural risk limits. |
| · | Westpac Group Market Risk Committee (MARCO) has approved separate VaR sub-limits for the trading activities of Financial Markets and Treasury and for Asset and Liability Management (ALM) activities. |
| · | Market risk limits are assigned to business management based upon the Bank’s risk appetite and business strategies in addition to the consideration of market liquidity and concentration. |
| · | Market risk positions are managed by the trading desks and ALM unit consistent with their delegated authorities and the nature and scale of the market risks involved. |
| · | Daily monitoring of current exposure and limit utilisation is conducted independently by the Market Risk unit, which monitors market risk exposures against VaR and structural risk limits. Daily VaR position reports are produced by risk type, by product lines and by geographic region. Quarterly reports are produced for the MARCO, RISKCO and the BRCC. |
| · | Daily stress testing and backtesting of VaR results are performed to support model integrity and to analyse extreme or unexpected movements. A review of both the potential profit and loss outcomes is also undertaken to monitor any skew created by the historical data. MARCO has ratified an approved escalation framework. |
| · | The BRCC has approved a framework for profit or loss escalation which considers both single day and 20 day cumulative results. |
| · | Treasury’s ALM unit is responsible for managing the non-traded interest rate risk including risk mitigation through hedging using derivatives. This is overseen by the Market Risk unit and reviewed by MARCO, RISKCO and BRCC. |
| | |
21.2 Credit Risk
21.2.1 Credit risk ratings system
The principal objective of the credit risk rating system is to reliably assess the credit risk to which the Group is exposed. The Group has two main approaches to this assessment.
Transaction-managed customers
Transaction managed customers are generally customers with business lending exposures. They are individually assigned a Customer Risk Grade (CRG), corresponding to their expected PD. Each facility is assigned an LGD. The Group’s risk rating system has a tiered scale of risk grades for both non-defaulted customers and defaulted customers. Non-defaulted CRGs are mapped to Moody’s and S&P Global Ratings (S&P) external senior ranking unsecured ratings.
The table below shows Westpac’s high level CRGs for transaction-managed portfolios mapped to the Group’s credit quality disclosure categories and to their corresponding external rating.
| 2019 Westpac Group Annual Report | 233 |
| | |
Notes to the financial statements
Note 21. Financial risk (continued)
| Transaction-managed |
Financial statement disclosure | Westpac CRG | Moody’s Rating | S&P Rating |
Strong | A | Aaa – Aa3 | AAA – AA– |
| B | A1 – A3 | A+ – A– |
| C | Baa1 – Baa3 | BBB+ – BBB– |
Good/satisfactory | D | Ba1 – B1 | BB+ – B+ |
| | | |
| | Westpac Rating |
Weak | E | Watchlist |
| F | Special Mention |
Weak/default/non-performing | G | Substandard/Default |
| H | Default |
Program-managed portfolio
The program-managed portfolio generally includes retail products including mortgages, personal lending (including credit cards) as well as SME lending. These customers are grouped into pools of similar risk. Pools are created by analysing similar risk characteristics that have historically predicted that an account is likely to go into default. Customers grouped according to these predictive characteristics are assigned a PD and LGD relative to their pool. The credit quality of these pools is based on a combination of behavioural factors, delinquency trends, PD estimates and loan to valuation ratio (housing loans only).
21.2.2 Credit risk mitigation, collateral and other credit enhancements
Westpac uses a variety of techniques to reduce the credit risk arising from its lending activities.
This includes the Group establishing that it has direct, irrevocable and unconditional recourse to collateral and other credit enhancements through obtaining legally enforceable documentation.
Collateral
The table below describes the nature of collateral or security held for each relevant class of financial asset:
Loans – housing and personal1 | | Housing loans are secured by a mortgage over property and additional security may take the form of guarantees and deposits. Personal lending (including credit cards and overdrafts) is predominantly unsecured. Where security is taken, it is restricted to eligible motor vehicles, caravans, campers, motor homes and boats. Personal lending also includes margin lending which is secured primarily by shares or managed funds. |
Loans – business1 | | Business loans may be secured, partially secured or unsecured. Security is typically taken by way of a mortgage over property and/or a general security agreement over business assets or other assets. Other security such as guarantees, standby letters of credit or derivative protection may also be taken as collateral, if appropriate. |
Trading securities, financial assets measured at FVIS and derivatives | | These exposures are carried at fair value which reflects the credit risk. For trading securities, no collateral is sought directly from the issuer or counterparty; however this may be implicit in the terms of the instrument (such as an asset-backed security). The terms of debt securities may include collateralisation. For derivatives, master netting agreements are typically used to enable the effects of derivative assets and liabilities with the same counterparty to be offset when measuring these exposures. Additionally, collateralisation agreements are also typically entered into with major institutional counterparties to avoid the potential build-up of excessive mark-to-market positions. Derivative transactions are increasingly being cleared through central clearers. |
| | |
1. This includes collateral held in relation to associated credit commitments.
234 | 2019 Westpac Group Annual Report | |
| | |
Notes to the financial statements
Note 21. Financial risk (continued)
Management of risk mitigation
The Group mitigates credit risk through controls covering:
| | |
Collateral and valuation management | | The estimated realisable value of collateral held in support of loans is based on a combination of: · formal valuations currently held for such collateral; and · management’s assessment of the estimated realisable value of all collateral held. This analysis also takes into consideration any other relevant knowledge available to management at the time. Updated valuations are obtained when appropriate. The Group revalues collateral related to financial markets positions on a daily basis and has formal processes in place to promptly call for collateral top-ups, if required. These processes include margining for non-centrally cleared customer derivatives as regulated by Australian Prudential Standard CPS226. The collateralisation arrangements are documented via the Credit Support Annex of the International Swaps and Derivatives Association (ISDA) dealing agreements and Global Master Repurchase Agreements (GMRA) for repurchase transactions. In relation to financial markets positions, Westpac only recognises collateral which is: · cash, primarily in Australian dollars (AUD), New Zealand dollars (NZD), US dollars (USD), Canadian dollars (CAD), British pounds (GBP) or European Union euro (EUR); · bonds issued by Australian Commonwealth, State and Territory governments or their Public Sector Enterprises, provided these attract a zero risk-weighting under Australian Prudential Standard (APS) 112; · securities issued by other sovereign governments and supranationals as approved by an authorised credit officer; · protection bought via credit-linked notes (provided the proceeds are invested in cash or other eligible collateral). |
| | |
Other credit enhancements | | The Group only recognises guarantees, standby letters of credit, or credit derivative protection from the following entities (provided they are not related to the entity with which Westpac has a credit exposure): · Sovereign; · Australia and New Zealand public sector; · ADIs and overseas banks with a minimum risk grade equivalent of A3 / A–; and · Others with a minimum risk grade equivalent of A3 / A–. Credit Portfolio Management (CPM) manages the Group’s corporate, sovereign and bank credit portfolios through monitoring the exposure and any offsetting hedge positions. CPM purchases credit protection from entities meeting the criteria above and sells credit protection to diversify the Group’s credit risk. |
| | |
Offsetting | | Creditworthy customers domiciled in Australia and New Zealand may enter into formal agreements with the Group, permitting the Group to set-off gross credit and debit balances in their nominated accounts. Cross-border set-offs are not permitted. Close-out netting is undertaken with counterparties with whom the Group has entered into a legally enforceable master netting agreement for their off-balance sheet financial market transactions in the event of default. Further details of offsetting are provided in Note 23. |
| | |
Central clearing | | The Group executes derivative transactions through central clearing counterparties. Central clearing counterparties mitigate risk through stringent membership requirements, the collection of margin against all trades placed, the default fund, and an explicitly defined order of priority of payments in the event of default. |
| 2019 Westpac Group Annual Report | 235 |
| | |
Notes to the financial statements
Note 21. Financial risk (continued)
21.2.3 Credit risk concentrations
Credit risk is concentrated when a number of counterparties are engaged in similar activities, have similar economic characteristics and thus may be similarly affected by changes in economic or other conditions.
The Group monitors its credit portfolio to manage risk concentrations and rebalance the portfolio.
Individual customers or groups of related customers
The Group has large exposure limits governing the aggregate size of credit exposure normally acceptable to individual customers and groups of related customers. These limits are tiered by customer risk grade.
Specific industries
Exposures to businesses, governments and other financial institutions are classified into a number of industry clusters based on related Australian and New Zealand Standard Industrial Classification (ANZSIC) codes and are monitored against the Group’s industry risk appetite limits.
Individual countries
The Group has limits governing risks related to individual countries, such as political situations, government policies and economic conditions that may adversely affect either a customer’s ability to meet its obligations to the Group, or the Group’s ability to realise its assets in a particular country.
Maximum exposure to credit risk
The maximum exposure to credit risk (excluding collateral received) is represented by the carrying amount of on-balance sheet financial assets (which comprises cash and balances with central banks, collateral paid, trading securities and financial assets measured at FVIS, derivatives, available-for-sale securities/investment securities, loans; and other financial assets) and undrawn credit commitments.
The following tables set out the credit risk concentrations to which the Group and the Parent Entity are exposed for on-balance sheet financial assets and for undrawn credit commitments.
Life insurance assets are excluded as primarily the credit risk is passed on to the policyholder and backed by the policyholder liabilities.
The balances for trading securities and financial assets measured at FVIS and available-for-sale securities/ investment securities exclude equity securities as the primary financial risk is not credit risk.
The credit concentrations for each significant class of financial asset are:1
Trading securities and financial assets measured at FVIS (Note 10) | | · 45% (2018: 41%) were issued by financial institutions for the Group; 44% (2018: 40%) for the Parent Entity. · 51% (2018: 55%) were issued by government or semi-government authorities for the Group; 52% (2018: 56%) for the Parent Entity. · 71% (2018: 73%) were held in Australia by the Group; 75% (2018: 76%) by the Parent Entity. |
Available-for-sale securities / Investment securities (Note 11) | | · 24% (2018: 27%) were issued by financial institutions for the Group; 25% (2018: 28%) for the Parent Entity. · 75% (2018: 73%) were issued by government or semi-government authorities for the Group; 75% (2018: 72%) for the Parent Entity. · 90% (2018: 89%) were held in Australia by the Group; 97% (2018: 96%) by the Parent Entity. |
Loans (Note 12) | | · Note 12 provides a detailed breakdown of loans by industry and geographic classification. |
Derivative financial instruments (Note 20) | | · 72% (2018: 79%) were issued by financial institutions for both the Group and Parent Entity. · 78% (2018: 84%) were held in Australia by the Group; 80% (2017: 86%) by the Parent Entity. |
1. The Group has adopted AASB 9 and AASB 15 from 1 October 2018. Comparatives have not been restated. In addition, the Group has made a number of presentation changes to the Balance Sheet. Comparatives have been restated. Refer to Note 1 for further detail.
236 | 2019 Westpac Group Annual Report | |
| | |
Notes to the financial statements
Note 21. Financial risk (continued)
| | 2019 | | | 20181 | |
| | Undrawn | | | Undrawn | |
| Total on | credit | | Total on | credit | |
Consolidated | balance | commit- | | balance | commit- | |
$m | sheet | ments | Total | sheet | ments | Total |
Australia | | | | | | |
Accommodation, cafes and restaurants | 8,061 | 1,070 | 9,131 | 8,316 | 1,404 | 9,720 |
Agriculture, forestry and fishing | 9,250 | 2,014 | 11,264 | 8,662 | 2,035 | 10,697 |
Construction | 7,229 | 3,340 | 10,569 | 6,764 | 3,324 | 10,088 |
Finance and insurance | 73,052 | 7,316 | 80,368 | 68,002 | 7,781 | 75,783 |
Government, administration and defence | 63,582 | 1,766 | 65,348 | 50,757 | 728 | 51,485 |
Manufacturing | 10,504 | 5,850 | 16,354 | 9,979 | 5,738 | 15,717 |
Mining | 3,325 | 3,802 | 7,127 | 3,641 | 3,079 | 6,720 |
Property | 45,467 | 10,119 | 55,586 | 45,871 | 12,309 | 58,180 |
Property services and business services | 14,191 | 5,898 | 20,089 | 13,577 | 5,596 | 19,173 |
Services | 12,340 | 6,523 | 18,863 | 12,312 | 5,700 | 18,012 |
Trade | 16,593 | 7,677 | 24,270 | 16,866 | 7,951 | 24,817 |
Transport and storage | 9,529 | 5,114 | 14,643 | 9,599 | 4,958 | 14,557 |
Utilities | 5,567 | 4,487 | 10,054 | 5,291 | 3,471 | 8,762 |
Retail lending | 467,206 | 84,057 | 551,263 | 464,329 | 86,421 | 550,750 |
Other | 6,668 | 2,740 | 9,408 | 7,924 | 1,597 | 9,521 |
Total Australia | 752,564 | 151,773 | 904,337 | 731,890 | 152,092 | 883,982 |
New Zealand | | | | | | |
Accommodation, cafes and restaurants | 356 | 36 | 392 | 324 | 39 | 363 |
Agriculture, forestry and fishing | 8,631 | 607 | 9,238 | 8,205 | 684 | 8,889 |
Construction | 503 | 350 | 853 | 505 | 429 | 934 |
Finance and insurance | 11,685 | 1,507 | 13,192 | 8,368 | 1,437 | 9,805 |
Government, administration and defence | 6,667 | 856 | 7,523 | 4,867 | 691 | 5,558 |
Manufacturing | 2,079 | 1,758 | 3,837 | 2,312 | 1,577 | 3,889 |
Mining | 289 | 29 | 318 | 213 | 101 | 314 |
Property | 6,977 | 1,120 | 8,097 | 6,252 | 1,035 | 7,287 |
Property services and business services | 1,300 | 557 | 1,857 | 1,110 | 512 | 1,622 |
Services | 2,023 | 577 | 2,600 | 1,762 | 613 | 2,375 |
Trade | 2,441 | 1,259 | 3,700 | 2,573 | 1,023 | 3,596 |
Transport and storage | 1,209 | 755 | 1,964 | 1,105 | 791 | 1,896 |
Utilities | 1,938 | 1,447 | 3,385 | 1,418 | 1,564 | 2,982 |
Retail lending | 49,542 | 12,056 | 61,598 | 46,700 | 12,114 | 58,814 |
Other | 151 | 161 | 312 | 14 | 245 | 259 |
Total New Zealand | 95,791 | 23,075 | 118,866 | 85,728 | 22,855 | 108,583 |
Other overseas | | | | | | |
Accommodation, cafes and restaurants | 109 | 11 | 120 | 112 | 12 | 124 |
Agriculture, forestry and fishing | 150 | 3 | 153 | 19 | 1 | 20 |
Construction | 55 | 127 | 182 | 71 | 121 | 192 |
Finance and insurance | 17,712 | 3,093 | 20,805 | 23,739 | 3,454 | 27,193 |
Government, administration and defence | 5,646 | 23 | 5,669 | 4,252 | 50 | 4,302 |
Manufacturing | 3,830 | 5,329 | 9,159 | 3,372 | 4,849 | 8,221 |
Mining | 500 | 1,872 | 2,372 | 354 | 1,793 | 2,147 |
Property | 493 | 29 | 522 | 468 | 57 | 525 |
Property services and business services | 1,766 | 863 | 2,629 | 1,758 | 733 | 2,491 |
Services | 244 | 637 | 881 | 207 | 448 | 655 |
Trade | 2,318 | 2,859 | 5,177 | 2,323 | 3,330 | 5,653 |
Transport and storage | 999 | 652 | 1,651 | 1,235 | 222 | 1,457 |
Utilities | 1,088 | 931 | 2,019 | 765 | 329 | 1,094 |
Retail lending | 864 | 37 | 901 | 684 | 45 | 729 |
Other | 171 | 26 | 197 | 318 | 6 | 324 |
Total other overseas | 35,945 | 16,492 | 52,437 | 39,677 | 15,450 | 55,127 |
Total gross credit risk | 884,300 | 191,340 | 1,075,640 | 857,295 | 190,397 | 1,047,692 |
1. Comparatives have been restated for consistency.
| 2019 Westpac Group Annual Report | 237 |
| | |
Notes to the financial statements
Note 21. Financial risk (continued)
| | 2019 | | | 20181 | |
| | Undrawn | | | Undrawn | |
| Total on | credit | | Total on | credit | |
Parent Entity | balance | commit- | | balance | commit- | |
$m | sheet | ments | Total | sheet | ments | Total |
Australia | | | | | | |
Accommodation, cafes and restaurants | 7,989 | 1,070 | 9,059 | 8,247 | 1,404 | 9,651 |
Agriculture, forestry and fishing | 9,191 | 2,014 | 11,205 | 8,604 | 2,035 | 10,639 |
Construction | 6,853 | 3,340 | 10,193 | 6,260 | 3,324 | 9,584 |
Finance and insurance | 158,418 | 7,316 | 165,734 | 156,489 | 7,781 | 164,270 |
Government, administration and defence | 63,599 | 1,766 | 65,365 | 50,745 | 728 | 51,473 |
Manufacturing | 10,322 | 5,850 | 16,172 | 9,754 | 5,738 | 15,492 |
Mining | 3,304 | 3,802 | 7,106 | 3,609 | 3,078 | 6,687 |
Property | 45,405 | 10,119 | 55,524 | 45,869 | 12,309 | 58,178 |
Property services and business services | 13,348 | 5,898 | 19,246 | 12,533 | 5,595 | 18,128 |
Services | 12,094 | 6,523 | 18,617 | 12,044 | 5,700 | 17,744 |
Trade | 16,408 | 7,677 | 24,085 | 16,655 | 7,949 | 24,604 |
Transport and storage | 9,221 | 5,114 | 14,335 | 9,202 | 4,957 | 14,159 |
Utilities | 5,542 | 4,487 | 10,029 | 5,265 | 3,471 | 8,736 |
Retail lending | 466,188 | 84,057 | 550,245 | 463,280 | 86,421 | 549,701 |
Other | 5,684 | 2,740 | 8,424 | 6,499 | 1,574 | 8,073 |
Total Australia | 833,566 | 151,773 | 985,339 | 815,055 | 152,064 | 967,119 |
New Zealand | | | | | | |
Accommodation, cafes and restaurants | - | - | - | - | - | - |
Agriculture, forestry and fishing | 67 | 7 | 74 | 52 | 7 | 59 |
Construction | 17 | 16 | 33 | 7 | 22 | 29 |
Finance and insurance | 10,938 | 116 | 11,054 | 8,103 | 50 | 8,153 |
Government, administration and defence | 2,196 | 8 | 2,204 | 1,039 | 29 | 1,068 |
Manufacturing | 259 | 69 | 328 | 209 | 97 | 306 |
Mining | 11 | - | 11 | 7 | 1 | 8 |
Property | 117 | 3 | 120 | 52 | 8 | 60 |
Property services and business services | 123 | 18 | 141 | 43 | 31 | 74 |
Services | 46 | 1 | 47 | 25 | 44 | 69 |
Trade | 392 | 170 | 562 | 324 | 234 | 558 |
Transport and storage | 76 | 64 | 140 | 77 | 87 | 164 |
Utilities | 507 | 73 | 580 | 374 | 146 | 520 |
Retail lending | - | 13 | 13 | 1 | 19 | 20 |
Other | 37 | 1 | 38 | 1 | 1 | 2 |
Total New Zealand | 14,786 | 559 | 15,345 | 10,314 | 776 | 11,090 |
Other overseas | | | | | | |
Accommodation, cafes and restaurants | 67 | 10 | 77 | 70 | 12 | 82 |
Agriculture, forestry and fishing | 130 | 1 | 131 | 4 | 1 | 5 |
Construction | 47 | 125 | 172 | 59 | 113 | 172 |
Finance and insurance | 60,388 | 3,067 | 63,455 | 63,043 | 3,442 | 66,485 |
Government, administration and defence | 4,815 | 23 | 4,838 | 3,475 | 50 | 3,525 |
Manufacturing | 3,822 | 5,269 | 9,091 | 3,367 | 4,741 | 8,108 |
Mining | 497 | 1,869 | 2,366 | 355 | 1,791 | 2,146 |
Property | 227 | 13 | 240 | 235 | 31 | 266 |
Property services and business services | 1,683 | 862 | 2,545 | 1,668 | 730 | 2,398 |
Services | 216 | 634 | 850 | 188 | 445 | 633 |
Trade | 2,140 | 2,688 | 4,828 | 2,137 | 3,216 | 5,353 |
Transport and storage | 888 | 643 | 1,531 | 1,129 | 214 | 1,343 |
Utilities | 1,038 | 905 | 1,943 | 763 | 329 | 1,092 |
Retail lending | 588 | 32 | 620 | 277 | 40 | 317 |
Other | 133 | 14 | 147 | 238 | 4 | 242 |
Total other overseas | 76,679 | 16,155 | 92,834 | 77,008 | 15,159 | 92,167 |
Total gross credit risk | 925,031 | 168,487 | 1,093,518 | 902,377 | 167,999 | 1,070,376 |
1. Comparatives have been restated for consistency.
238 | 2019 Westpac Group Annual Report | |
| | |
Notes to the financial statements
Note 21. Financial risk (continued)
21.2.4 Credit quality of financial assets
Credit quality disclosures (AASB 9)
The following tables show the credit quality of gross credit risk exposures measured at amortised cost or at FVOCI to which the impairment requirements of AASB 9 apply. The credit quality is determined by reference to the credit risk ratings system (refer Note 21.2.1) and expectations of future economic conditions under multiple scenarios:
| | Consolidated 2019 | | | Parent Entity 2019 | |
$m | Stage 1 | Stage 2 | Stage 3 | Total1 | Stage 1 | Stage 2 | Stage 3 | Total1 |
Loans - housing | | | | | | | | |
Strong | 382,119 | 743 | – | 382,862 | 361,727 | 536 | – | 362,263 |
Good/Satisfactory | 84,071 | 11,326 | – | 95,397 | 58,599 | 10,623 | – | 69,222 |
Weak | 4,201 | 10,715 | 4,367 | 19,283 | 3,735 | 10,244 | 4,076 | 18,055 |
Total loans - housing | 470,391 | 22,784 | 4,367 | 497,542 | 424,061 | 21,403 | 4,076 | 449,540 |
Loans - personal | | | | | | | | |
Strong | 5,694 | 2 | – | 5,696 | 5,106 | 1 | – | 5,107 |
Good/Satisfactory | 14,538 | 955 | – | 15,493 | 13,381 | 931 | – | 14,312 |
Weak | 573 | 831 | 380 | 1,784 | 427 | 680 | 334 | 1,441 |
Total loans - personal | 20,805 | 1,788 | 380 | 22,973 | 18,914 | 1,612 | 334 | 20,860 |
Loans - business2 | | | | | | | | |
Strong | 75,758 | 232 | – | 75,990 | 64,041 | 123 | – | 64,164 |
Good/Satisfactory | 109,541 | 4,581 | – | 114,122 | 90,937 | 3,455 | – | 94,392 |
Weak | 439 | 5,342 | 1,970 | 7,751 | 362 | 3,997 | 1,724 | 6,083 |
Total loans - business | 185,738 | 10,155 | 1,970 | 197,863 | 155,340 | 7,575 | 1,724 | 164,639 |
Debt securities | | | | | | | | |
Strong | 72,813 | – | – | 72,813 | 68,309 | – | – | 68,309 |
Good/Satisfactory | 463 | – | – | 463 | 23 | – | – | 23 |
Weak | – | – | – | – | – | – | – | – |
Total debt securities3 | 73,276 | – | – | 73,276 | 68,332 | – | – | 68,332 |
All other financial assets | | | | | | | | |
Strong | 30,623 | – | – | 30,623 | 162,339 | – | – | 162,339 |
Good/Satisfactory | 685 | – | – | 685 | 496 | – | – | 496 |
Weak | 48 | – | – | 48 | 41 | – | – | 41 |
Total all other financial assets | 31,356 | – | – | 31,356 | 162,876 | – | – | 162,876 |
Undrawn credit commitments | | | | | | | | |
Strong | 148,525 | 328 | – | 148,853 | 132,776 | 317 | – | 133,093 |
Good/Satisfactory | 39,782 | 1,294 | – | 41,076 | 33,097 | 1,122 | – | 34,219 |
Weak | 142 | 1,135 | 134 | 1,411 | 123 | 937 | 115 | 1,175 |
Total undrawn credit commitments | 188,449 | 2,757 | 134 | 191,340 | 165,996 | 2,376 | 115 | 168,487 |
| | | | | | | | |
Total strong | 715,532 | 1,305 | – | 716,837 | 794,298 | 977 | – | 795,275 |
Total good/satisfactory | 249,080 | 18,156 | – | 267,236 | 196,533 | 16,131 | – | 212,664 |
Total weak | 5,403 | 18,023 | 6,851 | 30,277 | 4,688 | 15,858 | 6,249 | 26,795 |
Total on and off balance sheet | 970,015 | 37,484 | 6,851 | 1,014,350 | 995,519 | 32,966 | 6,249 | 1,034,734 |
Details of collateral held in support of these balances are provided in Note 21.2.6.
1. This credit quality disclosure differs to that of credit risk concentration as it relates only to financial assets measured at amortised costs or at FVOCI and therefore excludes trading securities and financial assets measured at FVIS, and derivative financial instruments.
2. Included in strong is $131 million of exposure (Parent $131 million) that is covered by a highly rated guarantee, which if it were not considered, the exposure would be classified as weak.
3. Debt securities include $829 million at amortised cost for the Group and $27 million for the Parent Entity. $366 million of these are classified as strong for the Group and $4 million for the Parent Entity, and the rest are classified as good/satisfactory.
| 2019 Westpac Group Annual Report | 239 |
| | |
Notes to the financial statements
Note 21. Financial risk1 (continued)
Credit quality disclosures (AASB 139)
The tables below segregate the financial assets of the Group and Parent Entity between financial assets that are neither past due nor impaired, past due but not impaired and impaired. The credit quality of financial assets that are neither past due nor impaired is determined by reference to the credit risk ratings system (refer to Note 21.2.1). as these tables do not reflect the adoption of AASB 9 they are not directly comparable to the credit quality tables above.
| Neither past due nor impaired | | | | | |
Consolidated 2018
$m | Strong2 | Good/
Satisfactory | Weak2 | Total | Past due
but not
impaired | Impaired | Total | Impairment
provision | Total
carrying
value |
Cash and balances with central banks3 | 26,555 | 233 | – | 26,788 | – | – | 26,788 | – | 26,788 |
Collateral paid | 4,787 | – | – | 4,787 | – | – | 4,787 | – | 4,787 |
Trading securities and financial assets measured at FVIS4 | 22,718 | 145 | – | 22,863 | – | – | 22,863 | – | 22,863 |
Derivative financial instruments | 23,692 | 406 | 3 | 24,101 | – | – | 24,101 | – | 24,101 |
Available-for-sale securities4 | 60,229 | 506 | – | 60,735 | – | – | 60,735 | – | 60,735 |
Loans: | | | | | | | | | |
Loans - housing and personal | 379,383 | 114,627 | 4,365 | 498,375 | 16,162 | 687 | 515,224 | (1,303) | 513,921 |
Loans - business5 | 75,331 | 112,446 | 4,481 | 192,258 | 4,293 | 729 | 197,280 | (1,511) | 195,769 |
Other financial assets | 5,025 | 434 | 18 | 5,477 | 37 | 3 | 5,517 | – | 5,517 |
Total6 | 597,720 | 228,797 | 8,867 | 835,384 | 20,492 | 1,419 | 857,295 | (2,814) | 854,481 |
| Neither past due nor impaired | | | | | |
Parent Entity 2018
$m | Strong2 | Good/
Satisfactory | Weak2 | Total | Past due
but not
impaired | Impaired | Total | Impairment
provision | Total
carrying
value |
Cash and balances with central banks3 | 24,850 | 126 | – | 24,976 | – | – | 24,976 | – | 24,976 |
Collateral paid | 4,722 | – | – | 4,722 | – | – | 4,722 | – | 4,722 |
Trading securities and financial assets measured at FVIS4 | 21,199 | 145 | – | 21,344 | – | – | 21,344 | – | 21,344 |
Derivative financial instruments | 23,155 | 404 | 3 | 23,562 | – | – | 23,562 | – | 23,562 |
Available-for-sale securities4 | 56,443 | 3 | – | 56,446 | – | – | 56,446 | – | 56,446 |
Loans: | | | | | | | | | |
Loans - housing and personal | 359,843 | 87,667 | 4,050 | 451,560 | 15,044 | 572 | 467,176 | (1,125) | 466,051 |
Loans - business5 | 61,918 | 95,649 | 3,412 | 160,979 | 3,838 | 582 | 165,399 | (1,282) | 164,117 |
Due from subsidairies7 | 134,086 | – | – | 134,086 | – | – | 134,086 | – | 134,086 |
Other financial assets | 4,282 | 334 | 15 | 4,631 | 33 | 2 | 4,666 | – | 4,666 |
Total6 | 690,498 | 184,328 | 7,480 | 882,306 | 18,915 | 1,156 | 902,377 | (2,407) | 899,970 |
Details of collateral held in support of these balances are provided in Note 21.2.6.
1. The Group has adopted AASB 9 and AASB 15 from 1 October 2018. Comparatives have not been restated. In addition, the Group has made a number of presentational changes to the Balance Sheet and Income Statement. Comparatives have been restated. Refer to Note 1 for further detail.
2. Included in strong is $146 million of exposure for both the Group and the Parent Entity that is covered by a highly rated guarantee, which if it were not considered, the exposure would be classified as weak.
3. In prior years, cash and balances with central banks were not disclosed. These balances have now been included.
4. Exclude equity securities.
5. Loans - business classified as strong was restated from $90,408 million to $75,331 million for the Group, and from $76,995 million to $61,918 million for the Parent Entity. In addition, balances classified under good/satisfactory were reclassified from $97,369 million to $112,446 million for the Group, and from $80,572 million to $95,649 million for the Parent Entity.
6. Total amount disclosed as ‘strong’ was restated from $586,393 million to $597,720 million for the Group, and from $687,386 million to $690,498 million for the Parent Entity. Total amount disclosed as good/satisfactory was restated from $213,693 million to $228,797 million for the Group, and from $210,856 million to $184,328 million.
7. Due from subsidiaries excludes $6,511 million of long-term debt instruments with equity like characteristics which are part of the total investment in subsidiaries.
240 | 2019 Westpac Group Annual Report | |
| | |
Notes to the financial statements
Note 21. Financial risk (continued)
21.2.5 Non-performing loans and credit commitments
The loans and credit commitments balance in stage 3 (non-performing) is represented by those loans and credit commitments which are in default. A default occurs when Westpac considered that the customer is unlikely to repay its credit obligations in full, irrespective of recourse by the Group to actions such as realising security, or the customer is more than 90 days past due on any material credit obligation. This definition of default is aligned to the APRA regulatory definition of default. These can be disaggregated into impaired loans and credit commitments (which is where the customer is unlikely to pay its credit obligations in full including restructured loans) and items 90 days past due, or otherwise in default but not impaired.
Impaired loans and credit commitments include:
· housing and business loans with insufficient security to cover the principal and interest payments owing (aligned to an impaired internal credit risk grade);
· personal loans which are greater than 90 days past due; and
· restructured loans (the original contractual terms have been modified to provide for concessions for a customer facing financial difficulties).
Items 90 days past due, or otherwise in default but not impaired include:
· currently 90 days or more past due but well secured1;
· assets that were, but are no longer 90 days past due but are yet to satisfactorily demonstrate sustained improvement to allow reclassification; and
· other assets in default and not impaired, including those where an order for bankruptcy or similar legal action has been taken (e.g. appointment of an Administrator or Receiver).
The determination of the provision for expected credit losses is one of the Group’s critical accounting assumptions and estimates. Details of this and the Group’s accounting policy for the provision for expected credit losses are discussed in Notes 6 and 13, along with the total provision for expected credit losses on loans and credit commitments and the total for those loans that are considered non-performing (i.e. stage 3).
1. The estimated net realisable value of security to which the Group has recourse is sufficient to cover all principal and interest as at 30 September.
| 2019 Westpac Group Annual Report | 241 |
| | |
Notes to the financial statements
Note 21. Financial risk (continued)
The gross amount of non-performing loans and credit commitments, along with the provision for expected credit losses/provision for impairment charges, by type and geography of impaired loans at 30 September, is summarised in the following table:
Consolidated | | | | | |
$m | 2019 | 2018 | 2017 | 2016 | 2015 |
Impaired exposures | | | | | |
Australia | | | | | |
Housing and business loans | | | | | |
Gross amount | 1,215 | 882 | 975 | 1,589 | 1,220 |
Provision | (491) | (422) | (460) | (769) | (572) |
Net | 724 | 460 | 515 | 820 | 648 |
Personal loans greater than 90 days past due | | | | | |
Gross amount | 384 | 358 | 362 | 267 | 252 |
Provision | (233) | (179) | (187) | (159) | (164) |
Net | 151 | 179 | 175 | 108 | 88 |
Restructured loans | | | | | |
Gross amount | 16 | 9 | 12 | 13 | 22 |
Provision | (6) | (1) | (7) | (11) | (12) |
Net | 10 | 8 | 5 | 2 | 10 |
New Zealand | | | | | |
Housing and business loans | | | | | |
Gross amount | 62 | 124 | 152 | 218 | 348 |
Provision | (26) | (30) | (41) | (95) | (104) |
Net | 36 | 94 | 111 | 123 | 244 |
Personal loans greater than 90 days past due | | | | | |
Gross amount | 20 | 12 | 11 | 10 | 10 |
Provision | (15) | (9) | (8) | (7) | (7) |
Net | 5 | 3 | 3 | 3 | 3 |
Restructured loans | | | | | |
Gross amount | 12 | 14 | 15 | 16 | 17 |
Provision | (3) | (4) | (5) | (4) | (4) |
Net | 9 | 10 | 10 | 12 | 13 |
Other overseas | | | | | |
Housing and business loans | | | | | |
Gross amount | 50 | 13 | 15 | 44 | 25 |
Provision | (17) | (6) | (6) | (21) | (13) |
Net | 33 | 7 | 9 | 23 | 12 |
Personal loans greater than 90 days past due | | | | | |
Gross amount | 1 | 1 | – | – | 1 |
Provison | – | (1) | – | – | (1) |
Net | 1 | – | – | – | – |
Restructured loans | | | | | |
Gross amount | 3 | 3 | – | 2 | – |
Provison | (1) | (1) | – | (1) | – |
Net | 2 | 2 | – | 1 | – |
Total impaired loans | | | | | |
Gross amount | 1,763 | 1,416 | 1,542 | 2,159 | 1,895 |
Provision | (792) | (653) | (714) | (1,067) | (877) |
Total net impaired assets | 971 | 763 | 828 | 1,092 | 1,018 |
Items 90 days past due, or otherwise in default but not impaired | | | | | |
Australia | | | | | |
Gross amount | 4,684 | 3,861 | 3,322 | 3,075 | 2,149 |
Provison1 | (521) | (193) | (165) | (137) | (110) |
Net | 4,163 | 3,668 | 3,157 | 2,938 | 2,039 |
New Zealand | | | | | |
Gross amount | 340 | 127 | 117 | 89 | 130 |
Provison1 | (33) | (10) | (9) | (7) | (10) |
Net | 307 | 117 | 108 | 82 | 120 |
Overseas | | | | | |
Gross amount | 64 | 29 | 19 | 17 | 13 |
Provison1 | (9) | (2) | (2) | (1) | (1) |
Net | 55 | 27 | 17 | 16 | 12 |
Total Items 90 days past due, or otherwise in default but not impaired | | | | | |
Gross amount | 5,088 | 4,017 | 3,458 | 3,181 | 2,292 |
Provison1 | (563) | (205) | (176) | (145) | (121) |
Total net items 90 days past due, or otherwise in default but not impaired | 4,525 | 3,812 | 3,282 | 3,036 | 2,171 |
Total non-performing loans and credit commitments | | | | | |
Gross amount | 6,851 | 5,433 | 5,000 | 5,340 | 4,187 |
Provison | (1,355) | (858) | (890) | (1,212) | (998) |
Total net non-performing loans and credit commitments | 5,496 | 4,575 | 4,110 | 4,128 | 3,189 |
1. In prior periods only gross amounts were disclosed. Provision information has now been included for all reporting years.
242 | 2019 Westpac Group Annual Report | |
| | |
Notes to the financial statements
Note 21. Financial risk (continued)
The following table summarises the interest received and forgone on impaired loans:
Consolidated 2019 | | | |
$m | Australia | Overseas | Total |
Interest received | 4 | 6 | 10 |
Interest forgone | 32 | - | 32 |
21.2.6 Collateral held
Loans
The Group analyses the coverage of the loan portfolio which is secured by the collateral that it holds. Coverage is measured as follows:
Coverage | Secured loan to collateral value ratio |
Fully secured | Less than or equal to 100% |
Partially secured | Greater than 100% but not more than 150% |
Unsecured | Greater than 150%, or no security held (e.g. can include credit cards, personal loans, and exposure to highly rated corporate entities) |
The Group and the Parent Entity’s loan portfolio have the following coverage from collateral held based on the requirements of AASB 9:
Performing loans
| 2019 |
Consolidated | Housing | Personal | Business | |
% | Loans1 | Loans | Loans | Total |
Fully secured | 100.0 | 7.9 | 59.6 | 85.9 |
Partially secured | - | 29.9 | 19.3 | 6.3 |
Unsecured | - | 62.2 | 21.1 | 7.8 |
Total | 100.0 | 100.0 | 100.0 | 100.0 |
| 2019 |
Parent Entity | Housing | Personal | Business | |
% | Loans1 | Loans | Loans | Total |
Fully secured | 100.0 | 8.6 | 60.1 | 86.7 |
Partially secured | - | 31.1 | 18.2 | 5.7 |
Unsecured | - | 60.3 | 21.7 | 7.6 |
Total | 100.0 | 100.0 | 100.0 | 100.0 |
Non-performing loans
| 2019 |
Consolidated | Housing | Personal | Business | |
% | Loans1 | Loans | Loans | Total |
Fully secured | 90.3 | - | 49.5 | 73.3 |
Partially secured | 9.7 | 38.2 | 29.2 | 17.0 |
Unsecured | - | 61.8 | 21.3 | 9.7 |
Total | 100.0 | 100.0 | 100.0 | 100.0 |
| 2019 |
Parent Entity | Housing | Personal | Business | |
% | Loans1 | Loans | Loans | Total |
Fully secured | 90.1 | - | 54.0 | 75.1 |
Partially secured | 9.9 | 34.1 | 27.4 | 16.1 |
Unsecured | - | 65.9 | 18.6 | 8.8 |
Total | 100.0 | 100.0 | 100.0 | 100.0 |
Details of the carrying value and associated provisions for ECL are disclosed in Notes 12 and 13 respectively. The credit quality of loans is disclosed in Note 21.2.4.
1. For the purposes of collateral classification, housing loans are classified as fully secured unless they are non-performing in which case may be classified as partially secured.
| 2019 Westpac Group Annual Report | 243 |
| | |
Notes to the financial statements
Note 21. Financial risk (continued)
As the comparatives have not been restated for the adoption of AASB 9, the Group and the Parent Entity’s loan portfolio have the following coverage from collateral held based on the requirements of AASB 139 for prior years. Once AASB 9 has been effective for the comparative year end, these tables will no longer be presented.
Neither past due nor impaired
| 2018 |
| Loans - | | |
| Housing | | |
Consolidated | and | Loans- | |
% | personal | Business | Total |
Fully secured | 97.5 | 55.8 | 85.9 |
Partially secured | 0.6 | 22.9 | 6.8 |
Unsecured | 1.9 | 21.3 | 7.3 |
Total | 100.0 | 100.0 | 100.0 |
| 2018 |
| Loans - | | |
| Housing | | |
Parent Entity | and | Loans- | |
% | personal | Business | Total |
Fully secured | 98.1 | 57.8 | 87.5 |
Partially secured | 0.3 | 20.4 | 5.6 |
Unsecured | 1.6 | 21.8 | 6.9 |
Total | 100.0 | 100.0 | 100.0 |
Past due but not impaired
| 2018 |
| Loans - | | |
| Housing | | |
Consolidated | and | Loans- | |
% | personal | Business | Total |
Fully secured | 94.6 | 52.8 | 85.8 |
Partially secured | 2.0 | 28.2 | 7.5 |
Unsecured | 3.4 | 19.0 | 6.7 |
Total | 100.0 | 100.0 | 100.0 |
| 2018 |
| Loans - | | |
| Housing | | |
Parent Entity | and | Loans- | |
% | personal | Business | Total |
Fully secured | 95.7 | 54.7 | 87.3 |
Partially secured | 1.5 | 25.0 | 6.3 |
Unsecured | 2.8 | 20.3 | 6.4 |
Total | 100.0 | 100.0 | 100.0 |
Impaired
| 2018 |
| Loans - | | |
| Housing | | |
Consolidated | and | Loans- | |
% | personal | Business | Total |
Fully secured | 72.8 | 32.0 | 51.8 |
Partially secured | 10.0 | 11.5 | 10.8 |
Unsecured | 17.2 | 56.5 | 37.4 |
Total | 100.0 | 100.0 | 100.0 |
| 2018 |
| Loans - | | |
| Housing | | |
Parent Entity | and | Loans- | |
% | personal | Business | Total |
Fully secured | 76.4 | 28.5 | 52.2 |
Partially secured | 6.5 | 13.1 | 9.8 |
Unsecured | 17.1 | 58.4 | 38.0 |
Total | 100.0 | 100.0 | 100.0 |
244 | 2019 Westpac Group Annual Report | |
| | |
Notes to the financial statements
Note 21. Financial risk (continued)
Collateral held against financial assets other than loans
| Consolidated | Parent Entity |
$m | 2019 | 2018 | 2019 | 2018 |
Cash, primarily for derivatives | 3,289 | 2,187 | 2,851 | 1,751 |
Securities under reverse repurchase agreements1 | 6,836 | 1,404 | 6,733 | 1,404 |
Securities under derivatives and stock borrowing1 | 119 | 28 | 119 | 28 |
Total other collateral held | 10,244 | 3,619 | 9,703 | 3,183 |
21.3 Funding and liquidity risk
21.3.1 Liquidity modelling
In managing funding and liquidity for Westpac, Treasury utilises balance sheet forecasts and the maturity profile of Westpac’s wholesale funding portfolio to project liquidity outcomes. Local liquidity limits are also used by Westpac in applicable geographies to ensure liquidity is managed efficiently and prudently.
In addition, Westpac conducts regular stress testing to assess Westpac’s ability to meet cash flow obligations under a range of market conditions and scenarios. These scenarios inform liquidity limits and strategic planning.
21.3.2 Sources of funding
Sources of funding are regularly reviewed to maintain a wide diversification by currency, geography, product and term. Sources include, but are not limited to:
· deposits;
· debt issues;
· proceeds from sale of marketable securities;
· repurchase agreements with central banks;
· principal repayments on loans;
· interest income; and
· fee income.
Liquid assets
Treasury holds a portfolio of high-quality liquid assets as a buffer against unforeseen funding requirements. These assets are eligible for repurchase agreements with the Reserve Bank of Australia (RBA) or another central bank and are held in cash, Government, State Government and highly rated investment grade securities. The level of liquid asset holdings is reviewed frequently and is consistent with both the requirements of the balance sheet and market conditions.
Liquid assets that qualify as eligible collateral for repurchase agreements with a central bank (including internal securitisation) increased by $16.2 billion to $169.9 billion over the last 12 months.
A summary of the Group’s liquid asset holdings is as follows2:
| 2019 | 2018 |
$m | Actual | Average | Actual | Average |
Cash | 18,398 | 19,189 | 25,476 | 21,912 |
Trading securities and financial assets measured at FVIS | 18,867 | 17,184 | 11,235 | 10,051 |
Available-for-sale securities | – | - | 60,667 | 62,892 |
Investment securities | 73,328 | 66,701 | - | - |
Loans3 | 58,933 | 52,498 | 55,500 | 55,336 |
Other financial assets | 345 | 723 | 816 | 745 |
Total liquid assets | 169,871 | 156,295 | 153,694 | 150,936 |
1. Securities received as collateral are not recognised on the Group and Parent Entity’s balance sheet.
2. The Group has adopted AASB 9 and AASB 15 from 1 October 2018. Comparatives have not been restated. In addition, the Group has made a number of presentational changes to the Balance Sheet. Comparatives have been restated. Refer to Note 1 for further detail.
3. Loans are self-originated AAA rated mortgage backed securities which are eligible for repurchase with the RBA and Reserve Bank of New Zealand.
| 2019 Westpac Group Annual Report | 245 |
| | |
Notes to the financial statements
Note 21. Financial risk (continued)
Group’s funding composition
The Group monitors the composition and stability of its funding so that it remains within the Group’s funding risk appetite. This includes compliance with both the LCR and NSFR.
% | 2019 | 2018 |
Customer deposits | 62.5 | 63.1 |
Wholesale term funding with residual maturity greater than 12 months | 16.6 | 15.7 |
Wholesale funding with a residual maturity less than 12 months | 12.1 | 12.4 |
Securitisation | 1.0 | 0.9 |
Equity | 7.8 | 7.9 |
Group’s total funding | 100.0 | 100.0 |
Movements in the Group’s funding composition in 2019 included:
· Customer deposits decreased by 57 basis points to 62.5% of the Group’s total funding at 30 September 2019. Customer deposits increased by $6.8 billion over the year, however this was lower than growth in other forms funding, mainly long-term wholesale funding;
· Long term funding with a residual maturity greater than 12 months increased 98 basis points or $11 billion to 16.6%. The increase mainly reflects changes in interest rates and FX, in particular a lower Australian dollar, which increases the value of the Group’s offshore funding. Funding from securitisation was little changed at 1.0% of total funding, reflecting the issuance of a A$2.8 billion RMBS transaction in February 2019;
· Wholesale funding with a residual maturity less than 12 months decreased by 38 basis points to 12.1%. The Group’s short term funding portfolio (including long term to short term scroll) of $101.2 billion had a weighted average maturity of 135 days and is more than covered by the $169.9 billion of unencumbered repo-eligible liquid assets and cash held by the Group; and
· Funding from equity was little changed at 7.8% of total funding.
Maintaining a diverse funding base with the capacity and flexibility to access a wide range of funding markets, investors, currencies, maturities and products is an important part of managing liquidity risk. Westpac’s funding infrastructure supports its ability to meet changing and diverse investor demands. In 2019, the Group raised $33.5 billion of long term wholesale funding. The majority of new issuance came in the form of senior unsecured and covered bond format, in core currencies of AUD, USD, EUR and NZD. The Group also continued to benefit from its position as the only major Australian bank with an active Auto ABS capability and the only Australian bank with access to the US SEC registered market, raising funds in both these markets during the year.
New long term wholesale funding also included $4.2 billion of Tier 2 capital securities, as the Group made good progress towards the Total Loss Absorbing Capital (TLAC) requirements announced by APRA in July 2019. The Group also issued $1.4 billion in Basel III compliant Additional Tier 1 securities (refer to Note 19).
Borrowings and outstanding issuances from existing debt programs at 30 September 2019 can be found in Notes 16 to 19.
Credit ratings
As at 30 September 2019 the Parent Entity’s credit ratings were:
2019 | Short-term | Long-term | Outlook |
S&P Global Ratings | A-1+ | AA- | Stable |
Moody’s Investors Service | P-1 | Aa3 | Stable |
Fitch Ratings | F1+ | AA- | Negative |
If Westpac’s credit ratings were to be lowered from current levels, the Group’s borrowing costs and capacity may be adversely affected. A downgrade in Westpac’s credit ratings from current levels is likely to require the Group to pay higher interest rates than currently paid on our wholesale borrowings.
246 | 2019 Westpac Group Annual Report | |
| | |
Notes to the financial statements
Note 21. Financial risk (continued)
21.3.3 Assets pledged as collateral
The Group and Parent Entity are required to provide collateral (predominantly to other financial institutions), as part of standard terms, to secure liabilities. In addition to assets supporting securitisation and covered bond programs disclosed in Note 24, the carrying value of these financial assets pledged as collateral is:
| Consolidated | Parent Entity |
$m | 2019 | 2018 | 2019 | 2018 |
Cash | 5,912 | 4,754 | 5,755 | 4,690 |
Cash deposit on stock borrowed | 18 | 14 | 18 | 14 |
Securities (including certificates of deposit) | 1,932 | 1,544 | 1,932 | 1,544 |
Securities pledged under repurchase agreements | 13,754 | 12,492 | 13,754 | 12,492 |
Total amount pledged to secure liabilities | 21,616 | 18,804 | 21,459 | 18,740 |
21.3.4 Contractual maturity of financial liabilities1
The tables below present cash flows associated with financial liabilities, payable at the balance sheet date, by remaining contractual maturity. The amounts disclosed in the table are the future contractual undiscounted cash flows, whereas the Group manages inherent liquidity risk based on expected cash flows.
Cash flows associated with financial liabilities include both principal payments as well as fixed or variable interest payments incorporated into the relevant coupon period. Principal payments reflect the earliest contractual maturity date. Derivative liabilities designated for hedging purposes are expected to be held for their remaining contractual lives, and reflect gross cash flows over the remaining contractual term.
Derivatives held for trading and certain liabilities classified in “Other financial liabilities” which are measured at fair value through income statement” are not managed for liquidity purposes on the basis of their contractual maturity, and accordingly these liabilities are presented in the up to 1 month column. Only the liabilities that the Group manages based on their contractual maturity are presented on a contractual undiscounted basis in the tables below.
1. The Group has adopted AASB 9 and AASB 15 from 1 October 2018. Comparatives have not been restated. In addition, the Group has made a number of presentational changes to the Balance Sheet. Comparatives have been restated. Refer to Note 1 for further detail.
| 2019 Westpac Group Annual Report | 247 |
| | |
Notes to the financial statements
Note 21. Financial risk1 (continued)
Consolidated 2019 | Up to | Over 1 month | Over 3 months | Over 1 year to | Over | |
$m | 1 month | to 3 months | to 1 year | 5 years | 5 Years | Total |
Financial liabilities | | | | | | |
Collateral received | 3,291 | – | – | – | – | 3,291 |
Deposits and other borrowings | 374,126 | 83,365 | 97,081 | 11,968 | 73 | 566,613 |
Other financial liabilities | 19,425 | 3,176 | 3,874 | 157 | – | 26,632 |
Derivative financial instruments: | | | | | | |
Held for trading | 27,945 | – | – | – | – | 27,945 |
Held for hedging purposes (net settled) | 57 | 85 | 280 | 631 | 40 | 1,093 |
Held for hedging purposes (gross settled): | | | | | | |
Cash outflow | 4 | 287 | 902 | 517 | – | 1,710 |
Cash inflow | – | (276) | (875) | (466) | – | (1,617) |
Debt issues | 5,071 | 12,158 | 42,917 | 102,296 | 30,417 | 192,859 |
Total financial liabilities excluding loan capital | 429,919 | 98,795 | 144,179 | 115,103 | 30,530 | 818,526 |
Loan capital | 1 | 76 | 371 | 6,293 | 20,557 | 27,298 |
Total undiscounted financial liabilities | 429,920 | 98,871 | 144,550 | 121,396 | 51,087 | 845,824 |
Total contingent liabilities and commitments | | | | | | |
Letters of credit and guarantees | 15,150 | – | – | – | – | 15,150 |
Commitments to extend credit | 176,002 | – | – | – | – | 176,002 |
Other commitments | 188 | – | – | – | – | 188 |
Total undiscounted contingent liabilities and commitments | 191,340 | – | – | – | – | 191,340 |
Consolidated 2018 | Up to | Over 1 Month | Over 3 Months | Over 1 Year to | Over | |
$m | 1 Month | to 3 Months | to 1 Year | 5 Years | 5 Years | Total |
Financial liabilities | | | | | | |
Collateral received | 2,184 | – | – | – | – | 2,184 |
Deposits and other borrowings | 352,941 | 85,726 | 108,427 | 16,771 | 75 | 563,940 |
Other financial liabilities | 18,894 | 2,445 | 3,697 | 160 | – | 25,196 |
Derivative financial instruments: | | | | | | |
Held for trading | 22,869 | – | – | – | – | 22,869 |
Held for hedging purposes (net settled) | 68 | 95 | 377 | 741 | 96 | 1,377 |
Held for hedging purposes (gross settled): | | | | | | |
Cash outflow | 2,680 | 5,140 | 406 | 2,799 | 1,258 | 12,283 |
Cash inflow | (2,658) | (5,096) | (337) | (2,527) | (1,178) | (11,796) |
Debt issues | 1,743 | 7,502 | 48,848 | 100,245 | 31,892 | 190,230 |
Total financial liabilities excluding loan capital | 398,721 | 95,812 | 161,418 | 118,189 | 32,143 | 806,283 |
Loan capital | 8 | 79 | 253 | 4,866 | 16,509 | 21,715 |
Total undiscounted financial liabilities | 398,729 | 95,891 | 161,671 | 123,055 | 48,652 | 827,998 |
Total contingent liabilities and commitments | | | | | | |
Letters of credit and guarantees | 15,585 | – | – | – | – | 15,585 |
Commitments to extend credit | 174,658 | – | – | – | – | 174,658 |
Other commitments | 154 | – | – | – | – | 154 |
Total undiscounted contingent liabilities and commitments | 190,397 | – | – | – | – | 190,397 |
1. The Group has adopted AASB 9 and AASB 15 from 1 October 2018. Comparatives have not been restated. In addition, the Group has made a number of presentational changes to the Balance Sheet. Comparatives have been restated. Refer to Note 1 for further detail.
248 | 2019 Westpac Group Annual Report | |
| | |
Notes to the financial statements
Note 21. Financial risk1 (continued)
Parent Entity 2019 | Up to | Over 1 Month | Over 3 Months | Over 1 Year to | Over | |
$m | 1 Month | to 3 Months | to 1 Year | 5 Years | 5 Years | Total |
Financial liabilities | | | | | | |
Collateral received | 2,853 | – | – | – | – | 2,853 |
Deposits and other borrowings | 339,448 | 70,761 | 83,602 | 10,311 | 73 | 504,195 |
Other financial liabilities | 19,340 | 3,121 | 3,625 | 157 | – | 26,243 |
Derivative financial instruments: | | | | | | |
Held for trading | 28,329 | – | – | – | – | 28,329 |
Held for hedging purposes (net settled) | 21 | 9 | 97 | 378 | 33 | 538 |
Held for hedging purposes (gross settled): | | | | | | |
Cash outflow | – | 221 | 57 | – | – | 278 |
Cash inflow | – | (215) | (51) | – | – | (266) |
Debt issues | 4,790 | 10,959 | 37,104 | 86,064 | 28,063 | 166,980 |
Due to subsidiaries | 15,538 | 1,020 | 4,989 | 20,117 | 142,620 | 184,284 |
Total financial liabilities excluding loan capital | 410,319 | 85,876 | 129,423 | 117,027 | 170,789 | 913,434 |
Loan capital | 1 | 76 | 371 | 6,293 | 20,557 | 27,298 |
Total undiscounted financial liabilities | 410,320 | 85,952 | 129,794 | 123,320 | 191,346 | 940,732 |
Total contingent liabilities and commitments | | | | | | |
Letters of credit and guarantees | 14,583 | – | – | – | – | 14,583 |
Commitments to extend credit | 153,716 | – | – | – | – | 153,716 |
Other commitments | 188 | – | – | – | – | 188 |
Total undiscounted contingent liabilities and commitments | 168,487 | – | – | – | – | 168,487 |
Parent Entity 2018 | Up to | Over 1 Month | Over 3 Months | Over 1 Year to | Over | |
$m | 1 Month | to 3 Months | to 1 Year | 5 Years | 5 Years | Total |
Financial liabilities | | | | | | |
Collateral received | 1,748 | – | – | – | – | 1,748 |
Deposits and other borrowings | 320,365 | 74,530 | 94,855 | 14,606 | 75 | 504,431 |
Other financial liabilities | 18,835 | 2,363 | 3,334 | 160 | – | 24,692 |
Derivative financial instruments: | | | | | | |
Held for trading | 23,039 | – | – | – | – | 23,039 |
Held for hedging purposes (net settled) | 51 | 55 | 271 | 608 | 96 | 1,081 |
Held for hedging purposes (gross settled): | | | | | | |
Cash outflow | 2,632 | 4,725 | 377 | 2,174 | 726 | 10,634 |
Cash inflow | (2,615) | (4,687) | (324) | (2,043) | (644) | (10,313) |
Debt issues | 1,588 | 7,117 | 45,527 | 85,106 | 29,329 | 168,667 |
Due to subsidiaries2 | 18,249 | 1,156 | 5,388 | 23,653 | 139,076 | 187,522 |
Total financial liabilities excluding loan capital | 383,892 | 85,259 | 149,428 | 124,264 | 168,658 | 911,501 |
Loan capital | 8 | 79 | 253 | 4,866 | 16,509 | 21,715 |
Total undiscounted financial liabilities | 383,900 | 85,338 | 149,681 | 129,130 | 185,167 | 933,216 |
Total contingent liabilities and commitments | | | | | | |
Letters of credit and guarantees | 14,957 | – | – | – | – | 14,957 |
Commitments to extend credit | 152,943 | – | – | – | – | 152,943 |
Other commitments | 99 | – | – | – | – | 99 |
Total undiscounted contingent liabilities and commitments | 167,999 | – | – | – | – | 167,999 |
1. The Group has adopted AASB 9 and AASB 15 from 1 October 2018. Comparatives have not been restated. In addition, the Group has made a number of presentational changes to the Balance Sheet. Comparatives have been restated. Refer to Note 1 for further detail.
2. Due to subsidiaries was restated from $142,400 million (classified under ‘up to 1 month’) to $187,522 million (classified across different maturity buckets). The increase reflects the contractual undiscounted interest to be paid on the liability.
| 2019 Westpac Group Annual Report | 249 |
| | |
Notes to the financial statements
Note 21. Financial risk1 (continued)
21.3.5 Expected maturity
The tables below present the balance sheet based on expected maturity dates, except for deposits, based on historical behaviours. The liability balances in the following tables will not agree to the contractual maturity tables (Note 21.3.4) due to the analysis below being based on expected rather than contractual maturities, the impact of discounting and the exclusion of interest accruals beyond the reporting period. Included in the tables below are equity securities classified as trading securities, available-for-sale securities/investment securities and life insurance assets that have no specific maturity. These assets have been classified based on the expected period of disposal. Deposits are presented in the following table on a contractual basis, however as part of our normal banking operations, the Group would expect a large proportion of these balances to be retained.
Consolidated 2019 | Due within | Greater than | |
$m | 12 Months | 12 Months | Total |
Assets | | | |
Cash and balances with central banks | 20,059 | - | 20,059 |
Collateral paid | 5,930 | - | 5,930 |
Trading securities and financial assets measured at FVIS | 18,544 | 13,237 | 31,781 |
Derivative financial instruments | 20,695 | 9,164 | 29,859 |
Investment securities | 9,810 | 63,591 | 73,401 |
Loans (net of provisions) | 99,197 | 615,573 | 714,770 |
Other financial assets | 5,367 | - | 5,367 |
Life insurance assets | 1,541 | 7,826 | 9,367 |
Investment in associates | - | 129 | 129 |
All other assets | 1,222 | 14,741 | 15,963 |
Total assets | 182,365 | 724,261 | 906,626 |
Liabilities | | | |
Collateral received | 3,287 | - | 3,287 |
Deposits and other borrowings | 551,817 | 11,430 | 563,247 |
Other financial liabilities | 29,059 | 156 | 29,215 |
Derivative financial instruments | 19,203 | 9,893 | 29,096 |
Debt issues | 56,933 | 124,524 | 181,457 |
Life insurance liabilities | 1,703 | 5,674 | 7,377 |
All other liabilities | 3,907 | 1,707 | 5,614 |
Total liabilities excluding loan capital | 665,909 | 153,384 | 819,293 |
Loan capital | - | 21,826 | 21,826 |
Total liabilities | 665,909 | 175,210 | 841,119 |
Net assets/(net liabilities) | (483,544) | 549,051 | 65,507 |
1. The Group has adopted AASB 9 and AASB 15 from 1 October 2018. Comparatives have not been restated. In addition, the Group has made a number of presentation and changes to the Balance Sheet. Comparatives have been restated. Refer to Note 1 for further detail.
250 | 2019 Westpac Group Annual Report | |
| | |
Notes to the financial statements
Note 21. Financial risk1 (continued)
Consolidated 2018
$m | | Due within
12 Months | | Greater than
12 Months | | Total | |
| | | | | | | |
Assets | | | | | | | |
Cash and balances with central banks | | 26,788 | | - | | 26,788 | |
Collateral paid | | 4,787 | | - | | 4,787 | |
Trading securities and financial assets measured at FVIS | | 12,191 | | 10,941 | | 23,132 | |
Derivative financial instruments | | 17,828 | | 6,273 | | 24,101 | |
Available-for-sale securities | | 6,959 | | 54,160 | | 61,119 | |
Loans (net of provisions) | | 94,717 | | 614,973 | | 709,690 | |
Other financial assets | | 5,517 | | - | | 5,517 | |
Life insurance assets | | 1,598 | | 7,852 | | 9,450 | |
Investment in associates | | - | | 115 | | 115 | |
All other assets | | 1,008 | | 13,885 | | 14,893 | |
Total assets | | 171,393 | | 708,199 | | 879,592 | |
Liabilities | | | | | | | |
Collateral received | | 2,184 | | - | | 2,184 | |
Deposits and other borrowings | | 543,198 | | 16,087 | | 559,285 | |
Other financial liabilities | | 27,956 | | 149 | | 28,105 | |
Derivative financial instruments | | 17,346 | | 7,061 | | 24,407 | |
Debt issues | | 53,930 | | 118,666 | | 172,596 | |
Life insurance liabilities | | 1,547 | | 6,050 | | 7,597 | |
All other liabilities | | 2,812 | | 768 | | 3,580 | |
Total liabilities excluding loan capital | | 648,973 | | 148,781 | | 797,754 | |
Loan capital | | 1,382 | | 15,883 | | 17,265 | |
Total liabilities | | 650,355 | | 164,664 | | 815,019 | |
Net assets/(net liabilities) | | (478,962 | ) | 543,535 | | 64,573 | |
Parent Entity 2019
$m | | Due within
12 Months | | Greater than
12 Months | | Total | |
| | | | | | | |
Assets | | | | | | | |
Cash and balances with central banks | | 17,692 | | - | | 17,692 | |
Collateral paid | | 5,773 | | - | | 5,773 | |
Trading securities and financial assets measured at FVIS | | 16,736 | | 12,829 | | 29,565 | |
Derivative financial instruments | | 20,613 | | 8,670 | | 29,283 | |
Investment securities | | 7,200 | | 61,198 | | 68,398 | |
Loans (net of provisions) | | 79,956 | | 551,980 | | 631,936 | |
Other financial assets | | 4,615 | | - | | 4,615 | |
Due from subsidiaries | | 10,291 | | 132,670 | | 142,961 | |
Investment in subsidiaries | | - | | 6,436 | | 6,436 | |
Investment in associates | | - | | 100 | | 100 | |
All other assets | | 756 | | 12,224 | | 12,980 | |
Total assets | | 163,632 | | 786,107 | | 949,739 | |
Liabilities | | | | | | | |
Collateral received | | 2,849 | | - | | 2,849 | |
Deposits and other borrowings | | 491,562 | | 9,868 | | 501,430 | |
Other financial liabilities | | 28,360 | | 156 | | 28,516 | |
Derivative financial instruments | | 19,167 | | 9,700 | | 28,867 | |
Debt issues | | 50,028 | | 106,646 | | 156,674 | |
Due to subsidiaries | | 17,563 | | 131,044 | | 148,607 | |
All other liabilities | | 2,545 | | 1,587 | | 4,132 | |
Total liabilities excluding loan capital | | 612,074 | | 259,001 | | 871,075 | |
Loan capital | | - | | 21,826 | | 21,826 | |
Total liabilities | | 612,074 | | 280,827 | | 892,901 | |
Net assets/(net liabilities) | | (448,442 | ) | 505,280 | | 56,838 | |
1. The Group has adopted AASB 9 and AASB 15 from 1 October 2018. Comparatives have not been restated. In addition, the Group has made a number of presentational changes to the Balance Sheet. Comparatives have been restated. Refer to Note 1 for further detail.
| 2019 Westpac Group Annual Report | 251 |
| | |
Notes to the financial statements
Note 21. Financial risk1 (continued)
Parent Entity 2018
$m | | Due within
12 Months | | Greater than
12 Months | | Total | |
| | | | | | | |
Assets | | | | | | | |
Cash and balances with central banks | | 24,976 | | - | | 24,976 | |
Collateral paid | | 4,722 | | - | | 4,722 | |
Trading securities and financial assets measured at FVIS | | 11,466 | | 9,949 | | 21,415 | |
Derivative financial instruments | | 17,677 | | 5,885 | | 23,562 | |
Available-for-sale securities | | 4,846 | | 51,667 | | 56,513 | |
Loans (net of provisions) | | 76,389 | | 553,779 | | 630,168 | |
Other financial assets | | 4,666 | | - | | 4,666 | |
Due from subsidiaries | | 12,661 | | 127,936 | | 140,597 | |
Investment in subsidiaries | | - | | 4,508 | | 4,508 | |
Investment in associates | | - | | 76 | | 76 | |
All other assets | | 681 | | 11,346 | | 12,027 | |
Total assets | | 158,084 | | 765,146 | | 923,230 | |
Liabilities | | | | | | | |
Collateral received | | 1,748 | | - | | 1,748 | |
Deposits and other borrowings | | 486,418 | | 14,050 | | 500,468 | |
Other financial liabilities | | 27,117 | | 149 | | 27,266 | |
Derivative financial instruments | | 17,317 | | 6,912 | | 24,229 | |
Debt issues | | 50,499 | | 101,789 | | 152,288 | |
Due to subsidiaries | | 19,932 | | 122,468 | | 142,400 | |
All other liabilities | | 1,534 | | 676 | | 2,210 | |
Total liabilities excluding loan capital | | 604,565 | | 246,044 | | 850,609 | |
Loan capital | | 1,382 | | 15,883 | | 17,265 | |
Total liabilities | | 605,947 | | 261,927 | | 867,874 | |
Net assets/(net liabilities) | | (447,863 | ) | 503,219 | | 55,356 | |
21.4 Market risk
21.4.1 Value-at-Risk
The Group uses VaR as one of the mechanisms for controlling both traded and non-traded market risk.
VaR is a statistical estimate of the potential loss in earnings over a specified period of time and to a given level of confidence based on historical market movements. The confidence level indicates the probability that the loss will not exceed the VaR estimate on any given day.
VaR seeks to take account of all material market variables that may cause a change in the value of the portfolio, including interest rates, foreign exchange rates, price changes, volatility and the correlations between these variables. Daily monitoring of current exposure and limit utilisation is conducted independently by the Market Risk unit which monitors market risk exposures against VaR and structural concentration limits. These are supplemented by escalation triggers for material profits or losses and stress testing of risks beyond the 99% confidence interval.
The key parameters of VaR are:
Holding period | | 1 day | |
| | | |
Confidence level | | 99% | |
| | | |
Period of historical data used | | 1 year | |
| | | |
1. The Group has adopted AASB 9 and AASB 15 from 1 October 2018. Comparatives have not been restated. In addition, the Group has made a number of presentational changes to the Balance Sheet. Comparatives have been restated. Refer to Note 1 for further detail.
252 | 2019 Westpac Group Annual Report | |
| | |
Notes to the financial statements
Note 21. Financial risk (continued)
21.4.2 Traded market risk
The table below depicts the aggregate VaR, by risk type, for the year ended 30 September:
Consolidated and Parent Entity | | | | 2019 | | | | | | 2018 | | | | | | 2017 | | | |
$m | | High | | Low | | Average | | High | | Low | | Average | | High | | Low | | Average | |
| | | | | | | | | | | | | | | | | | | |
Interest rate risk | | 14.9 | | 6.6 | | 10.9 | | 15.6 | | 5.1 | | 8.6 | | 16.0 | | 4.6 | | 8.5 | |
Foreign exchange risk | | 8.6 | | 0.8 | | 4.1 | | 6.9 | | 0.7 | | 3.0 | | 9.4 | | 0.6 | | 3.1 | |
Equity risk | | 0.2 | | 0.0 | | 0.0 | | 1.0 | | 0.0 | | 0.1 | | 0.4 | | 0.0 | | 0.1 | |
Commodity risk1 | | 42.0 | | 1.7 | | 8.2 | | 24.3 | | 1.7 | | 6.5 | | 14.1 | | 3.3 | | 6.6 | |
Other market risks2 | | 5.5 | | 2.0 | | 3.5 | | 5.8 | | 1.4 | | 3.8 | | 5.1 | | 3.5 | | 4.2 | |
Diversification effect | | n/a | | n/a | | (12.3 | ) | n/a | | n/a | | (8.6 | ) | n/a | | n/a | | (8.6 | ) |
Net market risk | | 45.3 | | 7.9 | | 14.4 | | 28.1 | | 6.7 | | 13.4 | | 22.9 | | 9.7 | | 13.9 | |
21.4.3 Non-traded market risk
Non-traded market risk includes interest rate risk in the banking book (IRRBB) – the risk to interest income from a mismatch between the duration of assets and liabilities that arises in the normal course of business activities.
Net interest income (NII) sensitivity is managed in terms of the NaR. A simulation model is used to calculate Westpac’s potential NaR. This combines the underlying balance sheet data with assumptions about run off and new business, expected repricing behaviour and changes in wholesale market interest rates. Simulations using a range of interest rate scenarios are used to provide a series of potential future NII outcomes. The interest rate scenarios modelled, over a three year time horizon using a 99% confidence interval, include those projected using historical market interest rate volatility as well as 100 and 200 basis point shifts up and down from the current market yield curves in Australia and New Zealand. Additional stressed interest rate scenarios are also considered and modelled.
A comparison between the NII outcomes from these modelled scenarios indicates the sensitivity to interest rate changes.
Net interest income-at-risk (NaR)
The table below depicts NaR assuming a 100 basis point shock (with a floor of zero for falling interest rates) over the next 12 months as a percentage of reported net interest income:
| | 2019 | | 2018 | |
% (increase)/decrease in net interest | | | | Maximum | | Minimum | | Average | | | | Maximum | | Minimum | | Average | |
income | | As at | | Exposure | | Exposure | | Exposure | | As at | | Exposure | | Exposure | | Exposure | |
| | | | | | | | | | | | | | | | | |
Consolidated | | 2.88 | | 2.88 | | (0.46 | ) | 0.81 | | 0.01 | | 0.78 | | (0.09 | ) | 0.27 | |
Parent Entity | | 2.14 | | 2.14 | | (0.42 | ) | 0.43 | | (0.22 | ) | 0.51 | | (0.28 | ) | 0.04 | |
Value at Risk - IRRBB
The table below depicts VaR for IRRBB:
| | 2019 | | 2018 | |
$m | | As at | | High | | Low | | Average | | As at | | High | | Low | | Average | |
| | | | | | | | | | | | | | | | | |
Consolidated | | 34.1 | | 37.3 | | 19.4 | | 27.8 | | 23.2 | | 57.0 | | 23.2 | | 32.5 | |
As at 30 September 2019 the Value at Risk – IRRBB for the Parent Entity was $38.3 million (2018: $20.8 million).
Risk mitigation
IRRBB stems from the ordinary course of banking activities, including structural interest rate risk (the mismatch between the duration of assets and liabilities) and capital management.
The Group hedges its exposure to such interest rate risk using derivatives. Further details on the Group’s hedge accounting are discussed in Note 20.
The same controls as used to monitor traded market risk allow management to continuously monitor and manage IRRBB.
Structural foreign exchange risk
Structural foreign exchange risk results from the generation of foreign currency denominated earnings and from Westpac’s capital deployed in offshore branches and subsidiaries, where it is denominated in currencies other than Australian dollars. As exchange rates move, the Australian dollar equivalent of offshore earnings and capital is subject to change that could introduce significant variability to the Bank’s reported financial results and capital ratios. Note 20 includes details of the Group’s asset and liability risk management activities including details of the hedge accounting and economic hedges used to manage this risk.
1. Includes electricity risk.
2. Includes prepayment risk and credit spread risk (exposure to movements in generic credit rating bands).
| 2019 Westpac Group Annual Report | 253 |
| | |
Notes to the financial statements
Note 22. Fair values of financial assets and financial liabilities
Accounting policy
The fair value of a financial instrument is the price that would be received to sell an asset or paid to transfer a liability in an orderly transaction between market participants at the measurement date. On initial recognition, the transaction price generally represents the fair value of the financial instrument unless there is observable information from an active market to the contrary. Where unobservable information is used, the difference between the transaction price and the fair value (day one profit or loss) is recognised in the income statement over the life of the instrument when the inputs become observable. Critical accounting assumptions and estimates The majority of valuation models used by the Group employ only observable market data as inputs. However, for certain financial instruments data may be employed which is not readily observable in current markets. The availability of observable inputs is influenced by factors such as: · product type; · depth of market activity; · maturity of market models; and · complexity of the transaction. Where unobservable market data is used, more judgement is required to determine fair value. The significance of these judgements depends on the significance of the unobservable input to the overall valuation. Unobservable inputs are generally derived from other relevant market data and adjusted against: · standard industry practice; · economic models; and · observed transaction prices. In order to determine a reliable fair value for a financial instrument, management may apply adjustments to the techniques previously described. These adjustments reflect the Group’s assessment of factors that market participants would consider in setting the fair value. These adjustments incorporate bid/offer spreads, credit valuation adjustments and funding valuation adjustments. |
Fair Valuation Control Framework
The Group uses a Fair Valuation Control Framework where the fair value is either determined or validated by a function independent of the transaction. This framework formalises the policies and procedures used to achieve compliance with relevant accounting, industry and regulatory standards. The framework includes specific controls relating to:
· the revaluation of financial instruments;
· independent price verification;
· fair value adjustments; and
· financial reporting.
A key element of the framework is the Revaluation Committee, comprising senior valuation specialists from within the Group. The Revaluation Committee reviews the application of the agreed policies and procedures to assess that a fair value measurement basis has been applied.
The method of determining fair value differs depending on the information available.
Fair value hierarchy
A financial instrument’s categorisation within the valuation hierarchy is based on the lowest level input that is significant to the fair value measurement.
The Group categorises all fair value instruments according to the hierarchy described below.
Valuation techniques
The Group applies market accepted valuation techniques in determining the fair valuation of over the counter (OTC) derivatives. This includes credit valuation adjustments (CVA) and funding valuation adjustments (FVA), which incorporate credit risk and funding costs and benefits that arise in relation to uncollateralised derivative positions, respectively.
The specific valuation techniques, the observability of the inputs used in valuation models and the subsequent classification for each significant product category are outlined as follows:
254 | 2019 Westpac Group Annual Report | |
| | |
Notes to the financial statements
Note 22. Fair values of financial assets and financial liabilities (continued)
Level 1 instruments
The fair value of financial instruments traded in active markets is based on recent unadjusted quoted prices. These prices are based on actual arm’s length basis transactions.
The valuations of Level 1 instruments require little or no management judgement.
Instrument | | Balance Sheet Category | | Includes: | | Valuation |
| | | | | | |
| | | | | | | | |
Exchange traded products | | Derivatives | | Exchange traded interest rate futures and options and commodity, energy and carbon futures | | | | | |
Foreign exchange products | | Derivatives | | FX spot and futures contracts | | | | | |
Equity products | | Derivatives Trading securities and financial assets measured at FVIS Other financial liabilities | | Listed equities and equity indices | | | | | |
Non-asset backed debt instruments | | Trading securities and financial assets measured at FVIS Available-for-sale securities/Investment securities Other financial liabilities | | Australian Commonwealth and New Zealand government bonds | | | | | All these instruments are traded in liquid, active markets where prices are readily observable. No modelling or assumptions are used in the valuation. |
|
Life insurance assets and liabilities | | Life insurance assets Life insurance liabilities | | Listed equities, exchange traded derivatives and short sale of listed equities within controlled managed investment schemes | | | | | |
| | | | | | | | | |
| | | | | | | | | |
| 2019 Westpac Group Annual Report | 255 |
| | |
Notes to the financial statements
Note 22. Fair values of financial assets and financial liabilities (continued)
Level 2 instruments
The fair value for financial instruments that are not actively traded is determined using valuation techniques which maximise the use of observable market prices. Valuation techniques include:
· the use of market standard discounting methodologies;
· option pricing models; and
· other valuation techniques widely used and accepted by market participants.
Instrument | Balance Sheet
Category | Includes: | Valuation |
Interest rate products | Derivatives | Interest rate and inflation swaps, swaptions, caps, floors, collars and other non-vanilla interest rate derivatives | Industry standard valuation models are used to calculate the expected future value of payments by product, which is discounted back to a present value. The model’s interest rate inputs are benchmark interest rates and active broker quoted interest rates in the swap, bond and future markets. Interest rate volatilities are sourced from brokers and consensus data providers. If consensus prices are not available, these are classified as Level 3 instruments. |
Foreign exchange products | Derivatives | FX swap, FX forward contracts, FX options and other non-vanilla FX derivatives | Derived from market observable inputs or consensus pricing providers using industry standard models. |
Other credit products | Derivatives | Single Name and Index credit default swaps (CDS) | Valued using an industry standard model that incorporates the credit spread as its principal input. Credit spreads are obtained from consensus data providers. If consensus prices are not available, these are classified as Level 3 instruments. |
Commodity products | Derivatives | Commodity, energy and carbon derivatives | Valued using industry standard models. The models calculate the expected future value of deliveries and payments and discount them back to a present value. The model inputs include forward curves, volatilities implied from market observable inputs, discount curves and underlying spot and futures prices. The significant inputs are market observable or available through a consensus data service. If consensus prices are not available, these are classified as Level 3 instruments. |
Equity products | Derivatives | Exchange traded equity options, OTC equity options and equity warrants | Due to low liquidity, exchange traded options are Level 2. Valued using industry standard models based on observable parameters such as stock prices, dividends, volatilities and interest rates. |
Asset backed debt instruments | Trading securities and financial assets measured at FVIS Available-for-sale securities/Investment securities | Australian residential mortgage backed securities (RMBS) denominated in Australian dollar and other asset backed securities (ABS) | Valued using an industry approach to value floating rate debt with prepayment features. Australian RMBS are valued using prices sourced from a consensus data provider. If consensus prices are not available these are classified as Level 3 instruments. |
Non-asset backed debt instruments | Trading securities and financial assets measured at FVIS Available-for-sale securities/Investment securities Other financial liabilities | State and other government bonds, corporate bonds and commercial paper Repurchase agreements and reverse repurchase agreements over non-asset backed debt securities | Valued using observable market prices which are sourced from independent pricing services, broker quotes or inter-dealer prices. |
256 | 2019 Westpac Group Annual Report | |
| | |
Notes to the financial statements
Note 22. Fair values of financial assets and financial liabilities (continued)
Instrument | Balance Sheet
Category | Includes: | Valuation |
Loans at fair value | Loans | Fixed rate bills and syndicated loans | Discounted cash flow approach, using a discount rate which reflects the terms of the instrument and the timing of cash flows, adjusted for creditworthiness, or expected sale amount. |
Certificates of deposit | Deposits and other borrowings | Certificates of deposit | Discounted cash flow using market rates offered for deposits of similar remaining maturities. |
Debt issues at fair value | Debt issues | Debt issues | Discounted cash flows, using a discount rate which reflects the terms of the instrument and the timing of cash flows adjusted for market observable changes in Westpac’s implied credit worthiness. |
Life insurance assets and liabilities | Life insurance assets Life insurance liabilities | Corporate bonds, over the counter derivatives, units in unlisted unit trusts, life insurance contract liabilities, life investment contract liabilities and external liabilities of managed investment schemes controlled by statutory life funds | Valued using observable market prices or other widely used and accepted valuation techniques utilising observable market input. |
Level 3 instruments
Financial instruments valued where at least one input that could have a significant effect on the instrument’s valuation is not based on observable market data due to illiquidity or complexity of the product. These inputs are generally derived and extrapolated from other relevant market data and calibrated against current market trends and historical transactions.
These valuations are calculated using a high degree of management judgement.
Instrument | Balance Sheet
Category | Includes: | Valuation |
Asset backed debt instruments | Trading securities and financial assets measured at FVIS | Collateralised loan obligations | As prices for these securities are not available from a consensus provider these are revalued based on third party revaluations (lead manager or inter-dealer). Due to their illiquidity and/or complexity they are classified as Level 3 assets. |
Non-asset backed debt instruments | Trading securities and financial assets measured at FVIS Available-for-sale securities/Investment securities | Offshore non-asset backed debt instruments and debt securities issued via private placement | These securities are evaluated by an independent pricing service or based on third party revaluations. Due to their illiquidity and/or complexity these are classified as Level 3 assets. |
Equity investments | Trading securities and financial assets measured at FVIS Available-for-sale securities/Investment securities | Strategic equity investments, investments in unlisted funds and investments in boutique investment management companies | Valued using valuation techniques appropriate to the investment, including the use of recent arm’s length transactions where available, discounted cash flow approach, reference to the net assets of the entity or to the most recent fund unit pricing. Due to their illiquidity, complexity and/or use of unobservable inputs into valuation models, they are classified as Level 3 assets. |
| 2019 Westpac Group Annual Report | 257 |
| | |
Notes to the financial statements
Note 22. Fair values of financial assets and financial liabilities1 (continued)
The tables below summarise the attribution of financial instruments measured at fair value to the fair value hierarchy:
| | | 2019 | | | | 2018 | |
| | | | | | | | |
| | Valuation | Valuation | | | Valuation | Valuation | |
| Quoted | techniques | techniques | | Quoted | techniques | techniques | |
| market | (Market | (Non-market | | market | (Market | (Non-market | |
Consolidated | prices | observable) | observable) | | prices | observable) | observable) | |
$m | (Level 1) | (Level 2) | (Level 3) | Total | (Level 1) | (Level 2) | (Level 3) | Total |
Financial assets measured at fair value on a recurring basis | | | | | | | | |
Trading securities and financial assets measured at FVIS | 10,440 | 21,121 | 220 | 31,781 | 8,958 | 13,844 | 330 | 23,132 |
Derivative financial instruments | 7 | 29,828 | 24 | 29,859 | 20 | 24,066 | 15 | 24,101 |
Available-for-sale securities | – | – | – | – | 11,996 | 48,504 | 619 | 61,119 |
Investment securities | 11,163 | 61,284 | 134 | 72,581 | – | – | – | – |
Loans2 | – | 239 | 21 | 260 | – | 546 | – | 546 |
Life insurance assets | 1,097 | 8,270 | – | 9,367 | 1,345 | 8,105 | – | 9,450 |
Total financial assets measured at fair value on a recurring basis | 22,707 | 120,742 | 399 | 143,848 | 22,319 | 95,065 | 964 | 118,348 |
Financial liabilities measured at fair value on a recurring basis | | | | | | | | |
Deposits and other borrowings3 | – | 38,413 | – | 38,413 | – | 41,178 | – | 41,178 |
Other financial liabilities4 | 262 | 5,108 | – | 5,370 | 496 | 3,801 | – | 4,297 |
Derivative financial instruments | 8 | 29,059 | 29 | 29,096 | 76 | 24,325 | 6 | 24,407 |
Debt issues5 | – | 5,819 | – | 5,819 | – | 3,355 | – | 3,355 |
Life insurance liabilities | – | 7,377 | – | 7,377 | – | 7,597 | – | 7,597 |
Total financial liabilities measured at fair value on a recurring basis | 270 | 85,776 | 29 | 86,075 | 572 | 80,256 | 6 | 80,834 |
| | | | | | | | |
| | | 2019 | | | | 2018 | |
| | | | | | | | |
| | Valuation | Valuation | | | Valuation | Valuation | |
| Quoted | techniques | techniques | | Quoted | techniques | techniques | |
| market | (Market | (Non-market | | market | (Market | (Non-market | |
Parent Entity | prices | observable) | observable) | | prices | observable) | observable) | |
$m | (Level 1) | (Level 2) | (Level 3) | Total | (Level 1) | (Level 2) | (Level 3) | Total |
Financial assets measured at fair value on a recurring basis | | | | | | | | |
Trading securities and financial assets measured at FVIS | 10,213 | 19,159 | 193 | 29,565 | 8,952 | 12,257 | 206 | 21,415 |
Derivative financial instruments | 7 | 29,253 | 23 | 29,283 | 20 | 23,529 | 13 | 23,562 |
Available-for-sale securities | – | – | – | – | 10,657 | 45,786 | 70 | 56,513 |
Investment securities | 10,191 | 58,114 | 66 | 68,371 | – | – | – | – |
Loans2 | – | 239 | 21 | 260 | – | 546 | – | 546 |
Due from subsidiaries6 | – | 897 | – | 897 | – | 278 | – | 278 |
Total financial assets measured at fair value on a recurring basis | 20,411 | 107,662 | 303 | 128,376 | 19,629 | 82,396 | 289 | 102,314 |
Financial liabilities measured at fair value on a recurring basis | | | | | | | | |
Deposits and other borrowings3 | – | 37,355 | – | 37,355 | – | 40,062 | – | 40,062 |
Other financial liabilities4 | 262 | 5,108 | – | 5,370 | 496 | 3,801 | – | 4,297 |
Derivative financial instruments | 8 | 28,831 | 28 | 28,867 | 76 | 24,147 | 6 | 24,229 |
Debt issues5 | – | 3,624 | – | 3,624 | – | 3,223 | – | 3,223 |
Due to subsidiaries6 | – | 1,591 | – | 1,591 | – | 523 | – | 523 |
Total financial liabilities measured at fair value on a recurring basis | 270 | 76,509 | 28 | 76,807 | 572 | 71,756 | 6 | 72,334 |
1. | The Group has adopted AASB 9 and AASB 15 from 1 October 2018. Comparatives have not been restated. In addition, the Group has made a number of presentational changes to the Balance Sheet. Comparatives have been restated. Refer to Note 1 for further detail. |
| |
2. | As at 30 September 2018, loans measured at fair value were restated from $3,250 million to $546 million for both the Group and the Parent Entity. |
| |
3. | The contractual outstanding amount payable at maturity for the Group is $38,468 million (2018: $41,330 million) and for the Parent Entity is $37,410 million (2018: $40,214 million). |
| |
4. | The contractual outstanding amount payable at maturity for the Group and the Parent Entity is $5,369 million (2018: $4,298 million). |
| |
5. | The contractual outstanding amount payable at maturity for the Group is $5,632 million (2018: $3,475 million) and for the Parent Entity is $3,436 million (2018: $3,344 million). The cumulative change in the fair value of debt issues attributable to changes in Westpac’s own credit risk is $34 million decrease (2018: $45 million decrease) for the Group and Parent Entity. |
| |
6. | As at 30 September 2018, the balances disclosed have been restated to include due from subsidiaries and due to subsidiaries measured at fair value. |
258 | 2019 Westpac Group Annual Report | |
| | |
Notes to the financial statements
Note 22. Fair values of financial assets and financial liabilities (continued)
Reconciliation of non-market observables1
The following tables summarise the changes in financial instruments measured at fair value derived from non- market observable valuation techniques (Level 3):
| Trading | | | | | | |
| securities and | | | | | | |
| financial assets | Available- | | | Total | | Total |
Consolidated 2019 | measured | for-sale | Investment | | Level 3 | | Level 3 |
$m | at FVIS | securities | securities | Other2 | assets | Derivatives | liabilities |
Balance as at beginning of year | 330 | 619 | – | 15 | 964 | 6 | 6 |
Impact on adoption of AASB 9 | 4 | (619) | 109 | 14 | (492) | – | – |
Restated opening balance | 334 | – | 109 | 29 | 472 | 6 | 6 |
Gains/(losses) on assets and (gains)/ losses on liabilities recognised in: | | | | | | | |
Income statements | 36 | – | – | 12 | 48 | 7 | 7 |
Other comprehensive income | – | – | 11 | – | 11 | – | – |
Acquisition and issues | 63 | – | 36 | 16 | 115 | 4 | 4 |
Disposal and settlements | (216) | – | (22) | (12) | (250) | (6) | (6) |
Transfer into or out of non-market observables | – | – | – | – | – | 18 | 18 |
Foreign currency translation impacts | 3 | – | – | – | 3 | – | – |
Balance as at end of year | 220 | – | 134 | 45 | 399 | 29 | 29 |
Unrealised gains/(losses) recognised in the income statements for financial instruments held as at end of year | 26 | – | – | 16 | 42 | (11) | (11) |
| | | | | | | |
| | Trading | | | | | |
| | securities and | | | | | |
| | inancial assets | Available- | | Total | | Total |
Consolidated 2018 | | measured | for-sale | | Level 3 | | Level 3 |
$m | | at FVIS | securities | Other2 | assets | Derivatives | liabilities |
Balance as at beginning of year | 767 | 617 | 15 | 1,399 | 9 | 9 |
Gains/(losses) on assets/(gains)/losses on liabilities recognised in: | | | | | | |
Income statements | 2 | – | 1 | 3 | 1 | 1 |
Available-for-sale securities reserve | – | (7) | – | (7) | – | – |
Acquisition and issues | 67 | 1,446 | 3 | 1,516 | 1 | 1 |
Disposal and settlements | (433) | (1,456) | (4) | (1,893) | (5) | (5) |
Transfer into or out of non-market observables | (75) | – | – | (75) | – | – |
Foreign currency translation impacts | 2 | 19 | – | 21 | – | – |
Balance as at end of year | 330 | 619 | 15 | 964 | 6 | 6 |
Unrealised gains/(losses) recognised in the income statements for financial instruments held as at end of year | (7) | – | 4 | (3) | (2) | (2) |
1. | The Group has adopted AASB 9 and AASB 15 from 1 October 2018. Comparatives have not been restated. In addition, the Group has made a number of presentational changes to the Balance Sheet. Comparatives have been restated. Refer to Note 1 for further detail. |
| |
2. | Other is comprised of derivative financial assets and, for 2019 only, certain loans. |
| 2019 Westpac Group Annual Report | 259 |
| | |
Notes to the financial statements
Note 22. Fair values of financial assets and financial liabilities1 (continued)
| Trading | | | | | | |
| securities and | | | | | | |
| financial assets | Available- | | | Total | | Total |
Parent Entity 2019 | measured | for-sale | Investment | | Level 3 | | Level 3 |
$m | at FVIS | securities | securities | Other2 | assets | Derivatives | liabilities |
Balance as at beginning of year | 206 | 70 | – | 13 | 289 | 6 | 6 |
Impact on adoption of AASB 9 | – | (70) | 67 | 14 | 11 | – | – |
Restated opening balance | 206 | – | 67 | 27 | 300 | 6 | 6 |
Gains/(losses) on assets and (gains)/ losses on liabilities recognised in: | | | | | | | |
Income statements | 6 | – | – | 13 | 19 | 6 | 6 |
Other comprehensive income | – | – | – | – | – | – | – |
Acquisition and issues | 17 | – | 2 | 16 | 35 | 4 | 4 |
Disposal and settlements | (39) | – | (3) | (12) | (54) | (6) | (6) |
Transfer into or out of non-market observables | – | – | – | – | – | 18 | 18 |
Foreign currency translation impacts | 3 | – | – | – | 3 | – | – |
Balance as at end of year | 193 | – | 66 | 44 | 303 | 28 | 28 |
Unrealised gains/(losses) recognised in the income statements for financial instruments held as at end of year | 3 | – | – | 16 | 19 | (10) | (10) |
| | | | | | | |
| | Trading | | | | | |
| | securities and | | | | | |
| | financial assets | Available- | | Total | | Total |
Parent Entity 2018 | | measured | for-sale | | Level 3 | | Level 3 |
$m | | at FVIS | securities | Other2 | assets | Derivatives | liabilities |
Balance as at beginning of year | 501 | 64 | 15 | 580 | 9 | 9 |
Gains/(losses) on assets/(gains)/losses on liabilities recognised in: | | | | | | |
Income statements | 6 | – | 1 | 7 | 1 | 1 |
Available-for-sale securities reserve | – | 2 | – | 2 | – | – |
Acquisition and issues | 21 | 18 | 3 | 42 | 1 | 1 |
Disposal and settlements | (268) | (14) | (6) | (288) | (5) | (5) |
Transfer into or out of non-market observables | (53) | – | – | (53) | – | – |
Foreign currency translation impacts | (1) | – | – | (1) | – | – |
Balance as at end of year | 206 | 70 | 13 | 289 | 6 | 6 |
Unrealised gains/(losses) recognised in the income statements for financial instruments held as at end of year | 5 | – | 4 | 9 | (2) | (2) |
Transfers into and out of Level 3 have occurred due to changes in observability in the significant inputs into the valuation models used to determine the fair value of the related financial instruments. Transfers in and transfers out are reported using the end of year fair values.
1. | The Group has adopted AASB 9 and AASB 15 from 1 October 2018. Comparatives have not been restated. In addition, the Group has made a number of presentational changes to the Balance Sheet. Comparatives have been restated. Refer to Note 1 for further detail. |
| |
2. | Other is comprised of derivative financial assets and, for 2019 only, certain loans. |
260 | 2019 Westpac Group Annual Report | |
| | |
Notes to the financial statements
Note 22. Fair values of financial assets and financial liabilities (continued)
Significant unobservable inputs
Sensitivities to reasonably possible changes in non-market observable valuation assumptions would not have a material impact on the Group’s reported results.
Day one profit or loss
The closing balance of unrecognised day one profit for both the Group and the Parent Entity for the year was $3 million (2018: $4 million profit).
Financial instruments not measured at fair value
For financial instruments not measured at fair value on a recurring basis, fair value has been derived as follows:
Instrument | | Valuation |
Loans | | Where available, the fair value of loans is based on observable market transactions, otherwise fair value is estimated using discounted cash flow models. For variable rate loans, the discount rate used is the current effective interest rate. The discount rate applied for fixed rate loans reflects the market rate for the maturity of the loan and the credit worthiness of the borrower. |
Investment securities | | The carrying value approximates the fair value. The balance principally relates to government securities from illiquid markets. Fair value is monitored by reference to recent issuances. |
Deposits and other borrowings | | Fair values of deposit liabilities payable on demand (interest free, interest bearing and savings deposits) approximate their carrying value. Fair values for term deposits are estimated using discounted cash flows, applying market rates offered for deposits of similar remaining maturities. |
Debt issues and loan capital | | Fair values are calculated using a discounted cash flow model. The discount rates applied reflect the terms of the instruments, the timing of the estimated cash flows and are adjusted for any changes in Westpac’s credit spreads. |
All other financial assets and liabilities | | For all other financial assets and liabilities, the carrying value approximates the fair value. These items are either short-term in nature, re-price frequently or are of a high credit rating. |
| 2019 Westpac Group Annual Report | 261 |
| | |
Notes to the financial statements
Note 22. Fair values of financial assets and financial liabilities1 (continued)
The following tables summarise the estimated fair value and fair value hierarchy of financial instruments not measured at fair value:
| | 2019 Fair value | |
Consolidated
$m | Carrying
amount | Quoted
market
prices
(Level 1) | Valuation
techniques
(Market
observable)
(Level 2) | Valuation
techniques
(Non-market
observable)
(Level 3) | Total |
Financial assets not measured at fair value | | | | | |
Cash and balances with central banks | 20,059 | 20,059 | – | – | 20,059 |
Collateral paid | 5,930 | 5,930 | – | – | 5,930 |
Investment securities | 820 | – | 366 | 454 | 820 |
Loans | 714,510 | – | – | 716,130 | 716,130 |
Other financial assets | 5,367 | – | 5,367 | – | 5,367 |
Total financial assets not measured at fair value | 746,686 | 25,989 | 5,733 | 716,584 | 748,306 |
Financial liabilities not measured at fair value | | | | | |
Collateral received | 3,287 | 3,287 | – | – | 3,287 |
Deposits and other borrowings | 524,834 | – | 522,726 | 2,790 | 525,516 |
Other financial liabilities | 23,845 | – | 23,845 | – | 23,845 |
Debt issues2 | 175,638 | – | 176,838 | – | 176,838 |
Loan capital | 21,826 | – | 22,076 | – | 22,076 |
Total financial liabilities not measured at fair value | 749,430 | 3,287 | 745,485 | 2,790 | 751,562 |
| | | |
| | 2018 Fair value |
Consolidated
$m | Carrying
amount | Quoted
market
prices
(Level 1) | Valuation
techniques
(Market
observable)
(Level 2) | Valuation
techniques
(Non-market
observable)
(Level 3) | Total |
Financial assets not measured at fair value | | | | | |
Cash and balances with central banks | 26,788 | 26,788 | – | – | 26,788 |
Collateral paid | 4,787 | 4,787 | – | – | 4,787 |
Loans3 | 709,144 | – | – | 709,446 | 709,446 |
Other financial assets | 5,517 | – | 5,517 | – | 5,517 |
Total financial assets not measured at fair value | 746,236 | 31,575 | 5,517 | 709,446 | 746,538 |
Financial liabilities not measured at fair value | | | | | |
Collateral received | 2,184 | 2,184 | – | – | 2,184 |
Deposits and other borrowings | 518,107 | – | 515,953 | 2,838 | 518,791 |
Other financial liabilities | 23,808 | – | 23,808 | – | 23,808 |
Debt issues2 | 169,241 | – | 170,060 | – | 170,060 |
Loan capital | 17,265 | – | 17,438 | – | 17,438 |
Total financial liabilities not measured at fair value | 730,605 | 2,184 | 727,259 | 2,838 | 732,281 |
1. The Group has adopted AASB 9 and AASB 15 from 1 October 2018. Comparatives have not been restated. In addition, the Group has made a number of presentational changes to the Balance Sheet. Comparatives have been restated. Refer to Note 1 for further detail.
2. The estimated fair value of debt issues includes the impact of changes in Westpac’s credit spreads since origination.
3. As at 30 September 2018, loans measured at amortised cost were restated from $706,440 million to $709,144 million. Accordingly, the fair value estimates were also restated from $706,742 million to $709,446 million.
262 | 2019 Westpac Group Annual Report | |
| | |
Notes to the financial statements
Note 22. Fair values of financial assets and financial liabilities1 (continued)
| | 2019 Fair value | |
Parent Entity
$m | Carrying
amount | Quoted
market
prices
(Level 1) | Valuation
techniques
(Market
observable)
(Level 2) | Valuation
techniques
(Non-market
observable)
(Level 3) | Total |
Financial assets not measured at fair value | | | | | |
Cash and balances with central banks | 17,692 | 17,692 | – | – | 17,692 |
Collateral paid | 5,773 | 5,773 | – | – | 5,773 |
Investment securities | 27 | – | 4 | 23 | 27 |
Loans | 631,676 | – | – | 633,003 | 633,003 |
Due from subsidiaries2 | 133,899 | – | 89,680 | 45,175 | 134,855 |
Other financial assets | 4,615 | – | 4,615 | – | 4,615 |
Total financial assets not measured at fair value | 793,682 | 23,465 | 94,299 | 678,201 | 795,965 |
Financial liabilities not measured at fair value | | | | | |
Collateral received | 2,849 | 2,849 | – | – | 2,849 |
Deposits and other borrowings | 464,075 | – | 463,440 | 1,251 | 464,691 |
Other financial liabilities | 23,146 | – | 23,146 | – | 23,146 |
Debt issues3 | 153,050 | – | 154,111 | – | 154,111 |
Due to subsidiaries2 | 147,016 | – | 6,553 | 140,463 | 147,016 |
Loan capital | 21,826 | – | 22,076 | – | 22,076 |
Total financial liabilities not measured at fair value | 811,962 | 2,849 | 669,326 | 141,714 | 813,889 |
| | | |
| | 2018 Fair value | |
Parent Entity
$m | Carrying
amount | Quoted
market
prices
(Level 1) | Valuation
techniques
(Market
observable)
(Level 2) | Valuation
techniques
(Non-market
observable)
(Level 3) | Total |
Financial assets not measured at fair value | | | | | |
Cash and balances with central banks | 24,976 | 24,976 | – | – | 24,976 |
Collateral paid | 4,722 | 4,722 | – | – | 4,722 |
Loans4 | 629,622 | – | – | 629,774 | 629,774 |
Due from subsidiaries2 | 133,808 | – | 88,368 | 46,295 | 134,663 |
Other financial assets | 4,666 | – | 4,666 | – | 4,666 |
Total financial assets not measured at fair value | 797,794 | 29,698 | 93,034 | 676,069 | 798,801 |
Financial liabilities not measured at fair value | | | | | |
Collateral received | 1,748 | 1,748 | – | – | 1,748 |
Deposits and other borrowings | 460,406 | – | 459,841 | 1,213 | 461,054 |
Other financial liabilities | 22,969 | – | 22,969 | – | 22,969 |
Debt issues3 | 149,065 | – | 149,800 | – | 149,800 |
Due to subsidiaries2 | 141,877 | – | 6,933 | 134,944 | 141,877 |
Loan capital | 17,265 | – | 17,438 | – | 17,438 |
Total financial liabilities not measured at fair value | 793,330 | 1,748 | 656,981 | 136,157 | 794,886 |
1. The Group has adopted AASB 9 and AASB 15 from 1 October 2018. Comparatives have not been restated. In addition, the Group has made a number of presentational changes to the Balance Sheet. Comparatives have been restated. Refer to Note 1 for further detail.
2. Due from subsidiaries excludes $8,165 million (2018: $6,511 million) of long-term debt instruments with equity-like characteristics which are part of the total investment in subsidiaries. As at 30 September 2018, the due from subsidiaries measured at amortised cost was restated from $140,597 million to $133,808 million, and due to subsidiaries measured at amortised cost was restated from $142,400 million to $141,877 million. Accordingly, the fair value estimate of due from subsidiaries was restated from $140,597 million (all within Level 3) to $134,663 million (split between Level 2 and Level 3), and the fair value estimate of due to subsidiaries was restated from $142,400 million (all within Level 3) to $141,877 million (split between Level 2 and Level 3).
3. The estimated fair value of debt issues includes the impact of changes in Westpac’s credit spreads since origination.
4. As at 30 September 2018, loans measured at amortised cost were restated from $626,918 million to $629,622 million. Accordingly, the fair value estimates were also restated from $627,070 million to $629,774 million.
| 2019 Westpac Group Annual Report | 263 |
| | |
Notes to the financial statements
Note 23. Offsetting financial assets and financial liabilities1
Accounting policy
Financial assets and liabilities are presented net in the balance sheet when the Group has a legally enforceable right to offset them in all circumstances and there is an intention to settle the asset and liability on a net basis, or to realise the asset and settle the liability simultaneously. The gross assets and liabilities behind the net amounts reported in the balance sheet are disclosed in the table below. |
Some of the Group’s offsetting arrangements are not enforceable in all circumstances. The amounts in the tables below may not tie back to the balance sheet if there are balances which are not subject to offsetting or enforceable netting arrangements. The amounts presented in this note do not represent the credit risk exposure of the Group or Parent Entity. Refer to Note 21.2 for information on credit risk management. The offsetting and collateral arrangements and other credit risk mitigation strategies used by the Group are further explained in the ‘Management of risk mitigation’ section of Note 21.2.2.
| Effects of offsetting
on balance sheet | | Amounts subject to enforceable
netting arrangements but not offset |
| | | Net amounts | | Other | | | |
| | | reported on | | recognised | | Financial | |
Consolidated | Gross | Amounts | the balance | | financial | Cash | instrument | Net |
$m | amounts | offset | sheet | | instruments | collateral2,3 | collateral | amount |
2019 | | | | | | | | |
Assets | | | | | | | | |
Collateral paid4 | 6,643 | (6,559) | 84 | | – | – | (17) | 67 |
Derivative financial instruments | 61,464 | (31,605) | 29,859 | | (18,609) | (3,280) | (102) | 7,868 |
Reverse repurchase agreements5 | 6,833 | – | 6,833 | | – | (9) | (6,824) | – |
Loans6 | 18,202 | (18,130) | 72 | | – | – | – | 72 |
Total assets | 93,142 | (56,294) | 36,848 | | (18,609) | (3,289) | (6,943) | 8,007 |
Liabilities | | | | | | | | |
Collateral received | 3,024 | (2,972) | 52 | | – | – | – | 52 |
Derivative financial instruments | 64,288 | (35,192) | 29,096 | | (18,609) | (5,622) | (1,932) | 2,933 |
Repurchase agreements7 | 10,604 | – | 10,604 | | – | (3) | (10,601) | – |
Deposits and other borrowings6 | 28,880 | (18,130) | 10,750 | | – | – | – | 10,750 |
Total liabilities | 106,796 | (56,294) | 50,502 | | (18,609) | (5,625) | (12,533) | 13,735 |
2018 | | | | | | | | |
Assets | | | | | | | | |
Collateral paid4 | 4,196 | (4,162) | 34 | | – | – | (14) | 20 |
Derivative financial instruments | 32,828 | (8,727) | 24,101 | | (15,962) | (2,184) | (14) | 5,941 |
Reverse repurchase agreements5 | 1,379 | – | 1,379 | | – | (3) | (1,376) | – |
Loans6 | 8,519 | (8,420) | 99 | | – | – | – | 99 |
Total assets | 46,922 | (21,309) | 25,613 | | (15,962) | (2,187) | (1,404) | 6,060 |
Liabilities | | | | | | | | |
Derivative financial instruments | 37,296 | (12,889) | 24,407 | | (15,962) | (4,487) | (1,544) | 2,414 |
Repurchase agreements7 | 9,522 | – | 9,522 | | – | – | (9,522) | – |
Deposits and other borrowings6 | 20,486 | (8,420) | 12,066 | | – | – | – | 12,066 |
Total liabilities | 67,304 | (21,309) | 45,995 | | (15,962) | (4,487) | (11,066) | 14,480 |
1. The Group has adopted AASB 9 and AASB 15 from 1 October 2018. Comparatives have not been restated. In addition, the Group has made a number of presentational changes to the Balance Sheet. Comparatives have been restated. Refer to Note 1 for further detail.
2. $3,287 million (2018: $2,184 million) of cash collateral, subject to enforceable netting arrangements with derivative financial assets and reverse repurchase agreements, forms part of collateral received as disclosed on the balance sheet. The remainder is included in term deposits recognised in deposits and other borrowings within Note 16.
3. $5,625 million (2018: $4,487 million) of cash collateral, subject to enforceable netting arrangements with derivative financial liabilities and repurchase agreements, forms part of collateral paid as disclosed on the balance sheet. The remainder of collateral paid, as disclosed on the balance sheet, consists of $18 million (2018: $14 million) in stock borrowing arrangements and $287 million (2018: $286 million) related to futures margin that does not form part of this column.
4. Gross amounts consist of variation margin held directly with central clearing counterparties and stock borrowing arrangements. Where variation margin is receivable it is reported as part of collateral paid. Where variation margin is payable it is reported as part of collateral received. Amounts offset relate to variation margin. 2018 restated to exclude $61 million of initial margin.
5. Reverse repurchase agreements form part of trading securities and financial assets measured at FVIS in Note 10.
6. Gross amounts consist of debt and interest set-off accounts which meet the requirements for offsetting as described above. These accounts form part of business loans in Note 12 and part of deposits and other borrowings at amortised cost in Note 16.
7. Repurchase agreements form part of other financial liabilities in Note 17.
264 | 2019 Westpac Group Annual Report | |
| | |
Notes to the financial statements
Note 23. Offsetting financial assets and financial liabilities1 (continued)
| Effects of offsetting
on balance sheet | | Amounts subject to enforceable
netting arrangements but not offset |
| | | Net amounts | | Other | | | |
| | | reported on | | recognised | | Financial | |
Parent Entity | Gross | Amounts | the balance | | financial | Cash | instrument | Net |
$m | amounts | offset | sheet | | instruments | collateral2,3 | collateral | amount |
2019 | | | | | | | | |
Assets | | | | | | | | |
Collateral paid4 | 6,643 | (6,559) | 84 | | – | – | (17) | 67 |
Derivative financial instruments | 60,888 | (31,605) | 29,283 | | (18,526) | (2,842) | (102) | 7,813 |
Reverse repurchase agreements5 | 6,731 | – | 6,731 | | – | (9) | (6,722) | – |
Loans6 | 18,202 | (18,130) | 72 | | – | – | – | 72 |
Total assets | 92,464 | (56,294) | 36,170 | | (18,526) | (2,851) | (6,841) | 7,952 |
Liabilities | | | | | | | | |
Collateral received | 3,024 | (2,972) | 52 | | – | – | – | 52 |
Derivative financial instruments | 64,059 | (35,192) | 28,867 | | (18,526) | (5,466) | (1,932) | 2,943 |
Repurchase agreements7 | 10,604 | – | 10,604 | | – | (3) | (10,601) | – |
Deposits and other borrowings6 | 28,880 | (18,130) | 10,750 | | – | – | – | 10,750 |
Total liabilities | 106,567 | (56,294) | 50,273 | | (18,526) | (5,469) | (12,533) | 13,745 |
2018 | | | | | | | | |
Assets | | | | | | | | |
Collateral paid4 | 4,196 | (4,162) | 34 | | – | – | (14) | 20 |
Derivative financial instruments | 32,289 | (8,727) | 23,562 | | (15,862) | (1,748) | (14) | 5,938 |
Reverse repurchase agreements5 | 1,379 | – | 1,379 | | – | (3) | (1,376) | – |
Loans6 | 8,519 | (8,420) | 99 | | – | – | – | 99 |
Total assets | 46,383 | (21,309) | 25,074 | | (15,862) | (1,751) | (1,404) | 6,057 |
Liabilities | | | | | | | | |
Derivative financial instruments | 37,118 | (12,889) | 24,229 | | (15,862) | (4,423) | (1,544) | 2,400 |
Repurchase agreements7 | 9,522 | – | 9,522 | | – | – | (9,522) | – |
Deposits and other borrowings6 | 20,486 | (8,420) | 12,066 | | – | – | – | 12,066 |
Total liabilities | 67,126 | (21,309) | 45,817 | | (15,862) | (4,423) | (11,066) | 14,466 |
Other recognised financial instruments
These financial assets and liabilities are subject to master netting agreements which are not enforceable in all circumstances, so they are recognised gross in the balance sheet. The offsetting rights of the master netting arrangements can only be enforced if a predetermined event occurs in the future, such as a counterparty defaulting.
Cash collateral and financial instrument collateral
These amounts are received or pledged under master netting arrangements against the gross amounts of assets and liabilities. Financial instrument collateral typically comprises securities which can be readily liquidated in the event of counterparty default. The offsetting rights of the master netting arrangement can only be enforced if a predetermined event occurs in the future, such as a counterparty defaulting.
1. The Group has adopted AASB 9 and AASB 15 from 1 October 2018. Comparatives have not been restated. In addition, the Group has made a number of presentational changes to the Balance Sheet. Comparatives have been restated. Refer to Note 1 for further detail.
2. $2,849 million (2018: $1,748 million) of cash collateral, subject to enforceable netting arrangements with derivative financial assets and reverse repurchase agreements, forms part of collateral received as disclosed on the balance sheet. The remainder is included in term deposits recognised in deposits and other borrowings within Note 16.
3. $5,469 million (2018: $4,423 million) of cash collateral, subject to enforceable netting arrangements with derivative financial liabilities and repurchase agreements, forms part of collateral paid as disclosed on the balance sheet. The remainder of collateral paid, as disclosed on the balance sheet, consists of $18 million (2018: $14 million) in stock borrowing arrangements and $286 million (2018: $285 million) related to futures margin that does not form part of this column.
4. Gross amounts consist of variation margin held directly with central clearing counterparties and stock borrowing arrangements. Where variation margin is receivable it is reported as part of collateral paid. Where variation margin is payable it is reported as part of collateral received. Amounts offset relate to variation margin. 2018 restated to exclude $61 million of initial margin.
5. Reverse repurchase agreements form part of trading securities and financial assets measured at FVIS in Note 10.
6. Gross amounts consist of debt and interest set-off accounts which meet the requirements for offsetting as described above. These accounts form part of business loans in Note 12 and part of deposits and other borrowings at amortised cost in Note 16.
7. Repurchase agreements form part of other financial liabilities in Note 17.
| 2019 Westpac Group Annual Report | 265 |
| | |
Notes to the financial statements
Note 24. Securitisation, covered bonds and other transferred assets
The Group enters into transactions in the normal course of business by which financial assets are transferred to counterparties or structured entities. Depending on the circumstances, these transfers may result in derecognition of the assets in their entirety, partial derecognition or no derecognition of the assets subject to the transfer. For the Group’s accounting policy on derecognition of financial assets refer to the notes to the financial statements section before Note 10 titled ‘Financial assets and financial liabilities’.
Securitisation
Securitisation is the transferring of assets (or an interest in either the assets or the cash flows arising from the assets) to a structured entity which then issues the majority of interest bearing debt securities to third party investors for funding deals and to Westpac for liquidity deals.
Securitisation of its own assets is used by Westpac as a funding and liquidity tool.
For securitisation structured entities which Westpac controls, as defined in Note 31, the structured entities are classified as subsidiaries and consolidated. When assessing whether Westpac controls a structured entity, it considers its exposure to and ability to affect variable returns. Westpac may have variable returns from a structured entity through ongoing exposures to the risks and rewards associated with the assets, the provision of derivatives, liquidity facilities, trust management and operational services.
Undrawn funding and liquidity facilities of $537 million were provided by Westpac (2018: $517 million) for the securitisation of its own assets.
Covered bonds
The Group has two covered bond programs relating to Australian residential mortgages (Australian Program) and New Zealand residential mortgages (New Zealand Program). Under these programs, selected pools of residential mortgages are assigned to bankruptcy remote structured entities which provide guarantees on the payments to bondholders. Through the guarantees and derivatives with the structured entities, Westpac has variable returns from these structured entities and consolidates them.
Repurchase agreements
Where securities are sold subject to an agreement to repurchase at a predetermined price, they remain recognised on the balance sheet in their original category (i.e. Trading securities or Investment securities/Available-for-sale securities).
The cash consideration received is recognised as a liability (Repurchase agreements). Refer to Note 17 for further details.
266 | 2019 Westpac Group Annual Report | |
| | |
Notes to the financial statements
Note 24. Securitisation, covered bonds and other transferred assets (continued)
The following table presents Westpac’s assets transferred and their associated liabilities:
| | | | | | For those liabilities that only have
recourse to the transferred assets: | |
| | Carrying | | Carrying | | Fair | | Fair | | | |
| | amount of | | amount of | | value of | | value of | | Net fair | |
Consolidated | | transferred | | associated | | transferred | | associated | | value | |
$m | | assets | | liabilities | | assets | | liabilities | | position | |
2019 | | | | | | | | | | | |
Securitisation1 | | 8,221 | | 8,190 | | 8,268 | | 8,177 | | 91 | |
Covered bonds2 | | 44,676 | | 38,037 | | n/a | | n/a | | n/a | |
Repurchase agreements | | 13,754 | | 10,604 | | n/a | | n/a | | n/a | |
Total | | 66,651 | | 56,831 | | 8,268 | | 8,177 | | 91 | |
2018 | | | | | | | | | | | |
Securitisation1 | | 7,631 | | 7,588 | | 7,662 | | 7,565 | | 97 | |
Covered bonds2 | | 43,088 | | 35,434 | | n/a | | n/a | | n/a | |
Repurchase agreements | | 12,492 | | 9,522 | | n/a | | n/a | | n/a | |
Total | | 63,211 | | 52,544 | | 7,662 | | 7,565 | | 97 | |
| | | | | | For those liabilities that only have | |
| | | | | | recourse to the transferred assets: | |
| | Carrying | | Carrying | | Fair | | Fair | | | |
| | amount of | | amount of | | value of | | value of | | Net fair | |
Parent Entity | | transferred | | associated | | transferred | | associated | | value | |
$m | | assets | | liabilities | | assets | | liabilities | | position | |
2019 | | | | | | | | | | | |
Securitisation1 | | 101,689 | | 101,146 | | 101,871 | | 100,268 | | 1,603 | |
Covered bonds2 | | 37,697 | | 33,160 | | n/a | | n/a | | n/a | |
Repurchase agreements | | 13,754 | | 10,604 | | n/a | | n/a | | n/a | |
Total | | 153,140 | | 144,910 | | 101,871 | | 100,268 | | 1,603 | |
2018 | | | | | | | | | | | |
Securitisation1 | | 97,259 | | 96,728 | | 97,291 | | 96,473 | | 818 | |
Covered bonds2 | | 36,190 | | 30,268 | | n/a | | n/a | | n/a | |
Repurchase agreements | | 12,492 | | 9,522 | | n/a | | n/a | | n/a | |
Total | | 145,941 | | 136,518 | | 97,291 | | 96,473 | | 818 | |
1. The carrying amount of assets securitised exceeds the amount of notes issued primarily because the carrying amount includes both principal and income received from the transferred assets.
2. The difference between the carrying values of covered bonds and the assets pledged reflects the over-collateralisation required to maintain the ratings of the covered bonds and also additional assets to allow immediate issuance of additional covered bonds if required. These additional assets can be repurchased by Westpac at its discretion, subject to the conditions set out in the transaction documents.
| 2019 Westpac Group Annual Report | 267 |
| | |
Notes to the financial statements
INTANGIBLE ASSETS, PROVISIONS, COMMITMENTS AND CONTINGENCIES
Note 25. Intangible assets
Accounting policy
Indefinite life intangible assets Goodwill Goodwill acquired in a business combination is initially measured at cost, generally being the excess of: (i) the consideration paid; over (ii) the net fair value of the identifiable assets, liabilities and contingent liabilities acquired. Subsequently, goodwill is not amortised but rather tested for impairment. Impairment is tested at least annually or whenever there is an indication of impairment. An impairment charge is recognised when a cash generating unit’s (CGU) carrying value exceeds its recoverable amount. Recoverable amount means the higher of the CGU’s fair value less costs to sell and its value-in-use. Brand names Brand names acquired in a business combination including St.George, BT, BankSA and RAMS, are recognised at cost. Subsequently brand names are not amortised but tested for impairment at least annually or whenever there is an indication of impairment. Finite life intangible assets Finite life intangibles including computer software and core deposits, are recognised initially at cost and subsequently at amortised cost less any impairment. |
|
Intangible | Useful life | Depreciation method |
Goodwill | Indefinite | Not applicable |
| | |
Brand names | Indefinite | Not applicable |
| | |
Computer software | 3 to 10 years | Straight-line or the diminishing balance method (using the Sum of the Years Digits) |
| | |
Core deposit intangibles | 9 years | Straight-line |
| | |
Critical accounting assumptions and estimates Judgement is required in determining the fair value of assets and liabilities acquired in a business combination. A different assessment of fair values would have resulted in a different goodwill balance and different post-acquisition performance of the acquired entity. When assessing impairment of intangible assets, significant judgement is needed to determine the appropriate cash flows and discount rates to be applied to the calculations. The significant assumptions applied to the value-in-use calculations are outlined below. |
|
268 | 2019 Westpac Group Annual Report | |
| | |
Notes to the financial statements
Note 25. Intangible assets (continued)
| | Consolidated | | Parent Entity | |
$m | | 2019 | | 2018 | | 2019 | | 2018 | |
Goodwill | | | | | | | | | |
Opening balance | | 8,890 | | 9,012 | | 6,844 | | 6,844 | |
Disposals1 | | – | | (15 | ) | – | | – | |
Impairment1 | | – | | (105 | ) | – | | – | |
Other adjustments | | 5 | | (2 | ) | – | | – | |
Closing balance | | 8,895 | | 8,890 | | 6,844 | | 6,844 | |
Computer software | | | | | | | | | |
Opening balance | | 2,177 | | 1,916 | | 2,014 | | 1,758 | |
Additions | | 906 | | 882 | | 846 | | 823 | |
Impairment | | (25) | | (2 | ) | (25) | | (2 | ) |
Amortisation | | (694) | | (618 | ) | (628) | | (565 | ) |
Other adjustments | | 1 | | (1 | ) | – | | – | |
Closing balance | | 2,365 | | 2,177 | | 2,207 | | 2,014 | |
Cost | | 6,395 | | 5,727 | | 5,464 | | 4,861 | |
Accumulated amortisation and impairment | | (4,030) | | (3,550 | ) | (3,257) | | (2,847 | ) |
Carrying amount | | 2,365 | | 2,177 | | 2,207 | | 2,014 | |
Brand Names | | | | | | | | | |
Opening balance | | 670 | | 670 | | 636 | | 636 | |
Closing balance | | 670 | | 670 | | 636 | | 636 | |
Carrying amount | | 670 | | 670 | | 636 | | 636 | |
Core deposit intangibles | | | | | | | | | |
Opening balance | | – | | 21 | | – | | 21 | |
Amortisation | | – | | (21 | ) | – | | (21 | ) |
Closing balance | | – | | – | | – | | – | |
Cost | | – | | 1,494 | | – | | 1,279 | |
Accumulated amortisation | | – | | (1,494 | ) | – | | (1,279 | ) |
Carrying amount | | – | | – | | – | | – | |
Other intangible assets | | | | | | | | | |
Opening balance | | 26 | | 33 | | – | | – | |
Additions through business combination | | – | | – | | – | | – | |
Amortisation | | (3) | | (7 | ) | – | | – | |
Closing balance | | 23 | | 26 | | – | | – | |
Cost | | 144 | | 391 | | – | | 160 | |
Accumulated amortisation and impairment | | (121) | | (365 | ) | – | | (160 | ) |
Carrying amount | | 23 | | 26 | | – | | – | |
Total intangible assets | | 11,953 | | 11,763 | | 9,687 | | 9,494 | |
1. The sale of Hastings’ overseas operations and subsequent exit of Hastings’ Australian operations resulted in the entire balance of goodwill previously allocated to Hastings being derecognised ($15m) or impaired ($105m) in 2018.
| 2019 Westpac Group Annual Report | 269 |
| | |
Notes to the financial statements
Note 25. Intangible assets (continued)
Goodwill has been allocated to the following CGUs1:
| | Consolidated | | Parent Entity | |
$m | | 2019 | | 2018 | | 2019 | | 2018 | |
Consumer | | 4,060 | | 3,359 | | 3,144 | | 3,144 | |
Business | | 3,860 | | 2,513 | | 3,213 | | 2,378 | |
Westpac Institutional Bank | | 487 | | 487 | | 487 | | 487 | |
BT Financial Group (Australia) | | – | | 2,048 | | – | | 835 | |
New Zealand | | 488 | | 483 | | – | | – | |
Total goodwill | | 8,895 | | 8,890 | | 6,844 | | 6,844 | |
Significant assumptions used in recoverable amount calculations
Assumptions are used to determine the CGUs’ recoverable amount for goodwill, which is based on value-in-use calculations. Value-in-use refers to the present value of expected cash flows under its current use. The Group discounts the projected cash flows by its adjusted pre-tax equity rate.
· Group’s equity rate was 11.0% (2018: 11.0%).
· Group’s adjusted pre-tax equity rate for:
- Australia was 15.7% (2018: 15.7%); and
- New Zealand was 15.3% (2018: 15.3%).
For the purpose of goodwill impairment testing, the assumptions in the following table are made for each significant CGU. The forecasts applied by management are not reliant on any one particular assumption.
Assumption | | Based on: |
Cash flows | | Zero growth rate beyond 2 year forecast |
Economic market conditions | | Current market expectations |
Business performance | | Observable historical information and current market expectations of the future |
There are no reasonably possible changes in assumptions for any significant CGU that would result in an indication of impairment or have a material impact on the Group’s reported results.
Note 26. Operating lease commitments
Westpac leases various commercial and retail premises and related property and equipment. The lease commitments at 30 September 2018 and 30 September 2019 are as follows:
| | Consolidated | | Parent Entity | |
$m | | 2019 | | 2018 | | 2019 | | 2018 | |
Due within one year | | 608 | | 570 | | 555 | | 498 | |
Due after one year but not later than five years | | 1,716 | | 1,564 | | 1,583 | | 1,356 | |
Due after 5 years | | 1,421 | | 1,819 | | 1,305 | | 1,460 | |
Total lease commitments | | 3,745 | | 3,953 | | 3,443 | | 3,314 | |
Operating leases are entered into to meet the business needs of entities in the Group. Lease rentals are determined in accordance with market conditions when leases are entered into or on rental review dates.
Leased premises that have become excess to the Group’s business needs have been sublet where possible.
The future minimum lease payments receivable from non-cancellable sub-leases were $7 million (2018: $7 million) for the Group and $7 million (2018: $6 million) for Parent Entity.
1. In 2019, BT Financial Group (Australia)’s goodwill has been reallocated to Consumer and Business as a result of the restructure of its operations. Refer to Note 2 for further details of the restructure.
270 | 2019 Westpac Group Annual Report | |
| | |
Notes to the financial statements
Note 27. Provisions, contingent liabilities, contingent assets and credit commitments
Accounting policy
Provisions Provisions are recognised for present obligations arising from past events where a payment (or other economic transfer) is likely to be necessary to settle the obligation and can be reliably estimated. Employee benefits – long service leave provision Long service leave must be granted to employees in Australia and New Zealand. The provision is calculated based on the expected payments. When payments are expected to be more than one year in the future, the payments factor in expected employee service periods and average salary increases which are then discounted. Employee benefits – annual leave and other employee benefits provision The provision for annual leave and other employee benefits (including wages and salaries, inclusive of non- monetary benefits, and any associated on-costs (e.g. payroll tax)) is calculated based on expected payments. Provision for impairment on credit commitments The Group is committed to provide facilities and guarantees as explained below. If it is probable that a facility will be drawn and the resulting asset will be less than the drawn amount then a provision for impairment is recognised. The provision for impairment is calculated using the same methodology as the provision for expected credit losses (refer to Note 13). Compliance, Regulation and Remediation provisions The compliance, regulation and remediation provisions relate to matters of potential misconduct in providing services to our customers identified both as a result of regulatory action and internal reviews. An assessment of the likely cost to the Group of these matters (including applicable customer refunds) is made on a case-by-case basis and specific provisions are made where appropriate. Contingent liabilities Contingent liabilities are possible obligations whose existence will be confirmed only by uncertain future events, and present obligations where the transfer of economic resources is not probable or cannot be reliably measured. Contingent liabilities are not recognised on the balance sheet but are disclosed unless the outflow of economic resources is remote. Undrawn credit commitments The Group enters into various arrangements with customers which are only recognised in the balance sheet when called upon. These arrangements include commitments to extend credit, bill endorsements, financial guarantees, standby letters of credit and underwriting facilities. Contingent assets Contingent assets are possible assets whose existence will be confirmed only by uncertain future events. Contingent assets are not recognised on the balance sheet but are disclosed if an inflow of economic benefits is probable. Critical accounting assumptions and estimates The financial reporting of provisions for litigation and non-lending losses and for compliance, regulation and remediation matters involves a significant degree of judgement in relation to identifying whether a present obligation exists and also in estimating the probability, timing, nature and quantum of the outflows that may arise from past events. These judgements are made based on the specific facts and circumstances relating to individual events. Specific judgements in respect of material items are included in the discussion below. Provisions carried for long service leave are supported by an independent actuarial report. |
| 2019 Westpac Group Annual Report | 271 |
| | |
Notes to the financial statements
Note 27. Provisions, contingent liabilities, contingent assets and credit commitments (continued)
Provisions
| | | | Annual | | | | | | | | | | | | | |
| | | | leave and | | Litigation | | Provisions for | | | | | | Compliance, | | | |
| | Long | | other | | and non- | | impairment | | | | | | regulation and | | | |
| | service | | employee | | lending | | on credit | | Leasehold | | Restructuring | | remediation | | | |
$m | | leave | | benefits | | losses | | commitments1 | | Premises | | provisions | | provisions | | Total | |
Consolidated | | | | | | | | | | | | | | | | | |
Balance at 30 September 2018 | | 417 | | 699 | | 53 | | 239 | | 24 | | 27 | | 469 | | 1,928 | |
Impact on adoption of AASB 9 | | - | | - | | - | | 98 | | - | | - | | - | | 98 | |
Restated opening balance | | 417 | | 699 | | 53 | | 337 | | 24 | | 27 | | 469 | | 2,026 | |
Additions | | 90 | | 866 | | 66 | | - | | 7 | | 259 | | 1,489 | | 2,777 | |
Utilisation | | (51 | ) | (931 | ) | (81 | ) | - | | (7 | ) | (125 | ) | (324 | ) | (1,519 | ) |
Reversal of unutilised provisions | | - | | (20 | ) | - | | (32 | ) | - | | (1 | ) | (61 | ) | (114 | ) |
Other | | - | | - | | - | | - | | - | | - | | (1 | ) | (1 | ) |
Balance at 30 September 2019 | | 456 | | 614 | | 38 | | 305 | | 24 | | 160 | | 1,572 | | 3,169 | |
Parent Entity | | | | | | | | | | | | | | | | | |
Balance at 30 September 2018 | | 386 | | 639 | | 37 | | 206 | | 24 | | 27 | | 447 | | 1,766 | |
Impact on adoption of AASB 9 | | - | | - | | - | | 95 | | - | | - | | - | | 95 | |
Restated opening balance | | 386 | | 639 | | 37 | | 301 | | 24 | | 27 | | 447 | | 1,861 | |
Additions | | 90 | | 813 | | 53 | | - | | 7 | | 259 | | 1,436 | | 2,658 | |
Utilisation | | (48 | ) | (876 | ) | (67 | ) | - | | (7 | ) | (125 | ) | (313 | ) | (1,436 | ) |
Reversal of unutilised provisions | | - | | (19 | ) | - | | (26 | ) | - | | (1 | ) | (57 | ) | (103 | ) |
Balance at 30 September 2019 | | 428 | | 557 | | 23 | | 275 | | 24 | | 160 | | 1,513 | | 2,980 | |
Legislative liabilities
The Group had the following assessed liabilities as at 30 September 2019:
· $22 million (2018: $20 million) based on an actuarial assessment as a self-insurer under the Workers’ Compensation Act 1987 and the Workplace Injury Management and Workers’ Compensation Act 1998 (New South Wales);
· $7 million (2018: $9 million) based on actuarial assessment as a self-insurer under the Accident Compensation Act 1985 (Victoria);
· $6 million (2018: $5 million) based on actuarial assessment as a self-insurer under the Workers’ Rehabilitation and Compensation Act 1986 (South Australia);
· $1 million (2018: $2 million) based on an actuarial assessment as a self-insurer under the Workers’ Compensation and Rehabilitation Act 2003 (Queensland);
· $Nil (2018: $1 million) based on an actuarial assessment as a self-insurer under the Workers’ Compensation Act 1951 (Australian Capital Territory);
· $1 million (2018: $2 million) based on an actuarial assessment as a self-insurer under the Workers’ Compensation and Injury Management Act 1981 (Western Australia); and
· $1 million (2018: $1 million) based on an actuarial assessment as a self-insurer under the Workers’ Rehabilitation and Compensation Act 1988 (Tasmania).
Adequate provision has been made for these liabilities in the provision for annual leave and other employee benefits above.
Compliance, regulation and remediation provisions
Provisions in respect of compliance, regulation and remediation at 30 September 2019 include:
· customer refunds associated with certain ongoing advice service fees charged by the Group’s salaried financial planners;
· customer refunds associated with certain ongoing advice service fees charged by authorised representatives of the Group’s wholly owned subsidiaries, Securitor Financial Group Limited (Securitor) and Magnitude Group Pty Ltd (Magnitude);
· refunds for certain consumer and business customers that had interest only loans that did not automatically switch, when required, to principal and interest loans; and
· refunds to certain business customers who were provided with business loans where they should have been provided with loans covered by the National Consumer Credit Protection Act.
1. The Group has adopted AASB 9 and AASB 15 from 1 October 2018. Comparatives have not been restated. In addition, the Group has made a number of presentational changes to the Balance Sheet. Comparatives have been restated. Refer to Note 1 for further detail.
272 | 2019 Westpac Group Annual Report | |
| | |
Notes to the financial statements
Note 27. Provisions, contingent liabilities, contingent assets and credit commitments (continued)
The provisions for certain ongoing advice service fees charged by the Group’s salaried financial planners and by authorised representatives of Securitor and Magnitude require significant judgement and are summarised as follows:
Customer refunds associated with certain ongoing advice service fees charged by the Group’s salaried financial planners
Westpac has raised a provision for customer refunds associated with certain ongoing advice service fees charged by the Group’s salaried financial planners during the period 2008 to 2018, including instances where records of financial advice are insufficient.
A number of estimates have been used and judgements have been applied in determining the provision of $276 million as at 30 September 2019. These include:
· Total fees received by the Group in respect of salaried financial planners in the period 2008 to 2018 were approximately $594 million;
· The proportion of total fees that are estimated to be refunded is 26%. The key assumption in this estimate relates to the nature and extent of records to evidence that services were provided; and
· The time value of money including the forecast timing over which payments are likely to be made.
The provision also includes estimated costs associated with running the remediation program.
Ongoing advice service fees charged by authorised representatives of Securitor and Magnitude
The Group has estimated customer remediation costs (including interest on refunded fees and additional costs to implement the remediation program) where customers of authorised representatives of the Group’s wholly owned subsidiaries Securitor and Magnitude paid ongoing advice service fees to those representatives and where it is not clear that the services were provided. The ongoing advice service fees were charged during the period from 2008 to 2018.
There are challenges involved in determining the extent of the services provided by authorised representatives who are no longer operating under the Magnitude and Securitor licences because, amongst other things, many of the former authorised representatives’ files have been difficult to access particularly where authorised representatives have ceased operating under the Group’s licences or have left the industry.
As a result, we have conducted sample based reviews in order to develop an estimate of fees that may need to be refunded. The insights from these reviews have informed a number of the estimates that have been used and the judgements which have been applied in estimating the provision of $606 million at 30 September 2019. They include:
· Total fees received by authorised representatives from their customers in the period 2008 to 2018 were approximately $936 million; and
· The proportion of fees that are estimated to be refundable under the current proposed remediation methodology is 32%. The key assumptions in this estimate include:
- The basis for refunding customers of the authorised representatives; and
- The nature, extent and availability of records to evidence that service was provided; and
· The time value of money including the forecast timing over which payments are likely to be made.
The provision also includes estimated costs associated with running the remediation program.
The provision is necessarily based on a number of assumptions and incomplete information. Westpac is also yet to finalise its remediation approach which may change following industry and regulator discussions. It is possible that the final outcome could be below or above the provision, if the actual outcome differs to the assumptions used in estimating the provision. Remediation processes may change over time as further facts emerge and such changes could result in a change to the final exposure.
Restructuring provisions
The Group holds restructuring provisions in relation to management changes to the scope or manner of certain business activities.
During the year, the Group raised a restructuring provision in relation to the reset of its wealth strategy which was announced on 19 March 2019. This resulted in a number of changes to its wealth business. Key changes that have been made include:
· The realigning of the major BT businesses into expanded Consumer and Business divisions;
· Exiting of the provision of personal financial advice by Westpac Group salaried financial planners and authorised representatives;
· Moved to a referral model for financial advice by utilising a panel of advisers or adviser firms; and
· Sold part of the businesses to Viridian Advisory. This enabled many BT Financial Advice ongoing advice customers to transfer to Viridian Advisory. A number of the Group’s salaried financial advisers and support staff transitioned to Viridian from the completion date of 1 July 2019. Some authorised representatives also moved to Viridian prior to 30 September 2019.
| 2019 Westpac Group Annual Report | 273 |
| | |
Notes to the financial statements
Note 27. Provisions, contingent liabilities, contingent assets and credit commitments (continued)
Other provisions
The Group also holds certain provisions relating to previously claimed research and development tax incentives.
Contingent liabilities
Contingent liabilities are possible obligations whose existence will be confirmed only by uncertain future events and present obligations where the transfer of economic resources is not probable or cannot be reliably measured. Contingent liabilities are not recognised on the balance sheet but are disclosed unless the outflow of economic resource is remote.
Regulatory actions
Regulators and other bodies routinely conduct investigations and reviews involving the financial services sector, both in Australia and overseas. These investigations and reviews may consider a range of subject matters, and in Australia, a number of investigations and reviews have recently considered, and continue to consider, potential misconduct in credit and financial services.
Domestic regulators such as ASIC, APRA, ACCC, AUSTRAC, the OAIC and the ATO, as well as certain international regulators such as the Reserve Bank of New Zealand, Financial Markets Authority in New Zealand, Hong Kong Monetary Authority, Monetary Authority of Singapore and National Futures Association in the U.S. are also currently conducting investigations and reviews and inquiries (some of which are industry-wide) that involve or may involve the Group in the future. These investigations and reviews are separately considering a range of matters, including matters such as ongoing advice services fees, responsible lending, residential mortgages, credit portfolio management, consumer credit insurance, privacy and information governance, the provision of financial advice, competition law conduct, anti-money laundering and counter-terrorism financing processes and procedures, and financial markets conduct.
Westpac has also received various notices and requests for information from regulators as part of both industry- wide and Westpac-specific investigations and reviews and inquiries.
These investigations and reviews and inquiries, which may be conducted by a regulator, and in some cases also an external third party retained either by the regulator or by the Group (including where a matter has been self- identified by the Group), may result in litigation (including class action proceedings against the Group), fines, imposition of additional capital, civil or criminal penalties, revocation, suspension or variation of conditions of relevant regulatory licences or other enforcement or administrative action being taken by regulators or other parties. An assessment of the likely cost to the Group of these investigations and reviews and actions has been made on a case-by-case basis for the purpose of the financial statements but cannot always be reliably estimated.
One regulatory action currently being conducted relates to International Funds Transfer Instructions (IFTIs) required to be reported under Australia’s AML/CTF Act. Under the Act, the ‘sender’ financial institution of an IFTI transmitted out of Australia, or the ‘recipient’ financial institution of an IFTI transmitted into Australia, is required to report the IFTI to AUSTRAC within 10 business days of the instruction being sent or received. As reported in the Group’s 2018 Annual Report, the Group self-reported to AUSTRAC a failure to report a large number of IFTIs. The majority of the IFTIs which are the subject of the Group’s engagement with AUSTRAC, concern batch instructions received by Westpac through one WIB product between 2009 and 2018 from a small number of correspondent banks for payments made predominantly to beneficiaries living in Australia in Australian dollars, on behalf of clients of those correspondent banks. The majority of the payments were low value, recurring and made by foreign government pension funds and corporates.
AUSTRAC has issued a number of detailed statutory notices over the last year requiring information relating to the Group’s processes, procedures and oversight. These notices relate to a range of matters including these IFTI reporting failures and associated potential failings related to record keeping and obligations to obtain and pass on certain data in funds transfer instructions, as well as correspondent banking due diligence, risk assessments and transaction monitoring. Westpac has not yet received an indication from AUSTRAC about the nature of any enforcement action it may take. The Group is continuing to work with AUSTRAC in relation to these matters.
Any enforcement action against Westpac may include civil penalty proceedings and result in the payment of a significant financial penalty, which Westpac is currently unable to reliably estimate. Previous enforcement action by AUSTRAC against other institutions has resulted in a range of outcomes, depending on the nature and severity of the relevant conduct and its consequences.
As AUSTRAC is still investigating these issues, any penalty cannot be reliably estimated and accordingly no provision has been raised for this matter.
Litigation
There are ongoing court proceedings, claims and possible claims for and against the Group. Contingent liabilities exist in respect of actual and potential claims and proceedings, including those listed below. An assessment of the Group’s likely loss has been made on a case-by-case basis for the purpose of the financial statements but cannot always be reliably estimated, including in relation to those listed below.
· On 1 March 2017, ASIC commenced litigation in relation to certain Westpac home loans (including certain interest only loans) alleging contraventions of the National Consumer Credit Protection Act 2009 (Cth). The proceedings were heard in May 2019. On 13 August 2019, the Court handed down its judgment in the proceedings, and dismissed ASIC’s case. On 10 September 2019, ASIC filed an appeal in relation to the decision. No provision has been recognised in relation to this matter.
274 | 2019 Westpac Group Annual Report | |
| | |
Notes to the financial statements
Note 27. Provisions, contingent liabilities, contingent assets and credit commitments (continued)
· On 22 December 2016, ASIC commenced Federal Court proceedings against BT Funds Management Limited (BTFM) and Westpac Securities Administration Limited (WSAL) in relation to a number of superannuation account consolidation campaigns conducted between 2013 and 2016. ASIC has alleged that in the course of some of these campaigns, customers were provided with personal advice in contravention of a number of Corporations Act 2001 (Cth) provisions, and selected 15 specific customers as the focus of their claim. In December 2018 the primary Court handed down a judgment in which it held that no personal advice had been provided and that BTFM and WSAL did not contravene the relevant personal advice provisions although it did make a finding that BTFM and WSAL had each contravened section 912A(1)(a) of the Corporations Act. In February 2019, ASIC filed an appeal against this decision. On 28 October 2019, the Full Federal Court handed down its decision in ASIC’s favour and made findings that BTFM and WSAL each provided personal advice on the relevant calls. Once formal declarations of contravention are made, the matter will be remitted for penalty. No provision has been recognised in relation to this matter.
· In August 2016, a class action was filed in the United States District Court for the Southern District of New York against Westpac and a large number of Australian and international banks alleging misconduct in relation to the bank bill swap reference rate. On 26 November 2018, the US Court delivered its judgment on the Motion to Dismiss the US BBSW class action proceedings, with the case against Westpac and certain other foreign banks being dismissed on the basis that the Court does not have jurisdiction to hear the case. In April 2019, the Plaintiffs filed an amended claim, which brings Westpac back into the proceedings. Westpac is continuing to defend the proceedings with a Motion to Dismiss filed in May 2019. No provision has been recognised in relation to this matter.
· On 12 October 2017, a class action against Westpac and Westpac Life Insurance Services Limited (WLIS) was filed in the Federal Court of Australia. The class action was filed on behalf of customers who, since February 2011, obtained insurance issued by WLIS on the recommendation of certain financial advisers employed within the Westpac Group. The plaintiffs have alleged that aspects of the financial advice provided by those advisers breached fiduciary and statutory duties owed to the advisers’ clients, including the duty to act in the best interests of the client, and that WLIS was knowingly involved in those alleged breaches. Westpac and WLIS are defending the proceedings. These proceedings are currently stayed by order of the Court, pending the outcome of an appeal concerning a procedural issue unrelated to the substantive claims made in the class action. No provision has been recognised in relation to this matter.
· On 21 February 2019, a class action against Westpac was filed in the Federal Court of Australia. As directed by the Court, the Plaintiffs filed a Statement of Claim on 22 May 2019 and an amended statement of claim on 18 October 2019. The claims allege that Westpac did not comply with its responsible lending obligations and entered into certain home loans that it should otherwise have assessed as unsuitable. The allegations include that during the period from 1 January 2011 to 17 February 2018, Westpac failed to: conduct reasonable inquiries about the customers’ financial situation, requirements and objectives; verify customer’s financial situation; conduct assessments of suitability; and act efficiently and fairly. Westpac is defending the proceedings. No provision has been recognised in relation to this matter.
· On 5 September 2019, a class action against BT Funds Management Limited (BTFM) and WLIS was commenced in relation to aspects of BTFM’s BT Super for Life cash investment option. The claim follows other industry class actions as part of Slater and Gordon’s ‘Get your super back’ campaign. It is alleged in the proceedings that BTFM failed to adhere to a number of obligations under the general law, the relevant trust deed and the Superannuation Industry (Supervision) Act 1993 (Cth), and that WLIS was knowingly concerned with BTFM’s alleged contraventions. The damages sought by the claim are unspecified. BTFM and WLIS are defending the proceedings. No provision has been recognised in relation to this matter.
Internal reviews and remediation
Westpac is currently undertaking a number of reviews to identify and resolve prior issues that have the potential to impact our customers and reputation. These internal reviews have identified, and may continue to identify, issues in respect of which we are, or will be, taking steps to put things right (including in relation to areas of industry focus such as compliance with responsible lending obligations and the way some product terms and conditions are operationalised) so that our customers are not at a disadvantage from certain past practices. By undertaking these reviews we can also improve our processes and controls. An assessment of the Group’s likely loss has been made on a case-by-case basis for the purpose of the financial statements but cannot always be reliably estimated. Contingent liabilities may exist in respect of actual or potential claims, compensation payments and/or refunds identified as part of these reviews.
Australian Financial Complaints Authority
Contingent liabilities may also exist in relation to customer complaints brought before the Australian Financial Complaints Authority (AFCA). AFCA has the power to make determinations about complaints and can award compensation up to certain thresholds. AFCA has a broader jurisdiction than previous dispute resolution bodies which it has replaced and, up until 30 June 2020, can also consider customer complaints dating back to 1 January 2008.
Financial Claims Scheme
Under the Financial Claims Scheme (FCS), the Australian Government provides depositors a free guarantee of deposits in eligible ADIs up to and including $250,000. The FCS applies to an eligible ADI if APRA has applied for the winding up of the ADI and the responsible Australian Government minister has declared that the FCS applies to the ADI.
| 2019 Westpac Group Annual Report | 275 |
| | |
Notes to the financial statements
Note 27. Provisions, contingent liabilities, contingent assets and credit commitments (continued)
The Financial Claims Scheme (ADIs) Levy Act 2008 provides for the imposition of a levy to fund the excess of certain APRA FCS costs connected to an ADI, including payments by APRA to deposit holders in a failed ADI. The levy would be imposed on liabilities of eligible ADIs to their depositors and cannot be more than 0.5% of the amount of those liabilities. A contingent liability may exist in respect of any levy imposed under the FCS.
Contingent tax risk
Tax and regulatory authorities in Australia and in other jurisdictions are reviewing the taxation treatment of certain transactions (both historical and present-day transactions) undertaken by the Group in the course of normal business activities and the claiming of tax incentives and indirect taxes such as GST. The Group also responds to various notices and requests for information it receives from tax and regulatory authorities.
These reviews, notices and requests may result in additional tax liabilities (including interest and penalties).
The Group has assessed these and other taxation claims arising in Australia and elsewhere, including seeking independent advice.
Settlement risk
The Group is subject to a credit risk exposure in the event that another counterparty fails to settle for its payments clearing activities (including foreign exchange). The Group seeks to minimise credit risk arising from settlement risk in the payments system by aligning our processing method with the legal certainty of settlement in the relevant clearing mechanism.
Parent Entity guarantees and undertakings
The Parent Entity makes the following guarantees and undertakings to subsidiaries:
· letters of comfort for certain subsidiaries which recognise that Westpac has a responsibility that those subsidiaries continue to meet their obligations; and
· guarantees to certain wholly owned subsidiaries which are Australian financial services or credit licensees to comply with legislative requirements. Each guarantee is capped at $40 million per year and can only be utilised if the entity concerned becomes legally obliged to pay for a claim under the relevant licence. The Parent Entity has a right to recover any funds payable under the guarantees from the relevant subsidiary.
Undrawn credit commitments
The Group enters into various arrangements with customers which are only recognised in the balance sheet when called upon. These arrangements include commitments to extend credit, bill endorsements, financial guarantees, standby letters of credit and underwriting facilities.
They expose the Group to liquidity risk when called upon and also to credit risk if the customer fails to repay the amounts owed at the due date. The maximum exposure to credit loss is the contractual or notional amount of the instruments. Some of the arrangements can be cancelled by the Group at any time and a significant portion is expected to expire without being drawn. The actual required liquidity and credit risk exposure is therefore less than the amounts disclosed.
The Group uses the same credit policies when entering into these arrangements as it does for on-balance sheet instruments. Refer to Note 21 for further details of liquidity risk and credit risk management.
Undrawn credit commitments excluding derivatives are as follows:
| | Consolidated | | Parent Entity | |
$m | | 2019 | | 2018 | | 2019 | | 2018 | |
Undrawn credit commitments | | | | | | | | | |
Letters of credit and guarantees1 | | 15,150 | | 15,585 | | 14,583 | | 14,957 | |
Commitments to extend credit2 | | 176,002 | | 174,658 | | 153,716 | | 152,943 | |
Other | | 188 | | 154 | | 188 | | 99 | |
Total undrawn credit commitments | | 191,340 | | 190,397 | | 168,487 | | 167,999 | |
Consolidated 2019 | | Up to | | Over 1 | | Over 3 | | Over | | | |
$m | | 1 Year | | to 3 Years | | to 5 Years | | 5 Years | | Total | |
Letters of credit and guarantees | | 7,334 | | 4,639 | | 719 | | 2,458 | | 15,150 | |
Commitments to extend credit | | 41,488 | | 58,402 | | 12,917 | | 63,195 | | 176,002 | |
Other | | 125 | | - | | - | | 63 | | 188 | |
Total undrawn credit commitments | | 48,947 | | 63,041 | | 13,636 | | 65,716 | | 191,340 | |
Contingent assets
The credit commitments shown in the table above also constitute contingent assets. These commitments would be classified as loans in the balance sheet on the contingent event occurring.
1. Standby letters of credit are undertakings to pay, against presentation documents, an obligation in the event of a default by a customer. Guarantees are unconditional undertakings given to support the obligations of a customer to third parties. The Group may hold cash as collateral for certain guarantees issued.
2. Commitments to extend credit include all obligations on the part of the Group to provide credit facilities. As facilities may expire without being drawn upon, the notional amounts do not necessarily reflect future cash requirements. In addition to the commitments disclosed above, at 30 September 2019 the Group had offered $5.0 billion (2018: $5.7 billion) of facilities to customers, which had not yet been accepted.
276 | 2019 Westpac Group Annual Report | |
| | |
Notes to the financial statements
CAPITAL AND DIVIDENDS
Note 28. Shareholders’ equity
Accounting policy
Share capital Ordinary shares are recognised at the amount paid up per ordinary share net of directly attributable issue costs. Treasury shares are shares in the Parent Entity, purchased by the Parent Entity or other entities within the Group. These shares are adjusted against share capital as the net of the consideration paid to purchase the shares and, where applicable, any consideration received from the subsequent sale or reissue of these shares. Non-controlling interests Non-controlling interests represent the share in the net assets of subsidiaries attributable to equity interests that are not owned directly or indirectly by the Parent Entity. Reserves Foreign currency translation reserve Exchange differences arising on translation of the Group’s foreign operations, and any offsetting gains or losses on hedging the net investment are reflected in the foreign currency translation reserve. A cumulative credit balance in this reserve would not normally be regarded as being available for payment of dividends until such gains are realised and recognised in the income statement on sale or disposal of the foreign operation. Debt securities at FVOCI reserve (30 September 2019 – AASB 9) This reserve was established on adoption of AASB 9 and comprises the changes in fair value of debt securities measured at fair value through other comprehensive income (except for interest income, impairment charges and foreign exchange gains and losses which are recognised in the income statement), net of any related hedge accounting adjustments and tax. These changes are transferred to non-interest income in the income statement when the asset is disposed. Equity securities at FVOCI reserve (30 September 2019 – AASB 9) This reserve was established on adoption of AASB 9 and comprises the changes in fair value of equity securities measured at fair value through other comprehensive income, net of tax. These changes are not transferred to the income statement when the asset is disposed. Available-for-sale securities reserve (30 September 2018 – AASB 139) This comprises the changes in the fair value of available-for-sale financial securities (including both debt and equity securities), net of any related hedge accounting adjustments and tax. These changes were transferred to non-interest income in the income statement when the asset is either disposed of or impaired. This reserve was closed on the adoption of AASB 9 and the closing balance was allocated to the debt securities at FVOCI reserve and equity securities at FVOCI reserve noted above for the relevant securities. Cash flow hedge reserve This comprises the fair value gains and losses associated with the effective portion of designated cash flow hedging instruments, net of tax. Share-based payment reserve This comprises the fair value of equity-settled share-based payments recognised as an expense. Other reserves Other reserves for the Parent Entity relates to certain historic internal group restructurings performed at fair value. The reserve is eliminated on consolidation. Other reserves for the Group consist of transactions relating to changes in the Parent Entity’s ownership of a subsidiary that do not result in a loss of control. The amount recorded in other reserves reflects the difference between the amount by which non-controlling interests are adjusted and the fair value of any consideration paid or received. |
| 2019 Westpac Group Annual Report | 277 |
| | |
Notes to the financial statements
Note 28. Shareholders’ equity (continued)
| | Consolidated | | Parent Entity | |
$m | | 2019 | | 2018 | | 2019 | | 2018 | |
Share capital | | | | | | | | | |
Ordinary share capital, fully paid | | 37,508 | | 36,054 | | 37,508 | | 36,054 | |
Treasury shares held for RSP1 | | (572) | | (505 | ) | (572) | | (505 | ) |
Other treasury shares held2 | | 19 | | 12 | | (3) | | (3 | ) |
Total treasury shares held | | (553) | | (493 | ) | (575) | | (508 | ) |
Total share capital | | 36,955 | | 35,561 | | 36,933 | | 35,546 | |
Non-controlling interests | | 53 | | 52 | | – | | – | |
Ordinary shares
Westpac does not have authorised capital and the ordinary shares have no par value. Ordinary shares entitle the holder to participate in dividends and, in the event of Westpac winding up, to a share of the proceeds in proportion to the number of and amounts paid on the shares held.
Each ordinary share entitles the holder to one vote, either in person or by proxy, at a shareholder meeting.
Reconciliation of movement in number of ordinary shares.
Consolidated and Parent Entity | | | | | |
(number) | | 2019 | | 2018 | |
Opening balance | | 3,434,796,711 | | 3,394,364,279 | |
Dividend reinvestment plan3 | | 55,132,062 | | 21,242,667 | |
Conversion of Westpac Convertible Preference Shares4 | | – | | 19,189,765 | |
Closing balance | | 3,489,928,773 | | 3,434,796,711 | |
Ordinary shares purchased and sold on market
| | 2019 | | 2019 | |
Consolidated and Parent Entity | | Number | | Average Price ($) | |
For share-based payment arrangements: | | | | | |
Employee share plan (ESP) | | 1,061,442 | | 25.27 | |
RSP5 | | 2,707,931 | | 25.55 | |
Westpac Performance Plan (WPP) - share rights exercised | | 184,043 | | 26.73 | |
Westpac Long Term Variable Reward Plan (LTVR) - options exercised6 | | 37,831 | | 27.68 | |
As treasury shares: | | | | | |
Treasury shares sold | | (308,263) | | 26.19 | |
Net number of ordinary shares purchased/(sold) on market | | 3,682,984 | | | |
For details of the share-based payment arrangements refer to Note 33.
1. 2019: 4,784,213 unvested shares held (2018: 3,943,660).
2. 2019: 1,721,532 shares held (2018: 2,029,795).
3. The price per share for the issuance of shares in relation to the dividend reinvestment plan for the 2019 interim dividend was $27.36 and 2018 final dividend was $25.82 (2018: 2018 interim dividend was $28.11 and 2017 final dividend was $31.62).
4. The conversion price per share for the issuance of shares in relation to the conversion of Westpac Convertible Preference Shares was $29.49.
5. Ordinary shares allocated to employees under the RSP are classified as treasury shares until the shares vest.
6. The average exercise price per share received was $23.40 on the exercise of the LTVR options.
278 | 2019 Westpac Group Annual Report | |
| | |
Notes to the financial statements
Note 28. Shareholders’ equity (continued)
Reconciliation of movement in reserves1
| | Consolidated | | Parent Entity | |
$m | | 2019 | | 2018 | | 2019 | | 2018 | |
Available-for-sale securities reserve | | | | | | | | | |
Opening balance | | 37 | | 64 | | 24 | | 70 | |
Impact on adoption of AASB 9 | | (37) | | – | | (24) | | – | |
Net gains/(losses) from changes in fair value | | – | | (104 | ) | – | | (34 | ) |
Income tax effect | | – | | 34 | | – | | 13 | |
Transferred to income statements | | – | | 66 | | – | | (33 | ) |
Income tax effect | | – | | (25 | ) | – | | 6 | |
Exchange differences | | – | | 2 | | – | | 2 | |
Closing balance | | – | | 37 | | – | | 24 | |
Debt securities at FVOCI reserve | | | | | | | | | |
Opening balance | | – | | – | | – | | – | |
Impact on adoption of AASB 9 | | 33 | | – | | 25 | | – | |
Net gains/(losses) from changes in fair value | | (47) | | – | | (40) | | – | |
Income tax effect | | 12 | | – | | 10 | | – | |
Transferred to income statements | | (29) | | – | | (29) | | – | |
Income tax effect | | 8 | | – | | 8 | | – | |
Exchange differences | | 1 | | – | | 1 | | – | |
Closing balance | | (22) | | – | | (25) | | – | |
Equity securities at FVOCI reserve | | | | | | | | | |
Opening balance | | – | | – | | – | | – | |
Impact on adoption of AASB 9 | | 6 | | – | | 1 | | – | |
Net gains/(losses) from changes in fair value | | 11 | | – | | (2) | | – | |
Closing balance | | 17 | | – | | (1) | | – | |
Share-based payment reserve | | | | | | | | | |
Opening balance | | 1,534 | | 1,431 | | 1,425 | | 1,322 | |
Share-based payment expense | | 108 | | 103 | | 108 | | 103 | |
Closing balance | | 1,642 | | 1,534 | | 1,533 | | 1,425 | |
Cash flow hedge reserve | | | | | | | | | |
Opening balance | | (125) | | (154 | ) | (69) | | (94 | ) |
Net gains/(losses) from changes in fair value | | (203) | | (161 | ) | (121) | | (125 | ) |
Income tax effect | | 60 | | 47 | | 36 | | 38 | |
Transferred to income statements | | 197 | | 203 | | 128 | | 160 | |
Income tax effect | | (58) | | (60 | ) | (39) | | (48 | ) |
Closing balance | | (129) | | (125 | ) | (65) | | (69 | ) |
Foreign currency translation reserve | | | | | | | | | |
Opening balance | | (351) | | (529 | ) | (307) | | (481 | ) |
Exchange differences on translation of foreign operations | | 311 | | 164 | | 214 | | 175 | |
Gains/(losses) on net investment hedges | | (129) | | 17 | | (52) | | (1 | ) |
Transferred to income statements | | (10) | | (3 | ) | – | | – | |
Closing balance | | (179) | | (351 | ) | (145) | | (307 | ) |
Other reserves | | | | | | | | | |
Opening balance | | (18) | | (18 | ) | 41 | | 41 | |
Transactions with owners | | – | | – | | – | | – | |
Closing balance | | (18) | | (18 | ) | 41 | | 41 | |
Total reserves | | 1,311 | | 1,077 | | 1,338 | | 1,114 | |
1. The Group has adopted AASB 9 and AASB 15 from 1 October 2018. Comparatives have not been restated. In addition, the Group has made a number of presentational changes to the Balance Sheet. Comparatives have been restated. Refer to Note 1 for further detail.
| 2019 Westpac Group Annual Report | 279 |
| | |
Notes to the financial statements
Note 29. Capital adequacy
APRA measures an ADI’s regulatory capital using three measures:
Level of capital | | Definition |
Common Equity Tier 1 Capital (CET1) | | Comprises the highest quality components of capital that consists of paid-up share capital, retained profits and certain reserves, less certain intangible assets, capitalised expenses and software, and investments and retained profits in insurance and funds management subsidiaries that are not consolidated for capital adequacy purposes. |
| | |
Tier 1 Capital | | The sum of CET1 and AT1 Capital. AT1 Capital comprises high quality components of capital that consist of certain securities not included in CET1, but which include loss absorbing characteristics. |
| | |
Total Regulatory Capital | | The sum of Tier 1 Capital and Tier 2 Capital. Tier 2 Capital includes subordinated instruments and other components of capital that, to varying degrees, do not meet the criteria for Tier 1 Capital, but nonetheless contribute to the overall strength of an ADI and its capacity to absorb losses. |
Under APRA’s Prudential Standards, Australian ADIs, including Westpac, are required to maintain a minimum CET1 ratio of at least 4.5%, Tier 1 Capital ratio of at least 6.0% and Total Regulatory Capital ratio of at least 8.0%. APRA may also require ADIs, including, Westpac, to meet Prudential Capital Requirements (PCRs) above the minimum capital ratios. APRA does not allow the PCRs for individual ADIs to be disclosed.
APRA also requires ADIs to hold additional CET1 buffers comprising of:
· | a capital conservation buffer (CCB) of 3.5% for ADIs designated by APRA as domestic systemically important banks (D-SIBs) unless otherwise determined by APRA, which includes a 1.0% surcharge for D-SIBs. APRA has determined that Westpac is a D-SIB; and |
| |
· | a countercyclical capital buffer. The countercyclical buffer is set on a jurisdictional basis and APRA is responsible for setting the requirement in Australia. The countercyclical buffer requirement is currently set to zero for Australia and New Zealand. |
Collectively, the above buffers are referred to as the “Capital Buffer” (CB). Should the CET1 capital ratio fall within the capital buffer range restrictions on the distributions of earnings will apply. This includes restrictions on the amount of earnings that can be distributed through dividends, AT1 Capital distributions and discretionary staff bonuses.
Capital management strategy
Westpac’s approach to capital management seeks to ensure that it is adequately capitalised as an ADI. Westpac evaluates its approach to capital management through the Internal Capital Adequacy Assessment Process (ICAAP), the key features of which include:
· | the development of a capital management strategy, including consideration of regulatory minimums, capital buffers and contingency plans; |
| |
· | consideration of both economic and regulatory capital requirements; |
| |
· | a stress testing framework that challenges the capital measures, coverage and requirements including the impact of adverse economic scenarios; and |
| |
· | consideration of the perspective of external stakeholders’, including rating agencies and equity and debt investors. |
In light of APRA’s ‘unquestionably strong’ capital benchmarks, Westpac will seek to operate with a CET1 capital ratio above 10.5% in March and September as measured under the existing capital framework. Additional buffers may also be held to reflect challenging or uncertain environments. This also takes into consideration:
· current regulatory capital minimums and the CCB, which together are the total CET1 requirement;
· stress testing to calibrate an appropriate buffer against a downturn; and
· quarterly volatility of capital ratios due to the half yearly cycle of ordinary dividend payments.
Westpac will revise its target capital level once APRA finalises its review of the capital adequacy framework.
Total regulatory capital developments
On 9 July 2019 APRA announced that it will require the major banks (including Westpac) to lift Total Regulatory Capital by three percentage points of RWA by 1 January 2024 in order to boost loss absorbing capacity and support orderly resolution. APRA also confirmed that its overall long term target of an additional four to five percentage points of loss absorbing capacity remains unchanged, and that it will consider the most feasible alternative method of sourcing the remaining one to two percentage points, taking into account the particular characteristics of the Australian financial system.
Further details of APRA’s regulatory changes are set out in the Significant Developments section of the 2019 Annual Report.
280 | 2019 Westpac Group Annual Report | |
| | |
Notes to the financial statements
Note 30. Dividends
| | Consolidated | | Parent Entity | |
$m | | 2019 | | 2018 | | 2017 | | 2019 | | 2018 | |
Dividends not recognised at year end | | | | | | | | | | | |
Since year end the Directors have proposed the following dividends: | | | | | | | | | | | |
Final dividend 80 cents per share (2018: 94 cents, 2017: 94 cents) all fully franked at 30% | | 2,791 | | 3,227 | | 3,186 | | 2,792 | | 3,229 | |
Total dividends not recognised at year end | | 2,791 | | 3,227 | | 3,186 | | 2,792 | | 3,229 | |
Shareholders can choose to receive their dividends as cash or reinvest for an equivalent number of shares under the Dividend Reinvestment Plan (DRP). The Board has decided to issue new shares to satisfy the DRP for the 2019 final dividend. The DRP will not include a discount.
Details of dividends recognised during the year are provided in the statement of changes in equity.
Australian franking credits
Australian franking credits available to the Parent Entity for subsequent years are $1,558 million (2018: $1,357 million; 2017: $1,063 million). This is calculated as the year end franking credit balance, adjusted for the Australian current tax liability and the proposed 2019 final dividend.
New Zealand imputation credits
New Zealand imputation credits of NZ$0.07 (2018: NZ$0.07, 2017: NZ$0.07) per share will be attached to the proposed 2019 final dividend. New Zealand imputation credits available to the Parent Entity for subsequent years are NZ$860 million (2018: NZ$530 million, 2017: NZ$375 million). This is calculated on the same basis as the Australian franking credits but using the New Zealand current tax liability.
| 2019 Westpac Group Annual Report | 281 |
| | |
Notes to the financial statements
GROUP STRUCTURE
Note 31. Investments in subsidiaries and associates
Accounting policy
Subsidiaries Westpac’s subsidiaries are entities which it controls and consolidates as it is exposed to, or has rights to, variable returns from the entity, and can affect those returns through its power over the entity. When the Group ceases to control a subsidiary, any retained interest in the entity is remeasured to fair value, with any resulting gain or loss recognised in the income statement. Changes in the Group’s ownership interest in a subsidiary which do not result in a loss of control are accounted for as transactions with equity holders in their capacity as equity holders. In the Parent Entity’s financial statements, investments in subsidiaries are initially recorded at cost and are subsequently held at the lower of cost and recoverable amount. All transactions between Group entities are eliminated on consolidation. Associates Associates are entities in which the Group has significant influence, but not control, over the operating and financial policies. The Group accounts for associates using the equity method. The investments are initially recognised at cost (except where recognised at fair value due to a loss of control of a subsidiary), and increased (or decreased) each year by the Group’s share of the associate’s profit (or loss). Dividends received from the associate reduce the investment in associate. |
Overseas companies predominantly carry on business in the country of incorporation. For unincorporated entities, ‘Country of Incorporation’ refers to the country where business is carried on. The financial years of all controlled entities are the same as that of Westpac unless otherwise stated. From time to time, the Group consolidates a number of unit trusts where the Group has variable returns from its involvement with the trusts, and has the ability to affect those returns through its power over the trusts. These unit trusts are excluded from the table.
The following table includes the principal controlled entities of the Group as at 30 September 2019.
Name | | Country of
Incorporation | | Name | | Country of
Incorporation |
Advance Asset Management Limited | | Australia | | Westpac Financial Services Limited | | Australia |
Asgard Capital Management Limited | | Australia | | Westpac General Insurance Limited | | Australia |
Asgard Wealth Solutions Limited | | Australia | | Westpac General Insurance Services Limited | | Australia |
BT Financial Group Pty Limited | | Australia | | Westpac Lenders Mortgage Insurance Limited | | Australia |
BT Funds Management Limited | | Australia | | Westpac Life Insurance Services Limited | | Australia |
BT Portfolio Services Limited | | Australia | | Westpac Securitisation Holdings Pty Limited | | Australia |
Capital Finance Australia Limited | | Australia | | BT Funds Management (NZ) Limited | | New Zealand |
Crusade ABS Series 2017-1 Trust | | Australia | | Westpac Financial Services Group-NZ-Limited | | New Zealand |
Crusade ABS Series 2017-1P Trust | | Australia | | Westpac Life-NZ-Limited | | New Zealand |
Crusade Trust No.2P of 2008 | | Australia | | Westpac New Zealand Group Limited | | New Zealand |
Series 2008-1M WST Trust | | Australia | | Westpac New Zealand Limited | | New Zealand |
Series 2014-2 WST Trust | | Australia | | Westpac NZ Covered Bond Limited1 | | New Zealand |
Series 2015-1 WST Trust | | Australia | | Westpac NZ Operations Limited | | New Zealand |
Series 2019-1 WST Trust | | Australia | | Westpac NZ Securitisation Limited1 | | New Zealand |
St.George Finance Limited | | Australia | | Westpac Securities NZ Limited | | New Zealand |
Westpac Covered Bond Trust | | Australia | | Westpac Term Pie Fund2 | | New Zealand |
Westpac Equity Holdings Pty Limited | | Australia | | Westpac Bank-PNG-Limited | | Papua New Guinea |
Westpac Financial Services Group Limited | | Australia | | | | |
1. The Group indirectly owns 19% of Westpac NZ Covered Bond Limited (WNZCBL) and Westpac NZ Securitisation Limited (WNZSL), however, due to contractual and structural arrangements both WNZCBL and WNZSL are considered to be controlled entities within the Group.
2. The Group has funding agreements in place with this entity and is deemed to have exposure to the associated risks and rewards. The entity is consolidated as the Group is exposed to, or has rights to, variable returns from its involvement with the entity and has the ability to affect those returns through its power over the entity.
282 | 2019 Westpac Group Annual Report | |
| | |
Notes to the financial statements
Note 31. Investments in subsidiaries and associates (continued)
The following controlled entities have been granted relief from compliance with the balance date synchronisation provisions in the Corporations Act 2001:
· Westpac Cash PIE Fund;
· Westpac Notice Saver PIE Fund; and
· Westpac Term PIE Fund.
The following material controlled entities are not wholly owned:
Percentage Owned | | 2019 | | 2018 |
St.George Motor Finance Limited | | 75.0% | | 75.0% |
Westpac Bank-PNG-Limited | | 89.9% | | 89.9% |
Westpac NZ Covered Bond Limited | | 19.0% | | 19.0% |
Westpac NZ Securitisation Limited | | 19.0% | | 19.0% |
Non-controlling interests
Details of the balance of non-controlling interests are set out in Note 28. There are no non-controlling interests that are material to the Group.
Significant restrictions
There were no significant restrictions on the ability to transfer cash or other assets, pay dividends or other capital distributions, provide or repay loans and advances between the entities within the Group subject to local regulatory requirements. There were also no significant restrictions on Westpac’s ability to access or use the assets and settle the liabilities of the Group resulting from protective rights of non-controlling interests.
Associates
There are no associates that are material to the Group.
Changes in ownership of subsidiaries
Businesses disposed during the year ending 30 September 2019
Westpac sold its interest in Ascalon Capital Managers (Asia) Limited and Ascalon Capital Managers Limited on 8 February 2019 for a combined profit of $3 million recognised in non-interest income.
Businesses disposed during the year ending 30 September 2018
Westpac sold its interest in a number of Hastings offshore subsidiaries to Northill Capital. Completion of the sale of the US and UK entities occurred on 28 February 2018 and completion of the Singapore entity occurred on 23 March 2018, with a total loss of $9 million recognised in non-interest income.
Businesses disposed during the year ending 30 September 2017
No businesses were sold in the year ended 30 September 2017.
Details of the assets and liabilities which the Group ceased to control are provided in Note 37.
| 2019 Westpac Group Annual Report | 283 |
| | |
Notes to the financial statements
Note 32. Structured entities
Accounting policy
Structured entities are generally created to achieve a specific, defined objective and their operations are restricted such as only purchasing specific assets. Structured entities are commonly financed by debt or equity securities that are collateralised by and/or indexed to their underlying assets. The debt and equity securities issued by structured entities may include tranches with varying levels of subordination. Structured entities are classified as subsidiaries and consolidated if they meet the definition in Note 31. If the Group does not control a structured entity then it will not be consolidated. |
The Group engages in various transactions with both consolidated and unconsolidated structured entities that are mainly involved in securitisations, asset backed and other financing structures and managed funds.
Consolidated structured entities
Securitisation and covered bonds
The Group uses structured entities to securitise its financial assets, including two covered bond programs, to assign pools of residential mortgages to bankruptcy remote structured entities.
Refer to Note 24 for further details.
Group managed funds
The Group acts as the responsible entity and/or fund manager for various investment management funds. As fund manager, if the Group is deemed to be acting as a principal rather than an agent then it consolidates the fund. The principal versus agent decision requires judgement of whether the Group has sufficient exposure to variable returns.
Non-contractual financial support
The Group does not provide non-contractual financial support to these consolidated structured entities.
Unconsolidated structured entities
The Group has interests in various unconsolidated structured entities including debt or equity instruments, guarantees, liquidity and other credit support arrangements, lending, loan commitments, certain derivatives and investment management agreements.
Interests exclude non-complex derivatives (e.g. interest rate or currency swaps), instruments that create, rather than absorb, variability in the entity (e.g. credit protection under a credit default swap), and lending to a structured entity with recourse to a wider operating entity, not just the structured entity.
The Group’s main interests in unconsolidated structured entities, which arise in the normal course of business, are:
Trading securities | | The Group actively trades interests in structured entities and normally has no other involvement with the structured entity. The Group earns interest income on these securities and also recognises fair value changes through trading income in non-interest income. |
Investment securities/
Available-for-sale securities | | The Group holds mortgage-backed securities for liquidity purposes and the Group normally has no other involvement with the structured entity. These assets are highly-rated, investment grade and eligible for repurchase agreements with the RBA or another central bank. The Group earns interest income and net gains or losses on selling these assets are recognised in the income statements. |
Loans and other credit commitments | | The Group lends to unconsolidated structured entities, subject to the Group’s collateral and credit approval processes, in order to earn interest and fee income. The structured entities are mainly property trusts, securitisation entities and those associated with project and property financing transactions. |
Investment management agreements | | The Group manages funds that provide customers with investment opportunities. The Group also manages superannuation funds for its employees. The Group earns management and performance fee income which is recognised in non-interest income. The Group may also retain units in these investment management funds, primarily through life insurance subsidiaries. The Group earns fund distribution income and recognises fair value movements through non-interest income. |
284 | 2019 Westpac Group Annual Report | |
| | |
Notes to the financial statements
Note 32. Structured entities1 (continued)
The following tables show the Group’s interests in unconsolidated structured entities and its maximum exposure to loss in relation to those interests. The maximum exposure does not take into account any collateral or hedges that will reduce the risk of loss.
· For on-balance sheet instruments, including debt and equity instruments in and loans to unconsolidated structured entities, the maximum exposure to loss is the carrying value; and
· For off-balance sheet instruments, including liquidity facilities, loan and other credit commitments and guarantees, the maximum exposure to loss is the notional amounts.
Consolidated 2019
$m | | Investment in
third party
mortgage and
other
asset-backed
securities2 | | Financing to
securitisation
vehicles | | Group
managed
funds | | Interest
in other
structured
entities | | Total | |
Assets | | | | | | | | | | | |
Trading securities and financial assets measured at FVIS | | 1,827 | | – | | – | | 282 | | 2,109 | |
Investment securities | | 6,940 | | – | | – | | – | | 6,940 | |
Loans | | – | | 20,979 | | 9 | | 22,817 | | 43,805 | |
Life insurance assets | | – | | – | | 4,885 | | 1,879 | | 6,764 | |
Other assets | | – | | – | | 54 | | – | | 54 | |
Total on-balance sheet exposures | | 8,767 | | 20,979 | | 4,948 | | 24,978 | | 59,672 | |
Total notional amounts of off-balance sheet exposures | | – | | 5,157 | | 102 | | 10,086 | | 15,345 | |
Maximum exposure to loss | | 8,767 | | 26,136 | | 5,050 | | 35,064 | | 75,017 | |
Size of structured entities3 | | 66,015 | | 26,136 | | 71,538 | | 98,983 | | 262,672 | |
Consolidated 2018
$m | | Investment in
third party
mortgage and
other
asset-backed
securities2 | | Financing to
securitisation
vehicles | | Group
managed
funds | | Interest
in other
structured
entities | | Total | |
Assets | | | | | | | | | | | |
Trading securities and financial assets measured at FVIS | | 2,108 | | – | | – | | 139 | | 2,247 | |
Available-for-sale securities | | 7,352 | | – | | – | | – | | 7,352 | |
Loans | | – | | 21,977 | | 6 | | 22,894 | | 44,877 | |
Life insurance assets | | – | | – | | 4,702 | | 1,843 | | 6,545 | |
Other assets | | – | | – | | 47 | | – | | 47 | |
Total on-balance sheet exposures | | 9,460 | | 21,977 | | 4,755 | | 24,876 | | 61,068 | |
Total notional amounts of off-balance sheet exposures | | – | | 5,145 | | 60 | | 7,988 | | 13,193 | |
Maximum exposure to loss | | 9,460 | | 27,122 | | 4,815 | | 32,864 | | 74,261 | |
Size of structured entities3 | | 58,976 | | 27,122 | | 66,524 | | 100,427 | | 253,049 | |
Non-contractual financial support
The Group does not provide non-contractual financial support to these unconsolidated structured entities.
1. The Group has adopted AASB 9 and AASB 15 from 1 October 2018. Comparatives have not been restated. In addition, the Group has made a number of presentational changes to the Balance Sheet. Comparatives have been restated. Refer to Note 1 for further detail.
2. The Group’s interests in third party mortgage and other asset-backed securities are senior tranches of notes and are investment grade rated.
3. Represented either by the total assets or market capitalisation of the entity, or if not available, the Group’s total committed exposure (for lending arrangements and external debt and equity holdings), funds under management (for Group managed funds) or the total value of notes on issue (for investments in third-party asset-backed securities).
| 2019 Westpac Group Annual Report | 285 |
| | |
Notes to the financial statements
OTHER
Note 33. Share-based payments
Accounting policy
The Group enters into various share-based payment arrangements with its employees as a component of overall compensation for services provided. Share-based payment arrangements comprise options to purchase shares at a pre-determined price (share options), rights to receive shares for free (share rights) and restricted shares (issued at no cost). Share-based payment arrangements typically require a specified period of continuing employment (the service period or vesting period) and may include performance targets (vesting conditions). Specific details of each arrangement are provided below. Share-based payments must be classified as either cash-settled or equity-settled arrangements. The Group’s significant arrangements are equity-settled, as the Group is not obliged to settle in cash. Options and share rights Options and share rights are equity-settled arrangements. The fair value is measured at grant date and is recognised as an expense over the service period, with a corresponding increase in the share-based payment reserve in equity. The fair value of share options and share rights is estimated at grant date using a binomial/Monte Carlo simulation pricing model which incorporates the vesting and market-related performance targets of the grants. The fair value of share options and rights excludes non-market vesting conditions such as employees’ continuing employment by the Group. The non-market vesting conditions are instead incorporated in estimating the number of share options and rights that are expected to vest and are therefore recognised as an expense. At each reporting date the non-market vesting assumptions are revised and the expense recognised each year takes into account the most recent estimates. The market-related assumptions are not revised each year as the fair value is not re-estimated after the grant date. Restricted share plan (RSP) The RSP is accounted for as an equity-settled arrangement. The fair value of shares allocated to employees for nil consideration is recognised as an expense over the vesting period with a corresponding increase in the share-based payments reserve in equity. The fair value of ordinary shares issued to satisfy the obligation to employees is measured at grant date and is recognised as a separate component of equity. Employee share plan (ESP) The value of shares expected to be allocated to employees for nil consideration is recognised as an expense over the financial year and provided for as other employee benefits. The fair value of any ordinary shares issued to satisfy the obligation to employees is recognised in equity. Alternatively, shares may be purchased on market to satisfy the obligation to employees. |
Scheme name | | Westpac Long Term Variable
Reward Plan (LTVR) | | Westpac Performance Plan (WPP) | | Restricted Share Plan
(RSP) | | Employee Share Plan
(ESP) |
Type of share- based payment | | Share rights (allocated at no cost). Share options (no longer issued since October 2009). | | Share rights (allocated at no cost). Share options (no longer issued since October 2009). | | Westpac ordinary shares (allocated at no cost). | | Westpac ordinary shares (allocated at no cost) of up to $1,000 per employee per year. |
How it is used | | Aligns executive remuneration and accountability with shareholder interests over the long term. | | Primarily used for mandatory deferral of a portion of short-term incentives for New Zealand employees and key employees based outside Australia. | | Primarily used to reward key employees. | | To reward eligible Australian employees (unless they have already been provided instruments under another scheme for the previous year). |
Exercise price: | | | | | | | | |
Shares rights | | Nil | | Nil | | n/a | | n/a |
Share options | | The market price of Westpac shares at the start of the performance period | | The market price of Westpac shares at the start of the performance period. | | n/a | | n/a |
Performance hurdles | | Relative Total Shareholder return (TSR) over a four year performance period and average cash Return on Equity (cash ROE) over a three year performance period plus one year holding lock, each applying to half of the award (commencing with the 2016 LTVR award)1. | | None | | None | | None |
1. For the 2015 LTVR awards, the relative TSR is subject to a four year performance period and cash EPS compound annual growth rate (CAGR) over a three year performance period plus one year holding lock. For awards granted for the periods 2011 to 2014 both the relative TSR and cash EPS CAGR hurdles are subject to a three year performance and vesting period. Relative TSR hurdled awards granted prior to 2011 were measured over an initial three year performance period with subsequent performance testing possible at the fourth and fifth anniversaries however further vesting may only occur if the relative TSR ranking has improved.
286 | 2019 Westpac Group Annual Report | |
| | |
Notes to the financial statements
Note 33. Share-based payments (continued)
Scheme name | | Westpac Long Term Variable
Reward Plan (LTVR) | | Westpac Performance Plan (WPP) | | Restricted Share Plan
(RSP) | | Employee Share Plan
(ESP) |
Service conditions | | Continued employment throughout the vesting period or as determined by the Board. | | Continued employment throughout the vesting period or as determined by the Board. | | Continued employment throughout the restriction period or as determined by the Board. | | Shares must normally remain within the ESP for three years from granting unless the employee leaves Westpac. |
Vesting period (period over which expenses are recognised) | | 4 years1 | | Defined period set out at time of grant. | | Defined period set out at time of grant. | | 1 year |
Treatment at end of term | | Lapse if not exercised. | | Lapse if not exercised. | | Vested shares are released from the RSP at the end of the vesting period. Shares granted prior to October 2009 may be held in the RSP for up to 10 years from the grant date. | | Shares are released at the end of the restriction period or when the employee leaves Westpac. |
Does the employee receive dividends and voting rights during the vesting period? | | No | | No | | Yes | | Yes |
Each share-based payment scheme is quantified below:
(i) Westpac Long Term Variable Reward Plan (LTVR)
2019 | Outstanding at
1 October 2018 | Granted during
the year | Exercised
during the year | Lapsed during
the year | Outstanding at
30 September 2019 | Outstanding
and exercisable at
30 September 2019 |
Share options | 52,350 | – | 37,831 | 14,519 | – | – |
Weighted average exercise price | $23.40 | – | $23.40 | – | – | – |
Weighted average remaining contractual life | 0 years | | | | – | |
Share rights | 4,712,843 | 1,169,704 | – | 1,327,958 | 4,554,589 | 3,719 |
Weighted average remaining contractual life | 10.9 years | | | | 12.3 years | |
2018 | 1 Oct 2017 | | | | 30 Sept 2018 | |
Share options | 256,840 | – | 103,686 | 100,804 | 52,350 | 52,350 |
Weighted average exercise price | $26.36 | – | $24.23 | – | $23.40 | $23.40 |
Performance share rights | 5,231,904 | 808,290 | 2,929 | 1,324,422 | 4,712,843 | 3,719 |
The weighted average fair value at grant date of LTVR share rights issued during the year was $15.62 (2018: $17.86).
(ii) Westpac Performance Plan (WPP)
2019 | Outstanding at
1 October 2018 | Granted during
the year | Exercised
during the year | Lapsed during
the year | Outstanding at
30 September 2019 | Outstanding
and exercisable at
30 September 2019 |
Share rights | | | | | | |
One-year vesting period | 140,531 | 145,296 | 82,287 | 5,652 | 197,888 | 59,413 |
Two-year vesting period | 253,390 | 146,139 | 78,180 | 31,440 | 289,909 | 48,833 |
Three-year vesting period | 117,739 | 20,169 | 23,576 | 19,083 | 95,249 | 22,700 |
Four-year vesting period | 162,229 | 74,042 | – | 32,851 | 203,420 | – |
Total share rights | 673,889 | 385,646 | 184,043 | 89,026 | 786,466 | 130,946 |
Weighted average remaining contractual life | 12.4 years | | | | 12.8 years | |
2018 | 1 Oct 2017 | | | | 30 Sept 2018 | |
Performance share rights | 619,779 | 246,902 | 156,691 | 36,101 | 673,889 | 124,525 |
The weighted average fair value at grant date of WPP share rights issued during the year was $23.08 (2018: $27.83).
1. For the 2015 LTVR awards, the relative TSR is subject to a four year performance period and cash EPS compound annual growth rate (CAGR) over a three year performance period plus one year holding lock. For awards granted for the periods 2011 to 2014 both the relative TSR and cash EPS CAGR hurdles are subject to a three year performance and vesting period. Relative TSR hurdled awards granted prior to 2011 were measured over an initial three year performance period with subsequent performance testing possible at the fourth and fifth anniversaries however further vesting may only occur if the relative TSR ranking has improved.
| 2019 Westpac Group Annual Report | 287 |
| | |
Notes to the financial statements
Note 33. Share-based payments (continued)
(iii) Restricted Share Plan (RSP)
Allocation date1 | Outstanding at
1 October 2018 | Granted during
the year | Released | Forfeited
during the year | Outstanding at
30 September 2019 |
Granted prior to October 2009 | 346,732 | – | 346,732 | – | – |
Granted subsequent to October 2009 | 3,842,912 | 2,861,262 | 1,867,777 | 63,226 | 4,773,171 |
Total 2019 | 4,189,644 | 2,861,262 | 2,214,509 | 63,226 | 4,773,171 |
Total 2018 | 4,204,753 | 2,479,975 | 2,225,245 | 269,839 | 4,189,644 |
The weighted average fair value at grant date of RSP shares issued during the year was $25.20 (2018: $31.29).
(iv) Employee Share Plan (ESP)
| Allocation
date | Number of
participants | Average
number
of shares
allocated per
participant | Total Number
of shares
allocated | Market
price per share2 | Total
fair value |
2019 | 23 November 2018 | 27,245 | 39 | 1,062,555 | $25.35 | $26,935,769 |
2018 | 24 November 2017 | 27,557 | 31 | 854,267 | $31.80 | $27,165,691 |
The 2018 ESP award was satisfied through the purchase of shares on market.
The liability accrued for the ESP at 30 September 2019 is $26 million (2018: $28 million) and is provided for as other employee benefits.
(v) CEO plans
Details of share-based payment arrangements held by the CEO, Brian Hartzer, are on the same terms and conditions as described above for the relevant plan.
(vi) Other plans
Westpac also provides plans for small, specialised parts of the Group. The benefits under these plans are directly linked to growth and performance of the relevant part of the business. The plans individually and in aggregate are not material to the Group in terms of expenses and dilution of earnings.
The names of all persons who hold share options and/or rights currently on issue are entered in Westpac’s register of option holders which may be inspected at Link Market Services, Level 12, 680 George Street, Sydney, New South Wales.
(vii) Fair value assumptions
The fair values of share options and share rights have been independently calculated at their respective grant dates.
The fair value of share rights with performance targets based on relative TSR takes into account the average TSR outcome determined using a Monte Carlo simulation pricing model.
The fair values of share rights without TSR based performance targets (i.e. share rights with cash EPS CAGR, economic profit and cash ROE performance targets) have been determined with reference to the share price at grant date and a discount rate reflecting the expected dividend yield over their vesting periods.
Other significant assumptions include:
· a risk free rate of return of 2.1%, applied to TSR-hurdled grants;
· a dividend yield on Westpac shares of 7.5%, applied to TSR and ROE-hurdled grants;
· volatility in Westpac’s TSR of 20.3%, applied to TSR-hurdled grants; and
· volatilities of, and correlation factors between, TSR of the comparator group and Westpac for TSR-hurdled grants.
1. For awards made prior to October 2009, shares may be held in the RSP for up to 10 years from the date they are granted. For awards made from October 2009, shares are released from the RSP on vesting.
2. The market price per share for the allocation is based on the five day volume-weighted average price up to the grant date.
288 | 2019 Westpac Group Annual Report | |
| | |
Notes to the financial statements
Note 34. Superannuation commitments
Accounting policy
The Group recognises an asset or a liability for its defined benefit schemes, being the net of the defined benefit obligations and the fair value of the schemes’ assets. The defined benefit obligation is calculated as the present value of the estimated future cash flows, discounted using high-quality long dated corporate bond rates. The superannuation expense is recognised in operating expenses and remeasurements are recognised through other comprehensive income. Critical accounting assumptions and estimates The actuarial valuation of plan obligations is dependent upon a series of assumptions, principally price inflation, salary growth, mortality, morbidity, discount rate and investment returns. Different assumptions could significantly alter the valuation of the plan assets and obligations and the superannuation cost recognised in the income statement. |
Westpac had the following defined benefit plans at 30 September 2019:
Name of plan | Type | Form of benefit | Date of last actuarial assessment of
the funding status |
Westpac Group Plan (WGP) | Defined benefit and accumulation | Indexed pension and lump sum | 30 June 2018 |
Westpac New Zealand Superannuation Scheme (WNZS) | Defined benefit and accumulation | Indexed pension and lump sum | 30 June 2017 |
Westpac Banking Corporation UK | Defined benefit | Indexed pension and lump sum | 5 April 2018 |
Staff Superannuation Scheme (UKSS) | | | |
Westpac UK Medical Benefits Scheme | Defined benefit | Medical benefits | n/a |
The defined benefit sections of the schemes are closed to new members. The Group has no obligation beyond the annual contributions for the accumulation or defined contribution sections of the schemes.
The WGP is the Group’s principal defined benefit plan and is managed and administered in accordance with the terms of its trust deed and relevant legislation in Australia. Its defined benefit liabilities are based on salary and length of membership for active members and inflation in the case of pensioners.
The defined benefit schemes expose the Group to the following risks:
· discount rate – reductions in the discount rate would increase the present value of the future payments;
· inflation rate – increases in the inflation rate would increase the payments to pensioners;
· investment risk – lower investment returns would increase the contributions needed to offset the shortfall;
· mortality risk – members may live longer than expected extending the cash flows payable by the Group;
· behavioural risk – higher proportion of members taking some of their benefits as a pension rather than a lump sum would increase the cashflows payable by the group; and
· legislative risk – legislative changes could be made which increase the cost of providing defined benefits.
Investment risk is managed by setting benchmarks for the allocation of plan assets between asset classes. The long-term investment strategy will often adopt relatively high levels of equity investment in order to:
· secure attractive long term investment returns; and
· provide an opportunity for capital appreciation and dividend growth, which gives some protection against inflation.
Funding recommendations for the WGP, WNZS and the UKSS are made based on triennial actuarial valuations. The funding valuation of the defined benefit plans are based on different assumptions to the calculation of the defined benefit surplus/deficit for accounting purposes. Based on the most recent valuations, the defined benefit plan assets are adequate to cover the present value of the accrued benefits of all members with a combined surplus of $158 million (2018: $324 million). Current contribution rates are as follows:
· WGP – contributions are made to the WGP at the rate of 11.8% of members’ salaries;
· WNZS – contributions are made to the WNZS at the rate of 12% of members’ salaries; and
· UKSS – contributions are made to the UKSS at the rate of £1.05 million per year.
Contributions
| Consolidated | Parent Entity |
$m | 2019 | 2018 | 2019 | 2018 |
Employer contributions | 28 | 30 | 27 | 30 |
Member contributions | 11 | 12 | 11 | 11 |
Expected employer contributions for the year ended 30 September 2020 are $26 million.
| 2019 Westpac Group Annual Report | 289 |
| | |
Notes to the financial statements
Note 34. Superannuation commitments (continued)
Expense recognised
| Consolidated | Parent Entity |
$m | 2019 | 2018 | 2017 | 2019 | 2018 |
Current service cost | 33 | 37 | 42 | 32 | 37 |
Net interest cost on net benefit liability | (2) | 1 | 8 | (2) | - |
Total defined benefit expense | 31 | 38 | 50 | 30 | 37 |
Defined benefit balances recognised
| Consolidated | Parent Entity |
$m | 2019 | 2018 | 2019 | 2018 |
Benefit obligation at end of the year | 2,799 | 2,314 | 2,710 | 2,239 |
Fair value of plan assets at end of the year | 2,464 | 2,378 | 2,405 | 2,319 |
Net surplus/(deficit) | (335) | 64 | (305) | 80 |
Defined benefit surplus1 | 73 | 89 | 73 | 89 |
Defined benefit deficit2 | (408) | (25) | (378) | (9) |
Net surplus/(deficit) | (335) | 64 | (305) | 80 |
The average duration of the defined benefit obligation is 14 years (2018: 11 years).
Significant assumptions
| 2019 | 2018 |
Consolidated and Parent Entity | Australian
Funds | Overseas
Funds | Australian
Funds | Overseas
Funds |
Discount rate | 2.6% | 1.1%-1.8% | 4.1% | 2.6%-2.9% |
Salary increases | 2.4% | 3.0%-4.9% | 2.9% | 3%-5% |
Inflation rate (pensioners received inflationary increase) | 1.4% | 2.0%-3.4% | 1.9% | 2%-3.5% |
Life expectancy of a 60-year-old male | 31.1 | 27.9-28.1 | 31.0 | 27.9-28.4 |
Life expectancy of a 60-year-old female | 34.0 | 29.3-29.5 | 33.9 | 29.4-29.6 |
Sensitivity to changes in significant assumptions
The table below shows the impact of changes in assumptions on the defined benefit obligation for the WGP. No reasonably possible changes in the assumptions of the Group’s other defined benefit plans would have a material impact on the defined benefit obligation.
| Increase in obligation |
Change in assumption | 2019 | 2018 |
0.5% decrease in discount rate | 205 | 120 |
0.5% increase in annual salary increases | 14 | 8 |
0.5% increase in inflation rate (pensioners receive inflationary increases) | 188 | 111 |
1 year increase in life expectancy | 45 | 38 |
Asset allocation
Consolidated and Parent Entity | 2019 | 2018 |
% | Australian
Funds | Overseas
Funds | Australian
Funds | Overseas
Funds |
Cash | 3% | 3% | 5% | 2% |
Equity instruments | 45% | 7% | 45% | 7% |
Debt instruments | 28% | 5% | 28% | 80% |
Property | 10% | 1% | 10% | 1% |
Other assets | 14% | 84% | 12% | 10% |
Total | 100% | 100% | 100% | 100% |
Equity and debt instruments are mainly quoted assets while property and other assets are mainly unquoted. Other assets include infrastructure funds and private equity funds.
1. The defined benefit surplus is recognised in other assets.
2. The defined benefit deficit is recognised in other liabilities.
290 | 2019 Westpac Group Annual Report | |
| | |
Notes to the financial statements
OTHER
Note 35. Auditor’s remuneration
The fees payable to the auditor, PricewaterhouseCoopers (PwC), and overseas firms belonging to the PwC network of firms were:
| Consolidated | Parent Entity |
$’000 | 2019 | 2018 | 2019 | 2018 |
Audit and audit-related fees | | | | |
Audit fees | | | | |
PwC Australia | 28,153 | 19,999 | 28,025 | 19,967 |
Overseas PwC network firms | 3,216 | 3,338 | 321 | 68 |
Total audit fees | 31,369 | 23,337 | 28,346 | 20,035 |
Audit-related fees | | | | |
PwC Australia | 3,569 | 2,316 | 3,418 | 2,224 |
Overseas PwC network firms | 128 | 117 | 2 | – |
Total audit-related fees | 3,697 | 2,433 | 3,420 | 2,224 |
Total audit and audit-related fees | 35,066 | 25,770 | 31,766 | 22,259 |
Tax fees | | | | |
PwC Australia | 53 | 169 | 53 | 49 |
Total tax fees | 53 | 169 | 53 | 49 |
Other fees | | | | |
PwC Australia | 70 | 1,581 | 70 | 1,501 |
Overseas PwC network firms | 502 | – | 502 | – |
Total other fees | 572 | 1,581 | 572 | 1,501 |
Total audit and non-audit fees | 35,691 | 27,520 | 32,391 | 23,809 |
Fees payable to the auditor have been categorised as follows:
Audit | The year end audit, half-year review and comfort letters associated with debt issues and capital raisings. |
Audit-related | Consultations regarding accounting standards and reporting requirements, regulatory compliance reviews and assurance related to debt and capital offerings. |
Tax | Tax compliance and tax advisory services. |
Other | Various services including systems assurance, compliance advice and controls reviews. |
It is Westpac’s policy to engage PwC on assignments additional to their statutory audit duties only if their independence is not impaired or seen to be impaired and where their expertise and experience with Westpac is important. All services were approved by the Audit Committee in accordance with the pre-approval policy and procedures.
PwC also received fees of $7.5 million (2018: $7.5 million) for various entities which are related to Westpac but not consolidated. These non-consolidated entities include entities sponsored by the Group, trusts of which a Westpac Group entity is trustee, manager or responsible entity, superannuation funds and pension funds.
| 2019 Westpac Group Annual Report | 291 |
| | |
Notes to the financial statements
Note 36. Related party disclosures
Related parties
Westpac’s related parties are those it controls or can exert significant influence over. Examples include subsidiaries, associates, joint ventures and superannuation plans as well as key management personnel and their related parties.
Key management personnel (KMP)
Key management personnel are those who, directly or indirectly, have authority and responsibility for planning, directing and controlling the activities of Westpac. This includes all Executives and Non-Executive Directors.
Parent Entity
Westpac Banking Corporation is the ultimate parent company of the Group.
Subsidiaries - Note 31
The Parent Entity has the following related party transactions and balances with subsidiaries:
Type of transaction/balance | Details disclosed in |
Balances due to/from subsidiaries | Balance Sheet |
Dividend income/Transactions with subsidiaries | Note 4 |
Interest income and Interest expense | Note 3 |
Tax consolidated group transactions and undertakings | Note 7 |
Guarantees and undertakings | Note 27 |
The balances due to/from subsidiaries include a wide range of banking and other financial facilities.
The terms and conditions of related party transactions between the Parent Entity and subsidiaries are sometimes different to commercial terms and conditions. Related party transactions between the Parent Entity and subsidiaries eliminate on consolidation.
Associates - Note 31
The Group provides a wide range of banking and other financial facilities and funds management activities to its associates on commercial terms and conditions.
Superannuation plans
The Group contributed $347 million (2018: $348 million) to defined contribution plans and $28 million to defined benefit plans (2018: $30 million). Refer to Note 34.
Remuneration of KMP
Total remuneration of the KMP was:
$ | Short-term
Benefits | Post
Employment
Benefits | Other Long-
term
Benefits | Termination
Benefits | Share-based
Payments | Total |
Consolidated | | | | | | |
2019 | 23,805,197 | 712,883 | 36,572 | 558,984 | 20,691,480 | 45,805,116 |
2018 | 23,210,820 | 618,631 | 297,495 | – | 16,086,623 | 40,213,569 |
Parent Entity | | | | | | |
2019 | 22,515,477 | 625,173 | 36,572 | 558,984 | 19,783,900 | 43,520,106 |
2018 | 21,807,008 | 537,187 | 297,495 | – | 15,301,417 | 37,943,107 |
Other transactions with KMP
KMP receive personal banking and financial investment services from the Group in the ordinary course of business. The terms and conditions, for example interest rates and collateral, and the risks to Westpac are comparable to transactions with other employees and did not involve more than the normal risk of repayment or present other unfavourable features.
Details of loans provided and the related interest charged to KMP and their related parties are as follows:
$ | Interest
Payable for
the Year | Closing Loan
Balance | Number of
KMP with
Loans |
2019 | 672,167 | 31,718,007 | 14 |
2018 | 650,969 | 17,498,526 | 13 |
292 | 2019 Westpac Group Annual Report | |
| | |
Notes to the financial statements
Note 36. Related party disclosures (continued)
Options and share rights holdings
For compliance with SEC disclosure requirements, the following table sets out certain details of the performance options, performance share rights and unhurdled share rights held at 30 September 2019 by the CEO and other key management personnel (including their related parties):
| Latest Date of Exercise | Number of
Share Rights |
Managing Director & Chief Executive Officer | | |
Brian Hartzer | Ranges from 1 October 2030 to 1 October 2033 | 840,679 |
Group Executives | | |
Craig Bright | Ranges from 1 October 2033 to 1 October 2033 | 77,696 |
Lyn Cobley | Ranges from 1 October 2030 to 1 October 2033 | 356,810 |
Peter King | Ranges from 1 October 2030 to 1 October 2033 | 340,558 |
Rebecca Lim | Ranges from 1 October 2030 to 1 October 2033 | 193,217 |
David Lindberg | Ranges from 1 October 2030 to 1 April 2034 | 319,482 |
Carolyn McCann | Ranges from 1 October 2030 to 1 October 2033 | 78,548 |
David McLean | Ranges from 1 October 2022 to 1 October 2033 | 366,163 |
Christine Parker | Ranges from 1 October 2030 to 1 October 2033 | 260,523 |
David Stephen | Ranges from 1 October 2032 to 1 October 2033 | 278,698 |
Gary Thursby | Ranges from 1 October 2030 to 1 October 2033 | 213,978 |
Alastair Welsh | Ranges from 1 October 2030 to 1 October 2030 | 14,944 |
Former Group Executive | | |
Brad Cooper | Ranges from 1 October 2030 to 1 October 2033 | 349,204 |
Dave Curran | Ranges from 1 October 2030 to 1 October 2033 | 246,376 |
George Frazis | Ranges from 1 October 2030 to 1 October 2033 | 332,577 |
The Group has not issued any options during the year and previously issued options has either been exercised or lapsed as at 1 October 2018.
| 2019 Westpac Group Annual Report | 293 |
| | |
Notes to the financial statements
Note 37. Notes to the cash flow statements1
Accounting policy
Cash and balances with central banks include cash held at branches and in ATMs, balances with overseas banks in their local currency and balances with central banks including accounts with the RBA and accounts with overseas central banks. |
Reconciliation of net cash provided by/(used in) operating activities to net profit for the year is set out below:
| Consolidated | Parent Entity |
$m | 2019 | 2018 | 2017 | 2019 | 2018 |
Net profit for the year | 6,790 | 8,099 | 7,997 | 7,121 | 8,144 |
Adjustments: | | | | | |
Depreciation, amortisation and impairment | 1,079 | 1,144 | 1,269 | 1,082 | 952 |
Impairment charges | 966 | 889 | 1,021 | 893 | 820 |
Net (decrease)/increase in current and deferred tax | (541) | (96) | (34) | (804) | (598) |
(Increase)/decrease in accrued interest receivable | 132 | (83) | (75) | 98 | (74) |
(Decrease)/increase in accrued interest payable | (341) | 241 | 148 | (321) | 217 |
(Decrease)/increase in provisions | 1,143 | 289 | 219 | 1,214 | 294 |
Other non-cash items | (832) | 332 | (419) | (329) | 420 |
Cash flows from operating activities before changes in operating assets and liabilities | 8,396 | 10,815 | 10,126 | 8,954 | 10,175 |
Net (increase)/decrease in derivative financial instruments | 7,605 | 8,584 | (5,042) | 6,581 | 8,263 |
Net (increase)/decrease in life insurance assets and liabilities | (134) | (230) | 219 | - | - |
(Increase)/decrease in other operating assets: | | | | | |
Collateral paid | (847) | 969 | 2,320 | (755) | 662 |
Trading securities and other financial assets measured at fair value | (7,629) | 3,492 | (4,729) | (7,358) | 2,815 |
Loans | (4,188) | (24,740) | (26,815) | (3,312) | (23,661) |
Other financial assets | 336 | 859 | 466 | 324 | 502 |
Other assets | (13) | 10 | 67 | (41) | 33 |
(Decrease)/increase in other operating liabilities: | | | | | |
Collateral received | 1,007 | (295) | 739 | 1,004 | (606) |
Deposits and other borrowings | 1,113 | 23,928 | 23,062 | 963 | 20,783 |
Other financial liabilities | 1,463 | (3,632) | 2,506 | 1,555 | (3,742) |
Other liabilities | (5) | 10 | (82) | (24) | 17 |
Net cash provided by/(used in) operating activities | 7,104 | 19,770 | 2,837 | 7,891 | 15,241 |
1. The Group has adopted AASB 9 and AASB 15 from 1 October 2018. Comparatives have not been restated. In addition, the Group has made a number of presentational changes to the Balance Sheet. Comparatives have been restated. Refer to Note 1 for further detail.
294 | 2019 Westpac Group Annual Report | |
| | |
Notes to the financial statements
Note 37. Notes to the cash flow statements (continued)
Details of the assets and liabilities over which control ceased
Details of the entities over which control ceased are provided in Note 31.
| | Consolidated | | Parent Entity | |
$m | | 2019 | 2018 | | 2017 | | 2019 | | 2018 | |
Assets: | | | | | | | | | | |
Cash and balances with central banks | | 3 | 10 | | – | | – | | – | |
Trading securities and financial assets measured at fair value | | 3 | – | | – | | – | | – | |
Property and equipment | | – | 2 | | – | | – | | – | |
Deferred tax assets | | – | 4 | | – | | – | | – | |
Intangible assets | | – | 15 | | – | | – | | – | |
Other financial assets | | 3 | 5 | | – | | – | | – | |
Total assets | | 9 | 36 | | – | | – | | – | |
Liabilities: | | | | | | | | | | |
Provisions | | – | 2 | | – | | – | | – | |
Other liabilities | | – | 3 | | – | | – | | – | |
Total liabilities | | – | 5 | | – | | – | | – | |
Total equity attributable to owners of Westpac Banking Corporation | | 9 | 31 | | – | | – | | – | |
Cash proceeds (net of transaction costs) | | 2 | 19 | | – | | – | | – | |
Total consideration | | 2 | 19 | | – | | – | | – | |
Reserves recycled to income statement | | 10 | 3 | | – | | – | | – | |
Gain/(loss) on disposal | | 3 | (9 | ) | – | | – | | – | |
Reconciliation of cash proceeds from disposal | | | | | | | | | | |
Cash proceeds received (net of transaction costs) | | 2 | 19 | | – | | – | | – | |
Less: Cash deconsolidated | | (3) | (10 | ) | – | | – | | – | |
Cash consideration (paid)/received (net of transaction costs and cash held) | | (1) | 9 | | – | | – | | – | |
Non-cash financing activities
| | Consolidated | | Parent Entity | |
$m | | 2019 | 2018 | | 2017 | | 2019 | | 2018 | |
Shares issued under the dividend reinvestment plan | | 1,489 | 631 | | 1,452 | | 1,489 | | 631 | |
Shares issued from the conversion of Westpac CPS | | – | 566 | | – | | – | | 566 | |
On 13 March 2018, $623 million of CPS were transferred to the Westpac CPS nominated party for $100 each pursuant to the Westpac Capital Notes 5 reinvestment offer. Those CPS were subsequently bought back and cancelled by Westpac. On 3 April 2018, the remaining $566 million of CPS were transferred to the Westpac CPS nominated party for $100 each. Following the transfer, those remaining CPS were converted into 19,189,765 ordinary shares.
Restricted cash
Certain of our foreign operations are required to maintain reserves or minimum balances with central banks in their respective countries of operation, totalling $330 million (2018: $357 million) for the Group and $224 million (2018: $250 million) for the Parent Entity which are included in cash and balances with central banks.
| 2019 Westpac Group Annual Report | 295 |
| | |
Notes to the financial statements
Note 38. Subsequent events
Since the end of the year ended 30 September 2019, the Board has determined to pay a fully franked final dividend of 80 cents per fully paid ordinary share. The dividend is expected to be $2,791 million. The dividend is not recognised as a liability as at 30 September 2019. The proposed payment date of the dividend is 20 December 2019.
The Board has determined to issue shares to satisfy the Dividend Re-investment Plan (DRP) for the final 2019 ordinary dividend. The market price used to determine the number of shares issued under the DRP will be set over the 10 trading days commencing 18 November 2019.
On 4 November 2019, Westpac announced that it will be undertaking an underwritten placement of fully paid ordinary shares in Westpac to institutional investors to raise $2 billion. As further announced, following the placement, Westpac will make a share purchase plan available to shareholders and to raise approximately $500 million, subject to scaleback, and with the ability to raise less or more.
No other matters have arisen since the year ended 30 September 2019 which are not otherwise dealt with in this report, that have significantly affected or may significantly affect the operations of the Group, the results of its operations or the state of affairs of the Group in subsequent periods.
Note 39. Accounting polices relating to prior years
Due to the adoption of AASB 9, the accounting policies relating to some financial instruments and related balances have changed. The policies applicable to the current year are provided in the relevant note to the financial statements above. As prior comparative years have not been restated, the accounting policies detailed below reflect the policies applicable to financial years prior to 2019 based on AASB 139. Refer to Note 1 for further information.
Accounting policy relating to impairment (Note 6 and Note 13)
Impairment charges (Note 6) At each balance sheet date, the Group assesses whether there is any objective evidence of impairment of its loan portfolio. An impairment charge is recognised if there is objective evidence that the principal or interest repayments may not be recoverable and when the financial impact of the non-recoverable loan can be reliably measured. Objective evidence of impairment could include a breach of contract with the Group such as a default on interest or principal payments, a borrower experiencing significant financial difficulties or observable economic conditions that correlate to defaults on a group of loans. The impairment charge is measured as the difference between the loan’s current carrying amount and the present value of its estimated future cash flows. The estimated future cash flows exclude any expected future credit losses which have not yet occurred and are discounted to their present value using the loan’s original effective interest rate. If a loan has a variable interest rate, the discount rate for measuring any impairment is the current effective interest rate. The impairment charge is recognised in the income statement with a corresponding reduction of the carrying value of the loan through an offsetting provision account (refer to Note 13). In subsequent periods, objective evidence may indicate that an impairment charge should be reversed. Objective evidence could include a borrower’s credit rating or financial circumstances improving. The impairment charge is reversed in the income statement of that future period and the related provision for impairment is reduced. Uncollectable loans The policy for uncollectible loans is consistent with that applicable to 2019 based on AASB 9. Provision for impairment charges (Note 13) The Group recognises two types of impairment provisions for its loans, being provisions for loans which are: · individually assessed for impairment; and · collectively assessed for impairment. The Group assesses impairment as follows: · individually for loans that exceed specified thresholds. Where there is objective evidence of impairment, individually assessed provisions will be recognised; and · collectively for loans below the specified thresholds noted above or if there is no objective evidence of impairment. These loans are included in a group of loans with similar risk characteristics and collectively assessed for impairment. If there is objective evidence that the group of loans is collectively impaired, collectively assessed provisions will be recognised. Critical accounting assumptions and estimates The methodology and assumptions used for estimating future cash flows are reviewed regularly by the Group to reduce differences between impairment provisions and actual loss experience. |
296 | 2019 Westpac Group Annual Report | |
| | |
Notes to the financial statements
Note 39. Accounting polices relating to prior years (continued)
Individual component Key judgements include the business prospects for the customer, the realisable value of collateral, the Group’s position relative to other claimants, the reliability of customer information and the likely cost and duration of recovering the loan. Judgements can change with time as new information becomes available or as loan recovery strategies evolve, which may result in revisions to the impairment provision. Collective component Collective provisions are established on a portfolio basis taking into account the level of arrears, collateral and security, past loss experience, current economic conditions, expected default and timing of recovery based on portfolio trends. Key judgements include estimated loss rates and their related emergence periods. The emergence period for each loan type is determined through studies of loss emergence patterns. Loan files are reviewed to identify the average time period between observable loss indicator events and the loss becoming identifiable. Actual credit losses may differ materially from reported loan impairment provisions due to uncertainties including interest rates and their effect on consumer spending, unemployment levels, payment behaviour and bankruptcy rates. |
Accounting policy relating to classification and measurement of financial instruments (Policy prior to Note 10, Note 11 and Note 12)
Classification and measurement of financial assets and financial liabilities (Policy prior to Note 10) The Group classifies its financial assets in the following categories: cash and balances with central banks, receivables due from financial institutions, trading securities and financial assets designated at fair value, derivative financial instruments, available-for-sale securities, loans, life insurance assets and regulatory deposits with central banks overseas. The Group has not classified any of its financial assets as held-to-maturity investments. The Group classifies significant financial liabilities in the following categories: payables due to other financial institutions, deposits and other borrowings, other financial liabilities at fair value through income statement, derivative financial instruments, debt issues and loan capital. Financial assets and financial liabilities measured at fair value through income statement are recognised initially at fair value. All other financial assets and financial liabilities are recognised initially at fair value plus directly attributable transaction costs. Available-for-sale securities (Note 11) Available-for-sale debt securities (government and other) and equity securities are held at fair value with gains and losses recognised in other comprehensive income (OCI) except for interest on debt securities, dividends on equity securities, and impairment charges which are recognised in the income statement. The cumulative gain or loss recognised in OCI is subsequently recognised in the income statement when the instrument is disposed. At each reporting date, the Group assesses whether any available-for-sale securities are impaired. Impairment exists if one or more events have occurred which have a negative impact on the security’s estimated cash flows. For debt instruments, evidence of impairment includes significant financial difficulties or adverse changes in the payment status of an issuer. For equity securities, a significant or prolonged decline in the fair value of the security below its cost is considered evidence of impairment. If impairment exists, the cumulative loss is removed from OCI and recognised in the income statement. Any subsequent reversals of impairment on debt securities are also recognised in the income statement. Subsequent reversal of impairment charges on equity instruments is not recognised in the income statement until the instrument is disposed. Loans (Note 12) Loans are financial assets initially recognised at fair value plus directly attributable transaction costs and fees. Loans are subsequently measured at amortised cost using the effective interest rate method and are presented net of any provisions for impairment charges except for a portfolio of loans which are subsequently measured at fair value to reduce an accounting mismatch. |
| 2019 Westpac Group Annual Report | 297 |
| | |
Statutory statements
Directors’ declaration
In the Directors’ opinion:
(a) the financial statements and notes set out in ‘Section 3 – Financial report for the year ended 30 September 2019’ are in accordance with the Corporations Act 2001, including:
(i) complying with Australian Accounting Standards, the Corporations Regulations 2001 and other mandatory professional reporting requirements; and
(ii) giving a true and fair view of Westpac Banking Corporation and the Group’s financial position as at 30 September 2019 and of their performance for the financial year ended on that date; and
(b) there are reasonable grounds to believe that Westpac will be able to pay its debts as and when they become due and payable.
Note 1(a) includes a statement that the financial report also complies with International Financial Reporting Standards as issued by the International Accounting Standards Board.
The Directors have been given the declaration by the Chief Executive Officer and the Chief Financial Officer required by section 295A of the Corporations Act 2001.
This declaration is made in accordance with a resolution of the Directors.
For and on behalf of the Board.

| 
|
| |
Lindsay Maxsted | Brian Hartzer |
Chairman | Managing Director & Chief Executive Officer |
Sydney | |
4 November 2019 | |
298 | 2019 Westpac Group Annual Report | |
| | |
Statutory statements
Management’s report on internal control over financial reporting
The following report is required by rules of the US Securities and Exchange Commission.
The management of Westpac is responsible for establishing and maintaining adequate internal control over financial reporting for Westpac as defined in Rule 13a – 15 (f) under the Securities Exchange Act of 1934, as amended. Westpac’s internal control system is designed to provide reasonable assurance regarding the reliability of financial reporting and the preparation of financial statements for external purposes in accordance with applicable accounting standards.
Westpac’s internal control over financial reporting includes policies and procedures that: pertain to the maintenance of records that in reasonable detail accurately reflect the transactions and dispositions of the assets of Westpac and its consolidated entities; provide reasonable assurance that transactions are recorded as necessary to permit preparation of financial statements in accordance with applicable accounting standards, and that receipts and expenditures of Westpac are being made only in accordance with authorizations of management and directors of Westpac and its consolidated entities; and provide reasonable assurance regarding prevention or timely detection of unauthorized acquisition, use or disposition of the assets of Westpac and its consolidated entities that could have a material effect on the financial statements.
Because of its inherent limitations, internal control over financial reporting may not prevent or detect misstatements. Also, projections of any evaluation of effectiveness to future periods are subject to the risk that controls may become inadequate because of changes in conditions, or that the degree of compliance with the policies or procedures may deteriorate.
Westpac management, with the participation of the CEO and CFO, assessed the effectiveness of Westpac’s internal control over financial reporting as of 30 September 2019 based on the criteria set forth by the Committee of Sponsoring Organizations of the Treadway Commission (COSO) in its 2013 Internal Control-Integrated Framework. Based on this assessment, management has concluded that Westpac’s internal control over financial reporting as of 30 September 2019 was effective.
The effectiveness of Westpac’s internal control over financial reporting as of 30 September 2019 has been audited by PricewaterhouseCoopers, an independent registered public accounting firm, as stated in their report which is included herein.
| 2019 Westpac Group Annual Report | 299 |
| | |
Statutory statements

Report of Independent Registered Public Accounting Firm
To the Board of Directors and Shareholders of Westpac Banking Corporation
Opinions on the Financial Statements and Internal Control over Financial Reporting
We have audited the accompanying consolidated balance sheets of Westpac Banking Corporation and its subsidiaries (the “Company”) as of 30 September 2019 and 2018, and the related consolidated income statements, consolidated statements of comprehensive income, consolidated statements of changes in equity and consolidated cash flow statements for each of the three years in the period ended 30 September 2019, including the related notes (collectively referred to as the “consolidated financial statements”). We also have audited the Company’s internal control over financial reporting as of 30 September 2019, based on criteria established in Internal Control - Integrated Framework (2013) issued by the Committee of Sponsoring Organizations of the Treadway Commission (COSO).
In our opinion, the consolidated financial statements referred to above present fairly, in all material respects, the financial position of the Company as of 30 September 2019 and 2018, and the results of its operations and its cash flows for each of the three years in the period ended 30 September 2019 in conformity with Australian Accounting Standards as issued by the Australian Accounting Standards Board and International Financial Reporting Standards as issued by the International Accounting Standards Board. Also in our opinion, the Company maintained, in all material respects, effective internal control over financial reporting as of 30 September 2019, based on criteria established in Internal Control - Integrated Framework (2013) issued by the COSO.
The Company has included parent entity only information on the face of the consolidated financial statements and other parent entity only disclosures in the notes to the financial statements. Such parent entity only information is presented for purposes of additional analysis and is not a required part of the consolidated financial statements presented in accordance with Australian Accounting Standards as issued by the Australian Accounting Standards Board and International Financial Reporting Standards as issued by the International Accounting Standards Board. Such information has been subjected to the auditing procedures applied in the audit of the consolidated financial statements, and, in our opinion, is fairly stated in all material respects in relation to the consolidated financial statements taken as a whole.
|
PricewaterhouseCoopers, ABN 52 780 433 757 One International Towers Sydney, Watermans Quay, Barangaroo NSW 2000, GPO BOX 2650 Sydney NSW 2001 T: +61 2 8266 0000, F: +61 2 8266 9999, www.pwc.com.au |
300 | 2019 Westpac Group Annual Report | |
| | |
Statutory statements

Basis for Opinions
The Company’s management is responsible for these consolidated financial statements, for maintaining effective internal control over financial reporting, and for its assessment of the effectiveness of internal control over financial reporting, included in Management’s Report on Internal Control Over Financial Reporting appearing on page 298 of the 2019 Annual Report. Our responsibility is to express opinions on the Company’s consolidated financial statements and on the Company’s internal control over financial reporting based on our audits. We are a public accounting firm registered with the Public Company Accounting Oversight Board (United States) (“PCAOB”) and are required to be independent with respect to the Company in accordance with the U.S. federal securities laws and the applicable rules and regulations of the Securities and Exchange Commission and the PCAOB.
We conducted our audits in accordance with the standards of the PCAOB. Those standards require that we plan and perform the audits to obtain reasonable assurance about whether the consolidated financial statements are free of material misstatement, whether due to error or fraud, and whether effective internal control over financial reporting was maintained in all material respects.
Our audits of the consolidated financial statements included performing procedures to assess the risks of material misstatement of the consolidated financial statements, whether due to error or fraud, and performing procedures that respond to those risks. Such procedures included examining, on a test basis, evidence regarding the amounts and disclosures in the consolidated financial statements. Our audits also included evaluating the accounting principles used and significant estimates made by management, as well as evaluating the overall presentation of the consolidated financial statements. Our audit of internal control over financial reporting included obtaining an understanding of internal control over financial reporting, assessing the risk that a material weakness exists, and testing and evaluating the design and operating effectiveness of internal control based on the assessed risk. Our audits also included performing such other procedures as we considered necessary in the circumstances. We believe that our audits provide a reasonable basis for our opinions.
Definition and Limitations of Internal Control over Financial Reporting
A company’s internal control over financial reporting is a process designed to provide reasonable assurance regarding the reliability of financial reporting and the preparation of financial statements for external purposes in accordance with generally accepted accounting principles. A company’s internal control over financial reporting includes those policies and procedures that (i) pertain to the maintenance of records that, in reasonable detail, accurately and fairly reflect the transactions and dispositions of the assets of the company; (ii) provide reasonable assurance that transactions are recorded as necessary to permit preparation of financial statements in accordance with generally accepted accounting principles, and that receipts and expenditures of the company are being made only in accordance with authorizations of management and directors of the company; and (iii) provide reasonable
| 2019 Westpac Group Annual Report | 301 |
| | |
Statutory statements
assurance regarding prevention or timely detection of unauthorized acquisition, use, or disposition of the company’s assets that could have a material effect on the financial statements.
Because of its inherent limitations, internal control over financial reporting may not prevent or detect misstatements. Also, projections of any evaluation of effectiveness to future periods are subject to the risk that controls may become inadequate because of changes in conditions, or that the degree of compliance with the policies or procedures may deteriorate.
Critical Audit Matters
The critical audit matters communicated below are matters arising from the current period audit of the consolidated financial statements that were communicated or required to be communicated to the Board Audit Committee and that (i) relate to accounts or disclosures that are material to the consolidated financial statements, and (ii) involved especially challenging, subjective, or complex judgments. The communication of critical audit matters does not alter in any way our opinion on the consolidated financial statements, taken as a whole, and we are not, by communicating the critical audit matters below, providing separate opinions on the critical audit matters or on the accounts or disclosures to which they relate.
Provision for expected credit losses
As described in Note 13 to the consolidated financial statements, the provision for expected credit losses (ECL) was $3,913m at 30 September 2019. ECL are a probability-weighted estimate of the cash shortfalls expected to result from defaults over the relevant timeframe determined by evaluating a range of possible outcomes and taking into account the time value of money, past events, current conditions and forecasts of future economic conditions. Management’s model to determine the ECL includes significant judgment in assumptions used to determine when a significant increase in credit risk (SICR) has occurred, and in estimating forward looking macroeconomic scenarios (MES) and applying a probability weighting to different scenarios. There is also a significant volume of data used in the ECL model, which is sourced from relevant IT systems.
The principal considerations for our determination that performing procedures relating to the provision for ECL on loans is a critical audit matter are (i) there was significant judgment by management in determining the ECL, which in turn led to a high degree of auditor subjectivity in performing procedures related to the ECL model and assumptions used to estimate the ECL (ii) there was significant judgment and effort in evaluating audit evidence related to the model and assumptions used to determine the provision for ECL on loans (iii) the audit effort involved the use of professionals with specialized skill and knowledge (iv) the nature and extent of audit effort involved evaluating audit evidence related to critical data elements used in the model and (v) the nature and extent of audit testing related to user access for the relevant IT systems used in determining the provision for ECL on loans.
302 | 2019 Westpac Group Annual Report | |
| | |
Statutory statements

Addressing the matter involved performing procedures and evaluating audit evidence in connection with forming our overall opinion on the consolidated financial statements. These procedures included testing the effectiveness of controls relating to the Company’s ECL estimation process, which included controls over the data, model and assumptions used in determining the provision for ECL on loans as well as IT general controls related to user access for the relevant IT systems. These procedures also included, among others, (i) the involvement of professionals with specialized skill and knowledge to assist in testing management’s process for determining the provision for ECL on loans by evaluating the reasonableness of the model and the assumptions applied for SICR and MES and (ii) testing the accuracy and completeness of selected critical data elements that are inputs used in the ECL model.
Valuation of Level 2 financial instruments at fair value
As described in Note 22 to the consolidated financial statements, the value of Level 2 financial instruments held by the Company at fair value was $120,742m assets and $85,776m liabilities. The fair value for these financial instruments, which are not actively traded, is determined using valuation techniques. Where a valuation model is used, significant data inputs are obtained from relevant product IT systems.
The principal considerations for our determination that performing procedures relating to valuation of Level 2 financial instruments at fair value is a critical audit matter are (i) there was significant judgment by management to determine the fair value of Level 2 financial instruments using internally-developed models, which include inputs and other estimation assumptions (ii) there was significant judgement and audit effort to evaluate the evidence obtained related to the valuation models, inputs and assumptions, as well as the audit effort involving the use of professionals with specialized skill and knowledge and (iii) the nature and extent of audit testing related to user access for the relevant IT systems used in determining the valuation of financial instruments.
Addressing the matter involved performing procedures and evaluating audit evidence in connection with forming our overall opinion on the consolidated financial statements. These procedures included testing the effectiveness of controls relating to the valuation of financial instruments, including controls over certain models, significant assumptions and data inputs, as well as IT general controls related to user access for the relevant IT systems. These procedures also included, among others, the involvement of professionals with specialized skill and knowledge that independently price or obtain independent inputs for models and compare to management’s fair value.
Compliance, regulation and remediation provisions and contingent liabilities
As described in Note 27 to the consolidated financial statements, the Company recorded compliance, regulation and remediation provisions of $1,572m at 30 September 2019. The compliance, regulation and remediation provisions relate to matters of potential misconduct in
| 2019 Westpac Group Annual Report | 303 |
| | |
Statutory statements
providing services to customers identified as a result of regulatory action and internal reviews. An assessment of the likely cost to the Company of these matters (including applicable customer refunds) is made on a case-by-case basis and specific provisions or disclosures are made where management consider appropriate. There are large volumes of data from IT systems within the Company’s assessment. Disclosures are also required on contingent liabilities for possible obligations whose existence will be confirmed only by uncertain future events, and present obligations where the transfer of economic resources is not probable or cannot be reliably measured.
The principal considerations for our determination that performing procedures relating to compliance, regulation and remediation provisions and contingent liabilities is a critical audit matter are (i) significant judgment by management as to whether or not it is probable that a loss has occurred, (ii) significant judgment by management to quantify the provisions, which included assumptions related to the timing, nature and quantum of related cash outflows, (iii) the subjective nature of assessing the audit evidence for key assumptions in the provisions and contingent liabilities and (iv) and extent of audit testing related to user access for the relevant IT systems used in determining the provisions.
Addressing the matter involved performing procedures and evaluating audit evidence in connection with forming our overall opinion on the consolidated financial statements. These procedures included testing the effectiveness of controls relating to management’s evaluation of provisions to determine whether a present obligation exists and the probability, timing, nature and quantum of outflows that may arise from past events, as well as IT general controls related to user access for the relevant IT systems. For contingent liabilities, these procedures also included testing the effectiveness of controls relating to management’s evaluation, including controls over determining whether or not it is probable that a loss has occurred and whether the amount of loss can be reasonably measured. These procedures also included, among others, (i) evaluating the evidence of management’s quantification of provisions and the assumptions applied and (ii) assessing the appropriateness of disclosures.

PricewaterhouseCoopers
Sydney, Australia
November 4, 2019
We have served as the Company’s auditor since 1968.
304 | 2019 Westpac Group Annual Report | |
| | |
This page has been intentionally left blank
| 2019 Westpac Group Annual Report | 305 |
| | |

Shareholding information
Additional information
Information for shareholders
Glossary of abbreviations and defined terms
306 | 2019 Westpac Group Annual Report | |
| | |
Shareholding information
Westpac ordinary shares
Top 20 ordinary shareholders as at 3 October 2019
| Number of
Fully Paid Ordinary
Shares | % Held |
HSBC Custody Nominees (Australia) Limited | 816,515,538 | 23.40 |
J P Morgan Nominees Australia Pty Limited | 481,851,187 | 13.81 |
Citicorp Nominees Pty Limited | 208,567,202 | 5.98 |
National Nominees Limited | 125,967,460 | 3.61 |
BNP Paribas Nominees Pty Limited <Agency Lending DRP A/C> | 70,515,743 | 2.02 |
BNP Paribas NOMS Pty Ltd <DRP> | 34,567,225 | 0.99 |
Citicorp Nominees Pty Limited <Colonial First State Inv A/C> | 29,565,543 | 0.85 |
HSBC Custody Nominees (Australia) Limited <NT-Comwlth Super Corp A/C> | 27,514,450 | 0.79 |
Australian Foundation Investment Company Limited | 15,545,000 | 0.45 |
Pacific Custodians Pty Limited | 12,735,536 | 0.36 |
Argo Investments Limited | 11,908,448 | 0.34 |
Milton Corporation Limited | 10,545,458 | 0.30 |
AMP Life Limited | 9,623,747 | 0.28 |
HSBC Custody Nominees (Australia) Limited | 7,926,398 | 0.23 |
Netwealth Investments Limited | 6,288,844 | 0.18 |
HSBC Custody Nominees (Australia) Limited-GSCo ECA | 6,102,266 | 0.17 |
BNP Paribas Nominees Pty Ltd HUB24 Custodial Serv Ltd DRP | 5,250,107 | 0.15 |
Australia Executor Trustees Limited | 4,568,817 | 0.13 |
Navigator Australia Ltd | 4,500,720 | 0.13 |
Nulis Nominees (Australia) Limited | 4,243,532 | 0.12 |
Total of Top 20 registered shareholders1 | 1,894,303,221 | 54.29 |
As at 3 October 2019 there were 610,334 holders of our ordinary shares compared to 619,578 in 2018 and 633,272 in 20172. Ordinary shareholders with a registered address in Australia held approximately 96% of our fully paid share capital at 3 October 2019 (approximately 98% in 2018 and 98% in 2017).
Substantial shareholders as at 3 October 2019
As at 3 October 2019 BlackRock Group (comprised of BlackRock Inc. and its subsidiaries) and The Vanguard Group, Inc. (including its subsidiary Vanguard Investments Australia Ltd.) had a ‘substantial holding’ of our shares within the meaning of the Corporations Act. A person has a substantial holding of our shares if the total votes attached to our voting shares in which they or their associates have relevant interests is 5% or more of the total number of votes attached to all our voting shares. The above table of the Top 20 ordinary shareholders includes shareholders that may hold shares for the benefit of third parties.
BlackRock Group has been a substantial shareholder since 4 April 2017 and The Vanguard Group, Inc. has been a substantial shareholder since 17 July 2018.
Control of registrant
We are not directly or indirectly owned or controlled by any other corporation(s) or by any foreign government. Refer to the section ‘Exchange controls and other limitations affecting security holders’, which provides information on the Foreign Acquisitions and Takeovers Act 1975, Corporations Act 2001 and Financial Sector (Shareholdings) Act 1998, which impose limits on equity holdings.
At 30 September 2019, our Directors and Executive Officers owned beneficially, directly or indirectly, an aggregate of 1,260,100 (0.036%) of the fully paid ordinary shares outstanding.
1. As recorded on the share register by holder reference number.
2. Numbers include employee holdings previously consolidated on the share registry.
| 2019 Westpac Group Annual Report | 307 |
| | |
Shareholding information
Analysis by range of holdings of ordinary shares as at 3 October 2019
Number of Shares | Number of Holders
of Fully Paid
Ordinary Shares | % | Number of Fully Paid
Ordinary Shares | % | Number of Holders
of Share Options
and Rights |
1 – 1,000 | 332,831 | 54.53 | 127,962,909 | 3.67 | 24,049 |
1,001 – 5,000 | 211,921 | 34.72 | 490,047,791 | 14.04 | 313 |
5,001 – 10,000 | 39,153 | 6.42 | 273,610,658 | 7.84 | 18 |
10,001 – 100,000 | 25,775 | 4.22 | 542,968,274 | 15.56 | 99 |
100,001 and over | 654 | 0.11 | 2,055,339,141 | 58.89 | 35 |
Totals | 610,334 | 100 | 3,489,928,773 | 100 | 24,514 |
There were 12,715 shareholders holding less than a marketable parcel ($500) based on a market price of $28.50 at the close of trading on 3 October 2019.
Voting rights of ordinary shares
Holders of our fully paid ordinary shares have, at general meetings (including special general meetings), one vote on a show of hands and, upon a poll, one vote for each fully paid ordinary share held by them.
Westpac Capital Notes 2
Top 20 holders of Westpac Capital Notes 2 as at 3 October 2019
| Number of Westpac
Capital Notes 2 | % Held |
HSBC Custody Nominees (Australia) Limited | 952,574 | 7.27 |
BT Portfolio Services Limited | 250,000 | 1.91 |
Netwealth Investments Limited <Wrap Services A/C> | 183,618 | 1.40 |
BNP Paribas Nominees Pty Ltd HUB24 Custodial Serv Ltd DRP | 162,509 | 1.24 |
Netwealth Investments Limited <Super Services A/C> | 156,340 | 1.19 |
HSBC Custody Nominees (Australia) Limited - A/C 2 | 148,949 | 1.14 |
Navigator Australia Ltd | 131,450 | 1.00 |
Nulis Nominees (Australia) Limited | 130,188 | 0.99 |
BNP Paribas Noms Pty Ltd <DRP> | 108,764 | 0.83 |
Australian Executor Trustees Limited <IPS Super A/C> | 81,674 | 0.62 |
Rakio Pty Ltd | 63,000 | 0.48 |
J P Morgan Nominees Australia Pty Limited | 61,784 | 0.47 |
National Nominees Limited | 60,403 | 0.46 |
Dimbulu Pty Ltd | 51,000 | 0.39 |
Domer Mining Co P/L | 50,000 | 0.38 |
Royal FreeMasons Benevolent Institution | 50,000 | 0.38 |
Randazzo C & G Developments Pty Ltd | 50,000 | 0.38 |
Longhurst Management Services Pty Ltd | 48,191 | 0.37 |
Alsop Pty Ltd | 45,000 | 0.34 |
Australian Executor Trustees Limited <No 1 Account> | 43,720 | 0.33 |
Total of Top 20 registered holders1: | 2,829,164 | 21.57 |
1. As recorded on the holder register by holder reference number.
Analysis by range of holdings of Westpac Capital Notes 2 as at 3 October 2019
Number of Securities | Number of Holders of
Westpac Capital
Notes 2 | % | Number of Westpac
Capital Notes 2 | % |
1 – 1,000 | 13,851 | 88.28 | 4,799,668 | 36.62 |
1,001 – 5,000 | 1,605 | 10.23 | 3,312,756 | 25.28 |
5,001 – 10,000 | 147 | 0.94 | 1,048,730 | 8.00 |
10,001 – 100,000 | 77 | 0.49 | 1,720,159 | 13.13 |
100,001 and over | 9 | 0.06 | 2,224,392 | 16.97 |
Totals | 15,689 | 100 | 13,105,705 | 100 |
There were six security holders holding less than a marketable parcel ($500) of Westpac Capital Notes 2 based on a market price of $102.70 at the close of trading on 3 October 2019.
308 | 2019 Westpac Group Annual Report | |
| | |
Shareholding information
Westpac Capital Notes 3
Top 20 holders of Westpac Capital Notes 3 as at 3 October 2019
| Number of Westpac
Capital Notes 3 | % Held |
HSBC Custody Nominees (Australia) Limited | 1,178,530 | 8.90 |
JDB Services Pty Ltd | 193,551 | 1.46 |
Berne No 132 Nominees Pty Ltd | 190,458 | 1.44 |
Navigator Australia Ltd | 168,753 | 1.27 |
National Nominees Limited | 161,202 | 1.22 |
BNP Paribas Nominees Pty Limited HUB24 Custodial Serv Ltd DRP | 154,273 | 1.16 |
Nulis Nominees (Australia) Limited | 139,388 | 1.05 |
Balanced Property Pty Ltd | 100,000 | 0.76 |
HSBC Custody Nominees (Australia) Limited - A/C 2 | 95,443 | 0.72 |
Seymour Group Pty Ltd | 76,774 | 0.58 |
Netwealth Investments Limited | 70,622 | 0.53 |
V S Access Pty Ltd | 60,000 | 0.45 |
Dimbulu Pty Ltd | 50,000 | 0.38 |
Invia Custodian Pty Limited | 50,000 | 0.38 |
JMB Pty Ltd | 50,000 | 0.38 |
Randazzo C & G Developments Pty Ltd | 50,000 | 0.38 |
Wayrich Pty Ltd | 50,000 | 0.38 |
BNP Paribas Nominees Pty Limited <DRP> | 47,524 | 0.36 |
Marshstroke Pty Ltd | 47,000 | 0.35 |
Jove Pty Ltd | 44,550 | 0.34 |
Total of Top 20 registered holders1 | 2,978,068 | 22.49 |
1. As recorded on the holder register by holder reference number.
Analysis by range of holdings of Westpac Capital Notes 3 as at 3 October 2019
Number of Securities | Number of Holders of
Westpac Capital
Notes 3 | % | Number of Westpac
Capital Notes 3 | % |
1 – 1,000 | 13,735 | 89.09 | 4,622,912 | 34.91 |
1,001 – 5,000 | 1,469 | 9.53 | 3,164,963 | 23.90 |
5,001 – 10,000 | 123 | 0.80 | 986,534 | 7.45 |
10,001 – 100,000 | 83 | 0.54 | 2,283,716 | 17.24 |
100,001 and over | 7 | 0.05 | 2,186,155 | 16.51 |
Totals | 15,417 | 100 | 13,244,280 | 100 |
There were seven security holders holding less than a marketable parcel ($500) of Westpac Capital Notes 3 based on a market price of $102.82 at the close of trading on 3 October 2019.
| 2019 Westpac Group Annual Report | 309 |
| | |
Shareholding information
Westpac Capital Notes 4
Top 20 holders of Westpac Capital Notes 4 as at 3 October 2019
| Number of Westpac
Capital Notes 4 | % Held |
BNP Paribas Nominees Pty Ltd <Agency Lending DRP A/C> | 3,000,000 | 17.63 |
HSBC Custody Nominees (Australia) Limited | 1,341,442 | 7.88 |
National Nominees Limited | 309,667 | 1.82 |
Citicorp Nominees Pty Limited | 200,413 | 1.18 |
BNP Paribas Noms Pty Ltd | 175,152 | 1.03 |
Nora Goodrdge Invsetments Pty Limited | 165,000 | 0.97 |
Mutual Trust Pty Ltd | 136,875 | 0.80 |
Netwealth Investments Limited | 117,174 | 0.69 |
HSBC Custody Nominees (Australia) Limited - A/C 2 | 114,220 | 0.67 |
Australian Executor Trustees Limited | 111,143 | 0.65 |
BNP Paribas Nominees Pty Ltd HUB24 Custodial Serv Ltd DRP | 109,477 | 0.64 |
Zashvin Pty Ltd | 104,000 | 0.61 |
Dimbulu Pty Ltd | 100,000 | 0.59 |
Navigator Australia Ltd | 78,895 | 0.46 |
Nulis Nominees (Australia) Limited | 78,670 | 0.46 |
Taverners No 11 Pty Ltd | 63,763 | 0.37 |
J P Morgan Nominees Australia Pty Limited | 62,280 | 0.37 |
Williambury Pty Ltd | 60,000 | 0.35 |
V S Access Pty Ltd | 51,570 | 0.30 |
JMB Pty Ltd | 50,000 | 0.29 |
Total of Top 20 registered holders1 | 6,429,741 | 37.76 |
1. As recorded on the holder register by holder reference number.
Analysis by range of holdings of Westpac Capital Notes 4 as at 3 October 2019
Number of Securities | Number of Holders of
Westpac Capital
Notes 4 | % | Number of Westpac
Capital Notes 4 | % |
1 – 1,000 | 16,011 | 89.64 | 5,108,624 | 30.01 |
1,001 – 5,000 | 1,636 | 9.16 | 3,391,551 | 19.93 |
5,001 – 10,000 | 141 | 0.79 | 1,049,608 | 6.17 |
10,001 – 100,000 | 61 | 0.34 | 1,586,188 | 9.32 |
100,001 and over | 12 | 0.07 | 5,884,563 | 34.57 |
Totals | 17,861 | 100 | 17,020,534 | 100 |
There were three security holders holding less than a marketable parcel ($500) of Westpac Capital Notes 4 based on a market price of $105.90 at the close of trading on 3 October 2019.
310 | 2019 Westpac Group Annual Report | |
| | |
Shareholding information
Westpac Capital Notes 5
Top 20 holders of Westpac Capital Notes 5 as at 3 October 2019
| Number of Westpac
Capital Notes 5 | % Held |
HSBC Custody Nominees (Australia) Limited | 1,545,482 | 9.14 |
National Nominees Limited | 469,762 | 2.78 |
J P Morgan Nominees Australia Limited | 211,296 | 1.25 |
IOOF Investment Management Limited | 170,672 | 1.01 |
Navigator Australia Ltd | 155,138 | 0.92 |
HSBC Custody Nominees (Australia) Limited - A/C 2 | 136,064 | 0.80 |
Dimbulu Pty Ltd | 100,000 | 0.59 |
Nulis Nominees (Australia) Limited | 97,990 | 0.58 |
BNP Paribas Nominees Pty Ltd | 95,032 | 0.56 |
Netwealth Investments Limited | 94,859 | 0.56 |
Citicorp Nominees Pty Limited | 92,355 | 0.55 |
Zashvin Pty Ltd | 92,220 | 0.55 |
Randazzo C & G Developments Pty Ltd | 92,000 | 0.54 |
Berne No 132 Nominees Pty Ltd | 60,000 | 0.35 |
Nora Goodridge Investments Pty Limited | 60,000 | 0.35 |
Mrs Linda Anne Van Lieshout | 60,000 | 0.35 |
Rakio Pty Ltd | 55,000 | 0.33 |
Mccusker Foundation Ltd | 50,685 | 0.30 |
Avanteos Investments Limited | 50,000 | 0.30 |
JMB Pty Ltd | 50,000 | 0.30 |
Total of Top 20 registered holders1 | 3,738,555 | 22.11 |
1. As recorded on the holder register by holder reference number.
Analysis by range of holdings of Westpac Capital Notes 5 as at 3 October 2019
Number of Securities | Number of Holders of
Westpac Capital
Notes 5 | % | Number of Westpac
Capital Notes 5 | % |
1 – 1,000 | 16,269 | 87.45 | 5,661,147 | 33.49 |
1,001 – 5,000 | 2,041 | 10.97 | 4,308,544 | 25.49 |
5,001 – 10,000 | 184 | 0.99 | 1,353,746 | 8.01 |
10,001 – 100,000 | 100 | 0.54 | 2,482,834 | 14.69 |
100,001 and over | 10 | 0.05 | 3,097,112 | 18.32 |
Totals | 18,604 | 100 | 16,903,383 | 100 |
There were seven security holders holding less than a marketable parcel ($500) of Westpac Capital Notes 5 based on a market price of $102.40 at the close of trading on 3 October 2019.
| 2019 Westpac Group Annual Report | 311 |
| | |
Shareholding information
Westpac Capital Notes 6
Top 20 holders of Westpac Capital Notes 6 as at 3 October 2019
| Number of Westpac
Capital Notes 6 | % Held |
HSBC Custody Nominees (Australia) Limited | 1,561,998 | 10.98 |
BNP Paribas Noms Pty Ltd <DRP> | 280,014 | 1.97 |
BT Portfolio Services Limited | 200,000 | 1.41 |
Netwealth Investments Limited | 153,552 | 1.08 |
J P Morgan Nominees Australia Pty Limited | 150,299 | 1.06 |
HSBC Custody Nominees (Australia) Limited - A/C 2 | 136,501 | 0.96 |
Navigator Australia Ltd <MLC Investment Sett A/C> | 115,183 | 0.81 |
National Nominees Limited | 111,299 | 0.78 |
BNP Paribas Nominees Pty Ltd HUB24 Custodial Serv Ltd DRP | 110,833 | 0.78 |
Australian Executor Trustees Limited | 108,266 | 0.76 |
Dimbulu Pty Ltd | 100,000 | 0.70 |
G Harvey Investments Pty Limited | 100,000 | 0.70 |
V S Access Pty Ltd | 90,000 | 0.63 |
Citicorp Nominees Pty Limited | 61,157 | 0.43 |
179 Hyde Investment Pty Ltd | 60,000 | 0.42 |
Mutual Trust Pty Ltd | 59,064 | 0.42 |
Nulis Nominees (Australia) Limited | 56,784 | 0.40 |
Eastcote Pty Ltd | 50,000 | 0.35 |
Willimbury Pty Ltd | 50,000 | 0.35 |
Mr Roni G Sikh | 41,169 | 0.29 |
Total of Top 20 registered holders1 | 3,596,119 | 25.28 |
1. As recorded on the holder register by holder reference number.
Analysis by range of holdings of Westpac Capital Notes 6 as at 3 October 2019
Number of Securities | Number of Holders of
Westpac Capital
Notes 6 | % | Number of Westpac
Capital Notes 6 | % |
1 – 1,000 | 12,273 | 86.76 | 4,463,856 | 31.37 |
1,001 – 5,000 | 1,621 | 11.46 | 3,538,469 | 24.87 |
5,001 – 10,000 | 163 | 1.15 | 1,258,436 | 8.84 |
10,001 – 100,000 | 79 | 0.56 | 2,041,874 | 14.35 |
100,001 and over | 10 | 0.07 | 2,927,945 | 20.58 |
Totals | 14,146 | 100 | 14,230,580 | 100 |
There was one security holder holding less than a marketable parcel ($500) of Westpac Capital Notes 6 based on a market price of $105.01 at the close of trading on 3 October 2019.
Voting rights of Westpac Capital Notes 2, Westpac Capital Notes 3, Westpac Capital Notes 4, Westpac Capital Notes 5 and Westpac Capital Notes 6
In accordance with the terms of issue, holders of Westpac Capital Notes 2, Westpac Capital Notes 3, Westpac Capital Notes 4, Westpac Capital Notes 5 and Westpac Capital Notes 6 have no right to vote at any general meeting of Westpac before conversion into Westpac ordinary shares.
If conversion occurs (in accordance with the applicable terms of issue), holders of Westpac Capital Notes 2, Westpac Capital Notes 3, Westpac Capital Notes 4, Westpac Capital Notes 5 or Westpac Capital Notes 6 (as applicable) will become holders of Westpac ordinary shares and have the voting rights that attach to Westpac ordinary shares.
312 | 2019 Westpac Group Annual Report | |
| | |
Shareholding information
Domicile1 of ordinary shareholders as at 3 October 2019
| Number
of Holders | % of Holdings | Number of Issued
Shares and Options | % of Issued
Shares and Options |
Australia | 583,939 | 95.68 | 3,434,932,550 | 98.43 |
New Zealand | 22,318 | 3.66 | 39,042,253 | 1.12 |
United Kingdom | 1,537 | 0.25 | 2,942,274 | 0.08 |
United States | 557 | 0.09 | 1,465,471 | 0.04 |
Other overseas | 1,983 | 0.32 | 11,546,225 | 0.33 |
Total | 610,334 | 100 | 3,489,928,773 | 100 |
Domicile1 of holders of Westpac Capital Notes 2 as at 3 October 2019
| Number
of Holders | % of Holdings | Number of Issued
Westpac Capital
Notes 2 | % of Issued
Westpac Capital
Notes 2 |
Australia | 15,668 | 99.87 | 13,063,747 | 99.68 |
New Zealand | 3 | 0.02 | 24,827 | 0.19 |
United Kingdom | 2 | 0.01 | 1,200 | 0.01 |
United States | 2 | 0.01 | 1,032 | 0.01 |
Other overseas | 14 | 0.09 | 14,899 | 0.11 |
Total | 15,689 | 100 | 13,105,705 | 100 |
Domicile1 of holders of Westpac Capital Notes 3 as at 3 October 2019
| Number
of Holders | % of Holdings | Number of Issued
Westpac Capital
Notes 3 | % of Issued
Westpac Capital
Notes 3 |
Australia | 15,392 | 99.83 | 13,189,098 | 99.58 |
New Zealand | 7 | 0.05 | 5,400 | 0.04 |
United Kingdom | 2 | 0.01 | 800 | 0.01 |
United States | 1 | 0.01 | 400 | 0.00 |
Other overseas | 15 | 0.10 | 48,582 | 0.37 |
Total | 15,417 | 100 | 13,244,280 | 100 |
Domicile1 of holders of Westpac Capital Notes 4 as at 3 October 2019
| Number
of Holders | % of Holdings | Number of Issued
Westpac Capital
Notes 4 | % of Issued
Westpac Capital
Notes 4 |
Australia | 17,840 | 99.88 | 16,996,917 | 99.86 |
New Zealand | 5 | 0.03 | 2,245 | 0.01 |
United Kingdom | 1 | 0.01 | 1,913 | 0.01 |
United States | 2 | 0.01 | 733 | 0.00 |
Other overseas | 13 | 0.07 | 18,726 | 0.11 |
Total | 17,861 | 100 | 17,020,534 | 100.00 |
Domicile1 of holders of Westpac Capital Notes 5 as at 3 October 2019
| Number
of Holders | % of Holdings | Number of Issued
Westpac Capital
Notes 5 | % of Issued
Westpac Capital
Notes 5 |
Australia | 18,579 | 99.86 | 16,885,913 | 99.90 |
New Zealand | 5 | 0.03 | 3,964 | 0.02 |
United Kingdom | 2 | 0.01 | 1,200 | 0.01 |
United States | 2 | 0.01 | 410 | 0.00 |
Other overseas | 16 | 0.09 | 11,896 | 0.07 |
Total | 18,604 | 100 | 16,903,383 | 100 |
1. Based on registered address of holder.
| 2019 Westpac Group Annual Report | 313 |
| | |
Shareholding information
Domicile1 of holders of Westpac Capital Notes 6 as at 3 October 2019
| Number
of Holders | % of Holdings | Number of Issued
Westpac Capital
Notes 6 | % of Issued
Westpac Capital
Notes 6 |
Australia | 14,139 | 99.95 | 14,219,400 | 99.92 |
New Zealand | 0 | 0.00 | - | 0.00 |
United Kingdom | 0 | 0.00 | - | 0.00 |
United States | 1 | 0.01 | 300 | 0.00 |
Other overseas | 6 | 0.04 | 10,880 | 0.08 |
Total | 14,146 | 100 | 14,230,580 | 100 |
Market price information
The principal listing of our ordinary shares is on the ASX. American Depositary Shares (ADS), each representing one ordinary share, are listed on the NYSE2.
The tables below set forth, for the calendar periods indicated, the reported high and low market quotations for our ordinary shares on the ASX based on its daily official list and for our ADS on the NYSE.
| Per Ordinary Share in A$3 | Per ADS in US$2 |
Financial year ending | High | Low | High | Low |
September 2019 | 30.05 | 23.30 | 20.51 | 16.48 |
September 2018 | 33.68 | 27.24 | 26.27 | 19.64 |
September 2017 | 35.39 | 28.92 | 27.05 | 21.23 |
September 2016 | 33.74 | 27.57 | 25.20 | 20.13 |
September 2015 | 40.07 | 29.10 | 31.18 | 20.43 |
| Per Ordinary Share in A$ | Per ADS in US$ |
Quarter ending | High | Low | High | Low |
2019: | | | | |
September | 30.05 | 27.21 | 20.51 | 18.53 |
June | 28.84 | 25.39 | 19.93 | 17.35 |
March | 27.47 | 24.05 | 19.22 | 17.39 |
2018: | | | | |
December | 27.91 | 23.30 | 19.92 | 16.48 |
September | 30.44 | 27.30 | 22.35 | 19.64 |
June | 30.33 | 27.24 | 22.74 | 20.55 |
March | 31.74 | 28.44 | 25.23 | 21.92 |
2017: | | | | |
December | 33.68 | 30.68 | 26.27 | 23.30 |
September | 32.85 | 30.30 | 26.16 | 23.29 |
June | 35.30 | 29.40 | 26.66 | 22.30 |
March | 35.39 | 31.52 | 27.00 | 23.87 |
2016: | | | | |
December | 33.00 | 28.92 | 23.48 | 22.96 |
September | 31.29 | 27.83 | 23.80 | 21.16 |
June | 32.00 | 27.57 | 24.47 | 20.46 |
March | 33.46 | 27.69 | 25.20 | 20.13 |
| Per Ordinary Share in A$ | Per ADS in US$ |
Month ending – 2019 | High | Low | High | Low |
September | 30.05 | 27.89 | 20.51 | 19.03 |
August | 28.97 | 27.21 | 19.65 | 18.53 |
July | 29.11 | 27.44 | 19.92 | 19.38 |
June | 28.47 | 26.96 | 19.93 | 18.97 |
May | 28.84 | 25.39 | 19.70 | 17.35 |
April | 27.79 | 25.54 | 19.55 | 18.35 |
1. Based on registered address of holder.
2. On 19 August 2013, the ratio changed from one ADS representing five Westpac fully paid ordinary shares to one ADS representing one Westpac fully paid ordinary share.
3. Australian dollar (A$) market price information is intraday high and low trading prices. US dollar (US$) market price information is closing prices.
314 | 2019 Westpac Group Annual Report | |
| | |
Shareholding information
Fees and charges payable by a holder of Westpac ADS
The depositary for Westpac’s ADS program, The Bank of New York Mellon (the Depositary), collects fees for delivery and surrender of ADS directly from investors depositing ordinary shares or surrendering ADS for the purpose of withdrawal or from intermediaries acting for them. The Depositary may also collect fees for making distributions to investors by deducting those fees from the amounts distributed or by selling a portion of the distributable property to pay the fees.
The charges of the Depositary payable by investors are as follows:
Type of Service | | Depositary Actions | | Fee |
Depositing or substituting the underlying shares. | | Delivery of ADS against the deposit of ordinary shares, including deposits and issuances in respect of: · share distributions, stock splits, rights, mergers; and · exchange of securities or other transactions or events or other distribution affecting the ADS or deposited securities. | | US$5.00 or less per 100 ADS (or portion thereof) evidenced by the new ADS delivered. |
Receiving or distributing cash dividends. | | Distribution of cash dividends. | | US$0.05 or less per ADS. |
Withdrawing an underlying ordinary share. | | Acceptance of ADS surrendered for withdrawal of deposited ordinary shares. | | US$5.00 or less for each 100 ADS (or portion thereof) evidenced by the ADS surrendered. |
General depositary services, particularly those charged on an annual basis. | | Other services performed by the Depositary in administering the ADS program. | | US$0.05 or less per ADS. |
Expenses of the Depositary. | | Expenses incurred on behalf of holders in connection with: · taxes and other governmental charges; · cable, telex and facsimile transmission/delivery; · transfer or registration fees, if applicable, for the registration of transfers or underlying ordinary shares; and · expenses of the Depositary in connection with the conversion of foreign currency into US dollars (which are paid out of such foreign currency). | | Expenses payable at the sole discretion of the Depositary by billing holders or by deducting charges from one or more cash dividends or other cash distributions. |
Fees and payments made by the Depositary to Westpac
The Depositary has agreed to reimburse certain Westpac expenses related to Westpac’s ADS program and incurred by Westpac in connection with the program, subject to certain limits. The Depositary has also agreed to waive certain of its fees for standard costs associated with the maintenance and administration of the ADS program. The following table shows reimbursements made and fees waived during the year.
Category of Expense Reimbursed to Westpac or Fee Waived | Reimbursed or Waived for 2019 |
Investor relations | US$534,076.20 |
Total | US$534,076.20 |
Under certain circumstances, including removal of the Depositary or termination of the ADS program by Westpac, Westpac is required to repay the Depositary certain amounts reimbursed and/or expenses paid to or on behalf of Westpac.
| 2019 Westpac Group Annual Report | 315 |
| | |
Shareholding information
Exchange controls and other limitations affecting security holders
Australian exchange controls
Australian laws control and regulate or permit the control and regulation of a broad range of payments and transactions involving non-residents of Australia. Pursuant to a number of exemptions, authorities and approvals, there are no general restrictions from transferring funds from Australia or placing funds to the credit of non-residents of Australia. However, Australian foreign exchange controls are implemented from time to time against prescribed countries, entities and persons. At the present time, these include:
(a) withholding taxes in relation to remittances or dividends (to the extent they are unfranked) and interest payments;
(b) the financial sanctions administered by the Department of Foreign Affairs and Trade (DFAT) in accordance with the Autonomous Sanctions Act 2011 and the Autonomous Sanctions Regulations 2011, specifically, in relation to transactions involving the transfer of funds or payments to, by the order of, or on behalf of individuals or entities including:
– persons associated with the former Milosevic regime, and persons indicted or suspected of committing war crimes during the Balkan wars in the early 1990s;
– persons or entities engaged in activities that seriously undermine democracy, respect for human rights and the rule of law in Zimbabwe;
– certain persons or entities associated with the Democratic People’s Republic of Korea’s weapons of mass destruction program or missiles program;
– certain persons or entities that have contributed to or are contributing to Iran’s nuclear or missile program;
– certain individuals and entities associated with the former Qadhafi regime in Libya;
– certain individuals and entities supporting the Syrian regime or that are responsible for human rights abuses in Syria; and
– persons who have been instrumental or complicit in the threat to the sovereignty and territorial integrity of Ukraine,
without the prior approval of the Minister for Foreign Affairs;
(c) the United Nations Security Council (UNSC) financial sanctions administered by DFAT, including:
– Terrorist Asset Freezing Regime
In accordance with the Charter of the United Nations Act 1945 and the Charter of the United Nations (Dealings with Assets) Regulations 2008, a person is prohibited from using or dealing with funds, financial assets or economic resources of persons or entities listed as terrorists by the Minister for Foreign Affairs in the Commonwealth of Australia Gazette. It is also a criminal offence to make assets available to such persons or entities; and
– Country-based sanctions
Under the Charter of the United Nations Act 1945 and associated regulations, UNSC financial sanctions have been implemented. It is an offence to use or deal with funds, financial assets or economic resources of certain persons or entities associated with countries designated by the UNSC. It is also a criminal offence to make assets available to such persons or entities.
Limitations affecting security holders
The following Australian laws impose limitations on the right of non-residents or non-citizens of Australia to hold, own or vote Westpac shares. All these limitations apply to the holders of the American Depositary Receipts (ADRs) evidencing ADS, issued by our Depositary in the United States.
Foreign Acquisitions and Takeovers Act 1975
Acquisitions of interests in shares in Australian companies by foreign persons that meet certain thresholds are required to be notified to the Treasurer of Australia (through the Foreign Investment Review Board) and to obtain a no objections notification under the Foreign Acquisitions and Takeovers Act 1975 (Cth). That legislation applies to any acquisition by a foreign person, including a corporation or group of associated foreign persons, which results in ownership of 20% or more of the issued shares of an Australian company or the ability to control 20% or more of the total voting power. In addition, the legislation applies to any acquisition by a foreign government investor of 10% or more of the total voting power or ownership of an Australian company (or any interest if the foreign government investor acquires a control element – for example the right to appoint a director). The legislation requires any persons proposing to make any such acquisition to first notify the Treasurer of their intention to do so. Where such an acquisition has already occurred in the absence of a no objections notification, the Treasurer has the power to order divestment if he considers the acquisition to be contrary to Australia’s national interest.
Financial Sector (Shareholdings) Act 1998
The Financial Sector (Shareholdings) Act 1998 (Cth) imposes restrictions on shareholdings in Australian financial sector companies (which includes Westpac). Under that legislation a person (including a corporation) may not hold more than a 15% ‘stake’ in a financial sector company without prior approval from the Treasurer of Australia. A person’s stake in a financial sector company is equal to the aggregate of the person’s voting power in the company and the voting power of the person’s associates. The concept of voting power is broadly defined. The Treasurer may approve a higher percentage stake if the Treasurer is satisfied that it is in the national interest to do so.
In addition, even if a person’s stake in a financial sector company does not exceed the 15% limit, the Treasurer has the power to declare that a person has ‘practical control’ of a financial sector company and require the person to relinquish that control or reduce their stake in that company.
316 | 2019 Westpac Group Annual Report | |
| | |
Shareholding information
Corporations Act 2001
The Corporations Act 2001 (Cth) prohibits any person (including a corporation) from acquiring a relevant interest in our voting shares if, after the acquisition, that person or any other person would be entitled to exercise more than 20% of the voting power in our shares. The prohibition is subject to certain limited exceptions. In addition, under the Corporations Act, a person is required to give a notice to us and to the ASX providing certain prescribed information, including their name, address and details of their relevant interests in our voting shares if they begin to have, or cease to have, a substantial holding in us, or if they already have a substantial holding and there is a movement of at least 1% in their holding. Such notice must, generally, be provided within two business days after the person becomes aware of that information.
A person will have a substantial holding if the total votes attached to our voting shares in which they or their associates have relevant interests is 5% or more of the total number of votes attached to all our voting shares. The concepts of ‘associate’ and ‘relevant interest’ are broadly defined in the Corporations Act and investors are advised to seek their own advice on their scope. In general terms, a person will have a relevant interest in a share if they:
(a) are the holder of that share;
(b) have power to exercise, or control the exercise of, a right to vote attached to that share; or
(c) have power to dispose of, or control the exercise of a power to dispose of, that share.
It does not matter how remote the relevant interest is or how it arises. If two or more persons can jointly exercise any one of these powers, each of them is taken to have that power. Nor does it matter that the power or control is express or implied, formal or informal, exercisable either alone or jointly with someone else.
The American Depositary Shares (ADS) agreement
There is a Deposit Agreement between The Bank of New York Mellon as Depositary, and Westpac, and the record holders from time to time of all ADS. Holders of our ADS are subject to the foregoing limitations on the rights of non- residents or non-citizens of Australia to own or vote Westpac shares. Record holders of ADS are required by the Deposit Agreement to comply with our requests for information as to the capacity in which such holders own ADS and related ordinary shares as well as to the identity of any other person interested in such ADS and related ordinary shares and the nature of such interest.
Enforceability of foreign judgments in Australia
We are an Australian public corporation with limited liability. All of our Directors and Executive Officers reside outside the US. Substantially all or a substantial portion of the assets of all or many of such persons are located outside the US. As a result, it may not be possible for investors to effect service of process within the US upon such persons or to enforce against them judgments obtained in US courts predicated upon the civil liability provisions of the federal securities laws of the US. There may be doubt as to the enforceability in Australia, in original actions or in actions for enforcement of judgments of US courts, of civil liabilities predicated upon the federal securities laws of the US.
Taxation
Australian taxation
The following discussion is a summary of certain Australian taxation implications of the ownership and disposition of ordinary shares (including ADS) for shareholders holding their shares on capital account. This discussion is based on the laws in force at the date of the Annual Report and the Convention between the Government of Australia and the Government of the United States of America for the Avoidance of Double Taxation and The Prevention of Fiscal Evasion with Respect to Taxes on Income (the Tax Treaty), and is subject to any changes in Australian law and any change in the Tax Treaty occurring after that date.
This discussion is intended only as a descriptive summary and does not purport to be a complete analysis of all the potential Australian tax implications of owning and disposing of ordinary shares. The specific tax position of each investor will determine the applicable Australian income tax implications for that investor and we recommend that investors consult their own tax advisers concerning the implications of owning and disposing of ordinary shares.
Taxation of dividends
Under the Australian dividend imputation system, Australian tax paid at the company level is imputed (or allocated) to shareholders by means of imputation credits (also called franking credits) which attach to dividends paid by the company to the shareholder. Such dividends are termed ‘franked dividends’.
When an Australian resident individual shareholder receives a franked dividend, the shareholder receives a tax offset to the extent of the franking credits, which can be offset against the Australian income tax payable by the shareholder. An Australian resident shareholder may, in certain circumstances, be entitled to a refund of excess franking.
The extent to which a dividend is franked typically depends upon a company’s available franking credits at the time of payment of the dividend. Accordingly, a dividend paid to a shareholder may be wholly or partly franked or wholly unfranked.
Fully franked dividends paid to non-resident shareholders are exempt from Australian dividend withholding tax.
Dividends paid to a non-resident shareholder which are not fully franked are subject to dividend withholding tax at the rate of 30% (unless reduced by a double tax treaty) to the extent they are unfranked. In the case of residents of the US who are entitled to the benefits of the Tax Treaty and are beneficially entitled to the dividends, the rate is reduced to 15% under the Tax Treaty, provided the shares are not effectively connected with a permanent establishment or a fixed base of the non-resident in Australia through which the non-resident carries on business in Australia or provides independent personal services. In the case of residents of the US that have a permanent establishment or fixed base in Australia where the shares in respect of which the dividends are paid are attributable to that permanent establishment or fixed base, there is no dividend withholding tax. Rather, such dividends will be taxed on a net assessment basis and, where the dividends are franked, entitlement to a tax offset may arise.
| 2019 Westpac Group Annual Report | 317 |
| | |
Shareholding information
Fully franked dividends paid to non-resident shareholders and dividends that have been subject to dividend withholding tax should not be subject to any further Australian income tax.
There are circumstances where a shareholder may not be entitled to the benefit of franking credits. The application of these rules depends upon the shareholder’s own circumstances, including the period during which the shares are held and the extent to which the shareholder is ‘at risk’ in relation to their shareholding.
Gain or loss on disposition of shares
Generally, any profit made by a resident shareholder on disposal of shares will be subject to capital gains tax. However, if the shareholder is regarded as a trader or speculator, or carries on a business of investing for profit, any profits may be taxed as ordinary income.
A discount may be available on capital gains on shares held for 12 months or more by Australian resident individuals, trusts or complying superannuation entities. The discount is one half for individuals and trusts, and one third for complying superannuation entities. Companies are not eligible for the capital gains tax discount. For shares acquired prior to 21 September 1999, an alternative basis of calculation of the capital gain may be available which allows the use of an indexation formula.
Normal rates of income tax would apply to capital gains so calculated. Any capital loss can only be offset against capital gains. Excess capital losses may be able to be carried forward for offset against future capital gains.
Generally, subject to two exceptions, a non-resident disposing of shares in an Australian public company who holds those shares on capital account will be free from income tax in Australia. The main exceptions are:
· shares held as part of a trade or business conducted through a permanent establishment in Australia. In such a case, any profit on disposal would be assessable to tax. Losses may give rise to capital losses or be otherwise deductible; and
· shares held in companies where the shareholder and its associates have held at the time of disposal (or at least 12 months in the 24 months prior to disposal) a holding of 10% or more in the company and more than 50% of the company’s assets are represented by interests in Australian real property (which is unlikely to be the case for Westpac). In such a case, capital gains tax would apply.
United States taxation
The following discussion is a summary of certain US federal income tax implications of the ownership and disposition of ordinary shares (including ADS) by US holders (as defined below) that hold the ordinary shares as capital assets. This discussion is based on the US Internal Revenue Code of 1986, as amended, its legislative history, existing and proposed regulations, published rulings and court decisions, and the Tax Treaty, all as currently in effect and all of which are subject to change, possibly on a retroactive basis.
This discussion is intended only as a descriptive summary. It does not purport to be a complete analysis of all the potential US federal income tax consequences of owning and disposing of ordinary shares and does not address US federal income tax considerations
that may be relevant to US holders subject to special treatment under US federal income tax law (such as banks, insurance companies, real estate investment trusts, regulated investment companies, dealers in securities, brokers, tax-exempt entities, retirement plans, certain former citizens or residents of the US, persons holding ordinary shares as part of a straddle, hedge, conversion or other integrated transaction, persons that have a ‘functional currency’ other than the US dollar, persons that own 10% or more (by voting power) of our stock, persons that generally mark their securities to market for US federal income tax purposes or persons that receive ordinary shares as compensation). As this is a complex area, we recommend investors consult their own tax advisers concerning the US federal, state and/or local implications of owning and disposing of ordinary shares.
For the purposes of this discussion you are a US holder if you are a beneficial owner of ordinary shares and you are for US federal income tax purposes:
· an individual who is a citizen or resident of the US;
· a corporation created or organised in or under the laws of the US or any state thereof or the District of Columbia;
· an estate, the income of which is subject to US federal income taxation regardless of its source; or
· a trust, if a US court can exercise primary supervision over the trust’s administration and one or more US persons are authorised to control all substantial decisions of the trust, or certain electing trusts that were in existence on 19 August 1996 and were treated as domestic trusts on that date.
If an entity treated as a partnership for US federal income tax purposes owns the ordinary shares, the US federal income tax implications of the ownership and disposition of ordinary shares will generally depend upon the status and activities of such partnership and its partners. Such an entity should consult its own tax adviser concerning the US federal income tax implications to it and its partners of owning and disposing of ordinary shares.
Taxation of dividends
If you are a US holder, you must include in your income as a dividend, the gross amount of any distributions paid by us out of our current or accumulated earnings and profits (as determined for US federal income tax purposes) without reduction for any Australian tax withheld from such distribution. We have not maintained and do not plan to maintain calculations of earnings and profits for US federal income tax purposes, and as a result, you may need to include the entire amount of any distribution in income as a dividend. If you are a non-corporate US holder, dividends paid to you that constitute qualified dividend income may be taxable to you at a preferential tax rate so long as certain holding period and other requirements are met. Dividends we pay with respect to the ordinary shares generally will be qualified dividend income. Each non-corporate US holder should consult their own tax advisor regarding the possible applicability of the reduced tax rate and the related restrictions and special rules.
318 | 2019 Westpac Group Annual Report | |
| | |
Shareholding information
Dividends paid by us constitute ordinary income that must generally be included in income when actually or constructively received. Such dividends will not be eligible for the dividends-received deduction generally allowed to corporate shareholders with respect to dividends received from US corporations. The amount of the dividend that you must include in your income as a US holder will be the US dollar value of the Australian dollar payments made, determined at the spot Australian dollar/US dollar rate on the date the dividend distribution is included in your income, regardless of whether the payment is in fact converted into US dollars. Generally, any gain or loss resulting from currency exchange fluctuations during the period from the date you include the dividend payment in income to the date you convert the payment into US dollars will be treated as ordinary income or loss and will not be eligible for the special tax rate applicable to qualified dividend income. This gain or loss generally will be income from sources within the US for foreign tax credit limitation purposes. Distributions on an ordinary share in excess of current and accumulated earnings and profits, as determined for US federal income tax purposes, will be treated as a non-taxable return of capital to the extent of your basis in such ordinary share and thereafter as capital gain.
Subject to certain limitations, Australian tax withheld in accordance with the Tax Treaty and paid over to Australia may be claimed as a foreign tax credit against your US federal income tax liability. Special rules apply in determining the foreign tax credit limitation with respect to dividends that are subject to a preferential tax rate. A US holder that does not elect to claim a US foreign tax credit for Australian income tax withheld may instead claim a deduction for such withheld tax, but only for a taxable year in which the US holder elects to do so with respect to all non- US income taxes paid or accrued in such taxable year.
Dividends paid by us generally will be income from sources outside the US for foreign tax credit limitation purposes. Under the foreign tax credit rules, dividends will, depending on your circumstances, be ‘passive category’ or ‘general category’ income for purposes of computing the foreign tax credit.
The rules relating to US foreign tax credits are very complex, and each US holder should consult its own tax adviser regarding the application of such rules.
Taxation of capital gains
If you sell, exchange or otherwise dispose of your ordinary shares, you will generally recognise a capital gain or loss for US federal income tax purposes equal to the difference between the US dollar value of the amount that you realise and your tax basis, determined in US dollars, in your ordinary shares. A capital gain of a non-corporate US holder is generally taxed at a reduced rate if the holder has a holding period greater than one year. The deductibility of capital losses is subject to limitations. Such capital gain or loss generally will be income from sources within the US, for foreign tax credit limitation purposes.
Medicare tax
In addition to regular US federal income tax, certain US holders that are individuals, estates or trusts are subject to a 3.8% tax on all or a portion of their ‘net investment income’, which may include all or a portion of their dividend income and net gain from the sale, exchange or other disposition of their ordinary shares.
Passive foreign investment company considerations
We believe that we will not be treated as a passive foreign investment company (PFIC) for US federal income tax purposes, and this discussion assumes we are not a PFIC. However, the determination as to whether we are a PFIC is made annually at the end of each taxable year and therefore could change. If we were to be treated as a PFIC, a US holder of ordinary shares could be subject to certain adverse tax consequences.
Disclosure requirements for specified foreign financial assets
Individual US holders (and certain US entities specified in US Internal Revenue Service (IRS) guidance) who, during any taxable year, hold any interest in any specified foreign financial asset, generally will be required to file with their US federal income tax returns certain information on IRS Form 8938 if the aggregate value of all such assets exceeds certain specified amounts. ‘Specified foreign financial asset’ generally includes any financial account maintained with a non-US financial institution and may also include the ordinary shares if they are not held in an account maintained with a financial institution. Substantial penalties may be imposed, and the period of limitations on assessment and collection of US federal income taxes may be extended, in the event of a failure to comply. US holders should consult their own tax advisers as to the possible application to them of this filing requirement.
Information reporting and backup withholding
Under certain circumstances, information reporting and/or backup withholding may apply to US holders with respect to payments on or the proceeds from the sale, exchange or other disposition of the ordinary shares, unless an applicable exemption is satisfied.
Backup withholding is not an additional tax. Any amounts withheld under the backup withholding rules generally will be allowed as a refund or credit against a US holder’s US federal income tax liability if the required information is furnished by the US holder on a timely basis to the IRS.
| 2019 Westpac Group Annual Report | 319 |
| | |
Additional information
Our constitution
Overview
We were incorporated in 1850 under the Bank of New South Wales Act, a special piece of legislation passed by the New South Wales Parliament at a time when there was no general companies’ legislation in Australia. On 23 August 2002, Westpac became registered under the Corporations Act 2001 (Cth) as a public company limited by shares.
As part of the process of becoming a company regulated under the Corporations Act, shareholders adopted a new constitution at the AGM on 15 December 2000, which came into operation on 23 August 2002. Our constitution has been subsequently amended by shareholders on 15 December 2005, 13 December 2007 and 13 December 2012.
Our objects and purposes
Our constitution does not contain a statement of our objects and purposes. As a company regulated by the Corporations Act, we have the legal capacity and powers of an individual both within and outside Australia, and all the powers of a body corporate, including the power to issue and cancel shares, to issue debentures, to distribute our property among our equity holders (either in kind or otherwise), to give security by charging our uncalled capital, to grant a floating charge over our property and to do any other act permitted by any law.
Directors’ voting powers
Under clause 9.11(a) of our constitution, subject to complying with the Corporations Act regarding disclosure of and voting on matters involving material personal interests, our Directors may:
(a) hold any office or place of profit in our company, except that of auditor;
(b) hold any office or place of profit in any other company, body corporate, trust or entity promoted by our company or in which it has an interest of any kind;
(c) enter into any contract or arrangement with our company;
(d) participate in any association, institution, fund, trust or scheme for past or present employees or directors of our company or persons dependent on or connected with them;
(e) act in a professional capacity (or be a member of a firm that acts in a professional capacity) for our company, except as auditor; and
(f) participate in, vote on and be counted in a quorum for any meeting, resolution or decision of the Directors and be present at any meeting where any matter is being considered by the Directors.
Under clause 9.11(b) of our constitution, a Director may do any of the above despite the fiduciary relationship of the Director’s office:
(a) without any liability to account to our company for any direct or indirect benefit accruing to the Director; and
(b) without affecting the validity of any contract or arrangement.
Under the Corporations Act, however, a Director who has a material personal interest in any matter to be considered at any Board meeting must not be present while the matter is being considered or vote on the matter, unless the other Directors resolve to allow that Director to be present and vote or a declaration is made by ASIC permitting that Director to participate and vote. These restrictions do not apply to a limited range of matters set out in section 191(2) of the Corporations Act, where the Director’s interest:
(a) arises because the Director is a shareholder of the company and is held in common with other shareholders;
(b) arises in relation to the Director’s remuneration as a Director of the company;
(c) relates to a contract the company is proposing to enter into that is subject to shareholder approval and will not impose obligations on the company if not approved by shareholders;
(d) arises merely because the Director is a guarantor or has given an indemnity or security for all or part of a loan (or proposed loan) to the company;
(e) arises merely because the Director has a right of subrogation in relation to a guarantee or indemnity referred to in (d);
(f) relates to a contract that insures, or would insure, the Director against liabilities the Director incurs as an officer of the company (but only if the contract does not make the company or related body corporate the insurer);
(g) relates to any payment by the company or a related body corporate in respect of certain indemnities permitted by the Corporations Act or any contract relating to such an indemnity; or
(h) is in a contract or proposed contract with, or for the benefit of, or on behalf of, a related body corporate and arises merely because the Director is a Director of that related body corporate.
If there are not enough Directors to form a quorum for the Board meeting because of Directors’ interests in a particular matter, a general meeting for shareholders may be called to consider the matter and interested Directors are entitled to vote on any proposal to requisition such a meeting.
Under clause 9.7 of our constitution, the maximum aggregate amount of annual remuneration to be paid to our Non-executive Directors must be approved by our shareholders. This aggregate amount is paid to the Non-executive Directors in such manner as the Board from time to time determines. Directors’ remuneration is one of the exceptions under section 191 of the Corporations Act to the prohibitions against being present and voting on any matter in which a Director has a material personal interest.
320 | 2019 Westpac Group Annual Report | |
| | |
Additional information
Directors’ borrowing powers
Clause 10.2 of our constitution empowers our Directors, as a Board, to exercise all the powers of Westpac to borrow or raise money, to charge any property or business of Westpac or all or any of its uncalled capital and to issue debentures or give any other security for a debt, liability or obligation of Westpac or of any other person. Such powers may only be changed by amending the constitution, which requires a special resolution (that is, a resolution passed by at least 75% of the votes cast by members entitled to vote on the resolution and for which notice has been given in accordance with the Corporations Act).
Minimum number of Directors
Our constitution requires that the minimum number of Directors is determined in accordance with the Corporations Act or other regulations. Currently the Corporations Act prescribes three as a minimum number of Directors and APRA governance standards specify five as the minimum number of Directors for APRA regulated entities. Westpac’s current number of Directors is above these prescribed minimums.
Share rights
The rights attaching to our ordinary shares are set out in the Corporations Act and in our constitution, and may be summarised as follows:
a) Profits and dividends
Holders of ordinary shares are entitled to receive such dividends on those shares as may be determined by our Directors from time to time. Dividends that are paid but not claimed may be invested by our Directors for the benefit of Westpac until claimed or required to be dealt with in accordance with any law relating to unclaimed monies.
Our constitution requires that dividends be paid out of our profits. In addition, under the Corporations Act, Westpac must not pay a dividend unless our assets exceed our liabilities immediately before the dividend is declared and the excess is sufficient for payment of the dividend. In addition, the payment must be fair and reasonable to the company’s shareholders and must not materially prejudice our ability to pay our creditors.
Subject to the Corporations Act, the constitution, the rights of persons (if any) entitled to shares with special rights to dividend and any contrary terms of issue of or applying to any shares, our Directors may determine that a dividend is payable, fix the amount and the time for payment and authorise the payment or crediting by Westpac to, or at the direction of, each shareholder entitled to that dividend.
If any dividends are returned unclaimed, we are generally obliged, under the Banking Act 1959 (Cth), to hold those amounts as unclaimed monies for a period of seven years. If at the end of that period the monies remain unclaimed by the shareholder concerned, we must submit an annual unclaimed money return to the Australian Securities and Investment Commission by 31 March each year containing the unclaimed money as at 31 December of the previous year. Upon such payment being made, we are discharged from further liability in respect of that amount.
Our Directors may, before paying any dividend, set aside out of our profits such sums as they think proper as reserves, to be applied, at the discretion of our Directors, for any purpose for which the profits may be
properly applied. Our Directors may carry forward so much of the profits remaining as they consider ought not to be distributed as dividends without transferring those profits to a reserve.
The following restrictions apply to our ability to declare and/or pay dividends:
(i) if the payment of the dividend would breach or cause a breach by us of applicable capital adequacy or other supervisory requirements of APRA, including the capital conservation buffer. Currently, one such requirement is that a dividend should not be paid without APRA’s prior consent if payment of that dividend, after taking into account all other dividends (if any) paid on our shares and payments on more senior capital instruments, in the preceding 12 consecutive months to which they relate, would cause the aggregate of such dividend payments to exceed our after tax earnings for the preceding 12 consecutive months, as reflected in our relevant audited consolidated financial statements; and
(ii) if, under the Banking Act 1959 (Cth), we are directed by APRA not to pay a dividend;
(iii) if the declaration or payment of the dividend would result in us becoming insolvent; or
(iv) if any interest payment, dividend, redemption payment or other distribution on certain Additional Tier 1 securities issued by the Group is not paid in accordance with the terms of those securities, we may be restricted from declaring and/or paying dividends on ordinary shares. This restriction is subject to a number of exceptions.
b) Voting rights
Holders of our fully paid ordinary shares have, at general meetings, one vote on a show of hands and, upon a poll, one vote for each fully paid share held by them.
c) Voting and re-election of Directors
Under our constitution, at each AGM one-third of eligible Directors (or if their number is not a multiple of three, the number nearest to one-third) and any other Director who has held office for three years or more since the Director’s last election, must retire from office. In determining the number of Directors to retire, no account is to be taken of a Director who holds office in order to fill a casual vacancy or the Managing Director. A retiring Director holds office until the conclusion of the meeting at which that Director retires but is eligible for re-election at the meeting.
Under the ASX Listing Rules, no Director of a listed entity, apart from the Managing Director, may continue to hold office, without offering himself or herself for re-election, past the third AGM following their appointment or three years, whichever is the longer.
Under the Corporations Act, the election or re-election of each Director by shareholders at a general meeting of a public company must proceed as a separate item, unless the shareholders first resolve that the elections or re-elections may be voted on collectively. A resolution to allow collective voting in relation to elections or re-elections is effective only if no votes are cast against that resolution. Any resolution electing or re-electing two or more Directors in contravention of this requirement is void.
| 2019 Westpac Group Annual Report | 321 |
| | |
Additional information
d) Winding up
Subject to any preferential entitlement of holders of preference shares on issue at the relevant time, holders of our ordinary shares are entitled to share equally in any surplus assets if we are wound up.
e) Sinking fund provisions
We do not have any class of shares on issue that is subject to any sinking fund provisions.
Variation of rights attaching to our shares
Under the Corporations Act, unless otherwise provided by the terms of issue of a class of shares, the terms of issue of a class of shares in Westpac can only be varied or cancelled in any way by a special resolution of Westpac and with either the written consent of our shareholders holding at least three quarters of the votes in that class of shares or with the sanction of a special resolution passed at a separate meeting of the holders of that class of shares.
Convening general meetings
Under our constitution, our Directors may convene and arrange to hold a general meeting of Westpac whenever they think fit and must do so if required to do so under the Corporations Act and ASX Listing Rules. Under the Corporations Act, our Directors must call and arrange to hold a general meeting of Westpac if requested to do so by our shareholders who hold at least 5% of the votes that may be cast at the general meeting. Shareholders who hold at least 5% of the votes that may be cast at a general meeting may also call and arrange to hold a general meeting of Westpac at their own expense.
At least 28 days notice must be given of a meeting of our shareholders. Written notice must be given to all shareholders entitled to attend and vote at the meeting. All ordinary shareholders are entitled to attend and, subject to the constitution and the Corporations Act, to vote at general meetings of Westpac.
Limitations on securities ownership
A number of limitations apply in relation to the ownership of our shares, and these are more fully described in the section ‘Limitations affecting security holders’.
Change in control restrictions
Restrictions apply under the Corporations Act, the Financial Sector (Shareholdings) Act 1998 (Cth) and the Foreign Acquisitions and Takeovers Act 1975 (Cth).
For more detailed descriptions of these restrictions, refer to the sections ‘Limitations affecting security holders’, Foreign Acquisitions and Takeovers Act 1975, Financial Sector (Shareholdings) Act 1998, and Corporations Act 2001.
Substantial shareholder disclosure
There is no provision in our constitution that requires a shareholder to disclose the extent of their ownership of our shares.
Under the Corporations Act, however, any person who begins or ceases to have a substantial holding of our shares must notify us within two business days after they become aware of that information. A further notice must be given to us if there is an increase or decrease of 1% in a person’s substantial holding. Copies of these notices must also be given to the ASX. A person has a substantial holding of our shares if the total votes attached to our voting shares in which they or their associates have relevant interests is 5% or more of the total number of votes attached to all our voting shares. For more details, refer to the section ‘Corporations Act 2001’.
We also have a statutory right under the Corporations Act to trace the beneficial ownership of our shares by giving a direction to a shareholder, or certain other persons, requiring disclosure to us of, among other things, their own relevant interest in our shares and the name and address of each other person who has a relevant interest in those shares, the nature and extent of that interest and the circumstances that gave rise to that other person’s interest. Such disclosure must, except in certain limited circumstances, be provided within two business days after the direction is received.
Australian Company and Business Numbers
All Australian companies have a unique nine-digit identifier, referred to as an Australian Company Number (ACN), which must be included on public documents, eligible negotiable instruments and the company’s common seal. In addition, entities can apply for registration on the Australian Business Register and be allocated a unique eleven-digit identifier known as an Australian Business Number (ABN). For Australian companies, the last nine digits of their ABN are identical to their ACN. The ABN may be quoted on documents in lieu of the ACN.
Our ACN is 007 457 141 and our ABN is 33 007 457 141.
Documents on display
We are subject to the disclosure requirements of the US Securities Exchange Act of 1934, as amended. In accordance with these requirements, we file Annual Reports with, and furnish other information to, the US Securities & Exchange Commission (SEC). The SEC also maintains a website at www.sec.gov that contains reports, proxy statements and other information regarding registrants that file electronically with the SEC. Since April 2002, we have filed our reports on Form 20-F and have furnished other information to the SEC in electronic format which may be accessed through this website.
322 | 2019 Westpac Group Annual Report | |
| | |
Additional information
Exchange rates
For each of the years indicated, the high, low, average and year-end noon buying rates1 for Australian dollars were:
| Year Ended 30 September |
| |
| 20202 | 2019 | 2018 | 2017 | 2016 | 2015 |
| | | | | | |
| | | (US$ per A$1.00) | | |
High | | 0.7360 | 0.8105 | 0.8071 | 0.7817 | 0.8904 |
Low | | 0.6730 | 0.7107 | 0.7174 | 0.6855 | 0.6917 |
Average3 | n/a | 0.7023 | 0.7583 | 0.7624 | 0.7385 | 0.7781 |
Close (on 30 September)4 | n/a | 0.6746 | 0.7238 | 0.7840 | 0.7667 | 0.7020 |
For each of the months indicated, the high and low noon buying rates for Australian dollars were:
| | | Month | | | |
| October | September | August | July | June | May |
| 20192 | 2019 | 2019 | 2019 | 2019 | 2019 |
| | | | | | |
| | | (US$ per A$1.00) | | |
High | 0.6764 | 0.6886 | 0.6858 | 0.7043 | 0.7009 | 0.7038 |
Low | 0.6698 | 0.6746 | 0.6730 | 0.6872 | 0.6860 | 0.6874 |
1. | The noon buying rate in New York City for cable transfers in Australian dollars as certified for customs purposes by the Federal Reserve Bank of New York. |
| |
2. | Through to 4 October 2019. On 4 October 2019, the noon buying rate was A$1.00 = US$0.6764. |
| |
3. | The average is calculated by using the average of the exchange rates on the last day of each month during the period. |
| |
4. | The noon buying rate at such date may differ from the rate used in the preparation of our consolidated financial statements at such date. Refer to Note 1(a) to the financial statements. |
| 2019 Westpac Group Annual Report | 323 |
| | |
Information for shareholders
Financial calendar
Westpac shares are listed on the securities exchanges in Australia (ASX) and New Zealand (NZX) and as American Depository Receipts in New York. Westpac Capital Notes 2, Westpac Capital Notes 3, Westpac Capital Notes 4, Westpac Capital Notes 5 and Westpac Capital Notes 6 are listed on the ASX. Westpac NZD Subordinated Notes are listed on the NZX.
Important dates to note are set out below, subject to change. Payment of any distribution, dividend or interest payment is subject to the relevant payment conditions and the key dates for each payment will be confirmed to the ASX for securities listed on the ASX.
Westpac Ordinary Shares (ASXcode: WBC, NYSEcode: WBK) |
New York ex-dividend date for final dividend | | 8 November 2019 |
Ex-dividend date for final dividend | | 12 November 2019 |
New York record date for final dividend | | 12 November 2019 |
Record date for final dividend | | 13 November 2019 |
Annual General Meeting | | 12 December 2019 |
Final dividend payable | | 20 December 2019 |
Financial Half Year end | | 31 March 2020 |
Interim results and dividend announcement | | 4 May 2020 |
New York ex-dividend date for interim dividend | | 13 May 2020 |
Ex-dividend date for interim dividend | | 14 May 2020 |
New York record date for interim dividend | | 14 May 2020 |
Record date for interim dividend | | 15 May 2020 |
Interim dividend payable | | 25 June 2020 |
Financial Year end | | 30 September 2020 |
Final results and dividend announcement | | 2 November 2020 |
New York ex-dividend date for final dividend | | 9 November 2020 |
New York record date for final dividend | | 10 November 2020 |
Ex-dividend date for final dividend | | 11 November 2020 |
Record date for final dividend | | 12 November 2020 |
Annual General Meeting | | 11 December 20201 |
Final dividend payable | | 18 December 2020 |
1. | Details regarding the location of the meeting and the business to be dealt with will be contained in a Notice of Meeting sent to shareholders in the November before the meeting. |
Westpac Capital Notes 2 (ASX code: WBCPE) | | |
Ex-date for quarterly distribution | | 12 December 2019 |
Record date for quarterly distribution | | 13 December 20191 |
Payment date for quarterly distribution | | 23 December 2019 |
Ex-date for quarterly distribution | | 12 March 2020 |
Record date for quarterly distribution | | 13 March 20201 |
Payment date for quarterly distribution | | 23 March 2020 |
Ex-date for quarterly distribution | | 12 June 2020 |
Record date for quarterly distribution | | 15 June 2020 |
Payment date for quarterly distribution | | 23 June 2020 |
Ex-date for quarterly distribution | | 14 September 2020 |
Record date for quarterly distribution | | 15 September 2020 |
Payment date for quarterly distribution | | 23 September 2020 |
Ex-date for quarterly distribution | | 14 December 2020 |
Record date for quarterly distribution | | 15 December 2020 |
Payment date for quarterly distribution | | 23 December 2020 |
1. | Adjusted to immediately preceding business day as record date falls on a non-ASX business day. |
Westpac Capital Notes 3 (ASX code: WBCPF) | | |
Ex-date for quarterly distribution | | 12 December 2019 |
Record date for quarterly distribution | | 13 December 20191 |
Payment date for quarterly distribution | | 23 December 20192 |
Ex-date for quarterly distribution | | 12 March 2020 |
Record date for quarterly distribution | | 13 March 20201 |
Payment date for quarterly distribution | | 23 March 20202 |
Ex-date for quarterly distribution | | 11 June 2020 |
Record date for quarterly distribution | | 12 June 20201 |
Payment date for quarterly distribution | | 22 June 2020 |
Ex-date for quarterly distribution | | 11 September 2020 |
Record date for quarterly distribution | | 14 September 2020 |
Payment date for quarterly distribution | | 22 September 2020 |
Ex-date for quarterly distribution | | 11 December 2020 |
Record date for quarterly distribution | | 14 December 2020 |
Payment date for quarterly distribution | | 22 December 2020 |
1. | Adjusted to immediately preceding business day as record date falls on a non-ASX business day. |
| |
2. | Adjusted to next business day as payment date falls on a non-ASX business day. |
Westpac Capital Notes 4 (ASX code: WBCPG) | | |
Ex-date for quarterly distribution | | 19 December 2019 |
Record date for quarterly distribution | | 20 December 20191 |
Payment date for quarterly distribution | | 30 December 2019 |
Ex-date for quarterly distribution | | 19 March 2020 |
Record date for quarterly distribution | | 20 March 20201 |
Payment date for quarterly distribution | | 30 March 2020 |
Ex-date for quarterly distribution | | 19 June 2020 |
Record date for quarterly distribution | | 22 June 2020 |
Payment date for quarterly distribution | | 30 June 2020 |
Ex-date for quarterly distribution | | 21 September 2020 |
Record date for quarterly distribution | | 22 September 2020 |
Payment date for quarterly distribution | | 30 September 2020 |
Ex-date for quarterly distribution | | 21 December 2020 |
Record date for quarterly distribution | | 22 December 2020 |
Payment date for quarterly distribution | | 30 December 2020 |
1. | Adjusted to immediately preceding business day as record date falls on a non-ASX business day. |
324 | 2019 Westpac Group Annual Report | |
| | |
Information for shareholders
Westpac Capital Notes 5 (ASX code: WBCPH) | | |
Ex-date for quarterly distribution | | 12 December 2019 |
Record date for quarterly distribution | | 13 December 20191 |
Payment date for quarterly distribution | | 23 December 20192 |
Ex-date for quarterly distribution | | 12 March 2020 |
Record date for quarterly distribution | | 13 March 20201 |
Payment date for quarterly distribution | | 23 March 20202 |
Ex-date for quarterly distribution | | 11 June 2020 |
Record date for quarterly distribution | | 12 June 20201 |
Payment date for quarterly distribution | | 22 June 2020 |
Ex-date for quarterly distribution | | 11 September 2020 |
Record date for quarterly distribution | | 14 September 2020 |
Payment date for quarterly distribution | | 22 September 2020 |
Ex-date for quarterly distribution | | 11 December 2020 |
Record date for quarterly distribution | | 14 December 2020 |
Payment date for quarterly distribution | | 22 December 2020 |
1. | Adjusted to immediately preceding business day as record date falls on a non-ASX business day or a date on which banks are not open for general business in Sydney. |
| |
2. | Adjusted to next business day as payment date falls on a non-ASX business day or a date on which banks are not open for general business in Sydney. |
Westpac Capital Notes 6 (ASX code: WBCPI) | | |
Ex-date for quarterly distribution | | 9 December 2019 |
Record date for quarterly distribution | | 10 December 2019 |
Payment date for quarterly distribution | | 18 December 2019 |
Ex-date for quarterly distribution | | 9 March 2020 |
Record date for quarterly distribution | | 10 March 2020 |
Payment date for quarterly distribution | | 18 March 2020 |
Ex-date for quarterly distribution | | 9 June 2020 |
Record date for quarterly distribution | | 10 June 2020 |
Payment date for quarterly distribution | | 18 June 2020 |
Ex-date for quarterly distribution | | 9 September 2020 |
Record date for quarterly distribution | | 10 September 2020 |
Payment date for quarterly distribution | | 18 September 2020 |
Ex-date for quarterly distribution | | 9 December 2020 |
Record date for quarterly distribution | | 10 December 2020 |
Payment date for quarterly distribution | | 18 December 2020 |
Westpac NZD Subordinated Notes (NZX code: WBC010) |
Ex-date for quarterly interest payment | | 20 November 2019 |
Record date for quarterly interest payment | | 21 November 2019 |
Payment date for quarterly interest payment | | 2 December 20191 |
Ex-date for quarterly interest payment | | 19 February 2020 |
Record date for quarterly interest payment | | 20 February 2020 |
Payment date for quarterly interest payment | | 2 March 20201 |
Ex-date for quarterly interest payment | | 21 May 2020 |
Record date for quarterly interest payment | | 22 May 2020 |
Payment date for quarterly interest payment | | 2 June 20201 |
Ex-date for quarterly interest payment | | 20 August 2020 |
Record date for quarterly interest payment | | 21 August 20202 |
Payment date for quarterly interest payment | | 1 September 2020 |
Ex-date for quarterly interest payment | | 19 November 2020 |
Record date for quarterly interest payment | | 20 November 20202 |
Payment date for quarterly interest payment | | 1 December 2020 |
1. | Adjusted to next business day as payment date does not fall on a day on which banks are open for general business in Wellington and Auckland, New Zealand and Sydney, Australia. |
| |
2. | Adjusted to immediately preceding business day as record date falls on a date on which banks are not open for general business in Wellington and Auckland, New Zealand and Sydney, Australia. |
Annual General Meeting
The Westpac Annual General Meeting (AGM) will be held in the International Convention Centre, 14 Darling Drive, Sydney, on Thursday, 12 December 2019. The AGM will commence at 10.00am (Sydney time) and shareholder registration will open at 9:00am (Sydney time).
The AGM will be webcast live on Westpac’s website at www.westpac.com.au/investorcentre and an archived version of the webcast will be available on the website for viewing at a later time.
| 2019 Westpac Group Annual Report | 325 |
| | |
Information for shareholders
Useful information
Key sources of information for shareholders
We report our full year performance to shareholders, in late October or early November, in the following forms: an Annual Review & Sustainability Report; an Annual Report; a Sustainability Performance Report; an Investor Discussion Pack and earnings releases.
Electronic communications
Shareholders can elect to receive the following communications electronically:
· | Annual Review & Sustainability Report and Annual Report; |
| |
· | Dividend statements when paid by direct credit or via Westpac’s Dividend Reinvestment Plan (DRP); |
| |
· | Notices of Meetings and proxy forms; and |
| |
· | Major company announcements. |
Opt for electronic communications by logging into Westpac’s Share Registrar’s Investor Centre at www. linkmarketservices.com.au.
Australia
Westpac’s website www.westpac.com.au provides information for shareholders and customers, including:
· | access to internet banking and online investing services; |
| |
· | details on Westpac’s products and services; |
| |
· | company history, results, market releases and news; and |
| |
· | corporate responsibility and Westpac in the community activities. |
Investors can access the Investor Centre at www.westpac.com.au/investorcentre. The Investor Centre includes the current Westpac share price and links to the latest ASX announcements and Westpac’s Share Registrars’ websites.
New Zealand
Westpac’s New Zealand website www.westpac.co.nz provides:
· | access to internet banking services; |
| |
· | details on products and services; |
| |
· | economic updates, news and information, key financial results; and |
| |
· | sponsorships and other community activities. |
Westpac Investor Relations
Information other than that relating to your shareholding can be obtained from:
· | Westpac Investor Relations |
| 275 Kent Street |
| Sydney NSW 2000 Australia |
| Telephone: +61 2 8253 3143 |
| Facsimile: +61 2 8253 1207 |
| Email: investorrelations@westpac.com.au |
Westpac ordinary shares are listed on:
· | Australian Securities Exchange (code WBC); |
| |
· | New York Stock Exchange (NYSE), as American Depositary Shares (code WBK); and |
| |
· | New Zealand Exchange Limited (code WBC). |
Shareholders can check and update their information in Westpac’s Share Registrars’ online Investor Centres, see details below. In Australia, broker sponsored holders must contact their broker to amend their address.
Australia – Ordinary shares on the main register, Westpac Capital Notes 2, Westpac Capital Notes 3, Westpac Capital Notes 4, Westpac Capital Notes 5 and Westpac Capital Notes 6
Link Market Services Limited
Level 12, 680 George Street
Sydney NSW 2000
Postal address: Locked Bag A6015, Sydney South NSW 1235, Australia
www.linkmarketservices.com.au
Shareholder enquiries:
Telephone: 1800 804 255 (toll free within Australia)
International: +61 1800 804 255
Facsimile: +61 2 9287 0303
Email: westpac@linkmarketservices.com.au
New Zealand – Ordinary shares on the New Zealand Branch register and Westpac NZD Subordinated Notes
Link Market Services Limited
Level 11, Deloitte Centre
80 Queen Street
Auckland 1010, New Zealand
Postal address: P.O. Box 91976, Auckland 1142, New Zealand
www.linkmarketservices.co.nz
Shareholder enquiries:
Telephone: 0800 002 727 (toll free within New Zealand)
International: +64 9 375 5998
Facsimile: +64 9 375 5990
Email: enquiries@linkmarketservices.co.nz
Depositary in USA for American Depositary Shares1
Listed on New York Stock Exchange (CUSIP 961214301) BNY Mellon Shareowner Services
PO Box 505000
Louisville, KY 40233-5000, USA
https://www-us.computershare.com/investor
American Depositary Shares holder enquiries:
Telephone: 1-888-269-2377 (toll free in USA)
International: +1 201 680 6825
Email: shrrelations@bnymellon.com
1. Each ADS represents one fully paid ordinary share.
326 | 2019 Westpac Group Annual Report | |
| | |
Glossary of abbreviations and defined terms
AAS | Australian Accounting Standards |
AASB | Australian Accounting Standards Board |
ABS | Asset-backed securities |
ACCC | Australian Competition and Consumer Commission |
ADI | Authorised Deposit-taking Institution |
ADRs | American Depositary Receipts |
ADS | American Depositary Shares |
Advanced IRB | Advanced Internal Ratings Based |
AGM | Annual General Meeting |
AIRB | Advanced Internal Ratings Based |
ALCO | Westpac Asset and Liability Committee |
ALM | Asset and Liability Management |
AMA | Advanced Measurement Approach |
ANZSIC | Australian and New Zealand Standard Industrial Classification |
APRA | Australian Prudential Regulation Authority |
ASIC | Australian Securities and Investments Commission |
ASX | Australian Securities Exchange |
ASXCGC | ASX Corporate Governance Council |
AT1 | Additional Tier 1 |
ATMs | Automatic teller machines |
ATO | Australian Taxation Office |
AUSTRAC | Australian Transaction Reports and Analysis Centre |
BAC | Board Audit Committee |
BankSA | Bank of South Australia |
BBSW | Bank Bill Swap Reference Rate |
BCBS | Basel Committee on Banking Supervision |
bps | Basis points |
BRCC | Board Risk & Compliance Committee |
BTFG | BT Financial Group (Australia) |
CAGR | Compound annual growth rate |
CAPs | Collectively assessed provisions |
Cash EPS | Cash earnings per share |
CCB | Capital Conservation Buffer |
CDS | Credit default swap |
CEO | Chief Executive Officer |
CEOPP | Chief Executive Officer Performance Plan |
CEO RSP | Chief Executive Officer Restricted Share Plan |
CET1 | Common Equity Tier 1 |
CFO | Chief Financial Officer |
CFTC | Commodity Futures Trading Commission |
CGU | Cash Generating Unit |
CHF | Swiss franc |
CLF | Committed Liquidity Facility |
Corporations Act | Corporations Act 2001 (Cth) |
COSO | Committee of Sponsoring Organizations of the Treadway Commission |
CPM | Credit Portfolio Management |
CRG | Customer Risk Grade |
CRO | Chief Risk Officer |
CRS | Common Reporting Standard |
CVA | Credit valuation adjustment |
DFAT | Department of Foreign Affairs and Trade |
DRP | Dividend Reinvestment Plan |
D-SIB | Domestic Systemically Important Banks |
EAD | Exposure at default |
ECL | Expected credit loss |
EPS | Earnings per share |
ESG | Environmental, social and governance |
ESP | Employee Share Plan |
FBT | Fringe benefits tax |
FCA | Financial Conduct Authority |
FCS | Financial Claims Scheme |
FMA | Financial Markets Authority |
FSB | Financial Stability Board |
FTE | Full time equivalent employees |
FUA | Funds under administration |
FUM | Funds under management |
FVA | Funding Valuation Adjustment |
FX | Foreign Exchange |
GHG | Greenhouse gas |
G-SIBs | Global Systemically Important Banks |
| 2019 Westpac Group Annual Report | 327 |
| | |
Glossary of abbreviations and defined terms
Hastings | Hastings Funds Management Limited |
HKMA | Hong Kong Monetary Authority |
IAPs | Individually Assessed Provisions |
IASB | International Accounting Standards Board |
ICAAP | Internal Capital Adequacy Assessment Process |
IFRS | International Financial Reporting Standards |
IMF | International Monetary Fund |
IOSCO | International Organization of Securities Commission |
IRRBB | Interest Rate Risk in the Banking Book |
IRS | Internal Revenue Service |
ISDA | International Swaps and Derivatives Association |
KMP | Key Management Personnel |
LCR | Liquidity Coverage Ratio |
LGBTIQ+ | Lesbian, gay, bisexual, transgender, intersex and queer |
LGD | Loss given default |
LIBOR | London InterBank Offer Rate |
LMI | Lenders mortgage insurance |
LTIFR | Lost Time Injury Frequency Rate |
LTVR | Long Term Variable Reward |
LVR | Loan to value ratio |
Moody’s | Moody’s Investors Service |
NaR | Net interest income-at-risk |
NII | Net interest income |
NYSE | New York Stock Exchange |
NSFR | Net Stable Funding Ratio |
NZX | New Zealand Exchange Limited |
OBR | Open Bank Resolution |
OCC | Office of the Comptroller of the Currency |
OFAC | Office of Foreign Assets Control |
OTC | Over the counter |
PD | Probability of default |
PFIC | Passive foreign investment company |
PNG | Papua New Guinea |
RAMS | RAMS Home Loans |
RBA | Reserve Bank of Australia |
RBNZ | Reserve Bank of New Zealand |
RISKCO | Westpac Group Executive Risk Committee |
RMBS | Residential Mortgage Backed Securities |
ROE | Return on equity |
Cash ROE | Return on equity on a cash earnings basis |
RSP | Restricted Share Plan |
RWA | Risk-weighted assets |
S&P | Standard & Poor’s |
SEC | US Securities and Exchange Commission |
SME | Small to medium enterprises |
SOx | Sarbanes-Oxley Act of 2002 |
STVR | Short Term Variable Reward |
TCE | Total committed exposures |
TLAC | Total Loss Absorbing Capacity |
TSR | Total Shareholder Return |
UK | United Kingdom |
UKSS | Westpac Banking Corporation UK Staff Superannuation Scheme |
UNSC | United Nations Security Council |
US | United States |
VaR | Value at Risk |
VWAP | Volume weighted average price |
Westpac CPS | Westpac Convertible Preference Shares |
WGP | Westpac Group Plan |
WHS | Workplace Health and Safety |
WIB | Westpac Institutional Bank |
WNZL | Westpac New Zealand Limited |
WNZS | Westpac New Zealand Superannuation Scheme |
WPP | Westpac Performance Plan |
WRP | Westpac Reward Plan |
WSNZL | Westpac Securities NZ Limited |
328 | 2019 Westpac Group Annual Report | |
| | |
Item 19. Exhibits Index
Copies of any instrument relating to the long-term debt of Westpac Banking Corporation that is not being attached as an exhibit to this Annual Report on Form 20-F and which does not exceed 10% of the total consolidated assets of Westpac Banking Corporation will be furnished to the SEC upon request.
| 2019 Westpac Group Annual Report | 329 |
| | |
Signatures
The registrant hereby certifies that it meets all of the requirements for filing on Form 20-F and that it has duly caused and authorised the undersigned to sign this Annual Report on its behalf.
WESTPAC BANKING CORPORATION
By: /s/ Michael Clayton
Michael Clayton
General Counsel – Corporate, Treasury & Technology
Dated November 4, 2019
