EXHIBIT 1
Pillar 3 report Table of contents |
| Structure of Pillar 3 report | |
| Executive summary | 3 |
| Introduction | 6 |
| Risk appetite and risk types | 7 |
| Controlling and managing risk | 8 |
| Group structure | 14 |
| Capital overview | 16 |
| Leverage ratio | 21 |
| Credit risk management | 23 |
| Credit risk exposures | 33 |
| Credit risk mitigation | 57 |
| Counterparty credit risk | 59 |
| Securitisation | 62 |
| Market risk | 72 |
| Interest rate risk in the banking book | 76 |
| Operational risk | 78 |
| Equity risk | 80 |
| Funding and liquidity risk management | 82 |
| Liquidity coverage ratio | 83 |
| Net stable funding ratio | 84 |
| Appendices | |
| Appendix I – Regulatory capital reconciliation | 86 |
| Appendix II – Entities included in regulatory consolidation | 92 |
| Appendix III – Level 3 entities’ assets and liabilities | 95 |
| Appendix IV – Regulatory expected loss | 96 |
| Appendix V – APS330 quantitative requirements | 97 |
| Glossary | 100 |
| Disclosure regarding forward-looking statements | 105 |
In this report references to ‘Westpac’, ‘Westpac Group’, ‘the Group’, ‘we’, ‘us’ and ‘our’ are to Westpac Banking Corporation and its controlled entities (unless the context indicates otherwise).
In this report, unless otherwise stated or the context otherwise requires, references to '$', 'AUD' or 'A$' are to Australian dollars.
Any discrepancies between totals and sums of components in tables contained in this report are due to rounding.
In this report, unless otherwise stated, disclosures reflect the Australian Prudential Regulation Authority’s (APRA) implementation of Basel III.
Information contained in or accessible through the websites mentioned in this report does not form part of this report unless we specifically state that it is incorporated by reference and forms part of this report. All references in this report to websites are inactive textual references and are for information only.
| 2| Westpac Group March 2020 Pillar 3 report |  |
Pillar 3 report Executive summary |
Key capital ratios
| 31 March 2020 | 30 September 2019 | 31 March 2019 | |
| Level 2 Regulatory capital structure | |||
| Common equity Tier 1 capital after deductions $m | 47,982 | 45,752 | 44,680 |
| Risk weighted assets (RWA) $m | 443,905 | 428,794 | 419,819 |
| Common equity Tier 1 capital ratio % | 10.81 | 10.67 | 10.64 |
| Additional Tier 1 capital ratio % | 2.13 | 2.17 | 2.20 |
| Tier 1 capital ratio % | 12.94 | 12.84 | 12.84 |
| Tier 2 capital % | 3.35 | 2.79 | 1.78 |
| Total regulatory capital ratio % | 16.29 | 15.63 | 14.62 |
| APRA leverage ratio % | 5.66 | 5.68 | 5.72 |
| Level 1 Regulatory capital structure | |||
| Common equity Tier 1 capital after deductions ($m) | 48,482 | 46,380 | 43,850 |
| Risk weighted assets (RWA) ($m) | 437,137 | 422,475 | 409,231 |
| Level 1 Common equity Tier 1 capital ratio % | 11.09 | 10.98 | 10.72 |
CET1 capital ratio movement for First Half 2020
Westpac’s CET1 capital ratio was 10.81% at 31 March 2020. The CET1 ratio was 14 basis points higher than 30 September 2019 reflecting the institutional placement and share purchase plan (which together raised $2.8 billion of capital) and earnings for the half, partially offset by payment of the final 2019 dividend and higher RWA.
Cash earnings for First Half 2020 were $993 million (22 basis point increase). Cash earnings included additional impairment charges of $1,107 million after tax in anticipation of credit losses that Westpac expects to incur from the COVID-19 pandemic. The net impact to the CET1 capital ratio of the increased impairment provisions related to COVID-19 is an 11 basis point decrease reflecting the impact to cash earnings, the reduction in regulatory expected loss deduction to nil and a higher deduction for deferred tax assets. Cash earnings were also impacted by Notable Items ($1,285 million after tax) relating to provisions and costs associated with the AUSTRAC proceedings and an increase in provisions for estimated customer refunds, payments, associated costs and litigation (29 basis point impact)1.
CET1 movement – First Half 2020
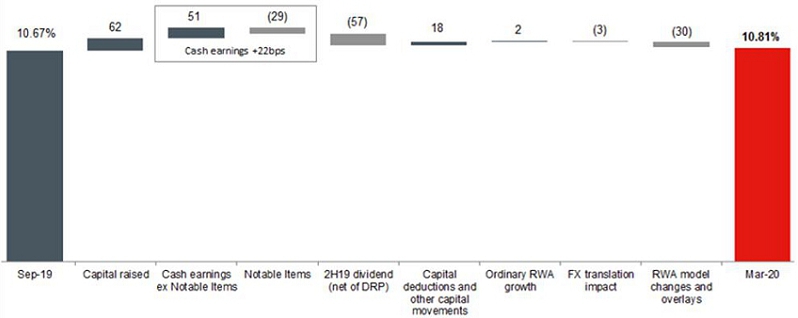
Key movements over the half were as follows:
| l | Capital raised totalling $2.8 billion over the half (62 basis point increase); |
| l | First Half 2020 cash earnings, including notable items (22 basis point increase); |
| l | The 2019 final dividend payment, net of the dividend reinvestment plan (DRP) share issuance (57 basis point decrease); |
| l | Capital deductions and other capital movements (18 basis point increase). This mainly reflects the impact of increased impairment provisions related to COVID-19, which reduced the regulatory expected loss deduction to nil (25 basis point increase) and a higher deduction for deferred tax assets (13 basis point decrease). Other capital items increased 6 basis points primarily driven by movements in fair value on economic hedges recognised in net profit; |
| 1 | Notable Items impacting cash earnings for First Half 2020 includes the provision for AUSTRAC and related matters, additional provisions for estimated customer refunds, payments and associated costs and litigation. |
| | Westpac Group March 2020 Pillar 3 report |3 |
Pillar 3 report Executive summary |
| l | Ordinary RWA growth (before model changes, overlays and foreign currency translation) decreased slightly over the period (2 basis point increase); and |
| l | Foreign currency impacts from the appreciation of the NZ$ against the A$ (3 basis point decrease)1. |
RWA model changes and overlays increased RWA $12.3 billion leading to a 30 basis point decrease in the CET1 capital ratio. This was primarily driven by:
| l | Operational Risk capital overlay of $500 million imposed by APRA following AUSTRAC’s Statement of Claim (15 basis point decrease, $6.25 billion increase in RWA); |
| l | An increase in IRRBB capital from plans to implement a new IRRBB model more suited to low interest rates. Until the model is finalised and approved, Westpac will include an IRRBB capital overlay of $500 million (15 basis point decrease, $6.25 billion increase in RWA); |
| l | Adoption of AASB 16 Leases methodology from 1 October 2019 in other assets risk calculation (8 basis point decrease, $3.3 billion increase in RWA); and |
| l | Model changes for a segment of the Australian mortgage portfolio and also New Zealand mortgages (8 basis point increase, $3.5 billion decrease in RWA). |
Risk Weighted Assets (RWA)
| $m | 31 March 2020 | 30 September 2019 | 31 March 2019 |
| Risk weighted assets at Level 2 | |||
| Credit risk | 369,142 | 367,864 | 362,762 |
| Market risk | 8,396 | 9,350 | 8,338 |
| Operational risk | 54,093 | 47,680 | 38,641 |
| Interest rate risk in the banking book (IRRBB) | 5,305 | 530 | 7,076 |
| Other | 6,969 | 3,370 | 3,002 |
| Total RWA | 443,905 | 428,794 | 419,819 |
| Total Exposure at Default | 1,089,104 | 1,054,178 | 1,029,817 |
Total RWA increased $15.1 billion or 3.5% this half mainly driven by an increase in non-credit risk RWA.
The $1.3 billion increase in credit risk RWA included:
| l | A $1.1 billion increase in RWA from changes in asset quality within Australian mortgages including higher consumer delinquencies; |
| l | Lower lending primarily within retail products, which decreased RWA by $1.2 billion; |
| l | Model changes detailed above which reduced RWA by $3.5 billion; |
| l | Foreign currency translation impacts which increased RWA by $3.9 billion from the appreciation of the US$ and NZ$ against the A$ mainly impacting corporate and NZ mortgages; and |
| l | An increase in mark-to-market related credit risk and counterparty credit risk RWA of $1.0 billion mostly within corporate exposures. |
A $13.8 billion increase in non-credit RWA mostly from the impact of the capital overlays and the adoption of AASB 16 detailed above. These were partly offset by a $1.0 billion decrease in market risk RWA and a higher embedded gain from lower interest rates in IRRBB RWA.
Additional Tier 1 and Tier 2 capital movement for First Half 2020
During the half, Westpac Issued US $1.5 billion of Tier 2 capital instruments (49 basis point increase) and redeemed CNY 1.25 billion of Tier 2 capital instruments (6 basis point decrease). The higher new issuance was in response to APRA’s increased total capital requirements to be met by 1 January 2024.
Exposure at Default
Exposure at default (EAD) increased $34.9 billion (or 3.3%) over the half, primarily due to higher sovereign exposures associated with increased levels of liquidity.
Leverage Ratio
The leverage ratio represents the amount of Tier 1 capital relative to exposure2. At 31 March 2020, Westpac’s leverage ratio was 5.66%, down 2 basis points since 30 September 2019.
| 1 | Reflecting the net impact of movements in the foreign currency translation reserve and RWA |
| 2 | As defined under Attachment D of APS110: Capital Adequacy. |
| 4| Westpac Group March 2020 Pillar 3 report | |
Pillar 3 report Executive summary |
Liquidity Coverage Ratio (LCR)
Westpac’s LCR for 31 March 2020 calculated on a spot basis was 154% (31 December 2019: 130%). The inclusion of Westpac’s allowance of the Term Funding Facility (TFF) added 14 percentage points to the ratio. Other movements in the Group’s LCR reflect an increase in HQLA by $31.1 billion over the half, while net cash outflows (NCOs) increased by $10.2 billion. Westpac’s average LCR for the quarter was 140%1(31 December 2019: 132%).
Net Stable Funding Ratio (NSFR)
Westpac had an NSFR of 117%2at 31 March 2020 (31 December 2019: 112%). The inclusion of Westpac’s allowance of the TFF added 2 percentage points to the ratio. Other movements in the Group’s NSFR over the half mainly reflect a $21 billion increase in available stable funding, due to deposits (up $9 billion), wholesale funding (up $9 billion) and other (up $3 billion). Required stable funding increased by $2 billion excluding the impact of the TFF.
| 1 | Calculated as a simple average of the daily observations over the quarter. |
| 2 | Calculated as total available stable funding divided by total required stable funding as at end of the quarter. |
| | Westpac Group March 2020 Pillar 3 report |5 |
Pillar 3 report Introduction |
Westpac Banking Corporation is an Authorised Deposit-taking Institution (ADI) subject to regulation by APRA. APRA has accredited Westpac to apply advanced models permitted by the Basel III global capital adequacy regime to the measurement of its regulatory capital requirements. Westpac uses the Advanced Internal Ratings-Based approach (Advanced IRB) for credit risk and the Advanced Measurement Approach (AMA) for operational risk.
In accordance with APS330 Public Disclosure, financial institutions that have received this accreditation, such as Westpac, are required to disclose prudential information about their risk management practices on a semi-annual basis. A subset of this information must be disclosed quarterly.
This report describes Westpac’s risk management practices and presents the prudential assessment of Westpac’s capital adequacy as at 31 March 2020.
In addition to this report, the regulatory disclosures section of the Westpac website1 contains the reporting requirements for:
| l | Capital instruments under Attachment B of APS330; and |
| l | The identification of potential Global-Systemically Important Banks (G-SIB) under Attachment H of APS330 (disclosed annually). |
Capital instruments disclosures are updated when:
| l | A new capital instrument is issued that will form part of regulatory capital; or |
| l | A capital instrument is redeemed, converted into CET1 capital, written off, or its terms and conditions are changed. |
| 1 | http://www.westpac.com.au/about-westpac/investor-centre/financial-information/regulatory-disclosures/ |
| 6| Westpac Group March 2020 Pillar 3 report | |
Pillar 3 report Risk appetite and risk types |
Westpac’s appetite for risk is informed by our strategic objectives and business plans, regulatory rules and ratios, and the potential for adverse outcomes that result in material impacts on our customers, our staff, our reputation, our regulatory relationships and/or our financial position including the potential for capital and liquidity ratios to fall below target levels in stressed scenarios.
Westpac distinguishes between different types of financial and non-financial risk and takes an integrated approach toward identifying, assessing and managing risks. The annual review of Westpac’s Risk Management Framework, which includes the Risk Management Strategy and Risk Appetite Statement, together with the establishment and monitoring of key controls through supporting frameworks and policies all play vital roles.
Overview of key risk types
| l | governance – the risk that the right information does not get to the right people or governance fora in the right format and timeframe to empower decision making. It is driven by organisational structures and relationships including between the Board, management, its shareholders and other stakeholders, which leads to deficient decision making, poor accountability and ineffective structures and processes; |
| l | risk culture – the risk that our culture does not promote and reinforce behavioural expectations or structures to identify, understand, discuss and act on risks. This leads to ineffective risk management, poor risk awareness, risk-taking outside of risk appetite that is tolerated and a culture where key learnings are not integrated into Group-wide and customer outcomes, impeding continuous improvement; |
| l | strategic – the risks arising from key elements of the strategic objectives and business plans; |
| l | capital adequacy – the risk that the firm has an insufficient level or composition of capital to support its normal business activities and to meet its regulatory capital requirements under normal operating environments or stressed conditions (both actual and as defined for internal planning or regulatory testing purposes). This includes the risk from Westpac’s pension plans; |
| l | credit – the risk of financial loss where a customer or counterparty fails to meet their financial obligations to Westpac; |
| l | funding and liquidity – the risk that Westpac cannot meet its payment obligations or that it does not have the appropriate amount, tenor and composition of funding and liquidity to support its assets; |
| l | market – the risk of an adverse impact on earnings resulting from changes in market factors, such as foreign exchange rates, interest rates, commodity prices and equity prices. This includes interest rate risk in the banking book - the risk to interest income from a mismatch between the duration of assets and liabilities that arises in the normal course of business activities; |
| l | operational – the risk of loss resulting from inadequate or failed internal processes, people and systems or from external events. This definition includes legal and regulatory risk but excludes strategic risk; |
| l | conduct and compliance – the risk of failing to abide by compliance obligations required of us or otherwise failing to have behaviours and practices that deliver suitable, fair and clear outcomes for our customers and that support market integrity; |
| l | cyber – the potential for loss or harm to the business and stakeholders related to the use of technology; and |
| l | reputational - the risk that an action, inaction, transaction, investment or event will reduce trust in Westpac’s integrity and competence by clients, counterparties, investors regulators, employees or the public. |
| | Westpac Group March 2020 Pillar 3 report |7 |
Pillar 3 report Controlling and managing risk |
We have adopted the Three Lines of Defence model to aid in holistic end-to-end management of risk, within which all employees play an active role. This necessitates co-operation between businesses and functions, such that there are no gaps in risk coverage. Effective risk management enables:
| l | accurate measurement of our risk profile and to balance risk and reward within our risk appetite, optimising financial growth opportunities and mitigating potential loss or damage; |
| l | protection of Westpac’s depositors, policyholders, and investors by maintaining a balance sheet with sound credit quality and buffers over regulatory minimums; |
| l | delivery of suitable, fair, clear and transparent outcomes for our customers that support market integrity; |
| l | embedment of adequate controls to guard against excessive risk or undue risk concentration; and |
| l | delivery of our regulatory and compliance obligations. |
The Board is responsible for approving Westpac’s risk management framework, Risk Management Strategy and Risk Appetite Statement and for monitoring the effectiveness of risk management by Westpac.
The Board has delegated to the Board Risk & Compliance Committee responsibility for establishing a view of the Group’s current and future risk position relative to its risk appetite and capital strength; review and approval of certain frameworks and policies for managing risk; and review and, where appropriate, approval of risks which may be beyond the approval discretion provided to management.
Risk management governance structure as at 31 March 2020
| Board | l | approves our risk management framework, Risk Management Strategy and Risk Appetite Statement; and |
| l | makes an annual declaration to APRA on risk management. | |
| Board Risk & Compliance Committee (BRCC) | l | assists the Board to consider and approve the Westpac’s overall risk framework for managing financial and non-financial risks; |
| l | reviews and recommends the Westpac Group Risk Management Framework, Risk Management Strategy and Risk Appetite Statement to the Board for approval on an annual basis; | |
| l | reviews and monitors Westpac’s risk profile and controls consistent with the Westpac Risk Appetite Statement; | |
| l | reviews and approves material frameworks, and policies for managing risk; | |
| l | reviews and approves the limits and conditions that apply to credit risk approval authority delegated to the CEO, CFO, CRO and any other officers of Westpac to whom the Board has delegated credit approval authority; | |
| l | monitors changes anticipated for the economic and business environment including consideration of emerging risks, and other factors considered relevant to our risk profile and risk appetite; | |
| l | assists the Board to make its annual declaration to APRA on risk management under APRA prudential standard CPS220 Risk Management; | |
| l | reviews and where appropriate approves risks beyond the approval discretion provided to management; and | |
| l | assists the Board to oversee compliance management within Westpac. | |
| From the perspective of specific types of risk, the Board Risk & Compliance Committee’s role includes: | ||
| l | credit risk – approving key policies and limits supporting the Credit Risk Management Framework, and monitoring the risk profile, performance and management of our credit portfolio; | |
| l | liquidity risk – approving key policies and limits supporting the Liquidity Risk Management Framework, including our annual funding strategy, recovery and resolution plans and monitoring the liquidity position and requirements; | |
| 8| Westpac Group March 2020 Pillar 3 report | |
Pillar 3 report Controlling and managing risk |
Risk management governance structure (continued)
| l | market risk – approving key policies and limits supporting the Market Risk Management Framework and monitoring the market risk profile; | |
| l | operational risk – approving key policies supporting the Operational Risk Management Framework, and monitoring the performance of operational risk management and controls; | |
| l | conduct risk – reviewing and approving the Westpac Group Conduct Framework and reviewing and monitoring the performance of conduct risk management and controls; | |
| l | reputation risk – reviewing and approving the Reputation Risk Management Framework, and reviewing and monitoring the performance of reputation risk management and controls; and | |
| l | compliance risk – reviewing and approving the Westpac Group Compliance Management Framework and Financial Crime Risk Management Framework, supporting policies and standards and monitoring the performance of compliance and financial crime risk management and controls. | |
| The Board Risk & Compliance Committee also: | ||
| l | oversees and approves the Internal Capital Adequacy Assessment Process and in doing so reviews the outcomes of Westpac’s stress testing, sets the target capital ranges for regulatory capital and reviews and monitors capital levels for consistency with Westpac’s risk appetite; | |
| l | provides relevant periodic assurances and reports (as appropriate) to the Board Audit Committee; | |
| l | reviews and approves other risk management frameworks1 and the monitoring of performance under those frameworks (as appropriate); | |
| l | forms a view on Westpac’s risk culture and oversees the identification of, and steps taken to address, any desirable changes to risk culture and periodically reports to the Board; | |
| l | refers to the Board or any other Board Committees relevant matters that come to the attention of the Board Risk & Compliance; and | |
| l | in its capacity as the Westpac Group’s US Risk Committee, oversees the key risks, risk management framework and policies of Westpac’s US operations. | |
| Board Committees with a Risk Focus | Board Audit Committee (BAC) | |
| l | oversees the integrity of financial statements and financial reporting systems and matters relating to taxation risks. | |
| Board Financial Crime Committee (BFC) | ||
| l | oversees the implementation of Westpac’s Financial Crime Strategic Plan, the program of work established to support this Plan and the appointment of external experts to conduct independent reviews. | |
| Board Remuneration Committee (BRC) | ||
| l | oversees remuneration policies and practices of Westpac, in the context that these policies and practices reflect Westpac’s risk management framework, including making recommendations to the Board for the adjustment of variable components of remuneration for relevant employees including as a result of risk or compliance failures. | |
| Board Technology Committee (BTC) | ||
| l | oversees the implementation of Westpac’s technology strategy, including risks associated with major technology programs. | |
| 1 | Additional frameworks include the Equity Risk Management Framework, Related Entity Risk Management Framework, and Insurance Risk Management Framework. |
| | Westpac Group March 2020 Pillar 3 report |9 |
Pillar 3 report Controlling and managing risk |
Risk management governance structure (continued)
| Executive Team | Westpac Executive Team (ET) | |
| l | executes the Board-approved strategy; | |
| l | delivers Westpac’s various strategic and performance goals within the approved risk appetite; | |
| l | approves position statements that guide Westpac’s response to sustainability issues; and | |
| l | monitors key risks within each business unit, capital adequacy and Westpac’s reputation. | |
| Executive risk committees | Westpac Group Executive Risk Committee (RISKCO) | |
| l | leads the management and oversight of material risks across Westpac within the context of the risk appetite approved by the Board; | |
| l | monitors the effectiveness of the Risk Management Framework and the execution of the Risk Management Strategy; | |
| l | monitors and reviews Westpac’s risk profile for all identified material risks; | |
| l | shapes and promotes a strong risk culture; and | |
| l | identifies emerging risks and allocates responsibility for assessing impacts and implementing appropriate actions to address these. | |
| Westpac Group Asset & Liability Committee (ALCO) | ||
| l | leads the optimisation of funding and liquidity risk-reward across Westpac; | |
| l | reviews the level and quality of capital to ensure that it is commensurate with Westpac’s risk profile, business strategy and risk appetite; | |
| l | oversees the Liquidity Risk Management Framework and key policies; | |
| l | oversees the funding and liquidity risk profile and balance sheet risk profile; and | |
| l | identifies emerging funding and liquidity risks and appropriate actions to address these. | |
| Westpac Group Credit Risk Committee (CREDCO) | ||
| l | reviews and oversees the Credit Risk Management Framework and key supporting policies; | |
| l | oversees Westpac’s credit risk profile; and | |
| l | identifies emerging credit risks, allocates responsibility for assessing impacts, and responds as appropriate. | |
| Westpac Group Market Risk Committee (MARCO) | ||
| l | reviews and monitors the Market Risk, and Insurance Risk Management Frameworks and key market risk management policies; | |
| l | reviews policies and limits for managing traded and non-traded market risk; and | |
| l | reviews and monitors the market risk, equity risk and insurance risk profile. | |
| Westpac Group Operational Risk Committee (OPCO) | ||
| l | reviews and monitors the Operational Risk Management Framework and the Compliance and Conduct Risk Management Framework, and reviews and approves key supporting policies; | |
| l | monitors Westpac’s operational risk profile; and | |
| l | identifies emerging operational, compliance and conduct risks, and appropriate actions to address these. | |
| 10| Westpac Group March 2020 Pillar 3 report | |
Pillar 3 report Controlling and managing risk |
Risk management governance structure (continued)
| Westpac Group Remuneration Oversight Committee (ROC) | ||
| l | supporting the CEO, BRC and the Board by reviewing and approving remuneration frameworks, guidelines and short term variable reward plans underpinning the Board-approved Westpac Group Remuneration Policy from a Human Resources, Risk (including Compliance), Finance and Legal perspective and in line with external requirements; | |
| l | assisting the BRC and the Board in fulfilling its responsibility to oversee remuneration policies and practices of Westpac in the context that these policies and practices fairly and responsibly reward individuals having regard to customer and shareholder interests, long term financial soundness and prudent risk management; | |
| l | recommending to the CEO for recommendation to the BRC remuneration arrangements for Responsible Persons, risk and financial control employees, Material Risk Takers and other individuals whose activities may impact the financial soundness of Westpac below the Group Executive level; and | |
| l | recommending to the CEO for recommendation to the BRC the criteria and rationale for determining the total quantum of Westpac’s variable reward pool. | |
| Prudential Reporting and Compliance Committee | ||
| l | oversees from a Group-wide perspective, Westpac’s compliance with prudential requirements and regulatory reporting; | |
| l | oversees the effective management of prudential compliance breaches, incidents or issues including remediation actions; and | |
| l | monitors and reviews ongoing prudential governance activities, including changes to prudential standards. | |
| Reputation Risk Committee | ||
| l | reviews issues with material reputation risk that arise in the operations of Westpac’s business to mitigate reputation risk and detrimental customer impacts. | |
| Westpac Group Financial Crime Risk Committee | ||
| l | oversees Anti-Money Laundering and Counter-Terrorism Financing, Anti-Bribery and Corruption, Sanctions and Tax Transparency within the context of the risk appetite approved by the Board; | |
| l | reviews and monitors the Financial Crime Risk Management Framework, key supporting policies, programs and standards; | |
| l | review and track key Regulator (AUSTRAC) commitments and communications; | |
| l | monitors and oversees Westpac’s financial crime risk profile; and | |
| l | identifies emerging financial crime risks, and appropriate actions to address these. | |
| | Westpac Group March 2020 Pillar 3 report |11 |
Pillar 3 report Controlling and managing risk |
Risk management governance structure (continued)
| Risk function | Risk Function | |
| l | promotes a strong risk culture; | |
| l | owns the design and content of the Risk Management Framework; | |
| l | defines the structure and coverage of risk appetite; | |
| l | defines the annual risk strategy to execute the Risk Management Framework ensuring the management of risks is in alignment with risk appetite and business strategy; | |
| l | establishes risk policies, procedures and limits; | |
| l | measures and reports on risk levels; and | |
| l | provides oversight of and direction on the management of risks. | |
| Independent internal review | Group Audit | |
| l | reviews the adequacy and effectiveness of management controls over risk. | |
Divisional business units and Functions | Business Units and Functions | |
| l | responsible for identifying, evaluating and managing the risks that they originate within approved risk appetite and policies; and | |
| l | establish and maintain appropriate risk management and compliance controls, resources and self-assessment processes. | |
| 12| Westpac Group March 2020 Pillar 3 report | |
Pillar 3 report Controlling and managing risk |
Roles and responsibilities
Our Three Lines of Defence approach is designed on a functional basis and covers all employees within Westpac.
The First Line of Defence – Business and support: manages the risks they originate
The First Line proactively identifies, evaluates, owns and manages the risks in their business/domain. It also ensures that business activities are within approved risk appetite and policies. This accountability cannot be abrogated. The First Line of defence is accountable for ‘self-certification’. In managing its risk, the First Line is required to establish and maintain appropriate governance structures, controls, resources and self-assessment processes, including issue identification, recording and escalation procedures.
The Second Line of Defence – Risk: provides oversight, insight and control of First Line activities
The Second Line sets frameworks, controls (including policies and limits), and standards for use across the Westpac. They can require remediation or cessation of activity where these are not adhered to. Their approach will be risk-based and proportionate. The Second Line reviews and challenges First Line activities and decisions that may materially affect Westpac’s risk position, and independently evaluate the effectiveness of First Line’s controls, monitoring, compliance, and monitors progress towards mitigating risks. In addition, the Second Line provides insight to the First Line, assisting in developing, maintaining and enhancing the business’ approach to risk management. The Second Line understands and reports on the aggregated risk profile of the Group to ensure end-to-end oversight of risk and can accept risks outside of the business’ risk appetite.
The Third Line of Defence – Audit: provides independent audit
The Third Line is an independent assurance function that evaluates and opines on the adequacy and effectiveness of both First and Second Line risk management approaches and tracks remediation progress, with the aim of providing the Board, and senior executives, with comfort that Westpac’s governance, risk management and internal controls are operating effectively.
| | Westpac Group March 2020 Pillar 3 report |13 |
Pillar 3 report GroupStructure |
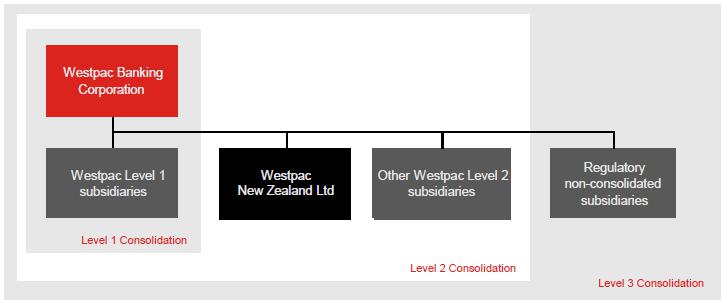
Westpac seeks to ensure that it is adequately capitalised at all times. APRA applies a tiered approach to measuring Westpac’s capital adequacy1by assessing financial strength at three levels:
| l | Level 1, comprising Westpac Banking Corporation and its subsidiary entities that have been approved by APRA as being part of a single 'Extended Licensed Entity' (ELE) for the purposes of measuring capital adequacy; |
| l | Level 2, the consolidation of Westpac Banking Corporation and all its subsidiary entities except those entities specifically excluded by APRA regulations. The head of the Level 2 group is Westpac Banking Corporation; and |
| l | Level 3, the consolidation of Westpac Banking Corporation and all its subsidiary entities. |
Unless otherwise specified, all quantitative disclosures in this report refer to the prudential assessment of Westpac’s financial strength on a Level 2 basis2.
The Westpac Group
The following diagram shows the Level 3 conglomerate group and illustrates the different tiers of regulatory consolidation.
Accounting consolidation3
The consolidated financial statements incorporate the assets and liabilities of all subsidiaries (including structured entities) controlled by Westpac. Westpac and its subsidiaries are referred to collectively as the ‘Group’. The effects of all transactions between entities in the Group are eliminated. Control exists when the parent entity is exposed to, or has rights to, variable returns from its involvement with an entity, and has the ability to affect those returns through its power over that entity. Subsidiaries are fully consolidated from the date on which control commences and they are no longer consolidated from the date that control ceases.
Group entities excluded from the regulatory consolidation at Level 2
Regulatory consolidation at Level 2 covers the global operations of Westpac and its subsidiary entities, including other controlled banking, securities and financial entities, except for those entities involved in the following business activities:
| l | insurance; |
| l | acting as manager, responsible entity, approved trustee, trustee or similar role in relation to funds management; |
| l | non-financial (commercial) operations; or |
| l | special purpose entities to which assets have been transferred in accordance with the requirements of APS120 Securitisation. |
Retained earnings and equity investments in subsidiary entities excluded from the consolidation at Level 2 are deducted from capital, with the exception of securitisation special purpose entities.
| 1 | APS110 Capital Adequacy outlines the overall framework adopted by APRA for the purpose of assessing the capital adequacy of an ADI. |
| 2 | Impaired assets and provisions held in Level 3 entities are excluded from the tables in this report. |
| 3 | Refer to Note 31 of Westpac’s 2019 Annual Report for further details. |
| 14| Westpac Group March 2020 Pillar 3 report | |
Pillar 3 report Group Structure |
Subsidiary banking entities
Westpac New Zealand Limited (WNZL), a wholly owned subsidiary entity, is a registered bank incorporated in New Zealand and regulated by the Reserve Bank of New Zealand (RBNZ). WNZL uses the Advanced IRB approach for credit risk and the AMA for operational risk. Other subsidiary banking entities in the Group include Westpac Bank-PNG-Limited and Westpac Europe Limited. For the purposes of determining Westpac’s capital adequacy subsidiary banking entities are consolidated at Level 2.
Restrictions and major impediments on the transfer of funds or regulatory capital within the Group
Minimum capital (‘thin capitalisation’) rules
Tax legislation in most jurisdictions in which the Group operates prescribes minimum levels of capital that must be retained in that jurisdiction to avoid a portion of the interest costs incurred in the jurisdiction ceasing to be tax deductible. Capital for these purposes includes both contributed capital and non-distributed retained earnings. Westpac seeks to maintain sufficient capital/retained earnings to comply with these rules.
Tax costs associated with repatriation
Repatriation of retained earnings (and capital) may result in tax being payable in either the jurisdiction from which the repatriation occurs or Australia on receipt of the relevant amounts. This cost would reduce the amount actually repatriated.
Intra-group exposure limits
Exposures to related entities are managed within the prudential limits prescribed by APRA in APS222 Associations with Related Entities1. Westpac has an internal limit structure and approval process governing credit exposures to related entities. This limit structure and approval process, combined with APRA’s prudential limits, is designed to reduce the potential for unacceptable contagion risk.
Prudential regulation of subsidiary entities
Certain subsidiary banking, insurance and trustee entities are subject to local prudential regulation in their own right, including capital adequacy requirements and investment or intra-group exposure limits. Westpac seeks to ensure that its subsidiary entities are adequately capitalised and adhere to regulatory requirements at all times. There are no capital deficiencies in subsidiary entities excluded from the regulatory consolidation at Level 2.
On 4 November 2019, the RBNZ advised it would change WNZL’s conditions of registration to remove the 2% overlay applying to its minimum capital requirements from 31 December 2019. This overlay had been in place since 31 December 2017 following the RBNZ’s review of WNZL’s compliance with the RBNZ’s ‘Capital Adequacy Framework’ (Internal Models Based Approach) (BS2B).
On 2 April 2020, a decision was made by the RBNZ to freeze the distribution of dividends on ordinary shares by all banks in New Zealand during the period of economic uncertainty caused by COVID-19.
| 1 | For the purposes of APS222, subsidiaries controlled by Westpac, other than subsidiaries that form part of the ELE, represent ‘related entities’. Prudential and internal limits apply to intra-group exposures between the ELE and related entities, both on an individual and aggregate basis. |
| | Westpac Group March 2020 Pillar 3 report |15 |
Pillar 3 report Capital overview |
Capital Structure
This table shows Westpac’s capital resources under APS111 Capital Adequacy: Measurement of Capital.
| 31 March | 30 September | 31 March | |
| $m | 2020 | 2019 | 2019 |
| Common equity Tier 1 capital | |||
| Paid up ordinary capital | 40,503 | 37,508 | 36,351 |
| Treasury shares | (619) | (575) | (571) |
| Equity based remuneration | 1,645 | 1,548 | 1,527 |
| Foreign currency translation reserve | 59 | (199) | (331) |
| Accumulated other comprehensive income | (190) | (68) | 15 |
| Non-controlling interests - other | 61 | 58 | 54 |
| Retained earnings | 25,985 | 27,188 | 26,949 |
| Less retained earnings in life and general insurance, funds management and securitisation entities | (1,326) | (1,407) | (1,289) |
| Deferred fees | 229 | 267 | 234 |
| Total common equity Tier 1 capital | 66,347 | 64,320 | 62,939 |
| Deductions from common equity Tier 1 capital | |||
| Goodwill (excluding funds management entities) | (8,673) | (8,648) | (8,665) |
| Deferred tax assets | (2,610) | (2,034) | (1,710) |
| Goodwill in life and general insurance, funds management and securitisation entities | (935) | (940) | (941) |
| Capitalised expenditure | (1,656) | (1,719) | (1,778) |
| Capitalised software | (2,029) | (2,019) | (1,881) |
| Investments in subsidiaries not consolidated for regulatory purposes | (1,633) | (1,540) | (1,522) |
| Regulatory expected loss in excess of eligible provisions1 | - | (1,106) | (1,148) |
| Defined benefit superannuation fund surplus | (80) | (73) | (66) |
| Equity investments | (327) | (425) | (482) |
| Regulatory adjustments to fair value positions | (407) | (63) | (65) |
| Other Tier 1 deductions | (15) | (1) | (1) |
| Total deductions from common equity Tier 1 capital | (18,365) | (18,568) | (18,259) |
| Total common equity Tier 1 capital after deductions | 47,982 | 45,752 | 44,680 |
| Additional Tier 1 capital | |||
| Basel III complying instruments | 9,473 | 9,299 | 9,216 |
| Total Additional Tier 1 capital | 9,473 | 9,299 | 9,216 |
| Net Tier 1 regulatory capital | 57,455 | 55,051 | 53,896 |
| Tier 2 capital | |||
| Basel III complying instruments | 14,455 | 11,645 | 7,143 |
| Basel III transitional instruments | 567 | 519 | 495 |
| Eligible general reserve for credit loss | 79 | 62 | 66 |
| Total Tier 2 capital | 15,101 | 12,226 | 7,704 |
| Deductions from Tier 2 capital | |||
| Investments in subsidiaries not consolidated for regulatory purposes | (140) | (140) | (140) |
| Holdings of own and other financial institutions Tier 2 capital instruments | (102) | (115) | (103) |
| Total deductions from Tier 2 capital | (242) | (255) | (243) |
| Net Tier 2 regulatory capital | 14,859 | 11,971 | 7,461 |
| Total regulatory capital | 72,314 | 67,022 | 61,357 |
| 1 | An explanation of the relationship between this deduction, regulatory expected loss and provisions for impairment charges is contained in Appendix IV. |
| 16| Westpac Group March 2020 Pillar 3 report | |
Pillar 3 report Capital overview |
APRA announcements on capital
As part of its response to the current economic environment following COVID-19, APRA has adjusted its expectations for bank capital. On 19 March 2020 APRA announced that during the period of disruption caused by COVID-19 APRA would not be concerned if banks were not meeting its 10.5% “unquestionably strong” benchmark for CET1. Banks may use their current capital buffers provided they remain above the current regulatory requirement (currently at least 8.0% for domestic systemically important banks (D-SIBs)1). APRA has also indicated that they do not envisage reinstating the “unquestionably strong” benchmarks for at least 12 months. Accordingly, Westpac has updated its capital management strategy which is set out below.
APRA has also deferred implementation of the Basel III capital reforms by one year to January 2023 and announced amendments to the calculation of RWA for COVID-19 relief packages which allow for payment deferrals. These COVID-19 packages have not impacted RWA at 31 March 2020 due to the timing of these packages being offered, however may impact future periods.
Further details of APRA’s regulatory changes are set out in the Significant Developments section of the 2020 Half Year Financial Results.
Capital management strategy
Westpac’s approach to capital management seeks to ensure that it is adequately capitalised as an ADI. Westpac evaluates its approach to capital management through an Internal Capital Adequacy Assessment Process (ICAAP), the key features of which include:
| l | the development of a capital management strategy, including consideration of regulatory minimums, capital buffers and contingency plans; |
| l | consideration of both regulatory and economic capital requirements; |
| l | a stress testing framework that challenges the capital measures, coverage and requirements including the impact of adverse economic scenarios; and |
| l | consideration of the perspectives of external stakeholders including rating agencies as well as equity and debt investors. |
During the period of disruption caused by COVID-19, Westpac will seek to operate with the following principles in relation to capital:
| l | prioritise maintaining capital strength; |
| l | in line with APRA guidance, utilise some of the “unquestionably strong” buffer and seek to maintain a buffer above the regulatory minimum; |
| l | retain capital to absorb further downside on credit quality and acknowledge a high degree of uncertainty regarding the length and depth of this stress; and |
| l | allow for capital flexibility to support lending to customers. |
These principles take into consideration:
| l | current regulatory capital minimums and the capital conservation buffer (CCB), which together are the Total CET1 Requirement. In line with the above, the Total CET1 Requirement for Westpac is at least 8.0%, based upon an industry minimum CET1 requirement of 4.5% plus a capital buffer of at least 3.5% applicable to D-SIBs1,2; |
| l | stress testing to calibrate an appropriate buffer against a downturn; and |
| l | quarterly volatility of capital ratios due to the half yearly cycle of ordinary dividend payments. |
Westpac will revise its target capital levels once the medium to longer term impacts of COVID-19 are clearer, taking into account APRA’s expectations for the timing of any capital rebuilding required and the finalisation of APRA’s review of the capital adequacy framework.
| 1 | Noting that APRA may apply higher CET1 requirements for an individual ADI. |
| 2 | If an ADI’s CET1 ratio falls below the Total CET1 Requirement (at least 8%), they face restrictions on the distribution of earnings, such as dividends, distribution payments on AT1 capital instruments and discretionary staff bonuses. |
| | Westpac Group March 2020 Pillar 3 report |17 |
Pillar 3 report Capital overview |
Westpac’s capital adequacy ratios
| % | 31 March 2020 | 30 September 2019 | 31 March 2019 |
| The Westpac Group at Level 2 | |||
| Common equity Tier 1 capital ratio | 10.8 | 10.7 | 10.6 |
| Additional Tier 1 capital | 2.1 | 2.2 | 2.2 |
| Tier 1 capital ratio | 12.9 | 12.8 | 12.8 |
| Tier 2 capital | 3.4 | 2.8 | 1.8 |
| Total regulatory capital ratio | 16.3 | 15.6 | 14.6 |
| The Westpac Group at Level 1 | |||
| Common equity Tier 1 capital ratio | 11.1 | 11.0 | 10.7 |
| Additional Tier 1 capital | 2.2 | 2.2 | 2.3 |
| Tier 1 capital ratio | 13.3 | 13.2 | 13.0 |
| Tier 2 capital | 3.4 | 2.9 | 1.8 |
| Total regulatory capital ratio | 16.7 | 16.1 | 14.8 |
Westpac New Zealand Limited’s capital adequacy ratios
| % | 31 March 2020 | 30 September 2019 | 31 March 2019 |
| Westpac New Zealand Limited | |||
| Common equity Tier 1 capital ratio | 11.4 | 11.3 | 11.7 |
| Additional Tier 1 capital | 2.7 | 2.6 | 2.8 |
| Tier 1 capital ratio | 14.1 | 13.9 | 14.5 |
| Tier 2 capital | 1.8 | 2.0 | 2.0 |
| Total regulatory capital ratio | 15.9 | 15.9 | 16.5 |
| 18| Westpac Group March 2020 Pillar 3 report | |
Pillar 3 report Capital overview |
Capital requirements
This table shows risk weighted assets and associated capital requirements1 for each risk type included in the regulatory assessment of Westpac’s capital adequacy. Westpac’s approach to managing these risks, and more detailed disclosures on the prudential assessment of capital requirements, are presented in the following sections of this report.
| 31 March 2020 | IRB | Standardised | Total Risk | Total Capital |
| $m | Approach | Approach2 | Weighted Assets | Required1 |
| Credit risk | ||||
| Corporate | 78,288 | 1,087 | 79,375 | 6,350 |
| Business lending | 34,493 | 993 | 35,486 | 2,839 |
| Sovereign | 2,192 | 1,354 | 3,546 | 284 |
| Bank | 6,956 | 51 | 7,007 | 561 |
| Residential mortgages | 131,424 | 4,714 | 136,138 | 10,891 |
| Australian credit cards | 4,837 | - | 4,837 | 387 |
| Other retail | 11,594 | 805 | 12,399 | 992 |
| Small business | 16,812 | - | 16,812 | 1,345 |
| Specialised lending | 56,004 | 503 | 56,507 | 4,521 |
| Securitisation | 5,747 | - | 5,747 | 460 |
| Mark-to-market related credit risk3 | - | 11,289 | 11,289 | 903 |
| Total | 348,347 | 20,795 | 369,142 | 29,533 |
| Market risk | 8,396 | 672 | ||
| Operational risk | 54,093 | 4,327 | ||
| Interest rate risk in the banking book | 5,305 | 424 | ||
| Other assets4 | 6,969 | 558 | ||
| Total | 443,905 | 35,514 | ||
| 30 September 2019 | IRB | Standardised | Total Risk | Total Capital |
| $m | Approach | Approach2 | Weighted Assets | Required1 |
| Credit risk | ||||
| Corporate | 74,807 | 1,166 | 75,973 | 6,078 |
| Business lending | 35,470 | 950 | 36,420 | 2,914 |
| Sovereign | 2,068 | 1,069 | 3,137 | 251 |
| Bank | 8,339 | 46 | 8,385 | 671 |
| Residential mortgages | 131,629 | 5,010 | 136,639 | 10,931 |
| Australian credit cards | 5,089 | - | 5,089 | 407 |
| Other retail | 12,395 | 894 | 13,289 | 1,063 |
| Small business | 16,090 | - | 16,090 | 1,287 |
| Specialised lending | 55,262 | 518 | 55,780 | 4,462 |
| Securitisation | 5,749 | - | 5,749 | 460 |
| Mark-to-market related credit risk3 | - | 11,313 | 11,313 | 905 |
| Total | 346,898 | 20,966 | 367,864 | 29,429 |
| Market risk | 9,350 | 748 | ||
| Operational risk | 47,680 | 3,814 | ||
| Interest rate risk in the banking book | 530 | 42 | ||
| Other assets4 | 3,370 | 270 | ||
| Total | 428,794 | 34,303 |
| 1 | Total capital required is calculated as 8% of total risk weighted assets. |
| 2 | Westpac’s Standardised risk weighted assets are categorised based on their equivalent IRB categories. |
| 3 | Mark-to-market related credit risk is measured under the standardised approach. It is also known as Credit Valuation Adjustment (CVA) risk. |
| 4 | Other assets include cash items, unsettled transactions, fixed assets and other non-interest earning assets. |
| | Westpac Group March 2020 Pillar 3 report |19 |
Pillar 3 report Capital overview |
| 31 March 2019 | IRB | Standardised | Total Risk | Total Capital |
| $m | Approach | Approach2 | Weighted Assets | Required1 |
| Credit risk | ||||
| Corporate | 73,551 | 1,737 | 75,288 | 6,023 |
| Business lending | 35,294 | 982 | 36,276 | 2,902 |
| Sovereign | 1,653 | 1,042 | 2,695 | 216 |
| Bank | 7,066 | 31 | 7,097 | 568 |
| Residential mortgages | 132,133 | 5,273 | 137,406 | 10,992 |
| Australian credit cards | 5,910 | - | 5,910 | 473 |
| Other retail | 13,082 | 944 | 14,026 | 1,122 |
| Small business | 16,092 | - | 16,092 | 1,287 |
| Specialised lending | 54,833 | 446 | 55,279 | 4,422 |
| Securitisation | 5,583 | - | 5,583 | 447 |
| Mark-to-market related credit risk3 | - | 7,110 | 7,110 | 569 |
| Total | 345,197 | 17,565 | 362,762 | 29,021 |
| Market risk | 8,338 | 667 | ||
| Operational risk | 38,641 | 3,091 | ||
| Interest rate risk in the banking book | 7,076 | 566 | ||
| Other assets4 | 3,002 | 240 | ||
| Total | 419,819 | 33,585 |
| 1 | Total capital required is calculated as 8% of total risk weighted assets. |
| 2 | Westpac’s Standardised risk weighted assets are categorised based on their equivalent IRB categories. |
| 3 | Mark-to-market related credit risk is measured under the standardised approach. It is also known as Credit Valuation Adjustment (CVA) risk. |
| 4 | Other assets include cash items, unsettled transactions, fixed assets and other non-interest earning assets. |
| 20| Westpac Group March 2020 Pillar 3 report | |
Pillar 3 report Leverage ratio |
Leverage ratio
The following table summarises Westpac’s leverage ratio. This has been determined using APRA’s definition of the leverage ratio as specified in APS110 Capital Adequacy.
| $ billion | 31 March 2020 | 31 December 2019 | 30 September 2019 | 30 June 2019 |
| Tier 1 Capital | 57.5 | 56.8 | 55.1 | 53.7 |
| Total Exposures | 1,014.2 | 948.7 | 968.8 | 946.7 |
| Leverage ratio | 5.7% | 6.0% | 5.7% | 5.7% |
Leverage ratio disclosure
| $m | 31 March 2020 | |
| On-balance sheet exposures | ||
| 1 | On-balance sheet items (excluding derivatives and securities financing transactions (SFTs), but including collateral) | 904,651 |
| 2 | (Asset amounts deducted in determining Tier 1 capital) | (18,790) |
| 3 | Total on-balance sheet exposures (excluding derivatives and SFTs) (sum of rows 1 and 2) | 885,861 |
| Derivative exposures | ||
| 4 | Replacement cost associated with all derivatives transactions (i.e. net of eligible cash variation margin) | 12,339 |
| 5 | Add-on amounts for potential future credit exposure (PFCE) associated with all derivatives transactions | 19,137 |
| 6 | Gross-up for derivatives collateral provided where deducted from the balance sheet assets pursuant to the Australian Accounting Standards | 5,927 |
| 7 | (Deductions of receivables assets for cash variation margin provided in derivatives transactions) | (8,313) |
| 8 | (Exempted central counterparty (CCP) leg of client-cleared trade exposures) | |
| 9 | Adjusted effective notional amount of written credit derivatives | 4,852 |
| 10 | (Adjusted effective notional offsets and add-on deductions for written credit derivatives) | (4,832) |
| 11 | Total derivative exposures (sum of rows 4 to 10) | 29,111 |
| SFT exposures | ||
| 12 | Gross SFT assets (with no recognition of netting), after adjusting for sales accounting transactions | 20,571 |
| 13 | (Netted amounts of cash payables and cash receivables of gross SFT assets) | |
| 14 | Counterparty credit risk exposure for SFT assets | 4,858 |
| 15 | Agent transaction exposures | |
| 16 | Total SFT exposures (sum of rows 12 to 15) | 25,429 |
| Other off-balance sheet exposures | ||
| 17 | Off-balance sheet exposure at gross notional amount | 197,768 |
| 18 | (Adjustments for conversion to credit equivalent amounts) | (123,956) |
| 19 | Other off-balance sheet exposures (sum of rows 17 and 18) | 73,811 |
| Capital and total exposures | ||
| 20 | Tier 1 Capital | 57,455 |
| 21 | Total exposures (sum of rows 3, 11, 16 and 19) | 1,014,212 |
| Leverage ratio % | ||
| 22 | Leverage ratio | 5.7% |
| | Westpac Group March 2020 Pillar 3 report |21 |
Pillar 3 report Leverage ratio |
Summary comparison of accounting assets versus leverage ratio exposure measure
| $m | 31 March 2020 | |
| 1 | Total consolidated assets as per published financial statements | 967,662 |
| 2 | Adjustment for investments in banking, financial, insurance or commercial entities that are consolidated for accounting purposes but outside the scope of regulatory consolidation | (2,648) |
| 3 | Adjustment for assets held on the balance sheet in a fiduciary capacity pursuant to the Australian Accounting Standards but excluded from the leverage ratio exposure measure | - |
| 4 | Adjustments for derivative financial instruments | (27,550) |
| 5 | Adjustment for SFTs (i.e. repos and similar secured lending) | 20,347 |
| 6 | Adjustment for off-balance sheet exposures (i.e. conversion to credit equivalent amounts of off-balance sheet exposures) | 73,811 |
| 7 | Other adjustments | (17,410) |
| 8 | Leverage ratio exposure | 1,014,212 |
| 22| Westpac Group March 2020 Pillar 3 report | |
Pillar 3 report Credit risk management |
Credit risk is the potential for financial loss where a customer or counterparty fails to meet their financial obligations to Westpac. Westpac maintains a credit risk management framework and a number of supporting policies, processes and controls governing the assessment, approval and management of customer and counterparty credit risk. These incorporate the assignment of risk grades, the quantification of loss estimates in the event of default, and the segmentation of credit exposures.
Structure and organisation
The Chief Risk Officer (CRO) is responsible for the effectiveness of overall risk management throughout Westpac, including credit risk. The Group Chief Credit Officer is responsible for the effectiveness of credit risk management, including credit approval decisioning beyond business authority level and appointing our most senior authorised credit officers. Authorised credit officers have delegated authority to approve credit risk exposures, including customer risk grades, other credit parameters and their ongoing review. Our largest exposures are approved by our most experienced authorised credit officers. Line business management is responsible for managing credit risks originated in their business and for managing risk adjusted returns from their business credit portfolios, within the approved risk appetite, risk management framework and policies.
Credit risk management framework and policies
Westpac maintains a credit risk management framework and supporting policies that are designed to clearly define roles and responsibilities, acceptable practices, limits and key controls.
The Credit Risk Management Framework describes the principles, methodologies, systems, roles and responsibilities, reports and controls that exist for managing credit risk in Westpac. The Credit Risk Rating System policy describes the credit risk rating system philosophy, design, key features and uses of rating outcomes.
Concentration risk policies cover individual counterparties, specific industries (e.g. property) and individual countries. In addition, we have policies covering risk appetite statements, environmental, social and governance (ESG) risk, credit risks and the delegation of credit approval authorities.
At the divisional level, credit manuals embed the Group’s framework requirements for application in line businesses. These manuals include policies covering the origination, evaluation, approval, documentation, settlement and on-going management of credit risks, and sector policies to guide the extension of credit where industry-specific guidelines are considered necessary.
Credit approval limits govern the extension of credit and represent the formal delegation of credit approval authority to responsible individuals throughout the organisation.
| | Westpac Group March 2020 Pillar 3 report |23 |
Pillar 3 report Credit risk management |
Approach
Westpac adopts two approaches to managing credit risk depending upon the nature of the customer and the product.
Transaction-managed approach
For larger customers, Westpac evaluates credit requests by undertaking detailed individual customer and transaction risk analysis (the ‘transaction-managed’ approach). Such customers are assigned a customer risk grade (CRG) representing Westpac’s estimate of their probability of default (PD). Each facility is assigned a loss given default (LGD). The Westpac credit risk rating system has 20 risk grades for non-defaulted customers and 10 risk grades for defaulted customers. Non-defaulted CRGs down to the level of normally acceptable risk (i.e. D grade – see table below) are mapped to Moody’s and Standard & Poor’s (S&P) external senior ranking unsecured ratings. This mapping allows Westpac to integrate the rating agencies’ default history with internal historical data when calculating PDs.
The final assignment of CRGs and LGDs is approved by authorised credit approvers with appropriate delegated approval authority. All material credit exposures are approved by authorised Credit Officers who are part of the risk management stream and operate independently of the areas originating the credit risk proposals. Authorised Credit Officer decisions are subject to reviews to ensure consistent quality and confirm compliance with approval authority. Separate teams are responsible for maintaining accurate and timely recording of all credit risk approvals and changes to customer and facility data. These teams also operate independently of both the areas originating the credit risk proposals and the credit risk approvers. Appropriate segregation of functions is one of the key requirements of our credit risk management framework.
Mapping of Westpac risk grades
The table below shows the current alignment between Westpac’s internal CRGs and the corresponding external rating. Note that only high-level CRG groupings are shown.
Westpac customer risk grade | Standard & Poor’s rating | Moody’s rating |
| A | AAA to AA– | Aaa to Aa3 |
| B | A+ to A– | A1 to A3 |
| C | BBB+ to BBB– | Baa1 to Baa3 |
| D | BB+ to B+ | Ba1 to B1 |
| Westpac Rating | ||
| E | Watchlist | |
| F | Special mention | |
| G | Substandard/default | |
| H | Default | |
For Specialised Lending Westpac maps exposures to the appropriate supervisory slot based on an assessment that takes into account borrower strength and security quality, as required by APS 113.
Program-managed approach
High-volume retail customer credit portfolios with homogenous credit risk characteristics are managed on a statistical basis according to pre-determined objective criteria (the ‘program-managed’ approach). Program-managed exposure to a consumer customer may exceed $1 million. Business customer exposures may be program managed for exposure up to $3 million. Quantitative scorecards are used to assign application and behavioural scores to enable risk-based decision making within these portfolios. The scorecard outcomes and decisions are regularly monitored and validated against subsequent customer performance and scorecards are recalibrated or rebuilt when required. For capital estimation and other purposes, risk-based customer segments are created based upon modelled expected PD, Exposure At Default (EAD) and LGD. Accounts are then assigned to respective segments based on customer and account characteristics. Each segment is assigned a quantified measure of its PD, LGD and EAD.
For both transaction-managed and program-managed approaches, CRGs, PDs and LGDs are reviewed at least annually.
| 24| Westpac Group March 2020 Pillar 3 report | |
Pillar 3 report Credit risk management |
Mapping of Basel categories to Westpac portfolios
APS113 Capital Adequacy: Internal Ratings-Based Approach to Credit Risk, states that under the Advanced IRB approach to credit risk, an ADI must categorise banking book exposures into six broad IRB asset classes and apply the prescribed treatment for those classes to each credit exposure within them for the purposes of deriving its regulatory capital requirement. Standardised and Securitised portfolios are subject to treatment under APS112 Capital Adequacy: Standardised Approach to Credit Risk and APS120 Securitisation respectively.
| APS Asset Class | Sub-asset class | Westpac category | Segmentation criteria |
| Corporate | Corporate | Corporate | All transaction-managed customers not elsewhere classified where annual turnover exceeds $50 million1. |
| SME Corporate | Business Lending | All transaction-managed customers not elsewhere classified where annual turnover is $50 million or less. | |
| Project Finance | Specialised Lending-Project Finance | Applied to transaction-managed customers where the primary source of debt service, security and repayment is derived from the revenue generated by a completed project (e.g. infrastructure such as toll roads or railways). | |
| Income-producing Real Estate | Specialised Lending- Property Finance | Applied to transaction-managed customers where the primary source of debt service, security and repayment is derived from either the sale of a property development or income produced by one or more investment properties2. | |
| Sovereign | Sovereign | Applied to transaction-managed exposures backed by governments. | |
| Bank | Bank | Applied to transaction-managed exposures to deposit-taking institutions and foreign equivalents. | |
| Residential Mortgage | Residential Mortgages | Exposures secured by residential mortgages not elsewhere classified. | |
| Qualifying Revolving Retail | Australian Credit Cards | Program-managed credit cards with low volatility in loss rates. The New Zealand cards portfolio is not eligible for Qualifying Revolving Retail treatment and is classified in Other Retail. | |
| Other Retail | Small Business | Program-managed business lending exposures under $1 million where complex products are not utilised by the customer. | |
| Other Retail | All other program-managed lending to retail customers, including New Zealand credit cards. |
1 Includes all NZ agribusiness loans, regardless of turnover.
2 Excludes large diversified property groups and property trusts, which appear in the Corporate asset class.
| | Westpac Group March 2020 Pillar 3 report |25 |
Pillar 3 report Credit risk management |
Mapping of Credit risk approach to Basel categories and exposure types
| Approach | APS asset class | Types of exposures |
| Transaction-Managed Portfolios | Corporate
Sovereign
Bank
| Direct lending
Contingent lending
Derivative counterparty
Asset warehousing
Underwriting
Secondary market trading
Foreign exchange settlement
Other intra-day settlement obligations |
| Program-Managed Portfolios | Residential mortgage | Mortgages
Equity access loans |
| Qualifying revolving retail | Australian credit cards | |
| Other retail | Personal loans
Overdrafts
New Zealand credit cards
Auto and equipment finance
Business development loans
Business overdrafts
Other term products |
Internal ratings process for transaction-managed portfolios
The process for assigning and approving individual customer PDs and facility LGDs involves:
| l | Business unit representatives recommend the CRG and facility LGDs under the guidance of criteria set out in established credit policies. Each CRG is associated with an estimated PD; |
| l | Authorised credit officers evaluate the recommendations and approve the final CRG and facility LGDs. Authorised credit officers may override line business unit recommendations; |
| l | An expert judgement decisioning process is employed to evaluate CRG and the outputs of various risk grading models are used as one of several inputs into that process; and |
| l | Authorised credit officers’ decisions are subject to reviews to ensure consistent quality and confirm compliance with approval authority. |
For on-going exposures to transaction-managed customers, risk grades and facility LGDs are required to be reviewed at least annually, but also whenever material changes occur.
No material deviations from the reference definition of default are permitted.
Internal ratings process for program-managed portfolios
The process for assigning PDs, LGDs and EADs to the program-managed portfolio involves dividing the portfolio into a number of pools per product. These pools are created by analysing risk characteristics that have historically predicted that an account is likely to go into default or loss.
No material deviations from the reference definition of default are permitted.
Internal credit risk ratings system
In addition to using the credit risk estimates as the basis for regulatory capital purposes, they are also used for the purposes described below:
Economic capital - Economic capital includes both credit and non-credit components. Economic credit capital is calculated using a framework that considers estimates of PD, LGD, EAD, total committed exposure and loan tenor, as well as measures of portfolio composition not reflected in regulatory capital formulae.
Provisioning - Credit provisions are held by Westpac to cover expected credit losses in the loan portfolio. Provisioning includes both individual and collective components. Individual provisions are calculated on impaired loans taking into account management’s best estimate of the present value of future cashflows.
| 26| Westpac Group March 2020 Pillar 3 report | |
Pillar 3 report Credit risk management |
Collective provisions are established on a portfolio basis using a framework that considers PD, LGD, EAD, total committed exposure, level of arrears, recent past experience and forward looking macro-economic forecasts.
Risk-adjusted performance measurement- Business performance is measured using allocated capital, which incorporates charges for economic capital and regulatory capital, including credit capital and capital for other risk types.
Pricing - Westpac prices loans to produce an acceptable return on the capital allocated to the loan. Returns include interest income and fees after expected credit losses and other costs.
Credit approval- For transaction-managed facilities, approval authorities are tiered based on the CRG, with lower limits applicable for customers with a higher PD. Program-managed facilities are approved on the basis of application scorecard outcomes and product based approval authorities.
Control mechanisms for the credit risk rating system include:
| l | Westpac’s credit risk rating system is reviewed annually to confirm that the rating criteria and procedures are appropriate given the current portfolio and external conditions; |
| l | All models materially impacting the risk rating process are periodically reviewed in accordance with Westpac’s model risk policy; |
| l | Specific credit risk estimates (including PD, LGD and EAD levels) are overseen, reviewed annually and supported by the Credit Risk Estimates Committee (a sub-committee of CREDCO) for approval by General Manager, Risk Analytics and Insights; |
| l | Credit Risk Assurance undertake an independent annual end-to-end technical and operational review of the overall process; and |
| l | CREDCO, RISKCO and BRCC monitor the risk profile, performance and management of Westpac’s credit portfolio and the development and review of key credit risk policies. |
Risk reporting
A comprehensive report on Westpac's credit risk portfolio is provided to CREDCO, RISKCO and BRCC quarterly. It details the current level of impairment losses, stressed exposures, delinquency trends, provisions, impaired assets and key performance metrics. It also reports on portfolio concentrations and large exposures.
Credit risk and asset quality are also reported to the Board each month, including details of impairment losses, stressed exposures, delinquency trends and key performance metrics.
Response to COVID-19
Westpac remains focused on supporting customers. In response to the current COVID-19 pandemic Westpac has introduced a range of support packages such as lowering interest rates on certain products, waiving certain fees and providing impacted customers with an option to defer their repayments for between 3 and 6 months. In accordance with guidance from APRA outlined below, customers approved for these deferrals will not be recorded in traditional stress metrics while part of these packages but will be closely monitored, particularly once the deferral period changes.
APRA has announced that it is providing a specific capital treatment for loans granted repayment deferrals of up to six months. Where a borrower who has been meeting their repayment obligations until recently chooses to take up the offer not to make repayments as part of a COVID-19 support package, a bank need not treat the period of the repayment holiday as a period of arrears. Similarly, loans that have been granted a repayment deferral as part of a COVID-19 support package need not be regarded as restructured. Westpac expects to apply this treatment.
However, APRA has advised that if there is objective evidence that an individual borrower on a repayment deferral is unlikely to pay its modified credit obligations in full, the loan should be regarded as impaired if not fully secured, and should also be considered as restructured.
| | Westpac Group March 2020 Pillar 3 report |27 |
Pillar 3 report Credit risk management |
Summary credit risk disclosure
| Regulatory | |||||||
| Expected | Specific | Actual | |||||
| Risk | Regulatory | Loss for | Provisions | Losses for | |||
| 31 March 2020 | Exposure | Weighted | Expected | non-defaulted | Impaired | for Impaired | the 6 months |
| $m | at Default | Assets | Loss1 | exposures | Loans | Loans | ended |
| Corporate | 146,529 | 78,288 | 787 | 547 | 363 | 232 | (4) |
| Business lending | 54,428 | 34,493 | 669 | 413 | 347 | 195 | 35 |
| Sovereign | 127,064 | 2,192 | 2 | 2 | - | - | - |
| Bank | 26,633 | 6,956 | 9 | 9 | - | - | - |
| Residential mortgages | 553,866 | 131,424 | 1,788 | 1,229 | 404 | 114 | 67 |
| Australian credit cards | 18,601 | 4,837 | 314 | 238 | 123 | 92 | 164 |
| Other retail | 15,223 | 11,594 | 601 | 419 | 312 | 218 | 135 |
| Small business | 33,181 | 16,812 | 557 | 378 | 501 | 183 | 39 |
| Specialised Lending | 65,866 | 56,004 | 813 | 583 | 52 | 26 | 1 |
| Securitisation | 28,097 | 5,747 | - | - | - | - | - |
| Standardised2 | 19,616 | 20,795 | - | - | 52 | 19 | - |
| Total | 1,089,104 | 369,142 | 5,540 | 3,818 | 2,154 | 1,079 | 437 |
| Regulatory | |||||||
| Expected | Specific | Actual | |||||
| Risk | Regulatory | Loss for | Provisions | Losses for | |||
| 30 September 2019 | Exposure | Weighted | Expected | non-defaulted | Impaired | for Impaired | the 12 months |
| $m | at Default | Assets | Loss1 | exposures | Loans | Loans | ended |
| Corporate | 139,173 | 74,807 | 523 | 473 | 135 | 50 | 30 |
| Business lending | 54,570 | 35,470 | 635 | 431 | 316 | 168 | 54 |
| Sovereign | 90,960 | 2,068 | 2 | 2 | - | - | - |
| Bank | 28,761 | 8,339 | 10 | 10 | - | - | - |
| Residential mortgages | 559,018 | 131,629 | 1,642 | 1,088 | 414 | 127 | 111 |
| Australian credit cards | 17,541 | 5,089 | 328 | 248 | 121 | 80 | 340 |
| Other retail | 15,951 | 12,395 | 582 | 417 | 283 | 165 | 354 |
| Small business | 33,365 | 16,090 | 512 | 351 | 367 | 152 | 78 |
| Specialised Lending | 65,553 | 55,262 | 748 | 557 | 69 | 29 | 13 |
| Securitisation | 26,774 | 5,749 | - | - | - | - | - |
| Standardised2 | 22,512 | 20,966 | - | - | 58 | 21 | 2 |
| Total | 1,054,178 | 367,864 | 4,982 | 3,577 | 1,763 | 792 | 982 |
| Regulatory | |||||||
| Expected | Specific | Actual | |||||
| Risk | Regulatory | Loss for | Provisions | Losses for | |||
| 31 March 2019 | Exposure | Weighted | Expected | non-defaulted | Impaired | for Impaired | the 6 months |
| $m | at Default | Assets | Loss1 | exposures | Loans | Loans | ended |
| Corporate | 135,502 | 73,551 | 561 | 468 | 176 | 79 | (3) |
| Business lending | 54,299 | 35,294 | 642 | 424 | 279 | 161 | 23 |
| Sovereign | 79,572 | 1,653 | 2 | 1 | - | - | - |
| Bank | 25,471 | 7,066 | 8 | 8 | - | - | - |
| Residential mortgages | 558,161 | 132,133 | 1,649 | 1,106 | 391 | 126 | 52 |
| Australian credit cards | 18,850 | 5,910 | 363 | 292 | 101 | 63 | 150 |
| Other retail | 16,583 | 13,082 | 640 | 459 | 297 | 173 | 162 |
| Small business | 33,280 | 16,092 | 497 | 345 | 374 | 148 | 33 |
| Specialised Lending | 64,781 | 54,833 | 798 | 562 | 118 | 44 | 10 |
| Securitisation | 25,929 | 5,583 | - | - | - | - | - |
| Standardised2 | 17,389 | 17,565 | - | - | 13 | 6 | 1 |
| Total | 1,029,817 | 362,762 | 5,160 | 3,665 | 1,749 | 800 | 428 |
1 Includes regulatory expected losses for defaulted and non-defaulted exposures.
2 Includes mark-to-market related credit risk.
| 28| Westpac Group March 2020 Pillar 3 report | |
Pillar 3 report Credit risk management |
Loan impairment provisions
Expected credit losses (ECL) are a estimate of the cash shortfalls expected to result from defaults over the relevant timeframe. They are determined by evaluating a range of possible outcomes and taking into account the time value of money, past events, current conditions and forecasts of future economic conditions. Westpac calculates provisions for ECL based on a three stage approach:
| l | Stage 1: 12 months ECL (performing) - For financial assets where there has been no significant increase in credit risk since origination, a provision for 12 months ECL is recognised. |
| l | Stage 2: Lifetime ECL (performing) - For financial assets where there has been a significant increase in credit risk since origination and where the asset is still performing, a provision for lifetime ECL is recognised. |
Determining when a financial asset has experienced a significant increase in credit risk is primarily based on changes in internal risk grades since origination of the financial asset. An internal risk grade assessed using both quantitative and qualitative factors. The number of notches (changes) in the internal risk grade that Westpac uses to represent a significant increase in credit risk is determined on a sliding scale where the number of notches will generally be greater for a financial asset with a lower credit risk compared to a financial asset with a higher credit risk.
| l | Stage 3: Lifetime ECL (non-performing) -For financial assets that are non-performing a provision for lifetime ECL is recognised. Indicators include a breach of contract with Westpac such as a default on interest or principal payments, a borrower experiencing significant financial difficulties. |
Collective and individual assessment -Financial assets that are in stages 1 and 2 are assessed on a collective basis as are financial assets in stage 3 below specified exposure thresholds. Those financial assets in stage 3 above the specified exposure thresholds are assessed on an individual basis.
Expected life -Expected credit losses are determined as a lifetime ECL in stages 2 and 3.
Lifetime ECL represents the expected credit losses that result from default events over the expected life of a financial instrument. In considering lifetime ECL, the remaining contractual life is used for non-retail portfolios. For retail portfolios lifetime ECL is calibrated to historically observed portfolio behaviour.
Forward looking information -The measurement of ECL for each stage and the assessment of significant increase in credit risk considers information about past events and current conditions as well as reasonable and supportable projections of future events and economic conditions. In order to capture the asymmetry of the losses expected over the range of plausible future events and economic conditions, Westpac considers three future macroeconomic scenarios i.e. base case, upside and downside scenarios.
The macroeconomic variables used in these scenarios, include (but are not limited to) unemployment rates, real gross domestic product growth rates and residential and commercial property price indices.
The ECL is a weighted average of the credit losses expected under these three scenarios. The scenarios are weighted based on Westpac’s assessment of upside and downside risks taking into account current trends, forward looking conditions and the degree of uncertainty attached to these projections.
Regulatory classification of loan impairment provisions
APS220 Credit Quality requires that Westpac report specific provisions and a General Reserve for Credit Loss (GRCL). All IAPs raised under Australian Accounting Standards (AAS) are classified as specific provisions. All Collectively Assessed Provisions (CAPs) raised under AAS are either classified into specific provisions or a GRCL.
| | Westpac Group March 2020 Pillar 3 report |29 |
Pillar 3 report Credit risk management |
Expected credit loss provision
| 31 March 2020 | A-IFRS Provisions | Total Regulatory | |
| $m | IAPs | CAPs | Provisions |
| Specific Provisions | |||
| for impaired loans | 606 | 473 | 1,079 |
| for defaulted but not impaired loans | NA | 628 | 628 |
| For Stage 2 | NA | 2,184 | 2,184 |
| Total Specific Provision1 | 606 | 3,285 | 3,891 |
| General Reserve for Credit Loss1 | NA | 1,900 | 1,900 |
| Total provisions for ECL | 606 | 5,185 | 5,791 |
| 30 September 2019 | A-IFRS Provisions | Total Regulatory | |
| $m | IAPs | CAPs | Provisions |
| Specific Provisions | |||
| for impaired loans | 412 | 380 | 792 |
| for defaulted but not impaired loans | NA | 554 | 554 |
| For Stage 2 | NA | 1,234 | 1,234 |
| Total Specific Provision1 | 412 | 2,168 | 2,580 |
| General Reserve for Credit Loss1 | NA | 1,344 | 1,344 |
| Total provisions for ECL | 412 | 3,512 | 3,924 |
| 31 March 2019 | A-IFRS Provisions | Total Regulatory | |
| $m | IAPs | CAPs | Provisions |
| Specific Provisions | |||
| for impaired loans | 433 | 367 | 800 |
| for defaulted but not impaired loans | NA | 558 | 558 |
| For Stage 2 | NA | 1,264 | 1,264 |
| Total Specific Provision1 | 433 | 2,189 | 2,622 |
| General Reserve for Credit Loss1 | NA | 1,375 | 1,375 |
| Total provisions for ECL | 433 | 3,564 | 3,997 |
1 Provisions classified according to APRA’s letter dated 4 July 2017 “Provisions for regulatory purposes and AASB 9 financial instruments”.
| 30| Westpac Group March 2020 Pillar 3 report | |
Pillar 3 report Credit risk management |
Movement in provisions for impairment
| For the 6 months ended 31 March 2020 | Performing | Non-performing | Collectively assessed | Individually assessed | ||
| $m | Stage 1 | Stage 2 | Stage 3 | provisions | provisions | Total |
| Balance as at 30 September 2019 for Loans and Credit Commitments | 884 | 1,674 | 1,355 | - | - | 3,913 |
| Transfers to Stage 1 | 600 | (583) | (17) | - | - | - |
| Transfers to Stage 2 | (131) | 466 | (335) | - | - | - |
| Transfers to Stage 3 | (2) | (334) | 336 | - | - | - |
| Business activity during the period | 120 | 114 | (50) | - | - | 184 |
| Net remeasurement of provision for ECL | (297) | 1,527 | 911 | - | - | 2,141 |
| Write-offs | - | - | (537) | - | - | (537) |
| Exchange rate and other adjustments | 7 | 14 | 44 | - | - | 65 |
| Balance as at 31 March 2020 for Loans and Credit Commitments | 1,181 | 2,878 | 1,707 | - | - | 5,766 |
| Balance as at 30 September 2019 for debt securities | 11 | 11 | ||||
| Provision for ECL on debt securities at amortised | 10 | 3 | - | 13 | ||
| Provision for ECL on debt securities at FVOCI1 | 1 | - | - | 1 | ||
| Total provision for ECL as at 31 March 2020 | 22 | 3 | - | - | - | 25 |
| Total provision for ECL as at 31 March 2020 | 1,203 | 2,881 | 1,707 | - | - | 5,791 |
| Collectively assessed | Individually assessed | ||||
| For the 12 months ended 30 September 2019 | Performing | Non-performing | ||||
| $m | Stage 1 | Stage 2 | Stage 3 | provisions | provisions | Total |
| Provision for impairment charges as at 30 September 2018 | - | - | - | 2,631 | 422 | 3,053 |
| Restatement for adoption of AASB 9 | 877 | 1,884 | 1,272 | (2,631) | (422) | 980 |
| Restated provision for ECL as at 1 October 2018 | 877 | 1,884 | 1,272 | - | - | 4,033 |
| Transfers in/(out) of Stage 1 | 1,458 | (1,404) | (54) | - | ||
| Transfers in/(out) of Stage 2 | (242) | 956 | (714) | - | ||
| Transfers in/(out) of Stage 3 | (5) | (621) | 626 | - | ||
| Business activity during the year | 179 | (19) | (330) | (170) | ||
| Net remeasurement of provision for ECL | (1,385) | 874 | 1,647 | 1,136 | ||
| Write-offs | - | - | (1,154) | (1,154) | ||
| Exchange rate and other adjustments | 2 | 4 | 62 | 68 | ||
| Total provision for ECL on loans and credit commitments as at 30 September 2019 | 884 | 1,674 | 1,355 | - | - | 3,913 |
| Presented as: | ||||||
| Provision for ECL loans | 763 | 1,496 | 1,349 | 3,608 | ||
| Provision for ECL credit commitments | 121 | 178 | 6 | 305 | ||
| Total provision for ECL on loans and credit commitments as at 30 September 2019 | 884 | 1,674 | 1,355 | - | - | 3,913 |
| Of which: | ||||||
| Individually assessed provisions | 412 | 412 | ||||
| Collectively assessed provisions | 884 | 1,674 | 943 | 3,501 | ||
| Total provision for ECL on loans and credit commitments as at 30 September 2019 | 884 | 1,674 | 1,355 | - | - | 3,913 |
| Provision for ECL on debt securities at amortised cost | 9 | - | - | 9 | ||
| Provision for ECL on debt securities at FVOCI1 | 2 | - | - | 2 | ||
| Total provision for ECL as at 30 September 2019 | 895 | 1,674 | 1,355 | - | - | 3,924 |
| 1 | Impairment of debt securities at Fair Value through Other Comprehensive Income (FVOCI) is recognised in the income statement with a corresponding amount in other comprehensive income. There is no reduction of the carrying value of the debt securities which remain at fair value. |
| | Westpac Group March 2020 Pillar 3 report |31 |
Pillar 3 report Credit risk management |
| Non-performing | Collectively Assessed Provision | Individually Assessed Provision | |||||
| 31 March 2019 | Performing | CAP | IAP | ||||
| $m | Stage 1 | Stage 2 | Stage 3 | Total | |||
| Provision for impairment charges as at 30 September 2018 | 2,631 | 422 | 3,053 | ||||
| Restatement for adoption of AASB 9 | 877 | 1,884 | 850 | 422 | (2,631) | (422) | 980 |
| Restated provision for ECL as at 1 October 2018 | 877 | 1,884 | 850 | 422 | - | - | 4,033 |
| Net changes in provisions | 34 | (182) | 457 | 94 | 403 | ||
| Write-offs | - | - | (418) | (81) | (499) | ||
| Exchange rate and other adjustments | 5 | 9 | 36 | (2) | 48 | ||
| Total provision for ECL on loans and credit commitments as at 31 March 2019 | 916 | 1,711 | 925 | 433 | 3,985 | ||
| Provision for ECL on debt securities at amortised cost | 10 | 10 | |||||
| Provision for ECL on debt securities at FVOCI1 | 2 | 2 | |||||
| Total provision for ECL as at 31 March 2019 | 928 | 1,711 | 925 | 433 | 3,997 | ||
| 1 | Impairment of debt securities at Fair Value through Other Comprehensive Income (FVOCI) is recognised in the income statement with a corresponding amount in other comprehensive income. There is no reduction of the carrying value of the debt securities which remain at fair value. |
| 32| Westpac Group March 2020 Pillar 3 report | |
Pillar 3 report Credit risk exposures |
The following tables segment the portfolio by characteristics that provide an insight into the assessment of credit risk concentration.
Exposure at Default by major type
| 31 March 2020 | On balance | Off-balance sheet | Total Exposure | Average | |
| $m | sheet | Non-market related | Market related | at Default | 6 months ended1 |
| Corporate | 69,038 | 57,950 | 19,541 | 146,529 | 140,586 |
| Business lending | 42,083 | 12,345 | - | 54,428 | 54,546 |
| Sovereign | 119,847 | 1,857 | 5,360 | 127,064 | 102,570 |
| Bank | 14,899 | �� 2,415 | 9,319 | 26,633 | 27,505 |
| Residential mortgages | 486,270 | 67,596 | - | 553,866 | 555,459 |
| Australian credit cards | 8,218 | 10,383 | - | 18,601 | 18,434 |
| Other retail | 11,881 | 3,342 | - | 15,223 | 15,607 |
| Small business | 26,181 | 7,000 | - | 33,181 | 33,311 |
| Specialised lending | 54,066 | 9,750 | 2,050 | 65,866 | 65,739 |
| Securitisation2 | 22,690 | 5,276 | 131 | 28,097 | 27,269 |
| Standardised | 13,476 | 1,162 | 4,978 | 19,616 | 19,992 |
| Total | 868,649 | 179,076 | 41,379 | 1,089,104 | 1,061,018 |
| 30 September 2019 | On balance | Off-balance sheet | Total Exposure | Average | |
| $m | sheet | Non-market related | Market related | at Default | 12 months ended3 |
| Corporate | 63,994 | 58,903 | 16,276 | 139,173 | 134,619 |
| Business lending | 42,385 | 12,185 | - | 54,570 | 54,532 |
| Sovereign | 80,891 | 1,711 | 8,358 | 90,960 | 81,034 |
| Bank | 16,291 | 2,026 | 10,444 | 28,761 | 25,672 |
| Residential mortgages | 485,049 | 73,969 | - | 559,018 | 557,762 |
| Australian credit cards | 8,720 | 8,821 | - | 17,541 | 18,847 |
| Other retail | 12,415 | 3,536 | - | 15,951 | 16,628 |
| Small business | 26,520 | 6,845 | - | 33,365 | 33,326 |
| Specialised lending | 52,745 | 10,761 | 2,047 | 65,553 | 65,495 |
| Securitisation2 | 22,559 | 4,037 | 178 | 26,774 | 26,683 |
| Standardised | 13,459 | 1,131 | 7,922 | 22,512 | 18,657 |
| Total | 825,028 | 183,925 | 45,225 | 1,054,178 | 1,033,255 |
| 31 March 2019 | On balance | Off-balance sheet | Total Exposure | Average | |
| $m | sheet | Non-market related | Market related | at Default | 6 months ended4 |
| Corporate | 66,944 | 57,852 | 10,706 | 135,502 | 133,079 |
| Business lending | 41,345 | 12,954 | - | 54,299 | 54,272 |
| Sovereign | 75,685 | 1,487 | 2,400 | 79,572 | 78,014 |
| Bank | 16,034 | 2,184 | 7,253 | 25,471 | 24,458 |
| Residential mortgages | 482,670 | 75,491 | - | 558,161 | 555,897 |
| Australian credit cards | 9,575 | 9,275 | - | 18,850 | 19,401 |
| Other retail | 13,145 | 3,438 | - | 16,583 | 16,938 |
| Small business | 26,246 | 7,034 | - | 33,280 | 33,279 |
| Specialised lending | 52,780 | 10,918 | 1,083 | 64,781 | 66,132 |
| Securitisation2 | 20,767 | 4,997 | 165 | 25,929 | 26,824 |
| Standardised | 13,641 | 1,195 | 2,553 | 17,389 | 17,839 |
| Total | 818,832 | 186,825 | 24,160 | 1,029,817 | 1,026,133 |
| 1 | Average is based on exposures as at 31 March 2020, 31 December 2019, and 30 September 2019. |
| 2 | EAD associated with securitisations is for the banking book only. |
| 3 | Average is based on exposures as at 30 September 2019, 30 June 2019, 31 March 2019, 31 December 2018, and 30 September 2018. |
| 4 | Average is based on exposures as at 31 March 2019, 31 December 2018, and 30 September 2018. |
| | Westpac Group March 2020 Pillar 3 report |33 |
Pillar 3 report Credit risk exposures |
Exposure at Default by measurement method
| 31 March 2020 | IRB | Standardised | Total Exposure |
| $m | Approach | Approach | at Default |
| Corporate | 146,529 | 8,133 | 154,662 |
| Business lending | 54,428 | 975 | 55,403 |
| Sovereign | 127,064 | 1,354 | 128,418 |
| Bank | 26,633 | 60 | 26,693 |
| Residential mortgages | 553,866 | 6,844 | 560,710 |
| Australian credit cards | 18,601 | - | 18,601 |
| Other retail | 15,223 | 1,758 | 16,981 |
| Small business | 33,181 | - | 33,181 |
| Specialised lending | 65,866 | 492 | 66,358 |
| Securitisation | 28,097 | - | 28,097 |
| Total | 1,069,488 | 19,616 | 1,089,104 |
| 30 September 2019 | IRB | Standardised | Total Exposure |
| $m | Approach | Approach | at Default |
| Corporate | 139,173 | 10,580 | 149,753 |
| Business lending | 54,570 | 931 | 55,501 |
| Sovereign | 90,960 | 1,069 | 92,029 |
| Bank | 28,761 | 53 | 28,814 |
| Residential mortgages | 559,018 | 7,298 | 566,316 |
| Australian credit cards | 17,541 | - | 17,541 |
| Other retail | 15,951 | 2,074 | 18,025 |
| Small business | 33,365 | - | 33,365 |
| Specialised lending | 65,553 | 507 | 66,060 |
| Securitisation | 26,774 | - | 26,774 |
| Total | 1,031,666 | 22,512 | 1,054,178 |
| 31 March 2019 | IRB | Standardised | Total Exposure |
| $m | Approach | Approach | at Default |
| Corporate | 135,502 | 5,044 | 140,546 |
| Business lending | 54,299 | 975 | 55,274 |
| Sovereign | 79,572 | 1,042 | 80,614 |
| Bank | 25,471 | 31 | 25,502 |
| Residential mortgages | 558,161 | 7,700 | 565,861 |
| Australian credit cards | 18,850 | - | 18,850 |
| Other retail | 16,583 | 2,160 | 18,743 |
| Small business | 33,280 | - | 33,280 |
| Specialised lending | 64,781 | 437 | 65,218 |
| Securitisation | 25,929 | - | 25,929 |
| Total | 1,012,428 | 17,389 | 1,029,817 |
| 34| Westpac Group March 2020 Pillar 3 report | |
Pillar 3 report Credit risk exposures |
Exposure at Default by industry classification
| 31 March 2020 $m | Accommodation, cafes & restaurants | Agriculture, forestry & fishing | Construction | Finance & insurance | Government administration & defence | Manufacturing | Mining | Property | Property services & business services | Services1 | Trade2 | Transport & storage | Utilities3 | Retail lending | Other | Total Exposure at Default |
| Corporate | 2,458 | 11,349 | 3,320 | 17,822 | 1,170 | 23,828 | 8,341 | 7,092 | 10,550 | 11,845 | 21,970 | 13,018 | 12,866 | - | 900 | 146,529 |
| Business lending | 5,853 | 8,759 | 4,280 | 2,437 | 19 | 4,842 | 544 | 1,230 | 6,794 | 5,914 | 8,929 | 2,435 | 505 | - | 1,887 | 54,428 |
| Sovereign | - | 1 | - | 47,479 | 79,069 | 8 | 95 | 146 | 6 | 187 | - | 60 | 13 | - | - | 127,064 |
| Bank | - | - | - | 26,582 | - | - | - | - | 50 | - | - | 1 | - | - | - | 26,633 |
| Residential mortgages | - | - | - | - | - | - | - | - | - | - | - | - | - | 553,866 | - | 553,866 |
| Australian credit cards | - | - | - | - | - | - | - | - | - | - | - | - | - | 18,601 | - | 18,601 |
| Other retail | - | - | - | - | - | - | - | - | - | - | - | - | - | 15,223 | - | 15,223 |
| Small business | 973 | 2,378 | 4,111 | 1,779 | 699 | 1,776 | 568 | 2,176 | 5,242 | 3,650 | 3,354 | 1,840 | 363 | - | 4,272 | 33,181 |
| Specialised lending | 489 | 19 | 32 | 22 | - | 4 | 823 | 56,845 | 26 | 1,272 | 17 | 3,340 | 2,426 | - | 551 | 65,866 |
| Securitisation | - | - | - | 26,432 | - | 162 | - | - | 1,236 | - | 267 | - | - | - | - | 28,097 |
| Standardised | 132 | 27 | 176 | 7,358 | 1,354 | 240 | 62 | 494 | 142 | 60 | 694 | 198 | 23 | 8,601 | 55 | 19,616 |
| Total | 9,905 | 22,533 | 11,919 | 129,911 | 82,311 | 30,860 | 10,433 | 67,983 | 24,046 | 22,928 | 35,231 | 20,892 | 16,196 | 596,291 | 7,665 | 1,089,104 |
1 Includes education, health & community services, cultural & recreational services and personal & other services.
2 Includes wholesale trade and retail trade.
3 Includes electricity, gas & water, and communication services.
| | Westpac Group March 2020 Pillar 3 report |35 |
Pillar 3 report Credit risk exposures |
| 30 September 2019 $m | Accommodation, cafes & restaurants | Agriculture, forestry & fishing | Construction | Finance & insurance | Government administration & defence | Manufacturing | Mining | Property | Property services & business services | Services1 | Trade2 | Transport & storage | Utilities3 | Retail lending | Other | Total Exposure at Default |
| Corporate | 2,450 | 10,290 | 3,192 | 15,986 | 164 | 24,250 | 7,963 | 6,274 | 11,692 | 10,719 | 22,345 | 10,815 | 12,068 | - | 965 | 139,173 |
| Business lending | 5,691 | 8,277 | 4,272 | 2,541 | 14 | 4,709 | 629 | 1,331 | 6,710 | 5,969 | 9,022 | 2,647 | 434 | - | 2,324 | 54,570 |
| Sovereign | - | 1 | - | 21,720 | 68,586 | 126 | 95 | 139 | 6 | 168 | - | 57 | 62 | - | - | 90,960 |
| Bank | - | - | - | 28,557 | 20 | - | - | - | 138 | - | - | 46 | - | - | - | 28,761 |
| Residential mortgages | - | - | - | - | - | - | - | - | - | - | - | - | - | 559,018 | - | 559,018 |
| Australian credit cards | - | - | - | - | - | - | - | - | - | - | - | - | - | 17,541 | - | 17,541 |
| Other retail | - | - | - | - | - | - | - | - | - | - | - | - | - | 15,951 | - | 15,951 |
| Small business | 991 | 2,401 | 4,153 | 1,847 | 649 | 1,771 | 555 | 2,221 | 5,271 | 3,522 | 3,404 | 1,860 | 366 | - | 4,354 | 33,365 |
| Specialised lending | 479 | 18 | 38 | 23 | - | 7 | 955 | 55,984 | 27 | 1,296 | 15 | 3,424 | 2,696 | - | 591 | 65,553 |
| Securitisation | - | - | - | 25,115 | - | 148 | - | - | 1,238 | - | 250 | - | - | - | 23 | 26,774 |
| Standardised | 114 | 22 | 170 | 9,778 | 1,069 | 245 | 12 | 511 | 142 | 56 | 721 | 199 | 11 | 9,373 | 89 | 22,512 |
| Total | 9,725 | 21,009 | 11,825 | 105,567 | 70,502 | 31,256 | 10,209 | 66,460 | 25,224 | 21,730 | 35,757 | 19,048 | 15,637 | 601,883 | 8,346 | 1,054,178 |
1 Includes education, health & community services, cultural & recreational services and personal & other services.
2 Includes wholesale trade and retail trade.
3 Includes electricity, gas & water, and communication services.
| 36| Westpac Group March 2020 Pillar 3 report | |
Pillar 3 report Credit risk exposures |
| 31 March 2019 $m | Accommodation, cafes & restaurants | Agriculture, forestry & fishing | Construction | Finance & insurance | Government administration & defence | Manufacturing | Mining | Property | Property services & business services | Services1 | Trade2 | Transport & storage | Utilities3 | Retail lending | Other | Total Exposure at Default |
| Corporate | 2,451 | 10,197 | 3,133 | 13,095 | 135 | 23,873 | 7,292 | 7,192 | 11,170 | 11,395 | 21,845 | 10,414 | 11,905 | - | 1,405 | 135,502 |
| Business lending | 5,724 | 7,945 | 4,197 | 2,520 | 6 | 4,710 | 577 | 987 | 6,619 | 6,118 | 9,117 | 2,663 | 450 | - | 2,666 | 54,299 |
| Sovereign | - | 1 | - | 15,659 | 63,308 | 128 | 92 | - | 104 | 164 | - | 55 | 59 | - | 2 | 79,572 |
| Bank | - | - | - | 25,249 | 20 | 15 | - | - | 187 | - | - | - | - | - | - | 25,471 |
| Residential mortgages | - | - | - | - | - | - | - | - | - | - | - | - | - | 558,161 | - | 558,161 |
| Australian credit cards | - | - | - | - | - | - | - | - | - | - | - | - | - | 18,850 | - | 18,850 |
| Other retail | - | - | - | - | - | - | - | - | - | - | - | - | - | 16,583 | - | 16,583 |
| Small business | 1,002 | 2,456 | 4,013 | 1,859 | 552 | 1,579 | 275 | 2,280 | 5,195 | 3,366 | 3,401 | 1,806 | 285 | - | 5,211 | 33,280 |
| Specialised lending | 619 | 6 | 259 | 34 | - | 14 | 992 | 55,533 | 31 | 1,668 | 5 | 3,038 | 2,051 | - | 531 | 64,781 |
| Securitisation | - | - | - | 24,492 | - | - | - | - | 1,219 | - | 218 | - | - | - | - | 25,929 |
| Standardised | 121 | 24 | 198 | 4,163 | 1,042 | 274 | 13 | 441 | 152 | 63 | 735 | 203 | 12 | 9,859 | 89 | 17,389 |
| Total | 9,917 | 20,629 | 11,800 | 87,071 | 65,063 | 30,593 | 9,241 | 66,433 | 24,677 | 22,774 | 35,321 | 18,179 | 14,762 | 603,453 | 9,904 | 1,029,817 |
1 Includes education, health & community services, cultural & recreational services and personal & other services.
2 Includes wholesale trade and retail trade.
3 Includes electricity, gas & water, and communication services.
| | Westpac Group March 2020 Pillar 3 report |37 |
Pillar 3 report Credit risk exposures |
Exposure at Default by geography1
| 31 March 2020 | Total Exposure | ||||||
| $m | Australia | New Zealand | Americas | Asia | Europe | Pacific | at Default |
| Corporate | 86,984 | 24,577 | 10,991 | 16,829 | 7,148 | - | 146,529 |
| Business lending | 49,307 | 5,121 | - | - | - | - | 54,428 |
| Sovereign | 97,932 | 10,359 | 16,633 | 1,655 | 485 | - | 127,064 |
| Bank | 20,388 | 2,408 | 139 | 3,646 | 52 | - | 26,633 |
| Residential mortgages | 494,238 | 59,404 | - | 224 | - | - | 553,866 |
| Australian credit cards | 18,601 | - | - | - | - | - | 18,601 |
| Other retail | 11,784 | 3,439 | - | - | - | - | 15,223 |
| Small business | 30,646 | 2,534 | - | 1 | - | - | 33,181 |
| Specialised lending | 57,147 | 8,673 | 46 | - | - | - | 65,866 |
| Securitisation | 23,627 | 4,106 | - | 364 | - | - | 28,097 |
| Standardised | 16,207 | - | - | 42 | - | 3,367 | 19,616 |
| Total | 906,861 | 120,621 | 27,809 | 22,761 | 7,685 | 3,367 | 1,089,104 |
| 30 September 2019 | Total Exposure | ||||||
| $m | Australia | New Zealand | Americas | Asia | Europe | Pacific | at Default |
| Corporate | 83,966 | 22,251 | 8,849 | 17,077 | 7,030 | - | 139,173 |
| Business lending | 49,891 | 4,679 | - | - | - | - | 54,570 |
| Sovereign | 73,168 | 7,634 | 8,054 | 2,079 | 25 | - | 90,960 |
| Bank | 24,033 | 1,171 | 132 | 3,379 | 46 | - | 28,761 |
| Residential mortgages | 504,152 | 54,633 | - | 233 | - | - | 559,018 |
| Australian credit cards | 17,541 | - | - | - | - | - | 17,541 |
| Other retail | 12,297 | 3,654 | - | - | - | - | 15,951 |
| Small business | 30,958 | 2,406 | - | 1 | - | - | 33,365 |
| Specialised lending | 57,128 | 8,396 | 29 | - | - | - | 65,553 |
| Securitisation | 23,009 | 3,604 | - | 161 | - | - | 26,774 |
| Standardised | 19,284 | - | - | 192 | - | 3,036 | 22,512 |
| Total | 895,427 | 108,428 | 17,064 | 23,122 | 7,101 | 3,036 | 1,054,178 |
| 31 March 2019 | Total Exposure | ||||||
| $m | Australia | New Zealand | Americas | Asia | Europe | Pacific | at Default |
| Corporate | 86,093 | 22,115 | 7,278 | 16,691 | 3,325 | - | 135,502 |
| Business lending | 49,609 | 4,690 | - | - | - | - | 54,299 |
| Sovereign | 56,268 | 6,917 | 15,940 | 447 | - | - | 79,572 |
| Bank | 20,760 | 1,265 | 113 | 3,301 | 32 | - | 25,471 |
| Residential mortgages | 503,271 | 54,647 | - | 243 | - | - | 558,161 |
| Australian credit cards | 18,850 | - | - | - | - | - | 18,850 |
| Other retail | 12,915 | 3,668 | - | - | - | - | 16,583 |
| Small business | 30,781 | 2,498 | - | 1 | - | - | 33,280 |
| Specialised lending | 57,042 | 7,739 | - | - | - | - | 64,781 |
| Securitisation | 22,263 | 3,490 | - | 176 | - | - | 25,929 |
| Standardised | 14,113 | - | - | 315 | - | 2,961 | 17,389 |
| Total | 871,965 | 107,029 | 23,331 | 21,174 | 3,357 | 2,961 | 1,029,817 |
| 1 | Geographic segmentation of exposures is based on the location of the office in which these items were booked. |
| 38| Westpac Group March 2020 Pillar 3 report | |
Pillar 3 report Credit risk exposures |
Exposure at Default by residual contractual maturity
| 31 March 2020 | Total Exposure | |||||
| $m | On demand | < 12 months | 1 to < 3 years | 3 to < 5 years | > 5 years | at Default |
| Corporate | 18,087 | 27,376 | 71,404 | 23,057 | 6,605 | 146,529 |
| Business lending | 3,081 | 13,297 | 23,945 | 5,912 | 8,193 | 54,428 |
| Sovereign | 1,899 | 44,635 | 18,625 | 22,685 | 39,220 | 127,064 |
| Bank | 5,188 | 4,025 | 15,961 | 1,390 | 69 | 26,633 |
| Residential mortgages | 28,723 | 4,658 | 13,725 | 2,760 | 504,000 | 553,866 |
| Australian credit cards | 18,601 | - | - | - | - | 18,601 |
| Other retail | 3,218 | 388 | 5,206 | 4,267 | 2,144 | 15,223 |
| Small business | 4,658 | 2,786 | 9,028 | 8,224 | 8,485 | 33,181 |
| Specialised lending | 408 | 19,699 | 32,119 | 9,198 | 4,442 | 65,866 |
| Securitisation | - | 1,706 | 12,585 | 2,075 | 11,731 | 28,097 |
| Standardised | 1,574 | 398 | 10,150 | 252 | 7,242 | 19,616 |
| Total | 85,437 | 118,968 | 212,748 | 79,820 | 592,131 | 1,089,104 |
| 30 September 2019 | Total Exposure | |||||
| $m | On demand | < 12 months | 1 to < 3 years | 3 to < 5 years | > 5 years | at Default |
| Corporate | 18,487 | 25,871 | 68,603 | 21,668 | 4,544 | 139,173 |
| Business lending | 3,051 | 13,550 | 23,455 | 6,386 | 8,128 | 54,570 |
| Sovereign | 1,774 | 21,634 | 19,742 | 18,643 | 29,167 | 90,960 |
| Bank | 3,971 | 3,599 | 18,880 | 2,214 | 97 | 28,761 |
| Residential mortgages | 36,004 | 4,501 | 15,235 | 2,731 | 500,547 | 559,018 |
| Australian credit cards | 17,541 | - | - | - | - | 17,541 |
| Other retail | 3,392 | 367 | 5,407 | 4,484 | 2,301 | 15,951 |
| Small business | 4,671 | 2,679 | 9,105 | 8,252 | 8,658 | 33,365 |
| Specialised lending | 451 | 21,120 | 30,001 | 8,438 | 5,543 | 65,553 |
| Securitisation | - | 6,991 | 6,331 | 2,024 | 11,428 | 26,774 |
| Standardised | 1,860 | 1,025 | 11,821 | 244 | 7,562 | 22,512 |
| Total | 91,202 | 101,337 | 208,580 | 75,084 | 577,975 | 1,054,178 |
| 31 March 2019 | Total Exposure | |||||
| $m | On demand | < 12 months | 1 to < 3 years | 3 to < 5 years | > 5 years | at Default |
| Corporate | 17,387 | 30,995 | 55,391 | 24,342 | 7,387 | 135,502 |
| Business lending | 3,100 | 13,618 | 22,948 | 6,491 | 8,142 | 54,299 |
| Sovereign | 1,743 | 22,234 | 12,947 | 13,797 | 28,851 | 79,572 |
| Bank | 3,324 | 7,607 | 10,856 | 3,000 | 684 | 25,471 |
| Residential mortgages | 36,648 | 4,599 | 17,922 | 2,850 | 496,142 | 558,161 |
| Australian credit cards | 18,850 | - | - | - | - | 18,850 |
| Other retail | 3,315 | 381 | 5,651 | 4,738 | 2,498 | 16,583 |
| Small business | 4,759 | 2,645 | 8,993 | 8,188 | 8,695 | 33,280 |
| Specialised lending | 532 | 23,732 | 28,985 | 6,904 | 4,628 | 64,781 |
| Securitisation | 2 | 4,244 | 9,076 | 1,856 | 10,751 | 25,929 |
| Standardised | 1,933 | 1,248 | 4,832 | 644 | 8,732 | 17,389 |
| Total | 91,593 | 111,303 | 177,601 | 72,810 | 576,510 | 1,029,817 |
| | Westpac Group March 2020 Pillar 3 report |39 |
Pillar 3 report Credit risk exposures |
Impaired and past due loans
The following tables disclose the crystallisation of credit risk as impairment and loss. Analysis of exposures defaulted not impaired, impaired loans, related provisions and actual losses are broken down by concentrations reflecting Westpac’s asset categories, industry and geography.
Impaired and past due loans by portfolio
| Specific | Specific | Actual | |||
| 31 March 2020 | Defaulted | Impaired | Provisions for | Provisions to | Losses for the |
| $m | not impaired1 | Loans | Impaired Loans | Impaired Loans | 6 months ended |
| Corporate | 91 | 363 | 232 | 64% | (4) |
| Business lending | 474 | 347 | 195 | 56% | 35 |
| Sovereign | - | - | - | - | - |
| Bank | - | - | - | - | - |
| Residential mortgages | 4,050 | 404 | 114 | 28% | 67 |
| Australian credit cards | - | 123 | 92 | 75% | 164 |
| Other retail | - | 312 | 218 | 70% | 135 |
| Small business | 359 | 501 | 183 | 37% | 39 |
| Specialised lending | 357 | 52 | 26 | 50% | 1 |
| Securitisation | - | - | - | - | - |
| Standardised | 78 | 52 | 19 | 37% | - |
| Total | 5,409 | 2,154 | 1,079 | 50% | 437 |
| Specific | Specific | Actual | |||
| 30 September 2019 | Defaulted | Impaired | Provisions for | Provisions to | Losses for the |
| $m | not impaired1 | Loans | Impaired Loans | Impaired Loans | 12 months ended |
| Corporate | 98 | 135 | 50 | 37% | 30 |
| Business lending | 455 | 316 | 168 | 53% | 54 |
| Sovereign | - | - | - | - | - |
| Bank | - | - | - | - | - |
| Residential mortgages | 3,839 | 414 | 127 | 31% | 111 |
| Australian credit cards | - | 121 | 80 | 66% | 340 |
| Other retail | - | 283 | 165 | 58% | 354 |
| Small business | 345 | 367 | 152 | 41% | 78 |
| Specialised lending | 279 | 69 | 29 | 42% | 13 |
| Securitisation | - | - | - | - | - |
| Standardised | 72 | 58 | 21 | 36% | 2 |
| Total | 5,088 | 1,763 | 792 | 45% | 982 |
| Specific | Specific | Actual | |||
| 31 March 2019 | Defaulted | Impaired | Provisions for | Provisions to | Losses for the |
| $m | not impaired1 | Loans | Impaired Loans | Impaired Loans | 6 months ended |
| Corporate | 108 | 176 | 79 | 45% | (3) |
| Business lending | 380 | 279 | 161 | 58% | 23 |
| Sovereign | - | - | - | - | - |
| Bank | - | - | - | - | - |
| Residential mortgages | 3,376 | 391 | 126 | 32% | 52 |
| Australian credit cards | - | 101 | 63 | 62% | 150 |
| Other retail | - | 297 | 173 | 58% | 162 |
| Small business | 310 | 374 | 148 | 40% | 33 |
| Specialised lending | 314 | 118 | 44 | 37% | 10 |
| Securitisation | - | - | - | - | - |
| Standardised | 34 | 13 | 6 | 46% | 1 |
| Total | 4,522 | 1,749 | 800 | 46% | 428 |
| 1 | Includes items past 90 days not impaired. |
| 40| Westpac Group March 2020 Pillar 3 report | |
Pillar 3 report Credit risk exposures |
Impaired and past due loans by industry classification
| Specific | Specific | Actual | |||
| 31 March 2020 | Defaulted | Impaired | Provisions for | Provisions to | Losses for the |
| $m | not impaired1 | Loans | Impaired Loans | Impaired Loans | 6 months ended |
| Accommodation, cafes & restaurants | 109 | 37 | 18 | 49% | 7 |
| Agriculture, forestry & fishing | 233 | 90 | 34 | 38% | 3 |
| Construction | 50 | 107 | 45 | 42% | 9 |
| Finance & insurance | 29 | 62 | 44 | 71% | 5 |
| Government administration & defence | - | - | - | - | - |
| Manufacturing | 81 | 221 | 149 | 67% | 7 |
| Mining | 6 | 17 | 6 | 35% | (1) |
| Property | 284 | 77 | 39 | 51% | 10 |
| Property services & business services | 83 | 130 | 67 | 52% | 9 |
| Services2 | 243 | 72 | 38 | 53% | 4 |
| Trade3 | 124 | 327 | 152 | 46% | 6 |
| Transport & storage | 27 | 72 | 25 | 35% | 9 |
| Utilities4 | 2 | 7 | 2 | 29% | - |
| Retail lending | 4,097 | 851 | 431 | 51% | 366 |
| Other | 41 | 84 | 29 | 35% | 3 |
| Total | 5,409 | 2,154 | 1,079 | 50% | 437 |
| Specific | Specific | Actual | |||
| 30 September 2019 | Defaulted | Impaired | Provisions for | Provisions to | Losses for the |
| $m | not impaired1 | Loans | Impaired Loans | Impaired Loans | 12 months ended |
| Accommodation, cafes & restaurants | 84 | 28 | 14 | 50% | 12 |
| Agriculture, forestry & fishing | 233 | 60 | 25 | 42% | 6 |
| Construction | 55 | 98 | 41 | 42% | 12 |
| Finance & insurance | 27 | 30 | 19 | 63% | 4 |
| Government administration & defence | - | - | - | - | - |
| Manufacturing | 35 | 54 | 29 | 54% | 11 |
| Mining | 9 | 17 | 7 | 41% | (1) |
| Property | 212 | 101 | 47 | 47% | 23 |
| Property services & business services | 76 | 103 | 53 | 51% | 23 |
| Services2 | 285 | 66 | 37 | 56% | 5 |
| Trade3 | 118 | 265 | 87 | 33% | 63 |
| Transport & storage | 18 | 68 | 25 | 37% | 13 |
| Utilities4 | 3 | 5 | 1 | 20% | 1 |
| Retail lending | 3,887 | 830 | 378 | 46% | 805 |
| Other | 46 | 38 | 29 | 76% | 5 |
| Total | 5,088 | 1,763 | 792 | 45% | 982 |
| Specific | Specific | Actual | |||
| 31 March 2019 | Defaulted | Impaired | Provisions for | Provisions to | Losses for the |
| $m | not impaired1 | Loans | Impaired Loans | Impaired Loans | 6 months ended |
| Accommodation, cafes & restaurants | 88 | 31 | 14 | 45% | 6 |
| Agriculture, forestry & fishing | 242 | 74 | 29 | 39% | 2 |
| Construction | 53 | 78 | 40 | 51% | 6 |
| Finance & insurance | 26 | 33 | 24 | 73% | 2 |
| Government administration & defence | - | - | - | - | - |
| Manufacturing | 29 | 76 | 46 | 61% | 2 |
| Mining | 8 | 15 | 7 | 47% | (1) |
| Property | 185 | 151 | 58 | 38% | 13 |
| Property services & business services | 59 | 96 | 50 | 52% | 9 |
| Services2 | 277 | 50 | 29 | 58% | 1 |
| Trade3 | 124 | 228 | 83 | 36% | 11 |
| Transport & storage | 17 | 59 | 24 | 41% | 8 |
| Utilities4 | 3 | 3 | 1 | 33% | - |
| Retail lending | 3,386 | 791 | 363 | 46% | 366 |
| Other | 25 | 64 | 32 | 50% | 3 |
| Total | 4,522 | 1,749 | 800 | 46% | 428 |
| 1 | Includes items past 90 days not impaired. |
| 2 | Includes education, health & community services, cultural & recreational services and personal & other services. |
| 3 | Includes wholesale trade and retail trade. |
| 4 | Includes electricity, gas & water, and communication services. |
| | Westpac Group March 2020 Pillar 3 report |41 |
Pillar 3 report Credit risk exposures |
Impaired and past due loans by geography1
| Specific | Specific | Actual | |||
| 31 March 2020 | Defaulted | Impaired | Provisions for | Provisions to | Losses for the |
| $m | not impaired2 | Loans | Impaired Loans | Impaired Loans | 6 months ended |
| Australia | 4,964 | 1,681 | 818 | 49% | 423 |
| New Zealand | 390 | 208 | 99 | 48% | 13 |
| Americas | - | - | - | - | - |
| Asia | 2 | 216 | 145 | 67% | - |
| Europe | - | - | - | - | - |
| Pacific | 53 | 49 | 17 | 35% | 1 |
| Total | 5,409 | 2,154 | 1,079 | 50% | 437 |
| Specific | Specific | Actual | |||
| 30 September 2019 | Defaulted | Impaired | Provisions for | Provisions to | Losses for the |
| $m | not impaired2 | Loans | Impaired Loans | Impaired Loans | 12 months ended |
| Australia | 4,684 | 1,615 | 730 | 45% | 944 |
| New Zealand | 340 | 94 | 44 | 47% | 36 |
| Americas | - | - | - | - | - |
| Asia | 18 | - | - | - | - |
| Europe | - | - | - | - | - |
| Pacific | 46 | 54 | 18 | 33% | 2 |
| Total | 5,088 | 1,763 | 792 | 45% | 982 |
| Specific | Specific | Actual | |||
| 31 March 2019 | Defaulted | Impaired | Provisions for | Provisions to | Losses for the |
| $m | not impaired2 | Loans | Impaired Loans | Impaired Loans | 6 months ended |
| Australia | 4,295 | 1,595 | 734 | 46% | 414 |
| New Zealand | 192 | 140 | 60 | 43% | 13 |
| Americas | - | - | - | - | - |
| Asia | - | - | - | - | - |
| Europe | - | - | - | - | - |
| Pacific | 35 | 14 | 6 | 43% | 1 |
| Total | 4,522 | 1,749 | 800 | 46% | 428 |
| 1 | Geographic segmentation of exposures is based on the location of the office in which these items were booked. |
| 2 | Includes items past 90 days not impaired. |
| 42| Westpac Group March 2020 Pillar 3 report | |
Pillar 3 report Credit risk exposures |
Portfolios subject to the standardised approach
This table presents exposures subject to the standardised approach for the calculation of risk weighted assets.
As at 31 March 2020, exposures subject to the standardised approach and categorised by risk weight are primarily Westpac Pacific, Asian retail exposures, the margin lending portfolio, self-managed superannuation fund exposures and some other small portfolios. Mark-to-market related credit risk and qualifying central clearing counterparties exposure1is also included in the standardised approach.
| 31 March 2020 | Total Exposure | Risk Weighted |
| Risk Weight % | at Default $m | Assets $m |
| 0% | 1,650 | - |
| 2% | 5,481 | 110 |
| 20% | 1,190 | 238 |
| 35% | 478 | 167 |
| 50% | 1,340 | 670 |
| 75% | 4,631 | 3,473 |
| 100% | 4,651 | 4,651 |
| 150% | 67 | 100 |
| Default fund contributions1 | 128 | 98 |
| Mark-to-market related credit risk | - | 11,289 |
| Total | 19,616 | 20,795 |
| 30 September 2019 | Total Exposure | Risk Weighted |
| Risk Weight % | at Default $m | Assets $m |
| 0% | 1,442 | - |
| 2% | 8,136 | 163 |
| 20% | 1,472 | 294 |
| 35% | 614 | 215 |
| 50% | 1,352 | 676 |
| 75% | 4,884 | 3,663 |
| 100% | 4,435 | 4,435 |
| 150% | 66 | 99 |
| Default fund contributions1 | 111 | 108 |
| Mark-to-market related credit risk | - | 11,313 |
| Total | 22,512 | 20,966 |
| 31 March 2019 | Total Exposure | Risk Weighted |
| Risk Weight % | at Default $m | Assets $m |
| 0% | 1,110 | - |
| 2% | 2,863 | 57 |
| 20% | 1,516 | 303 |
| 35% | 732 | 256 |
| 50% | 1,349 | 675 |
| 75% | 5,108 | 3,832 |
| 100% | 4,554 | 4,554 |
| 150% | 42 | 64 |
| Default fund contributions1 | 115 | 714 |
| Mark-to-market related credit risk | - | 7,110 |
| Total | 17,389 | 17,565 |
| 1 | Portfolios subject to the standardised approach include exposures to qualifying central clearing counterparties used to clear derivative transactions. Derivative counterparty exposure and initial margin are risk weighted at 2%. Default fund contributions to qualifying central clearing counterparties are shown separately and are subject to higher risk weights. |
| | Westpac Group March 2020 Pillar 3 report |43 |
Pillar 3 report Credit risk exposures |
Portfolios subject to supervisory risk-weights in the IRB approach
Exposures subject to supervisory risk-weights in the IRB approach include assets categorised as specialised lending, where a regulatory capital ‘slotting’ approach applies.
Westpac has property finance and project finance credit risk exposures categorised as specialised lending. The ‘Credit Risk Management’ section of this report describes the mapping of Westpac risk grades to both external rating equivalents and regulatory capital ‘slots’.
Property finance
| 31 March 2020 | Exposure at | Regulatory | Risk Weighted | |
| $m | Risk Weight | Default | Expected Loss | Assets |
| Strong | 70% | 23,013 | 92 | 16,110 |
| Good | 90% | 29,436 | 236 | 26,491 |
| Satisfactory | 115% | 4,479 | 125 | 5,151 |
| Weak | 250% | 795 | 64 | 1,988 |
| Default | NA | 297 | 148 | - |
| Total | 58,020 | 665 | 49,740 | |
| 30 September 2019 | Exposure at | Regulatory | Risk Weighted | |
| $m | Risk Weight | Default | Expected Loss | Assets |
| Strong | 70% | 23,270 | 92 | 16,289 |
| Good | 90% | 28,607 | 229 | 25,746 |
| Satisfactory | 115% | 4,383 | 123 | 5,041 |
| Weak | 250% | 729 | 58 | 1,823 |
| Default | NA | 215 | 108 | - |
| Total | 57,204 | 610 | 48,899 | |
| 31 March 2019 | Exposure at | Regulatory | Risk Weighted | |
| $m | Risk Weight | Default | Expected Loss | Assets |
| Strong | 70% | 22,165 | 89 | 15,516 |
| Good | 90% | 29,126 | 233 | 26,213 |
| Satisfactory | 115% | 4,840 | 136 | 5,566 |
| Weak | 250% | 676 | 54 | 1,690 |
| Default | NA | 304 | 152 | - |
| Total | 57,111 | 664 | 48,985 |
| 44| Westpac Group March 2020 Pillar 3 report | |
Pillar 3 report Credit risk exposures |
Project finance
| 31 March 2020 | Exposure at | Regulatory | Risk Weighted | |
| $m | Risk Weight | Default | Expected Loss | Assets |
| Strong | 70% | 5,803 | 23 | 4,063 |
| Good | 90% | 1,064 | 9 | 957 |
| Satisfactory | 115% | 589 | 16 | 677 |
| Weak | 250% | 227 | 18 | 567 |
| Default | NA | 163 | 82 | - |
| Total | 7,846 | 148 | 6,264 | |
| 30 September 2019 | Exposure at | Regulatory | Risk Weighted | |
| $m | Risk Weight | Default | Expected Loss | Assets |
| Strong | 70% | 6,526 | 26 | 4,568 |
| Good | 90% | 1,236 | 10 | 1,112 |
| Satisfactory | 115% | 276 | 8 | 317 |
| Weak | 250% | 146 | 12 | 366 |
| Default | NA | 165 | 82 | - |
| Total | 8,349 | 138 | 6,363 | |
| 31 March 2019 | Exposure at | Regulatory | Risk Weighted | |
| $m | Risk Weight | Default | Expected Loss | Assets |
| Strong | 70% | 5,827 | 23 | 4,079 |
| Good | 90% | 1,328 | 11 | 1,195 |
| Satisfactory | 115% | 217 | 6 | 250 |
| Weak | 250% | 130 | 10 | 325 |
| Default | NA | 168 | 84 | - |
| Total | 7,670 | 134 | 5,849 |
| | Westpac Group March 2020 Pillar 3 report |45 |
Pillar 3 report Credit risk exposures |
Portfolios subject to IRB approaches
In the table below Westpac’s transaction-managed exposures are classified by the external credit rating. Each external credit rating aligns to one or more internally assigned credit risk grades, as outlined in the ‘Credit Risk Management’ section of this report. Westpac’s internal rating scale has more risk grades than does the external rating scale, and as a result, average PD can vary from portfolio to portfolio for the same external grade. Westpac’s program-managed exposures are classified by PD band and the average PD within a band can, likewise, vary from portfolio to portfolio.
For both non-defaulted and defaulted exposures, regulatory expected loss is defined at facility level. For non-defaulted exposures, regulatory expected loss is the product of PD, LGD and EAD while for defaulted exposures, this is the best estimates of loss. Total regulatory expected loss as shown in the table below is the sum of both non-defaulted and defaulted regulatory expected loss and given the difference in methodology, regulatory expected loss reported is not equal to the product of the corresponding reported average PD, average LGD and aggregate EAD.
Corporate portfolio by external credit rating
| Risk | Average | |||||||
| 31 March 2020 | Committed | Exposure | Probability | Loss Given | Regulatory | Weighted | Risk | |
| $m | Outstandings1 | Undrawn2 | at Default | of Default | Default | Expected Loss | Assets | Weight |
| AAA | 101 | - | 101 | 0.01% | 50% | - | 28 | 28% |
| AA | 7,126 | 2,490 | 9,611 | 0.03% | 50% | 1 | 1,487 | 15% |
| A | 19,424 | 13,330 | 32,702 | 0.07% | 52% | 12 | 8,898 | 27% |
| BBB | 39,261 | 22,664 | 61,632 | 0.22% | 49% | 64 | 29,637 | 48% |
| BB | 28,062 | 8,919 | 36,876 | 1.13% | 37% | 152 | 27,522 | 75% |
| B | 1,554 | 209 | 1,719 | 4.78% | 44% | 36 | 2,671 | 155% |
| Other | 2,765 | 616 | 3,382 | 21.23% | 41% | 282 | 7,083 | 209% |
| Subtotal | 98,293 | 48,228 | 146,023 | 0.94% | 46% | 547 | 77,326 | 53% |
| Default | 365 | 142 | 506 | NA | 65% | 240 | 962 | 190% |
| Total | 98,658 | 48,370 | 146,529 | 1.29% | 47% | 787 | 78,288 | 53% |
| Risk | Average | |||||||
| 30 September 2019 | Committed | Exposure | Probability | Loss Given | Regulatory | Weighted | Risk | |
| $m | Outstandings1 | Undrawn2 | at Default | of Default | Default | Expected Loss | Assets | Weight |
| AAA | 109 | 23 | 109 | 0.01% | 49% | - | 27 | 25% |
| AA | 4,223 | 2,292 | 6,001 | 0.03% | 52% | 1 | 843 | 14% |
| A | 18,806 | 18,557 | 31,996 | 0.07% | 54% | 11 | 8,560 | 27% |
| BBB | 37,160 | 24,807 | 61,361 | 0.22% | 49% | 65 | 30,119 | 49% |
| BB | 28,121 | 8,705 | 35,566 | 1.21% | 38% | 160 | 27,679 | 78% |
| B | 1,342 | 92 | 1,428 | 4.27% | 44% | 28 | 2,269 | 159% |
| Other | 1,842 | 603 | 2,447 | 21.59% | 39% | 208 | 4,901 | 200% |
| Subtotal | 91,603 | 55,079 | 138,908 | 0.85% | 47% | 473 | 74,398 | 54% |
| Default | 246 | 17 | 265 | NA | 30% | 50 | 409 | 154% |
| Total | 91,849 | 55,096 | 139,173 | 1.04% | 47% | 523 | 74,807 | 54% |
| Risk | Average | |||||||
| 31 March 2019 | Committed | Exposure | Probability | Loss Given | Regulatory | Weighted | Risk | |
| $m | Outstandings1 | Undrawn2 | at Default | of Default | Default | Expected Loss | Assets | Weight |
| AAA | 52 | - | 52 | 0.01% | 52% | - | 7 | 13% |
| AA | 3,035 | 1,652 | 4,678 | 0.03% | 52% | 1 | 733 | 16% |
| A | 18,095 | 12,562 | 30,668 | 0.07% | 53% | 11 | 8,195 | 27% |
| BBB | 36,124 | 24,101 | 59,979 | 0.22% | 49% | 63 | 29,530 | 49% |
| BB | 27,763 | 8,433 | 36,165 | 1.18% | 39% | 161 | 28,207 | 78% |
| B | 1,186 | 157 | 1,342 | 4.25% | 40% | 23 | 1,795 | 134% |
| Other | 1,731 | 557 | 2,309 | 22.94% | 39% | 209 | 4,638 | 201% |
| Subtotal | 87,986 | 47,462 | 135,193 | 0.86% | 47% | 468 | 73,105 | 54% |
| Default | 295 | 9 | 309 | NA | 37% | 93 | 446 | 144% |
| Total | 88,281 | 47,471 | 135,502 | 1.09% | 47% | 561 | 73,551 | 54% |
| 1 | Outstandings are balances that were drawn down as at the reporting date and include certain off-balance sheet items. |
| 2 | Committed undrawn balances are committed exposures that were not drawn down as at the reporting date. |
| 46| Westpac Group March 2020 Pillar 3 report | |
Pillar 3 report Credit risk exposures |
Business lending portfolio by external credit rating
| Risk | Average | |||||||
| 31 March 2020 | Committed | Exposure | Probability | Loss Given | Regulatory | Weighted | Risk | |
| $m | Outstandings1 | Undrawn2 | at Default | of Default | Default | Expected Loss | Assets | Weight |
| AAA | - | - | - | - | - | - | - | - |
| AA | - | - | - | - | - | - | - | - |
| A | 218 | 65 | 282 | 0.08% | 42% | - | 60 | 21% |
| BBB | 1,469 | 502 | 1,969 | 0.21% | 26% | 1 | 430 | 22% |
| BB | 38,131 | 10,024 | 48,015 | 1.56% | 30% | 221 | 28,438 | 59% |
| B | 1,063 | 142 | 1,206 | 4.78% | 33% | 19 | 1,036 | 86% |
| Other | 1,833 | 266 | 2,099 | 21.74% | 37% | 172 | 3,516 | 168% |
| Subtotal | 42,714 | 10,999 | 53,571 | 2.37% | 30% | 413 | 33,480 | 62% |
| Default | 828 | 26 | 857 | 100.00% | 35% | 256 | 1,013 | 118% |
| Total | 43,542 | 11,025 | 54,428 | 3.90% | 30% | 669 | 34,493 | 63% |
| Risk | Average | |||||||
| 30 September 2019 | Committed | Exposure | Probability | Loss Given | Regulatory | Weighted | Risk | |
| $m | Outstandings1 | Undrawn2 | at Default | of Default | Default | Expected Loss | Assets | Weight |
| AAA | - | - | - | - | - | - | - | - |
| AA | - | - | - | - | - | - | - | - |
| A | 175 | 22 | 196 | 0.09% | 48% | - | 39 | 20% |
| BBB | 1,475 | 491 | 1,964 | 0.22% | 26% | 1 | 433 | 22% |
| BB | 38,439 | 9,938 | 48,228 | 1.57% | 30% | 228 | 29,031 | 60% |
| B | 1,166 | 124 | 1,290 | 4.62% | 32% | 19 | 1,074 | 83% |
| Other | 1,870 | 206 | 2,075 | 22.66% | 38% | 183 | 3,646 | 176% |
| Subtotal | 43,125 | 10,781 | 53,753 | 2.40% | 30% | 431 | 34,223 | 64% |
| Default | 788 | 29 | 817 | NA | 32% | 204 | 1,247 | 153% |
| Total | 43,913 | 10,810 | 54,570 | 3.86% | 30% | 635 | 35,470 | 65% |
| Risk | Average | |||||||
| 31 March 2019 | Committed | Exposure | Probability | Loss Given | Regulatory | Weighted | Risk | |
| $m | Outstandings1 | Undrawn2 | at Default | of Default | Default | Expected Loss | Assets | Weight |
| AAA | - | - | - | - | - | - | - | |
| AA | - | 4 | 4 | 0.03% | 60% | - | - | 0% |
| A | 186 | 26 | 212 | 0.09% | 50% | - | 44 | 21% |
| BBB | 1,480 | 559 | 2,036 | 0.22% | 26% | 1 | 454 | 22% |
| BB | 37,701 | 10,626 | 48,193 | 1.58% | 30% | 231 | 29,303 | 61% |
| B | 1,126 | 138 | 1,263 | 4.66% | 32% | 19 | 1,060 | 84% |
| Other | 1,655 | 196 | 1,851 | 23.74% | 39% | 173 | 3,338 | 180% |
| Subtotal | 42,148 | 11,549 | 53,559 | 2.36% | 30% | 424 | 34,199 | 64% |
| Default | 709 | 20 | 740 | NA | 34% | 218 | 1,095 | 148% |
| Total | 42,857 | 11,569 | 54,299 | 3.69% | 30% | 642 | 35,294 | 65% |
| 1 | Outstandings are balances that were drawn down as at the reporting date and include certain off-balance sheet items. |
| 2 | Committed undrawn balances are committed exposures that were not drawn down as at the reporting date. |
| | Westpac Group March 2020 Pillar 3 report |47 |
Pillar 3 report Credit risk exposures |
Sovereign portfolio by external credit rating
| Risk | Average | |||||||
| 31 March 2020 | Committed | Exposure | Probability | Loss Given | Regulatory | Weighted | Risk | |
| $m | Outstandings1 | Undrawn2 | at Default | of Default | Default | Expected Loss | Assets | Weight |
| AAA | 56,238 | 150 | 60,998 | 0.01% | 6% | - | 718 | 1% |
| AA | 59,725 | 1,160 | 64,805 | 0.02% | 7% | 2 | 1,220 | 2% |
| A | 594 | 233 | 828 | 0.05% | 27% | - | 84 | 10% |
| BBB | 407 | 7 | 414 | 0.21% | 33% | - | 154 | 37% |
| BB | 8 | 11 | 19 | 2.07% | 36% | - | 16 | 84% |
| B | - | - | - | - | - | - | - | - |
| Other | - | - | - | - | - | - | - | - |
| Subtotal | 116,972 | 1,561 | 127,064 | 0.02% | 7% | 2 | 2,192 | 2% |
| Default | - | - | - | NA | - | - | - | - |
| Total | 116,972 | 1,561 | 127,064 | 0.02% | 7% | 2 | 2,192 | 2% |
| Risk | Average | |||||||
| 30 September 2019 | Committed | Exposure | Probability | Loss Given | Regulatory | Weighted | Risk | |
| $m | Outstandings1 | Undrawn2 | at Default | of Default | Default | Expected Loss | Assets | Weight |
| AAA | 40,003 | 143 | 43,383 | 0.01% | 7% | - | 820 | 2% |
| AA | 42,333 | 997 | 46,146 | 0.02% | 7% | 2 | 947 | 2% |
| A | 650 | 245 | 898 | 0.05% | 28% | - | 91 | 10% |
| BBB | 496 | 16 | 512 | 0.24% | 33% | - | 189 | 37% |
| BB | 10 | 10 | 21 | 1.96% | 43% | - | 21 | 100% |
| B | - | - | - | - | - | - | - | - |
| Other | - | - | - | - | - | - | - | - |
| Subtotal | 83,492 | 1,411 | 90,960 | 0.02% | 7% | 2 | 2,068 | 2% |
| Default | - | - | - | NA | - | - | - | - |
| Total | 83,492 | 1,411 | 90,960 | 0.02% | 7% | 2 | 2,068 | 2% |
| Risk | Average | |||||||
| 31 March 2019 | Committed | Exposure | Probability | Loss Given | Regulatory | Weighted | Risk | |
| $m | Outstandings1 | Undrawn2 | at Default | of Default | Default | Expected Loss | Assets | Weight |
| AAA | 33,513 | 140 | 36,401 | 0.01% | 7% | 1 | 601 | 2% |
| AA | 39,349 | 778 | 41,948 | 0.02% | 7% | - | 781 | 2% |
| A | 605 | 222 | 829 | 0.05% | 27% | - | 106 | 13% |
| BBB | 336 | 15 | 352 | 0.25% | 33% | - | 129 | 37% |
| BB | 11 | 27 | 38 | 1.89% | 38% | - | 33 | 87% |
| B | - | - | - | - | 0% | - | - | - |
| Other | - | - | - | - | - | - | - | - |
| Subtotal | 73,814 | 1,182 | 79,568 | 0.02% | 7% | 1 | 1,650 | 2% |
| Default | 4 | - | 4 | NA | 18% | 1 | 3 | 1 |
| Total | 73,818 | 1,182 | 79,572 | 0.02% | 7% | 2 | 1,653 | 2% |
| 1 | Outstandings are balances that were drawn down as at the reporting date and include certain off-balance sheet items. |
| 2 | Committed undrawn balances are committed exposures that were not drawn down as at the reporting date. |
| 48| Westpac Group March 2020 Pillar 3 report | |
Pillar 3 report Credit risk exposures |
Bank portfolio by external credit rating
| Risk | Average | |||||||
| 31 March 2020 | Committed | Exposure | Probability | Loss Given | Regulatory | Weighted | Risk | |
| $m | Outstandings1 | Undrawn2 | at Default | of Default | Default | Expected Loss | Assets | Weight |
| AAA | 625 | 55 | 680 | 0.01% | 11% | - | 24 | 4% |
| AA | 8,861 | 173 | 9,015 | 0.03% | 58% | 2 | 1,762 | 20% |
| A | 14,412 | 473 | 14,800 | 0.05% | 54% | 4 | 4,057 | 27% |
| BBB | 1,984 | 173 | 2,110 | 0.19% | 54% | 3 | 1,091 | 52% |
| BB | 15 | 12 | 27 | 0.60% | 48% | - | 19 | 70% |
| B | - | - | - | - | - | - | - | - |
| Other | 1 | - | 1 | 12.11% | 60% | - | 3 | 300% |
| Subtotal | 25,898 | 886 | 26,633 | 0.05% | 54% | 9 | 6,956 | 26% |
| Default | - | - | - | NA | - | - | - | - |
| Total | 25,898 | 886 | 26,633 | 0.05% | 54% | 9 | 6,956 | 26% |
| Risk | Average | |||||||
| 30 September 2019 | Committed | Exposure | Probability | Loss Given | Regulatory | Weighted | Risk | |
| $m | Outstandings1 | Undrawn2 | at Default | of Default | Default | Expected Loss | Assets | Weight |
| AAA | 515 | - | 516 | 0.01% | 14% | - | 14 | 3% |
| AA | 11,111 | 312 | 11,488 | 0.03% | 58% | 2 | 2,686 | 23% |
| A | 14,278 | 303 | 14,583 | 0.05% | 56% | 5 | 4,328 | 30% |
| BBB | 1,837 | �� 161 | 2,001 | 0.19% | 55% | 2 | 1,082 | 54% |
| BB | 125 | 47 | 172 | 1.58% | 54% | 1 | 225 | 131% |
| B | - | - | - | - | - | - | - | - |
| Other | 1 | - | 1 | 12.11% | 60% | - | 4 | 400% |
| Subtotal | 27,867 | 823 | 28,761 | 0.06% | 56% | 10 | 8,339 | 29% |
| Default | - | - | - | NA | - | - | - | - |
| Total | 27,867 | 823 | 28,761 | 0.06% | 56% | 10 | 8,339 | 29% |
| Risk | Average | |||||||
| 31 March 2019 | Committed | Exposure | Probability | Loss Given | Regulatory | Weighted | Risk | |
| $m | Outstandings1 | Undrawn2 | at Default | of Default | Default | Expected Loss | Assets | Weight |
| AAA | 418 | 66 | 485 | 0.01% | 13% | - | 21 | 4% |
| AA | 10,656 | 237 | 11,018 | 0.03% | 59% | 2 | 2,737 | 25% |
| A | 11,374 | 346 | 11,736 | 0.05% | 55% | 3 | 2,902 | 25% |
| BBB | 1,773 | 218 | 1,996 | 0.20% | 56% | 2 | 1,247 | 62% |
| BB | 218 | 18 | 236 | 0.77% | 42% | 1 | 159 | 67% |
| B | - | - | - | - | - | - | - | - |
| Other | - | - | - | - | - | - | - | - |
| Subtotal | 24,439 | 885 | 25,471 | 0.06% | 56% | 8 | 7,066 | 28% |
| Default | - | - | - | NA | - | - | - | - |
| Total | 24,439 | 885 | 25,471 | 0.06% | 56% | 8 | 7,066 | 28% |
| 1 | Outstandings are balances that were drawn down as at the reporting date and include certain off-balance sheet items. |
| 2 | Committed undrawn balances are committed exposures that were not drawn down as at the reporting date. |
| | Westpac Group March 2020 Pillar 3 report |49 |
Pillar 3 report Credit risk exposures |
Residential mortgages portfolio by PD band
| Risk | Average | |||||||
| 31 March 2020 | Committed | Exposure | Probability | Loss Given | Regulatory | Weighted | Risk | |
| $m | Outstandings1 | Undrawn2 | at Default | of Default | Default | Expected Loss | Assets | Weight |
| 0.0 to 0.10 | 145,843 | 40,976 | 185,030 | 0.06% | 20% | 23 | 10,384 | 6% |
| 0.10 to 0.25 | 75,031 | 11,716 | 86,067 | 0.22% | 20% | 37 | 12,272 | 14% |
| 0.25 to 1.0 | 194,476 | 19,051 | 209,423 | 0.57% | 20% | 237 | 52,333 | 25% |
| 1.0 to 2.5 | 36,418 | 3,655 | 38,978 | 1.44% | 21% | 118 | 17,782 | 46% |
| 2.5 to 10.0 | 15,317 | 669 | 15,657 | 4.69% | 21% | 150 | 14,043 | 90% |
| 10.0 to 99.99 | 14,062 | 200 | 14,215 | 23.35% | 20% | 664 | 19,141 | 135% |
| Subtotal | 481,147 | 76,267 | 549,370 | 1.11% | 20% | 1,229 | 125,955 | 23% |
| Default | 4,486 | 30 | 4,496 | NA | 20% | 559 | 5,469 | 122% |
| Total | 485,633 | 76,297 | 553,866 | 1.91% | 20% | 1,788 | 131,424 | 24% |
| Risk | Average | |||||||
| 30 September 2019 | Committed | Exposure | Probability | Loss Given | Regulatory | Weighted | Risk | |
| $m | Outstandings1 | Undrawn2 | at Default | of Default | Default | Expected Loss | Assets | Weight |
| 0.0 to 0.10 | 148,591 | 38,041 | 186,899 | 0.06% | 20% | 23 | 10,472 | 6% |
| 0.10 to 0.25 | 75,806 | 11,352 | 86,873 | 0.21% | 20% | 37 | 12,165 | 14% |
| 0.25 to 1.0 | 182,589 | 22,417 | 204,268 | 0.54% | 20% | 223 | 52,592 | 26% |
| 1.0 to 2.5 | 43,736 | 3,657 | 46,813 | 1.41% | 20% | 133 | 19,616 | 42% |
| 2.5 to 10.0 | 17,377 | 423 | 17,761 | 4.72% | 20% | 171 | 15,277 | 86% |
| 10.0 to 99.99 | 12,079 | 80 | 12,177 | 20.54% | 20% | 501 | 16,630 | 137% |
| Subtotal | 480,178 | 75,970 | 554,791 | 0.97% | 20% | 1,088 | 126,752 | 23% |
| Default | 4,216 | 21 | 4,227 | NA | 20% | 554 | 4,877 | 115% |
| Total | 484,394 | 75,991 | 559,018 | 1.72% | 20% | 1,642 | 131,629 | 24% |
| Risk | Average | |||||||
| 31 March 2019 | Committed | Exposure | Probability | Loss Given | Regulatory | Weighted | Risk | |
| $m | Outstandings1 | Undrawn2 | at Default | of Default | Default | Expected Loss | Assets | Weight |
| 0.0 to 0.10 | 146,376 | 38,513 | 185,186 | 0.06% | 20% | 23 | 10,369 | 6% |
| 0.10 to 0.25 | 75,550 | 11,709 | 86,992 | 0.21% | 20% | 37 | 12,192 | 14% |
| 0.25 to 1.0 | 181,306 | 23,260 | 203,842 | 0.54% | 20% | 222 | 52,410 | 26% |
| 1.0 to 2.5 | 44,529 | 3,518 | 47,470 | 1.41% | 20% | 134 | 20,006 | 42% |
| 2.5 to 10.0 | 18,350 | 448 | 18,765 | 4.73% | 20% | 181 | 16,249 | 87% |
| 10.0 to 99.99 | 11,913 | 64 | 11,998 | 21.20% | 20% | 509 | 16,364 | 136% |
| Subtotal | 478,024 | 77,512 | 554,253 | 0.99% | 20% | 1,106 | 127,590 | 23% |
| Default | 3,895 | 19 | 3,908 | NA | 20% | 543 | 4,543 | 116% |
| Total | 481,919 | 77,531 | 558,161 | 1.68% | 20% | 1,649 | 132,133 | 24% |
1 Outstandings are balances that were drawn down as at the reporting date.
2 Committed undrawn balances are committed exposures that were not drawn down as at the reporting date.
| 50| Westpac Group March 2020 Pillar 3 report | |
Pillar 3 report Credit risk exposures |
Australian credit cards portfolio by PD band
| Risk | Average | |||||||
| 31 March 2020 | Committed | Exposure | Probability | Loss Given | Regulatory | Weighted | Risk | |
| $m | Outstandings1 | Undrawn2 | at Default | of Default | Default | Expected Loss | Assets | Weight |
| 0.0 to 0.10 | 1,704 | 9,799 | 7,793 | 0.05% | 70% | 3 | 181 | 2% |
| 0.10 to 0.25 | 1,146 | 4,397 | 3,603 | 0.16% | 73% | 4 | 247 | 7% |
| 0.25 to 1.0 | 1,260 | 1,335 | 2,109 | 0.46% | 73% | 7 | 346 | 16% |
| 1.0 to 2.5 | 2,350 | 1,146 | 3,124 | 1.70% | 74% | 39 | 1,373 | 44% |
| 2.5 to 10.0 | 1,060 | 245 | 1,222 | 6.22% | 73% | 55 | 1,295 | 106% |
| 10.0 to 99.99 | 608 | 95 | 629 | 29.22% | 70% | 130 | 1,186 | 189% |
| Subtotal | 8,128 | 17,017 | 18,480 | 1.80% | 72% | 238 | 4,628 | 25% |
| Default | 121 | 17 | 121 | NA | 72% | 76 | 209 | 173% |
| Total | 8,249 | 17,034 | 18,601 | 2.44% | 72% | 314 | 4,837 | 26% |
| Risk | Average | |||||||
| 30 September 2019 | Committed | Exposure | Probability | Loss Given | Regulatory | Weighted | Risk | |
| $m | Outstandings1 | Undrawn2 | at Default | of Default | Default | Expected Loss | Assets | Weight |
| 0.0 to 0.10 | 1,808 | 9,814 | 6,254 | 0.05% | 70% | 2 | 146 | 2% |
| 0.10 to 0.25 | 1,206 | 4,662 | 3,529 | 0.16% | 73% | 4 | 242 | 7% |
| 0.25 to 1.0 | 1,315 | 1,463 | 2,173 | 0.46% | 73% | 8 | 358 | 16% |
| 1.0 to 2.5 | 2,525 | 1,294 | 3,418 | 1.71% | 74% | 43 | 1,511 | 44% |
| 2.5 to 10.0 | 1,176 | 289 | 1,405 | 6.20% | 73% | 63 | 1,488 | 106% |
| 10.0 to 99.99 | 606 | 99 | 649 | 27.81% | 70% | 128 | 1,213 | 187% |
| Subtotal | 8,636 | 17,621 | 17,428 | 1.98% | 72% | 248 | 4,958 | 28% |
| Default | 113 | 15 | 113 | NA | 72% | 80 | 131 | 116% |
| Total | 8,749 | 17,636 | 17,541 | 2.61% | 72% | 328 | 5,089 | 29% |
| Risk | Average | |||||||
| 31 March 2019 | Committed | Exposure | Probability | Loss Given | Regulatory | Weighted | Risk | |
| $m | Outstandings1 | Undrawn2 | at Default | of Default | Default | Expected Loss | Assets | Weight |
| 0.0 to 0.10 | 1,808 | 9,784 | 6,245 | 0.05% | 70% | 2 | 146 | 2% |
| 0.10 to 0.25 | 1,234 | 4,900 | 3,727 | 0.16% | 73% | 4 | 256 | 7% |
| 0.25 to 1.0 | 1,366 | 1,590 | 2,315 | 0.46% | 73% | 8 | 384 | 17% |
| 1.0 to 2.5 | 3,037 | 1,443 | 4,050 | 1.68% | 74% | 50 | 1,760 | 43% |
| 2.5 to 10.0 | 1,341 | 353 | 1,626 | 6.23% | 73% | 74 | 1,736 | 107% |
| 10.0 to 99.99 | 717 | 114 | 772 | 27.96% | 71% | 154 | 1,461 | 189% |
| Subtotal | 9,503 | 18,184 | 18,735 | 2.16% | 72% | 292 | 5,743 | 31% |
| Default | 115 | 17 | 115 | NA | 72% | 71 | 167 | 145% |
| Total | 9,618 | 18,201 | 18,850 | 2.76% | 72% | 363 | 5,910 | 31% |
1 Outstandings are balances that were drawn down as at the reporting date.
2 Committed undrawn balances are committed exposures that were not drawn down as at the reporting date.
| | Westpac Group March 2020 Pillar 3 report |51 |
Pillar 3 report Credit risk exposures |
Other retail portfolio by PD band
| Risk | Average | |||||||
| 31 March 2020 | Committed | Exposure | Probability | Loss Given | Regulatory | Weighted | Risk | |
| $m | Outstandings1 | Undrawn2 | at Default | of Default | Default | Expected Loss | Assets | Weight |
| 0.0 to 0.10 | 215 | 940 | 786 | 0.05% | 48% | - | 59 | 8% |
| 0.10 to 0.25 | 365 | 1,376 | 1,307 | 0.19% | 60% | 2 | 329 | 25% |
| 0.25 to 1.0 | 3,469 | 961 | 4,252 | 0.67% | 56% | 16 | 2,068 | 49% |
| 1.0 to 2.5 | 3,114 | 919 | 3,837 | 1.66% | 66% | 45 | 3,232 | 84% |
| 2.5 to 10.0 | 3,197 | 340 | 3,486 | 4.90% | 67% | 121 | 3,630 | 104% |
| 10.0 to 99.99 | 1,185 | 46 | 1,254 | 27.19% | 66% | 235 | 1,854 | 148% |
| Subtotal | 11,545 | 4,582 | 14,922 | 4.07% | 62% | 419 | 11,172 | 75% |
| Default | 298 | 11 | 301 | NA | 67% | 182 | 422 | 140% |
| Total | 11,843 | 4,593 | 15,223 | 5.96% | 62% | 601 | 11,594 | 76% |
| Risk | Average | |||||||
| 30 September 2019 | Committed | Exposure | Probability | Loss Given | Regulatory | Weighted | Risk | |
| $m | Outstandings1 | Undrawn2 | at Default | of Default | Default | Expected Loss | Assets | Weight |
| 0.0 to 0.10 | 23 | 20 | 36 | 0.07% | 65% | - | 5 | 14% |
| 0.10 to 0.25 | 326 | 811 | 965 | 0.18% | 57% | 1 | 226 | 23% |
| 0.25 to 1.0 | 3,870 | 2,136 | 5,362 | 0.61% | 58% | 19 | 2,514 | 47% |
| 1.0 to 2.5 | 3,645 | 1,221 | 4,745 | 1.78% | 64% | 58 | 3,990 | 84% |
| 2.5 to 10.0 | 2,989 | 251 | 3,236 | 4.77% | 67% | 110 | 3,386 | 105% |
| 10.0 to 99.99 | 1,255 | 64 | 1,333 | 25.71% | 64% | 229 | 1,914 | 144% |
| Subtotal | 12,108 | 4,503 | 15,677 | 3.93% | 62% | 417 | 12,035 | 77% |
| Default | 271 | 10 | 274 | NA | 65% | 165 | 360 | 131% |
| Total | 12,379 | 4,513 | 15,951 | 5.58% | 62% | 582 | 12,395 | 78% |
| Risk | Average | |||||||
| 31 March 2019 | Committed | Exposure | Probability | Loss Given | Regulatory | Weighted | Risk | |
| $m | Outstandings1 | Undrawn2 | at Default | of Default | Default | Expected Loss | Assets | Weight |
| 0.0 to 0.10 | 25 | 21 | 39 | 0.07% | 65% | - | 5 | 13% |
| 0.10 to 0.25 | 354 | 948 | 1,072 | 0.18% | 55% | 1 | 239 | 22% |
| 0.25 to 1.0 | 3,941 | 2,455 | 5,544 | 0.60% | 58% | 19 | 2,603 | 47% |
| 1.0 to 2.5 | 3,878 | 938 | 4,678 | 1.76% | 65% | 57 | 3,957 | 85% |
| 2.5 to 10.0 | 3,192 | 271 | 3,455 | 4.81% | 68% | 118 | 3,635 | 105% |
| 10.0 to 99.99 | 1,398 | 72 | 1,475 | 26.56% | 64% | 264 | 2,133 | 145% |
| Subtotal | 12,788 | 4,705 | 16,263 | 4.15% | 63% | 459 | 12,572 | 77% |
| Default | 316 | 10 | 320 | NA | 64% | 181 | 510 | 159% |
| Total | 13,104 | 4,715 | 16,583 | 6.01% | 63% | 640 | 13,082 | 79% |
1 Outstandings are balances that were drawn down as at the reporting date.
2 Committed undrawn balances are committed exposures that were not drawn down as at the reporting date.
| 52| Westpac Group March 2020 Pillar 3 report | |
Pillar 3 report Credit risk exposures |
Small business portfolio by PD band
| Regulatory | Risk | Average | ||||||
| 31 March 2020 | Committed | Exposure | Probability | Loss Given | Expected | Weighted | Risk | |
| $m | Outstandings1 | Undrawn2 | at Default | of Default | Default | Loss | Assets | Weight |
| 0.0 to 0.10 | 241 | 361 | 435 | 0.07% | 50% | - | 46 | 11% |
| 0.10 to 0.25 | 131 | 191 | 314 | 0.19% | 21% | - | 27 | 9% |
| 0.25 to 1.0 | 6,267 | 3,602 | 9,770 | 0.47% | 28% | 13 | 2,039 | 21% |
| 1.0 to 2.5 | 14,668 | 1,805 | 16,447 | 1.64% | 39% | 104 | 8,476 | 52% |
| 2.5 to 10.0 | 3,331 | 309 | 3,643 | 5.25% | 36% | 71 | 2,534 | 70% |
| 10.0 to 99.99 | 1,762 | 66 | 1,831 | 27.83% | 38% | 190 | 2,039 | 111% |
| Subtotal | 26,400 | 6,334 | 32,440 | 3.14% | 35% | 378 | 15,161 | 47% |
| Default | 731 | 19 | 741 | NA | 37% | 179 | 1,651 | 223% |
| Total | 27,131 | 6,353 | 33,181 | 5.30% | 35% | 557 | 16,812 | 51% |
| Regulatory | Risk | Average | ||||||
| 30 September 2019 | Committed | Exposure | Probability | Loss Given | Expected | Weighted | Risk | |
| $m | Outstandings1 | Undrawn2 | at Default | of Default | Default | Loss | Assets | Weight |
| 0.0 to 0.10 | 295 | 537 | 601 | 0.06% | 57% | - | 60 | 10% |
| 0.10 to 0.25 | 98 | 114 | 213 | 0.23% | 20% | - | 20 | 9% |
| 0.25 to 1.0 | 5,454 | 3,187 | 8,666 | 0.45% | 28% | 10 | 1,725 | 20% |
| 1.0 to 2.5 | 15,940 | 1,945 | 17,809 | 1.66% | 38% | 110 | 8,800 | 49% |
| 2.5 to 10.0 | 3,485 | 316 | 3,806 | 5.27% | 35% | 73 | 2,448 | 64% |
| 10.0 to 99.99 | 1,569 | 58 | 1,631 | 26.19% | 37% | 158 | 1,729 | 106% |
| Subtotal | 26,841 | 6,157 | 32,726 | 2.94% | 35% | 351 | 14,782 | 45% |
| Default | 630 | 14 | 639 | NA | 36% | 161 | 1,308 | 205% |
| Total | 27,471 | 6,171 | 33,365 | 4.80% | 35% | 512 | 16,090 | 48% |
| Regulatory | Risk | Average | ||||||
| 31 March 2019 | Committed | Exposure | Probability | Loss Given | Expected | Weighted | Risk | |
| $m | Outstandings1 | Undrawn2 | at Default | of Default | Default | Loss | Assets | Weight |
| 0.0 to 0.10 | 291 | 549 | 605 | 0.06% | 58% | - | 61 | 10% |
| 0.10 to 0.25 | 99 | 108 | 208 | 0.23% | 20% | - | 20 | 10% |
| 0.25 to 1.0 | 5,463 | 3,270 | 8,759 | 0.45% | 28% | 11 | 1,756 | 20% |
| 1.0 to 2.5 | 15,556 | 2,003 | 17,480 | 1.66% | 38% | 107 | 8,703 | 50% |
| 2.5 to 10.0 | 3,644 | 363 | 4,012 | 5.18% | 34% | 73 | 2,643 | 66% |
| 10.0 to 99.99 | 1,574 | 66 | 1,644 | 25.62% | 37% | 154 | 1,801 | 110% |
| Subtotal | 26,627 | 6,359 | 32,708 | 2.93% | 35% | 345 | 14,984 | 46% |
| Default | 561 | 13 | 572 | NA | 36% | 152 | 1,108 | 194% |
| Total | 27,188 | 6,372 | 33,280 | 4.60% | 35% | 497 | 16,092 | 48% |
1 Outstandings are balances that were drawn down as at the reporting date and include certain off-balance sheet items.
2 Committed undrawn balances are committed exposures that were not drawn down as at the reporting date.
| | Westpac Group March 2020 Pillar 3 report |53 |
Pillar 3 report Credit risk exposures |
Credit Quality
Prior to the onset of the Covid-19 pandemic the portfolio was performing well across retail, business and institutional portfolios. While stressed assets and retail delinquencies had risen moderately in recent periods, these metrics were rising from a low base.
The impact of the COVID-19 pandemic on the Australian economy and Westpac remains uncertain. The severity of its impact will depend on the spread and duration of the pandemic, customer responses, and the effectiveness of the responses from governments and central banks.
Actual losses
| 31 March 2020 | Write-offs | Legal and | Write-offs from | Actual Losses for the | |
| $m | direct | recovery costs | provisions1 | Recoveries | 6 months ended |
| Corporate | 1 | - | 1 | (6) | (4) |
| Business lending | 21 | - | 19 | (5) | 35 |
| Sovereign | - | - | - | - | - |
| Bank | - | - | - | - | - |
| Residential mortgages | 8 | - | 59 | - | 67 |
| Australian credit cards | 197 | - | - | (33) | 164 |
| Other retail | 181 | 7 | 1 | (54) | 135 |
| Small business | 20 | - | 19 | - | 39 |
| Specialised lending | 1 | 2 | - | (2) | 1 |
| Securitisation | - | - | - | - | - |
| Standardised | - | - | - | - | - |
| Total | 429 | 9 | 99 | (100) | 437 |
| 30 September 2019 | Write-offs | Legal and | Write-offs from | Actual Losses for the | |
| $m | direct | recovery costs | provisions1 | Recoveries | 12 months ended |
| Corporate | 2 | - | 35 | (7) | 30 |
| Business lending | 40 | 2 | 21 | (9) | 54 |
| Sovereign | - | - | - | - | - |
| Bank | - | - | - | - | - |
| Residential mortgages | 14 | - | 98 | (1) | 111 |
| Australian credit cards | 383 | - | - | (43) | 340 |
| Other retail | 438 | 17 | 6 | (107) | 354 |
| Small business | 44 | 2 | 32 | - | 78 |
| Specialised lending | 3 | 6 | 9 | (5) | 13 |
| Securitisation | - | - | - | - | - |
| Standardised | 2 | - | - | - | 2 |
| Total | 926 | 27 | 201 | (172) | 982 |
| 31 March 2019 | Write-offs | Legal and | Write-offs from | Actual Losses for the | |
| $m | direct | recovery costs | provisions1 | Recoveries | 6 months ended |
| Corporate | - | 2 | 2 | (7) | (3) |
| Business lending | 18 | 1 | 9 | (5) | 23 |
| Sovereign | - | - | - | - | - |
| Bank | - | - | - | - | - |
| Residential mortgages | 6 | - | 46 | - | 52 |
| Australian credit cards | 162 | - | - | (12) | 150 |
| Other retail | 198 | 7 | 2 | (45) | 162 |
| Small business | 20 | - | 13 | - | 33 |
| Specialised lending | 1 | 2 | 9 | (2) | 10 |
| Securitisation | - | - | - | - | - |
| Standardised | 1 | - | - | - | 1 |
| Total | 406 | 12 | 81 | (71) | 428 |
| 1 | Write-offs from individually assessed provisions. |
| 54| Westpac Group March 2020 Pillar 3 report | |
Pillar 3 report Credit risk exposures |
Regulatory loss estimates and actual losses
The table below compares regulatory credit risk estimates used in the calculation of risk weighted assets to the average of actual outcomes observed since the time of Advanced IRB accreditation for each portfolio.
Predicted parameters represent average internally predicted long-run probabilities of default for non-defaulted obligors at the start of each year, as well as downturn estimates of loss (or the regulatory minimum where required). They are averaged using data from the financial years beginning at the time of Advanced IRB accreditation (2008 for most portfolios) and compared to observed outcomes over the same period1.
Predicted parameters are reviewed annually utilising observed outcomes from prior periods as a key input.
Default rates
At the start of each year, a predicted default probability is assigned to all non-defaulted obligors. This is averaged over the portfolio for the period since IRB accreditation and reported as the predicted default rate. The actual default rate reflects the fraction of obligors who start the year not in default but default during the one year period. The observed annual default rates are averaged over the period since IRB accreditation.
Loss Given Default (LGD)
The LGD analysis excludes recent defaults in order to allow sufficient time for the full workout of the facility and hence an accurate LGD to be determined. The workout period varies by portfolio: a two year workout period is assumed for transaction-managed and residential mortgage lending; and a one year period for other program-managed portfolios.
Exposure at Default (EAD)
The EAD variance compares the observed EAD to the predicted EAD one year prior to default. For transaction-managed portfolios, predicted EAD is currently mandated to be 100% of committed exposures. The observed EAD is averaged for all obligors that defaulted over the observation period.
| Observed EAD | ||||||
| 31 March 2020 | Regulatory | Default rate | Loss Given Default | variance to | ||
| $m | Expected Loss2 | Predicted | Observed | Predicted | Observed | Predicted3 |
| Corporate | 787 | 2.25% | 0.93% | 47% | 36% | (23%) |
| Business lending | 669 | 2.24% | 1.56% | 34% | 17% | (13%) |
| Sovereign | 2 | 0.23% | - | - | - | |
| Bank | 9 | 0.43% | 0.13% | - | - | |
| Residential mortgages | 1,788 | 0.66% | 0.53% | 20% | 1% | (1%) |
| Australian credit cards | 314 | 1.68% | 1.63% | 75% | 59% | (2%) |
| Other retail | 601 | 4.83% | 3.80% | 69% | 45% | (8%) |
| Small business | 557 | 3.28% | 2.21% | 39% | 12% | (9%) |
| Specialised lending | 813 | NA | 1.93% | NA | 22% | (9%) |
| Securitisation | - | NA | NA | NA | NA | NA |
| Standardised | - | NA | NA | NA | NA | NA |
| Total | 5,540 | |||||
| 1 | Predicted parameters are not available for specialised lending, securitisation or standardised exposures because risk weights for these portfolios do not rely on credit estimates and are shown as NA in the tables above. |
| 2 | Includes regulatory expected losses for defaulted and non-defaulted exposures. |
| 3 | A negative outcome indicates observed EAD was lower than predicted EAD, which can happen because exposures were managed down prior to default or off-balance sheet items or undrawn limits were not fully drawn prior to default. |
| | Westpac Group March 2020 Pillar 3 report |55 |
Pillar 3 report Credit risk exposures |
| Observed EAD | ||||||
| 30 September 2019 | Regulatory | Default rate | Loss Given Default | variance to | ||
| $m | Expected Loss1 | Predicted | Observed | Predicted | Observed | Predicted2 |
| Corporate | 523 | 2.24% | 0.93% | 47% | 36% | (23%) |
| Business lending | 635 | 2.24% | 1.52% | 34% | 17% | (13%) |
| Sovereign | 2 | 0.23% | - | - | - | - |
| Bank | 10 | 0.44% | 0.14% | - | - | - |
| Residential mortgages | 1,642 | 0.64% | 0.51% | 20% | 2% | (1%) |
| Australian credit cards | 328 | 1.68% | 1.64% | 75% | 59% | (2%) |
| Other retail | 582 | 4.82% | 3.79% | 69% | 46% | (8%) |
| Small business | 512 | 3.19% | 2.11% | 39% | 13% | (9%) |
| Specialised lending | 748 | NA | 1.90% | NA | 22% | (9%) |
| Securitisation | - | NA | NA | NA | NA | NA |
| Standardised | - | NA | NA | NA | NA | NA |
| Total | 4,982 | |||||
| Observed EAD | ||||||
| 31 March 2019 | Regulatory | Default rate | Loss Given Default | variance to | ||
| $m | Expected Loss1 | Predicted | Observed | Predicted | Observed | Predicted2 |
| Corporate | 561 | 2.24% | 0.95% | 47% | 37% | (23%) |
| Business lending | 642 | 2.24% | 1.53% | 34% | 17% | (13%) |
| Sovereign | 2 | 0.23% | - | - | - | - |
| Bank | 8 | 0.44% | 0.14% | - | - | - |
| Residential mortgages | 1,649 | 0.64% | 0.50% | 20% | 2% | (1%) |
| Australian credit cards | 363 | 1.68% | 1.65% | 75% | 58% | (2%) |
| Other retail | 640 | 4.82% | 3.81% | 69% | 47% | (8%) |
| Small business | 497 | 3.07% | 2.01% | 39% | 14% | (9%) |
| Specialised lending | 798 | NA | 1.93% | NA | 22% | (8%) |
| Securitisation | NA | NA | NA | NA | NA | NA |
| Standardised | NA | NA | NA | NA | NA | NA |
| Total | 5,160 | |||||
| 1 | Includes regulatory expected losses for defaulted and non-defaulted exposures |
| 2 | A negative outcome indicates observed EAD was lower than predicted EAD, which can happen because exposures were managed down prior to default or off-balance sheet items or undrawn limits were not fully drawn prior to default. |
| 56| Westpac Group March 2020 Pillar 3 report | |
Pillar 3 report Credit risk mitigation |
This section describes the way in which Westpac reduces its credit risk by using financial collateral, guarantees or credit derivatives for the Corporate, Sovereign and Bank asset classes.
Approach
Westpac recognises credit risk mitigation only when formal legal documentation is held that establishes Westpac’s direct, irrevocable and unconditional recourse to the collateral or to an unrelated credit risk mitigation provider. Minimum standards for recognising credit risk mitigation are set out in Westpac's credit rules and policies. All proposals for recognising risk mitigation require approval by an authorised credit officer. Authorised credit officer approval is also required for existing risk mitigation to be discontinued or withdrawn.
The amount of credit risk mitigation recognised is the face value of the mitigation instrument, adjusted by the application of discounts for any maturity and/or currency mismatch with the underlying obligation, so that a discounted amount is recognised when calculating the residual exposure after mitigation.
For regulatory capital purposes:
| l | exposures secured by eligible financial collateral, either cash or certain government or semi-government securities, or where protection is bought via credit linked notes, provided proceeds are invested in eligible financial collateral, are included at the gross value, with risk weighted assets for the portion thus secured calculated by applying a 5% LGD1; |
| l | exposures mitigated by eligible guarantees, standby letters of credit or similar instruments, where Westpac has direct recourse to an unrelated third party, or credit protection bought via credit default swaps where Westpac is entitled to recover either full principal or credit losses on occurrence of defined credit events, are treated under double default rules where the protection provider is rated A-/A3 or better. The GCCO has the authority to approve exceptions to the A-/A3 minimum; and |
| l | exposures mitigated by guarantees, letters of credit, credit default swaps or similar instruments, which are not eligible for double default treatment are treated under the substitution approach. |
When Westpac uses credit risk mitigation techniques to reduce counterparty exposure, limits are applied to both gross (i.e. pre-mitigation) and net exposure. Furthermore, exposure is recorded against the provider of any credit risk mitigation and a limit framework prevents excessive concentration to such counterparties.
Netting
Risk reduction by way of current account set-offs is recognised for exposures to creditworthy customers domiciled in Australia and New Zealand only. Customers are required to enter into formal agreements giving Westpac the unfettered right to set-off gross credit and debit balances in their nominated accounts to determine Westpac’s net exposure within each of these two jurisdictions. Cross-border set-offs are not permitted.
Close-out netting is undertaken for off-balance sheet financial market transactions with counterparties with whom Westpac has entered into master netting agreements which allow such netting in specified jurisdictions. Close-out netting effectively aggregates pre-settlement risk exposure at time of default, thus reducing overall exposure.
Collateral valuation and management
Westpac revalues financial markets and associated collateral positions on a daily basis to monitor the net risk position, and has formal processes in place so that calls for collateral top-up or exposure reduction are made promptly. An independent operational unit has responsibility for monitoring these positions. The collateralisation arrangements are documented via the Credit Support Annex of the International Swaps and Derivatives Association (ISDA) master agreement for derivatives transactions and Global Master Repurchase Agreement (GMRA) for repurchase transactions and Clearing Agreements for cleared trades.
| 1 | Excludes collateralised derivative transactions. |
| | Westpac Group March 2020 Pillar 3 report |57 |
Pillar 3 report Credit risk mitigation |
Total exposure covered by collateral, credit derivatives and guarantees
| Impact | Total exposure for | Credit Risk Mitigants | |||||
| 31 March 2020 | Total before | of credit | Total after | which some credit | Eligible Financial | Covered by | Covered by |
| $m | mitigation | mitigation1 | mitigation | risk is mitigated | Collateral | Guarantees | Credit Derivatives |
| Corporate | 150,294 | (3,765) | 146,529 | 8,562 | 5,617 | 305 | - |
| Sovereign | 127,690 | (626) | 127,064 | 1,422 | 626 | 103 | - |
| Bank | 34,129 | (7,496) | 26,633 | 15,088 | 7,496 | - | - |
| Standardised | 19,616 | - | 19,616 | 4,932 | - | - | - |
| Total | 331,729 | (11,887) | 319,842 | 30,004 | 13,739 | 408 | - |
| Impact | Total exposure for | Credit Risk Mitigants | |||||
| 30 September 2019 | Total before | of credit | Total after | which some credit | Eligible Financial | Covered by | Covered by |
| $m | mitigation | mitigation1 | mitigation | risk is mitigated | Collateral | Guarantees | Credit Derivatives |
| Corporate | 139,598 | (425) | 139,173 | 3,351 | 2,028 | 258 | - |
| Sovereign | 91,284 | (324) | 90,960 | 905 | 324 | 221 | - |
| Bank | 30,496 | (1,735) | 28,761 | 4,639 | 1,735 | - | - |
| Standardised | 22,512 | - | 22,512 | - | - | - | - |
| Total | 283,890 | (2,484) | 281,406 | 8,895 | 4,087 | 479 | - |
| Impact | Total exposure for | Credit Risk Mitigants | |||||
| 31 March 2019 | Total before | of credit | Total after | which some credit | Eligible Financial | Covered by | Covered by |
| $m | mitigation | mitigation1 | mitigation | risk is mitigated | Collateral | Guarantees | Credit Derivatives |
| Corporate | 135,725 | (223) | 135,502 | 2,855 | 1,859 | 394 | 3 |
| Sovereign | 79,681 | (109) | 79,572 | 284 | 109 | 101 | - |
| Bank | 26,749 | (1,278) | 25,471 | 3,790 | 1,278 | - | - |
| Standardised | 18,249 | (860) | 17,389 | 3,057 | 860 | - | - |
| Total | 260,404 | (2,470) | 257,934 | 9,986 | 4,106 | 495 | 3 |
| 1 | Impact of credit mitigation under the substitution approach. |
| 58| Westpac Group March 2020 Pillar 3 report | |
Pillar 3 report Counterparty credit risk |
This section describes Westpac’s exposure to credit risk arising from derivative and treasury products.
Approach
Westpac actively assesses and manages the derivative and treasury credit risk (known collectively as counterparty credit risk) arising from its derivatives business. Westpac’s process for managing counterparty credit risk is based on its assessment of the potential future credit risk Westpac is exposed to when dealing in derivatives products and securities financing transactions. Westpac quantifies this risk through a daily simulation of future market price and rate shocks and converts the effect of these shocks on the mark-to-market value of Westpac’s positions to a credit exposure using Westpac’s Derivative Risk Equivalent (DRE) methodology. Exposures are loaded into Westpac’s credit limit management system where they are checked against pre-settlement risk limits that are set at the counterparty level. Limit excesses are reported to credit managers and actioned within strict timeframes.
Structure and organisation
The Financial Markets Credit management team is charged with managing the counterparty credit exposure arising from derivatives and treasury products.
Market related credit risk
There are two components to the regulatory capital requirements for credit risk arising from derivative products:
| l | capital to absorb losses arising from the default of derivative counterparties; and |
| l | capital to absorb losses arising from mark-to-market valuation movements resulting from changes in the credit quality of derivative counterparties. These valuation movements are referred to as credit valuation adjustments (CVA) and this risk is sometimes labelled as CVA risk. Westpac refers to this requirement as mark-to-market related credit risk. |
Risk mitigation
Mitigation is achieved in a number of ways:
| l | the limit system monitors for excesses of the pre-determined limits, with any excesses being notified to authorised credit officers; |
| l | Westpac has netting agreements with counterparties to allow the exposure across a portfolio of trades to be netted; |
| l | Westpac has collateral agreements with its largest counterparties. The market value of the counterparty’s portfolio is used to recalculate the credit position at each end of day, with collateral being called for when certain pre-set limits are met or exceeded. Westpac exchanges Initial Margin with eligible counterparties for eligible products as protection against potential future exposure to changes in market value; |
| l | Westpac has initial margin agreements with qualifying counterparties subject to relevant international regulations. The exchange of initial margin for eligible products covers the potential future exposure that could arise from changes in the market value of derivative transactions over the close-out period in the event of a counterparty default; |
| l | credit derivatives are used to mitigate credit exposure against certain counterparties; and |
| l | regular marking to market and settling of the foreign exchange components of foreign exchange reset contracts. |
Counterparty derivative exposures and limits
The risk management methodology for counterparty derivatives exposures is similar to the credit methodology for transaction-managed loans. The main difference is in the estimation of the exposure for derivatives which is based on the DRE methodology. DRE is a credit exposure measure for derivative trades which is calibrated to a ‘loan-equivalent’ exposure.
Counterparty credit limits are approved on an uncommitted and unadvised basis by authorised credit officers. This follows an evaluation of each counterparty’s credit worthiness and establishing an agreed credit risk appetite for the nature and extent of prospective business.
| | Westpac Group March 2020 Pillar 3 report |59 |
Pillar 3 report Counterparty credit risk |
Wrong-way risk exposures
Westpac defines wrong-way risk as exposure to a counterparty which is adversely correlated with the credit quality of that counterparty. With respect to credit derivatives, wrong-way risk refers to credit protection purchased from a counterparty highly correlated to the reference obligation.
Wrong-way risk exposures using credit derivatives are controlled by only buying protection from highly rated counterparties. These transactions are assessed by an authorised credit officer who has the right to decline any transaction where they feel there is an unacceptably high correlation between the ability to perform under the trade and the performance of the underlying counterparty.
Consequences of a downgrade in Westpac’s credit rating
A downgrade in Westpac’s credit rating can have an impact on Westpac’s collateral agreements. Where an outright threshold and minimum transfer amount are agreed, there will not be any impact on the amount of collateral posted by Westpac in the event of a credit rating downgrade. Where the threshold and minimum transfer amount are tiered according to credit rating, the impact of Westpac being downgraded below its current credit rating would be: for a one notch downgrade, postings of $31 million; while for a two notch downgrade, postings would be $33 million1.
Counterparty credit risk summary
| 31 March | 30 September | 31 March | |||||||
| $m | 2020 | 2019 | 2019 | ||||||
| Gross positive fair value of contracts | 92,175 | 89,963 | 71,944 | ||||||
| Netting benefits | (32,468) | (41,834) | (45,159) | ||||||
| Netted current credit exposure | 59,707 | 48,129 | 26,785 | ||||||
| Collateral held | (11,887) | (2,798) | (2,471) | ||||||
| Mark-to-market credit related risk reduction | (263) | (159) | (112) | ||||||
| Net derivatives credit exposure | 47,557 | 45,172 | 24,202 | ||||||
| Exposure at default | |||||||||
| Gross credit exposure amount of credit derivative hedges | - | - | |||||||
| Credit exposure | - | - | |||||||
| Interest rate contracts | 17,070 | 19,587 | 7,665 | ||||||
| Foreign exchange contracts | 20,403 | 18,251 | 9,702 | ||||||
| Equity contracts | 5 | 6 | 414 | ||||||
| Credit derivatives | 141 | 155 | 263 | ||||||
| Commodity contracts | 1,201 | 1,186 | 4,762 | ||||||
| Other | 8,737 | 5,987 | 1,396 | ||||||
| Total | 47,557 | 45,172 | 24,202 | ||||||
Credit derivative transactions that create exposures to counterparty credit risk
| 31 March 2020 | Westpac Portfolio | Intermediation activities | ||||||||||||||
| Credit derivatives products used ($m) | Bought | Sold | Bought | Sold | ||||||||||||
| Credit Default Swaps | 69 | 72 | - | |||||||||||||
| Total Return Swaps | ||||||||||||||||
| Credit options | ||||||||||||||||
| Credit linked notes | ||||||||||||||||
| Collateralised Loan Obligations | ||||||||||||||||
| Other | ||||||||||||||||
| Total | 69 | 72 | - | - | ||||||||||||
| 30 September 2019 | Westpac Portfolio | Intermediation activities | ||||||||||||||
| Credit derivatives products used ($m) | Bought | Sold | Bought | Sold | ||||||||||||
| Credit Default Swaps | 29 | 126 | 1 | 5 | ||||||||||||
| Total Return Swaps | - | - | - | - | ||||||||||||
| Credit options | - | - | - | - | ||||||||||||
| Credit linked notes | - | - | - | - | ||||||||||||
| Collateralised Loan Obligations | - | - | - | - | ||||||||||||
| Other | - | - | - | - | ||||||||||||
| Total | 29 | 126 | 1 | 5 | ||||||||||||
1Credit rating downgrade postings are cumulative.
| 60| Westpac Group March 2020 Pillar 3 report | |
Pillar 3 report Counterparty credit risk |
| 31 March 2019 | Westpac Portfolio | Intermediation activities | ||||||||||||||
| Credit derivatives products used ($m) | Bought | Sold | Bought | Sold | ||||||||||||
| Credit Default Swaps | 129 | 132 | - | 3 | ||||||||||||
| Total Return Swaps | - | - | - | - | ||||||||||||
| Credit options | - | - | - | - | ||||||||||||
| Credit linked notes | - | - | - | - | ||||||||||||
| Collateralised Loan Obligations | - | - | - | - | ||||||||||||
| Other | - | - | - | - | ||||||||||||
| Total | 129 | 132 | - | 3 | ||||||||||||
| | Westpac Group March 2020 Pillar 3 report |61 |
Pillar 3 report Securitisation |
A securitisation is a financial structure where the cash flow from a pool of assets is used to service obligations to at least two different tranches or classes of creditors (typically holders of debt securities), with each class or tranche reflecting a different degree of credit risk (i.e. one class of creditors is entitled to receive payments from the pool before another class of creditors).
Securitisation transactions are generally grouped into two broad categories:
| l | traditional or true sale securitisations, which involve the transfer of ownership of the underlying asset pool to a third party; and |
| l | synthetic transactions, where the ownership of the pool remains with the originator and only the credit risk of the pool is transferred to a third party, using credit derivatives or guarantees. |
Covered bond transactions, in which bonds issued by Westpac are guaranteed by assets held in a special purpose vehicle, are not considered to be securitisation transactions.
Approach
Westpac’s involvement in securitisation activities ranges from a seller of its own assets to an investor in third-party transactions and includes the arranging of transactions, the provision of securitisation services and the provision of funding for clients, including clients requiring access to capital markets.
Securitisation of Westpac originated assets - Securitisation is a funding, liquidity and capital management tool. It allows Westpac the ability to liquefy a pool of assets and increase Westpac’s wholesale funding capacity. Westpac may provide arm’s length facilities to the securitisation vehicles. The facilities entered into typically include the provision of liquidity, funding, underwriting and derivative contracts.
Westpac has entered into on balance sheet securitisation transactions whereby loans originated by Westpac are transformed into stocks of saleable mortgage backed securities and held in the originating bank’s liquid asset portfolio. These ‘self securitisations’ do not change risk weighted assets1. No securitisation transactions for Westpac originated assets are classified as a resecuritisation.
Securitisation in the management of Westpac’s credit portfolio - Westpac uses securitisation, including portfolio credit default swaps, to manage its corporate and institutional loan and counterparty credit risk portfolios. Single name credit default swaps are not treated as securitisations but as credit risk mitigation facilities. Transactions are entered into to manage counterparty credit risk or concentration risks.
Provision of securitisation services, including funding and management of conduit vehicles - Westpac provides services to clients wishing to access asset-backed financing through securitisation. Those services include access to the Asset Backed Commercial Paper market through the Waratah conduit, which is the Westpac-sponsored securitisation conduit; the provision of warehouse and term funding of securitised assets on Westpac’s balance sheet; and arranging asset backed bond issues. Westpac provides facilities to the Waratah securitisation conduit including liquidity, funding, underwriting, credit enhancement and derivative contracts. Securitisation facilities provided by Westpac include resecuritisation exposures which are securitisation exposures in which the risk associated with an underlying pool of exposures is tranched and at least one of the underlying exposures is itself a securitisation exposure. Westpac also buys and sells securitisation exposures in the secondary market to facilitate portfolio management activity by its institutional customers who hold asset backed bonds.
Westpac’s role in the securitisation process
| Securitisation activity | Role played by Westpac | |
| Securitisation of Westpac originated assets | l Arranger
l Asset originator
l Bond distributor
l Facility provider
| l Note holder
l Trust manager
l Swap provider
l Servicer
|
Securitisation in the management of Westpac’s credit | l Hedger - protection purchaser
l Investor - protection seller
l Investor - purchaser of securitisation exposures
| |
1 The credit exposures of the underlying loans are measured in accordance with APS113.
| 62| Westpac Group March 2020 Pillar 3 report | |
Pillar 3 report Securitisation |
| Provision of securitisation services including funding and management of conduit vehicle | l Arranger
l Bond distributor
l Credit enhancement provider
l Funder
| l Liquidity facility provider
l Swap counterparty servicer
l Market maker and broker for distributed bonds
|
Key Objectives
Securitisation of Westpac originated assets - The securitisation of Westpac's own assets provides funding diversity, and is a core tool of liquidity management.
Securitisation in the management of Westpac’s credit portfolio - Westpac acts as principal in transactions and will buy and sell protection in order to meet its portfolio management objectives. Westpac also purchases securitisation exposures in order to earn income. All securitisation activity must follow Westpac’s credit policies and approval processes.
Provision of securitisation services including funding and management of conduit vehicles - Westpac receives market-based fees in return for its services as servicer, swap counterparty, arranger and facility provider and program fees, interest margins and bond distribution fees on warehouse and term funding facilities. Westpac facilitates portfolio management activity by its institutional customers by buying and selling securitisation exposures in the secondary market and is compensated through an interest margin and bid-offer spread on the transactions.
Structure and organisation
Securitisation of Westpac originated assets - Westpac’s Treasury operations are responsible for all Westpac originated securitisation activity including funding, liquidity and capital management.
Securitisation in the management of Westpac’s credit portfolio - Westpac’s exposure arising from securitisation, including portfolio hedging, is managed by Westpac Institutional Bank (WIB) and integrated within Westpac’s standard risk reporting and management systems.
Provision of securitisation services including funding and management of conduit vehicles - These services are provided by WIB and include the provision of liquidity, credit enhancement, funding and derivative facilities, servicer and arranger services, and market-making and broking of asset-backed bonds.
Risk reporting
Credit exposure - Funding, liquidity, credit enhancement and redraw facilities, swap arrangements and counterparty exposures are captured and monitored in key source systems along with other facilities/derivatives entered into by Westpac.
Operational risk exposure - The operational risk review process for Westpac includes the identification of risks, controls and key performance indicators in relation to all securitisation activity and services provided by Westpac or any of its subsidiaries.
Market risk exposure - Exposures arising from transactions with the securitisation conduit and other counterparties are captured as part of Westpac’s traded and non-traded market risk reporting and limit management framework.
Liquidity risk exposure - Exposure to, and the impact of, securitisation transactions are managed under the Liquidity Risk Management Framework and are integrated into routine reporting for capital and liquidity positions, net interest margin analysis, balance sheet forecasting and funding scenario testing. The annual funding plan incorporates consideration of overall liquidity risk limits and the securitisation of Westpac originated assets.
Risk mitigation
Securitisation of Westpac originated assets - The interest rate and basis risks generated by Westpac’s hedging arrangements to each securitisation trust are captured and managed within Westpac’s asset and liability management framework. The liquidity risk generated by Westpac’s liquidity and redraw facilities to each securitisation trust is captured and managed in accordance with Westpac’s liquidity management policies along with all other contingent liquidity facilities.
Securitisation in the management of Westpac’s credit portfolio - Transactions are approved in accordance with Westpac’s credit risk mitigation approach (see pages 57 and 58).
Provision of securitisation services including funding and management of conduit vehicles - All securitisation transactions are approved within the context of a securitisation credit policy that sets detailed
| | Westpac Group March 2020 Pillar 3 report |63 |
Pillar 3 report Securitisation |
transaction-specific guidelines that regulate servicer counterparty risk appetite, transaction tenor, asset class, third party credit support and portfolio quality. This policy is applied in conjunction with other credit and market risk policies that governs the provision of derivative and other services that support securitisation transactions. In particular, credit hedging transactions are subject to Westpac’s credit risk mitigation approach (see pages 57 and 58). Any interest rate or currency hedging is subject to counterparty credit risk management (see pages 59 and 60) and market risk management (see pages 72 and 73) policies and processes.
Regulatory capital approaches
The regulatory capital treatment of all securitisation exposures is measured in accordance with APS1201. APS120 specifies that securitisation exposures held in the trading book are subject to the requirements of Prudential Standard APS 116 Capital Adequacy: Market Risk.
Under APS120 the approaches employed include the External Rating Based Approach (ERBA) and the Supervisory Formula Approach (SFA). Under the ERBA, APRA provides risk-weights that are matched to external credit ratings and takes into account tranche maturity and tranche thickness. The SFA applicable to unrated exposures dynamically looks at the type and performance of underlying asset pools funded by the securitisation exposure as well as the structural features of the transaction to determine capital requirements. The Internal Assessment Approach (IAA) is not permitted under APS120.
Securitisation of Westpac originated assets - The assets sold by Westpac to a securitisation trust are excluded from Westpac’s calculation of credit risk weighted assets if capital relief is sought and the requirements of APS120 are satisfied2. Westpac cannot rely on external rating when risk weighting its exposure to these trusts and must use the SFA instead.
In instances where insufficient risk transfer is achieved by the transaction for regulatory purposes, the capital calculation is performed on the underlying asset pool while the facilities provided to such securitisation vehicles do not attract regulatory capital charges.
Securitisation in the management of Westpac’s credit portfolio - Securitisation exposures are assessed using either the ERBA or SFA approaches.
Provision of securitisation services including funding- Westpac uses the ERBA and the SFA methodology when determining regulatory capital requirements for warehouse and term funding facilities related to securitised assets on Westpac’s balance sheet.
The External Credit Assessment Institutions that can be used by Westpac for securitisations are Standard & Poor’s, Moody’s and Fitch.
Westpac’s accounting policies for securitisation activities
Securitisation of Westpac originated assets - The assets sold by Westpac to a securitisation trust remain on Westpac’s balance sheet for accounting purposes.
Securitisation in the management of Westpac’s credit portfolio- For risk mitigation using synthetic securitisation, the underlying assets remain on Westpac's balance sheet for accounting purposes. The accounting treatment of the assets will depend on their nature. They could include loans and receivables, available for sale securities or derivatives. The most common form of synthetic securitisation is via a credit default swap, which is treated as a derivative and recognised in the profit and loss statement at fair value.
For investment in securitisation exposures, if the instrument has been designated on initial recognition at fair value (including instruments containing a credit default swap), the exposure will be measured at fair value through the Income Statement. All other investments in securitisation exposures will be classified as available-for-sale (AFS) and measured at fair value through Other Comprehensive Income (within the AFS securities reserve).
Provision of securitisation services including funding and management of conduit vehicles- Fee income from these services is recognised on an accrual basis. Liquidity and funding facilities are treated as commitments to provide finance, with fee and margin income recognised on an accrual basis. Warehouse and term funding facilities are treated as loans.
1The latest version of APS120 came into effect from 1 January 2019.
2 Including the requirements to achieve capital relief.
| 64| Westpac Group March 2020 Pillar 3 report | |
Pillar 3 report Securitisation |
Banking book summary of assets securitised by Westpac
This table shows outstanding banking book securitisation assets and assets intended to be securitised1for Westpac originated assets by underlying asset type. It includes the amount of impaired and past due assets, along with any losses recognised by Westpac during the current period.
Securitised assets are held in securitisation trusts. Trusts which meet requirements to achieve capital relief do not form part of the Level 2 consolidated group. Self securitisation trusts remain consolidated at Level 2 and the assets transferred to these trusts are risk weighted in accordance with APS113.
| Total outstanding securitised by ADI | Assets | Westpac | |||||
| 31 March 2020 | Traditional | Synthetic | intended to be | Impaired | Past due | recognised | |
| $m | Securitisation2 | Securitisation | securitised | loans | assets | losses | |
| Residential mortgages | 106,523 | - | - | 68 | 838 | - | |
| Credit cards | - | - | - | - | - | - | |
| Auto and equipment finance | 2,306 | - | - | 38 | - | - | |
| Business lending | - | - | - | - | - | - | |
| Investments in ABS | - | - | - | - | - | - | |
| Other | - | - | - | - | - | - | |
| Total | 108,829 | - | - | 106 | 838 | - | |
| Total outstanding securitised by ADI | Assets | Westpac | |||||
| 30 September 2019 | Traditional | Synthetic | intended to be | Impaired | Past due | recognised | |
| $m | Securitisation2 | Securitisation | securitised | loans | assets | losses | |
| Residential mortgages | 96,725 | - | - | 70 | 781 | - | |
| Credit cards | - | - | - | - | - | - | |
| Auto and equipment finance | 2,710 | - | - | 36 | - | - | |
| Business lending | - | - | - | - | - | - | |
| Investments in ABS | - | - | - | - | - | - | |
| Other | - | - | - | - | - | - | |
| Total | 99,435 | - | - | 106 | 781 | - | |
| Total outstanding securitised by ADI | Assets | Westpac | |||||
| 31 March 2019 | Traditional | Synthetic | intended to be | Impaired | Past due | recognised | |
| $m | Securitisation2 | Securitisation | securitised | loans | assets | losses | |
| Residential mortgages | 92,969 | - | - | 66 | 737 | - | |
| Credit cards | - | - | - | - | - | - | |
| Auto and equipment finance | 3,256 | - | - | 46 | - | - | |
| Business lending | - | - | - | - | - | - | |
| Investments in ABS | - | - | - | - | - | - | |
| Other | - | - | - | - | - | - | |
| Total | 96,225 | - | - | 112 | 737 | - | |
Banking book summary of total Westpac sponsored third party assets securitised
This table represents banking book third party assets where Westpac acts as a sponsor.
| $m | 31 March 2020 | 30 September 2019 | 31 March 2019 | |
| Residential mortgages | 122 | 310 | 87 | |
| Credit cards | - | - | - | |
| Auto and equipment finance | - | - | - | |
| Business lending | - | - | - | |
| Investments in ABS | - | - | - | |
| Other | - | - | - | |
| Total | 122 | 310 | 87 |
| 1 | Represents securitisation activity from the end of the reporting period to the disclosure date of this report. |
| 2 | Includes self-securitisation assets of $98,212 million as at 31 March 2020 ($90,184 million as at 30 September 2019 and $85,449 million at 31 March 2019). |
| | Westpac Group March 2020 Pillar 3 report |65 |
Pillar 3 report Securitisation |
Banking book summary of securitisation activity by asset type
This table shows assets transferred into securitisation schemes by underlying asset type (ADI originated) for the relevant period.
| For the 6 months ended | ||
| 31 March 2020 | Amount | Recognised gain or |
| $m | securitised | loss on sale |
| Residential mortgages | 19,547 | - |
| Credit cards | - | - |
| Auto and equipment finance | 318 | - |
| Business lending | - | - |
| Investments in ABS | - | - |
| Other | - | - |
| Total | 19,865 | - |
| For the 12 months ended | ||
| 30 September 2019 | Amount | Recognised gain or |
| $m | securitised | loss on sale |
| Residential mortgages | 30,899 | - |
| Credit cards | - | - |
| Auto and equipment finance | 600 | - |
| Business lending | - | - |
| Investments in ABS | - | - |
| Other | - | - |
| Total | 31,499 | - |
| For the 6 months ended | ||
| 31 March 2019 | Amount | Recognised gain or |
| $m | securitised | loss on sale |
| Residential mortgages | 17,444 | - |
| Credit cards | - | - |
| Auto and equipment finance | 295 | - |
| Business lending | - | - |
| Investments in ABS | - | - |
| Other | - | - |
| Total | 17,739 | - |
| 66| Westpac Group March 2020 Pillar 3 report | |
Pillar 3 report Securitisation |
Banking book summary of on and off-balance sheet securitisation by exposure type
| 31 March 2020 | On balance sheet | Off-balance | Total Exposure | |
| $m | Securitisation retained | Securitisation purchased | sheet | at Default |
| Securities | - | 8,583 | 39 | 8,622 |
| Liquidity facilities | - | - | 306 | 306 |
| Funding facilities | 3,163 | - | 783 | 3,946 |
| Underwriting facilities | - | - | - | - |
| Lending facilities | 536 | - | 299 | 835 |
| Warehouse facilities | 10,408 | - | 3,980 | 14,388 |
| Total | 14,107 | 8,583 | 5,407 | 28,097 |
| 30 September 2019 | On balance sheet | Off-balance | Total Exposure | |
| $m | Securitisation retained | Securitisation purchased | sheet | at Default |
| Securities | - | 8,685 | 37 | 8,722 |
| Liquidity facilities | 147 | - | 384 | 531 |
| Funding facilities | 2,989 | - | 1,054 | 4,043 |
| Underwriting facilities | - | - | - | - |
| Lending facilities | 428 | - | 169 | 597 |
| Warehouse facilities | 10,310 | - | 2,571 | 12,881 |
| Total | 13,874 | 8,685 | 4,215 | 26,774 |
| 31 March 2019 | On balance sheet | Off-balance | Total Exposure | |
| $m | Securitisation retained | Securitisation purchased | sheet | at Default |
| Securities | - | 8,746 | 34 | 8,780 |
| Liquidity facilities | - | - | 299 | 299 |
| Funding facilities | 2,577 | - | 1,168 | 3,745 |
| Underwriting facilities | - | - | - | - |
| Lending facilities | 9 | - | 8 | 17 |
| Warehouse facilities | 9,435 | - | 3,653 | 13,088 |
| Total | 12,021 | 8,746 | 5,162 | 25,929 |
| | Westpac Group March 2020 Pillar 3 report |67 |
Pillar 3 report |
Securitisation |
Banking book securitisation exposure at default by risk weight band
| 31 March 2020 | Exposure | Total Exposure | Risk Weighted Assets | Total Risk | ||
| $m | Securitisation | Resecuritisation | at Default | Securitisation | Resecuritisation | Weighted Assets |
| Less than or equal to 10% | 5 | - | 5 | - | - | - |
| Greater than 10 - 20% | 22,579 | - | 22,579 | 3,887 | - | 3,887 |
| Greater than 20 - 30% | 2,787 | - | 2,787 | 680 | - | 680 |
| Greater than 30 - 50% | 2,109 | - | 2,109 | 814 | - | 814 |
| Greater than 50 - 75% | 554 | - | 554 | 306 | - | 306 |
| Greater than 75 - 100% | 2 | - | 2 | 2 | - | 2 |
| Greater than 100 - 250% | 48 | - | 48 | 57 | - | 57 |
| Greater than 250 - 425% | - | - | - | - | - | - |
| Greater than 425 - 650% | - | - | - | - | - | - |
| Other | - | - | - | - | - | - |
| Deductions | 14 | - | 14 | - | - | - |
| Total | 28,097 | - | 28,097 | 5,747 | - | 5,747 |
| 30 September 2019 | Exposure | Total Exposure | Risk Weighted Assets | Total Risk | ||
| $m | Securitisation | Resecuritisation | at Default | Securitisation | Resecuritisation | Weighted Assets |
| Less than or equal to 10% | - | - | - | - | - | - |
| Greater than 10 - 20% | 21,676 | - | 21,676 | 3,743 | - | 3,743 |
| Greater than 20 - 30% | 2,007 | - | 2,007 | 498 | - | 498 |
| Greater than 30 - 50% | 2,225 | - | 2,225 | 859 | - | 859 |
| Greater than 50 - 75% | 464 | - | 464 | 266 | - | 266 |
| Greater than 75 - 100% | 373 | - | 373 | 350 | - | 350 |
| Greater than 100 - 250% | 30 | - | 30 | 33 | - | 33 |
| Greater than 250 - 425% | - | - | - | - | - | - |
| Greater than 425 - 650% | - | - | - | - | - | - |
| Other | - | - | - | - | - | - |
| Deductions | - | - | - | - | - | - |
| Total | 26,774 | - | 26,774 | 5,749 | - | 5,749 |
| 31 March 2019 | Exposure | Total Exposure | Risk Weighted Assets | Total Risk | ||
| $m | Securitisation | Resecuritisation | at Default | Securitisation | Resecuritisation | Weighted Assets |
| Less than or equal to 10% | - | - | - | - | - | - |
| Greater than 10 - 20% | 21,621 | - | 21,621 | 3,771 | - | 3,771 |
| Greater than 20 - 30% | 1,825 | - | 1,825 | 461 | - | 461 |
| Greater than 30 - 50% | 1,723 | - | 1,723 | 714 | - | 714 |
| Greater than 50 - 75% | 439 | - | 439 | 252 | - | 252 |
| Greater than 75 - 100% | 267 | - | 267 | 249 | - | 249 |
| Greater than 100 - 250% | 36 | - | 36 | 40 | - | 40 |
| Greater than 250 - 425% | - | - | - | - | - | - |
| Greater than 425 - 650% | 18 | - | 18 | 96 | - | 96 |
| Other | - | - | - | - | - | - |
| Deductions | - | - | - | - | - | - |
| Total | 25,929 | - | 25,929 | 5,583 | - | 5,583 |
Banking book securitisation exposure deducted from capital
| $m | 31 March 2020 | 30 September 2019 | 31 March 2019 |
| Securities | - | - | - |
| Liquidity facilities | - | - | - |
| Funding facilities | 14 | - | - |
| Underwriting facilities | - | - | - |
| Credit enhancements | - | - | - |
| Derivative transactions | - | - | - |
| Total | 14 | - | - |
| 68| Westpac Group March 2020 Pillar 3 report | |
Pillar 3 report |
Securitisation |
Banking book securitisation subject to early amortisation treatment
There is no securitisation exposure in the banking book that is subject to early amortisation treatment as at 31 March 2020 (nil as at 30 September 2019).
Banking book resecuritisation exposure subject to credit risk mitigation (CRM)
As at 31 March 2020 resecuritisation exposures subject to CRM was nil (nil at 30 September 2019).
Banking book resecuritisation exposure to guarantors
Westpac has no third party guarantors providing guarantees for securitised assets, principal or interest repayments as at 31 March 2020 (nil as at 30 September 2019).
Trading book summary of assets securitised by Westpac
As at 31 March 2020 there was nil in outstanding securitisation exposures for Westpac originated assets held in the trading book (nil as at 30 September 2019).
Trading book summary of total Westpac sponsored third party assets securitised
There are no third party assets held in the trading book where Westpac is responsible for the establishment of the securitisation program and subsequent management as at 31 March 2020 (nil as at 30 September 2019).
Trading book summary of securitisation activity by asset type
There is no originated securitisation activity in the trading book for the 12 months to 31 March 2020 (nil for the 6 months to 30 September 2019).
Trading book aggregated amount of exposure securitised by Westpac and subject to APS116 Capital Adequacy: Market Risk
As at 31 March 2020 there is no Westpac originated outstanding securitisation exposure held in the trading book subject to APS116 Capital Adequacy: Market Risk (nil as at 30 September 2019).
| | Westpac Group March 2020 Pillar 3 report |69 |
Pillar 3 report |
Securitisation |
Trading book summary of on and off-balance sheet securitisation by exposure type1
| 31 March 2020 | On balance sheet | Off-balance | Total Exposure | |
| $m | Securitisation retained | Securitisation purchased | sheet | at Default |
| Securities | - | 92 | - | 92 |
| Liquidity facilities | - | - | - | - |
| Funding facilities | - | - | - | - |
| Underwriting facilities | - | - | - | - |
| Lending facilities | - | - | - | - |
| Warehouse facilities | - | - | - | - |
| Credit enhancements | - | - | - | - |
| Basis swaps | - | - | 116 | 116 |
| Other derivatives | - | - | 16 | 16 |
| Total | - | 92 | 132 | 224 |
| 30 September 2019 | On balance sheet | Off-balance | Total Exposure | |
| $m | Securitisation retained | Securitisation purchased | sheet | at Default |
| Securities | - | 44 | - | 44 |
| Liquidity facilities | - | - | - | - |
| Funding facilities | - | - | - | - |
| Underwriting facilities | - | - | - | - |
| Lending facilities | - | - | - | - |
| Warehouse facilities | - | - | - | - |
| Credit enhancements | - | - | - | - |
| Basis swaps | - | - | 59 | 59 |
| Other derivatives | - | - | 13 | 13 |
| Total | - | 44 | 72 | 116 |
| 31 March 2019 | On balance sheet | Off-balance | Total Exposure | |
| $m | Securitisation retained | Securitisation purchased | sheet | at Default |
| Securities | - | 30 | - | 30 |
| Liquidity facilities | - | - | - | - |
| Funding facilities | - | - | - | - |
| Underwriting facilities | - | - | - | - |
| Lending facilities | - | - | - | - |
| Warehouse facilities | - | - | - | - |
| Credit enhancements | - | - | - | - |
| Basis swaps | - | - | 48 | 48 |
| Other derivatives | - | - | 7 | 7 |
| Total | - | 30 | 55 | 85 |
Trading book securitisation exposure subject to specific risk
There is no trading book securitisation exposure subject to specific risk for 31 March 2020 (nil for 30 September 2019).
Trading book securitisation exposure subject to APS120 Securitisation specific risk by risk weight band
There is no trading book securitisation exposure subject to APS120 specific risk for 31 March 2020 (nil for 30 September 2019).
Trading book capital requirements for securitisation exposures subject to internal models approach (IMA) by risk classification
There is no trading book capital requirement for securitisation subject to IMA for 31 March 2020 (nil for 30 September 2019).
Trading book capital requirements for securitisation regulatory capital approaches by risk weight band
There is no trading book capital requirement for securitisation subject to regulatory capital approaches for 31 March 2020 (nil for 30 September 2019).
| 1 | EAD associated with trading book securitisation is not included in the EAD by Major Type on page 33. Trading book securitisation exposure is captured and risk weighted under APS116. |
| 70| Westpac Group March 2020 Pillar 3 report | |
Pillar 3 report |
Securitisation |
Trading book securitisation exposure deducted from capital
There is no trading book capital deduction for 31 March 2020 (nil for 30 September 2019).
Trading book securitisation subject to early amortisation treatment
There is no securitisation exposure in the trading book that is subject to early amortisation treatment for 31 March 2020 (nil for 30 September 2019).
Trading book resecuritisation exposure subject to CRM
Westpac has no resecuritisation exposure subject to CRM at31 March 2020 (nil for 30 September 2019).
Trading book resecuritisation by guarantor creditworthiness
Westpac has no third party guarantors providing guarantees for securitised assets, principal or interest repayments for 31 March 2020 (nil for 30 September 2019).
| | Westpac Group March 2020 Pillar 3 report |71 |
Pillar 3 report Market risk |
Westpac’s exposure to market risk arises out of its Financial Markets and Treasury trading activities. This is quantified for regulatory capital purposes using both the standard method and the internal model approach, details of which are provided below.
Approach
Financial Markets’ trading activity includes dealings that encompass book running and distribution activity. The types of market risk arising from these activities include interest rate, foreign exchange, commodity, equity price, credit spread and volatility risk.
Treasury’s trading activity includes the management of interest rate, foreign exchange and credit spread risks associated with the wholesale funding book, liquid asset portfolios and foreign exchange repatriations. Treasury also manages banking book risk which is discussed in the Interest Rate Risk in the Banking Book section.
Trading activities are managed within a BRCC approved market risk framework that incorporates BRCC approved value at risk (VaR) and stressed value at risk (SVaR) limits. VaR and SVaR are the primary mechanisms for measuring and managing market risk. Market risk is managed using VaR, SVaR and structural risk limits (including volume limits and basis point value limits) in conjunction with scenario analysis and stress testing. Market risk limits are allocated to business management based upon Westpac’s risk appetite and business strategies, in addition to the consideration of market liquidity and concentration risk.
Trades are fair valued daily using rates that have been captured from an independent market data source that has been approved by the Revaluation Committee (RC). Where there is no source of independent rates, data will either be derived using a methodology approved by the RC or sourced from dealer contributions. Rates that are dealer-sourced or have limited independent sources are reviewed at least on a monthly basis. The RC will meet monthly to review the results of independent price verification performed by the Finance valuation function. In addition, valuation adjustments may be made as deductions from Common Equity Tier 1 Capital for exposures which are not be captured through the fair valuation framework.
VaR and SVaR limits
Market risk arising from trading book activities is primarily measured using VaR based on an historical simulation methodology. Westpac estimates VaR as the potential loss in earnings from adverse market movements and is calculated to a 99% confidence level using the most recent 12 months of historical market data. SVaR is an additional VaR measure which uses 12 months of historical market data that includes a period of significant financial stress. VaR and SVaR take account of all material market variables that may cause a change in the value of the trading portfolio, including interest rates, foreign exchange rates, price changes, volatility, and the correlation between these variables.
The BRCC approved market risk VaR and SVaR limits for trading activities include separate VaR and SVaR sub-limits for the trading activities of Financial Markets and Treasury.
Backtesting
Daily backtesting of VaR results is performed to ensure that model integrity is maintained. A review of both the actual and potential profit and loss outcomes is also undertaken to monitor any skew created by the historical data.
Stress testing
Daily stress testing against pre-determined scenarios is carried out to analyse potential losses beyond the 99% confidence level. An escalation framework around selective stress tests is approved by the Head of Market Risk.
Profit and loss notification framework
The BRCC has approved a profit and loss notification framework. Included in this framework are levels of escalation in accordance with the size of the profit or loss. Triggers are applied to both a 1-day and a rolling 20-day cumulative total.
| 72| Westpac Group March 2020 Pillar 3 report | |
Pillar 3 report Market risk |
Risk reporting
Daily monitoring of current exposure and limit utilisation is conducted independently by risk managers in the Market Risk and Treasury Risk teams, who monitor market risk exposures against VaR, SVaR and structural limits. Daily VaR and SVaR position reports are produced by risk type, by product lines and by geographic region. These are supplemented by structural risk reporting, advice of profit and loss trigger levels and stress test escalation trigger points. Model accreditation has been granted by APRA for the use of an internal model for the determination of regulatory capital for the key classes of interest rate (general market), foreign exchange, commodity and equity risks (including equity specific risk). Under the model, regulatory capital is derived from both the current VaR window (based upon the most recent 12 months of historical market data) and a SVaR window (12 months of market data that includes a period of significant financial stress), where these VaR measures are calculated over a 10-day time horizon to a 99th percentile, one-tailed confidence interval. Specific risk refers to the variations in individual security prices that cannot be explained by general market movements, and event and default risk. Interest rate specific risk capital (specific issuer risk) is calculated using the Standard method and is added to the VaR regulatory capital measure.
Risk mitigation
Market risk positions are managed by the trading desks consistent with delegated trading and product authorities. Risks are consolidated into portfolios based on product and risk type. Risk management is carried out by qualified personnel with varying levels of seniority commensurate with the nature and scale of market risks under management.
The following controls allow monitoring by management:
| l | trading authorities and responsibilities are clearly delineated at all levels; |
| l | a structured system of limits and reporting of risk exposures, including stress testing; |
| l | surveillance of dealing room conduct; |
| l | all new products and significant product variations undergo a rigorous approval process to identify business risks prior to launch; |
| l | models that are used to determine risk or profit and loss for Westpac’s accounts are independently reviewed; |
| l | duties are segregated so that employees involved in the origination, processing and valuation of transactions operate under separate reporting lines, minimising the opportunity for collusion; and |
| l | legal personnel review documentation for compliance with relevant laws and regulations. In addition, internal audit independently reviews compliance with policies, procedures and limits. |
In addition, Group Audit independently reviews compliance with policies, procedures and limits.
Market risk regulatory capital and risk weighted assets
The Internal model approach uses VaR and Stressed VaR, while the Standard approach is used for interest rate specific risk.
| $m | 31 March 2020 | 30 September 2019 | 31 March 2019 |
| Internal model approach | 571 | 652 | 596 |
| Standard approach | 101 | 96 | 71 |
| Total capital required | 672 | 748 | 667 |
| Risk weighted assets | 8,396 | 9,350 | 8,338 |
| | Westpac Group March 2020 Pillar 3 report |73 |
Pillar 3 report Market risk |
VaR by risk type
| 31 March 2020 | For the 6 months ended | |||
| $m | High | Low | Average | Period end |
| Interest rate risk | 21.7 | 7.0 | 9.9 | 15.4 |
| Foreign exchange risk | 11.2 | 0.5 | 3.9 | 1.5 |
| Equity risk | 0.4 | 0.0 | 0.1 | 0.4 |
| Commodity risk | 3.4 | 1.2 | 2.2 | 2.7 |
| Other market risks | 32.9 | 2.4 | 6.5 | 28.1 |
| Diversification benefit | NA | NA | (10.9) | (25.1) |
| Net market risk1 | 31.8 | 7.1 | 11.6 | 23.0 |
| 30 September 2019 | For the 6 months ended | |||
| $m | High | Low | Average | Period end |
| Interest rate risk | 14.3 | 6.6 | 10.1 | 8.2 |
| Foreign exchange risk | 7.0 | 0.8 | 3.6 | 3.0 |
| Equity risk | 0.2 | 0.0 | 0.1 | 0.0 |
| Commodity risk | 42.0 | 1.7 | 8.2 | 2.6 |
| Other market risks | 4.6 | 2.8 | 3.7 | 4.0 |
| Diversification benefit | NA | NA | (11.5) | (8.8) |
| Net market risk1 | 45.3 | 7.9 | 14.1 | 9.2 |
| 31 March 2019 | For the 6 months ended | |||
| $m | High | Low | Average | Period end |
| Interest rate risk | 14.9 | 8.7 | 11.8 | 10.5 |
| Foreign exchange risk | 8.6 | 1.4 | 4.5 | 3.5 |
| Equity risk | 0.1 | 0.0 | 0.0 | 0.1 |
| Commodity risk | 14.5 | 4.6 | 8.1 | 13.5 |
| Other market risks | 5.5 | 2.0 | 3.3 | 3.7 |
| Diversification benefit | NA | NA | (13.2) | (15.0) |
| Net market risk1 | 18.8 | 10.7 | 14.6 | 16.3 |
Stressed VaR by risk type
| 31 March 2020 | For the 6 months ended | |||
| $m | High | Low | Average | Period end |
| Interest rate risk | 85.7 | 39.5 | 58.0 | 55.5 |
| Foreign exchange risk | 34.3 | 0.9 | 10.8 | 2.4 |
| Equity risk | 0.3 | 0.0 | 0.1 | 0.2 |
| Commodity risk | 13.1 | 2.2 | 5.0 | 5.9 |
| Other market risks | 23.3 | 16.2 | 18.8 | 19.0 |
| Diversification benefit | NA | NA | (66.6) | (22.5) |
| Net market risk1 | 89.4 | 34.0 | 56.0 | 60.6 |
| 30 September 2019 | For the 6 months ended | |||
| $m | High | Low | Average | Period end |
| Interest rate risk | 93.6 | 38.4 | 57.9 | 48.0 |
| Foreign exchange risk | 26.2 | 1.4 | 11.4 | 9.3 |
| Equity risk | 0.3 | 0.0 | 0.1 | 0.1 |
| Commodity risk | 105.4 | 4.0 | 14.1 | 5.6 |
| Other market risks | 19.6 | 12.4 | 16.7 | 19.0 |
| Diversification benefit | NA | NA | (89.5) | (28.0) |
| Net market risk1 | 106.2 | 37.9 | 56.4 | 54.0 |
1VaR and SVaR measures shown here use a 1 day time horizon. The net market risk measure reflects the aggregate diversified risk position for the period. Therefore, individual risk factors will not sum to this total.
| 74| Westpac Group March 2020 Pillar 3 report | |
Pillar 3 report Market risk |
| 31 March 2019 | For the 6 months ended | |||
| $m | High | Low | Average | Period end |
| Interest rate risk | 90.3 | 33.7 | 58.6 | 63.4 |
| Foreign exchange risk | 36.6 | 2.4 | 14.6 | 6.5 |
| Equity risk | 0.2 | 0.1 | 0.2 | 0.2 |
| Commodity risk | 34.0 | 6.7 | 17.0 | 30.3 |
| Other market risks | 14.4 | 8.8 | 12.7 | 14.4 |
| Diversification benefit | NA | NA | (89.0) | (48.0) |
| Net market risk1 | 86.8 | 39.8 | 57.8 | 66.8 |
Back-testing results
The following graph gives a comparison of actual profit and loss to VaR over the 6 months ended 31 March 2020.
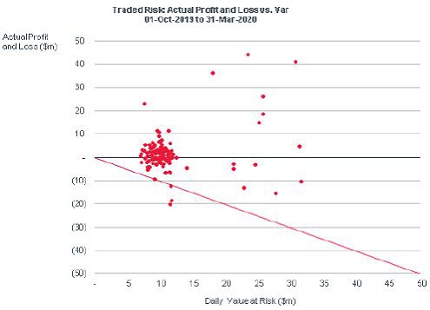
Each point on the graph represents 1 day’s trading profit or loss. This result is placed on the graph relative to the associated VaR utilisation. The downward sloping line represents the point where a loss is equal to VaR utilisation.
1The net market risk measure reflects the aggregate diversified risk position for the period. Therefore, individual risk factors will not sum to this total.
| | Westpac Group March 2020 Pillar 3 report |75 |
| Pillar | 3 report |
| Interest Rate Risk in the Banking Book (IRRBB) |
Interest Rate Risk in the Banking Book (IRRBB) is the risk to interest income arising from a mismatch between the duration of assets and liabilities that arises in the normal course of banking activities.
Approach
The banking book activities that give rise to market risk include lending activities, balance sheet funding and capital management. Interest rate risk, basis risk, currency risk and funding and liquidity risk are inherent in these activities. Treasury’s Asset & Liability Management (ALM) unit is responsible for managing market risk arising from Westpac’s banking book activity.
All material regions, business lines and legal entities are included in Westpac’s IRRBB framework.
Model accreditation has been granted by APRA for the use of an internal model for the determination of IRRBB regulatory capital. Under the model, regulatory capital is primarily derived from a VaR measure using 6 years of historical data with a scaled 1 year, 99th percentile, one-tailed confidence interval. A standardised calculation of credit spread risk is added to the VaR regulatory capital measure.
Asset and liability management
The ALM unit manages the structural interest rate mismatch associated with the transfer priced balance sheet, including the investment of Westpac’s capital to its agreed benchmark duration. A key risk management objective is to achieve reasonable stability of Net Interest Income (NII) over time. These activities are performed under the oversight of ALCO and the Treasury Risk team.
Net Interest Income sensitivity
NII sensitivity is managed in terms of the net interest income-at-risk (NaR) modelled over a set time horizon using defined scenarios for movements in wholesale market interest rates. The NII measurement framework combines the underlying statement of financial position data with assumptions about runoff and new business, expected repricing behaviour and changes in wholesale market interest rates. The interest rate scenarios modelled include those projected using 100 and 200 basis point shifts up and down from current market yield curves.
A comparison between the NII outcomes from these modelled scenarios indicates the sensitivity to interest rate changes. On and off-balance sheet instruments are then used to manage this interest rate risk.
NaR limit
The BRCC has approved a NaR limit. This limit is managed by the Group Treasurer and is expressed as a defined basis point shock over a one year risk horizon. This limit is monitored by the Treasury Risk team.
VaR limit
The BRCC has also approved an interest rate VaR limit for ALM activities. This limit is managed by the Group Treasurer and monitored by the Treasury Risk team. Additionally, the BRCC and the Treasury Risk team set structural risk limits to prevent undue concentration of risk
Structural foreign exchange rate risk
Structural foreign exchange rate risk results from the generation of foreign currency denominated earnings and from Westpac's capital deployed in offshore branches and subsidiaries, where it is denominated in currencies other than Australian dollars. The Australian dollar equivalent of offshore earnings and capital is subject to change as exchange rates fluctuate, which could introduce significant variability to Westpac's reported financial results. ALCO provides oversight of the appropriateness of foreign exchange hedges on earnings and capital.
Risk reporting
Interest rate risk in the banking book risk measurement systems include front office product systems, which capture all treasury funding and derivative transactions; the transfer pricing system, which captures all retail and other business transactions; and non-traded Interest Rate Risk systems, which calculate amongst other things, ALM VaR and NaR.
Daily monitoring of market risk exposure against VaR and structural risk limits is conducted independently by the Treasury Risk team, with NaR monitored on a monthly basis. Management reports detailing structural positions and VaR are produced and distributed daily for use by dealers and management across all stakeholder groups. Quarterly reports are produced for the senior management market risk forums of RISKCO and BRCC to provide transparency of material market risks and issues.
| | Westpac Group March 2020 Pillar 3 report |76 |
Pillar 3 report
| Interest Rate Risk in the Banking Book (IRRBB) |
Risk mitigation
Market risk arising in the banking book stems from the ordinary course of banking activities, including structural interest rate risk (the mismatch between the duration of assets and liabilities) and capital management. Hedging Westpac’s exposure to interest rate risk is undertaken using derivatives. The hedge accounting strategy adopted utilises a combination of the cash flow, fair value and net investment hedge approaches. Some derivatives held for economic hedging purposes do not meet the criteria for hedge accounting as defined under AASB 139 Financial Instruments: Recognition and Measurement and therefore are accounted for in the same way as derivatives held for trading.
The same controls used to monitor traded market risk allow for continuous monitoring by management.
Change in economic value of a sudden upward and downward movement in interest rates
| 31 March 2020 | 200bp parallel | 200bp parallel | |
| $m | increase | decrease | |
| AUD | 7.7 | 5.6 | |
| NZD | 10.2 | 10.6 | |
| USD | 71.1 | (38.9) | |
| Total | 89.0 | (22.7) | |
| 30 September 2019 | 200bp parallel | 200bp parallel | |
| $m | increase | decrease | |
| AUD | 67.9 | (24.0) | |
| NZD | 2.2 | 14.6 | |
| USD | 70.7 | (73.0) | |
| Total | 140.8 | (82.4) | |
| 31 March 2019 | 200bp parallel | 200bp parallel | |
| $m | increase | decrease | |
| AUD | (560.1) | 518.4 | |
| NZD | 18.6 | (6.2) | |
| USD | 7.5 | (11.5) | |
| Total | (534.0) | 500.7 | |
VaR results for non-traded interest rate risk1
| For the | For the | For the | |
| 6 months ended | 6 months ended | 6 months ended | |
| 31 March | 30 September | 31 March | |
| $m | 2020 | 2019 | 2019 |
| High | 169.2 | 37.3 | 31.8 |
| Low | 31.0 | 25.2 | 19.4 |
| Average | 45.7 | 32.4 | 23.2 |
| Period end | 169.2 | 34.1 | 30.8 |
Interest rate risk in the banking book regulatory capital and risk weighted assets2
| 31 March | 30 September | 31 March | |
| $m | 2020 | 2019 | 2019 |
| Total capital required | 424 | 42 | 566 |
| Risk weighted assets | 5,305 | 530 | 7,076 |
| 1 | IRRBB VaR includes interest rate risk, credit spread risk in liquid assets and other basis risks as used for internal management purposes. |
| 2 | IRRBB capital currently includes a $500m adjustment for the impacts of the low interest rate environment pending a model upgrade. The effect of this adjustment is offset by gains embedded in the valuation of banking book exposures which are a component of the IRRBB capital calculation. |
| | Westpac Group March 2020 Pillar 3 report |77 |
Pillar 3 report
| Operational risk |
Operational risk is defined as the risk of loss resulting from inadequate or failed internal processes, people and systems or from external events. This definition includes legal and regulatory risk but excludes strategic risk. Westpac’s operational risk definition is aligned to APS115 Capital Adequacy: Advanced Measurement Approaches to Operational Risk (AMA).
Approach
Westpac has been accredited to use the AMA in accordance with APS115. Westpac’s operational risk is measured and managed in accordance with the policies and processes defined in its Operational Risk Management Framework.
Westpac’s Operational Risk Management Framework
The Operational Risk Management Framework outlines our approach to the:
| l | identification, measurement and management of operational risks that may impede Westpac’s ability to achieve its strategic objectives and vision; |
| l | identification and escalation of operational risk incidents in order to mitigate potential financial loss, regulatory impacts and reputational damage that may impact shareholders, the community, and employees; and |
| l | calculation of operational risk capital. |
The key components of Westpac’s operational risk management framework are listed below:
Governance- The governance structure provides clearly defined roles and responsibilities for overseeing and reviewing operational risk exposure and its management.
The Board and BRCC are supported by committees, including RISKCO, that monitor the Group’s operational risk profile and the effectiveness of operational risk management practices, including operational risk capital.
Risk and Control Management (RCM)- The RCM process provides a structured approach both at a Divisional and Business Unit level for the identification, assessment and management of operational risks that could prevent Westpac from meeting its strategic and business objectives.
Issue and Action Management- The Issue and Action Management process encompasses the identification and management of issues, which relate to control deficiencies or gaps, to ensure that they are effectively addressed through action plans.
Key Indicators (KIs) - The framework defines requirements and processes for KIs, which are objective measures used by management to monitor the risk and control environment.
Incident Management - Incident management involves identifying operational risk events, capturing them in the Group’s operational risk system and escalating them to appropriate levels of management. Early identification supports the ability to mitigate any immediate impacts, address the primary cause, and devise management actions to strengthen the control environment.
Data- The framework includes principles and processes to ensure the integrity of operational risk data used to support management decision-making and calculate and allocate capital. The principles apply to the governance, input and capture, reconciliation and validation, reporting and storage of operational risk data. Operational risk data is subject to independent validation on a regular basis.
Scenario Analysis- Scenario analysis is used to assess the impacts of severe but plausible loss events and is an input to the calculation of operational risk capital.
Operational Risk in Projects- The framework defines requirements for understanding and managing the operational risk implications of projects.
Reporting- Regular reporting of operational risk information to governance bodies and senior management is used to support timely and proactive management of operational risk and enable transparent and formal oversight of the risk and control environment.
Controls Assurance - The framework defines the process and requirements for providing assurance over the effectiveness of the operational risk control environment, including the testing and assessment of the design and operating effectiveness of controls.
| | Westpac Group March 2020 Pillar 3 report |78 |
Pillar 3 report
| Operational risk |
AMA capital model overview
Operational risk regulatory capital is calculated on a quarterly basis. Westpac’s operational risk capital is based on three data sources:
| l | Internal Loss Data – operational risk losses experienced by Westpac; |
| l | External Loss Data – operational risk losses experienced by other financial institutions; and |
| l | Scenario Data – potential losses from severe but plausible events relevant to Westpac. |
These data sources together represent the internal and external operational risk profile, across the spectrum of operational risk losses, from both historical and forward-looking perspectives. The model combines these data sources to produce a loss distribution.
Expected loss offsets and risk mitigation
No adjustments or deductions are currently made to Westpac’s measurement of operational risk regulatory capital for the mitigating impacts of insurance or expected operational risk losses.
Operational Risk regulatory capital and risk weighted assets
| $m | 31 March 2020 | 30 September 2019 | 31 March 2019 |
| Advanced measurement approach | 2,562 | 2,549 | 2,491 |
| Standardised approach overlay | 765 | 765 | 600 |
| Culture, Governance & Accountability Review overlay | 500 | 500 | - |
| AUSTRAC related overlay | 500 | - | - |
| Total capital required | 4,327 | 3,814 | 3,091 |
| Risk weighted assets | 54,093 | 47,680 | 38,641 |
| | Westpac Group March 2020 Pillar 3 report |79 |
Pillar 3 report
| Equity risk |
Equity risk is defined as the potential for financial loss arising from movements in equity values. The disclosures in this section exclude investments in equities made by Westpac subsidiaries outside the regulatory Level 2 group.
Structure and organisation
Portfolio and transactional limits for Westpac’s direct equity investments are governed by various supporting policies and delegated approval limits. Where appropriate, the BRCC (under delegation from the Westpac Board) will consider and approve risks beyond management’s approval authority.
Approach
Westpac has established a comprehensive set of policies defining the management of equity risk. These policies are reviewed and approved periodically (in most cases annually).
Risk mitigation
Westpac does not use financial instruments to mitigate its exposure to equities in the banking book.
Banking book positions
Hybrid equity underwriting and equity warehousing risk - As a financial intermediary Westpac underwrites listed and unlisted hybrid equity securities.
Investment securities - Westpac undertakes, as part of the ordinary course of business, certain investments in strategic equity holdings and over time the nature of underlying investments will vary.
Measurement of equity securities - Equity securities are generally carried at their fair value. Fair value for equities that have a quoted market price (in an active market) is determined based upon current bid prices. If a market for a financial asset is not active, fair value is determined based upon a valuation technique. This includes the use of recent arms-length transactions, discounted cash flow analysis, option pricing models and other valuation techniques commonly used by market participants to price similar instruments. In the event that the fair value of an unlisted security cannot be measured reliably, these investments are measured at cost.
Where the investment is held for long term strategic purposes, these investments are accounted for either at fair value through other comprehensive income (OCI), fair values through profit and loss, or equity accounted for and recognised as a share in associates.
Other related matters
| l | Fair value should not differ to the listed stock price. Should a listed stock price not be available, fair value is estimated using the valuation techniques referred to above. The book value of certain unlisted investments for which active markets do not exist are measured at cost because cost is considered to be a reasonable approximation of fair value. |
| l | The equity method of accounting is used for investments in Associates. Associates are entities in which the Group has significant influence, but not control, over the operating and financial policies. |
Risk reporting
Westpac manages equity risk in two ways, VaR limits and investment limits:
| l | A VaR limit (in conjunction with structural limits) is used to manage traded equity. This limit is a sub-limit of the overall VaR limit for Financial Markets trading activities. Equity trading activity is overseen by the independent Market Risk function applying the same controls used for monitoring other trading book activities in Financial Markets and Treasury; and |
| l | Investment exposures are reported annually to MARCO. |
| | Westpac Group March 2020 Pillar 3 report |80 |
Pillar 3 report
| Equity risk |
Book value of equity exposures
| 31 March | 30 September | 31 March | |
| $m | 2020 | 2019 | 2019 |
| Listed equity exposures (publicly traded) | 199 | 328 | 383 |
| Unlisted equity exposures (privately traded) | 128 | 97 | 98 |
| Total book value of equity exposures | 327 | 425 | 481 |
Gains/losses
| 31 March | 30 September | 31 March | |
| $m | 2020 | 2019 | 2019 |
| Cumulative realised gains (losses) | - | (2) | 1 |
| Total unrealised gains (losses) through profit & loss | (91) | (72) | (29) |
| Total unrealised gains (losses) through equity | - | - | |
| Total latent revaluation gains (losses) | - | - |
| | Westpac Group March 2020 Pillar 3 report |81 |
Pillar 3 report
| Funding and liquidity risk management |
Funding and liquidity risk is the risk that Westpac cannot meet its payment obligations or that it does not have the appropriate amount, tenor and composition of funding and liquidity to support its assets.
Approach
Funding and liquidity risk is measured and managed in accordance with the policies and processes defined in the Board-approved Liquidity Risk Management Framework which is part of the Westpac Board-approved Risk Management Strategy.
Responsibility for managing Westpac’s liquidity and funding positions in accordance with the Liquidity Risk Management Framework is delegated to Treasury, under the oversight of Group ALCO and Treasury Risk.
Liquidity Risk Management Framework
The Liquidity Risk Management Framework sets out Westpac’s funding and liquidity risk appetite, roles and responsibilities of key people managing funding and liquidity risk within Westpac, risk reporting and control processes and limits and targets used to manage Westpac’s balance sheet. Key components of Westpac’s approach to liquidity risk management are listed below.
Funding strategy
Treasury undertakes an annual funding review that outlines Westpac’s balance sheet funding strategy over a three year period. This review encompasses trends in global markets, peer analysis, wholesale funding capacity, expected funding requirements and a funding risk analysis. This strategy is continuously reviewed to take account of changing market conditions, investor sentiment and estimations of asset and liability growth rates.
Westpac monitors the composition and stability of its funding so that it remains within its funding risk appetite. This includes compliance with both the LCR and Net Stable Funding Ratio (NSFR).
Liquid asset holdings
Westpac holds a portfolio of liquid assets for several purposes, including as a buffer against unforeseen funding requirements. The level of liquid assets held takes into account the liquidity requirements of Westpac’s balance sheet under normal and stress conditions.
Liquidity modelling
In managing liquidity for Westpac, Treasury utilises balance sheet forecasts and the maturity profile of Westpac’s wholesale funding portfolio to project liquidity outcomes. Local liquidity limits are also used by Westpac in applicable jurisdictions to ensure liquidity is managed efficiently and prudently.
In addition, Westpac conducts regular stress testing to assess its ability to meet cash flow obligations under a range of market conditions and scenarios. These scenarios inform liquidity limits and strategic planning.
Liquidity transfer pricing
Westpac has a liquidity transfer pricing framework which allocates liquidity costs across Westpac.
Contingency planning
Treasury maintains a contingent funding plan that outlines the steps that should be taken by Westpac in the event of an emerging ‘funding crisis’. The plan is aligned with Westpac’s broader Liquidity Crisis Management Policy which is approved annually by the Board.
Liquidity reporting
Daily liquidity risk reports are reviewed by the Group’s Treasury and Treasury Risk teams. Liquidity reports are presented to ALCO monthly and to the Board quarterly.
| | Westpac Group March 2020 Pillar 3 report |82 |
Pillar 3 report Liquidity coverage ratio |
Liquidity Coverage Ratio
Westpac’s LCR as at 31 March 2020 was 154%1 (31 December 2019: 130%) and the average LCR for the quarter was 140%2 (31 December 2019: 132%).
Liquid assets included in the LCR comprise High Quality Liquid Assets (HQLA), the Committed Liquidity Facility (CLF), the Term Funding Facility (TFF) from the Reserve Bank of Australia and additional qualifying Reserve Bank of New Zealand securities. Westpac received approval from APRA for a CLF of $52.0 billion for the calendar year 2020 (2019 calendar year: $54.0 billion). Westpac received approval from APRA for an Initial Allowance of TFF of $17.9 billion from 31 March 2020. Westpac maintains a portfolio of HQLA and these averaged $98.6 billion over the quarter2.
Funding is sourced from retail, small business, corporate and institutional customer deposits and wholesale funding. Westpac seeks to minimise the outflows associated with this funding by targeting customer deposits with lower LCR outflow rates and actively manages the maturity profile of its wholesale funding portfolio. Westpac maintains a buffer over the regulatory minimum of 100%.
| 31 March 2020 | 31 December 2019 | ||||
| $m | Total unweighted value (average)2 | Total weighted value (average)2 | Total unweighted value (average)2 | Total weighted value (average)2 | |
| Liquid assets, of which: | |||||
| 1 | High-quality liquid assets (HQLA) | 98,611 | 87,120 | ||
| 2 | Alternative liquid assets (ALA) | 46,069 | 47,950 | ||
| 3 | Reserve Bank of New Zealand (RBNZ) securities | 8,238 | 8,098 | ||
| Cash Outflows | |||||
| 4 | Retail deposits and deposits from small business customers, of which: | 252,779 | 22,866 | 250,147 | 22,638 |
| 5 | Stable deposits | 121,722 | 6,086 | 121,356 | 6,068 |
| 6 | Less stable deposits | 131,057 | 16,780 | 128,791 | 16,570 |
| 7 | Unsecured wholesale funding, of which: | 133,858 | 65,160 | 131,192 | 65,100 |
| 8 | Operational deposits (all counterparties) and deposits in networks for cooperative banks | 53,192 | 13,224 | 50,784 | 12,624 |
| 9 | Non-operational deposits (all counterparties) | 68,623 | 39,893 | 68,156 | 40,224 |
| 10 | Unsecured debt | 12,043 | 12,043 | 12,252 | 12,252 |
| 11 | Secured wholesale funding | - | 1 | ||
| 12 | Additional requirements, of which: | 193,136 | 28,113 | 188,922 | 25,166 |
| 13 | Outflows related to derivatives exposures and other collateral requirements | 12,582 | 12,582 | 10,856 | 10,856 |
| 14 | Outflows related to loss of funding on debt products | 1,269 | 1,269 | 183 | 183 |
| 15 | Credit and liquidity facilities | 179,285 | 14,262 | 177,883 | 14,127 |
| 16 | Other contractual funding obligations | 526 | 526 | 1,256 | 1,256 |
| 17 | Other contingent funding obligations | 42,212 | 3,642 | 42,224 | 3,630 |
| 18 | Total cash outflows | 120,307 | 117,791 | ||
| Cash inflows | |||||
| 19 | Secured lending (e.g. reverse repos) | 6,381 | - | 7,730 | - |
| 20 | Inflows from fully performing exposures | 11,675 | 7,057 | 11,734 | 6,910 |
| 21 | Other cash inflows | 4,282 | 4,282 | 2,642 | 2,642 |
| 22 | Total cash inflows | 22,338 | 11,339 | 22,106 | 9,552 |
| 23 | Total liquid assets | 152,918 | 143,168 | ||
| 24 | Total net cash outflows | 108,968 | 108,239 | ||
| 25 | Liquidity Coverage Ratio (%) | 140% | 132% | ||
| Number of data points used | 64 | 65 | |||
1Calculated as total liquid assets divided by total net cash outflows.
2 Calculated as a simple average of the daily observations over the quarter.
 | Westpac Group March 2020 Pillar 3 report |83 |
Pillar 3 report Net stable funding ratio |
Net Stable Funding Ratio (NSFR) disclosure
The NSFR is a structural measure which requires that a bank has sufficient Available Stable Funding (ASF) to cover its Required Stable Funding (RSF) over a one year horizon. Westpac’s NSFR as at 31 March 2020 was 117%1(31 December 2019 112%). Westpac maintains a buffer over the regulatory minimum of 100%.
| Unweighted value by residual maturity | Weighted value | |||||
| 31 March 2020 $m | No maturity | < 6 months | 6 months to < 1yr | > 1 year | ||
| Available Stable Funding (ASF) Item | ||||||
| 1 | Capital | 89,641 | - | - | - | 89,641 |
| 2 | Regulatory capital | 89,641 | - | - | - | 89,641 |
| 3 | Other capital instruments | - | - | - | - | - |
| 4 | Retail deposits and deposits from small business customers | 237,278 | 93,615 | 370 | 231 | 305,607 |
| 5 | Stable deposits | 118,128 | 26,632 | 12 | 18 | 137,551 |
| 6 | Less stable deposits | 119,150 | 66,983 | 359 | 214 | 168,056 |
| 7 | Wholesale funding | 129,391 | 150,245 | 48,178 | 129,360 | 231,654 |
| 8 | Operational deposits | 61,812 | - | - | - | 30,906 |
| 9 | Other wholesale funding | 67,579 | 150,245 | 48,178 | 129,360 | 200,748 |
| 10 | Liabilities with matching interdependent assets | - | - | - | - | - |
| 11 | Other liabilities | - | 34,706 | 700 | 424 | 774 |
| 12 | NSFR derivative liabilities | 10,394 | ||||
| 13 | All other liabilities and equity not included in the above categories | 24,312 | 700 | 424 | 774 | |
| 14 | Total ASF | �� | 627,676 | |||
| Required Stable Funding (RSF) Item | ||||||
| 15a) | Total NSFR (High quality liquid assets - HQLA) | 3,928 | ||||
| 15b) | Alternate Liquid Assets (ALA) | 6,990 | ||||
| 15c) | Reserve Bank of New Zealand (RBNZ) securities | 343 | ||||
| 16 | Deposits held at other financial institutions for operational purposes | - | - | - | - | - |
| 17 | Performing loans and securities | 1,278 | 53,570 | 38,547 | 577,995 | 477,334 |
| 18 | Performing loans to financial institutions secured by Level 1 HQLA | 1,193 | 3,889 | - | - | 1,582 |
| 19 | Performing loans to financial institutions secured by non-Level 1 HQLA and unsecured performing loans to financial institutions | 85 | 4,558 | 2,435 | 15,663 | 17,649 |
| 20 | Performing loans to nonfinancial corporate clients, loans to retail and small business customers, and loans to sovereigns, central banks and public sector entities (PSEs), of which: | - | 37,074 | 27,475 | 138,612 | 149,827 |
| 21 | With a risk weight of less than or equal to 35% under APS 112 | - | 206 | 29 | 1,339 | 988 |
| 22 | Performing residential mortgages, of which: | - | 7,519 | 7,932 | 418,324 | 303,175 |
| 23 | With a risk weight equal to 35% under APS 112 | - | 6,913 | 7,291 | 370,129 | 260,724 |
| 24 | Securities that are not in default and do not qualify as HQLA, including exchange-traded equities | - | 529 | 706 | 5,396 | 5,101 |
| 25 | Assets with matching interdependent liabilities | - | - | - | - | - |
| 26 | Other assets: | 11,569 | 30,448 | 474 | 19,105 | 36,803 |
| 27 | Physical traded commodities, including gold | - | - | |||
| 28 | Assets posted as initial margin for derivative contracts and contributions to default funds of central counterparties (CCPs) | 2,070 | 1,760 | |||
| 29 | NSFR derivative assets | 10,437 | 43 | |||
| 30 | NSFR derivative liabilities before deduction of variation margin posted | 15,031 | 3,006 | |||
| 31 | All other assets not included in the above categories | 11,569 | 2,910 | 474 | 19,105 | 31,994 |
| 32 | Off-balance sheet items | 184,477 | 11,203 | |||
| 33 | Total RSF | 536,601 | ||||
| 34 | Net Stable Funding Ratio (%) | 117.0% | ||||
1Calculated as total available stable funding divided by total required stable funding as at end of the quarter.
| | Westpac Group March 2020 Pillar 3 report |84 |
Pillar 3 report Net stable funding ratio
|
| Unweighted value by residual maturity | Weighted value | |||||
| 31 December 2019 $m | No maturity | < 6 months | 6 months to < 1yr | > 1 year | ||
| Available Stable Funding (ASF) Item | ||||||
| 1 | Capital | 86,507 | - | - | - | 86,507 |
| 2 | Regulatory capital | 86,507 | - | - | - | 86,507 |
| 3 | Other capital instruments | - | - | - | - | - |
| 4 | Retail deposits and deposits from small business customers | 232,189 | 96,366 | 417 | 224 | 303,582 |
| 5 | Stable deposits | 116,788 | 28,869 | 16 | 19 | 138,408 |
| 6 | Less stable deposits | 115,401 | 67,497 | 401 | 205 | 165,174 |
| 7 | Wholesale funding | 92,469 | 168,048 | 46,304 | 121,907 | 213,878 |
| 8 | Operational deposits | 52,716 | - | - | - | 26,358 |
| 9 | Other wholesale funding | 39,753 | 168,048 | 46,304 | 121,907 | 187,520 |
| 10 | Liabilities with matching interdependent assets | - | - | - | - | - |
| 11 | Other liabilities | - | 22,067 | - | 489 | 489 |
| 12 | NSFR derivative liabilities | 5,111 | ||||
| 13 | All other liabilities and equity not included in the above categories | 16,956 | - | 489 | 489 | |
| 14 | Total ASF | 604,456 | ||||
| Required Stable Funding (RSF) Item | ||||||
| 15a) | Total NSFR (High quality liquid assets - HQLA) | 3,333 | ||||
| 15b) | Alternate Liquid Assets (ALA) | 5,400 | ||||
| 15c) | Reserve Bank of New Zealand (RBNZ) securities | 348 | ||||
| 16 | Deposits held at other financial institutions for operational purposes | - | - | - | - | - |
| 17 | Performing loans and securities | 607 | 59,447 | 40,144 | 581,768 | 481,301 |
| 18 | Performing loans to financial institutions secured by Level 1 HQLA | 484 | 3,727 | - | - | 857 |
| 19 | Performing loans to financial institutions secured by non-Level 1 HQLA and unsecured performing loans to financial institutions | 123 | 6,761 | 2,810 | 11,705 | 14,248 |
| 20 | Performing loans to nonfinancial corporate clients, loans to retail and small business customers, and loans to sovereigns, central banks and public sector entities (PSEs), of which: | - | 41,585 | 29,215 | 127,912 | 143,865 |
| 21 | With a risk weight of less than or equal to 35% under APS 112 | - | 39 | 180 | 1,298 | 954 |
| 22 | Performing residential mortgages, of which: | - | 6,987 | 7,402 | 437,066 | 317,489 |
| 23 | With a risk weight equal to 35% under APS 112 | - | 6,404 | 6,799 | 387,196 | 271,645 |
| 24 | Securities that are not in default and do not qualify as HQLA, including exchange-traded equities | - | 388 | 718 | 5,084 | 4,842 |
| 25 | Assets with matching interdependent liabilities | - | - | - | - | - |
| 26 | Other assets: | 11,660 | 21,992 | 417 | 20,422 | 38,191 |
| 27 | Physical traded commodities, including gold | - | - | |||
| 28 | Assets posted as initial margin for derivative contracts and contributions to default funds of central counterparties (CCPs) | 1,626 | 1,382 | |||
| 29 | NSFR derivative assets | 6,075 | 963 | |||
| 30 | NSFR derivative liabilities before deduction of variation margin posted | 13,332 | 2,666 | |||
| 31 | All other assets not included in the above categories | 11,660 | 960 | 417 | 20,422 | 33,180 |
| 32 | Off-balance sheet items | 187,064 | 11,352 | |||
| 33 | Total RSF | 539,925 | ||||
| 34 | Net Stable Funding Ratio (%) | 112.0% | ||||
| | Westpac Group March 2020 Pillar 3 report |85 |
Pillar 3 report Appendix I | Regulatory capital reconciliation |
|
Balance Sheet Reconciliation
| 31 March 2020 $m | Group Balance Sheet | Adjustment | Level 2 Regulatory Balance Sheet | Reconciliation Table Capital Disclosure Template |
| Assets | ||||
| Cash and balances with central banks | 45,815 | (126) | 45,689 | |
| Collateral paid | 5,339 | - | 5,339 | |
| Due from subsidiaries | - | 225 | 225 | |
| Trading securities and financial assets measured at fair value through income statement (FVIS) | 26,280 | (375) | 25,905 | |
| Derivative financial instruments | 56,661 | - | 56,661 | |
| Available-for-sale securities | - | - | - | |
| Investment securities | 85,789 | (76) | 85,713 | |
| Loans | 719,678 | - | 719,678 | |
| Other financial assets | 5,849 | (646) | 5,203 | |
| Current tax assets | - | - | - | |
| Life insurance assets | 2,574 | (2,574) | - | |
| Investments in associates | 101 | - | 101 | |
| Property and equipment | 4,170 | (4) | 4,166 | |
| Deferred tax assets | 2,623 | (13) | 2,610 | Table a |
| Intangible assets | 11,943 | (306) | 11,637 | Table b |
| Investments in life & general insurance, funds management & securitisation entities | - | 1,633 | 1,633 | Table c |
| Other assets | 840 | (386) | 454 | |
| Total assets | 967,662 | (2,648) | 965,014 | |
| Liabilities | ||||
| Collateral received | 12,728 | - | 12,728 | |
| Due to subsidiaries | - | 518 | 518 | |
| Deposits and other borrowings | 582,920 | - | 582,920 | |
| Other financial liabilities | 33,996 | (148) | 33,848 | |
| Derivative financial instruments | 48,089 | - | 48,089 | |
| Debt issues | 185,835 | - | 185,835 | |
| Current tax liabilities | 31 | (31) | - | |
| Life insurance liabilities | 604 | (604) | - | |
| Provisions | 4,669 | (27) | 4,642 | |
| Deferred tax liabilities | 45 | (31) | 14 | |
| Loan capital | 25,807 | - | 25,807 | Table d and e |
| Other liabilities | 5,292 | (952) | 4,340 | |
| Total liabilities | 900,016 | (1,275) | 898,741 | |
| Equity |
| Ordinary share capital | 40,503 | - | 40,503 | Row 1 |
| Treasury shares and RSP treasury shares | (586) | - | (586) | Table f |
| Reserves | 1,688 | (54) | 1,634 | Table g |
| Retained Profits | 25,985 | (1,325) | 24,660 | Row 2 |
| Non-controlling interests | 56 | 6 | 62 | |
| Total equity | 67,646 | (1,373) | 66,273 |
| 86| Westpac Group March 2020 Pillar 3 report | |
Pillar 3 report Appendix I | Regulatory capital reconciliation |
|
| $m | 31 March 2020 | Capital Disclosure Template Reference |
| Table a | ||
| Deferred Tax Assets | ||
| Total Deferred Tax Assets per level 2 Regulatory Balance Sheet | 2,610 | |
| Deferred tax asset adjustment before applying prescribed thresholds | 2,610 | Row 26e |
| Less: Amounts below prescribed threshold - risk weighted | (2,610) | Row 75 |
| Total per Capital Disclosure Template - Deferred Tax Asset | - | Row 21 / 25 |
| $m | 31 March 2020 | Capital Disclosure Template Reference |
| Table b | ||
| Goodwill and other intangible assets | ||
| Total Goodwill and Intangibles Assets per level 2 Regulatory Balance Sheet | 11,637 | |
| Less: Capitalised Software Disclosed Under Intangibles | (2,029) | Row 9 |
| Total per Capital Disclosure Template - Goodwill | 9,608 | Row 8 |
| $m | 31 March 2020 | Capital Disclosure Template Reference |
| Table c | ||
| Equity Investments | ||
| Significant Investment in financial entities | 204 | |
| Equity Investments in non-consolidated subsidiaries | 1,633 | |
| Total Significant Investment in financial entities | 1,837 | Row 73 |
| Non-significant Investment in financial entities | 55 | Row 72 |
| Total Investments in financial institutions | 1,892 | Row 26d |
| Investment in commercial entities | 68 | Row 26g |
| Total Equity Investments before applying prescribed threshold | 1,960 | |
| Less: Amounts below prescribed threshold | (1,960) | |
| Total per Capital Disclosure Template - Equity Investments | - | Row 18/ 19/ 23 |
| $m | 31 March 2020 | Capital Disclosure Template Reference |
| Table d | ||
| Additional Tier 1 Capital | ||
| Total Loan Capital per Level 2 Regulatory Balance Sheet | 25,807 | |
| Less: Tier 2 Capital Instruments Reported Below | (16,161) | |
| Add: Capitalised Issue Costs for Additional Tier 1 Capital Instruments1 | 52 | |
| Less: Fair Value Adjustment2 | (225) | |
| Total per Capital Disclosure Template - Tier 1 Capital | 9,473 | Row 36 |
| Additional Tier 1 Capital included in Regulatory Capital | ||
| Westpac Capital Notes 2 | 1,311 | |
| Westpac Capital Notes 3 | 1,324 | |
| Westpac Capital Notes 4 | 1,702 | |
| Westpac Capital Notes 5 | 1,690 | |
| Westpac Capital Notes 6 | 1,423 | |
| SEC Registered Capital Securities | 2,023 | |
| Total Basel III complying instruments | 9,473 | Row 30 |
| Total Basel III non complying instruments | - | Row 33 |
| Total per Capital Disclosure Template - Additional Tier 1 Capital Instruments | 9,473 | Row 36 |
1Unamortised issue costs relating to capital instruments are netted off against each instrument in the Balance Sheet. For regulatory capital purposes, these capital instruments are shown gross of unamortised issue costs. The unamortised issue costs are deducted from CET1 as part of capitalised expenses in Row 26f in the capital disclosure template.
2 For regulatory capital purposes, APRA requires these instruments to be included as if they were unhedged.
| | Westpac Group March 2020 Pillar 3 report |87 |
Pillar 3 report Appendix I | Regulatory capital reconciliation |
|
| $m | 31 March 2020 | Capital Disclosure Template Reference |
| Table e | ||
| Tier 2 Capital | ||
| Total Tier 2 Capital per Level 2 Regulatory Balance Sheet | 16,161 | |
| Add: Capitalised Issue Costs for Tier 2 Capital Instruments1 | - | |
| Less: Fair Value Adjustment2 | (1,139) | |
| Less: Cumulative amortisation of Tier 2 Capital Instruments | - | |
| Less: Basel III transitional adjustment | - | Row 56c |
| Provisions | 79 | Row 50 / 76 |
| Total per Capital Disclosure Template - Tier 2 | 15,101 | Row 51 |
| Tier 2 Capital included in Regulatory Capital | ||
| AUD350 million Westpac Subordinated Notes | 350 | |
| SGD325 million Westpac Subordinated Notes | 369 | |
| USD100 million Westpac Subordinated Notes | 162 | |
| AUD700 million Westpac Subordinated Notes | 700 | |
| JPY20,000 million Westpac Subordinated Notes | 298 | |
| JPY10,200 million Westpac Subordinated Notes | 152 |
| JPY10,000 million Westpac Subordinated Notes | 149 | |
| AUD175 million Westpac Subordinated Notes | 175 | |
| NZD400 million Westpac Subordinated Notes | 390 | |
| USD1,500 million Westpac Subordinated Notes | 2,422 | |
| JPY8,000 million Westpac Subordinated Notes | 119 | |
| JPY13,500 million Westpac Subordinated Notes | 201 | |
| JPY12,000 million Westpac Subordinated Notes | 179 | |
| HKD 600 million Westpac Subordinated Notes | 125 | |
| AUD350 million Westpac Subordinated Notes | 350 | |
| AUD185 million Westpac Subordinated Notes | 185 | |
| AUD250 million Westpac Subordinated Notes | 250 | |
| AUD130 million Westpac Subordinated Notes | 130 | |
| AUD725 million Westpac Subordinated Notes II | 725 | |
| USD1,000 million Westpac Subordinated Notes | 1,599 | |
| USD1,250 million Westpac Subordinated Notes | 2,003 | |
| AUD1,000 million Westpac Subordinated Notes | 1,000 | |
| USD1,500 million Westpac Subordinated Notes | 2,422 | |
| Total Basel III complying instruments | 14,455 | Row 46 |
| USD352 million Perpetual Floating Rate Notes | 567 | |
| Total Basel III non complying instruments | 567 | |
| Less: Basel III transitional adjustment | - | Row 85 |
| Total Basel III non complying instruments after transitional adjustment | 567 | Row 47 |
| Provisions | 79 | Row 50 / 76 |
| Total per Capital Disclosure Template - Tier 2 Capital Instruments | 15,101 | Row 51 |
| $m | 31 March 2020 | Capital Disclosure Template Reference |
| Table f | ||
| Treasury Shares and RSP Treasury Shares | ||
| Total treasury shares per Level 2 Regulatory Balance Sheet | (586) | |
| Less: Treasury Shares not included for Level 2 Regulatory Capital | (33) | |
| Total per Capital Disclosure Template - Treasury Shares | (619) | Row 26a |
| $m | 31 March 2020 | Capital Disclosure Template Reference |
| Table g | ||
| Accumulated Other Comprehensive Income | ||
| Total reserves per Level 2 Regulatory Balance Sheet | 1,634 | |
| Less: Share Based Payment Reserve not included within capital | (56) | |
| Total per Capital Disclosure Template - Accumulated Other Comprehensive Income | 1,578 | Row 3 |
| 1 | For regulatory capital purposes, APRA requires these instruments to be included as if they were unhedged. |
| 88| Westpac Group March 2020 Pillar 3 report | |
Pillar 3 report Appendix I | Regulatory capital reconciliation |
|
The capital disclosure template below represents the post 1 January 2018 Basel III template.
| $m | 31 March 2020 | Table Reference | |
| Common Equity Tier 1 capital: instruments and reserves | |||
| 1 | Directly issued qualifying ordinary shares (and equivalent for mutually-owned entities) capital | 40,503 | |
| 2 | Retained earnings | 24,659 | |
| 3 | Accumulated other comprehensive income (and other reserves) | 1,578 | Table g |
| 4 | Directly issued capital subject to phase out from CET1 (only applicable to mutually-owned companies) | - | |
| 5 | Ordinary share capital issued by subsidiaries and held by third parties (amount allowed in group CET1) | 61 | |
| 6 | Common Equity Tier 1 capital before regulatory adjustments | 66,801 | |
| Common Equity Tier 1 capital : regulatory adjustments | |||
| 7 | Prudential valuation adjustments | - | |
| 8 | Goodwill (net of related tax liability) | (9,608) | Table b |
| 9 | Other intangibles other than mortgage servicing rights (net of related tax liability) | (2,029) | Table b |
| 10 | Deferred tax assets that rely on future profitability excluding those arising from temporary differences (net of related tax liability) | - | |
| 11 | Cash-flow hedge reserve | (64) | |
| 12 | Shortfall of provisions to expected losses | - | |
| 13 | Securitisation gain on sale (as set out in paragraph 562 of Basel II framework) | - | |
| 14 | Gains and losses due to changes in own credit risk on fair valued liabilities | (407) | |
| 15 | Defined benefit superannuation fund net assets | (80) | |
| 16 | Investments in own shares (if not already netted off paid-in capital on reported balance sheet) | - | |
| 17 | Reciprocal cross-holdings in common equity | - | |
| 18 | Investments in the capital of banking, financial and insurance entities that are outside the scope of regulatory consolidation, net of eligible short positions, where the ADI does not own more than 10% of the issued share capital (amount above 10% threshold) | - | Table c |
| 19 | Significant investments in the ordinary shares of banking, financial and insurance entities that are outside the scope of regulatory consolidation, net of eligible short positions (amount above 10% threshold) | - | Table c |
| 20 | Mortgage service rights (amount above 10% threshold) | - | |
| 21 | Deferred tax assets arising from temporary differences (amount above 10% threshold, net of related tax liability) | - | Table a |
| 22 | Amount exceeding the 15% threshold | - | |
| 23 | of which: significant investments in the ordinary shares of financial entities | - | Table c |
| 24 | of which: mortgage servicing rights | - | |
| 25 | of which: deferred tax assets arising from temporary differences | - | Table a |
| 26 | National specific regulatory adjustments (sum of rows 26a, 26b, 26c, 26d, 26e, 26f, 26g, 26h, 26i and 26j) | (6,631) | |
| 26a | of which: treasury shares | (619) | Table f |
| 26b | of which: offset to dividends declared under a dividend reinvestment plan (DRP), to the extent that the dividends are used to purchase new ordinary shares issued by the ADI | - | |
| 26c | of which: deferred fee income | 229 | |
| 26d | of which: equity investments in financial institutions not reported in rows 18, 19 and 23 | (1,892) | Table c |
| 26e | of which: deferred tax assets not reported in rows 10, 21 and 25 | (2,610) | Table a |
| 26f | of which: capitalised expenses | (1,656) | |
| 26g | of which: investments in commercial (non-financial) entities that are deducted under APRA prudential requirements | (68) | Table c |
| 26h | of which: covered bonds in excess of asset cover in pools | - |
| 26i | of which: undercapitalisation of a non-consolidated subsidiary | - | |
| 26j | of which: other national specific regulatory adjustments not reported in rows 26a to 26i | (15) | |
| 27 | Regulatory adjustments applied to Common Equity Tier 1 due to insufficient Additional Tier 1 and Tier 2 to cover deductions | - | |
| 28 | Total regulatory adjustments to Common Equity Tier 1 | (18,819) | |
| 29 | Common Equity Tier 1 Capital (CET1) | 47,982 |
| | Westpac Group March 2020 Pillar 3 report |89 |
Pillar 3 report Appendix I | Regulatory capital reconciliation |
|
| $m | 31 March 2020 | Table Reference | |
| Additional Tier 1 Capital: instruments | |||
| 30 | Directly issued qualifying Additional Tier 1 instruments | 9,473 | Table d |
| 31 | of which: classified as equity under applicable accounting standards | - | |
| 32 | of which: classified as liabilities under applicable accounting standards | 9,473 | Table d |
| 33 | Directly issued capital instruments subject to phase out from Additional Tier 1 | - | Table d |
| 34 | Additional Tier 1 instruments (and CET1 instruments not included in row 5) issued by subsidiaries and held by third parties (amount allowed in group AT1) | - | |
| 35 | of which: instruments issued by subsidiaries subject to phase out | - | |
| 36 | Additional Tier 1 Capital before regulatory adjustments | 9,473 | Table d |
| Additional Tier 1 Capital: regulatory adjustments | |||
| 37 | Investments in own Additional Tier 1 instruments | - | |
| 38 | Reciprocal cross-holdings in Additional Tier 1 instruments | - | |
| 39 | Investments in the capital of banking, financial and insurance entities that are outside the scope of regulatory consolidation, net of eligible short positions, where the ADI does not own more than 10% of the issued share capital (amount above 10% threshold) | - | |
| 40 | Significant investments in the capital of banking, financial and insurance entities that are outside the scope of regulatory consolidation (net of eligible short positions) | - | |
| 41 | National specific regulatory adjustments (sum of rows 41a, 41b and 41c) | - | |
| 41a | of which: holdings of capital instruments in group members by other group members on behalf of third parties | - | |
| 41b | of which: investments in the capital of financial institutions that are outside the scope of regulatory consolidations not reported in rows 39 and 40 | - | |
| 41c | of which: other national specific regulatory adjustments not reported in rows 41a and 41b | - | |
| 42 | Regulatory adjustments applied to Additional Tier 1 due to insufficient Tier 2 to cover deductions | - | |
| 43 | Total regulatory adjustments to Additional Tier 1 capital | - | |
| 44 | Additional Tier 1 capital (AT1) | 9,473 | Table d |
| 45 | Tier 1 Capital (T1=CET1+AT1) | 57,455 | |
| Tier 2 Capital: instruments and provisions | |||
| 46 | Directly issued qualifying Tier 2 instruments | 14,455 | Table e |
| 47 | Directly issued capital instruments subject to phase out from Tier 2 | 567 | Table e |
| 48 | Tier 2 instruments (and CET1 and AT1 instruments not included in rows 5 or 34) issued by subsidiaries and held by third parties (amount allowed in group T2) | - | |
| 49 | of which: instruments issued by subsidiaries subject to phase out | - | |
| 50 | Provisions | 79 | Table e |
| 51 | Tier 2 Capital before regulatory adjustments | 15,101 | Table e |
| Tier 2 Capital: regulatory adjustments | |||
| 52 | Investments in own Tier 2 instruments | (50) | |
| 53 | Reciprocal cross-holdings in Tier 2 instruments | - |
| 54 | Investments in the Tier 2 capital of banking, financial and insurance entities that are outside the scope of regulatory consolidation, net of eligible short positions, where the ADI does not own more than 10% of the issued share capital (amount above 10% threshold) | - | |
| 55 | Significant investments in the Tier 2 capital of banking, financial and insurance entities that are outside the scope of regulatory consolidation, net of eligible short positions | (140) | |
| 56 | National specific regulatory adjustments (sum of rows 56a, 56b and 56c) | (52) | |
| 56a | of which: holdings of capital instruments in group members by other group members on behalf of third parties | - | |
| 56b | of which: investments in the capital of financial institutions that are outside the scope of regulatory consolidation not reported in rows 54 and 55 | (52) | |
| 56c | of which: other national specific regulatory adjustments not reported in rows 56a and 56b | - | |
| 57 | Total regulatory adjustments to Tier 2 capital | (242) | |
| 58 | Tier 2 capital (T2) | 14,859 | |
| 59 | Total capital (TC=T1+T2) | 72,314 | |
| 60 | Total risk-weighted assets based on APRA standards | 443,905 |
| 90 |Westpac Group March 2020 Pillar 3 report |  |
Pillar 3 report Appendix I | Regulatory capital reconciliation |
|
| $m | 31 March 2020 | Table Reference | |
| Capital ratios and buffers | |||
| 61 | Common Equity Tier 1 (as a percentage of risk-weighted assets) | 10.8% | |
| 62 | Tier 1 (as a percentage of risk-weighted assets) | 12.9% | |
| 63 | Total capital (as a percentage of risk-weighted assets) | 16.3% | |
| 64 | Buffer requirement (minimum CET1 requirement of 4.5% plus capital conservation buffer of 2.5% plus any countercyclical buffer requirements expressed as a percentage of risk-weighted assets)1 | 8.0% | |
| 65 | of which: capital conservation buffer requirement1 | 3.5% | |
| 66 | of which: ADI-specific countercyclical buffer requirements | 0.0% | |
| 67 | of which: G-SIB buffer requirement (not applicable) | NA | |
| 68 | Common Equity Tier 1 available to meet buffers (as a percentage of risk-weighted assets) | 10.8% | |
| National minima (if different from Basel III) | |||
| 69 | National Common Equity Tier 1 minimum ratio (if different from Basel III minimum) | 4.5% | |
| 70 | National Tier 1 minimum ratio (if different from Basel III minimum) | 6.0% | |
| 71 | National total capital minimum ratio (if different from Basel III minimum) | 8.0% | |
| Amount below thresholds for deductions (not risk-weighted) | |||
| 72 | Non-significant investments in the capital of other financial entities | 55 | Table c |
| 73 | Significant investments in the ordinary shares of financial entities | 1,837 | Table c |
| 74 | Mortgage servicing rights (net of related tax liability) | - | |
| 75 | Deferred tax assets arising from temporary differences (net of related tax liability) | 2,610 | Table a |
| Applicable caps on the inclusion of provisions in Tier 2 | |||
| 76 | Provisions eligible for inclusion in Tier 2 in respect of exposures subject to standardised approach (prior to application of cap) | 79 | Table e |
| 77 | Cap on inclusion of provisions in Tier 2 under standardised approach | 260 | |
| 78 | Provisions eligible for inclusion in Tier 2 in respect of exposures subject to internal ratings-based approach (prior to application of cap) | - | |
| 79 | Cap for inclusion of provisions in Tier 2 under internal ratings-based approach | 2,054 | |
| Capital instruments subject to phase-out arrangements (only applicable between 1 Jan 2018 and 1 Jan 2022) | |||
| 80 | Current cap on CET1 instruments subject to phase out arrangements | NA | |
| 81 | Amount excluded from CET1 due to cap (excess over cap after redemptions and maturities | NA | |
| 82 | Current cap on AT1 instruments subject to phase out arrangements | 1,115 | |
| 83 | Amount excluded from AT1 instruments due to cap (excess over cap after redemptions and maturities) | - | |
| 84 | Current cap on T2 instruments subject to phase out arrangements | 1,137 | |
| 85 | Amount excluded from T2 due to cap (excess over cap after redemptions and maturities) | - | Table e |
Countercyclical buffer
The table below details Westpac’s countercyclical buffer requirement.
| Exposure at default | Risk Weighted Assets2 | Jurisdictional buffer | ADI-specific buffer | |
| France | - | 7 | 0.250% | 0.00000% |
| Hong Kong | 3,402 | 2,308 | 1.000% | 0.00617% |
| Luxembourg | - | 129 | 0.250% | 0.00009% |
| Norway | 4 | 9 | 1.000% | 0.00003% |
| Other | 1,085,698 | 371,501 | 0.000% | 0.00000% |
| Total | 1,089,104 | 373,954 | 0.00629% | |
| Total Risk Weighted Assets | 443,905 | |||
| Countercyclical capital buffer | 28 |
| 1 | Includes 1% Domestic Systemically Important Bank (D-SIB) requirement. |
| 2 | Represents total private sector (excludes Banks and Sovereigns) credit and specific market risk weighted assets. |
| | Westpac Group March 2020 Pillar 3 report |91 |
Pillar 3 report Appendix II | Entities included in regulatory consolidation |
|
This appendix lists all subsidiaries controlled by Westpac according to their level of regulatory consolidation.
Level 1 Entities
The following controlled entities have been approved by APRA for inclusion in the Westpac ADI’s ‘Extended Licensed Entity’ (ELE) for the purposes of measuring capital adequacy at Level 1:
| Westpac Banking Corporation | Westpac Capital-NZ-Limited |
| 1925 (Commercial) Pty Limited | Westpac Debt Securities Pty Limited |
| 1925 (Industrial) Pty Limited | Westpac Direct Equity Investments Pty Limited |
| Belliston Pty Limited | Westpac Equity Investments NZ Limited |
| Bill Acceptance Corporation Pty Limited | Westpac Finance (HK) Limited |
| Capital Finance Australia Limited | Westpac Financial Holdings Pty Limited |
| CBA Limited | Westpac Group Investment-NZ-Limited |
| Challenge Limited | Westpac Holdings-NZ-Limited |
| Mortgage Management Pty Limited | Westpac Investment Capital Corporation |
| Partnership Pacific Pty Limited | Westpac Investment Vehicle No.2 Pty Limited |
| Partnership Pacific Securities Pty Limited | Westpac Investment Vehicle Pty Limited |
| Pashley Investments Pty Limited | Westpac Leasing Nominees-Vic.-Pty Limited |
| Sallmoor Pty Limited | Westpac New Zealand Group Limited |
| Sixty Martin Place (Holdings) Pty Limited | Westpac Overseas Holdings No. 2 Pty Limited |
| St.George Business Finance Pty Limited | Westpac Overseas Holdings Pty Limited |
| St.George Equity Finance Limited | Westpac Properties Limited |
| St.George Finance Holdings Limited | Westpac Securitisation Holdings Pty Limited |
| St.George Security Holdings Pty Limited | Westpac Structured Products Limited |
| Value Nominees Pty Limited | Westpac TPS Trust |
| Westpac Administration 2 Pty Limited | Westpac Unit Trust |
| Westpac Administration Pty Limited | Westpac USA Inc. |
| Westpac Americas Inc. |
Level 2 Entities
The following controlled entities are included in the Level 2 consolidation (along with the ELE entities) for the purposes of measuring capital adequacy:
| 1925 Advances Pty Limited | Capital Finance New Zealand Limited |
| Altitude Administration Pty Limited | Capital Fleetlease Limited |
| Altitude Rewards Pty Limited | Capital Motor Finance Limited |
| Aotearoa Financial Services Limited | Capital Rent Group Limited |
| BT (Queensland) Pty Limited | Crusade ABS Series 2016-1 Trust |
| BT Australia Pty Limited | Crusade ABS Series 2017-1 Trust |
| BT Financial Group (NZ) Limited | Crusade ABS Series 2017-1P Trust |
| BT Financial Group Pty Limited | Crusade ABS Series 2018-1P Trust |
| BT Securities Limited | Crusade Trust No.2P of 2008 |
| Capital Corporate Finance Limited | Danaby Pty Limited |
| Capital Finance (NZ) Limited | General Credits Pty Limited |
92 | Westpac Group March 2020 Pillar 3 report | |
Pillar 3 report Appendix II | Entities included in regulatory consolidation |
|
Level 2 Entities (Continued)
| Hastings Management Pty Limited | Westpac Altitude Rewards Trust |
| Net Nominees Limited | Westpac Asian Lending Pty Limited |
| Number 120 Limited | Westpac Bank-PNG-Limited |
| Oniston Pty Limited | Westpac Capital Markets Holding Corp. |
| Qvalent Pty Limited | Westpac Capital Markets LLC |
| RAMS Financial Group Pty Limited | Westpac Cash PIE Fund |
| RMS Warehouse Trust 2007-1 | Westpac Covered Bond Trust |
| Series 2008-1M WST Trust | Westpac Equity Holdings Pty Limited |
| Series 2011-2 WST Trust | Westpac Europe Limited |
| Series 2011-3 WST Trust | Westpac Financial Consultants Limited |
| Series 2012-1 WST Trust | Westpac Financial Services Group Limited |
| Series 2013-1 WST Trust | Westpac Financial Services Group-NZ-Limited |
| Series 2013-2 WST Trust | Westpac Global Capital Markets Pty Limited |
| Series 2014-1 WST Trust | Westpac Investment Vehicle No.3 Pty Limited |
| Series 2014-2 WST Trust | Westpac New Zealand Limited |
| Series 2015-1 WST Trust | Westpac Notice Saver PIE Fund |
| Series 2019-1 WST Trust | Westpac NZ Covered Bond Holdings Limited |
| Series 2020-1 WST Trust | Westpac NZ Covered Bond Limited |
| SIE-LEASE (Australia) Limited | Westpac NZ Operations Limited |
| SIE-LEASE (New Zealand) Pty Limited | Westpac NZ Securitisation Holdings Limited |
| St.George Commercial Credit Corporation Limited | Westpac NZ Securitisation Limited |
| St.George Finance Limited | Westpac NZ Securitisation No.2 Limited |
| St.George Motor Finance Limited | Westpac Securities Limited |
| The Home Mortgage Company Limited | Westpac Securities NZ Limited |
| W2 Investments Pty Limited | Westpac Securitisation Management Pty Limited |
| Westpac (NZ) Investments Limited | Westpac Singapore Limited |
| Westpac Administration 3 Pty Limited | Westpac Syndications Management Pty Limited |
| Westpac Administration 4 Pty Limited | Westpac Term PIE Fund |
| | Westpac Group March 2020 Pillar 3 report |93 |
Pillar 3 report Appendix II | Entities included in regulatory consolidation |
|
Level 3 Entities
The following controlled entities are excluded from the Level 2 consolidation but form part of the conglomerate group at Level 3:
| Advance Asset Management Limited | St.George Life Pty Limited |
| Asgard Capital Management Limited | Sydney Capital Corporation Inc. |
| Asgard Wealth Solutions Limited | Waratah Receivables Corporation Pty Limited |
| BT Funds Management (NZ) Limited | Waratah Securities Australia Limited |
| BT Funds Management Limited | Westpac Custodian Nominees Pty Limited |
| BT Funds Management No.2 Limited | Westpac Databank Pty Limited |
| BT Portfolio Services Limited | Westpac Digital Partnerships Pty Ltd |
| eQR Securities Pty. Limited | Westpac Financial Services Limited |
| GIS Private Nominees Pty Limited | Westpac General Insurance Limited |
| Hastings Funds Management Pty Limited | Westpac General Insurance Services Limited |
| Magnitude Group Pty Limited | Westpac Lenders Mortgage Insurance Limited |
| Pendal Long Term Income Fund | Westpac Life Insurance Services Limited |
| Pendal Short Term Income Fund | Westpac Life-NZ-Limited |
| Planwise AU Pty Ltd | Westpac New Zealand Staff Superannuation Scheme Trustee Limited |
| Reinventure Fund II I.L.P | Westpac Nominees-NZ-Limited |
| Reinventure Fund III I.L.P | Westpac RE Limited |
| Reinventure Fund, I.L.P. | Westpac Securities Administration Limited |
| Reinventure Special Purpose Investment Unit Trust | Westpac Superannuation Nominees-NZ-Limited |
| Securitor Financial Group Limited |
| 94| Westpac Group March 2020 Pillar 3 report | |
Pillar 3 report Appendix III | Level 3 entities’ assets and liabilities |
|
The following legal entities are excluded from the regulatory scope of consolidation.
The total assets and liabilities should not be aggregated because some of the entities are holding companies for other entities in the table shown below.
| 31 March 2020 | Liabilities | |||||||
| $m | Total Assets | (excluding equity) | ||||||
| a) Securitisation | ||||||||
| Sydney Capital Corporation Inc. | - | - | ||||||
| Waratah Receivables Corporation Pty Limited | 1 | 1 | ||||||
| Waratah Securities Australia Limited | - | - | ||||||
| b) Insurance, funds management and other | ||||||||
| Advance Asset Management Limited | 57 | 29 | ||||||
| Asgard Capital Management Limited | 36 | 7 | ||||||
| Asgard Wealth Solutions Limited | 22 | 4 | ||||||
| BT Funds Management (NZ) Limited | 70 | 22 | ||||||
| BT Funds Management Limited | 341 | 270 | ||||||
| BT Funds Management No.2 Limited | 10 | 1 | ||||||
| BT Portfolio Services Limited | 79 | 14 | ||||||
| eQR Securities Pty. Limited | - | - | ||||||
| GIS Private Nominees Pty Limited | 6 | 1 | ||||||
| Hastings Funds Management Pty Limited | - | - | ||||||
| Magnitude Group Pty Limited | 4 | - | ||||||
| Pendal Long Term Income Fund | 438 | 438 | ||||||
| Pendal Short Term Income Fund | 428 | 428 | ||||||
| Planwise AU Pty Ltd | 13 | 5 | ||||||
| Reinventure Fund II I.L.P | 30 | - | ||||||
| Reinventure Fund III I.L.P | 16 | - | ||||||
| Reinventure Fund, I.L.P. | 98 | 7 | ||||||
| Reinventure Special Purpose Investment Unit Trust | 18 | - | ||||||
| Securitor Financial Group Limited | 4 | - | ||||||
| St.George Life Pty Limited | - | - | ||||||
| Westpac Custodian Nominees Pty Limited | - | - | ||||||
| Westpac Databank Pty Limited | - | - | ||||||
| Westpac Digital Partnerships Pty Ltd | 42 | 17 | ||||||
| Westpac Financial Services Limited | 20 | 8 | ||||||
| Westpac General Insurance Limited | 880 | 739 | ||||||
| Westpac General Insurance Services Limited | 64 | 6 | ||||||
| Westpac Lenders Mortgage Insurance Limited | 1,007 | 727 | ||||||
| Westpac Life Insurance Services Limited | 3,945 | 2,278 | ||||||
| Westpac Life-NZ-Limited | 219 | (41 | ) | |||||
| Westpac New Zealand Staff Superannuation Scheme Trustee Limited | - | - | ||||||
| Westpac Nominees-NZ-Limited | 4 | - | ||||||
| Westpac RE Limited | 8 | 1 | ||||||
| Westpac Securities Administration Limited | 13 | 6 | ||||||
| Westpac Superannuation Nominees-NZ-Limited | - | - | ||||||
| | Westpac Group March 2020 Pillar 3 report |95 |
Pillar 3 report Appendix IV | Regulatory expected loss |
|
Capital deduction for regulatory expected loss
For capital adequacy purposes APRA requires the amount of regulatory expected credit losses in excess of eligible provisions to be deducted from capital. The following table shows how the deduction is calculated.
| 31 March | 30 September | 31 March | ||||||||||
| $m | 2020 | 2019 | 2019 | |||||||||
| Provisions associated with eligible portfolios | ||||||||||||
| Total provisions for impairment charges | 5,791 | 3,924 | 3,997 | |||||||||
| plus general reserve for credit losses adjustment | - | - | - | |||||||||
| plus provisions associated with partial write-offs | 41 | 41 | 94 | |||||||||
| less ineligible provisions1 | (129 | ) | (89 | ) | (79 | ) | ||||||
| Total eligible provisions | 5,703 | 3,876 | 4,012 | |||||||||
| Regulatory expected downturn loss | 5,540 | 4,982 | 5,160 | |||||||||
| (Excess)/shortfall in eligible provisions compared to regulatory expected downturn loss | 163 | (1,106 | ) | (1,148 | ) | |||||||
| Common equity Tier 1 capital deduction for regulatory expecteddownturn loss in excess of eligible provisions2 | - | (1,106 | ) | (1,148 | ) | |||||||
| 1 | Provisions associated with portfolios subject to the Basel standardised approach to credit risk are not eligible. |
| 2 | Regulatory expected loss is calculated for portfolios subject to the Basel advanced IRB approach to credit risk. The comparison between regulatory expected loss and eligible provisions is performed separately for defaulted and non-defaulted exposures. As at 31 March 2020, there was no excess of eligible provisions compared to regulatory expected loss for defaulted exposures (30 September 2019: nil). |
| 96| Westpac Group March 2020 Pillar 3 report | |
Pillar 3 report |
Appendix V | APS330 quantitative requirements |
The following table cross-references the quantitative disclosure requirements given by Attachments A, C, D and E of APS330 to the quantitative disclosures made in this report. The continuous reporting requirements for capital instruments under Attachment B are satisfied separately and can be found on the regulatory disclosures section on the Westpac website
In addition to this report, the regulatory disclosures section of the Westpac website1 contains the reporting requirements for:
| l | Capital instruments under Attachment B of APS330; and |
| l | The identification of potential Global-Systemically Important Banks (G-SIB) under Attachment H of APS330 (disclosed annually). |
| APS330 reference | Westpac disclosure | Page | |
| General Requirements | |||
| Paragraph 12 | (a) (c) to (d) | Balance Sheet Reconciliation | 86 |
| Paragraph 13 | Level 3 entities’ assets and liabilities | 96 | |
| Paragraph 49 | Summary leverage ratio | 21 | |
| Attachment A: | |||
| Table 1: Capital disclosure template | Capital disclosure template | 89 | |
| Attachment C: | |||
| Table 3: Capital adequacy | (a) to (e) | Capital requirements | 19 |
| (f) | Westpac’s capital adequacy ratios | 18 | |
| Capital adequacy ratios of major subsidiary banks | 18 | ||
| Table 4: Credit risk | (a) | Exposure at Default by major type | 33 |
| (b) | Impaired and past due loans by portfolio | 40 | |
| (c) | General reserve for credit losses | 30
| |
| Table 5: Securitisation exposures | (a) | Banking book summary of securitisation activity by asset type | 66 |
| (b) | Banking book summary of on and off-balance sheet securitisation by exposure type | 67 | |
| Trading book summary of on and off-balance sheet securitisation by exposure type | 70
| ||
| Attachment D: | |||
| Table 6: Capital adequacy | (b) to (f) | Capital requirements | 19 |
| (g) | Westpac’s capital adequacy ratios | 18 | |
| Capital adequacy ratios of major subsidiary banks | 18 | ||
| Table 7: Credit risk - general disclosures | (b) | Exposure at Default by major type | 33 |
| (c) | Exposure at Default by geography | 38 | |
| (d) | Exposure at Default by industry classification | 35 | |
| (e) | Exposure at Default by residual contractual maturity | 39 | |
| (f) | Impaired and past due loans by industry classification | 41 | |
| (g) | Impaired and past due loans by geography | 42 | |
| (h) | Movement in provisions for impairment charges | 31 | |
| (h) | Loan impairment provisions | 30 | |
| (i) | Exposure at Default by measurement method | 34 | |
| (j) | General reserve for credit losses | 30 | |
| Table 8: Credit risk - disclosures for portfolios subject to the standardised approach and supervisory risk-weights in the IRB approaches (formerly Table 5) | (b) | Portfolios subject to the standardised approach | 43 |
| Property finance | 44 | ||
Project finance
| 45 |
1 http://www.westpac.com.au/about-westpac/investor-centre/financial-information/regulatory-disclosures/
| | Westpac Group March 2020 Pillar 3 report |97 |
Pillar 3 report |
Appendix V | APS330 quantitative requirements |
| APS330 reference | Westpac disclosure | Page | |
| Table 9: Credit risk - disclosures for portfolios subject to IRB approaches | (d) | Corporate portfolio by external credit rating | 46 |
| Business lending portfolio by external credit rating | 47 | ||
| Sovereign portfolio by external credit rating | 48 | ||
| Bank portfolio by external credit rating | 49 | ||
| Residential mortgages portfolio by PD band | 50 | ||
| Australian credit cards portfolio by PD band | 51 | ||
| Other retail portfolio by PD band | 52 | ||
| Small business portfolio by PD band | 53 | ||
| (e) | Actual losses | 54 | |
| (f) | Comparison of regulatory expected and actual loss rates | 55 | |
| Table 10: Credit risk mitigation disclosures | (b) to (c) | Total exposure covered by collateral, credit derivatives and guarantees | 58 |
| Table 11: General disclosure for exposures related to counterparty credit risk | (b) | Counterparty credit risk summary | 60 |
| (c) | Credit derivative transactions that create exposures to counterparty credit risk | 60 | |
| Table 12: Securitisation exposures | Banking Book | ||
| (g) part i and (h) to (i) | Summary of assets securitised by Westpac | 65 | |
| (g) part ii | Summary of total Westpac sponsored third party assets securitised | 65 | |
| (j) | Summary of securitisation activity by asset type | 66 | |
| (k) | Summary of on and off-balance sheet securitisation by exposure type | 67 | |
| (l) part i | Securitisation exposure by risk weight band | 68 | |
| (l) part ii | Securitisation exposures deducted from capital | 68 | |
| (m) | Securitisation subject to early amortisation treatment | 69 | |
| (n) part i | Resecuritisation exposure subject to credit risk mitigation | 69 | |
| (n) part ii | Resecuritisation exposure to guarantors | 69 | |
| Trading Book | |||
| (o) part i and (p) | Summary of assets securitised by Westpac | 69 | |
| (o) part ii | Summary of total Westpac sponsored third party assets securitised | 69 | |
| (q) | Summary of securitisation activity by asset type | 69 | |
| (r) | Aggregate amount of exposures securitised by Westpac and subject to APS116 Capital Adequacy: Market Risk | 69 | |
| (s) | Summary of on and off-balance sheet securitisation by exposure type | 70 | |
| (t) part i | Securitisation exposure retained or purchase subject to specific risk | 70 | |
| (t) part ii | Securitisation exposure subject to APS120 for Specific risk by risk weight band | 70 | |
| (u) part i | Capital requirements for securitisation exposure subject to internal models approach (IMA) by risk classification | 70 | |
| (u) part ii | Capital requirements for securitisation regulatory capital approaches by risk weight band | 70 | |
| (u) part iii | Securitisation exposures deducted from capital | 71 | |
| (v) | Securitisation subject to early amortisation treatment | 71 | |
| (w) part i | Aggregate resecuritisation exposures retain or purchased subject to credit risk mitigation | 71 | |
| (w) part ii | Resecuritisation exposure to guarantors credit worthiness | 71 |
| 98| Westpac Group March 2020 Pillar 3 report | |
Pillar 3 report |
Appendix V | APS330 quantitative requirements |
| APS330 reference | Westpac disclosure | Page | |
| Table 13: Market risk - disclosures for ADIs using the standard method | (b) | Market Risk regulatory capital and risk weighted assets | 73 |
| Table 14: Market risk - disclosures for ADIs using the IMA for trading portfolios | (d) | VaR and Stressed VaR by risk type | 74 |
| Table 16: Equities - disclosures for banking book positions | (b) to (c) | Book value of listed equity exposures by industry classification / Book value of unlisted equity exposures by industry classification | 81 |
| (d) to (e) | Gains/losses | 81 | |
| (f) | Capital requirement1 | NA | |
| Table 17: Interest rate risk in the banking book | (b) | Change in economic value of sudden upward and downward movement in interest rates | 77 |
| (b) | Capital requirement | 77 | |
| Attachment E | |||
| Table 18: Leverage ratio disclosure template | Leverage ratio disclosure | 21 | |
| Table 19: Summary comparison of accounting assets vs leverage ratio exposure measure | Summary comparison of accounting assets vs leverage ratio exposure measure | 22 | |
| Attachment F | |||
| Table 20: Liquidity Coverage Ratio disclosure template | Liquidity Coverage Ratio disclosure | 83 | |
| Table 21: Net Stable Funding Ratio template | Net Stable Funding Ratio disclosure | 84 | |
| Attachment G2 | |||
| Table 21: Remuneration disclosure requirements | (g) | Governance structure | NA |
| (h) | Quantitative Disclosures | NA | |
| (i) | Deferred remuneration | NA | |
| (j) to (k) | Total value of remuneration awards for the current financial year for senior managers and material risk takers | NA | |
1 Equity exposures are not risk weighted at Level 2.
2 Remuneration disclosure is an annual reporting requirement under APS330.
| | Westpac Group March 2020 Pillar 3 report |99 |
Pillar 3 report Glossary |
Term | Description | |
| Actual losses | Represent direct write-offs and write-offs from provisions after adjusting for recoveries. | |
Additional Tier 1 capital
| Comprises high quality components of capital that provide a permanent and unrestricted commitment of funds that are freely available to absorb losses but rank behind claims of depositors and other more senior creditors. They also provide for fully discretionary capital distributions. | |
| Alternate Liquid Assets (ALA) | Assets that qualify for inclusion in the numerator of the LCR in jurisdictions where there is insufficient supply of HQLA. | |
| Advanced measurement approach (AMA) | The capital requirement using the AMA is based on a bank’s internal operational risk systems, which must both measure and manage operational risk. | |
| Assets intended to be securitised | Represents securitisation activity from the end of the reporting period to the disclosure date of this report. | |
| Australian accounting standards (AAS) | A set of Australian reporting standards and interpretations issued by the Australian Accounting Standards Board. | |
| Australian and New Zealand standard industrial classification (ANZSIC) | A code used by the Australian Bureau of Statistics and Statistics New Zealand for classifying businesses. | |
| Authorised deposit-taking institution (ADI) | ADIs are corporations that are authorised under the Banking Act 1959 to carry on banking business in Australia. | |
| Banking book | The banking book includes all securities that are not actively traded by Westpac. | |
| Cash EPS compound annual growth rate (CAGR) | An internal measure used to assess performance by measuring growth in cash earnings per share over a three year performance period. | |
| Committed Liquidity Facility (CLF) | Facility established with the RBA to cover the shortfall in Australian dollars between the ADI’s holding of HQLA and net cash outflows. The CLF is an ALA for the Group’s LCR calculation. | |
| Common equity Tier 1 (CET1) capital | The highest form of capital. The key components of common equity are shares, retained earnings and undistributed current year earnings. | |
| Credit valuation adjustment (CVA) risk | Refer to mark-to-market related credit risk. | |
| Default | A customer default is deemed to have occurred when Westpac considers that either or both of the following events have taken place:
| |
| l | the customer is unlikely to pay its credit obligations to its financiers in full, without recourse by any of them to actions such as realising security (where held); and | |
| l | the customer is past due 90 or more calendar days on any material credit obligation to its financiers. Overdrafts will be considered past due once the customer has breached an advised limit, or been advised of a limit smaller than the current outstandings. | |
| 100| Westpac Group March 2020 Pillar 3 report | |
Pillar 3 report Glossary |
Term | Description |
Defaulted not impaired | Includes facilities where:
l contractual payments of interest and/or principal are 90 or more calendar days overdue, including overdrafts or other revolving facilities that remain continuously outside approved limits by material amounts for 90 or more calendar days (including accounts for customers who have been granted hardship assistance); or
l an order has been sought for the customer’s bankruptcy or similar legal action has been instituted, which may avoid or delay repayment of its credit obligations; and
l the estimated net realisable value of assets/security to which Westpac has recourse is sufficient to cover repayment of all principal and interest, or where there are otherwise reasonable grounds to expect payment in full and interest is being taken to profit on an accrual basis.
These facilities, while in default, are not treated as impaired for accounting purposes.
|
| Double default rules | Double default applies to exposures where a particular obligor’s exposure has been hedged by the purchase of credit protection from a counterparty and loss will only occur if both obligor and counterparty default. In this instance, capital can be reduced. |
| Exposure at default (EAD) | EAD is calculated at facility level and includes outstandings as well as the proportion of committed undrawn that is expected to be drawn in the event of a future default. |
| Extended licensed entity (ELE) | An extended licensed entity (ELE) comprises an ADI and any subsidiaries of the ADI that have been approved by APRA as being part of a single ‘stand-alone’ entity. |
| External credit assessment institution (ECAI) | ECAI is an external institution recognised by APRA (directly or indirectly) to provide credit assessment in determining the risk-weights on financial institutions’ rated credit exposures (including securitisation exposures). |
| Geography | Geographic segmentation of exposures is based on the location of the office in which these items were booked. |
| High-quality liquid assets (HQLA) | Assets which meet APRA’s criteria for inclusion as HQLA in the numerator of the LCR. |
| Impaired exposures | Includes exposures that have deteriorated to the point where full collection of interest and principal is in doubt, based on an assessment of the customer’s outlook, cashflow, and the net realisation of value of assets to which recourse is held:
l facilities 90 days or more past due, and full recovery is in doubt: exposures where contractual payments are 90 or more days in arrears and the net realisable value of assets to which recourse is held may not be sufficient to allow full collection of interest and principal, including overdrafts or other revolving facilities that remain continuously outside approved limits by material amounts for 90 or more calendar days;
l non-accrual facilities: exposures with individually assessed impairment provisions held against them, excluding restructured loans;
l restructured facilities: exposures where the original contractual terms have been formally modified to provide for concessions of interest or principal for reasons related to the financial difficulties of the customer;
l other assets acquired through security enforcement (includes other real estate owned): includes the value of any other assets acquired as full or partial settlement of outstanding obligations through the enforcement of security arrangements; and
l any other facilities where the full collection of interest and principal is in doubt.
|
| | Westpac Group March 2020 Pillar 3 report |101 |
Pillar 3 report Glossary |
| Term | Description | |
| Industry | Exposures to businesses, government and other financial institutions are classified into industry clusters based upon groups of related ANZSIC codes. Companies that operate in multiple industries are classified according to their primary industry. Consumer customers as classified as “retail” and not further broken down. | |
| Interest rate risk in the banking book (IRRBB) | The risk to current and future year interest income arising from a mismatch between the duration of assets and liabilities that arises in the normal course of banking activities. | |
| Internal ratings-based approach (IRB & Advanced IRB) | These approaches allow banks to use internal estimates of the risks of their loans as inputs into the determination of the amount of credit risk capital needed to support the organisation. In the Advanced IRB approach, banks must supply their own estimates for all three credit parameters – Probability of Default, Loss Given Default and Exposure at Default. | |
| Leverage ratio | The leverage ratio is defined by APRA as Tier 1 capital divided by the “Exposure measure” and is expressed as a percentage. “Exposure measure” includes on-balance sheet exposures, derivatives exposures, securities financing transaction (SFT) exposures, and other off-balance sheet exposures. | |
| Liquidity coverage ratio (LCR) | An APRA requirement to maintain an adequate level of unencumbered high quality liquid assets, to meet liquidity needs for a 30 calendar day period under an APRA-defined severe stress scenario. Absent a situation of financial stress, the value of the LCR must not be less than 100%. LCR is calculated as the percentage ratio of stock of HQLA, CLF and qualifying Reserve Bank of New Zealand securities over the total net cash out flows in a modelled 30 day defined stressed scenario. | |
| Loss given default (LGD) | The LGD represents an estimate of the expected severity of a loss to Westpac should a customer default occur during a severe economic downturn. Westpac assigns LGD to each credit facility, assuming an event of default has occurred and taking into account a conservative estimate of the net realisable value of assets to which Westpac has recourse and over which it has security. LGDs also reflect the seniority of exposure in the customer’s capital and debt structure. | |
| Maturity | The maturity date used is drawn from the contractual maturity date of the customer loans. | |
| Mark-to-market related credit risk | The risk of mark-to-market losses related to deterioration in the credit quality of a derivative counterparty also referred to as credit valuation adjustment (CVA) risk. | |
| Monte Carlo simulation | A method of random sampling to achieve numerical solutions to mathematical problems. | |
| Net cash outflows | Total expected cash outflows minus total expected cash inflows in the specified LCR stress scenario calculated in accordance with APRA’s liquidity standard. | |
| Net interest income at risk (NaR) | BRCC-approved limit expressed as a deviation from the benchmark hedge level over a 1-year time frame, at a 99% confidence level. | |
| Net Stable Funding Ratio (NSFR) | The NSFR is defined as the ratio of the amount of available stable funding (ASF) to the amount of required stable funding (RSF) defined by APRA. The amount of ASF is the portion of an ADI’s capital and liabilities expected to be a reliable source of funds over a one year time horizon. The amount of RSF is a function of the liquidity characteristics and residual maturities of an ADI’s assets and off-balance sheet activities. ADI’s must maintain an NSFR of at least 100%. | |
| Off-balance sheet exposure | Credit exposures arising from facilities that are not recorded on Westpac's balance sheet (under accounting methodology). Undrawn commitments and the expected future exposure calculated for Westpac's derivative products are included in off-balance sheet exposure. | |
| 102| Westpac Group March 2020 Pillar 3 report | |
Pillar 3 report Glossary |
| Term | Description |
| On balance sheet exposure | Credit exposures arising from facilities that are recorded on Westpac's balance sheet (under accounting methodology). |
| Potential future credit exposure (PFCE) | The PFCE for each transaction is calculated by multiplying the effective notional principal amount by a credit conversion factor specified in APS112. |
| Probability of default (PD) | Probability of default is a through-the-cycle assessment of the likelihood of a customer defaulting on its financial obligations within one year. |
| Resecuritisation | A resecuritisation exposure is a securitisation exposure in which the risk associated with an underlying pool of exposures is tranched and at least one of the underlying exposures is a securitisation exposure. In addition, an exposure to one or more resecuritisation exposures is a resecuritisation exposure; |
| Risk weighted assets (RWA) | Assets (both on and off-balance sheet) are risk weighted according to each asset's inherent potential for default and what the likely losses would be in case of default. In the case of non-asset backed risks (i.e. market and operational risk), RWA is determined by multiplying the capital requirements for those risks by 12.5. |
| Securitisation purchased | The purchase of third party securitisation exposure, for example residential mortgage backed securities. |
| Securitisation retained | Securitisation exposures arising through Westpac originated assets or generated by Westpac third party securitisation activity. |
| Securities financing transactions (SFT) | APRA defines SFTs as “transactions such as repurchase agreements, reverse repurchase agreements, and security lending and borrowing, and margin lending transactions, where the value of the transactions depends on the market valuation of securities and the transactions are typically subject to margin agreements.” |
| Sponsor | An ADI would generally be considered a sponsor if it, in fact or substance, manages or advises the securitisation program, places securities into the market, or provide liquidity and/or credit enhancements. |
| Standard model | The standard model for Market risk applies supervisory risk weights to trading positions. |
| Stressed VaR (SVaR) | Stressed VaR uses the approved VaR model but applies a period of significant market stress. Market risk capital is estimated by adding Stressed VaR to regular VaR. |
| Substitution approach | Substitutions refers to the rules governing the circumstances when capital can be reduced because an obligor’s exposure has been hedged by the purchase of credit protection from a counterparty and the counterparty’s PD is used in place of the obligors’ PD. |
| Supervisory Formula Approach (SFA) | The SFA applicable to unrated exposures dynamically looks at the type and performance of underlying asset pools funded by the securitisation exposure as well as the structural features of the transaction to determine capital requirements |
Tier 2 capital
| Includes other capital elements, which, to varying degrees, fall short of the quality of Tier 1 capital but still contribute to the overall strength of an entity as a gone concern capital. |
| | Westpac Group March 2020 Pillar 3 report |103 |
Pillar 3 report Glossary |
| Term | Description |
| Trading book | Trading book activity represents dealings that encompass book running and distribution activity. The types of market risk arising from trading activity include interest rate risk, foreign exchange risk, commodity risk, equity price risk, credit spread risk and volatility risk. Financial Markets and Treasury are responsible for managing market risk arising from Westpac’s trading activity. |
| Value at risk (VaR) | VaR is the potential loss in earnings from adverse market movements and is calculated over a one-day time horizon at a 99% confidence level using a minimum of one year of historical rate data. VaR takes account of all material market variables that may cause a change in the value of the trading portfolio and the banking book including interest rates, foreign exchange rates, price changes, volatility, and the correlation among these variables. |
Exchange rates
The following exchange rates were used in the Westpac Pillar 3 report, and reflect spot rates for the period end.
| $ | 31 March 2020 | 30 September 2019 | 31 March 2019 |
| USD | 0.6191 | 0.6755 | 0.7092 |
| GBP | 0.5017 | 0.5493 | 0.5425 |
| NZD | 1.0264 | 1.0791 | 1.0439 |
| EUR | 0.5620 | 0.6176 | 0.6313 |
| 104| Westpac Group March 2020 Pillar 3 report | |
Pillar 3 report |
Disclosure regarding forward-looking statements |
This report contains statements that constitute ‘forward-looking statements’ within the meaning of Section 21E of the US Securities Exchange Act of 1934.
Forward-looking statements are statements about matters that are not historical facts. Forward-looking statements appear in a number of places in this report and include statements regarding Westpac’s intent, belief or current expectations with respect to its business and operations, market conditions, results of operations and financial condition, including, without limitation, future loan loss provisions and financial support to certain borrowers. Words such as ‘will’, ‘may’, ‘expect’, ‘intend’, ‘seek’, ‘would’, ‘should’, ‘could’, ‘continue’, ‘plan’, ‘estimate’, ‘anticipate’, ‘believe’, ‘probability’, ‘risk’, ‘aim’ or other similar words are used to identify forward-looking statements. These forward-looking statements reflect Westpac’s current views with respect to future events and are subject to change, certain risks, uncertainties and assumptions which are, in many instances, beyond Westpac’s control, and have been made based upon management’s expectations and beliefs concerning future developments and their potential effect upon Westpac. There can be no assurance that future developments will be in accordance with Westpac’s expectations or that the effect of future developments on Westpac will be those anticipated. Actual results could differ materially from those expected, depending on the outcome of various factors, including, but not limited to:
| l | the effect of the global COVID-19 pandemic, which has had, and is expected to continue to have, a negative impact on our business and global economic conditions, adversely affect a wide-range of Westpac's customers, create increased volatility in financial markets and may result in increased impairments, defaults and write-offs; |
| l | disruptions to our business and operations and to the business and operations of key suppliers, third party contractors and customers connected with the COVID-19 pandemic; |
| l | the effect of, and changes in, laws, regulations, taxation or accounting standards or practices and government policy, particularly changes to liquidity, leverage and capital requirements; |
| l | regulatory investigations, reviews, and other actions, inquiries, litigation, fines, penalties, restrictions or other regulator imposed conditions, including as a result of our actual or alleged failure to comply with laws (such as financial crime laws), regulations or regulatory policy; |
| l | internal and external events which may adversely impact Westpac's reputation; |
| l | information security breaches, including cyberattacks; |
| l | reliability and security of Westpac's technology and risks associated with changes to technology systems; |
| l | the stability of Australian and international financial systems and disruptions to financial markets and any losses or business impacts Westpac or its customers or counterparties may experience as a result; |
| l | market volatility, including uncertain conditions in funding, equity and asset markets; |
| l | adverse asset, credit or capital market conditions; |
| l | an increase in defaults in credit exposures because of a deterioration in economic conditions; |
| l | the conduct, behaviour or practices of Westpac or its staff; |
| l | changes to Westpac's credit ratings or to the methodology used by credit rating agencies; |
| l | levels of inflation, interest rates (including low or negative rates), exchange rates and market and monetary fluctuations; |
| l | market liquidity and investor confidence; |
| l | changes in economic conditions, consumer spending, saving and borrowing habits in Australia, New Zealand and in other countries (including as a result of tariffs and protectionist trade measures) in which Westpac or its customers or counterparties conduct their operations and Westpac’s ability to maintain or to increase market share, margins and fees, and control expenses; |
| l | the effects of competition, including from established providers of financial services and from non-financial service entities in the geographic and business areas in which Westpac conducts its operations; |
| l | the timely development and acceptance of new products and services and the perceived overall value of these products and services by customers; |
| l | the effectiveness of Westpac's risk management policies, including internal processes, systems and employees; |
| l | the incidence or severity of Westpac-insured events; |
| l | the occurrence of environmental change (including as a result of climate change) or external events in countries in which Westpac or its customers or counterparties conduct their operations; |
| l | changes to the value of Westpac's intangible assets; |
| l | changes in political, social or economic conditions in any of the major markets in which Westpac or its customers or counterparties operate; |
| l | the success of strategic decisions involving diversification or innovation, in addition to business expansion activity, business acquisitions and the integration of new businesses; and |
| l | various other factors beyond Westpac's control. |
| | Westpac Group March 2020 Pillar 3 report |105 |
Pillar 3 report |
Disclosure regarding forward-looking statements |
The above list is not exhaustive. For certain other factors that may impact on forward-looking statements made by Westpac refer to ‘Risk factors’ in Westpac’s 2020 Interim Financial Results Announcement. When relying on forward-looking statements to make decisions with respect to Westpac, investors and others should carefully consider the foregoing factors and other uncertainties and events.
Westpac is under no obligation to update any forward-looking statements contained in this report, whether as a result of new information, future events or otherwise, after the date of this report.
| 106| Westpac Group March 2020 Pillar 3 report | |