Exhibit 2
| ASX Release 3 MAY 2021 Westpac 1H21 Presentation and Investor Discussion Pack Westpac Banking Corporation (“Westpac”) today provides the attached Westpac 1H21 Presentation and Investor Discussion Pack. For further information: David Lording Andrew Bowden Group Head of Media Relations Head of Investor Relations 0419 683 411 0438 284 863 This document has been authorised for release by Tim Hartin, General Manager & Company Secretary. Level 18, 275 Kent Street Sydney, NSW, 2000 |
| Presentation and Investor Discussion Pack 2021 INTERIM FINANCIAL RESULTS FOR THE SIX MONTHS ENDED 31 MARCH 2021 WESTPAC BANKING CORPORATION ABN 33 007 457 141 Fix. Simplify. Perform. Financial results throughout this presentation are in Australian dollars and are based on cash earnings unless otherwise stated. Refer page 35 for definition. Results principally cover the 1H21, 2H20 and 1H20 periods. Comparison of 1H21 versus 2H20 (unless otherwise stated). |
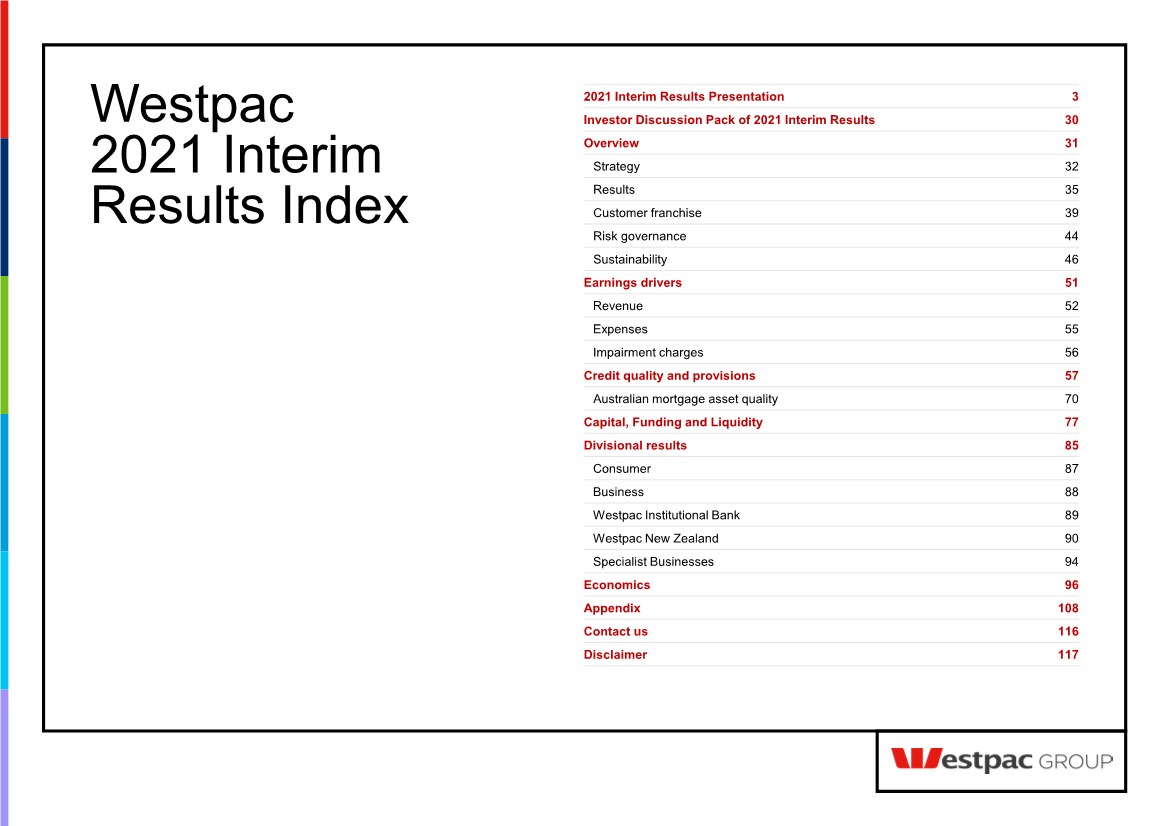
| Westpac 2021 Interim Results Index 2021 Interim Results Presentation 3 Investor Discussion Pack of 2021 Interim Results 30 Overview 31 Strategy 32 Results 35 Customer franchise 39 Risk governance 44 Sustainability 46 Earnings drivers 51 Revenue 52 Expenses 55 Impairment charges 56 Credit quality and provisions 57 Australian mortgage asset quality 70 Capital, Funding and Liquidity 77 Divisional results 85 Consumer 87 Business 88 Westpac Institutional Bank 89 Westpac New Zealand 90 Specialist Businesses 94 Economics 96 Appendix 108 Contact us 116 Disclaimer 117 |
| Financial results throughout this presentation are in Australian dollars and are based on cash earnings unless otherwise stated. Refer page 30 for definition. Results principally cover the 1H20, 2H19 and 1H19 periods. Comparison of 1H20 versus 2H19 (unless otherwise stated). Peter King Chief Executive Officer |
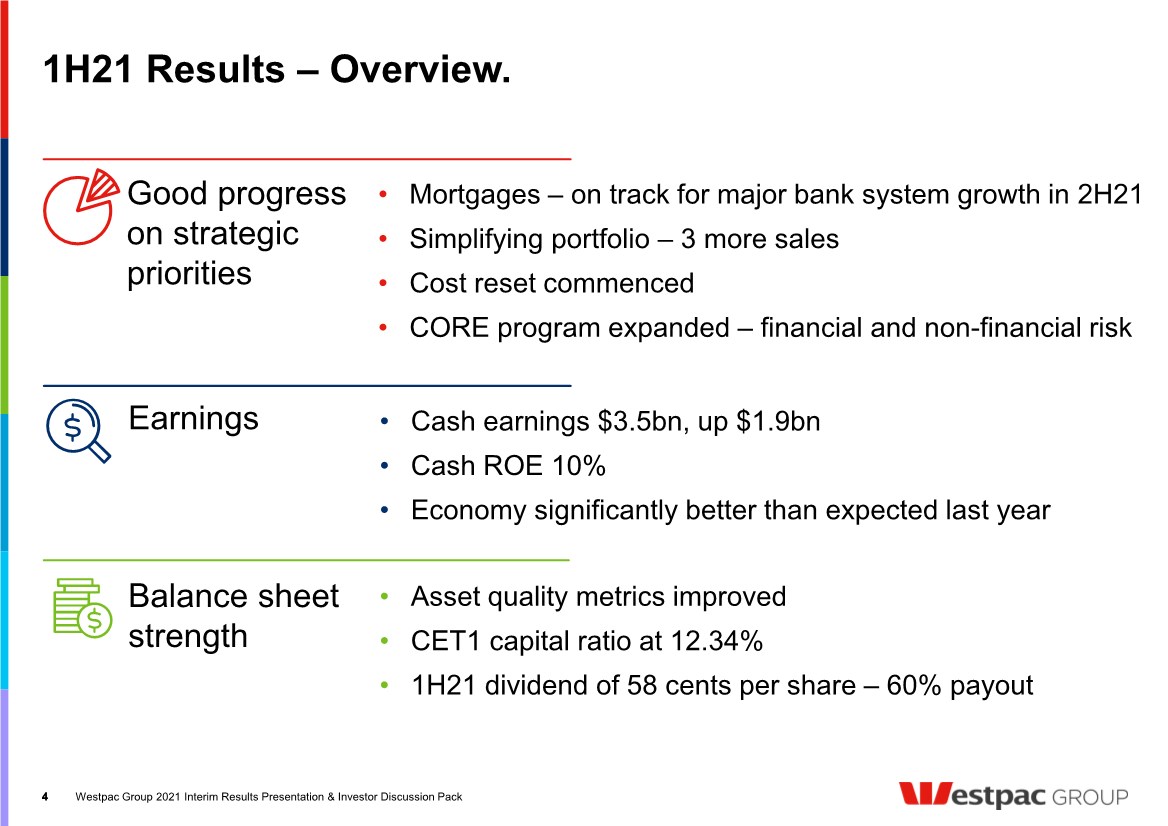
| 1H21 Results – Overview. Earnings Good progress on strategic priorities 4 Westpac Group 2021 Interim Results Presentation & Investor Discussion Pack Balance sheet strength • Cash earnings $3.5bn, up $1.9bn • Cash ROE 10% • Economy significantly better than expected last year • Mortgages – on track for major bank system growth in 2H21 • Simplifying portfolio – 3 more sales • Cost reset commenced • CORE program expanded – financial and non-financial risk • Asset quality metrics improved • CET1 capital ratio at 12.34% • 1H21 dividend of 58 cents per share – 60% payout 4 |
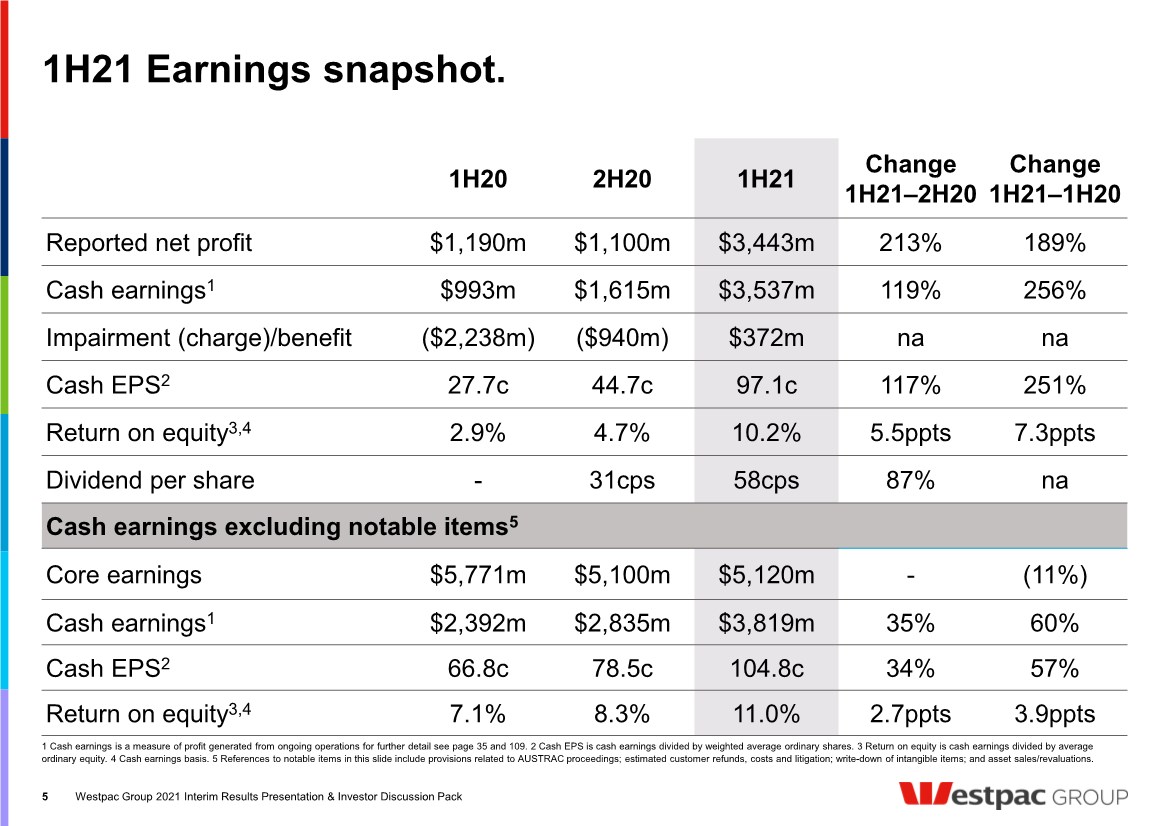
| 1H21 Earnings snapshot. 1 Cash earnings is a measure of profit generated from ongoing operations for further detail see page 35 and 109. 2 Cash EPS is cash earnings divided by weighted average ordinary shares. 3 Return on equity is cash earnings divided by average ordinary equity. 4 Cash earnings basis. 5 References to notable items in this slide include provisions related to AUSTRAC proceedings; estimated customer refunds, costs and litigation; write-down of intangible items; and asset sales/revaluations. 1H20 2H20 1H21 Change 1H21–2H20 Change 1H21–1H20 Reported net profit $1,190m $1,100m $3,443m 213% 189% Cash earnings1 $993m $1,615m $3,537m 119% 256% Impairment (charge)/benefit ($2,238m) ($940m) $372m na na Cash EPS2 27.7c 44.7c 97.1c 117% 251% Return on equity3,4 2.9% 4.7% 10.2% 5.5ppts 7.3ppts Dividend per share - 31cps 58cps 87% na Cash earnings excluding notable items5 Core earnings $5,771m $5,100m $5,120m - (11%) Cash earnings1 $2,392m $2,835m $3,819m 35% 60% Cash EPS2 66.8c 78.5c 104.8c 34% 57% Return on equity3,4 7.1% 8.3% 11.0% 2.7ppts 3.9ppts 5 Westpac Group 2021 Interim Results Presentation & Investor Discussion Pack |
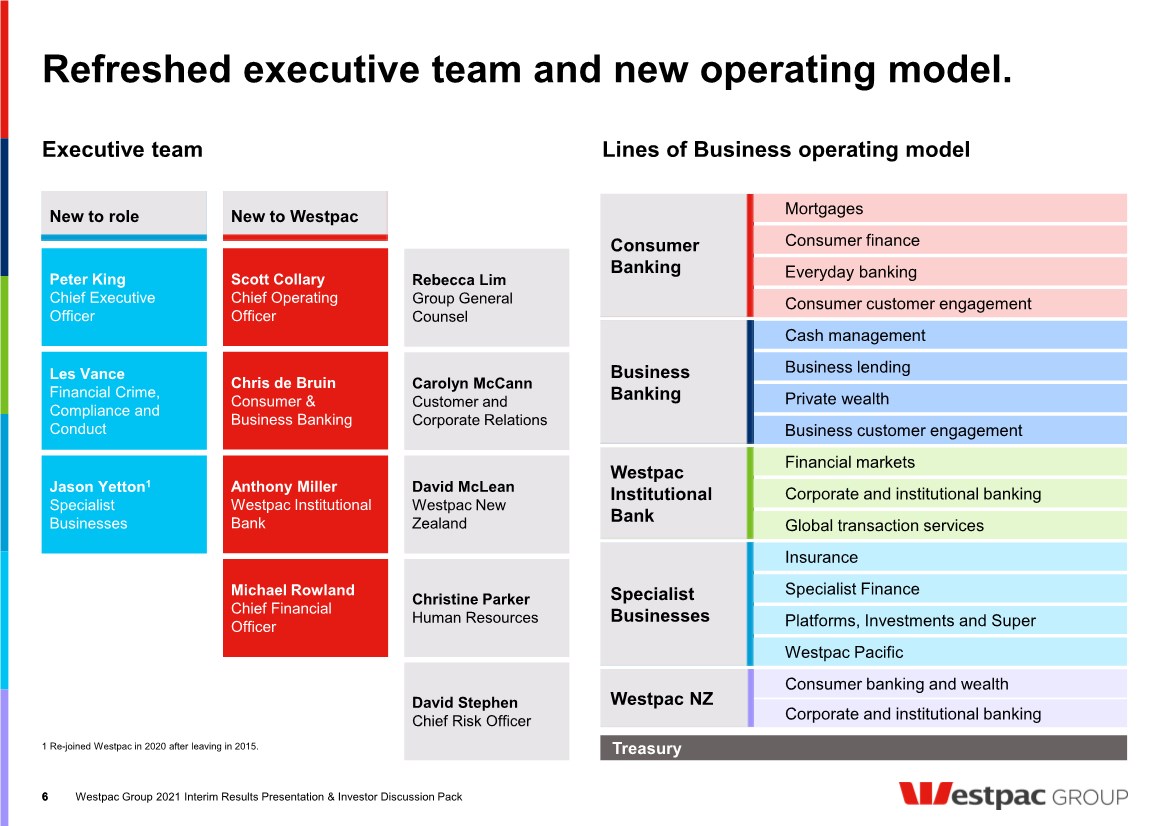
| Refreshed executive team and new operating model. Executive team Lines of Business operating model 6 Consumer Banking Private wealth Cash management Business lending Business customer engagement Westpac Institutional Bank Financial markets Corporate and institutional banking Consumer banking and wealth Corporate and institutional banking Specialist Businesses Westpac NZ Treasury Global transaction services Insurance Specialist Finance Platforms, Investments and Super Westpac Pacific Business Banking Mortgages Consumer finance Everyday banking Consumer customer engagement Peter King Chief Executive Officer Jason Yetton1 Specialist Businesses Scott Collary Chief Operating Officer Chris de Bruin Consumer & Business Banking Rebecca Lim Group General Counsel Carolyn McCann Customer and Corporate Relations Anthony Miller Westpac Institutional Bank Christine Parker Human Resources Michael Rowland Chief Financial Officer David Stephen Chief Risk Officer Les Vance Financial Crime, Compliance and Conduct David McLean Westpac New Zealand New to Westpac New to role Westpac Group 2021 Interim Results Presentation & Investor Discussion Pack 1 Re-joined Westpac in 2020 after leaving in 2015. 6 |
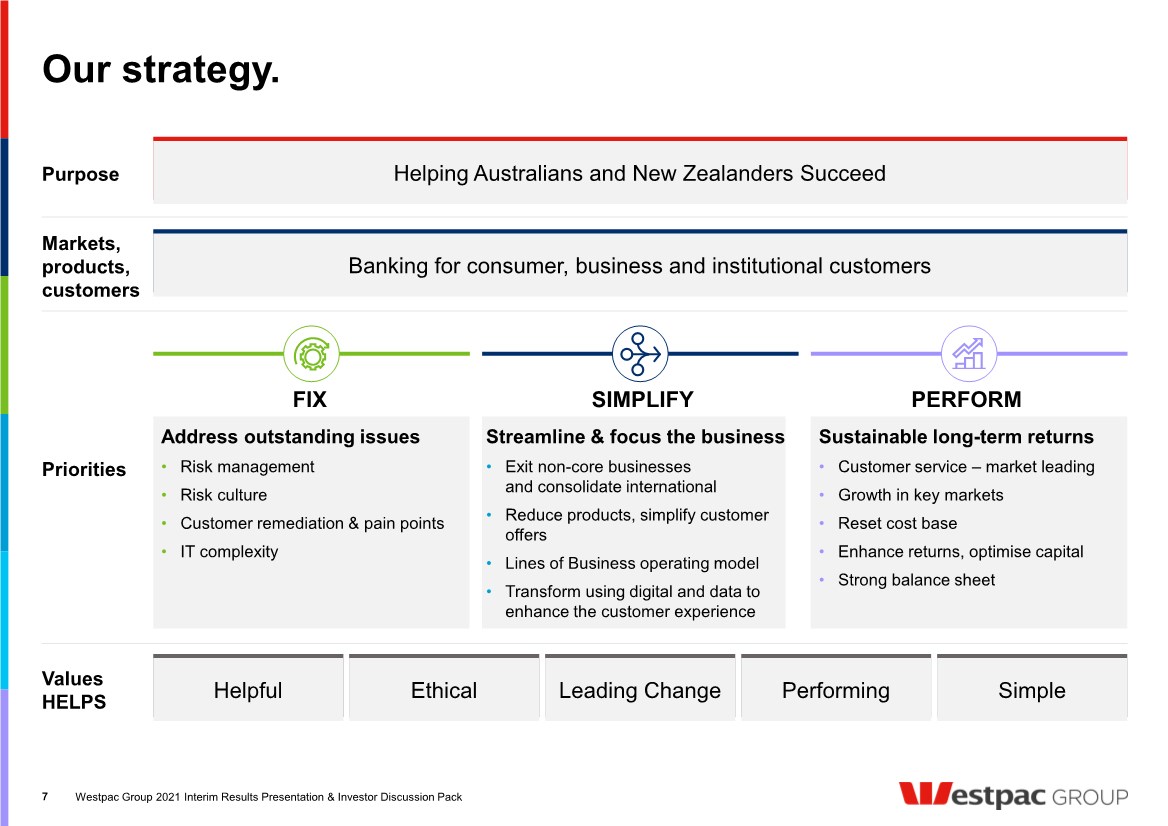
| Our strategy. 7 Priorities Values HELPS Helpful Ethical Leading Change Performing Simple Purpose Markets, products, customers Helping Australians and New Zealanders Succeed Banking for consumer, business and institutional customers SIMPLIFY Sustainable long-term returns • Customer service – market leading • Growth in key markets • Reset cost base • Enhance returns, optimise capital • Strong balance sheet Streamline & focus the business • Exit non-core businesses and consolidate international • Reduce products, simplify customer offers • Lines of Business operating model • Transform using digital and data to enhance the customer experience Address outstanding issues • Risk management • Risk culture • Customer remediation & pain points • IT complexity FIX PERFORM Westpac Group 2021 Interim Results Presentation & Investor Discussion Pack |
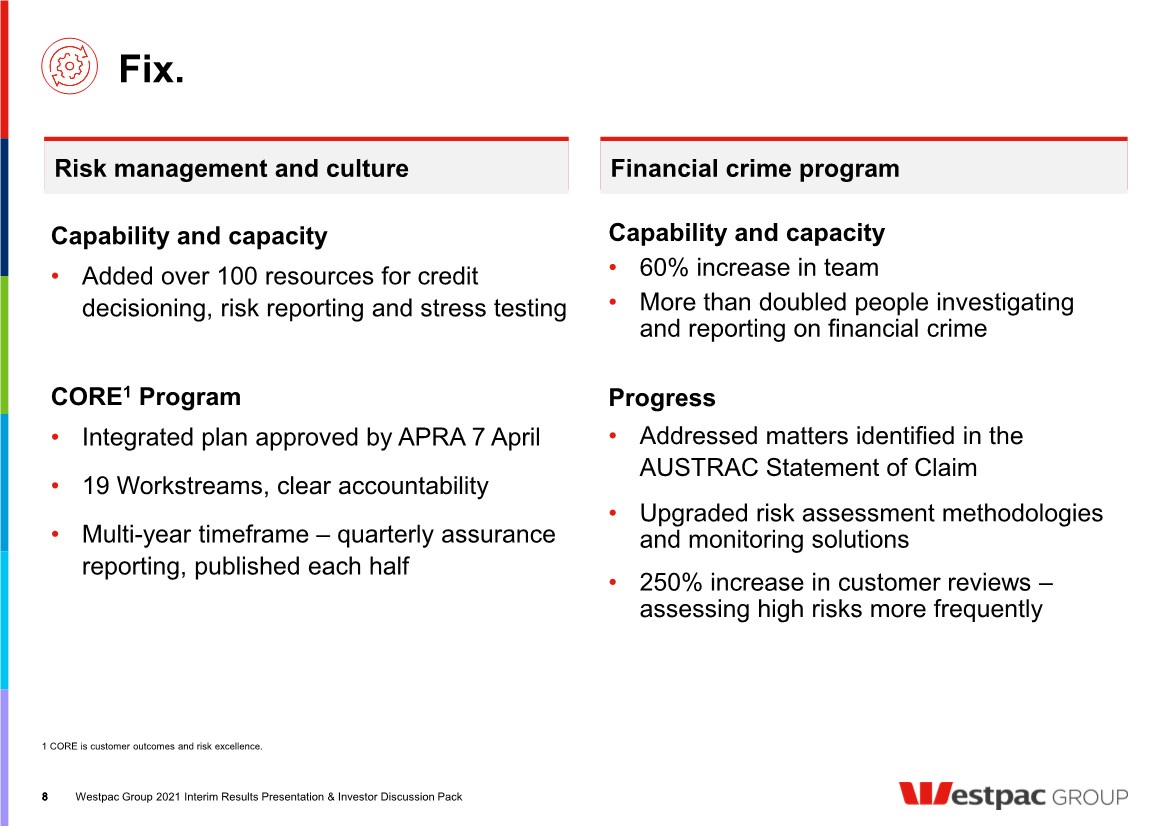
| Westpac Group 2021 Interim Results Presentation & Investor Discussion Pack 1 CORE is customer outcomes and risk excellence. 8 Fix. Risk management and culture Capability and capacity • Added over 100 resources for credit decisioning, risk reporting and stress testing CORE1 Program • Integrated plan approved by APRA 7 April • 19 Workstreams, clear accountability • Multi-year timeframe – quarterly assurance reporting, published each half Capability and capacity • 60% increase in team • More than doubled people investigating and reporting on financial crime Progress • Addressed matters identified in the AUSTRAC Statement of Claim • Upgraded risk assessment methodologies and monitoring solutions • 250% increase in customer reviews – assessing high risks more frequently Financial crime program 8 |
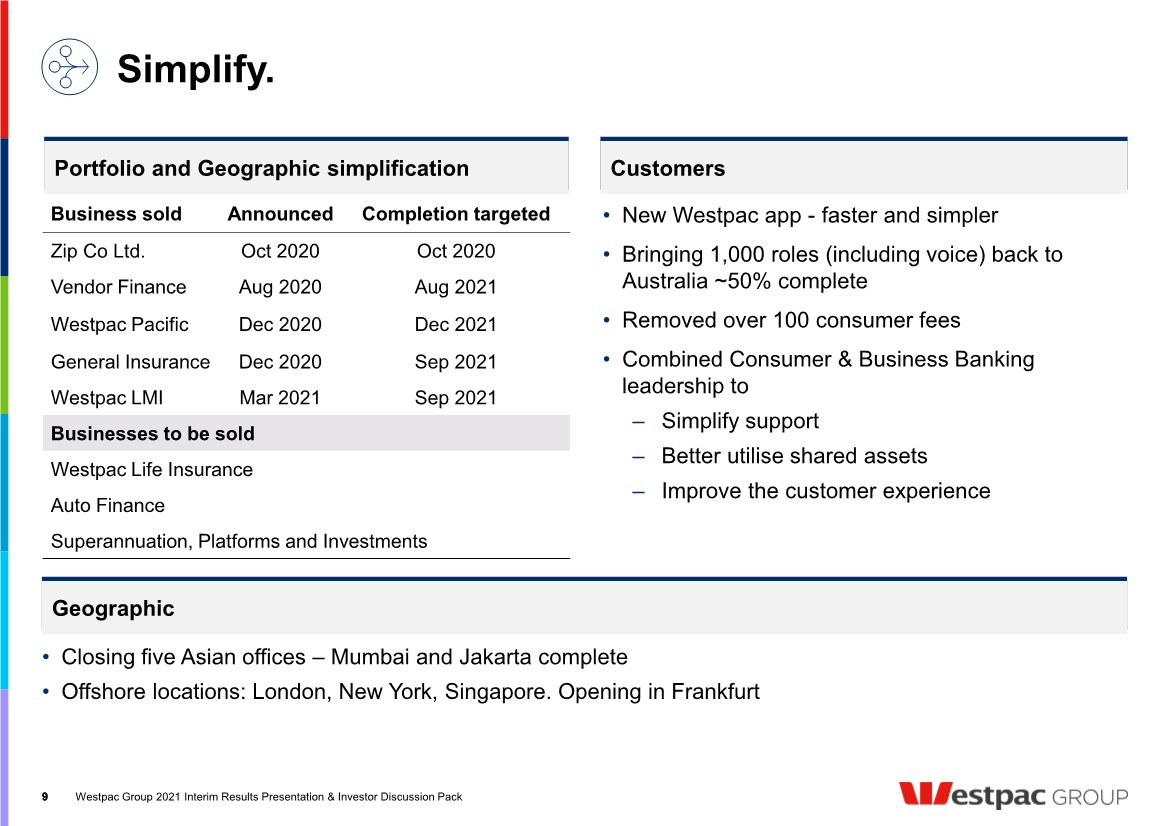
| Simplify. Westpac Group 2021 Interim Results Presentation & Investor Discussion Pack • Closing five Asian offices – Mumbai and Jakarta complete • Offshore locations: London, New York, Singapore. Opening in Frankfurt • New Westpac app - faster and simpler • Bringing 1,000 roles (including voice) back to Australia ~50% complete • Removed over 100 consumer fees • Combined Consumer & Business Banking leadership to ‒ Simplify support ‒ Better utilise shared assets ‒ Improve the customer experience 9 Business sold Announced Completion targeted Zip Co Ltd. Oct 2020 Oct 2020 Vendor Finance Aug 2020 Aug 2021 Westpac Pacific Dec 2020 Dec 2021 General Insurance Dec 2020 Sep 2021 Westpac LMI Mar 2021 Sep 2021 Businesses to be sold Westpac Life Insurance Auto Finance Superannuation, Platforms and Investments Portfolio and Geographic simplification Customers Geographic 9 |
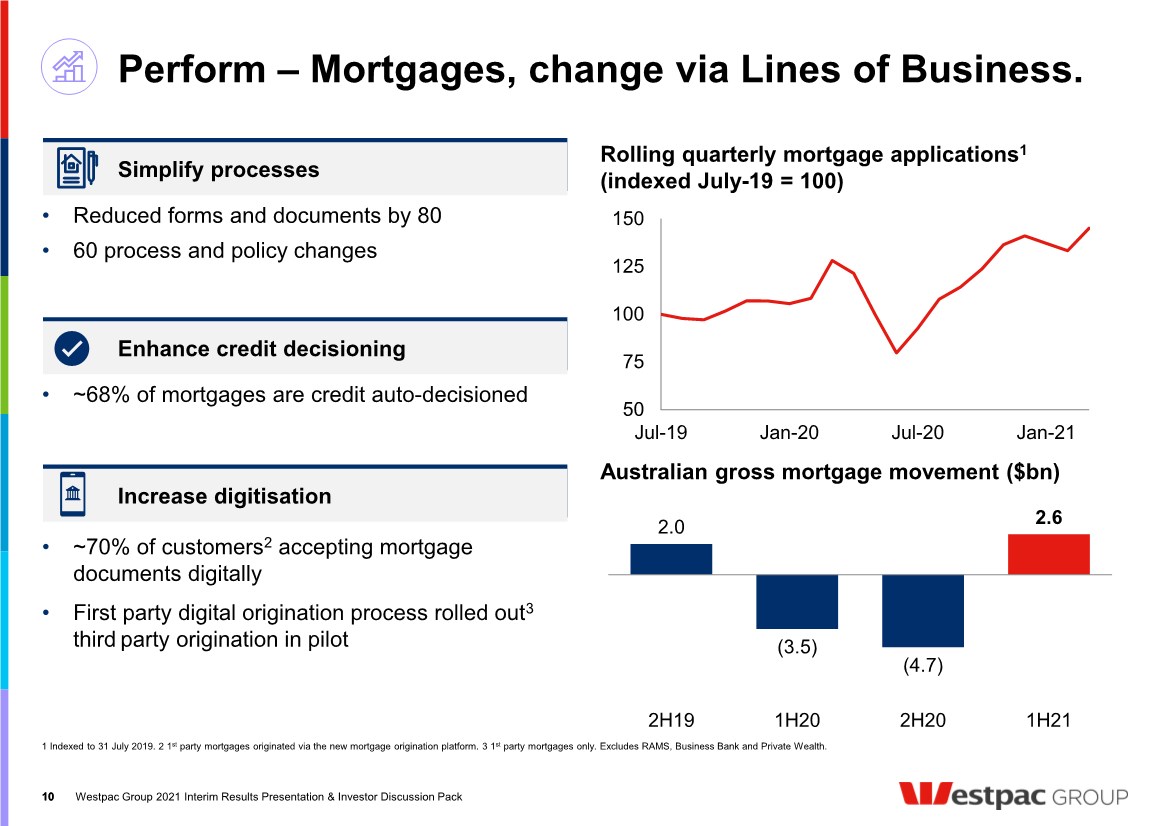
| • Reduced forms and documents by 80 • 60 process and policy changes • ~68% of mortgages are credit auto-decisioned • ~70% of customers2 accepting mortgage documents digitally • First party digital origination process rolled out3 third party origination in pilot Westpac Group 2021 Interim Results Presentation & Investor Discussion Pack Rolling quarterly mortgage applications1 (indexed July-19 = 100) Australian gross mortgage movement ($bn) 1 Indexed to 31 July 2019. 2 1st party mortgages originated via the new mortgage origination platform. 3 1st party mortgages only. Excludes RAMS, Business Bank and Private Wealth. 10 50 75 100 125 150 Jul-19 Jan-20 Jul-20 Jan-21 Perform – Mortgages, change via Lines of Business. 2.0 (3.5) (4.7) 2.6 2H19 1H20 2H20 1H21 Simplify processes Enhance credit decisioning Increase digitisation 10 |
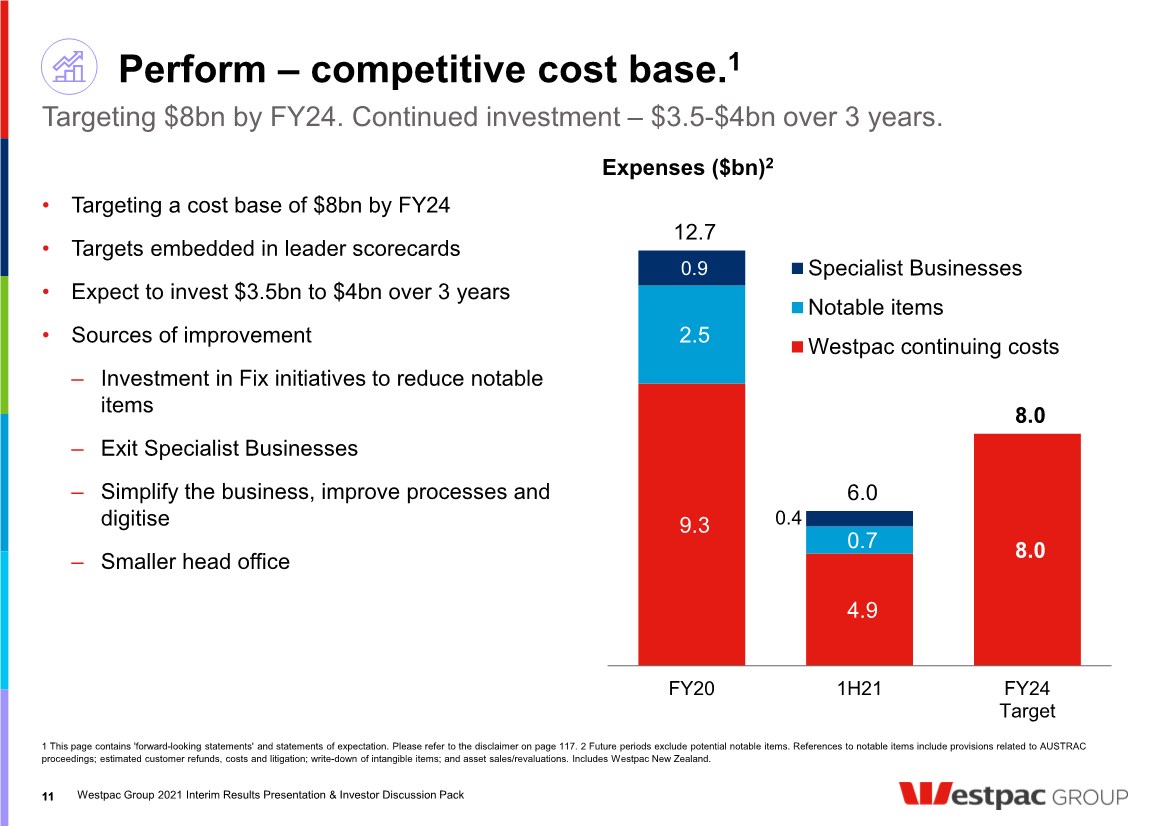
| Perform – competitive cost base.1 Westpac Group 2021 Interim Results Presentation & Investor Discussion Pack 1 This page contains 'forward-looking statements' and statements of expectation. Please refer to the disclaimer on page 117. 2 Future periods exclude potential notable items. References to notable items include provisions related to AUSTRAC proceedings; estimated customer refunds, costs and litigation; write-down of intangible items; and asset sales/revaluations. Includes Westpac New Zealand. Expenses ($bn)2 11 • Targeting a cost base of $8bn by FY24 • Targets embedded in leader scorecards • Expect to invest $3.5bn to $4bn over 3 years • Sources of improvement ‒ Investment in Fix initiatives to reduce notable items ‒ Exit Specialist Businesses ‒ Simplify the business, improve processes and digitise ‒ Smaller head office 9.3 4.9 8.0 2.5 0.7 0.9 0.4 12.7 6.0 8.0 FY20 1H21 FY24 Target Specialist Businesses Notable items Westpac continuing costs Targeting $8bn by FY24. Continued investment – $3.5-$4bn over 3 years. 11 |
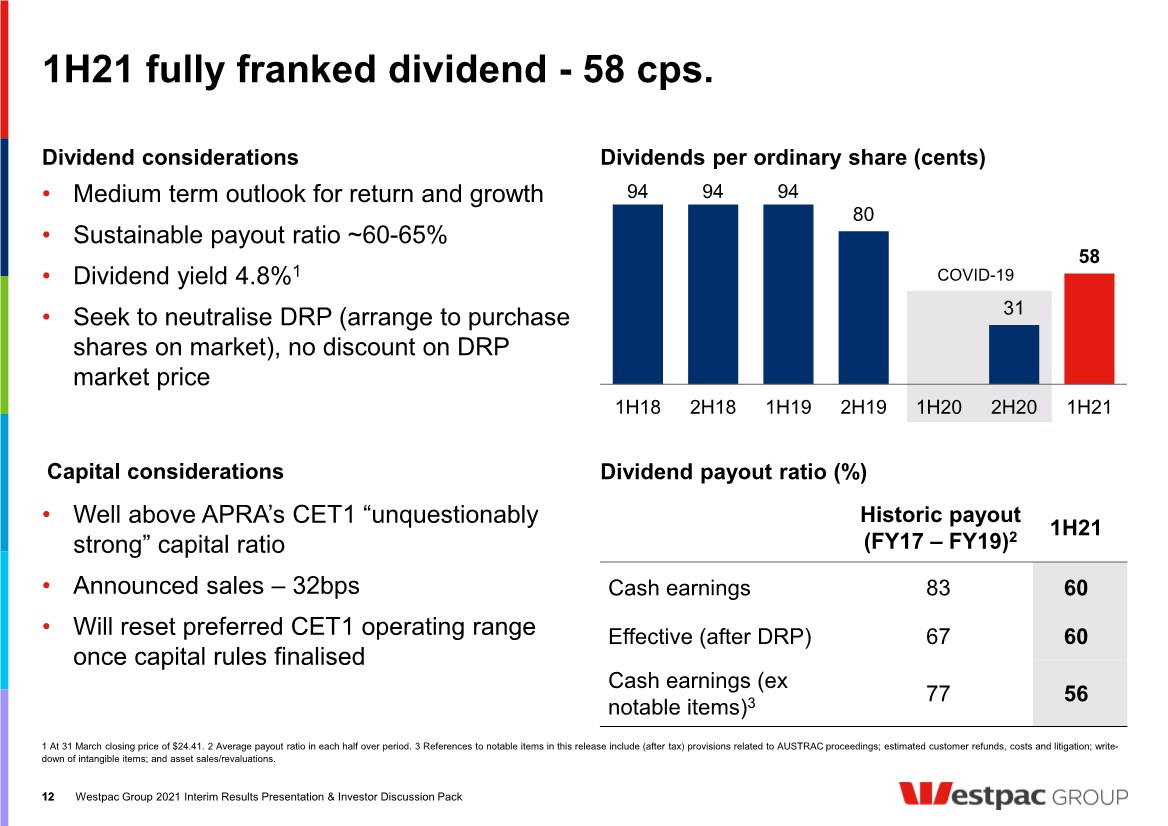
| 1H21 fully franked dividend - 58 cps. Westpac Group 2021 Interim Results Presentation & Investor Discussion Pack • Medium term outlook for return and growth • Sustainable payout ratio ~60-65% • Dividend yield 4.8%1 • Seek to neutralise DRP (arrange to purchase shares on market), no discount on DRP market price Dividends per ordinary share (cents) Dividend payout ratio (%) Dividend considerations 1 At 31 March closing price of $24.41. 2 Average payout ratio in each half over period. 3 References to notable items in this release include (after tax) provisions related to AUSTRAC proceedings; estimated customer refunds, costs and litigation; write- down of intangible items; and asset sales/revaluations. 94 94 94 80 31 58 1H18 2H18 1H19 2H19 1H20 2H20 1H21 Historic payout (FY17 – FY19)2 1H21 Cash earnings 83 60 Effective (after DRP) 67 60 Cash earnings (ex notable items)3 77 56 COVID-19 12 Capital considerations • Well above APRA’s CET1 “unquestionably strong” capital ratio • Announced sales – 32bps • Will reset preferred CET1 operating range once capital rules finalised 12 |
| Financial results throughout this presentation are in Australian dollars and are based on cash earnings unless otherwise stated. Refer page 30 for definition. Results principally cover the 1H20, 2H19 and 1H19 periods. Comparison of 1H20 versus 2H19 (unless otherwise stated). Michael Rowland Chief Financial Officer |
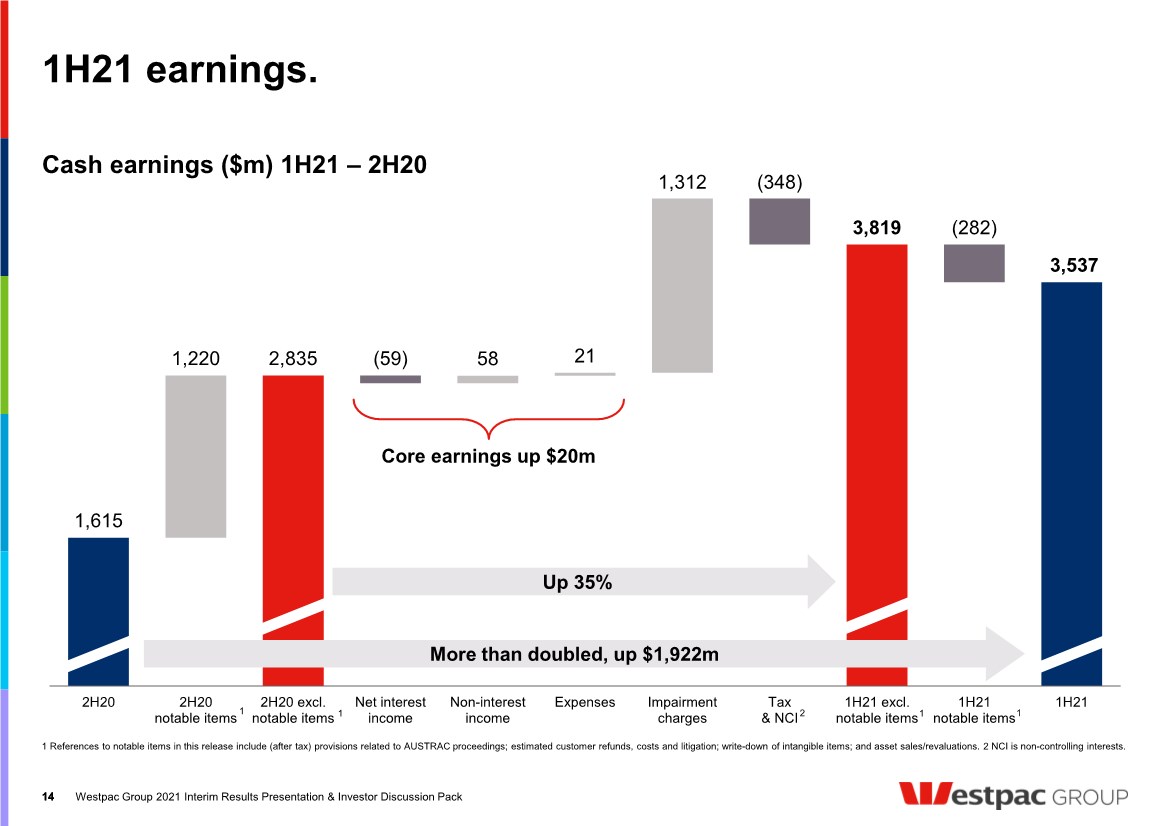
| 1,615 1,220 2,835 58 21 1,312 3,819 (59) (348) (282) 3,537 2H20 2H20 notable items 2H20 excl. notable items Net interest income Non-interest income Expenses Impairment charges Tax & NCI 1H21 excl. notable items 1H21 notable items 1H21 1H21 earnings. 1 References to notable items in this release include (after tax) provisions related to AUSTRAC proceedings; estimated customer refunds, costs and litigation; write-down of intangible items; and asset sales/revaluations. 2 NCI is non-controlling interests. Westpac Group 2021 Interim Results Presentation & Investor Discussion Pack Cash earnings ($m) 1H21 – 2H20 Up 35% More than doubled, up $1,922m 2 1 1 1 1 14 Core earnings up $20m 14 |
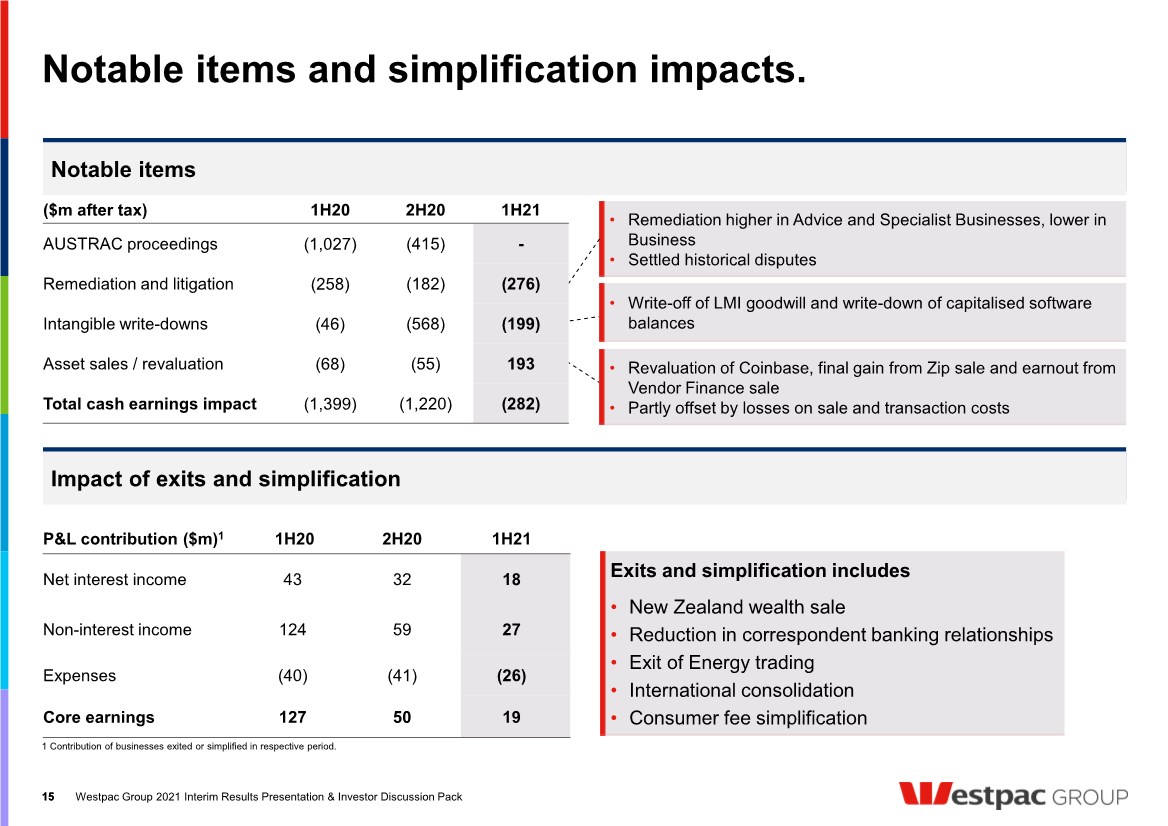
| Notable items and simplification impacts. Westpac Group 2021 Interim Results Presentation & Investor Discussion Pack Notable items 1 Contribution of businesses exited or simplified in respective period. 15 • Remediation higher in Advice and Specialist Businesses, lower in Business • Settled historical disputes • Write-off of LMI goodwill and write-down of capitalised software balances • Revaluation of Coinbase, final gain from Zip sale and earnout from Vendor Finance sale • Partly offset by losses on sale and transaction costs ($m after tax) 1H20 2H20 1H21 AUSTRAC proceedings (1,027) (415) - Remediation and litigation (258) (182) (276) Intangible write-downs (46) (568) (199) Asset sales / revaluation (68) (55) 193 Total cash earnings impact (1,399) (1,220) (282) P&L contribution ($m)1 1H20 2H20 1H21 Net interest income 43 32 18 Non-interest income 124 59 27 Expenses (40) (41) (26) Core earnings 127 50 19 Notable items Impact of exits and simplification Exits and simplification includes • New Zealand wealth sale • Reduction in correspondent banking relationships • Exit of Energy trading • International consolidation • Consumer fee simplification 15 |
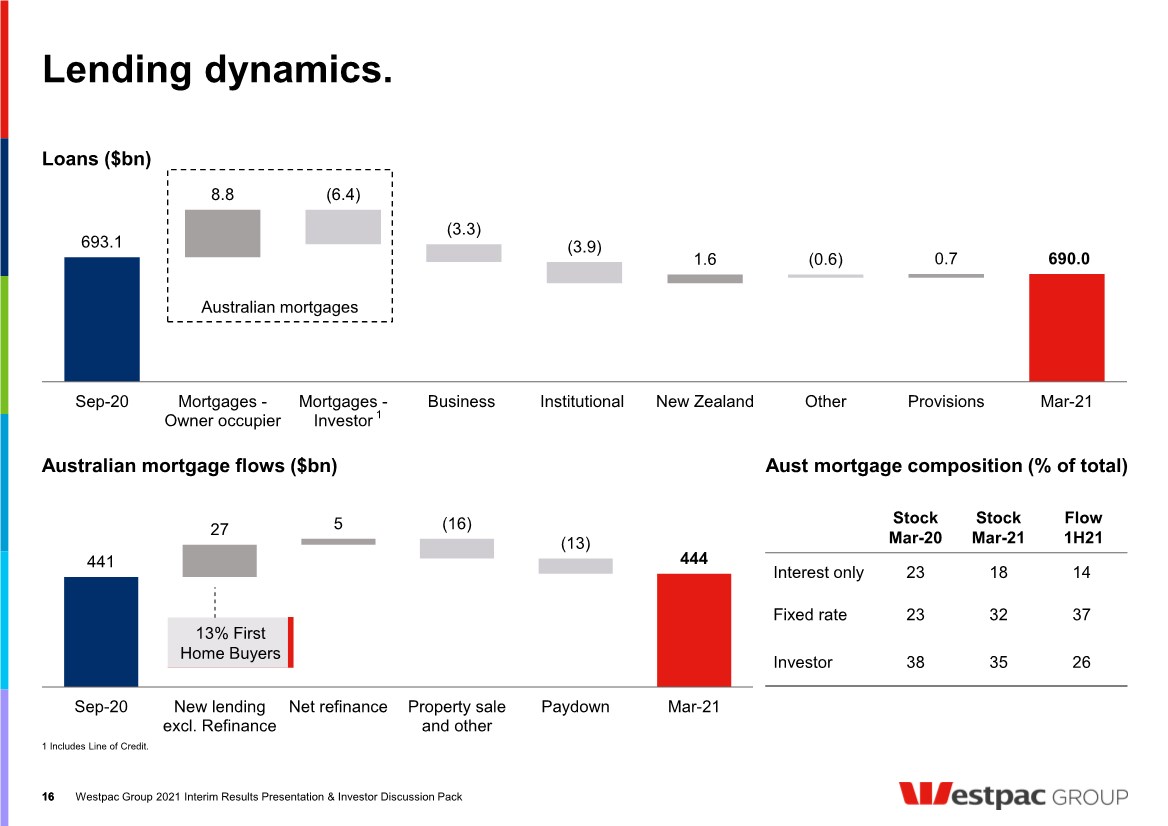
| 441 27 5 444 (16) (13) Sep-20 New lending excl. Refinance Net refinance Property sale and other Paydown Mar-21 Lending dynamics. Westpac Group 2021 Interim Results Presentation & Investor Discussion Pack Australian mortgage flows ($bn) Loans ($bn) 1 Includes Line of Credit. 16 690.0 693.1 8.8 1.6 0.7 (6.4) (3.3) (3.9) (0.6) Sep-20 Mortgages - Owner occupier Mortgages - Investor Business Institutional New Zealand Other Provisions Mar-21 13% First Home Buyers 1 Stock Mar-20 Stock Mar-21 Flow 1H21 Interest only 23 18 14 Fixed rate 23 32 37 Investor 38 35 26 Aust mortgage composition (% of total) Australian mortgages 16 |
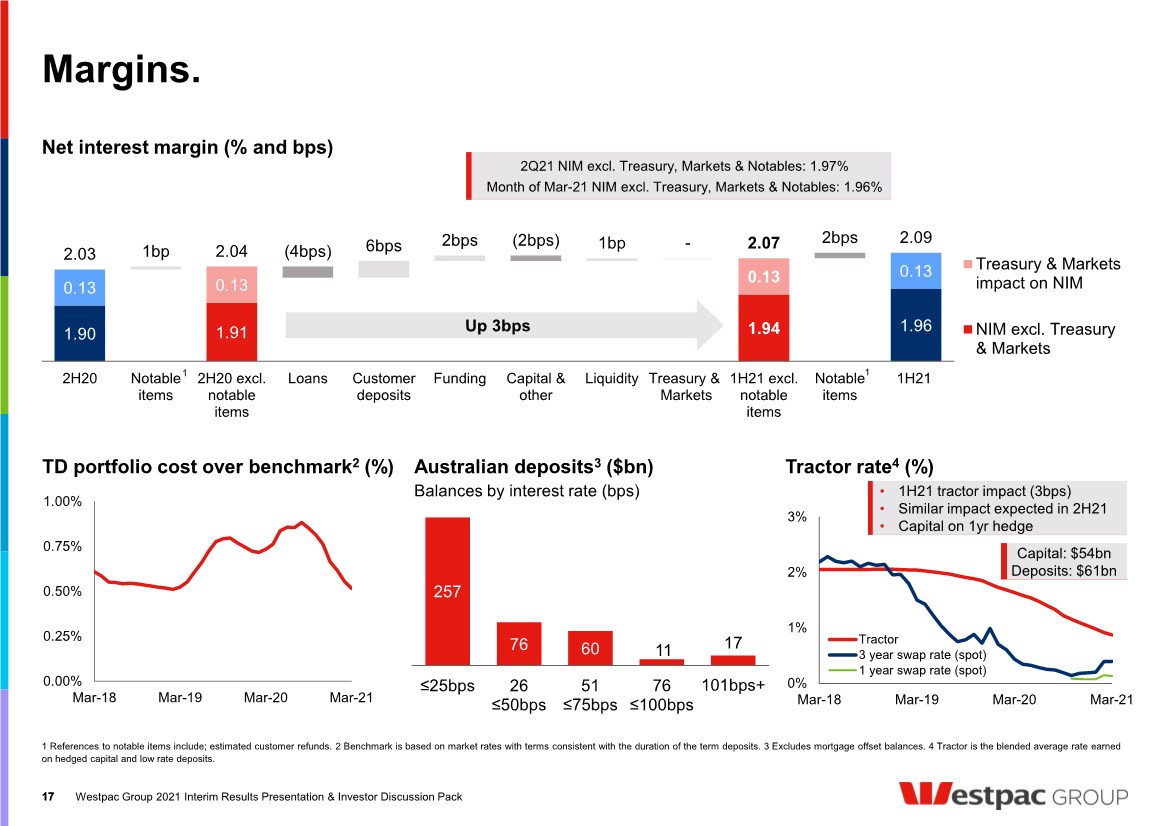
| 1.90 1.91 1.94 1.96 0.13 0.13 0.13 0.13 2.03 1bp 2.04 (4bps) 6bps 2bps (2bps) 1bp - 2.07 2bps 2.09 2H20 Notable items 2H20 excl. notable items Loans Customer deposits Funding Capital & other Liquidity Treasury & Markets 1H21 excl. notable items Notable items 1H21 Treasury & Markets impact on NIM NIM excl. Treasury & Markets 0% 1% 2% 3% Mar-18 Mar-19 Mar-20 Mar-21 Tractor 3 year swap rate (spot) 1 year swap rate (spot) Margins. Westpac Group 2021 Interim Results Presentation & Investor Discussion Pack Net interest margin (% and bps) Tractor rate4 (%) Australian deposits3 ($bn) 1 References to notable items include; estimated customer refunds. 2 Benchmark is based on market rates with terms consistent with the duration of the term deposits. 3 Excludes mortgage offset balances. 4 Tractor is the blended average rate earned on hedged capital and low rate deposits. Up 3bps • 1H21 tractor impact (3bps) • Similar impact expected in 2H21 • Capital on 1yr hedge 17 TD portfolio cost over benchmark2 (%) Capital: $54bn Deposits: $61bn 2Q21 NIM excl. Treasury, Markets & Notables: 1.97% Month of Mar-21 NIM excl. Treasury, Markets & Notables: 1.96% 0.00% 0.25% 0.50% 0.75% 1.00% Mar-18 Mar-19 Mar-20 Mar-21 257 76 60 11 17 ≤25bps 26 ≤50bps 51 ≤75bps 76 ≤100bps 101bps+ Balances by interest rate (bps) 1 1 17 |
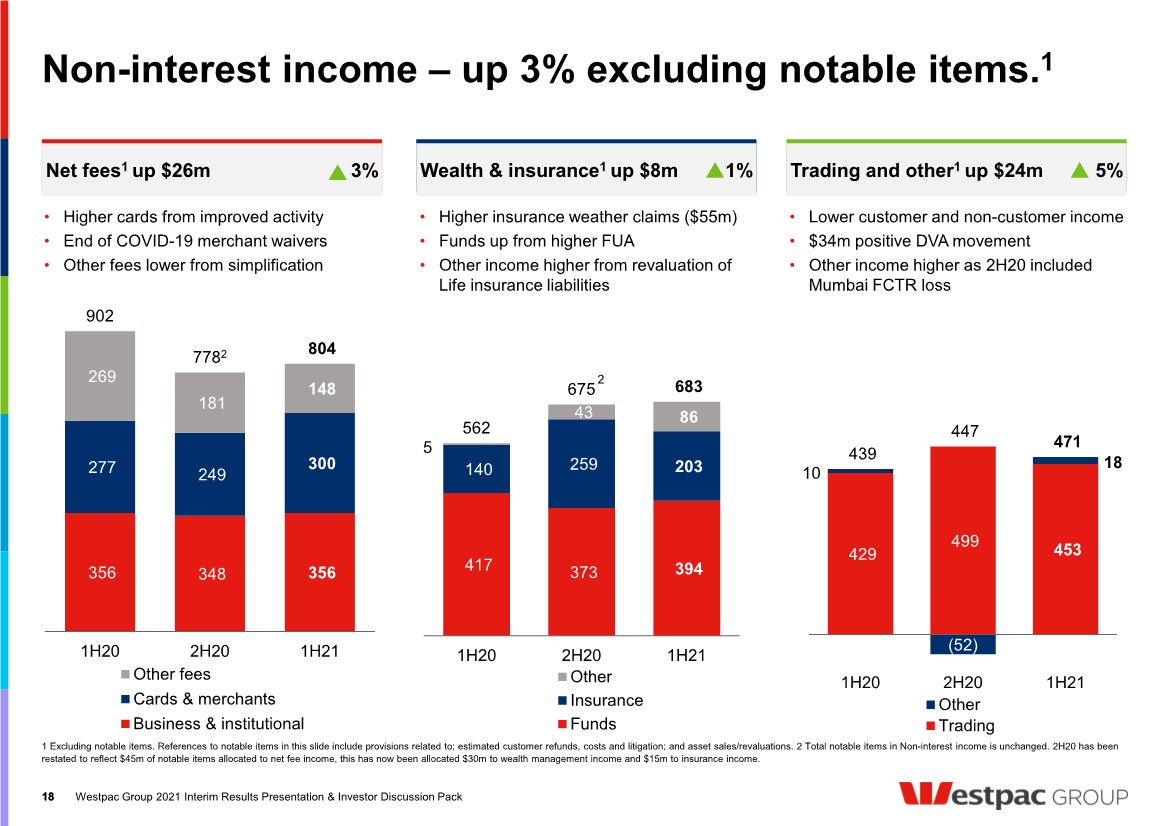
| 429 499 453 10 (52) 18 439 447 471 1H20 2H20 1H21 Other Trading 356 348 356 277 249 300 269 181 148 902 7782 804 1H20 2H20 1H21 Other fees Cards & merchants Business & institutional 417 373 394 140 259 203 5 43 86 562 675 683 1H20 2H20 1H21 Other Insurance Funds Non-interest income – up 3% excluding notable items.1 Westpac Group 2021 Interim Results Presentation & Investor Discussion Pack • Higher insurance weather claims ($55m) • Funds up from higher FUA • Other income higher from revaluation of Life insurance liabilities • Lower customer and non-customer income • $34m positive DVA movement • Other income higher as 2H20 included Mumbai FCTR loss • Higher cards from improved activity • End of COVID-19 merchant waivers • Other fees lower from simplification 1 Excluding notable items. References to notable items in this slide include provisions related to; estimated customer refunds, costs and litigation; and asset sales/revaluations. 2 Total notable items in Non-interest income is unchanged. 2H20 has been restated to reflect $45m of notable items allocated to net fee income, this has now been allocated $30m to wealth management income and $15m to insurance income. 18 Net fees1 up $26m 3% Wealth & insurance1 up $8m 1% Trading and other1 up $24m 5% 2 18 |
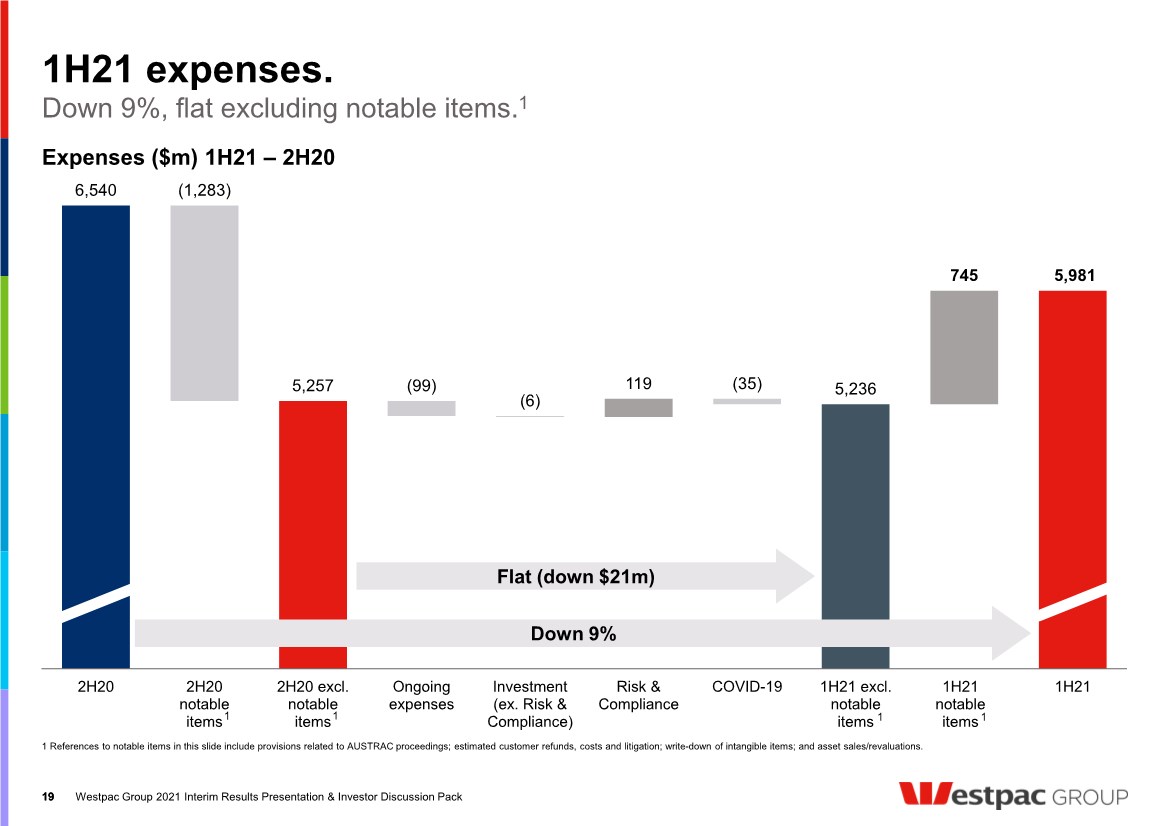
| 6,540 5,257 119 5,236 745 (1,283) (99) (6) (35) 5,981 2H20 2H20 notable items 2H20 excl. notable items Ongoing expenses Investment (ex. Risk & Compliance) Risk & Compliance COVID-19 1H21 excl. notable items 1H21 notable items 1H21 1H21 expenses. 1 References to notable items in this slide include provisions related to AUSTRAC proceedings; estimated customer refunds, costs and litigation; write-down of intangible items; and asset sales/revaluations. Westpac Group 2021 Interim Results Presentation & Investor Discussion Pack Expenses ($m) 1H21 – 2H20 Down 9%, flat excluding notable items.1 Flat (down $21m) 1 19 1 1 Down 9% 1 19 |
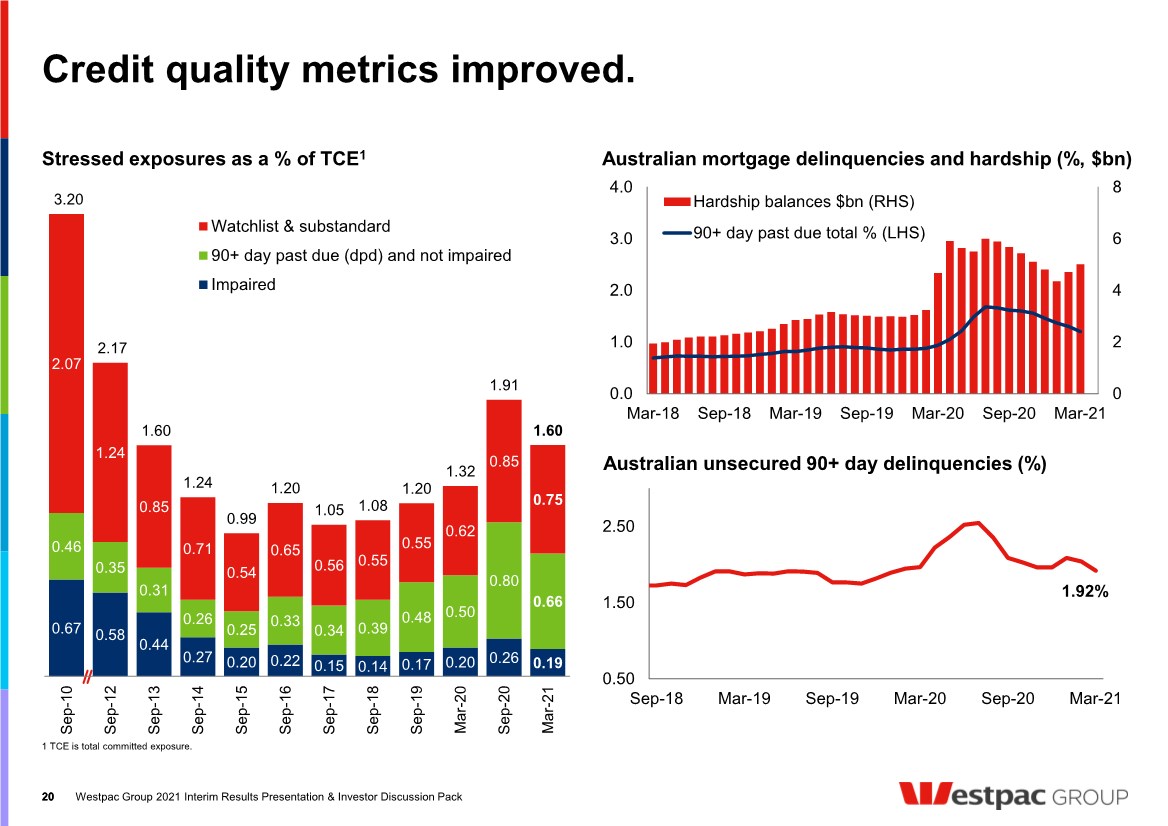
| Credit quality metrics improved. Westpac Group 2021 Interim Results Presentation & Investor Discussion Pack 1 TCE is total committed exposure. Stressed exposures as a % of TCE1 Australian mortgage delinquencies and hardship (%, $bn) Australian unsecured 90+ day delinquencies (%) 20 0 2 4 6 8 0.0 1.0 2.0 3.0 4.0 Mar-18 Sep-18 Mar-19 Sep-19 Mar-20 Sep-20 Mar-21 Hardship balances $bn (RHS) 90+ day past due total % (LHS) 0.67 0.58 0.44 0.27 0.20 0.22 0.15 0.14 0.17 0.20 0.26 0.19 0.46 0.35 0.31 0.26 0.25 0.33 0.34 0.39 0.48 0.50 0.80 0.66 2.07 1.24 0.85 0.71 0.54 0.65 0.56 0.55 0.55 0.62 0.85 0.75 3.20 2.17 1.60 1.24 0.99 1.20 1.05 1.08 1.20 1.32 1.91 1.60 Sep-10 Sep-12 Sep-13 Sep-14 Sep-15 Sep-16 Sep-17 Sep-18 Sep-19 Mar-20 Sep-20 Mar-21 Watchlist & substandard 90+ day past due (dpd) and not impaired Impaired 0.50 1.50 2.50 Sep-18 Mar-19 Sep-19 Mar-20 Sep-20 Mar-21 1.92% 20 |
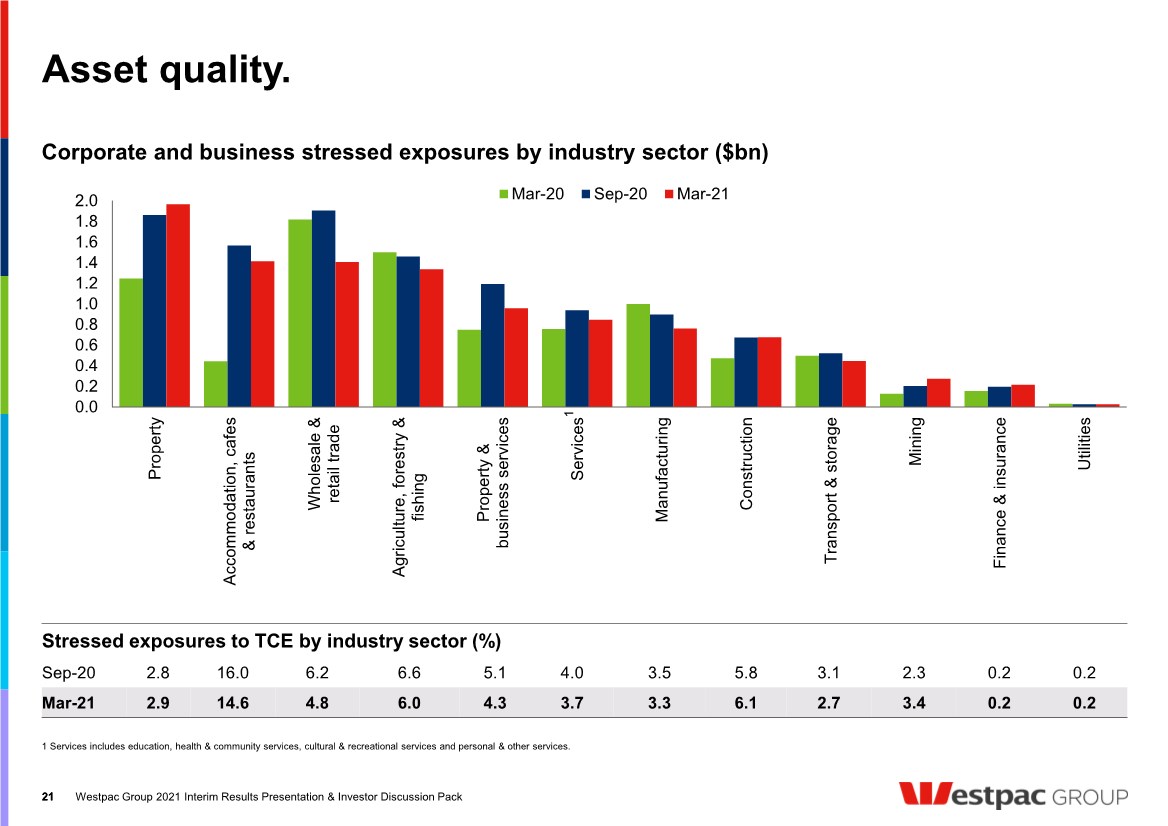
| Asset quality. Westpac Group 2021 Interim Results Presentation & Investor Discussion Pack 21 1 Services includes education, health & community services, cultural & recreational services and personal & other services. 0.0 0.2 0.4 0.6 0.8 1.0 1.2 1.4 1.6 1.8 2.0 Property Accommodation, cafes & restaurants Wholesale & retail trade Agriculture, forestry & fishing Property & business services Services Manufacturing Construction Transport & storage Mining Finance & insurance Utilities Mar-20 Sep-20 Mar-21 Corporate and business stressed exposures by industry sector ($bn) Stressed exposures to TCE by industry sector (%) Sep-20 2.8 16.0 6.2 6.6 5.1 4.0 3.5 5.8 3.1 2.3 0.2 0.2 Mar-21 2.9 14.6 4.8 6.0 4.3 3.7 3.3 6.1 2.7 3.4 0.2 0.2 1 21 |
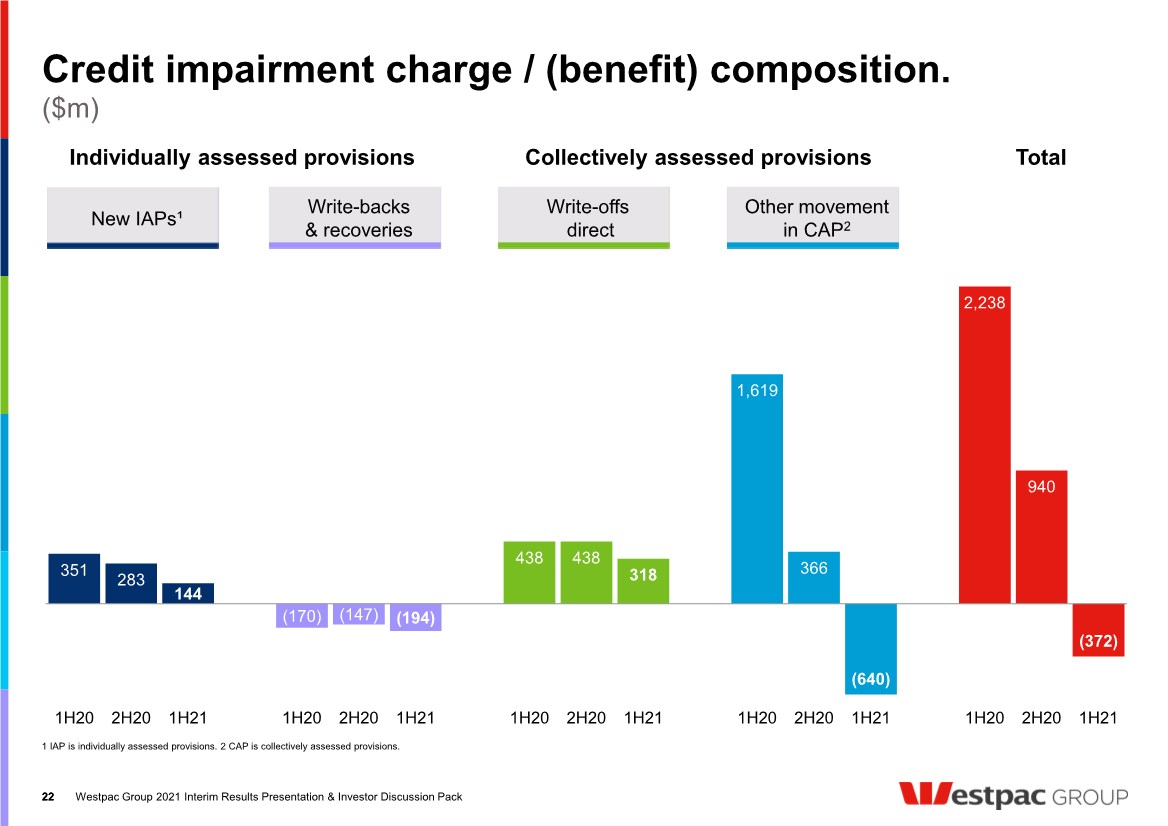
| 351 283 144 (170) (147) (194) 438 438 318 1,619 366 (640) 2,238 940 (372) 1H20 2H20 1H21 1H20 2H20 1H21 1H20 2H20 1H21 1H20 2H20 1H21 1H20 2H20 1H21 Credit impairment charge / (benefit) composition. Westpac Group 2021 Interim Results Presentation & Investor Discussion Pack Individually assessed provisions ($m) Collectively assessed provisions Total 1 IAP is individually assessed provisions. 2 CAP is collectively assessed provisions. 22 New IAPs¹ Write-backs & recoveries Write-offs direct Other movement in CAP2 22 |
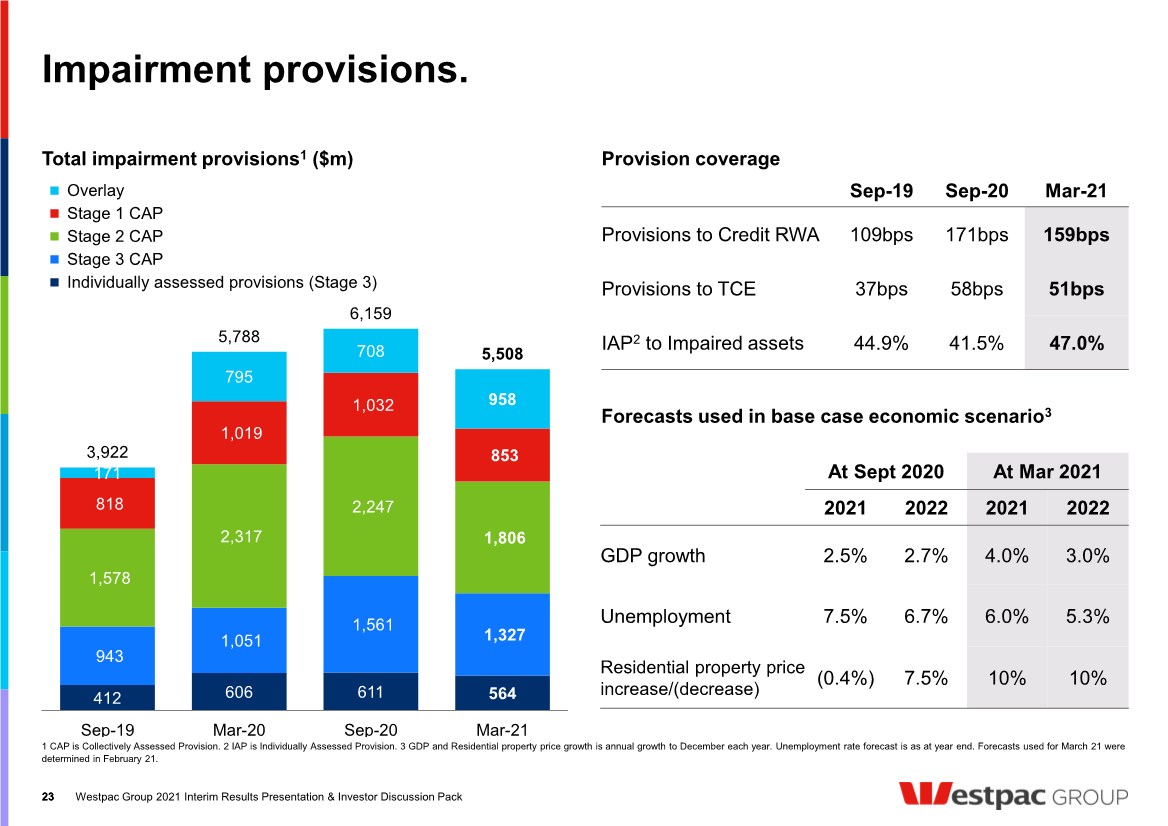
| Impairment provisions. Westpac Group 2021 Interim Results Presentation & Investor Discussion Pack At Sept 2020 At Mar 2021 2021 2022 2021 2022 GDP growth 2.5% 2.7% 4.0% 3.0% Unemployment 7.5% 6.7% 6.0% 5.3% Residential property price increase/(decrease) (0.4%) 7.5% 10% 10% Forecasts used in base case economic scenario3 1 CAP is Collectively Assessed Provision. 2 IAP is Individually Assessed Provision. 3 GDP and Residential property price growth is annual growth to December each year. Unemployment rate forecast is as at year end. Forecasts used for March 21 were determined in February 21. 23 412 606 611 564 943 1,051 1,561 1,327 1,578 2,317 2,247 1,806 818 1,019 1,032 853 171 795 708 958 3,922 5,788 6,159 5,508 Sep-19 Mar-20 Sep-20 Mar-21 Overlay Stage 1 CAP Stage 2 CAP Stage 3 CAP Individually assessed provisions (Stage 3) Total impairment provisions1 ($m) Provision coverage Sep-19 Sep-20 Mar-21 Provisions to Credit RWA 109bps 171bps 159bps Provisions to TCE 37bps 58bps 51bps IAP2 to Impaired assets 44.9% 41.5% 47.0% 23 |
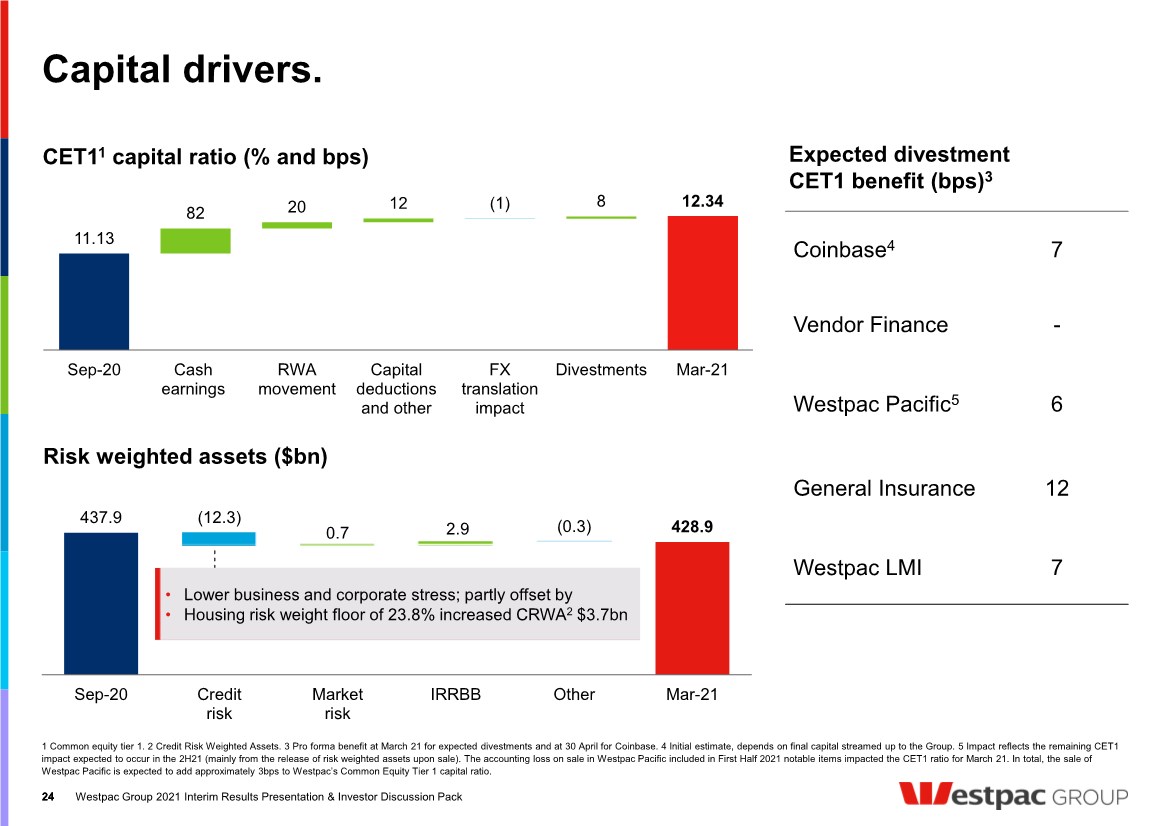
| 437.9 0.7 2.9 428.9 (12.3) (0.3) Sep-20 Credit risk Market risk IRRBB Other Mar-21 Capital drivers. Westpac Group 2021 Interim Results Presentation & Investor Discussion Pack 1 Common equity tier 1. 2 Credit Risk Weighted Assets. 3 Pro forma benefit at March 21 for expected divestments and at 30 April for Coinbase. 4 Initial estimate, depends on final capital streamed up to the Group. 5 Impact reflects the remaining CET1 impact expected to occur in the 2H21 (mainly from the release of risk weighted assets upon sale). The accounting loss on sale in Westpac Pacific included in First Half 2021 notable items impacted the CET1 ratio for March 21. In total, the sale of Westpac Pacific is expected to add approximately 3bps to Westpac’s Common Equity Tier 1 capital ratio. 24 CET11 capital ratio (% and bps) 11.13 82 20 12 8 12.34 (1) Sep-20 Cash earnings RWA movement Capital deductions and other FX translation impact Divestments Mar-21 Risk weighted assets ($bn) Coinbase4 7 Vendor Finance - Westpac Pacific5 6 General Insurance 12 Westpac LMI 7 Expected divestment CET1 benefit (bps)3 • Lower business and corporate stress; partly offset by • Housing risk weight floor of 23.8% increased CRWA2 $3.7bn 24 |
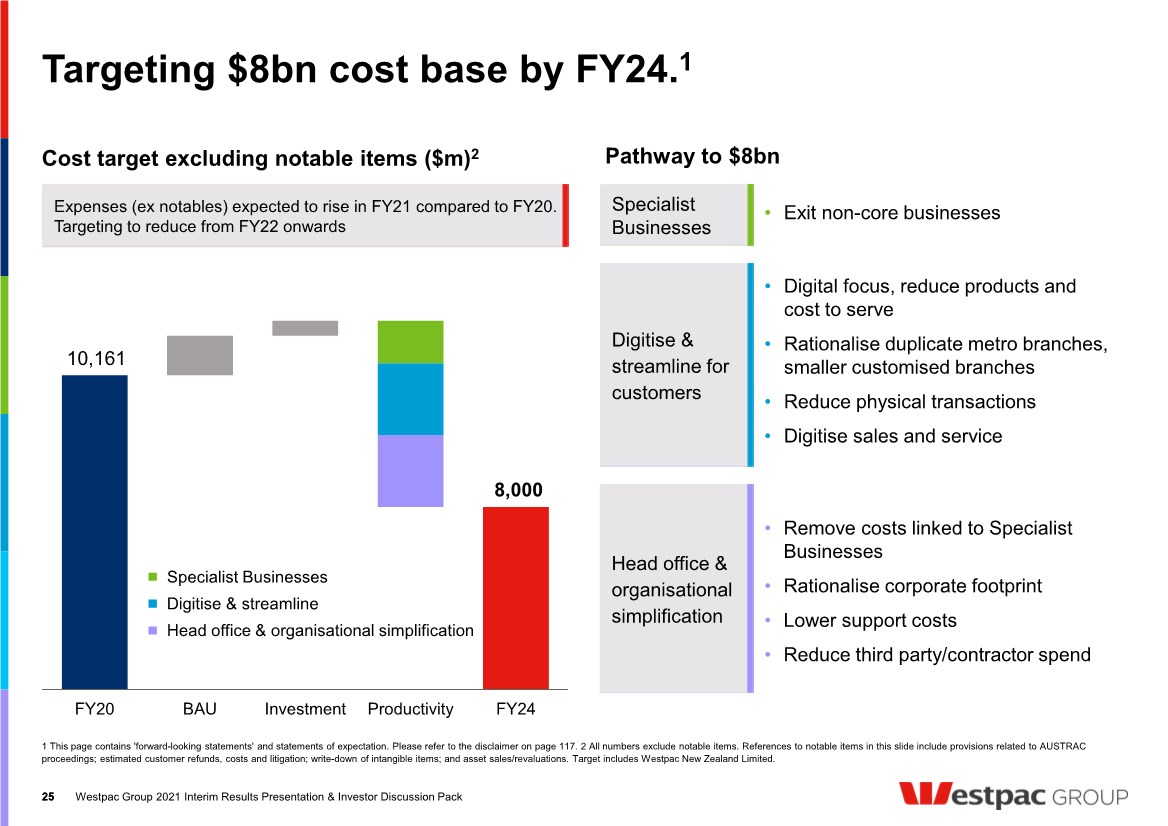
| Targeting $8bn cost base by FY24.1 Westpac Group 2021 Interim Results Presentation & Investor Discussion Pack 1 This page contains 'forward-looking statements' and statements of expectation. Please refer to the disclaimer on page 117. 2 All numbers exclude notable items. References to notable items in this slide include provisions related to AUSTRAC proceedings; estimated customer refunds, costs and litigation; write-down of intangible items; and asset sales/revaluations. Target includes Westpac New Zealand Limited. Cost target excluding notable items ($m)2 10,161 8,000 FY20 BAU Investment Productivity FY24 Expenses (ex notables) expected to rise in FY21 compared to FY20. Targeting to reduce from FY22 onwards 25 Pathway to $8bn • Exit non-core businesses • Digital focus, reduce products and cost to serve • Rationalise duplicate metro branches, smaller customised branches • Reduce physical transactions • Digitise sales and service • Remove costs linked to Specialist Businesses • Rationalise corporate footprint • Lower support costs • Reduce third party/contractor spend Specialist Businesses Digitise & streamline for customers Head office & organisational simplification Digitise & streamline Specialist Businesses Head office & organisational simplification 25 |
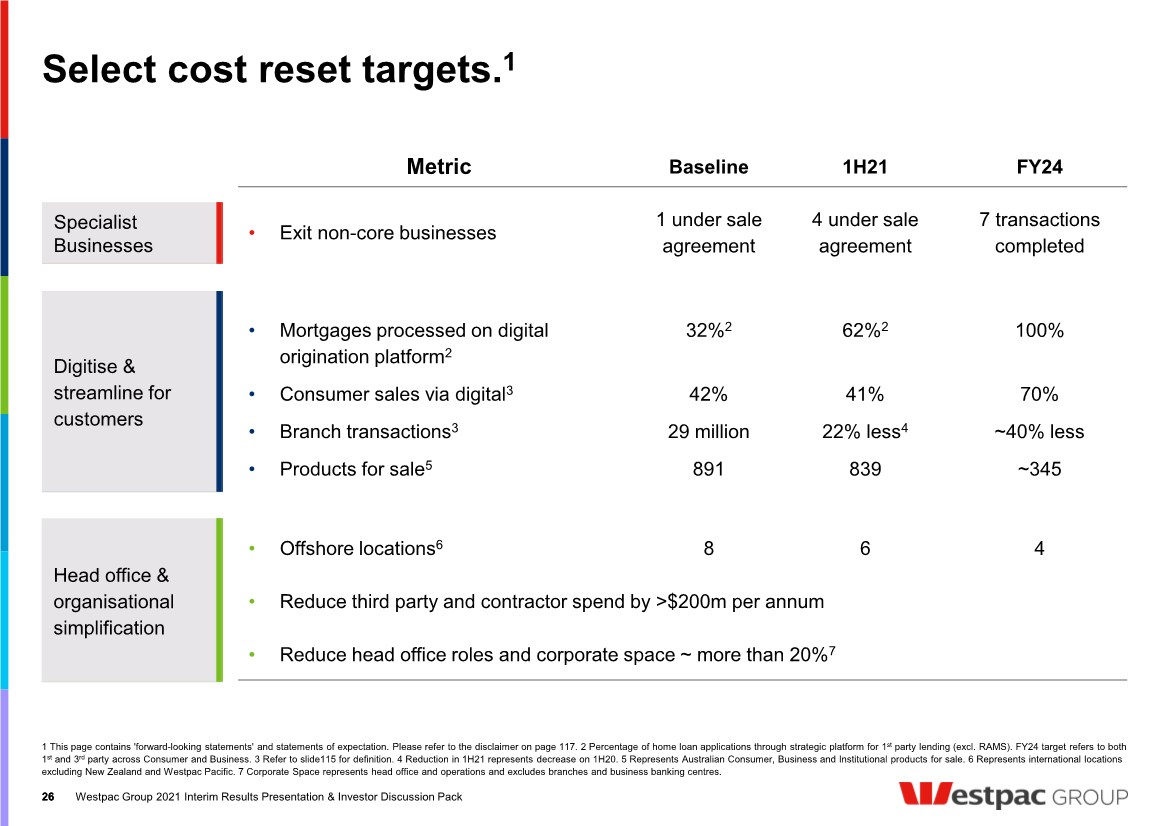
| Select cost reset targets.1 Westpac Group 2021 Interim Results Presentation & Investor Discussion Pack 1 This page contains 'forward-looking statements' and statements of expectation. Please refer to the disclaimer on page 117. 2 Percentage of home loan applications through strategic platform for 1st party lending (excl. RAMS). FY24 target refers to both 1st and 3rd party across Consumer and Business. 3 Refer to slide115 for definition. 4 Reduction in 1H21 represents decrease on 1H20. 5 Represents Australian Consumer, Business and Institutional products for sale. 6 Represents international locations excluding New Zealand and Westpac Pacific. 7 Corporate Space represents head office and operations and excludes branches and business banking centres. Metric Baseline 1H21 FY24 • Exit non-core businesses 1 under sale agreement 4 under sale agreement 7 transactions completed • Mortgages processed on digital origination platform2 • Consumer sales via digital3 • Branch transactions3 • Products for sale5 32%2 42% 29 million 891 62%2 41% 22% less4 839 100% 70% ~40% less ~345 • Offshore locations6 8 6 4 • Reduce third party and contractor spend by >$200m per annum • Reduce head office roles and corporate space ~ more than 20%7 26 Specialist Businesses Digitise & streamline for customers Head office & organisational simplification 26 |
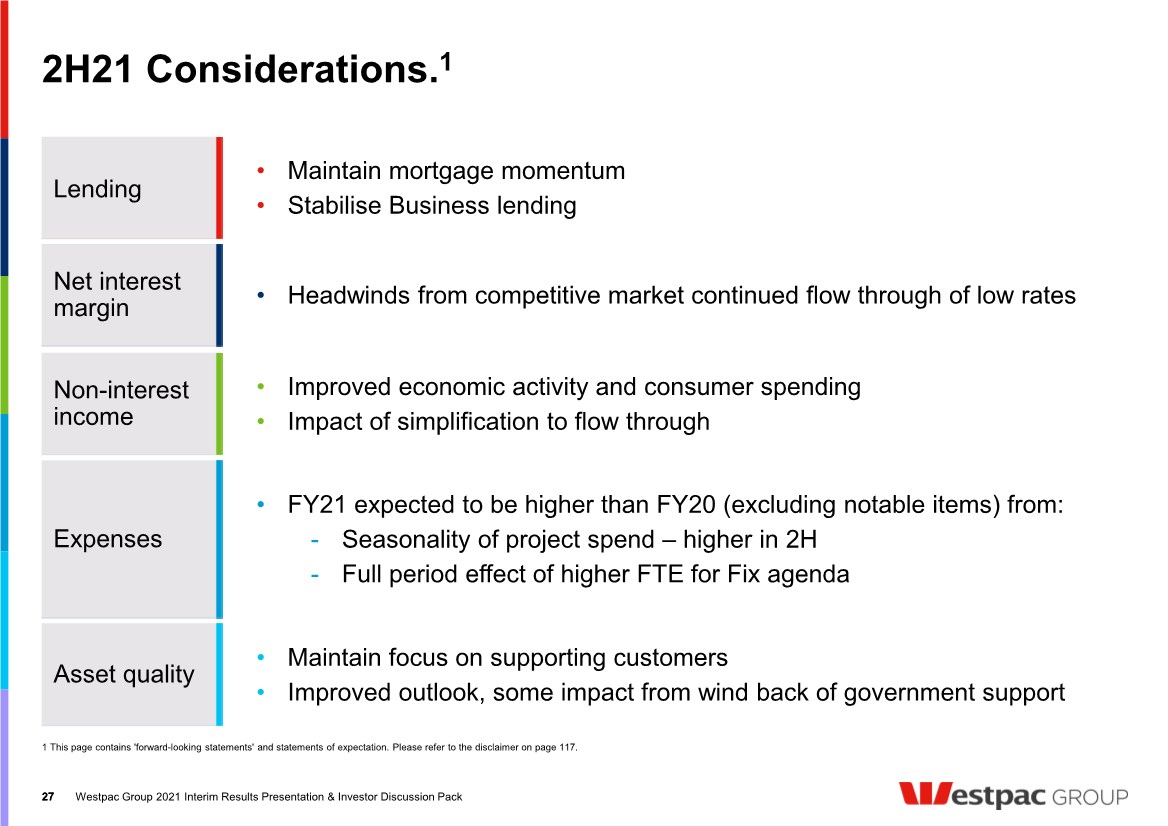
| 2H21 Considerations.1 1 This page contains 'forward-looking statements' and statements of expectation. Please refer to the disclaimer on page 117. Westpac Group 2021 Interim Results Presentation & Investor Discussion Pack 27 Lending • Maintain mortgage momentum • Stabilise Business lending Net interest margin • Headwinds from competitive market continued flow through of low rates Non-interest income • Improved economic activity and consumer spending • Impact of simplification to flow through Expenses • FY21 expected to be higher than FY20 (excluding notable items) from: - Seasonality of project spend – higher in 2H - Full period effect of higher FTE for Fix agenda Asset quality • Maintain focus on supporting customers • Improved outlook, some impact from wind back of government support 27 |
| Financial results throughout this presentation are in Australian dollars and are based on cash earnings unless otherwise stated. Refer page 30 for definition. Results principally cover the 1H20, 2H19 and 1H19 periods. Comparison of 1H20 versus 2H19 (unless otherwise stated). Peter King Chief Executive Officer |

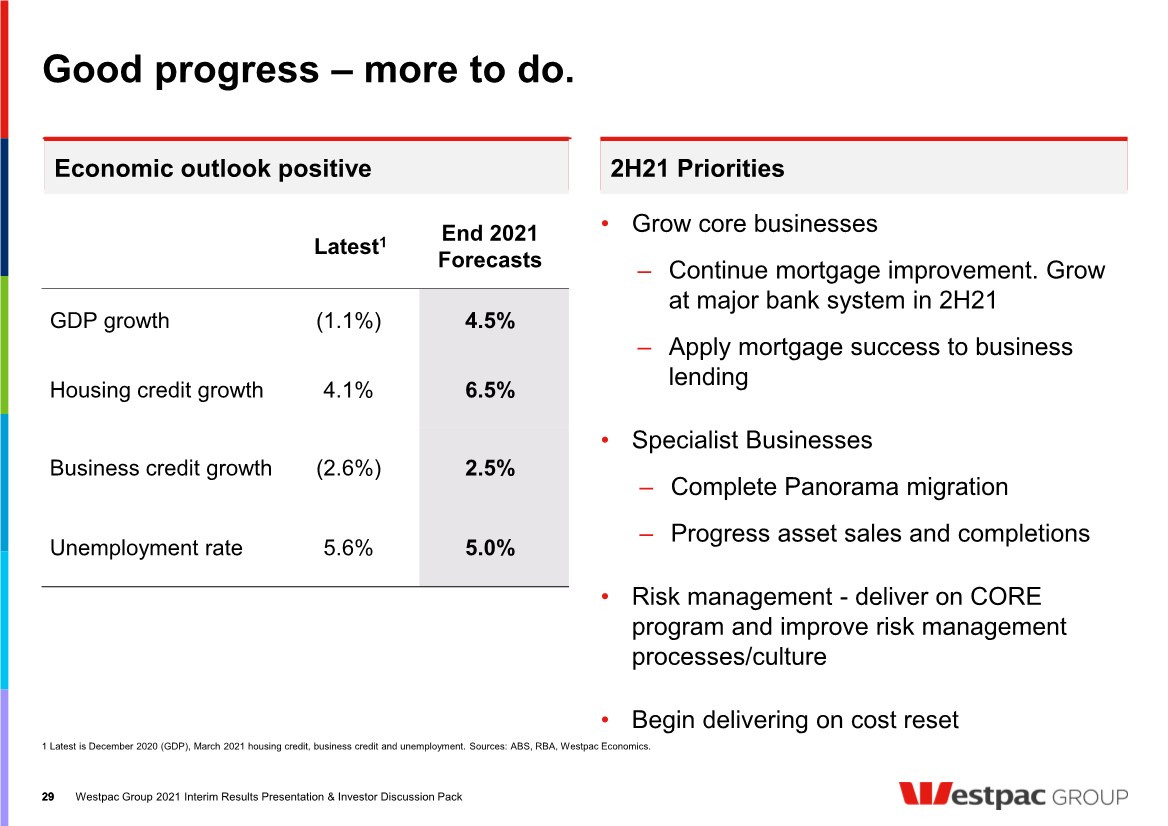
| Good progress – more to do. 1 Latest is December 2020 (GDP), March 2021 housing credit, business credit and unemployment. Sources: ABS, RBA, Westpac Economics. Westpac Group 2021 Interim Results Presentation & Investor Discussion Pack 29 Economic outlook positive 2H21 Priorities • Grow core businesses ‒ Continue mortgage improvement. Grow at major bank system in 2H21 ‒ Apply mortgage success to business lending • Specialist Businesses ‒ Complete Panorama migration ‒ Progress asset sales and completions • Risk management - deliver on CORE program and improve risk management processes/culture • Begin delivering on cost reset Latest1 End 2021 Forecasts GDP growth (1.1%) 4.5% Housing credit growth 4.1% 6.5% Business credit growth (2.6%) 2.5% Unemployment rate 5.6% 5.0% 29 |
| Investor Discussion Pack Fix. Simplify. Perform. |

| Overview |
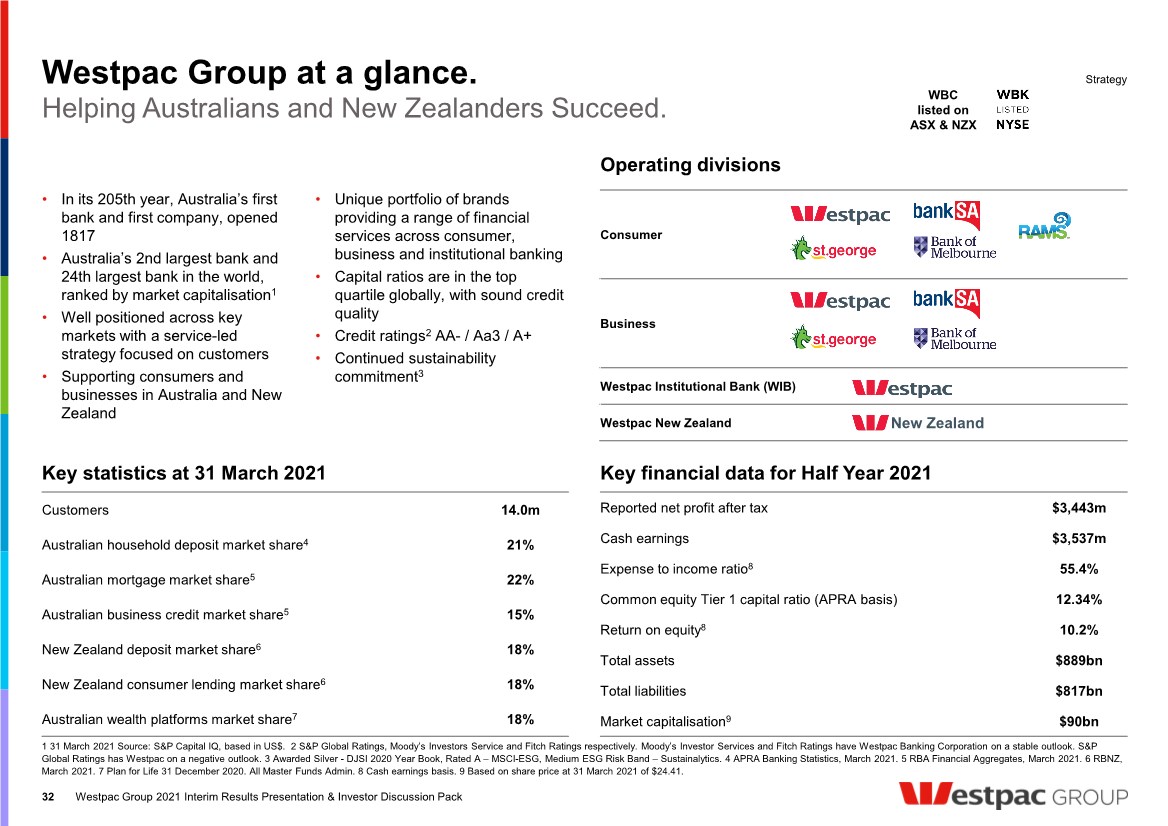
| Westpac Group at a glance. 32 • In its 205th year, Australia’s first bank and first company, opened 1817 • Australia’s 2nd largest bank and 24th largest bank in the world, ranked by market capitalisation1 • Well positioned across key markets with a service-led strategy focused on customers • Supporting consumers and businesses in Australia and New Zealand • Unique portfolio of brands providing a range of financial services across consumer, business and institutional banking • Capital ratios are in the top quartile globally, with sound credit quality • Credit ratings2 AA- / Aa3 / A+ • Continued sustainability commitment3 Operating divisions Consumer Business Westpac Institutional Bank (WIB) Westpac New Zealand Key statistics at 31 March 2021 Customers 14.0m Australian household deposit market share4 21% Australian mortgage market share5 22% Australian business credit market share5 15% New Zealand deposit market share6 18% New Zealand consumer lending market share6 18% Australian wealth platforms market share7 18% Key financial data for Half Year 2021 Reported net profit after tax $3,443m Cash earnings $3,537m Expense to income ratio8 55.4% Common equity Tier 1 capital ratio (APRA basis) 12.34% Return on equity8 10.2% Total assets $889bn Total liabilities $817bn Market capitalisation9 $90bn Helping Australians and New Zealanders Succeed. 1 31 March 2021 Source: S&P Capital IQ, based in US$. 2 S&P Global Ratings, Moody’s Investors Service and Fitch Ratings respectively. Moody’s Investor Services and Fitch Ratings have Westpac Banking Corporation on a stable outlook. S&P Global Ratings has Westpac on a negative outlook. 3 Awarded Silver - DJSI 2020 Year Book, Rated A – MSCI-ESG, Medium ESG Risk Band – Sustainalytics. 4 APRA Banking Statistics, March 2021. 5 RBA Financial Aggregates, March 2021. 6 RBNZ, March 2021. 7 Plan for Life 31 December 2020. All Master Funds Admin. 8 Cash earnings basis. 9 Based on share price at 31 March 2021 of $24.41. Strategy WBC listed on ASX & NZX New Zealand Westpac Group 2021 Interim Results Presentation & Investor Discussion Pack |
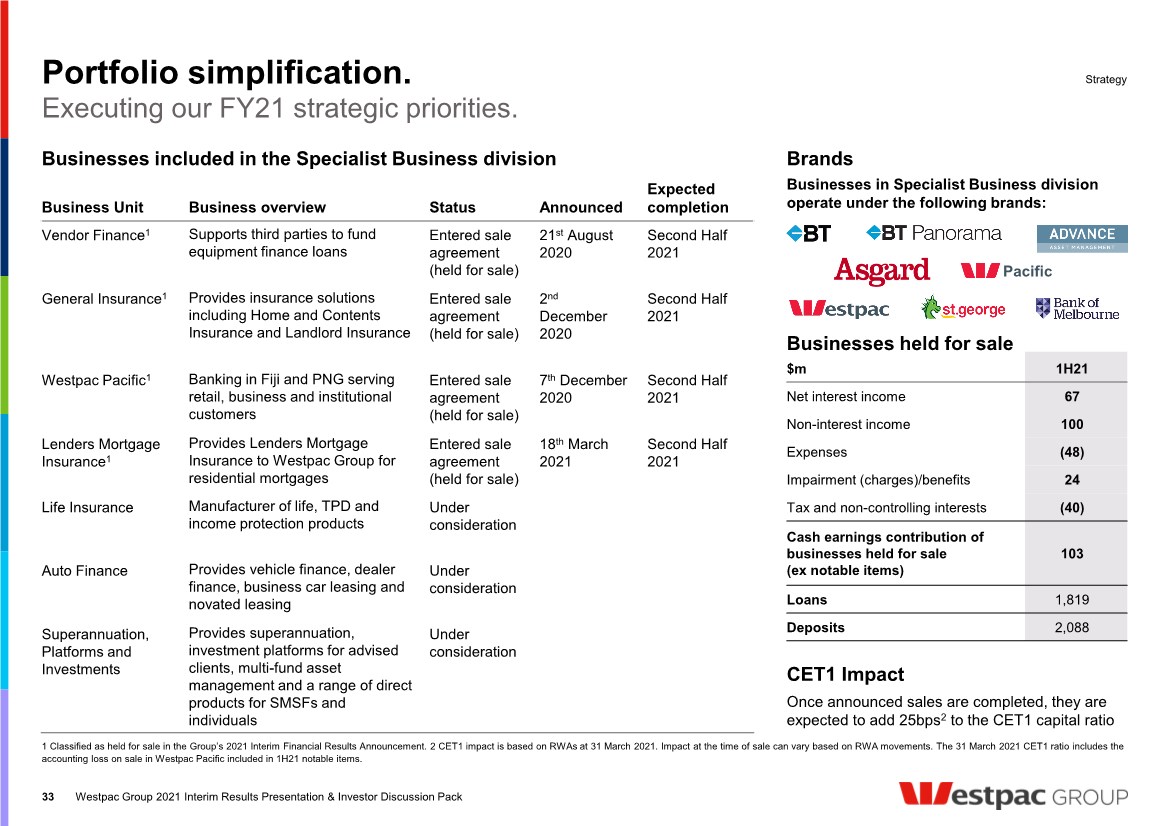
| $m 1H21 Net interest income 67 Non-interest income 100 Expenses (48) Impairment (charges)/benefits 24 Tax and non-controlling interests (40) Cash earnings contribution of businesses held for sale (ex notable items) 103 Loans 1,819 Deposits 2,088 Portfolio simplification. 33 Businesses held for sale Brands Executing our FY21 strategic priorities. 1 Classified as held for sale in the Group’s 2021 Interim Financial Results Announcement. 2 CET1 impact is based on RWAs at 31 March 2021. Impact at the time of sale can vary based on RWA movements. The 31 March 2021 CET1 ratio includes the accounting loss on sale in Westpac Pacific included in 1H21 notable items. Strategy Westpac Group 2021 Interim Results Presentation & Investor Discussion Pack Business Unit Business overview Status Announced Expected completion Vendor Finance1 Supports third parties to fund equipment finance loans Entered sale agreement (held for sale) 21st August 2020 Second Half 2021 General Insurance1 Provides insurance solutions including Home and Contents Insurance and Landlord Insurance Entered sale agreement (held for sale) 2nd December 2020 Second Half 2021 Westpac Pacific1 Banking in Fiji and PNG serving retail, business and institutional customers Entered sale agreement (held for sale) 7th December 2020 Second Half 2021 Lenders Mortgage Insurance1 Provides Lenders Mortgage Insurance to Westpac Group for residential mortgages Entered sale agreement (held for sale) 18th March 2021 Second Half 2021 Life Insurance Manufacturer of life, TPD and income protection products Under consideration Auto Finance Provides vehicle finance, dealer finance, business car leasing and novated leasing Under consideration Superannuation, Platforms and Investments Provides superannuation, investment platforms for advised clients, multi-fund asset management and a range of direct products for SMSFs and individuals Under consideration Businesses in Specialist Business division operate under the following brands: Pacific CET1 Impact Once announced sales are completed, they are expected to add 25bps2 to the CET1 capital ratio Businesses included in the Specialist Business division |
| 85 15 Group ex Westpac NZ Westpac NZ Westpac New Zealand review. Westpac Group 2021 Interim Results Presentation & Investor Discussion Pack • Banking is increasingly a local business • BS11 – operational separation limits synergies 1H21 Cash earnings ex notables (%) Westpac is reviewing the most appropriate ownership structure for its New Zealand operations. The business has been a valuable contributor for many years. The review is ongoing. .. Strategy 34 Lending (%) 88 12 Group ex Westpac NZ Westpac NZ • Potential value uplift from two locally focused businesses • Separation and independence costs • Impact of RBNZ reviews Rationale for the review Considerations Contribution to Westpac Group Status • Regulator engagement required • Determining potential split of balance sheet in a demerger • Progressing analysis 34 |

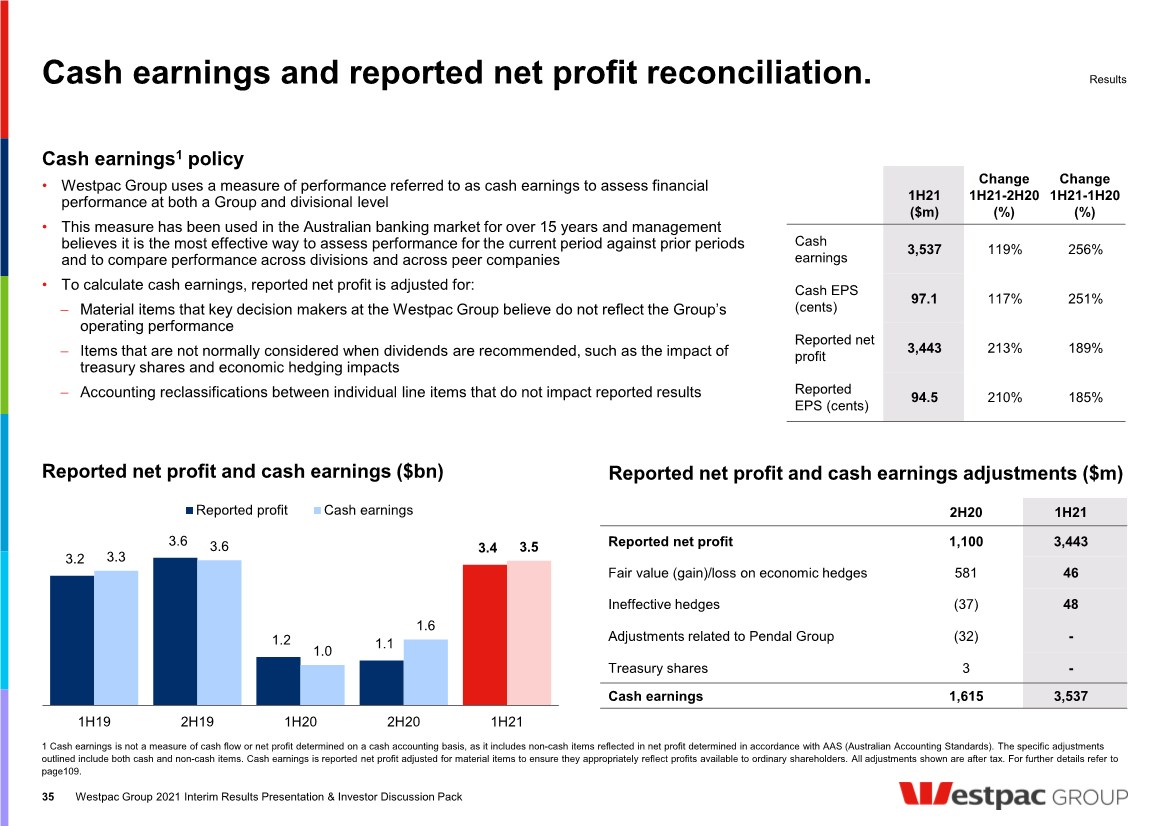
| Cash earnings and reported net profit reconciliation. 35 Reported net profit and cash earnings ($bn) Cash earnings1 policy • Westpac Group uses a measure of performance referred to as cash earnings to assess financial performance at both a Group and divisional level • This measure has been used in the Australian banking market for over 15 years and management believes it is the most effective way to assess performance for the current period against prior periods and to compare performance across divisions and across peer companies • To calculate cash earnings, reported net profit is adjusted for: − Material items that key decision makers at the Westpac Group believe do not reflect the Group’s operating performance − Items that are not normally considered when dividends are recommended, such as the impact of treasury shares and economic hedging impacts − Accounting reclassifications between individual line items that do not impact reported results Reported net profit and cash earnings adjustments ($m) 1 Cash earnings is not a measure of cash flow or net profit determined on a cash accounting basis, as it includes non-cash items reflected in net profit determined in accordance with AAS (Australian Accounting Standards). The specific adjustments outlined include both cash and non-cash items. Cash earnings is reported net profit adjusted for material items to ensure they appropriately reflect profits available to ordinary shareholders. All adjustments shown are after tax. For further details refer to page109. Results 3.2 3.6 1.2 1.1 3.4 3.3 3.6 1.0 1.6 3.5 1H19 2H19 1H20 2H20 1H21 Reported profit Cash earnings 1H21 ($m) Change 1H21-2H20 (%) Change 1H21-1H20 (%) Cash earnings 3,537 119% 256% Cash EPS (cents) 97.1 117% 251% Reported net profit 3,443 213% 189% Reported EPS (cents) 94.5 210% 185% 2H20 1H21 Reported net profit 1,100 3,443 Fair value (gain)/loss on economic hedges 581 46 Ineffective hedges (37) 48 Adjustments related to Pendal Group (32) - Treasury shares 3 - Cash earnings 1,615 3,537 Westpac Group 2021 Interim Results Presentation & Investor Discussion Pack |
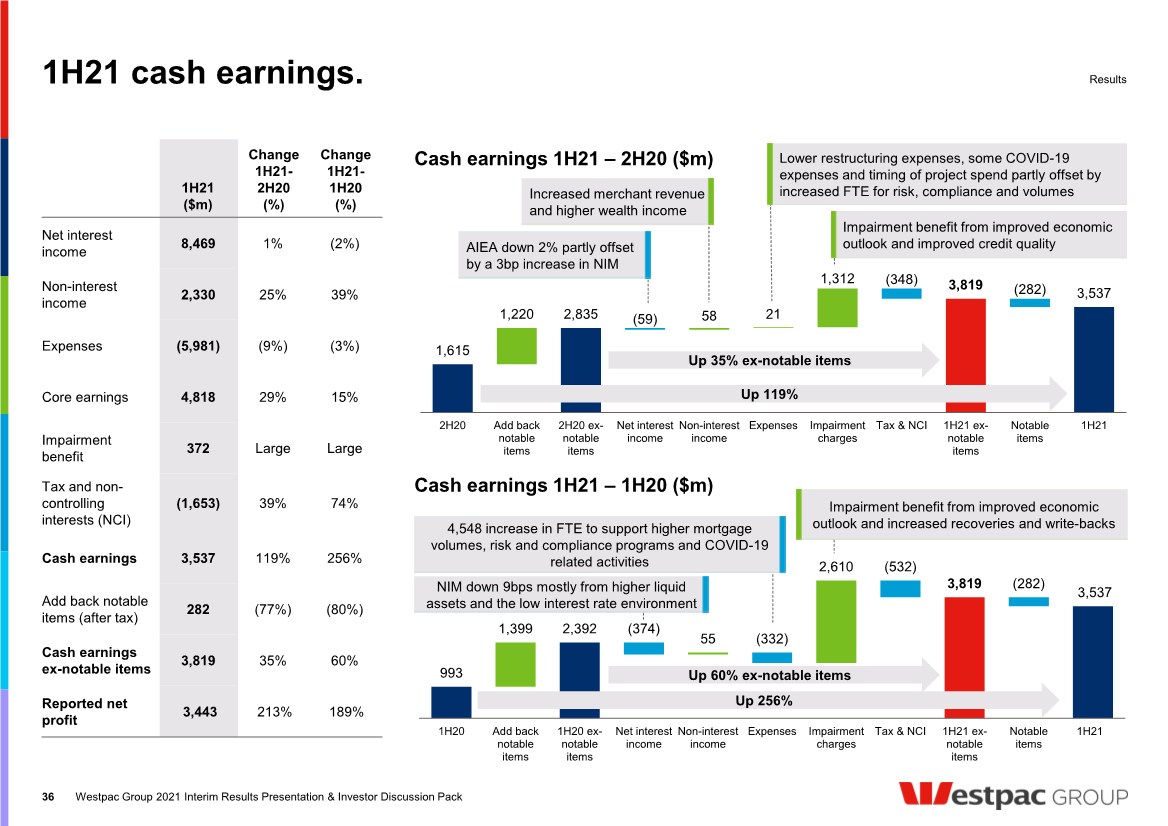
| 993 1,399 2,392 55 2,610 3,819 (374) (332) (532) (282) 3,537 1H20 Add back notable items 1H20 ex- notable items Net interest income Non-interest income Expenses Impairment charges Tax & NCI 1H21 ex- notable items Notable items 1H21 1H21 cash earnings. 36 1H21 ($m) Change 1H21- 2H20 (%) Change 1H21- 1H20 (%) Net interest income 8,469 1% (2%) Non-interest income 2,330 25% 39% Expenses (5,981) (9%) (3%) Core earnings 4,818 29% 15% Impairment benefit 372 Large Large Tax and non- controlling interests (NCI) (1,653) 39% 74% Cash earnings 3,537 119% 256% Add back notable items (after tax) 282 (77%) (80%) Cash earnings ex-notable items 3,819 35% 60% Reported net profit 3,443 213% 189% Results Cash earnings 1H21 – 1H20 ($m) Cash earnings 1H21 – 2H20 ($m) 58 21 1,312 1,615 1,220 2,835 3,819 3,537 (59) (348) (282) 2H20 Add back notable items 2H20 ex- notable items Net interest income Non-interest income Expenses Impairment charges Tax & NCI 1H21 ex- notable items Notable items 1H21 Up 119% Up 35% ex-notable items Up 256% Up 60% ex-notable items Impairment benefit from improved economic outlook and improved credit quality AIEA down 2% partly offset by a 3bp increase in NIM Increased merchant revenue and higher wealth income Westpac Group 2021 Interim Results Presentation & Investor Discussion Pack Lower restructuring expenses, some COVID-19 expenses and timing of project spend partly offset by increased FTE for risk, compliance and volumes NIM down 9bps mostly from higher liquid assets and the low interest rate environment Impairment benefit from improved economic outlook and increased recoveries and write-backs 4,548 increase in FTE to support higher mortgage volumes, risk and compliance programs and COVID-19 related activities |
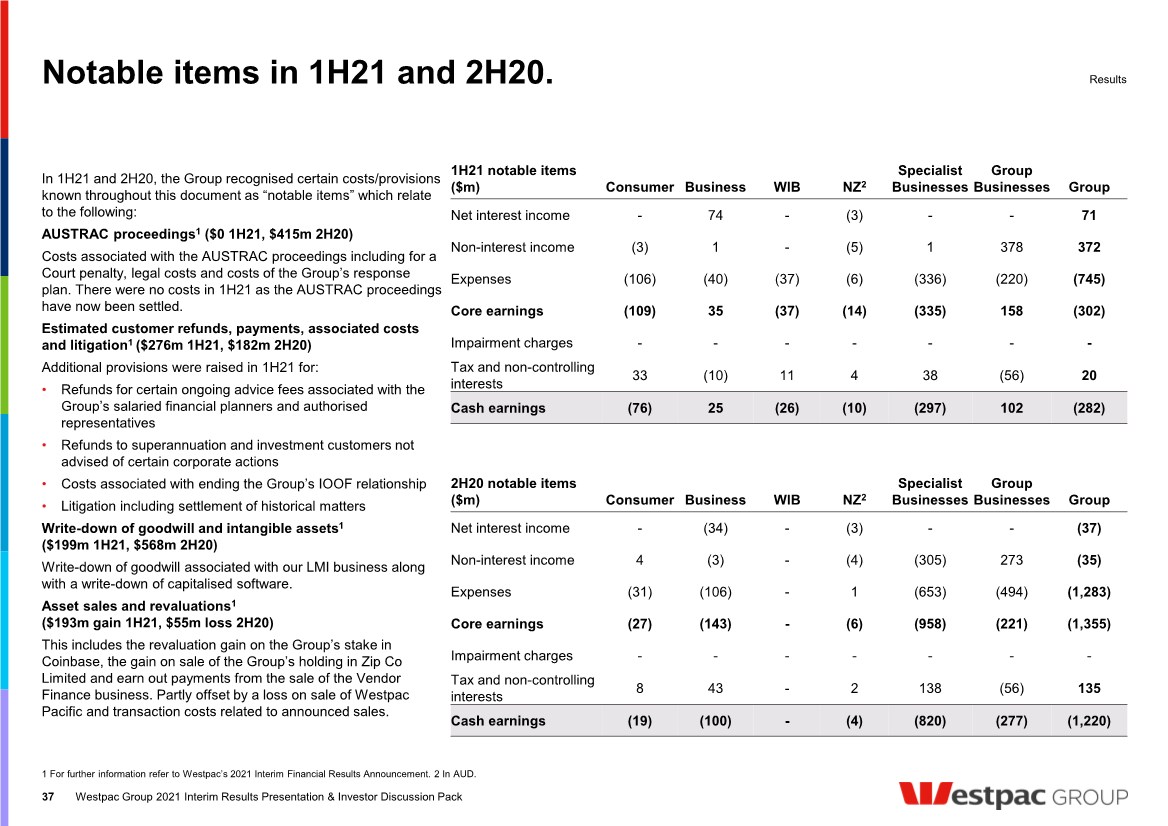
| Notable items in 1H21 and 2H20. 37 In 1H21 and 2H20, the Group recognised certain costs/provisions known throughout this document as “notable items” which relate to the following: AUSTRAC proceedings1 ($0 1H21, $415m 2H20) Costs associated with the AUSTRAC proceedings including for a Court penalty, legal costs and costs of the Group’s response plan. There were no costs in 1H21 as the AUSTRAC proceedings have now been settled. Estimated customer refunds, payments, associated costs and litigation1 ($276m 1H21, $182m 2H20) Additional provisions were raised in 1H21 for: • Refunds for certain ongoing advice fees associated with the Group’s salaried financial planners and authorised representatives • Refunds to superannuation and investment customers not advised of certain corporate actions • Costs associated with ending the Group’s IOOF relationship • Litigation including settlement of historical matters Write-down of goodwill and intangible assets1 ($199m 1H21, $568m 2H20) Write-down of goodwill associated with our LMI business along with a write-down of capitalised software. Asset sales and revaluations1 ($193m gain 1H21, $55m loss 2H20) This includes the revaluation gain on the Group’s stake in Coinbase, the gain on sale of the Group’s holding in Zip Co Limited and earn out payments from the sale of the Vendor Finance business. Partly offset by a loss on sale of Westpac Pacific and transaction costs related to announced sales. 1H21 notable items ($m) Consumer Business WIB NZ2 Specialist Businesses Group Businesses Group Net interest income - 74 - (3) - - 71 Non-interest income (3) 1 - (5) 1 378 372 Expenses (106) (40) (37) (6) (336) (220) (745) Core earnings (109) 35 (37) (14) (335) 158 (302) Impairment charges - - - - - - - Tax and non-controlling interests 33 (10) 11 4 38 (56) 20 Cash earnings (76) 25 (26) (10) (297) 102 (282) 1 For further information refer to Westpac’s 2021 Interim Financial Results Announcement. 2 In AUD. Results Westpac Group 2021 Interim Results Presentation & Investor Discussion Pack 2H20 notable items ($m) Consumer Business WIB NZ2 Specialist Businesses Group Businesses Group Net interest income - (34) - (3) - - (37) Non-interest income 4 (3) - (4) (305) 273 (35) Expenses (31) (106) - 1 (653) (494) (1,283) Core earnings (27) (143) - (6) (958) (221) (1,355) Impairment charges - - - - - - - Tax and non-controlling interests 8 43 - 2 138 (56) 135 Cash earnings (19) (100) - (4) (820) (277) (1,220) |
| 1H21 financial snapshot. 1 All measures on a cash earnings basis. 2 Internationally comparable methodology aligns with the APRA study titled ‘International Capital Comparison Study’ dated 13 July 2015. 3 Includes items classified as held for sale. 4 NSFR is reported on a spot basis. 5 LCR is reported on a quarterly average basis. 6 1H21 and 2H20 includes Term Funding Facility (TFF). 7 Total liquid assets represent cash, interbank deposits and assets eligible for existing repurchase agreements with a central bank. 38 Results 1H21 Change 1H21 – 2H20 Change 1H21 - 1H20 Earnings1 Earnings per share (cents) 97.1 117% 251% Core earnings ($m) 4,818 29% 15% Cash earnings ($m) 3,537 119% 256% Return on equity (%) 10.19 Large Large Dividend (cents per share) 58 87% N/A Expense to income ratio (%) 55.4 Large Large Net interest margin (%) 2.09 6bps (4bps) Credit quality Impairment benefit to average gross loans (bps) 11 Large Large Impaired assets to gross loans (bps) 30 (10bps) - Impaired provisions to impaired assets (%) 47 6ppts (3ppts) Total provisions to credit RWA (bps) 159 (12bps) 2bps Collectively assessed provisions to credit RWA (bps) 142 (12bps) 2bps 1H21 Change 1H21 – 2H20 Change 1H21 - 1H20 Balance sheet Total assets ($bn) 889.5 (2%) (8%) Common equity Tier 1 (CET1) capital ratio (APRA basis) (%) 12.34 121bps 153bps CET1 capital ratio (Internationally comparable2) (%) 18.08 158bps 227bps CET1 capital ($bn) 52.9 9% 10% Risk weighted assets (RWA) ($bn) 428.9 (2%) (3%) Average interest-earning assets ($bn) 813.0 (2%) - Loans3 ($bn) 690.0 - (4%) Customer deposits3 ($bn) 550.3 (1%) 1% Net tangible assets per share ($) 16.60 6% 8% Funding and liquidity Customer deposit to loan ratio (%) 79.8 (39bps) Large Net stable funding ratio4 (%) (NSFR) 123 1ppt 6ppts Liquidity coverage ratio5,6 (%) (LCR) 124 (27ppts) (16ppts) Total liquid assets7 ($bn) 195.2 (12%) (2%) Westpac Group 2021 Interim Results Presentation & Investor Discussion Pack |

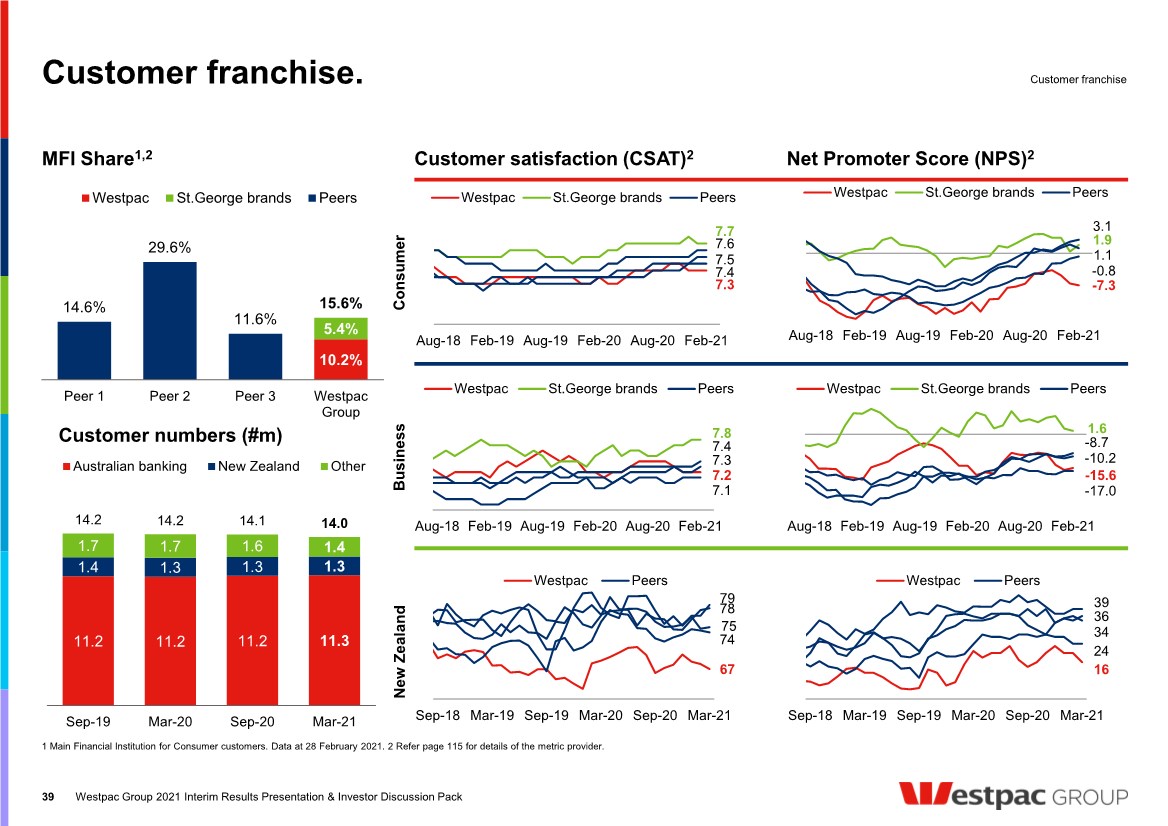
| Customer franchise. MFI Share1,2 -7.3 1.9 -0.8 1.1 3.1 Aug-18 Feb-19 Aug-19 Feb-20 Aug-20 Feb-21 Westpac St.George brands Peers 39 Customer satisfaction (CSAT)2 11.2 11.2 11.2 11.3 1.4 1.3 1.3 1.3 1.7 1.7 1.6 1.4 14.2 14.2 14.1 14.0 Sep-19 Mar-20 Sep-20 Mar-21 Australian banking New Zealand Other Net Promoter Score (NPS)2 1 Main Financial Institution for Consumer customers. Data at 28 February 2021. 2 Refer page 115 for details of the metric provider. Customer franchise Westpac Group 2021 Interim Results Presentation & Investor Discussion Pack Business Consumer New Zealand -15.6 1.6 -17.0 -8.7 -10.2 Aug-18 Feb-19 Aug-19 Feb-20 Aug-20 Feb-21 Westpac St.George brands Peers 16 39 24 34 36 Sep-18 Mar-19 Sep-19 Mar-20 Sep-20 Mar-21 Westpac Peers 10.2% 5.4% 14.6% 29.6% 11.6% 15.6% Peer 1 Peer 2 Peer 3 Westpac Group Westpac St.George brands Peers Customer numbers (#m) 7.3 7.7 7.4 7.5 7.6 Aug-18 Feb-19 Aug-19 Feb-20 Aug-20 Feb-21 Westpac St.George brands Peers 7.2 7.8 7.1 7.4 7.3 Aug-18 Feb-19 Aug-19 Feb-20 Aug-20 Feb-21 Westpac St.George brands Peers 67 78 74 75 79 Sep-18 Mar-19 Sep-19 Mar-20 Sep-20 Mar-21 Westpac Peers |
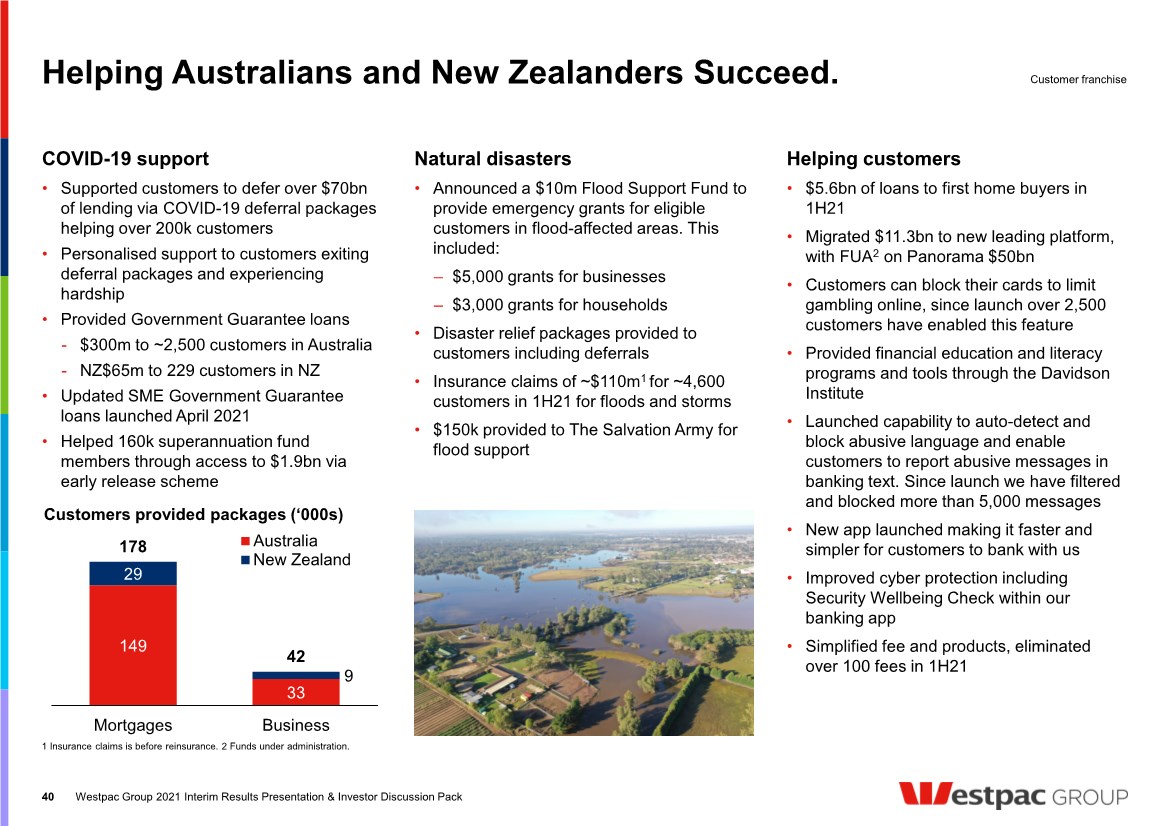
| Helping Australians and New Zealanders Succeed. COVID-19 support • Supported customers to defer over $70bn of lending via COVID-19 deferral packages helping over 200k customers • Personalised support to customers exiting deferral packages and experiencing hardship • Provided Government Guarantee loans - $300m to ~2,500 customers in Australia - NZ$65m to 229 customers in NZ • Updated SME Government Guarantee loans launched April 2021 • Helped 160k superannuation fund members through access to $1.9bn via early release scheme 40 Natural disasters • Announced a $10m Flood Support Fund to provide emergency grants for eligible customers in flood-affected areas. This included: ‒ $5,000 grants for businesses ‒ $3,000 grants for households • Disaster relief packages provided to customers including deferrals • Insurance claims of ~$110m1 for ~4,600 customers in 1H21 for floods and storms • $150k provided to The Salvation Army for flood support Helping customers • $5.6bn of loans to first home buyers in 1H21 • Migrated $11.3bn to new leading platform, with FUA2 on Panorama $50bn • Customers can block their cards to limit gambling online, since launch over 2,500 customers have enabled this feature • Provided financial education and literacy programs and tools through the Davidson Institute • Launched capability to auto-detect and block abusive language and enable customers to report abusive messages in banking text. Since launch we have filtered and blocked more than 5,000 messages • New app launched making it faster and simpler for customers to bank with us • Improved cyber protection including Security Wellbeing Check within our banking app • Simplified fee and products, eliminated over 100 fees in 1H21 1 Insurance claims is before reinsurance. 2 Funds under administration. Customer franchise Westpac Group 2021 Interim Results Presentation & Investor Discussion Pack 149 33 29 9 178 42 Mortgages Business Australia New Zealand Customers provided packages (‘000s) |
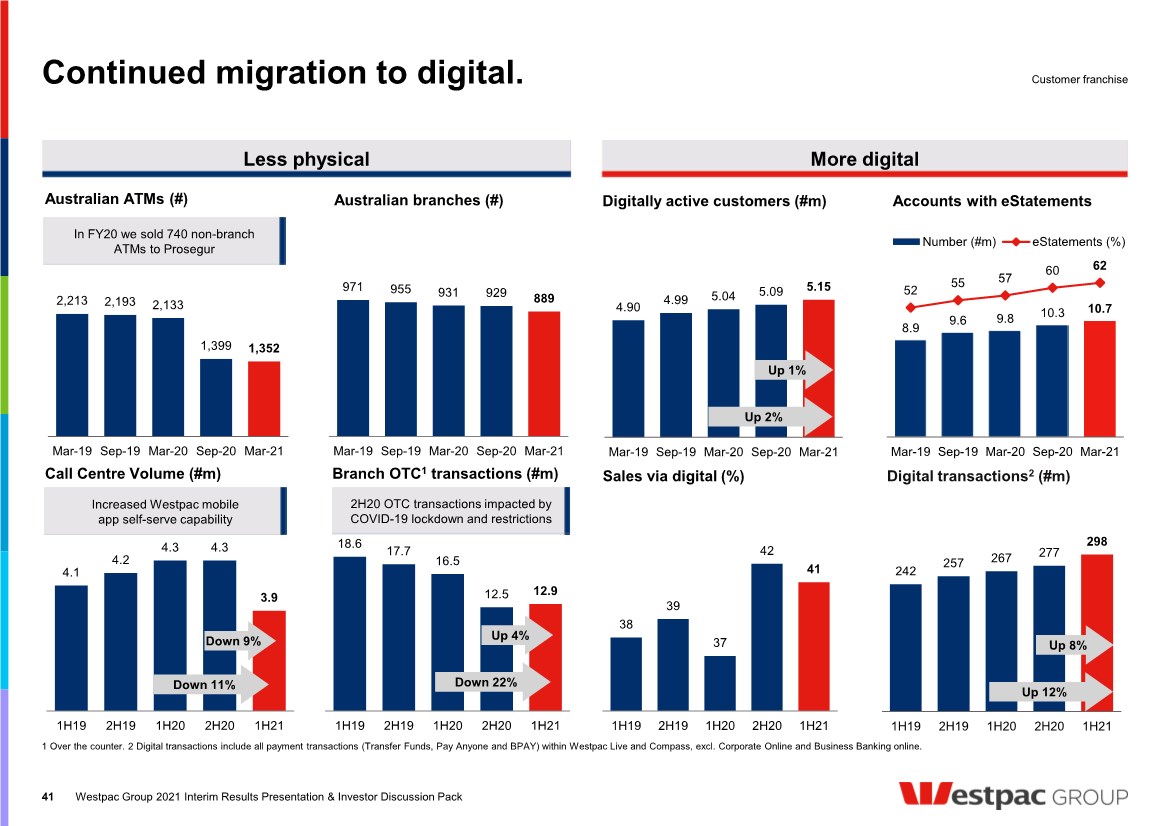
| 4.1 4.2 4.3 4.3 3.9 1H19 2H19 1H20 2H20 1H21 Continued migration to digital. 41 Australian ATMs (#) Australian branches (#) Call Centre Volume (#m) Digitally active customers (#m) Accounts with eStatements 1 Over the counter. 2 Digital transactions include all payment transactions (Transfer Funds, Pay Anyone and BPAY) within Westpac Live and Compass, excl. Corporate Online and Business Banking online. Branch OTC1 transactions (#m) Digital transactions2 (#m) 4.90 4.99 5.04 5.09 5.15 Mar-19 Sep-19 Mar-20 Sep-20 Mar-21 8.9 9.6 9.8 10.3 10.7 52 55 57 60 62 Mar-19 Sep-19 Mar-20 Sep-20 Mar-21 Number (#m) eStatements (%) 242 257 267 277 298 1H19 2H19 1H20 2H20 1H21 2,213 2,193 2,133 1,399 1,352 Mar-19 Sep-19 Mar-20 Sep-20 Mar-21 971 955 931 929 889 Mar-19 Sep-19 Mar-20 Sep-20 Mar-21 18.6 17.7 16.5 12.5 12.9 1H19 2H19 1H20 2H20 1H21 Up 2% Up 1% In FY20 we sold 740 non-branch ATMs to Prosegur Sales via digital (%) 38 39 37 42 41 1H19 2H19 1H20 2H20 1H21 Westpac Group 2021 Interim Results Presentation & Investor Discussion Pack Down 22% Up 4% Up 8% Up 12% Down 9% Down 11% 2H20 OTC transactions impacted by COVID-19 lockdown and restrictions Increased Westpac mobile app self-serve capability Customer franchise Less physical More digital |
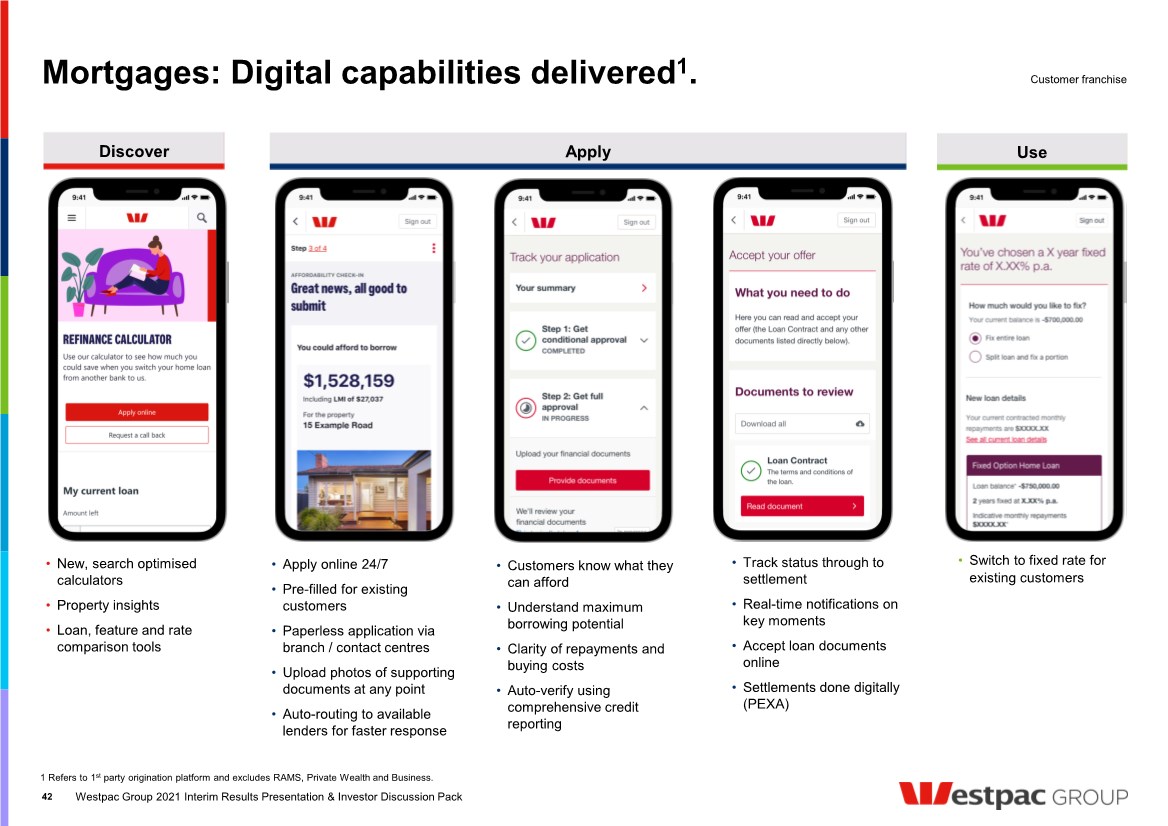
| Mortgages: Digital capabilities delivered1. 1 Refers to 1st party origination platform and excludes RAMS, Private Wealth and Business. 42 • New, search optimised calculators • Property insights • Loan, feature and rate comparison tools • Apply online 24/7 • Pre-filled for existing customers • Paperless application via branch / contact centres • Upload photos of supporting documents at any point • Auto-routing to available lenders for faster response • Switch to fixed rate for existing customers Apply Use Discover Westpac Group 2021 Interim Results Presentation & Investor Discussion Pack Customer franchise • Customers know what they can afford • Understand maximum borrowing potential • Clarity of repayments and buying costs • Auto-verify using comprehensive credit reporting • Track status through to settlement • Real-time notifications on key moments • Accept loan documents online • Settlements done digitally (PEXA) |
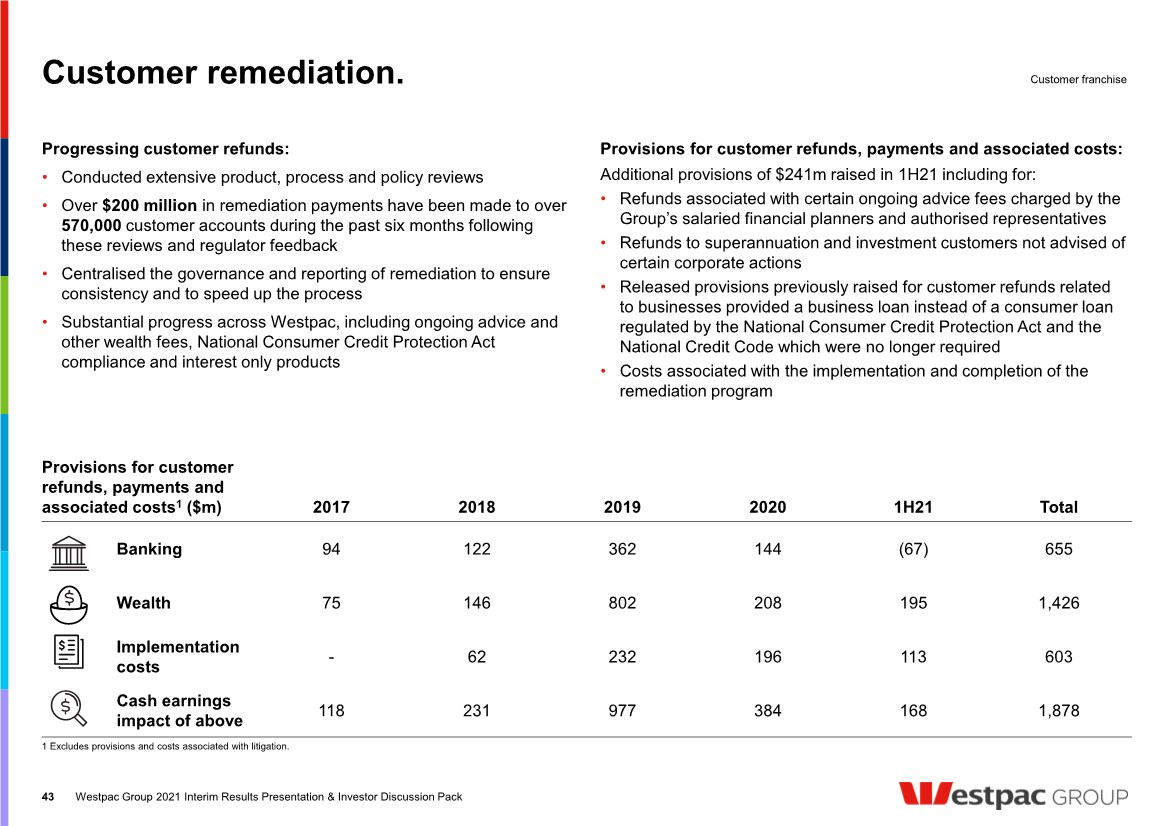
| Customer remediation. Provisions for customer refunds, payments and associated costs: Additional provisions of $241m raised in 1H21 including for: • Refunds associated with certain ongoing advice fees charged by the Group’s salaried financial planners and authorised representatives • Refunds to superannuation and investment customers not advised of certain corporate actions • Released provisions previously raised for customer refunds related to businesses provided a business loan instead of a consumer loan regulated by the National Consumer Credit Protection Act and the National Credit Code which were no longer required • Costs associated with the implementation and completion of the remediation program 1 Excludes provisions and costs associated with litigation. Progressing customer refunds: • Conducted extensive product, process and policy reviews • Over $200 million in remediation payments have been made to over 570,000 customer accounts during the past six months following these reviews and regulator feedback • Centralised the governance and reporting of remediation to ensure consistency and to speed up the process • Substantial progress across Westpac, including ongoing advice and other wealth fees, National Consumer Credit Protection Act compliance and interest only products Provisions for customer refunds, payments and associated costs1 ($m) 2017 2018 2019 2020 1H21 Total Banking 94 122 362 144 (67) 655 Wealth 75 146 802 208 195 1,426 Implementation costs - 62 232 196 113 603 Cash earnings impact of above 118 231 977 384 168 1,878 43 Westpac Group 2021 Interim Results Presentation & Investor Discussion Pack Customer franchise |
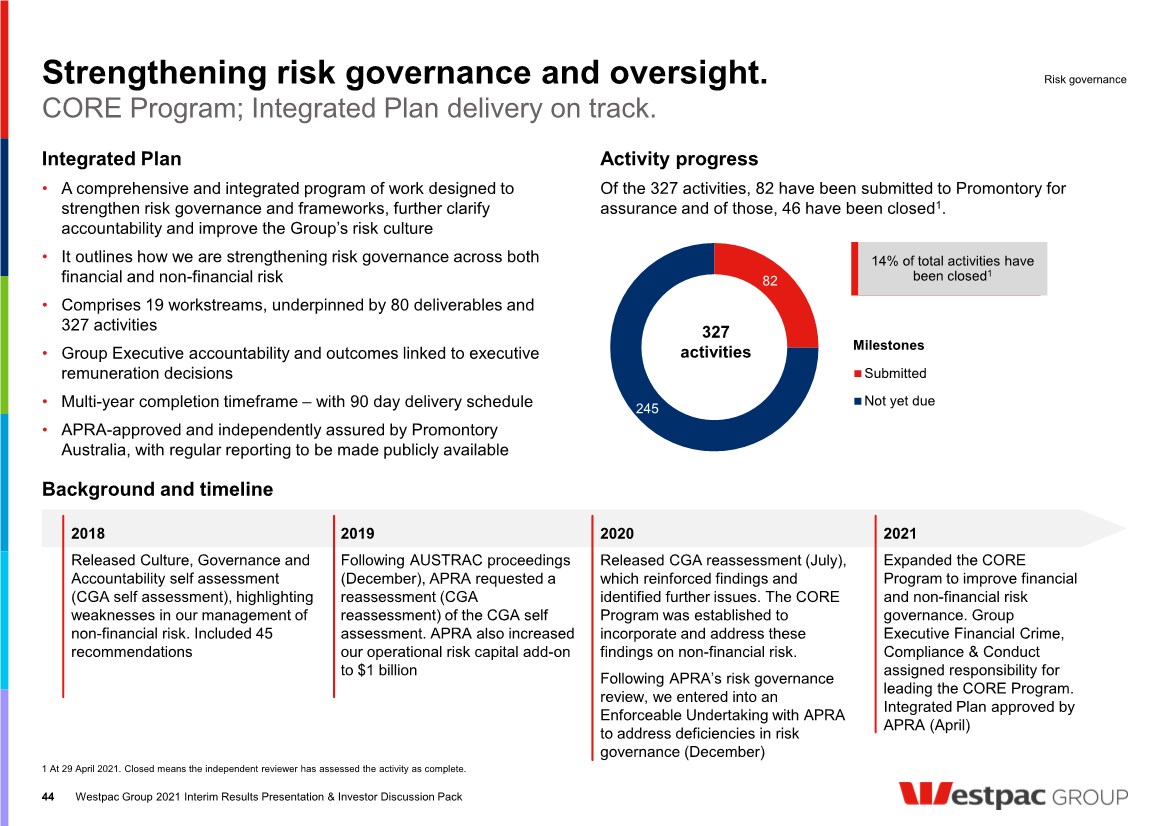
| Strengthening risk governance and oversight. 44 Integrated Plan • A comprehensive and integrated program of work designed to strengthen risk governance and frameworks, further clarify accountability and improve the Group’s risk culture • It outlines how we are strengthening risk governance across both financial and non-financial risk • Comprises 19 workstreams, underpinned by 80 deliverables and 327 activities • Group Executive accountability and outcomes linked to executive remuneration decisions • Multi-year completion timeframe – with 90 day delivery schedule • APRA-approved and independently assured by Promontory Australia, with regular reporting to be made publicly available Activity progress CORE Program; Integrated Plan delivery on track. 1 At 29 April 2021. Closed means the independent reviewer has assessed the activity as complete. Risk governance Westpac Group 2021 Interim Results Presentation & Investor Discussion Pack Background and timeline Of the 327 activities, 82 have been submitted to Promontory for assurance and of those, 46 have been closed1. 82 245 Milestones Submitted Not yet due 327 activities 2018 Released Culture, Governance and Accountability self assessment (CGA self assessment), highlighting weaknesses in our management of non-financial risk. Included 45 recommendations 2019 Following AUSTRAC proceedings (December), APRA requested a reassessment (CGA reassessment) of the CGA self assessment. APRA also increased our operational risk capital add-on to $1 billion 2020 Released CGA reassessment (July), which reinforced findings and identified further issues. The CORE Program was established to incorporate and address these findings on non-financial risk. Following APRA’s risk governance review, we entered into an Enforceable Undertaking with APRA to address deficiencies in risk governance (December) 2021 Expanded the CORE Program to improve financial and non-financial risk governance. Group Executive Financial Crime, Compliance & Conduct assigned responsibility for leading the CORE Program. Integrated Plan approved by APRA (April) Board 14% of total activities have been closed1 |
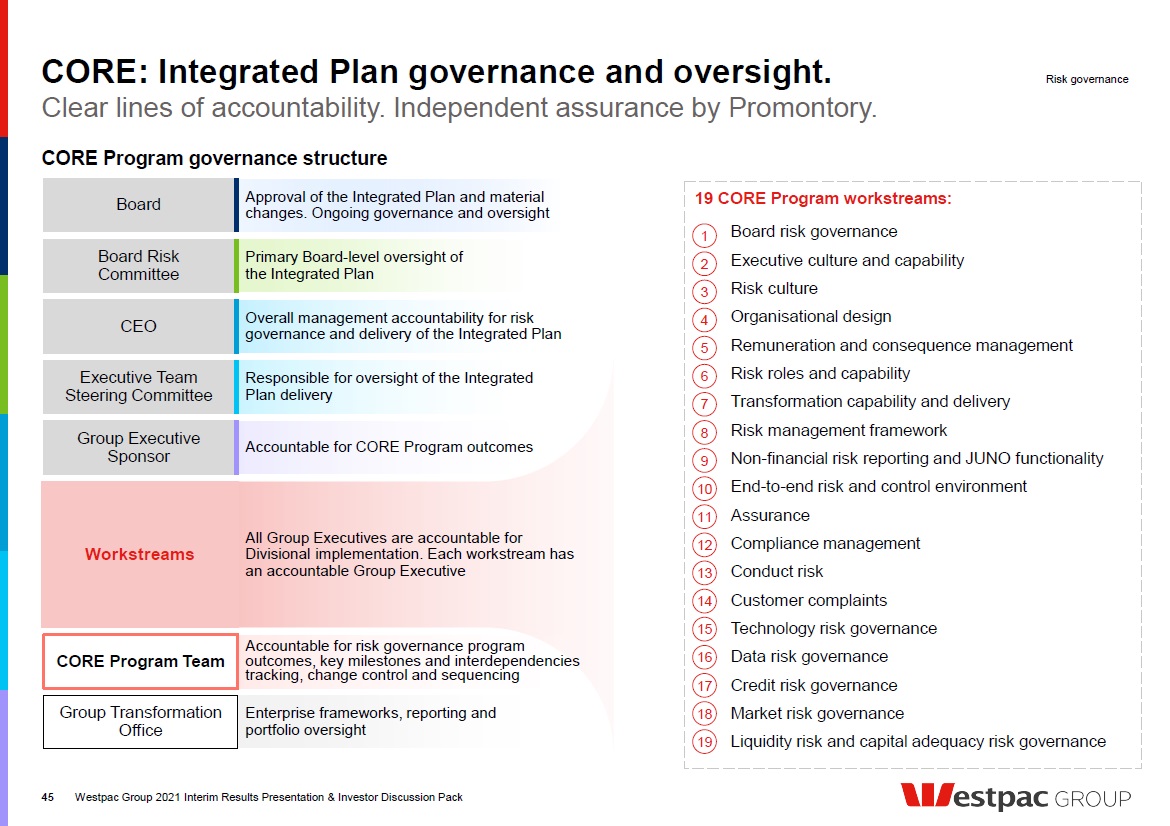
| CORE: Integrated Plan governance and oversight. 45 CORE Program governance structure Clear lines of accountability. Independent assurance by Promontory. Risk governance Westpac Group 2021 Interim Results Presentation & Investor Discussion Pack Accountable for risk governance program outcomes, key milestones and interdependencies tracking, change control and sequencing Enterprise frameworks, reporting and portfolio oversight Primary Board-level oversight of the Integrated Plan Approval of the Integrated Plan and material changes. Ongoing governance and oversight 19 CORE Program workstreams: Board risk governance Executive culture and capability Risk culture Organisational design Remuneration and consequence management Risk roles and capability Transformation capability and delivery Risk management framework Non-financial risk reporting and JUNO functionality End-to-end risk and control environment Assurance Compliance management Conduct risk Customer complaints Technology risk governance Data risk governance Credit risk governance Market risk governance Liquidity risk and capital adequacy risk governance 1 2 3 4 5 6 7 8 9 10 11 12 13 14 15 16 17 18 19 All Group Executives are accountable for Divisional implementation. Each workstream has an accountable Group Executive CORE Program Team Group Transformation Office Responsible for oversight of the Integrated Plan delivery Accountable for CORE Program outcomes Overall management accountability for risk governance and delivery of the Integrated Plan Executive Team Steering Committee Executive Team Steering Committee Board Risk Committee Board Risk Committee Group Executive Sponsor Group Executive Sponsor Board Board CEO CEO Workstreams |
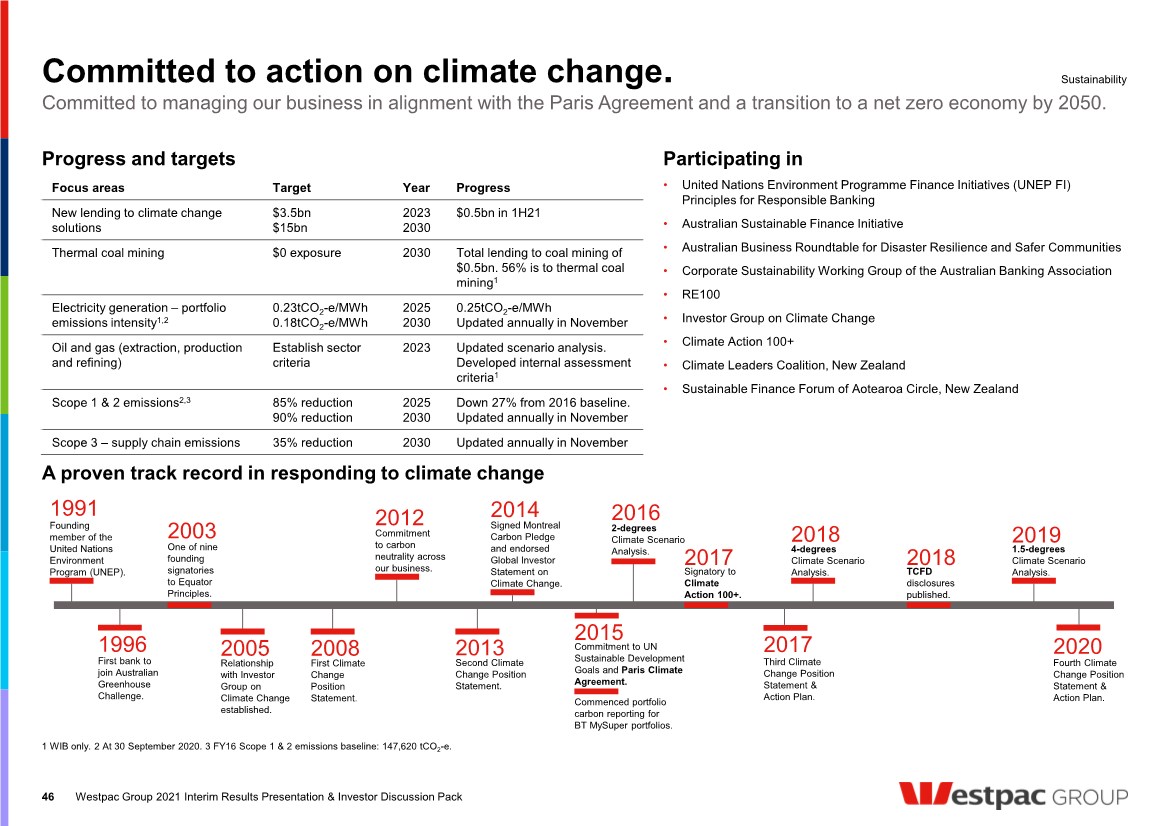
| Focus areas Target Year Progress New lending to climate change solutions $3.5bn $15bn 2023 2030 $0.5bn in 1H21 Thermal coal mining $0 exposure 2030 Total lending to coal mining of $0.5bn. 56% is to thermal coal mining1 Electricity generation – portfolio emissions intensity1,2 0.23tCO2-e/MWh 0.18tCO2-e/MWh 2025 2030 0.25tCO2-e/MWh Updated annually in November Oil and gas (extraction, production and refining) Establish sector criteria 2023 Updated scenario analysis. Developed internal assessment criteria1 Scope 1 & 2 emissions2,3 85% reduction 90% reduction 2025 2030 Down 27% from 2016 baseline. Updated annually in November Scope 3 – supply chain emissions 35% reduction 2030 Updated annually in November Committed to action on climate change. 46 Participating in Committed to managing our business in alignment with the Paris Agreement and a transition to a net zero economy by 2050. Sustainability Westpac Group 2021 Interim Results Presentation & Investor Discussion Pack Progress and targets 1 WIB only. 2 At 30 September 2020. 3 FY16 Scope 1 & 2 emissions baseline: 147,620 tCO2-e. A proven track record in responding to climate change 2017 Commenced portfolio carbon reporting for BT MySuper portfolios. 1996 Founding member of the United Nations Environment Program (UNEP). 2008 4-degrees Climate Scenario Analysis. 1.5-degrees Climate Scenario Analysis. TCFD disclosures published. Signed Montreal Carbon Pledge and endorsed Global Investor Statement on Climate Change. 2015 Commitment to carbon neutrality across our business. 2013 2005 1991 First bank to join Australian Greenhouse Challenge. One of nine founding signatories to Equator Principles. 2003 Relationship with Investor Group on Climate Change established. First Climate Change Position Statement. 2012 Second Climate Change Position Statement. 2014 Commitment to UN Sustainable Development Goals and Paris Climate Agreement. 2017 Signatory to Climate Action 100+. Third Climate Change Position Statement & Action Plan. 2018 2018 2019 2020 Fourth Climate Change Position Statement & Action Plan. 2-degrees Climate Scenario Analysis. 2016 • United Nations Environment Programme Finance Initiatives (UNEP FI) Principles for Responsible Banking • Australian Sustainable Finance Initiative • Australian Business Roundtable for Disaster Resilience and Safer Communities • Corporate Sustainability Working Group of the Australian Banking Association • RE100 • Investor Group on Climate Change • Climate Action 100+ • Climate Leaders Coalition, New Zealand • Sustainable Finance Forum of Aotearoa Circle, New Zealand |
| Climate-related disclosures – scenario analysis. 47 Alignment with the TCFD • We continue to integrate the consideration of climate-related risks and opportunities into our operations. This includes alignment with the recommendations of the Task Force on Climate-related Financial Disclosures (TCFD), referenced in APRA’s draft Prudential Practice Guide on Climate Change Financial Risks. • Climate change-related risks are managed within the Group’s risk management framework • Participating in APRA’s 2021 Climate Vulnerability Assessment Transition risk – key points • Transition climate risk includes domestic and market changes when moving to a greener economy, which can result in changes to costs, income and profits, investment preferences and asset viability • Our analysis of transition risk focuses on our current Australian Business and Institutional lending1 and exposure to sectors which may face growth constraints under 1.5-degree and 2-degree scenarios2 • Approximately 1.2% of our current Australian Business and Institutional lending is exposed to sectors that by 2030 may experience higher risk3 in a transition to a 1.5-degree economy. Under a 2050 scenario this is 2.5% • During the half, we undertook transition risk analysis, and developed internal assessment criteria for the oil and gas sector (extraction, production and refining)4. • Our updated approach means we will: - expect any new oil and gas exploration, production and refining customers, to whom we provide lending, to have publicly disclosed Paris-aligned business goals; - support existing customers to develop Paris-aligned financing strategies; - develop our approach and understanding of climate-related risk and opportunities in the oil and gas sector (including downstream segments) through engagement with our customers5; and - continue to provide annual updates on our progress Physical risk – key points • Physical climate risk refers to changes in climate and the frequency and magnitude of extreme weather events, with impacts including direct damage to assets or property • Updated our approach to assessing the impact of extreme weather events under climate change scenarios on our Australian mortgage portfolio6,7 • Focused on the Australian mortgage portfolio and exposure to locations that may face increased physical risk under an IPCC RCP8 8.5 Scenario • Approximately 2.0% of the current Australian mortgage portfolio may be exposed to higher physical risk9 under an IPCC RCP 8.5 Scenario by 2050 1 Australian Business and Institutional lending, excludes retail, sovereign, and bank exposures. 2 For further information see Westpac’s FY20 Sustainability Performance Report. 3 Sectors whose medium (2030) and long-term (2050) performance under a scenario deviated by more than one standard deviation below average GDP growth, were classified as 'may face relatively higher growth constraints’. 4 For further information see 2021 Interim Financial Results. 5 WIB customers only. 6 Excludes RAMS and Equity Access. 7 Considered riverine flooding, coastal inundation, forest fire, extreme wind and soil subsidence. 8 Intergovernmental Panel on Climate Change (IPCC) Representative Concentration Pathway (RCP). 9 ‘Higher risk’ were locations where insurance may become more expensive or unavailable. Sustainability Westpac Group 2021 Interim Results Presentation & Investor Discussion Pack |
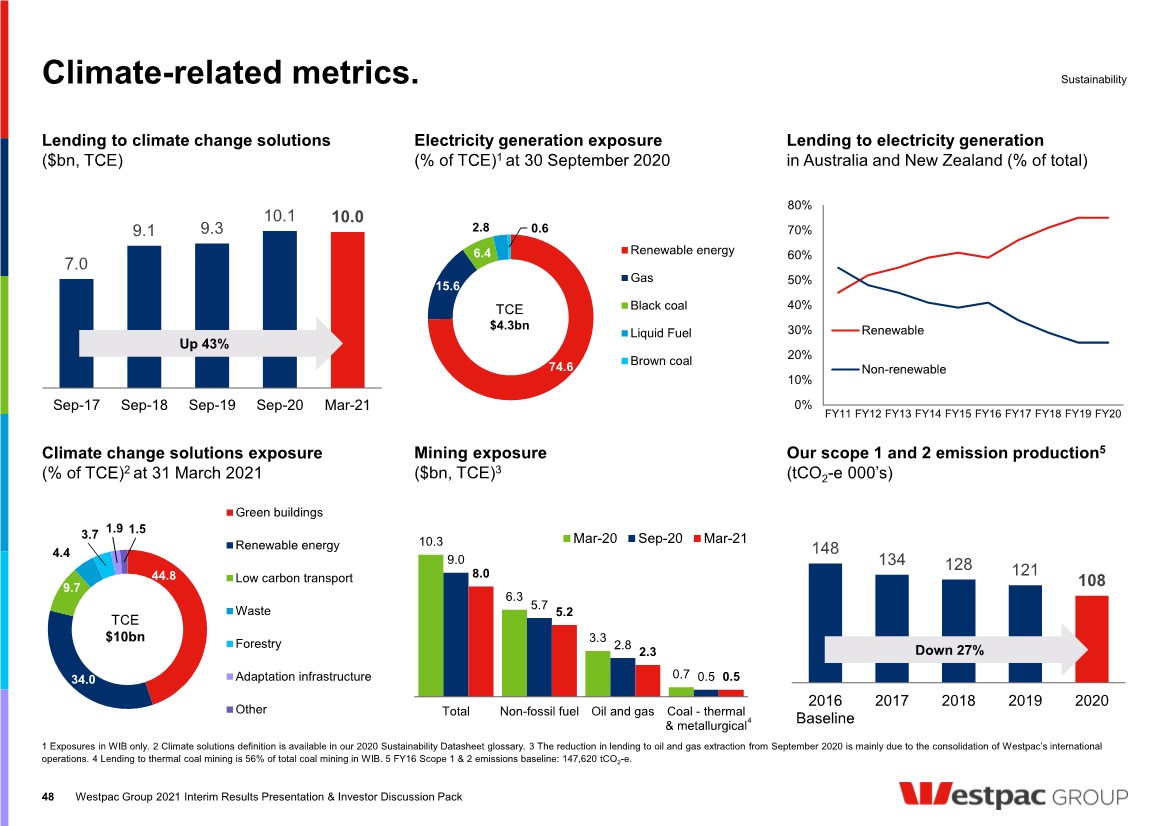
| 148 134 128 121 108 2016 Baseline 2017 2018 2019 2020 0% 10% 20% 30% 40% 50% 60% 70% 80% FY11 FY12 FY13 FY14 FY15 FY16 FY17 FY18 FY19 FY20 Renewable Non-renewable Climate-related metrics. 48 Lending to climate change solutions ($bn, TCE) 7.0 9.1 9.3 10.1 10.0 Sep-17 Sep-18 Sep-19 Sep-20 Mar-21 Climate change solutions exposure (% of TCE)2 at 31 March 2021 Electricity generation exposure (% of TCE)1 at 30 September 2020 1 Exposures in WIB only. 2 Climate solutions definition is available in our 2020 Sustainability Datasheet glossary. 3 The reduction in lending to oil and gas extraction from September 2020 is mainly due to the consolidation of Westpac’s international operations. 4 Lending to thermal coal mining is 56% of total coal mining in WIB. 5 FY16 Scope 1 & 2 emissions baseline: 147,620 tCO2-e. Sustainability Westpac Group 2021 Interim Results Presentation & Investor Discussion Pack Down 27% Up 43% Mining exposure ($bn, TCE)3 Our scope 1 and 2 emission production5 (tCO2-e 000’s) Lending to electricity generation in Australia and New Zealand (% of total) 44.8 34.0 9.7 4.4 3.7 1.9 1.5 Green buildings Renewable energy Low carbon transport Waste Forestry Adaptation infrastructure Other TCE $10bn 74.6 15.6 6.4 2.8 0.6 Renewable energy Gas Black coal Liquid Fuel Brown coal TCE $4.3bn 10.3 6.3 3.3 0.7 9.0 5.7 2.8 0.5 8.0 5.2 2.3 0.5 Total Non-fossil fuel Oil and gas Coal - thermal & metallurgical Mar-20 Sep-20 Mar-21 4 |
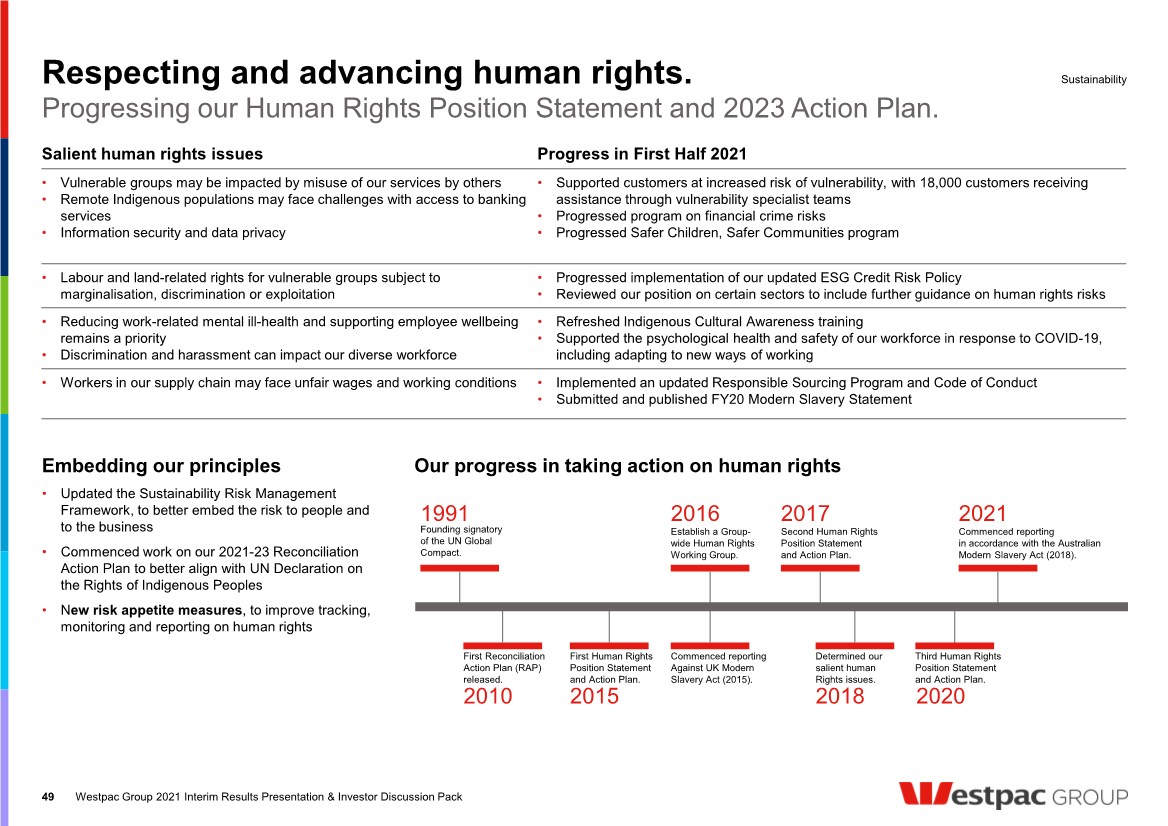
| Respecting and advancing human rights. 49 Our progress in taking action on human rights Salient human rights issues Progress in First Half 2021 • Vulnerable groups may be impacted by misuse of our services by others • Remote Indigenous populations may face challenges with access to banking services • Information security and data privacy • Supported customers at increased risk of vulnerability, with 18,000 customers receiving assistance through vulnerability specialist teams • Progressed program on financial crime risks • Progressed Safer Children, Safer Communities program • Labour and land-related rights for vulnerable groups subject to marginalisation, discrimination or exploitation • Progressed implementation of our updated ESG Credit Risk Policy • Reviewed our position on certain sectors to include further guidance on human rights risks • Reducing work-related mental ill-health and supporting employee wellbeing remains a priority • Discrimination and harassment can impact our diverse workforce • Refreshed Indigenous Cultural Awareness training • Supported the psychological health and safety of our workforce in response to COVID-19, including adapting to new ways of working • Workers in our supply chain may face unfair wages and working conditions • Implemented an updated Responsible Sourcing Program and Code of Conduct • Submitted and published FY20 Modern Slavery Statement Progressing our Human Rights Position Statement and 2023 Action Plan. Embedding our principles • Updated the Sustainability Risk Management Framework, to better embed the risk to people and to the business • Commenced work on our 2021-23 Reconciliation Action Plan to better align with UN Declaration on the Rights of Indigenous Peoples • New risk appetite measures, to improve tracking, monitoring and reporting on human rights Sustainability Westpac Group 2021 Interim Results Presentation & Investor Discussion Pack First Human Rights Position Statement and Action Plan. Commenced reporting Against UK Modern Slavery Act (2015). Determined our salient human Rights issues. Third Human Rights Position Statement and Action Plan. Commenced reporting in accordance with the Australian Modern Slavery Act (2018). Second Human Rights Position Statement and Action Plan. Establish a Group- wide Human Rights Working Group. Founding signatory of the UN Global Compact. 1991 2016 2017 2021 2015 2018 2020 First Reconciliation Action Plan (RAP) released. 2010 |
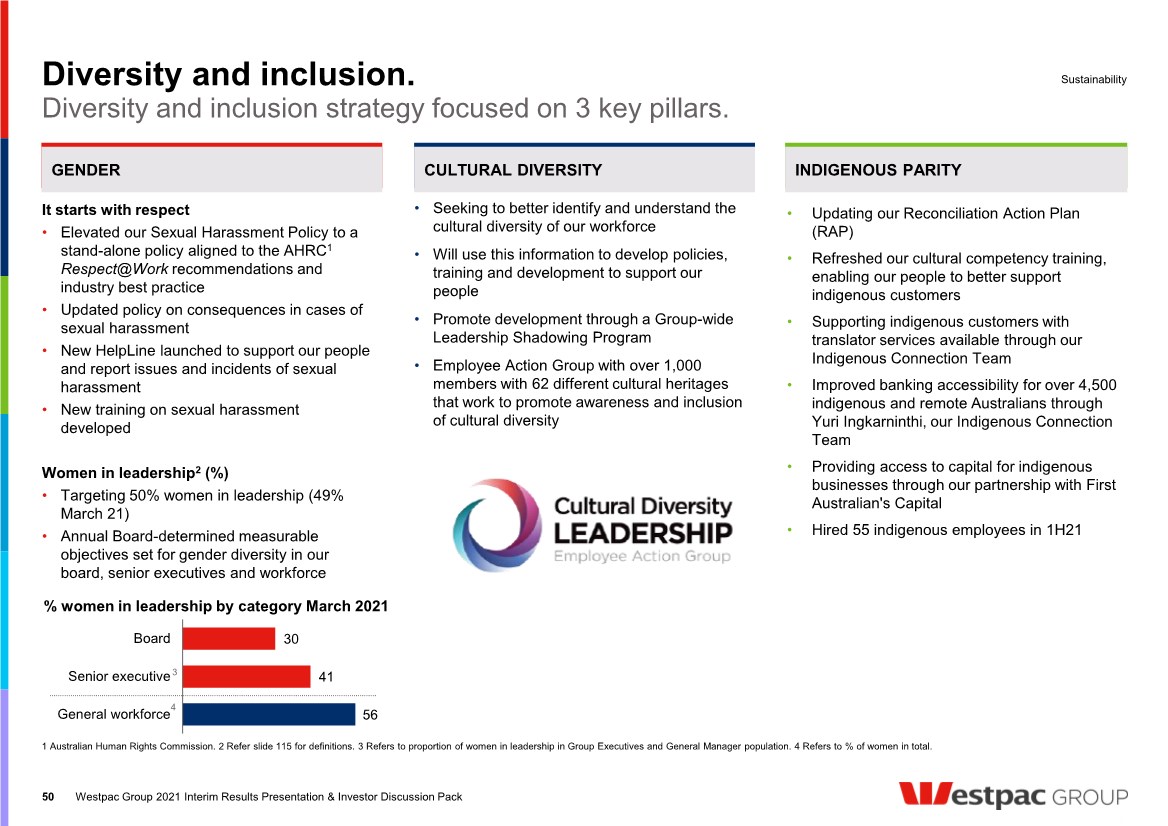
| It starts with respect • Elevated our Sexual Harassment Policy to a stand-alone policy aligned to the AHRC1 Respect@Work recommendations and industry best practice • Updated policy on consequences in cases of sexual harassment • New HelpLine launched to support our people and report issues and incidents of sexual harassment • New training on sexual harassment developed Women in leadership2 (%) • Targeting 50% women in leadership (49% March 21) • Annual Board-determined measurable objectives set for gender diversity in our board, senior executives and workforce CULTURAL DIVERSITY GENDER INDIGENOUS PARITY • Seeking to better identify and understand the cultural diversity of our workforce • Will use this information to develop policies, training and development to support our people • Promote development through a Group-wide Leadership Shadowing Program • Employee Action Group with over 1,000 members with 62 different cultural heritages that work to promote awareness and inclusion of cultural diversity 1 Australian Human Rights Commission. 2 Refer slide 115 for definitions. 3 Refers to proportion of women in leadership in Group Executives and General Manager population. 4 Refers to % of women in total. 50 Diversity and inclusion strategy focused on 3 key pillars. Sustainability • Updating our Reconciliation Action Plan (RAP) • Refreshed our cultural competency training, enabling our people to better support indigenous customers • Supporting indigenous customers with translator services available through our Indigenous Connection Team • Improved banking accessibility for over 4,500 indigenous and remote Australians through Yuri Ingkarninthi, our Indigenous Connection Team • Providing access to capital for indigenous businesses through our partnership with First Australian's Capital • Hired 55 indigenous employees in 1H21 Diversity and inclusion. 56 41 30 General workforce Senior executive Board 3 % women in leadership by category March 2021 4 Westpac Group 2021 Interim Results Presentation & Investor Discussion Pack |
| Earnings Drivers |
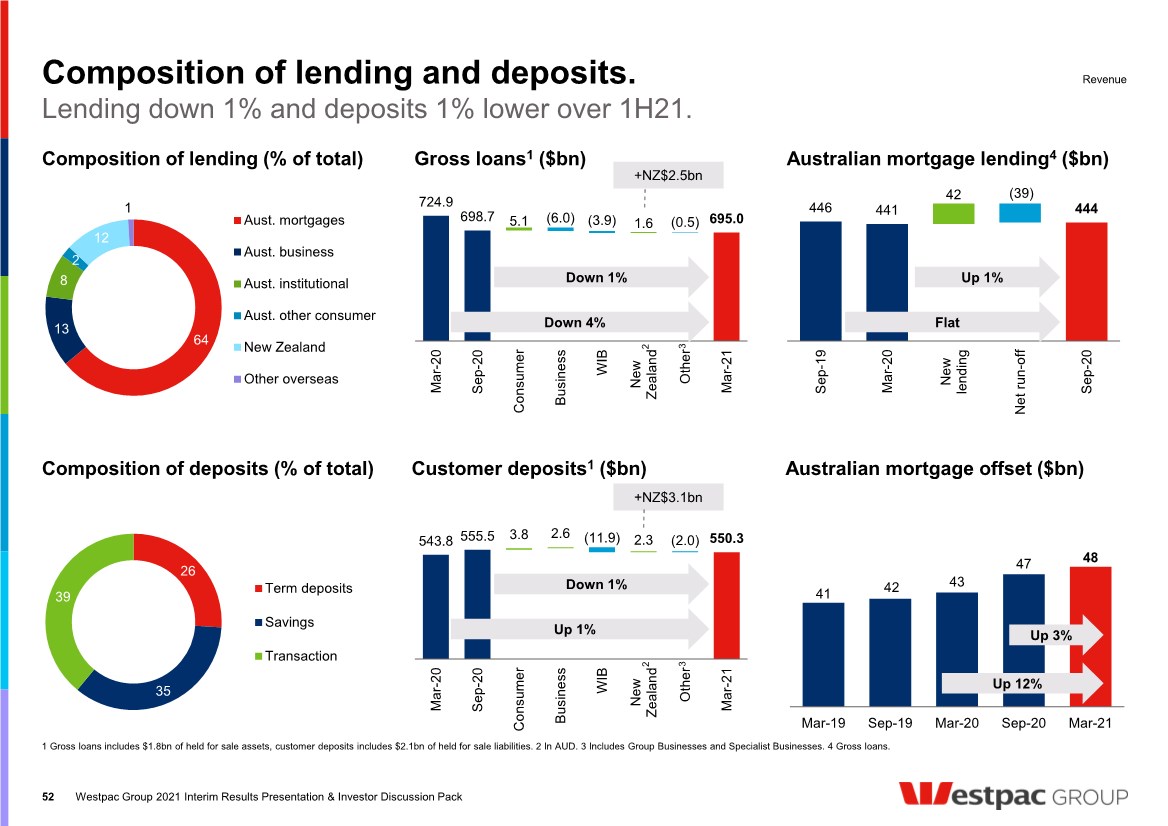
| 41 42 43 47 48 Mar-19 Sep-19 Mar-20 Sep-20 Mar-21 Composition of lending and deposits. Composition of lending (% of total) 64 13 8 2 12 1 Aust. mortgages Aust. business Aust. institutional Aust. other consumer New Zealand Other overseas 52 Gross loans1 ($bn) 5.1 1.6 724.9 698.7 695.0 (6.0) (3.9) (0.5) Mar-20 Sep-20 Consumer Business WIB New Zealand Other Mar-21 Customer deposits1 ($bn) 1 Gross loans includes $1.8bn of held for sale assets, customer deposits includes $2.1bn of held for sale liabilities. 2 In AUD. 3 Includes Group Businesses and Specialist Businesses. 4 Gross loans. Revenue 2 Australian mortgage lending4 ($bn) 42 446 441 444 (39) Sep-19 Mar-20 New lending Net run-off Sep-20 Composition of deposits (% of total) Lending down 1% and deposits 1% lower over 1H21. Down 4% Down 1% Flat Up 1% 543.8 555.5 3.8 2.6 2.3 550.3 (11.9) (2.0) Mar-20 Sep-20 Consumer Business WIB New Zealand Other Mar-21 26 35 39 Term deposits Savings Transaction Up 1% Down 1% Australian mortgage offset ($bn) Up 12% Up 3% 3 2 3 +NZ$3.1bn Westpac Group 2021 Interim Results Presentation & Investor Discussion Pack +NZ$2.5bn |
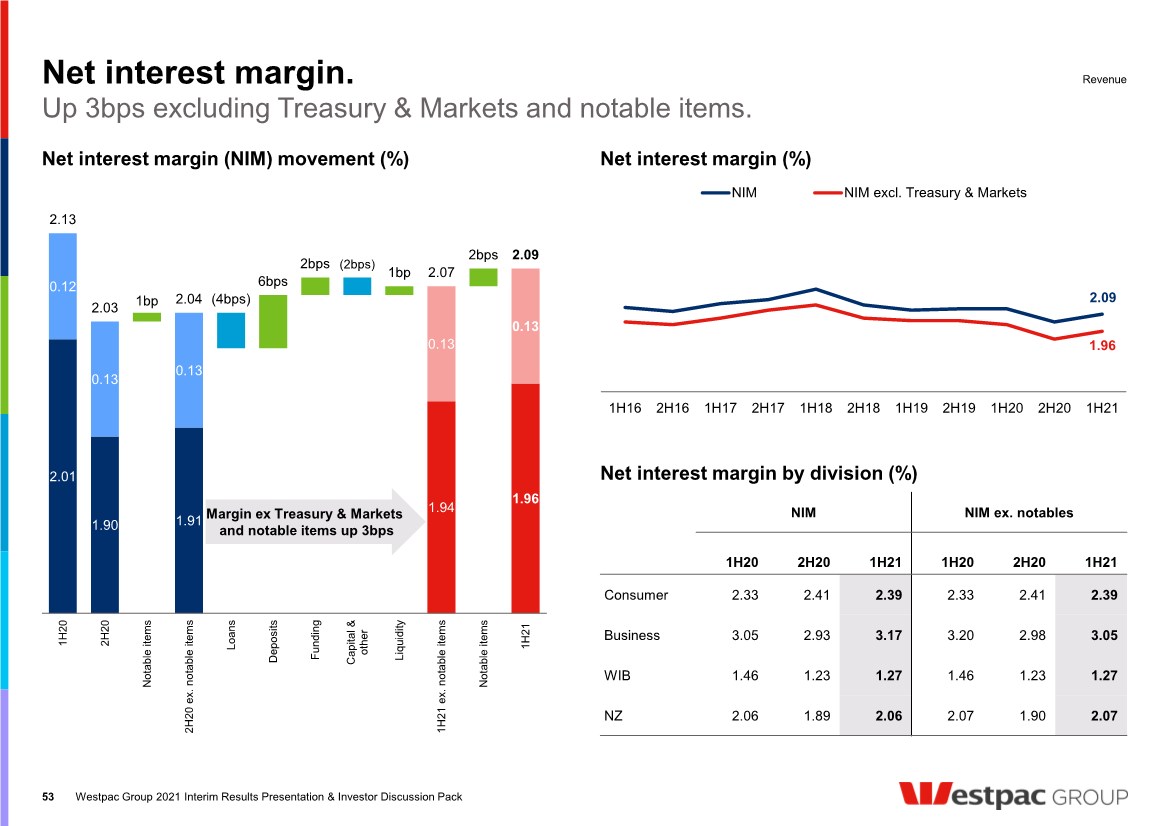
| 2.01 1.90 1.91 1.94 1.96 0.12 0.13 1bp 0.13 0.13 0.13 2.13 2.03 2.04 (4bps) 6bps 2bps (2bps) 1bp 2.07 2bps 2.09 1H20 2H20 Notable items 2H20 ex. notable items Loans Deposits Funding Capital & other Liquidity 1H21 ex. notable items Notable items 1H21 2.09 1.96 1H16 2H16 1H17 2H17 1H18 2H18 1H19 2H19 1H20 2H20 1H21 NIM NIM excl. Treasury & Markets Net interest margin. 53 Net interest margin (%) Net interest margin by division (%) NIM NIM ex. notables 1H20 2H20 1H21 1H20 2H20 1H21 Consumer 2.33 2.41 2.39 2.33 2.41 2.39 Business 3.05 2.93 3.17 3.20 2.98 3.05 WIB 1.46 1.23 1.27 1.46 1.23 1.27 NZ 2.06 1.89 2.06 2.07 1.90 2.07 Net interest margin (NIM) movement (%) Up 3bps excluding Treasury & Markets and notable items. Revenue Margin ex Treasury & Markets and notable items up 3bps Westpac Group 2021 Interim Results Presentation & Investor Discussion Pack |
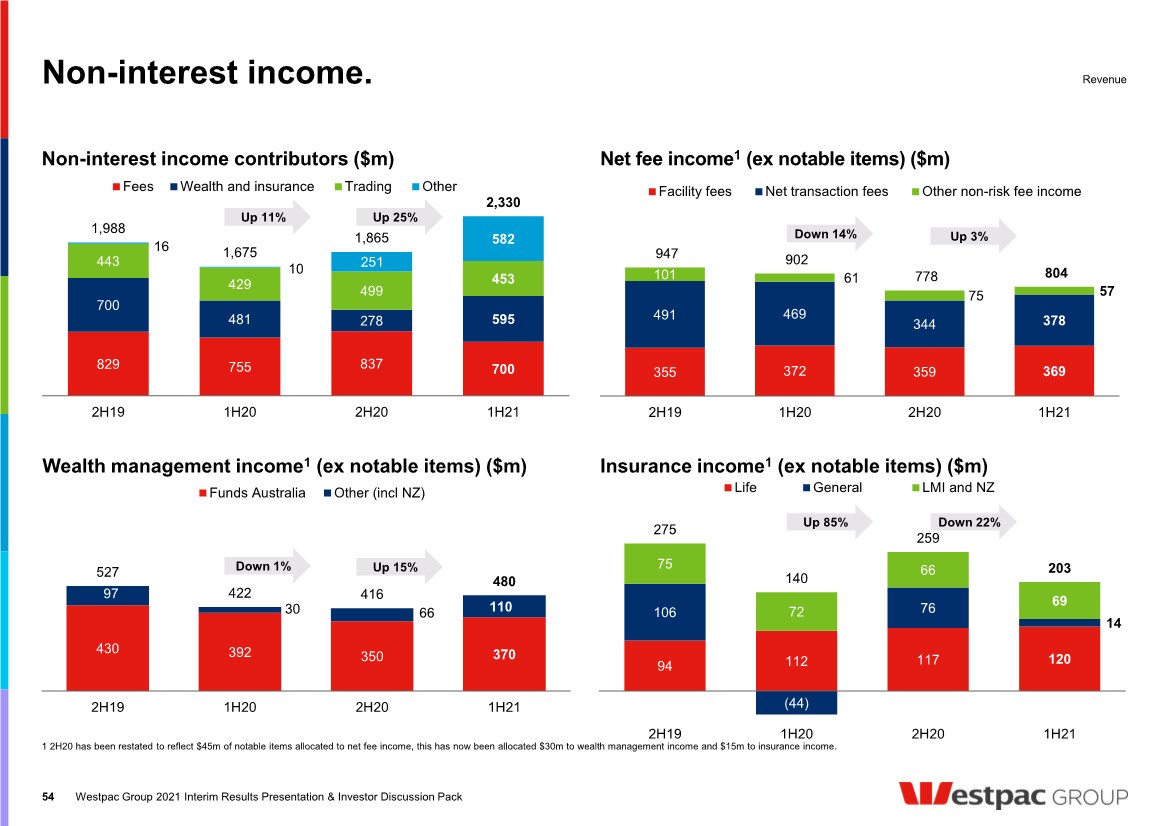
| 94 112 117 120 106 (44) 76 14 75 72 66 69 275 140 259 203 2H19 1H20 2H20 1H21 Life General LMI and NZ 430 392 350 370 97 30 66 110 527 422 416 480 2H19 1H20 2H20 1H21 Funds Australia Other (incl NZ) Non-interest income. 54 Non-interest income contributors ($m) Net fee income1 (ex notable items) ($m) Wealth management income1 (ex notable items) ($m) Insurance income1 (ex notable items) ($m) 1 2H20 has been restated to reflect $45m of notable items allocated to net fee income, this has now been allocated $30m to wealth management income and $15m to insurance income. Revenue 829 755 837 700 700 481 278 595 443 429 499 453 16 10 251 582 1,988 1,675 1,865 2,330 2H19 1H20 2H20 1H21 Fees Wealth and insurance Trading Other 355 372 359 369 491 469 344 378 101 61 75 57 947 902 778 804 2H19 1H20 2H20 1H21 Facility fees Net transaction fees Other non-risk fee income Up 25% Up 11% Down 22% Up 85% Up 3% Down 14% Up 15% Down 1% Westpac Group 2021 Interim Results Presentation & Investor Discussion Pack |
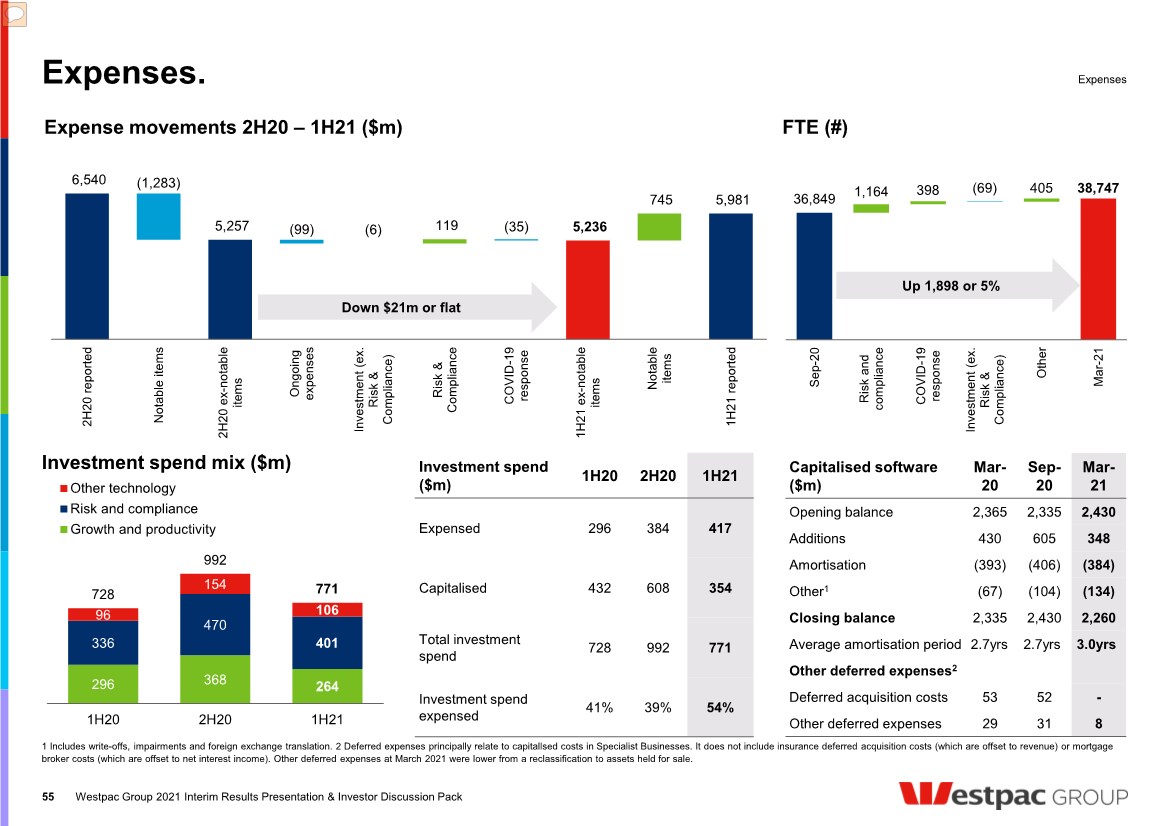
| 6,540 5,257 119 5,236 745 5,981 (1,283) (99) (6) (35) 2H20 reported Notable items 2H20 ex-notable items Ongoing expenses Investment (ex. Risk & Compliance) Risk & Compliance COVID-19 response 1H21 ex-notable items Notable items 1H21 reported 1,164 398 405 36,849 38,747 (69) Sep-20 Risk and compliance COVID-19 response Investment (ex. Risk & Compliance) Other Mar-21 Expense movements 2H20 – 1H21 ($m) Expenses. 55 FTE (#) Expenses Up 1,898 or 5% Investment spend mix ($m) 296 368 264 336 470 401 96 154 106 728 992 771 1H20 2H20 1H21 Other technology Risk and compliance Growth and productivity Investment spend ($m) 1H20 2H20 1H21 Expensed 296 384 417 Capitalised 432 608 354 Total investment spend 728 992 771 Investment spend expensed 41% 39% 54% Capitalised software ($m) Mar- 20 Sep- 20 Mar- 21 Opening balance 2,365 2,335 2,430 Additions 430 605 348 Amortisation (393) (406) (384) Other1 (67) (104) (134) Closing balance 2,335 2,430 2,260 Average amortisation period 2.7yrs 2.7yrs 3.0yrs Other deferred expenses2 Deferred acquisition costs 53 52 - Other deferred expenses 29 31 8 Down $21m or flat Westpac Group 2021 Interim Results Presentation & Investor Discussion Pack 1 Includes write-offs, impairments and foreign exchange translation. 2 Deferred expenses principally relate to capitallsed costs in Specialist Businesses. It does not include insurance deferred acquisition costs (which are offset to revenue) or mortgage broker costs (which are offset to net interest income). Other deferred expenses at March 2021 were lower from a reclassification to assets held for sale. |
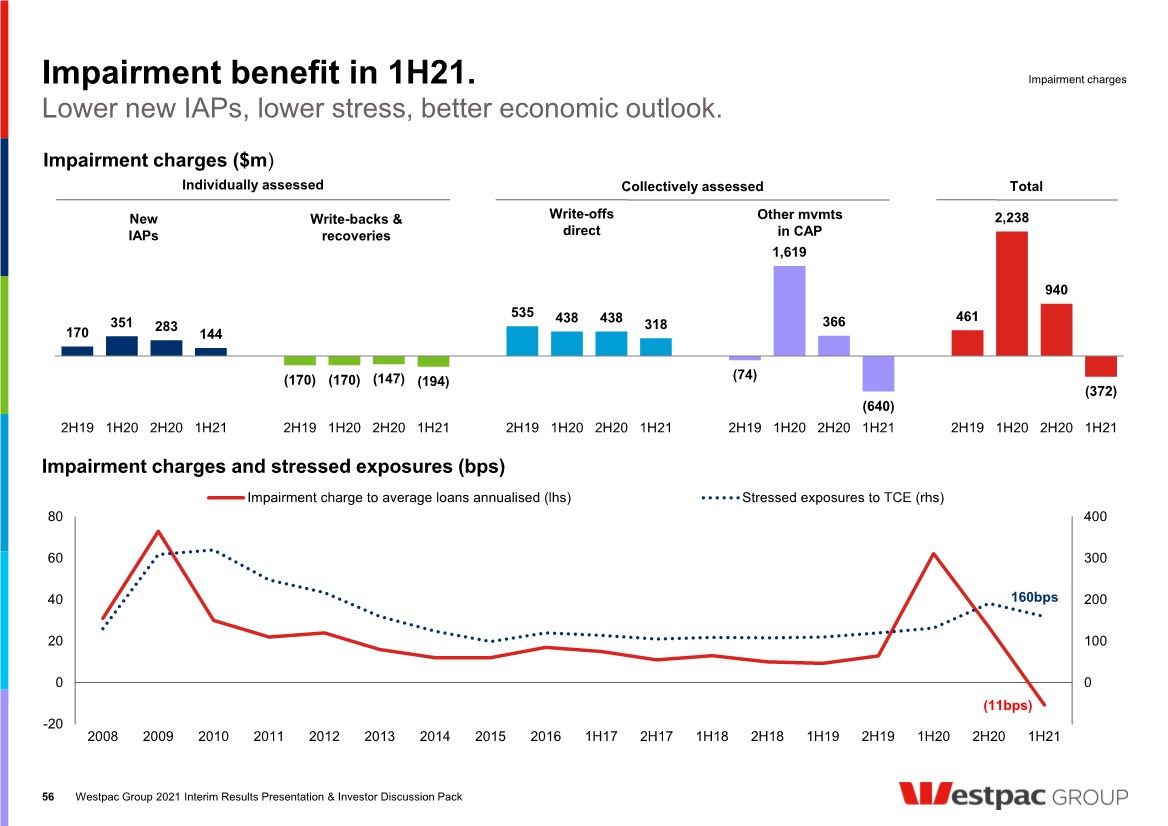
| Impairment benefit in 1H21. Westpac Group 2021 Interim Results Presentation & Investor Discussion Pack 56 Lower new IAPs, lower stress, better economic outlook. 170 351 283 144 (170) (170) (147) (194) 535 438 438 318 (74) 1,619 366 (640) 461 2,238 940 (372) 2H19 1H20 2H20 1H21 2H19 1H20 2H20 1H21 2H19 1H20 2H20 1H21 2H19 1H20 2H20 1H21 2H19 1H20 2H20 1H21 Impairment charges and stressed exposures (bps) Impairment charges ($m) New IAPs Write-backs & recoveries Write-offs direct Other mvmts in CAP Individually assessed Collectively assessed (11bps) 160bps -100 0 100 200 300 400 -20 0 20 40 60 80 2008 2009 2010 2011 2012 2013 2014 2015 2016 1H17 2H17 1H18 2H18 1H19 2H19 1H20 2H20 1H21 Impairment charge to average loans annualised (lhs) Stressed exposures to TCE (rhs) Total Impairment charges |
| Credit quality and provisions |
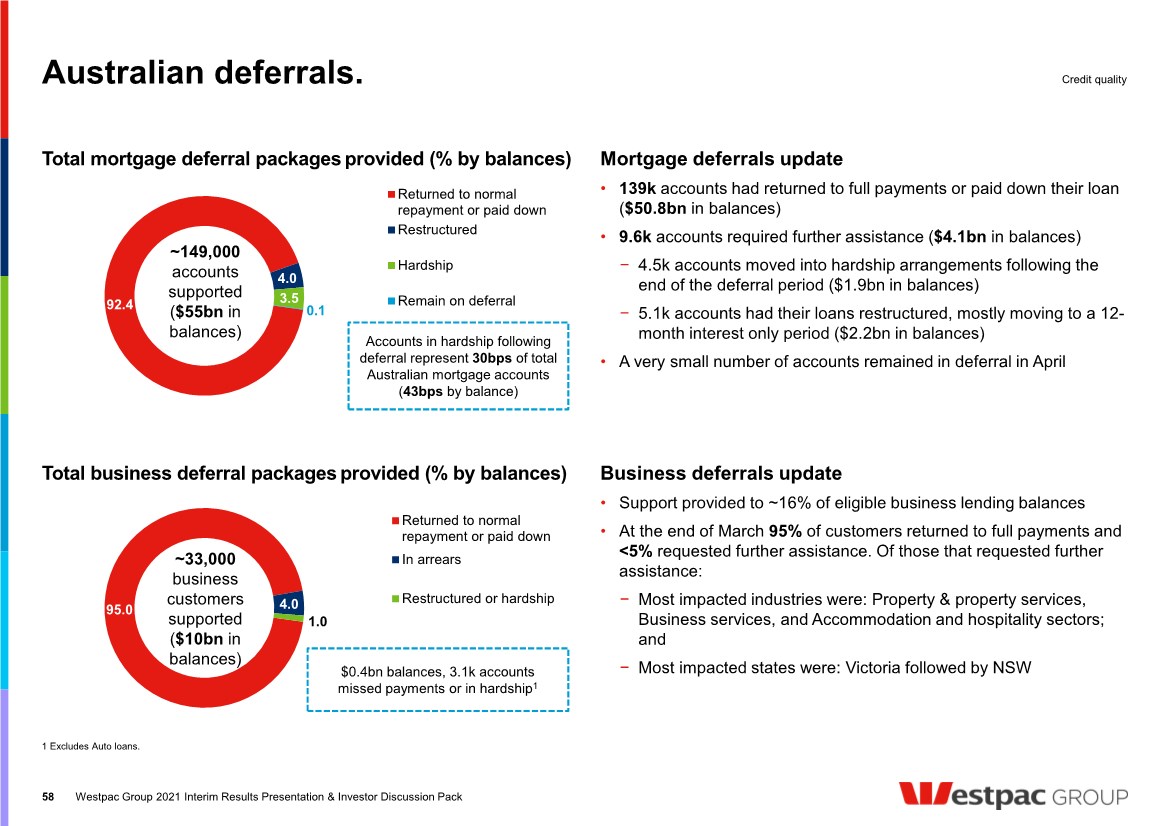
| Australian deferrals. 58 Total mortgage deferral packages provided (% by balances) Mortgage deferrals update Total business deferral packages provided (% by balances) Business deferrals update • Support provided to ~16% of eligible business lending balances • At the end of March 95% of customers returned to full payments and <5% requested further assistance. Of those that requested further assistance: − Most impacted industries were: Property & property services, Business services, and Accommodation and hospitality sectors; and − Most impacted states were: Victoria followed by NSW 1 Excludes Auto loans. Credit quality Westpac Group 2021 Interim Results Presentation & Investor Discussion Pack 92.4 4.0 3.5 0.1 Returned to normal repayment or paid down Restructured Hardship Remain on deferral Accounts in hardship following deferral represent 30bps of total Australian mortgage accounts (43bps by balance) 95.0 4.0 1.0 Returned to normal repayment or paid down In arrears Restructured or hardship • 139k accounts had returned to full payments or paid down their loan ($50.8bn in balances) • 9.6k accounts required further assistance ($4.1bn in balances) − 4.5k accounts moved into hardship arrangements following the end of the deferral period ($1.9bn in balances) − 5.1k accounts had their loans restructured, mostly moving to a 12- month interest only period ($2.2bn in balances) • A very small number of accounts remained in deferral in April $0.4bn balances, 3.1k accounts missed payments or in hardship1 ~149,000 accounts supported ($55bn in balances) ~33,000 business customers supported ($10bn in balances) |
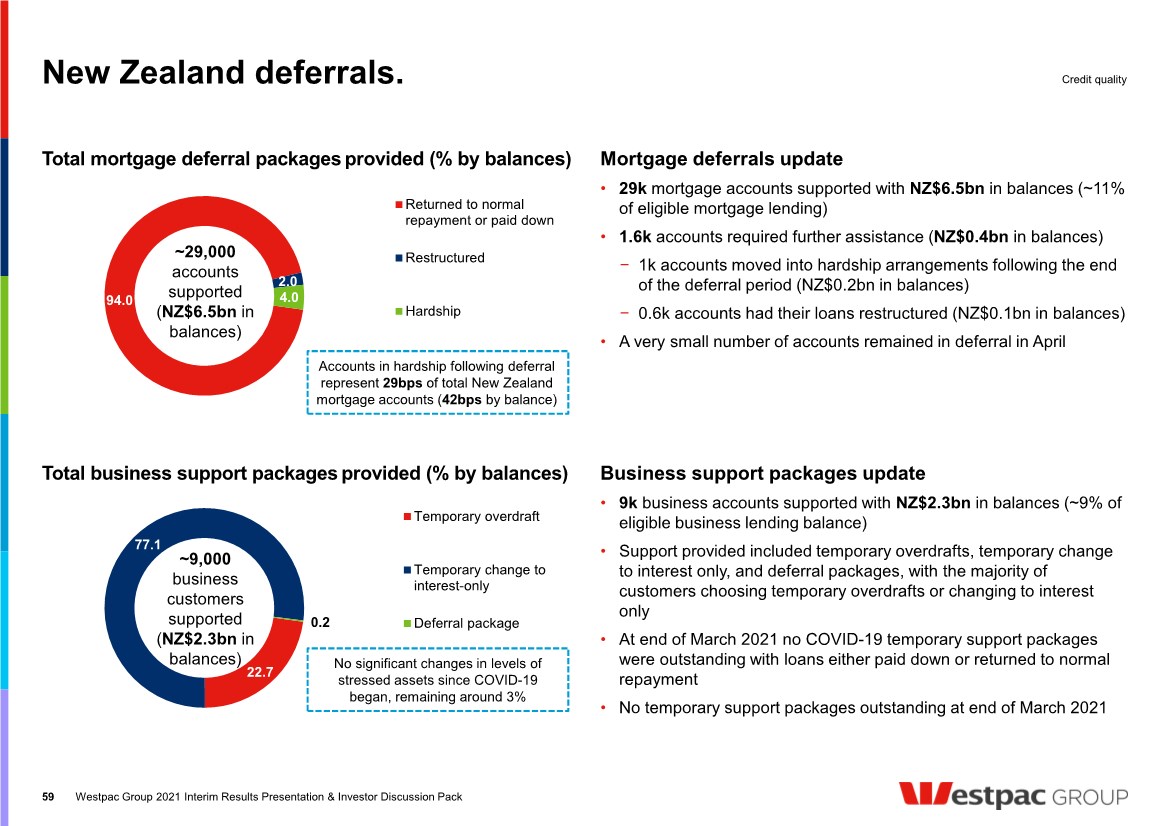
| New Zealand deferrals. 59 Total mortgage deferral packages provided (% by balances) Mortgage deferrals update Total business support packages provided (% by balances) • 9k business accounts supported with NZ$2.3bn in balances (~9% of eligible business lending balance) • Support provided included temporary overdrafts, temporary change to interest only, and deferral packages, with the majority of customers choosing temporary overdrafts or changing to interest only • At end of March 2021 no COVID-19 temporary support packages were outstanding with loans either paid down or returned to normal repayment • No temporary support packages outstanding at end of March 2021 Credit quality Westpac Group 2021 Interim Results Presentation & Investor Discussion Pack 94.0 2.0 4.0 Returned to normal repayment or paid down Restructured Hardship Accounts in hardship following deferral represent 29bps of total New Zealand mortgage accounts (42bps by balance) 22.7 77.1 0.2 Temporary overdraft Temporary change to interest-only Deferral package • 29k mortgage accounts supported with NZ$6.5bn in balances (~11% of eligible mortgage lending) • 1.6k accounts required further assistance (NZ$0.4bn in balances) − 1k accounts moved into hardship arrangements following the end of the deferral period (NZ$0.2bn in balances) − 0.6k accounts had their loans restructured (NZ$0.1bn in balances) • A very small number of accounts remained in deferral in April No significant changes in levels of stressed assets since COVID-19 began, remaining around 3% ~29,000 accounts supported (NZ$6.5bn in balances) ~9,000 business customers supported (NZ$2.3bn in balances) Business support packages update |
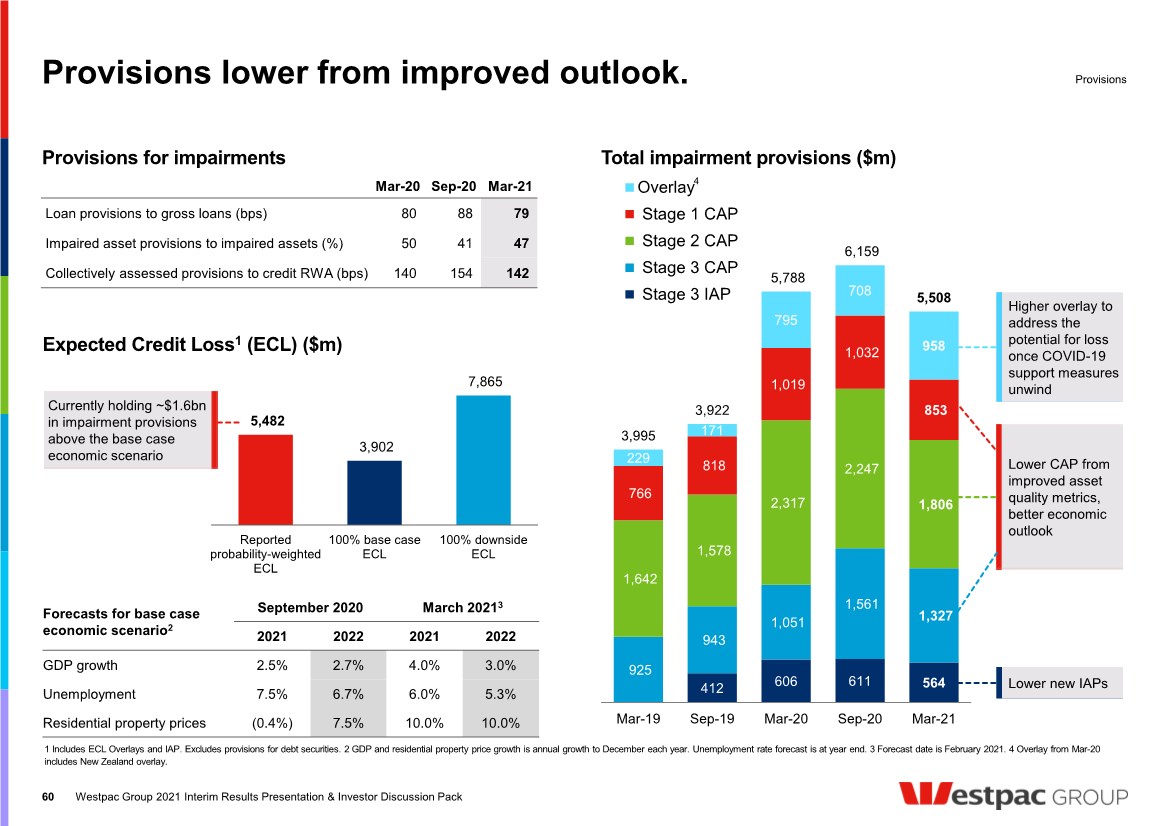
| 60 412 606 611 564 925 943 1,051 1,561 1,327 1,642 1,578 2,317 2,247 1,806 766 818 1,019 1,032 853 229 171 795 708 958 3,995 3,922 5,788 6,159 5,508 Mar-19 Sep-19 Mar-20 Sep-20 Mar-21 Overlay Stage 1 CAP Stage 2 CAP Stage 3 CAP Stage 3 IAP Provisions lower from improved outlook. Westpac Group 2021 Interim Results Presentation & Investor Discussion Pack Provisions for impairments Total impairment provisions ($m) Mar-20 Sep-20 Mar-21 Loan provisions to gross loans (bps) 80 88 79 Impaired asset provisions to impaired assets (%) 50 41 47 Collectively assessed provisions to credit RWA (bps) 140 154 142 Provisions 4 Higher overlay to address the potential for loss once COVID-19 support measures unwind Lower CAP from improved asset quality metrics, better economic outlook Lower new IAPs Forecasts for base case economic scenario2 September 2020 March 20213 2021 2022 2021 2022 GDP growth 2.5% 2.7% 4.0% 3.0% Unemployment 7.5% 6.7% 6.0% 5.3% Residential property prices (0.4%) 7.5% 10.0% 10.0% Expected Credit Loss1 (ECL) ($m) Currently holding ~$1.6bn in impairment provisions above the base case economic scenario 5,482 3,902 7,865 Reported probability-weighted ECL 100% base case ECL 100% downside ECL 1 Includes ECL Overlays and IAP. Excludes provisions for debt securities. 2 GDP and residential property price growth is annual growth to December each year. Unemployment rate forecast is at year end. 3 Forecast date is February 2021. 4 Overlay from Mar-20 includes New Zealand overlay. |
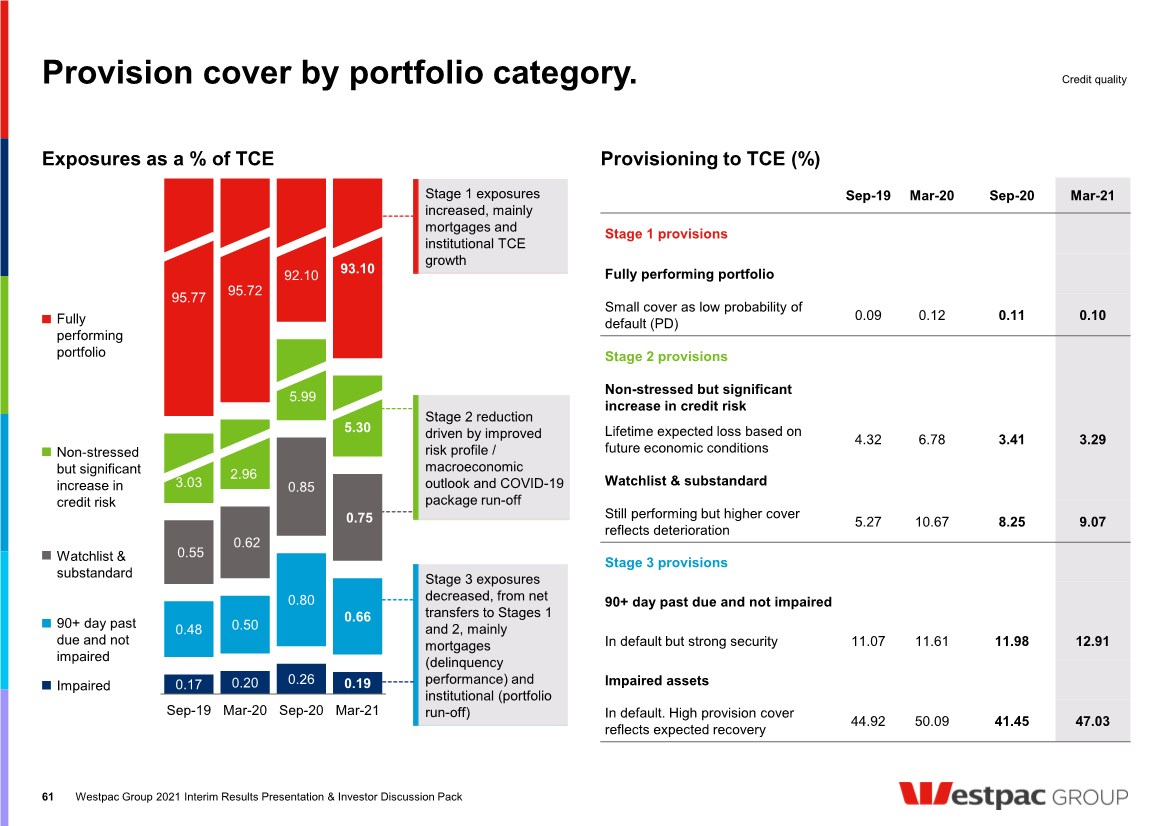
| Stage 1 exposures increased, mainly mortgages and institutional TCE growth Stage 2 reduction driven by improved risk profile / macroeconomic outlook and COVID-19 package run-off Stage 3 exposures decreased, from net transfers to Stages 1 and 2, mainly mortgages (delinquency performance) and institutional (portfolio run-off) Provision cover by portfolio category. Westpac Group 2021 Interim Results Presentation & Investor Discussion Pack Exposures as a % of TCE 0.17 0.20 0.26 0.19 0.48 0.50 0.80 0.66 0.55 0.62 0.85 0.75 3.03 2.96 5.99 5.30 95.77 95.72 92.10 93.10 Sep-19 Mar-20 Sep-20 Mar-21 Fully performing portfolio Watchlist & substandard 90+ day past due and not impaired Impaired Non-stressed but significant increase in credit risk 61 Sep-19 Mar-20 Sep-20 Mar-21 Stage 1 provisions Fully performing portfolio Small cover as low probability of default (PD) 0.09 0.12 0.11 0.10 Stage 2 provisions Non-stressed but significant increase in credit risk Lifetime expected loss based on future economic conditions 4.32 6.78 3.41 3.29 Watchlist & substandard Still performing but higher cover reflects deterioration 5.27 10.67 8.25 9.07 Stage 3 provisions 90+ day past due and not impaired In default but strong security 11.07 11.61 11.98 12.91 Impaired assets In default. High provision cover reflects expected recovery 44.92 50.09 41.45 47.03 Credit quality Provisioning to TCE (%) |
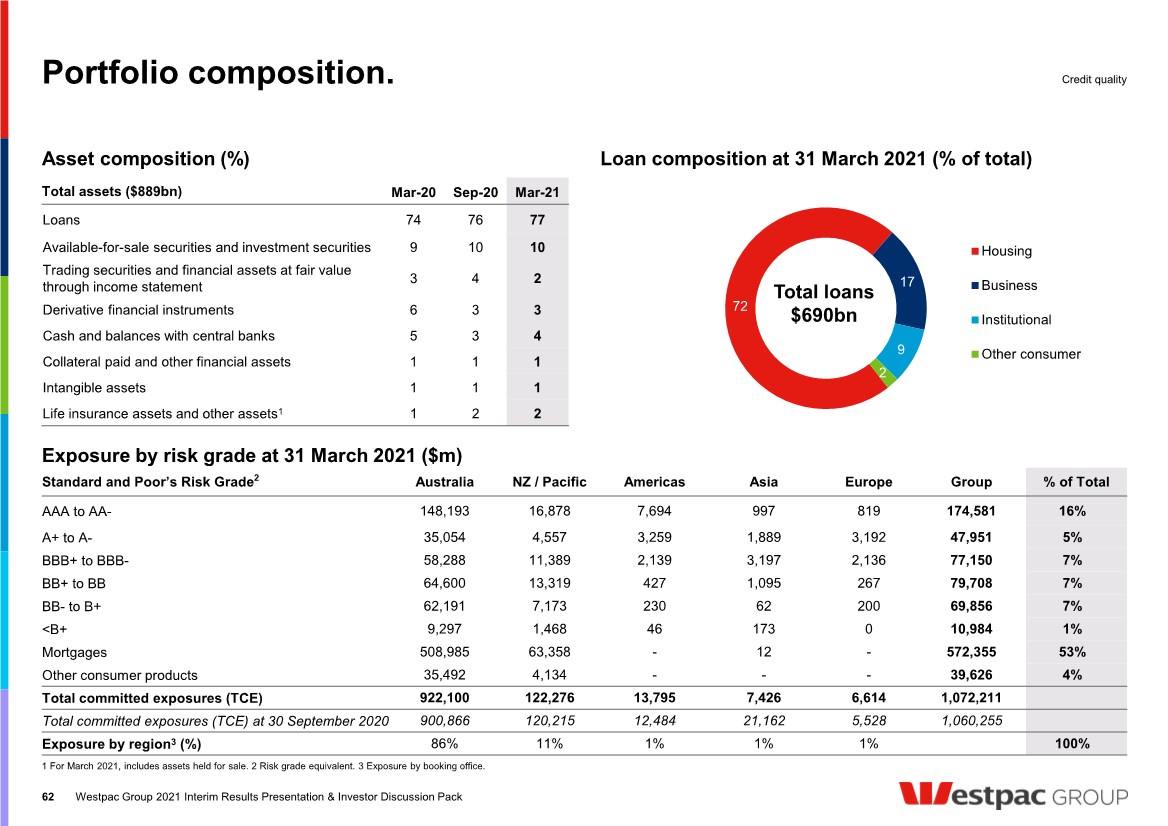
| Portfolio composition. Westpac Group 2021 Interim Results Presentation & Investor Discussion Pack 62 Asset composition (%) Loan composition at 31 March 2021 (% of total) Exposure by risk grade at 31 March 2021 ($m) 1 For March 2021, includes assets held for sale. 2 Risk grade equivalent. 3 Exposure by booking office. Total assets ($889bn) Mar-20 Sep-20 Mar-21 Loans 74 76 77 Available-for-sale securities and investment securities 9 10 10 Trading securities and financial assets at fair value through income statement 3 4 2 Derivative financial instruments 6 3 3 Cash and balances with central banks 5 3 4 Collateral paid and other financial assets 1 1 1 Intangible assets 1 1 1 Life insurance assets and other assets1 1 2 2 Standard and Poor’s Risk Grade2 Australia NZ / Pacific Americas Asia Europe Group % of Total AAA to AA- 148,193 16,878 7,694 997 819 174,581 16% A+ to A- 35,054 4,557 3,259 1,889 3,192 47,951 5% BBB+ to BBB- 58,288 11,389 2,139 3,197 2,136 77,150 7% BB+ to BB 64,600 13,319 427 1,095 267 79,708 7% BB- to B+ 62,191 7,173 230 62 200 69,856 7% <B+ 9,297 1,468 46 173 0 10,984 1% Mortgages 508,985 63,358 - 12 - 572,355 53% Other consumer products 35,492 4,134 - - - 39,626 4% Total committed exposures (TCE) 922,100 122,276 13,795 7,426 6,614 1,072,211 Total committed exposures (TCE) at 30 September 2020 900,866 120,215 12,484 21,162 5,528 1,060,255 Exposure by region3 (%) 86% 11% 1% 1% 1% 100% 72 17 9 2 Housing Business Institutional Other consumer Total loans $690bn Credit quality |
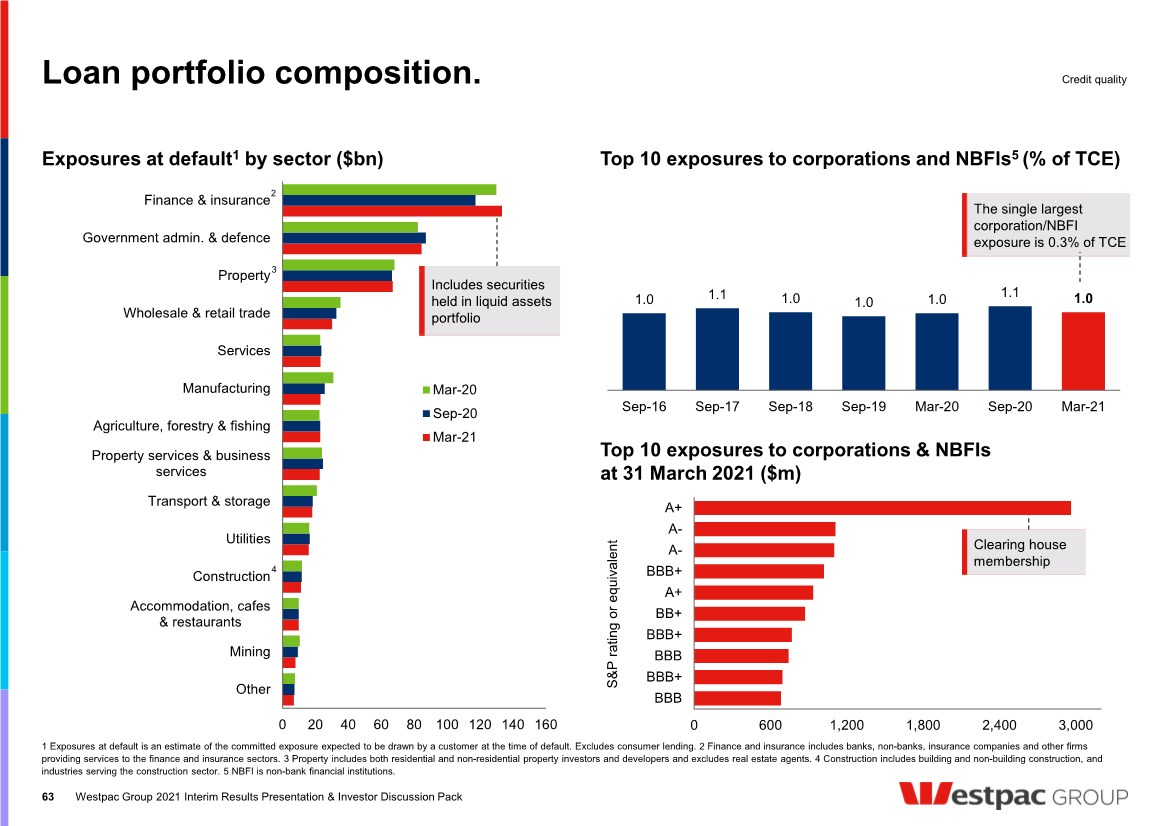
| Loan portfolio composition. Westpac Group 2021 Interim Results Presentation & Investor Discussion Pack 63 Top 10 exposures to corporations and NBFIs5 (% of TCE) Top 10 exposures to corporations & NBFIs at 31 March 2021 ($m) Exposures at default1 by sector ($bn) 1 Exposures at default is an estimate of the committed exposure expected to be drawn by a customer at the time of default. Excludes consumer lending. 2 Finance and insurance includes banks, non-banks, insurance companies and other firms providing services to the finance and insurance sectors. 3 Property includes both residential and non-residential property investors and developers and excludes real estate agents. 4 Construction includes building and non-building construction, and industries serving the construction sector. 5 NBFI is non-bank financial institutions. 1.0 1.1 1.0 1.0 1.0 1.1 1.0 Sep-16 Sep-17 Sep-18 Sep-19 Mar-20 Sep-20 Mar-21 0 600 1,200 1,800 2,400 3,000 BBB BBB+ BBB BBB+ BB+ A+ BBB+ A- A- A+ S&P rating or equivalent The single largest corporation/NBFI exposure is 0.3% of TCE 2 4 Credit quality Clearing house membership 0 20 40 60 80 100 120 140 160 Other Mining Accommodation, cafes & restaurants Construction Utilities Transport & storage Property services & business services Agriculture, forestry & fishing Manufacturing Services Wholesale & retail trade Property Government admin. & defence Finance & insurance Mar-20 Sep-20 Mar-21 Includes securities held in liquid assets portfolio 3 |
| 0.67 0.58 0.44 0.27 0.20 0.22 0.15 0.15 0.14 0.17 0.17 0.20 0.26 0.19 0.46 0.35 0.31 0.26 0.25 0.33 0.34 0.37 0.39 0.43 0.48 0.50 0.80 0.66 2.07 1.24 0.85 0.71 0.54 0.65 0.56 0.57 0.55 0.50 0.55 0.62 0.85 0.75 3.20 2.17 1.60 1.24 0.99 1.20 1.05 1.09 1.08 1.10 1.20 1.32 1.91 1.60 Sep-10 Sep-12 Sep-13 Sep-14 Sep-15 Sep-16 Sep-17 Mar-18 Sep-18 Mar-19 Sep-19 Mar-20 Sep-20 Mar-21 Stressed exposures down 31bps in 1H21. 64 Decrease in impaired, 90+ days past due and not impaired and watchlist. 1 Facilities 90 days or more past due date not impaired. These facilities, while in default, are not treated as impaired for accounting purposes. 2 Group 90+ day mortgage delinquencies, Australian 90+ day mortgage delinquencies decreased by 42bps. 3 Includes exposures that are managed on a facility by facility basis. Credit quality Stressed exposures as a % of TCE Movement in stress categories (bps) New and increased gross impaired assets ($m)3 1,194 997 958 708 609 607 633 1,078 477 589 440 471 450 519 550 897 864 222 2H12 1H13 2H13 1H14 2H14 1H15 2H15 1H16 2H16 1H17 2H17 1H18 2H18 1H19 2H19 1H20 2H20 1H21 Watchlist and substandard • Upgrades in business lending following reviews coupled with improved delinquencies in small business 90+ days past due and not impaired1 • Decrease in mortgage 90+ delinquencies of 39bps2 Impaired • Lower new IAPs and return to performing and run-off mostly from small business and institutional portfolios 132 6 30 1 22 191 (7) (14) 2 (12) 160 Mar-20 Impaired 90+ dpd not impaired Substandard Watchlist Sep-20 Impaired 90+ dpd not impaired Substandard Watchlist Mar-21 1 1 Westpac Group 2021 Interim Results Presentation & Investor Discussion Pack |

| Corporate and business stressed exposures. 1 Services includes education, health & community services, cultural & recreational and personal & other services. Westpac Group 2021 Interim Results Presentation & Investor Discussion Pack 65 Corporate and business stressed exposures by industry sector ($bn) Credit quality Stress to TCE by sector Sector Property Accomm., cafes & restaurants Wholesale & retail trade Agriculture, forestry & fishing Property & business services Services1 Manufacturing Construction Transport & storage Mining Finance & Insurance Utilities Sep-20 (%) 2.8 16.0 6.2 6.6 5.1 4.0 3.5 5.8 3.1 2.3 0.2 0.2 Mar-21 (%) 2.9 14.6 4.8 6.0 4.3 3.7 3.3 6.1 2.7 3.4 0.2 0.2 Reduction in part due to lower stress in motor vehicle retailing and services Increase reflects small number of names mainly in business division Mostly downgrades to watchlist 0.0 0.2 0.4 0.6 0.8 1.0 1.2 1.4 1.6 1.8 2.0 Property Accommodation, cafes & restaurants Wholesale & retail trade Agriculture, forestry & fishing Property & business services Services Manufacturing Construction Transport & storage Mining Finance & insurance Utilities Mar-20 Sep-20 Mar-21 |
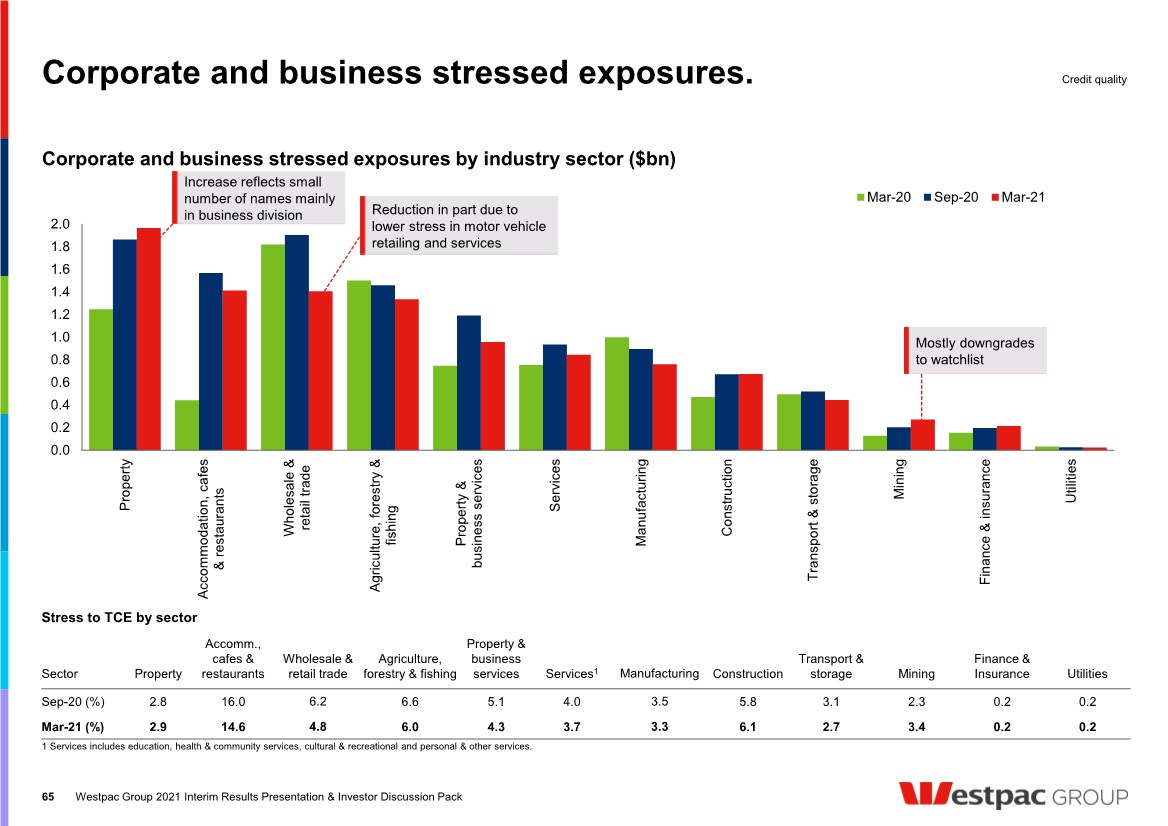
| Sectors in focus. Westpac Group 2021 Interim Results Presentation & Investor Discussion Pack 66 Accommodation, cafes and restaurants Accommodation, cafes & restaurants and Construction. 1 Includes impaired exposures. 2 Percentage of portfolio TCE. 3 Fully secured: Secured loan to collateral value ratio ≤ 100%, Partially secured: Secured loan to collateral value ratio > 100%, but < 150%, Unsecured: Secured loan to collateral value ratio > 150%, or no security held. Credit quality Mar-20 Sep-20 Mar-21 Total committed exposures (TCE) $9.7bn $9.8bn $9.7bn Lending $8.7bn $8.5bn $8.3bn As a % of Group TCE 0.90 0.92 0.91 % of portfolio graded as stressed1,2 4.57 16.00 14.55 % of portfolio impaired2 0.38 0.73 0.67 Portfolio security composition3 (TCE) (%) Portfolio by sub-sector (TCE) (%) 38 32 24 6 Accommodation Pubs, Taverns and Bars Cafes and Restaurants Clubs (Hospitality) 67 25 8 Fully Secured Partially Secured Unsecured Construction Portfolio security composition3 (TCE) (%) Portfolio by sub-sector (TCE) (%) Mar-20 Sep-20 Mar-21 Total committed exposures (TCE) $11.7bn $11.5bn $11.1bn Lending $8.5bn $7.9bn $7.6bn As a % of Group TCE 1.08 1.09 1.04 % of portfolio graded as stressed1,2 4.04 5.85 6.06 % of portfolio impaired2 0.92 1.65 1.11 61 19 20 Fully Secured Partially Secured Unsecured 24 12 9 6 16 7 26 Building Construction Non-Building Construction Site Preparation Services Building Structure Services Installation Trade Services Building Completion Services Other Construction Services |
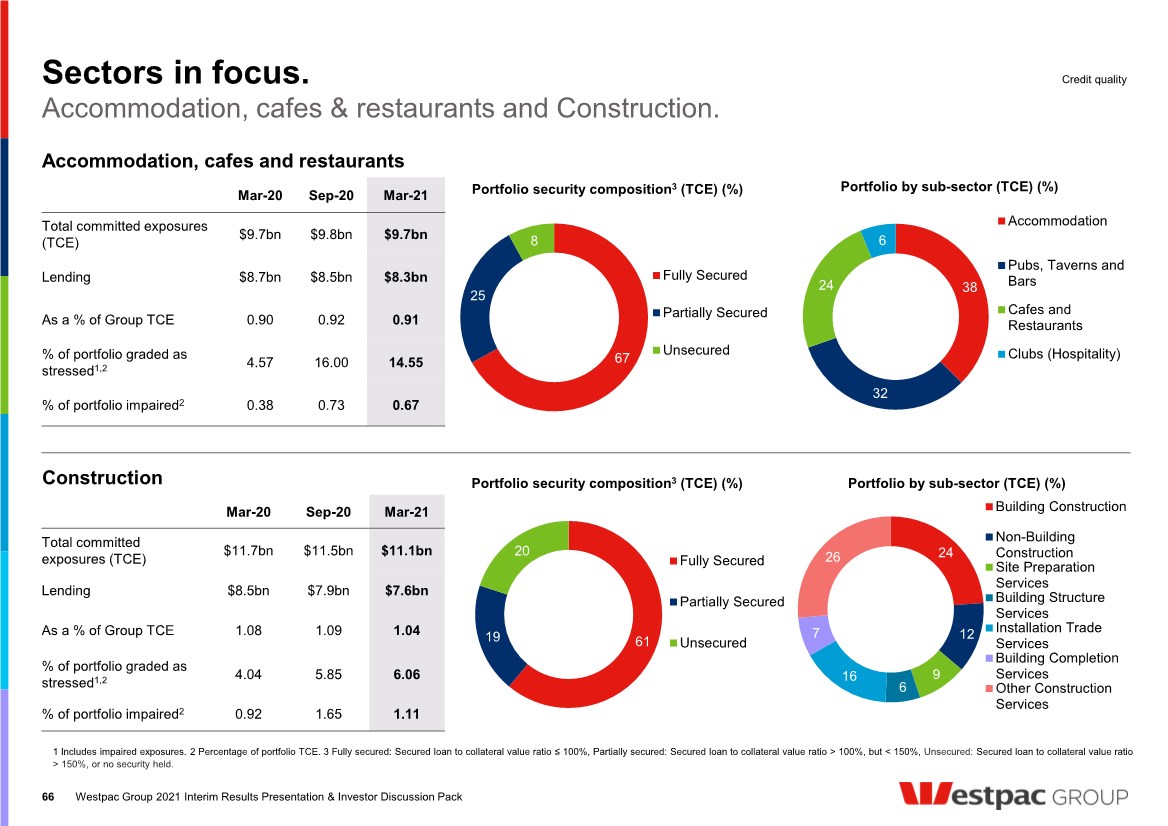
| Sectors in focus. Westpac Group 2021 Interim Results Presentation & Investor Discussion Pack 67 Commercial property Commercial property exposures % of TCE and % in stress Commercial property portfolio composition (TCE) (%) Commercial property. 1 Includes impaired exposures. 2 Percentage of commercial property portfolio TCE. Credit quality Mar-20 Sep-20 Mar-21 Total committed exposures (TCE) $67.6bn $65.9bn $67.4bn Lending $52.7bn $51.9bn $52.2bn As a % of Group TCE 6.25 6.22 6.28 Median risk grade (S&P equivalent) BB+ BB+ BB+ % of portfolio graded as stressed1,2 1.84 2.83 2.92 % of portfolio impaired2 0.11 0.16 0.14 0 5 10 15 20 0 2 4 6 8 Sep-11 Mar-12 Sep-12 Mar-13 Sep-13 Mar-14 Sep-14 Mar-15 Sep-15 Mar-16 Sep-16 Mar-17 Sep-17 Mar-18 Sep-18 Mar-19 Sep-19 Mar-20 Sep-20 Mar-21 Commercial property as % of TCE (lhs) Commercial property % in stress (rhs) 33 20 21 12 12 2 Commercial Offices Residential Retail Industrial Corporate Other 23 8 6 2 3 11 47 NSW & ACT VIC QLD SA & NT WA NZ & Pacific Institutional 40 7 38 15 Investors & Developers <$10m Developers >$10m Investors >$10m Diversified Property Groups and Property Trusts >$10m Borrower type (%) Region (%) Sector (%) |
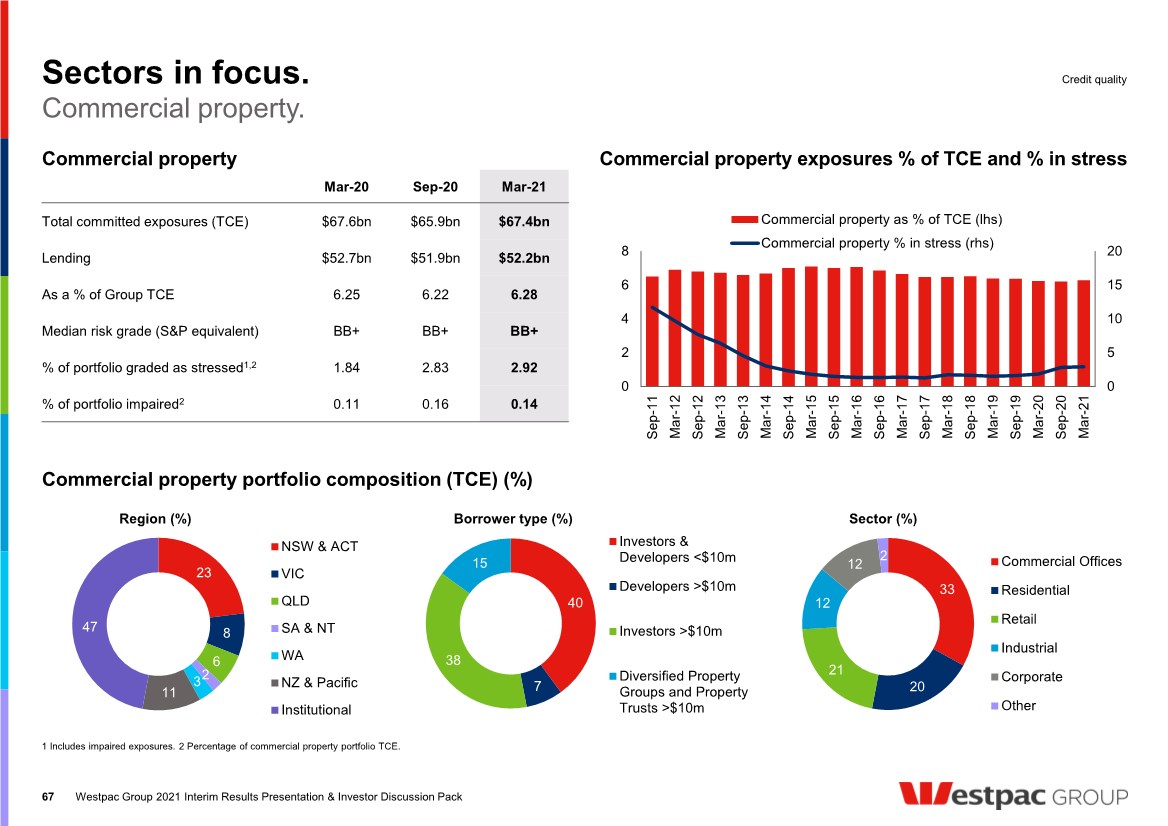
| Sectors in focus. 68 Retail trade Retail trade exposure by sub-sector (TCE) ($bn) Retail trade portfolio graded as stressed (%) Retail trade by internal risk grade category (TCE) ($bn) Retail trade. 1 Includes impaired exposures. 2 Percentage of retail trade portfolio TCE. Credit quality Mar-20 Sep-20 Mar-21 Total committed exposures (TCE) $15.5bn $15.0bn $13.9bn Lending $11.1bn $9.5bn $8.7bn As a % of Group TCE 1.43 1.41 1.30 Median risk grade BB equivalent BB equivalent BB equivalent % of portfolio graded as stressed1,2 6.70 7.26 5.48 % of portfolio impaired2 1.44 1.84 1.82 3.02 4.67 4.84 5.43 6.05 6.70 7.26 5.48 Sep-17 Mar-18 Sep-18 Mar-19 Sep-19 Mar-20 Sep-20 Mar-21 7.0 6.4 4.4 4.0 3.6 3.4 Sep-20 Mar-21 Sep-20 Mar-21 Sep-20 Mar-21 Investment Sub-investment Stressed Decreasing stress reflects improving economic conditions, in particular the improved trading across the motor vehicle industry Personal and household goods retailing Motor vehicle retailing and services Food retailing Westpac Group 2021 Interim Results Presentation & Investor Discussion Pack 7.0 4.6 3.8 7.0 4.4 3.6 6.4 4.0 3.4 Personal and household goods retailing Motor vehicle retailing and services Food retailing Mar-20 Sep-20 Mar-21 |
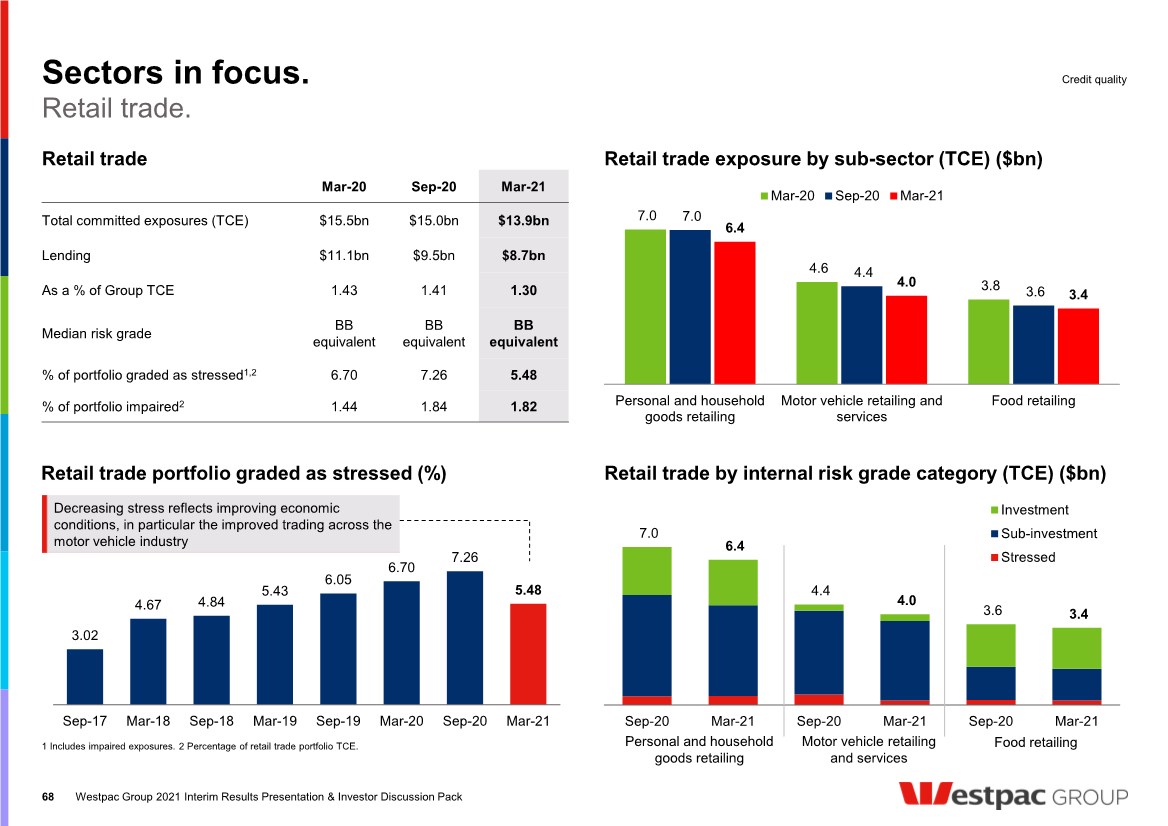
| 0.50 1.50 2.50 Sep-18 Mar-19 Sep-19 Mar-20 Sep-20 Mar-21 1.92% Australian consumer finance. Westpac Group 2021 Interim Results Presentation & Investor Discussion Pack 69 Australian consumer finance portfolio1 Total consumer finance 90+ day delinquencies (%) Australian consumer finance portfolio ($bn)1 Australian consumer finance portfolio ($bn) 1 Does not include Margin Lending. Credit quality 8.3 3.8 6.3 18.4 6.8 3.0 5.9 15.7 6.8 2.8 5.4 15.0 Credit cards Personal loans Auto loans (consumer) Total consumer finance Mar-20 Sep-20 Mar-21 2% of Group loans. Consumer unsecured 90+ day delinquencies down 17bps mostly due to portfolio improvement 0 1 2 3 0 5 10 15 20 25 Mar-19 May-19 Jul-19 Sep-19 Nov-19 Jan-20 Mar-20 May-20 Jul-20 Sep-20 Nov-20 Jan-21 Mar-21 Unsecured performing loans balance ($bn lhs) Unsecured 90+ day delinquencies balance ($bn rhs) Mar-20 Sep-20 Mar-21 Lending $18.4bn $15.7bn $15.0bn 30+ day delinquencies (%) 4.22 3.62 3.58 90+ day delinquencies (%) 1.97 2.09 1.92 90+ day delinquencies down 17bps over the period, reflecting 26bps improvement in portfolio, offset by 9bps from contraction in loans. |
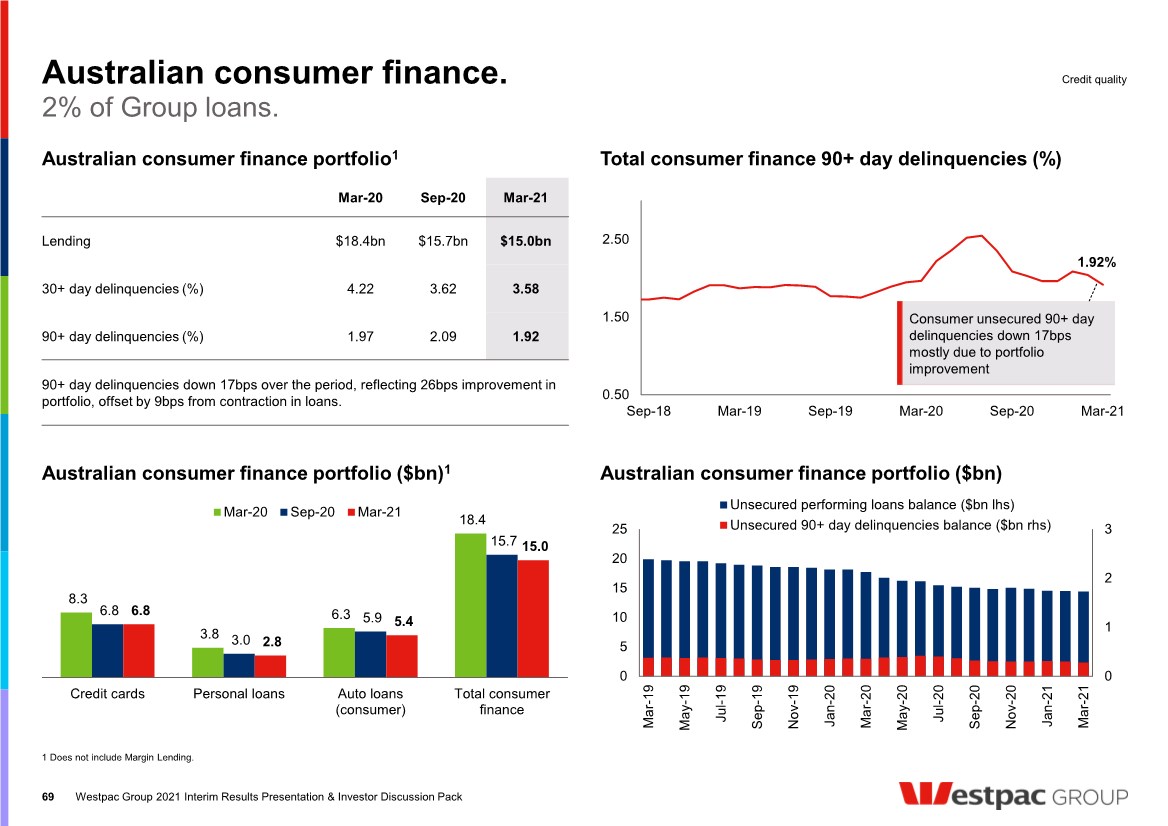
| Australian mortgage delinquencies. Westpac Group 2021 Interim Results Presentation & Investor Discussion Pack 70 Lower over the half in line with hardship balances. 1 Financial hardship assistance is available to customers experiencing unforeseen events, including changes in income due to illness, a relationship breakdown or natural disasters. Hardship assistance often takes the form of a reduction or deferral of repayments for a short period. Customer requesting financial hardship assistance must provide a statement of financial position and an assessment is made regarding the customer’s eligibility. 2 Mortgage loss rates are write-offs for the 6 months ending. Mortgage asset quality Australian mortgage delinquencies (%) Australian mortgages Mar-20 Sep-20 Mar-21 Total portfolio 30+ day delinquencies (bps) 188 214 179 Total portfolio 90+ day delinquencies (bps) (inc. impaired mortgages) 94 162 120 Investment property loans 90+ day delinquencies (bps) 78 148 118 Interest only loans 90+ day delinquencies (bps) 73 125 91 Customers in hardship1 (by balances, bps) 105 129 113 Consumer properties in possession (number) 468 256 180 Impaired mortgages (by balances, bps) 9 8 6 Australian mortgage 90+ day delinquencies by State (%) 0.0 1.0 2.0 3.0 Mar-18 Sep-18 Mar-19 Sep-19 Mar-20 Sep-20 Mar-21 NSW/ACT VIC/TAS QLD WA SA/NT ALL 0.0 1.0 2.0 3.0 4.0 Mar-18 Sep-18 Mar-19 Sep-19 Mar-20 Sep-20 Mar-21 90+ day past due total 30+ day past due total Australian mortgage hardship balances ($bn and # of accounts) 0 4,000 8,000 12,000 16,000 20,000 0 1 2 3 4 5 6 7 Mar-18 May-18 Jul-18 Sep-18 Nov-18 Jan-19 Mar-19 May-19 Jul-19 Sep-19 Nov-19 Jan-20 Mar-20 May-20 Jul-20 Sep-20 Nov-20 Jan-21 Mar-21 Balances ($bn, lhs) Number of accounts (rhs) |
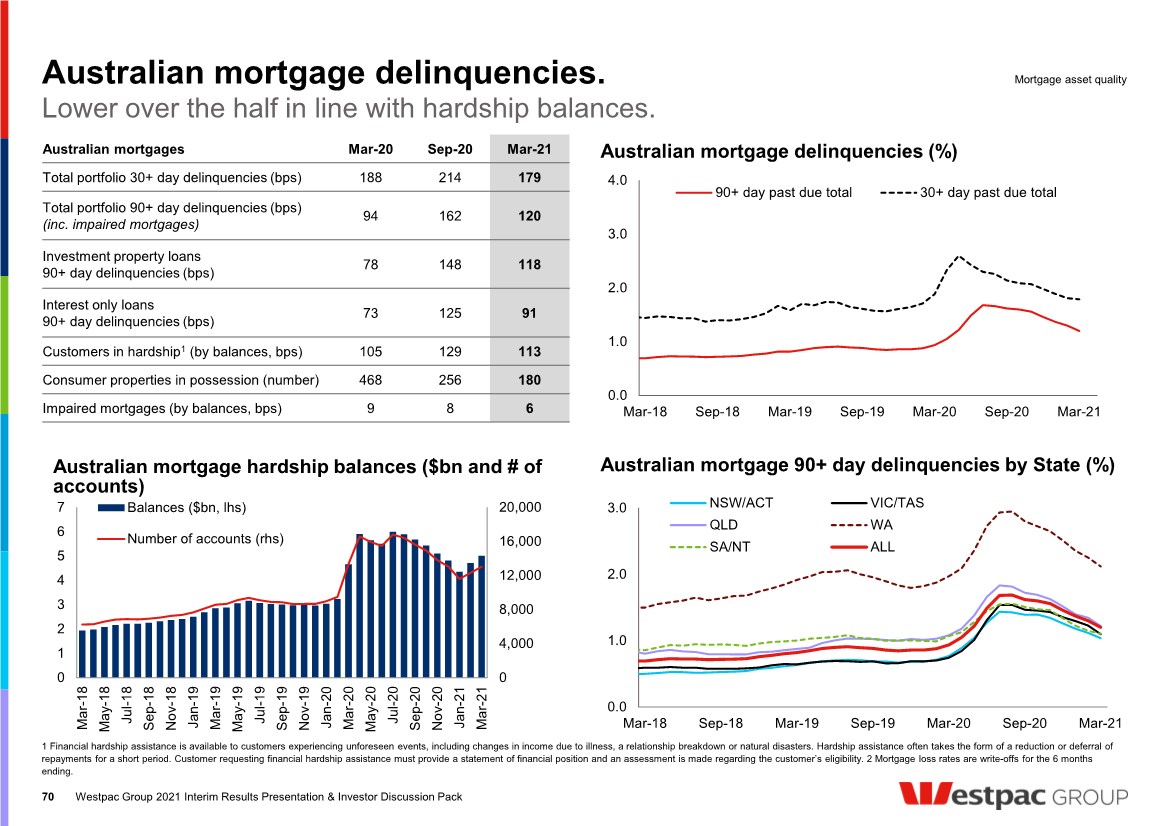
| Australian mortgage portfolio composition. Westpac Group 2021 Interim Results Presentation & Investor Discussion Pack 1 Flow is new mortgages settled in the 6 months ended 31 March 2021 and includes RAMS. 2 Includes amortisation. Calculated at account level, where split loans represent more than one account. 3 Loans ahead on payments exclude equity/line of credit products as there are no scheduled principal payments. 4 Mortgage loss rates are write-offs for the 6 months ending. 71 Owner occupiers driving new flows; more customers choosing fixed rates. Mortgage asset quality Australian mortgage portfolio Mar-20 balance Sep-20 balance Mar-21 balance 1H21 Flow1 Total portfolio ($bn) 445.7 440.9 443.6 42.0 Owner occupied (OO) (%) 59.4 60.4 62.0 73.6 Investment property loans (IPL) (%) 37.6 36.6 35.2 26.2 Portfolio loan/line of credit (LOC) (%) 2.9 2.5 2.3 0.2 Variable rate / Fixed rate (%) 77 / 23 72 / 28 68/32 63/37 Interest only (I/O) (%) 23.4 20.6 18.2 13.6 Proprietary channel (%) 55.5 54.8 54.2 48.2 First home buyer (%) 8.8 9.0 9.4 13.4 Mortgage insured (%) 16.1 16.0 16.1 16.1 Mar-20 Sep-20 Mar-21 1H21 Flow1 Average loan size2 ($’000) 276 275 284 367 Customers ahead on repayments including offset account balances3 (%) 70 71 72 Actual mortgage losses net of insurance ($m, for the 6 months ending) 67 58 44 Actual mortgage loss rate annualised4 (bps, for the 6 months ending) 3 3 2 Australian mortgage portfolio and 1H21 flow by product and repayment type (%) 3 16 22 7 52 3 15 22 6 55 2 13 22 5 57 0.2 10 18 4 69 LOC IPL-I/O IPL-P&I OO-I/O OO-P&I Mar-20 (Portfolio) Sep-20 (Portfolio) Mar-21 (Portfolio) 1H21 Flow 76 75 77 72 68 24 25 23 28 32 1H19 2H19 1H20 2H20 1H21 Variable Fixed Australian mortgage portfolio by interest rate type (% by balances) |
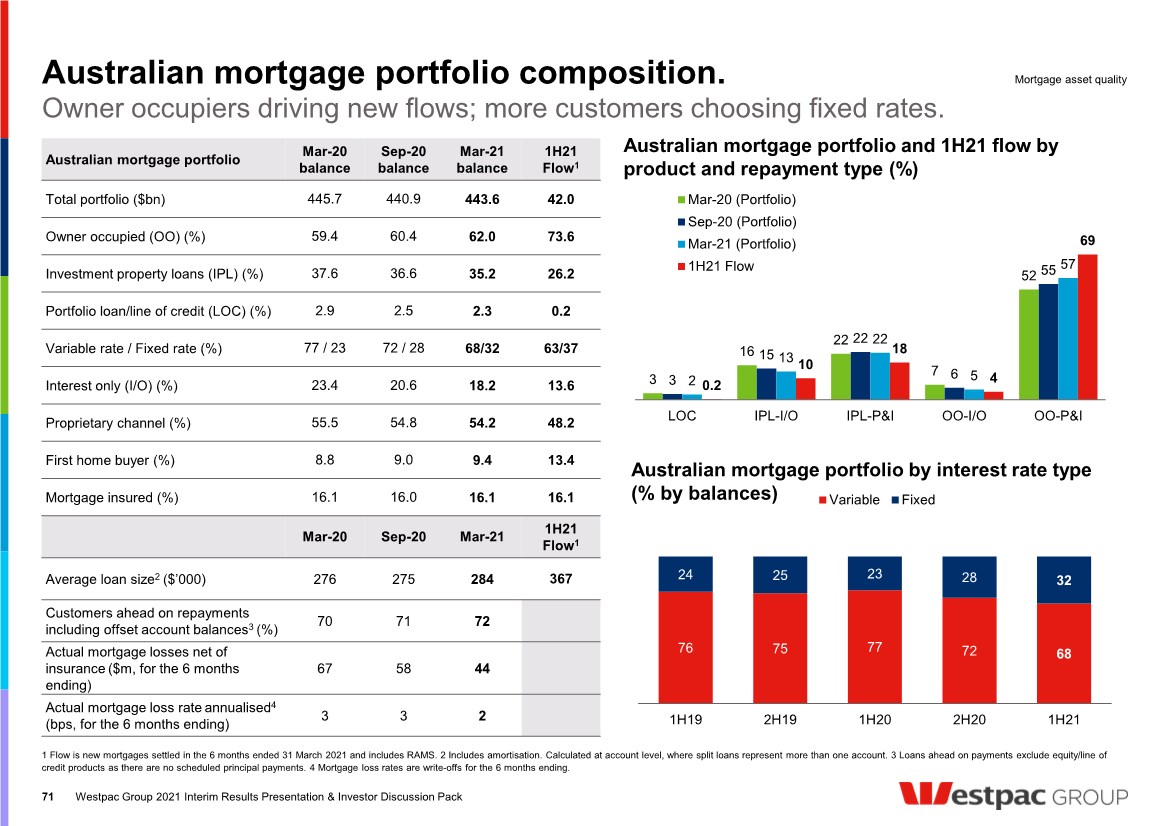
| Australian mortgage portfolio. Westpac Group 2021 Interim Results Presentation & Investor Discussion Pack 72 Australian housing loan-to-value ratios (LVRs) (%) Majority of borrowers have significant equity. 1 Dynamic LVR is the loan-to-value ratio taking into account the current loan balance, changes in security value, offset account balances and other loan adjustments. Property valuation source CoreLogic. 2 Weighted average LVR calculation considers size of outstanding balances. 3 Average LVR of new loans is on rolling 6 months. 4 Interest rates for Westpac Rocket Repay Home Loan/Rocket Investment Loan inclusive of Premier Advantage Package discount assuming LVR up to 70%. At 14 April 2021. Mortgage asset quality Australian mortgage portfolio LVRs Mar-20 balance Sep-20 balance Mar-21 balance Weighted averages2 LVR at origination (%) 73 73 73 Dynamic LVR1 (%) 57 56 54 LVR of new loans3 (%) 72 71 72 20 16 42 13 9 0 N/A 18 14 47 12 7 2 56 17 16 8 2 1 1 0 10 20 30 40 50 60 70 80 90 100 0<=60 60<=70 70<=80 80<=90 90<=95 95<=100 >100 1H21 drawdowns LVR at origination Portfolio LVR at origination Portfolio dynamic LVR1 Serviceability assessment rate4 (%) 3.19 3.74 2.50 2.50 5.69 6.24 Owner Occupied P&I Investor P&I Serviceability assessment rate Floor rate 5.05% • Loans are assessed at the higher of the customer rate (including any life-of-loan discounts) plus a 2.50% buffer, or the minimum assessment rate (called the “floor rate”) • Westpac applies a floor rate of 5.05% • Interest only loans are assessed based on the residual P&I term using the applicable P&I rate • Fixed rate loans are assessed on the variable rate to which the loan will revert after the fixed period – usually higher than the fixed rate 2.50% buffer applied in serviceability test |
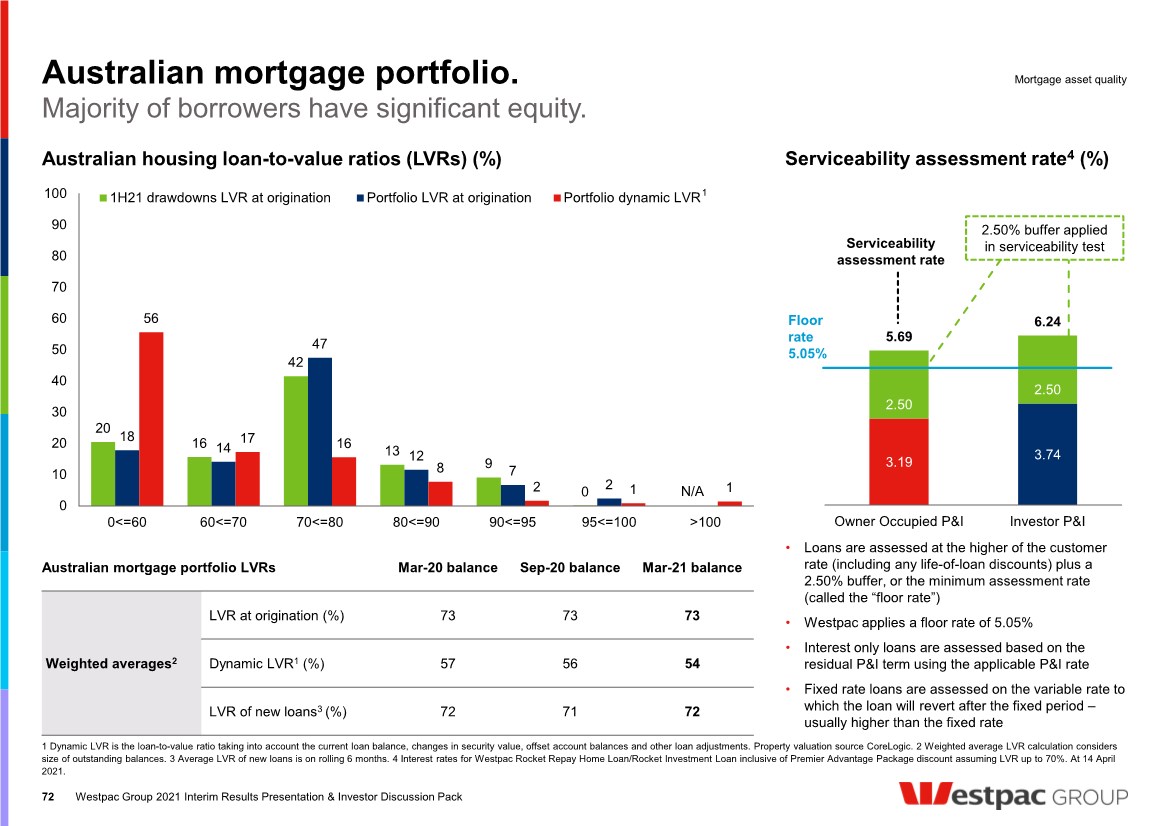
| 10 9 8 20 Mar-21 Investment property loans - incentive is to keep repayments high for tax purposes Accounts opened in the last 12 months Loans with structural restrictions on repayments e.g. fixed rate Residual - less than 1 month repayment buffer Loans ‘on time’ and <1 mth ahead (% of balances) Australian mortgage portfolio repayment buffers. Westpac Group 2021 Interim Results Presentation & Investor Discussion Pack 73 Offset account balances2 ($bn) Australian home loan customers ahead on repayments1 (% by balances) >70% of customers remain ahead of scheduled repayments. 1 Customer loans ahead on payments exclude equity/line of credit products as there are no scheduled principal payments. Includes mortgage offset accounts. ‘Behind’ is more than 30 days past due. ‘On time’ includes up to 30 days past due. 2 Includes RAMS from September 2020 onwards. Mortgage asset quality 31 33 35 36 37 39 39 40 41 42 46 48 Sep-15 Mar-16 Sep-16 Mar-17 Sep-17 Mar-18 Sep-18 Mar-19 Sep-19 Mar-20 Sep-20 Mar-21 Linked to I/O mortgages Linked to P&I mortgages 2 28 20 16 6 6 21 2 27 18 16 6 6 24 2 27 20 16 6 6 24 Behind On time < 1 Mth < 6 Mths < 1 Yr < 2 Yrs >2 Yrs Mar-20 Sep-20 Mar-21 47 10 12 14 13 20 26 5 4 6 8 8 19 46 10 <75k 75k to 100k 100k to 125k 125k to 150k 150k to 200k 200k to 500k >500k Owner Occupied Investment Property Loan Applicant gross income band (1H21 drawdowns, % by balances) |
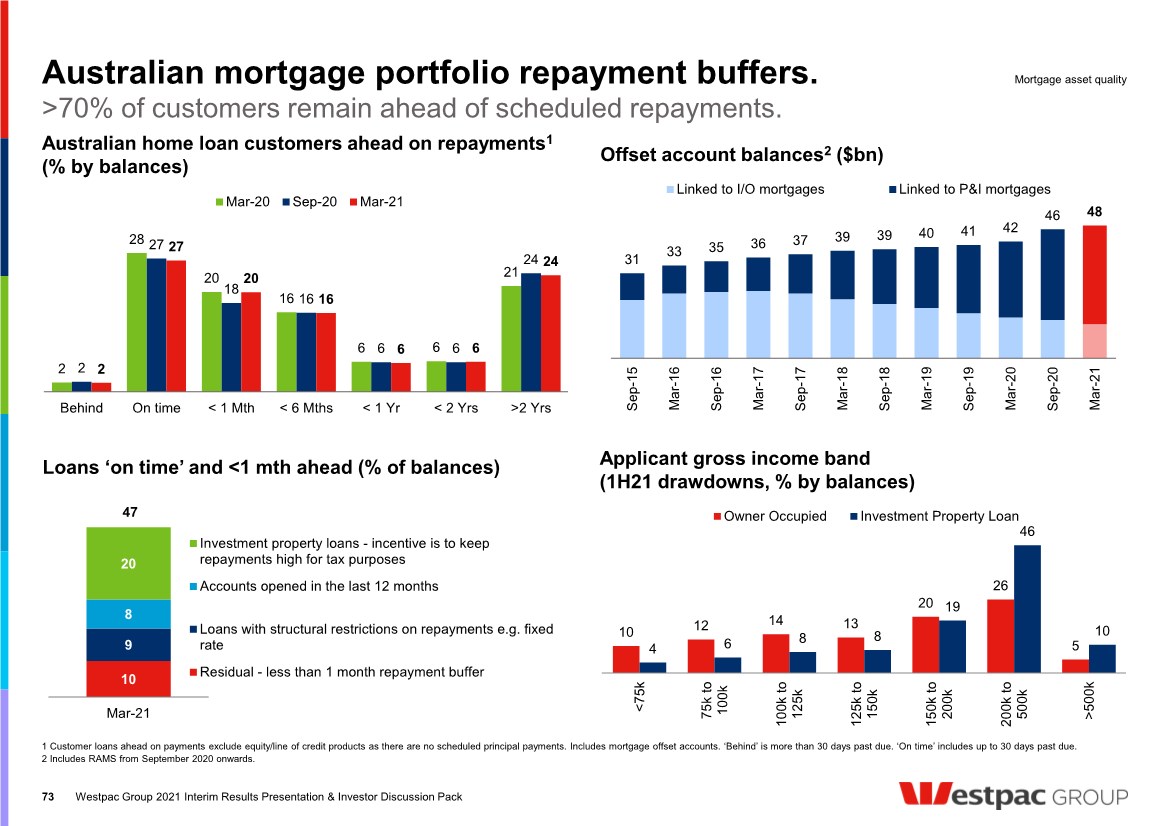
| Australian mortgage portfolio underwriting. Westpac Group 2021 Interim Results Presentation & Investor Discussion Pack 74 Credit policy at April 2021 Australian mortgage portfolio by year of origination (% of total book) 1 HEM is the Household Expenditure Measure, produced by the Melbourne Institute. Mortgage asset quality 2 1 1 1 2 2 2 3 4 6 8 9 11 12 12 16 6 Pre-2006 2006 2007 2008 2009 2010 2011 2012 2013 2014 2015 2016 2017 2018 2019 2020 2021 Calendar year Income • Income verified via payslips or tax returns with other supporting documentation such as PAYG income statements and salary credits to accounts where required (minimum standards for documents apply) • Discount of at least 20% applies to less certain income sources i.e. rental income, bonuses Credit Score & Credit Bureau • Bespoke application scorecards segmented by new and existing customers • Credit and score override rates tracked and capped • Credit bureau checks required Expenses • Expenses are assessed as the higher of a borrower’s HEM1 comparable expenses or HEM, plus any expenses that are not comparable to HEM (e.g. private school fees, life insurance) • HEM is adjusted by income bands, post settlement postcode location, marital status and dependants • 17 expense categories used, aligned with Melbourne Institute guidelines and LIXI standards Serviceability assessment • For serviceability assessment, interest rate applied to all mortgage debt is the greater of: – Actual interest rate plus buffer of 2.50%; and – Minimum assessment rate of 5.05% (effective 9 October 2020, previously 5.35%) • For IO Loans, serviceability is assessed on a P&I basis over the residual term • All existing customer commitments are verified • Review Westpac Group accounts and Comprehensive Credit Reporting (CCR) to identify customer commitments • Limits apply to higher debt-to-Income lending; above 7x referred for manual credit assessment • Credit card repayments assessed at 3.8% of limit Genuine savings deposit requirements • Minimum 5% proof of genuine savings for higher LVR loans (typically LVR >85%). First Home Owners Grants not considered genuine savings Security • LVR restrictions apply depending on location, property value and nature of security • Restrictions on high-density apartments based in postcode defined areas (generally Capital City CBD’s) and properties in towns heavily reliant on a single industry (e.g. mining, tourism) LMI • Mortgage insurance for higher risk loans, such as high LVRs. Exception policy applies for certain professionals and Westpac Group staff. |
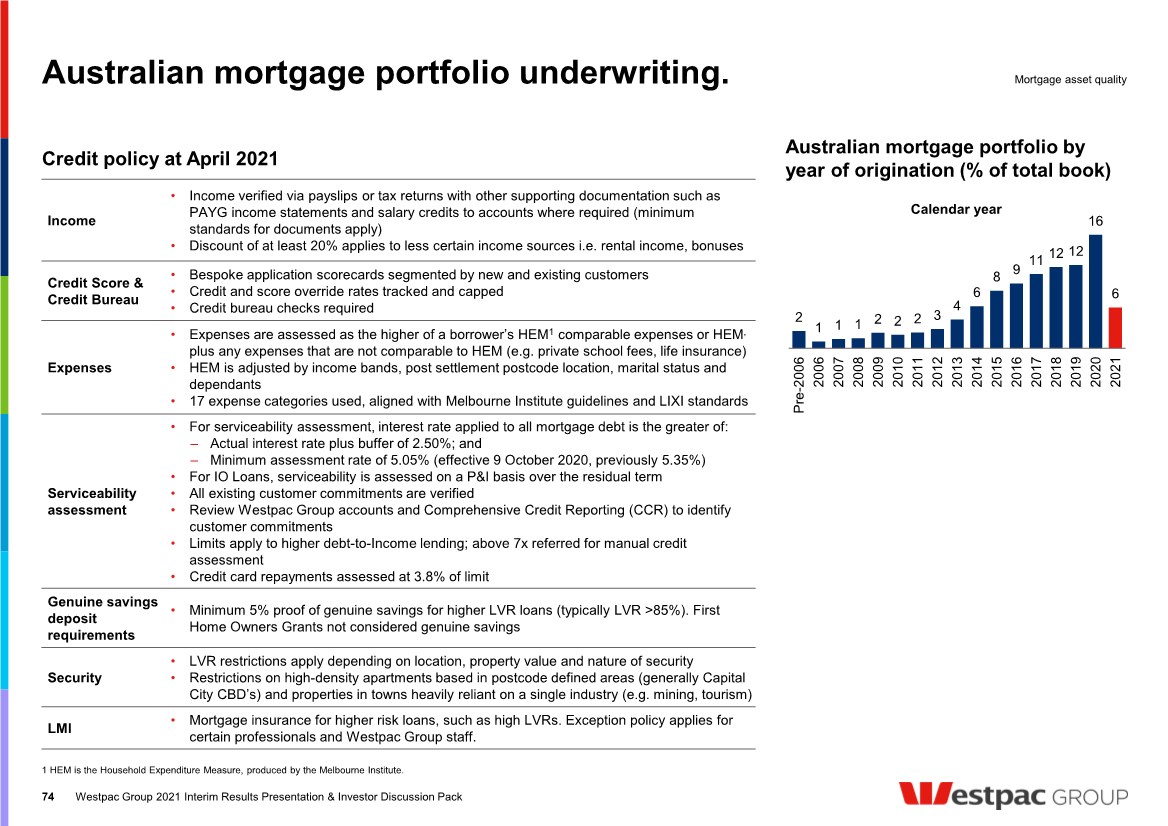
| Australian mortgages. Westpac Group 2021 Interim Results Presentation & Investor Discussion Pack 75 Scheduled I/O term expiry2 (% of total I/O loans) I/O lending by dynamic LVR1 and income band (%) Interest only and investment property lending. 1 Dynamic LVR is the loan-to-value ratio taking into account the current loan balance, changes in security value, offset account balances and other loan adjustments. Property valuation source CoreLogic. 2 Based on outstanding balance. Excludes line of credit loans, I/O loans without date (including bridging loans and loans with construction purpose) and I/O loans that should have switched to P&I but for the previously announced mortgage processing error. 3 Includes amortisation. Calculated at account level where split loans represent more than one account. 4 Customer loans ahead on payments exclude equity/line of credit products as there are no scheduled principal payments. Mortgage asset quality 11 6 2 27 17 6 17 10 3 55 33 12 <=60% 60%<=80% >80% Dynamic LVR bands (%) <$100k $100k - $250k >$250k 25 18 11 11 11 23 1 0<1 Yr 1<2 Yrs 2<3 Yrs 3<4 Yrs 4<5 Yrs 5<10 Yrs 10 Yrs+ Applicant gross income bands Chart does not add due to rounding Investment property portfolio by number of properties per customer (%) 64 25 7 211 1 2 3 4 5 6+ Investment property lending (IPL) portfolio Mar-20 Sep-20 Mar-21 Investment property loans ($bn) 167 161 157 Weighted averages1 LVR of IPL loans at origination (%) 72 72 72 LVR of new IPL loans in the period2 (%) 70 69 70 Dynamic LVR1 of IPL loans (%) 57 57 54 Average loan size3 ($’000) 322 320 320 Customers ahead on repayments including offset accounts4 (%) 60 62 63 90+ day delinquencies (bps) 78 148 118 Annualised loss rate (net of insurance claims) (bps) 5 3 3 |
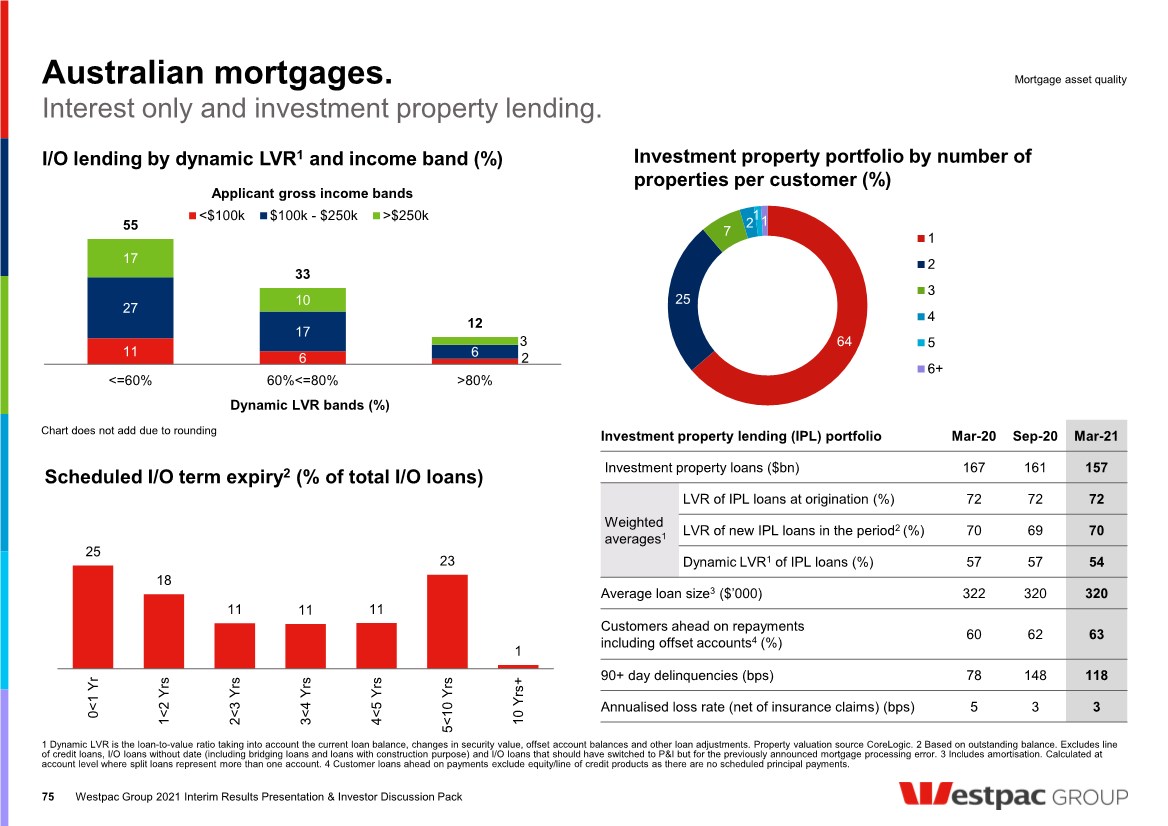
| Lenders mortgage insurance arrangements. Westpac Group 2021 Interim Results Presentation & Investor Discussion Pack 76 Insurance statistics Lenders mortgage insurance (LMI) • Where mortgage insurance is required, mortgages are insured through Westpac Lenders Mortgage Insurance1 (WLMI), and reinsured through external LMI providers, based on risk profile • In March, Westpac announced it would sell WLMI to Arch Capital Group (Arch) and enter into a 10-year exclusive supply agreement for Arch to provide lenders mortgage insurance to the Group • Completion of this transaction is expected to occur by the end of August 2021, after which all LMI required on WBC mortgages will be underwritten by Arch • Arch has provided reinsurance services to WLMI since 2011 • Westpac will retain responsibility for certain legacy matters and provide protection to Arch through customary warranties and indemnities • WLMI remains well capitalised (separate from bank capital) and subject to APRA regulation. WLMI targets a capitalisation ratio of 1.2x PCR2 and has consistently been above this target Lenders mortgage insurance arrangements from 1 October 2020 WLMI continues to provide mortgage insurance to Westpac. 1 Since 18 May 2015 WLMI has underwritten all mortgage insurance, where required, on Westpac originated mortgages. The in-force portfolio of loans includes mortgage insurance provided by external providers. 2 Prudential Capital Requirement (PCR) calculated in accordance with APRA standards. 3 Insured coverage is net of quota share. Third party has decreased compared to 30 September 2020 due to a reclassification of loans where the insurance is provided by WLMI and 100% reinsured through Arch LMI. 4 Loss ratio is claims over the total earned premium plus exchange commission. 5 LMI gross written premium includes loans >90% LVR reinsured with Arch Reinsurance Limited. 1H21 gross written premium includes $104m from the arrangement (2H20: $61m and 1H20: $63m). Westpac’s Australian mortgage portfolio at 31 March 2021 (%) Mortgage asset quality LVR Band Insurance • LVR ≤80% Not required • LVR >80% to ≤ 90% • Where insurance required, insured through WLMI • LMI not required for certain borrower groups • Reinsurance arrangements: − 40% risk retained by WLMI − 60% risk transferred through quota share arrangements with Arch LMI Pty Ltd, Sompo International (Endurance Speciality), Everest Re and Trans Re • LVR >90% • Where insurance required, insured through WLMI • LMI not required for certain borrower groups • 100% reinsurance through Arch LMI Pty Ltd 1H20 2H20 1H21 Insurance claims ($m) 5 21 2 WLMI claims ratio4 (%) 15 67 3 WLMI gross written premiums5 ($m) 89 91 154 84 5 11 Not insured Insured by third parties Insured by WLMI 3 |
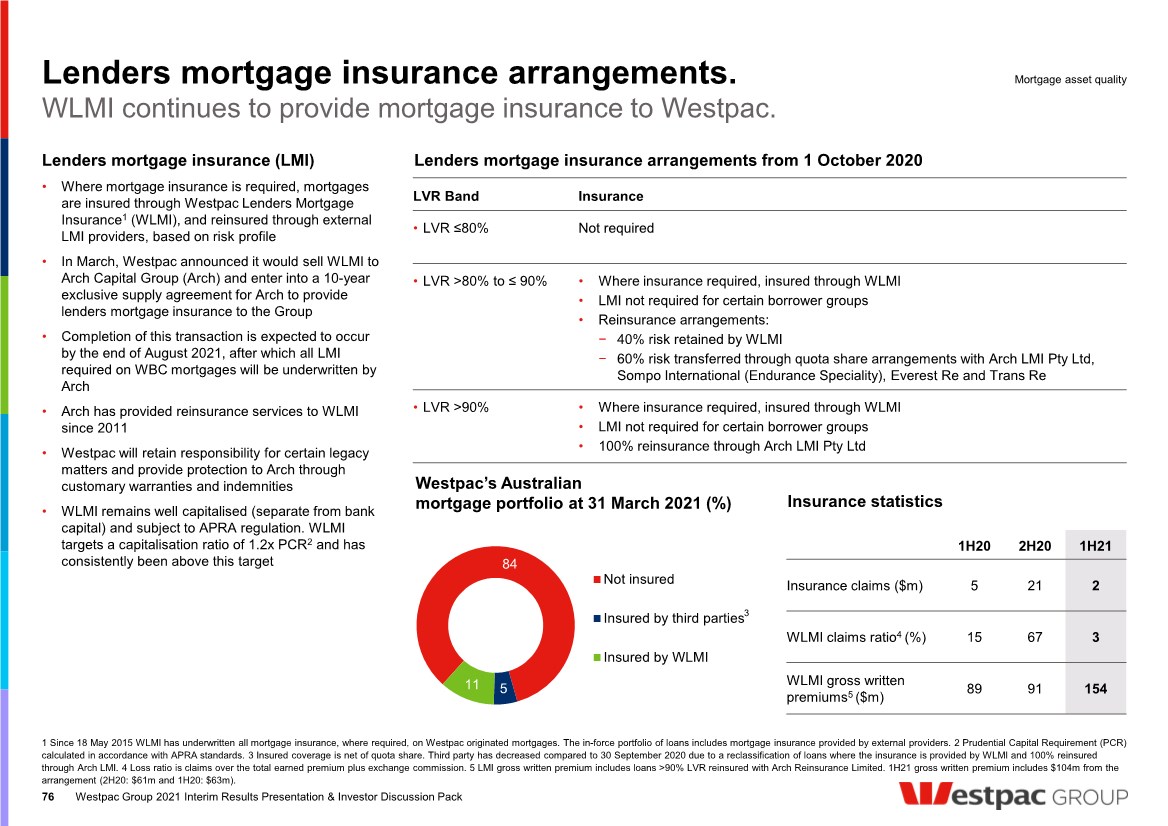
| Capital, funding and liquidity |
| 10.81 11.13 82 12 20 8 12.34 32 12.66 (1) Mar-20 Sep-20 Cash earnings Deductions and other RWA FX translation impact Divestments Mar-21 Sales Pro forma Mar-21 • CET1 capital ratio of 12.34%, up 121bps from 30 September 2020 • RWA declined 20bps mostly from lower credit RWA due to a reduction in lending and improved credit metrics • Capital deductions and other capital movements mostly reflect deferred tax assets and higher other comprehensive income. Partly offset by higher earnings held in entities that are not consolidated for regulatory purposes • Divestment impact 8bps from sale of Westpac’s stake in Zip Co Limited • 2020 final dividend paid was offset by the fully underwritten DRP • Pro forma CET1 ratio includes the expected 32bp benefit from announced divestments (Vendor Finance, Westpac General Insurance, Westpac Pacific and Lenders Mortgage Insurance) and the sale of Coinbase CET1 capital ratio 12.3%. 78 Capital, Funding and Liquidity Key capital ratios (%) Mar-20 Sep-20 Mar-21 CET1 capital ratio 10.8 11.1 12.3 Additional Tier 1 capital 2.1 2.1 2.2 Tier 1 capital ratio 12.9 13.2 14.5 Tier 2 capital 3.4 3.1 3.9 Total regulatory capital ratio 16.3 16.4 18.4 Risk weighted assets (RWA) ($bn) 444 438 429 Leverage ratio 5.7 5.8 6.3 Level 1 CET1 ratio 11.1 11.4 12.6 Internationally comparable ratios1 Leverage ratio (internationally comparable) 6.3 6.5 6.9 CET1 capital ratio (internationally comparable) 15.8 16.5 18.1 1 Internationally comparable methodology aligns with the APRA study titled ‘International Capital Comparison Study’ dated 13 July 2015. CET1 capital ratio movements (%, bps) Westpac Group 2021 Interim Results Presentation & Investor Discussion Pack |
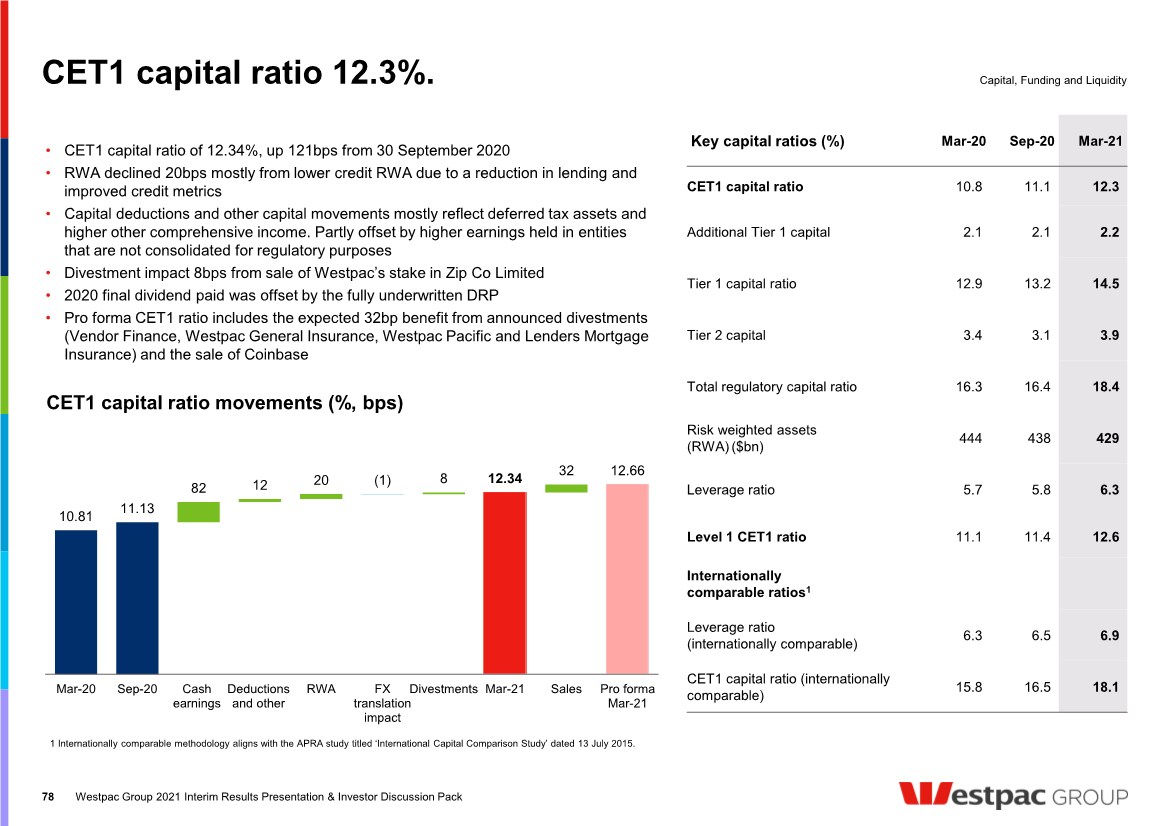
| 369.1 359.4 347.1 (4.4) (1.6) (1.6) (1.0) (1.4) (2.3) Mar-20 Sep-20 Credit metrics Lower lending COVID-19 overlay Methodology changes FX translation impacts Counterparty credit and mark-to- market risk Mar-21 Risk weighted assets. 79 • RWA decreased $9.0bn over 1H21, mostly from lower credit RWA (CRWA), partly offset by non-credit risk • CRWA reduced $12.3bn due to: - Lower corporate and business lending, partly offset by mortgage lending growth - Improved asset quality metrics across corporate and small business portfolios, including $1.6 billion reduction in the RWA overlay for corporate, business and specialised lending - Lower counterparty credit and mark-to-market risk - RWA floor on mortgages to 23.8% increased CRWA $3.7bn Down $9.0bn or 2.1% Risk weighted assets ($bn) Movement in credit risk weighted assets ($bn) Down $12.3bn or 3.4% Operational risk Decrease from lower credit risk RWA. Commentary Capital, Funding and Liquidity Westpac Group 2021 Interim Results Presentation & Investor Discussion Pack 443.9 437.9 0.7 2.9 0.0 428.9 (12.3) (0.3) Mar-20 Sep-20 Credit risk Market risk IRRBB Other Mar-21 |
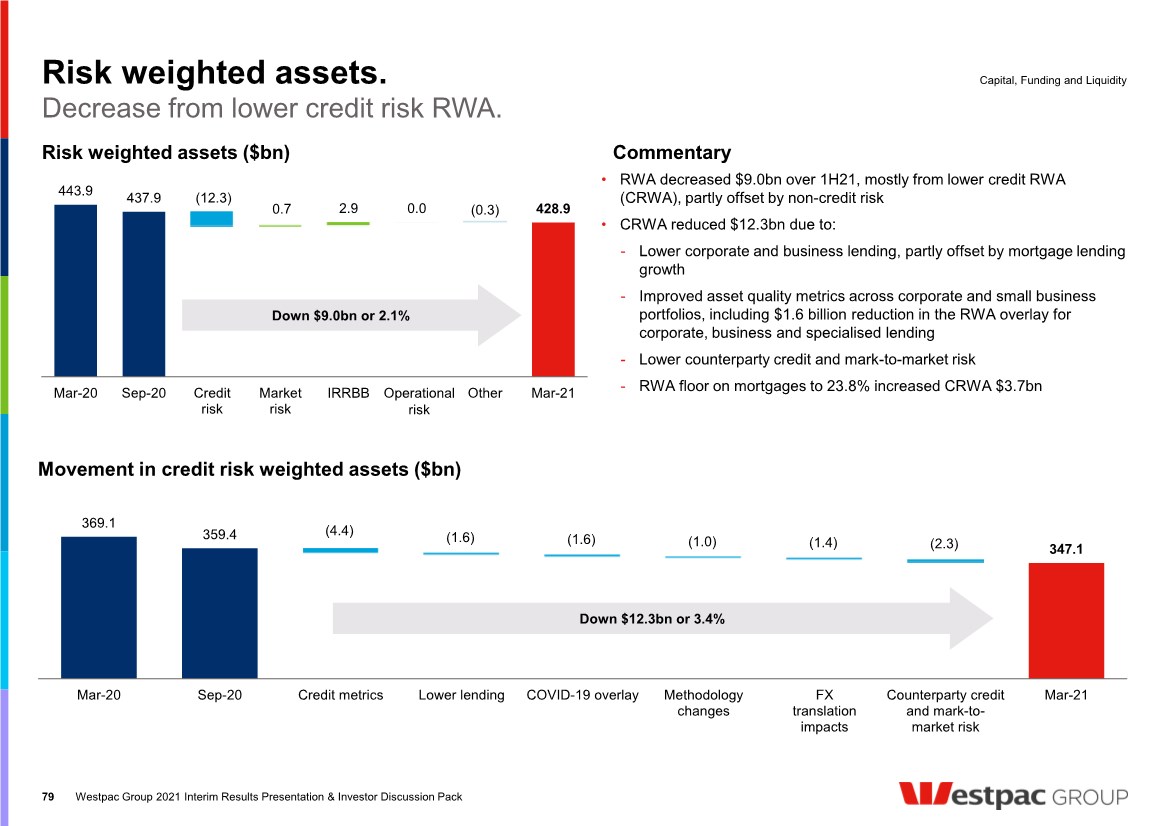
| Internationally comparable capital ratio reconciliation. APRA’s Basel III capital requirements are more conservative than those of the Basel Committee on Banking Supervision (BCBS), leading to lower reported capital ratios by Australian banks. In July 2015, APRA published a study that compared the major banks’ capital ratios against a set of international peers1. The following details the adjustments from this study and how Westpac’s APRA Basel III CET1 capital ratio aligns to an internationally comparable ratio. 80 1 Methodology aligns with the APRA study titled “International capital comparison study", dated 13 July 2015. Westpac’s CET1 capital ratio (APRA basis) (%) 12.3 Equity investments Balances below prescribed threshold are risk weighted, compared to a 100% CET1 deduction under APRA’s requirements 0.4 Deferred tax assets Balances below prescribed threshold are risk weighted, compared to a 100% CET1 deduction under APRA’s requirements 0.6 Interest rate risk in the banking book (IRRBB) APRA requires capital to be held for IRRBB. The BCBS does not have a Pillar 1 capital requirement for IRRBB 0.5 Residential mortgages Loss given default (LGD) of 15%, compared to the 20% LGD floor under APRA’s requirements. APRA also applies a correlation factor for mortgages higher than the 15% factor prescribed in the Basel rules 1.9 Unsecured non-retail exposures LGD of 45%, compared to the 60% or higher LGD under APRA’s requirements 0.7 Non-retail undrawn commitments Credit conversion factor of 75%, compared to 100% under APRA’s requirements 0.5 Specialised lending Use of internal-ratings based (IRB) probabilities of default (PD) and LGDs for income producing real estate and project finance exposures, reduced by application of a scaling factor of 1.06. APRA applies higher risk weights under a supervisory slotting approach, but does not require the application of the scaling factors 0.7 Currency conversion threshold Increase in the A$ equivalent concessional threshold level for small business retail and small to medium enterprise corporate exposures 0.2 Capitalised expenses APRA requires these items to be deducted from CET1. The BCBS only requires exposures classified as intangible assets under relevant accounting standards to be deducted from CET1 0.3 Internationally comparable CET1 capital ratio 18.1 Internationally comparable Tier 1 capital ratio 21.0 Internationally comparable total regulatory capital ratio 25.9 Capital, Funding and Liquidity Westpac Group 2021 Interim Results Presentation & Investor Discussion Pack |
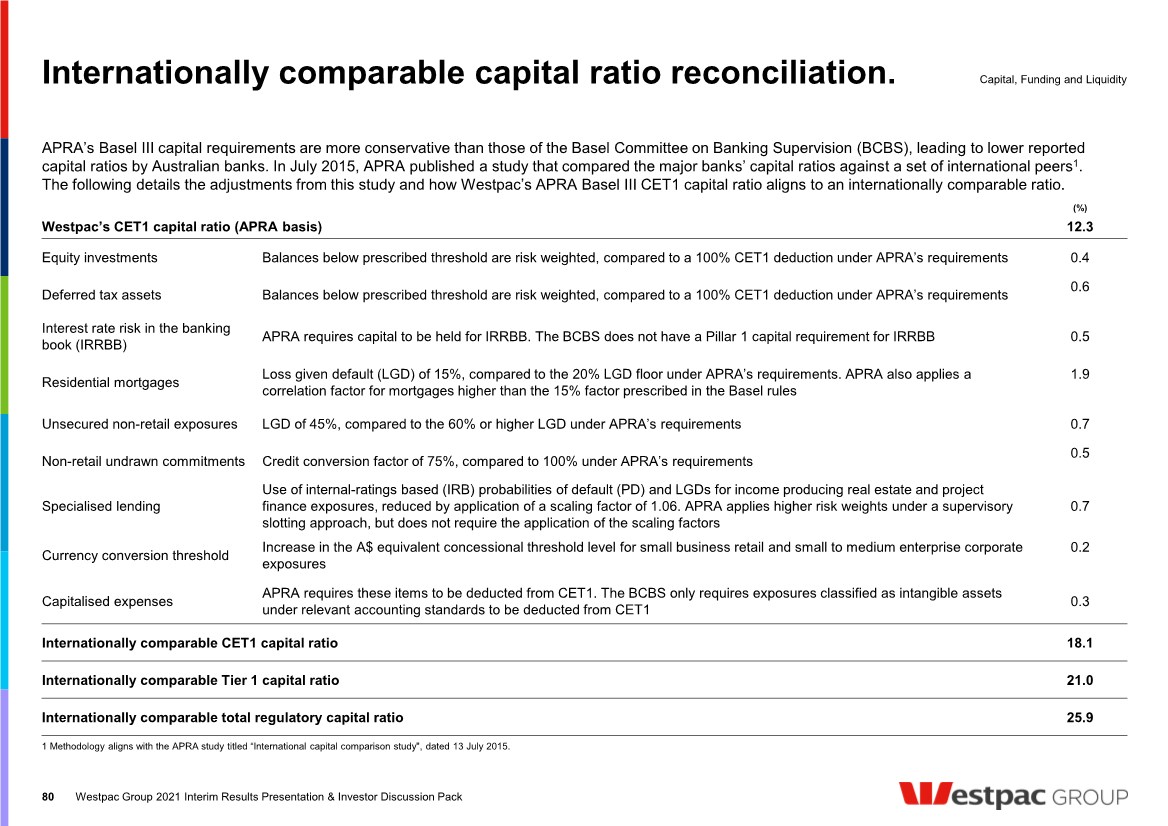
| Well placed on internationally comparable. Common equity Tier 1 ratio (%)1 81 Leverage ratio (%)1 CET1 and leverage ratios. 1 Comparison group comprises listed commercial banks with assets in excess of A$700bn and which have disclosed fully implemented Basel III ratios or provided sufficient disclosure to estimate. Based on company reports/ presentations. Ratios at 31 December 2020, except for Westpac which is at 31 March 2021, ANZ and NAB which are at 30 September 2020, and Bank of Montreal, Scotiabank, Royal Bank of Canada and Toronto Dominion are at 31 October 2020. Leverage ratio is on a transitional basis. Where accrued expected dividends have been deducted and disclosed, these have been added back for comparability. US banks are excluded from leverage ratio analysis due to business model differences, for example from loans sold to US Government sponsored enterprises. NAB has not disclosed an internationally comparable leverage ratio since September 2017. Shows ratios at the last reporting date, which may take account of measures taken by jurisdictions in response to COVID-19. Capital, Funding and Liquidity Norinchukin Bank NatWest CBA Danske Bank Nordea Westpac (18.1%) Morgan Stanley Rabobank ANZ Lloyds BPCE Sumitomo Mitsui Unicredit HSBC NAB ING Group Intesa Sanpaolo Standard Chartered Barclays UBS China Construction Bank Societe Generale Deutsche Bank JPMorgan Chase Goldman Sachs Commerzbank Credit Agricole SA ICBC Toronto Dominion Bank BNP Paribas Credit Suisse Mitsubishi UFJ Bank of America Royal Bank of Canada Santander China Merchants Bank BBVA CIBC Citigroup Bank of Montreal Natixis Scotiabank Wells Fargo Mizuho FG Bank of China Agricultural Bank of .. 0% 5% 10% 15% 20% Norinchukin Bank ICBC China Construction Bank Bank of China Agricultural Bank of China China Merchants Bank Intesa Sanpaolo Rabobank Westpac (6.9%) CBA BBVA Credit Suisse Unicredit ANZ Lloyds Nordea NAB BPCE UBS HSBC Standard Chartered Santander NatWest Barclays BNP Paribas Commerzbank Credit Agricole SA ING Group Societe Generale Bank of Montreal Royal Bank of Canada Scotiabank CIBC Deutsche Bank Natixis Danske Bank Toronto Dominion Sumitomo Mitsui Mitsubishi UFJ Mizuho FG 0% 2% 4% 6% 8% 10% Westpac Group 2021 Interim Results Presentation & Investor Discussion Pack |
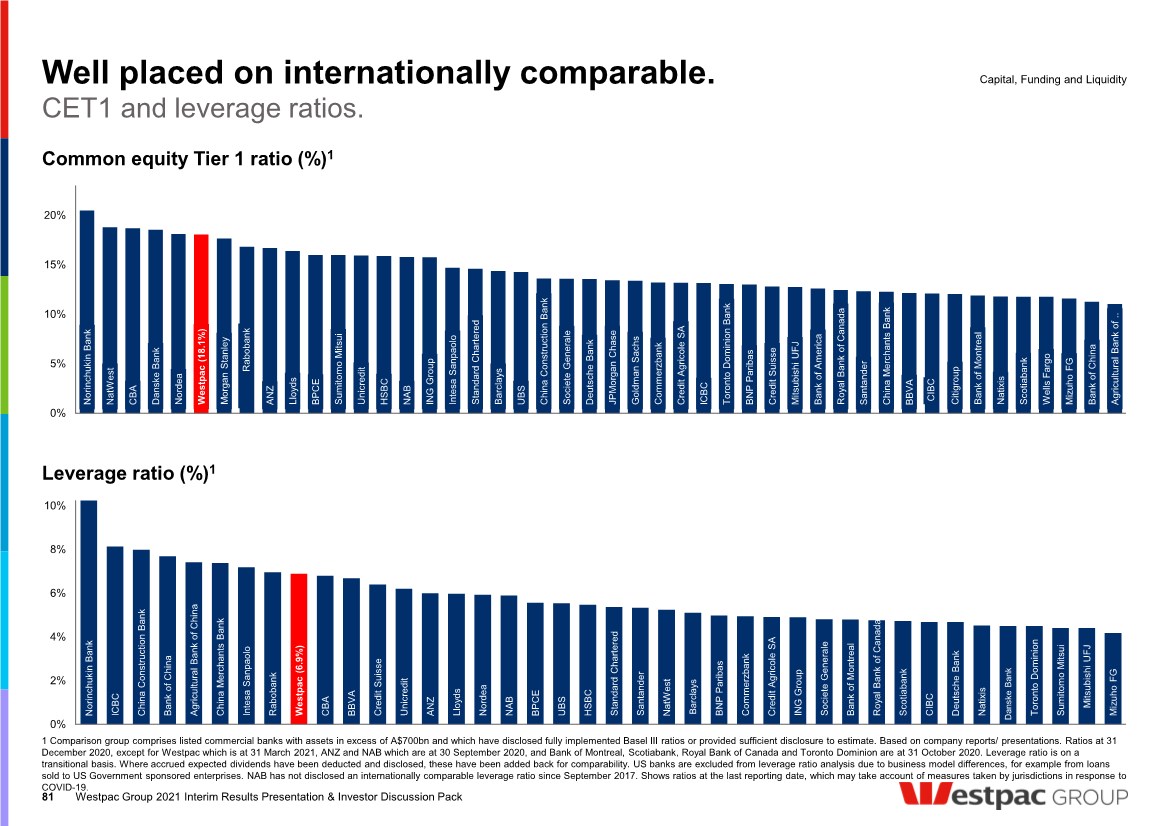
| Liquidity and funding. 82 Liquidity coverage ratio1 (LCR) (quarterly avg, $bn) LCR lower from reduction in CLF and NCO overlay; NSFR little changed. 1 LCR is calculated as the percentage ratio of stock of liquid assets over the total net cash outflows in a modelled 30 day defined stressed scenario. Liquid assets include HQLA as defined in APS 210, RBNZ eligible liquids, CLF eligible securities less RBA open repos funding end of day ESA balances with the RBA. The Committed Liquidity Facility (CLF) and Term Funding Facility (TFF) are made available to Australian Authorised Deposit-taking Institutions by the RBA that, subject to qualifying conditions, can be accessed to meet LCR requirements under APS210 – Liquidity. Other flows include credit and liquidity facilities, collateral outflows and inflows from customers. 2 Other flows includes net cash outflow overlay. Effective 1 January 2021, the Group is required to increase the value of its net cash outflows by 10% for the purpose of calculating LCR, in response to action taken by APRA for breaches of Westpac’s liquidity requirements predominantly relating to Westpac New Zealand Limited. This reduces the average LCR for the quarter ended 31 March 2021 by 12 percentage points. 3 Other includes derivatives and other assets. 4 Other loans includes off balance sheet exposures and residential mortgages >35% risk weight. Capital, Funding and Liquidity 88 119 85 118 10 52 13 37 22 35 11 10 120 182 134 165 Net cash outflows Liquid assets Net cash outflows Liquid assets Net cash outflows (NCOs) Other flows2 Wholesale funding Customer deposits Liquid assets Term Funding Facility (undrawn) Committed Liquidity Facility High Quality Liquid Assets Liquidity coverage ratio1 (quarterly average, %) Sep 2020: LCR 151% Westpac Group 2021 Interim Results Presentation & Investor Discussion Pack 151 124 (1) (12) 3 (3) (14) Sep-20 HQLA CLF and TFF Customer Deposits Wholesale funding Other flows Mar-21 Lower from reduction in CLF and net cash outflow overlay2 2 Mar 2021: LCR 124% Net stable funding ratio (NSFR) ($bn) Available Stable Funding Required Stable Funding 625.2 510.3 Capital Retail & SME deposits Corp. & Insto deposits Wholesale funding and other liabilities Residential mortgages ≤35% risk weight Other loans4 Liquids and other3 Net stable funding ratio (NSFR) (%) NSFR at 31 March 2021: 123% 122 123 1.4 1.1 (0.5) (1.7) (2.1) 2.7 Sep-20 Capital Retail & SME Deposits Corporate & Institutional Deposits Wholesale funding and other Residential Mortgages ≤35% Risk Weight Other loans, liquids & other Mar-21 Bars do not add due to rounding |
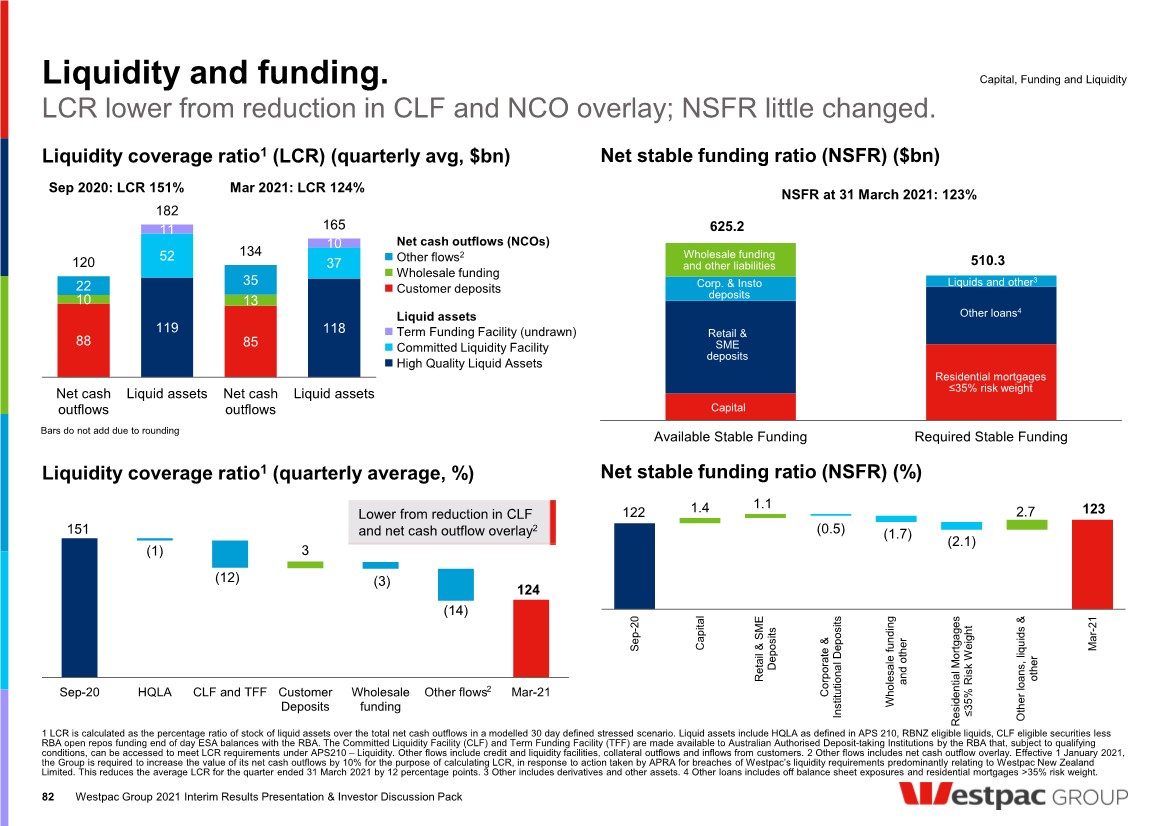
| Balance sheet funding. 83 Funding composition (%) Shift in balance sheet: higher customer deposits, lower offshore wholesale funding 1 Includes long term wholesale funding with a residual maturity less than or equal to 1 year. 2 Equity excludes FX translation, Available-for-Sale securities and Cash Flow Hedging Reserves. 3 Short term funding includes scroll. Scroll represents wholesale funding with an original maturity greater than 12 months that now has a residual maturity less than 12 months. Long term includes securitisation. Capital, Funding and Liquidity Bars may not add to 100 due to rounding By residual maturity Westpac Group 2021 Interim Results Presentation & Investor Discussion Pack 63 66 8 9 1 1 12 9 5 6 7 5 5 5 Sep-19 Mar-21 Wholesale onshore <1yr1 stable Wholesale offshore <1yr1 down $17bn W’sale onshore >1yr up $14bn, inc. TFF drawdowns $22bn Wholesale offshore >1yr down $29bn Securitisation down $1.5bn Equity2 up $6bn Customer deposits up $26bn Significant balance sheet changes in the last 18 months Customer deposits to net loans ratio (%) 525 544 555 550 715 720 693 690 73.4 75.6 80.1 79.8 Sep-19 Mar-20 Sep-20 Mar-21 Customer deposits Net customer loans Deposits to net loans ratio 101 148 249 105 150 255 88 142 230 85 131 216 Short term Long term Total wholesale Sep-19 Mar-20 Sep-20 Mar-21 Wholesale funding by residual maturity3 ($bn) Long term includes TFF drawn down Sep-20 $18bn Mar-21 $22bn |
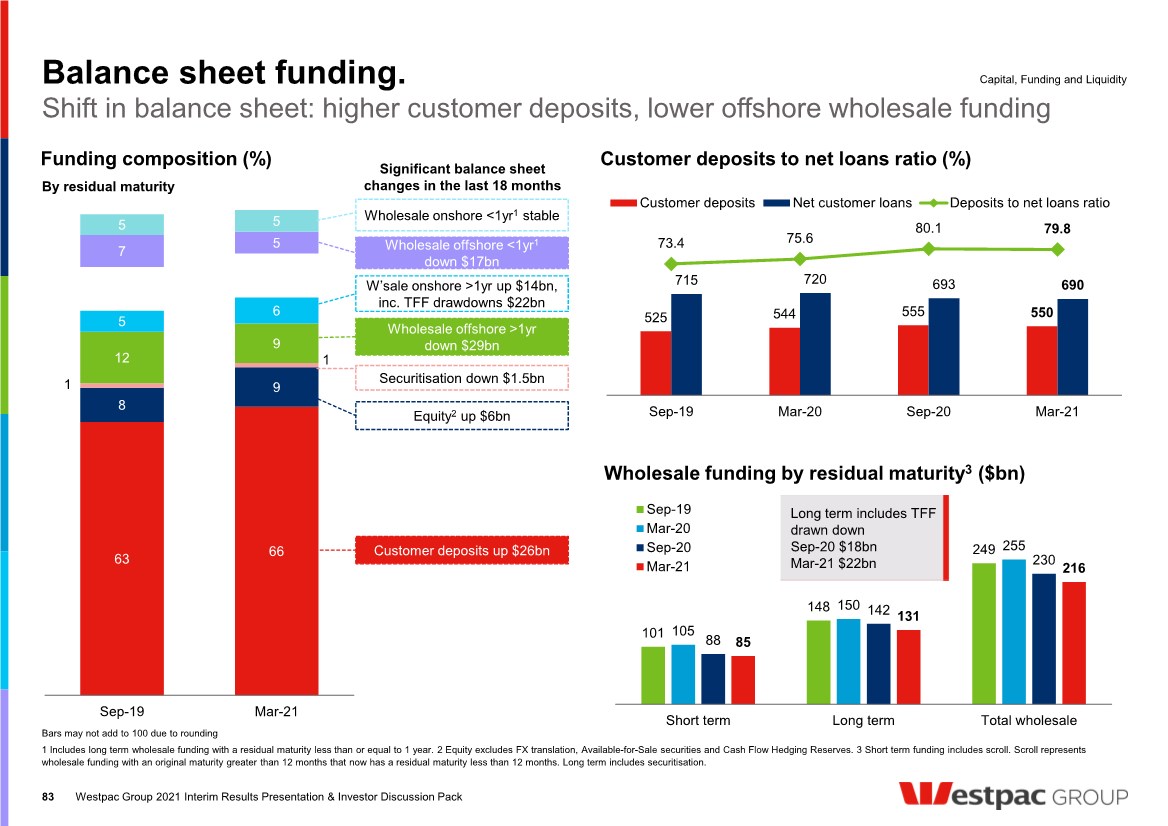
| Long term wholesale funding. Capital, Funding and Liquidity 84 Term Funding Facility1 (TFF) ($bn) 1 Westpac’s Additional Allowance at 31 March 2021 was zero. 2 Based on residual maturity and FX spot currency translation. Includes all debt issuance with contractual maturity greater than 13 months excluding US Commercial Paper and Yankee Certificates of Deposit. Contractual maturity date for hybrids and callable subordinated instruments is the first scheduled conversion date or call date for the purposes of this disclosure. Perpetual sub debt has been included in >FY26 maturity bucket. Maturities exclude securitisation amortisation. 3 Based on current capital regulation. Does not include balance sheet growth or management buffer. 4 Represents AUD equivalent notional amount using spot FX translation at date of issue for issuance and spot FX translation at 31 March 2021 for maturities. Securities in callable format profiled to first call date, excluding the Perpetual Floating Rate Notes issued 30 September 1986. Securities in bullet format profiled to maturity date. 18 18 12 4 TFF Allowance Drawn down Supplementary allowance (Drawdown Oct-20 to Jun-21) Initial allowance (Drawdown Mar-20 to Sep-20) 30 Funding in 1H21 limited to meeting TLAC and capital needs. Westpac Group 2021 Interim Results Presentation & Investor Discussion Pack 22 37 32 34 31 12 13 26 37 29 12 9 25 FY17 FY18 FY19 FY20 1H21 2H21 FY22 FY23 FY24 FY25 FY26 >FY26 Funding for Lending Programme (NZ) Term Funding Facility (Aus) Subordinated debt Senior/Securitisation Hybrid Covered bond Term debt issuance and maturity profile2 ($bn) At 31 March 2021 Westpac Total Regulatory Capital 31 March 2021 APRA- basis 1 Jan 2024 APRA-basis CET1 Additional Tier 1 Tier 2 5.0% (approx. $21bn3) 12.3% ($53bn) 2.2% ($9bn) 3.9% ($17bn) Westpac Tier 2 issuance and calls/maturities4 (notional amount, A$m) 4.2 2.2 4.7 0.4 1.2 1.2 1.4 2.0 1.7 2.0 0.0 1.6 0.0 5.5 0.0 1.0 2.0 3.0 4.0 5.0 6.0 FY19 FY20 1H21 2H21 FY22 FY23 FY24 FY25 FY26 FY27 FY28 FY29 FY30 >FY30 Issuance Maturities FY21 Tier 2 issuance expected to be approx. $5-7billion (including buffer) Issuance Maturities |
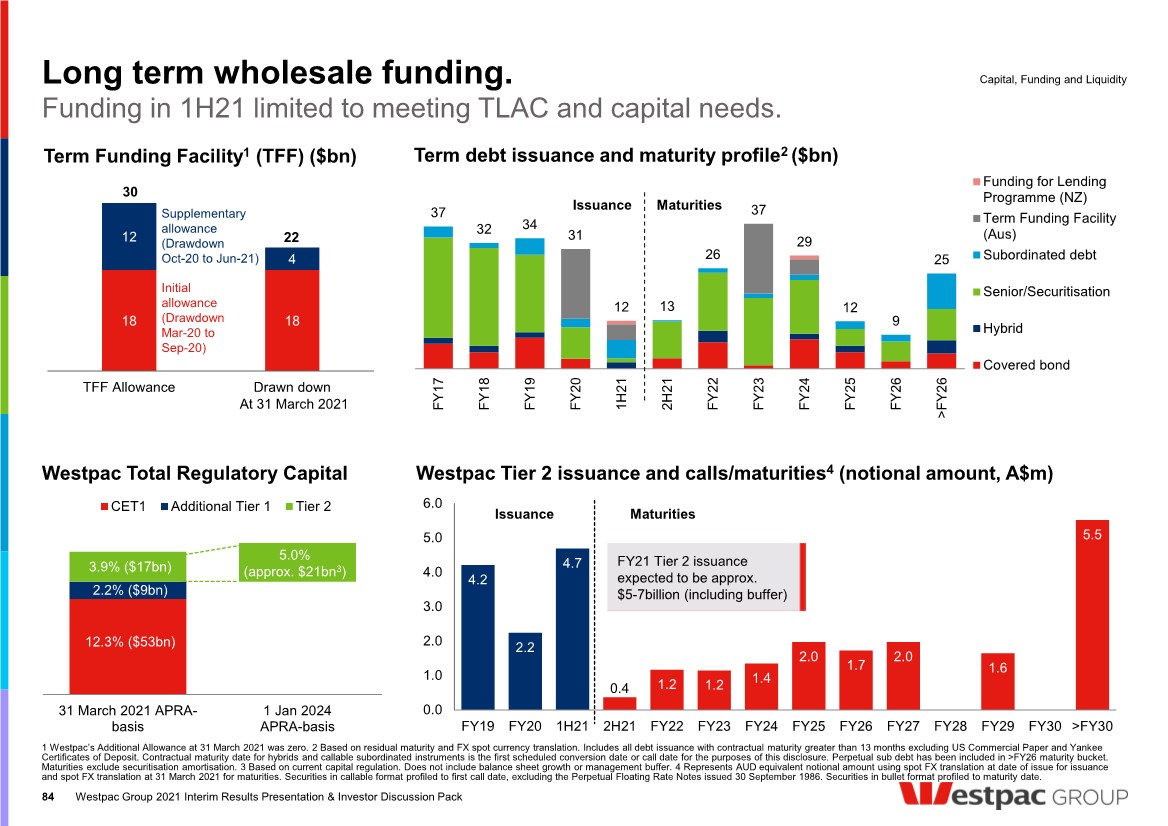
| Divisional Results |
| Divisional1 contributions. 1 Refer to division descriptions, page 114. NZ in A$. 86 Divisional results 1H21 ($m) Consumer Business WIB NZ Specialist Businesses Group Businesses Group Operating income 4,457 2,356 1,046 1,163 937 840 10,799 Expenses (2,270) (1,170) (698) (500) (740) (603) (5,981) Core earnings 2,187 1,186 348 663 197 237 4,818 Impairment (charges)/benefits 80 129 (8) 92 80 (1) 372 Tax & non-controlling interests (675) (395) (110) (210) (143) (120) (1,653) Cash earnings 1,592 920 230 545 134 116 3,537 2H20 ($m) Consumer Business WIB NZ Specialist Businesses Group Businesses Group Operating income 4,560 2,268 1,132 1,044 581 700 10,285 Expenses (2,141) (1,230) (697) (482) (1,128) (862) (6,540) Core earnings 2,419 1,038 435 562 (547) (162) 3,745 Impairment (charges)/benefits (599) (674) (111) (102) (95) 641 (940) Tax & non-controlling interests (546) (108) (139) (129) 43 (311) (1,190) Cash earnings 1,274 256 185 331 (599) 168 1,615 Westpac Group 2021 Interim Results Presentation & Investor Discussion Pack |
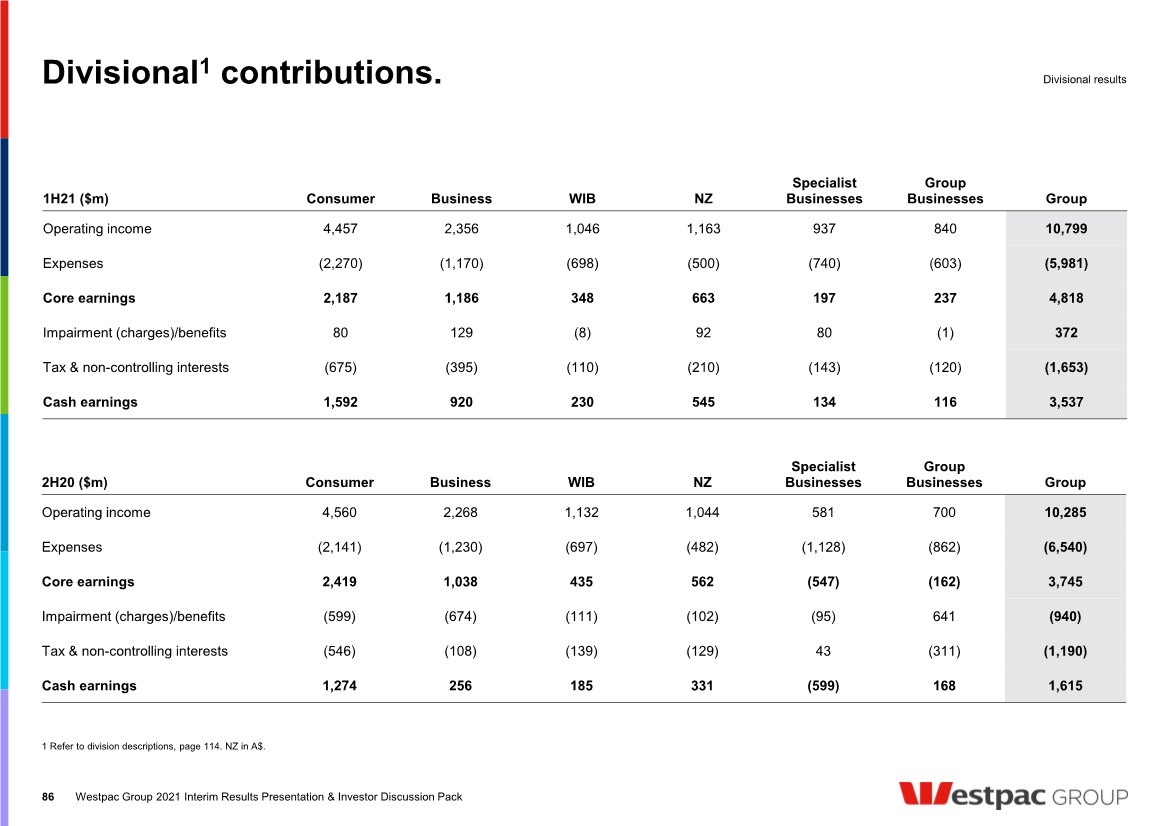
| 1 Includes all points of presence including Advisory and Community banking centres. 2 Refer page 115 for metric definitions and details of provider. Data for 1H21 at February 2021. 1 1,472 1,274 19 1,293 679 1,668 1,592 (97) (54) (154) (76) 1H20 2H20 Add back notable items 2H20 ex-notable items Net interest income Non-interest income Operating expenses Impairment charges Tax and NCI 1H21 ex-notable items Notable items 1H21 1H20 2H20 1H21 Change on 2H20 Revenue ($m) 4,560 4,560 4,457 (2%) Net interest margin (%) 2.33 2.41 2.39 (2bps) Expense to income (%) 44.6 47.0 50.9 398bps Customer deposit to loan ratio (%) 52.68 56.26 56.47 21bps Stressed exposures to TCE (%) 0.83 1.38 1.02 (36bps) Mortgage 90+ day delinquencies (%) 0.94 1.60 1.18 (42bps) Consumer 1H21 performance. 87 Cash earnings ($m) Consumer Up $375m or 29% Up $318m or 25% 1H20 2H20 1H21 Change on 2H20 Total customers (#m) 9.7 9.7 9.7 - Active digital banking customers (#m) 4.49 4.53 4.58 1% Branches (#)1 931 929 889 (40) ATMs (#) 2,133 1,399 1,352 (47) Main Financial Institution2 (%) 16.3 15.7 15.6 (0.1ppt) NIM 2bps lower from asset spread compression partly offset by lower funding costs and higher deposit spreads Mostly increased spending on risk and compliance and higher operational costs Westpac Group 2021 Interim Results Presentation & Investor Discussion Pack Key financial metrics Key operating metrics Improved economic outlook and improved asset quality |
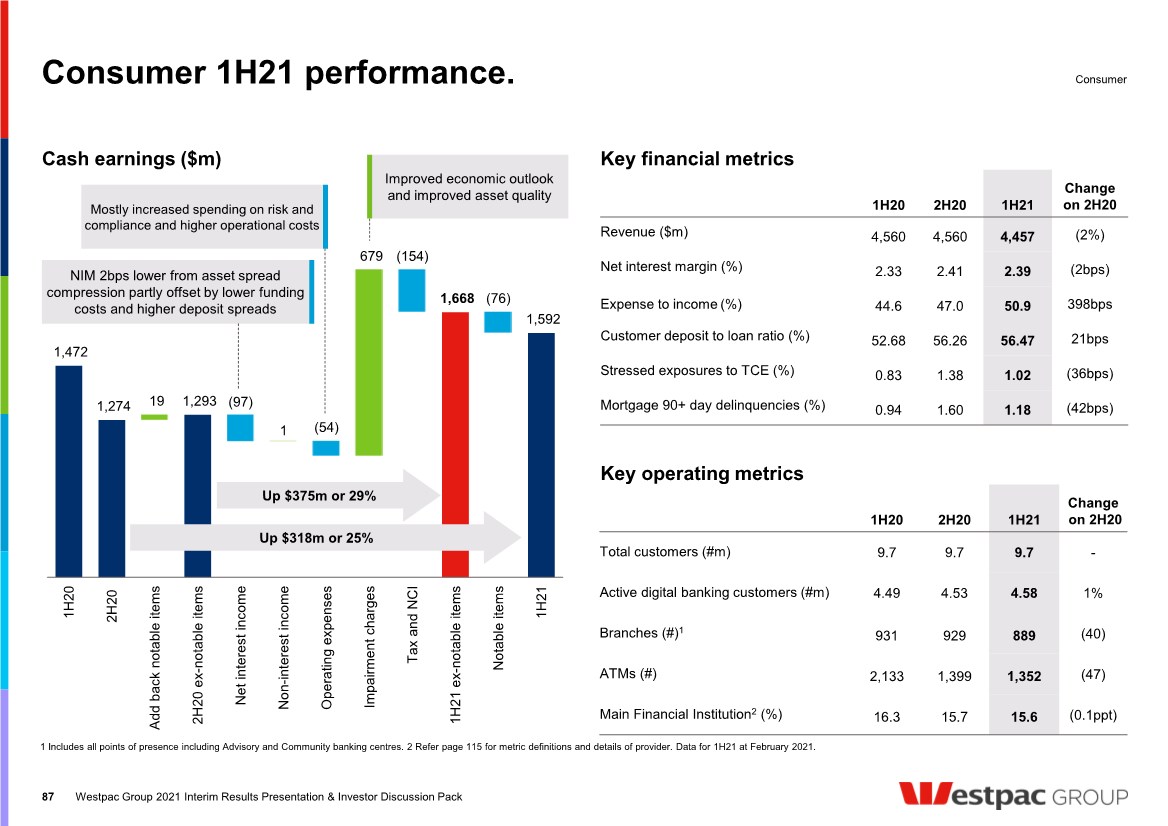
| 25 478 256 100 356 20 803 895 920 (44) (6) (234) 1H20 2H20 Add back notable items 2H20 ex-notable items Net interest income Non-interest income Operating expenses Impairment charges Tax and NCI 1H21 ex-notable items Notable items 1H21 Business 1H21 performance. 88 Cash earnings ($m) Business Up $539m or 151% Up $664m or 259% Key financial metrics 1H20 2H20 1H21 Change on 2H20 Revenue ($m) 2,455 2,268 2,356 4% Net interest margin (%) 3.05 2.93 3.17 24bps Expense to income (%) 43.5 54.2 49.7 Large Customer deposit to loan ratio (%) 98.1 108.0 114.6 Large Stressed exposures to TCE (%) 3.07 4.70 4.60 (10bps) Key operating metrics 1H20 2H20 1H21 Change on 2H20 Total customers1 (‘000’s) 1,021 1,053 1,063 1% Customer satisfaction2 (rank) #1 #1 =#1 – Customer satisfaction – SME2 (rank) =#1 #1 =#2 Down 1 Digital sales3 (%) 23 28 27 (1ppt) 1 Excludes Private Wealth customers. 2 Refer page 115 for details of metric definition and provider. Data for 1H21 at Feb 21. 3 Share of sales made digitally for eligible products. Westpac Group 2021 Interim Results Presentation & Investor Discussion Pack AIEA down 4% partly offset by 7bps increase in NIM Higher merchant fees Lower collectively assessed provisions from improved economic outlook and improved asset quality |
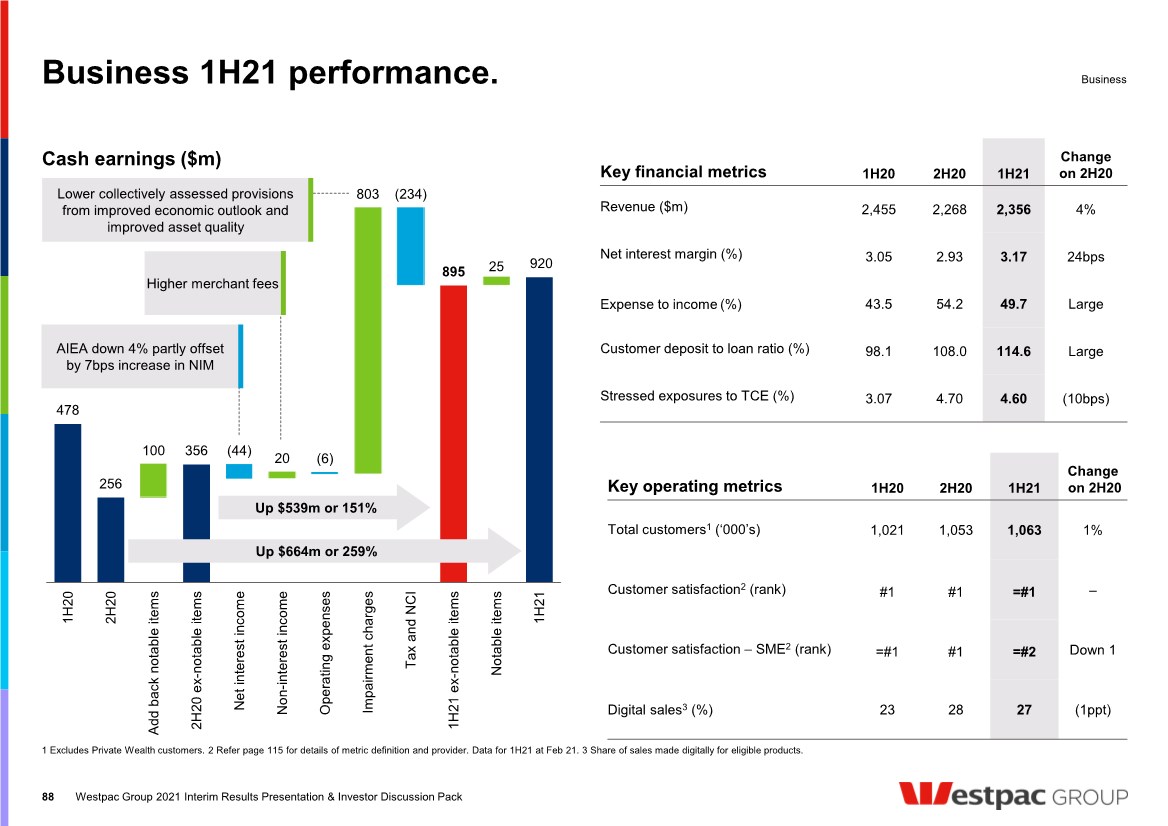
| 147 185 36 103 18 256 230 (42) (44) (26) 1H20 2H20 Net interest income Non-interest income Operating expenses Impairment charges Tax and NCI 1H21 ex-notable items Notable items 1H21 Key financial metrics 1H20 2H20 1H21 Change on 2H20 Revenue ($m) 1,161 1,132 1,046 (8%) Net interest margin (%) 1.46 1.23 1.27 4bps Expense to income ratio (%) 53.3 61.6 66.7 Large Net loans 78.6 66.2 62.4 (6%) Customer deposits 110.0 102.9 91.0 (12%) Customer deposit to loan ratio (%) 139.9 155.4 145.8 Large Stressed exposures to TCE (%) 1.09 1.03 0.56 (47bps) Key operating metrics 1H20 2H20 1H21 Change on 2H20 Customer revenue1 / total revenue (%) 94.4 88.3 91.5 Large Trading revenue / total revenue (%) 15.0 13.1 7.2 Large Revenue per FTE ($’000) 784 717 668 (7%) WIB 1H21 performance. 89 Cash earnings ($m) 1 WIB customer revenue is lending revenue, deposit revenue, sales and fee income. Excludes trading and derivative valuation adjustments. Westpac Institutional Bank Up $71m or 38% Westpac Group 2021 Interim Results Presentation & Investor Discussion Pack Up $45m or 24% AIEA down 11%; margins up 4bps Lower Markets income Lower restructuring costs and reduced professional services expenses Lower new impaired assets and lower CAPs from improved economic outlook |
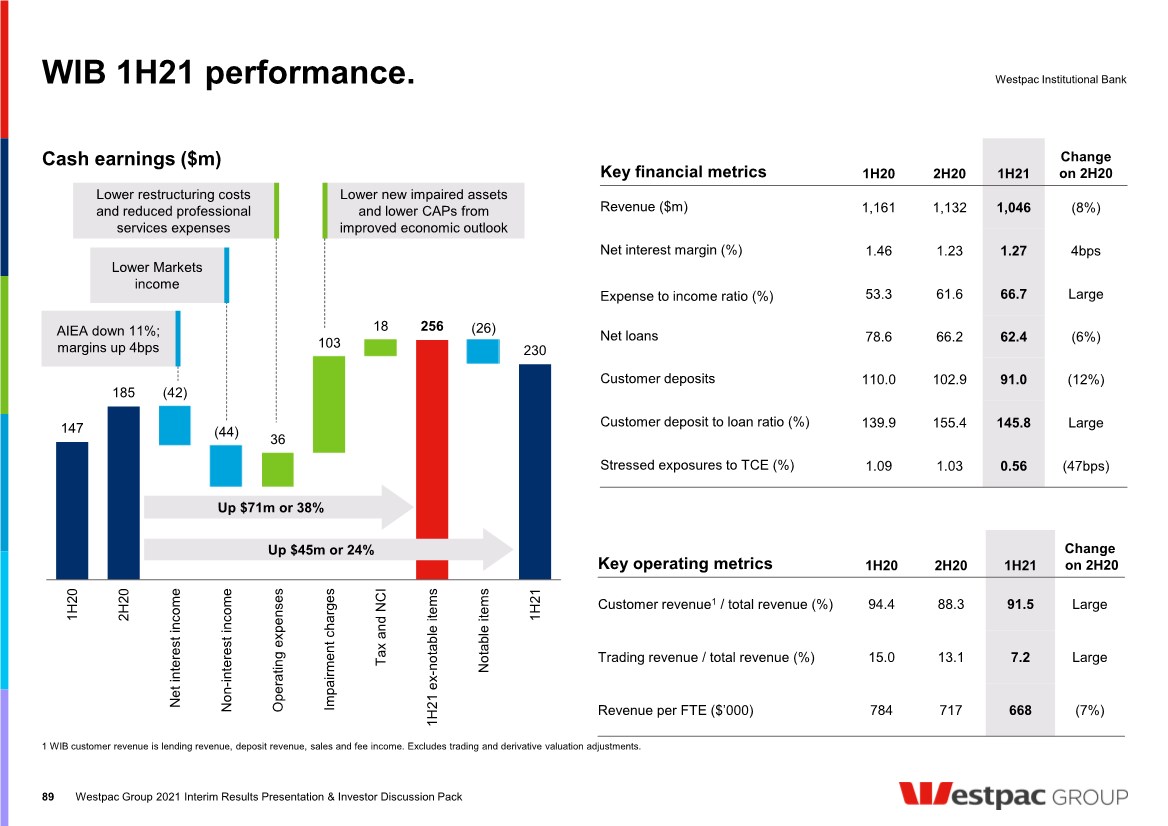
| Key financial metrics 1H20 2H20 1H21 Change on 2H20 Revenue (NZ$m) 1,162 1,120 1,245 11% Net interest margin (%) 2.06 1.89 2.06 17bps Expense to income (%) 46.6 46.3 43.1 (320bps) Customer deposit to loan ratio (%) 79.4 80.7 81.8 111bps Stressed exposures to TCE (%) 1.64 1.59 1.56 (3bps) 110 17 295 354 4 358 208 593 583 (11) (89) (10) 1H20 2H20 Add back notable items 2H20 ex-notable items Net interest income Non-interest income Operating expenses Impairment charges Tax and NCI 1H21 ex-notables Notable items 1H21 New Zealand 1H21 performance1. 90 Cash earnings (NZ$m) 1 In NZ$ unless otherwise noted. 2 Refer page 115 for details of metric definition and provider. New Zealand Key operating metrics 1H20 2H20 1H21 Change on 2H20 Customers (#m) 1.35 1.34 1.33 (1%) Branches (#) 151 143 134 (9) Consumer NPS2 +21 +14 +16 Up 2 Business NPS2 +1 +7 (1) Down 8 Agri NPS2 +21 +34 +34 - Funds (NZ$bn) (spot) 10.9 12.2 11.9 (2%) Service quality – complaints (000’s) 9.6 9.5 9.3 (2%) Up $235m or 66% Up $229m or 65% Westpac Group 2021 Interim Results Presentation & Investor Discussion Pack 3% increase in AIEA and 17bps increase in NIM due to repricing and favourable deposit mix Gain on sale of Wealth Advisory business and higher cards income, partly offset by lower insurance income Improved economic outlook and asset quality Primarily higher spend on technology and risk, regulatory and compliance programs |
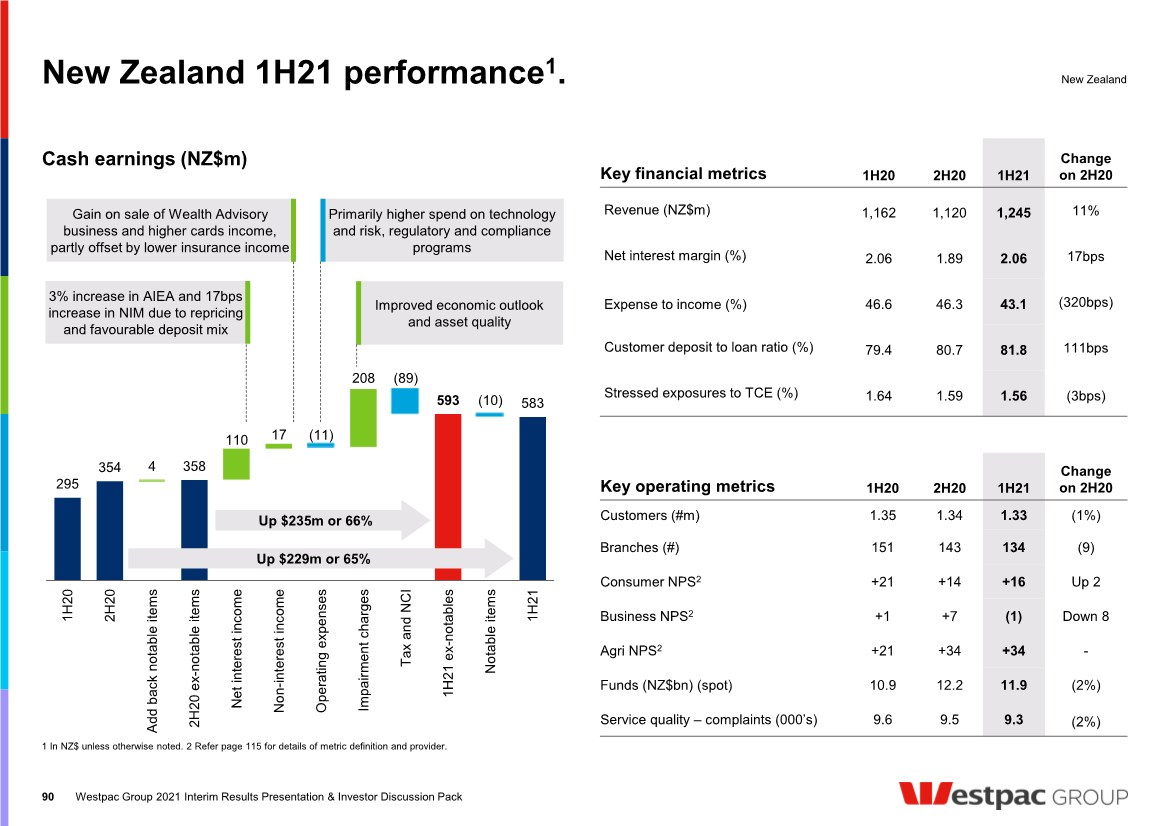
| 69.1 71.0 1.0 2.1 74.1 Mar-20 Sep-20 Consumer Business Mar-21 87.0 88.0 3.0 90.6 (0.4) Mar-20 Sep-20 Consumer Business Mar-21 New Zealand balance sheet. 91 Net loans (NZ$bn) Deposits (NZ$bn) Loans (NZ$bn) and % of total Customer deposits (NZ$bn) and % of total 51 53 55 58 2 2 1 1 31 32 32 32 84 87 88 91 Sep-19 Mar-20 Sep-20 Mar-21 Business Personal Mortgage 64% 1% 35% Up 3% Up 4% Up 3% Up 1% Up 3% New Zealand 34 33 31 29 15 16 18 21 15 20 22 24 64 69 71 74 Sep-19 Mar-20 Sep-20 Mar-21 Transaction Savings Term deposits 39% 28% 33% Up 4% Up 3% Up 7% Westpac Group 2021 Interim Results Presentation & Investor Discussion Pack |
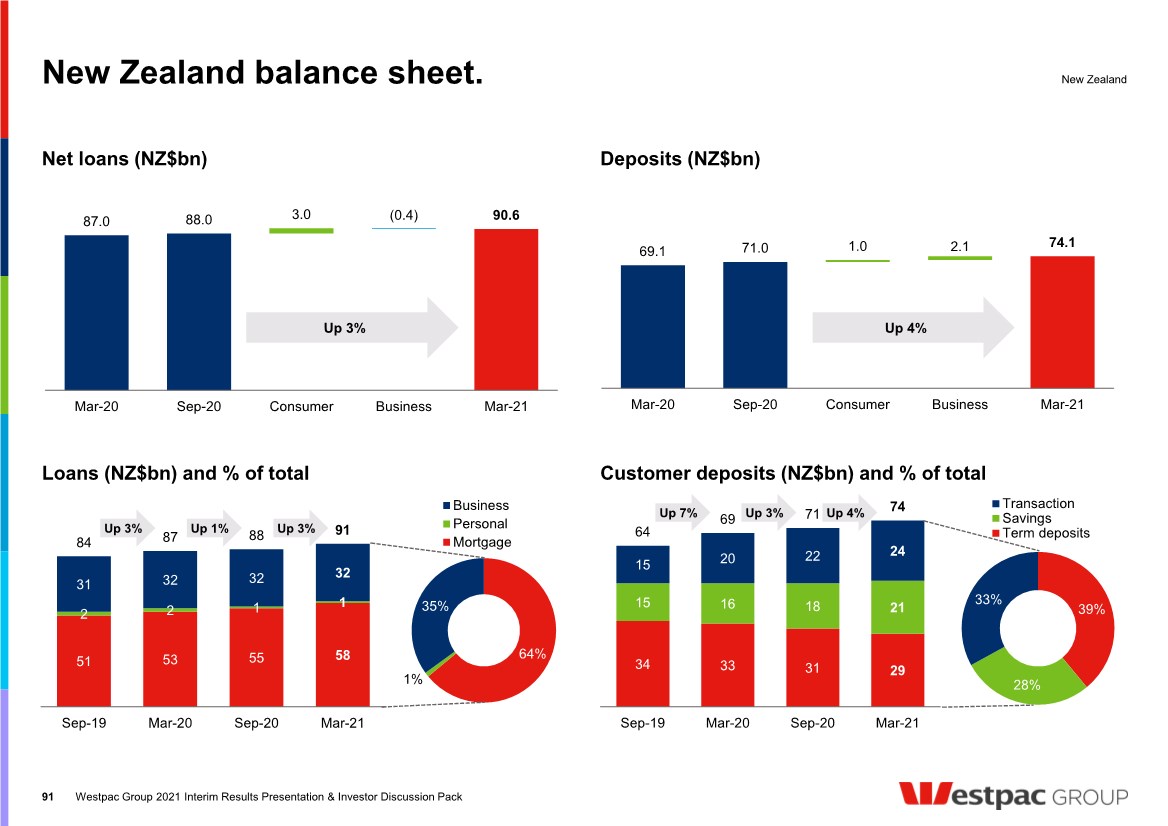
| New Zealand stressed exposures. 92 Business stressed exposures as a % of business TCE Agribusiness portfolio Milk price (NZ$) Dairy portfolio summary • Overall portfolio health remains sound with risk profiles improving as a result of the higher milk prices paid over the last two seasons. Focus remains on supporting existing dairy customers with proven long-term viability • Global dairy prices have increased on the back of rebounding Chinese and South-East Asian demand. Fonterra has revised its 2020/21 milk price forecast range to $7.30/kg - $7.90/kg, while Westpac has lifted its forecast to $7.90/kg • Uncertainty around environmental regulations, rising compliance costs, Fonterra’s financial performance and labour shortages are ongoing risks to the dairy sector outlook 1 Includes impaired exposures. Mar-20 Sep-20 Mar-21 TCE (NZ$bn) 9.6 10.0 10.1 Agriculture as a % of total TCE 7.6 7.9 7.7 % of portfolio graded as ‘stressed’1 9.8 8.2 8.0 % of portfolio in impaired 0.48 0.48 0.29 1.5 0.9 0.8 0.5 0.3 0.3 0.1 0.3 0.3 0.2 0.2 0.1 0.2 0.0 0.1 0.0 0.1 0.1 0.1 0.2 3.2 2.3 2.4 5.0 4.0 3.0 2.9 2.5 2.2 2.4 4.9 3.3 3.4 5.5 4.4 3.3 3.1 2.9 2.6 2.8 Sep-13 Sep-14 Sep-15 Sep-16 Sep-17 Sep-18 Sep-19 Mar-20 Sep-20 Mar-21 Watchlist & substandard 90+ day past due and not impaired Impaired 19 9 47 4 4 17 Property Manufacturing Agriculture, forestry & fishing Wholesale trade Construction Other 6.12 6.69 6.35 7.14 7.90 $0 $1 $2 $3 $4 $5 $6 $7 $8 $9 $10 2016/17 2017/18 2018/19 2019/20 2020/21 Kg Ms Westpac Economics forecast New Zealand Westpac Group 2021 Interim Results Presentation & Investor Discussion Pack |
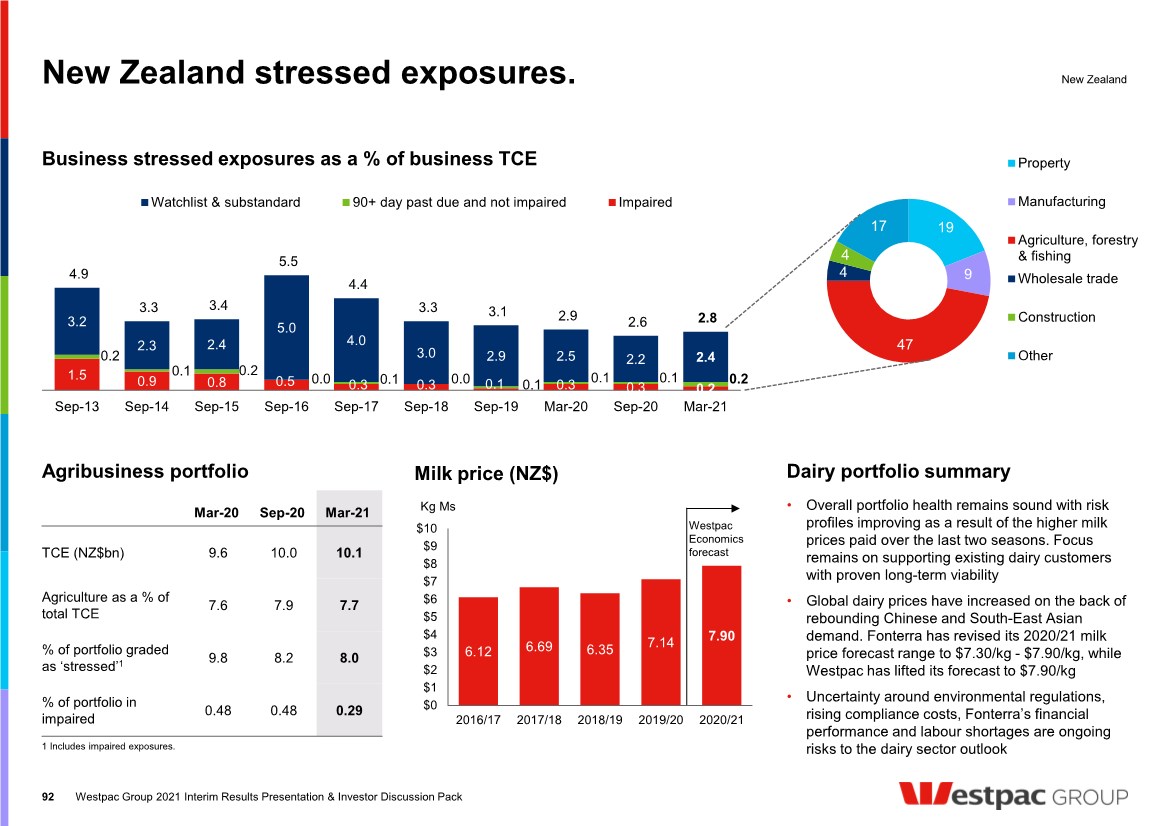
| 1.14 1.91 0.0 1.0 2.0 3.0 Sep-13 Mar-14 Sep-14 Mar-15 Sep-15 Mar-16 Sep-16 Mar-17 Sep-17 Mar-18 Sep-18 Mar-19 Sep-19 Mar-20 Sep-20 Mar-21 90+ day past due (ex-hardship) 90+ day past due 0.16 0.33 0.0 0.1 0.2 0.3 0.4 0.5 0.6 Sep-13 Mar-14 Sep-14 Mar-15 Sep-15 Mar-16 Sep-16 Mar-17 Sep-17 Mar-18 Sep-18 Mar-19 Sep-19 Mar-20 Sep-20 Mar-21 90+ day past due (ex-hardship) 90+ day past due New Zealand consumer portfolio. 93 Mortgage 90+ day delinquencies1 (%) Unsecured consumer 90+ day delinquencies1 (%) Mortgage portfolio LVR2 (%) of portfolio Mortgage loss rates each half (%) 1 In May 2019 we made changes to the reporting of customers in hardship to align to the method used by APRA. 2 LVR based on current loan property value at latest credit event. New Zealand Introduction of changes to the reporting of hardship 0.00 0.00 0.05 0.10 0.15 0.20 0.25 1H12 2H12 1H13 2H13 1H14 2H14 1H15 2H15 1H16 2H16 1H17 2H17 1H18 2H18 1H19 2H19 1H20 2H20 1H21 Introduction of changes to the reporting of hardship 47% 23% 23% 5% 2% 0<=60 60<=70 70<=80 80<=90 90+ 93% of mortgage portfolio less than 80% LVR Westpac Group 2021 Interim Results Presentation & Investor Discussion Pack |
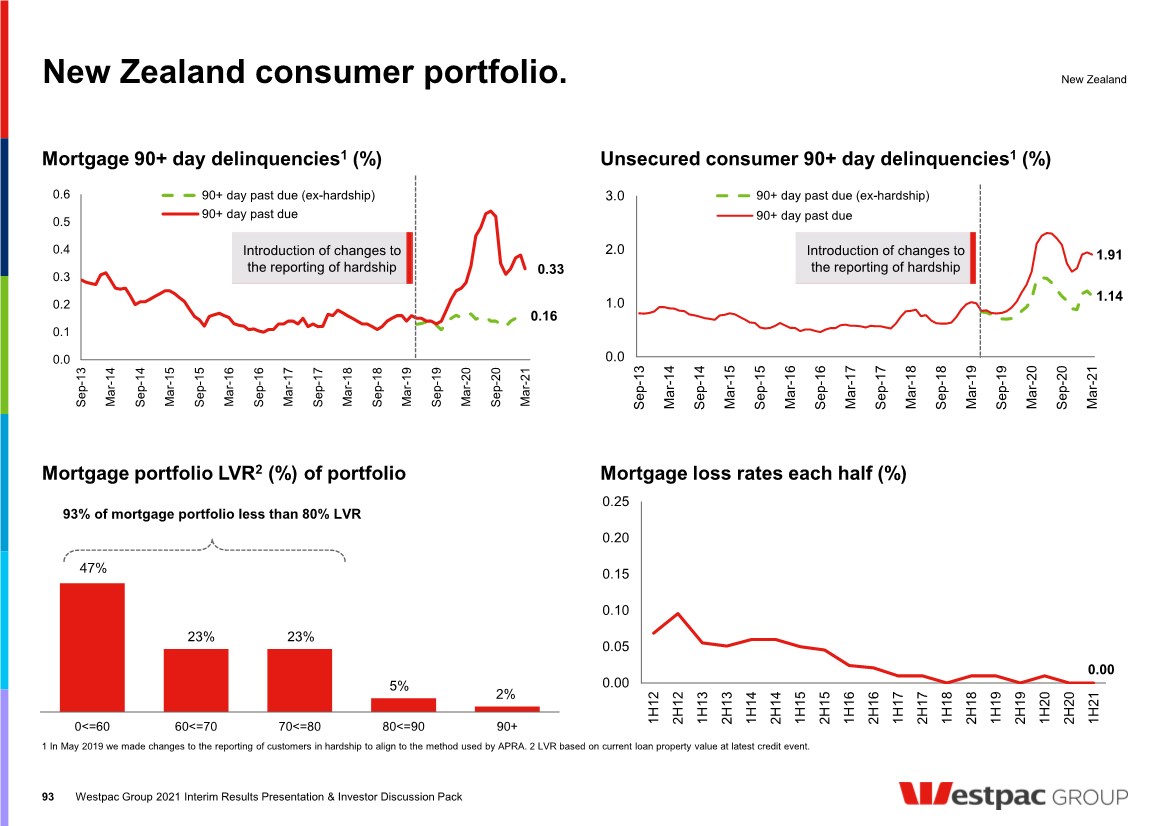
| 93 (599) 820 221 6 44 71 175 431 134 (86) (297) 1H20 2H20 Add back notable items 2H20 ex-notable items Net interest income Non-interest income Operating expenses Impairment charges Tax and NCI 1H21 ex-notable items Notable items 1H21 Key financial metrics 1H20 2H20 1H21 Change on 2H20 Average funds ($bn) 203.8 191.1 205.6 8% Spot funds ($bn) 179.1 193.0 211.7 10% Platforms deposits ($bn) 5.2 4.9 4.3 (12%) Platform FUA market share (inc. Corp Super)1 (%) 18.4 18.4 18.5 0.1ppt Retail Life Insurance in-force premiums ($m) 949 942 938 - Life Insurance claims ratio2 (%) 54 48 63 Large Auto Finance loans ($bn) 12.5 11.5 11.1 (3%) Held for sale businesses Key financial metrics 1H20 2H20 1H21 Change on 2H20 Vendor Finance loans ($bn) 0.5 0.4 0.5 25% Westpac Pacific loans ($bn) 1.8 1.6 1.4 (13%) General Insurance GWP3 ($m) 273 282 289 2% General Insurance claims ratio (%) 107 58 82 Large LMI4 GWP ($m) 89 91 154 69% LMI claims (loss) ratio (%) 15 67 3 Large Specialist Businesses 1H21 performance. 94 Cash earnings ($m) 1 Plan for Life, December 2020. 2 Loss ratio is claims net of reinsurance over the total earned premium plus exchange commission. 3 Gross written premium. 4 Lenders mortgage insurance. Specialist Businesses Up $210m or 95% Up $733m Westpac Group 2021 Interim Results Presentation & Investor Discussion Pack NIM up 23bps mostly from the roll-off of COVID-19 interest rate discounts as part of support Higher Life Insurance, LMI and funds income Improved economic outlook and improved asset quality Decrease in COVID-19 support costs, timing of project spend and seasonality of spend |
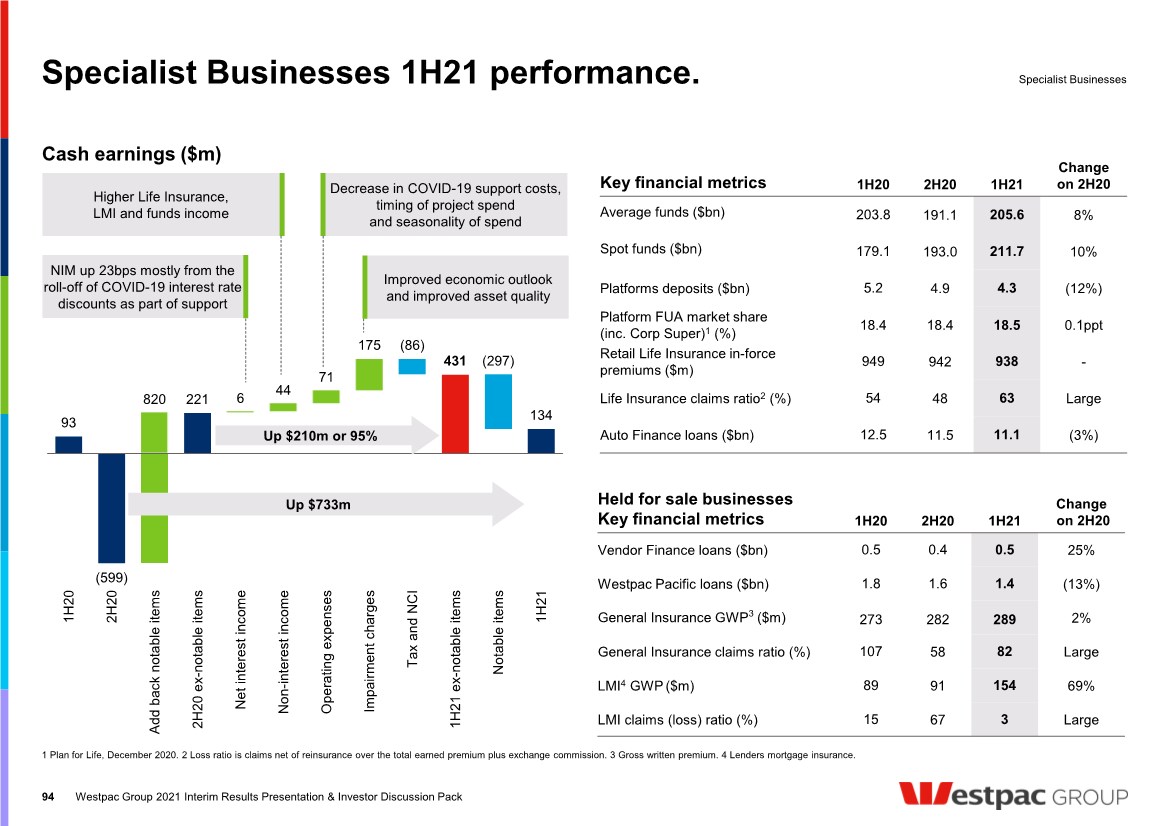
| 12,402 17,041 23,387 24,700 31,240 49,593 Sep-18 Mar-19 Sep-19 Mar-20 Sep-20 Mar-21 BT Wrap migration 23,462 32,444 44,314 54,781 67,109 115,369 Sep-18 Mar-19 Sep-19 Mar-20 Sep-20 Mar-21 BT Wrap migration Panorama. 95 Supporting advisers and investors. One core operating system SMSFs Digital user experience Bank connectivity /security One system for all investors & advisers BT Panorama’s unique offering Active advisers on Panorama3 (#) SMSF funds on Panorama3 (#) FUA on Panorama2 ($m) Investors on Panorama2 (#) 1,775 2,291 2,494 2,827 3,017 3,535 Sep-18 Mar-19 Sep-19 Mar-20 Sep-20 Mar-21 6,215 7,204 9,289 10,981 12,310 14,118 Sep-18 Mar-19 Sep-19 Mar-20 Sep-20 Mar-21 Up 111% Up 29% Up 101% Up 25% 1 Investment Trends Platform and Competitive Analysis and Benchmarking Report, December 2020. 2 Migration from BT Wrap to Panorama is underway, expected to complete by 30 June 2021. 3 Advisers and SMSF funds that have been migrated from BT Wrap are not shown separately. • Best Mobile Platform1 • Best Client Portal1 • Best Online Business Management1 Westpac Group 2021 Interim Results Presentation & Investor Discussion Pack Panorama UX supports both advised and direct to consumer investment and superannuation propositions Specialist Businesses |
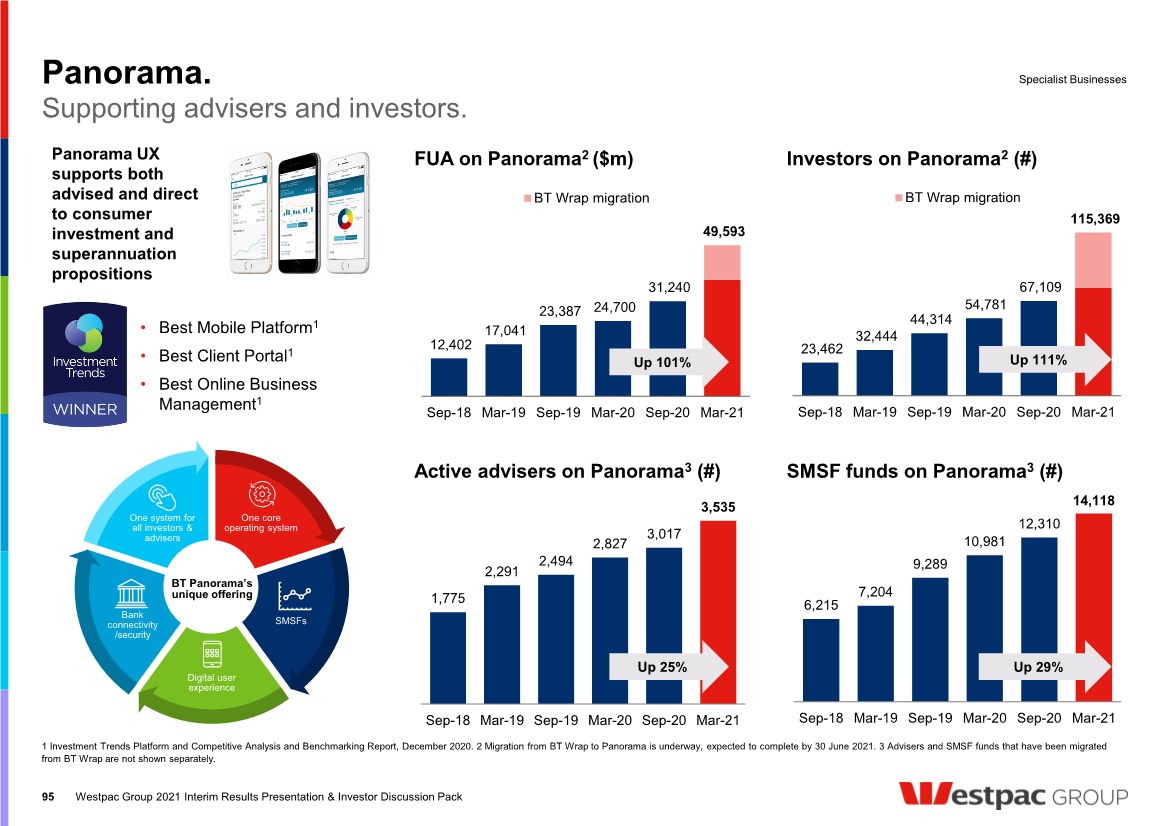
| Economics |
| Australian and New Zealand economic forecasts. Source: Westpac Economics. 1 Year average growth rates. 2 Through the year growth rates. 97 Economics Westpac Group 2021 Interim Results Presentation & Investor Discussion Pack Key economic indicators (%) at April 2021 2019 2020 2021F 2022F World GDP1 2.8 -3.3 5.9 4.5 Australia GDP2 2.2 -1.1 4.5 3.0 Unemployment – end period 5.2 6.8 5.0 4.7 CPI headline – year end 1.8 0.9 3.1 2.1 Interest rates – cash rate 0.75 0.10 0.10 0.10 New Zealand GDP2 1.7 -0.9 2.1 4.9 Unemployment – end period 4.1 4.9 4.9 4.2 Consumer prices 1.9 1.4 2.4 1.3 Interest rates – official cash rate 1.00 0.25 0.25 0.25 Key economic indicators (%) at April 2021 2019 2020 2021F 2022F Australia Credit growth Total – year end 2.4 1.8 4.6 5.6 Housing – year end 3.0 3.5 6.5 7.2 Business – year end 2.4 0.9 2.5 3.6 New Zealand Credit growth Total – year end 5.7 3.3 5.7 5.7 Housing – year end 6.9 8.2 8.6 6.1 Business – year end 4.6 -2.6 1.3 5.3 Private sector credit growth (% ann) -10 -5 0 5 10 15 20 25 Mar-07 Mar-09 Mar-11 Mar-13 Mar-15 Mar-17 Mar-19 Mar-21 Housing Australia Total credit Australia Business Australia Total credit New Zealand Westpac f’casts % ann Sources: RBA, Westpac Economics GDP growth (year average) -6.0 -4.0 -2.0 0.0 2.0 4.0 6.0 8.0 10.0 12.0 Australia New Zealand United States China 2018 2019 2020 2021f 2022f |
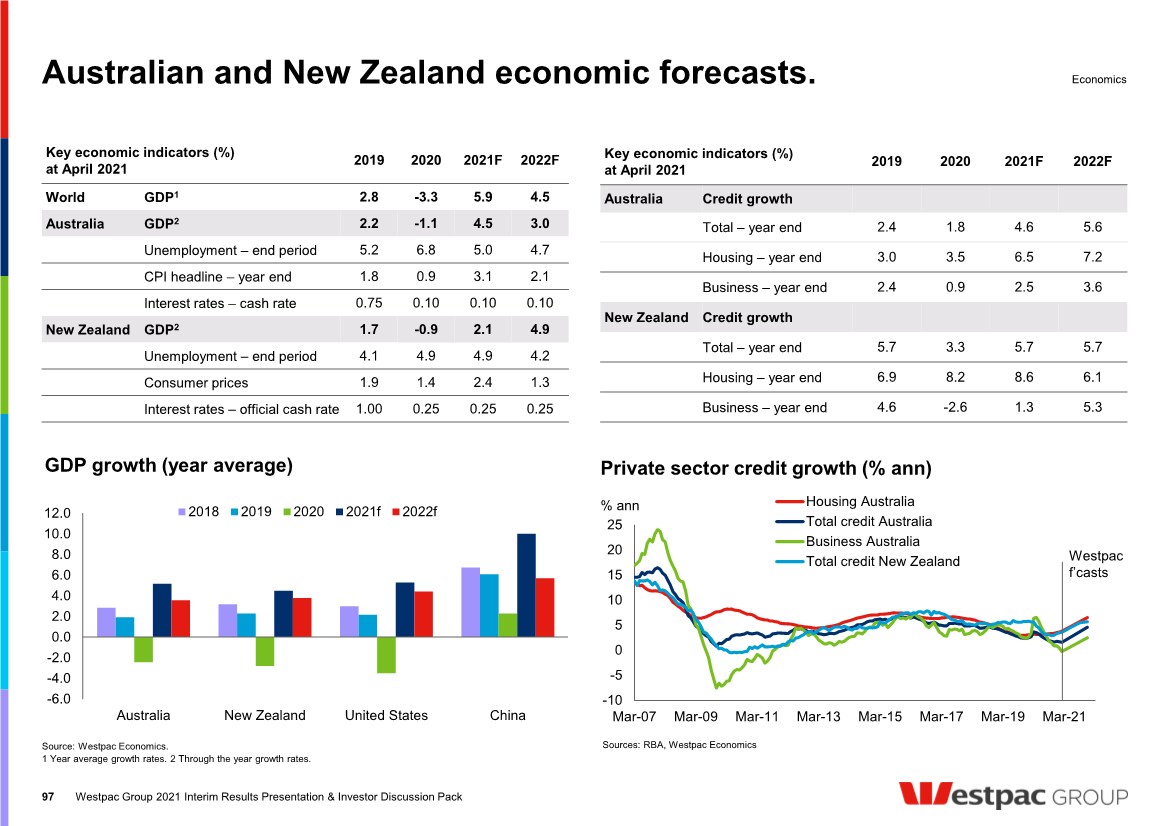
| TAS 540k The Australian economy. Australian GDP and employment composition Population 25.7 million. Sources: ABS, Westpac Economics 1 Real, financial years, experimental estimates. Economics 10 6 8 8 9 2 6 9 6 6 10 19 Mining Manufacturing Construction Transport, Utilities Wholesale, Retail Agriculture Household services Health Education Public administration Finance Business services 2 8 9 6 14 3 13 12 8 6 4 15 Mining Manufacturing Construction Transport, Utilities Wholesale, Retail Agriculture Household services Health, Social Assistance Education Public Administration Finance Business services Output 2020 - sector contribution to GDP1 (%) Australian employment by sector 2020 (%) 33 24 19 14 6 2 32 26 20 10 7 2 32 26 20 11 7 2 29 14 20 35 4 1 NSW Victoria Queensland WA SA Tasmania GSP Population Employment Exports Relative size of States (Share of Australia, 2019/20, %) 98 Westpac Group 2021 Interim Results Presentation & Investor Discussion Pack Australian population WA 2.7m SA 1.8m QLD 5.2m NT 245k NSW 8.2m VIC 6.7m ACT 430k |
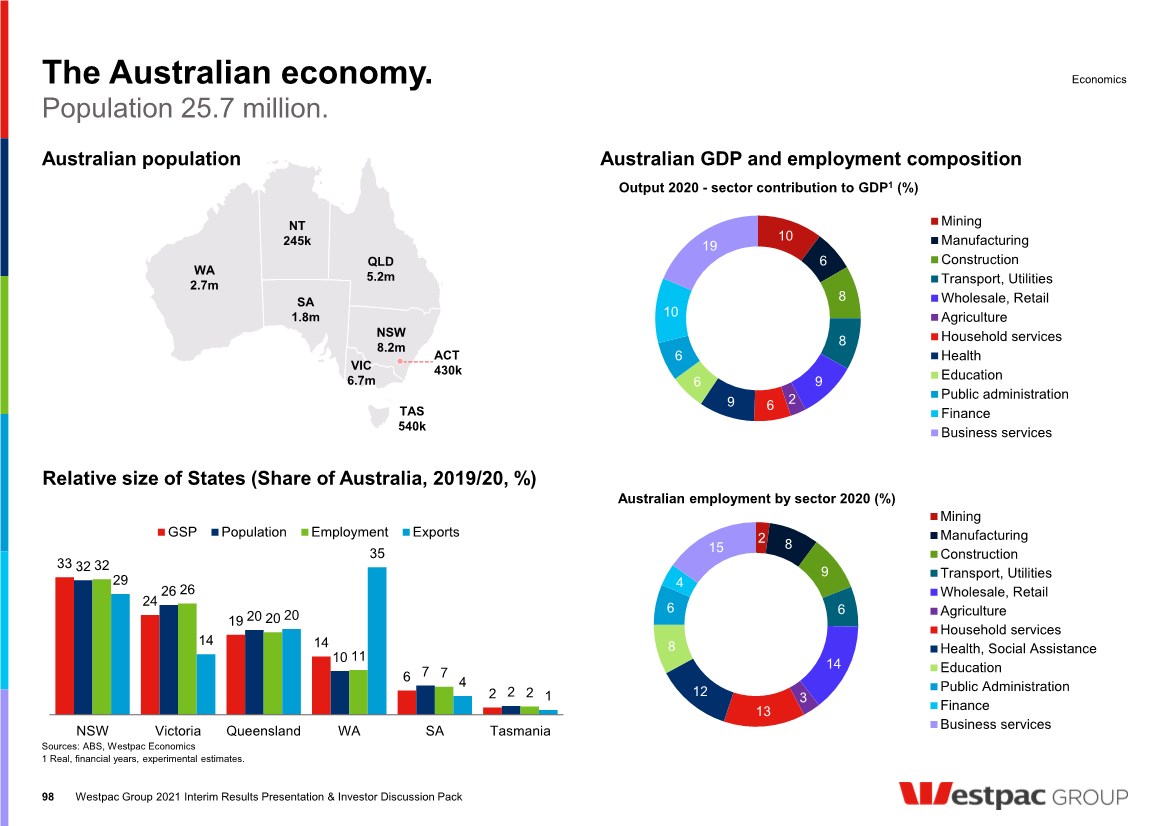
| -50 -40 -30 -20 -10 0 10 -50 -40 -30 -20 -10 0 10 Feb-20 Apr-20 Jun-20 Aug-20 Oct-20 Dec-20 Feb-21 Apr-21 Index The Australian economy. Australia’s GDP profile (index) Economics Sources: ABS, Westpac Economics. Recovery well under way and stronger than expected. 88 92 96 100 104 108 112 88 92 96 100 104 108 112 Dec-15 Dec-16 Dec-17 Dec-18 Dec-19 Dec-20 Dec-21 Dec-22 Index Index Pre covid forecast Current forecast Dec 2019 = 100 Westpac f’casts 99 Westpac Group 2021 Interim Results Presentation & Investor Discussion Pack GDP growth year end contributions (ppts) Sources: ABS, Westpac Economics. -3 -2 -1 0 1 2 3 4 5 -3 -2 -1 0 1 2 3 4 5 Consumer Housing Business Investment Public Net exports GDP ppts ann ppts ann 2019 2020 2021f 2022f Consumer sentiment (index) Sources: Westpac MI, Westpac Economics 70 80 90 100 110 120 130 70 80 90 100 110 120 130 Apr-07 Apr-09 Apr-11 Apr-13 Apr-15 Apr-17 Apr-19 Apr-21 Index Monthly Source: Google, Westpac Economics Australian mobility measures (index) Chart shows movement trends over time in Australia, using Google location data for retail locations. 28-day rolling avg, indexed, daily, Jan 3-Feb 6 avg = 0. Consumer sentiment at 11 year high in April National lockdowns in March / April 2020 |
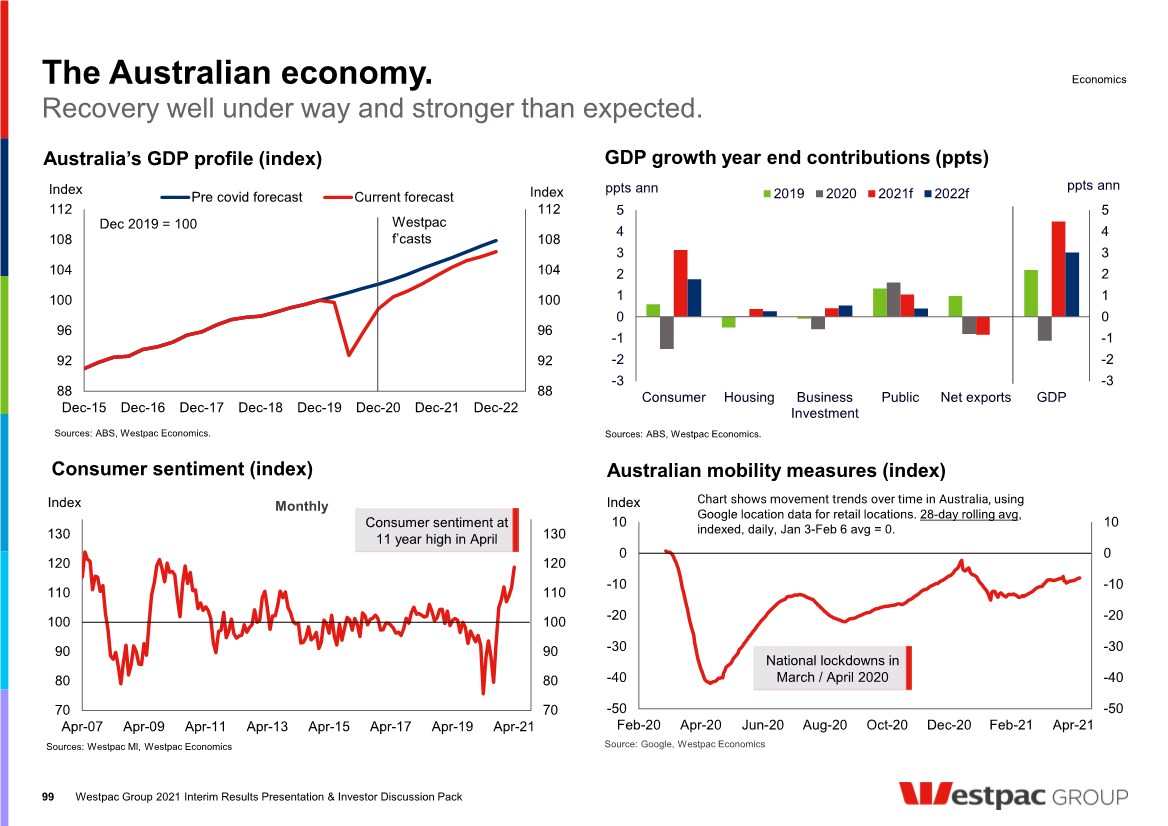
| The Australian economy. Economics Momentum in consumer and housing. 100 Westpac Group 2021 Interim Results Presentation & Investor Discussion Pack Sources: ABS, Westpac Economics. Consumer spending: broad categories 40 50 60 70 80 90 100 110 120 40 50 60 70 80 90 100 110 120 Dec-05 Dec-08 Dec-11 Dec-14 Dec-17 Dec-20 Index Index Essential services Durables Discretionary services Basic food Fuel *Index based to Dec 2019 qtr = 100 Latest vs pre-COVID: –27% –10.7% +2.4% +6.2% +11.8% Sources: ABS, Westpac Economics. Household saving ratio (% of income) -4 0 4 8 12 16 20 24 28 -4 0 4 8 12 16 20 24 28 Dec-88 Dec-93 Dec-98 Dec-03 Dec-08 Dec-13 Dec-18 % Income % Income Sources: CoreLogic, Westpac Economics 70 90 110 130 150 170 190 210 70 90 110 130 150 170 190 210 Mar-09 Mar-11 Mar-13 Mar-15 Mar-17 Mar-19 Mar-21 Mar-23 Index Index Sydney Melbourne Brisbane Perth Westpac f’casts to Dec-22 2017 peaks Dec-09 = 100 Dwelling prices (all dwellings, index) Sources: CoreLogic, Westpac Economics. Residential property: listings and sales (‘000s) 15 17 19 21 23 25 27 29 31 33 15 17 19 21 23 25 27 29 31 Mar-08 Mar-10 Mar-12 Mar-14 Mar-16 Mar-18 Mar-20 ‘000s ‘000s new listings (lhs) sales (lhs) |
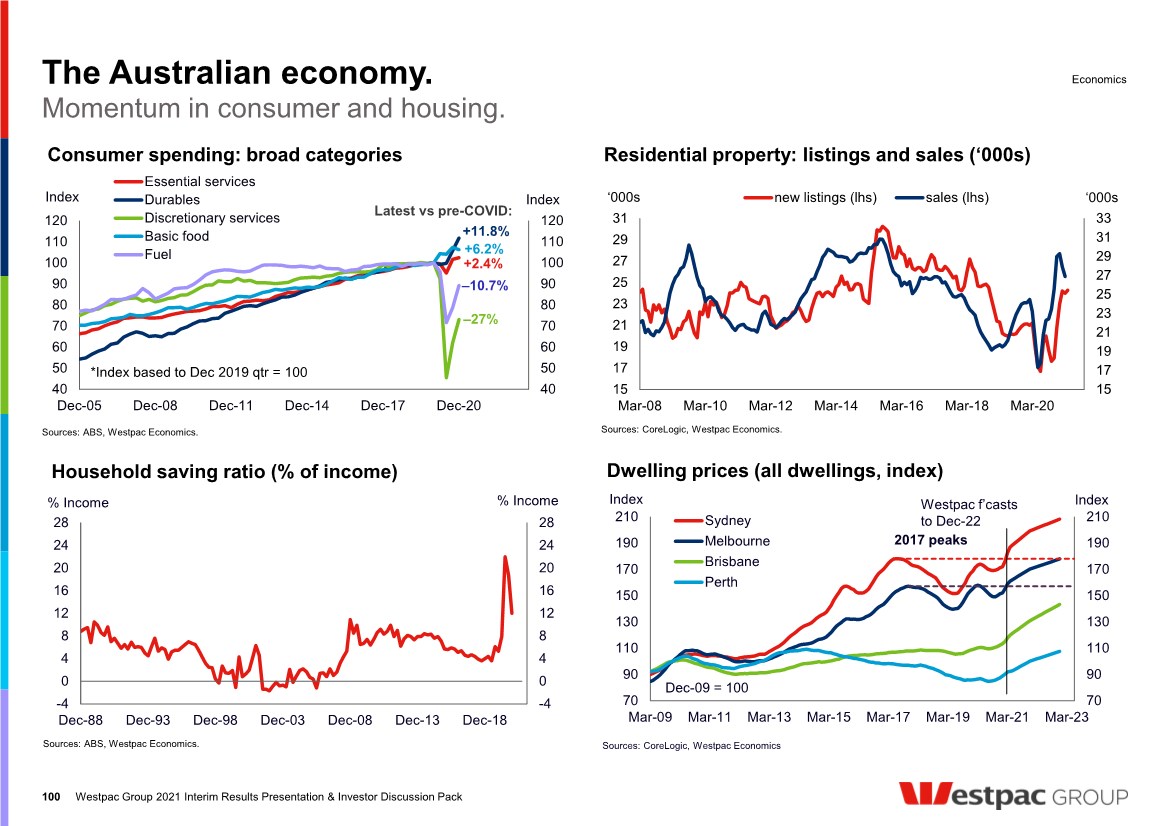
| The Australian economy. Sources: RBA, Westpac Economics 101 Positive signs but still a long way from potential. Economics Westpac Group 2021 Interim Results Presentation & Investor Discussion Pack Wages (%) 1 2 3 4 5 1 2 3 4 5 Dec-96 Dec-00 Dec-04 Dec-08 Dec-12 Dec-16 Dec-20 % % RBA’s target: > 3% Westpac f’casts to Dec-23 Unemployment rate (%) Sources: NAB survey, ABS, Westpac Economics. Aust. population growth: medium term prospects (% ann) Sources: ABS, Aus Govt Centre for Population, Westpac Economics. -0.5 0.0 0.5 1.0 1.5 2.0 2.5 -0.5 0.0 0.5 1.0 1.5 2.0 2.5 1980 1990 2000 2010 2020 Ann % Ann % Population Contribution from net migration Gov’t forecasts (to Jun-24) Sources: NAB survey, ABS, Westpac Economics Business confidence and investment 2 3 4 5 6 7 8 9 2 3 4 5 6 7 8 9 Mar-97 Mar-01 Mar-05 Mar-09 Mar-13 Mar-17 Mar-21 % % RBA’s target: < 4% Westpac f’casts to Dec-23 -30 -20 -10 0 10 20 30 -30 -20 -10 0 10 20 30 Mar-91 Mar-00 Mar-09 Mar-18 % yr end Net Bal. Business investment real, non-mining, lhs Business confidence, adv 2qtrs, rhs |
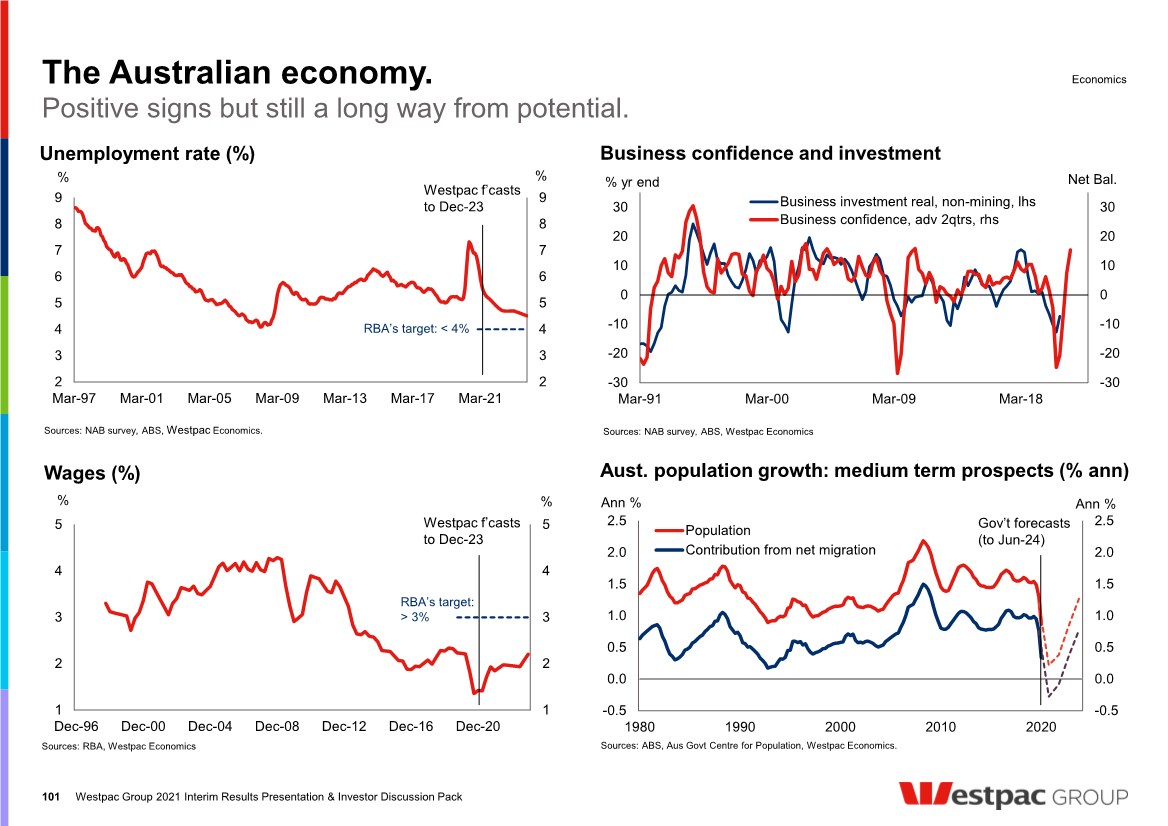
| The Australian economy. Economics Commodity prices expected to remain higher for longer. 102 Westpac Group 2021 Interim Results Presentation & Investor Discussion Pack Australian exports to China1 ($bn) Sources: IMF, Westpac Economics -5 -4 -3 -2 -1 0 1 2 3 4 5 6 7 -5 -4 -3 -2 -1 0 1 2 3 4 5 6 7 1995 1998 2001 2004 2007 2010 2013 2016 2019 2022 %yr %yr China Other Advanced Total Westpac f’casts World growth post COVID-19 (% yr) Sources: Westpac Economics, Bloomberg, ABS 20 40 60 80 100 120 140 160 20 40 60 80 100 120 140 160 Mar-13 Mar-15 Mar-17 Mar-19 Mar-21 2012=100 2012=100 Iron ore Met coal Thermal coal Brent Westpac f’casts to Dec-22 Australian commodity prices (index) Source: DFAT, ABS, Westpac Economics Australian export destinations1 ($bn) Sources: DFAT, Westpac Economics Australian export composition1 ($bn) Source: ABS, DFAT, Westpac Economics 1 All figures show $bn exports in 2020, note that figures may not sum due to rounding and other small differences in source data. Iron ore, 116 Coal, 43 LNG, 36 Other resources, 75 Services, 92 Rural, 43 Mfg/Other, 50 China, 145 Japan, 44 Korea, 23 Asia, rest of, 65 US, 19 Europe, 12 NZ, 10 Other, 22 Iron ore, 93 Coal, 16 LNG, 10 Other resources, 9 Services, 16 Rural, 13 Mfg/Other, 3 |

| Australian housing market. Australian dwelling prices (index) Housing market in strong, broad-based upswing led by owner-occupiers. Sources: CoreLogic, Westpac Economics. Economics 90 110 130 150 170 190 210 230 90 110 130 150 170 190 210 230 Mar-04 Jan-07 Nov-09 Sep-12 Jul-15 May-18 Mar-21 Index Rest of Australia Other capitals Sydney-Melbourne Sources: CoreLogic, Westpac Economics. % change over period Capital city Pop’n Last 3 mths (to Mar-21) Last 12 mths (Mar-21) Last 5 years (to Mar-21) Sydney 4.8m Up 6.7% Up 5.4% Up 3.7% Melbourne 4.5m Up 4.9% Up 0.7% Up 3.8% Brisbane 2.3m Up 4.8% Up 6.8% Up 2.4% Perth 1.9m Up 5.0% Up 6.0% Down 2.0% All dwellings (index, Jan 2004 = 100) 103 Westpac Economics dwelling price forecasts (%) Sources: CoreLogic, Westpac Economics. Westpac Group 2021 Interim Results Presentation & Investor Discussion Pack Sources: ABS, Westpac Economics. Housing finance approvals by segment ($bn) 0 5 10 15 20 25 30 35 40 45 0 5 10 15 20 25 30 35 40 45 Feb-01 Feb-05 Feb-09 Feb-13 Feb-17 Feb-21 $bn $bn 'Upgraders' Investor First home buyers Dwelling prices 0 5 10 15 20 0 5 10 15 20 Sydney Melbourne Brisbane Perth Adelaide Australia % % 2021 forecast 2021 year to date |
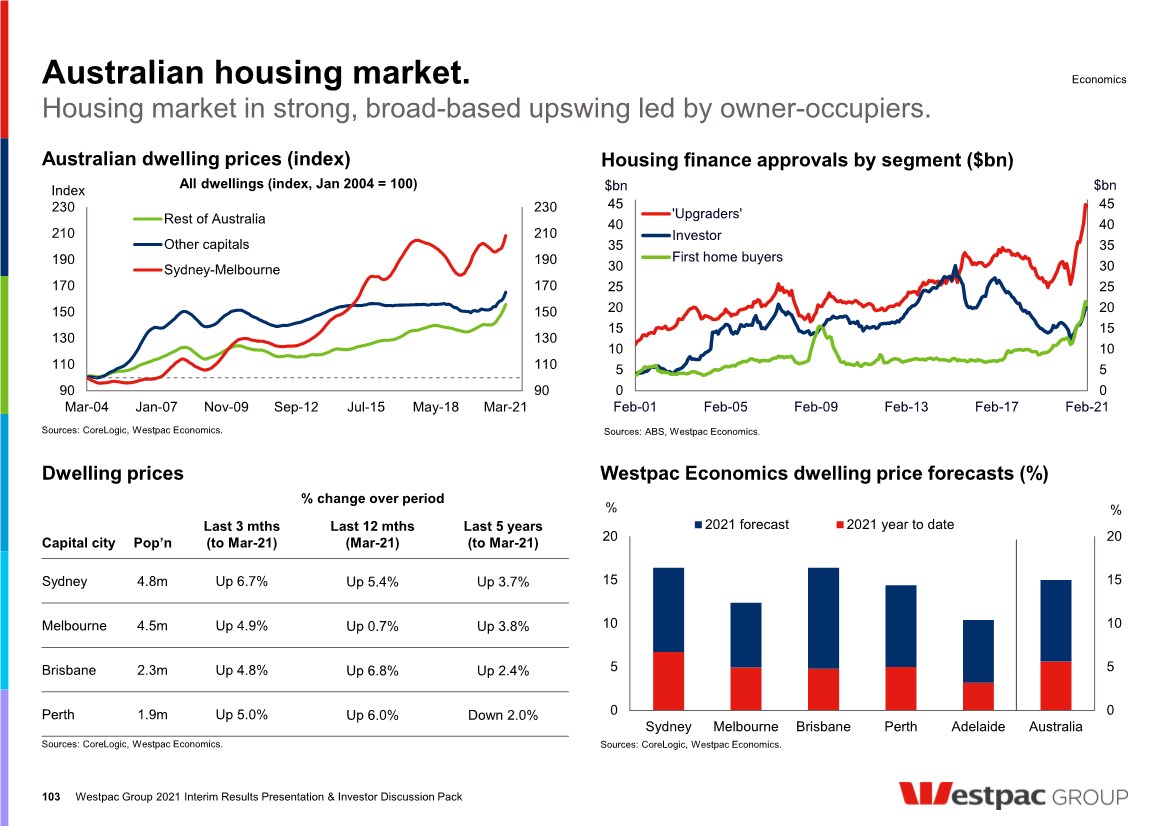
| Australian housing market. Rental vacancy rates (%) Affordability issues to re-emerge in Sydney and Melbourne. Economics 0 1 2 3 4 5 6 7 8 Mar-88 Sep-93 Mar-99 Sep-04 Mar-10 Sep-15 Mar-21 % Sydney Brisbane Melbourne Perth National average since 1980 Rental vacancy rates (%, quarterly, annual average) Sources: ABS, Westpac Economics. 104 Westpac Group 2021 Interim Results Presentation & Investor Discussion Pack Mortgage interest rates (%) Sources: RBA, Westpac Economics. * Standard, owner occupier, including discount 0 2 4 6 8 10 0 2 4 6 8 10 Mar-07 Mar-09 Mar-11 Mar-13 Mar-15 Mar-17 Mar-19 Mar-21 % % Variable* 3 year fixed 10 15 20 25 30 35 10 15 20 25 30 35 Dec-99 Dec-02 Dec-05 Dec-08 Dec-11 Dec-14 Dec-17 Dec-20 % % NSW Vic Aus Share of average income required to raise a deposit over 5yrs and pay mortgage over first 5yrs for purchase of median-priced dwelling Westpac f’casts to Dec-22 2017 peaks Sources: CoreLogic, Westpac Economics Affordability: Australia (%) Consumer Sentiment: ‘time to buy a dwelling’ (index) Sources: Melbourne Institute, Westpac Economics 60 70 80 90 100 110 120 130 140 150 160 60 70 80 90 100 110 120 130 140 150 160 Apr-01 Apr-05 Apr-09 Apr-13 Apr-17 Apr-21 Index Index *quarterly observations prior to 2007 |
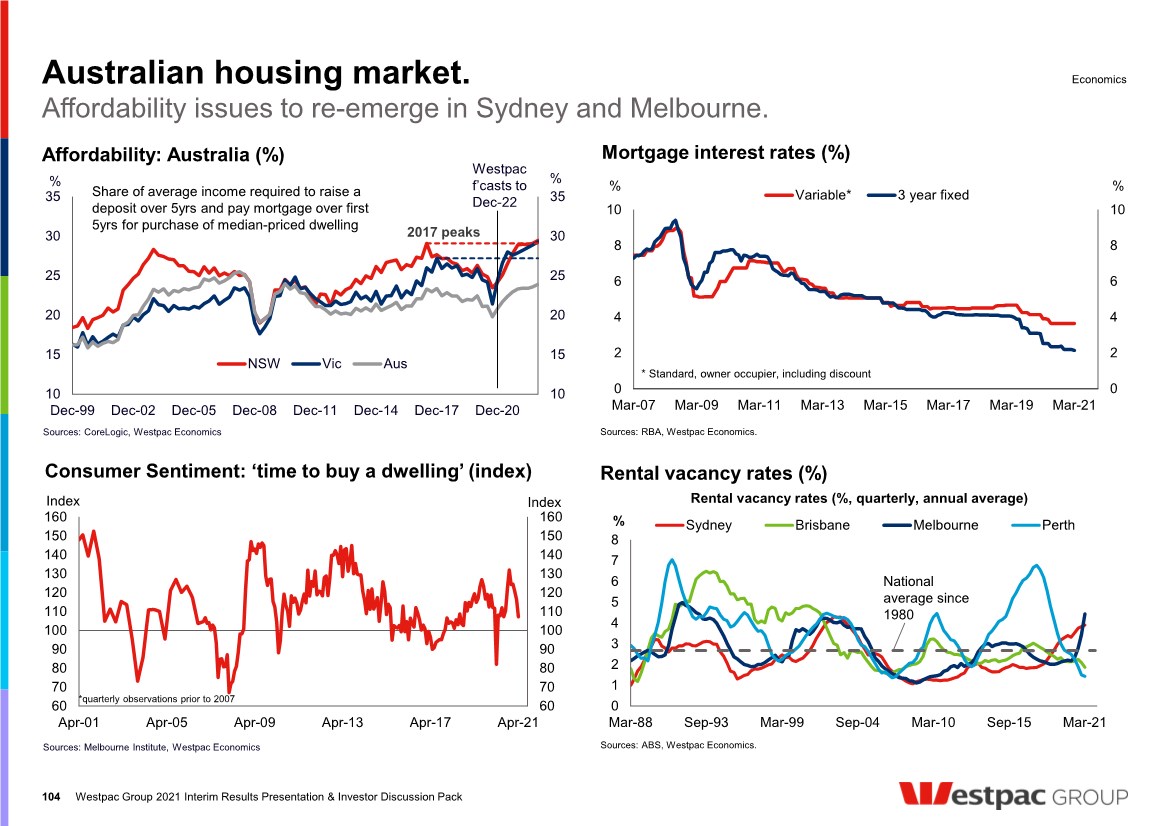
| 6 6 3 9 12 3 35 5 10 11 Primary industries Construction Electricity, gas, and water Manufacturing Wholesale, retail and accommodation Transport Financial and professional services Public administration Social services (incl. health and education) Other The New Zealand economy. 105 Economy Regional GDP Population 5.1 million. Sources: Stats NZ, Westpac Economics. Nationwide GDP and employment figures are for the year to Dec 2020, regional figure are for the year to March 2020. Economics NZ employment by sector 2020 (%) Output 2020 - sector shares of GDP (%) Total nominal GDP 2020: $322 bn Charts may not add to 100 due to rounding. Westpac Group 2021 Interim Results Presentation & Investor Discussion Pack 6 10 1 9 18 4 19 6 19 7 Primary industries Construction Electricity, gas, and water Manufacturing Wholesale, retail and accommodation Transport Financial and professional services Public administration Social services (incl. health and education) Other Total nominal GDP 2019: $303bn Northland, $8bn 4% of population Auckland, $122bn 35% of population Waikato, $28bn 10% of population Taranaki, Whanganui/Manawatu, $21bn 7% of population Wellington, $40bn 11% of population Bay of Plenty, $19bn 6% of population Southland, $7bn 2% of population Otago, $14bn 5% of population Canterbury, $40bn 13% of population West Coast, $2bn 1% of population Tasman/Nelson, $6bn 2% of population Marlborough, $3bn 1% of population Gisborne/Hawke’s Bay, $11bn 4% of population |
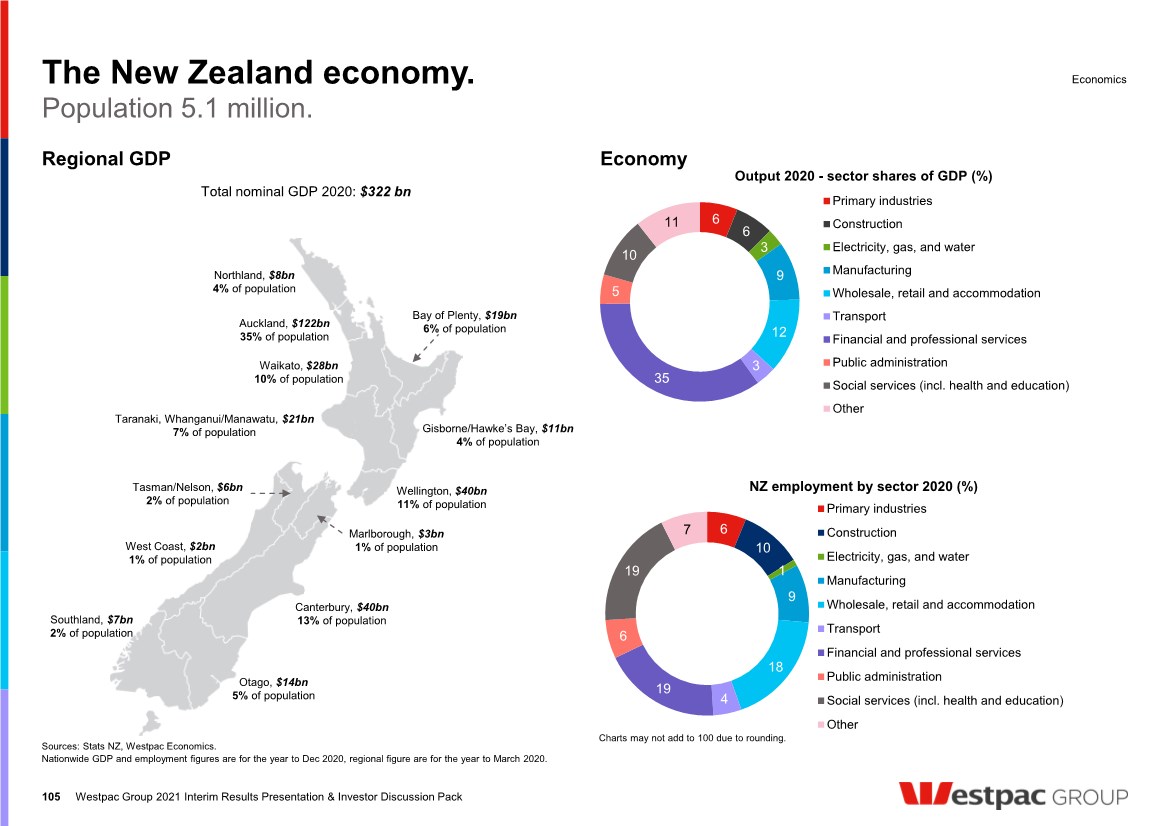
| The New Zealand economy. Westpac Group 2021 Interim Results Presentation & Investor Discussion Pack 106 New Zealand GDP ($bn) Unemployment rate (%) New Zealand private sector credit growth (% ann) Sources: Stats NZ, Westpac Economics. Economics Economic indicators Current Dec 2021 forecast Cash rate 0.25% (14 Apr 2021) 0.25% Unemployment 4.9% (Dec qtr 2020) 4.9% GDP (%yr end) -0.9% (Dec qtr 2020) 2.1% Private sector credit 3.6% (Feb 2021) 5.7% Sources: Stats NZ, Westpac Economics. Business activity surveys (index) Sources: ANZ, Westpac Economics 2 3 4 5 6 7 8 2 3 4 5 6 7 8 2006 2009 2012 2015 2018 2021 Pre-Covid forecast Current forecast Westpac forecasts % % 25 30 35 40 45 50 55 60 65 70 25 30 35 40 45 50 55 60 65 70 2017 2018 2019 2020 2021 PSI - Services PMI - Manufacturing Index Index -10 -5 0 5 10 15 20 25 Aug-00 Aug-04 Aug-08 Aug-12 Aug-16 Aug-20 Housing Total credit Business % ann Westpac forecasts 50 55 60 65 70 75 50 55 60 65 70 75 2018 2020 2022 Pre-Covid forecast Current forecast $bn $bn Westpac forecasts Sources: Westpac Economics Recovery well advanced. |
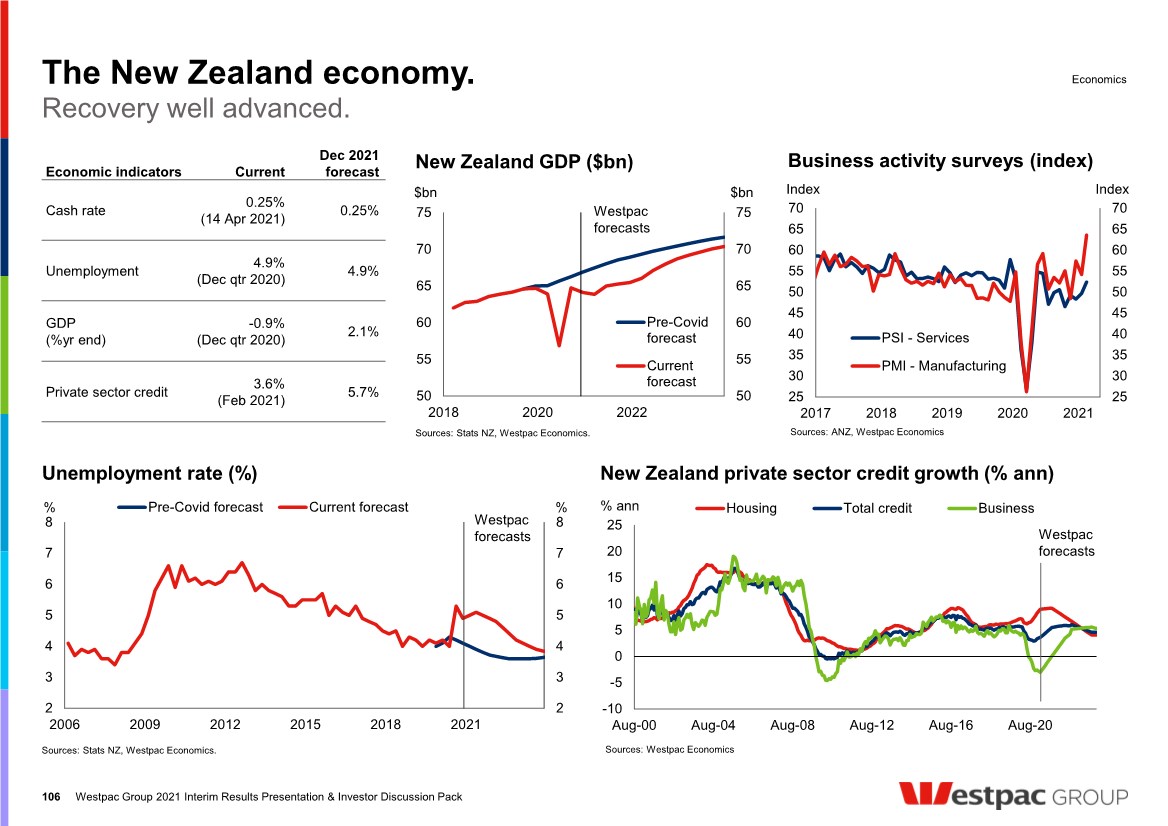
| New Zealand housing market. 107 New Zealand dwelling prices (index, Jan 2007 = 1000) Major policy shift. Sources: REINZ, Westpac Economics. Economics Sources:REINZ, Stats NZ. Westpac Group 2021 Interim Results Presentation & Investor Discussion Pack Changes to housing market policies Dwelling prices % change over period Region Pop’n Last 3 mths (to Mar-21) Last 12 mths (Mar-21) Last 5 years (to Mar-21) Auckland 1.7m Up 7.1% Up 22.5% Up 39.2% Wellington 0.5m Up 9.5% Up 31.2% Up 104.7% Canterbury 0.6m Up 7.7% Up 20.3% Up 30.1% Nationwide 5.1m Up 8.5% Up 24.0% Up 58.6% • The Government has announced a suite of new housing market policies affecting both demand and supply • The most significant changes relate to the tax treatment of mortgage interest costs • This will erode the financial incentives for property investors and tilt housing market conditions more in favour of owner occupiers • Westpac expects these policy changes will prompt a flattening off of house prices over the remainder of 2021. That follows a period of very strong growth since the economy exited lockdown. The major changes introduced by the Government include: • Removing the ability to offset mortgage costs on residential investment properties against the income earned on those properties − This change will take effect from 1 October 2021 for properties purchased after 27 March 2021 and will be gradually phased in over the next four years for existing property owners − The Government is also looking at exceptions for new builds • The holding period for taxing capital gains on residential investment properties (otherwise known as the ‘Bright-line test’) has been extended from 5 to 10 years − The holding period remains at 5 years for investors who buy new builds • A $3.8bn Housing Acceleration Fund is being established to assist with the development of infrastructure (such as pipes and roads) to support new housing • Additional financial assistance for first home buyers with changes in First Home Loans and Grants settings, including increases in income caps, as well as changes to regional price caps 900 1300 1700 2100 2500 900 1300 1700 2100 2500 2007 2009 2011 2013 2015 2017 2019 2021 Auckland Canterbury Wellington Other regions Index Index |
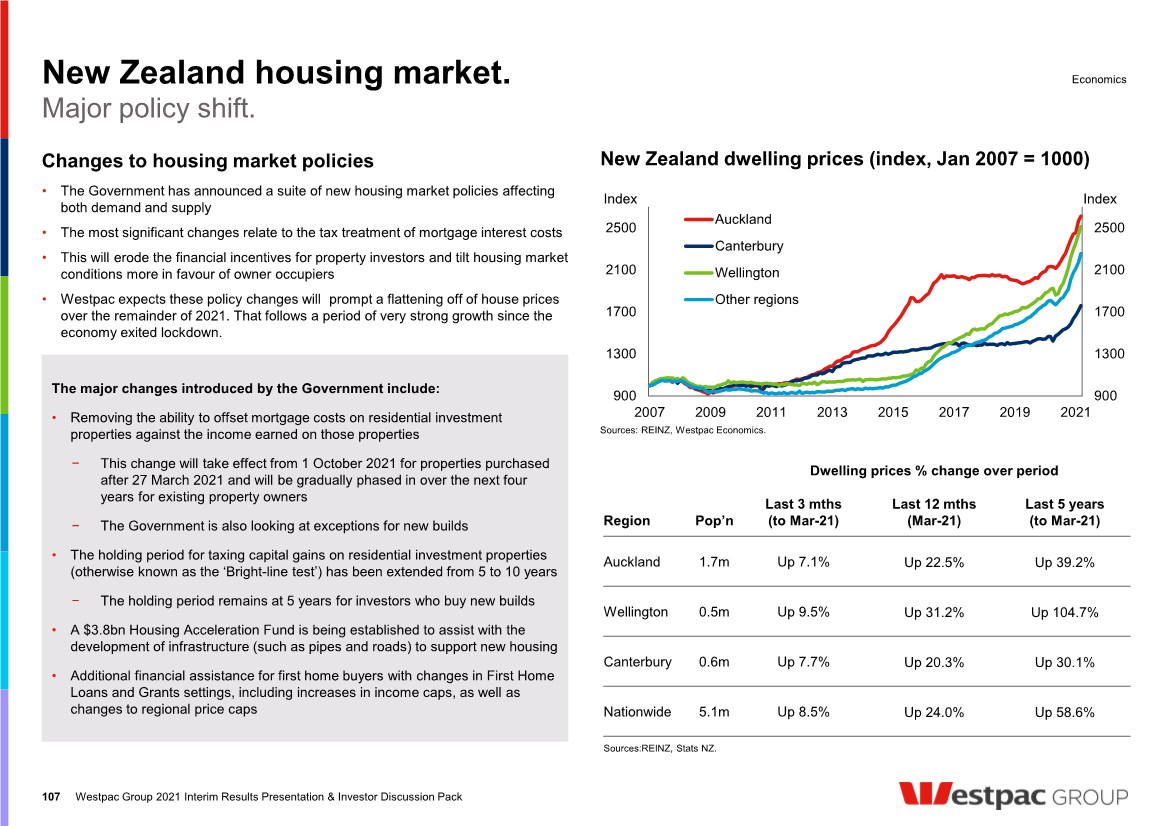
| Appendix and Disclaimer |
| Appendix 1: 109 Cash earnings adjustments. Appendix Appendix Cash earnings adjustment ($m) 1H20 2H20 1H21 Description Reported net profit 1,190 1,100 3,443 Net profit attributable to owners of Westpac Banking Corporation Fair value (gain)/loss on economic hedges (219) 581 48 Fair value on economic hedges (which do not qualify for hedge accounting under AAS) comprise: • The unrealised fair value (gain)/loss on foreign exchange hedges of future New Zealand earnings impacting non- interest income is reversed in deriving cash earnings as they may create a material timing difference on reported results but do not affect the Group’s cash earnings over the life of the hedge. Westpac has ceased this activity, and at this stage no further adjustments will be recognised; and • The unrealised fair value (gain)/loss on hedges of accrual accounted term funding transactions are reversed in deriving cash earnings as they may create a material timing difference on reported results but do not affect the Group’s cash earnings over the life of the hedge Ineffective hedges (24) (37) 46 The unrealised (gain)/loss on ineffective hedges is reversed in deriving cash earnings because the gain or loss arising from the fair value movement in these hedges reverses over time and does not affect the Group’s profits over time Adjustments related to Pendal Group 63 (32) - Consistent with prior periods, this item has been treated as a cash earnings adjustment given its size and that it does not reflect ongoing operations. The adjustment relates to the mark-to-market of the shares. Westpac disposed of its holdings in Full Year 2020. As a result, no further adjustments will be recognised Treasury shares (17) 3 - Under AAS, Westpac shares held by the Group in the managed funds and life businesses are deemed to be Treasury shares and the results of holding these shares cannot be recognised in the reported results. In deriving cash earnings, these results are included to ensure there is no asymmetrical impact on the Group’s profits because the Treasury shares support policyholder liabilities and equity derivative transactions which are revalued in determining income. At 31 March 2021, there are no Treasury shares Cash earnings 993 1,615 3,537 Westpac Group 2021 Interim Results Presentation & Investor Discussion Pack |
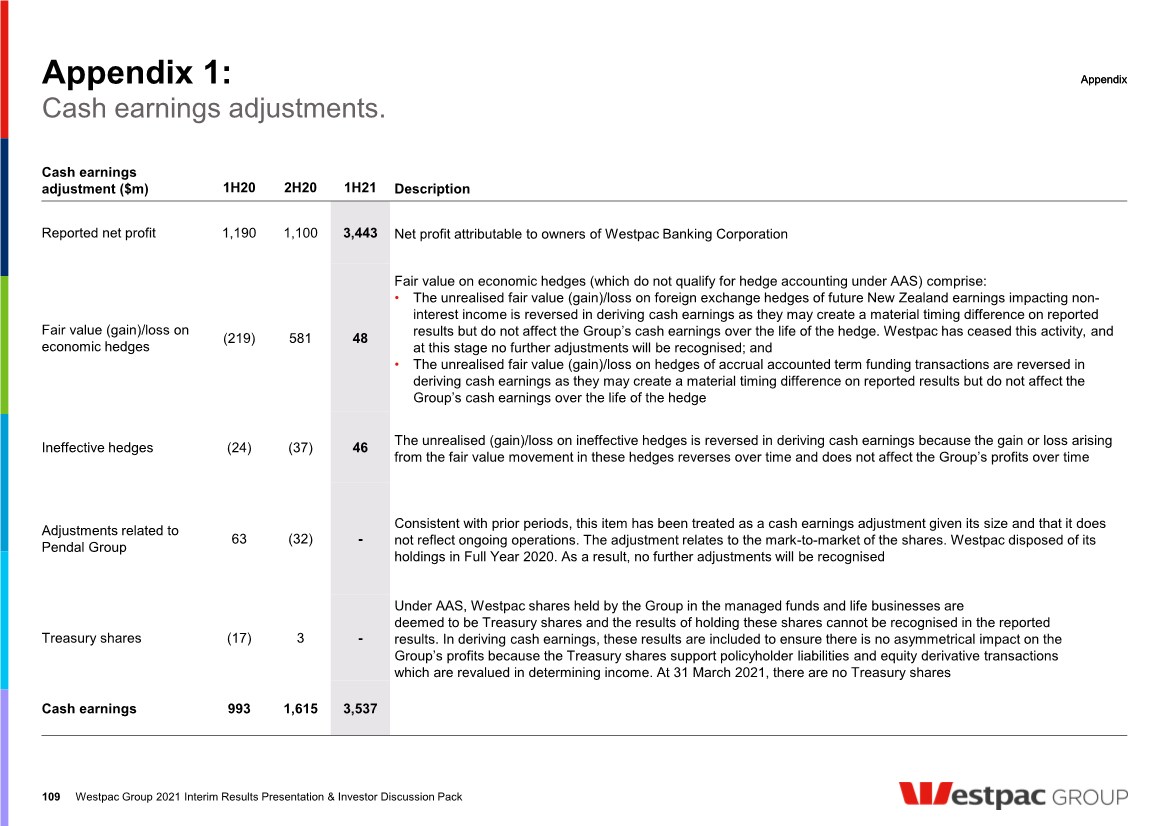
| Appendix 2: New business models 110 New technology capabilities Data, AI and analytics 1 Logos are of the respective companies. Appendix A natural language AI system for data analysis targeting relatively simple business queries that comprise 70% of an analyst’s work in a large organisation Open Banking API platform that provides connectivity to over 100 financial sources across Australia and NZ Comprehensive cloud-based human resources and employee benefits platform to streamline HR processes Full stack payments platform A trust framework and secure platform that allows users to exchange data safely and securely Enterprise cyber security company that protects businesses from malicious bot attacks Enabling software development teams to scale processes and improve code quality Digitised debt collection, leveraging modern communications, automation and machine learning Uses data to shed light on high volume crimes, improving prevention and detection A fund of funds for cryptocurrency and blockchain technology Peer-to-peer (P2P) online lending platform connecting borrowers and investors Helps home sellers make decisions about who they choose to sell their property Business loan marketplace that matches SMEs to the best lender based on their characteristics and needs A payment app for customers when dining out or grabbing a coffee on the go A bitcoin wallet and platform AI company that integrates neuroscience into their platform creating capability that not only manages complex problems but is able to form intrinsic relationships with humans Smart receipts that automatically link purchase receipts to customers’ bank accounts AI-powered, context-as-a-service platform, to deliver personalised experiences to customers B2B platform for physical retail stores that provides insights through their AI engine and in-store sensors A consumer digital lending platform Pioneering a new asset class called Tradeable Income Based Securities (TIBS) Creating real-game assets for developers, using blockchain technology Conversational voice-based AI for digital interviewing, powered by machine learning Turning buildings into community-centric dwellings Westpac has invested $150m in fintech venture capital fund, Reinventure. Reinventure enables Westpac to access insights and adjacent business opportunities, both in Australia and offshore. The model also helps Westpac to source commercial partnerships that create value for customers Reinventure – Investing in fintech businesses1. A leading digital credit platform in Indonesia Westpac Group 2021 Interim Results Presentation & Investor Discussion Pack Empowering banks to connect seamlessly with merchants and their customers |
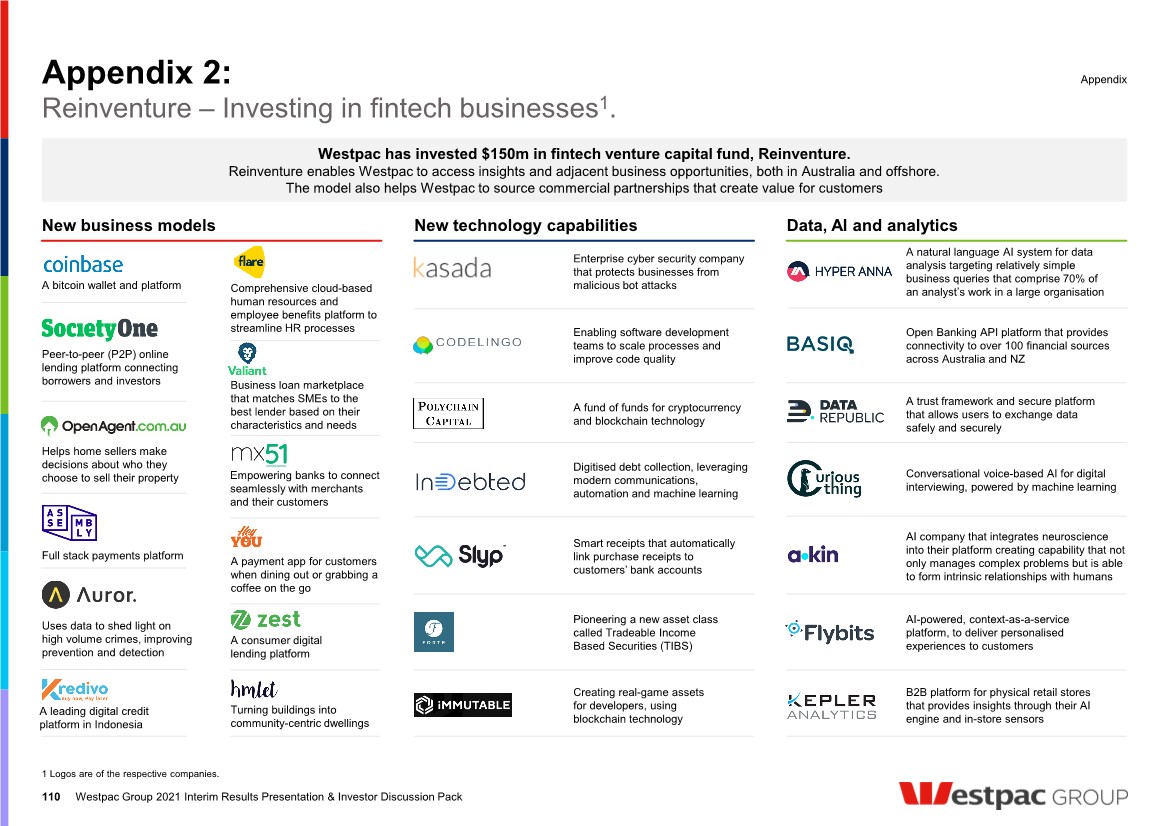
| Appendix 3: Industry recognition 111 Sustainability indexes Inclusion and diversity recognition Sustainability. Appendix Rated Prime status of “C” by ISS ESG (formerly ISS-oekom) Achieved highest ISS QualityScore for Environment and Social dimensions Member of the DJSI Indexes since 2002 Recognised as Silver Tier Employer in 2020 in the Australian Workplace Equality Index Awards Included in the 2019-20 Australian Network on Disability Access and Inclusion Index Westpac Group 2021 Interim Results Presentation & Investor Discussion Pack Received “B” rating in the 2020 CDP for our response to Climate Change, announced December 2020 As of March 2021, Westpac received an ESG Risk Rating of 27.3 from Sustainalytics and was assessed to be at Medium risk of experiencing material financial impacts from ESG factors1 Member of the FTSE4Good Index Series, of which Westpac has been a member for over 19 years, announced in June 2020 As of 2020, Westpac received an MSCI ESG Rating of A2 Recognised by the Bloomberg Gender Equality Index for the 5th consecutive year Accredited as Level 1 Activate as a Carer Friendly Employer under the CarersNSW Carers + Employers Program in 2020 1 Copyright ©2021 Sustainalytics. All rights reserved. This section contains information developed by Sustainalytics (www.sustainalytics.com). Such information and data are proprietary of Sustainalytics and/or its third party suppliers (Third Party Data) and are provided for informational purposes only. They do not constitute an endorsement of any product or project, nor an investment advice and are not warranted to be complete, timely, accurate or suitable for a particular purpose. Their use is subject to conditions available at https://www.sustainalytics.com/legal-disclaimers. 2 The use by WBC of any MSCI ESG Research LLC or its affiliates (“MSCI”) data, and the use of MSCI logos, trademarks, service marks or index names herein, do not constitute a sponsorship, endorsement, recommendation, or promotion of WBC by MSCI. MSCI services and data are the property of MSCI or its information providers, and are provided ‘as-is’ and without warranty. MSCI names and logos are trademarks or service marks of MSCI. Received the 2020 Advancement Award in recognition of Westpac’s innovative autism hiring program, Tailored Talent Ranked #1 in the ASX-50 and #2 in the world for transparency and effectiveness of our standalone sustainability Reporting, according to the Global ESG Monitor Report |
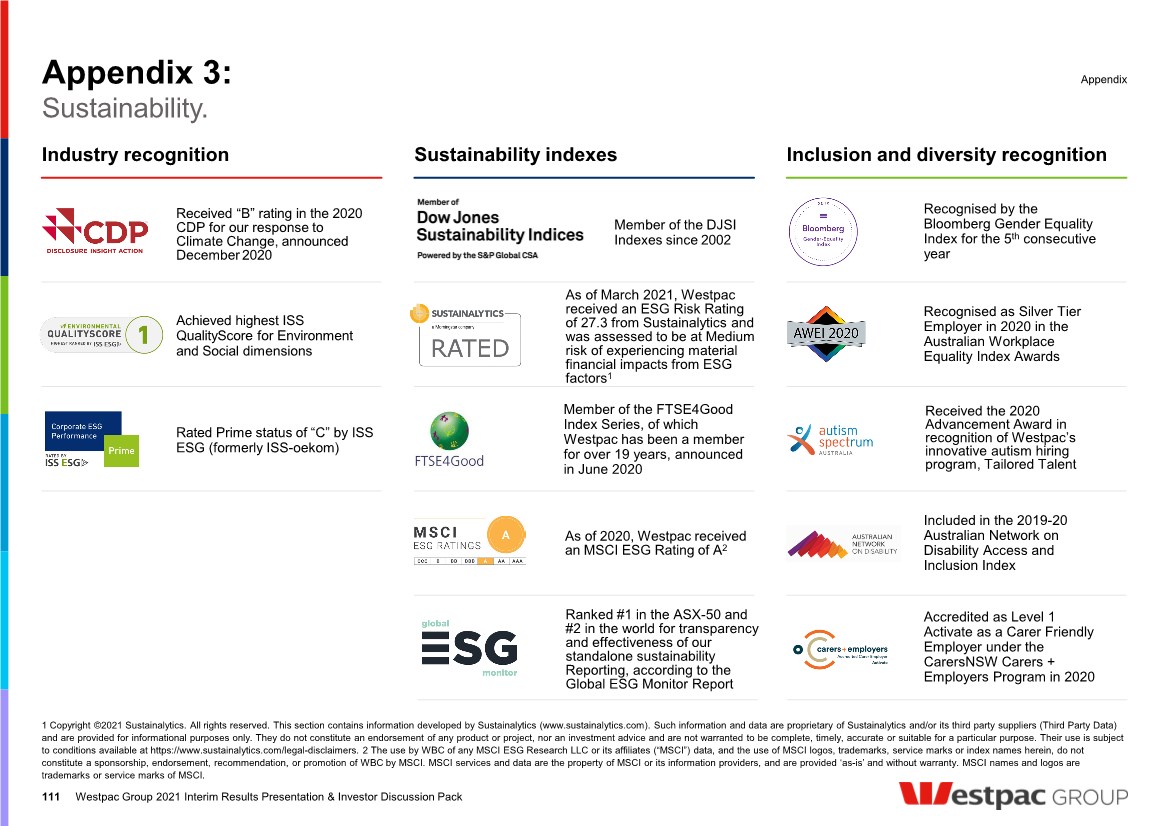
| Appendix 3: 112 Key commitments and partnerships Sustainability. Appendix Carbon Markets Institute Corporate Member UN Environment Program Finance Initiative Founding Member (1991) Commitment to United Nations Global Compact Signatory (2002), Global Compact Network Australia Founding Member (2009) Principles for Responsible Investment Signatory (2007) Supply Nation (for Indigenous owned businesses) Founding member (2016) Australian Business Roundtable for Disaster Resilience & Safer Communities Founding member (2012) Global Investor Coalition Statement on Climate Change Signatory (2014) WeConnect International (for women owned businesses) (2014) Financial Stability Board’s Task Force on Climate-related Financial Disclosures Align with and support UN Sustainable Development Goals CEO Statement of Commitment (2015) Climate Action 100+ Signatory (2017) The Montreal Carbon Pledge Signatory (2014) Paris Climate Agreement Supporter (2015) United Nations Tobacco-Free Finance pledge Founding signatory (2018) Australian Sustainable Finance Initiative Steering Committee Member The Equator Principles Founding Adopter, First Australian Bank (2003) Climate Bonds Initiative Partner Carbon Neutral Certification Since 2012 (previously NCOS) Principles for Responsible Banking Signatory 2019 RE100, an initiative of The Climate Group in partnership with CDP Member (2019) Westpac Group 2021 Interim Results Presentation & Investor Discussion Pack |
| Appendix 4: 113 Definitions – Credit quality. Appendix 90 days past due and not impaired Includes facilities where: • contractual payments of interest and / or principal are 90 or more calendar days overdue, including overdrafts or other revolving facilities that remain continuously outside approved limits by material amounts for 90 or more calendar days (including accounts for customers who have been granted hardship assistance); or • an order has been sought for the customer’s bankruptcy or similar legal action has been instituted which may avoid or delay repayment of its credit obligations; and • the estimated net realisable value of assets / security to which Westpac has recourse is sufficient to cover repayment of all principal and interest, or where there are otherwise reasonable grounds to expect payment in full and interest is being taken to profit on an accrual basis. These facilities, while in default, are not treated as impaired for accounting purposes Provision for expected credit losses (ECL) Expected credit losses (ECL) are a probability-weighted estimate of the cash shortfalls expected to result from defaults over the relevant timeframe. They are determined by evaluating a range of possible outcomes and taking into account the time value of money, past events, current conditions and future economic conditions Collectively assessed provisions (CAPs) CAPs for expected credit loss under AASB 9 represent the Expected Credit Loss (ECL) which is collectively assessed in pools of similar assets with similar risk characteristics. This incorporates forward looking information and does not require an actual loss event to have occurred for an impairment provision to be recognised Individually assessed provisions (IAPs) Provisions raised for losses that are known to be impaired and are assessed on an individual basis. The estimated losses on these impaired loans is based on expected future cash flows discounted to their present value and, as this discount unwinds, interest will be recognised in the income statement Stage 1: 12 months ECL – performing For financial assets where there has been no significant increase in credit risk since origination a provision for 12 months expected credit losses is recognised. Interest revenue is calculated on the gross carrying amount of the financial asset Stage 2: Lifetime ECL – performing For financial assets where there has been a significant increase in credit risk since origination but where the asset is still performing a provision for lifetime expected losses is recognised. Interest revenue is calculated on the gross carrying amount of the financial asset Stage 3 Lifetime ECL – non-performing For financial assets that are non-performing a provision for lifetime expected losses is recognised. Interest revenue is calculated on the carrying amount net of the provision for ECL rather than the gross carrying amount Impaired assets Includes exposures that have deteriorated to the point where full collection of interest and principal is in doubt, based on an assessment of the customer’s outlook, cashflow, and the net realisation of value of assets to which recourse is held: • facilities 90 days or more past due, and full recovery is in doubt: exposures where contractual payments are 90 or more days in arrears and the net realisable value of assets to which recourse is held may not be sufficient to allow full collection of interest and principal, including overdrafts or other revolving facilities that remain continuously outside approved limits by material amounts for 90 or more calendar days; • non-accrual facilities: exposures with individually assessed impairment provisions held against them, excluding restructured loans; • restructured assets: exposures where the original contractual terms have been formally modified to provide for concessions of interest or principal for reasons related to the financial difficulties of the customer; • other assets acquired through security enforcement (includes other real estate owned): includes the value of any other assets acquired as full or partial settlement of outstanding obligations through the enforcement of security arrangements; and • any other facility where the full collection of interest and principal is in doubt Stressed exposures Watchlist and substandard, 90 days past due and not impaired and impaired exposures. Stressed exposures do not include stressed exposures which are on an active COVID-19 deferral package as of 30 September 2020 Total committed exposures (TCE) Represents the sum of the committed portion of direct lending (including funds placement overall and deposits placed), contingent and pre-settlement risk plus the committed portion of secondary market trading and underwriting risk Watchlist and substandard Loan facilities where customers are experiencing operating weakness and financial difficulty but are not expected to incur loss of interest or principal Westpac Group 2021 Interim Results Presentation & Investor Discussion Pack |
| Appendix 4: 114 Definitions – Divisions, earnings drivers, capital and liquidity. Appendix Capital and liquidity Capital ratios As defined by APRA (unless stated otherwise) Committed liquidity facility (CLF) The RBA makes available to Australian Authorised Deposit-taking Institutions a CLF that, subject to qualifying conditions, can be accessed to meet LCR requirements under APS210 Liquidity High quality liquid assets (HQLA) Assets which meet APRA’s criteria for inclusion as HQLA in the numerator of the LCR Internationally comparable ratios Internationally comparable regulatory capital ratios are Westpac’s estimated ratios after adjusting the capital ratios determined under APRA Basel III regulations for various items. Analysis aligns with the APRA study titled “International capital comparison study” dated 13 July 2015 Leverage ratio As defined by APRA (unless stated otherwise). Tier 1 capital divided by ‘exposure measure’ and expressed as a percentage. ‘Exposure measure’ is the sum of on- balance sheet exposures, derivative exposures, securities financing transaction exposures and other off-balance sheet exposures Liquidity coverage ratio (LCR) An APRA requirement to maintain an adequate level of unencumbered high quality liquid assets, to meet liquidity needs for a 30 calendar day period under an APRA- defined severe stress scenario. Absent a situation of financial stress, the value of the LCR must not be less than 100%, effective 1 January 2015. LCR is calculated as the percentage ratio of stock of HQLA and CLF over the total net cash out-flows in a modelled 30 day defined stressed scenario Net stable funding ratio (NSFR) The NSFR is defined as the ratio of the amount of available stable funding (ASF) to the amount of required stable funding (RSF) defined by APRA. The amount of ASF is the portion of an ADI’s capital and liabilities expected to be a reliable source of funds over a one year time horizon. The amount of RSF is a function of the liquidity characteristics and residual maturities of an ADI’s assets and off-balance sheet activities. ADI’s must maintain an NSFR of at least 100% Risk weighted assets or RWA Assets (both on and off-balance sheet) are risk weighted according to each asset’s inherent potential for default and what the likely losses would be in case of default. In the case of non-asset-backed risks (ie. market and operational risk), RWA is determined by multiplying the capital requirements for those risks by 12.5 Westpac Group 2021 Interim Results Presentation & Investor Discussion Pack Divisions Consumer Consumer provides banking products and services to Australian personal customers, including mortgages, credit cards, personal loans, and savings and deposit products Business Business serves the banking needs of Australian SME and Commercial customers (including Agribusiness) and provides banking and advisory services to high net worth individuals through Private Wealth WIB Westpac Institutional Bank (WIB) provides a broad range of financial products and services to corporate, institutional and government customers Westpac NZ Westpac New Zealand provides banking, wealth and insurance products and services for consumer, business and institutional customers in New Zealand Specialist Businesses Specialist Businesses provides auto finance, Australian life, general and lenders mortgage insurance, investment product and services (including margin lending and equities broking), superannuation and retirement products as well as wealth administration platforms. It also manages Westpac Pacific which provides a full range of banking services in Fiji and Papua New Guinea. Westpac has announced it has entered into a sales agreement for Westpac Pacific, Westpac Vendor Finance business, Westpac General Insurance, and Westpac Lenders Mortgage Insurance. These sales are expected to finalise in 2021, subject to regulator approvals Group Businesses or GB Group Businesses includes the results of unallocated support functions such as Treasury, Technology and Operations, and Core Support. It also includes Group-wide elimination entries arising on consolidation, centrally raised provisions and other unallocated revenue and expenses Earnings drivers Average interest- earning assets (AIEA) The average balance of assets held by the Group that generate interest income. Where possible, daily balances are used to calculate the average balance for the period Cash earnings per ordinary share Cash earnings divided by the weighted average ordinary shares (cash earnings basis) Core earnings Net operating income less operating expenses Full-time equivalent employees (FTE) A calculation based on the number of hours worked by full and part-time employees as part of their normal duties. For example, the full-time equivalent of one FTE is 76 hours paid work per fortnight |
| Appendix 4: 115 Definitions – Other. Appendix Branch transactions Branch transactions are typically withdrawals, deposits, transfers and payments Customer satisfaction or CSat The Customer Satisfaction score is an average of customer satisfaction ratings of the customer’s main financial institution for consumer or business banking on a scale of 0 to 10 (0 means ‘extremely dissatisfied’ and 10 means ‘extremely satisfied’) CSAT (Main Bank Service Satisfaction) (Westpac NZ) Source: 3 month rolling Retail Market Monitor data (survey conducted by Camorra Research). Respondents are asked to rate the overall level of service they receive from their main bank (self-selected which ONE bank is their main provider of financial services) on a scale of 1 (Poor) to 5 (Excellent). The rating represents % of respondents who scored 4 (Very Good) or 5 (Excellent) CSat – overall consumer Source: DBM Consultants Consumer Atlas, August 2018 – February 2021, 6MMA. MFI customers CSat – overall business Source: DBM Consultants Business Atlas, August 2018 – February 2021, 6MMA. MFI customers, all businesses CSat – SME Source: DBM Consultants Business Atlas, 6 months to September 2019, March 2020 and August 2020. MFI customers, Total SME businesses. Total SME businesses are those organisations with annual turnover under $5 million (excluding Agribusinesses) Digitally active Australian consumer and business customers who have had an authenticated session (including Quickzone) on Westpac Group digital banking platforms in the prior 90 days Digital sales Sales refers to digital sales of consumer core products only. Sales with a funded deposit or activation constitute a quality sale. Includes new American Express credit card sales Digital transactions Digital transactions including payment and transfers that occur on Westpac Live and Compass platforms (excludes payments on other platforms such as Corporate Online and Business Banking Online) MFI share MFI share results are based on the number of customers who have a Main Financial Institution (MFI) relationship with an institution, as a proportion of the number of customers that have a MFI relationship with any institution Consumer MFI share Source: DBM Consultants Consumer Atlas, 6 months to February 2021. MFI customers Net Promoter Score or NPS Net Promoter Score measures the net likelihood of recommendation to others of the customer’s main financial institution for retail or business banking. Net Promoter ScoreSM is a trademark of Bain & Co Inc., Satmetrix Systems, Inc., and Mr Frederick Reichheld. Using a 11 point numerical scale where 10 is ‘Extremely likely’ and 0 is ‘Extremely unlikely’, Net Promoter Score is calculated by subtracting the percentage of Detractors (0-6) from the percentage of Promoters (9-10) NPS Agri (Westpac NZ) 6 month Agri Market Monitor data (survey conducted by Key Research). Respondents are asked about likelihood to recommend their main business bank to business colleagues, friends or family on a scale of 1 (extremely unlikely) to 10 (extremely likely). Net Promoter Score is represents % of Promoters (recommend score of 9 or 10) minus % of Detractors (recommend score of 1 to 6) NPS Business (Westpac NZ) Source: 6 month rolling Business Finance Monitor data (survey conducted by Kantar TNS among businesses with an annual turnover of $5 to $150 million). Respondents are asked about likelihood to recommend their main business bank to business colleagues and associates on a scale of 1 (extremely unlikely) to 10 (extremely likely). Net Promoter Score is represents % of Promoters (recommend score of 9 or 10) minus % of Detractors (recommend score of 1 to 6) NPS Consumer (Westpac NZ) Source: 3 month rolling Retail Market Monitor data (survey conducted by Camorra Research). Respondents are asked about likelihood to recommend their main bank to family and friends on a scale of 1 (extremely unlikely) to 10 (extremely likely). Net Promoter Score is represents % of Promoters (recommend score of 9 or 10) minus % of Detractors (recommend score of 1 to 6) NPS – overall consumer Source: DBM Consultants Consumer Atlas, August 2018 – February 2021, 6MMA. MFI customers NPS – overall business Source: DBM Consultants Business Atlas, August 2018 – February 2021, 6MMA. MFI customers, all businesses St.George (SGB) Brands SGB Brands (Consumer): St.George Bank, Bank of Melbourne, BankSA, RAMS, Dragondirect SGB Brands (Business): St.George Bank, Bank of Melbourne and BankSA Women in Leadership The proportion of women in leadership roles across the Group. It includes the CEO, Group Executives, General Managers, senior leaders with significant influence on business outcomes (direct reports to General Managers and their direct reports), large (3+) team people leaders three levels below General Manager, and Bank and Assistant Bank Managers. Senior Executive refers to the proportion of women in the combined Group Executives and General Manager populations Westpac Group 2021 Interim Results Presentation & Investor Discussion Pack |
| Louise Coughlan Head of Rating Agencies and Analysis +61 2 8254 0549 +61 425 213 504 lcoughlan@westpac.com.au Investor Relations Team. Contact Us. Contact us www.westpac.com.au/investorcentre Annual reports Presentations and webcasts 5 year financial summary Prior financial results 116 Westpac Group 2021 Interim Results Presentation & Investor Discussion Pack Andrew Bowden Head of Investor Relations +61 2 8253 4008 +61 438 284 863 andrewbowden@westpac.com.au Jacqueline Boddy Head of Debt Investor Relations +61 2 8253 3133 +61 448 064 012 jboddy@westpac.com.au Alec Leithhead Manager +61 2 8254 0159 +61 481 906 863 alec.leithhead@westpac.com.au Rebecca Plackett Director +61 2 8253 6556 +61 478 336 647 rplackett@westpac.com.au Or email: investorrelations@westpac.com.au |
| Disclaimer The material contained in this presentation is intended to be general background information on Westpac Banking Corporation (Westpac) and its activities. The information is supplied in summary form and is therefore not necessarily complete. It is not intended that it be relied upon as advice to investors or potential investors, who should consider seeking independent professional advice depending upon their specific investment objectives, financial situation or particular needs. The material contained in this presentation may include information derived from publicly available sources that have not been independently verified. No representation or warranty is made as to the accuracy, completeness or reliability of the information. All amounts are in Australian dollars unless otherwise indicated. Unless otherwise noted, financial information in this presentation is presented on a cash earnings basis. Cash earnings is a non-GAAP measure. Refer to Westpac’s 2021 Interim Financial Results (incorporating the requirements of Appendix 4D) for the six months ended 31 March 2021 available at www.westpac.com.au for details of the basis of preparation of cash earnings. Refer to page 35 for an explanation of cash earnings and Appendix 1 page 109 for a reconciliation of reported net profit to cash earnings. This presentation contains statements that constitute “forward-looking statements” within the meaning of Section 21E of the US Securities Exchange Act of 1934. Forward-looking statements are statements about matters that are not historical facts. Forward-looking statements appear in a number of places in this presentation and include statements regarding our intent, belief or current expectations with respect to our business and operations, macro and micro economic and market conditions, results of operations and financial condition, including, without limitation, future loan loss provisions, financial support to certain borrowers, indicative drivers, forecasted economic indicators and performance metric outcomes. We use words such as ‘will’, ‘may’, ‘expect’, ‘intend’, ‘seek’, ‘would’, ‘should’, ‘could’, ‘continue’, ‘plan’, ‘estimate’, ‘anticipate’, ‘believe’, ‘probability’, ‘risk’, ‘aim’, or other similar words to identify forward-looking statements. These forward-looking statements reflect our current views with respect to future events and are subject to change, certain risks, uncertainties and assumptions which are, in many instances, beyond our control, and have been made based upon management’s expectations and beliefs concerning future developments and their potential effect upon us. There can be no assurance that future developments will be in accordance with our expectations or that the effect of future developments on us will be those anticipated. Actual results could differ materially from those which we expect, depending on the outcome of various factors. Factors that may impact on the forward-looking statements made include, but are not limited to, those described in the section titled ‘Risk factors' in Westpac’s 2021 Interim Financial Results (incorporating the requirements of Appendix 4D) for the six months ended 31 March 2021 available at www.westpac.com.au. When relying on forward-looking statements to make decisions with respect to us, investors and others should carefully consider such factors and other uncertainties and events. Except as required by law, we assume no obligation to update any forward-looking statements contained in this presentation, whether as a result of new information, future events or otherwise, after the date of this presentation. Disclaimer 117 Westpac Group 2021 Interim Results Presentation & Investor Discussion Pack |