Exhibit 1
Pillar 3 report Table of contents |
| Structure of Pillar 3 report | |
| Executive summary | 3 |
| Introduction | 5 |
| Group structure | 7 |
| Capital overview | 8 |
| Leverage ratio | 12 |
| Credit risk exposures | 13 |
| Securitisation | 17 |
| Liquidity coverage ratio | 20 |
| Appendix | |
| Appendix I | APS330 Quantitative requirements | 21 |
| Disclosure regarding forward-looking statements | 22 |
In this report references to ‘Westpac’, ‘Westpac Group’, ‘the Group’, ‘we’, ‘us’ and ‘our’ are to Westpac
Banking Corporation and its controlled entities (unless the context indicates otherwise).
In this report, unless otherwise stated or the context otherwise requires, references to ‘$’, ‘AUD’ or ‘A$’ are to Australian dollars.
Any discrepancies between totals and sums of components in tables contained in this report are due to rounding.
In this report, unless otherwise stated, disclosures reflect the Australian Prudential Regulation Authority’s (APRA) implementation of Basel III.
Information contained in or accessible through the websites mentioned in this report does not form part of this report unless we specifically state that it is incorporated by reference and forms part of this report. All references in this report to websites are inactive textual references and are for information only.
| 2 | Westpac Group June 2021 Pillar 3 Report |  |
Pillar 3 report Executive summary |
Key capital ratios
| % | 30 June 2021 | 31 March 2021 | 30 June 2020 |
| Level 2 Regulatory capital structure | |||
| Common equity Tier 1 capital ratio | 12.0 | 12.3 | 10.8 |
| Additional Tier 1 capital ratio | 2.2 | 2.2 | 2.1 |
| Tier 1 capital ratio | 14.2 | 14.5 | 12.9 |
| Tier 2 capital | 4.2 | 3.9 | 3.1 |
| Total regulatory capital ratio | 18.4 | 18.4 | 16.0 |
| APRA leverage ratio | 5.9 | 6.3 | 5.9 |
| Level 1 Common equity Tier 1 capital ratio | 12.2 | 12.6 | 11.1 |
Westpac’s Common equity Tier 1 (CET1) capital ratio was 12.0% at 30 June 2021. The CET1 ratio was lower than the CET1 ratio of 12.3% at 31 March 2021 due to payment of the 2021 interim dividend and a 2% increase in risk weighted assets (RWA). These impacts were partly offset by earnings over the quarter and divestments related to the sale of Coinbase Inc shares.
Risk Weighted Assets
| $m | 30 June 2021 | 31 March 2021 | 30 June 2020 |
| Risk weighted assets at Level 2 | |||
| Credit risk | 358,249 | 347,127 | 373,675 |
| Market risk | 6,642 | 9,490 | 9,486 |
| Operational risk | 54,090 | 54,090 | 54,090 |
| Interest rate risk in the banking book | 12,155 | 11,998 | 6,849 |
| Other | 6,263 | 6,194 | 6,464 |
| Total RWA | 437,399 | 428,899 | 450,564 |
| Total Exposure at Default | 1,110,454 | 1,076,503 | 1,058,269 |
Total RWA increased $8.5 billion or 2.0% over the quarter from higher credit risk RWA partly offset by a decrease in non-credit RWA. The $11.1 billion increase in credit risk RWA included:
| • | A $4.7 billion increase from higher lending, mostly residential mortgage lending and from a rise in corporate lending facilities; |
| • | A $6.9 billion increase from mortgage RWA. At 30 June 2021 Westpac has chosen to apply an overlay to our modelled outcomes to increase the mortgage risk weight floor to 25%. This is to reflect the anticipated unwind of temporary COVID-19 stimulus effects and our expectation that mortgage risk weights will rise from APRA’s capital changes; |
| • | Foreign currency translation impacts increased RWA by $0.8 billion mostly from the depreciation of the A$ against the and NZ$; partially offset by; |
| • | A $0.6 billion decrease from improved credit quality metrics; and |
| • | A decrease in credit RWA associated with derivative exposures (counterparty credit risk and mark-to-market related credit risk) of $0.7 billion. |
Non-credit risk RWA was $2.6 billion lower, mainly due to a $2.8 billion decrease in market risk RWA as the volatile period around March 2020 (related to the onset of COVID-19) rolled out of the one-year Value at Risk (VaR) lookback window.
Tier 2 Capital movements for third quarter 2021
On 13 May 2021, Westpac issued EUR 1.0 billion (approximately A$1.6 billion) Tier 2 capital instruments increasing our total capital ratio by approximately 37 basis points.
Exposure at Default
Exposure at default (EAD) increased $34.0 billion over the quarter, primarily due to an increase in exposure to sovereigns ($18.3 billion) due to higher liquid assets, residential mortgage lending ($12.5 billion) and corporate lending facilities ($2.9 billion).
| | Westpac Group June 2021 Pillar 3 Report | 3 |
Pillar 3 report Executive summary |
Leverage Ratio
Westpac’s leverage ratio was 5.9%, down 35 basis points since 31 March 2021. The decline in the ratio was mainly due to an increase in total exposures1 by 5.4%.
Liquidity Coverage Ratio (LCR)
Westpac’s average LCR for the quarter ending 30 June 2021 was 127% (quarter ending 31 March 2021: 124%)2.
| 1 | As defined under Attachment D of APS110: Capital Adequacy. |
| 2 | Calculated as a simple average of the daily observations over the relevant quarter. |
| 4 | Westpac Group June 2021 Pillar 3 Report | |
Pillar 3 report Introduction |
Westpac Banking Corporation is an Authorised Deposit–taking Institution (ADI) subject to regulation by the Australian Prudential Regulation Authority (APRA). APRA has accredited Westpac to apply advanced models permitted by the Basel III global capital adequacy regime to the measurement of its regulatory capital requirements. Westpac uses the Advanced Internal Ratings-Based approach (Advanced IRB) for credit risk and the Advanced Measurement Approach (AMA) for operational risk.
In accordance with APS330 Public Disclosure, financial institutions that have received this accreditation, such as Westpac, are required to disclose prudential information about their risk management practices on a semi-annual basis. A subset of this information must be disclosed quarterly.
In addition to this report, the regulatory disclosures section of the Westpac website1 contains the reporting requirements for:
| • | Capital instruments under Attachment B of APS330; and |
| • | The identification of potential Global-Systemically Important Banks (G-SIB) under Attachment H of APS330 (disclosed annually). |
Capital instruments disclosures are updated when:
| • | A new capital instrument is issued that will form part of regulatory capital; or |
| • | A capital instrument is redeemed, converted into CET1 capital, written off, or its terms and conditions are changed. |
1 http://www.westpac.com.au/about-westpac/investor-centre/financial-information/regulatory-disclosures/
| | Westpac Group June 2021 Pillar 3 Report | 5 |
Pillar 3 report Group structure |
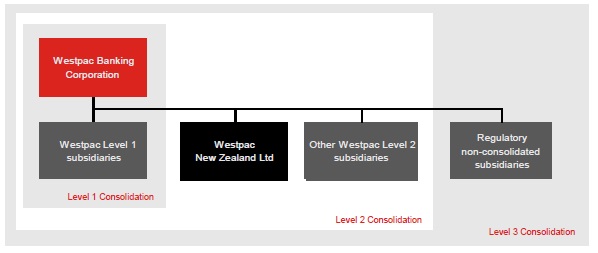
APRA applies a tiered approach to measuring Westpac’s capital adequacy1 by assessing financial strength at three levels:
| • | Level 1, comprising Westpac Banking Corporation and its subsidiary entities that have been approved by APRA as being part of a single 'Extended Licensed Entity' (ELE) for the purposes of measuring capital adequacy; |
| • | Level 2, the consolidation of Westpac Banking Corporation and all its subsidiary entities except those entities specifically excluded by APRA regulations. The head of the Level 2 group is Westpac Banking Corporation; and |
| • | Level 3, the consolidation of Westpac Banking Corporation and all its subsidiary entities. |
Unless otherwise specified, all quantitative disclosures in this report refer to the prudential assessment of Westpac’s financial strength on a Level 2 basis2.
The Westpac Group
The following diagram shows the Level 3 conglomerate group and illustrates the different tiers of regulatory consolidation.
Accounting consolidation3
The consolidated financial statements incorporate the assets and liabilities of all subsidiaries (including structured entities) controlled by Westpac. Westpac and its subsidiaries are referred to collectively as the ‘Group’. The effects of all transactions between entities in the Group are eliminated on consolidation. Control exists when the parent entity is exposed to, or has rights to, variable returns from its involvement with an entity, and has the ability to affect those returns through its power over that entity. Subsidiaries are fully consolidated from the date on which control commences and they are no longer consolidated from the date that control ceases.
Group entities excluded from the regulatory consolidation at Level 2
Regulatory consolidation at Level 2 covers the global operations of Westpac and its subsidiary entities, including other controlled banking, securities and financial entities, except for those entities involved in the following business activities:
| • | insurance; |
| • | acting as manager, responsible entity, approved trustee, trustee or similar role in relation to funds management; |
| • | non-financial (commercial) operations; or |
| • | special purpose entities to which assets have been transferred in accordance with the requirements of APS120 Securitisation. |
Retained earnings and equity investments in subsidiary entities excluded from the consolidation at Level 2 are deducted from capital, with the exception of securitisation special purpose entities.
| 1 | APS110 Capital Adequacy outlines the overall framework adopted by APRA for the purpose of assessing the capital adequacy of an ADI. |
| 2 | Impaired assets and provisions held in Level 3 entities are excluded from the tables in this report. |
| 3 | Refer to Note 31 of Westpac’s 2020 Annual Report for further details. |
| 6 | Westpac Group June 2021 Pillar 3 Report | |
Pillar 3 report Group structure |
Subsidiary banking entities
Westpac New Zealand Limited (WNZL), a wholly owned subsidiary entity, is a registered bank incorporated in New Zealand and regulated by the Reserve Bank of New Zealand (RBNZ). WNZL uses the Advanced IRB approach for credit risk and the AMA for operational risk. Other subsidiary banking entities in the Group include Westpac Europe Limited. For the purposes of determining Westpac’s capital adequacy subsidiary banking entities are consolidated at Level 2.
Restrictions and major impediments on the transfer of funds or regulatory capital within the Group Minimum capital (‘thin capitalisation’) rules
Tax legislation in most jurisdictions in which the Group operates prescribes minimum levels of capital that must be retained in that jurisdiction to avoid a portion of the interest costs incurred in the jurisdiction ceasing to be tax deductible. Capital for these purposes includes both contributed capital and non-distributed retained earnings. Westpac seeks to maintain sufficient capital/retained earnings to comply with these rules.
Tax costs associated with repatriation
Repatriation of retained earnings (and capital) may result in tax being payable in either the jurisdiction from which the repatriation occurs or Australia on receipt of the relevant amounts. This cost would reduce the amount actually repatriated.
Intra-group exposure limits
Exposures to related entities are managed within the prudential limits prescribed by APRA in APS222 Associations with Related Entities1. Westpac has an internal limit structure and approval process governing credit exposures to related entities. This limit structure and approval process, combined with APRA’s prudential limits, is designed to reduce the potential for unacceptable contagion risk.
Prudential regulation of subsidiary entities
Certain subsidiary banking, insurance and trustee entities are subject to local prudential regulation in their own right, including capital adequacy requirements and investment or intra-group exposure limits. Westpac seeks to ensure that its subsidiary entities are adequately capitalised and adhere to regulatory requirements at all times. There are no capital deficiencies in subsidiary entities excluded from the regulatory consolidation at Level 2.
On 23 March 2021, the RBNZ issued two notices to WNZL under section 95 of the Reserve Bank of New Zealand Act 1989 requiring WNZL to supply two external review reports to the RBNZ. The reports are required to address concerns raised by the RBNZ around WNZL’s risk governance processes following various compliance issues reported over recent years. Those issues include non-compliance with the RBNZ’s liquidity, capital adequacy and outsourcing requirements (as previously reported in WNZL’s RBNZ disclosure statements) and IT outages. While work has been underway to address these areas for some time, more work is required to meet WNZL’s expectations and those of the regulator.
With effect from 31 March 2021, the RBNZ amended WNZL's conditions of registration to apply an overlay to WNZL's liquidity mismatch ratios2. The overlay requires WNZL to discount the value of its liquid assets by approximately 14% which as at 30 June 2021 was NZ$2.2 billion. This overlay will apply until the RBNZ is satisfied that:
| • | the RBNZ's concerns regarding liquidity risk controls have been resolved; and |
| • | sufficient progress has been made to address risk culture issues in WNZL's Treasury and Market and Liquidity Risk functions. |
The RBNZ have appointed independent advisers to supply the report on liquidity risk controls and risk culture and the report on the effectiveness of risk governance.
| 1 | For the purposes of APS222, subsidiaries controlled by Westpac, other than subsidiaries that form part of the ELE, represent ‘related entities’. Prudential and internal limits apply to intra-group exposures between the ELE and related entities, both on an individual and aggregate basis. | |
| 2 | The mismatch ratio is a measure of a bank’s liquid assets, adjusted for expected cash inflows and outflows during a one-month or one-week period of stress. |
| | Westpac Group June 2021 Pillar 3 Report | 7 |
Pillar 3 report Capital overview |
Capital management strategy
Westpac’s approach to capital management seeks to ensure that it is adequately capitalised as an ADI. Westpac evaluates its approach to capital management through an Internal Capital Adequacy Assessment Process (ICAAP), the key features of which include:
| • | the development of a capital management strategy, including consideration of regulatory minimums, capital buffers and contingency plans; |
| • | consideration of both regulatory and economic capital requirements; |
| • | a stress testing framework that challenges the capital measures, coverage and requirements including the impact of adverse economic scenarios; and |
| • | consideration of the perspectives of external stakeholders including rating agencies as well as equity and debt investors. |
During the period of disruption caused by COVID-19, Westpac is operating with the following principles in relation to capital:
| • | prioritise maintaining capital strength; |
| • | in the event of a significant market deterioration Westpac will retain capital to absorb any further potential downside on credit quality and to acknowledge a high degree of uncertainty regarding the length and depth of the stress; |
| • | allow for capital flexibility to support lending to customers; and |
| • | in line with APRA guidance, Westpac will seek to maintain a buffer above the regulatory requirement including buffers (currently at least 8% for Domestically – Systemically important Banks (D-SIBs) including Westpac). |
These principles take into consideration:
| • | current regulatory capital minimums and the capital conservation buffer (CCB), which together are the Total CET1 Requirement. In line with the above, the Total CET1 Requirement for Westpac is at least 8.0%, based upon an industry minimum CET1 requirement of 4.5% plus a capital buffer of at least 3.5% applicable to D-SIBs1, 2; |
| • | stress testing to calibrate an appropriate buffer against a downturn; and |
| • | quarterly volatility of capital ratios due to the half yearly cycle of ordinary dividend payments. |
Westpac will revise its capital management preferred range once APRA’s review of the capital adequacy framework is finalised.
APRA announcements on capital
On 19 July 2021 APRA announced regulatory support for banks offering temporary financial assistance to borrowers impacted by COVID-193. APRA has outlined that for eligible borrowers, ADIs do not need to treat the period of deferral as a period of arrears or loan restructuring. This will apply to loans that are granted a repayment deferral of up to three months before the end of August 2021. ADIs must still continue to provision for these loans under relevant accounting standards.
In addition, over the quarter APRA has made the following announcement in relation to their capital framework reforms:
| • | APRA has released the final revised standard for APS 111 Capital Adequacy: Measurement of Capital effective from 1 January 20224. The final standard includes changes to the parent ADI’s (Level 1) treatment of equity investments in banking and insurance subsidiaries including: |
| • | Equity investments in subsidiaries (including any Additional Tier 1 and Tier 2 capital investments in subsidiaries) will be risk weighted at 250%, up to a limit of 10% of Level 1 CET1 capital per investment; and |
| • | Any equity investments in excess of the 10% limit will be fully deducted from Level 1 CET1 capital in determining Level 1 capital ratios. |
The impact to the Group’s Level 1 ratio on a pro-forma basis at 30 June 2021 is an approximate reduction of 20 basis points. There is no impact from this proposal on the calculation of the Group’s reported regulatory capital ratios on a Level 2 basis.
| 1 | Noting that APRA may apply higher CET1 requirements for an individual ADI. | |
| 2 | If an ADI’s CET1 ratio falls below the Total CET1 Requirement (at least 8%), it faces restrictions on the distribution of earnings, such as dividends, distribution payments on AT1 capital instruments and discretionary staff bonuses. |
| 3 | APRA announcement – “APRA announces further regulatory support for loans impacted by COVID-19” dated 19 July 2021. | |
| 4 | Letter to all authorised deposit taking institutions – “Final revised Prudential Standard: APS 111 Capital Adequacy - Measurement of Capital” dated 5 August 2021. |
| 8 | Westpac Group June 2021 Pillar 3 Report | |
Pillar 3 report Capital overview |
| • | APRA is currently proposing a number of changes to embed the ‘unquestionably strong’ level of capital in the capital framework including implementation of Basel III reforms1. On 21 July 2021 APRA released further guidance on capital buffers and the calculation of RWA including for specific asset classes. As part of the proposal APRA are intending to increase the capital conservation buffer from 2.5% to 4.0% and introduce a base level for the countercyclical capital buffer of 1.0%. As a result, the CET1 requirement (comprising the minimum requirement and buffers) for the major banks is proposed to increase from 8% to 10.5% from 1 January 2023. We expect further clarity on the changes ahead of 1 January 2023. |
Westpac’s capital adequacy ratios
| % | 30 June 2021 | 31 March 2021 | 30 June 2020 |
| The Westpac Group at Level 2 | |||
| Common equity Tier 1 capital ratio | 12.0 | 12.3 | 10.8 |
| Additional Tier 1 capital | 2.2 | 2.2 | 2.1 |
| Tier 1 capital ratio | 14.2 | 14.5 | 12.9 |
| Tier 2 capital | 4.2 | 3.9 | 3.1 |
| Total regulatory capital ratio | 18.4 | 18.4 | 16.0 |
| The Westpac Group at Level 1 | |||
| Common equity Tier 1 capital ratio | 12.2 | 12.6 | 11.1 |
| Additional Tier 1 capital | 2.2 | 2.2 | 2.1 |
| Tier 1 capital ratio | 14.4 | 14.8 | 13.2 |
| Tier 2 capital | 4.3 | 4.0 | 3.2 |
| Total regulatory capital ratio | 18.7 | 18.8 | 16.4 |
Westpac New Zealand Limited’s capital adequacy ratios
| % | 30 June 2021 | 31 March 2021 | 30 June 2020 |
| Westpac New Zealand Limited | |||
| Common equity Tier 1 capital ratio | 13.9 | 13.4 | 11.9 |
| Additional Tier 1 capital | 2.8 | 2.8 | 2.6 |
| Tier 1 capital ratio | 16.7 | 16.2 | 14.5 |
| Tier 2 capital | 2.1 | 2.0 | 2.1 |
| Total regulatory capital ratio | 18.8 | 18.2 | 16.6 |
| 1 | Letter to all authorised deposit taking institutions – “Bank Capital Reforms: Update” dated 21 July 2021 |
| | Westpac Group June 2021 Pillar 3 Report | 9 |
Pillar 3 report Capital overview |
Capital requirements
This table shows RWA and associated capital requirements1 for each risk type included in the regulatory assessment of Westpac’s capital adequacy. More detailed disclosures on the prudential assessment of capital requirements are presented in the following sections of this report.
| 30 June 2021 | IRB | Standardised | Total Risk | Total Capital |
| $m | Approach | Approach2 | Weighted Assets | Required1 |
| Credit risk | ||||
| Corporate | 68,028 | 849 | 68,877 | 5,510 |
| Business lending | 33,528 | 783 | 34,311 | 2,745 |
| Sovereign | 2,576 | 1,232 | 3,808 | 305 |
| Bank | 5,264 | 120 | 5,384 | 431 |
| Residential mortgages | 143,834 | 3,934 | 147,768 | 11,822 |
| Australian credit cards | 4,171 | - | 4,171 | 334 |
| Other retail | 8,844 | 772 | 9,616 | 769 |
| Small business | 16,160 | - | 16,160 | 1,293 |
| Specialised lending | 55,769 | 377 | 56,146 | 4,492 |
| Securitisation | 5,801 | - | 5,801 | 464 |
| Mark-to-market related credit risk3 | - | 6,207 | 6,207 | 497 |
| Total | 343,975 | 14,274 | 358,249 | 28,662 |
| Market risk | 6,642 | 531 | ||
| Operational risk | 54,090 | 4,327 | ||
| Interest rate risk in the banking book | 12,155 | 972 | ||
| Other assets4 | 6,263 | 501 | ||
| Total | 437,399 | 34,993 |
| 31 March 2021 | IRB | Standardised | Total Risk | Total Capital |
| $m | Approach | Approach2 | Weighted Assets | Required1 |
| Credit risk | ||||
| Corporate | 66,086 | 849 | 66,935 | 5,355 |
| Business lending | 34,061 | 774 | 34,835 | 2,787 |
| Sovereign | 2,355 | 1,081 | 3,436 | 275 |
| Bank | 5,708 | 132 | 5,840 | 467 |
| Residential mortgages | 133,938 | 4,090 | 138,028 | 11,042 |
| Australian credit cards | 4,279 | - | 4,279 | 342 |
| Other retail | 9,266 | 779 | 10,045 | 804 |
| Small business | 16,097 | - | 16,097 | 1,288 |
| Specialised lending | 55,314 | 386 | 55,700 | 4,456 |
| Securitisation | 5,513 | - | 5,513 | 441 |
| Mark-to-market related credit risk3 | - | 6,419 | 6,419 | 514 |
| Total | 332,617 | 14,510 | 347,127 | 27,771 |
| Market risk | 9,490 | 759 | ||
| Operational risk | 54,090 | 4,327 | ||
| Interest rate risk in the banking book | 11,998 | 960 | ||
| Other assets4 | 6,194 | 496 | ||
| Total | 428,899 | 34,313 |
| 1 | Total capital required is calculated as 8% of total risk weighted assets. | |
| 2 | Westpac’s standardised risk weighted assets are categorised based on their equivalent IRB categories. | |
| 3 | Mark-to-market related credit risk is measured under the standardised approach. It is also known as Credit Valuation Adjustment (CVA) risk. |
| 4 | Other assets include cash items, unsettled transactions, fixed assets and other non-interest earning assets. |
| 10 | Westpac Group June 2021 Pillar 3 Report | |
Pillar 3 report Capital overview |
| 30 June 2020 | IRB | Standardised | Total Risk | Total Capital |
| $m | Approach | Approach2 | Weighted Assets | Required1 |
| Credit risk | ||||
| Corporate | 76,303 | 1,012 | 77,315 | 6,185 |
| Business lending | 37,584 | 913 | 38,497 | 3,080 |
| Sovereign | 2,194 | 1,233 | 3,427 | 274 |
| Bank | 6,461 | 63 | 6,524 | 522 |
| Residential mortgages | 134,425 | 4,567 | 138,992 | 11,119 |
| Australian credit cards | 4,332 | - | 4,332 | 347 |
| Other retail | 10,594 | 796 | 11,390 | 911 |
| Small business | 17,638 | - | 17,638 | 1,411 |
| Specialised lending | 59,114 | 458 | 59,572 | 4,766 |
| Securitisation | 5,429 | - | 5,429 | 434 |
| Mark-to-market related credit risk3 | - | 10,559 | 10,559 | 845 |
| Total | 354,074 | 19,601 | 373,675 | 29,894 |
| Market risk | 9,486 | 759 | ||
| Operational risk | 54,090 | 4,327 | ||
| Interest rate risk in the banking book | 6,849 | 548 | ||
| Other assets4 | 6,464 | 517 | ||
| Total | 450,564 | 36,045 |
| 1 | Total capital required is calculated as 8% of total risk weighted assets. | |
| 2 | Westpac’s standardised risk weighted assets are categorised based on their equivalent IRB categories. | |
| 3 | Mark-to-market related credit risk is measured under the standardised approach. It is also known as CVA risk. | |
| 4 | Other assets include cash items, unsettled transactions, fixed assets, and other non-interest earning assets. |
| | Westpac Group June 2021 Pillar 3 Report | 11 |
Pillar 3 report Leverage ratio disclosure |
Leverage ratio
The following table summarises Westpac’s leverage ratio. This has been determined using APRA’s definition of the leverage ratio as specified in APS110 Capital Adequacy.
| $ billion | 30 June 2021 | 31 March 2021 | 31 December 2020 | 30 September 2020 |
| Tier 1 Capital | 62.2 | 62.4 | 61.0 | 57.9 |
| Total Exposures | 1,049.9 | 995.8 | 984.3 | 1,001.8 |
| Leverage ratio | 5.9% | 6.3% | 6.2% | 5.8% |
| 12 | Westpac Group June 2021 Pillar 3 Report | |
Pillar 3 report
Credit risk exposures
Summary credit risk disclosure
| Regulatory | ||||||||||||||||||||||||||||
| Expected | Specific | Actual | ||||||||||||||||||||||||||
| Risk | Regulatory | Loss for | Provisions | Losses for | ||||||||||||||||||||||||
| 30 June 2021 | Exposure | Weighted | Expected | non-defaulted | Impaired | for Impaired | the 9 months | |||||||||||||||||||||
| $m | at Default | Assets | Loss1 | exposures | Loans2 | Loans | ended | |||||||||||||||||||||
| Corporate | 127,472 | 68,028 | 961 | 418 | 675 | 539 | 56 | |||||||||||||||||||||
| Business lending | 52,922 | 33,528 | 680 | 401 | 343 | 179 | 40 | |||||||||||||||||||||
| Sovereign | 161,510 | 2,576 | 2 | 2 | - | - | - | |||||||||||||||||||||
| Bank | 21,780 | 5,264 | 6 | 6 | - | - | - | |||||||||||||||||||||
| Residential mortgages | 575,339 | 143,834 | 1,842 | 1,103 | 276 | 81 | 54 | |||||||||||||||||||||
| Australian credit cards | 16,048 | 4,171 | 186 | 140 | 76 | 47 | 107 | |||||||||||||||||||||
| Other retail | 12,130 | 8,844 | 420 | 279 | 246 | 141 | 116 | |||||||||||||||||||||
| Small business | 31,658 | 16,160 | 579 | 369 | 495 | 207 | 37 | |||||||||||||||||||||
| Specialised Lending | 65,995 | 55,769 | 877 | 580 | 60 | 16 | 1 | |||||||||||||||||||||
| Securitisation | 29,641 | 5,801 | - | - | - | - | - | |||||||||||||||||||||
| Standardised3 | 15,959 | 14,274 | - | - | 68 | 22 | - | |||||||||||||||||||||
| Total | 1,110,454 | 358,249 | 5,553 | 3,298 | 2,239 | 1,232 | 411 | |||||||||||||||||||||
| Regulatory | ||||||||||||||||||||||||||||
| Expected | Specific | Actual | ||||||||||||||||||||||||||
| Risk | Regulatory | Loss for | Provisions | Losses for | ||||||||||||||||||||||||
| 31 March 2021 | Exposure | Weighted | Expected | non-defaulted | Impaired | for Impaired | the 6 months | |||||||||||||||||||||
| $m | at Default | Assets | Loss1 | exposures | Loans | Loans | ended | |||||||||||||||||||||
| Corporate | 124,567 | 66,086 | 654 | 431 | 319 | 220 | 56 | |||||||||||||||||||||
| Business lending | 53,052 | 34,061 | 750 | 475 | 388 | 198 | 25 | |||||||||||||||||||||
| Sovereign | 143,237 | 2,355 | 2 | 2 | - | - | - | |||||||||||||||||||||
| Bank | 23,404 | 5,708 | 7 | 7 | - | - | - | |||||||||||||||||||||
| Residential mortgages | 562,798 | 133,938 | 1,919 | 1,126 | 263 | 78 | 44 | |||||||||||||||||||||
| Australian credit cards | 16,459 | 4,279 | 202 | 154 | 82 | 49 | 71 | |||||||||||||||||||||
| Other retail | 12,579 | 9,266 | 459 | 301 | 277 | 158 | 78 | |||||||||||||||||||||
| Small business | 31,941 | 16,097 | 613 | 373 | 639 | 229 | 24 | |||||||||||||||||||||
| Specialised Lending | 64,867 | 55,314 | 813 | 598 | 39 | 12 | 1 | |||||||||||||||||||||
| Securitisation | 28,299 | 5,513 | - | - | - | - | - | |||||||||||||||||||||
| Standardised3 | 15,300 | 14,510 | - | - | 64 | 30 | - | |||||||||||||||||||||
| Total | 1,076,503 | 347,127 | 5,419 | 3,467 | 2,071 | 974 | 299 |
| Regulatory | ||||||||||||||||||||||||||||
| Expected | Specific | Actual | ||||||||||||||||||||||||||
| Risk | Regulatory | Loss for | Provisions | Losses for | ||||||||||||||||||||||||
| 30 June 2020 | Exposure | Weighted | Expected | non-defaulted | Impaired | for Impaired | the 9 months | |||||||||||||||||||||
| $m | at Default | Assets | Loss1 | exposures | Loans | Loans | ended | |||||||||||||||||||||
| Corporate | 135,178 | 76,303 | 820 | 580 | 425 | 236 | (4) | |||||||||||||||||||||
| Business lending | 54,710 | 37,584 | 805 | 538 | 377 | 206 | 55 | |||||||||||||||||||||
| Sovereign | 116,800 | 2,194 | 1 | 1 | - | - | - | |||||||||||||||||||||
| Bank | 23,919 | 6,461 | 7 | 7 | - | - | - | |||||||||||||||||||||
| Residential mortgages | 551,420 | 134,425 | 1,898 | 1,125 | 379 | 102 | 96 | |||||||||||||||||||||
| Australian credit cards | 17,649 | 4,332 | 269 | 195 | 127 | 75 | 247 | |||||||||||||||||||||
| Other retail | 14,110 | 10,594 | 573 | 359 | 387 | 213 | 196 | |||||||||||||||||||||
| Small business | 33,099 | 17,638 | 669 | 393 | 816 | 294 | 55 | |||||||||||||||||||||
| Specialised Lending | 64,943 | 59,114 | 1,011 | 790 | 59 | 25 | 1 | |||||||||||||||||||||
| Securitisation | 27,135 | 5,429 | - | - | - | - | - | |||||||||||||||||||||
| Standardised3 | 19,306 | 19,601 | - | - | 49 | 20 | 1 | |||||||||||||||||||||
| Total | 1,058,269 | 373,675 | 6,053 | 3,988 | 2,619 | 1,171 | 647 |
| 1 | Includes regulatory expected losses for defaulted and non-defaulted exposures. |
| 2 | Increase in impaired mainly driven by one large institutional exposure. |
| 3 | Includes mark-to-market related credit risk. |
 | Westpac Group June 2021 Pillar 3 Report | 13 |
Pillar 3 report
Credit risk exposures
Exposure at Default by major type
| 30 June 2021 | On balance | Off-balance sheet | Total Exposure | Average | ||||||||||||||||
| $m | sheet | Non-market related | Market related | at Default | 3 months ended1 | |||||||||||||||
| Corporate | 52,560 | 61,160 | 13,752 | 127,472 | 126,020 | |||||||||||||||
| Business lending | 39,659 | 13,263 | - | 52,922 | 52,987 | |||||||||||||||
| Sovereign | 124,106 | 1,435 | 35,969 | 161,510 | 152,374 | |||||||||||||||
| Bank | 12,956 | 1,949 | 6,875 | 21,780 | 22,592 | |||||||||||||||
| Residential mortgages | 496,954 | 78,385 | - | 575,339 | 569,069 | |||||||||||||||
| Australian credit cards | 6,564 | 9,484 | - | 16,048 | 16,254 | |||||||||||||||
| Other retail | 9,124 | 3,006 | - | 12,130 | 12,355 | |||||||||||||||
| Small business | 24,680 | 6,978 | - | 31,658 | 31,800 | |||||||||||||||
| Specialised lending | 53,087 | 11,370 | 1,538 | 65,995 | 65,431 | |||||||||||||||
| Securitisation2 | 21,775 | 7,764 | 102 | 29,641 | 28,970 | |||||||||||||||
| Standardised | 12,373 | 1,060 | 2,526 | 15,959 | 15,630 | |||||||||||||||
| Total | 853,838 | 195,854 | 60,762 | 1,110,454 | 1,093,482 | |||||||||||||||
| 31 March 2021 | On balance | Off-balance sheet | Total Exposure | Average | ||||||||||||||||
| $m | sheet | Non-market related | Market related | at Default | 6 months ended3 | |||||||||||||||
| Corporate | 52,808 | 57,449 | 14,310 | 124,567 | 126,100 | |||||||||||||||
| Business lending | 39,220 | 13,832 | - | 53,052 | 53,786 | |||||||||||||||
| Sovereign | 109,514 | 1,490 | 32,233 | 143,237 | 137,438 | |||||||||||||||
| Bank | 14,085 | 1,829 | 7,490 | 23,404 | 22,546 | |||||||||||||||
| Residential mortgages | 486,802 | 75,996 | - | 562,798 | 556,398 | |||||||||||||||
| Australian credit cards | 6,664 | 9,795 | - | 16,459 | 16,731 | |||||||||||||||
| Other retail | 9,467 | 3,112 | - | 12,579 | 13,060 | |||||||||||||||
| Small business | 24,730 | 7,211 | - | 31,941 | 32,410 | |||||||||||||||
| Specialised lending | 52,619 | 10,598 | 1,650 | 64,867 | 65,297 | |||||||||||||||
| Securitisation2 | 20,145 | 8,033 | 121 | 28,299 | 27,319 | |||||||||||||||
| Standardised | 12,192 | 1,048 | 2,060 | 15,300 | 16,208 | |||||||||||||||
| Total | 828,246 | 190,393 | 57,864 | 1,076,503 | 1,067,293 | |||||||||||||||
| 30 June 2020 | On balance | Off-balance sheet | Total Exposure | Average | ||||||||||||||||
| $m | sheet | Non-market related | Market related | at Default | 3 months ended4 | |||||||||||||||
| Corporate | 61,212 | 60,146 | 13,820 | 135,178 | 140,854 | |||||||||||||||
| Business lending | 42,209 | 12,501 | - | 54,710 | 54,569 | |||||||||||||||
| Sovereign | 103,877 | 1,675 | 11,248 | 116,800 | 121,932 | |||||||||||||||
| Bank | 14,237 | 2,010 | 7,672 | 23,919 | 25,276 | |||||||||||||||
| Residential mortgages | 484,540 | 66,880 | - | 551,420 | 552,643 | |||||||||||||||
| Australian credit cards | 7,268 | 10,381 | - | 17,649 | 18,125 | |||||||||||||||
| Other retail | 10,841 | 3,269 | - | 14,110 | 14,667 | |||||||||||||||
| Small business | 26,023 | 7,076 | - | 33,099 | 33,140 | |||||||||||||||
| Specialised lending | 53,231 | 9,652 | 2,060 | 64,943 | 65,405 | |||||||||||||||
| Securitisation2 | 21,554 | 5,457 | 124 | 27,135 | 27,616 | |||||||||||||||
| Standardised | 12,838 | 1,211 | 5,257 | 19,306 | 19,461 | |||||||||||||||
| Total | 837,830 | 180,258 | 40,181 | 1,058,269 | 1,073,688 | |||||||||||||||
| 1 | Average is based on exposures as at 30 June 2021 and 31 March 2021. |
| 2 | The EAD associated with securitisations is for the banking book only. |
| 3 | Average is based on exposures as at 31 March 2021, 31 December 2020, and 30 September 2020. |
| 4 | Average is based on exposures as at 30 June 2021 and 31 March 2021. |
14 | Westpac Group June 2021 Pillar 3 Report | |
Pillar 3 report
Credit risk exposures
Loan impairment provisions
APS220 Credit Quality requires that Westpac report specific provisions and a General Reserve for Credit Loss (GRCL). All Individually Assessed Provisions (IAP) raised under Australian Accounting Standards (AAS) are classified as specific provisions. All Collectively Assessed Provisions (CAP) raised under AAS are either classified into specific provisions or a GRCL.
| 30 June 2021 | A-IFRS Provisions | Total Regulatory | ||||||||||
| $m | IAPs | CAPs | Provisions | |||||||||
| Specific Provisions | ||||||||||||
| for impaired loans | 868 | 364 | 1,232 | |||||||||
| for defaulted but not impaired loans | NA | 908 | 908 | |||||||||
| For Stage 2 | NA | 1,895 | 1,895 | |||||||||
| Total Specific Provision1 | 868 | 3,167 | 4,035 | |||||||||
| General Reserve for Credit Loss1 | NA | 1,505 | 1,505 | |||||||||
| Total provisions for ECL | 868 | 4,672 | 5,540 | |||||||||
| 31 March 2021 | A-IFRS Provisions | Total Regulatory | ||||||||||
| $m | IAPs | CAPs | Provisions | |||||||||
| Specific Provisions | ||||||||||||
| for impaired loans | 564 | 410 | 974 | |||||||||
| for defaulted but not impaired loans | NA | 918 | 918 | |||||||||
| For Stage 2 | NA | 2,051 | 2,051 | |||||||||
| Total Specific Provision1 | 564 | 3,379 | 3,943 | |||||||||
| General Reserve for Credit Loss1 | NA | 1,565 | 1,565 | |||||||||
| Total provisions for ECL | 564 | 4,944 | 5,508 | |||||||||
| 30 June 2020 | A-IFRS Provisions | Total Regulatory | ||||||||||
| $m | IAPs | CAPs | Provisions | |||||||||
| Specific Provisions | ||||||||||||
| for impaired loans | 607 | 564 | 1,171 | |||||||||
| for defaulted but not impaired loans | NA | 860 | 860 | |||||||||
| For Stage 2 | NA | 2,167 | 2,167 | |||||||||
| Total Specific Provision1 | 607 | 3,591 | 4,198 | |||||||||
| General Reserve for Credit Loss1 | NA | 2,172 | 2,172 | |||||||||
| Total provisions for ECL | 607 | 5,763 | 6,370 | |||||||||
| 1 | Provisions classified according to APRA’s letter dated 4 July 2017 “Provisions for regulatory purposes and AASB 9 financial instruments”. |
| | Westpac Group June 2021 Pillar 3 Report | 15 |
Pillar 3 report
Credit risk exposures
Impaired and past due loans
The following tables disclose the crystallisation of credit risk as impairment and loss. Analysis of exposures defaulted not impaired, impaired loans, related provisions and actual losses is broken down by concentrations reflecting Westpac’s asset categories.
| Specific | Specific | Actual | ||||||||||||||||||
| 30 June 2021 | Defaulted | Impaired | Provisions for | Provisions to | Losses for the | |||||||||||||||
| $m | not impaired1, 2 | Loans | Impaired Loans | Impaired Loans | 9 months ended | |||||||||||||||
| Corporate | 175 | 675 | 539 | 80 | % | 56 | ||||||||||||||
| Business lending | 1,068 | 343 | 179 | 52 | % | 40 | ||||||||||||||
| Sovereign | - | - | - | - | - | |||||||||||||||
| Bank | - | - | - | - | - | |||||||||||||||
| Residential mortgages | 5,031 | 276 | 81 | 29 | % | 54 | ||||||||||||||
| Australian credit cards | - | 76 | 47 | 62 | % | 107 | ||||||||||||||
| Other retail | - | 246 | 141 | 57 | % | 116 | ||||||||||||||
| Small business | 604 | 495 | 207 | 42 | % | 37 | ||||||||||||||
| Specialised lending | 470 | 60 | 16 | 27 | % | 1 | ||||||||||||||
| Securitisation | - | - | - | - | - | |||||||||||||||
| Standardised | 74 | 68 | 22 | 32 | % | - | ||||||||||||||
| Total | 7,422 | 2,239 | 1,232 | 55 | % | 411 | ||||||||||||||
| Specific | Specific | Actual | ||||||||||||||||||
| 31 March 2021 | Defaulted | Impaired | Provisions for | Provisions to | Losses for the | |||||||||||||||
| $m | not impaired1 | Loans | Impaired Loans | Impaired Loans | 6 months ended | |||||||||||||||
| Corporate | 155 | 319 | 220 | 69 | % | 56 | ||||||||||||||
| Business lending | 793 | 388 | 198 | 51 | % | 25 | ||||||||||||||
| Sovereign | - | - | - | - | - | |||||||||||||||
| Bank | - | - | - | - | - | |||||||||||||||
| Residential mortgages | 5,298 | 263 | 78 | 30 | % | 44 | ||||||||||||||
| Australian credit cards | - | 82 | 49 | 60 | % | 71 | ||||||||||||||
| Other retail | - | 277 | 158 | 57 | % | 78 | ||||||||||||||
| Small business | 423 | 639 | 229 | 36 | % | 24 | ||||||||||||||
| Specialised lending | 367 | 39 | 12 | 31 | % | 1 | ||||||||||||||
| Securitisation | - | - | - | - | - | |||||||||||||||
| Standardised | 73 | 64 | 30 | 47 | % | - | ||||||||||||||
| Total | 7,109 | 2,071 | 974 | 47 | % | 299 | ||||||||||||||
| Specific | Specific | Actual | ||||||||||||||||||
| 30 June 2020 | Defaulted | Impaired | Provisions for | Provisions to | Losses for the | |||||||||||||||
| $m | not impaired1 | Loans | Impaired Loans | Impaired Loans | 9 months ended | |||||||||||||||
| Corporate | 89 | 425 | 236 | 56 | % | (4 | ) | |||||||||||||
| Business lending | 568 | 377 | 206 | 55 | % | 55 | ||||||||||||||
| Sovereign | - | - | - | - | - | |||||||||||||||
| Bank | - | - | - | - | - | |||||||||||||||
| Residential mortgages | 6,692 | 379 | 102 | 27 | % | 96 | ||||||||||||||
| Australian credit cards | - | 127 | 75 | 59 | % | 247 | ||||||||||||||
| Other retail | 2 | 387 | 213 | 55 | % | 196 | ||||||||||||||
| Small business | 516 | 816 | 294 | 36 | % | 55 | ||||||||||||||
| Specialised lending | 331 | 59 | 25 | 42 | % | 1 | ||||||||||||||
| Securitisation | - | - | - | - | - | |||||||||||||||
| Standardised | 105 | 49 | 20 | 41 | % | 1 | ||||||||||||||
| Total | 8,303 | 2,619 | 1,171 | 45 | % | 647 | ||||||||||||||
| 1 | Includes items past 90 days not impaired. |
| 2 | Increase over quarter includes reclassification of facilities subject to a forbearance agreement. |
16 | Westpac Group June 2021 Pillar 3 Report | |
Pillar 3 report
Securitisation
Banking book summary of securitisation activity by asset type
| For the 3 months ended | ||||||||
| 30 June 2021 | Amount | Recognised gain or | ||||||
| $m | securitised | loss on sale | ||||||
| Residential mortgages | 17,952 | - | ||||||
| Credit cards | - | - | ||||||
| Auto and equipment finance | - | - | ||||||
| Business lending | - | - | ||||||
| Investments in ABS | - | - | ||||||
| Other | - | - | ||||||
| Total | 17,952 | - | ||||||
| For the 6 months ended | ||||||||
| 31 March 2021 | Amount | Recognised gain or | ||||||
| $m | securitised | loss on sale | ||||||
| Residential mortgages | 9,925 | - | ||||||
| Credit cards | - | - | ||||||
| Auto and equipment finance | 325 | - | ||||||
| Business lending | - | - | ||||||
| Investments in ABS | - | - | ||||||
| Other | - | - | ||||||
| Total | 10,250 | - | ||||||
| For the 3 months ended | ||||||||
| 30 June 2020 | Amount | Recognised gain or | ||||||
| $m | securitised | loss on sale | ||||||
| Residential mortgages | 46,347 | - | ||||||
| Credit cards | - | - | ||||||
| Auto and equipment finance | - | - | ||||||
| Business lending | - | - | ||||||
| Investments in ABS | - | - | ||||||
| Other | - | - | ||||||
| Total | 46,347 | - | ||||||
| | Westpac Group June 2021 Pillar 3 Report | 17 |
Pillar 3 report Securitisation |
Banking book summary of on and off-balance sheet securitisation by exposure type
| 30 June 2021 | On balance sheet | Off-balance | Total Exposure | |
| $m | Securitisation retained | Securitisation purchased | sheet | at Default |
| Securities | - | 7,353 | 37 | 7,390 |
| Liquidity facilities | - | - | 271 | 271 |
| Funding facilities | 3,029 | - | 1,432 | 4,461 |
| Underwriting facilities | - | - | - | - |
| Lending facilities | 686 | - | 374 | 1,060 |
| Warehouse facilities | 10,707 | - | 5,752 | 16,459 |
| Total | 14,422 | 7,353 | 7,866 | 29,641 |
| 31 March 2021 | On balance sheet | Off-balance | Total Exposure | |
| $m | Securitisation retained | Securitisation purchased | sheet | at Default |
| Securities | - | 7,303 | 37 | 7,340 |
| Liquidity facilities | - | - | 273 | 273 |
| Funding facilities | 2,951 | - | 1,451 | 4,402 |
| Underwriting facilities | - | - | - | - |
| Lending facilities | 625 | - | 540 | 1,165 |
| Warehouse facilities | 9,265 | - | 5,854 | 15,119 |
| Total | 12,841 | 7,303 | 8,155 | 28,299 |
| 30 June 2020 | On balance sheet | Off-balance | Total Exposure | |
| $m | Securitisation retained | Securitisation purchased | sheet | at Default |
| Securities | - | 8,165 | 37 | 8,202 |
| Liquidity facilities | - | - | 287 | 287 |
| Funding facilities | 2,702 | - | 1,049 | 3,751 |
| Underwriting facilities | - | - | - | - |
| Lending facilities | 527 | - | 291 | 818 |
| Warehouse facilities | 10,160 | - | 3,917 | 14,077 |
| Total | 13,389 | 8,165 | 5,581 | 27,135 |
18 | Westpac Group June 2021 Pillar 3 Report |  |
Pillar 3 report Securitisation |
Trading book summary of on and off-balance sheet securitisation by exposure type1
| 30 June 2021 | On balance sheet | Off-balance | Total Exposure | |
| $m | Securitisation retained | Securitisation purchased | sheet | at Default |
| Securities | - | - | - | - |
| Liquidity facilities | - | - | - | - |
| Funding facilities | - | - | - | - |
| Underwriting facilities | - | - | - | - |
| Lending facilities | - | - | - | - |
| Warehouse facilities | - | - | - | - |
| Credit enhancements | - | - | - | - |
| Basis swaps | - | - | 89 | 89 |
| Other derivatives | - | - | 12 | 12 |
| Total | - | - | 101 | 101 |
| 31 March 2021 | On balance sheet | Off-balance | Total Exposure | |
| $m | Securitisation retained | Securitisation purchased | sheet | at Default |
| Securities | - | 29 | - | 29 |
| Liquidity facilities | - | - | - | - |
| Funding facilities | - | - | - | - |
| Underwriting facilities | - | - | - | - |
| Lending facilities | - | - | - | - |
| Warehouse facilities | - | - | - | - |
| Credit enhancements | - | - | - | - |
| Basis swaps | - | - | 112 | 112 |
| Other derivatives | - | - | 11 | 11 |
| Total | - | 29 | 123 | 152 |
| 30 June 2020 | On balance sheet | Off-balance | Total Exposure | |
| $m | Securitisation retained | Securitisation purchased | sheet | at Default |
| Securities | - | 18 | - | 18 |
| Liquidity facilities | - | - | - | - |
| Funding facilities | - | - | - | - |
| Underwriting facilities | - | - | - | - |
| Lending facilities | - | - | - | - |
| Warehouse facilities | - | - | - | - |
| Credit enhancements | - | - | - | - |
| Basis swaps | - | - | 109 | 109 |
| Other derivatives | - | - | 18 | 18 |
| Total | - | 18 | 127 | 145 |
| 1 | EAD associated with trading book securitisation is not included in EAD by major type on page 13. Trading book securitisation exposure is captured and risk weighted under APS116 Capital Adequacy: Market Risk. |
| Westpac Group June 2021 Pillar 3 Report | 19 |
Pillar 3 report Liquidity Coverage Ratio |
Liquidity Coverage Ratio (LCR)
Westpac’s average LCR for the quarter was 127%1 (31 March 2021: 124%).
Liquid assets included in the LCR comprise High Quality Liquid Assets (HQLA), the Committed Liquidity Facility (CLF) offered by the Reserve Bank of Australia and additional qualifying Reserve Bank of New Zealand securities. LCR liquid assets also includes Westpac’s Additional Allowance of the Term Funding Facility (TFF).
Westpac’s portfolio of HQLA averaged $123.4 billion over the quarter1.
Funding is sourced from retail, small business, corporate and institutional customer deposits and wholesale funding. Westpac seeks to minimise the outflows associated with this funding by targeting customer deposits with lower LCR outflow rates and actively manages the maturity profile of its wholesale funding portfolio. Westpac maintains a buffer over the regulatory minimum of 100%.
Effective 1 January 2021, the Group is required by APRA to increase the value of its net cash outflows by 10% for the purpose of calculating LCR. The overlay to the Group’s net cash outflows has been required by APRA in response to breaches of liquidity requirements. A program is underway to address APRA’s requirements including commencement of APRA mandated reviews.
| 30 June 2021 | 31 March 2021 | ||||
| Total unweighted | Total weighted | Total unweighted | Total weighted | ||
| $m | value (average)1 | value (average)1 | value (average)1 | value (average)1 | |
| Liquid assets, of which: | |||||
| 1 | High-quality liquid assets (HQLA) | 123,429 | 117,280 | ||
| 2 | Alternative liquid assets (ALA) | 35,610 | 39,604 | ||
| 3 | Reserve Bank of New Zealand (RBNZ) securities | 7,558 | 8,196 | ||
| Cash Outflows | |||||
| 4 | Retail deposits and deposits from small business | 297,200 | 25,568 | 287,212 | 25,064 |
| customers, of which: | |||||
| 5 | Stable deposits | 146,982 | 7,349 | 142,384 | 7,119 |
| 6 | Less stable deposits | 150,218 | 18,219 | 144,828 | 17,945 |
| 7 | Unsecured wholesale funding, of which: | 162,662 | 70,798 | 161,362 | 73,242 |
| 8 | Operational deposits (all counterparties) and deposits | 82,217 | 20,466 | 79,933 | 19,898 |
| in networks for cooperative banks | |||||
| 9 | Non-operational deposits (all counterparties) | 70,116 | 40,003 | 68,405 | 40,320 |
| 10 | Unsecured debt | 10,329 | 10,329 | 13,024 | 13,024 |
| 11 | Secured wholesale funding | - | 1 | ||
| 12 | Additional requirements, of which: | 206,587 | 26,844 | 204,259 | 27,461 |
| 13 | Outflows related to derivatives exposures and other | 10,004 | 10,004 | 10,882 | 10,882 |
| collateral requirements | |||||
| 14 | Outflows related to loss of funding on debt products | 781 | 781 | 1,365 | 1,365 |
| 15 | Credit and liquidity facilities | 195,802 | 16,059 | 192,012 | 15,214 |
| 16 | Other contractual funding obligations | 1,141 | 1,141 | 251 | 251 |
| 17 | Other contingent funding obligations | 40,502 | 3,290 | 37,718 | 3,185 |
| 18 | Total cash outflows | 127,641 | 129,204 | ||
| Cash inflows | |||||
| 19 | Secured lending (e.g. reverse repos) | 2,894 | - | 5,891 | - |
| 20 | Inflows from fully performing exposures | 10,006 | 5,732 | 8,817 | 5,202 |
| 21 | Other cash inflows | 2,513 | 2,513 | 2,559 | 2,559 |
| 22 | Total cash inflows | 15,413 | 8,245 | 17,267 | 7,761 |
| 23 | Total liquid assets | 166,597 | 165,080 | ||
| 24 | Total net cash outflows | 131,336 | 133,587 | ||
| 24.1 Of which: Net cash outflows overlay | 11,940 | 12,144 | |||
| 25 | Liquidity Coverage Ratio (%) | 127% | 124% | ||
| Number of data points used | 62 | 64 | |||
| 1 | Calculated as a simple average of the daily observations over the quarter. |
20 | Westpac Group June 2021 Pillar 3 Report | |
Pillar 3 report Appendix I - APS330 quantitative requirements |
The following table cross-references the quantitative disclosure requirements outlined in Attachment C of APS330 to the quantitative disclosures made in this report.
| APS330 reference | Westpac disclosure | Page | ||
| General Requirements | ||||
| Paragraph 49 | Summary leverage ratio | 12 | ||
| Attachment C | ||||
| Table 3: | (a) to (e) | Capital requirements | 10 | |
| Capital Adequacy | (f) | Westpac’s capital adequacy ratios | 9 | |
| Capital adequacy ratios of major subsidiary banks | ||||
| Table 4: | (a) | Exposure at Default by major type | 14 | |
| Credit Risk - general | (b) | Impaired and past due loans | 16 | |
| disclosures | (c) | General reserve for credit loss | 15 | |
| Table 5: | (a) | Banking Book summary of securitisation activity by asset type | 17 | |
| Securitisation exposures | Banking Book summary of on and off-balance sheet | |||
| (b) | securitisation by exposure type | 18 | ||
| Trading Book summary of on and off-balance sheet | ||||
| securitisation by exposure type | 19 | |||
| Attachment F | ||||
| Table 20: Liquidity | Liquidity Coverage Ratio disclosure | 20 | ||
| Coverage Ratio disclosure | ||||
| template | ||||
Exchange rates
The following exchange rates were used in this report, and reflect spot rates for the period end.
| $ | 30 June 2021 | 31 March 2021 | 30 June 2020 |
| USD | 0.7520 | 0.7596 | 0.6856 |
| GBP | 0.5431 | 0.5536 | 0.5584 |
| NZD | 1.0741 | 1.0892 | 1.0698 |
| EUR | 0.6319 | 0.6487 | 0.6114 |
| Westpac Group June 2021 Pillar 3 Report | 21 |
Pillar 3 report Disclosure regarding forward-looking statements |
This report contains statements that constitute ‘forward-looking statements’ within the meaning of Section 21E of the US Securities Exchange Act of 1934.
Forward-looking statements are statements about matters that are not historical facts. Forward-looking statements appear in a number of places in this report and include statements regarding Westpac’s intent, belief or current expectations with respect to its business and operations, market conditions, results of operations and financial condition, including, without limitation, future loan loss provisions and financial support to certain borrowers. Words such as ‘will’, ‘may’, ‘expect’, ‘intend’, ‘seek’, ‘would’, ‘should’, ‘could’, ‘continue’, ‘plan’, ‘estimate’, ‘anticipate’, ‘believe’, ‘probability’, ‘risk’, ‘aim’, ‘outlook’ or other similar words are used to identify forward-looking statements. These forward-looking statements reflect Westpac’s current views with respect to future events and are subject to change, certain risks, uncertainties and assumptions which are, in many instances, beyond Westpac’s control, and have been made based upon management’s expectations and beliefs concerning future developments and their potential effect upon Westpac. There can be no assurance that future developments will be in accordance with Westpac’s expectations or that the effect of future developments on Westpac will be those anticipated. Actual results could differ materially from those expected, depending on the outcome of various factors, including, but not limited to:
| • | information security breaches, including cyberattacks; |
| • | the effect of the global COVID-19 pandemic, which has had, and may continue to have, a negative impact on our business and global economic conditions, adversely affect a wide-range of Westpac’s key suppliers, third-party contractors and customers, create increased volatility in financial markets and result in increased impairments, defaults and write-offs; |
| • | the effect of, and changes in, laws, regulations, taxation or accounting standards or practices and government policy, particularly changes to liquidity, leverage and capital requirements; |
| • | regulatory investigations, reviews and other actions, inquiries, litigation, fines, penalties, restrictions or other regulator imposed conditions, including as a result of our actual or alleged failure to comply with laws (such as financial crime laws), regulations or regulatory policy; |
| • | the effectiveness of Westpac’s risk management policies, including internal processes, systems and employees, and operational risks resulting from ineffective processes and controls, as well as breakdowns in processes and procedures requiring remediation activity; |
| • | the failure to comply with financial crime obligations, which has had, and could further have, adverse effects on our business and reputation; |
| • | the occurrence of environmental change (including as a result of climate change) or external events in countries in which Westpac or its customers or counterparties conduct their operations; |
| • | internal and external events which may adversely impact Westpac’s reputation; |
| • | litigation and other legal proceedings and regulator investigations and enforcement actions; |
| • | reliability and security of Westpac’s technology and risks associated with changes to technology systems; |
| • | the stability of Australian and international financial systems and disruptions to financial markets and any losses or business impacts Westpac or its customers or counterparties may experience as a result; |
| • | market volatility, including uncertain conditions in funding, equity and asset markets; |
| • | an increase in defaults in credit exposures because of a deterioration in economic conditions; adverse asset, credit or capital market conditions; |
| • | the incidence of inadequate capital levels under stressed conditions; |
| • | the risk that governments will default on their debt obligations or will be unable to refinance their debts as they fall due; |
| • | changes to Westpac’s credit ratings or the methodology used by credit rating agencies; |
| • | levels of inflation, interest rates (including low or negative interest rates), exchange rates and market and monetary fluctuations and volatility; |
| • | an increase in defaults, write-offs and provisions for credit impairments; |
| • | changes in economic conditions, consumer spending, saving and borrowing habits in Australia, New Zealand and other countries (including as a result of tariffs and other protectionist trade measures) in which Westpac or its customers or counterparties conduct their operations and Westpac’s ability to maintain or to increase market share, margins and fees, and control expenses; |
| • | the effects of competition, including from established providers of financial services and from non-financial services entities, in the geographic and business areas in which Westpac conducts its operations; |
| • | poor data quality or poor data retention; |
| • | the incidence or severity of Westpac-insured events; |
| • | changes to Westpac’s critical accounting estimates and judgements and changes to the value of Westpac’s intangible assets; |
22 | Westpac Group June 2021 Pillar 3 Report | |
Pillar 3 report Disclosure regarding forward-looking statements |
| • | changes in political, social or economic conditions in any of the major markets in which Westpac or its customers or counterparties operate; |
| • | the inability to syndicate or sell down underwritten securities, particularly during times of heightened market volatility; |
| • | strategic decisions including diversification, innovation, divestment, acquisitions or business expansion activity, including the integration of new businesses; and |
| • | various other factors beyond Westpac’s control. |
The above list is not exhaustive. For certain other factors that may impact on forward-looking statements made by Westpac, refer to ‘Risk factors’ in the Directors’ report in the 2021 Interim Financial Results Announcement. When relying on forward-looking statements to make decisions with respect to Westpac, investors and others should carefully consider the foregoing factors and other uncertainties and events.
Westpac is under no obligation to update any forward-looking statements contained in this report, whether as a result of new information, future events or otherwise, after the date of this report.
| Westpac Group June 2021 Pillar 3 Report | 23 |