Exhibit 1
| ASX Release 1 November 2021 Westpac FY21 Presentation and Investor Discussion Pack Westpac Banking Corporation (“Westpac”) today provides the attached Westpac FY21 Presentation and Investor Discussion Pack. For further information: David Lording Andrew Bowden Group Head of Media Relations Head of Investor Relations 0419 683 411 0438 284 863 This document has been authorised for release by Tim Hartin, General Manager & Company Secretary. Level 18, 275 Kent Street Sydney, NSW, 2000 |

| Fix. Simplify. Perform. Financial results throughout this presentation are in Australian dollars and are based on cash earnings unless otherwise stated. Refer page 38 for definition. Results principally cover the 2H21, 1H21 and 2H20 periods. Comparison of 2H21 versus 1H21 (unless otherwise stated). Financial results throughout this presentation are in Australian dollars and are based on cash earnings unless otherwise stated. Refer page 38 for definition. Results principally cover the 2H21, 1H21 and 2H20 periods. Comparisons of 2H21 versus 1H21 (unless otherwise stated). |

| Westpac 2021 Full Year Results Index 2021 Full Year Results Presentation 3 Investor Discussion Pack of 2021 Full Year Results 35 Overview 36 Strategy 37 Results 38 Customer franchise 43 Governance and risk management 51 Sustainability 53 Earnings drivers 58 Revenue 59 Expenses 62 Impairment charges 64 Credit quality and provisions 65 Australian mortgage credit quality 76 Capital, funding and liquidity 83 Divisional results 95 Consumer 97 Business 98 Westpac Institutional Bank 99 Westpac New Zealand 100 Specialist Businesses 104 Economics 106 Appendix 121 Contact us 130 Disclaimer 131 |
| Financial results throughout this presentation are in Australian dollars and are based on cash earnings unless otherwise stated. Refer page 30 for definition. Results principally cover the 1H20, 2H19 and 1H19 periods. Comparison of 1H20 versus 2H19 (unless otherwise stated). Peter King Chief Executive Officer ,11estpac GROUP |
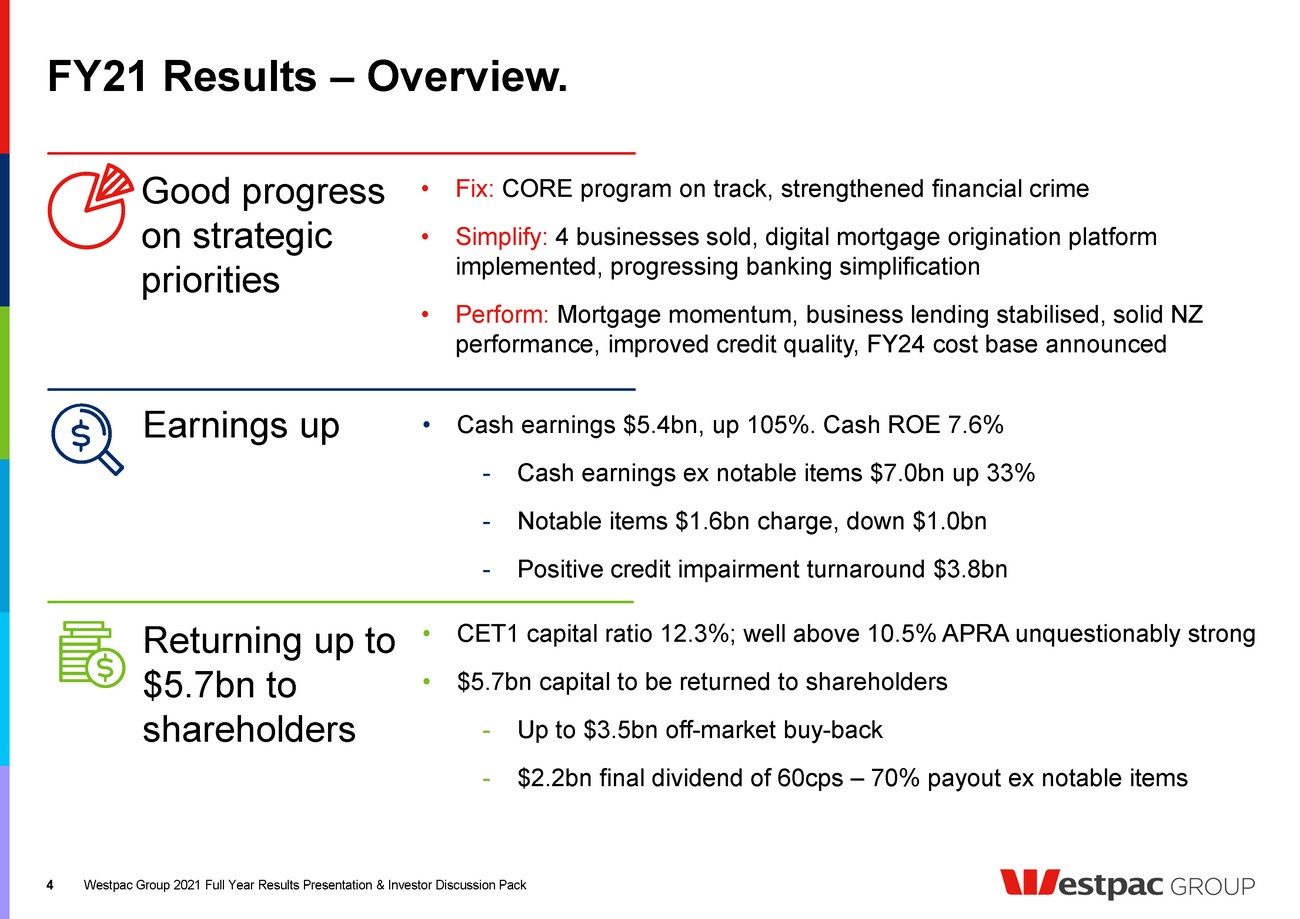
| FY21 Results – Overview. Earnings up Good progress on strategic priorities 4 Westpac Group 2021 Full Year Results Presentation & Investor Discussion Pack Returning up to $5.7bn to shareholders 4 • Cash earnings $5.4bn, up 105%. Cash ROE 7.6% - Cash earnings ex notable items $7.0bn up 33% - Notable items $1.6bn charge, down $1.0bn - Positive credit impairment turnaround $3.8bn • Fix: CORE program on track, strengthened financial crime • Simplify: 4 businesses sold, digital mortgage origination platform implemented, progressing banking simplification • Perform: Mortgage momentum, business lending stabilised, solid NZ performance, improved credit quality, FY24 cost base announced • CET1 capital ratio 12.3%; well above 10.5% APRA unquestionably strong • $5.7bn capital to be returned to shareholders - Up to $3.5bn off-market buy-back - $2.2bn final dividend of 60cps – 70% payout ex notable items |
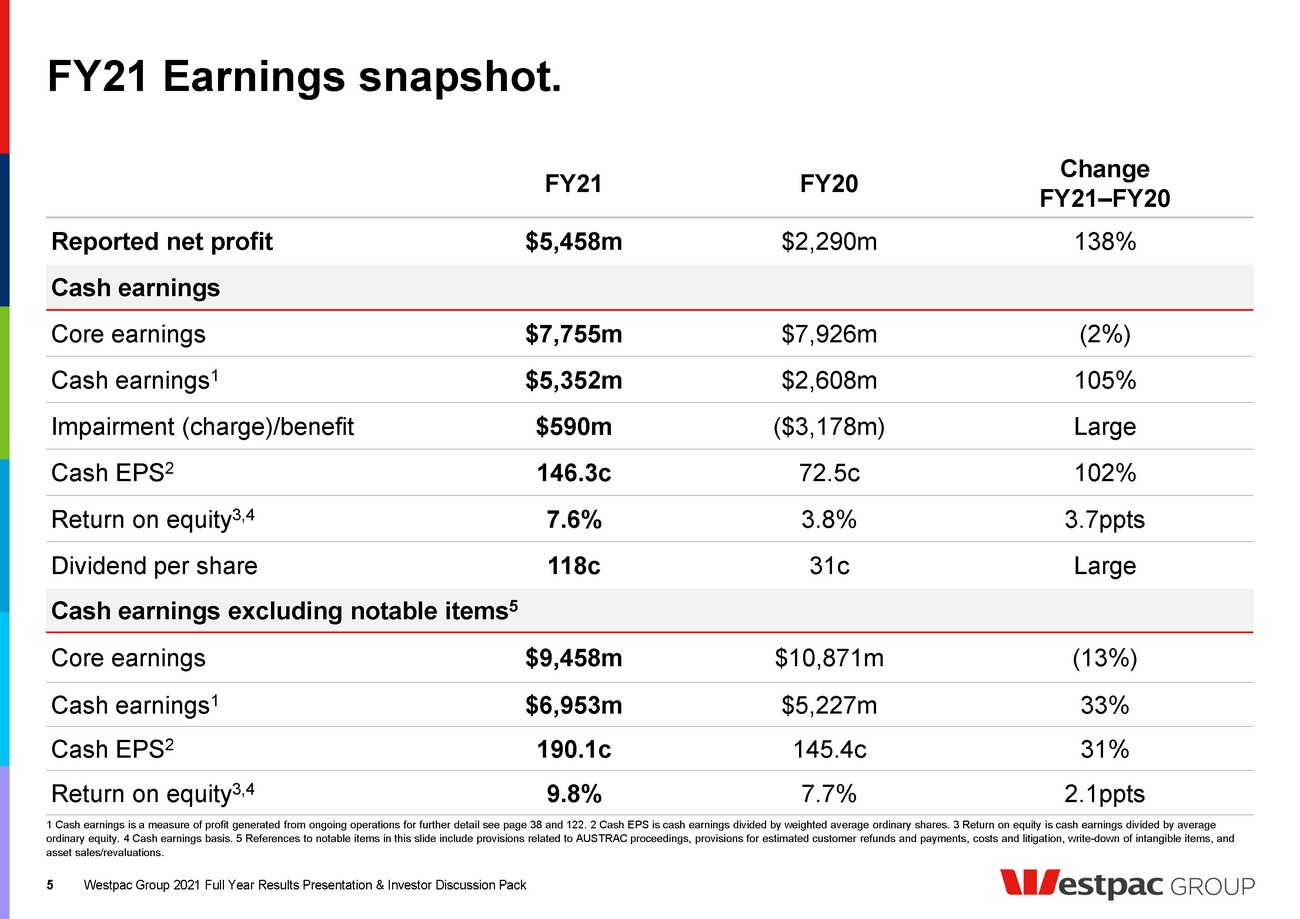
| FY21 Earnings snapshot. 1 Cash earnings is a measure of profit generated from ongoing operations for further detail see page 38 and 122. 2 Cash EPS is cash earnings divided by weighted average ordinary shares. 3 Return on equity is cash earnings divided by average ordinary equity. 4 Cash earnings basis. 5 References to notable items in this slide include provisions related to AUSTRAC proceedings, provisions for estimated customer refunds and payments, costs and litigation, write-down of intangible items, and asset sales/revaluations. FY21 FY20 Change FY21–FY20 Reported net profit $5,458m $2,290m 138% Cash earnings Core earnings $7,755m $7,926m (2%) Cash earnings1 $5,352m $2,608m 105% Impairment (charge)/benefit $590m ($3,178m) Large Cash EPS2 146.3c 72.5c 102% Return on equity3,4 7.6% 3.8% 3.7ppts Dividend per share 118c 31c Large Cash earnings excluding notable items5 Core earnings $9,458m $10,871m (13%) Cash earnings1 $6,953m $5,227m 33% Cash EPS2 190.1c 145.4c 31% Return on equity3,4 9.8% 7.7% 2.1ppts 5 Westpac Group 2021 Full Year Results Presentation & Investor Discussion Pack |
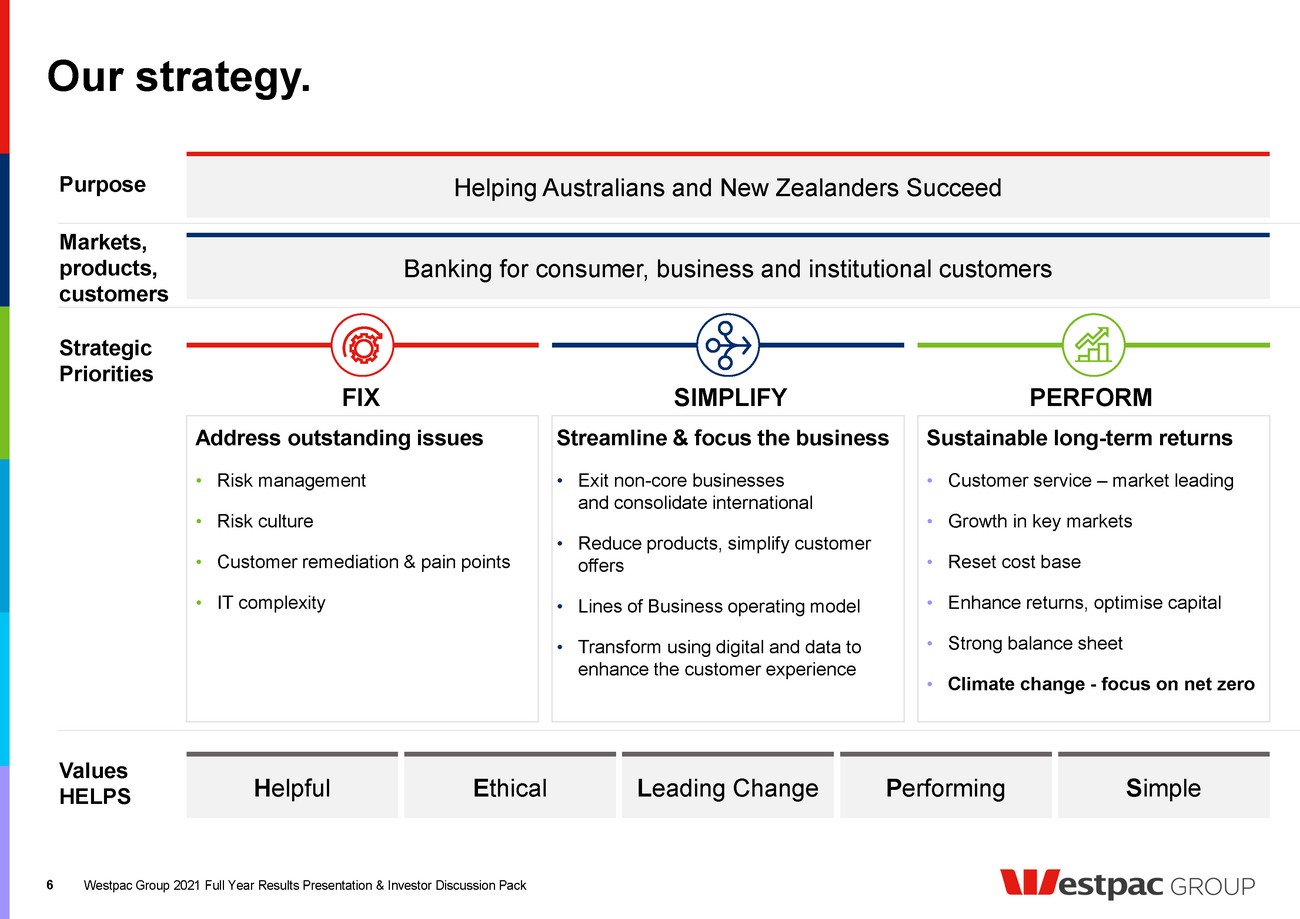
| Our strategy. 6 Westpac Group 2021 Full Year Results Presentation & Investor Discussion Pack Strategic Priorities Values HELPS Helpful Ethical Leading Change Performing Simple Purpose Markets, products, customers Helping Australians and New Zealanders Succeed Banking for consumer, business and institutional customers SIMPLIFY Sustainable long-term returns • Customer service – market leading • Growth in key markets • Reset cost base • Enhance returns, optimise capital • Strong balance sheet • Climate change - focus on net zero Streamline & focus the business • Exit non-core businesses and consolidate international • Reduce products, simplify customer offers • Lines of Business operating model • Transform using digital and data to enhance the customer experience Address outstanding issues • Risk management • Risk culture • Customer remediation & pain points • IT complexity FIX PERFORM |
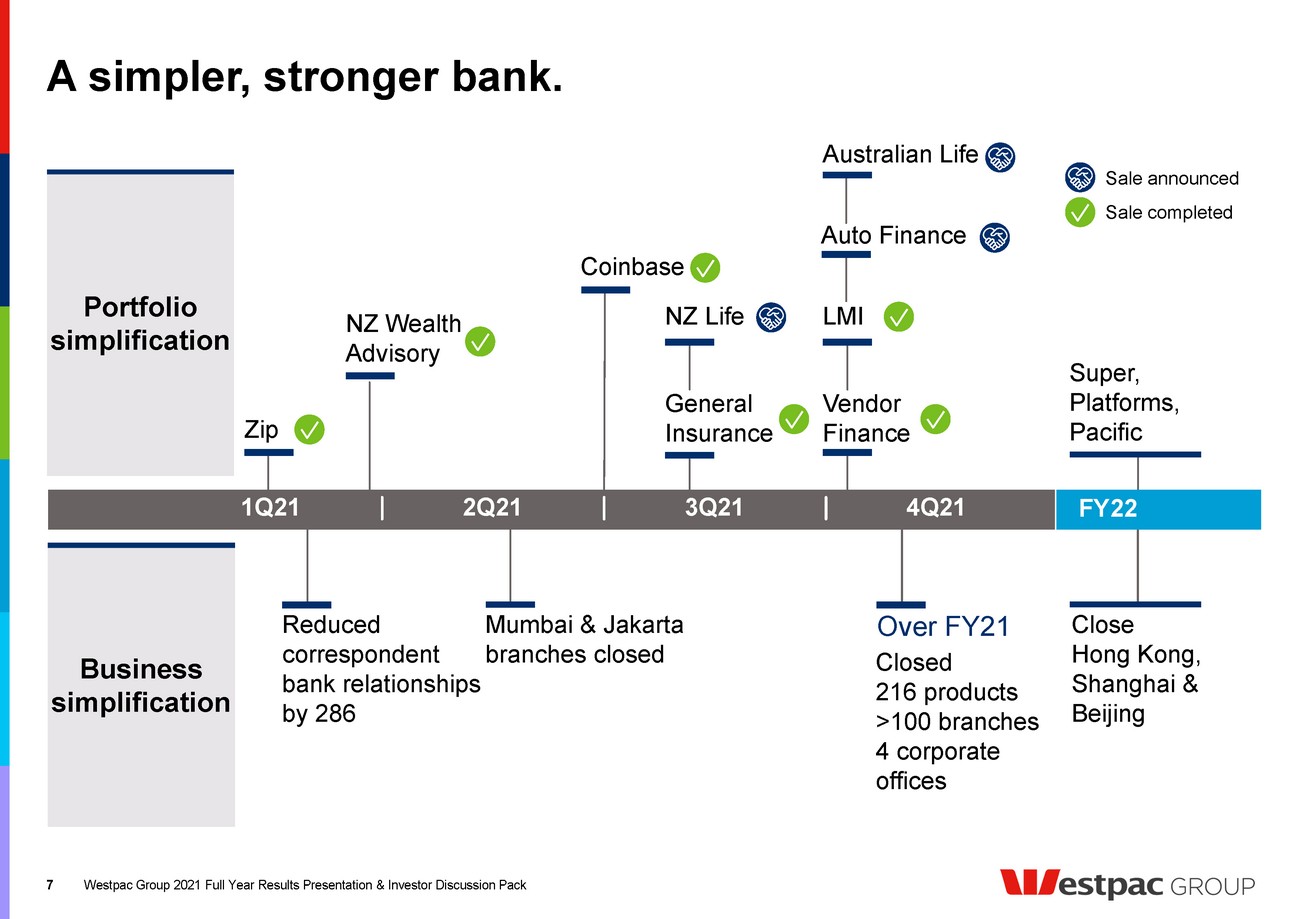
| Westpac Group 2021 Full Year Results Presentation & Investor Discussion Pack 7 7 Zip Vendor Finance LMI Auto Finance NZ Life Australian Life Super, Platforms, Pacific Reduced correspondent bank relationships by 286 Closed 216 products >100 branches 4 corporate offices Over FY21 A simpler, stronger bank. Business simplification General Insurance Portfolio simplification Close Hong Kong, Shanghai & Beijing Mumbai & Jakarta branches closed Sale announced Sale completed 1Q21 2Q21 NZ Wealth Advisory Coinbase 3Q21 4Q21 FY22 |
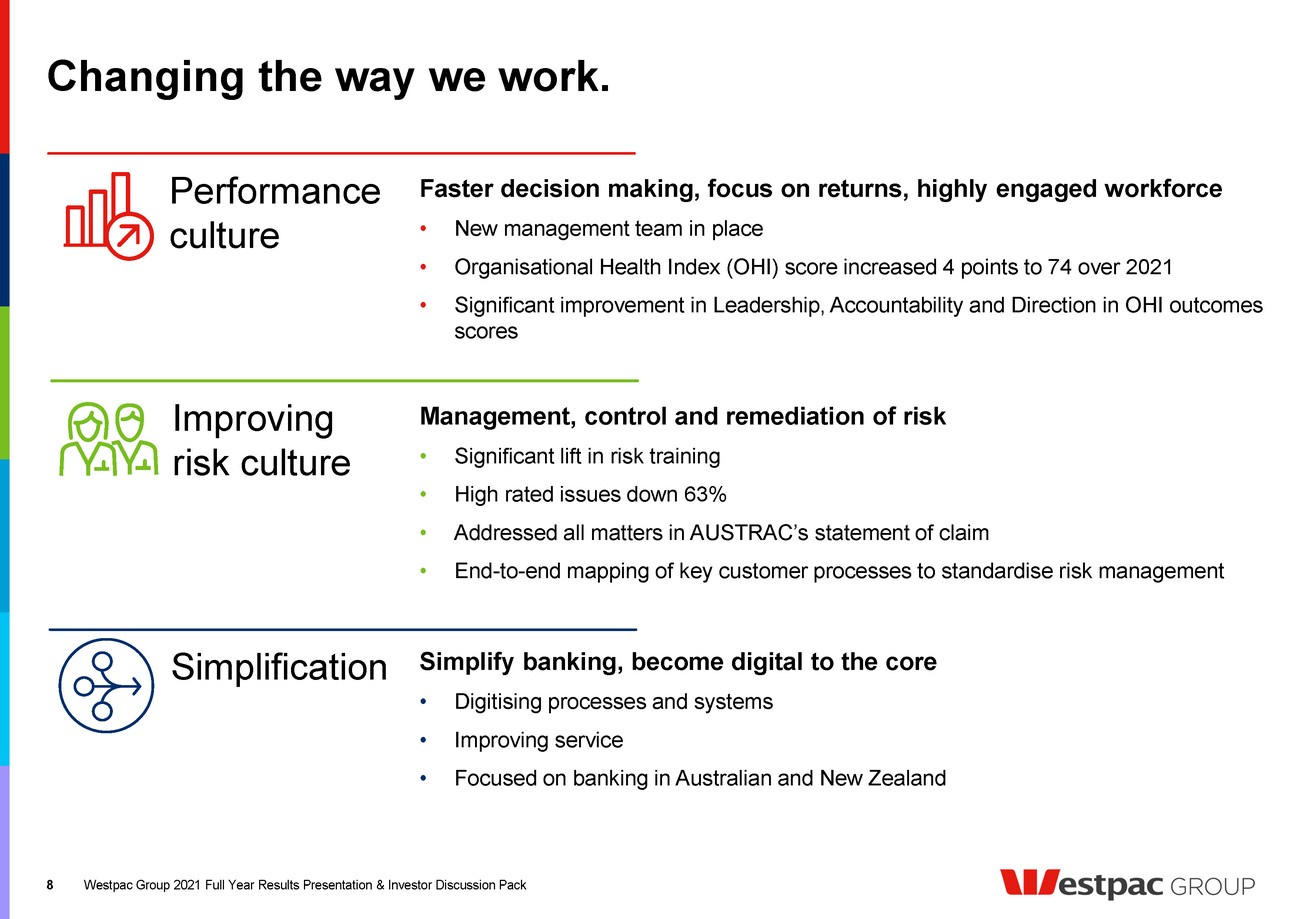
| Westpac Group 2021 Full Year Results Presentation & Investor Discussion Pack 8 8 Changing the way we work. Performance culture Improving risk culture Simplification Faster decision making, focus on returns, highly engaged workforce • New management team in place • Organisational Health Index (OHI) score increased 4 points to 74 over 2021 • Significant improvement in Leadership, Accountability and Direction in OHI outcomes scores Management, control and remediation of risk • Significant lift in risk training • High rated issues down 63% • Addressed all matters in AUSTRAC’s statement of claim • End-to-end mapping of key customer processes to standardise risk management Simplify banking, become digital to the core • Digitising processes and systems • Improving service • Focused on banking in Australian and New Zealand |
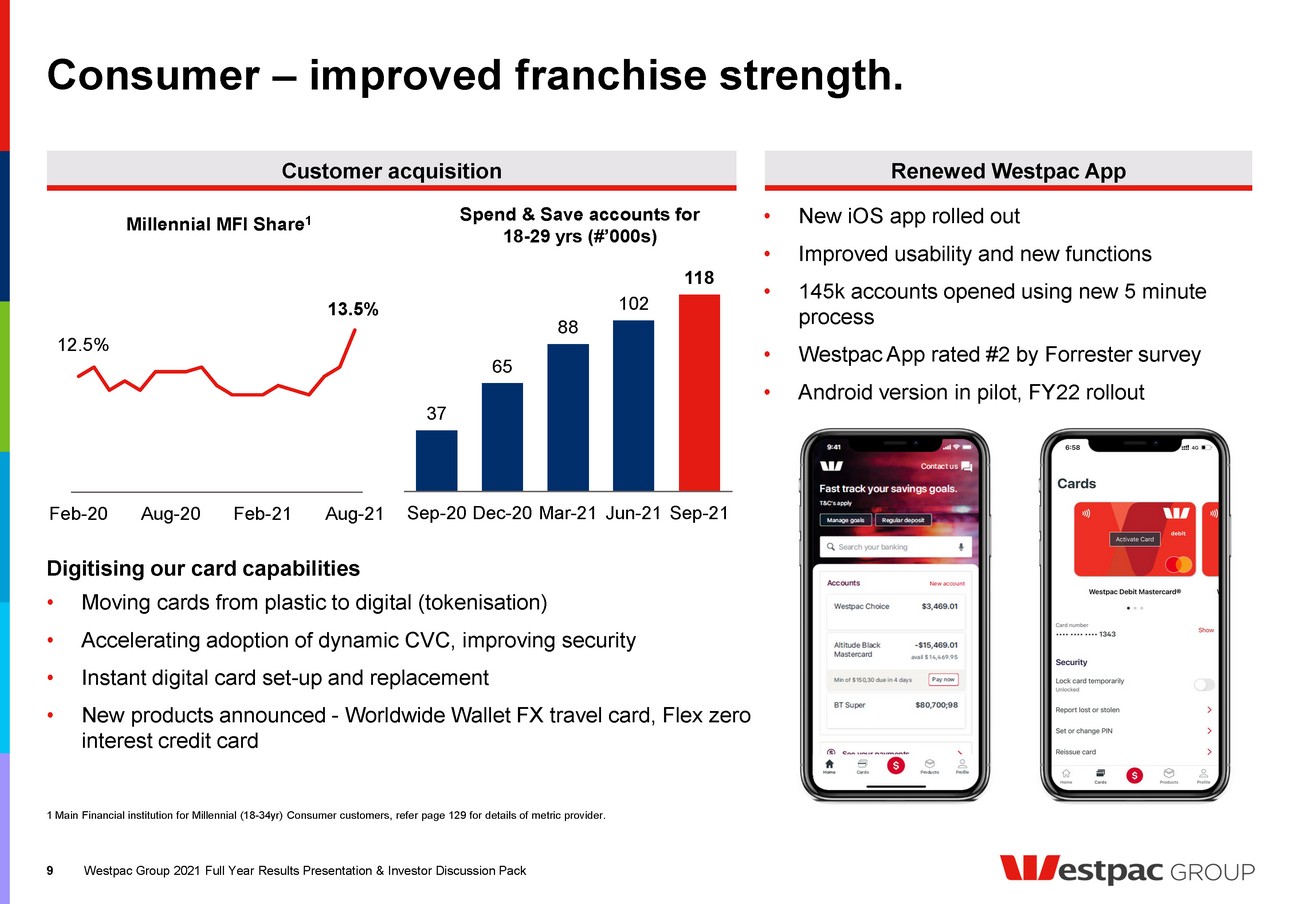
| Consumer – improved franchise strength. 9 Digitising our card capabilities • Moving cards from plastic to digital (tokenisation) • Accelerating adoption of dynamic CVC, improving security • Instant digital card set-up and replacement • New products announced - Worldwide Wallet FX travel card, Flex zero interest credit card 1 Main Financial institution for Millennial (18-34yr) Consumer customers, refer page 129 for details of metric provider. Westpac Group 2021 Full Year Results Presentation & Investor Discussion Pack 9 37 65 88 102 118 Sep-20 Dec-20 Mar-21 Jun-21 Sep-21 Millennial MFI Share1 Spend & Save accounts for 18-29 yrs (#’000s) Customer acquisition Renewed Westpac App • New iOS app rolled out • Improved usability and new functions • 145k accounts opened using new 5 minute process • Westpac App rated #2 by Forrester survey • Android version in pilot, FY22 rollout 12.5% 13.5% Feb-20 Aug-20 Feb-21 Aug-21 |
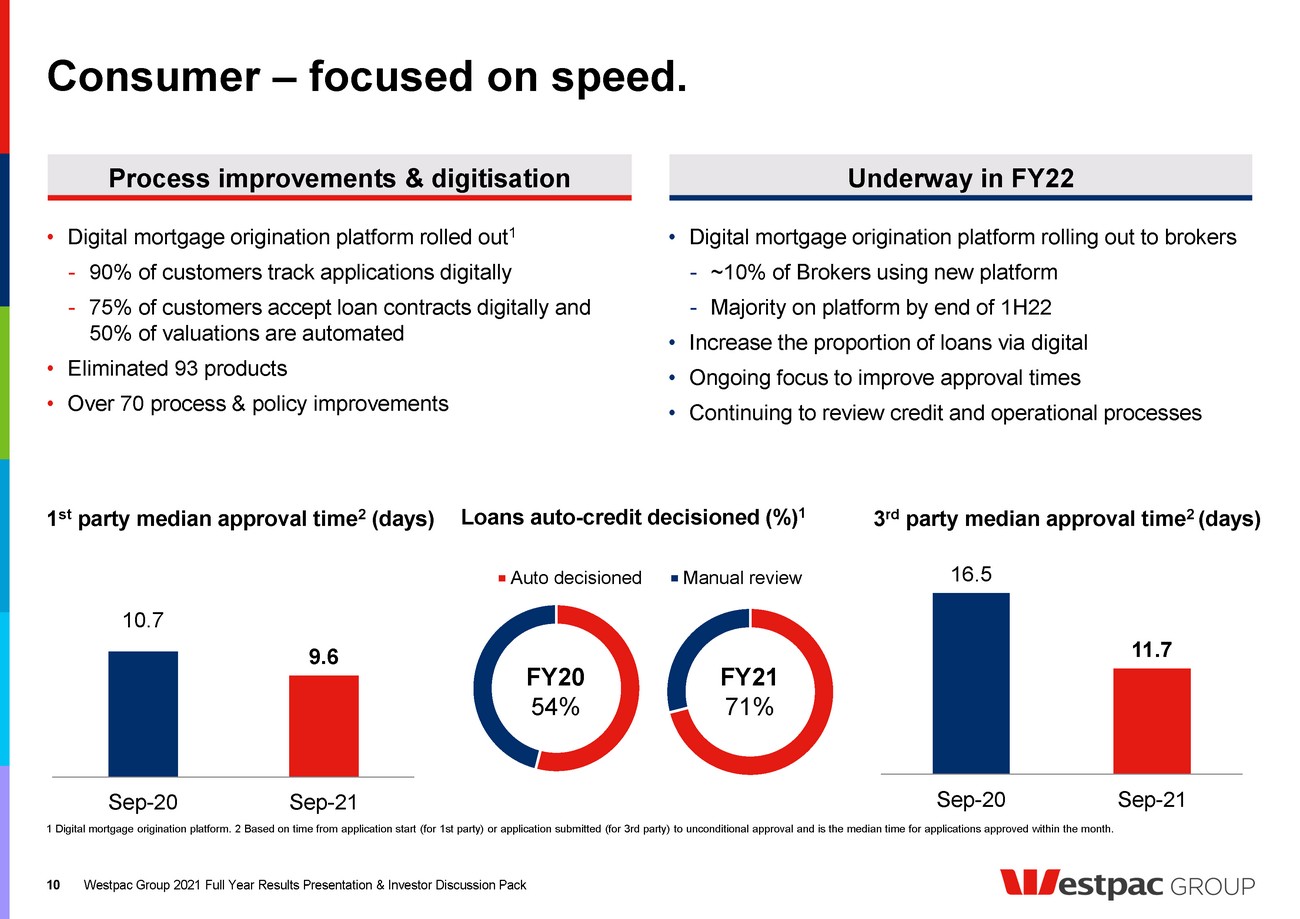
| Auto decisioned Manual review Consumer – focused on speed. 10 1st party median approval time2 (days) 1 Digital mortgage origination platform. 2 Based on time from application start (for 1st party) or application submitted (for 3rd party) to unconditional approval and is the median time for applications approved within the month. Westpac Group 2021 Full Year Results Presentation & Investor Discussion Pack 10 10.7 9.6 Sep-20 Sep-21 Process improvements & digitisation Underway in FY22 • Digital mortgage origination platform rolled out1 - 90% of customers track applications digitally - 75% of customers accept loan contracts digitally and 50% of valuations are automated • Eliminated 93 products • Over 70 process & policy improvements • Digital mortgage origination platform rolling out to brokers - ~10% of Brokers using new platform - Majority on platform by end of 1H22 • Increase the proportion of loans via digital • Ongoing focus to improve approval times • Continuing to review credit and operational processes 16.5 11.7 Sep-20 Sep-21 Loans auto-credit decisioned (%)1 3rd party median approval time2 (days) FY20 54% FY21 71% |
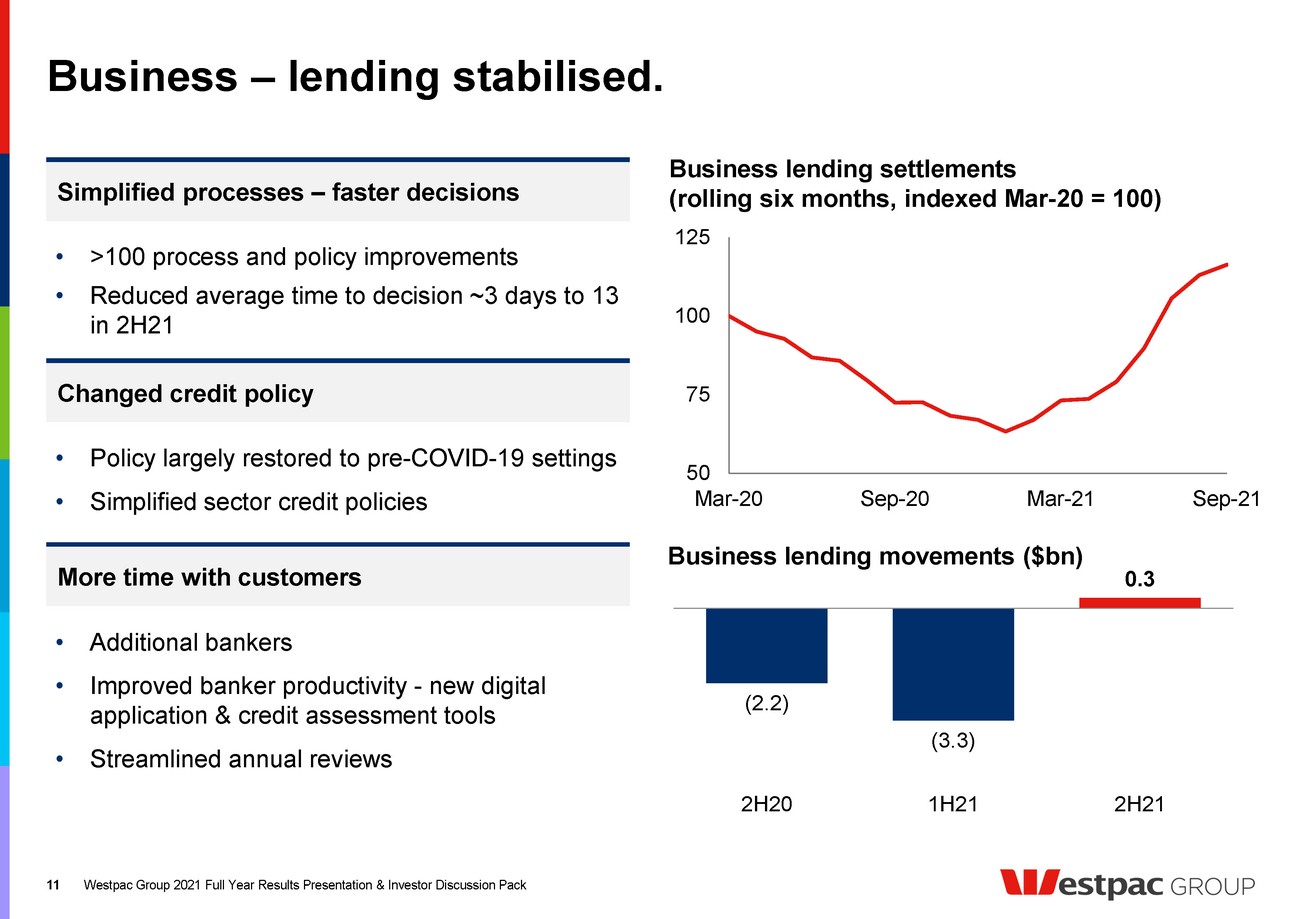
| • >100 process and policy improvements • Reduced average time to decision ~3 days to 13 in 2H21 More time with customers Business – lending stabilised. 11 Business lending settlements (rolling six months, indexed Mar-20 = 100) Westpac Group 2021 Full Year Results Presentation & Investor Discussion Pack 50 75 100 125 Mar-20 Sep-20 Mar-21 Sep-21 (2.2) (3.3) 0.3 2H20 1H21 2H21 Simplified processes – faster decisions Changed credit policy Business lending movements ($bn) • Policy largely restored to pre-COVID-19 settings • Simplified sector credit policies • Additional bankers • Improved banker productivity - new digital application & credit assessment tools • Streamlined annual reviews |
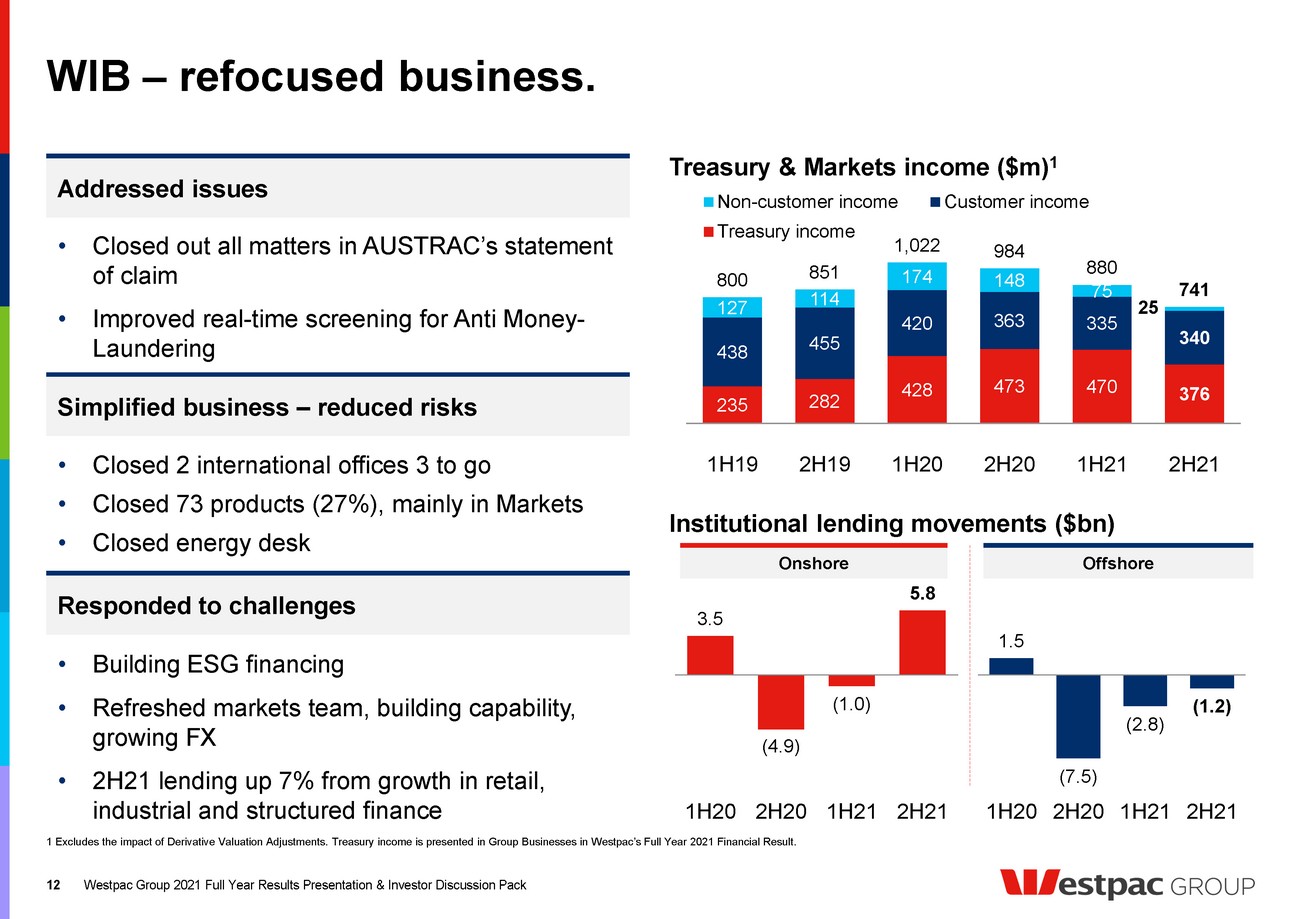
| 3.5 (4.9) (1.0) 5.8 1H20 2H20 1H21 2H21 • Closed out all matters in AUSTRAC’s statement of claim • Improved real-time screening for Anti Money- Laundering WIB – refocused business. 12 Treasury & Markets income ($m)1 1 Excludes the impact of Derivative Valuation Adjustments. Treasury income is presented in Group Businesses in Westpac’s Full Year 2021 Financial Result. Westpac Group 2021 Full Year Results Presentation & Investor Discussion Pack Simplified business – reduced risks 1.5 (7.5) (2.8) (1.2) 1H20 2H20 1H21 2H21 Addressed issues Responded to challenges 235 282 428 473 470 376 438 455 420 363 335 340 127 114 174 148 75 25 800 851 1,022 984 880 741 1H19 2H19 1H20 2H20 1H21 2H21 Non-customer income Customer income Treasury income Institutional lending movements ($bn) Offshore Onshore • Building ESG financing • Refreshed markets team, building capability, growing FX • 2H21 lending up 7% from growth in retail, industrial and structured finance • Closed 2 international offices 3 to go • Closed 73 products (27%), mainly in Markets • Closed energy desk |
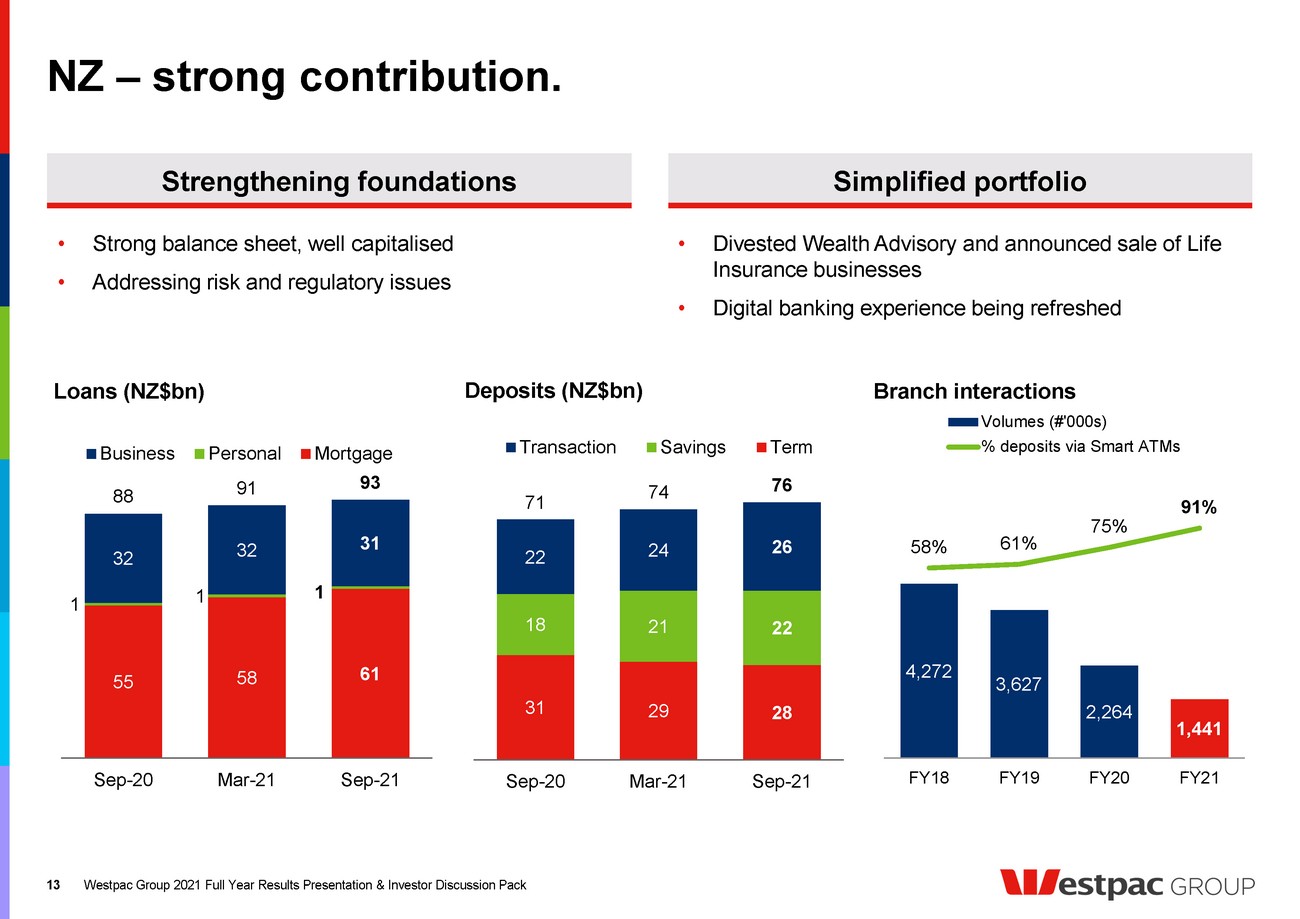
| NZ – strong contribution. 13 Branch interactions Westpac Group 2021 Full Year Results Presentation & Investor Discussion Pack 4,272 3,627 2,264 1,441 58% 61% 75% 91% FY18 FY19 FY20 FY21 Volumes (#'000s) % deposits via Smart ATMs Strengthening foundations Simplified portfolio • Strong balance sheet, well capitalised • Addressing risk and regulatory issues • Divested Wealth Advisory and announced sale of Life Insurance businesses • Digital banking experience being refreshed Loans (NZ$bn) 55 58 61 1 1 1 32 32 31 88 91 93 Sep-20 Mar-21 Sep-21 Business Personal Mortgage 31 29 28 18 21 22 22 24 26 71 74 76 Sep-20 Mar-21 Sep-21 Transaction Savings Term Deposits (NZ$bn) |
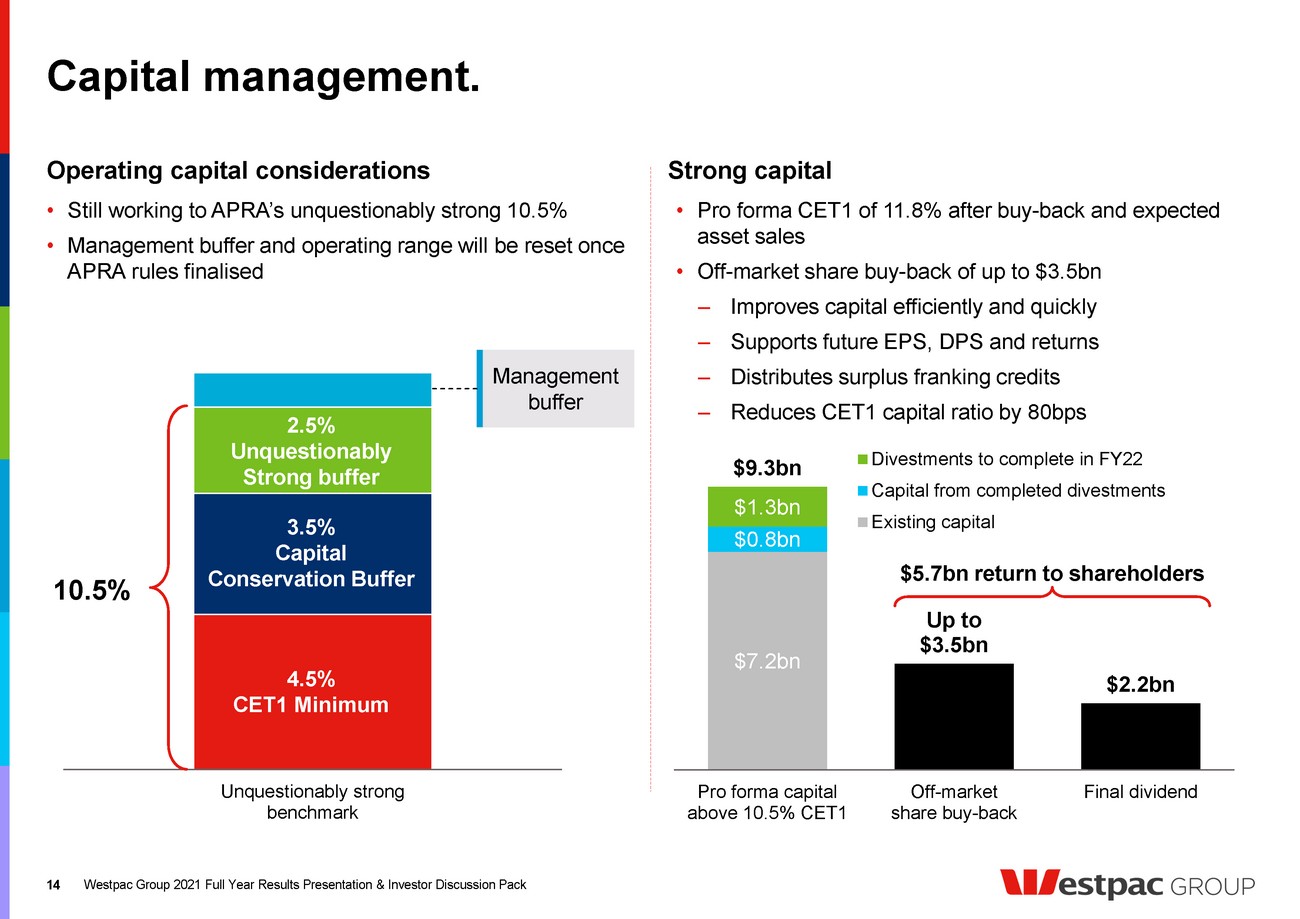
| Capital management. 14 14 • Pro forma CET1 of 11.8% after buy-back and expected asset sales • Off-market share buy-back of up to $3.5bn ‒ Improves capital efficiently and quickly ‒ Supports future EPS, DPS and returns ‒ Distributes surplus franking credits ‒ Reduces CET1 capital ratio by 80bps • Still working to APRA’s unquestionably strong 10.5% • Management buffer and operating range will be reset once APRA rules finalised Operating capital considerations Strong capital $7.2bn $0.8bn $1.3bn $9.3bn Up to $3.5bn $2.2bn Pro forma capital above 10.5% CET1 Off-market share buy-back Final dividend Divestments to complete in FY22 Capital from completed divestments Existing capital Unquestionably strong benchmark 2.5% Unquestionably Strong buffer 3.5% Capital Conservation Buffer 4.5% CET1 Minimum Management buffer 10.5% $5.7bn return to shareholders Westpac Group 2021 Full Year Results Presentation & Investor Discussion Pack |
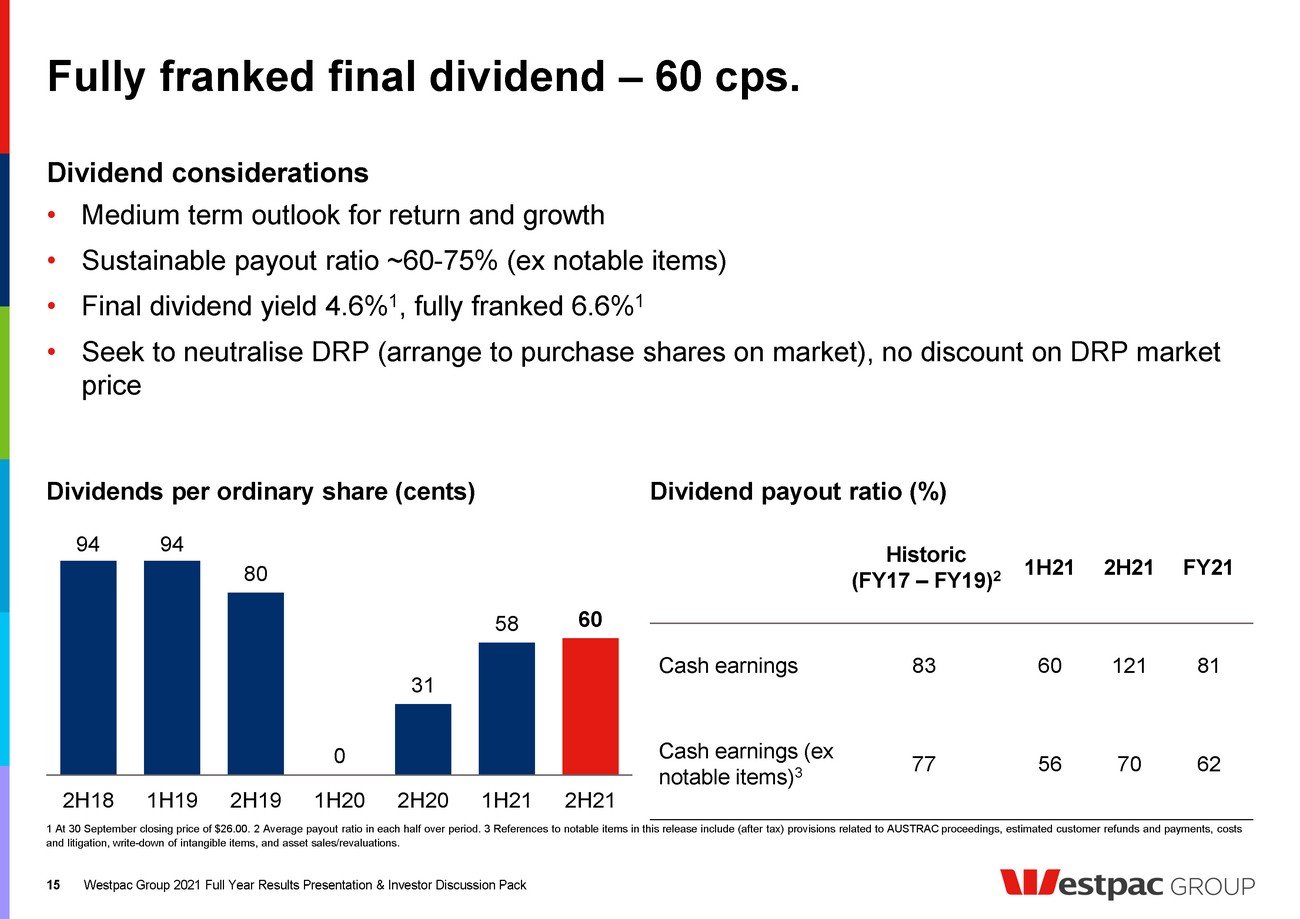
| 94 94 80 0 31 58 60 2H18 1H19 2H19 1H20 2H20 1H21 2H21 Fully franked final dividend – 60 cps. Westpac Group 2021 Full Year Results Presentation & Investor Discussion Pack • Medium term outlook for return and growth • Sustainable payout ratio ~60-75% (ex notable items) • Final dividend yield 4.6% 1, fully franked 6.6% 1 • Seek to neutralise DRP (arrange to purchase shares on market), no discount on DRP market price Dividends per ordinary share (cents) Dividend payout ratio (%) Dividend considerations 1 At 30 September closing price of $26.00. 2 Average payout ratio in each half over period. 3 References to notable items in this release include (after tax) provisions related to AUSTRAC proceedings, estimated customer refunds and payments, costs and litigation, write-down of intangible items, and asset sales/revaluations. Historic (FY17 – FY19) 2 1H21 2H21 FY21 Cash earnings 83 60 121 81 Cash earnings (ex notable items) 3 77 56 70 62 15 15 |
| Financial results throughout this presentation are in Australian dollars and are based on cash earnings unless otherwise stated. Refer page 30 for definition. Results principally cover the 1H20, 2H19 and 1H19 periods. Comparison of 1H20 versus 2H19 (unless otherwise stated). Michael Rowland Chief Financial Officer ,11estpac GROUP |
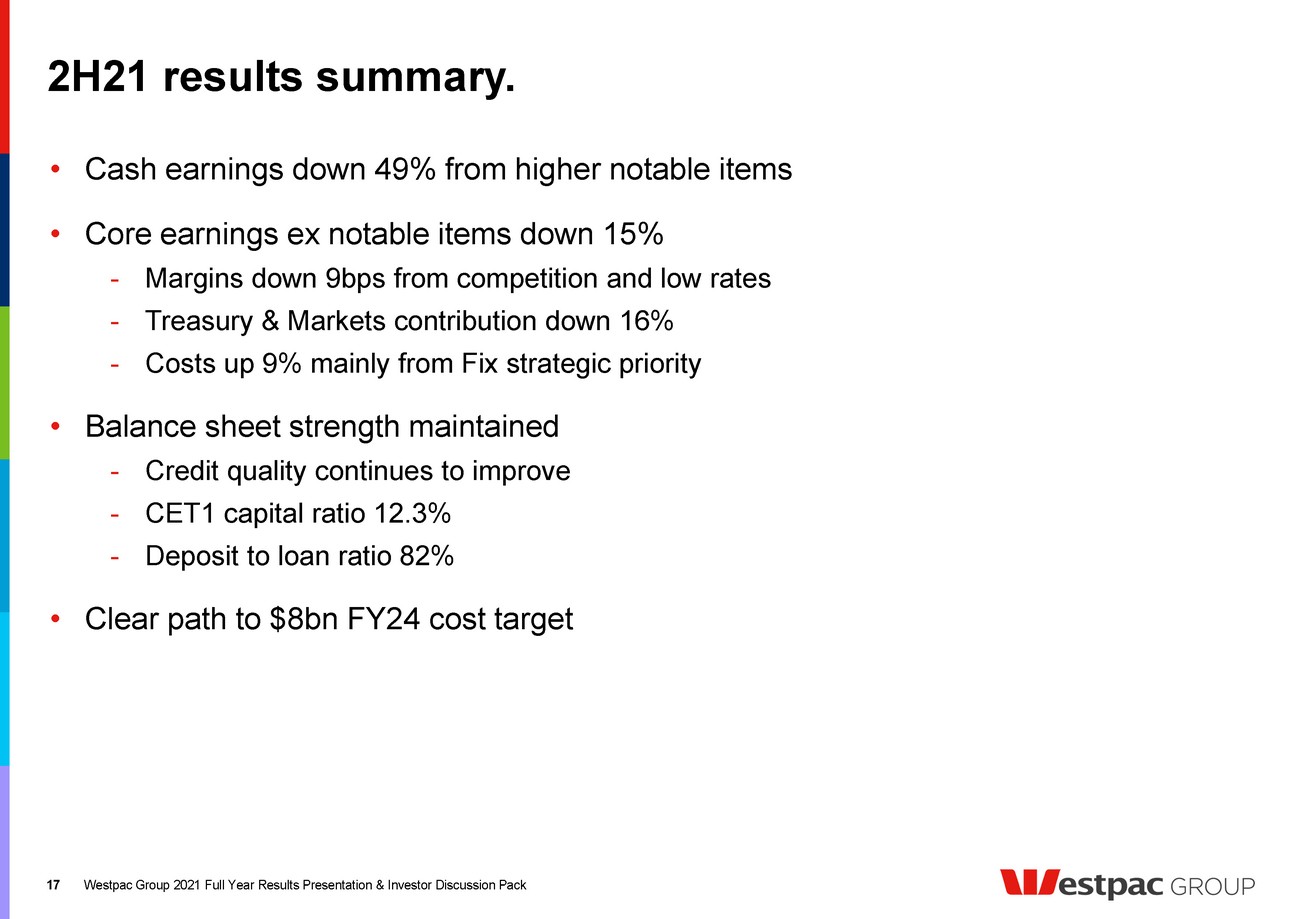
| 2H21 results summary. 17 Westpac Group 2021 Full Year Results Presentation & Investor Discussion Pack • Cash earnings down 49% from higher notable items • Core earnings ex notable items down 15% - Margins down 9bps from competition and low rates - Treasury & Markets contribution down 16% - Costs up 9% mainly from Fix strategic priority • Balance sheet strength maintained - Credit quality continues to improve - CET1 capital ratio 12.3% - Deposit to loan ratio 82% • Clear path to $8bn FY24 cost target ,11estpac GROU P |
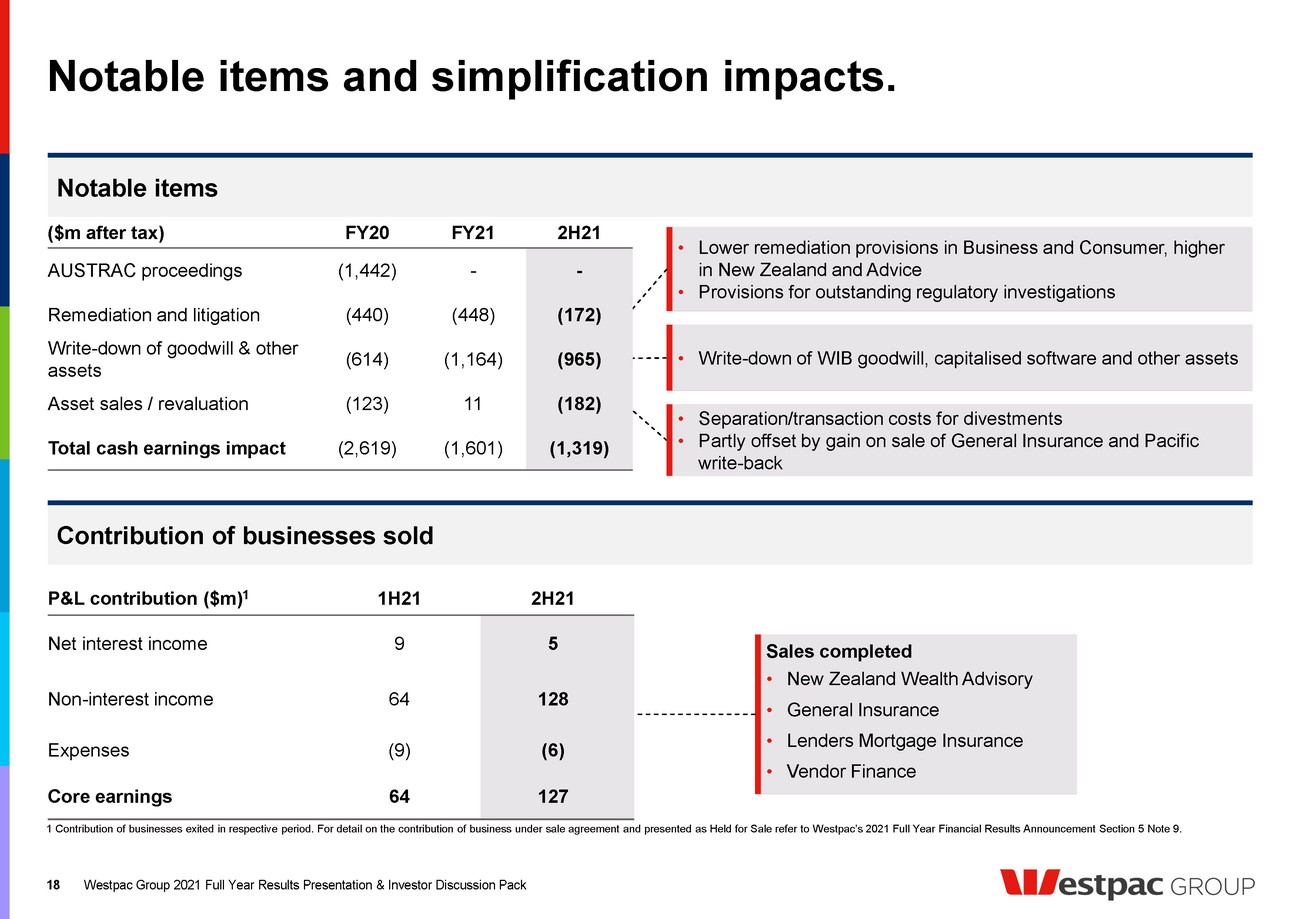
| Notable items and simplification impacts. Westpac Group 2021 Full Year Results Presentation & Investor Discussion Pack Notable items 1 Contribution of businesses exited in respective period. For detail on the contribution of business under sale agreement and presented as Held for Sale refer to Westpac’s 2021 Full Year Financial Results Announcement Section 5 Note 9. 18 • Lower remediation provisions in Business and Consumer, higher in New Zealand and Advice • Provisions for outstanding regulatory investigations • Write-down of WIB goodwill, capitalised software and other assets • Separation/transaction costs for divestments • Partly offset by gain on sale of General Insurance and Pacific write-back ($m after tax) FY20 FY21 2H21 AUSTRAC proceedings (1,442) - - Remediation and litigation (440) (448) (172) Write-down of goodwill & other assets (614) (1,164) (965) Asset sales / revaluation (123) 11 (182) Total cash earnings impact (2,619) (1,601) (1,319) P&L contribution ($m) 1 1H21 2H21 Net interest income 9 5 Non-interest income 64 128 Expenses (9) (6) Core earnings 64 127 Notable items Contribution of businesses sold Sales completed • New Zealand Wealth Advisory • General Insurance • Lenders Mortgage Insurance • Vendor Finance 18 |
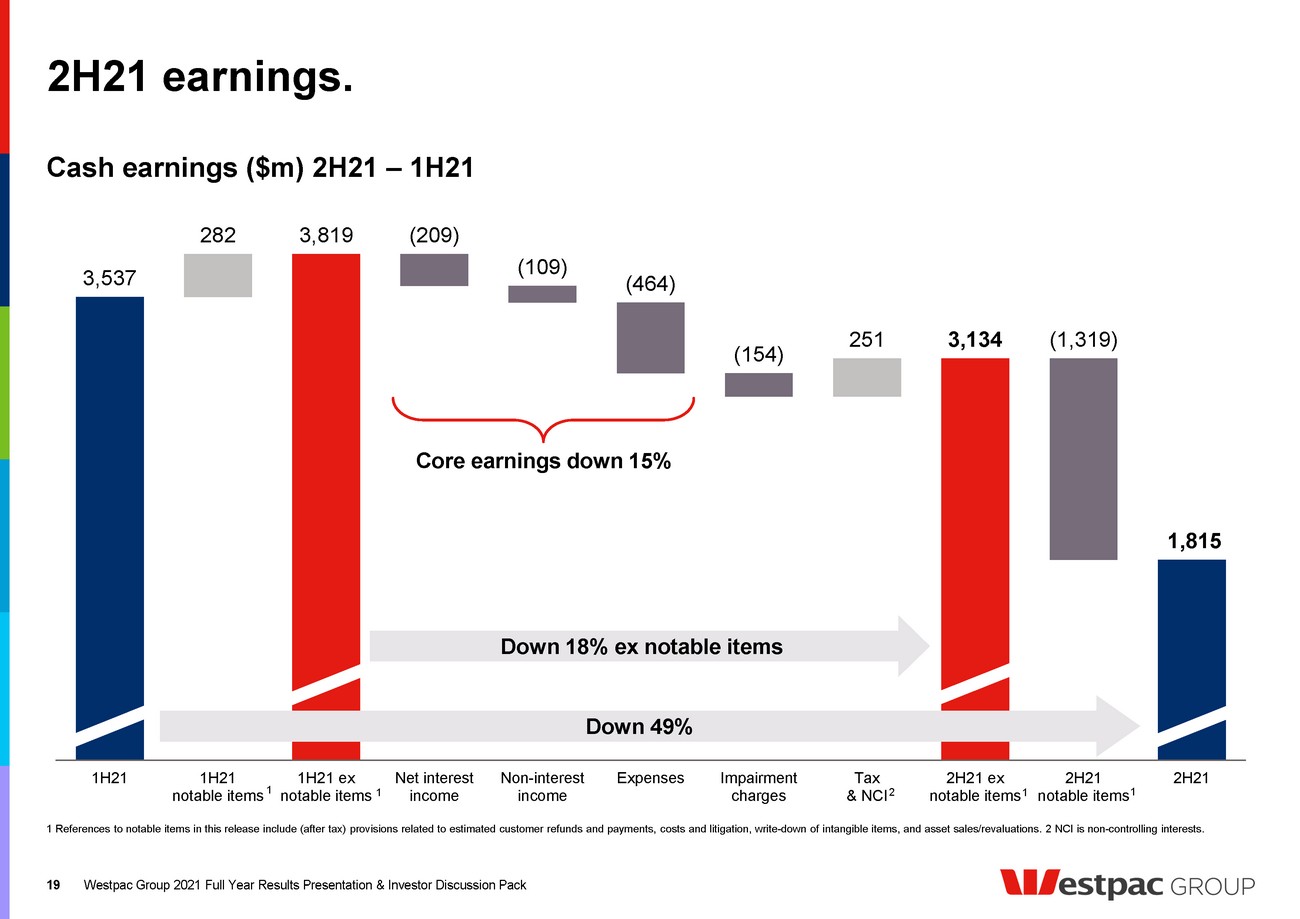
| 3,537 282 3,819 251 3,134 (209) (109) (464) (154) (1,319) 1,815 1H21 1H21 notable items 1H21 ex notable items Net interest income Non-interest income Expenses Impairment charges Tax & NCI 2H21 ex notable items 2H21 notable items 2H21 2H21 earnings. 1 References to notable items in this release include (after tax) provisions related to estimated customer refunds and payments, costs and litigation, write-down of intangible items, and asset sales/revaluations. 2 NCI is non-controlling interests. Westpac Group 2021 Full Year Results Presentation & Investor Discussion Pack Cash earnings ($m) 2H21 – 1H21 Down 18% ex notable items Down 49% 2 1 1 1 1 19 Core earnings down 15% 19 |
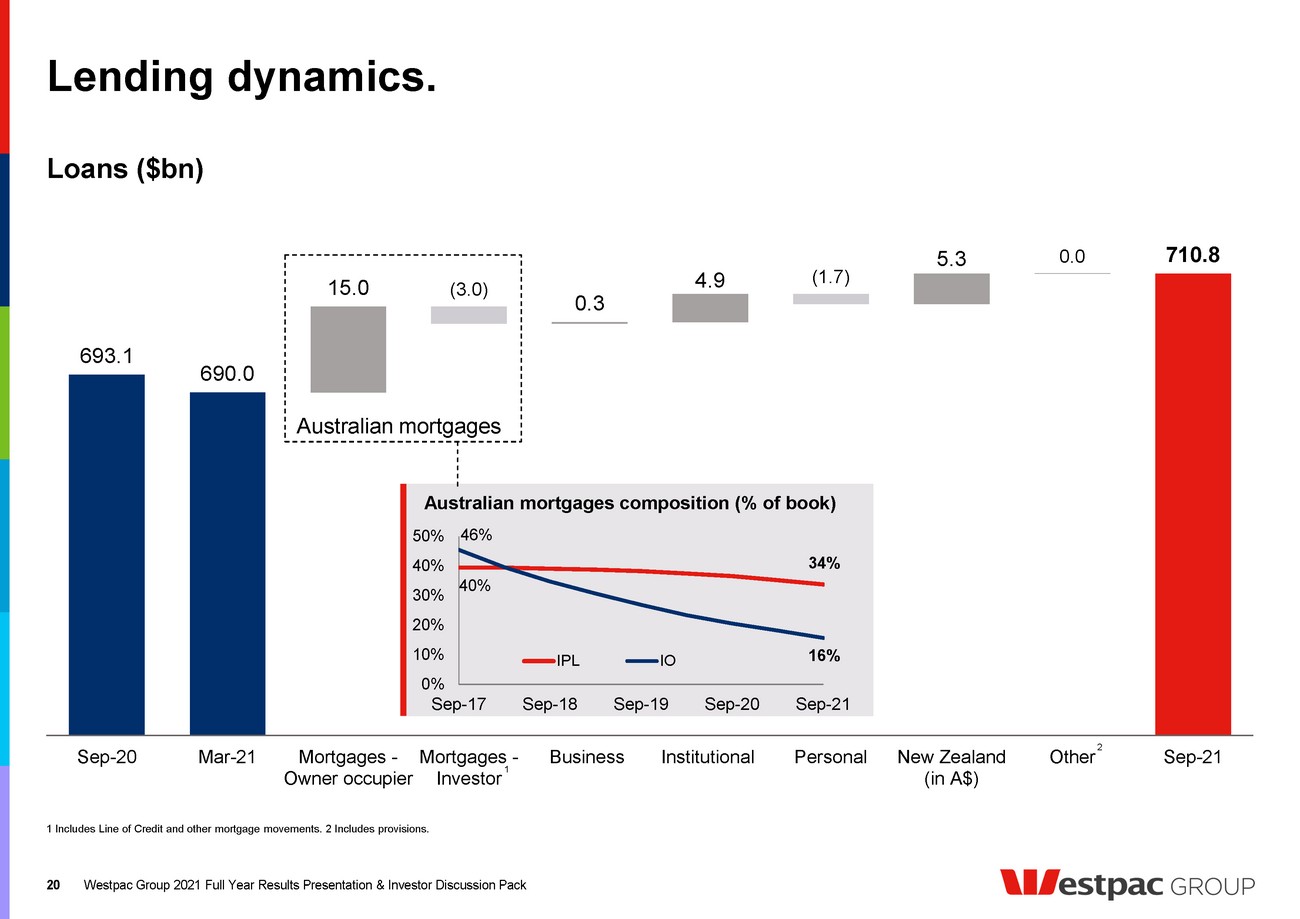
| 693.1 690.0 15.0 0.3 4.9 5.3 710.8 (3.0) (1.7) 0.0 Sep-20 Mar-21 Mortgages - Owner occupier Mortgages - Investor Business Institutional Personal New Zealand (in A$) Other Sep-21 Lending dynamics. Westpac Group 2021 Full Year Results Presentation & Investor Discussion Pack Loans ($bn) 1 Includes Line of Credit and other mortgage movements. 2 Includes provisions. 20 20 Australian mortgages composition (% of book) 40% 34% 46% 16% 0% 10% 20% 30% 40% 50% Sep-17 Sep-18 Sep-19 Sep-20 Sep-21 IPL IO 1 Australian mortgages 2 |
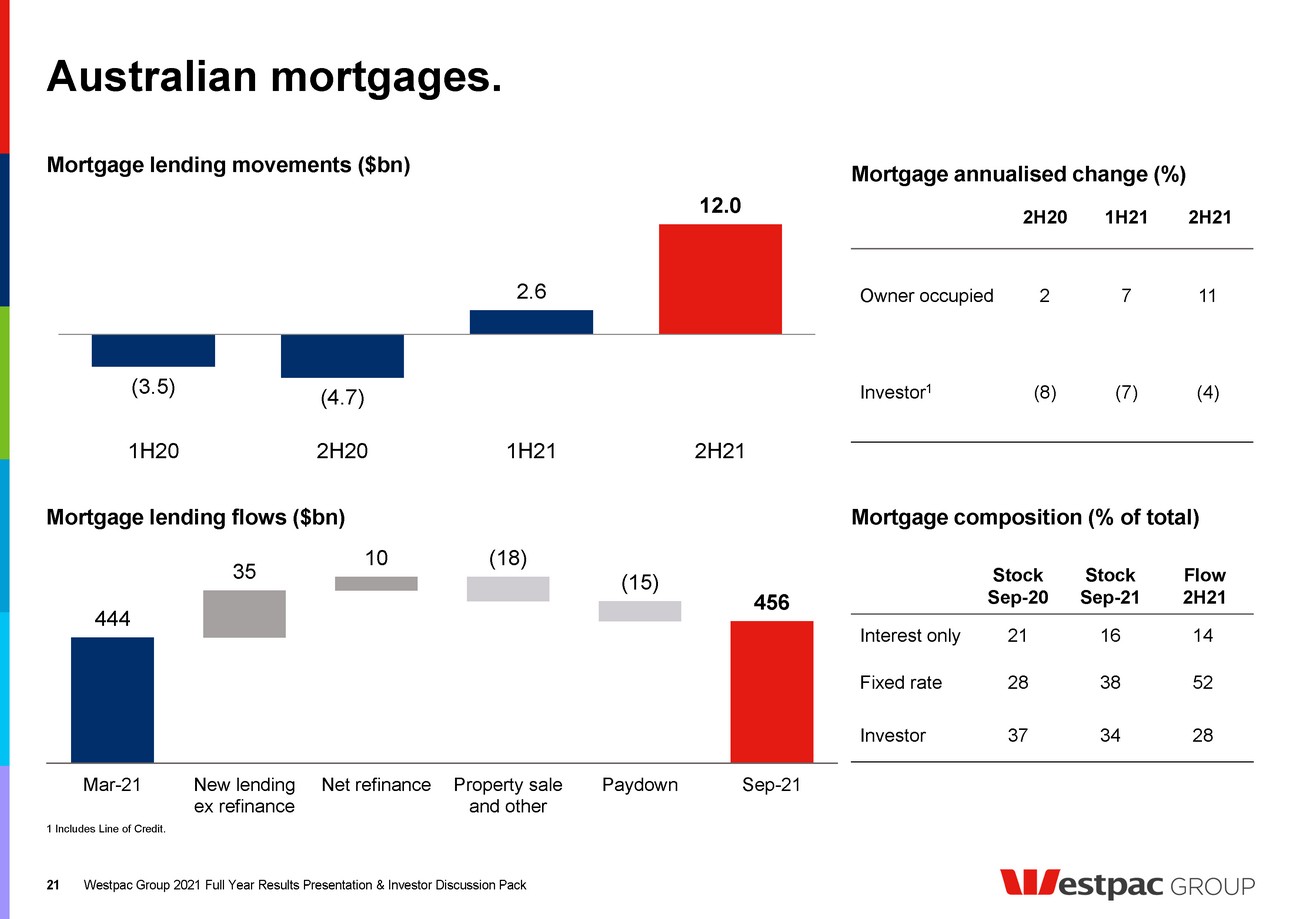
| 444 35 10 456 (18) (15) Mar-21 New lending ex refinance Net refinance Property sale and other Paydown Sep-21 Australian mortgages. Westpac Group 2021 Full Year Results Presentation & Investor Discussion Pack Mortgage lending flows ($bn) Mortgage lending movements ($bn) 1 Includes Line of Credit. 21 Stock Sep-20 Stock Sep-21 Flow 2H21 Interest only 21 16 14 Fixed rate 28 38 52 Investor 37 34 28 Mortgage composition (% of total) 21 (3.5) (4.7) 2.6 12.0 1H20 2H20 1H21 2H21 2H20 1H21 2H21 Owner occupied 2 7 11 Investor 1 (8) (7) (4) Mortgage annualised change (%) |
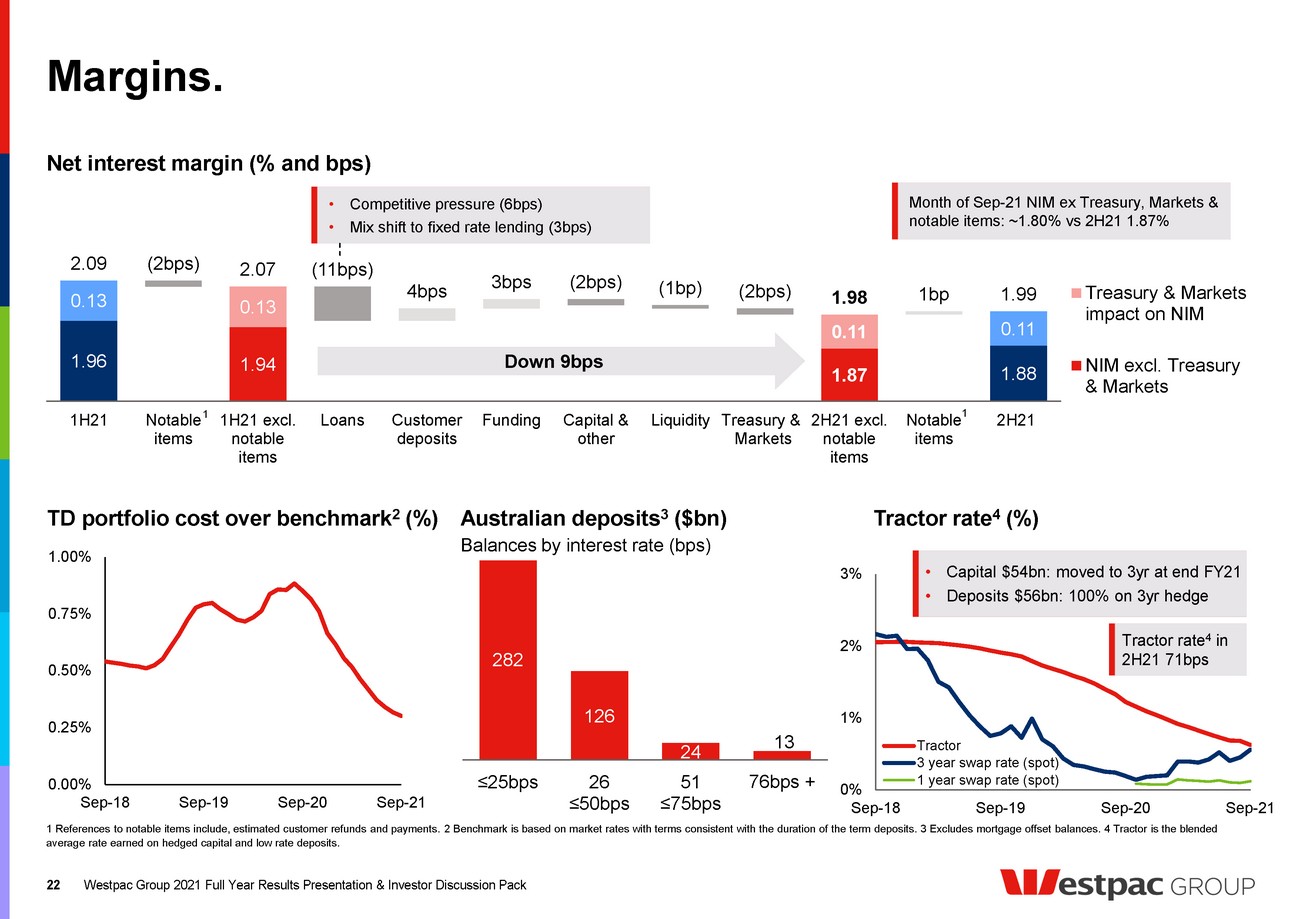
| 1.96 1.94 1.87 1.88 0.13 0.13 0.11 0.11 2.09 (2bps) 2.07 (11bps) 4bps 3bps (2bps) (1bp) (2bps) 1.98 1bp 1.99 1H21 Notable items 1H21 excl. notable items Loans Customer deposits Funding Capital & other Liquidity Treasury & Markets 2H21 excl. notable items Notable items 2H21 Treasury & Markets impact on NIM NIM excl. Treasury & Markets 0% 1% 2% 3% Sep-18 Sep-19 Sep-20 Sep-21 Tractor 3 year swap rate (spot) 1 year swap rate (spot) Margins. Westpac Group 2021 Full Year Results Presentation & Investor Discussion Pack Net interest margin (% and bps) Tractor rate 4 (%) 1 References to notable items include, estimated customer refunds and payments. 2 Benchmark is based on market rates with terms consistent with the duration of the term deposits. 3 Excludes mortgage offset balances. 4 Tractor is the blended average rate earned on hedged capital and low rate deposits. Down 9bps • Capital $54bn: moved to 3yr at end FY21 • Deposits $56bn: 100% on 3yr hedge 22 Month of Sep-21 NIM ex Treasury, Markets & notable items: ~1.80% vs 2H21 1.87% 1 1 22 • Competitive pressure (6bps) • Mix shift to fixed rate lending (3bps) Tractor rate 4 in 2H21 71bps Australian deposits 3 ($bn) TD portfolio cost over benchmark 2 (%) 0.00% 0.25% 0.50% 0.75% 1.00% Sep-18 Sep-19 Sep-20 Sep-21 282 126 24 13 ≤25bps 26 ≤50bps 51 ≤75bps 76bps + Balances by interest rate (bps) |
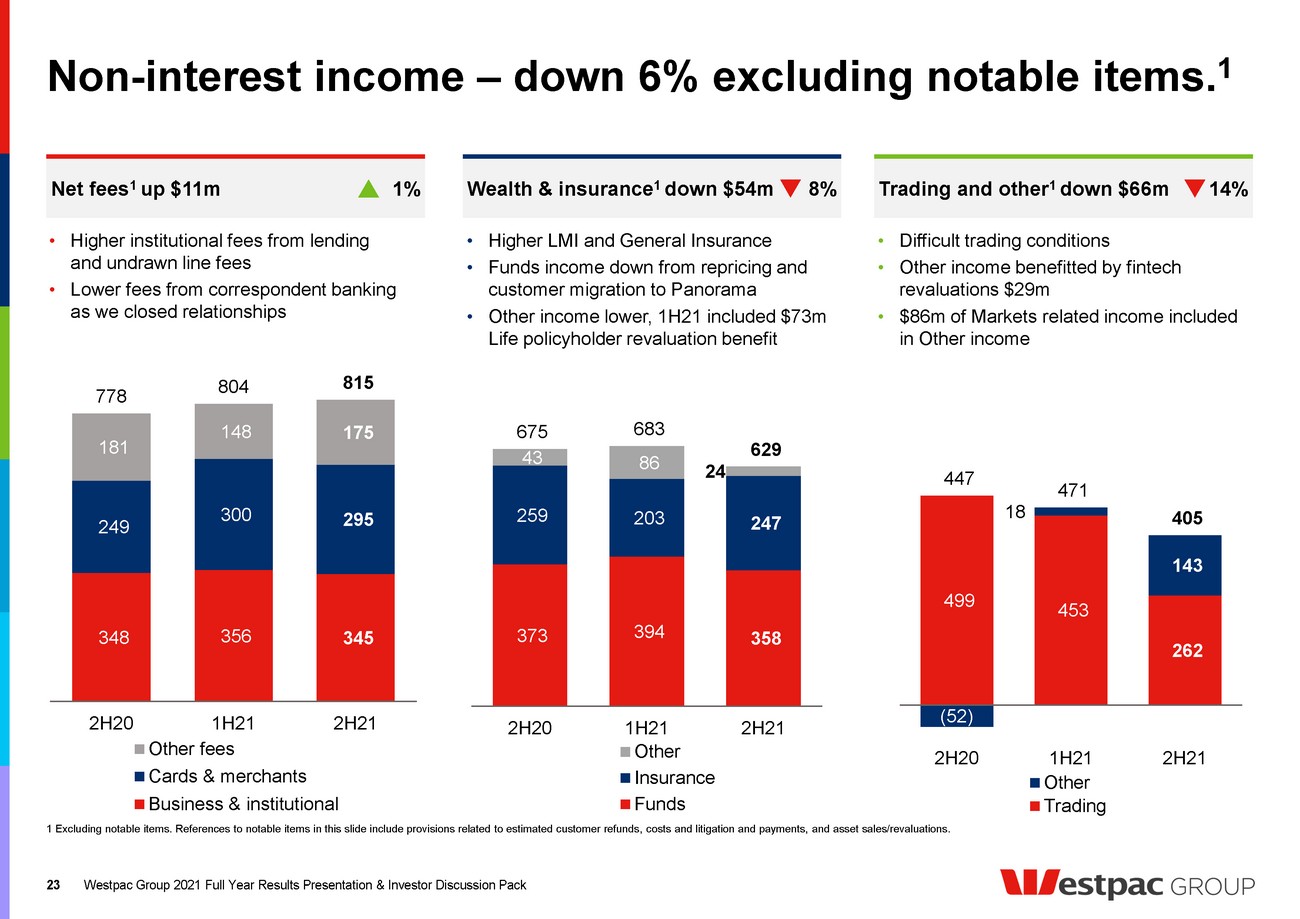
| 499 453 262 (52) 18 143 447 471 405 2H20 1H21 2H21 Other Trading 348 356 345 249 300 295 181 148 175 778 804 815 2H20 1H21 2H21 Other fees Cards & merchants Business & institutional 373 394 358 259 203 247 43 86 24 675 683 629 2H20 1H21 2H21 Other Insurance Funds Non-interest income – down 6% excluding notable items. 1 Westpac Group 2021 Full Year Results Presentation & Investor Discussion Pack • Higher LMI and General Insurance • Funds income down from repricing and customer migration to Panorama • Other income lower, 1H21 included $73m Life policyholder revaluation benefit • Difficult trading conditions • Other income benefitted by fintech revaluations $29m • $86m of Markets related income included in Other income • Higher institutional fees from lending and undrawn line fees • Lower fees from correspondent banking as we closed relationships 1 Excluding notable items. References to notable items in this slide include provisions related to estimated customer refunds, costs and litigation and payments, and asset sales/revaluations. 23 Net fees 1 up $11m 1% Wealth & insurance 1 down $54m 8% Trading and other 1 down $66m 14% 23 |
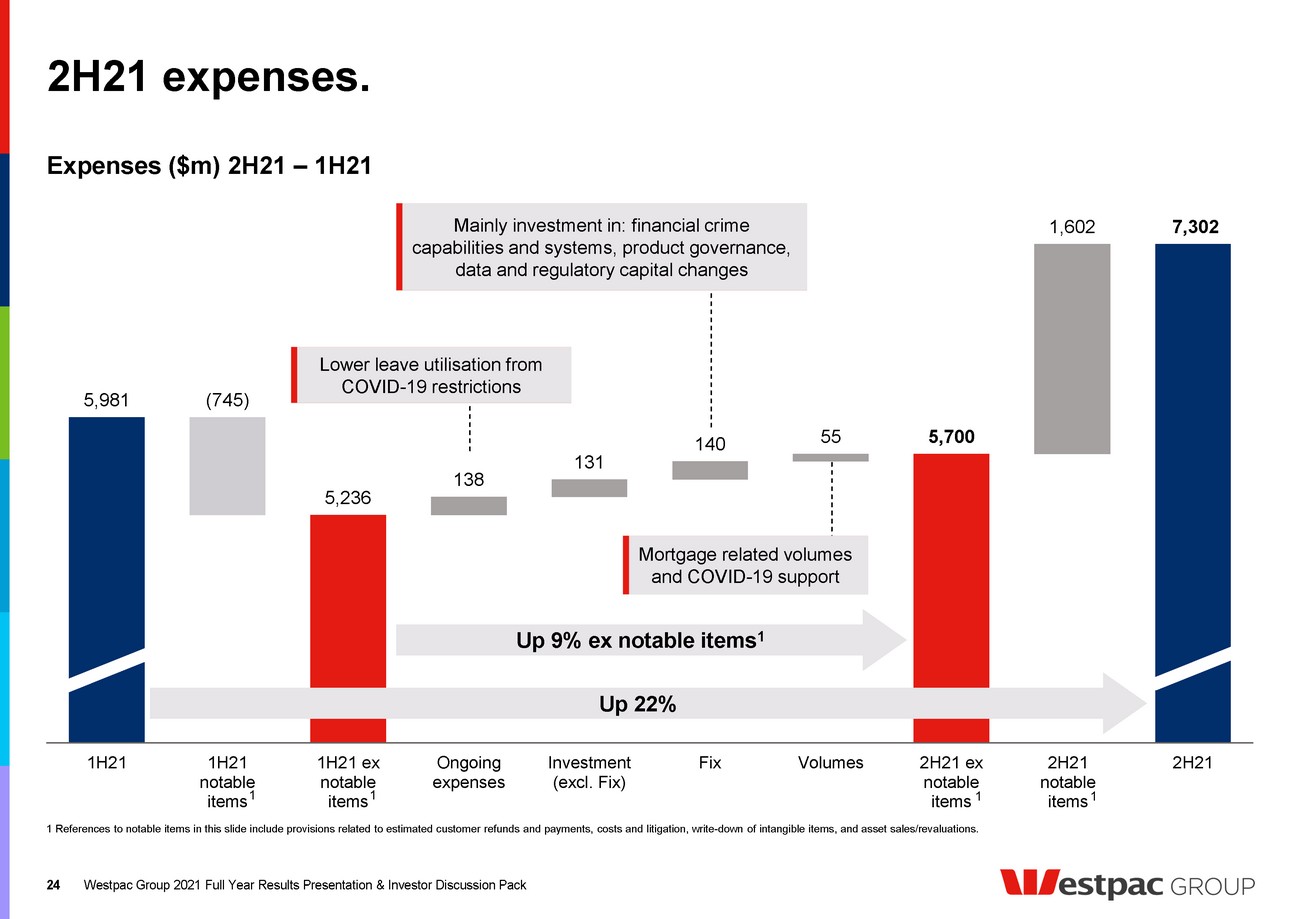
| 5,981 5,236 138 131 140 55 5,700 1,602 (745) 7,302 1H21 1H21 notable items 1H21 ex notable items Ongoing expenses Investment (excl. Fix) Fix Volumes 2H21 ex notable items 2H21 notable items 2H21 2H21 expenses. 1 References to notable items in this slide include provisions related to estimated customer refunds and payments, costs and litigation, write-down of intangible items, and asset sales/revaluations. Westpac Group 2021 Full Year Results Presentation & Investor Discussion Pack Expenses ($m) 2H21 – 1H21 Up 9% ex notable items 1 1 24 1 1 Up 22% 1 24 Lower leave utilisation from COVID-19 restrictions Mainly investment in: financial crime capabilities and systems, product governance, data and regulatory capital changes Mortgage related volumes and COVID-19 support |
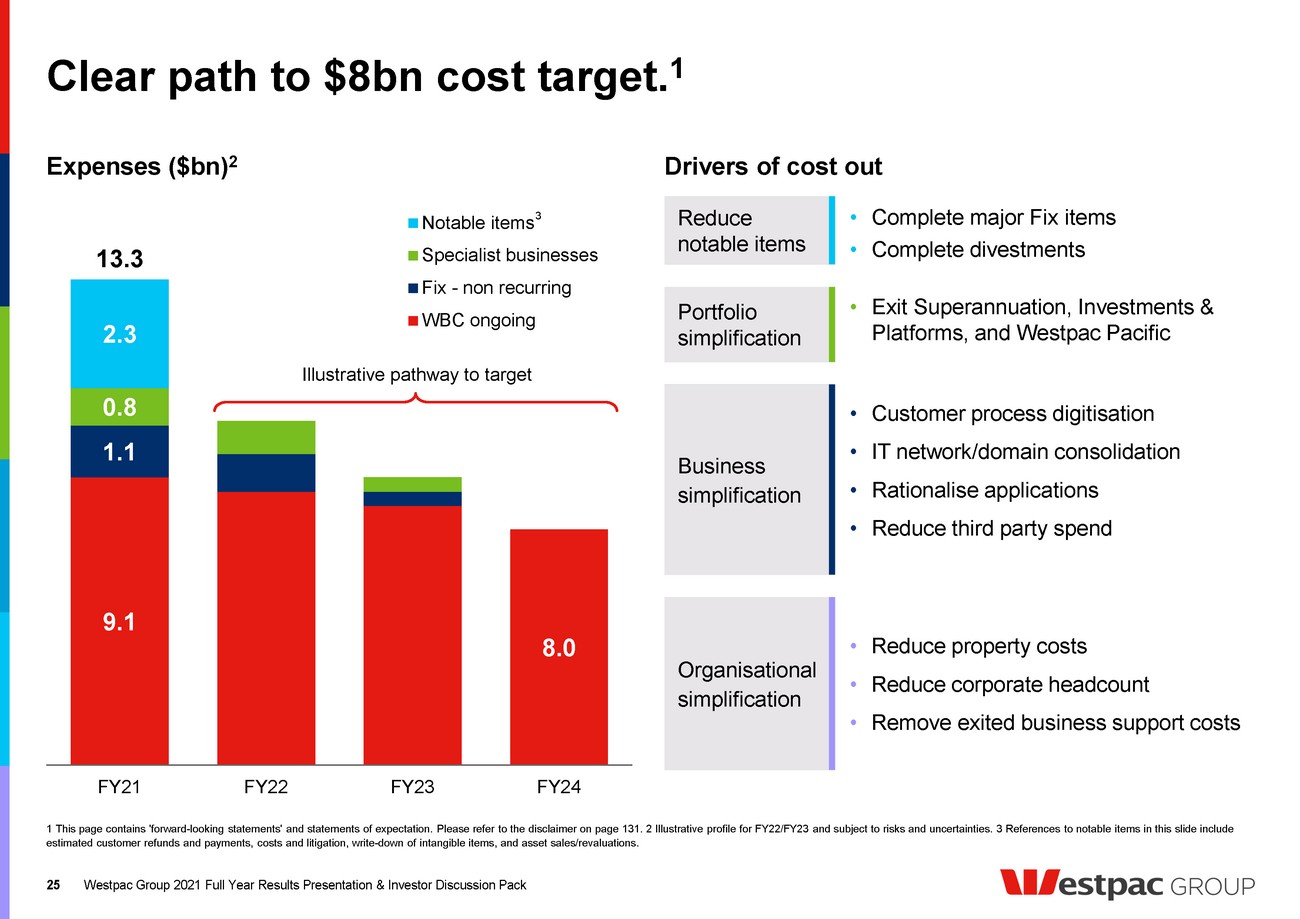
| Clear path to $8bn cost target. 1 Westpac Group 2021 Full Year Results Presentation & Investor Discussion Pack 1 This page contains 'forward-looking statements' and statements of expectation. Please refer to the disclaimer on page 131. 2 Illustrative profile for FY22/FY23 and subject to risks and uncertainties. 3 References to notable items in this slide include estimated customer refunds and payments, costs and litigation, write-down of intangible items, and asset sales/revaluations. Expenses ($bn) 2 25 Drivers of cost out • Complete major Fix items • Complete divestments • Exit Superannuation, Investments & Platforms, and Westpac Pacific • Customer process digitisation • IT network/domain consolidation • Rationalise applications • Reduce third party spend • Reduce property costs • Reduce corporate headcount • Remove exited business support costs Portfolio simplification Business simplification Organisational simplification 25 9.1 8.0 1.1 0.8 2.3 13.3 FY21 FY22 FY23 FY24 Notable items Specialist businesses Fix - non recurring WBC ongoing Reduce notable items 3 Illustrative pathway to target |
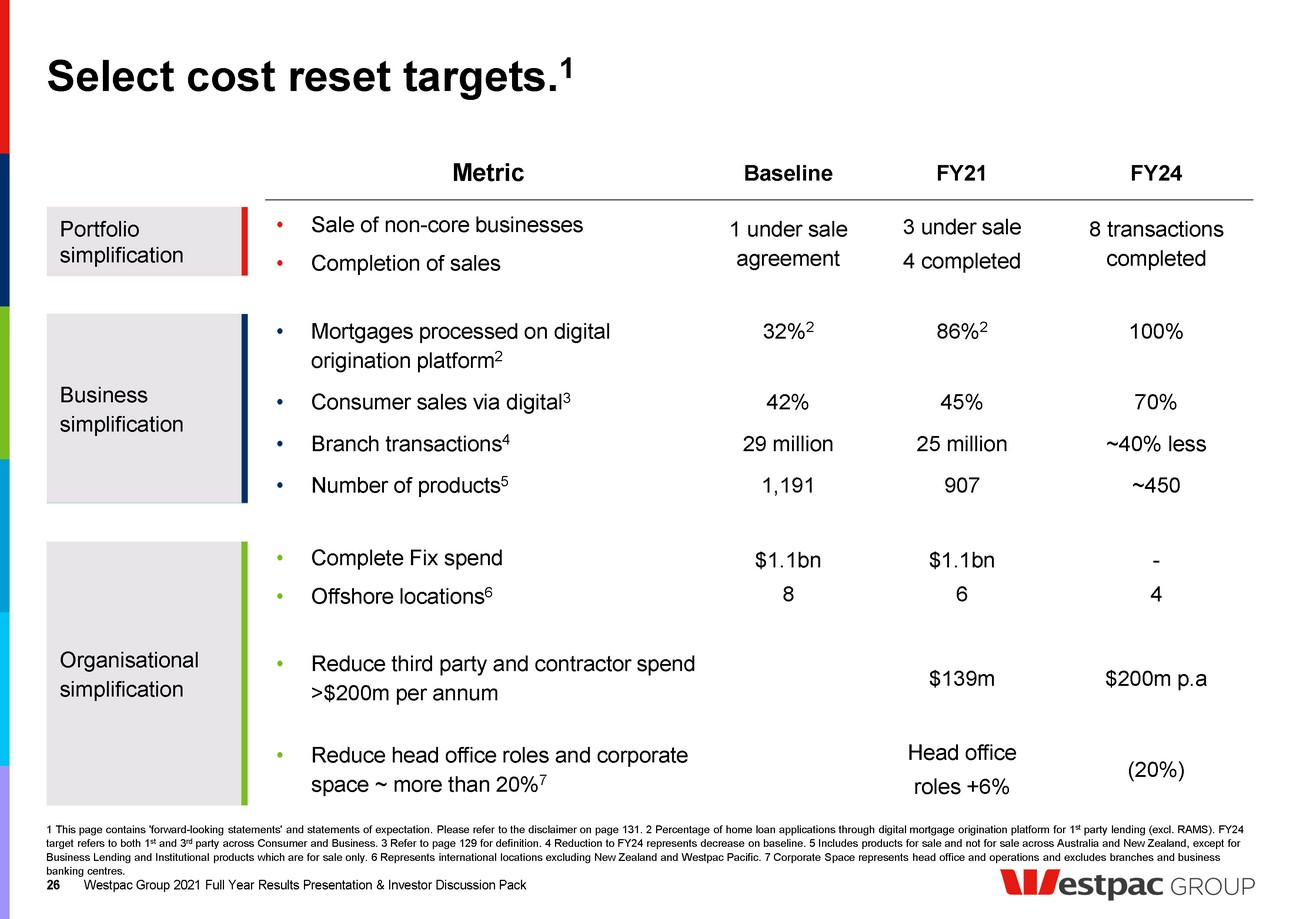
| Select cost reset targets. 1 Westpac Group 2021 Full Year Results Presentation & Investor Discussion Pack 1 This page contains 'forward-looking statements' and statements of expectation. Please refer to the disclaimer on page 131. 2 Percentage of home loan applications through digital mortgage origination platform for 1 st party lending (excl. RAMS). FY24 target refers to both 1 st and 3 rd party across Consumer and Business. 3 Refer to page 129 for definition. 4 Reduction to FY24 represents decrease on baseline. 5 Includes products for sale and not for sale across Australia and New Zealand, except for Business Lending and Institutional products which are for sale only. 6 Represents international locations excluding New Zealand and Westpac Pacific. 7 Corporate Space represents head office and operations and excludes branches and business banking centres. Metric Baseline FY21 FY24 • Sale of non-core businesses • Completion of sales 1 under sale agreement 3 under sale 4 completed 8 transactions completed • Mortgages processed on digital origination platform 2 • Consumer sales via digital 3 • Branch transactions 4 • Number of products 5 32% 2 42% 29 million 1,191 86% 2 45% 25 million 907 100% 70% ~40% less ~450 • Complete Fix spend • Offshore locations 6 $1.1bn 8 $1.1bn 6 - 4 • Reduce third party and contractor spend >$200m per annum $139m $200m p.a • Reduce head office roles and corporate space ~ more than 20% 7 Head office roles +6% (20%) 26 Portfolio simplification Business simplification Organisational simplification 26 |
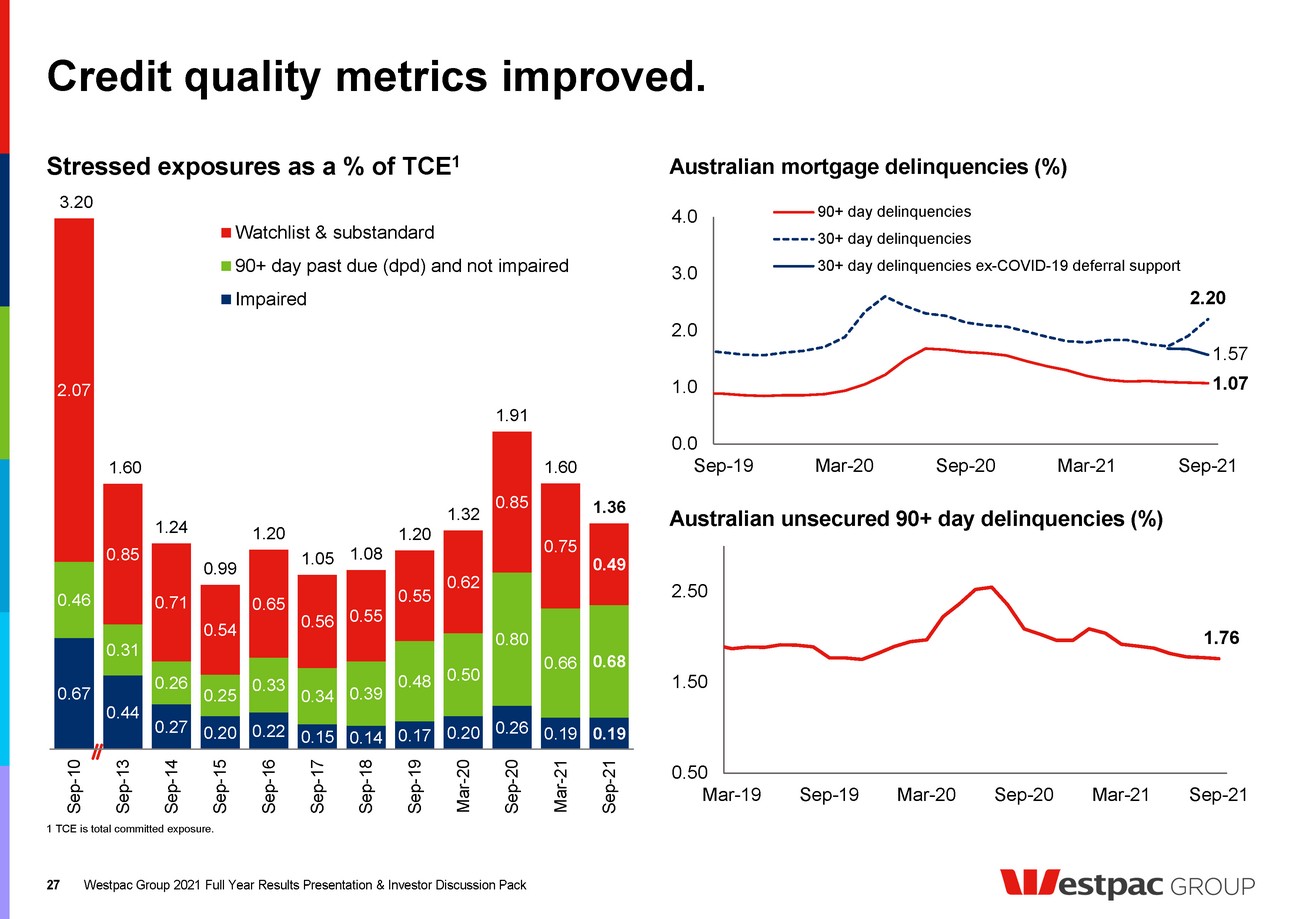
| Credit quality metrics improved. Westpac Group 2021 Full Year Results Presentation & Investor Discussion Pack 1 TCE is total committed exposure. Stressed exposures as a % of TCE 1 Australian mortgage delinquencies (%) Australian unsecured 90+ day delinquencies (%) 27 0.67 0.44 0.27 0.20 0.22 0.15 0.14 0.17 0.20 0.26 0.19 0.19 0.46 0.31 0.26 0.25 0.33 0.34 0.39 0.48 0.50 0.80 0.66 0.68 2.07 0.85 0.71 0.54 0.65 0.56 0.55 0.55 0.62 0.85 0.75 0.49 3.20 1.60 1.24 0.99 1.20 1.05 1.08 1.20 1.32 1.91 1.60 1.36 Sep-10 Sep-13 Sep-14 Sep-15 Sep-16 Sep-17 Sep-18 Sep-19 Mar-20 Sep-20 Mar-21 Sep-21 Watchlist & substandard 90+ day past due (dpd) and not impaired Impaired 27 1.76 0.50 1.50 2.50 Mar-19 Sep-19 Mar-20 Sep-20 Mar-21 Sep-21 1.07 2.20 1.57 0.0 1.0 2.0 3.0 4.0 Sep-19 Mar-20 Sep-20 Mar-21 Sep-21 90+ day delinquencies 30+ day delinquencies 30+ day delinquencies ex-COVID-19 deferral support |
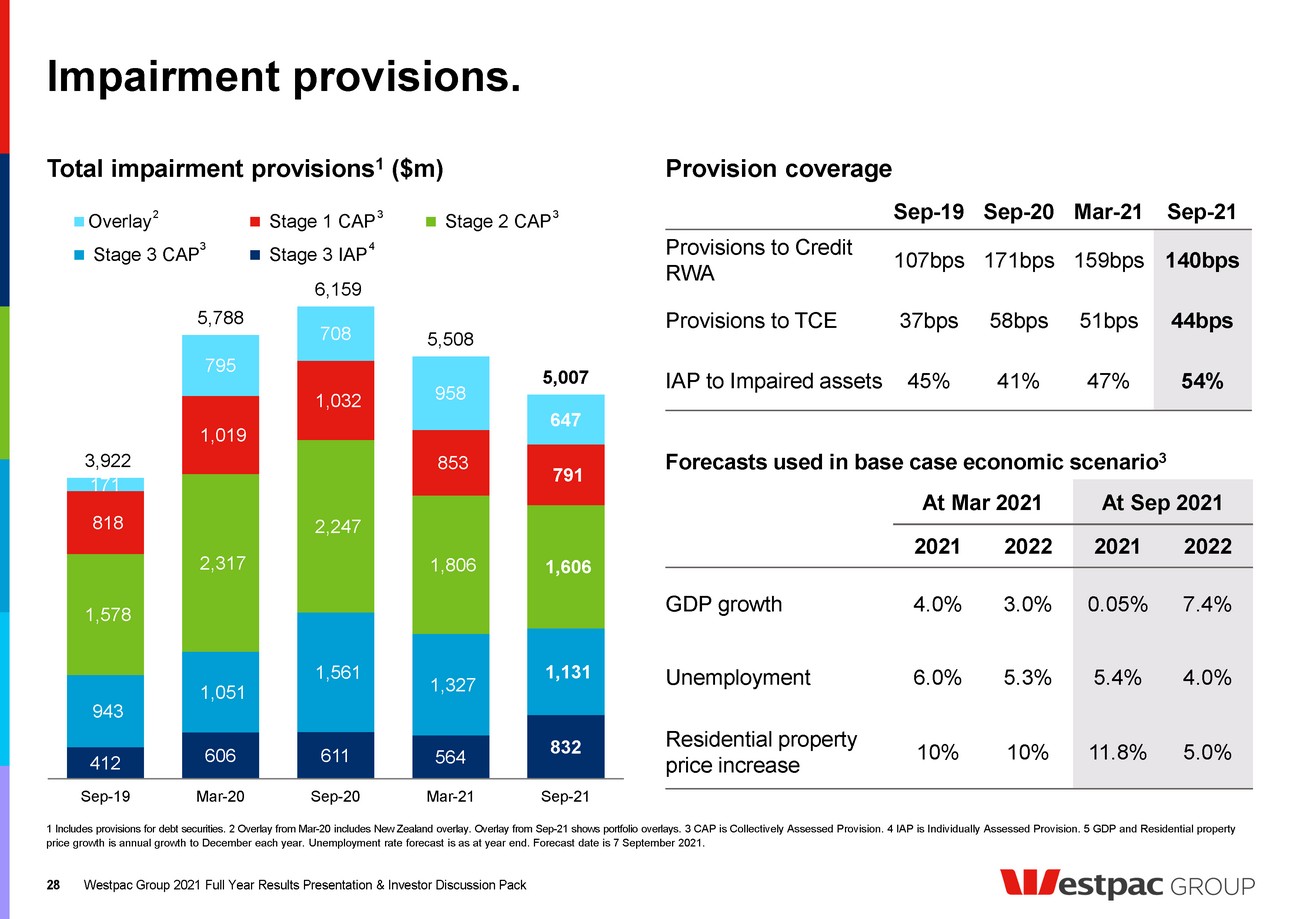
| Impairment provisions. Westpac Group 2021 Full Year Results Presentation & Investor Discussion Pack At Mar 2021 At Sep 2021 2021 2022 2021 2022 GDP growth 4.0% 3.0% 0.05% 7.4% Unemployment 6.0% 5.3% 5.4% 4.0% Residential property price increase 10% 10% 11.8% 5.0% Forecasts used in base case economic scenario 3 1 Includes provisions for debt securities. 2 Overlay from Mar-20 includes New Zealand overlay. Overlay from Sep-21 shows portfolio overlays. 3 CAP is Collectively Assessed Provision. 4 IAP is Individually Assessed Provision. 5 GDP and Residential property price growth is annual growth to December each year. Unemployment rate forecast is as at year end. Forecast date is 7 September 2021. 28 Total impairment provisions 1 ($m) Provision coverage Sep-19 Sep-20 Mar-21 Sep-21 Provisions to Credit RWA 107bps 171bps 159bps 140bps Provisions to TCE 37bps 58bps 51bps 44bps IAP to Impaired assets 45% 41% 47% 54% 28 412 606 611 564 832 943 1,051 1,561 1,327 1,131 1,578 2,317 2,247 1,806 1,606 818 1,019 1,032 853 791 171 795 708 958 647 3,922 5,788 6,159 5,508 5,007 Sep-19 Mar-20 Sep-20 Mar-21 Sep-21 Overlay Stage 1 CAP Stage 2 CAP Stage 3 CAP Stage 3 IAP 3 3 3 4 2 |
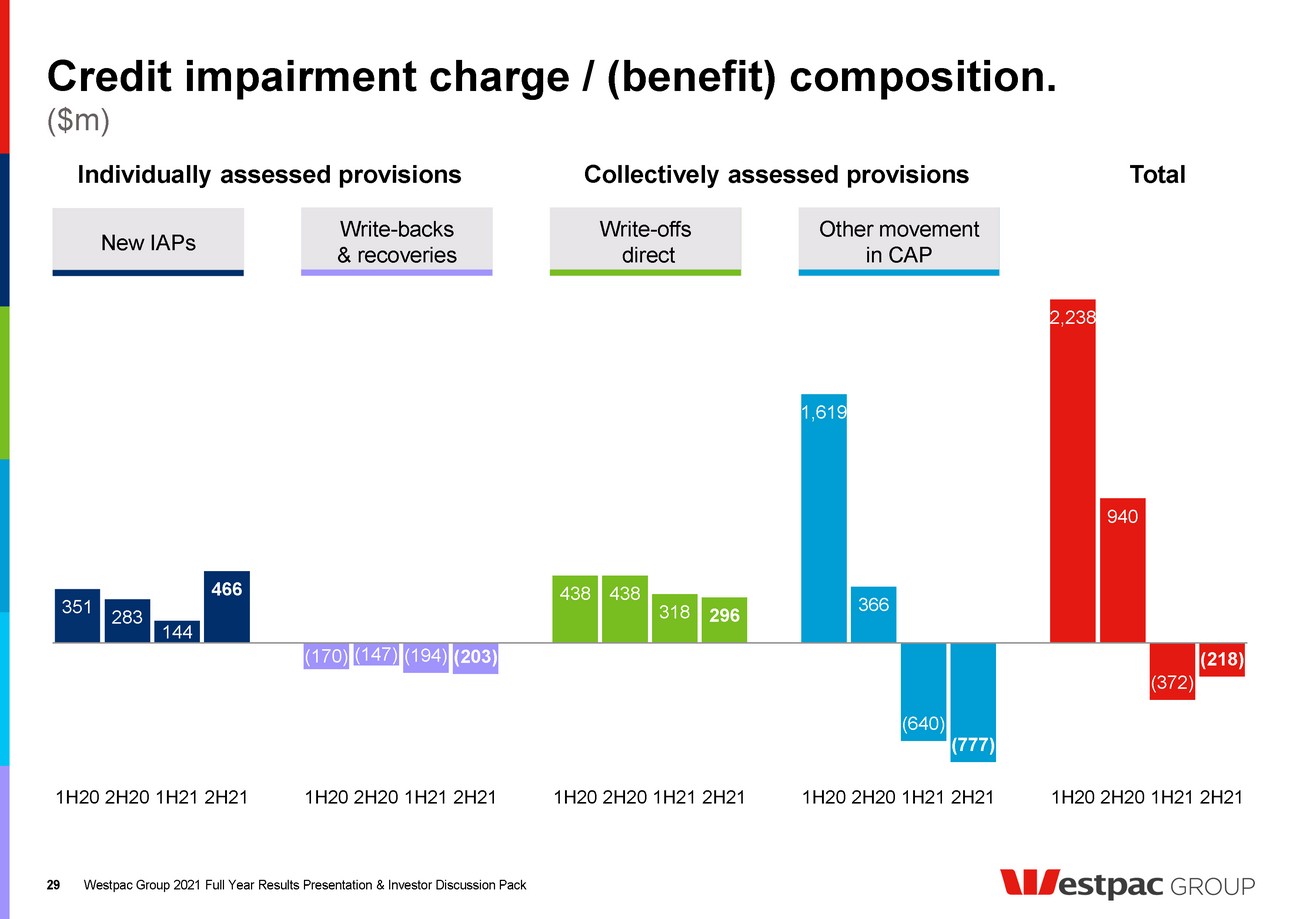
| 351 283 144 466 (170) (147) (194) (203) 438 438 318 296 1,619 366 (640) (777) 2,238 940 (372) (218) 1H20 2H20 1H21 2H21 1H20 2H20 1H21 2H21 1H20 2H20 1H21 2H21 1H20 2H20 1H21 2H21 1H20 2H20 1H21 2H21 Credit impairment charge / (benefit) composition. Westpac Group 2021 Full Year Results Presentation & Investor Discussion Pack Individually assessed provisions ($m) Collectively assessed provisions Total 29 New IAPs Write-backs & recoveries Write-offs direct Other movement in CAP 29 |
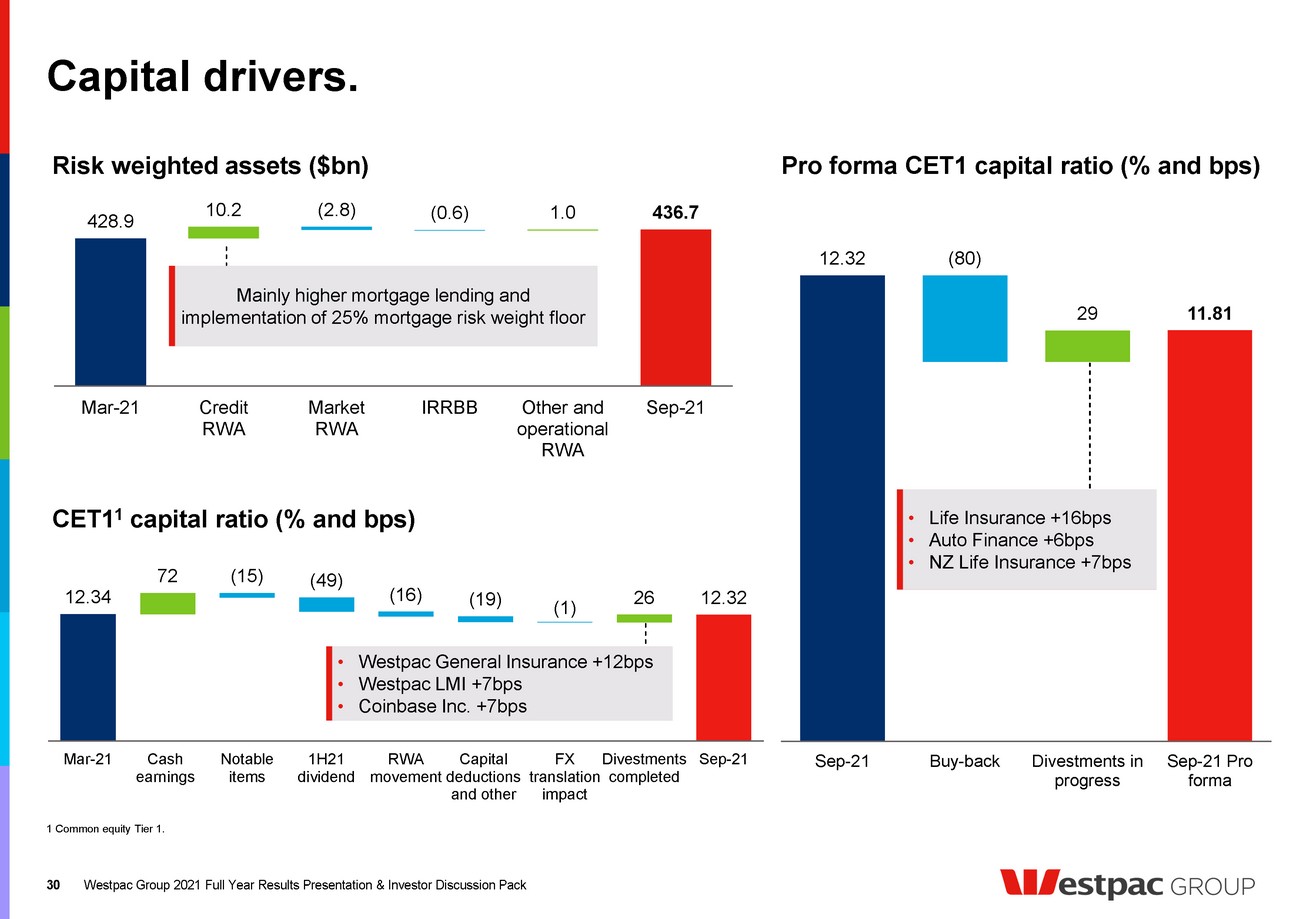
| 12.32 29 11.81 (80) Sep-21 Buy-back Divestments in progress Sep-21 Pro forma 428.9 10.2 1.0 436.7 (2.8) (0.6) Mar-21 Credit RWA Market RWA IRRBB Other and operational RWA Sep-21 Capital drivers. 30 1 Common equity Tier 1. Westpac Group 2021 Full Year Results Presentation & Investor Discussion Pack 30 CET1 1 capital ratio (% and bps) 12.34 72 26 12.32 (15) (49) (16) (19) (1) Mar-21 Cash earnings Notable items 1H21 dividend RWA movement Capital deductions and other FX translation impact Divestments completed Sep-21 Risk weighted assets ($bn) Mainly higher mortgage lending and implementation of 25% mortgage risk weight floor Pro forma CET1 capital ratio (% and bps) • Westpac General Insurance +12bps • Westpac LMI +7bps • Coinbase Inc. +7bps • Life Insurance +16bps • Auto Finance +6bps • NZ Life Insurance +7bps |
| Off-market share buy-back. 31 • Up to $3.5bn off-market share buy-back to be undertaken via a tender process: - Efficient form of capital management - Shares bought back at a discount to market price - Reduces share count - Supports EPS, DPS and return metrics - Distributes franking credits • Nominated discount range of 8-14% • Flexibility created by strong capital position, excess franking credits, future asset sales Westpac Group 2021 Full Year Results Presentation & Investor Discussion Pack 31 ,11estpac GROU P |
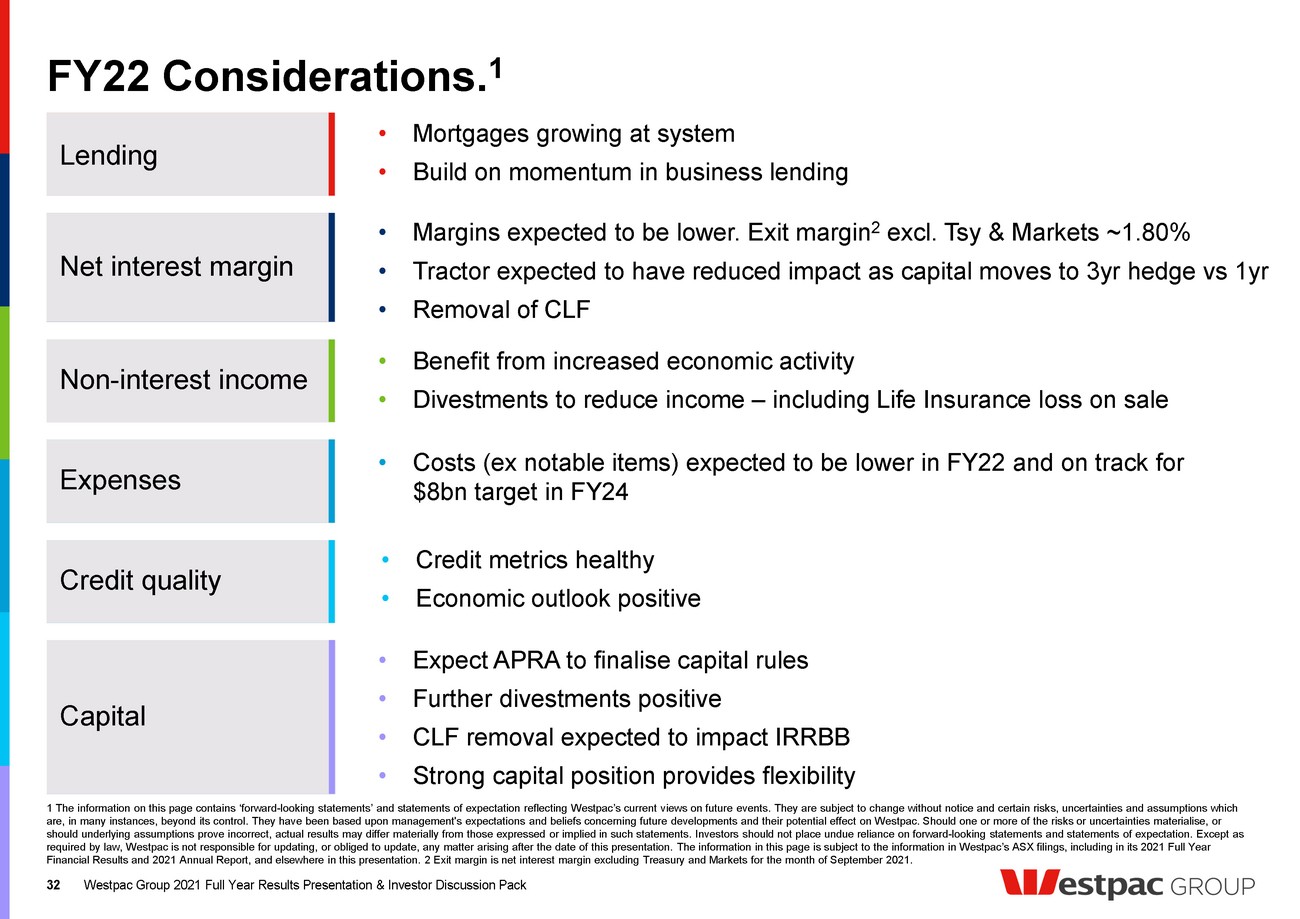
| FY22 Considerations. 1 1 The information on this page contains ‘forward-looking statements’ and statements of expectation reflecting Westpac’s current views on future events. They are subject to change without notice and certain risks, uncertainties and assumptions which are, in many instances, beyond its control. They have been based upon management's expectations and beliefs concerning future developments and their potential effect on Westpac. Should one or more of the risks or uncertainties materialise, or should underlying assumptions prove incorrect, actual results may differ materially from those expressed or implied in such statements. Investors should not place undue reliance on forward-looking statements and statements of expectation. Except as required by law, Westpac is not responsible for updating, or obliged to update, any matter arising after the date of this presentation. The information in this page is subject to the information in Westpac’s ASX filings, including in its 2021 Full Year Financial Results and 2021 Annual Report, and elsewhere in this presentation. 2 Exit margin is net interest margin excluding Treasury and Markets for the month of September 2021. Westpac Group 2021 Full Year Results Presentation & Investor Discussion Pack 32 Lending • Mortgages growing at system • Build on momentum in business lending Net interest margin • Margins expected to be lower. Exit margin 2 excl. Tsy & Markets ~1.80% • Tractor expected to have reduced impact as capital moves to 3yr hedge vs 1yr • Removal of CLF Non-interest income • Benefit from increased economic activity • Divestments to reduce income – including Life Insurance loss on sale Expenses • Costs (ex notable items) expected to be lower in FY22 and on track for $8bn target in FY24 Credit quality • Credit metrics healthy • Economic outlook positive 32 Capital • Expect APRA to finalise capital rules • Further divestments positive • CLF removal expected to impact IRRBB • Strong capital position provides flexibility |
| Financial results throughout this presentation are in Australian dollars and are based on cash earnings unless otherwise stated. Refer page 30 for definition. Results principally cover the 1H20, 2H19 and 1H19 periods. Comparison of 1H20 versus 2H19 (unless otherwise stated). Peter King Chief Executive Officer ,11estpac GROUP |

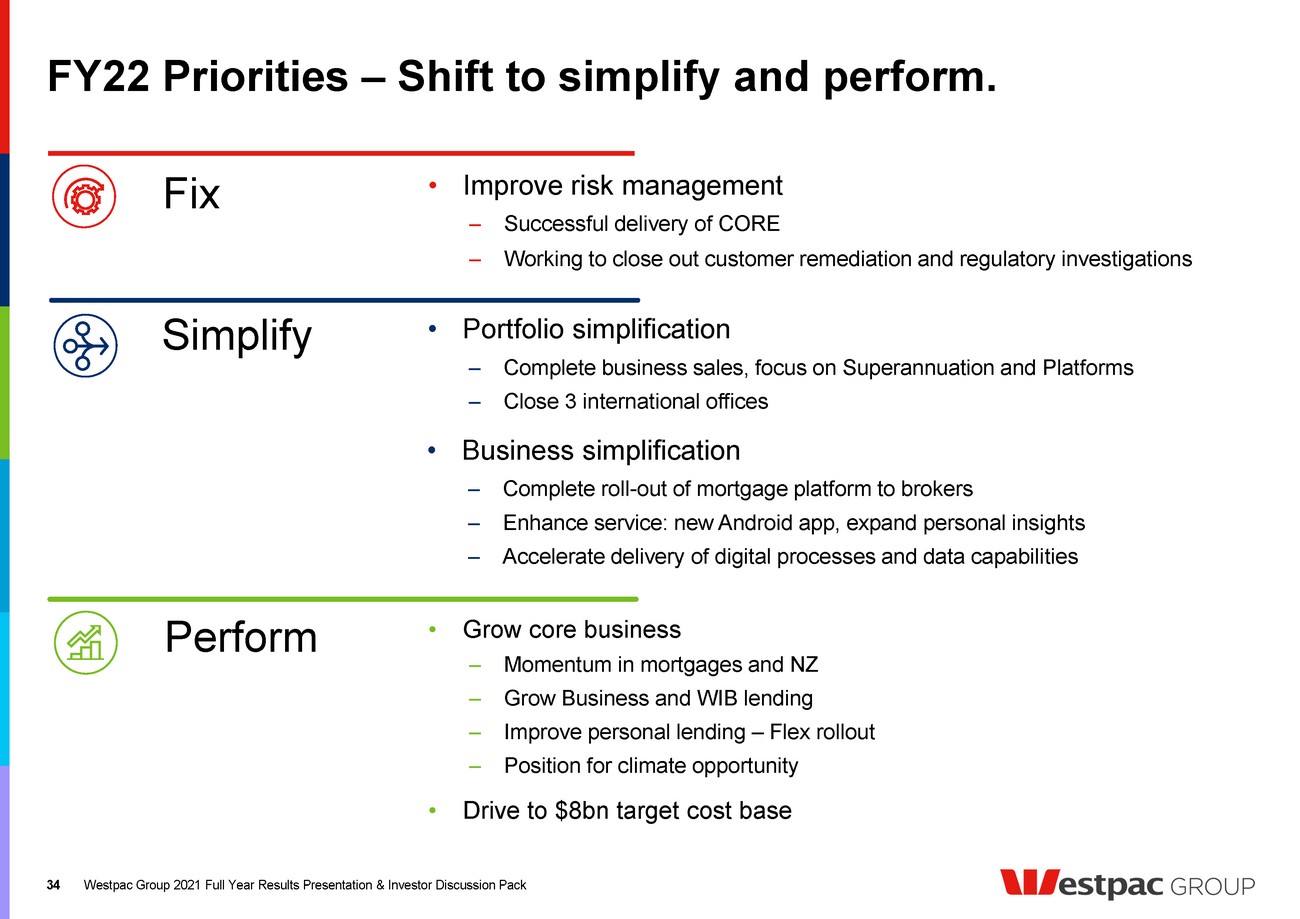
| Westpac Group 2021 Full Year Results Presentation & Investor Discussion Pack 34 34 FY22 Priorities – Shift to simplify and perform. Fix Simplify Perform • Improve risk management – Successful delivery of CORE – Working to close out customer remediation and regulatory investigations • Portfolio simplification – Complete business sales, focus on Superannuation and Platforms – Close 3 international offices • Business simplification – Complete roll-out of mortgage platform to brokers – Enhance service: new Android app, expand personal insights – Accelerate delivery of digital processes and data capabilities • Grow core business – Momentum in mortgages and NZ – Grow Business and WIB lending – Improve personal lending – Flex rollout – Position for climate opportunity • Drive to $8bn target cost base |
| Investor Discussion Pack Fix. Simplify. Perform. ,11estpac GROUP |

| Overview ,11estpac GROUP |
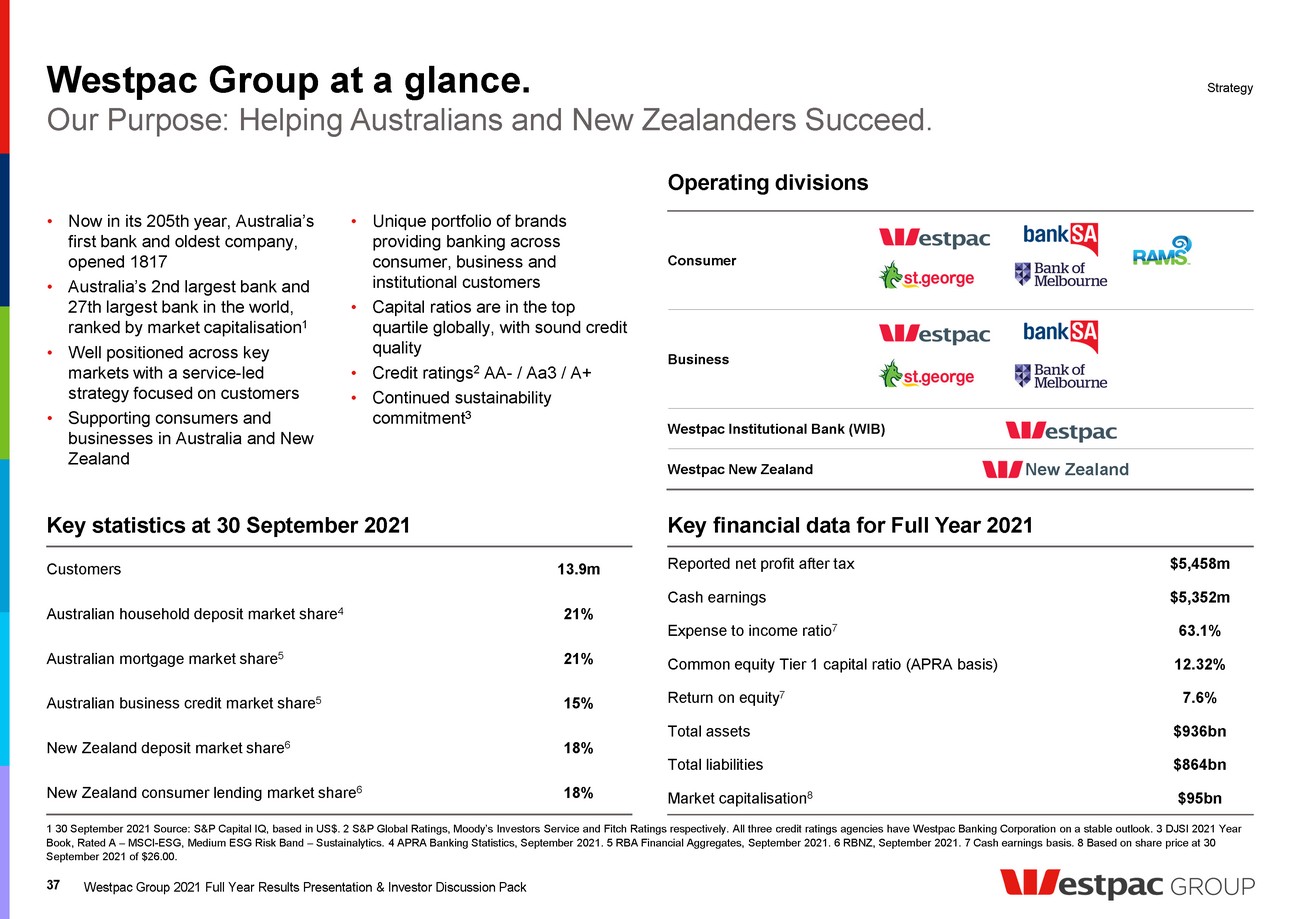
| Westpac Group at a glance. 37 • Now in its 205th year, Australia’s first bank and oldest company, opened 1817 • Australia’s 2nd largest bank and 27th largest bank in the world, ranked by market capitalisation 1 • Well positioned across key markets with a service-led strategy focused on customers • Supporting consumers and businesses in Australia and New Zealand • Unique portfolio of brands providing banking across consumer, business and institutional customers • Capital ratios are in the top quartile globally, with sound credit quality • Credit ratings 2 AA- / Aa3 / A+ • Continued sustainability commitment 3 Operating divisions Consumer Business Westpac Institutional Bank (WIB) Westpac New Zealand Key statistics at 30 September 2021 Key financial data for Full Year 2021 Reported net profit after tax $5,458m Cash earnings $5,352m Expense to income ratio 7 63.1% Common equity Tier 1 capital ratio (APRA basis) 12.32% Return on equity 7 7.6% Total assets $936bn Total liabilities $864bn Market capitalisation 8 $95bn Our Purpose: Helping Australians and New Zealanders Succeed. 1 30 September 2021 Source: S&P Capital IQ, based in US$. 2 S&P Global Ratings, Moody’s Investors Service and Fitch Ratings respectively. All three credit ratings agencies have Westpac Banking Corporation on a stable outlook. 3 DJSI 2021 Year Book, Rated A – MSCI-ESG, Medium ESG Risk Band – Sustainalytics. 4 APRA Banking Statistics, September 2021. 5 RBA Financial Aggregates, September 2021. 6 RBNZ, September 2021. 7 Cash earnings basis. 8 Based on share price at 30 September 2021 of $26.00. Strategy New Zealand Westpac Group 2021 Full Year Results Presentation & Investor Discussion Pack Customers 13.9m Australian household deposit market share 4 21% Australian mortgage market share 5 21% Australian business credit market share 5 15% New Zealand deposit market share 6 18% New Zealand consumer lending market share 6 18% |
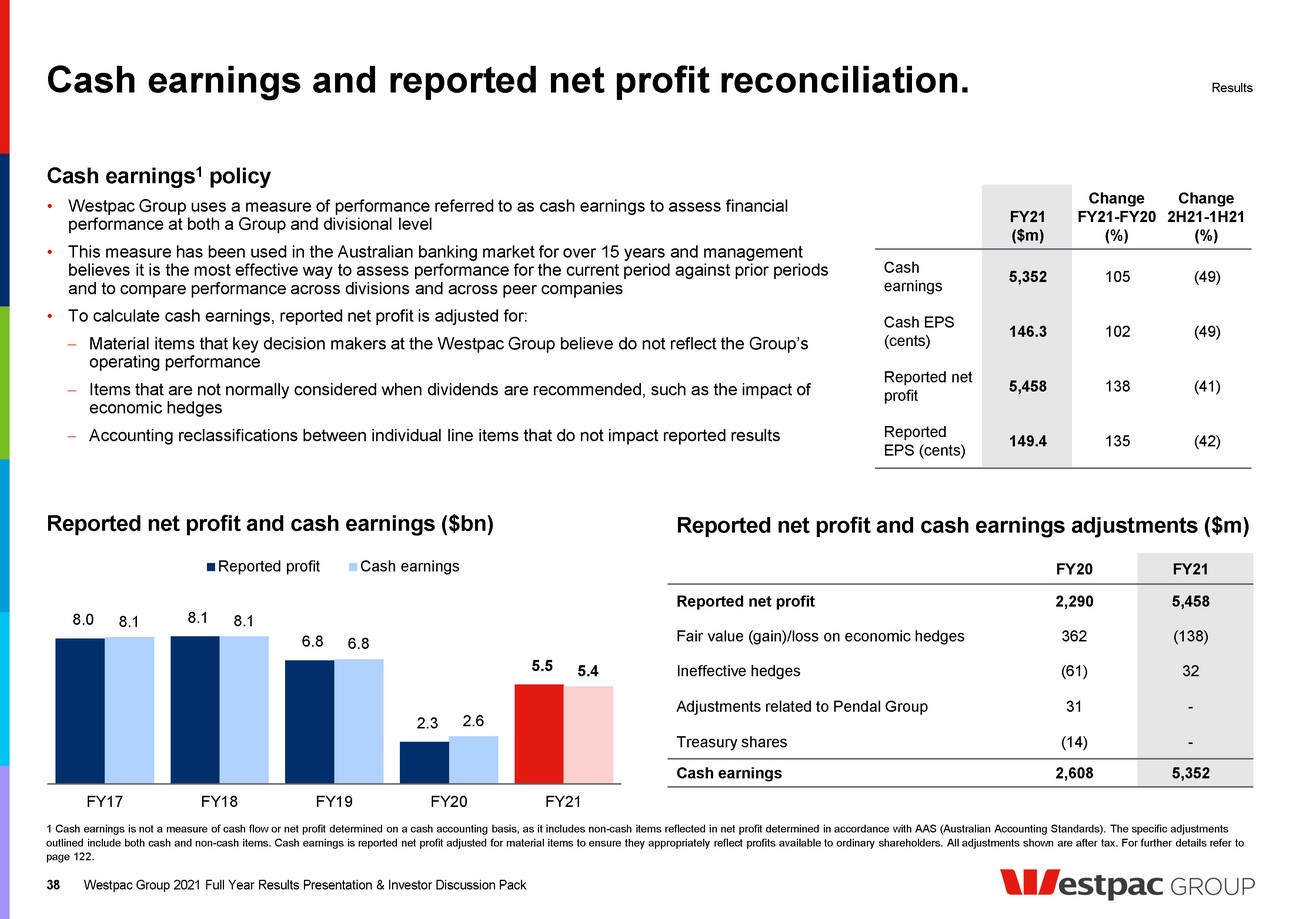
| Cash earnings and reported net profit reconciliation. 38 Reported net profit and cash earnings ($bn) Cash earnings 1 policy • Westpac Group uses a measure of performance referred to as cash earnings to assess financial performance at both a Group and divisional level • This measure has been used in the Australian banking market for over 15 years and management believes it is the most effective way to assess performance for the current period against prior periods and to compare performance across divisions and across peer companies • To calculate cash earnings, reported net profit is adjusted for: Material items that key decision makers at the Westpac Group believe do not reflect the Group’s operating performance Items that are not normally considered when dividends are recommended, such as the impact of economic hedges Accounting reclassifications between individual line items that do not impact reported results Reported net profit and cash earnings adjustments ($m) 1 Cash earnings is not a measure of cash flow or net profit determined on a cash accounting basis, as it includes non-cash items reflected in net profit determined in accordance with AAS (Australian Accounting Standards). The specific adjustments outlined include both cash and non-cash items. Cash earnings is reported net profit adjusted for material items to ensure they appropriately reflect profits available to ordinary shareholders. All adjustments shown are after tax. For further details refer to page 122. Results 8.0 8.1 6.8 2.3 5.5 8.1 8.1 6.8 2.6 5.4 FY17 FY18 FY19 FY20 FY21 Reported profit Cash earnings FY21 ($m) Change FY21-FY20 (%) Change 2H21-1H21 (%) Cash earnings 5,352 105 (49) Cash EPS (cents) 146.3 102 (49) Reported net profit 5,458 138 (41) Reported EPS (cents) 149.4 135 (42) FY20 FY21 Reported net profit 2,290 5,458 Fair value (gain)/loss on economic hedges 362 (138) Ineffective hedges (61) 32 Adjustments related to Pendal Group 31 - Treasury shares (14) - Cash earnings 2,608 5,352 Westpac Group 2021 Full Year Results Presentation & Investor Discussion Pack |
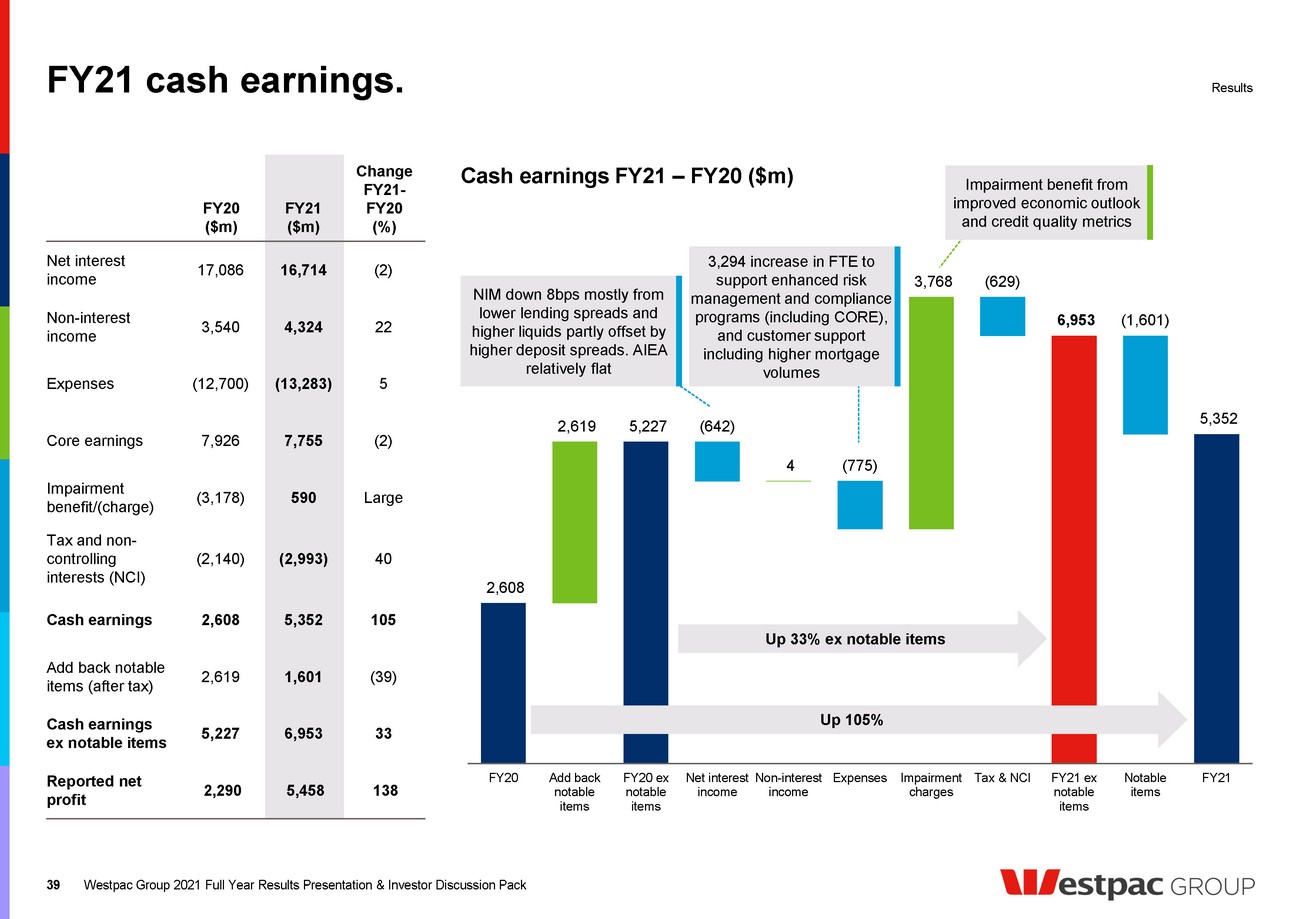
| 2,608 2,619 5,227 4 3,768 6,953 5,352 (642) (775) (629) (1,601) FY20 Add back notable items FY20 ex notable items Net interest income Non-interest income Expenses Impairment charges Tax & NCI FY21 ex notable items Notable items FY21 FY21 cash earnings. 39 FY20 ($m) FY21 ($m) Change FY21- FY20 (%) Net interest income 17,086 16,714 (2) Non-interest income 3,540 4,324 22 Expenses (12,700) (13,283) 5 Core earnings 7,926 7,755 (2) Impairment benefit/(charge) (3,178) 590 Large Tax and non- controlling interests (NCI) (2,140) (2,993) 40 Cash earnings 2,608 5,352 105 Add back notable items (after tax) 2,619 1,601 (39) Cash earnings ex notable items 5,227 6,953 33 Reported net profit 2,290 5,458 138 Results Cash earnings FY21 – FY20 ($m) Up 105% Up 33% ex notable items Westpac Group 2021 Full Year Results Presentation & Investor Discussion Pack NIM down 8bps mostly from lower lending spreads and higher liquids partly offset by higher deposit spreads. AIEA relatively flat 3,294 increase in FTE to support enhanced risk management and compliance programs (including CORE), and customer support including higher mortgage volumes Impairment benefit from improved economic outlook and credit quality metrics |
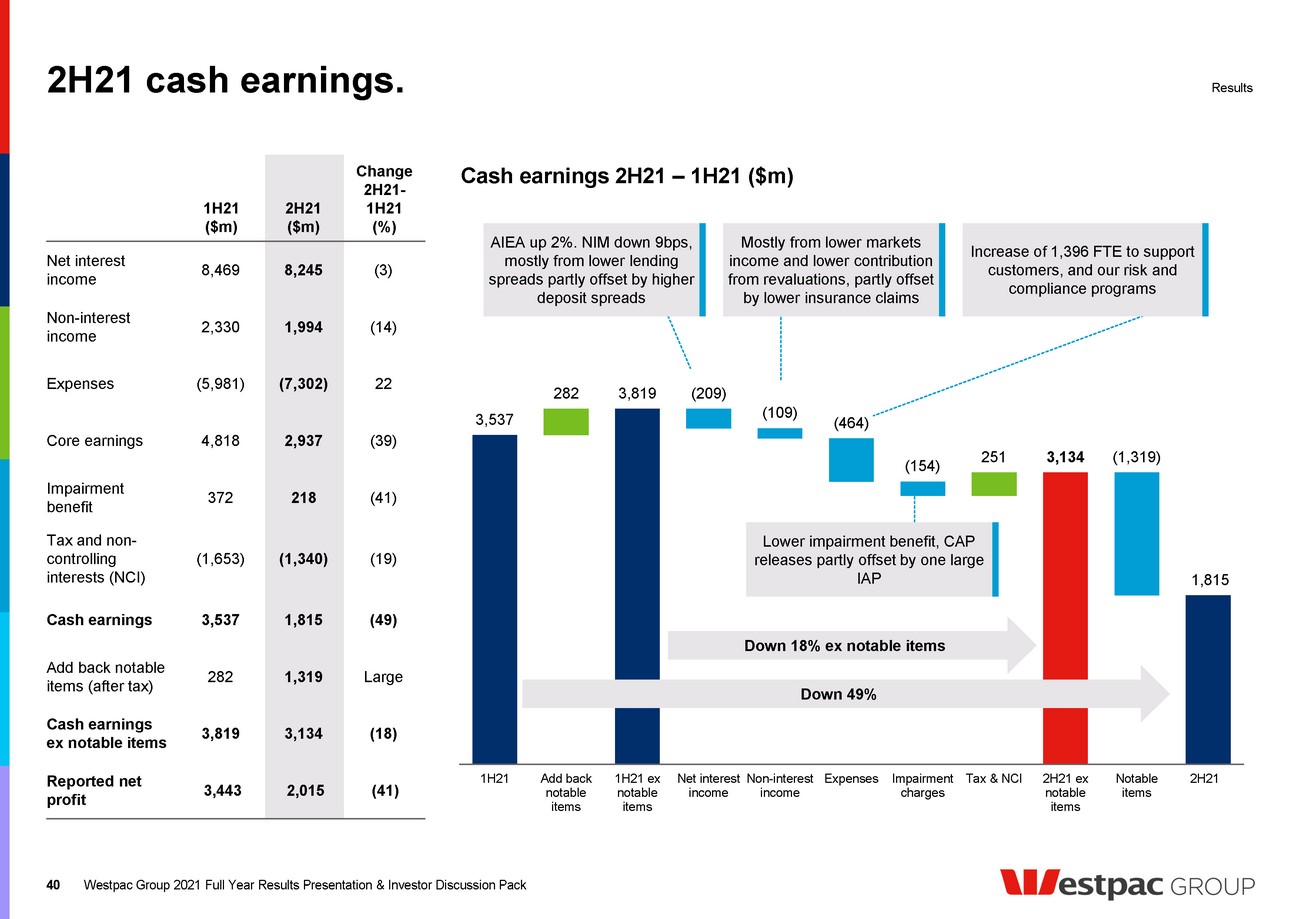
| 3,537 282 3,819 251 3,134 (209) (109) (464) (154) (1,319) 1,815 1H21 Add back notable items 1H21 ex notable items Net interest income Non-interest income Expenses Impairment charges Tax & NCI 2H21 ex notable items Notable items 2H21 2H21 cash earnings. 40 1H21 ($m) 2H21 ($m) Change 2H21- 1H21 (%) Net interest income 8,469 8,245 (3) Non-interest income 2,330 1,994 (14) Expenses (5,981) (7,302) 22 Core earnings 4,818 2,937 (39) Impairment benefit 372 218 (41) Tax and non- controlling interests (NCI) (1,653) (1,340) (19) Cash earnings 3,537 1,815 (49) Add back notable items (after tax) 282 1,319 Large Cash earnings ex notable items 3,819 3,134 (18) Reported net profit 3,443 2,015 (41) Results Cash earnings 2H21 – 1H21 ($m) Westpac Group 2021 Full Year Results Presentation & Investor Discussion Pack Down 49% Down 18% ex notable items AIEA up 2%. NIM down 9bps, mostly from lower lending spreads partly offset by higher deposit spreads Mostly from lower markets income and lower contribution from revaluations, partly offset by lower insurance claims Increase of 1,396 FTE to support customers, and our risk and compliance programs Lower impairment benefit, CAP releases partly offset by one large IAP |
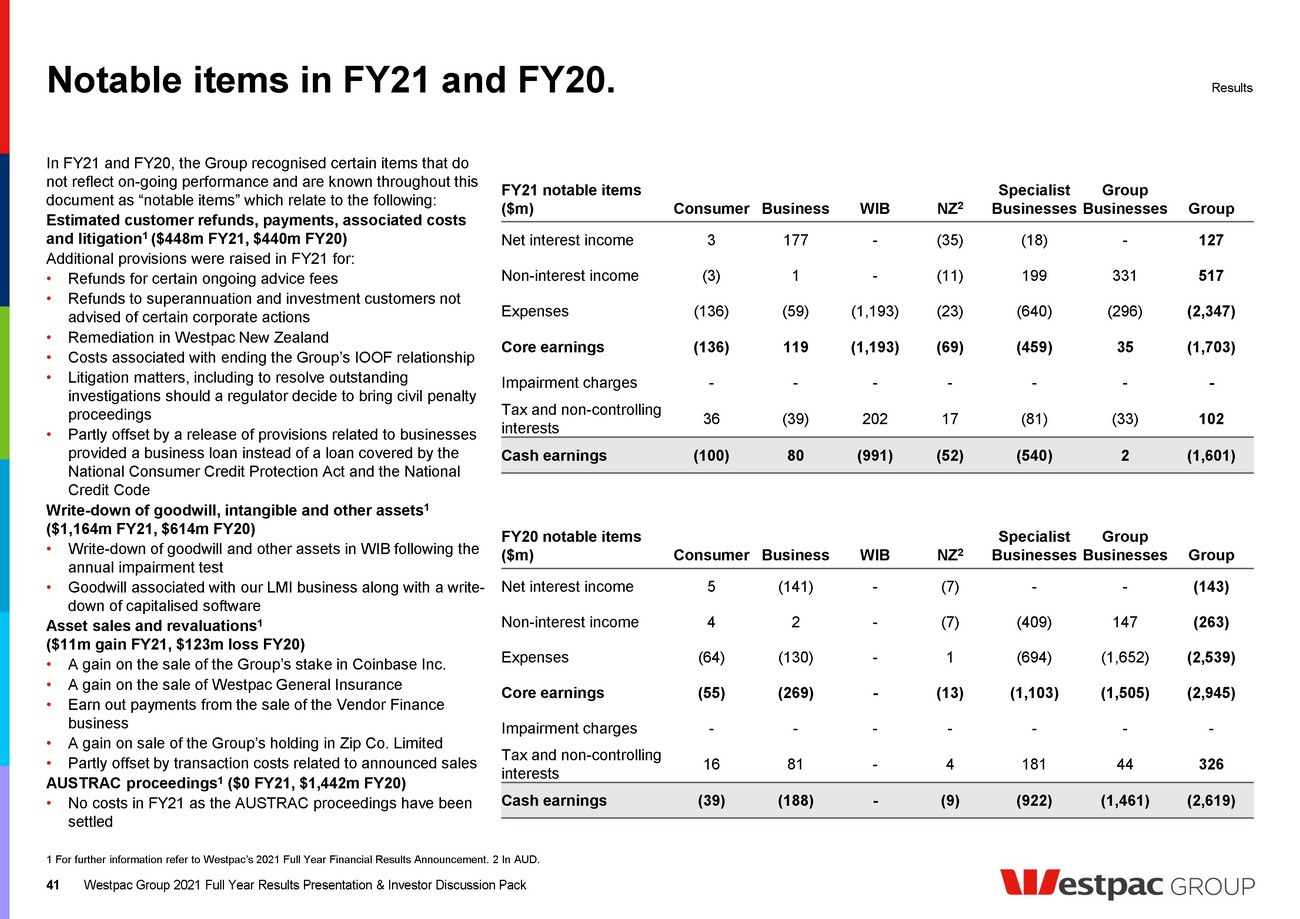
| Notable items in FY21 and FY20. 41 In FY21 and FY20, the Group recognised certain items that do not reflect on-going performance and are known throughout this document as “notable items” which relate to the following: Estimated customer refunds, payments, associated costs and litigation 1 ($448m FY21, $440m FY20) Additional provisions were raised in FY21 for: • Refunds for certain ongoing advice fees • Refunds to superannuation and investment customers not advised of certain corporate actions • Remediation in Westpac New Zealand • Costs associated with ending the Group’s IOOF relationship • Litigation matters, including to resolve outstanding investigations should a regulator decide to bring civil penalty proceedings • Partly offset by a release of provisions related to businesses provided a business loan instead of a loan covered by the National Consumer Credit Protection Act and the National Credit Code Write-down of goodwill, intangible and other assets1 ($1,164m FY21, $614m FY20) • Write-down of goodwill and other assets in WIB following the annual impairment test • Goodwill associated with our LMI business along with a write- down of capitalised software Asset sales and revaluations 1 ($11m gain FY21, $123m loss FY20) • A gain on the sale of the Group’s stake in Coinbase Inc. • A gain on the sale of Westpac General Insurance • Earn out payments from the sale of the Vendor Finance business • A gain on sale of the Group’s holding in Zip Co. Limited • Partly offset by transaction costs related to announced sales AUSTRAC proceedings 1 ($0 FY21, $1,442m FY20) • No costs in FY21 as the AUSTRAC proceedings have been settled FY21 notable items ($m) Consumer Business WIB NZ 2 Specialist Businesses Group Businesses Group Net interest income 3 177 - (35) (18) - 127 Non-interest income (3) 1 - (11) 199 331 517 Expenses (136) (59) (1,193) (23) (640) (296) (2,347) Core earnings (136) 119 (1,193) (69) (459) 35 (1,703) Impairment charges - - - - - - - Tax and non-controlling interests 36 (39) 202 17 (81) (33) 102 Cash earnings (100) 80 (991) (52) (540) 2 (1,601) 1 For further information refer to Westpac’s 2021 Full Year Financial Results Announcement. 2 In AUD. Results Westpac Group 2021 Full Year Results Presentation & Investor Discussion Pack FY20 notable items ($m) Consumer Business WIB NZ 2 Specialist Businesses Group Businesses Group Net interest income 5 (141) - (7) - - (143) Non-interest income 4 2 - (7) (409) 147 (263) Expenses (64) (130) - 1 (694) (1,652) (2,539) Core earnings (55) (269) - (13) (1,103) (1,505) (2,945) Impairment charges - - - - - - - Tax and non-controlling interests 16 81 - 4 181 44 326 Cash earnings (39) (188) - (9) (922) (1,461) (2,619) |
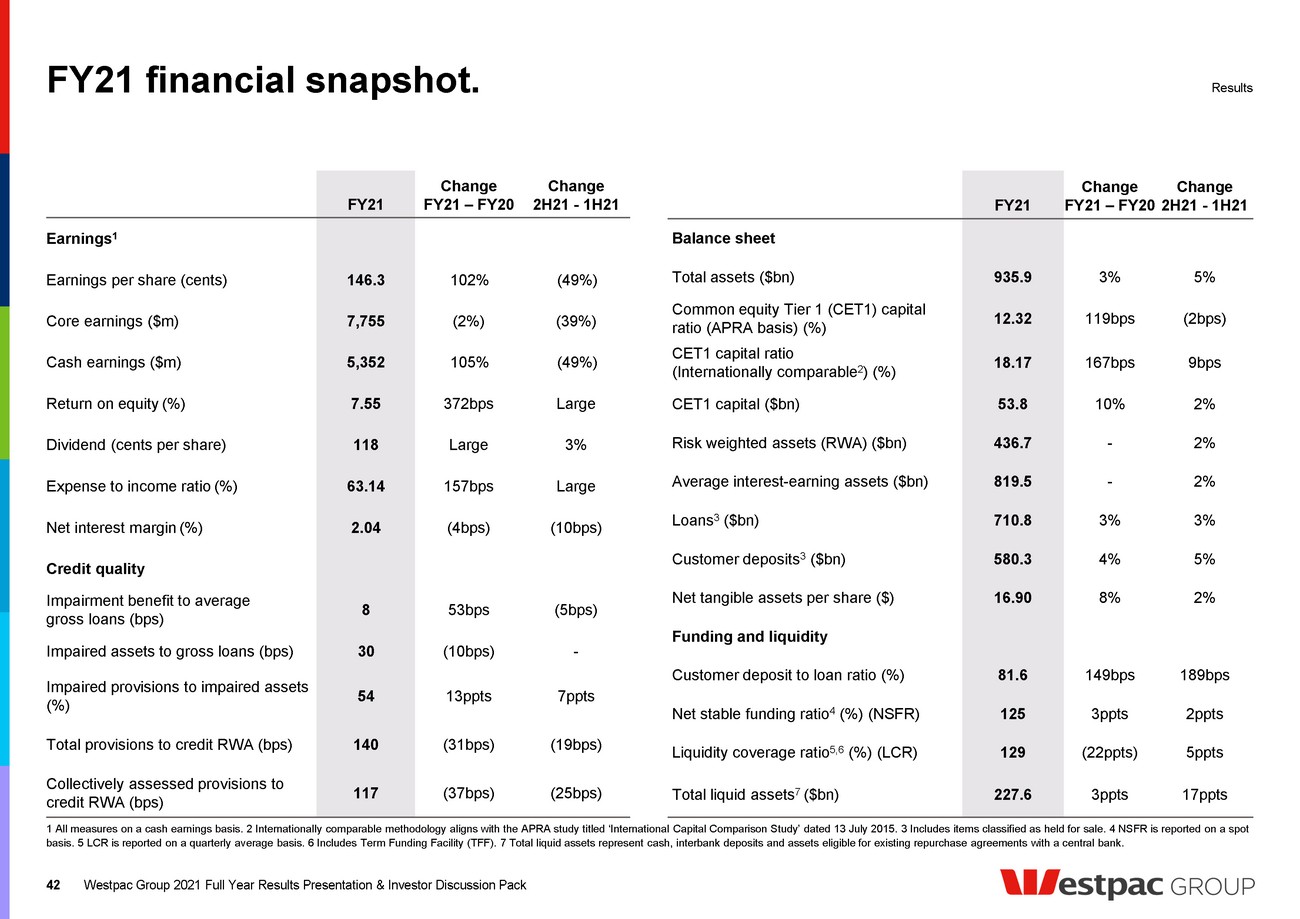
| FY21 financial snapshot. 1 All measures on a cash earnings basis. 2 Internationally comparable methodology aligns with the APRA study titled ‘International Capital Comparison Study’ dated 13 July 2015. 3 Includes items classified as held for sale. 4 NSFR is reported on a spot basis. 5 LCR is reported on a quarterly average basis. 6 Includes Term Funding Facility (TFF). 7 Total liquid assets represent cash, interbank deposits and assets eligible for existing repurchase agreements with a central bank. 42 Results FY21 Change FY21 – FY20 Change 2H21 - 1H21 Earnings 1 Earnings per share (cents) 146.3 102% (49%) Core earnings ($m) 7,755 (2%) (39%) Cash earnings ($m) 5,352 105% (49%) Return on equity (%) 7.55 372bps Large Dividend (cents per share) 118 Large 3% Expense to income ratio (%) 63.14 157bps Large Net interest margin (%) 2.04 (4bps) (10bps) Credit quality Impairment benefit to average gross loans (bps) 8 53bps (5bps) Impaired assets to gross loans (bps) 30 (10bps) - Impaired provisions to impaired assets (%) 54 13ppts 7ppts Total provisions to credit RWA (bps) 140 (31bps) (19bps) Collectively assessed provisions to credit RWA (bps) 117 (37bps) (25bps) FY21 Change FY21 – FY20 Change 2H21 - 1H21 Balance sheet Total assets ($bn) 935.9 3% 5% Common equity Tier 1 (CET1) capital ratio (APRA basis) (%) 12.32 119bps (2bps) CET1 capital ratio (Internationally comparable 2) (%) 18.17 167bps 9bps CET1 capital ($bn) 53.8 10% 2% Risk weighted assets (RWA) ($bn) 436.7 - 2% Average interest-earning assets ($bn) 819.5 - 2% Loans 3 ($bn) 710.8 3% 3% Customer deposits 3 ($bn) 580.3 4% 5% Net tangible assets per share ($) 16.90 8% 2% Funding and liquidity Customer deposit to loan ratio (%) 81.6 149bps 189bps Net stable funding ratio 4 (%) (NSFR) 125 3ppts 2ppts Liquidity coverage ratio 5,6 (%) (LCR) 129 (22ppts) 5ppts Total liquid assets 7 ($bn) 227.6 3ppts 17ppts Westpac Group 2021 Full Year Results Presentation & Investor Discussion Pack |
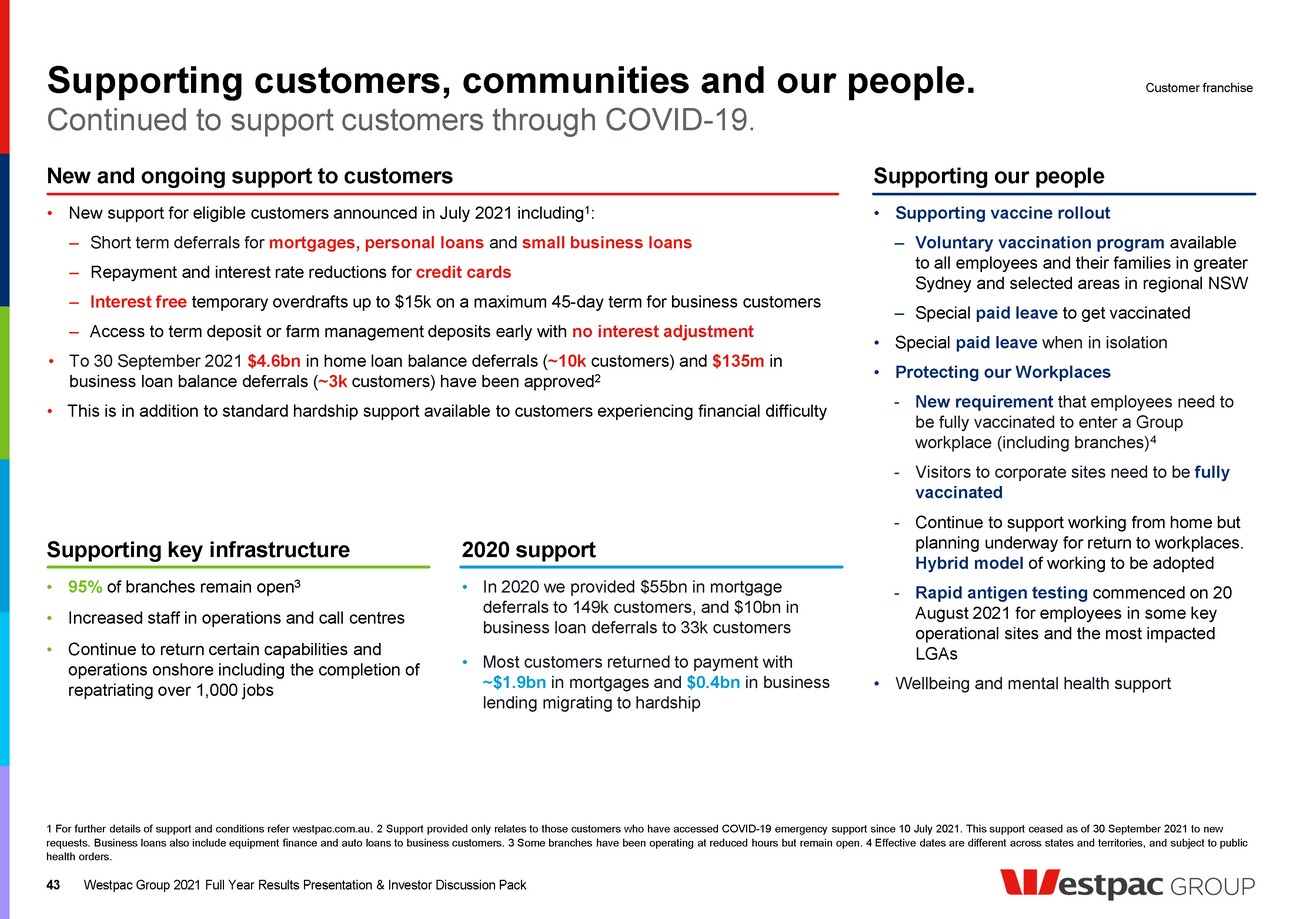
| Supporting customers, communities and our people. Westpac Group 2021 Full Year Results Presentation & Investor Discussion Pack 43 Supporting key infrastructure • 95% of branches remain open 3 • Increased staff in operations and call centres • Continue to return certain capabilities and operations onshore including the completion of repatriating over 1,000 jobs New and ongoing support to customers • New support for eligible customers announced in July 2021 including 1: – Short term deferrals for mortgages, personal loans and small business loans – Repayment and interest rate reductions for credit cards – Interest free temporary overdrafts up to $15k on a maximum 45-day term for business customers – Access to term deposit or farm management deposits early with no interest adjustment • To 30 September 2021 $4.6bn in home loan balance deferrals ( ~10k customers) and $135m in business loan balance deferrals ( ~3k customers) have been approved 2 • This is in addition to standard hardship support available to customers experiencing financial difficulty Supporting our people • Supporting vaccine rollout – Voluntary vaccination program available to all employees and their families in greater Sydney and selected areas in regional NSW – Special paid leave to get vaccinated • Special paid leave when in isolation • Protecting our Workplaces - New requirement that employees need to be fully vaccinated to enter a Group workplace (including branches) 4 - Visitors to corporate sites need to be fully vaccinated - Continue to support working from home but planning underway for return to workplaces. Hybrid model of working to be adopted - Rapid antigen testing commenced on 20 August 2021 for employees in some key operational sites and the most impacted LGAs • Wellbeing and mental health support Continued to support customers through COVID-19. 1 For further details of support and conditions refer westpac.com.au. 2 Support provided only relates to those customers who have accessed COVID-19 emergency support since 10 July 2021. This support ceased as of 30 September 2021 to new requests. Business loans also include equipment finance and auto loans to business customers. 3 Some branches have been operating at reduced hours but remain open. 4 Effective dates are different across states and territories, and subject to public health orders. Customer franchise 2020 support • In 2020 we provided $55bn in mortgage deferrals to 149k customers, and $10bn in business loan deferrals to 33k customers • Most customers returned to payment with ~$1.9bn in mortgages and $0.4bn in business lending migrating to hardship |
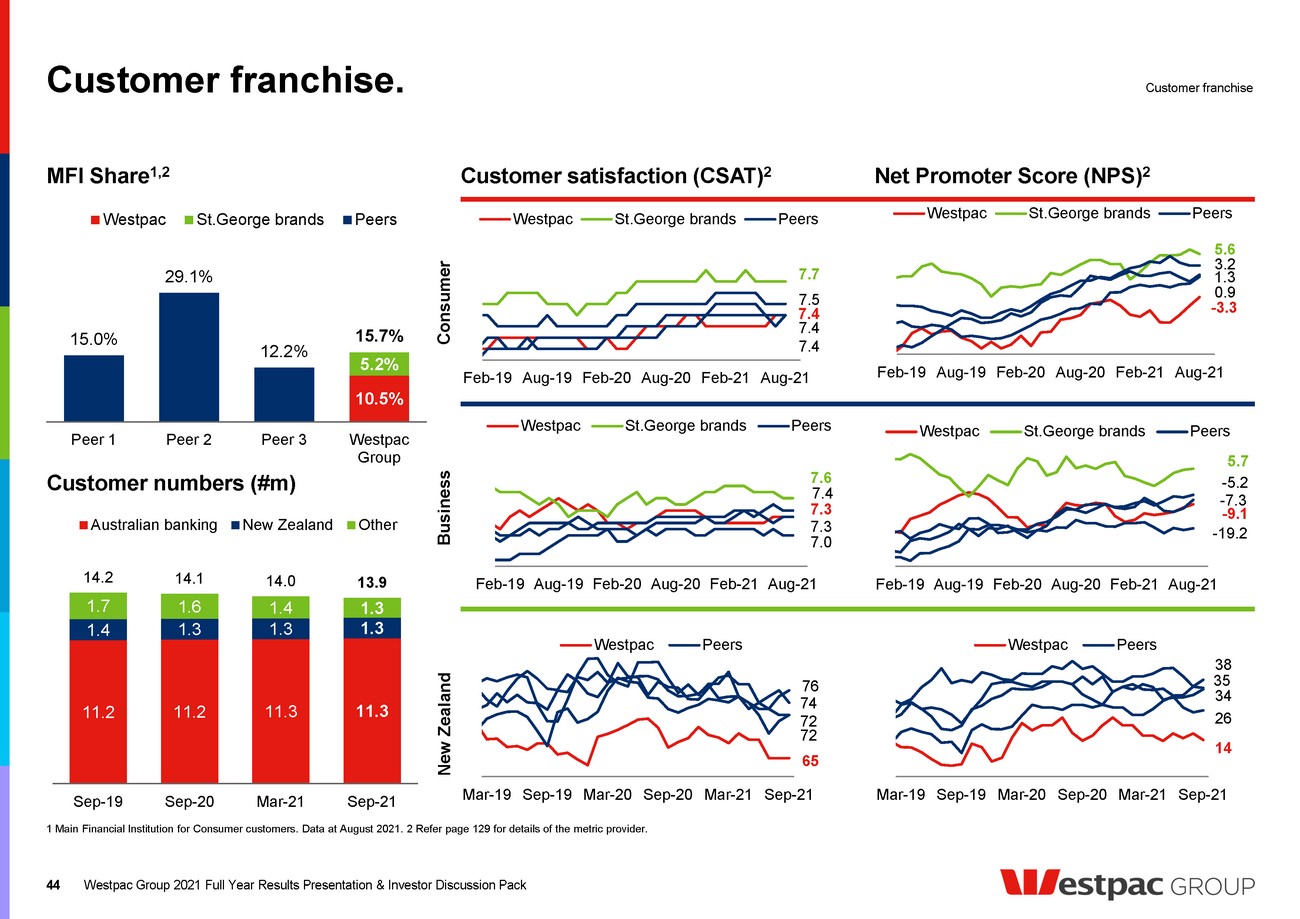
| Customer franchise. MFI Share 1,2 -3.3 5.6 0.9 1.3 3.2 Feb-19 Aug-19 Feb-20 Aug-20 Feb-21 Aug-21 Westpac St.George brands Peers 44 Customer satisfaction (CSAT) 2 11.2 11.2 11.3 11.3 1.4 1.3 1.3 1.3 1.7 1.6 1.4 1.3 14.2 14.1 14.0 13.9 Sep-19 Sep-20 Mar-21 Sep-21 Australian banking New Zealand Other Net Promoter Score (NPS) 2 1 Main Financial Institution for Consumer customers. Data at August 2021. 2 Refer page 129 for details of the metric provider. Customer franchise Westpac Group 2021 Full Year Results Presentation & Investor Discussion Pack Business Consumer New Zealand -9.1 5.7 -19.2 -5.2 -7.3 Feb-19 Aug-19 Feb-20 Aug-20 Feb-21 Aug-21 Westpac St.George brands Peers 10.5% 5.2% 15.0% 29.1% 12.2% 15.7% Peer 1 Peer 2 Peer 3 Westpac Group Westpac St.George brands Peers Customer numbers (#m) 7.4 7.7 7.4 7.4 7.5 Feb-19 Aug-19 Feb-20 Aug-20 Feb-21 Aug-21 Westpac St.George brands Peers 7.3 7.6 7.0 7.4 7.3 Feb-19 Aug-19 Feb-20 Aug-20 Feb-21 Aug-21 Westpac St.George brands Peers 14 35 26 38 34 Mar-19 Sep-19 Mar-20 Sep-20 Mar-21 Sep-21 Westpac Peers 65 72 72 76 74 Mar-19 Sep-19 Mar-20 Sep-20 Mar-21 Sep-21 Westpac Peers |
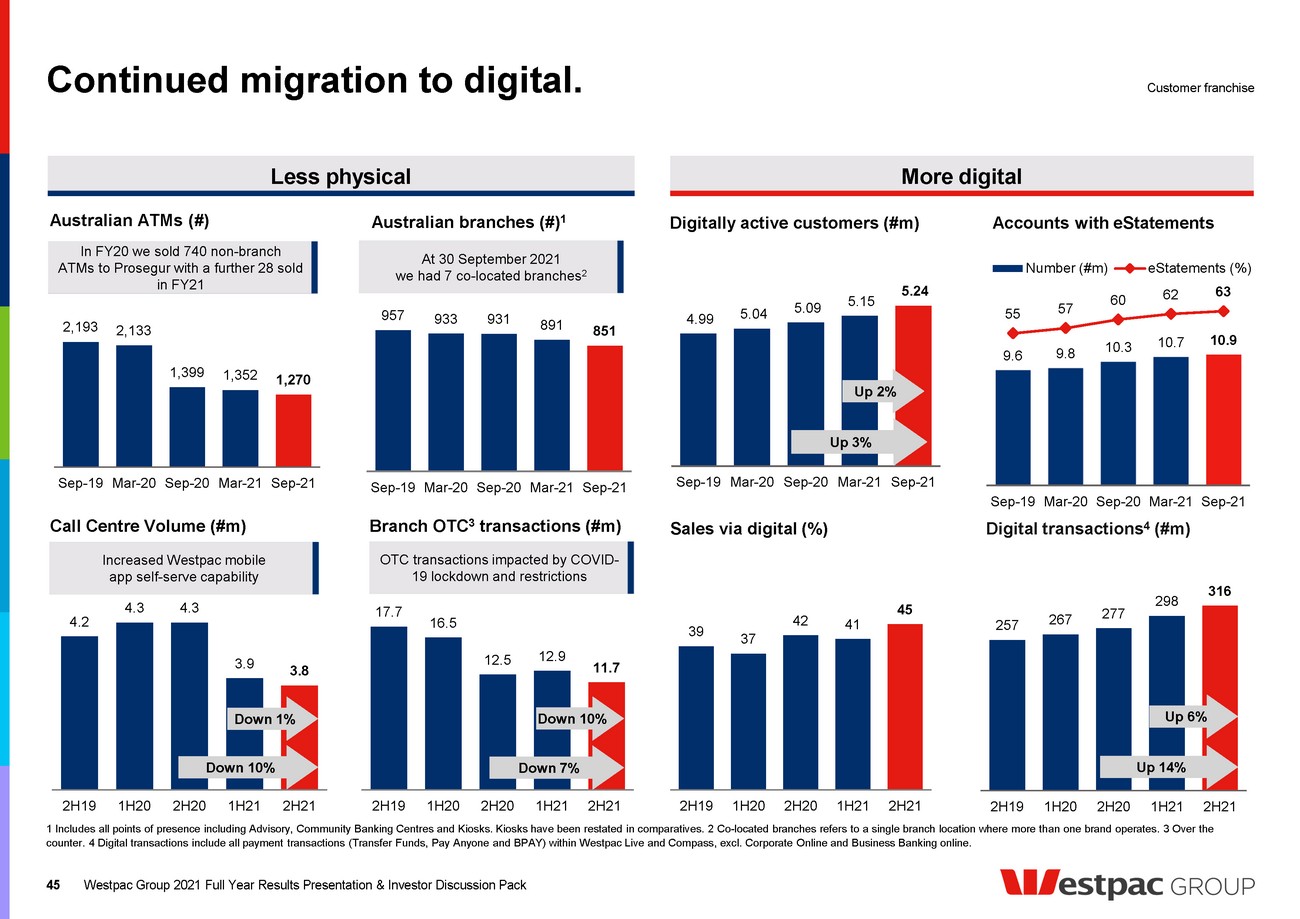
| 4.2 4.3 4.3 3.9 3.8 2H19 1H20 2H20 1H21 2H21 Continued migration to digital. 45 Australian ATMs (#) Australian branches (#) 1 Call Centre Volume (#m) Digitally active customers (#m) Accounts with eStatements 1 Includes all points of presence including Advisory, Community Banking Centres and Kiosks. Kiosks have been restated in comparatives. 2 Co-located branches refers to a single branch location where more than one brand operates. 3 Over the counter. 4 Digital transactions include all payment transactions (Transfer Funds, Pay Anyone and BPAY) within Westpac Live and Compass, excl. Corporate Online and Business Banking online. Branch OTC 3 transactions (#m) Digital transactions 4 (#m) 9.6 9.8 10.3 10.7 10.9 55 57 60 62 63 Sep-19 Mar-20 Sep-20 Mar-21 Sep-21 Number (#m) eStatements (%) 257 267 277 298 316 2H19 1H20 2H20 1H21 2H21 2,193 2,133 1,399 1,352 1,270 Sep-19 Mar-20 Sep-20 Mar-21 Sep-21 957 933 931 891 851 Sep-19 Mar-20 Sep-20 Mar-21 Sep-21 17.7 16.5 12.5 12.9 11.7 2H19 1H20 2H20 1H21 2H21 In FY20 we sold 740 non-branch ATMs to Prosegur with a further 28 sold in FY21 Sales via digital (%) 39 37 42 41 45 2H19 1H20 2H20 1H21 2H21 Westpac Group 2021 Full Year Results Presentation & Investor Discussion Pack Down 7% Down 10% Up 6% Up 14% Down 1% Down 10% OTC transactions impacted by COVID- 19 lockdown and restrictions Increased Westpac mobile app self-serve capability Customer franchise Less physical More digital At 30 September 2021 we had 7 co-located branches 2 4.99 5.04 5.09 5.15 5.24 Sep-19 Mar-20 Sep-20 Mar-21 Sep-21 Up 3% Up 2% |
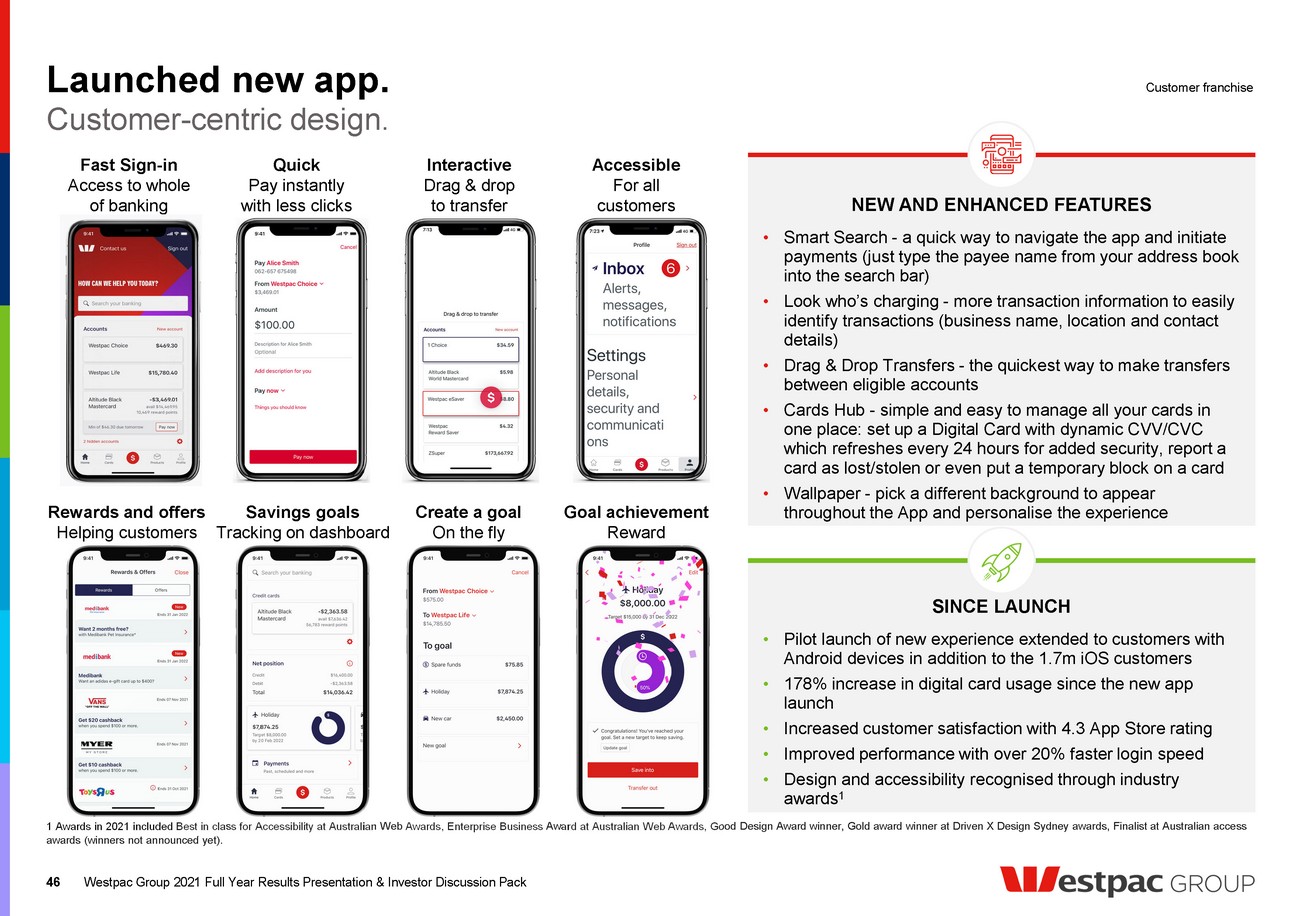
| Launched new app. 46 Customer-centric design. 1 Awards in 2021 included Best in class for Accessibility at Australian Web Awards, Enterprise Business Award at Australian Web Awards, Good Design Award winner, Gold award winner at Driven X Design Sydney awards, Finalist at Australian access awards (winners not announced yet). Westpac Group 2021 Full Year Results Presentation & Investor Discussion Pack NEW AND ENHANCED FEATURES • Smart Search - a quick way to navigate the app and initiate payments (just type the payee name from your address book into the search bar) • Look who’s charging - more transaction information to easily identify transactions (business name, location and contact details) • Drag & Drop Transfers - the quickest way to make transfers between eligible accounts • Cards Hub - simple and easy to manage all your cards in one place: set up a Digital Card with dynamic CVV/CVC which refreshes every 24 hours for added security, report a card as lost/stolen or even put a temporary block on a card • Wallpaper - pick a different background to appear throughout the App and personalise the experience Customer franchise Fast Sign-in Access to whole of banking Quick Pay instantly with less clicks Interactive Drag & drop to transfer Accessible For all customers Rewards and offers Helping customers Savings goals Tracking on dashboard Create a goal On the fly Goal achievement Reward SINCE LAUNCH • Pilot launch of new experience extended to customers with Android devices in addition to the 1.7m iOS customers • 178% increase in digital card usage since the new app launch • Increased customer satisfaction with 4.3 App Store rating • Improved performance with over 20% faster login speed • Design and accessibility recognised through industry awards 1 |
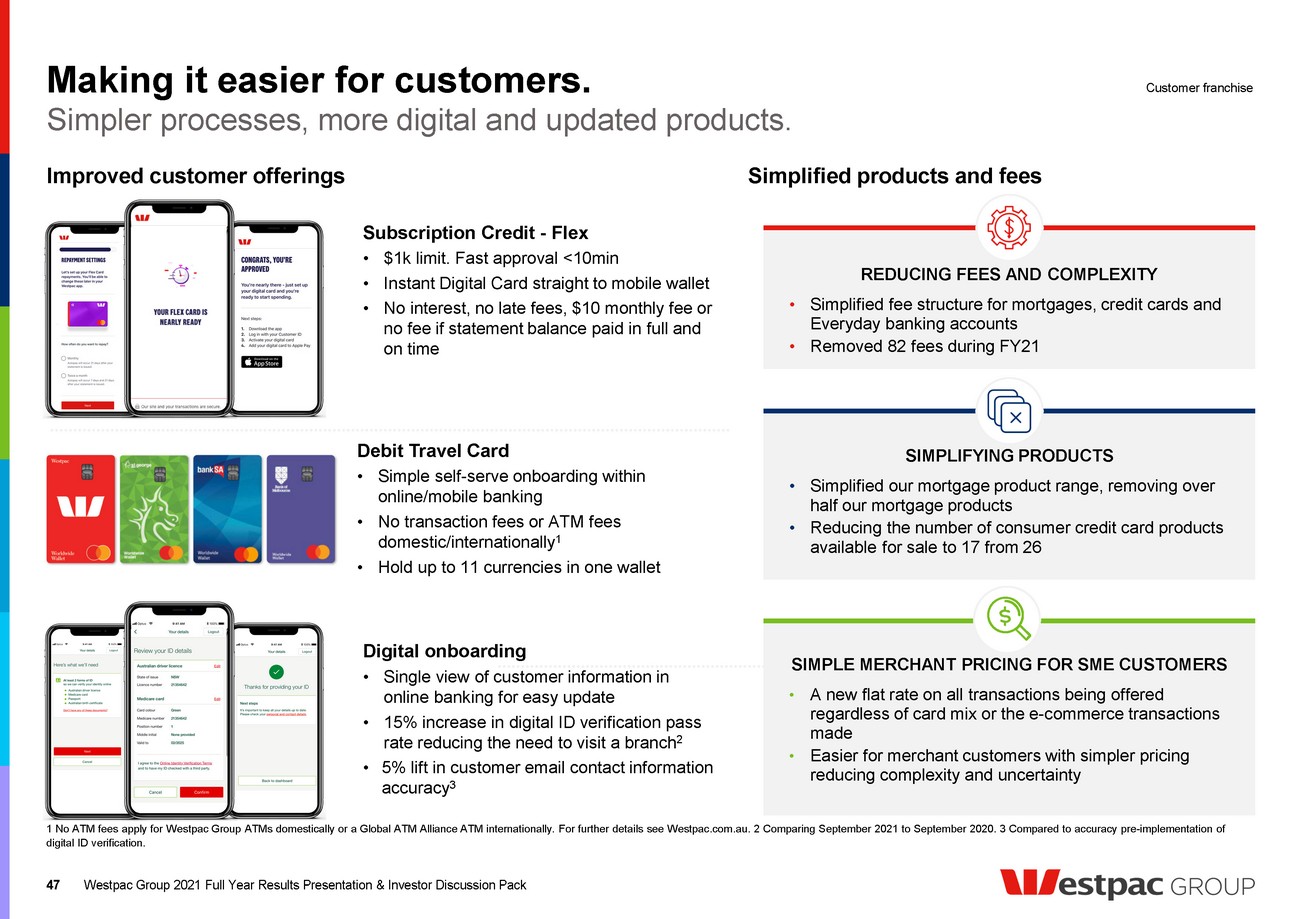
| Making it easier for customers. 47 Improved customer offerings Simplified products and fees Simpler processes, more digital and updated products. 1 No ATM fees apply for Westpac Group ATMs domestically or a Global ATM Alliance ATM internationally. For further details see Westpac.com.au. 2 Comparing September 2021 to September 2020. 3 Compared to accuracy pre-implementation of digital ID verification. Westpac Group 2021 Full Year Results Presentation & Investor Discussion Pack Customer franchise Subscription Credit - Flex • $1k limit. Fast approval <10min • Instant Digital Card straight to mobile wallet • No interest, no late fees, $10 monthly fee or no fee if statement balance paid in full and on time Digital onboarding • Single view of customer information in online banking for easy update • 15% increase in digital ID verification pass rate reducing the need to visit a branch 2 • 5% lift in customer email contact information accuracy 3 Debit Travel Card • Simple self-serve onboarding within online/mobile banking • No transaction fees or ATM fees domestic/internationally 1 • Hold up to 11 currencies in one wallet REDUCING FEES AND COMPLEXITY • Simplified fee structure for mortgages, credit cards and Everyday banking accounts • Removed 82 fees during FY21 SIMPLIFYING PRODUCTS • Simplified our mortgage product range, removing over half our mortgage products • Reducing the number of consumer credit card products available for sale to 17 from 26 SIMPLE MERCHANT PRICING FOR SME CUSTOMERS • A new flat rate on all transactions being offered regardless of card mix or the e-commerce transactions made • Easier for merchant customers with simpler pricing reducing complexity and uncertainty |
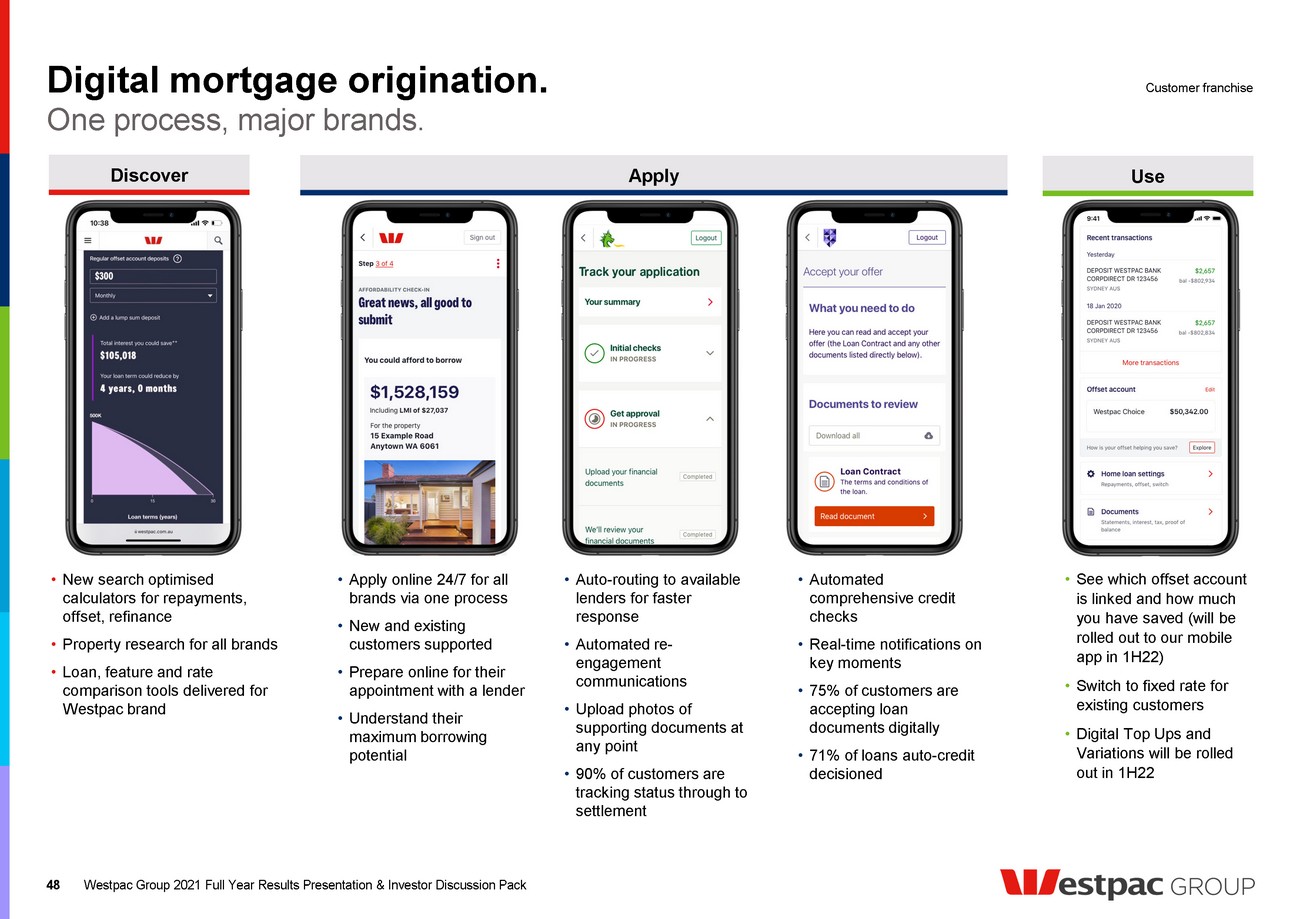
| Digital mortgage origination. 48 One process, major brands. Customer franchise Westpac Group 2021 Full Year Results Presentation & Investor Discussion Pack Apply Use Discover • New search optimised calculators for repayments, offset, refinance • Property research for all brands • Loan, feature and rate comparison tools delivered for Westpac brand • Apply online 24/7 for all brands via one process • New and existing customers supported • Prepare online for their appointment with a lender • Understand their maximum borrowing potential • Auto-routing to available lenders for faster response • Automated re- engagement communications • Upload photos of supporting documents at any point • 90% of customers are tracking status through to settlement • Automated comprehensive credit checks • Real-time notifications on key moments • 75% of customers are accepting loan documents digitally • 71% of loans auto-credit decisioned • See which offset account is linked and how much you have saved (will be rolled out to our mobile app in 1H22) • Switch to fixed rate for existing customers • Digital Top Ups and Variations will be rolled out in 1H22 |
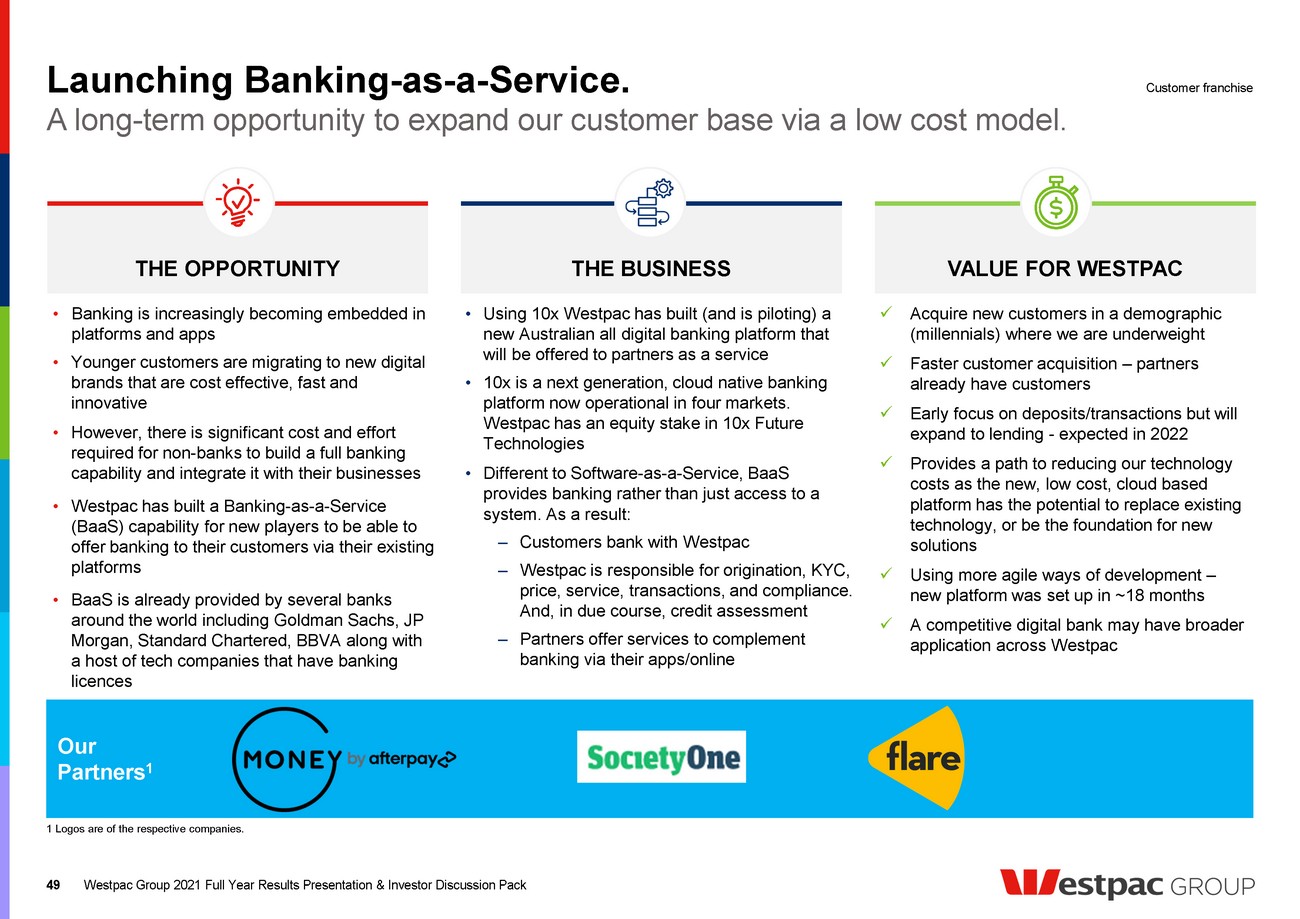
| Launching Banking-as-a-Service. Westpac Group 2021 Full Year Results Presentation & Investor Discussion Pack A long-term opportunity to expand our customer base via a low cost model. 49 49 Our Partners 1 1 Logos are of the respective companies. VALUE FOR WESTPAC THE BUSINESS THE OPPORTUNITY • Banking is increasingly becoming embedded in platforms and apps • Younger customers are migrating to new digital brands that are cost effective, fast and innovative • However, there is significant cost and effort required for non-banks to build a full banking capability and integrate it with their businesses • Westpac has built a Banking-as-a-Service (BaaS) capability for new players to be able to offer banking to their customers via their existing platforms • BaaS is already provided by several banks around the world including Goldman Sachs, JP Morgan, Standard Chartered, BBVA along with a host of tech companies that have banking licences • Using 10x Westpac has built (and is piloting) a new Australian all digital banking platform that will be offered to partners as a service • 10x is a next generation, cloud native banking platform now operational in four markets. Westpac has an equity stake in 10x Future Technologies • Different to Software-as-a-Service, BaaS provides banking rather than just access to a system. As a result: ‒ Customers bank with Westpac ‒ Westpac is responsible for origination, KYC, price, service, transactions, and compliance. And, in due course, credit assessment ‒ Partners offer services to complement banking via their apps/online Acquire new customers in a demographic (millennials) where we are underweight Faster customer acquisition – partners already have customers Early focus on deposits/transactions but will expand to lending - expected in 2022 Provides a path to reducing our technology costs as the new, low cost, cloud based platform has the potential to replace existing technology, or be the foundation for new solutions Using more agile ways of development – new platform was set up in ~18 months A competitive digital bank may have broader application across Westpac Customer franchise |
| Provisions for customer refunds, payments and associated costs 1 ($m) 2017 2018 2019 2020 2021 Total Banking 94 122 362 144 (135) 587 Wealth 75 146 802 208 251 1,482 Implementation costs - 62 232 196 195 685 Cash earnings impact of above 118 231 977 384 218 1,928 Customer remediation. Provisions for customer compensation and associated costs Net provisions of $311m raised in FY21 including for: • Refunds associated with certain ongoing advice fees charged by the Group’s salaried financial planners and authorised representatives • Refunds to past BT Advice customers who were not advised of historical corporate actions or were charged fees without adequate disclosure • Customer remediation in Westpac New Zealand • Costs associated with the implementation and completion of remediation programs • Partly offset by a release of provisions related to businesses provided a business loan instead of a loan covered by the National Consumer Credit Protection Act and the National Credit Code 1 Excludes provisions and costs associated with litigation. Significant acceleration of remediation payments in FY21 • In FY21 we paid or offered over $1bn to approximately 1 million customers and substantially completed the two largest legacy Advice programs • To date we have paid more than $1.5bn to customers • Continuing focus is on further initiatives to speed up payments to customers, including simplification and standardisation of remediation policies, processes and tools 50 Westpac Group 2021 Full Year Results Presentation & Investor Discussion Pack Customer franchise |

| Customer Outcomes and Risk Excellence (CORE) program. 1 At 30 September 2021. Definition of Submitted, Completed and Closed are as following: Completed means Activities have been finalised but not yet submitted to Promontory Australia for assessment. Submitted means Activities have been completed and submitted to Promontory Australia for assessment. Closed means Activities have been completed and assessed by Promontory Australia as complete and effective. • Strengthening risk governance, accountability and risk culture • 19 workstreams, 80 deliverables and 327 activities • Group Executive accountability, including remuneration • Quarterly independent assurance by Promontory Australia Over one third of CORE activities completed, submitted and closed 1 102 19 28 Closed Submitted Complete Total Delivery of CORE activities yet to be completed and submitted 40 80 160 120 200 240 280 Sep Sep Mar Jun Sep Mar Jun Dec Jun Dec Mar Dec CY2021 CY2022 CY2023 ~95% of Design activities complete ~95% of Implement activities complete 100% of Embed activities complete Design Implement Embed Classification of activities 327 121 submitted 149 completed Governance Westpac Group 2021 Full Year Results Presentation & Investor Discussion Pack 51 |

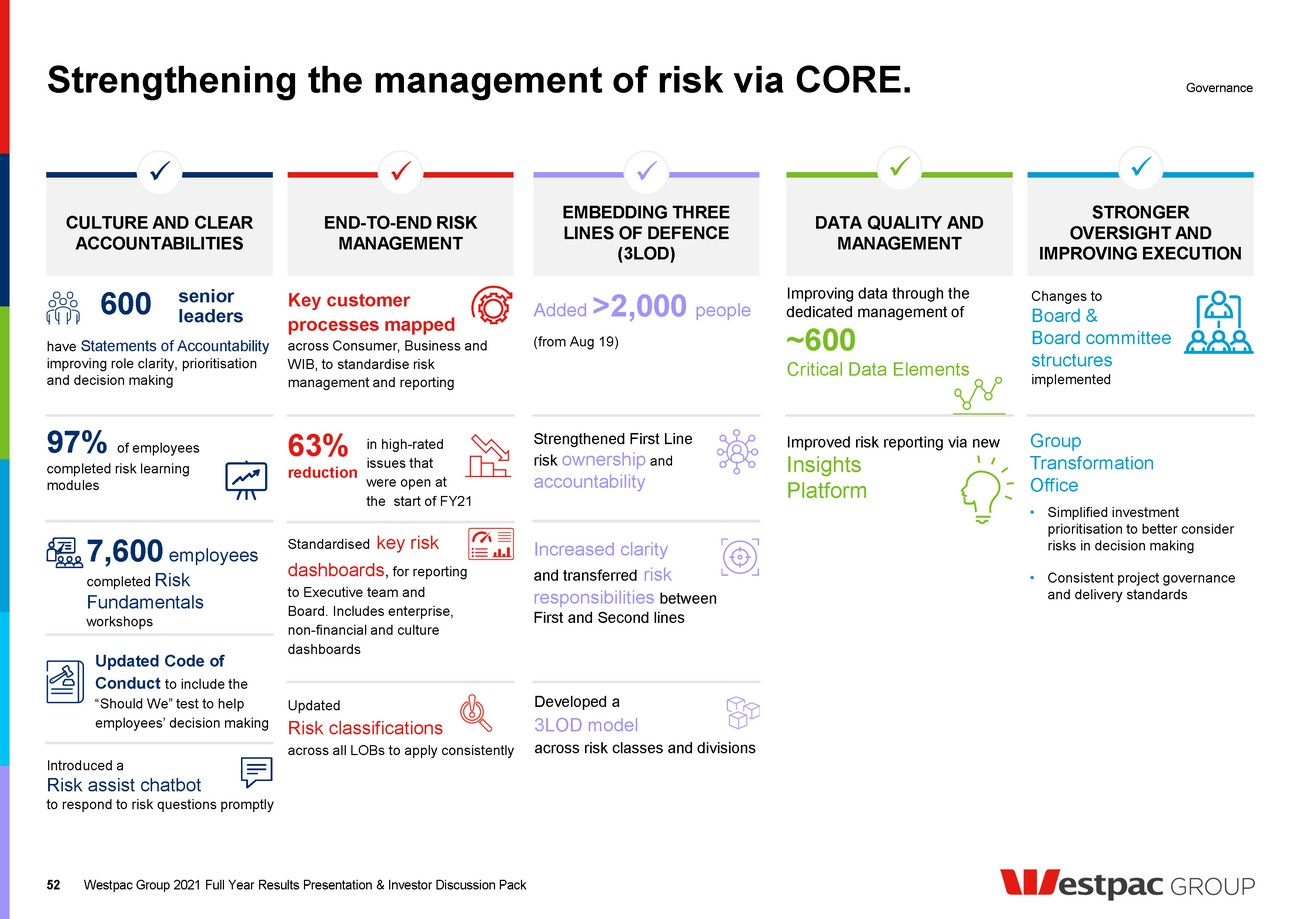
| STRONGER OVERSIGHT AND IMPROVING EXECUTION CULTURE AND CLEAR ACCOUNTABILITIES END-TO-END RISK MANAGEMENT EMBEDDING THREE LINES OF DEFENCE (3LOD) DATA QUALITY AND MANAGEMENT Strengthening the management of risk via CORE. Westpac Group 2021 Full Year Results Presentation & Investor Discussion Pack 52 Governance Changes to Board & Board committee structures implemented 7,600 employees completed Risk Fundamentals workshops Standardised key risk dashboards , for reporting to Executive team and Board. Includes enterprise, non-financial and culture dashboards Strengthened First Line risk ownership and accountability Improved risk reporting via new Insights Platform 600 have Statements of Accountability improving role clarity, prioritisation and decision making senior leaders 97% of employees completed risk learning modules Updated Code of Conduct to include the “Should We” test to help employees’ decision making Introduced a Risk assist chatbot to respond to risk questions promptly Key customer processes mapped across Consumer, Business and WIB, to standardise risk management and reporting 63% reduction in high-rated issues that were open at the start of FY21 Updated Risk classifications across all LOBs to apply consistently Added >2,000 people (from Aug 19) Developed a 3LOD model across risk classes and divisions Increased clarity and transferred risk responsibilities between First and Second lines Improving data through the dedicated management of ~600 Critical Data Elements Group Transformation Office • Simplified investment prioritisation to better consider risks in decision making • Consistent project governance and delivery standards |
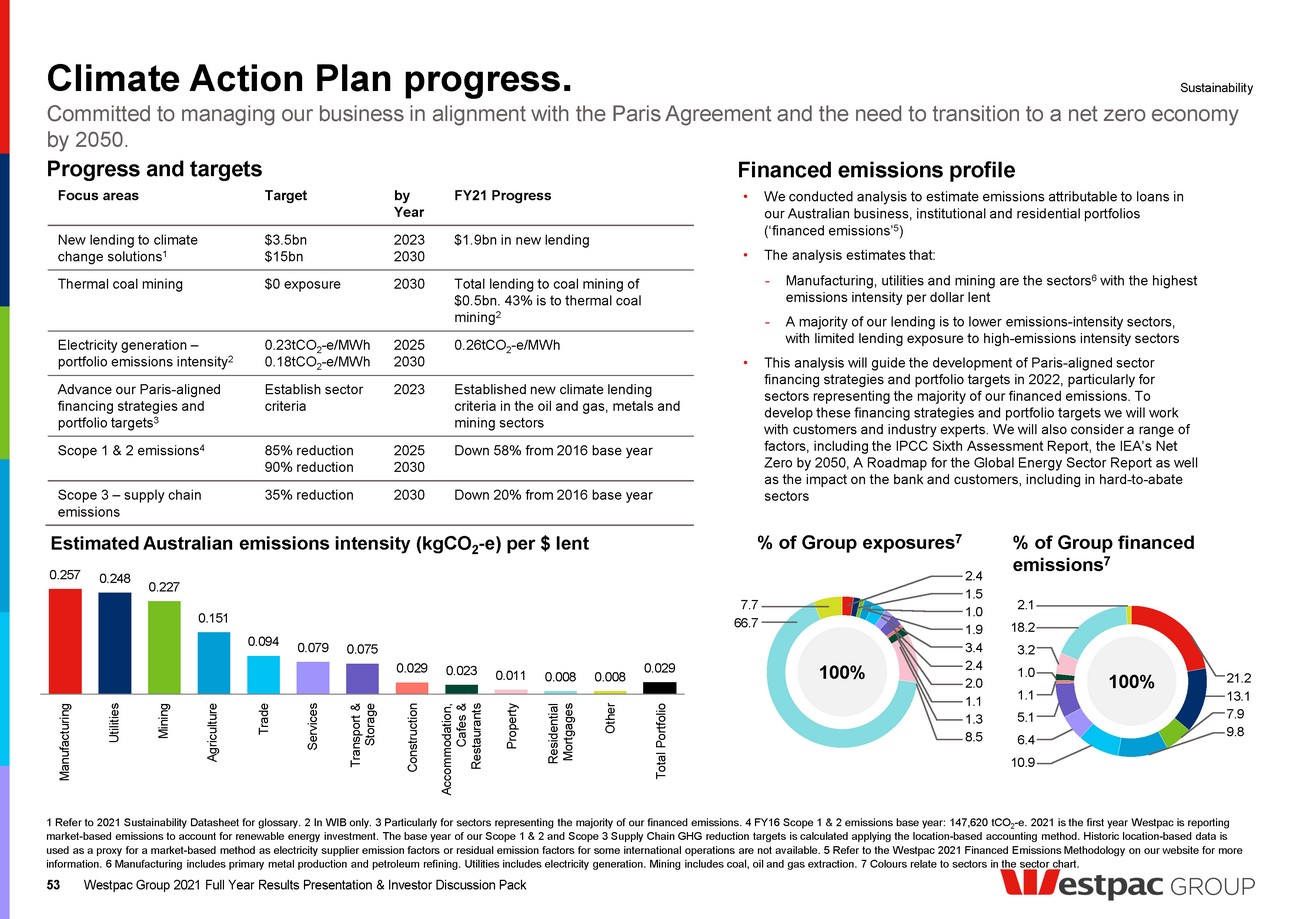
| • We conducted analysis to estimate emissions attributable to loans in our Australian business, institutional and residential portfolios (‘financed emissions’ 5) • The analysis estimates that: - Manufacturing, utilities and mining are the sectors6 with the highest emissions intensity per dollar lent - A majority of our lending is to lower emissions-intensity sectors, with limited lending exposure to high-emissions intensity sectors • This analysis will guide the development of Paris-aligned sector financing strategies and portfolio targets in 2022, particularly for sectors representing the majority of our financed emissions. To develop these financing strategies and portfolio targets we will work with customers and industry experts. We will also consider a range of factors, including the IPCC Sixth Assessment Report, the IEA’s Net Zero by 2050, A Roadmap for the Global Energy Sector Report as well as the impact on the bank and customers, including in hard-to-abate sectors 0.257 0.248 0.227 0.151 0.094 0.079 0.075 0.029 0.023 0.011 0.008 0.008 0.029 Manufacturing Utilities Mining Agriculture Trade Services Transport & Storage Construction Accomodation, Cafes & Restaurants Property Residential Mortgages Other Total Portfolio Estimated Australian emissions intensity (kgCO 2-e) per $ lent % of Group exposures 7 % of Group financed emissions 7 100% Manufacturing Utilities Mining Agriculture Trade Transport & Storage Services Construction Accommodation, Cafes & Restaurants Property Residential Mortgages Other Total Portfolio Focus areas Target by Year FY21 Progress New lending to climate change solutions 1 $3.5bn $15bn 2023 2030 $1.9bn in new lending Thermal coal mining $0 exposure 2030 Total lending to coal mining of $0.5bn. 43% is to thermal coal mining 2 Electricity generation – portfolio emissions intensity 2 0.23tCO 2-e/MWh 0.18tCO 2-e/MWh 2025 2030 0.26tCO 2-e/MWh Advance our Paris-aligned financing strategies and portfolio targets 3 Establish sector criteria 2023 Established new climate lending criteria in the oil and gas, metals and mining sectors Scope 1 & 2 emissions 4 85% reduction 90% reduction 2025 2030 Down 58% from 2016 base year Scope 3 – supply chain emissions 35% reduction 2030 Down 20% from 2016 base year Climate Action Plan progress . 53 Committed to managing our business in alignment with the Paris Agreement and the need to transition to a net zero economy by 2050. Sustainability Westpac Group 2021 Full Year Results Presentation & Investor Discussion Pack Progress and targets Financed emissions profile 1 Refer to 2021 Sustainability Datasheet for glossary. 2 In WIB only. 3 Particularly for sectors representing the majority of our financed emissions. 4 FY16 Scope 1 & 2 emissions base year: 147,620 tCO 2-e. 2021 is the first year Westpac is reporting market-based emissions to account for renewable energy investment. The base year of our Scope 1 & 2 and Scope 3 Supply Chain GHG reduction targets is calculated applying the location-based accounting method. Historic location-based data is used as a proxy for a market-based method as electricity supplier emission factors or residual emission factors for some international operations are not available. 5 Refer to the Westpac 2021 Financed Emissions Methodology on our website for more information. 6 Manufacturing includes primary metal production and petroleum refining. Utilities includes electricity generation. Mining includes coal, oil and gas extraction. 7 Colours relate to sectors in the sector chart. 2.4 1.5 1.0 1.9 3.4 2.4 2.0 1.1 1.3 8.5 7.7 66.7 21.2 13.1 7.9 9.8 2.1 18.2 3.2 1.0 1.1 5.1 6.4 10.9 100% |
| Climate-related disclosures – scenario analysis. 54 Managing climate-related risk • We continue to integrate climate-related risks and opportunities into our operations. This includes alignment with the recommendations of the Task Force on Climate-related Financial Disclosures (TCFD), referenced in APRA’s draft Prudential Practice Guide on Climate Change Financial Risks • Climate change-related risks are managed within the Group’s Risk Management Framework • Participating in APRA’s 2021 Climate Vulnerability Assessment Transition risk – key points • Transition climate risk includes regulatory, market and technology changes when moving to a greener economy. This can result in changes to costs, income, profits, investment preferences and asset viability • Our analysis of transition risk focuses on our Australian business and institutional lending 1 and exposure to sectors that may face growth constraints under 1.5- degree and 2-degree scenarios 2 • Approximately 1.1% of our current Australian business and institutional lending is exposed to sectors that by 2030 may experience higher risk 3 in a transition to a 1.5-degree economy. Under a 2050 scenario this is 2.4% Physical risk – key points • Physical climate risk refers to changes in climate and the frequency and magnitude of extreme weather events, with impacts including direct damage to assets or property • Updated our approach to assessing the impact of extreme weather events under climate change scenarios on our Australian mortgage portfolio 5,6 • Focused on the Australian mortgage portfolio and exposure to locations that may face increased physical risk under an IPCC RCP 7 8.5 and RCP 2.6 Scenarios • Approximately 3.8% of the current Australian mortgage portfolio may be exposed to higher physical risk 8 under an IPCC RCP 8.5 Scenario, and 3.3% under an IPCC RCP 2.6 Scenario by 2050 • Advanced work to understand how best to support our agribusiness customers in Australia and New Zealand to manage climate risk 1 Australian lending, excludes retail, sovereign, and bank exposures. 2 For further information see Westpac’s FY21 Sustainability Supplement. 3 Sectors whose medium (2030) and long-term (2050) performance under a scenario deviated by more than one standard deviation below average GDP growth, were classified as ‘higher risk’. 4 Initial focus on WIB customers. 5 Excludes Equity Access. 6 Considers riverine or surface water flooding, coastal inundation, forest fires, extreme wind including cyclones and soil subsidence. For further information see 2021 Sustainability Supplement. 7 Intergovernmental Panel on Climate Change (IPCC) Representative Concentration Pathway (RCP). 8 ‘Higher risk’ were locations where insurance may become more expensive or unavailable. Sustainability Westpac Group 2021 Full Year Results Presentation & Investor Discussion Pack Sector criteria updates – key points • During the year we continued work on our sector-based approaches for sectors that represent the majority of our financed emissions • Following engagement with customers, we refined our approach, with a focus on WIB’s oil and gas exploration, production and refining customers, and we will: expect any new oil and gas exploration, production and refining customers, to whom we provide lending, to have publicly disclosed Paris-aligned business goals support existing customers as they develop their Paris-aligned business strategies, including decarbonisation and capital allocation plans continue to develop our approach and understanding of climate-related risk and opportunities in the oil and gas sector (including downstream segments) through engagement with our customers 4 For more information, please refer to the 2021 Sustainability Supplement • For metallurgical coal mining, diversified mining and primary metal production, we will: expect all new customers, to whom we provide lending, to have publicly disclosed Paris-aligned business goals support existing customers as they develop their Paris-aligned business strategies, including decarbonisation and capital allocation plans |
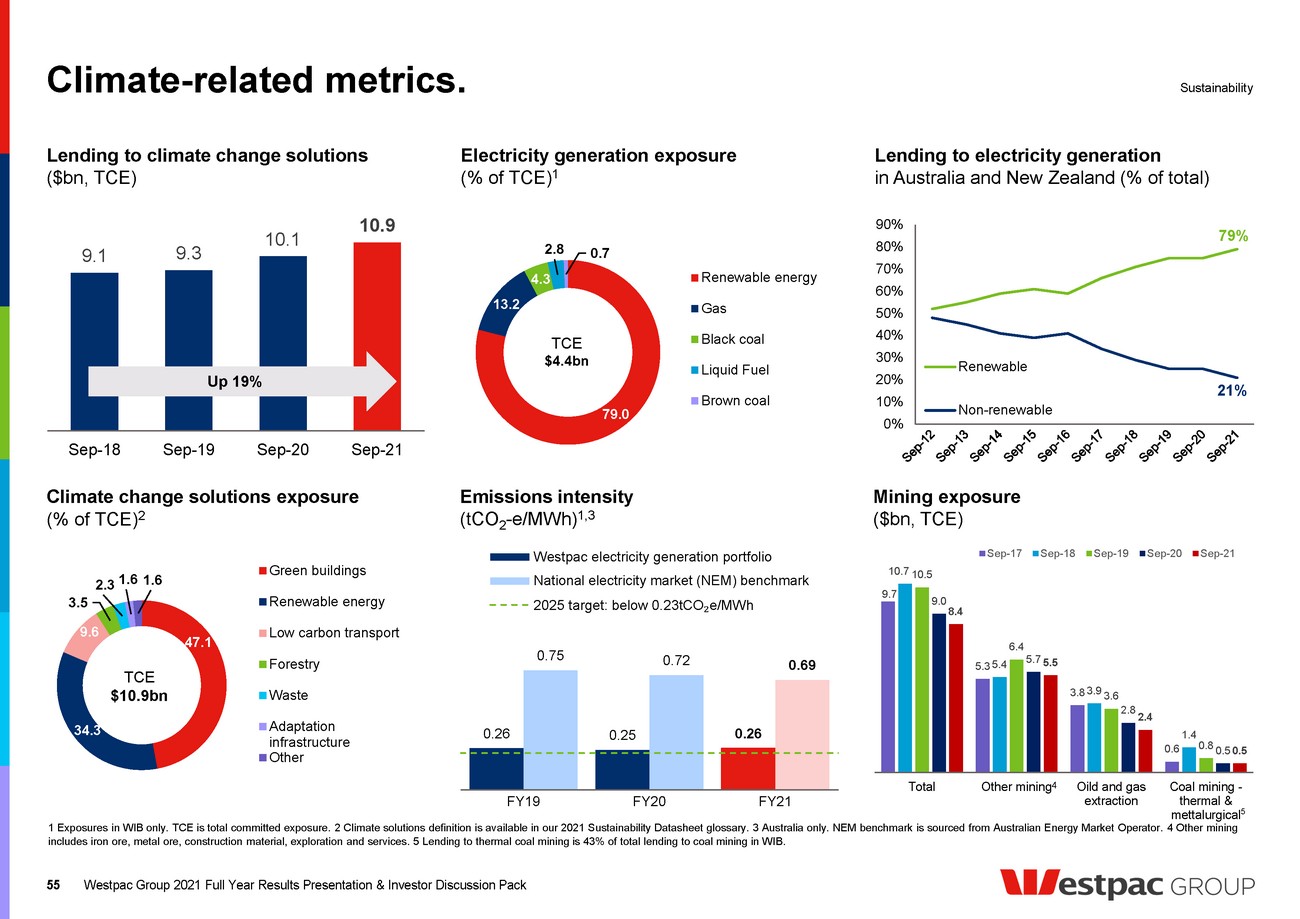
| 9.7 5.3 3.8 0.6 10.7 5.4 3.9 1.4 10.5 6.4 3.6 0.8 9.0 5.7 2.8 0.5 8.4 5.5 2.4 0.5 Total Other mining Oild and gas extraction Coal mining - thermal & mettalurgical Sep-17 Sep-18 Sep-19 Sep-20 Sep-21 79.0 13.2 4.3 2.8 0.7 Renewable energy Gas Black coal Liquid Fuel Brown coal 79% 21% 0% 10% 20% 30% 40% 50% 60% 70% 80% 90% Renewable Non-renewable Climate-related metrics. 55 Lending to climate change solutions ($bn, TCE) 9.1 9.3 10.1 10.9 Sep-18 Sep-19 Sep-20 Sep-21 Climate change solutions exposure (% of TCE) 2 Electricity generation exposure (% of TCE) 1 1 Exposures in WIB only. TCE is total committed exposure. 2 Climate solutions definition is available in our 2021 Sustainability Datasheet glossary. 3 Australia only. NEM benchmark is sourced from Australian Energy Market Operator. 4 Other mining includes iron ore, metal ore, construction material, exploration and services. 5 Lending to thermal coal mining is 43% of total lending to coal mining in WIB. Sustainability Westpac Group 2021 Full Year Results Presentation & Investor Discussion Pack Up 19% Mining exposure ($bn, TCE) Emissions intensity (tCO 2-e/MWh) 1,3 Lending to electricity generation in Australia and New Zealand (% of total) TCE $4.4bn 5 4 0.26 0.25 0.26 0.75 0.72 0.69 FY19 FY20 FY21 Westpac electricity generation portfolio National electricity market (NEM) benchmark 2025 target: below 0.23tCO ₂e/MWh 47.1 34.3 9.6 3.5 2.3 1.6 1.6 Green buildings Renewable energy Low carbon transport Forestry Waste Adaptation infrastructure Other TCE $10.9bn |
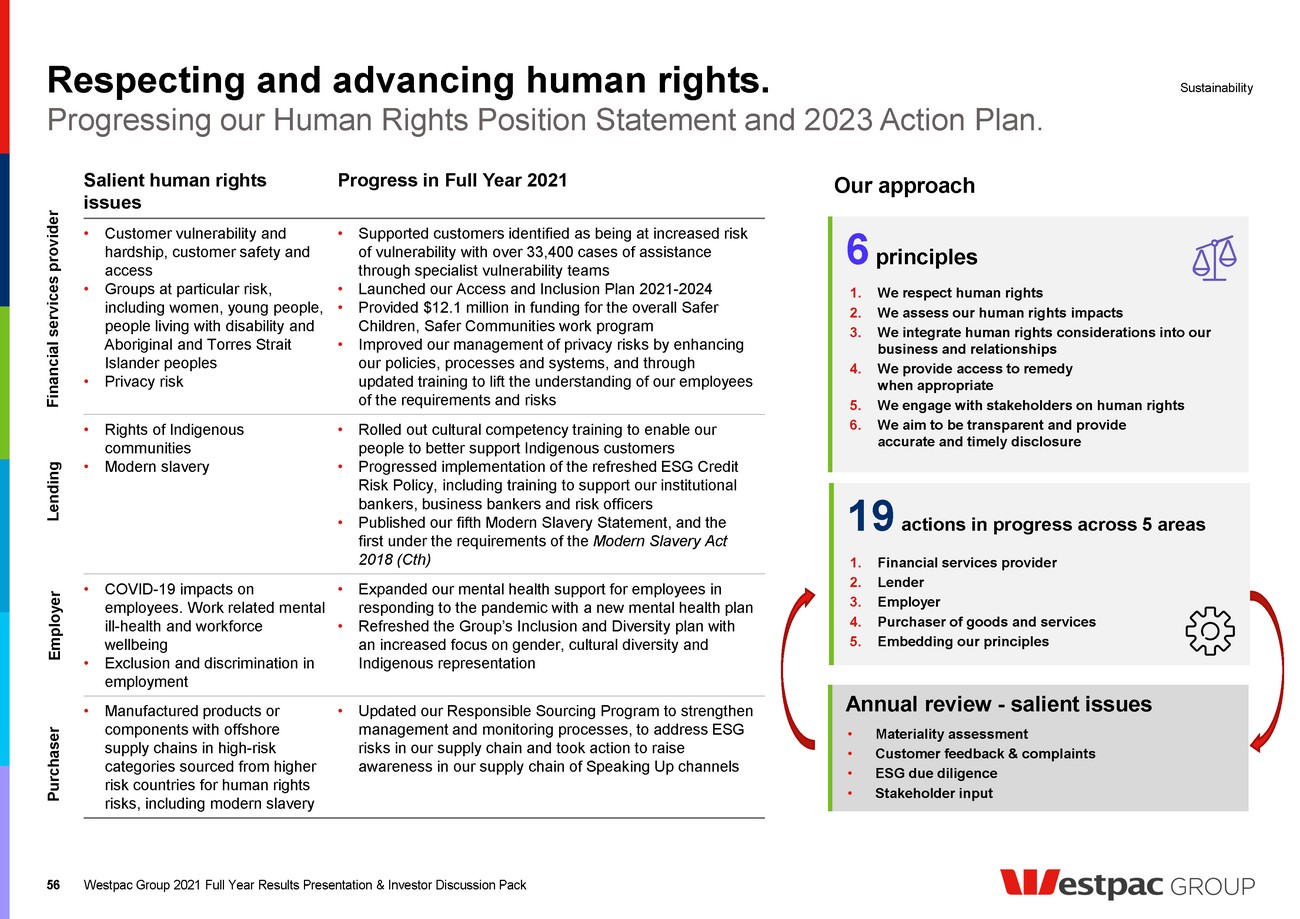
| 6 principles 1. We respect human rights 2. We assess our human rights impacts 3. We integrate human rights considerations into our business and relationships 4. We provide access to remedy when appropriate 5. We engage with stakeholders on human rights 6. We aim to be transparent and provide accurate and timely disclosure Respecting and advancing human rights. 56 Our approach Salient human rights issues Progress in Full Year 2021 • Customer vulnerability and hardship, customer safety and access • Groups at particular risk, including women, young people, people living with disability and Aboriginal and Torres Strait Islander peoples • Privacy risk • Supported customers identified as being at increased risk of vulnerability with over 33,400 cases of assistance through specialist vulnerability teams • Launched our Access and Inclusion Plan 2021-2024 • Provided $12.1 million in funding for the overall Safer Children, Safer Communities work program • Improved our management of privacy risks by enhancing our policies, processes and systems, and through updated training to lift the understanding of our employees of the requirements and risks • Rights of Indigenous communities • Modern slavery • Rolled out cultural competency training to enable our people to better support Indigenous customers • Progressed implementation of the refreshed ESG Credit Risk Policy, including training to support our institutional bankers, business bankers and risk officers • Published our fifth Modern Slavery Statement, and the first under the requirements of the Modern Slavery Act 2018 (Cth) • COVID-19 impacts on employees. Work related mental ill-health and workforce wellbeing • Exclusion and discrimination in employment • Expanded our mental health support for employees in responding to the pandemic with a new mental health plan • Refreshed the Group’s Inclusion and Diversity plan with an increased focus on gender, cultural diversity and Indigenous representation • Manufactured products or components with offshore supply chains in high-risk categories sourced from higher risk countries for human rights risks, including modern slavery • Updated our Responsible Sourcing Program to strengthen management and monitoring processes, to address ESG risks in our supply chain and took action to raise awareness in our supply chain of Speaking Up channels Progressing our Human Rights Position Statement and 2023 Action Plan. Sustainability Westpac Group 2021 Full Year Results Presentation & Investor Discussion Pack 19 actions in progress across 5 areas Annual review - salient issues Financial services provider Lending Employer Purchaser 1. Financial services provider 2. Lender 3. Employer 4. Purchaser of goods and services 5. Embedding our principles • Materiality assessment • Customer feedback & complaints • ESG due diligence • Stakeholder input |
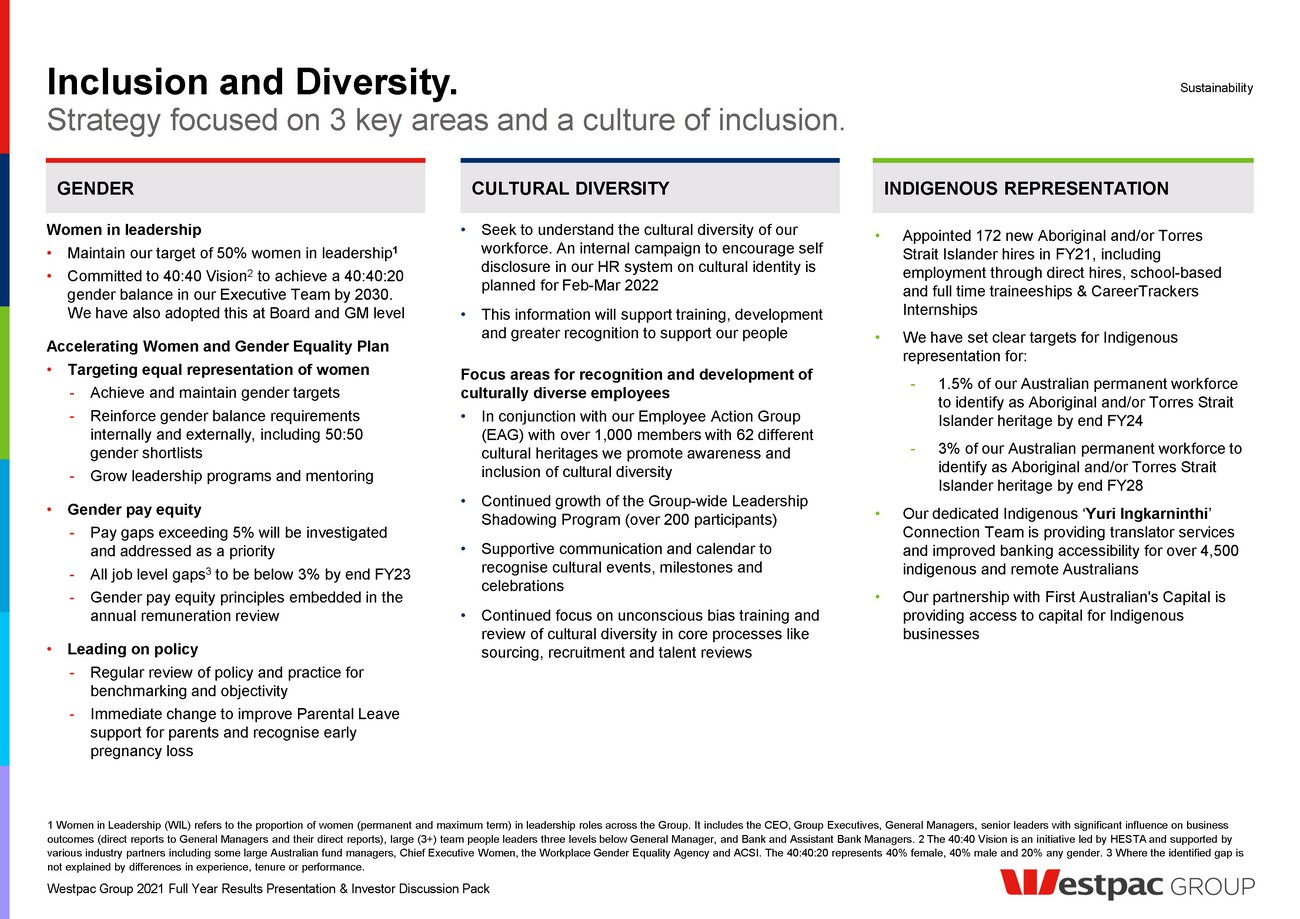
| Women in leadership • Maintain our target of 50% women in leadership 1 • Committed to 40:40 Vision 2 to achieve a 40:40:20 gender balance in our Executive Team by 2030. We have also adopted this at Board and GM level Accelerating Women and Gender Equality Plan • Targeting equal representation of women - Achieve and maintain gender targets - Reinforce gender balance requirements internally and externally, including 50:50 gender shortlists - Grow leadership programs and mentoring • Gender pay equity - Pay gaps exceeding 5% will be investigated and addressed as a priority - All job level gaps 3 to be below 3% by end FY23 - Gender pay equity principles embedded in the annual remuneration review • Leading on policy - Regular review of policy and practice for benchmarking and objectivity - Immediate change to improve Parental Leave support for parents and recognise early pregnancy loss CULTURAL DIVERSITY GENDER INDIGENOUS REPRESENTATION 1 Women in Leadership (WIL) refers to the proportion of women (permanent and maximum term) in leadership roles across the Group. It includes the CEO, Group Executives, General Managers, senior leaders with significant influence on business outcomes (direct reports to General Managers and their direct reports), large (3+) team people leaders three levels below General Manager, and Bank and Assistant Bank Managers. 2 The 40:40 Vision is an initiative led by HESTA and supported by various industry partners including some large Australian fund managers, Chief Executive Women, the Workplace Gender Equality Agency and ACSI. The 40:40:20 represents 40% female, 40% male and 20% any gender. 3 Where the identified gap is not explained by differences in experience, tenure or performance. Strategy focused on 3 key areas and a culture of inclusion. Sustainability • Appointed 172 new Aboriginal and/or Torres Strait Islander hires in FY21, including employment through direct hires, school-based and full time traineeships & CareerTrackers Internships • We have set clear targets for Indigenous representation for: - 1.5% of our Australian permanent workforce to identify as Aboriginal and/or Torres Strait Islander heritage by end FY24 - 3% of our Australian permanent workforce to identify as Aboriginal and/or Torres Strait Islander heritage by end FY28 • Our dedicated Indigenous ‘ Yuri Ingkarninthi ’ Connection Team is providing translator services and improved banking accessibility for over 4,500 indigenous and remote Australians • Our partnership with First Australian's Capital is providing access to capital for Indigenous businesses Inclusion and Diversity. Westpac Group 2021 Full Year Results Presentation & Investor Discussion Pack • Seek to understand the cultural diversity of our workforce. An internal campaign to encourage self disclosure in our HR system on cultural identity is planned for Feb-Mar 2022 • This information will support training, development and greater recognition to support our people Focus areas for recognition and development of culturally diverse employees • In conjunction with our Employee Action Group (EAG) with over 1,000 members with 62 different cultural heritages we promote awareness and inclusion of cultural diversity • Continued growth of the Group-wide Leadership Shadowing Program (over 200 participants) • Supportive communication and calendar to recognise cultural events, milestones and celebrations • Continued focus on unconscious bias training and review of cultural diversity in core processes like sourcing, recruitment and talent reviews |
| Earnings drivers ,11estpac GROUP |
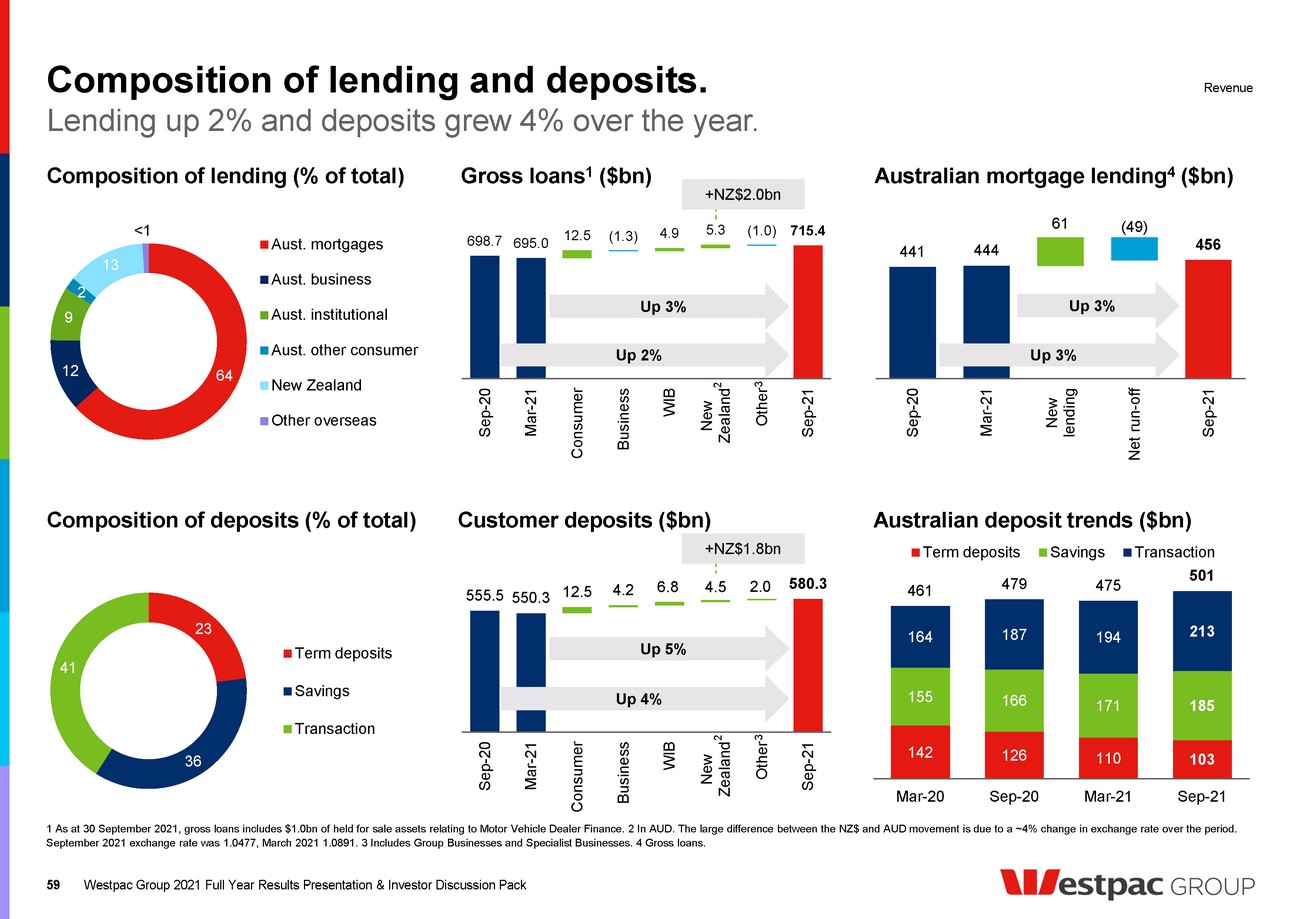
| 698.7 695.0 12.5 4.9 5.3 715.4 (1.3) (1.0) Sep-20 Mar-21 Consumer Business WIB New Zealand Other Sep-21 +NZ$2.0bn 555.5 550.3 12.5 4.2 6.8 4.5 2.0 580.3 Sep-20 Mar-21 Consumer Business WIB New Zealand Other Sep-21 142 126 110 103 155 166 171 185 164 187 194 213 461 479 475 501 Mar-20 Sep-20 Mar-21 Sep-21 Term deposits Savings Transaction Composition of lending and deposits. Composition of lending (% of total) 64 12 9 2 13 <1 Aust. mortgages Aust. business Aust. institutional Aust. other consumer New Zealand Other overseas 59 Gross loans 1 ($bn) Customer deposits ($bn) 1 As at 30 September 2021, gross loans includes $1.0bn of held for sale assets relating to Motor Vehicle Dealer Finance. 2 In AUD. The large difference between the NZ$ and AUD movement is due to a ~4% change in exchange rate over the period. September 2021 exchange rate was 1.0477, March 2021 1.0891. 3 Includes Group Businesses and Specialist Businesses. 4 Gross loans. Revenue 2 Australian mortgage lending 4 ($bn) 441 444 61 456 (49) Sep-20 Mar-21 New lending Net run-off Sep-21 Composition of deposits (% of total) Lending up 2% and deposits grew 4% over the year. Up 2% Up 3% Up 3% Up 3% 23 36 41 Term deposits Savings Transaction Up 4% Up 5% Australian deposit trends ($bn) 3 2 3 +NZ$1.8bn Westpac Group 2021 Full Year Results Presentation & Investor Discussion Pack |
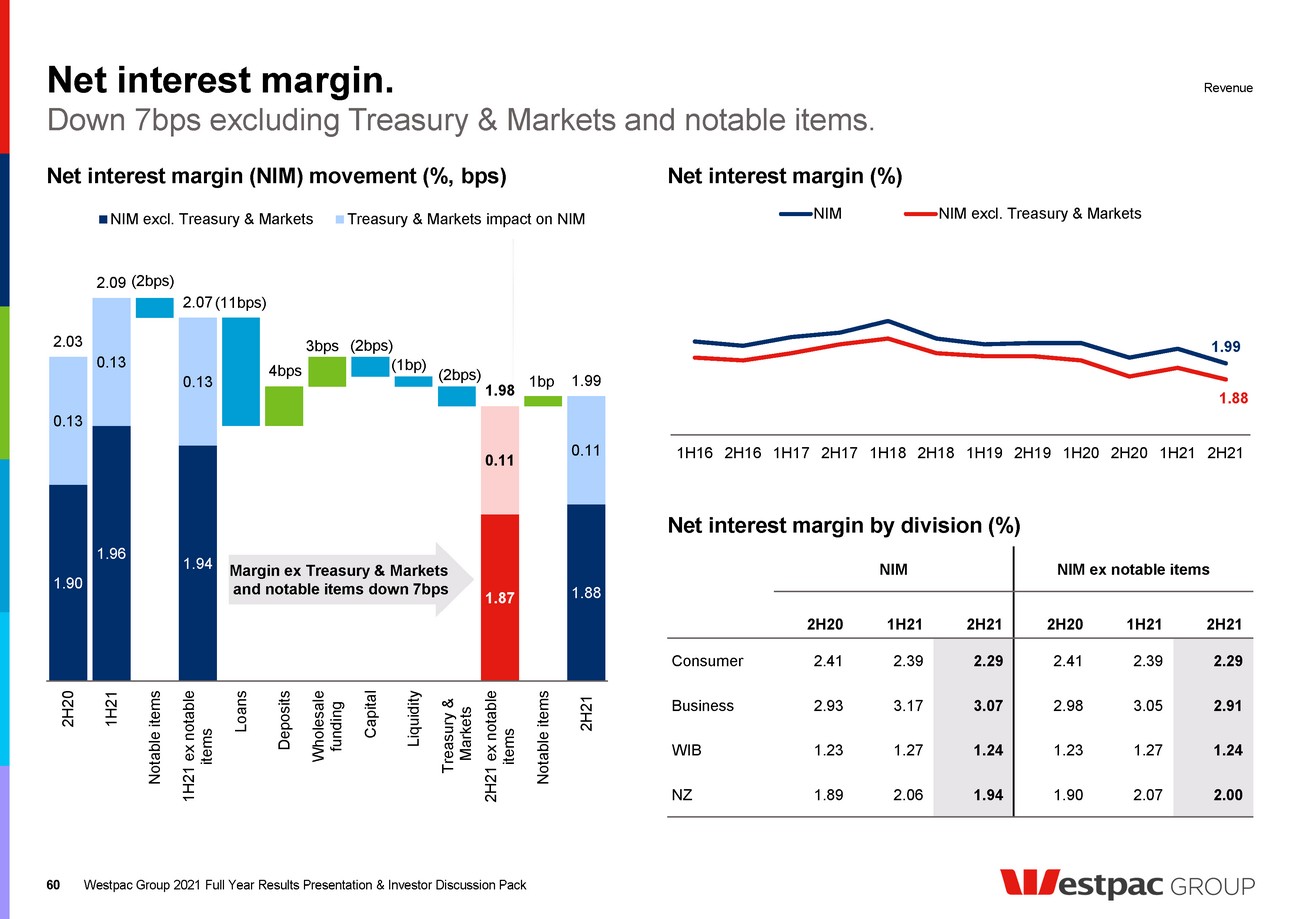
| Net interest margin. 60 Net interest margin (%) Net interest margin by division (%) Net interest margin (NIM) movement (%, bps) Down 7bps excluding Treasury & Markets and notable items. Revenue Westpac Group 2021 Full Year Results Presentation & Investor Discussion Pack 60 1.99 1.88 1H16 2H16 1H17 2H17 1H18 2H18 1H19 2H19 1H20 2H20 1H21 2H21 NIM NIM excl. Treasury & Markets NIM NIM ex notable items 2H20 1H21 2H21 2H20 1H21 2H21 Consumer 2.41 2.39 2.29 2.41 2.39 2.29 Business 2.93 3.17 3.07 2.98 3.05 2.91 WIB 1.23 1.27 1.24 1.23 1.27 1.24 NZ 1.89 2.06 1.94 1.90 2.07 2.00 1.90 1.96 1.94 1.87 1.88 0.13 0.13 (2bps) 0.13 (11bps) 4bps 3bps (2bps) (1bp) (2bps) 0.11 1bp 0.11 2.03 2.09 2.07 1.98 1.99 2H20 1H21 Notable items 1H21 ex notable items Loans Deposits Wholesale funding Capital Liquidity Treasury & Markets 2H21 ex notable items Notable items 2H21 NIM excl. Treasury & Markets Treasury & Markets impact on NIM Margin ex Treasury & Markets and notable items down 7bps |
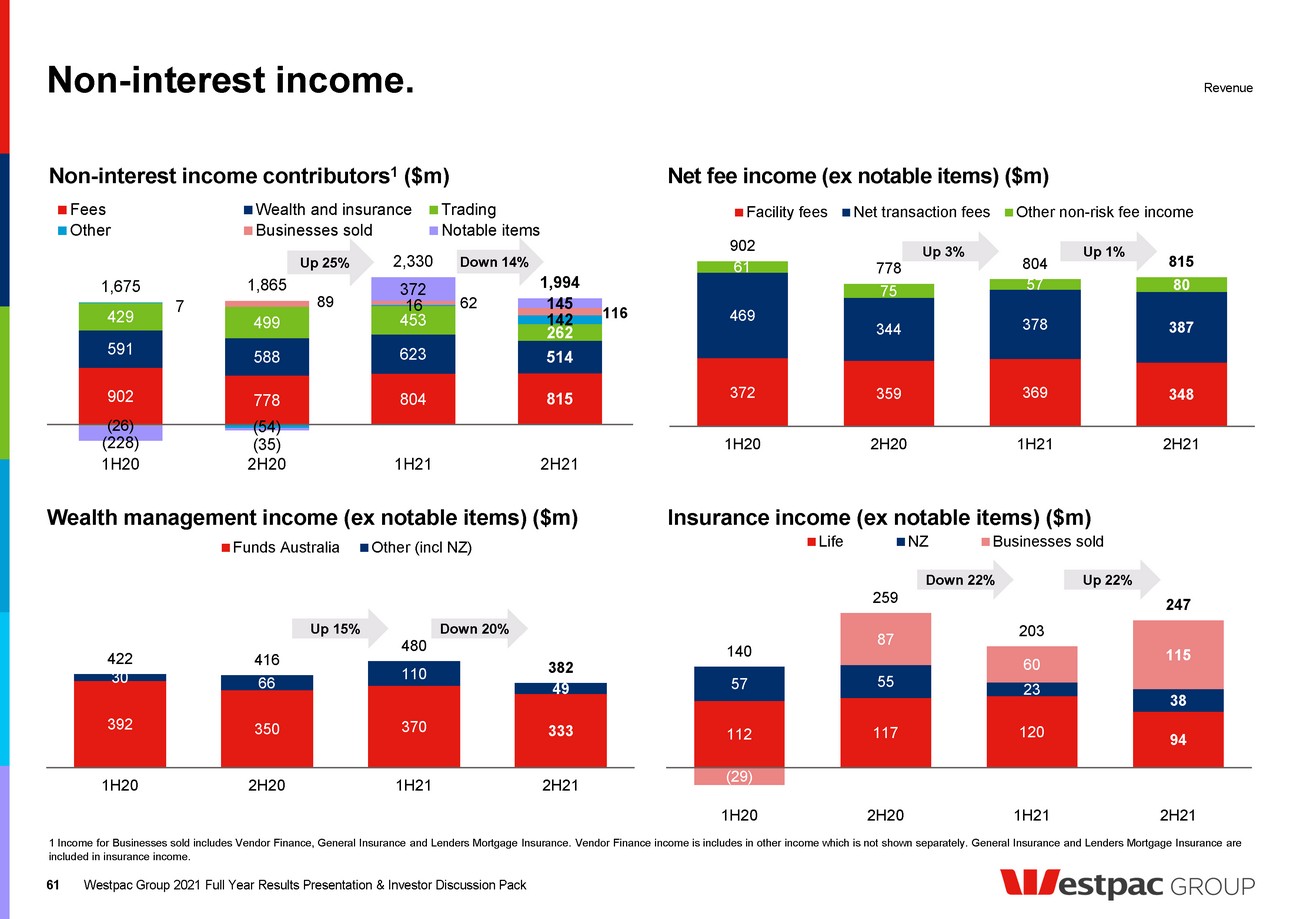
| 112 117 120 94 57 55 23 38 (29) 87 60 115 140 259 203 247 1H20 2H20 1H21 2H21 Life NZ Businesses sold 392 350 370 333 30 66 110 49 422 416 480 382 1H20 2H20 1H21 2H21 Funds Australia Other (incl NZ) Non-interest income. 61 Non-interest income contributors 1 ($m) Net fee income (ex notable items) ($m) Wealth management income (ex notable items) ($m) Insurance income (ex notable items) ($m) 1 Income for Businesses sold includes Vendor Finance, General Insurance and Lenders Mortgage Insurance. Vendor Finance income is includes in other income which is not shown separately. General Insurance and Lenders Mortgage Insurance are included in insurance income. Revenue Up 22% Down 22% Down 20% Up 15% Westpac Group 2021 Full Year Results Presentation & Investor Discussion Pack 372 359 369 348 469 344 378 387 61 75 57 80 902 778 804 815 1H20 2H20 1H21 2H21 Facility fees Net transaction fees Other non-risk fee income Up 1% Up 3% 902 778 804 815 591 588 623 514 429 499 453 262 7 (54) 16 142 (26) 89 62 116 (228) (35) 372 145 1,675 1,865 2,330 1,994 1H20 2H20 1H21 2H21 Fees Wealth and insurance Trading Other Businesses sold Notable items Down 14% Up 25% |
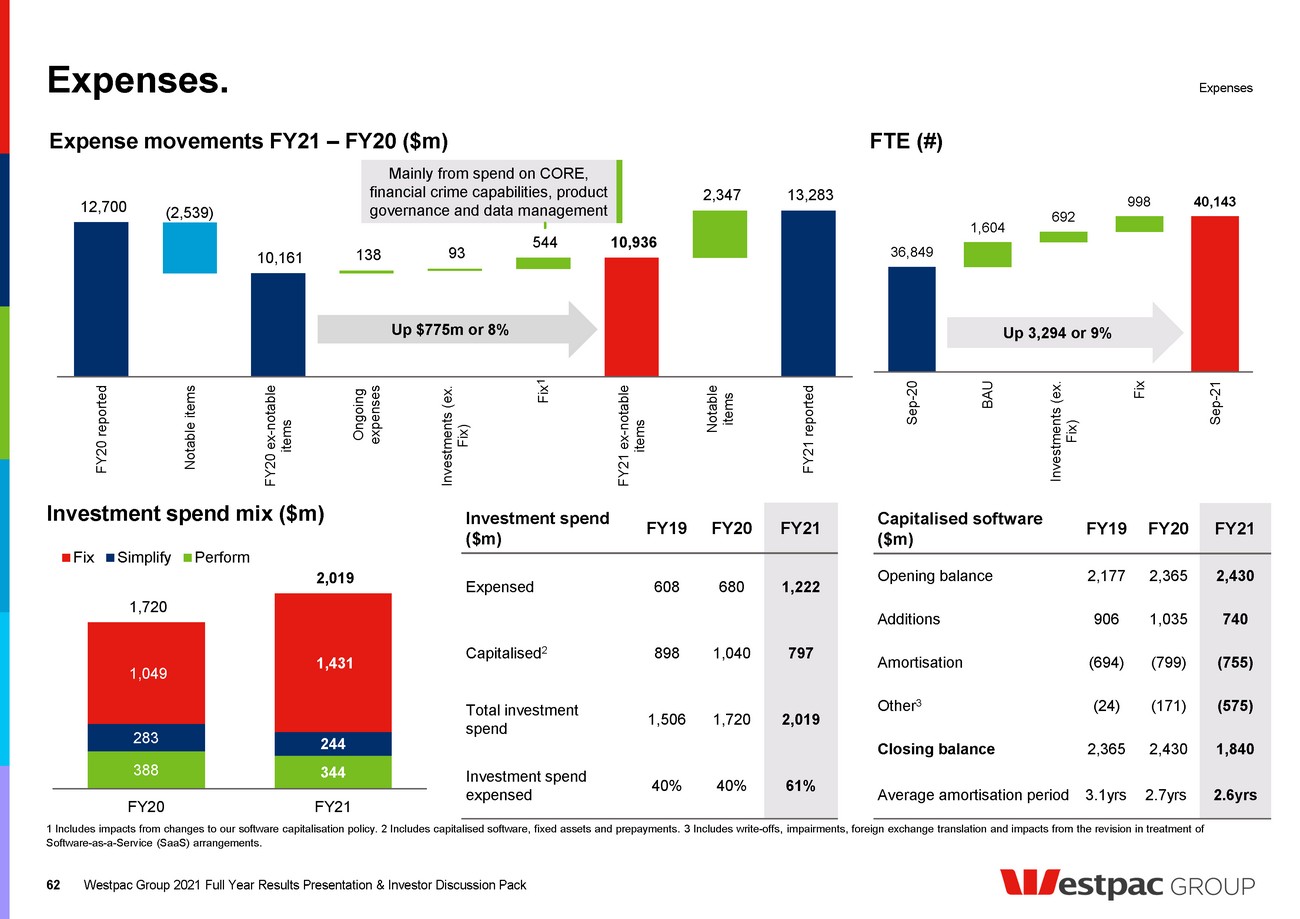
| Expense movements FY21 – FY20 ($m) Expenses. 62 FTE (#) Investment spend mix ($m) 388 344 283 244 1,049 1,431 1,720 2,019 FY20 FY21 Fix Simplify Perform Investment spend ($m) FY19 FY20 FY21 Expensed 608 680 1,222 Capitalised 2 898 1,040 797 Total investment spend 1,506 1,720 2,019 Investment spend expensed 40% 40% 61% Capitalised software ($m) FY19 FY20 FY21 Opening balance 2,177 2,365 2,430 Additions 906 1,035 740 Amortisation (694) (799) (755) Other 3 (24) (171) (575) Closing balance 2,365 2,430 1,840 Average amortisation period 3.1yrs 2.7yrs 2.6yrs Westpac Group 2021 Full Year Results Presentation & Investor Discussion Pack 1 Includes impacts from changes to our software capitalisation policy. 2 Includes capitalised software, fixed assets and prepayments. 3 Includes write-offs, impairments, foreign exchange translation and impacts from the revision in treatment of Software-as-a-Service (SaaS) arrangements. 10,161 10,392 12,700 10,161 138 93 544 10,936 2,347 13,283 (2,539) FY20 reported Notable items FY20 ex-notable items Ongoing expenses Investments (ex. Fix) Fix FY21 ex-notable items Notable items FY21 reported Up $775m or 8% 36,849 1,604 692 998 40,143 Sep-20 BAU Investments (ex. Fix) Fix Sep-21 Up 3,294 or 9% Mainly from spend on CORE, financial crime capabilities, product governance and data management 1 Expenses |
| Expense movements 2H21 – 1H21 ($m) Expenses. 63 FTE (#) Investment spend mix ($m) 218 184 160 152 100 144 622 572 859 992 856 1,163 2H20 1H21 2H21 Fix Simplify Perform Investment spend ($m) 2H20 1H21 2H21 Expensed 384 502 720 Capitalised 1 608 354 443 Total investment spend 992 856 1,163 Investment spend expensed 39% 59% 62% Capitalised software ($m) 2H20 1H21 2H21 Opening balance 2,335 2,430 2,260 Additions 605 348 392 Amortisation (406) (384) (371) Other 2 (104) (134) (441) Closing balance 2,430 2,260 1,840 Average amortisation period 2.7yrs 3.2yrs 2.6yrs Westpac Group 2021 Full Year Results Presentation & Investor Discussion Pack 1 Includes capitalised software, fixed assets and prepayments. 2 Includes write-offs, impairments, foreign exchange translation and impacts from the revision in treatment of Software-as-a-Service (SaaS) arrangements. 5,981 5,236 193 131 140 5,700 1,602 7,302 (745) 1H21 reported Notable items 1H21 ex-notable items Ongoing expenses Investments (ex Fix) Fix 2H21 ex-notable items Notable items 2H21 reported Up $464m or 9% 38,747 522 208 666 40,143 Mar-21 BAU Investments (ex. Fix) Fix Sep-21 Up 1,396 or 4% Expenses |
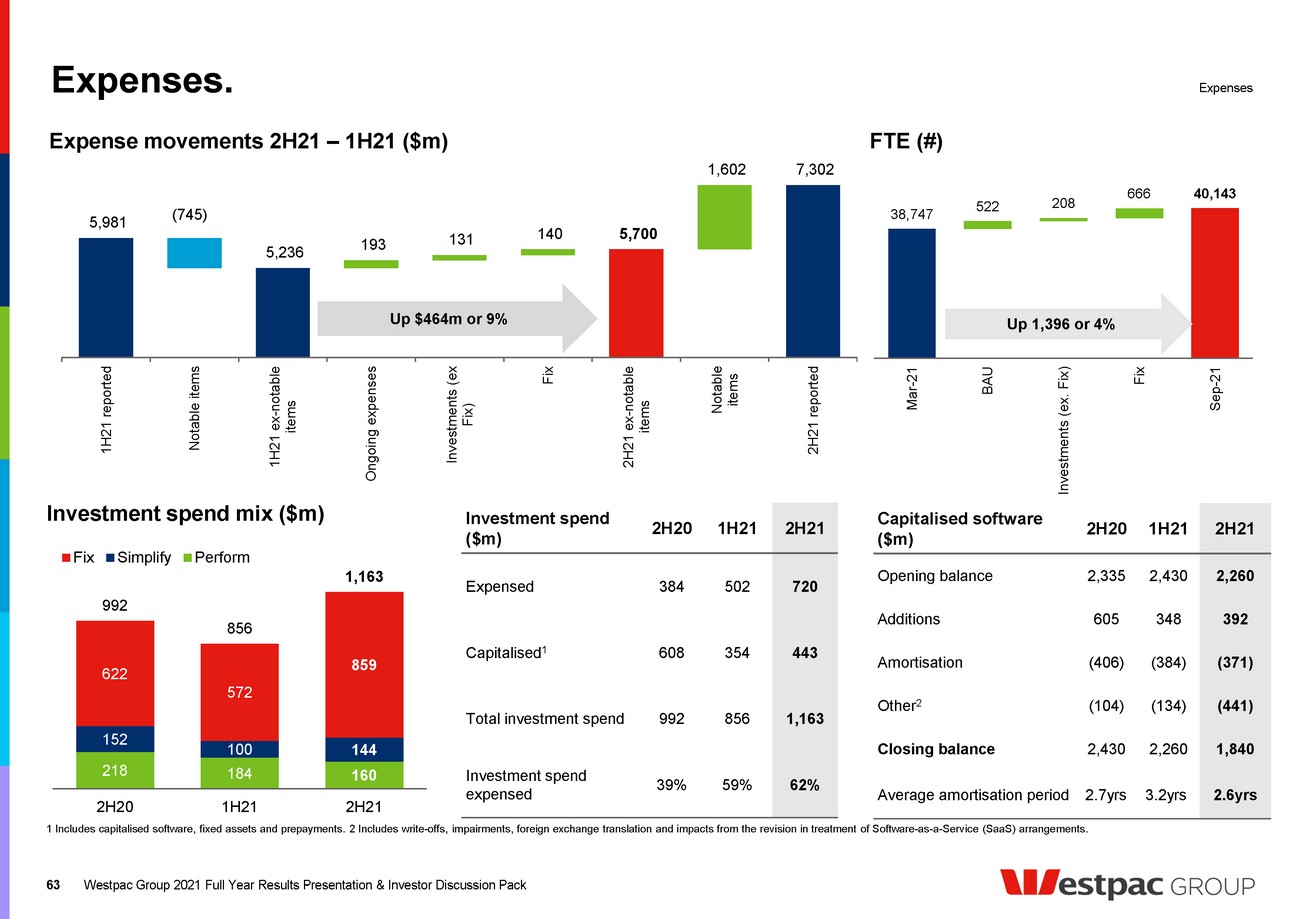
| 2H21 impairment benefit of $218m. Westpac Group 2021 Full Year Results Presentation & Investor Discussion Pack 64 Higher CAP release driven by resilient portfolio and refresh of portfolio overlays. 351 283 144 466 (170) (147) (194) (203) 438 438 318 296 1,619 366 (640) (777) 2,238 940 (372) (218) 1H20 2H20 1H21 2H21 1H20 2H20 1H21 2H21 1H20 2H20 1H21 2H21 1H20 2H20 1H21 2H21 1H20 2H20 1H21 2H21 Impairment charges and stressed exposures (bps) Impairment charges ($m ) New IAPs Write-backs & recoveries Write-offs direct Other mvmts in CAP Individually assessed Collectively assessed (6bps) 136bps -100 0 100 200 300 400 -20 0 20 40 60 80 2008 2009 2010 2011 2012 2013 2014 2015 2016 1H17 2H17 1H18 2H18 1H19 2H19 1H20 2H20 1H21 2H21 Impairment charge to average loans annualised (lhs) Stressed exposures to TCE (rhs) Total Impairment charges |
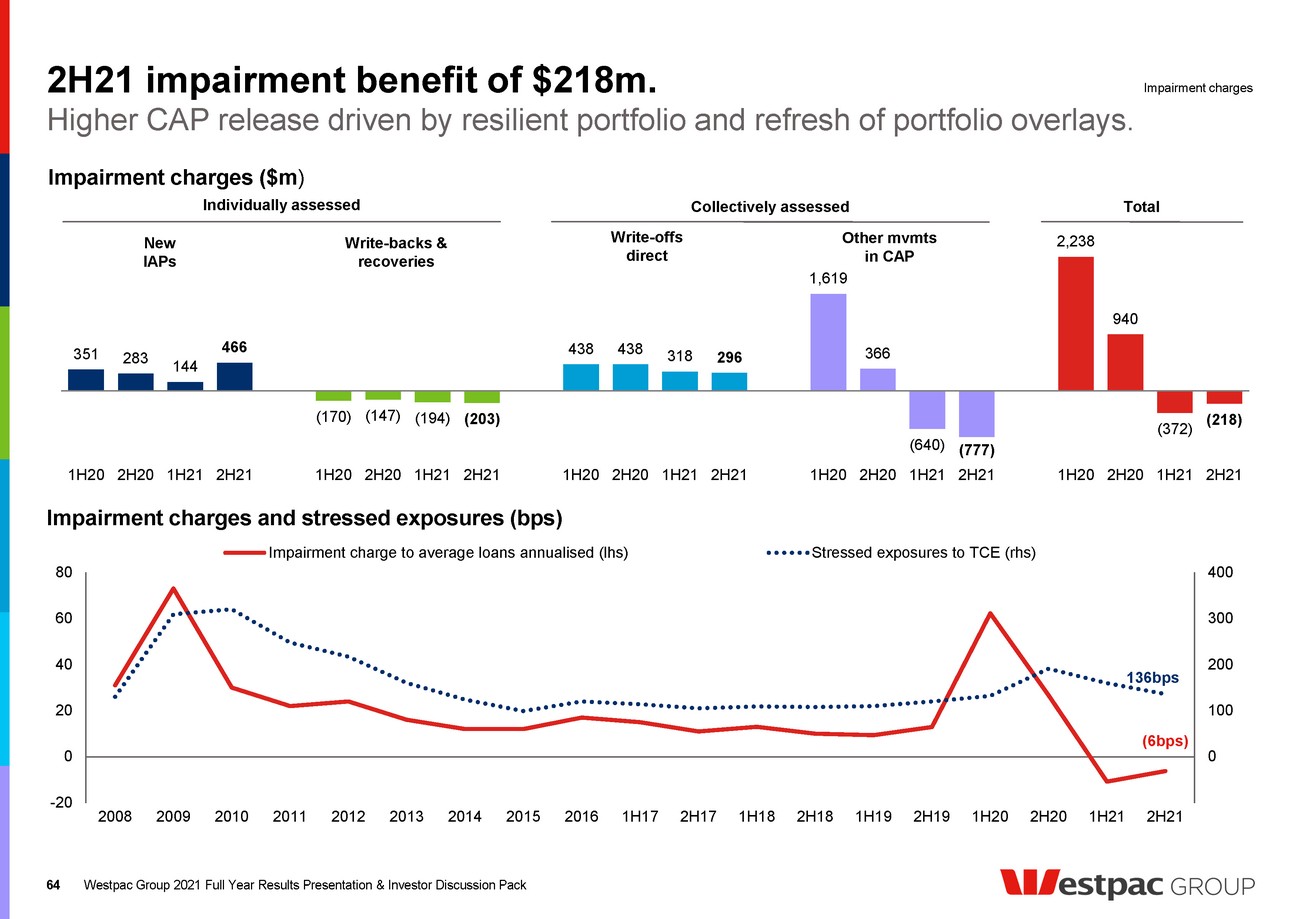
| Credit quality and provisions ,11estpac GROUP |
| 66 412 606 611 564 832 943 1,051 1,561 1,327 1,131 1,578 2,317 2,247 1,806 1,606 818 1,019 1,032 853 791 171 795 708 958 647 3,922 5,788 6,159 5,508 5,007 Sep-19 Mar-20 Sep-20 Mar-21 Sep-21 Overlay Stage 1 CAP Stage 2 CAP Stage 3 CAP Stage 3 IAP Provisions. Westpac Group 2021 Full Year Results Presentation & Investor Discussion Pack Provisions for impairments Total impairment provisions 4 ($m) Sep-20 Mar-21 Sep-21 Loan provisions to gross loans (bps) 88 79 70 Impaired asset provisions to impaired assets (%) 41 47 54 Collectively assessed provisions to credit RWA (bps) 154 142 117 Credit quality 5 Refresh of portfolio overlays, principally COVID-19 related Lower provisions across all stages driven by improvement in credit metrics and a change in portfolio composition Increase driven by one large IAP Forecasts for base case economic scenario 2 September 2020 September 2021 3 2021 2022 2021 2022 GDP growth 2.5% 2.7% 0.05% 7.4% Unemployment 7.5% 6.7% 5.4% 4.0% Residential property prices (0.4%) 7.5% 11.8% 5.0% Expected Credit Loss 1 (ECL) ($m) $1.6bn in impairment provisions above the base case economic scenario 4,999 3,411 7,399 Reported probability-weighted ECL 100% base case ECL 100% downside ECL 1 Includes ECL Overlays and IAP. Excludes provisions for debt securities. 2 GDP and residential property price growth is annual growth to December each year. Unemployment rate forecast is at year end. 3 Forecast date is 7 September 2021. 4 Includes provisions for debt securities. 5 Overlay from Mar-20 includes New Zealand overlay. Overlay from Sep-21 shows portfolio overlays. |
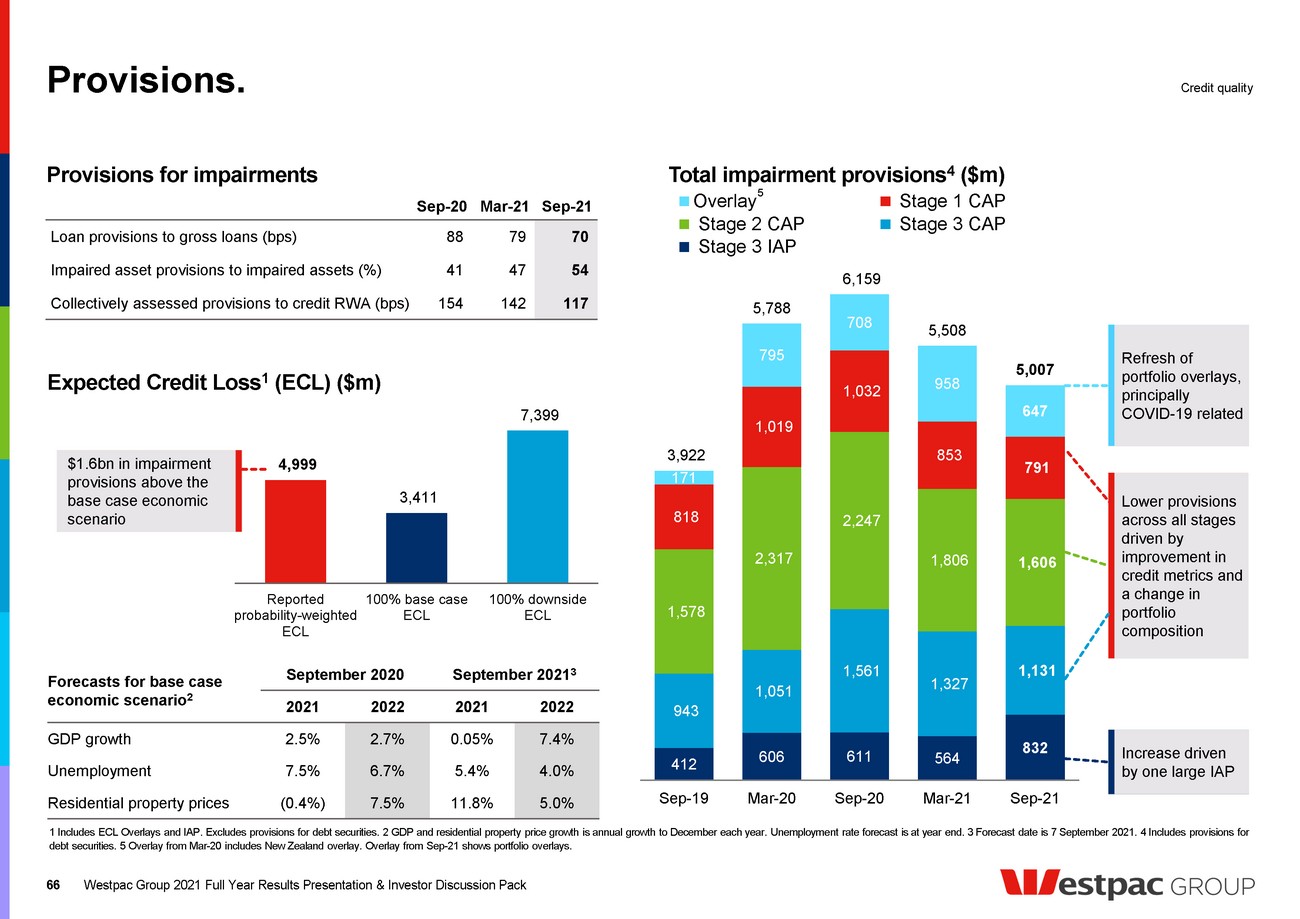
| Stage 1 decreased as a result of larger TCE transfer to Stage 2 mostly from a change in methodology Stage 2 increase driven by larger TCE transfer from Stage 1 to Stage 2 mostly from a change in methodology, partly offset by reduction in Watchlist & substandard Small increase in Stage 3 exposures due to increase in 90+ day past due in Business division, partly offset by improvement in mortgages Provision cover by portfolio category. Westpac Group 2021 Full Year Results Presentation & Investor Discussion Pack Exposures as a % of TCE 0.20 0.26 0.19 0.19 0.50 0.80 0.66 0.68 0.62 0.85 0.75 0.49 2.96 5.99 5.30 6.40 95.72 92.10 93.10 92.25 Mar-20 Sep-20 Mar-21 Sep-21 Fully performing portfolio Watchlist & substandard 90+ day past due and not impaired Impaired Non-stressed but significant increase in credit risk 67 Mar-20 Sep-20 Mar-21 Sep-21 Stage 1 provisions Fully performing portfolio Small cover as low probability of default (PD) 0.12 0.11 0.10 0.09 Stage 2 provisions Non-stressed but significant increase in credit risk Lifetime expected loss based on future economic conditions 6.78 3.41 3.29 2.16 Watchlist & substandard Still performing but higher cover reflects deterioration 10.67 8.25 9.07 9.80 Stage 3 provisions 90+ day past due and not impaired In default but strong security 11.61 11.98 12.91 10.57 Impaired assets In default. High provision cover reflects expected recovery 50.09 41.45 47.03 54.43 Credit quality Revised methodology for determining significant increase in credit risk 1. Provisioning to TCE (%) 1 Further details of the methodology change see Note 13 in Westpac’s 2021 Annual Report. |
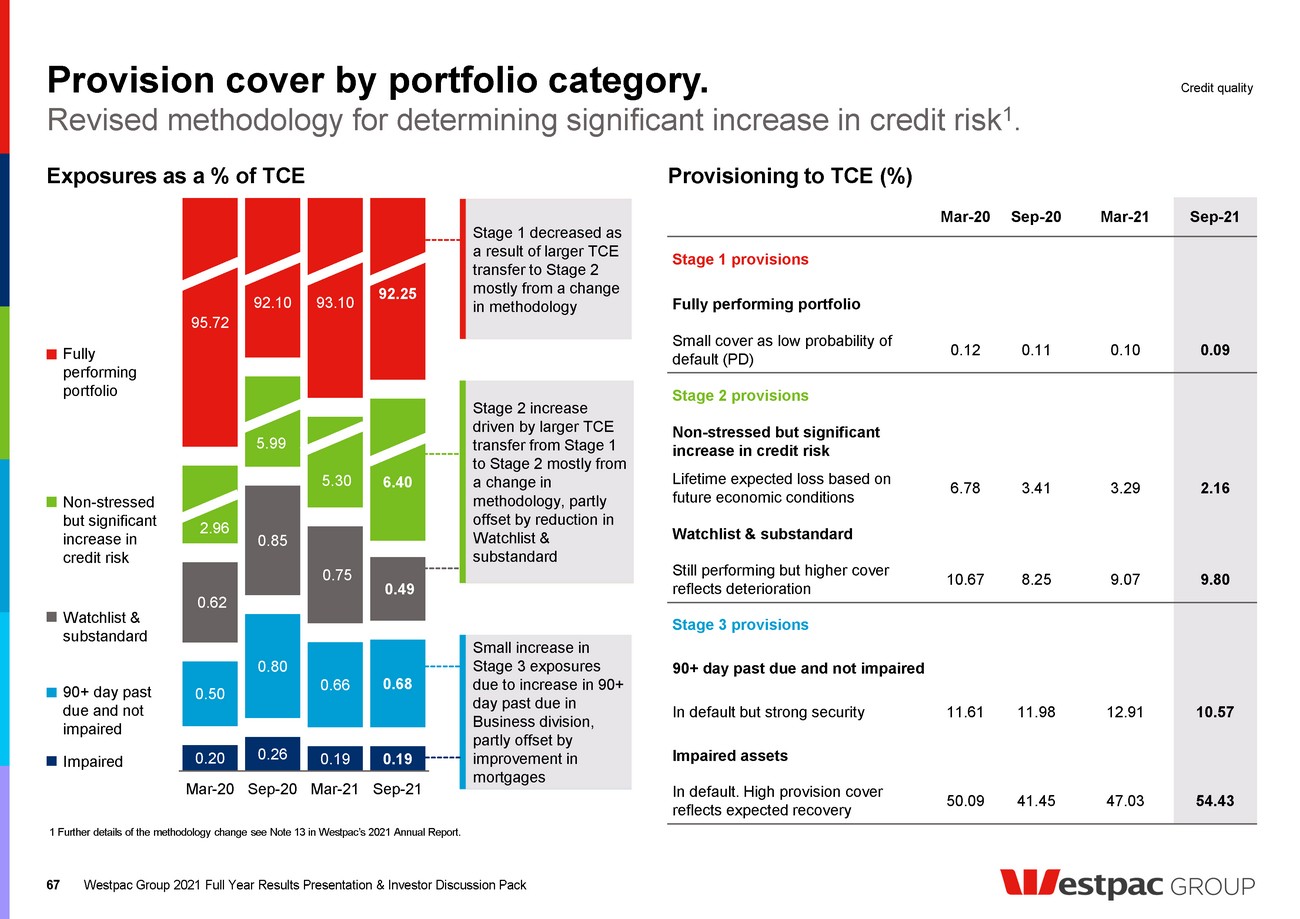
| 72 17 9 2 Housing Business Institutional Other consumer Portfolio composition. Westpac Group 2021 Full Year Results Presentation & Investor Discussion Pack 68 Asset composition (%) Loan composition at 30 September 2021 (% of total) Exposure by risk grade at 30 September 2021 ($m) 1 For September 2021, includes assets held for sale. 2 Risk grade equivalent. 3 Exposure by booking office. Total assets ($936bn) Sep-19 Sep-20 Sep-21 Loans 79 76 76 Investment securities 8 10 9 Trading securities and financial assets at fair value through income statement 4 4 2 Derivative financial instruments 3 3 2 Cash and balances with central banks 2 3 8 Collateral paid and other financial assets 1 1 1 Intangible assets 1 1 1 Life insurance assets and other assets 1 2 2 1 Standard and Poor’s Risk Grade 2 Australia NZ / Pacific Asia Americas Europe Group % of Total AAA to AA- 171,086 20,081 639 14,765 793 207,364 19% A+ to A- 34,124 5,388 1,312 3,106 3,115 47,045 4% BBB+ to BBB- 64,061 11,985 3,146 2,575 1,914 83,681 7% BB+ to BB 66,444 14,440 507 366 158 81,915 7% BB- to B+ 59,373 7,195 336 246 244 67,394 6% <B+ 8,278 1,142 32 34 0 9,486 1% Mortgages 522,210 68,576 2 0 0 590,788 53% Other consumer products 33,491 4,118 0 0 0 37,609 3% Total committed exposures (TCE) 959,067 132,925 5,974 21,092 6,224 1,125,282 Total committed exposures (TCE) at 31 March 2021 922,100 122,276 13,795 7,426 6,614 1,072,211 Exposure by region 3 (%) 86% 12% <1% 2% <1% 100% Total loans $711bn Credit quality |
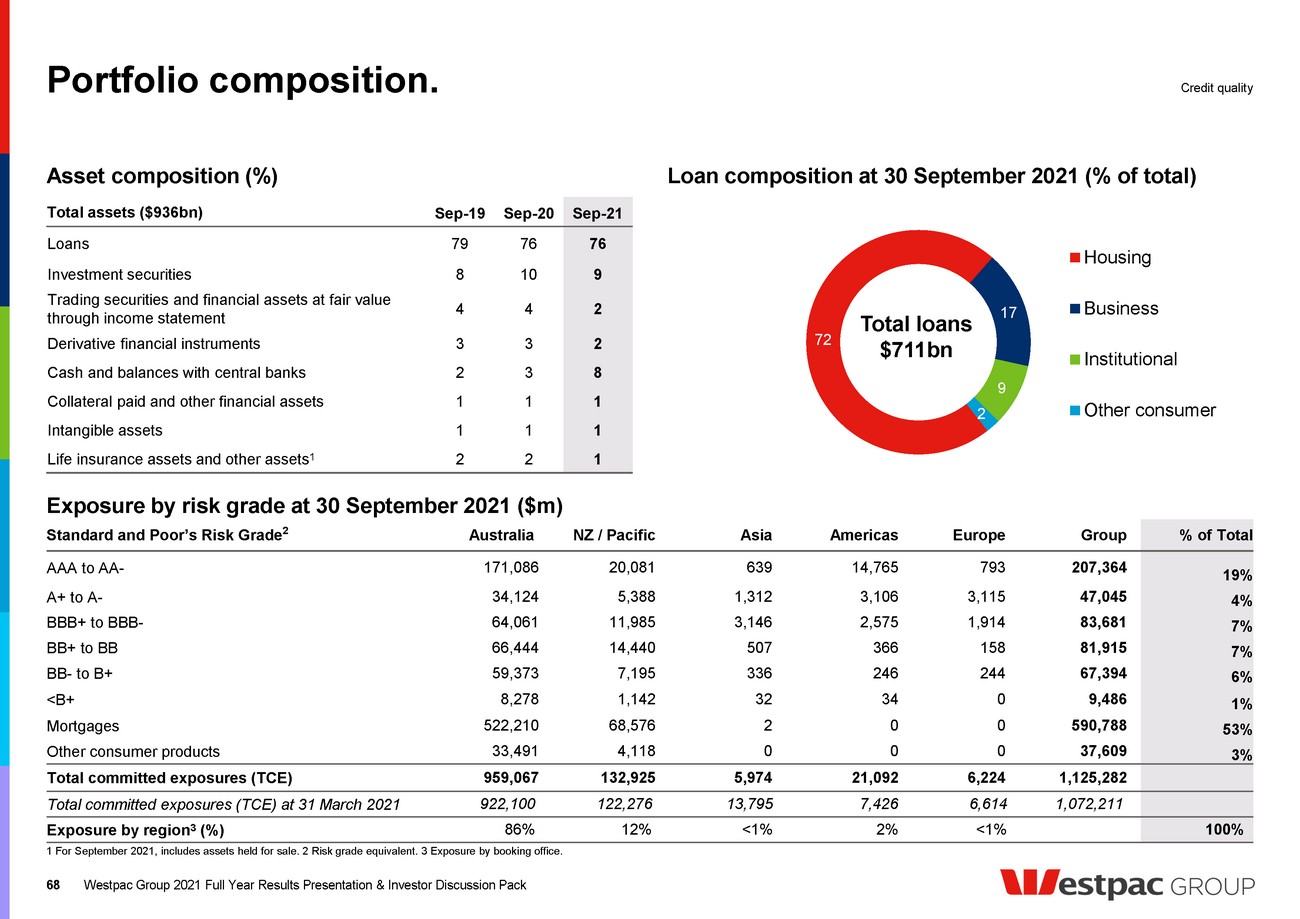
| 0 600 1,200 1,800 2,400 3,000 3,600 A- BBB- BBB- A+ A- BBB+ A- BBB+ BBB- AA- S&P rating or equivalent 1.0 1.1 1.0 1.0 1.1 1.0 1.2 Sep-16 Sep-17 Sep-18 Sep-19 Sep-20 Mar-21 Sep-21 0 50 100 150 200 Other Mining Accommodation, cafes & restaurants Construction Utilities Transport & storage Property services & business services Manufacturing Services Agriculture, forestry & fishing Wholesale & retail trade Property Government admin. & defence Finance & insurance Sep-20 Mar-21 Sep-21 Loan portfolio composition. Westpac Group 2021 Full Year Results Presentation & Investor Discussion Pack 69 Top 10 exposures to corporations and NBFIs 5 (% of TCE) Top 10 exposures to corporations & NBFIs at 30 September 2021 ($m) Exposures at default 1 by sector ($bn) 1 Exposures at default is an estimate of the committed exposure expected to be drawn by a customer at the time of default. Excludes consumer lending. 2 Finance and insurance includes banks, non-banks, insurance companies and other firms providing services to the finance and insurance sectors. 3 Property includes both residential and non-residential property investors and developers and excludes real estate agents. 4 Construction includes building and non-building construction, and industries serving the construction sector. 5 NBFI is non-bank financial institutions. The single largest corporation/NBFI exposure is 0.29% of TCE 2 4 Credit quality Clearing house membership Includes securities held in liquid assets portfolio 3 |
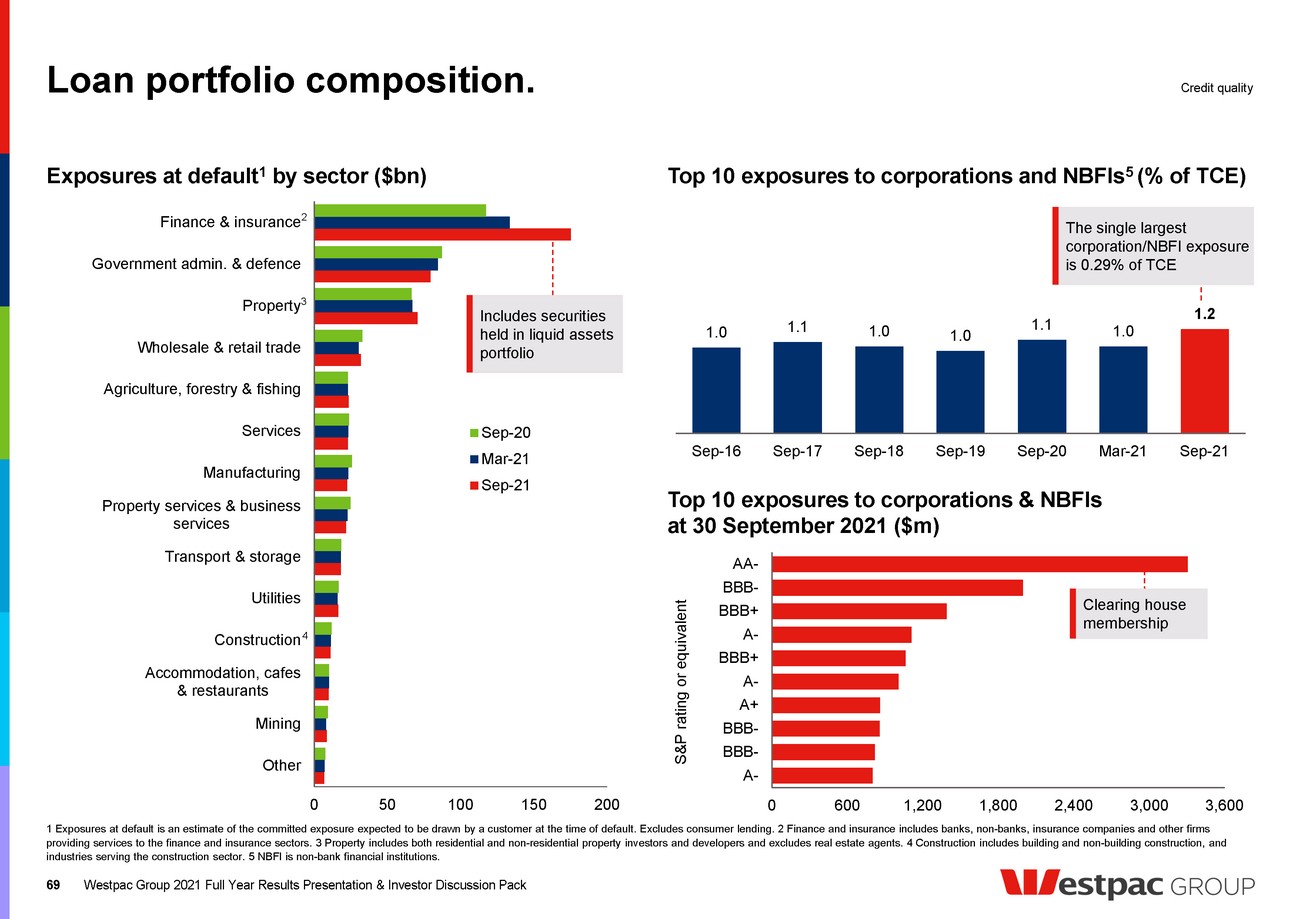
| 1,194 997 958 708 609 607 633 1,078 477 589 440 471 450 519 550 897 864 222 614 2H12 1H13 2H13 1H14 2H14 1H15 2H15 1H16 2H16 1H17 2H17 1H18 2H18 1H19 2H19 1H20 2H20 1H21 2H21 0.67 0.62 0.58 0.44 0.27 0.20 0.22 0.15 0.15 0.14 0.17 0.17 0.20 0.26 0.19 0.19 0.46 0.41 0.35 0.31 0.26 0.25 0.33 0.34 0.37 0.39 0.43 0.48 0.50 0.80 0.66 0.68 2.07 1.45 1.24 0.85 0.71 0.54 0.65 0.56 0.57 0.55 0.50 0.55 0.62 0.85 0.75 0.49 3.20 2.48 2.17 1.60 1.24 0.99 1.20 1.05 1.09 1.08 1.10 1.20 1.32 1.91 1.60 1.36 Sep-10 Sep-11 Sep-12 Sep-13 Sep-14 Sep-15 Sep-16 Sep-17 Mar-18 Sep-18 Mar-19 Sep-19 Mar-20 Sep-20 Mar-21 Sep-21 Credit quality. 70 Stressed exposures down 24bps in 2H21. 1 Facilities 90 days or more past due date not impaired. These facilities, while in default, are not treated as impaired for accounting purposes. 2 Group 90+ day mortgage delinquencies, Australian 90+ day mortgage delinquencies decreased by 13bps. 3 Includes exposures that are managed on a facility by facility basis. Credit quality Stressed exposures as a % of TCE Movement in stress categories (bps) New and increased gross impaired assets ($m) 3 Watchlist and substandard • Improvement driven in part by rating upgrades across business lending portfolios 90+ day past due and not impaired 1 • Increase driven by Business division, partly offset by 12bps decrease in mortgage 90+ delinquencies 2 Impaired • No change over 2H21; small increase in impaired balances offset by portfolio expansion Westpac Group 2021 Full Year Results Presentation & Investor Discussion Pack 160 2 0 2 191 136 (7) (14) (12) (8) (18) Sep-20 Impaired 90+ dpd not impaired Substandard Watchlist Mar-21 Impaired 90+ dpd not impaired Substandard Watchlist Sep-21 1 1 Increase driven in part by fully provided fraud |
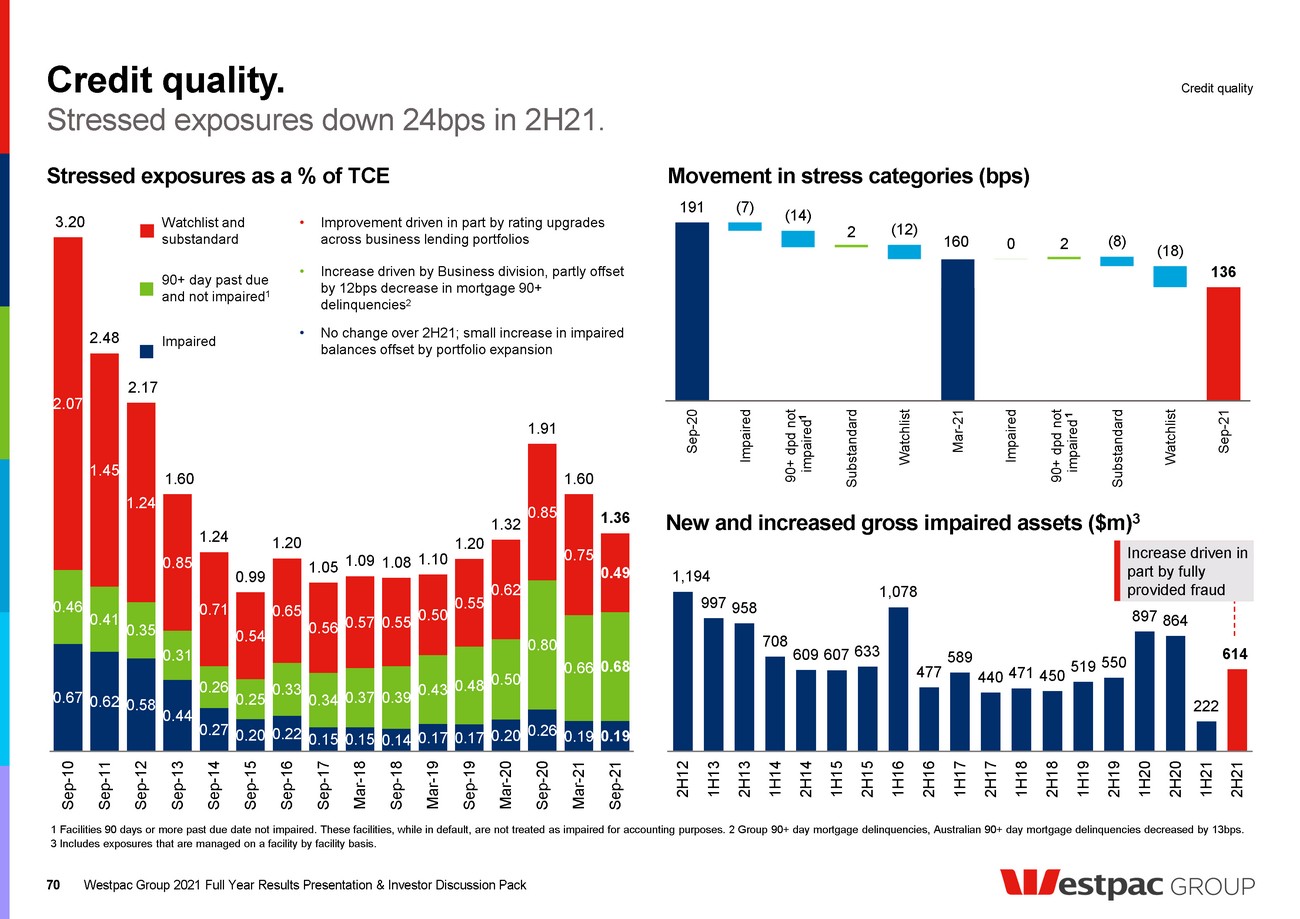
| 0.0 0.2 0.4 0.6 0.8 1.0 1.2 1.4 1.6 1.8 2.0 Property Accommodation, cafes & restaurants Wholesale & retail trade Agriculture, forestry & fishing Property & business services Services Manufacturing Construction Transport & storage Mining Finance & insurance Utilities Sep-20 Mar-21 Sep-21 Credit quality improved across most sectors. 1 Services includes education, health & community services, cultural & recreational and personal & other services. Westpac Group 2021 Full Year Results Presentation & Investor Discussion Pack 71 Corporate and business stressed exposures by industry sector ($bn) Credit quality Stress to TCE by sector Sector Property Accomm., cafes & restaurants Wholesale & retail trade Agriculture, forestry & fishing Property & business services Services 1 Manufacturing Construction Transport & storage Mining Finance & Insurance Utilities Mar-21 (%) 2.9 14.6 4.8 6.0 4.3 3.7 3.3 6.1 2.7 3.4 0.2 0.2 Sep-21 (%) 2.2 12.4 3.6 4.4 4.0 4.5 3.2 5.5 2.3 1.7 0.2 0.2 Mostly one institutional exposure related to a fraud in equipment leasing |
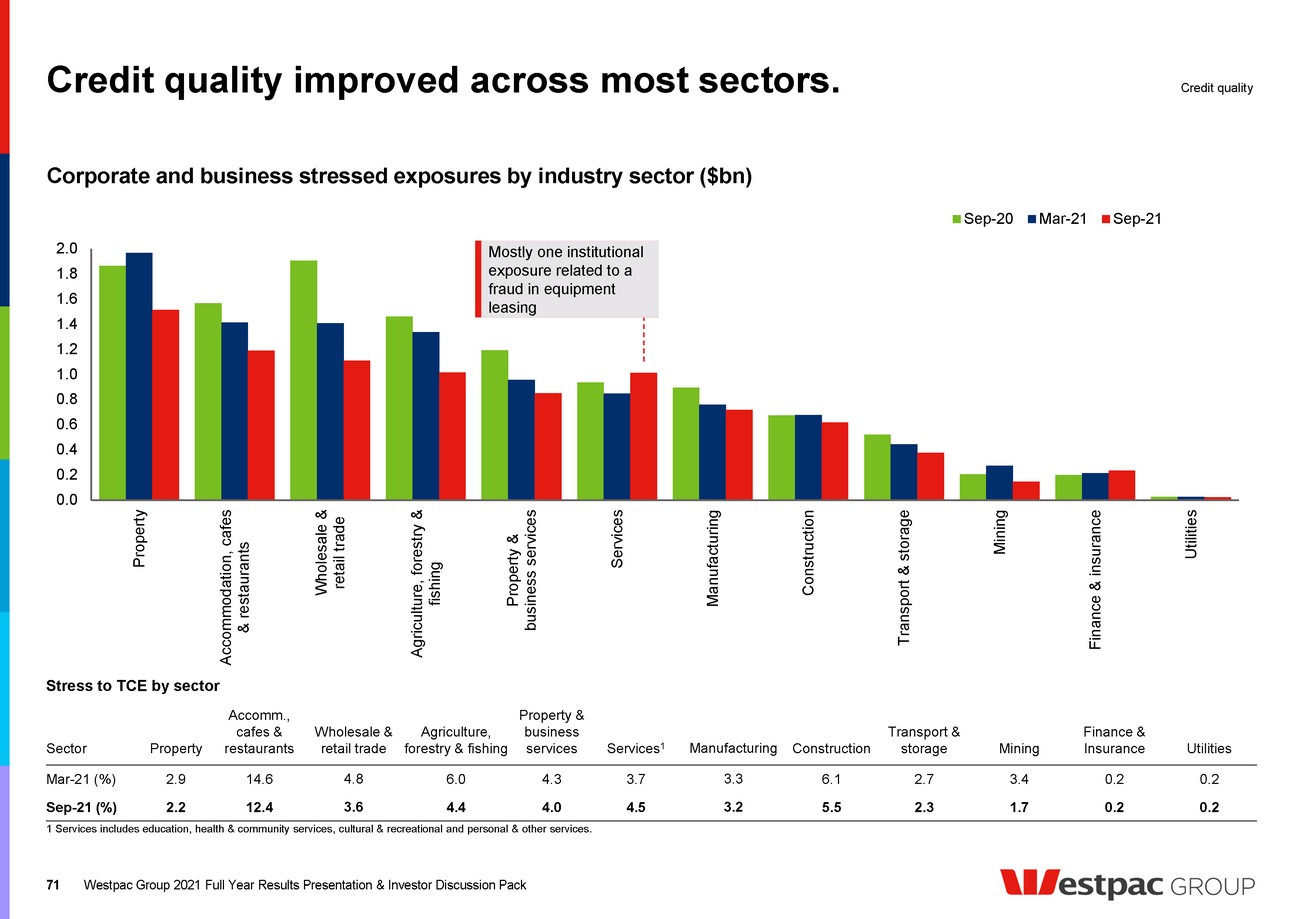
| Sectors in focus. Westpac Group 2021 Full Year Results Presentation & Investor Discussion Pack 72 Accommodation, cafes and restaurants Accommodation, cafes & restaurants and Construction. 1 Includes impaired exposures. 2 Percentage of portfolio TCE. 3 Fully secured: Secured loan to collateral value ratio ≤ 100%, Partially secured: Secured loan to collateral value ratio > 100%, but < 150%, Unsecured: Secured loan to collateral value ratio > 150%, or no security held. Credit quality Sep-20 Mar-21 Sep-21 Total committed exposures (TCE) $9.8bn $9.7bn $9.6bn Lending $8.5bn $8.3bn $8.2bn As a % of Group TCE 0.92 0.91 0.85 % of portfolio graded as stressed 1,2 16.00 14.55 12.38 % of portfolio impaired 2 0.73 0.67 0.94 Portfolio security composition 3 (TCE) (%) Portfolio by sub-sector (TCE) (%) 36 34 24 6 Accommodation Pubs, Taverns and Bars Cafes and Restaurants Clubs (Hospitality) 73 20 7 Fully Secured Partially Secured Unsecured Construction Portfolio security composition 3 (TCE) (%) Portfolio by sub-sector (TCE) (%) Sep-20 Mar-21 Sep-21 Total committed exposures $11.5bn $11.1bn $11.2bn Lending $7.9bn $7.6bn $6.7bn As a % of Group TCE 1.09 1.04 1.00 % of portfolio graded as stressed 1,2 5.85 6.06 5.51 % of portfolio impaired 2 1.65 1.11 0.86 60 17 23 Fully Secured Partially Secured Unsecured 23 13 8 5 17 6 28 Building Construction Non-Building Construction Site Preparation Services Building Structure Services Installation Trade Services Building Completion Services Other Construction Services |
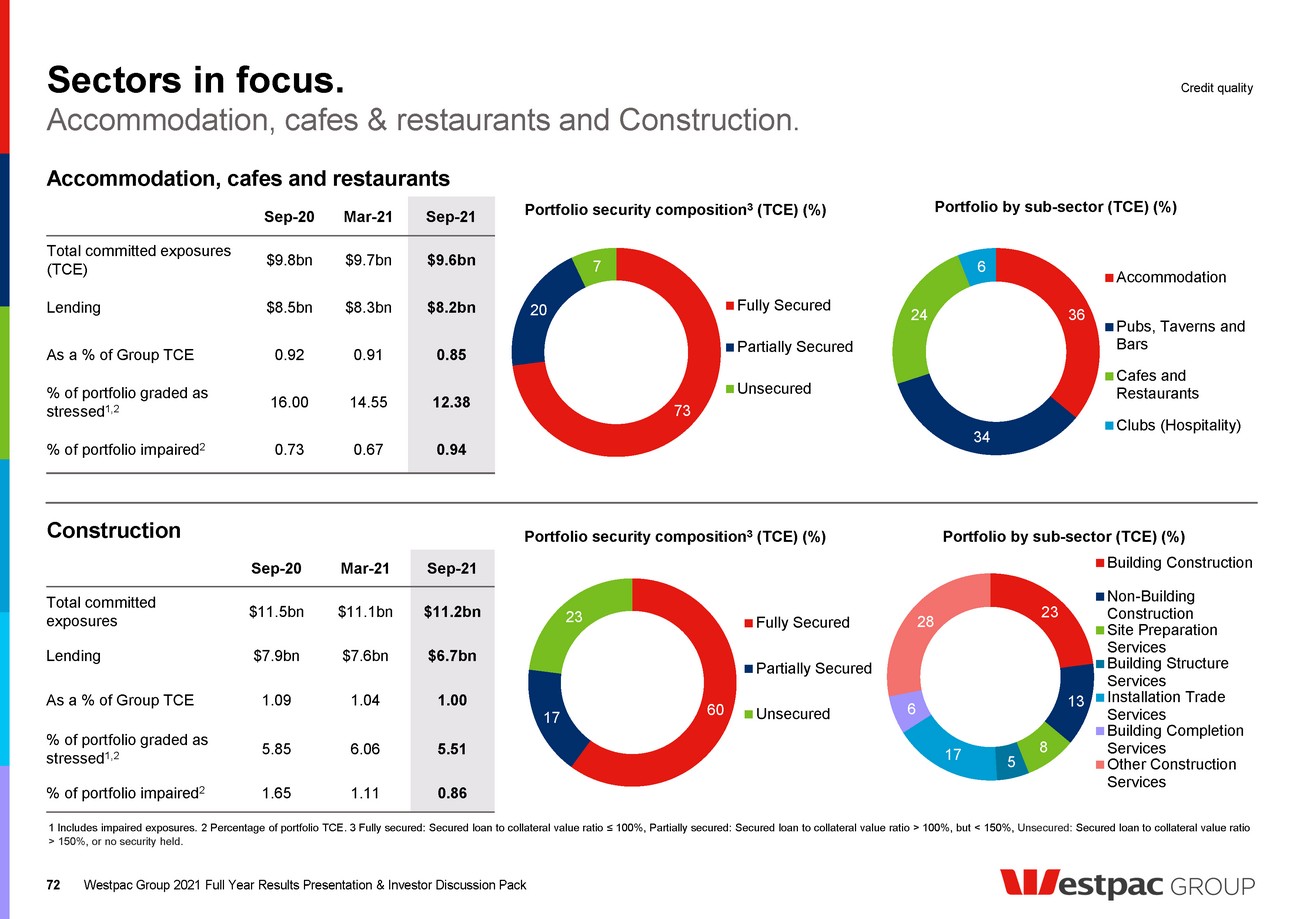
| Sectors in focus. Westpac Group 2021 Full Year Results Presentation & Investor Discussion Pack 73 Commercial property Commercial property exposures % of TCE and % in stress Commercial property portfolio composition (TCE) (%) Commercial property. 1 Includes impaired exposures. 2 Percentage of commercial property portfolio TCE. Credit quality Sep-20 Mar-21 Sep-21 Total committed exposures $65.9bn $67.4bn $70.0bn Lending $51.9bn $52.2bn $51.7bn As a % of Group TCE 6.22 6.28 6.22 Median risk grade (S&P equivalent) BB+ BB+ BB+ % of portfolio graded as stressed 1,2 2.83 2.92 2.16 % of portfolio impaired 2 0.16 0.14 0.21 0 5 10 15 20 0 2 4 6 8 Sep-11 Mar-12 Sep-12 Mar-13 Sep-13 Mar-14 Sep-14 Mar-15 Sep-15 Mar-16 Sep-16 Mar-17 Sep-17 Mar-18 Sep-18 Mar-19 Sep-19 Mar-20 Sep-20 Mar-21 Sep-21 Commercial property as % of TCE (lhs) Commercial property % in stress (rhs) 30 19 21 12 14 4 Commercial Offices Residential Retail Industrial Corporate Other 24 9 5 1 3 11 47 NSW & ACT VIC QLD SA & NT WA NZ & Pacific Institutional 38 7 38 17 Investors & Developers <$10m Developers >$10m Investors >$10m Diversified Property Groups and Property Trusts >$10m Borrower type (%) Region (%) Sector (%) |
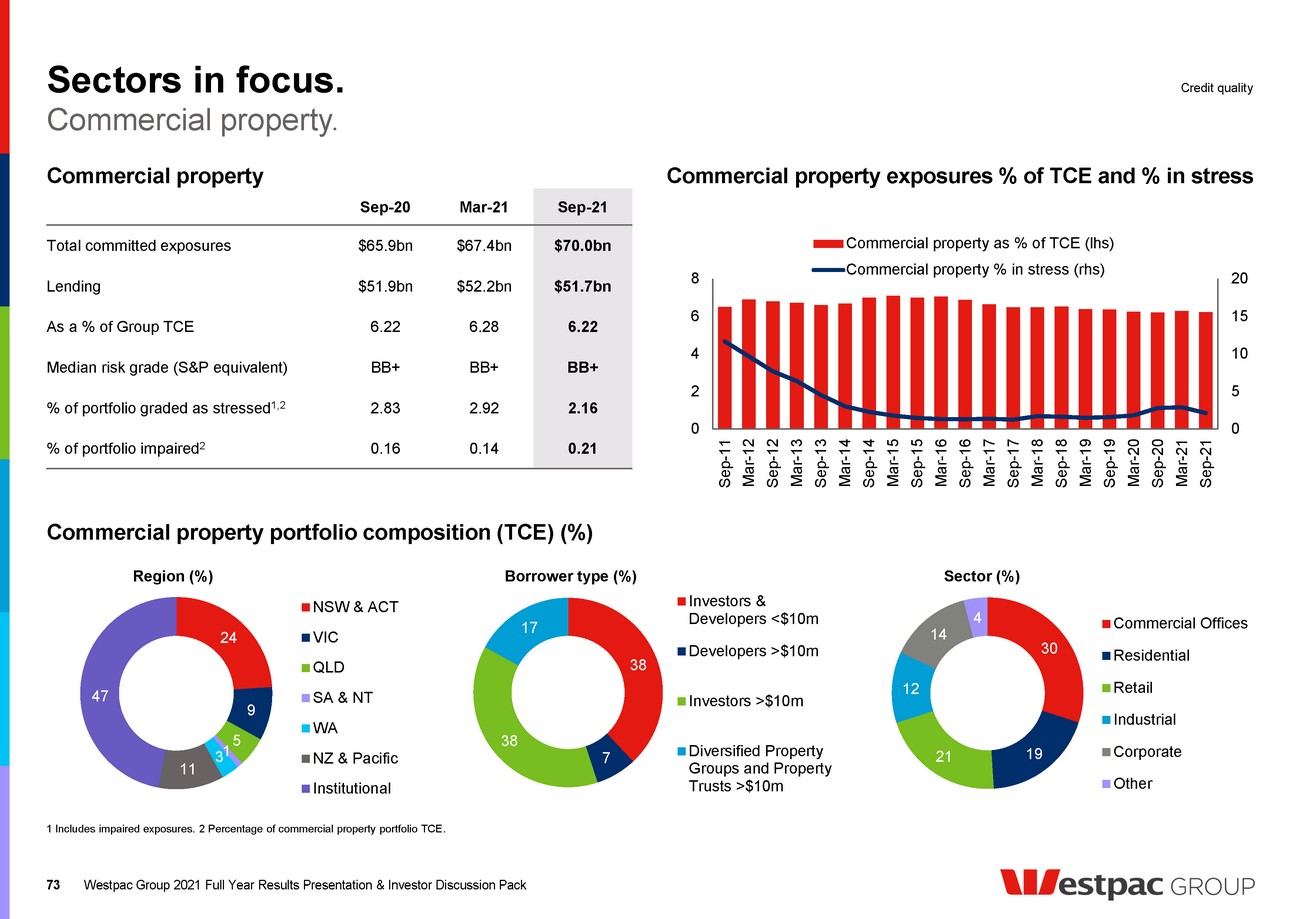
| 3.02 4.67 4.84 5.43 6.05 6.70 7.26 5.48 3.68 Sep-17 Mar-18 Sep-18 Mar-19 Sep-19 Mar-20 Sep-20 Mar-21 Sep-21 Sectors in focus. 74 Retail trade Retail trade exposure by sub-sector (TCE) ($bn) Retail trade portfolio graded as stressed (%) Retail trade by internal risk grade category (TCE) ($bn) Retail trade. 1 Includes impaired exposures. 2 Percentage of retail trade portfolio TCE. Credit quality Sep-20 Mar-21 Sep-21 Total committed exposures $15.0bn $13.9bn $14.0bn Lending $9.5bn $8.7bn $8.6bn As a % of Group TCE 1.41 1.30 1.24 % of portfolio graded as stressed 1,2 7.26 5.48 3.68 % of portfolio impaired 2 1.84 1.82 1.55 6.4 6.2 4.0 4.2 3.4 3.6 Mar-21 Sep-21 Mar-21 Sep-21 Mar-21 Sep-21 Investment Sub-investment Stressed Personal and household goods retailing Motor vehicle retailing and services Food retailing Westpac Group 2021 Full Year Results Presentation & Investor Discussion Pack 7.0 4.4 3.6 6.4 4.0 3.4 6.2 4.2 3.6 Personal and household goods retailing Motor vehicle retailing and services Food retailing Sep-20 Mar-21 Sep-21 |
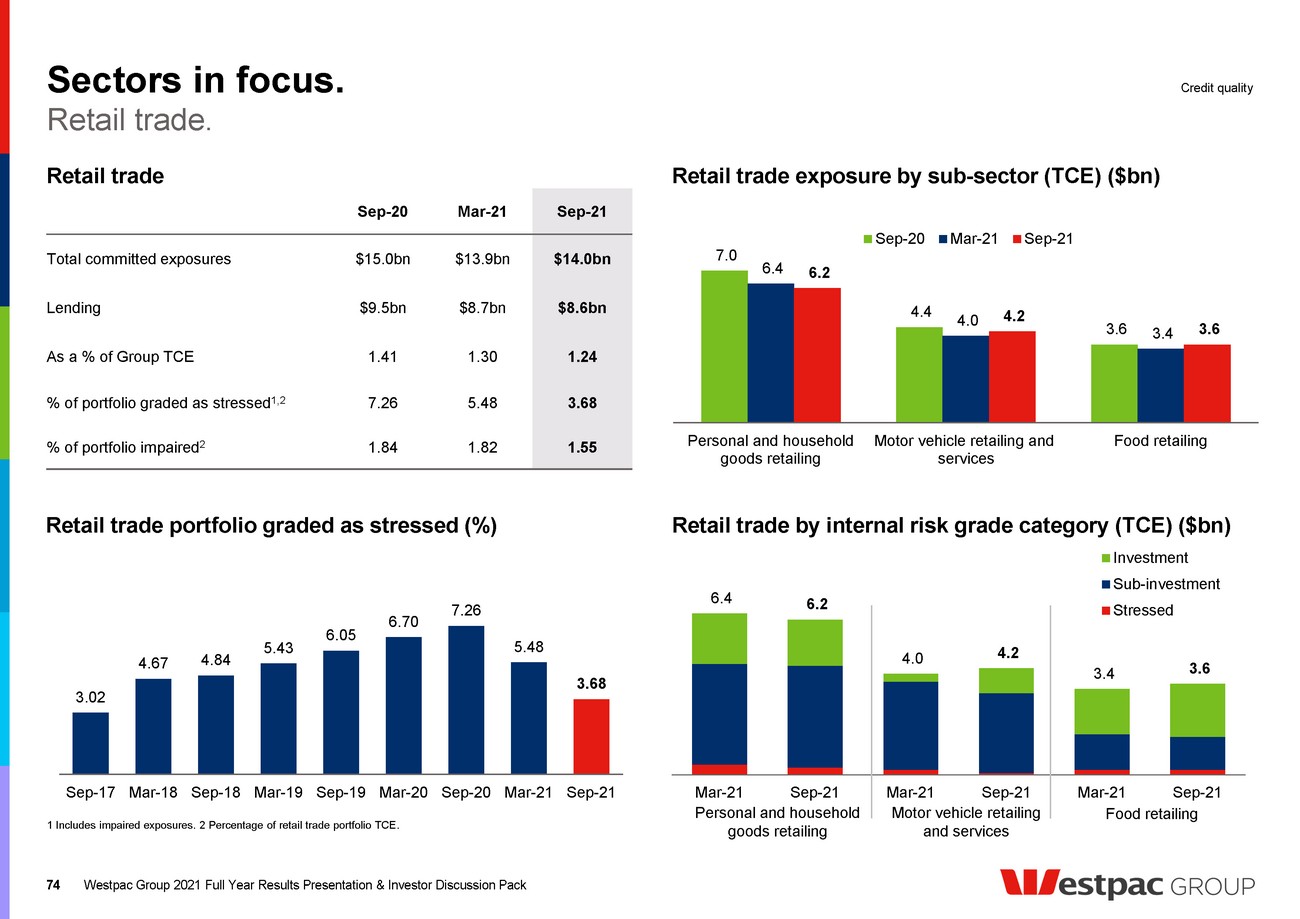
| 1.76 0.50 1.50 2.50 Mar-19 Sep-19 Mar-20 Sep-20 Mar-21 Sep-21 Australian consumer finance. Westpac Group 2021 Full Year Results Presentation & Investor Discussion Pack 75 Australian consumer finance portfolio 1 Australian consumer finance 90+ day delinquencies (%) Australian consumer finance portfolio ($bn) Australian consumer finance portfolio ($bn) 1 Does not include Margin Lending. 2 These Auto loans only relate to consumer loans and do not relate to loans outstanding to business customers. These loans will be run-down over their contractual term. Credit quality 6.8 3.0 5.9 15.7 6.8 2.8 5.4 15.0 6.8 2.8 5.4 15.0 Credit cards Personal loans Auto loans (consumer) Total consumer finance Sep-20 Mar-21 Sep-21 1.8% of Group loans. 0 1 2 3 0 5 10 15 20 25 Sep-19 Nov-19 Jan-20 Mar-20 May-20 Jul-20 Sep-20 Nov-20 Jan-21 Mar-21 May-21 Jul-21 Sep-21 Performing loans balance ($bn lhs) 90+ day delinquencies balance ($bn rhs) Sep-20 Mar-21 Sep-21 Lending $15.7bn $15.0bn $13.2bn 30+ day delinquencies (%) 3.62 3.58 3.26 90+ day delinquencies (%) 2.09 1.92 1.76 90+ day delinquencies down 16bps over the period, reflecting 36bps improvement in portfolio, partly offset by 20bps from contraction in portfolio 2 |
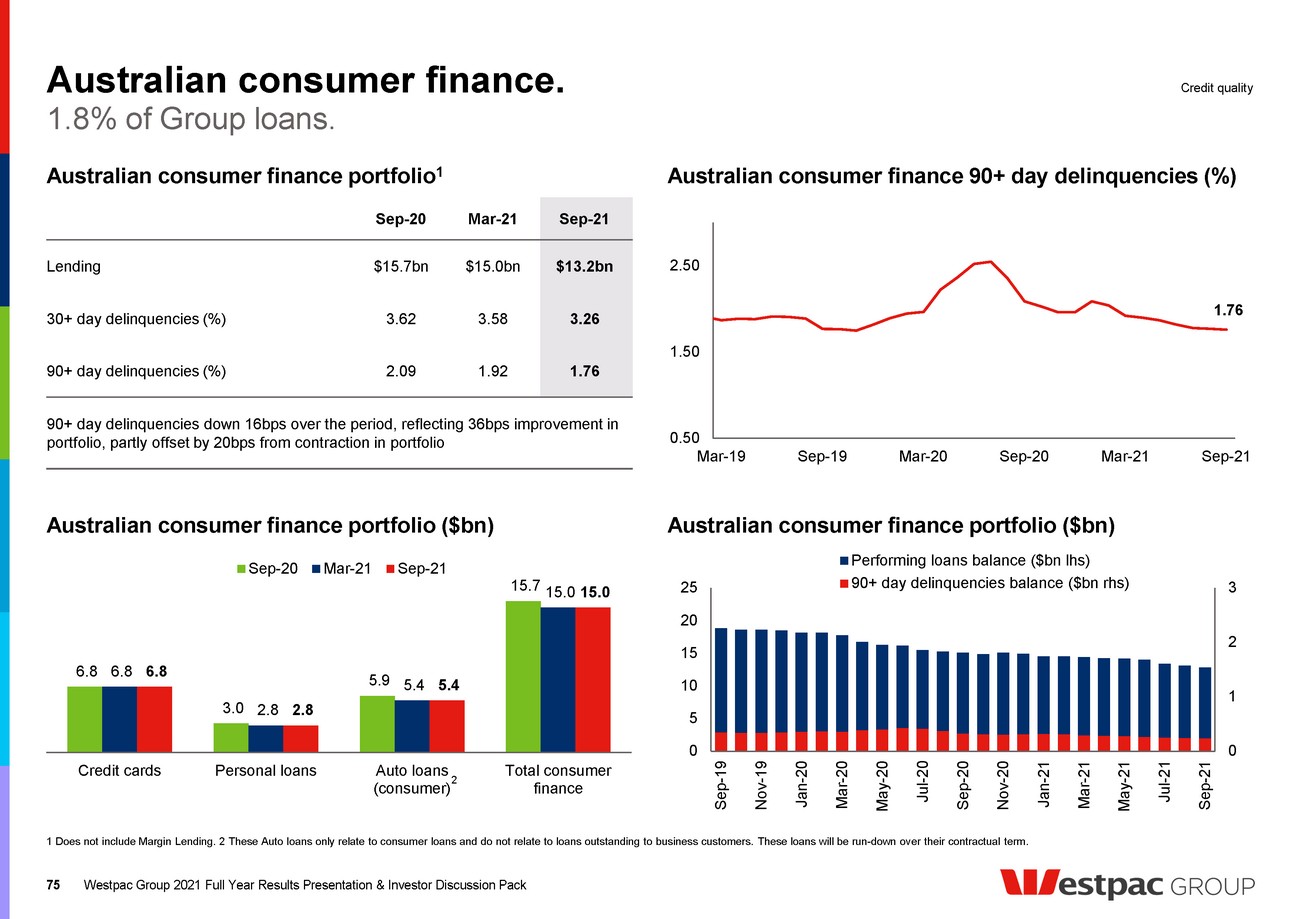
| Australian mortgage delinquencies. Westpac Group 2021 Full Year Results Presentation & Investor Discussion Pack 76 Customers in deferral leading to a rise in early cycle arrears. 1 Financial hardship assistance is available to customers experiencing unforeseen events, including changes in income due to illness, a relationship breakdown or natural disasters. Hardship assistance often takes the form of a reduction or deferral of repayments for a short period. Customer requesting financial hardship assistance, excluding those seeking COVID-19 related support, must provide a statement of financial position and an assessment is made regarding the customer’s eligibility. Mortgage credit quality Australian mortgage delinquencies (%) Australian mortgage portfolio Sep-20 Mar-21 Sep-21 Total portfolio 30+ day delinquencies (bps) 214 179 220 Total portfolio 30+ day delinquencies ex-COVID-19 deferral (bps) - - 157 Total portfolio 90+ day delinquencies, including impaired mortgages (bps) 162 120 107 Total portfolio 90+ day delinquencies ex-COVID-19 deferral (bps) - - 101 Investment property loans 90+ day delinquencies (bps) 148 118 109 Interest only loans 90+ day delinquencies (bps) 125 91 82 Customers in hardship 1 including 6mth serviceability period (by balances, bps) 129 113 196 Consumer properties in possession (number) 256 180 224 Impaired mortgages (by balances, bps) 8 6 6 Australian mortgage 90+ day delinquencies by State (%) 0.0 1.0 2.0 3.0 Sep-18 Mar-19 Sep-19 Mar-20 Sep-20 Mar-21 Sep-21 NSW/ACT VIC/TAS QLD WA SA/NT ALL 1.07 2.20 1.57 1.01 0.0 1.0 2.0 3.0 4.0 Mar-18 Jun-18 Sep-18 Dec-18 Mar-19 Jun-19 Sep-19 Dec-19 Mar-20 Jun-20 Sep-20 Dec-20 Mar-21 Jun-21 Sep-21 90+ day delinquencies 30+ day delinquencies 30+ day delinquencies ex COVID-19 deferrals 90+ day delinquencies ex COVID-19 deferrals • 30+ day delinquencies increased 41bps to 220bps, driven by accounts granted COVID-19 support − COVID-19 deferral loans are reported in hardship and move through arrears − 30+ day delinquencies 157bps, excluding loans granted COVID-19 support • 90+ day delinquencies decreased 13bps to 107bps − 36bps improvement in the underlying portfolio, offset by 23bps increase in accounts that had exited the first round of deferrals (Mar 20 – Mar 21) and accounts on current COVID-19 support |
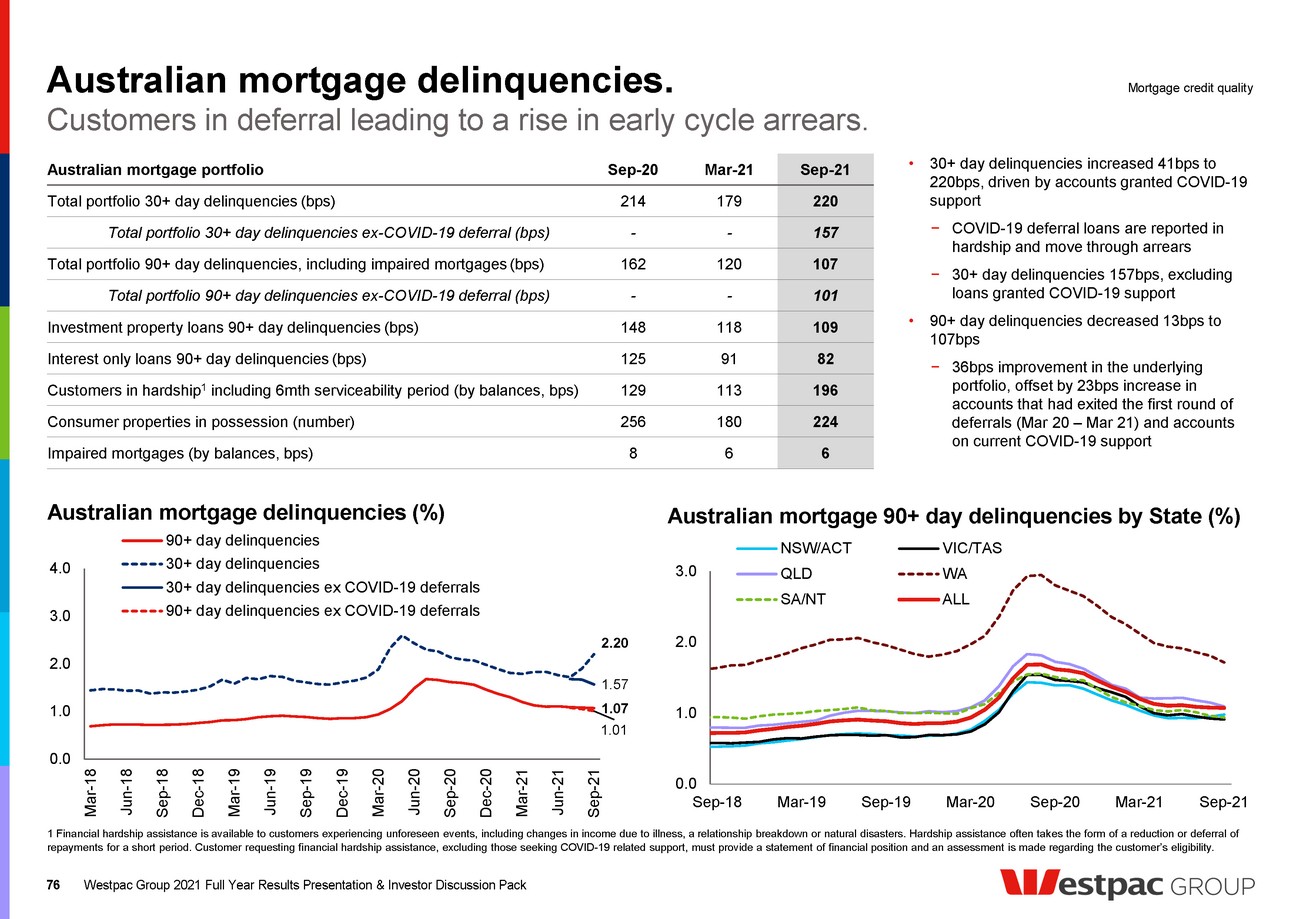
| Australian mortgage portfolio hardship and deferrals. Westpac Group 2021 Full Year Results Presentation & Investor Discussion Pack 77 COVID-19 deferral loans increasing hardship balances. 1 Financial hardship assistance is available to customers experiencing unforeseen events, including changes in income due to illness, a relationship breakdown or natural disasters. Hardship assistance often takes the form of a reduction or deferral of repayments for a short period. Customer requesting financial hardship assistance, excluding those seeking COVID-19 related support, must provide a statement of financial position and an assessment is made regarding the customer’s eligibility. 2 Not reported to credit agencies. Mortgage credit quality Deferrals provided Mar20-Mar21 Deferrals provided Jun21-Oct21 Repayment deferrals provided • ~149k accounts • $55bn in balances (12% of portfolio) • 10.4k accounts • $4.6bn in balances (1% of portfolio) • 55% weighted average dynamic LVR • 1.4% dynamic LVR >90% Eligibility • Not in hardship • Must be up to date with their scheduled amortisation at some point last 90 days • Not in hardship • Less than 90 days delinquent • NSW and Victoria only % balances previously deferred First COVID-19 relief 61% % NSW 39% 80% Reported in arrears No Yes Reported in hardship 2 Not during deferral period Yes, during deferral period Subject to 6 months serviceability at end of deferral period No No Australian mortgage repayment deferrals - treatment Australian mortgage hardship 1 balances ($bn and # of accounts) 0 4,000 8,000 12,000 16,000 20,000 24,000 0 2 4 6 8 10 Mar-18 Jun-18 Sep-18 Dec-18 Mar-19 Jun-19 Sep-19 Dec-19 Mar-20 Jun-20 Sep-20 Dec-20 Mar-21 Jun-21 Sep-21 Balances ($bn, lhs) Number of accounts (rhs) Australian mortgage hardship 1 balances (% of portfolio) Rise in accounts in hardship reflects treatment of COVID-19 support, particularly in NSW 1.0 1.0 1.4 1.6 1.8 2.0 2.0 0 1 2 3 30-Jun-21 16-Jul-21 30-Jul-21 13-Aug-21 27-Aug-21 10-Sep-21 30-Sep-21 Non-COVID-19 support COVID-19 support . |
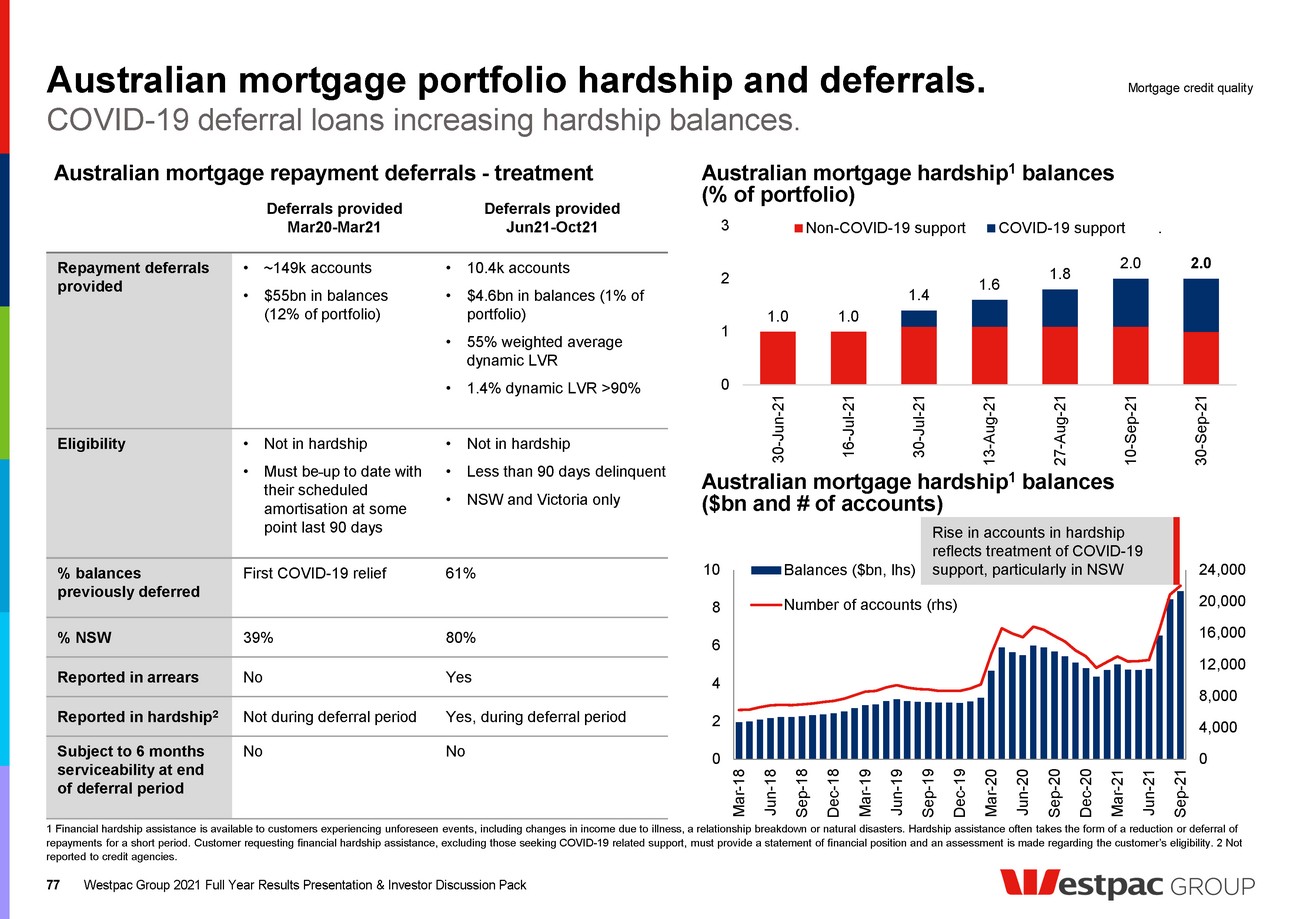
| Australian mortgage portfolio composition. Westpac Group 2021 Full Year Results Presentation & Investor Discussion Pack 1 Flow is new mortgages settled in the 6 months ended 30 September 2021. 2 Includes amortisation. Calculated at account level, where split loans represent more than one account. 3 Loans ahead on payments exclude equity/line of credit products as there are no scheduled principal payments. 4 Mortgage loss rates are write-offs for the 6 months ending. 78 Increased flows into fixed rate loans. Mortgage credit quality Australian mortgage portfolio Sep-20 balance Mar-21 balance Sep-21 balance 2H21 Flow 1 Total portfolio ($bn) 440.9 443.6 455.6 60.8 Owner occupied (OO) (%) 60.4 62.0 63.7 71.4 Investment property loans (IPL) (%) 36.6 35.2 33.8 28.4 Portfolio loan/line of credit (LOC) (%) 2.5 2.3 1.9 0.1 Variable rate / Fixed rate (%) 72 / 28 68/32 62/38 48/52 Interest only (I/O) (%) 20.6 18.2 15.8 13.8 Proprietary channel (%) 54.8 54.2 52.8 43.3 First home buyer (%) 9.0 9.4 9.6 12.2 Mortgage insured (%) 16.0 16.1 15.8 12.4 Sep-20 Mar-21 Sep-21 2H21 Flow 1 Average loan size 2 ($’000) 275 284 277 377 Customers ahead on repayments including offset account balances 3 (%) 71 72 70 Actual mortgage losses net of insurance ($m, for the 6 months ending) 58 44 71 Actual mortgage loss rate annualised 4 (bps, for the 6 months ending) 3 2 3 Australian mortgage portfolio and 2H21 flow by product and repayment type (%) 3 15 22 6 55 2 13 22 5 57 2 12 22 4 60 0 11 18 3 68 LOC IPL-I/O IPL-P&I OO-I/O OO-P&I Sep-20 Mar-21 Sep-21 2H21 76 75 77 72 68 62 24 25 23 28 32 38 Mar-19 Sep-19 Mar-20 Sep-20 Mar-21 Sep-21 Variable Fixed Australian mortgage portfolio by interest rate type (% by balances) Portfolio Flow |
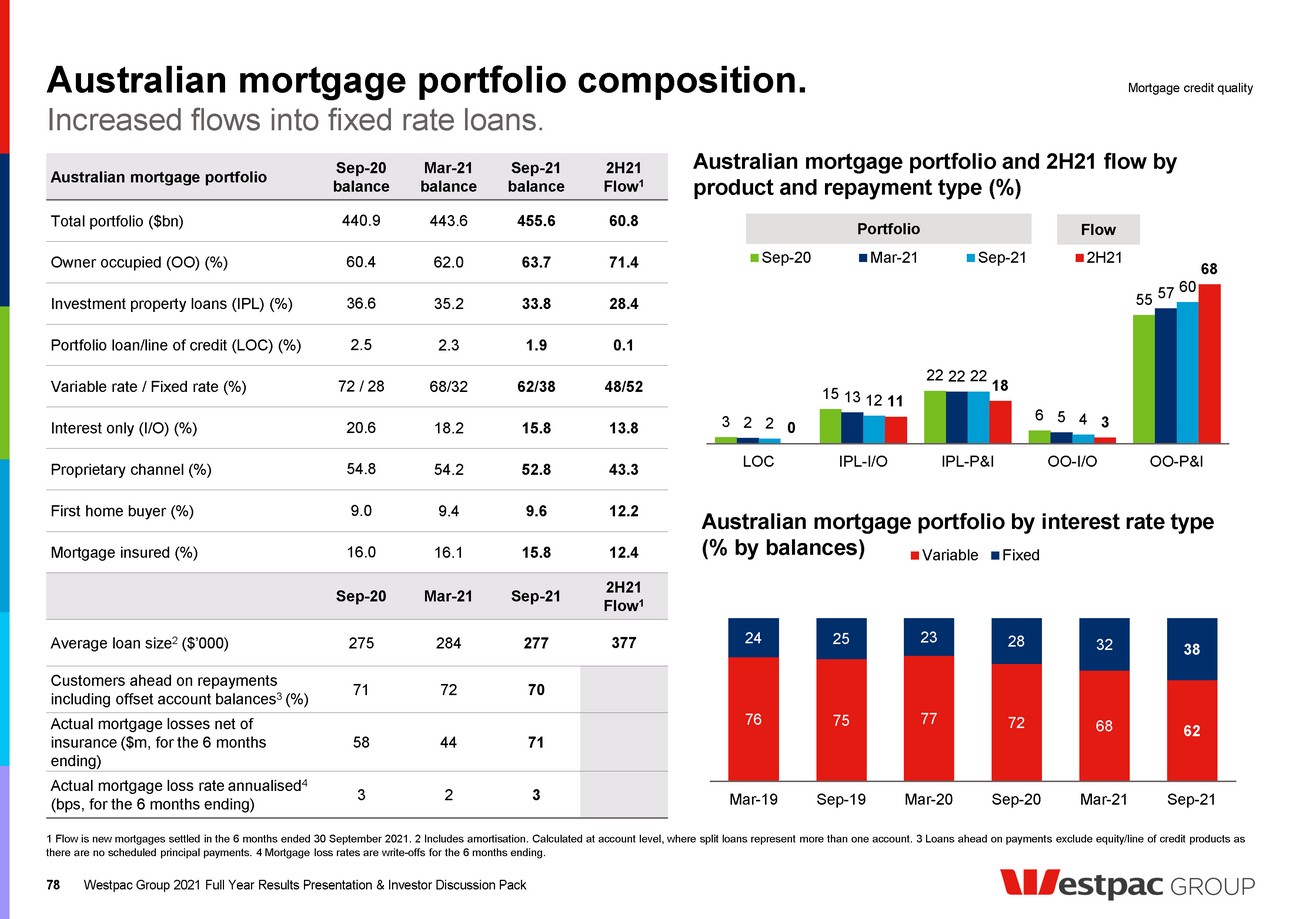
| Australian mortgage portfolio. Westpac Group 2021 Full Year Results Presentation & Investor Discussion Pack 79 Australian housing loan-to-value ratios (LVRs) (%) House price rises have increased borrower equity; Serviceability buffers have lifted. 1 Dynamic LVR is the loan-to-value ratio taking into account the current loan balance, changes in security value, offset account balances and other loan adjustments. Property valuation source CoreLogic. 2 Weighted average LVR calculation considers size of outstanding balances. 3 Average LVR of new loans is on rolling 6 months. 4 Interest rates shown are for Westpac Rocket Repay Home Loan/Rocket Investment Loan inclusive of Premier Advantage Package discount assuming LVR up to 70%. At 14 October 2021. Mortgage credit quality Australian mortgage portfolio LVRs Sep-20 balance Mar-21 balance Sep-21 balance Weighted averages 2 LVR at origination (%) 73 73 73 Dynamic LVR 1 (%) 56 54 50 LVR of new loans 3 (%) 71 72 71 22 17 42 13 6 0 N/A 18 15 47 12 7 2 64 17 12 5 1 0 1 0 10 20 30 40 50 60 70 80 90 100 0<=60 60<=70 70<=80 80<=90 90<=95 95<=100 >100 2H21 drawdowns LVR at origination Portfolio LVR at origination Portfolio dynamic LVR 1 Serviceability assessment 3.19 3.74 3.00 3.00 Owner Occupied P&I Investor P&I 5.05 • Loans are assessed at the higher of − The customer rate, including any life-of-loan discounts, plus the buffer, or − The minimum assessment rate, called the “floor rate” • The buffer increased from 2.50% to 3.00% in October 2021 • Westpac applies a floor rate of 5.05% • Interest only loans are assessed based on the residual P&I term using the applicable P&I rate • Fixed rate loans are assessed on the variable rate to which the loan will revert after the fixed period – usually higher than the fixed rate Customer rate 4 (%) Buffer (%) Floor rate (%) |
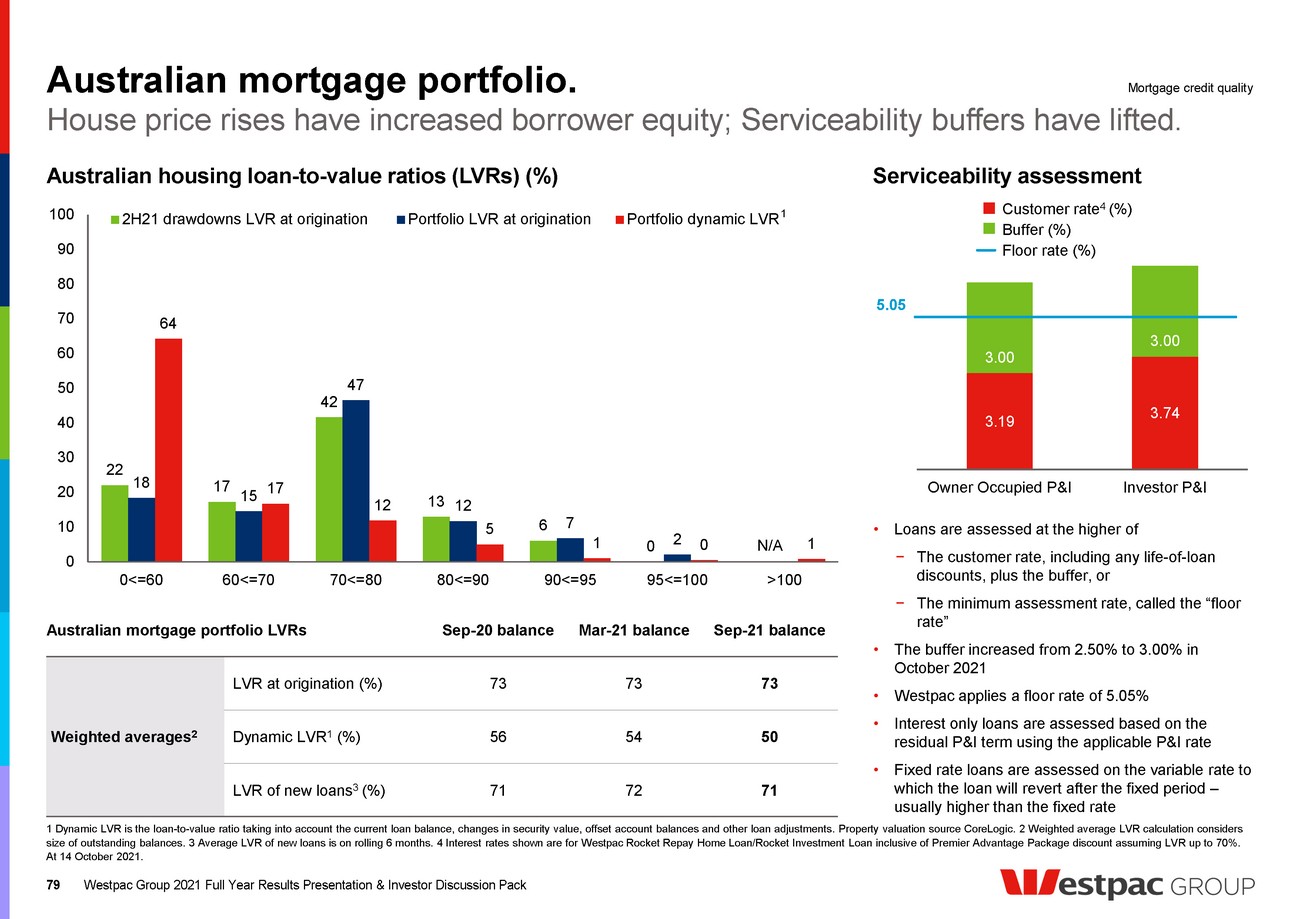
| 8 10 10 19 Sep-21 Investment property loans - incentive is to keep repayments high for tax purposes Accounts opened in the last 12 months Loans with structural restrictions on repayments e.g. fixed rate Residual - less than 1 month repayment buffer Loans ‘on time’ and <1 mth ahead (% of balances) 3 Australian mortgage portfolio repayment buffers. Westpac Group 2021 Full Year Results Presentation & Investor Discussion Pack 80 Offset account balances 2 ($bn) Australian home loan customers ahead on repayments 1 (% by balances) 1 Customer loans ahead on payments exclude equity/line of credit products as there are no scheduled principal payments. Includes mortgage offset accounts. ‘Behind’ is more than 30 days past due. ‘On time’ includes up to 30 days past due. 2 Includes RAMS from September 2020 onwards. 3 The chart does not add due to rounding. Mortgage credit quality 31 33 35 36 37 39 39 40 41 42 46 48 51 Sep-15 Mar-16 Sep-16 Mar-17 Sep-17 Mar-18 Sep-18 Mar-19 Sep-19 Mar-20 Sep-20 Mar-21 Sep-21 Linked to I/O mortgages Linked to P&I mortgages 2 27 18 16 6 6 24 2 27 20 16 6 6 24 2 28 20 16 6 6 23 Behind On time < 1 Mth < 6 Mths < 1 Yr < 2 Yrs >2 Yrs Sep-20 Mar-21 Sep-21 48 7 10 13 13 21 29 7 3 5 7 8 18 47 13 <75k 75k to 100k 100k to 125k 125k to 150k 150k to 200k 200k to 500k >500k Owner Occupied Investment Property Loan Applicant gross income band (2H21 drawdowns, % by balances) |
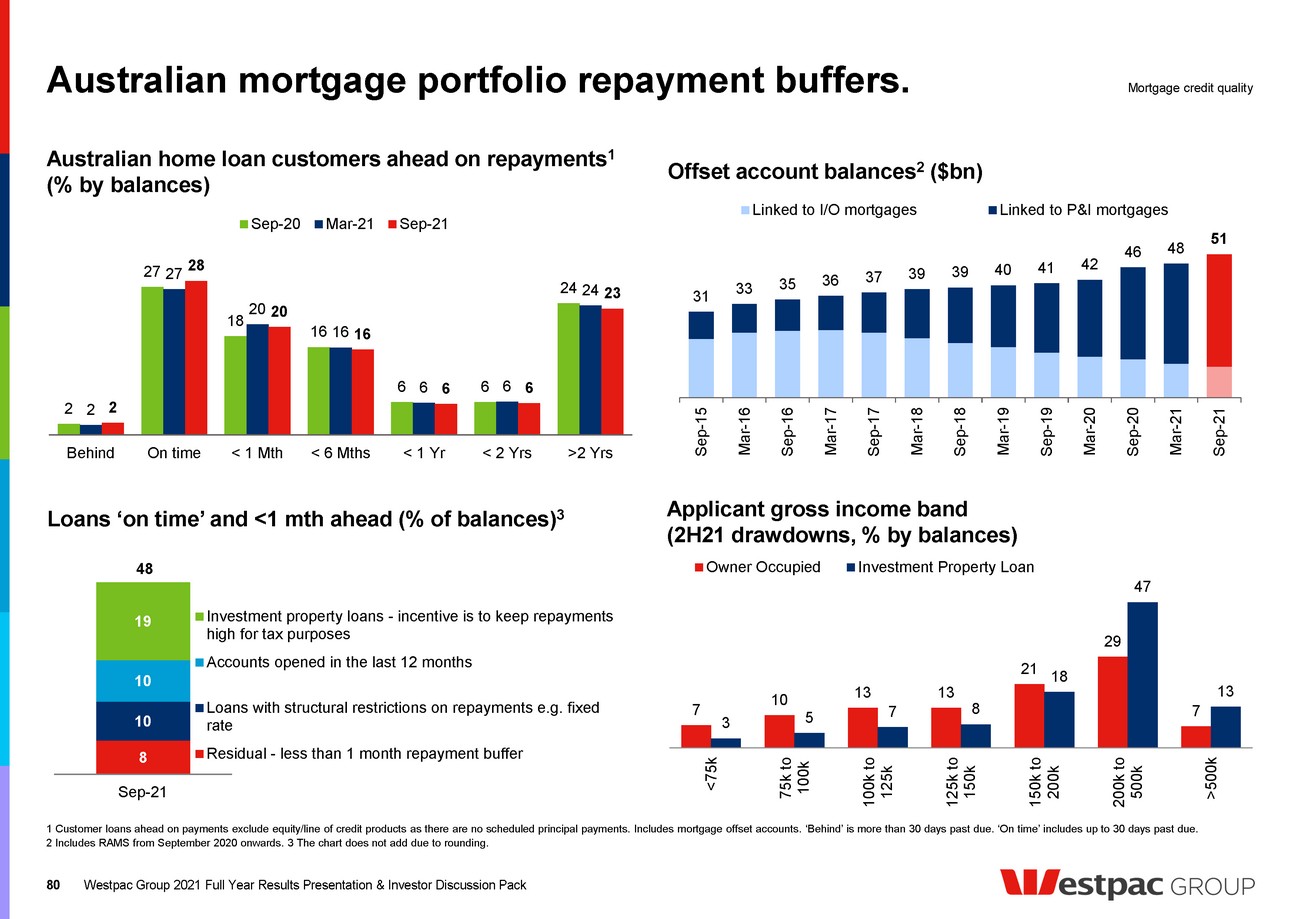
| Calendar year Australian mortgage portfolio underwriting. Westpac Group 2021 Full Year Results Presentation & Investor Discussion Pack 81 Credit policy at October 2021 Australian mortgage portfolio by year of origination (% of total book) 1 HEM is the Household Expenditure Measure, produced by the Melbourne Institute. 2 In Second Half 2021 Westpac Lender’s Mortgage Insurance Limited was sold to Arch Capital Group. The sale was completed on 31 August 2021. Westpac has entered into a 10-year exclusive supply agreement for Arch to provide lenders mortgage insurance to the Group. Mortgage credit quality 2 1 1 1 2 2 2 2 4 5 7 8 9 10 10 14 20 Pre-2006 2006 2007 2008 2009 2010 2011 2012 2013 2014 2015 2016 2017 2018 2019 2020 2021 Income • Income verified via payslips, tax returns or salary credits, with other supporting documentation such as PAYG payment summaries or ATO Income Statements (minimum document standards apply) • Discount of at least 20% applies to less certain income sources i.e. rental income, bonuses Credit Score & Credit Bureau • Bespoke application scorecards segmented by new and existing customers • Credit and score override rates tracked and capped • Credit bureau checks required Expenses • Expenses are assessed as the higher of a borrower’s HEM 1 comparable expenses or HEM , plus any expenses that are not comparable to HEM (e.g. private school fees, life insurance) • HEM is adjusted by income bands, post settlement postcode location, marital status and dependants • 17 expense categories used, aligned with Melbourne Institute guidelines and LIXI standards Serviceability assessment • For serviceability assessment, interest rate applied to all mortgage debt is the greater of: – Actual interest rate plus buffer of 3.00% (from 29 October 2021, previously 2.50%), and – Minimum assessment rate of 5.05% (from 9 October 2020, previously 5.35%) • For I/O Loans, serviceability is assessed on a P&I basis over the residual term • All existing customer commitments are verified • Review Westpac Group accounts and Comprehensive Credit Reporting (CCR) to identify customer commitments • Limits apply to higher debt-to-Income lending; above 7x referred for manual credit assessment • Credit card repayments assessed at 3.8% of limit Genuine savings deposit requirements • Minimum 5% proof of genuine savings for higher LVR loans (typically LVR >85%). First Home Owners Grants not considered genuine savings Security • LVR restrictions apply depending on location, property value and nature of security • Restrictions on high-density apartments based in postcode defined areas (generally capital city CBD’s) and properties in towns heavily reliant on a single industry (e.g. mining, tourism) LMI • Mortgage insurance for higher risk loans, such as LVRs >80%. Exception policy applies for certain professionals and Westpac Group staff Australian mortgage portfolio by insurance profile 2 (%) 16 6 79 Insurance not required (Low risk profile including loans <80% LVR) Not insured >80% LVR (LMI waiver policy applies to certain professionals and staff) Insured (>80% LVR) |

| Australian mortgages. Westpac Group 2021 Full Year Results Presentation & Investor Discussion Pack 82 Scheduled I/O term expiry 2 (% of total I/O loans) I/O lending by dynamic LVR 1 and income band (%) Interest only and Investment property lending. 1 Dynamic LVR is the loan-to-value ratio taking into account the current loan balance, changes in security value, offset account balances and other loan adjustments. Property valuation source CoreLogic. 2 Based on outstanding balance. Excludes line of credit loans, I/O loans without date (including bridging loans and loans with construction purpose) and I/O loans that should have switched to P&I but for the previously announced mortgage processing error. 3 Includes amortisation. Calculated at account level where split loans represent more than one account. 4 Customer loans ahead on payments exclude equity/line of credit products as there are no scheduled principal payments. Mortgage credit quality 12 4 1 31 15 4 21 10 2 64 29 7 <=60% 60%<=80% >80% Dynamic LVR bands (%) <$100k $100k - $250k >$250k 24 15 13 12 12 24 1 0<1 Yr 1<2 Yrs 2<3 Yrs 3<4 Yrs 4<5 Yrs 5<10 Yrs 10 Yrs+ Applicant gross income bands Chart does not add due to rounding Investment property portfolio by number of properties per customer (%) 64 25 7 211 1 2 3 4 5 6+ Investment property lending (IPL) portfolio Sep-20 Mar-21 Sep-21 Investment property loans ($bn) 161 157 154 Weighted averages LVR of IPL loans at origination (%) 72 72 72 LVR of new IPL loans in the period (%) 69 70 70 Dynamic LVR 1 of IPL loans (%) 57 54 50 Average loan size 3 ($’000) 320 320 318 Customers ahead on repayments including offset accounts 4 (%) 62 63 61 90+ day delinquencies (bps) 148 118 109 Annualised loss rate (net of insurance claims) (bps) 3 3 4 |
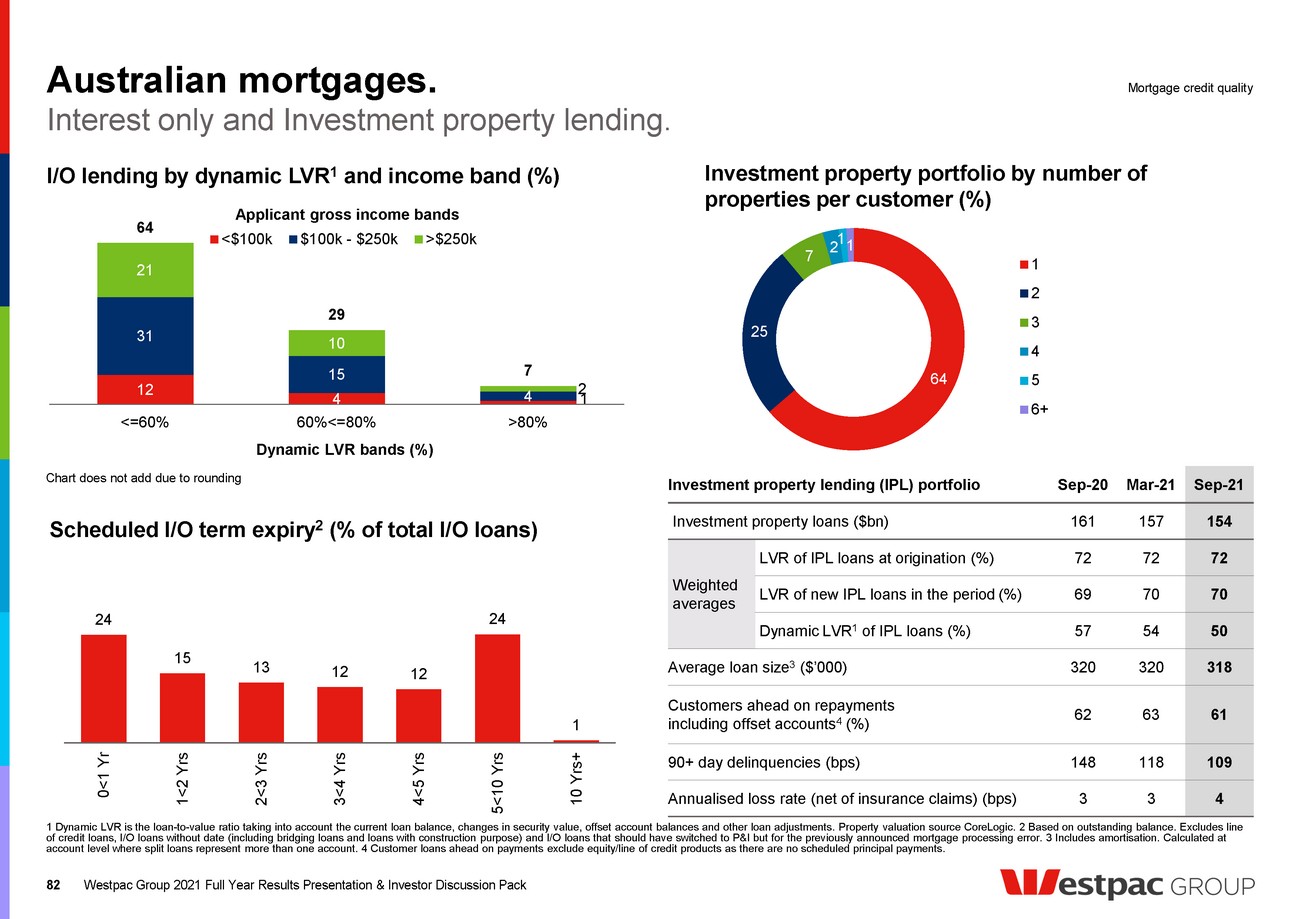
| Capital, funding and liquidity ,11estpac GROUP |
| 53.8 3.5 50.3 CET1 capital September 2021 Off-market share buy-back (pro forma) CET1 capital post share buy-back CET1 capital above 10.5% CET1 capital at 10.5% Capital management. 84 Rationale for off-market share buy-back • Westpac has a strong capital position. Its CET1 capital ratio of 12.32% reflects $8.0 billion of capital above APRA’s unquestionably strong CET1 ratio of 10.5% • The CET1 capital ratio will be above APRA’s unquestionably strong capital benchmark post share buy-back • Westpac’s dividend payout ratio range of 60% to 75% means it continues to generate capital organically • Westpac’s strong CET1 capital ratio, along with further asset sales and a positive economic outlook provides flexibility in how Westpac considers future capital management Capital overview ($bn) Franking credit position • The adjusted franking credit balance at 30 September 2021 was ~$3.8bn (after the 2021 final dividend payable on 21 December 2021) • The announced off-market share buy-back is expected to utilise around $0.8bn of franking credits 1 • The off-market share buy-back is not expected to diminish our ability to fully frank ordinary dividends in the future • Over each of the past seven years, we have generated more franking credits than we have paid out given the high percent of Australian tax paid Franking credit balance ($bn) 1 Illustrative of a market price of $25.00 and a share buy-back discount of 10%. Capital, funding and liquidity Westpac Group 2021 Full Year Results Presentation & Investor Discussion Pack 3.8 0.8 3.0 1 |
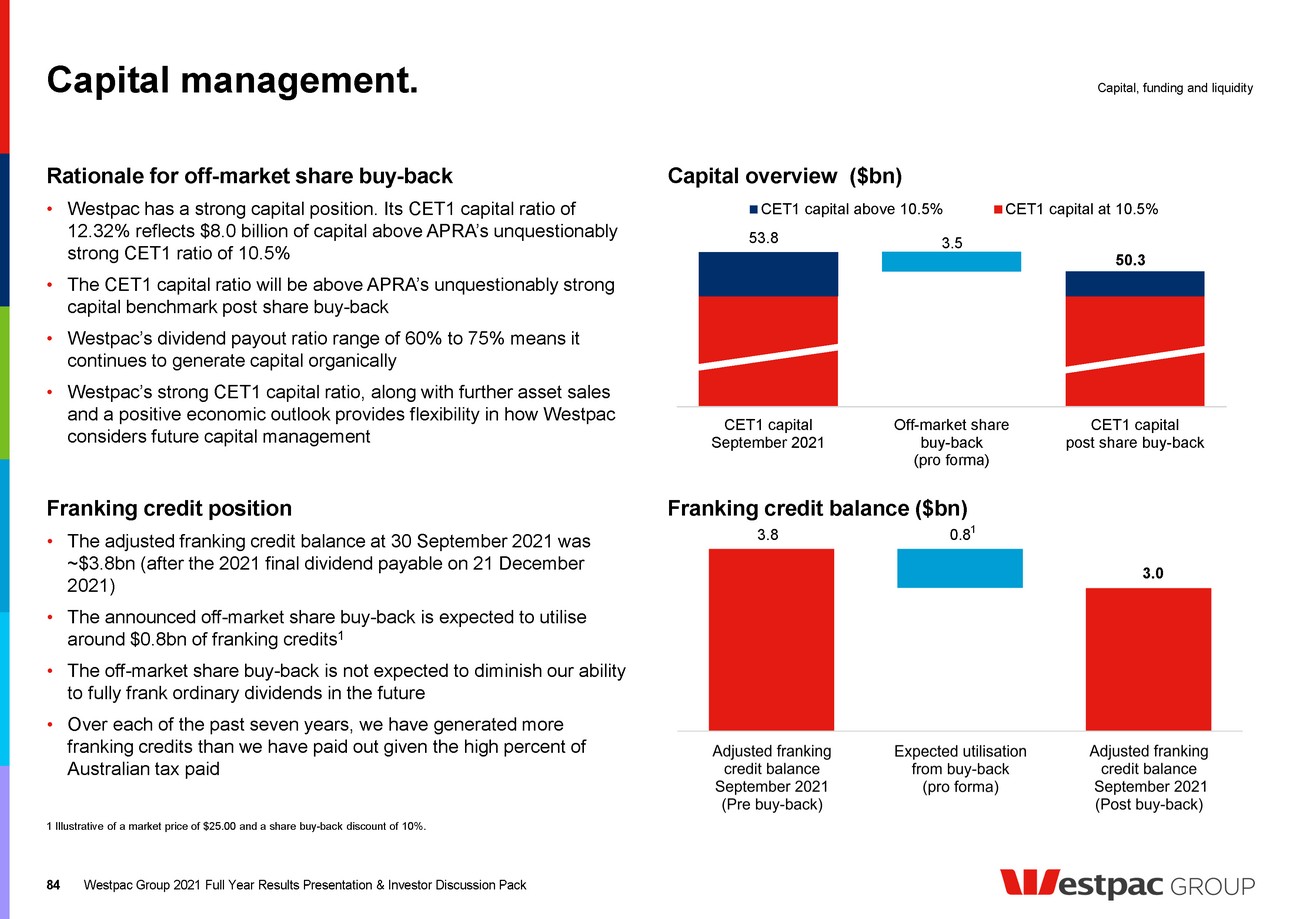
| Off-market share buy-back: key details. 85 Key features • Off-market share buy-back of up to $3.5bn • Size of share buy-back is up to approximately 4.2% of issued capital 1 • Share buy-back price consists of capital component and fully-franked dividend • Details in share buy-back booklet 2 Key dates 3 1 Illustrative of a market price of $25.00 and a share buy-back discount of 10%. 2 Eligible shareholders can access the booklet at westpac.com.au/buyback. Shareholders who are (or nominees or trustees who hold shares on behalf of or for the account or benefit of persons who are) located in the United States or US Persons (within the meaning of Regulation S under the United States Securities Act of 1933, as amended), residents of Canada or who are otherwise excluded foreign persons will not be eligible to participate in the share buy-back. The booklet is not to be distributed into the United States or Canada. 3 While Westpac does not anticipate changes to these dates, it reserves the right to change them without notice, subject to laws and ASX requirements. If any dates are changed, subsequent dates may also change. Westpac also reserves the right to terminate the share buy-back at anytime, which would be announced to the ASX. 4 Last date for shares to qualify for franking credit entitlements. Capital, funding and liquidity Westpac Group 2021 Full Year Results Presentation & Investor Discussion Pack 13 December 1 November Market price – pricing period commences Announcement of share buy- back acceptances and share buy-back price Share buy-back record date 4 November 8 November Tender period closes Market price – pricing period ends 17 December 23 December Despatch of share buy- back booklet on request commences 2 17 November 15 November 20 December Payment of share buy-back proceeds Announcement of off- market share buy-back Last day shares can be acquired to be eligible to participate 4 Tender period opens |
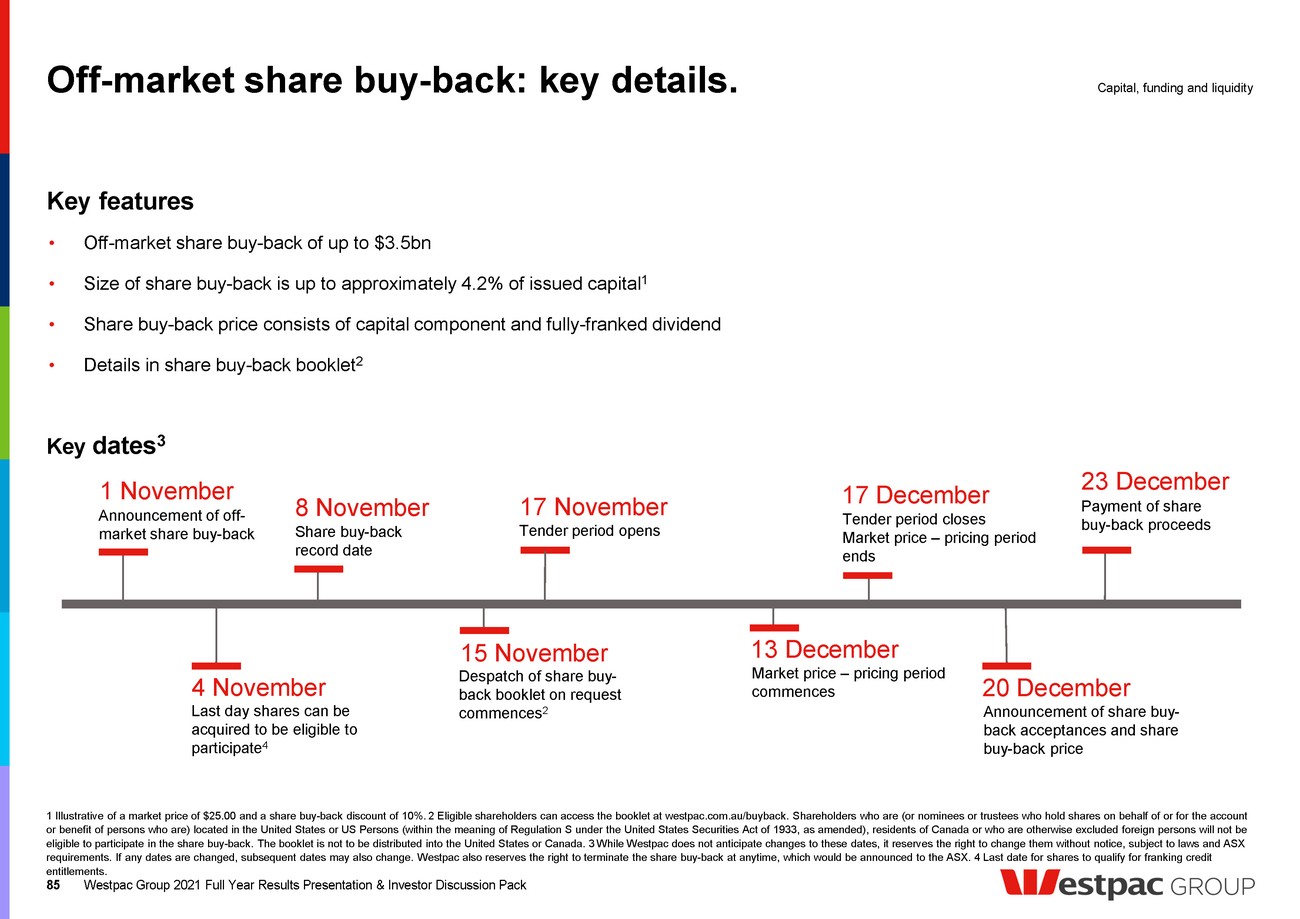
| 26 29 12.34 72 12.32 11.81 (15) (49) (16) (19) (1) (80) Mar-21 Cash earnings ex notables Notable items Interim dividend RWA De- ductions and other FX trans- lation impact Divest- ments Sep-21 Future sales Buy- back Pro forma Sep-21 • CET1 capital ratio of 12.32%, down 2bps from 31 March 2021 • 26bps benefit from the divestment of Coinbase Inc., and the sales of Westpac General Insurance and Westpac Lenders Mortgage Insurance • Interim dividend payment (49bps) • Higher RWAs (16bps) mainly from higher mortgage RWAs • Notable items (15bps) • Capital deductions and other capital movements (19bps) mostly from additional capital invested in non-consolidated entities and higher deductions for capitalised expenditure and regulatory expected loss • Pro forma CET1 ratio reflects expected benefit from announced divestments (29bps, Westpac Life Insurance Services, Westpac Life-NZ and Auto Finance) expected 80bps impact from the off-market share buy-back of up to $3.5bn CET1 capital ratio 12.32%. 86 Capital, funding and liquidity Key capital ratios 1 (%) Sep-20 Mar-21 Sep-21 Level 2 CET1 capital ratio 11.1 12.3 12.3 Additional Tier 1 capital ratio 2.1 2.2 2.3 Tier 1 capital ratio 13.2 14.5 14.6 Tier 2 capital ratio 3.1 3.9 4.2 Total regulatory capital ratio 16.4 18.4 18.9 Risk weighted assets (RWA) ($bn) 438 429 437 Leverage ratio 5.8 6.3 6.0 Level 1 CET1 capital ratio 11.4 12.6 12.6 Internationally comparable ratios 2 Leverage ratio (internationally comparable) 6.5 6.9 6.6 CET1 capital ratio (internationally comparable) 16.5 18.1 18.2 1 Table may not add due to rounding. 2 Internationally comparable methodology aligns with the APRA study titled ‘International Capital Comparison Study’ dated 13 July 2015. 3 Subject to completion occurring as expected. Level 2 CET1 capital ratio movements (%, bps) Westpac Group 2021 Full Year Results Presentation & Investor Discussion Pack 3 |
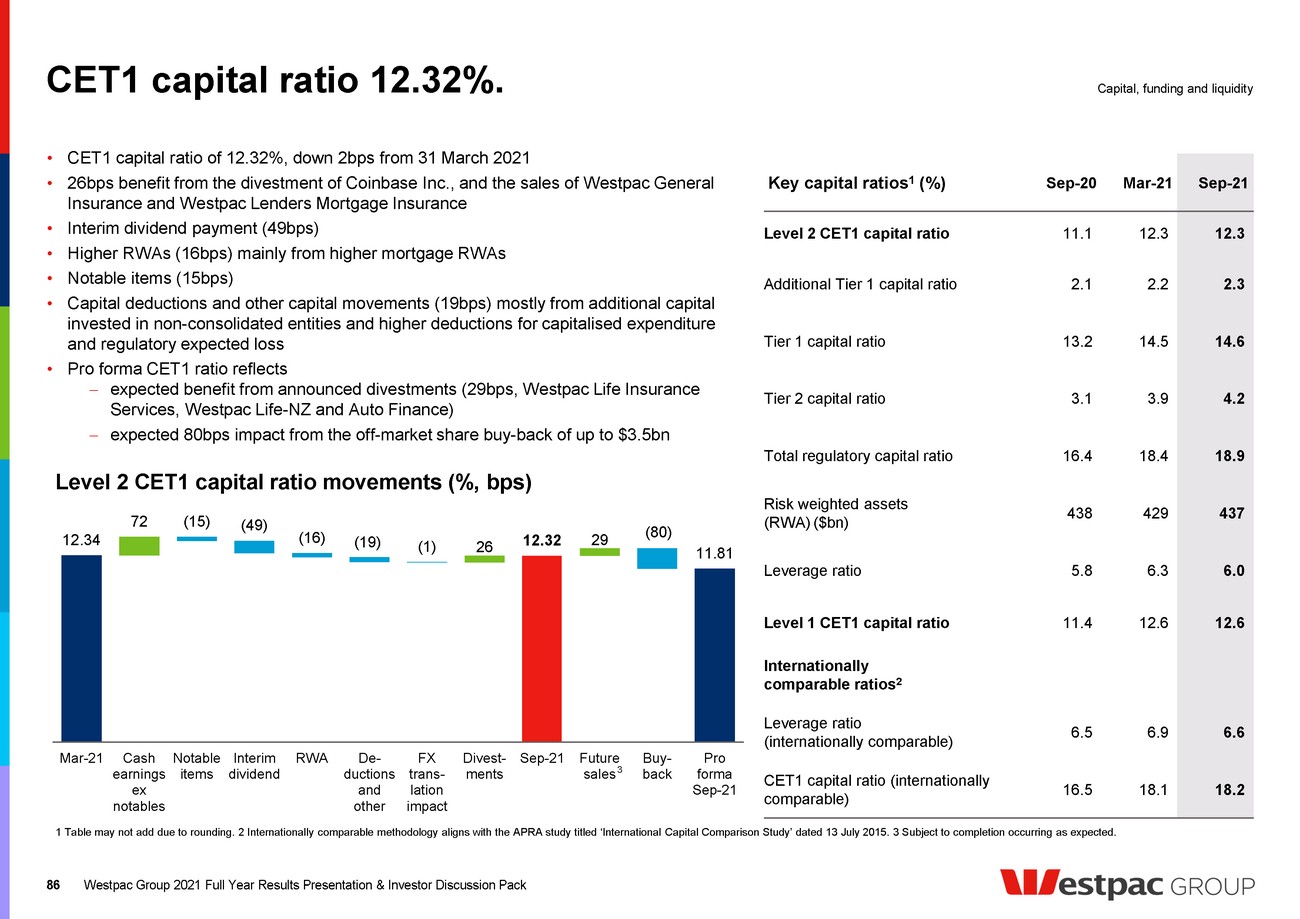
| 437.9 428.9 10.2 1.8 436.7 (2.8) (0.6) (0.8) Sep-20 Mar-21 Credit risk Market risk IRRBB Operational risk Other Sep-21 359.4 347.1 5.6 5.1 2.4 357.3 (2.3) (0.6) Sep-20 Mar-21 Credit quality Lending Mortgage risk weight floor FX translation impacts Counterparty credit and mark-to-market risk Sep-21 Risk weighted assets. 87 • RWA increased $7.8bn over 2H21, mostly from higher credit risk RWA (CRWA), partly offset by non-credit risk • CRWA increased $10.2bn due to: Higher lending in mortgages and corporate Foreign currency translation impacts from depreciation of the A$ against the US$ and NZ$ RWA floor on mortgages to 25% increased CRWA $5.1bn Partly offset by improved credit quality metrics across specialised lending and business lending • Market risk lower from roll-off of prior year volatility from models Up $7.8bn or 1.8% Risk weighted assets ($bn) Movement in credit risk weighted assets ($bn) Up $10.2bn or 3% Increase from higher credit risk RWA. Commentary Capital, funding and liquidity Westpac Group 2021 Full Year Results Presentation & Investor Discussion Pack |
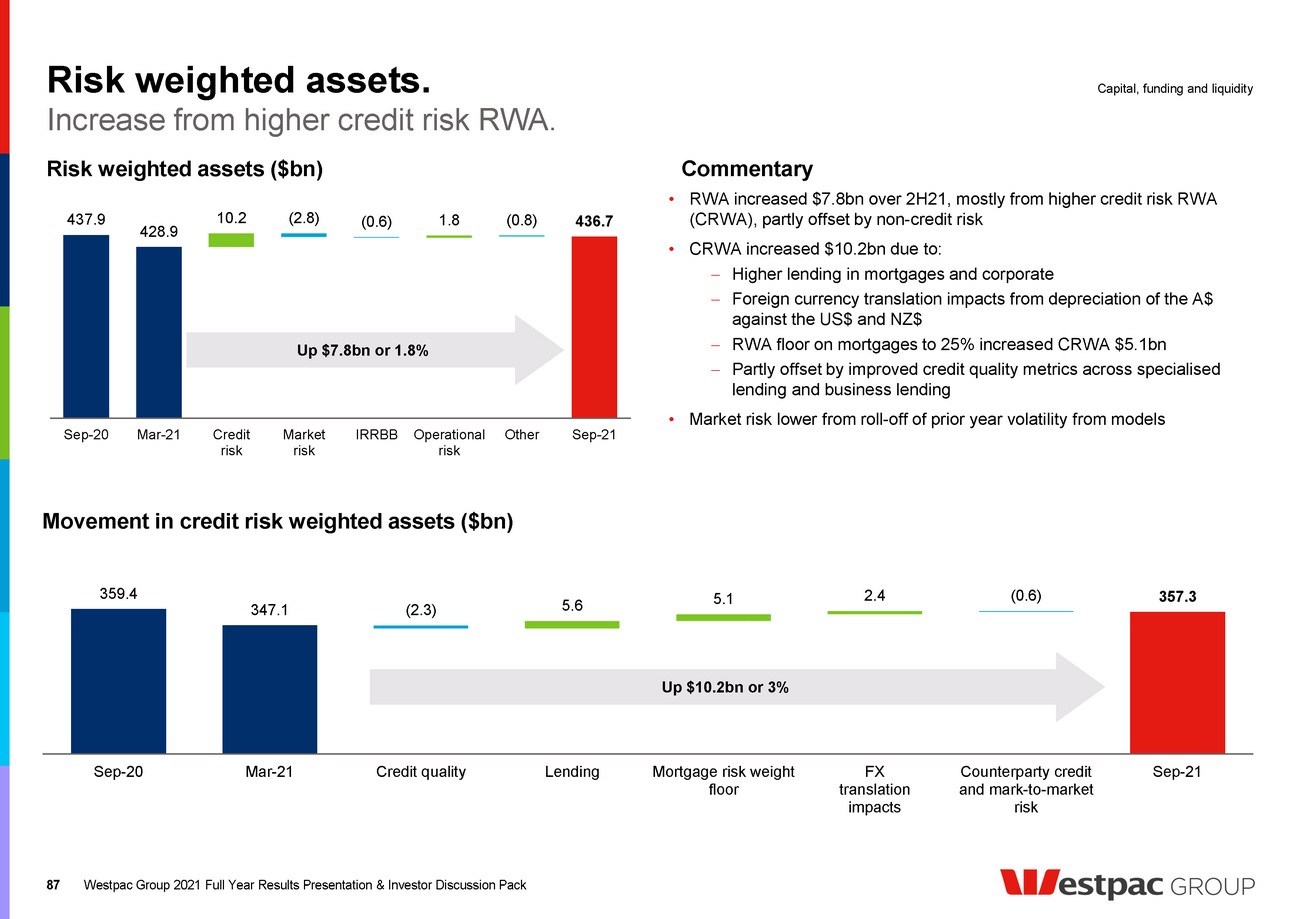
| Implementation Change Details Immediately RBNZ dividend restrictions • Banks are able to pay up to a maximum 50% of their earnings as dividends to shareholders • The restriction will remain in place until 1 July 2022 1 Jan 2022 Capital adequacy • APRA released the final revised APS 111 standard which will come into force from 1 Jan 2022 • Individual equity exposures in subsidiaries (including AT1 and T2 capital invested in subsidiaries) will be risk weighted at 250% up to a limit of 10% of Level 1 CET1 capital (per investment), with any excess above the 10% limit deducted from Level 1 CET1 capital • The changes are expected to reduce the Level 1 CET1 capital ratio by 18bps, primarily from the Group’s equity investment in WNZL. There is no impact to our Level 2 CET1 capital ratio 1 Jan 2022 Liquidity Coverage Ratio (LCR) • APRA requires ADIs to reduce their reliance on the Committed Liquidity Facility (CLF) to zero by the end of 2022 subject to financial market conditions. This change is likely to increase our holding of HQLA and is expected to increase IRRBB RWA 1 Jan 2023 APRA’s revisions to the ADI capital framework APRA’s proposals include: • Increasing the CET1 requirement for domestically systematically important banks (D-SIBs) from 8.0% to 10.5% through an increase in the capital conservation buffer (to 5% from 3.5%)1 and the introduction of a counter-cyclical capital buffer of 1.0% • Adjustments to RWA calculations for certain assets (residential mortgages, non-retail lending) • Implementing a 72.5% output floor to limit the capital benefit for internal ratings-based (IRB) ADIs relative to standardised ADIs We expect the final standards to be released in November 2021 1 Jan 2023 Leverage ratio • Proposed minimum 3.5%. Currently, Westpac’s leverage ratio is 6.0% 1 Jan 2024 Loss Absorbing Capacity (LAC) • APRA requires D-SIBs to lift the total capital ratio by three percentage points of RWA by 1 January 2024. Our Tier 2 capital ratio is 4.2% at 30 September 2021 1 Jul 2028 RBNZ Capital Review • Capital review finalised, with requirements coming into effect through bank’s conditions of registration • RWA of IRB banks including WNZL will effectively increase to 90% of that required under a standardised approach through the introduction of an 85% output floor and increasing IRB scalar from 1.06 to 1.2 • D-SIB Tier 1 capital requirement of 16% with at least 13.5% in the form of CET1 • Implementation from 1 January 2022 with a transitional period of ~6 years Regulatory capital changes. 88 Scheduled implementation of Basel III reforms in Australia deferred by one year. Westpac Group 2021 Full Year Results Presentation & Investor Discussion Pack Capital, funding and liquidity 1 Includes 1% D-SIB buffer. ,11estpac GROUP |
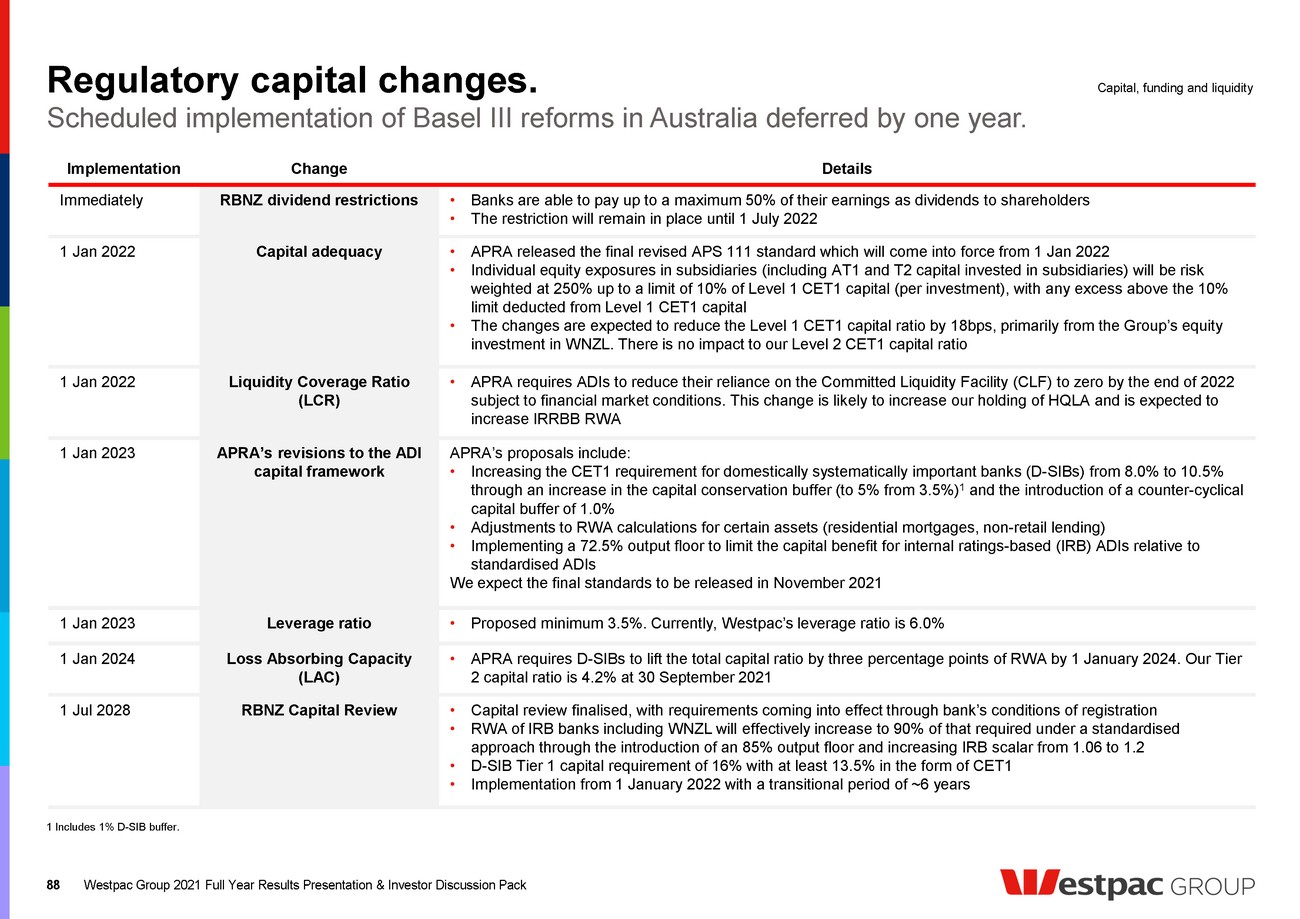
| Internationally comparable capital ratio reconciliation. APRA’s Basel III capital requirements are more conservative than those of the Basel Committee on Banking Supervision (BCBS), leading to lower reported capital ratios by Australian banks. In July 2015, APRA published a study that compared the major banks’ capital ratios against a set of international peers 1. The following details the adjustments from this study and how Westpac’s APRA Basel III CET1 capital ratio aligns to an internationally comparable ratio. 89 1 Methodology aligns with the APRA study titled “International capital comparison study", dated 13 July 2015. Westpac’s CET1 capital ratio (APRA basis) 12.3 Equity investments Balances below prescribed threshold are risk weighted, compared to a 100% CET1 deduction under APRA’s requirements 0.4 Deferred tax assets Balances below prescribed threshold are risk weighted, compared to a 100% CET1 deduction under APRA’s requirements 0.6 Interest rate risk in the banking book (IRRBB) APRA requires capital to be held for IRRBB. The BCBS does not have a Pillar 1 capital requirement for IRRBB 0.4 Residential mortgages Loss given default (LGD) of 15%, compared to the 20% LGD floor under APRA’s requirements. APRA also applies a correlation factor for mortgages higher than the 15% factor prescribed in the Basel rules 2.1 Unsecured non-retail exposures LGD of 45%, compared to the 60% or higher LGD under APRA’s requirements 0.7 Non-retail undrawn commitments Credit conversion factor of 75%, compared to 100% under APRA’s requirements 0.5 Specialised lending Use of internal-ratings based (IRB) probabilities of default (PD) and LGDs for income producing real estate and project finance exposures, reduced by application of a scaling factor of 1.06. APRA applies higher risk weights under a supervisory slotting approach, but does not require the application of the scaling factors 0.6 Currency conversion threshold Increase in the A$ equivalent concessional threshold level for small business retail and small to medium enterprise corporate exposures 0.2 Capitalised expenses APRA requires these items to be deducted from CET1. The BCBS only requires exposures classified as intangible assets under relevant accounting standards to be deducted from CET1 0.4 Internationally comparable CET1 capital ratio 18.2 Internationally comparable Tier 1 capital ratio 21.2 Internationally comparable total regulatory capital ratio 26.6 Capital, funding and liquidity Westpac Group 2021 Full Year Results Presentation & Investor Discussion Pack |
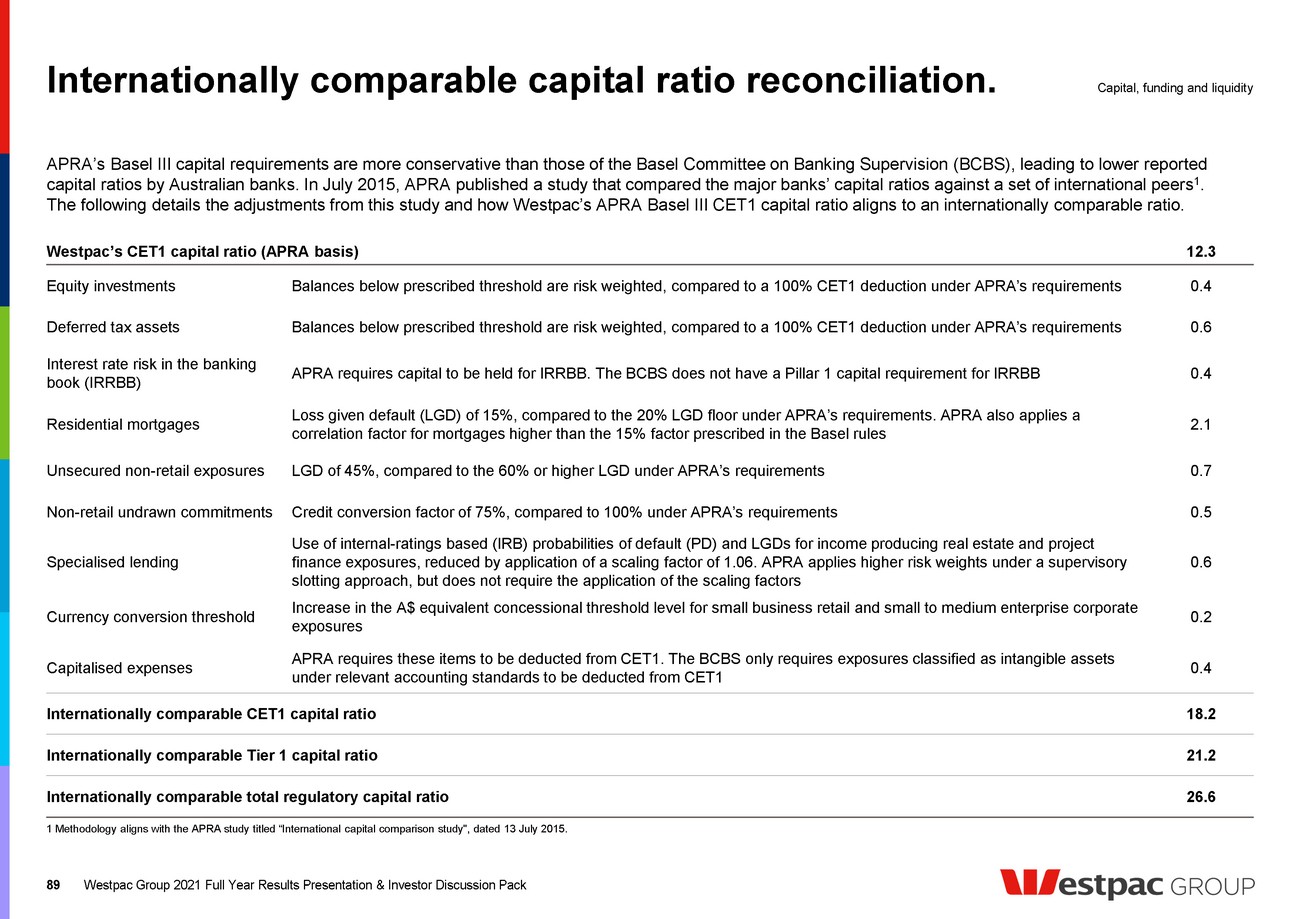
| Well placed on internationally comparable. Common equity Tier 1 ratio (%) 1 90 Leverage ratio (%) 1 CET1 and leverage ratios. 1 Comparison group comprises listed commercial banks with assets in excess of A$700bn and which have disclosed fully implemented Basel III ratios or provided sufficient disclosure to estimate. Based on company reports/ presentations. Ratios at 30 June 2021, except for Westpac and ANZ which are at 30 September 2021, NAB and Natixis which are at 31 March 2021, and Bank of Montreal, Scotiabank, Royal Bank of Canada, CIBC and Toronto Dominion are at 31 July 2021. Leverage ratio is on a transitional basis. Where accrued expected dividends have been deducted and disclosed, these have been added back for comparability. US banks are excluded from leverage ratio analysis due to business model differences, for example from loans sold to US Government sponsored enterprises. NAB has not disclosed an internationally comparable leverage ratio since September 2017. Shows ratios at the last reporting date, which may take account of measures taken by jurisdictions in response to COVID-19. Capital, funding and liquidity Norinchukin Bank CBA NatWest ANZ Westpac, 18.17% Danske Bank Nordea Morgan Stanley Rabobank Lloyds NAB Unicredit ING Group Sumitomo Mitsui HSBC BPCE Intesa Sanpaolo Barclays UBS Toronto Dominion Bank BBVA Standard Chartered Credit Suisse Societe Generale Royal Bank of Canada JPMorgan Chase Bank of Montreal Goldman Sachs Commerzbank China Construction Bank Deutsche Bank Mitsubishi UFJ BNP Paribas ICBC Bank of America Credit Agricole SA Wells Fargo CIBC Scotiabank Santander Mizuho FG China Merchants Bank Natixis Citigroup Agricultural Bank of .. Bank of China 0% 5% 10% 15% 20% Norinchukin Bank ICBC China Construction Bank BBVA Bank of China Agricultural Bank of China China Merchants Bank Rabobank CBA Intesa Sanpaolo Westpac (6.6%) Unicredit ANZ Credit Suisse NAB BPCE UBS HSBC Lloyds Standard Chartered Nordea Santander Bank of Montreal Royal Bank of Canada Barclays NatWest Toronto Dominion Deutsche Bank Scotiabank ING Group Danske Bank Societe Generale CIBC Commerzbank Credit Agricole SA Sumitomo Mitsui Natixis Mitsubishi UFJ Mizuho FG BNP Paribas 0% 2% 4% 6% 8% 10% Westpac Group 2021 Full Year Results Presentation & Investor Discussion Pack |
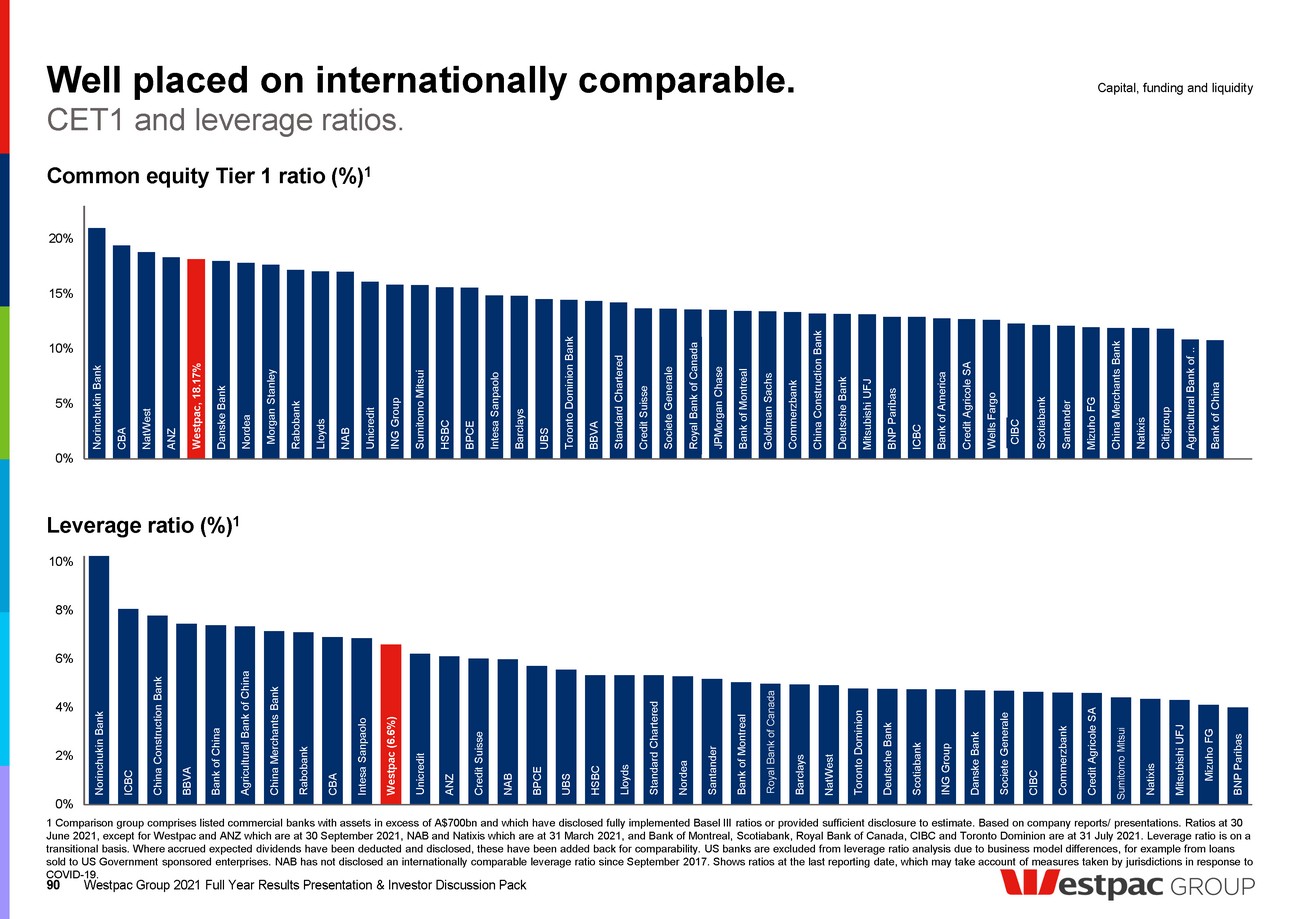
| 85 118 90 137 13 37 10 37 35 34 10 134 165 134 174 Net cash outflows Liquid assets Net cash outflows Liquid assets Liquidity and funding. 91 Liquidity coverage ratio 1,2 (LCR) (quarterly average, $bn) Increase in key ratios. 1 Charts may not add due to rounding. 2 LCR is calculated as the percentage ratio of stock of liquid assets over the total net cash outflows in a modelled 30 day defined stressed scenario. Liquid assets include HQLA as defined in APS 210, RBNZ eligible liquids, CLF eligible securities less RBA open repos funding end of day ESA balances with the RBA. CLF and TFF are made available to Australian Authorised Deposit-taking Institutions by the RBA that, subject to qualifying conditions, can be accessed to meet LCR requirements under APS210 – Liquidity. Other flows include credit and liquidity facilities, collateral outflows and inflows from customers. 2 Other flows includes net cash outflow overlay. Effective 1 January 2021, the Group is required to increase the value of its net cash outflows by 10% for the purpose of calculating LCR, in response to action taken by APRA for breaches of Westpac’s liquidity requirements predominantly relating to WNZL. This reduces the average LCR for the quarter ended 30 September 2021 by 13 percentage points. 3 Other includes derivatives and other assets. 4 Other loans includes off balance sheet exposures and residential mortgages >35% risk weight. Capital, funding and liquidity Net cash outflows (NCOs) Other flows 2 Wholesale funding Customer deposits Liquid assets Term Funding Facility (TFF, undrawn) Committed Liquidity Facility (CLF) High Quality Liquid Assets (HQLA) Liquidity coverage ratio 1,2 (quarterly average, %) Mar 2021: LCR 124% Westpac Group 2021 Full Year Results Presentation & Investor Discussion Pack 124 129 14 (8) (4) 3 1 Mar-21 HQLA CLF and TFF Customer Deposits Wholesale funding Other flows Sep-21 Increase mainly from higher HQLA 3 Sep 2021: LCR 129% Net stable funding ratio (NSFR) ($bn) Available Stable Funding Required Stable Funding 651 521 Capital Retail & SME deposits Corporate & institutional deposits Wholesale funding and other liabilities Residential mortgages ≤35% risk weight Other loans 4 Liquids and other 3 Net stable funding ratio 1 (%) NSFR at 30 September 2021: 125% 123 125 0.5 1.5 0.8 2.3 (1.5) (1.2) Mar-21 Capital Retail & SME deposits Corporate & institutional deposits Wholesale funding and other Residential mortgages ≤35% Risk Weight Other loans, liquids & other Sep-21 |

| 63 65 65 8 8 8 1 1 1 12 10 9 5 6 6 7 6 5 5 4 6 Sep-19 Sep-20 Sep-21 Balance sheet funding. 92 Funding composition (%) Increase in customer deposits. 1 Includes long term wholesale funding with a residual maturity less than or equal to 1 year. 2 Equity excludes FX translation, Available-for-Sale securities and Cash Flow Hedging Reserves. 3 Short term funding includes scroll. Scroll represents wholesale funding with an original maturity greater than 12 months that now has a residual maturity less than 12 months. Long term includes securitisation. Capital, funding and liquidity Charts may not add to 100 due to rounding By residual maturity Westpac Group 2021 Full Year Results Presentation & Investor Discussion Pack Movement in funding sources Sep19 – Sep21 (A$) Customer deposits to net loans ratio (%) 544 555 550 580 720 693 690 711 75.6 80.1 79.8 81.6 Mar-20 Sep-20 Mar-21 Sep-21 Customer deposits Net loans Customer deposits to net loans ratio 105 150 255 88 142 230 85 131 216 97 144 240 Short term Long term Total wholesale Mar-20 Sep-20 Mar-21 Sep-21 Wholesale funding by residual maturity 3 ($bn) Long term includes TFF drawn down: Sep-20 $18bn Mar-21 $22bn Sep-21: $30bn W’sale onshore <1yr 1 up $10bn W’sale offshore <1yr 1 down $15bn W’sale onshore >1yr up $17bn inc. $30bn TFF W’sale offshore >1yr down $17bn Securitisation down $3bn Equity 2 up $6bn Customer deposits up $56bn |
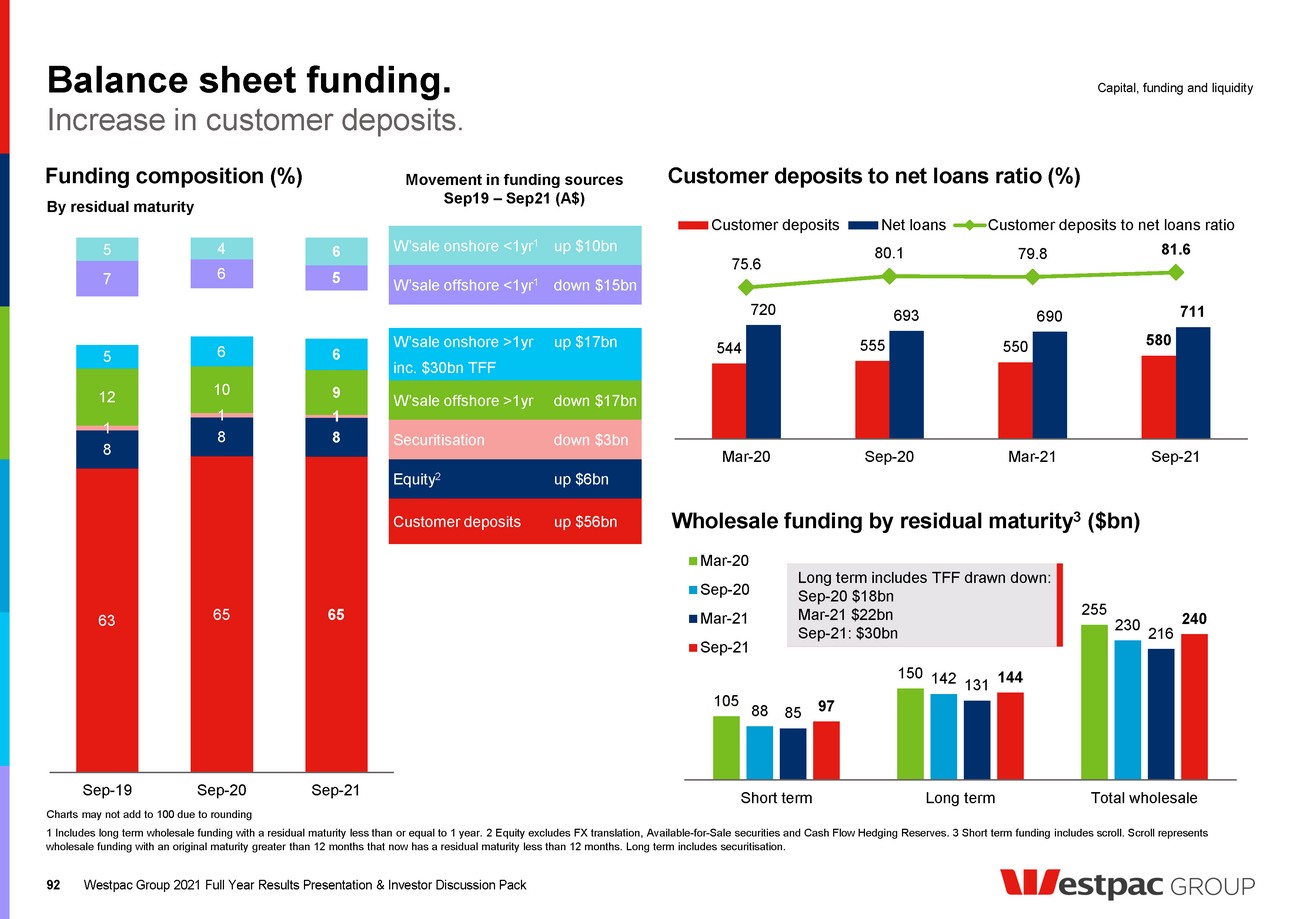
| Long term wholesale funding. 93 1 Based on residual maturity and FX spot currency translation. Includes all debt issuance with contractual maturity greater than 13 months excluding US Commercial Paper and Yankee Certificates of Deposit. Contractual maturity date for hybrids and callable subordinated instruments is the first scheduled conversion date or call date for the purposes of this disclosure. Perpetual sub debt has been included in >FY27 maturity bucket. Maturities exclude securitisation amortisation. 2 Data includes issuance between FY15 and FY19. Includes WNZL. 3 RMBS and ABS at amortised value. Returning to more normal funding activities in FY22. Westpac Group 2021 Full Year Results Presentation & Investor Discussion Pack By program 2,3 (%) Capital, funding and liquidity 31 42 37 32 34 31 35 27 38 40 13 13 11 21 FY15 FY16 FY17 FY18 FY19 FY20 FY21 FY22 FY23 FY24 FY25 FY26 FY27 >FY27 Covered bond Hybrid Senior/Securitisation Subordinated debt Term Funding Facility (Aus) Funding for Lending Programme (NZ) Term debt issuance and maturity profile 1 ($bn) By currency 2 (%) 65 18 7 4 6 Senior bonds Covered bonds RMBS & ABS Additional Tier 1 capital Tier 2 capital 33 40 17 11 AUD USD EUR Other (inc GBP, NZD, CHF and Yen) Issuance Maturities Issuance composition prior to COVID-19 $30 billion in TFF drawdowns April 2020 to June 2021 |
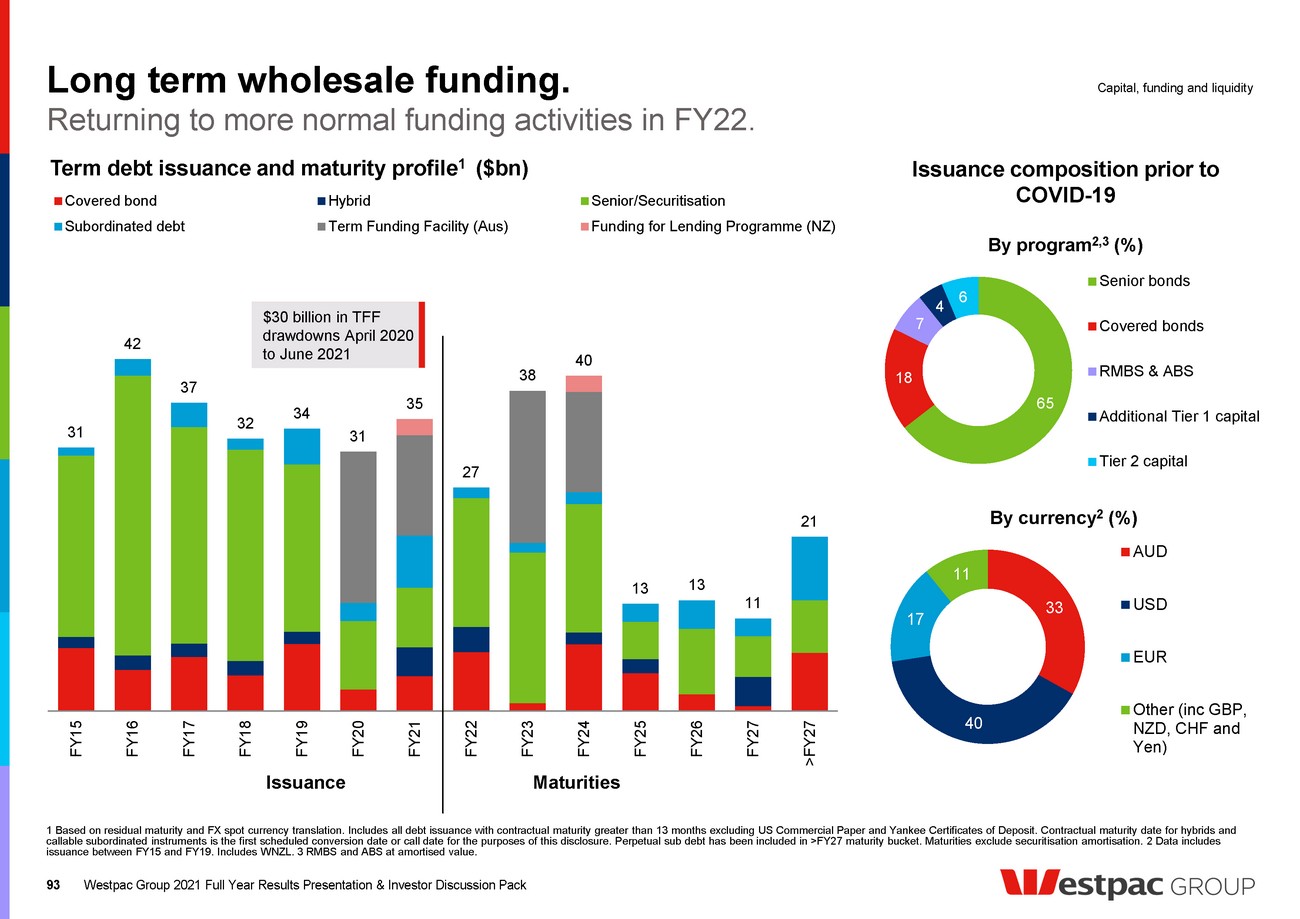
| Tier 2 capital issuance. 94 Progress towards meeting TLAC requirements ahead of time. Westpac Group 2021 Full Year Results Presentation & Investor Discussion Pack Westpac Total Regulatory Capital 30 September 2021 APRA-basis 1 Jan 2024 APRA-basis CET1 Additional Tier 1 Tier 2 5% (approx. $22bn 3) 12.3% ($54bn) 2.3% ($10bn) 4.2% ($19bn) Westpac Tier 2 issuance and calls/maturities 1,2 (notional amount, A$bn) 4.2 2.2 6.2 1.2 1.2 1.4 2.1 3.4 2.1 1.7 5.8 0.0 2.0 4.0 6.0 8.0 FY19 FY20 FY21 FY22 FY23 FY24 FY25 FY26 FY27 FY28 FY29 FY30 >FY30 Issuance Maturities FY22 Tier 2 issuance expected to be approx. $5-7billion (including buffer above regulatory minimum) Westpac Tier 2 capital (notional amount, %) 80 20 Callable Bullet 61 17 6 9 5 21 USD AUD Domestic AUD EMTN EUR JPY SGD HKD By format 4 By currency 4 1 Represents AUD equivalent notional amount using spot FX translation at date of issue for issuance and spot FX translation at 30 September 2021 for maturities. 2 Securities in callable format profiled to first call date, excluding the Perpetual Floating Rate Notes issued 30 September 1986. Securities in bullet format profiled to maturity date. 3 Based on current capital regulation. Does not include balance sheet growth or management buffer. 4 Represents AUD equivalent notional amount using spot FX translation as at 30 September 2021. New TLAC requirement effective 1 Jan 2024 Capital, funding and liquidity |
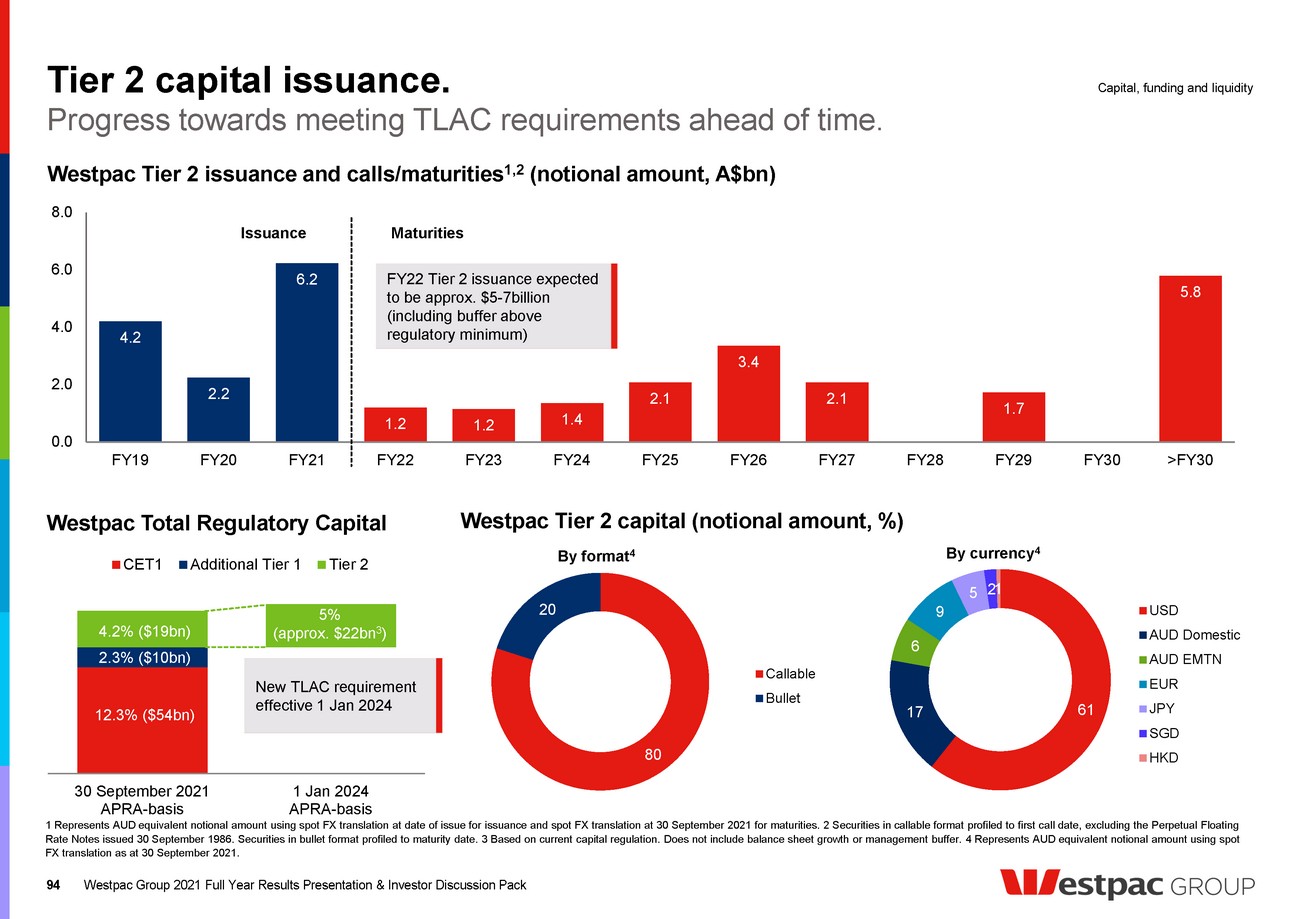
| Divisional results ,11estpac GROUP |

| Divisional 1 contributions. 1 Refer to division descriptions, page 128. NZ in A$. 96 Divisional results FY21 ($m) Consumer Business WIB NZ Specialist Businesses Group Businesses Group Operating income 8,893 4,614 2,021 2,310 1,993 1,207 21,038 Expenses (4,622) (2,530) (2,574) (1,062) (1,477) (1,018) (13,283) Core earnings 4,271 2,084 (553) 1,248 516 189 7,755 Impairment (charges)/benefits 125 484 (162) 79 66 (2) 590 Tax & non-controlling interests (1,315) (779) 45 (377) (389) (178) (2,993) Cash earnings 3,081 1,789 (670) 950 193 9 5,352 FY20 ($m) Consumer Business WIB NZ Specialist Businesses Group Businesses Group Operating income 9,120 4,723 2,293 2,151 1,296 1,043 20,626 Expenses (4,176) (2,298) (1,316) (998) (1,548) (2,364) (12,700) Core earnings 4,944 2,425 977 1,153 (252) (1,321) 7,926 Impairment (charges)/benefits (1,015) (1,371) (404) (302) (255) 169 (3,178) Tax & non-controlling interests (1,183) (320) (241) (239) 1 (158) (2,140) Cash earnings 2,746 734 332 612 (506) (1,310) 2,608 Westpac Group 2021 Full Year Results Presentation & Investor Discussion Pack |
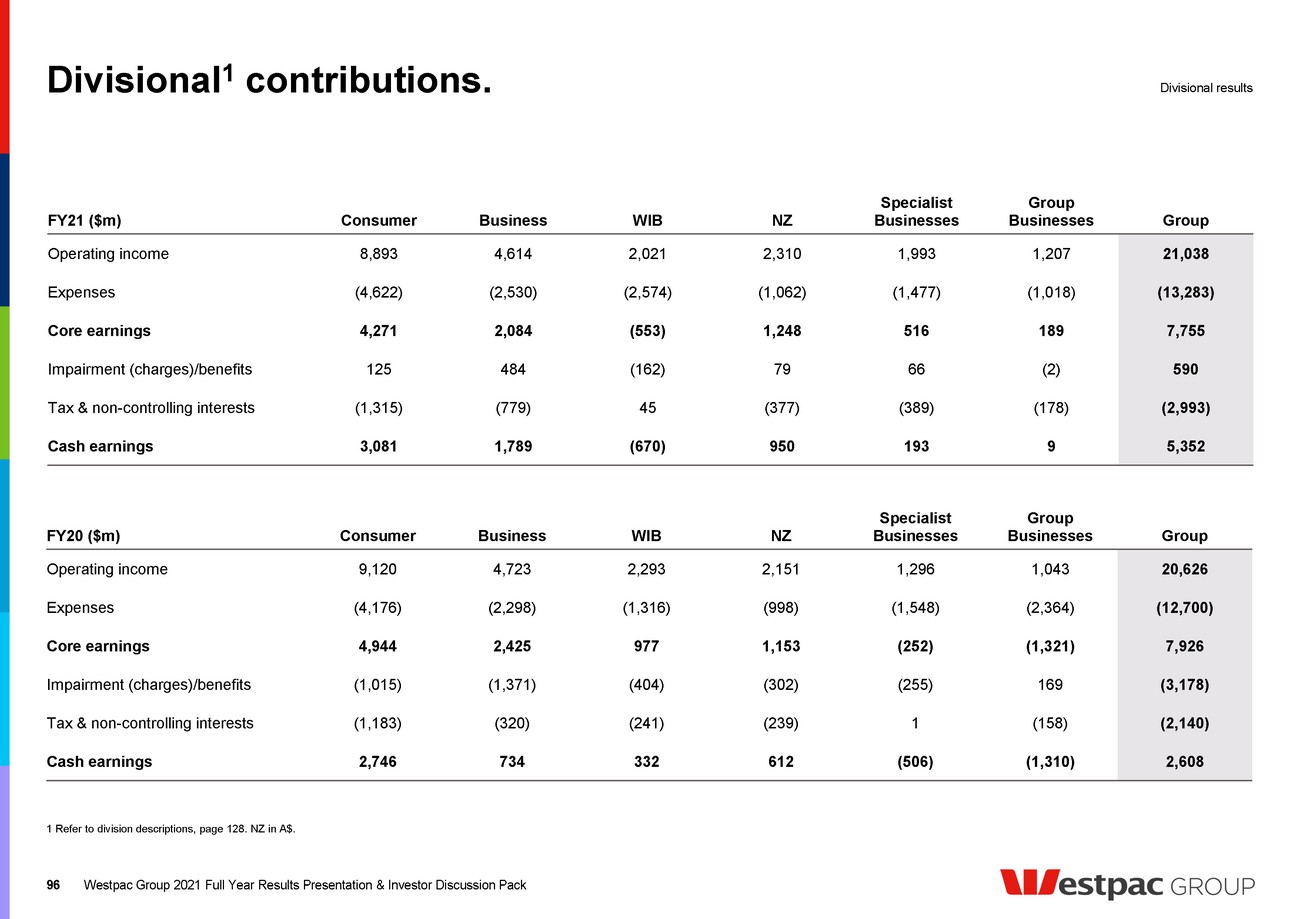
| 3 65 1,274 1,592 76 1,668 1,513 1,489 (30) (158) (35) (24) 2H20 1H21 Add back notable items 1H21 ex-notable items Net interest income Non-interest income Operating expenses Impairment charges Tax and NCI 2H21 ex-notable items Notable items 2H21 Cash earnings ($m) 1 Includes all points of presence including Advisory, Community Banking Centres and Kiosks. Kiosks have been restated in comparatives. 2 Refer page 129 for metric definitions and details of provider. Data for 2H21 at August 2021, 1H21 at February 2021. 2H20 1H21 2H21 Change on 1H21 Revenue ($m) 4,560 4,457 4,436 - Net interest margin (%) 2.41 2.39 2.29 (10bps) Expense to income (%) 47.0 50.9 53.0 209bps Customer deposit to loan ratio (%) 56.3 56.5 57.8 130bps Stressed exposures to TCE (%) 1.38 1.02 0.95 (7bps) Mortgage 90+ day delinquencies (%) 1.60 1.18 1.06 (12bps) Consumer 2H21 performance. 97 Consumer Down $155m or 9% Down $103m or 6% 2H20 1H21 2H21 Change on 1H21 Total customers (#m) 9.7 9.7 9.8 1% Active digital banking customers (#m) 4.53 4.58 4.67 2% Branches (#) 1 931 891 851 (40) ATMs (#) 1,399 1,352 1,270 (82) Main Financial Institution 2 (%) 15.7 15.6 15.7 0.1ppt Westpac Group 2021 Full Year Results Presentation & Investor Discussion Pack Key financial metrics Key operating metrics NIM 10bps lower from asset spread compression, partly offset by lower funding costs and higher deposit spreads Higher spend on risk and compliance programs including financial crime and our CORE program Impairment benefit from improved credit quality metrics and lower unsecured lending. The impairment benefit was lower than 1H21 |
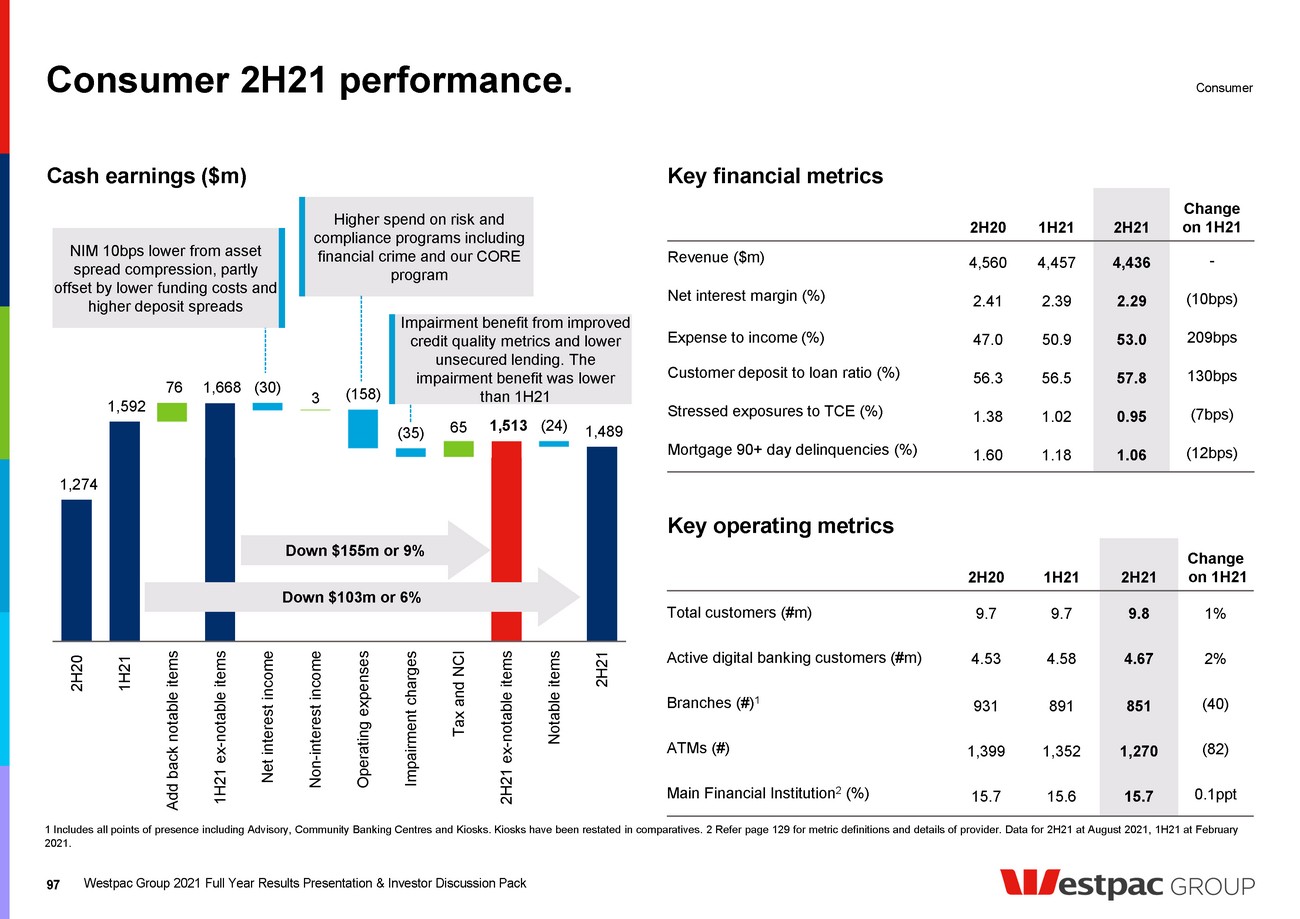
| 55 256 920 895 4 226 30 814 869 (25) (130) (211) 2H20 1H21 Add back notable items 1H21 ex-notable items Net interest income Non-interest income Operating expenses Impairment charges Tax and NCI 2H21 ex-notable items Notable items 2H21 Business 2H21 performance. 98 Cash earnings ($m) Business Down $81m or 9% Down $51m or 6% Key financial metrics 2H20 1H21 2H21 Change on 1H21 Revenue ($m) 2,268 2,356 2,258 (4%) Net interest margin (%) 2.93 3.17 3.07 (10bps) Expense to income (%) 54.2 49.7 60.2 Large Customer deposit to loan ratio (%) 108.0 114.6 118.4 382bps Stressed exposures to TCE (%) 4.70 4.60 3.92 (68bps) Key operating metrics 2H20 1H21 2H21 Change on 1H21 Total customers 1 (‘000’s) 1,053 1,063 1,048 (1%) Customer satisfaction 2 (rank) =#1 =#1 =#2 Down 1 Customer satisfaction – SME 2 (rank) #1 =#2 =#2 - Digital sales 3 (%) 28 27 28 1ppt 1 Excludes Private Wealth customers. 2 DBM external ratings data 2H21 at August 2021, 1H21 at February 2021 for WBC brand. SME refers to Total SME. 3 Share of sales made digitally for eligible products. Westpac Group 2021 Full Year Results Presentation & Investor Discussion Pack NIM 10bps lower (ex notable items 14bps) from asset spread compression, partly offset by higher deposit spreads Higher spend on risk and compliance programs including financial crime, our CORE program and risk Benefit from lower stressed assets and reduction in overlay provision |
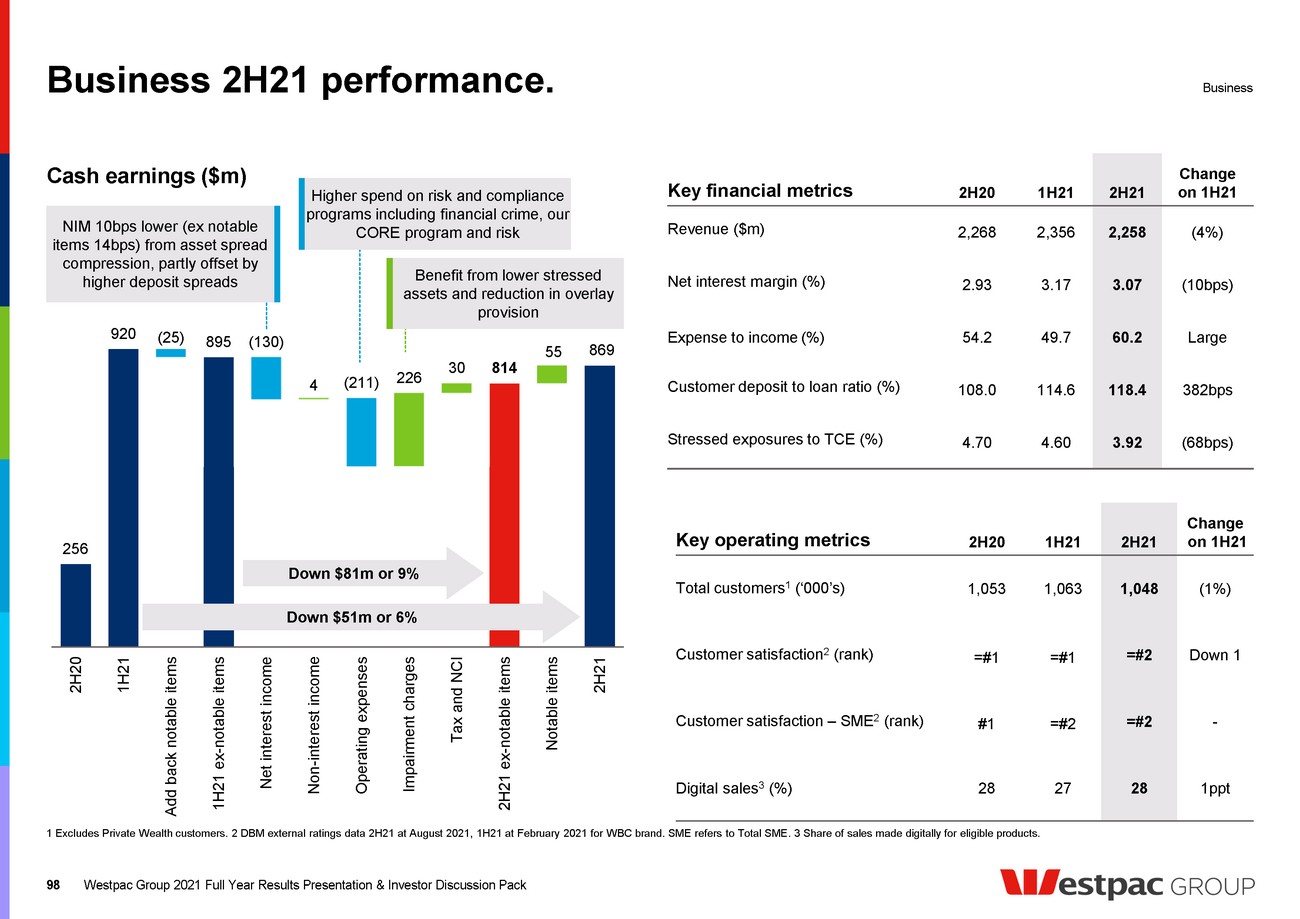
| 256 26 (965) 185 230 (9) (62) (59) (146) 65 85 2H20 1H21 Add back notable items 1H21 ex-notable items Net interest income Non-interest income Operating expenses Impairment charges Tax and NCI 2H21 ex-notable items Notable items 2H21 256 (900) Margins down 3bps, AIEA down 1% Key financial metrics 2H20 1H21 2H21 Change on 1H21 Revenue ($m) 1,132 1,046 975 (7%) Net interest margin (%) 1.23 1.27 1.24 (3bps) Expense to income ratio 1(%) 61.6 63.2 73.8 Large Net loans 66.2 62.4 67.0 7% Customer deposits 102.9 91.0 97.8 7% Customer deposit to loan ratio (%) 155.4 145.8 146.0 14bps Stressed exposures to TCE (%) 1.03 0.56 0.64 8bps Key operating metrics 2H20 1H21 2H21 Change on 1H21 Customer revenue 2 / total revenue (%) 88.3 91.5 98.9 Large Trading revenue / total revenue (%) 13.1 7.2 2.6 Large Revenue per FTE ($’000) 717 668 641 (4%) WIB 2H21 performance. 99 Cash earnings ($m) 1 Excluding notable items. 2 WIB customer revenue is lending revenue, deposit revenue, sales and fee income. Excludes trading and derivative valuation adjustments. Westpac Institutional Bank Down $191m or 75% Westpac Group 2021 Full Year Results Presentation & Investor Discussion Pack Down $1,130m Lower non-customer markets income One large IAP partly offset by lower CAPs Write-down of goodwill, capitalised software and other assets following annual impairment test Higher risk, compliance and legal costs |
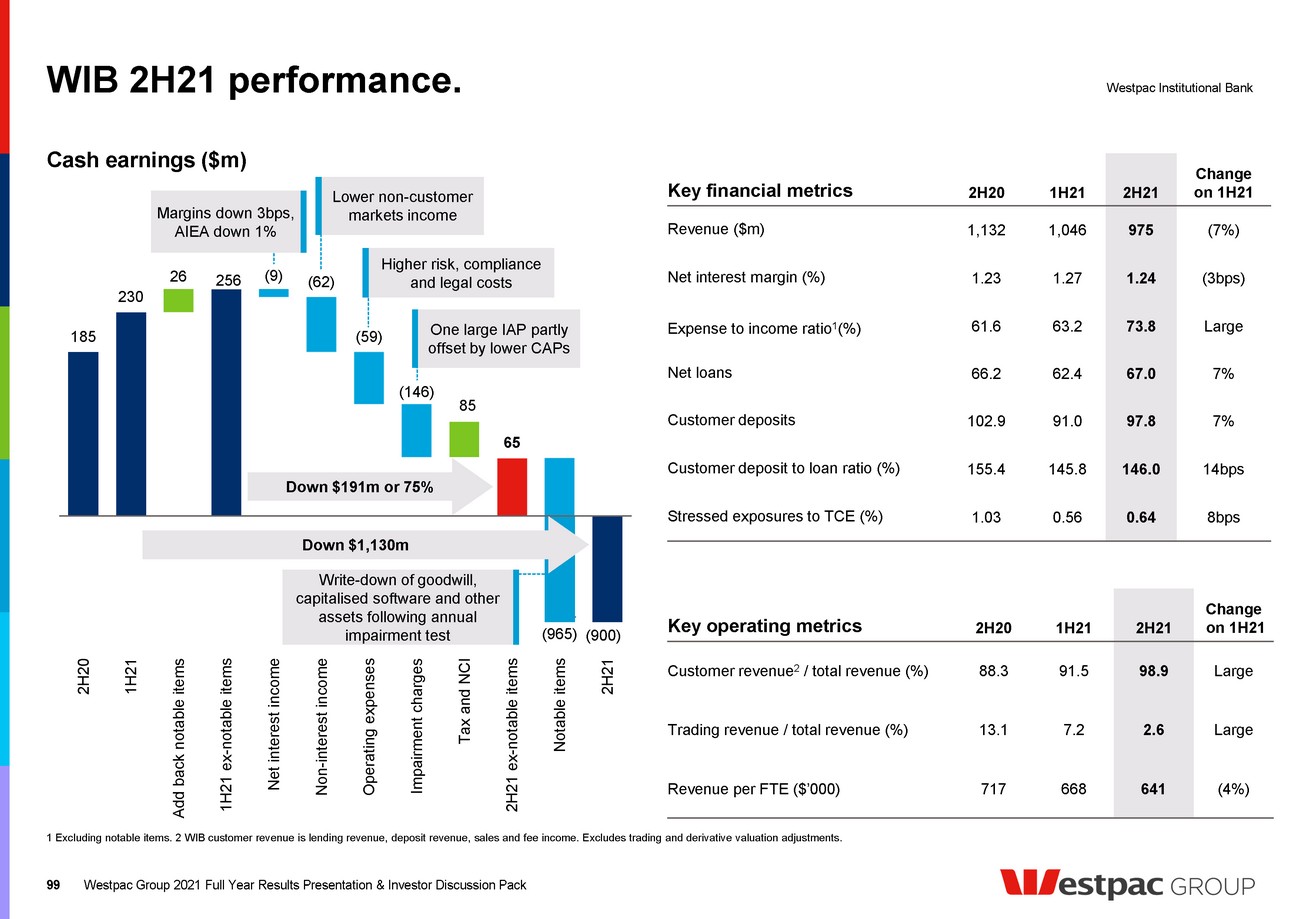
| 16 40 (12) (114) 354 583 10 593 474 430 (49) (44) 2H20 1H21 Add back notable items 1H21 ex-notable items Net interest income Non-interest income Operating expenses Impairment charges Tax and NCI 2H21 ex-notables Notable items 2H21 Key financial metrics 2H20 1H21 2H21 Change on 1H21 Revenue (NZ$m) 1,120 1,245 1,218 (2%) Net interest margin (%) 1.89 2.06 1.94 (12bps) Expense to income (%) 46.3 43.1 48.9 Large Customer deposit to loan ratio (%) 80.7 81.8 82.0 18bps Stressed exposures to TCE (%) 1.59 1.56 1.19 (37bps) New Zealand 2H21 performance 1. 100 Cash earnings (NZ$m) 1 In NZ$ unless otherwise noted. 2 Refer to page 129 for details of metric definition and provider. New Zealand Key operating metrics Sep-20 Mar-21 Sep-21 Change Mar-21 Customers (#m) 1.34 1.33 1.33 - Branches (#) 143 134 116 (18) ATMs (#) 495 482 464 (18) Consumer NPS 2 +14 +16 +14 Down 2 Business NPS 2 +7 (1) (14) Down 13 Agri NPS 2 +34 +8 +13 +5 Funds (NZ$bn) (spot) 12.2 11.9 12.0 1% Down $119m or 20% Down $153m or 26% Westpac Group 2021 Full Year Results Presentation & Investor Discussion Pack 4% increase in AIEA, offset by 7bps decline in NIM from lower lending spreads partly offset by deposit repricing and mix 1H21 included a gain on the sale of Wealth Advisory business. Cards and insurance income lower Primarily higher spend on technology and risk and compliance programs Lower CAP benefit in 2H21 compared to 1H21 and a large IAP raised in 2H21 |
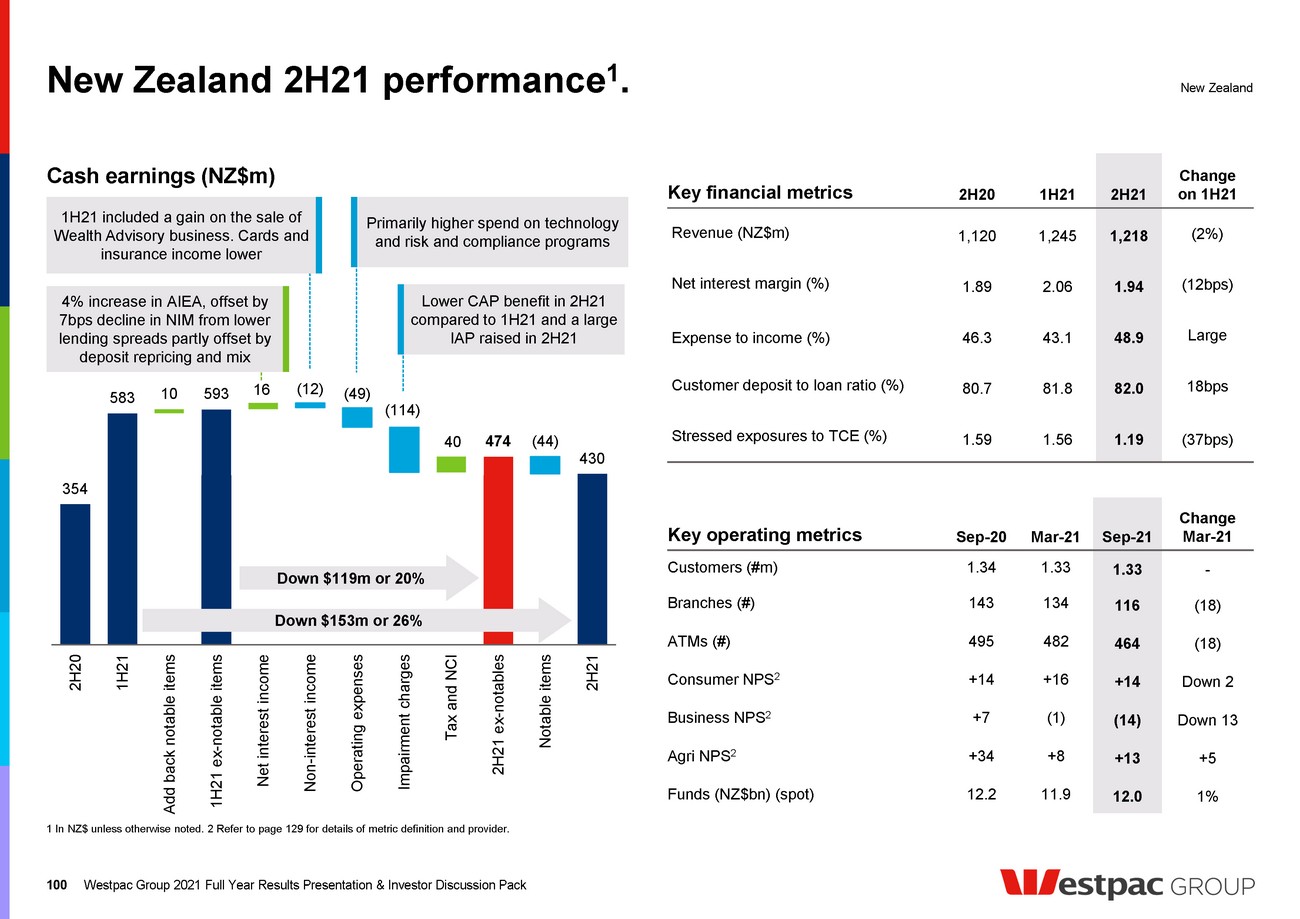
| 71.0 74.1 0.7 1.1 75.9 Sep-20 Mar-21 Consumer Business Sep-21 88.0 90.6 2.3 92.6 (0.3) Sep-20 Mar-21 Consumer Business Sep-21 New Zealand balance sheet. 101 Net loans (NZ$bn) Deposits (NZ$bn) Loans (NZ$bn) and % of total Customer deposits (NZ$bn) and % of total 53 55 58 61 2 1 1 1 32 32 32 31 87 88 91 93 Mar-20 Sep-20 Mar-21 Sep-21 Business Personal Mortgage 65% 1% 34% Up 2% Up 2% Up 2% Up 3% Up 1% New Zealand 33 31 29 28 16 18 21 22 20 22 24 26 69 71 74 76 Mar-20 Sep-20 Mar-21 Sep-21 Transaction Savings Term deposits 37% 29% 34% Up 2% Up 4% Up 3% Westpac Group 2021 Full Year Results Presentation & Investor Discussion Pack |
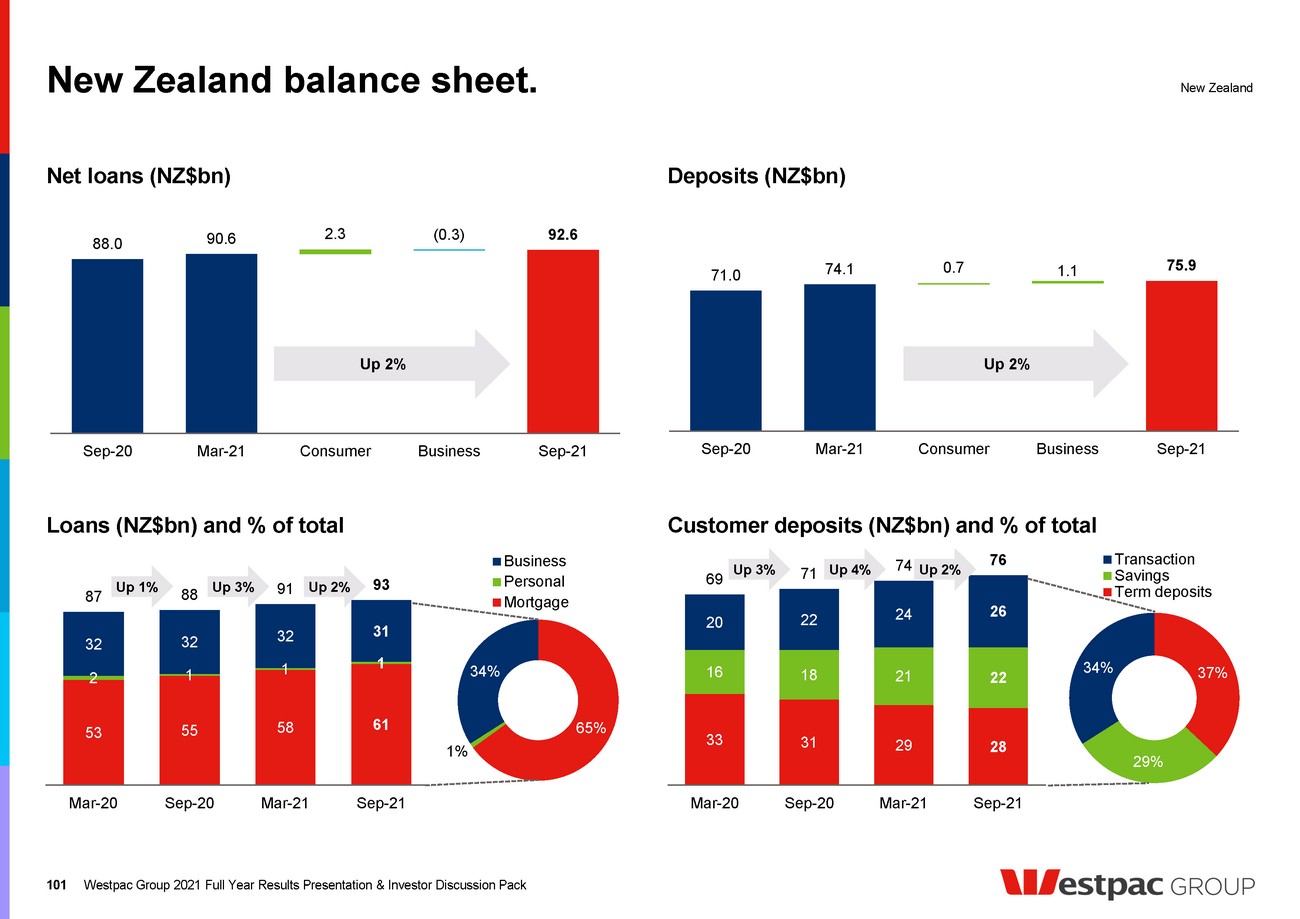
| New Zealand business exposures. 102 Business stressed exposures as a % of business TCE Agribusiness 1 portfolio Milk price (NZ$) Dairy portfolio summary • Portfolio health remains sound with risk profiles improving from higher milk prices. Focus on supporting existing dairy customers with proven long term viability while selectively targeting new customers • Global dairy prices have been healthy so far over 2021, underpinned by firm global demand and tight global dairy supply. Fonterra’s 2021/22 milk price forecast range is $7.25/kg to $8.75/kg, while Westpac has lifted its forecast to $8.50/kg • Uncertainty around environmental regulation and compliance, cyclically rising on-farm costs and labour shortages are risks to the dairy industry outlook 1 Includes forestry and fishing. 2 Includes impaired exposures. Sep-20 Mar-21 Sep-21 TCE (NZ$bn) 10.5 10.6 10.6 Agriculture as a % of total TCE 8.2 8.0 7.7 % of portfolio graded as ‘stressed’ 2 7.8 7.6 5.7 % of portfolio in impaired 0.47 0.28 0.13 1.5 0.9 0.8 0.5 0.3 0.3 0.1 0.3 0.2 0.2 0.2 0.1 0.2 0.0 0.1 0.0 0.1 0.1 0.2 0.2 3.2 2.3 2.4 5.0 4.0 3.0 2.9 2.2 2.4 1.6 4.9 3.3 3.4 5.5 4.4 3.3 3.1 2.6 2.8 2.0 Sep-13 Sep-14 Sep-15 Sep-16 Sep-17 Sep-18 Sep-19 Sep-20 Mar-21 Sep-21 Watchlist & substandard 90+ day past due and not impaired Impaired 6.69 6.35 7.14 7.54 8.5 $0 $2 $4 $6 $8 $10 2017/18 2018/19 2019/20 2020/21 2021/22 Kg Ms Westpac Economics forecast Westpac Group 2021 Full Year Results Presentation & Investor Discussion Pack Business TCE by industry sector % 17 14 10 8 5 5 6 3 2 7 1 22 Agriculture, Forestry and Fishing Rental, Hiring and Real Estate Services Finance and Insurance Public Administration and Safety Manufacturing Electricity, Gas, Water and Waste Services Wholesale Trade Transport, Postal and Warehousing Construction Administrative and Support Services Accommodation and Food Services Other/Not classified New Zealand |
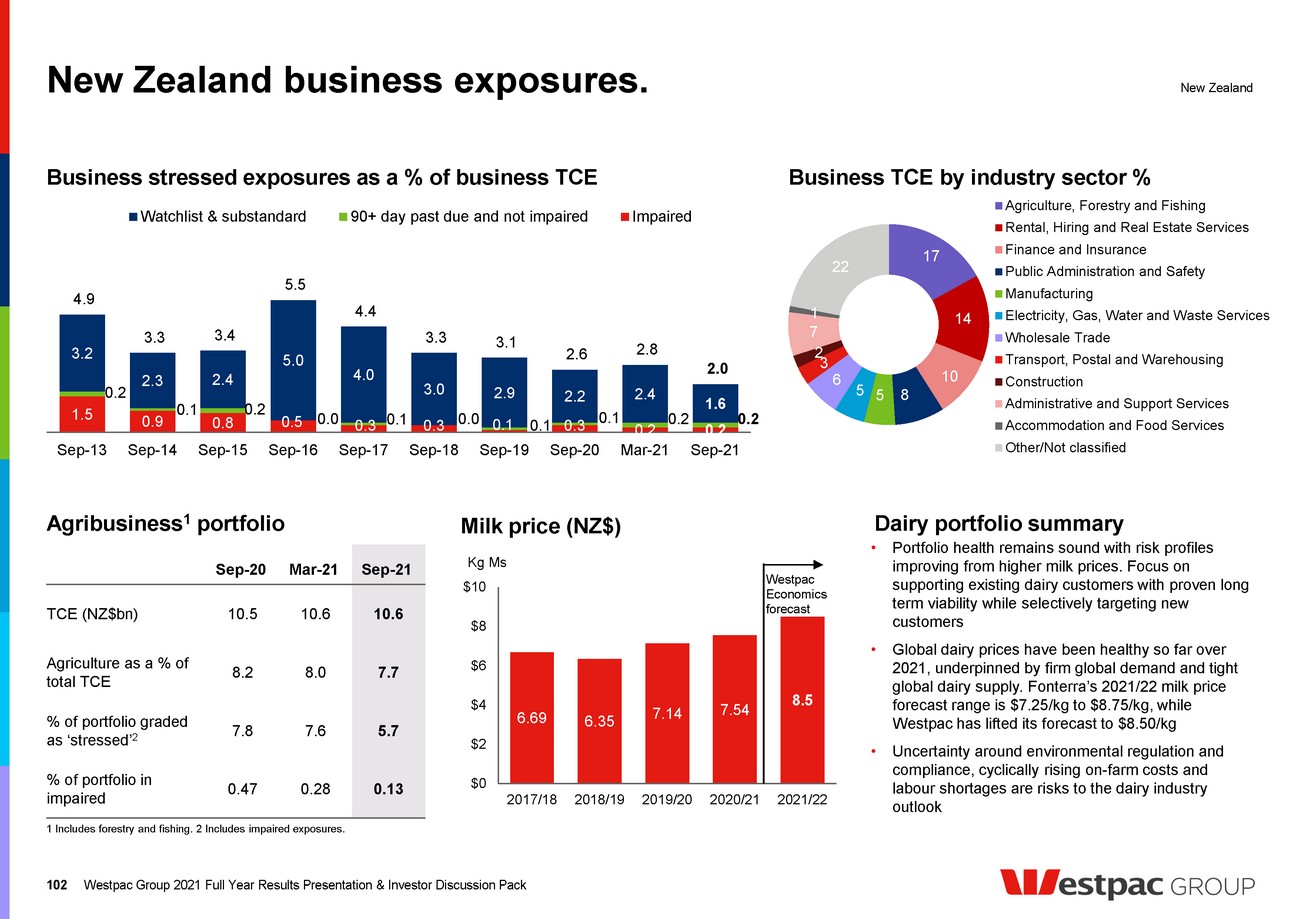
| 0.89 1.65 0.0 1.0 2.0 3.0 Sep-13 Mar-14 Sep-14 Mar-15 Sep-15 Mar-16 Sep-16 Mar-17 Sep-17 Mar-18 Sep-18 Mar-19 Sep-19 Mar-20 Sep-20 Mar-21 Sep-21 90+ day past due (ex-hardship) 90+ day past due 0.16 0.30 0.0 0.1 0.2 0.3 0.4 0.5 0.6 Sep-13 Mar-14 Sep-14 Mar-15 Sep-15 Mar-16 Sep-16 Mar-17 Sep-17 Mar-18 Sep-18 Mar-19 Sep-19 Mar-20 Sep-20 Mar-21 Sep-21 90+ day past due (ex-hardship) 90+ day past due New Zealand consumer portfolio. 103 Mortgage 90+ day delinquencies 1 (%) Unsecured consumer 90+ day delinquencies 1 (%) Mortgage portfolio LVR 2 (%) of portfolio Mortgage loss rates each half (%) 1 In May 2019 we made changes to the reporting of customers in hardship to align to the method used by APRA. 2 LVR based on current loan property value at latest credit event. New Zealand Introduction of changes to the reporting of hardship 0.00 0.00 0.05 0.10 0.15 0.20 0.25 1H12 2H12 1H13 2H13 1H14 2H14 1H15 2H15 1H16 2H16 1H17 2H17 1H18 2H18 1H19 2H19 1H20 2H20 1H21 2H21 Introduction of changes to the reporting of hardship 50% 22% 21% 5% 2% 0<=60 60<=70 70<=80 80<=90 90+ 93% of mortgage portfolio less than 80% LVR Westpac Group 2021 Full Year Results Presentation & Investor Discussion Pack |
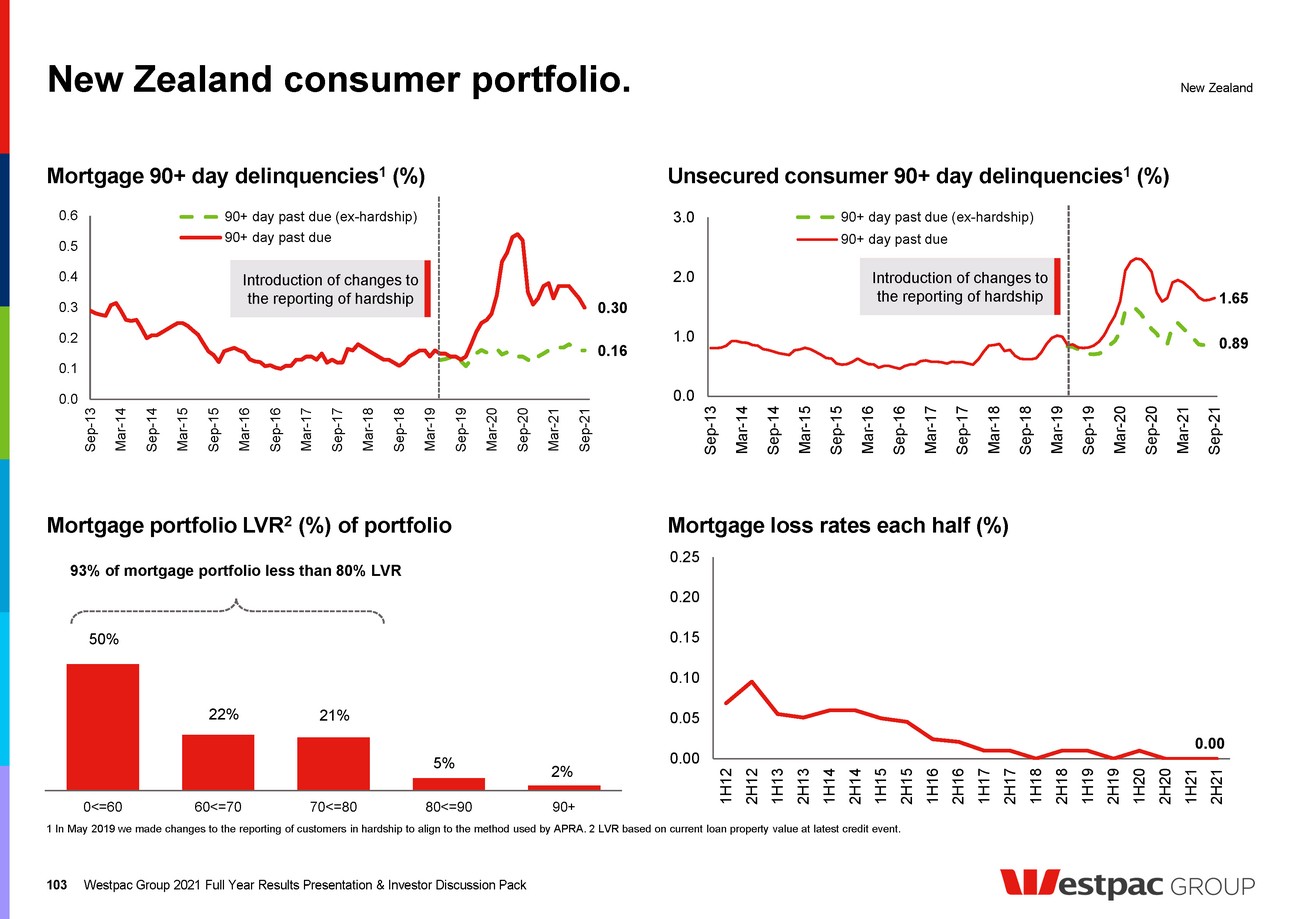
| (75) (94) (599) 134 297 431 15 (29) 302 59 54 (243) 2H20 1H21 Add back notable items 1H21 ex-notable items Net interest income Non-interest income Operating expenses Impairment charges Tax and NCI 2H21 ex-notable items Notable items 2H21 Specialist Businesses 2H21 performance. 104 Cash earnings ($m) Specialist Businesses Down $129m or 30% Down $75m or 56% Westpac Group 2021 Full Year Results Presentation & Investor Discussion Pack Lower funding costs and the write-back of provisions Lower life insurance income (valuation of policyholder liabilities), lower funds income (margin compression) and partly offset by lower claims in GI and LMI Higher expenses to meet regulatory requirements Higher IAP and a lower CAP benefit in 2H21 Key financial metrics 2H20 1H21 2H21 Change on 1H21 Average funds ($bn) 191.1 205.6 223.8 9% Spot funds ($bn) 193.0 211.7 227.4 7% Platforms deposits ($bn) 4.9 4.3 6.1 42% Platform FUA market share (exc. Corp Super) 2 (%) 19.1 18.9 18.8 (10bps) Margin lending loans ($bn) 1.4 1.5 1.5 - Auto finance loans ($bn) 3 11.5 11.1 10.6 (5%) Westpac Pacific loans 1.6 1.4 1.4 0% Held for sale businesses Key financial metrics 2H20 1H21 2H21 Change on 1H21 Auto finance loans – under sale agreement ($bn) 1.1 1.0 1.0 - Retail Life Insurance in-force premiums ($m) 942 938 951 1% Life Insurance claims ratio 4 (%) 48 63 64 1% 1 Notable items include transaction-related impacts for businesses sold or held for sale, customer remediation and settlements and other matters. 2 Plan for Life, June 2021. 3 Average term of Auto finance loans is 3 years (as at September 2021). 4 Loss ratio is claims net of reinsurance over the total earned premium plus exchange commission. 1 1 |
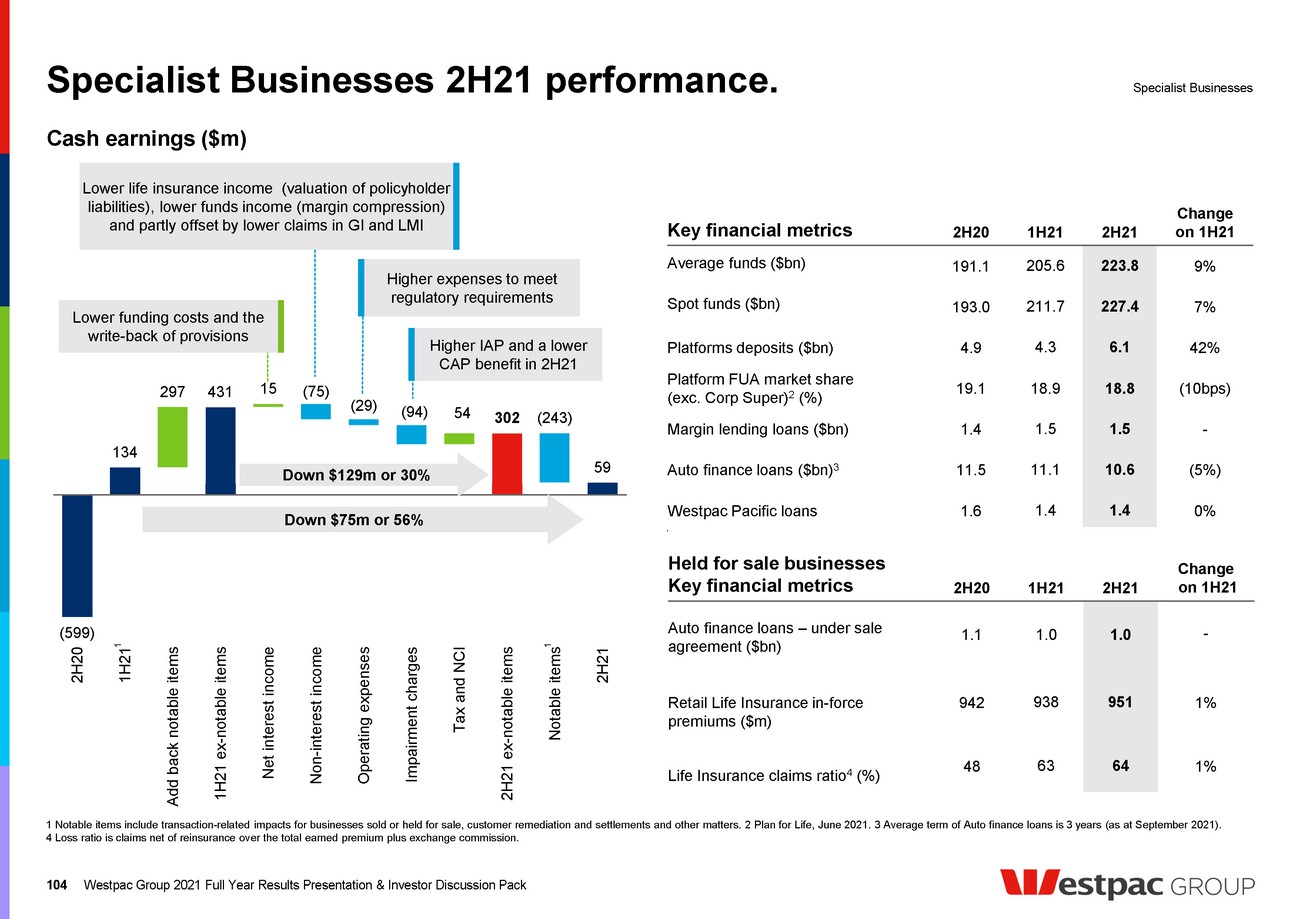
| 12,402 23,387 31,240 49,593 104,779 Sep-18 Sep-19 Sep-20 Mar-21 Sep-21 BT Wrap migration Panorama Platform Improved Panorama functions • Updated mobile app providing advisors and investors improved security and navigation • Chatbot “Blue” assisted 14,000 advisors and investors in September 2021 quarter. Since its launch in February 2021 Blue has conducted over 150,000 conversations Migration from Wrap to BT Panorama Completed the migration of customers from Wrap to BT Panorama in June 2021 • Over 230,000 customers (~$105bn in FUA) on the Panorama platform, with access to mobile app functionality • Over 6,000 advisers can provide clients flexible investment options, in-depth reporting, a customised online experience and a broad range of managed account solutions An outage affected BT Panorama users in early August 2021 • The registry system was not impacted, and it was not an information security issue • The cause of the interruption has been rectified and enhanced monitoring is in place 23,462 44,314 67,109 115,369 234,948 Sep-18 Sep-19 Sep-20 Mar-21 Sep-21 BT Wrap migration BT Panorama. 105 Supporting advisers and investors. Active advisers on BT Panorama 2 (#) SMSF funds on BT Panorama 2 (#) FUA on BT Panorama 1 ($m) Investors on BT Panorama 1 (#) 1,775 2,494 3,017 3,524 6,034 Sep-18 Sep-19 Sep-20 Mar-21 Sep-21 6,215 9,289 12,310 14,118 25,320 Sep-18 Sep-19 Sep-20 Mar-21 Sep-21 Up 250% Up 106% Up 235% Up 100% 1 Migration from BT Wrap to Panorama was completed in June 2021. 2 Advisers and SMSF funds that have been migrated from BT Wrap are not shown separately. Westpac Group 2021 Full Year Results Presentation & Investor Discussion Pack Specialist Businesses |
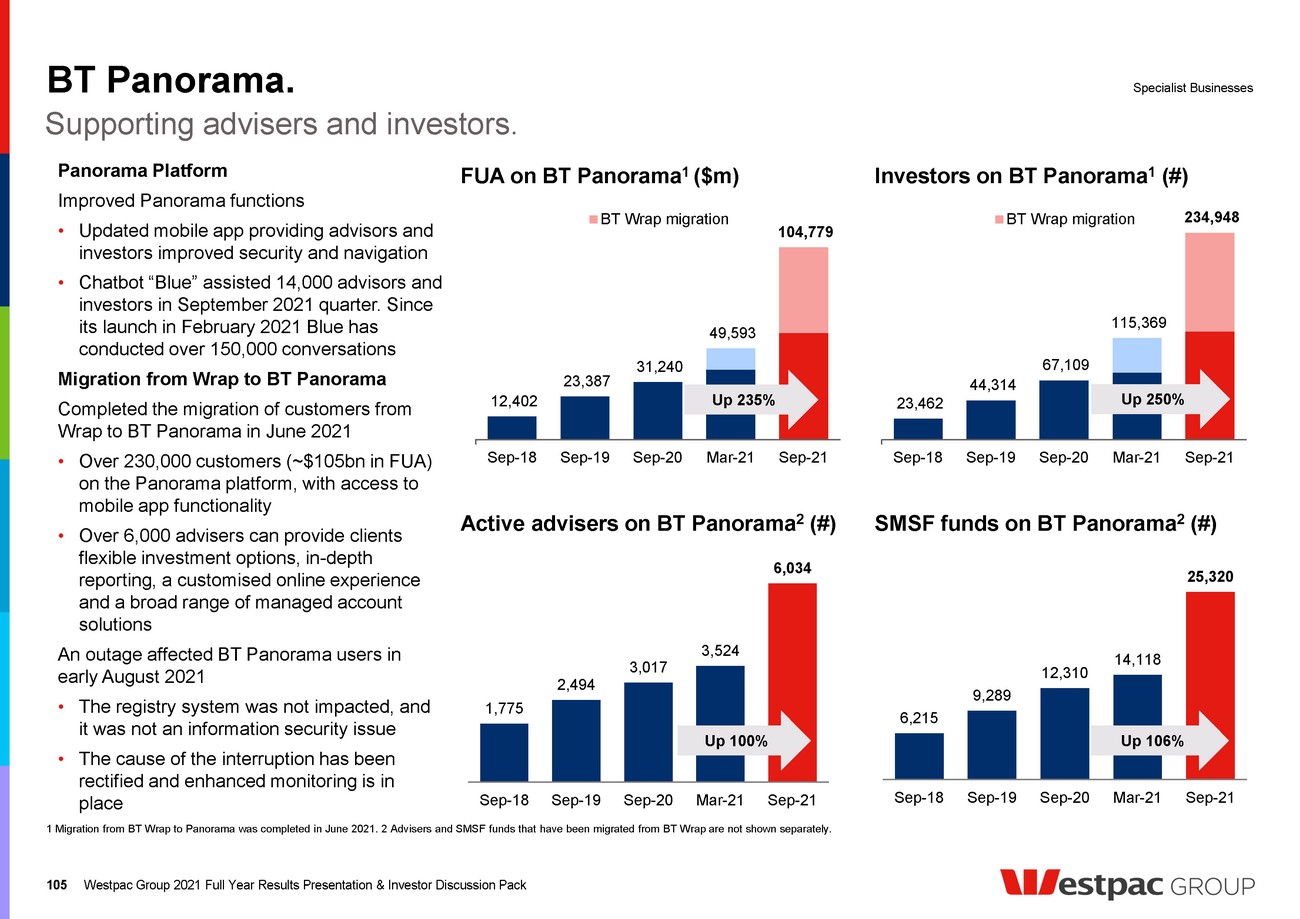
| Economics ,11estpac GROUP |
| Australian and New Zealand economic forecasts. Source: Westpac Economics. 1 Year average growth rates. 2 Through the year growth rates. 107 Economics Westpac Group 2021 Full Year Results Presentation & Investor Discussion Pack Key economic indicators (%) at October 2021 2019 2020 2021F 2022F World GDP 1 2.8 -3.3 5.4 4.6 Australia GDP 2 2.1 -0.9 0.0 7.4 Unemployment – end period 5.2 6.8 5.1 3.8 CPI headline – year end 1.8 0.9 2.8 2.4 Interest rates – cash rate 0.75 0.10 0.10 0.10 New Zealand GDP 2 1.8 0.1 2.8 4.9 Unemployment – end period 4.0 4.8 4.2 3.5 Consumer prices 1.9 1.4 5.1 2.9 Interest rates – official cash rate 1.00 0.25 0.75 1.50 Key economic indicators (%) at October 2021 2019 2020 2021F 2022F Australia Credit growth Total – year end 2.4 1.8 5.6 6.8 Housing – year end 3.0 3.5 7.2 8.5 Business – year end 2.5 0.9 4.0 4.5 New Zealand Credit growth Total – year end 5.7 3.4 6.6 5.1 Housing – year end 7.0 8.3 10.0 5.7 Business – year end 4.5 -2.6 1.8 4.0 Private sector credit growth (% ann) Sources: RBA, Westpac Economics GDP growth (year average) -6.0 -4.0 -2.0 0.0 2.0 4.0 6.0 8.0 10.0 12.0 Australia New Zealand United States China 2018 2019 2020 2021f 2022f -10 -5 0 5 10 15 20 25 Aug-07 Aug-09 Aug-11 Aug-13 Aug-15 Aug-17 Aug-19 Aug-21 Housing Australia Total credit Australia Business Australia Total credit New Zealand Westpac f’casts % ann |
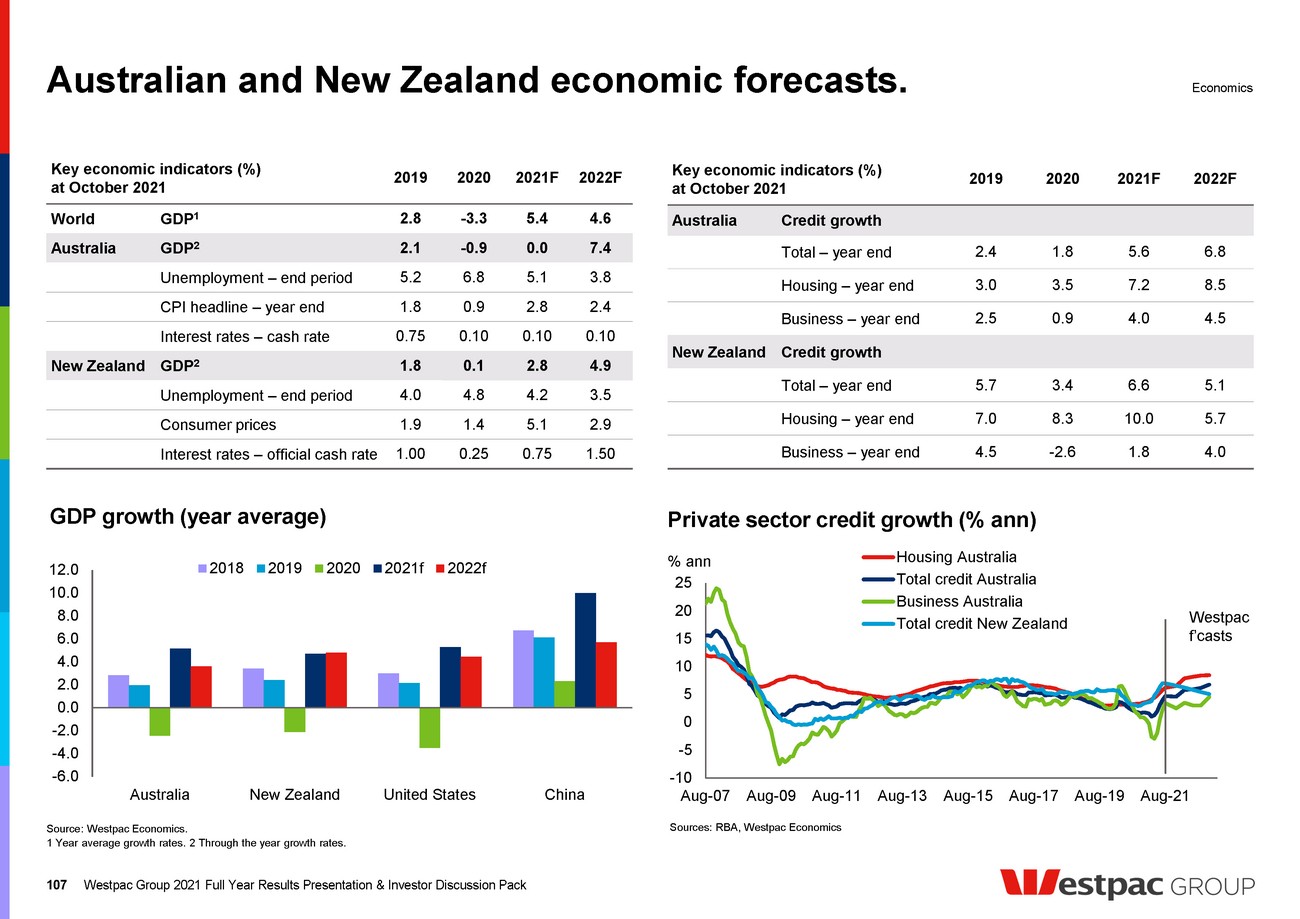
| The Australian economy. Westpac Group 2021 Full Year Results Presentation & Investor Discussion Pack 108 Australia’s GDP profile (index) Sources: ABS, Westpac Economics. 88 92 96 100 104 108 112 88 92 96 100 104 108 112 Jun-16 Jun-17 Jun-18 Jun-19 Jun-20 Jun-21 Jun-22 Jun-23 Index Index pre COVID-19 forecast current forecast Dec 2019 = 100 Westpac f’casts to end 2022 Re-opening underway on high vaccination rates; activity to bounce back in 2022. Australian vaccinations (%) Source: Macrobond, Westpac Economics. Vaccine hesitancy in Australia (%) Sources: Melbourne Institute, Westpac Economics. 7 0 10 20 30 40 Oct-20 Mar-21 Apr-21 Jun-21 Jul-21 Sep-21 % don't know no Willingness to get vaccinated, % adults Output impacts by state (index) Sources: ABS, Westpac Economics. 91 93 95 97 99 101 103 105 107 Jun-21 Sep-21 Dec-21 Mar-22 Jun-22 Sep-22 Dec-22 Mar-23 Index NSW Vic rest of Australia Jun 2021 = 100 +5.4% +3.8% +4.4% end 2022 vs Jun 2021 Westpac f’casts to end 2022 20 30 40 50 60 70 80 Aug-21 Sep-21 Oct-21 Nov-21 Dec-21 Jan-22 Feb-22 % Aus NSW Vic Qld WA % total population potentially fully vaccinated (i.e. total doses divided by two) Simple linear projections. Dashed segment shows projected rise to current first dose share of pop’n 70% of adults 80% of adults 90% of adults Economics |
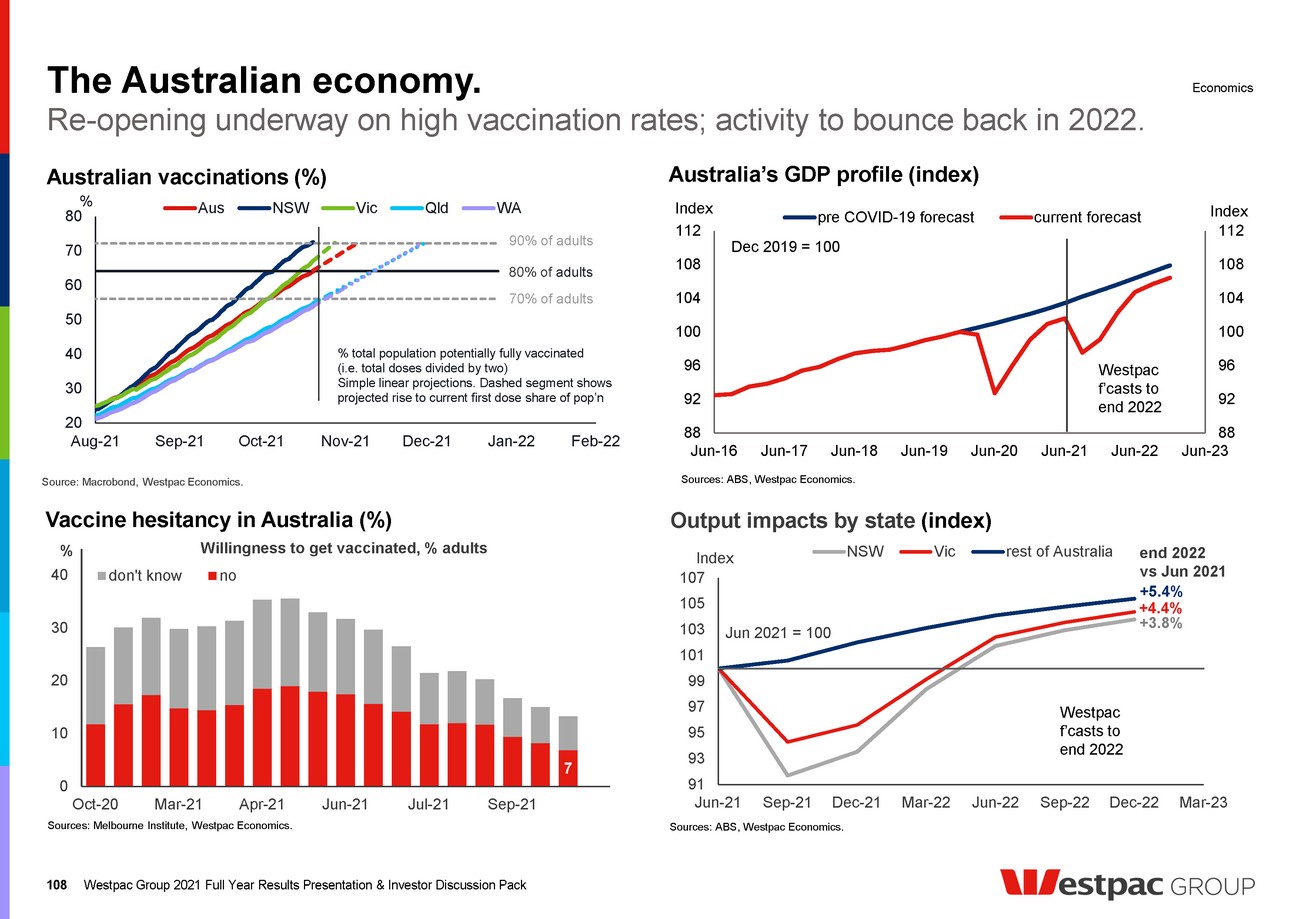
| The Australian economy. Economics Consumer well placed to rebound. 109 Westpac Group 2021 Full Year Results Presentation & Investor Discussion Pack Sources: ABS, Westpac Economics. Consumer spending: big rotation back to services in 2022 Sources: ABS, Westpac Economics. Household saving (% of income) Consumer sentiment (index, monthly) Sources: Westpac MI, NAB, Westpac Economics 70 80 90 100 110 120 130 Oct-07 Oct-09 Oct-11 Oct-13 Oct-15 Oct-17 Oct-19 Oct-21 net bal. Consumer mood remarkably resilient, even at epicentre of ‘delta’ shock … • Sydney: 108 • Melbourne: 110 -4 0 4 8 12 16 20 24 28 -4 0 4 8 12 16 20 24 28 Jun-89 Jun-94 Jun-99 Jun-04 Jun-09 Jun-14 Jun-19 % of income % of income Westpac estimate 2021Q3 Sources: ABS, Westpac Economics. 40 50 60 70 80 90 100 110 120 Jun-06 Jun-09 Jun-12 Jun-15 Jun-18 Jun-21 index essential services durables discretionary services basic food *index based to Dec 2019 qtr = 100 latest vs pre-COVID: –18 % -2 0 2 4 6 8 -2 0 2 4 6 8 Consumer Housing Business Investment Public Net exports GDP ppts ann ppts ann 2019 2020 2021f 2022f contributions to GDP growth, year end 0.0 7.4 -0.9 2.1 15% 4% 3% Australia’s growth mix |
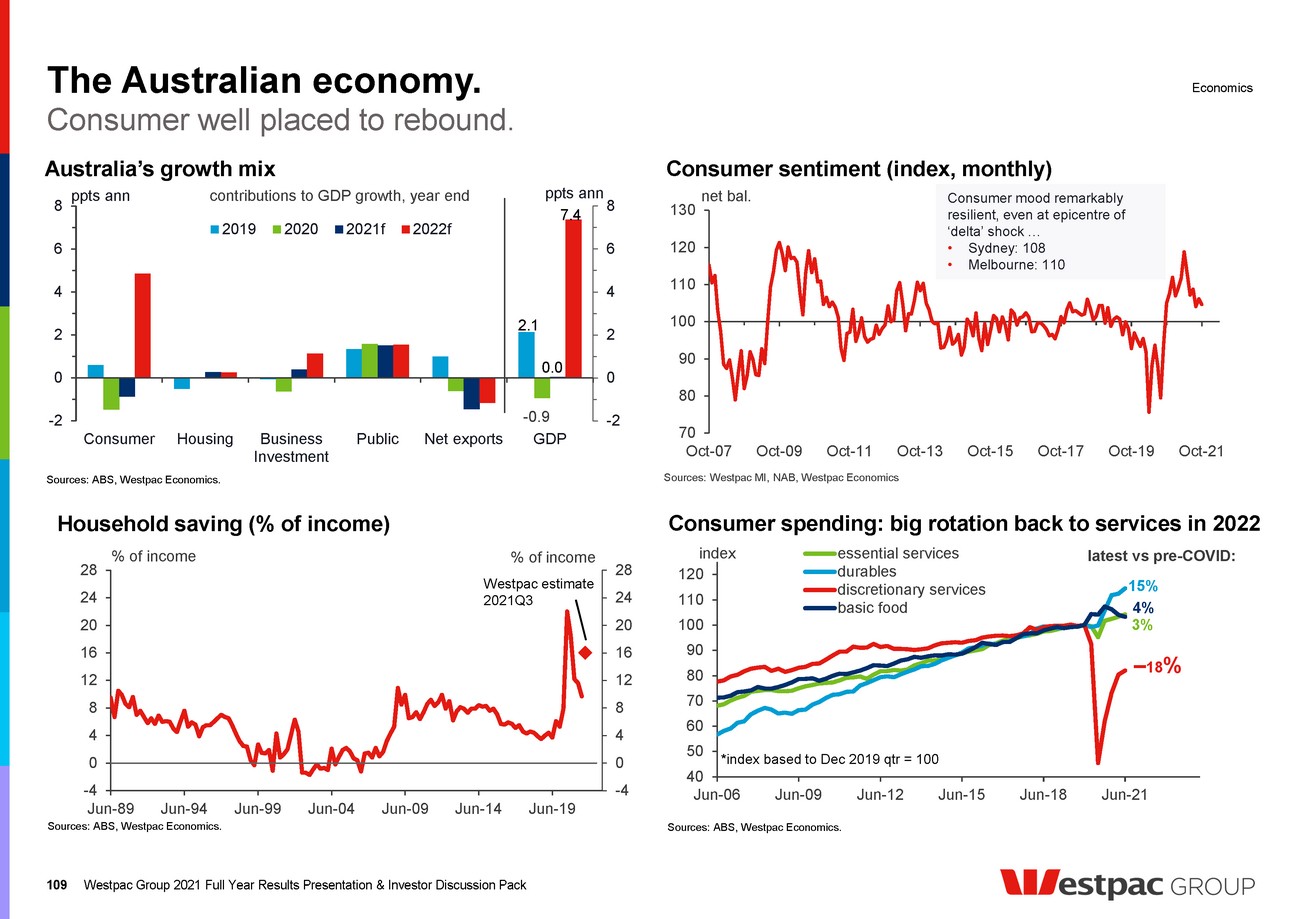
| The Australian economy. Sources: ABS, Westpac Economics. 110 Rebound likely to see tightening in labour markets in 2022. Economics Westpac Group 2021 Full Year Results Presentation & Investor Discussion Pack Wages (%) Unemployment rate (%) Sources: ABS, Westpac Economics. Aust. population growth: medium term prospects (% ann) Sources: ABS, Treasury, Westpac Economics. Sources: NAB survey, ABS, Westpac Economics. Business confidence and employment intentions (qtly) -0.5 0.0 0.5 1.0 1.5 2.0 2.5 Mar-81 Mar-91 Mar-01 Mar-11 Mar-21 ann% population contribution from net migration Gov’t forecasts 1.0 1.5 2.0 2.5 3.0 3.5 4.0 4.5 5.0 Jun-97 Jun-01 Jun-05 Jun-09 Jun-13 Jun-17 Jun-21 ann% RBA’s target: >3% Westpac f’casts to Dec-22 -30 -20 -10 0 10 20 30 40 -30 -20 -10 0 10 20 30 40 Sep-91 Sep-97 Sep-03 Sep-09 Sep-15 Sep-21 net bal. net bal. Business employment, next 12mths Business confidence Sep month 3 4 5 6 7 8 9 Sep-07 Sep-09 Sep-11 Sep-13 Sep-15 Sep-17 Sep-19 Sep-21 % Latest, Sep 2021 Unemployment rate: 4.6% Peaked: July 2020 at 7.5% Westpac f’casts to Dec-22 |
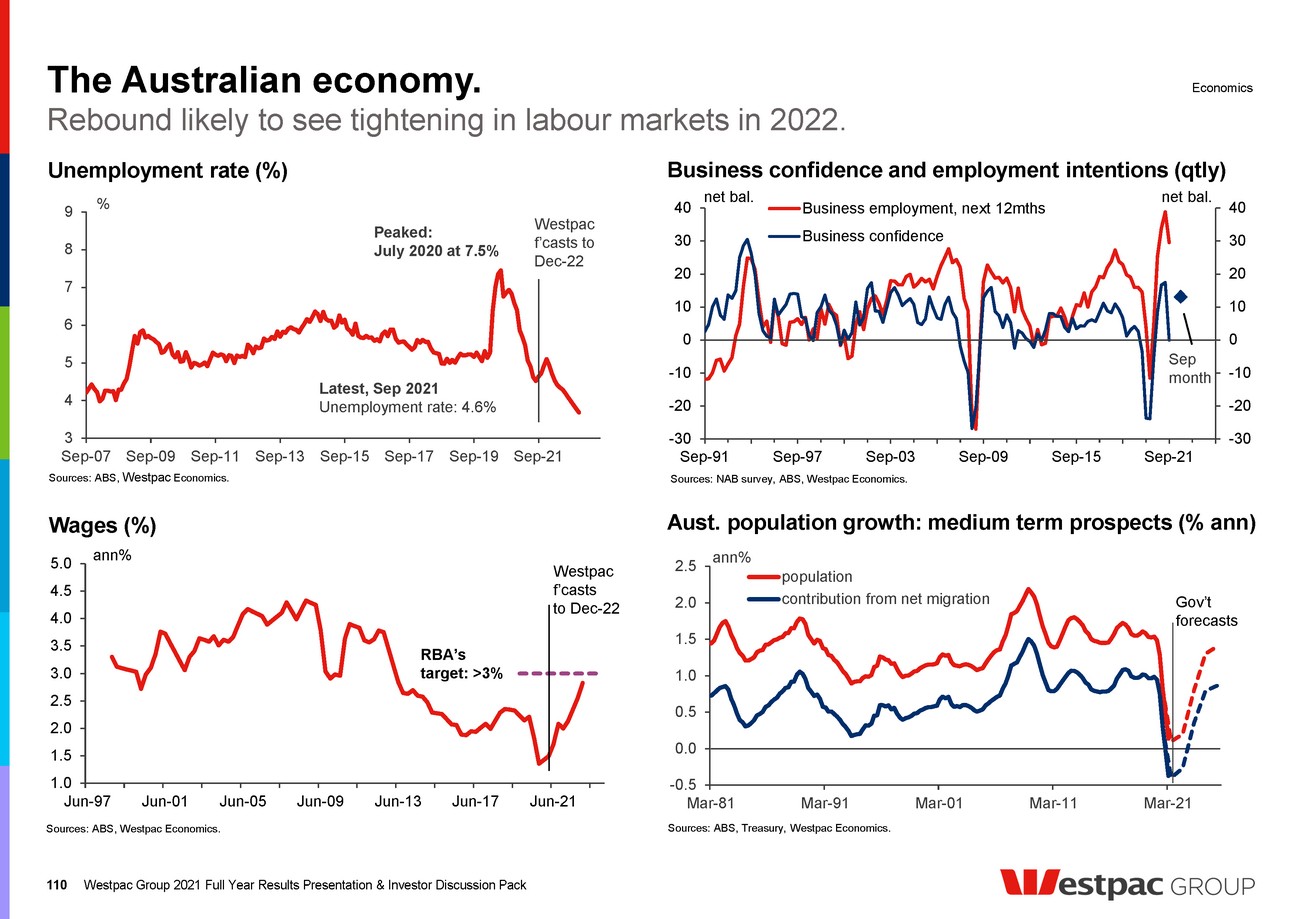
| The Australian economy. Economics Iron ore finding new equilibrium; demand pushing coal higher in the short term. 111 Westpac Group 2021 Full Year Results Presentation & Investor Discussion Pack Australian exports to China 1 ($bn) Sources: IMF, Westpac Economics World growth post COVID-19 (% yr) Sources: Westpac Economics, Bloomberg, ABS 20 70 120 170 220 270 320 20 70 120 170 220 270 320 Oct-13 Oct-15 Oct-17 Oct-19 Oct-21 2012=100 2012=100 Iron ore Met coal Thermal coal Brent Westpac f’casts to Dec-22 Australian commodity prices (index) Source: DFAT, ABS, Westpac Economics Australian export destinations 1 ($bn) Sources: ABS, Westpac Economics Australian export composition 1 ($bn) Sources: ABS, Westpac Economics 1 All figures show $bn exports in 2020, note that figures may not sum due to rounding and other small differences in source data. Iron ore, 117 Coal, 43 LNG, 36 Other resources, 75 Services, 71 Rural, 43 Mfg/Other, 50 Total, $435bn China, 145 Japan, 44 Korea, 23 Asia, rest of, 65 US, 19 Europe, 12 NZ, 10 Other, 45 Goods exports $363bn Iron ore, 93 Coal, 16 LNG, 10 Other resources, 9 Services, 16 Rural, 13 Mfg/Other, 3 -5 -4 -3 -2 -1 0 1 2 3 4 5 6 7 1995 1998 2001 2004 2007 2010 2013 2016 2019 2022 other developing China %yr Westpac forecast |
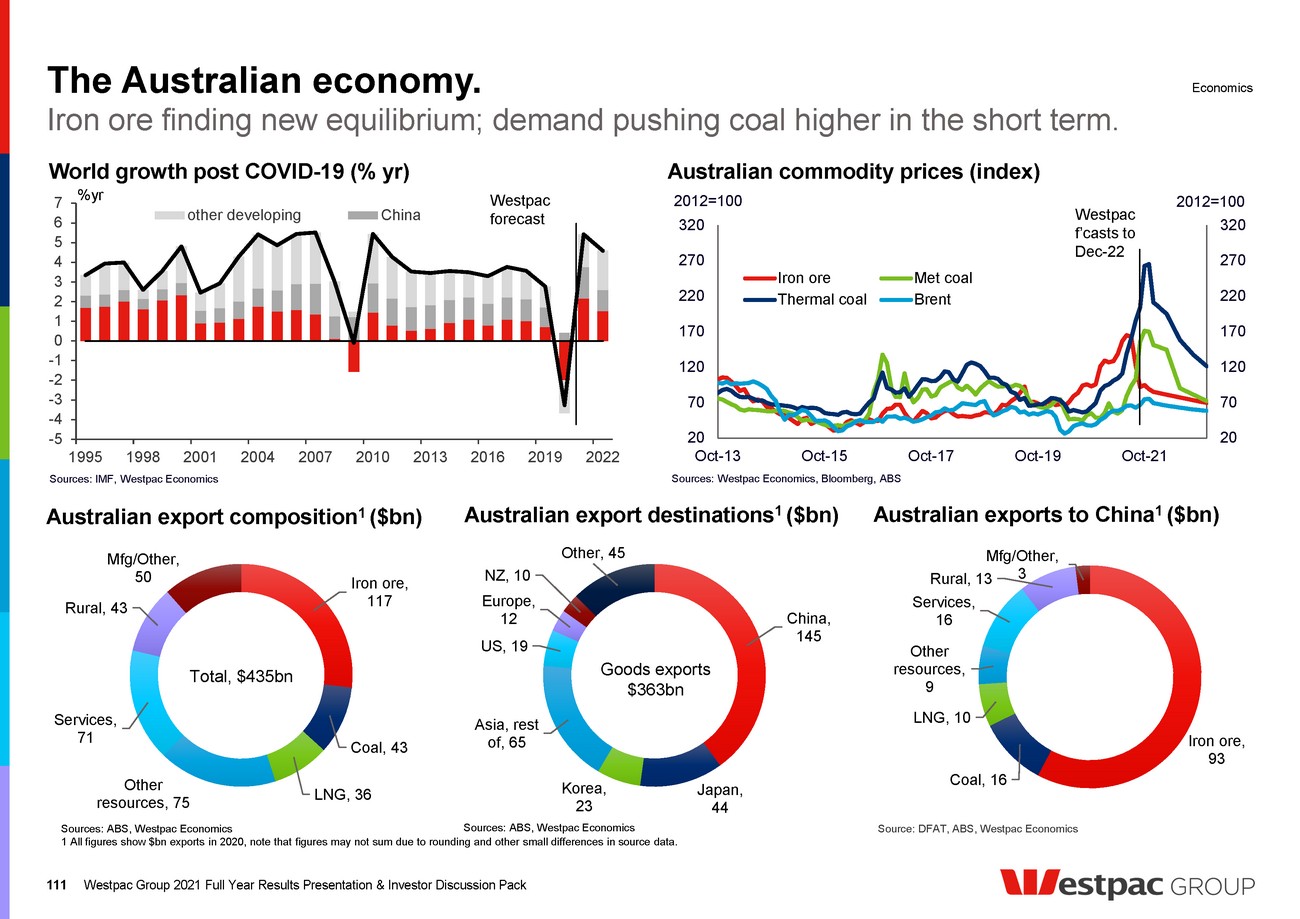
| Australian housing market. Australian dwelling prices (3month annualised) Activity picking up as restrictions ease in NSW and Victoria. Sources: CoreLogic, Westpac Economics. * Price data for Perth has been temporarily suspended as a technical issue is reviewed. Sources: CoreLogic, Westpac Economics. % change over period Capital city Pop’n Last 3 mths (to Sep-21) Last 12 mths (Sep-21) Last 5 years (to Sep-21) Sydney 4.8m Up 5.7% Up 23.6% Up 29.8% Melbourne 4.5m Up 3.3% Up 15.0% Up 24.8% Brisbane 2.3m Up 5.9% Up 19.9% Up 25.2% Perth* 1.9m Up 1.2% Up 18.1% Up 8.4% 112 Westpac Economics dwelling price forecasts (%) * average last 10yrs Sources: CoreLogic, Westpac Economics. Westpac Group 2021 Full Year Results Presentation & Investor Discussion Pack Dwelling prices Capital city Pop’n avg* 2020 2021f 2022f 2023f Sydney 4.8m 7.3 2.7 27 6 -6 Melbourne 4.5m 5.2 -1.3 18 8 -6 Brisbane 2.3m 3.7 3.6 22 10 -1 Perth 1.9m 3.6 7.3 15 8 -1 Australia 25m 5.3 1.8 22 8 -5 -15 -10 -5 0 5 10 15 20 25 30 35 40 Oct-13 Oct-14 Oct-15 Oct-16 Oct-17 Oct-18 Oct-19 Oct-20 Oct-21 Oct-22 % rate cuts Macro-prudential measures 2019 election COVID-19 ‘Delta’ Macro- prudential measures Economics |
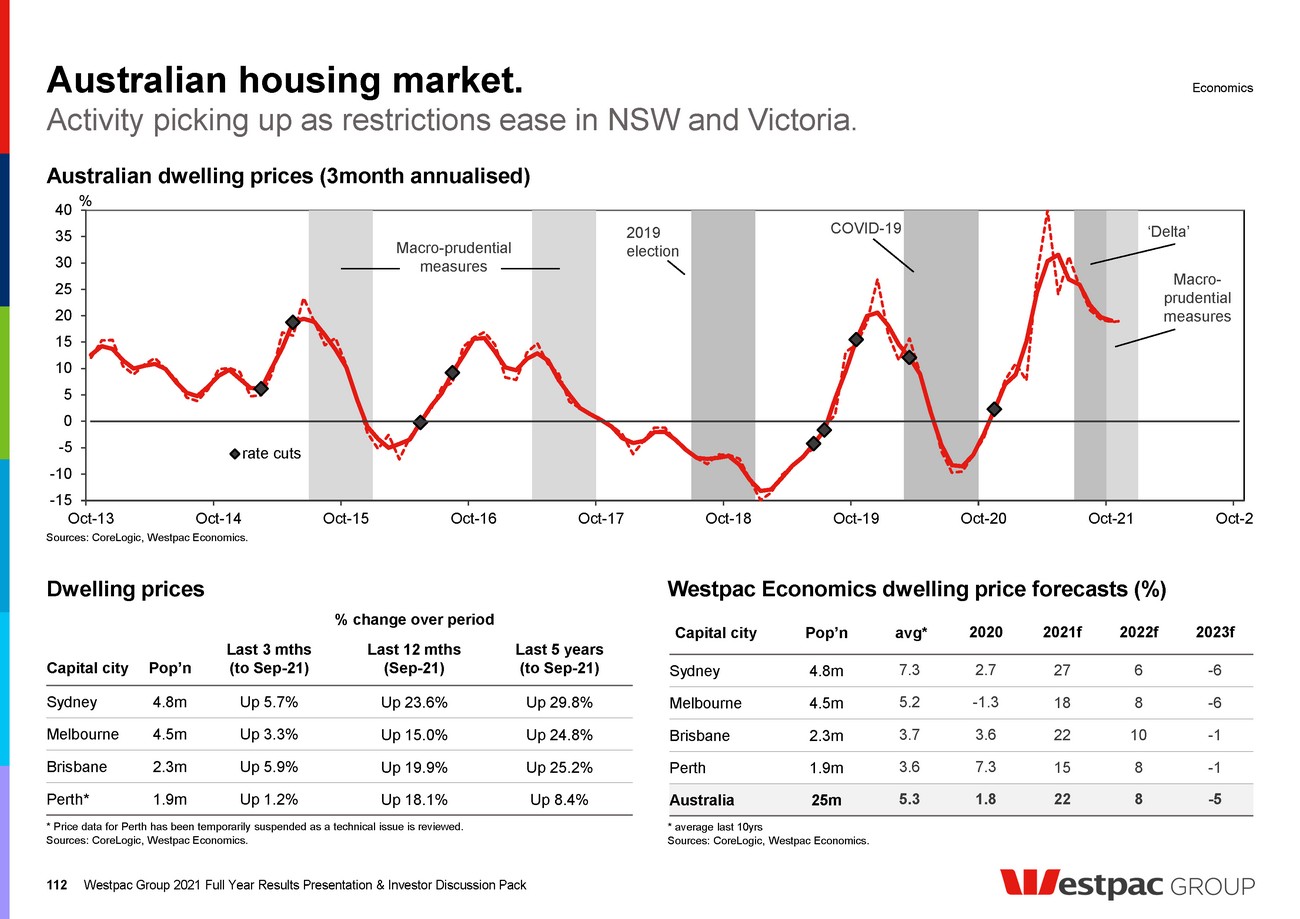
| Australian housing market. 113 Westpac Group 2021 Full Year Results Presentation & Investor Discussion Pack Residential property: sales vs listings 15 17 19 21 23 25 27 29 31 15 17 19 21 23 25 27 29 31 33 Sep-09 Sep-11 Sep-13 Sep-15 Sep-17 Sep-19 Sep-21 ‘000s ‘000s new listings (lhs) sales (lhs) Source: CoreLogic, Westpac Economics. Monthly, capital cities combined, seasonally adjusted by Westpac, smoothed Sources: ABS, Westpac Economics. Housing finance approvals by segment ($bn) 0 2 4 6 8 10 12 14 16 18 0 2 4 6 8 10 12 14 16 18 Aug-21 Aug-05 Aug-09 Aug-13 Aug-17 Aug-21 $bn $bn First home buyers Upgraders Investors value of housing finance Auction clearance rates (monthly, %) Dwelling stock and population: ann change Sources: ABS, Australian Government, Westpac Economics. -100 0 100 200 300 400 500 -100 0 100 200 300 400 500 1900 1920 1940 1960 1980 2000 2020 ‘000s ‘000s population dwellings Westpac forecasts Activity levels to respond to macroprudential measures. Sources: APM, CoreLogic, Westpac Economics. 25 35 45 55 65 75 85 95 25 35 45 55 65 75 85 95 Oct-11 Oct-14 Oct-17 Oct-20 Oct-11 Oct-14 Oct-17 Oct-20 % % Seasonally adjusted by Westpac Sydney Melbourne Economics |
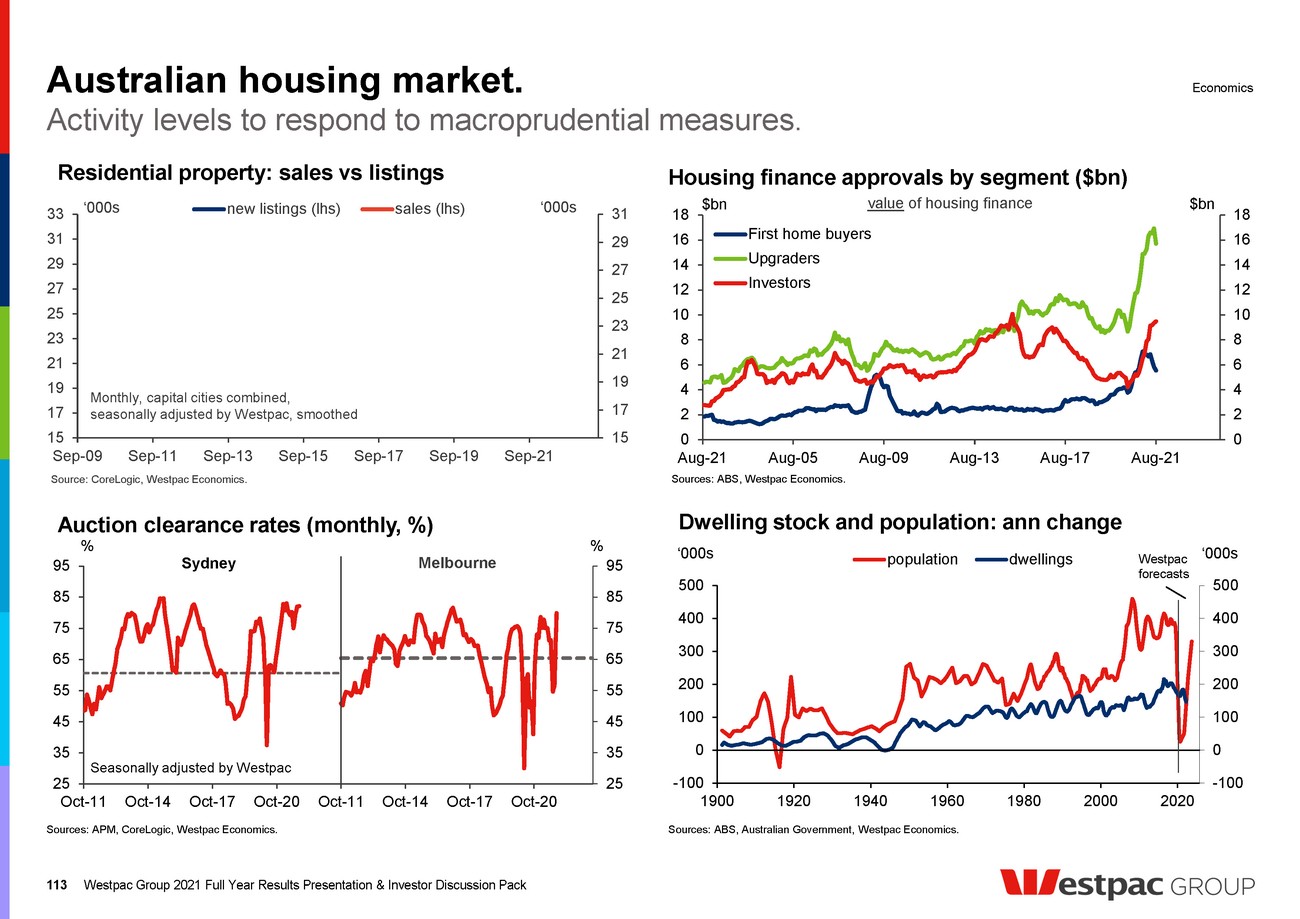
| Australian housing market. Affordability challenges emerging in Sydney and Melbourne. 114 Westpac Group 2021 Full Year Results Presentation & Investor Discussion Pack Mortgage interest rates (%) Sources: RBA, Westpac Economics. * Standard, owner occupier, including discount 0 2 4 6 8 10 0 2 4 6 8 10 Sep-07 Sep-09 Sep-11 Sep-13 Sep-15 Sep-17 Sep-19 Sep-21 % % Variable* 3 year fixed Sources: CoreLogic, Westpac Economics Affordability: Australia (%) Housing consumer sentiment (index) Sources: Melbourne Institute, Westpac Economics Rental vacancy rates (% quarterly, annual average) Sources: REIA, Westpac Economics. 0 1 2 3 4 5 6 7 8 0 1 2 3 4 5 6 7 8 Jun-96 Jun-01 Jun-06 Jun-11 Jun-16 Jun-21 % % Sydney Melbourne Perth Brisbane latest month (where available) 40 60 80 100 120 140 160 180 200 60 80 100 120 140 160 Oct-07 Oct-09 Oct-11 Oct-13 Oct-15 Oct-17 Oct-19 Oct-21 index index 'time to buy a dwelling' (lhs) house price expectations (rhs) Share of average income required to raise a deposit over 5yrs and pay mortgage over first 5yrs for purchase of median-priced dwelling Westpac f’casts to Dec-22 2017 peaks 10 15 20 25 30 35 10 15 20 25 30 35 Sep-87 Sep-93 Sep-99 Sep-05 Sep-11 Sep-17 % % Sydney Melbourne Economics |
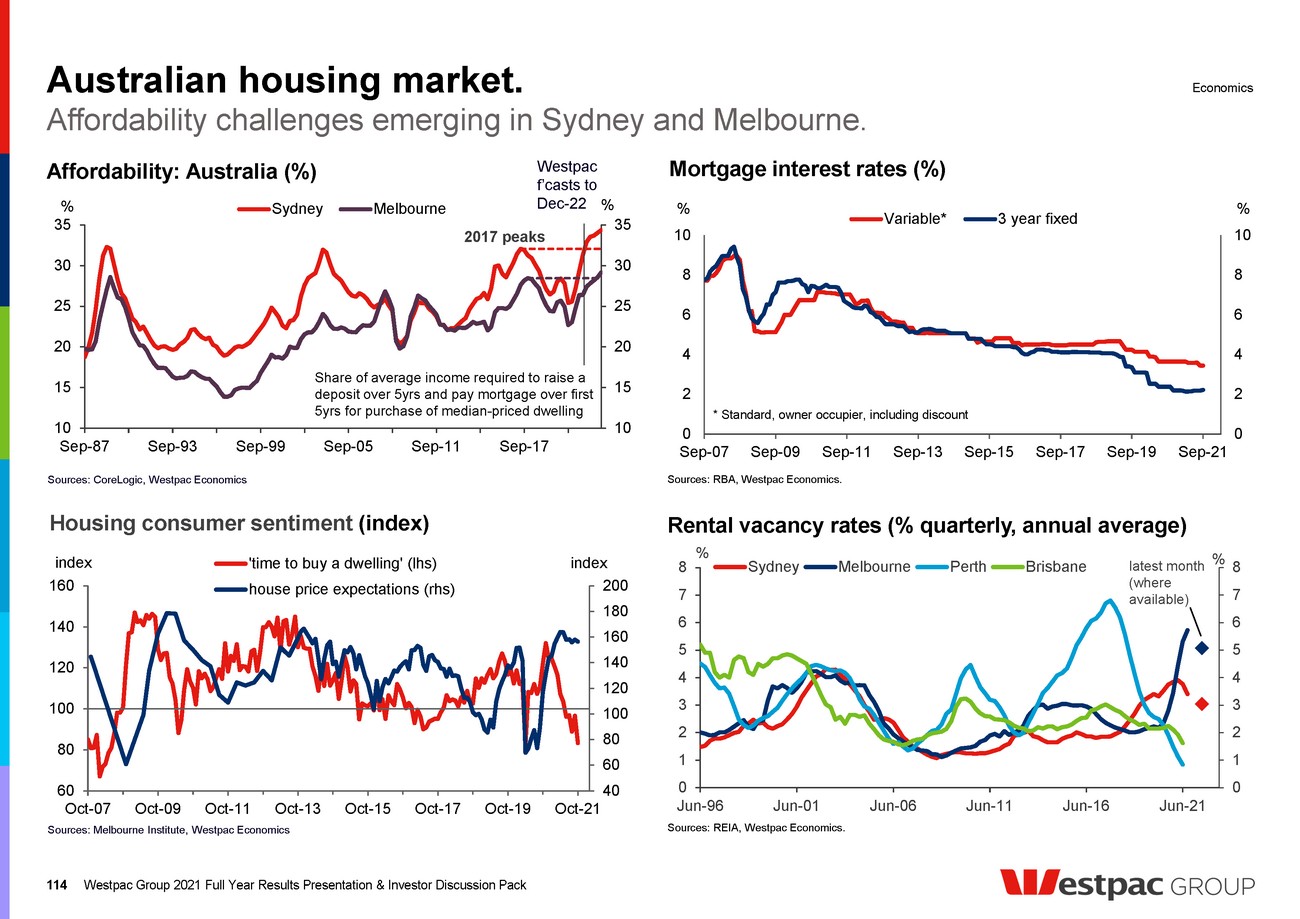
| TAS 542k The Australian economy. Australian GDP and employment composition Population 25.7 million. Sources: ABS, Westpac Economics 1 Real, financial years. 2 GSP, exports are for 2019-20; Population as at March 2021; Employment as at June 2021.. Economics 11 6 8 7 9 3 5 9 6 7 10 18 Mining Manufacturing Construction Transport, Utilities Wholesale, Retail Agriculture Household services Health Education Public administration Finance Business services 2 7 9 6 13 3 12 14 9 7 4 16 Mining Manufacturing Construction Transport, Utilities Wholesale, Retail Agriculture Household services Health, Social Assistance Education Public Administration Finance Business services Output by sector 2020-21 (% contribution to GDP) 1 Australian employment by sector, June 2021 (%) 33 24 19 14 6 2 32 26 20 10 7 2 32 26 20 11 7 2 21 12 22 37 3 1 NSW Victoria Queensland WA SA Tasmania GSP Population Employment Exports Relative size of States (Share of Australia, %) 2 115 Westpac Group 2021 Full Year Results Presentation & Investor Discussion Pack Australian population ` WA 2.7m SA 1.8m QLD 5.2m NT 247k NSW 8.2m VIC 6.7m ACT 432k |
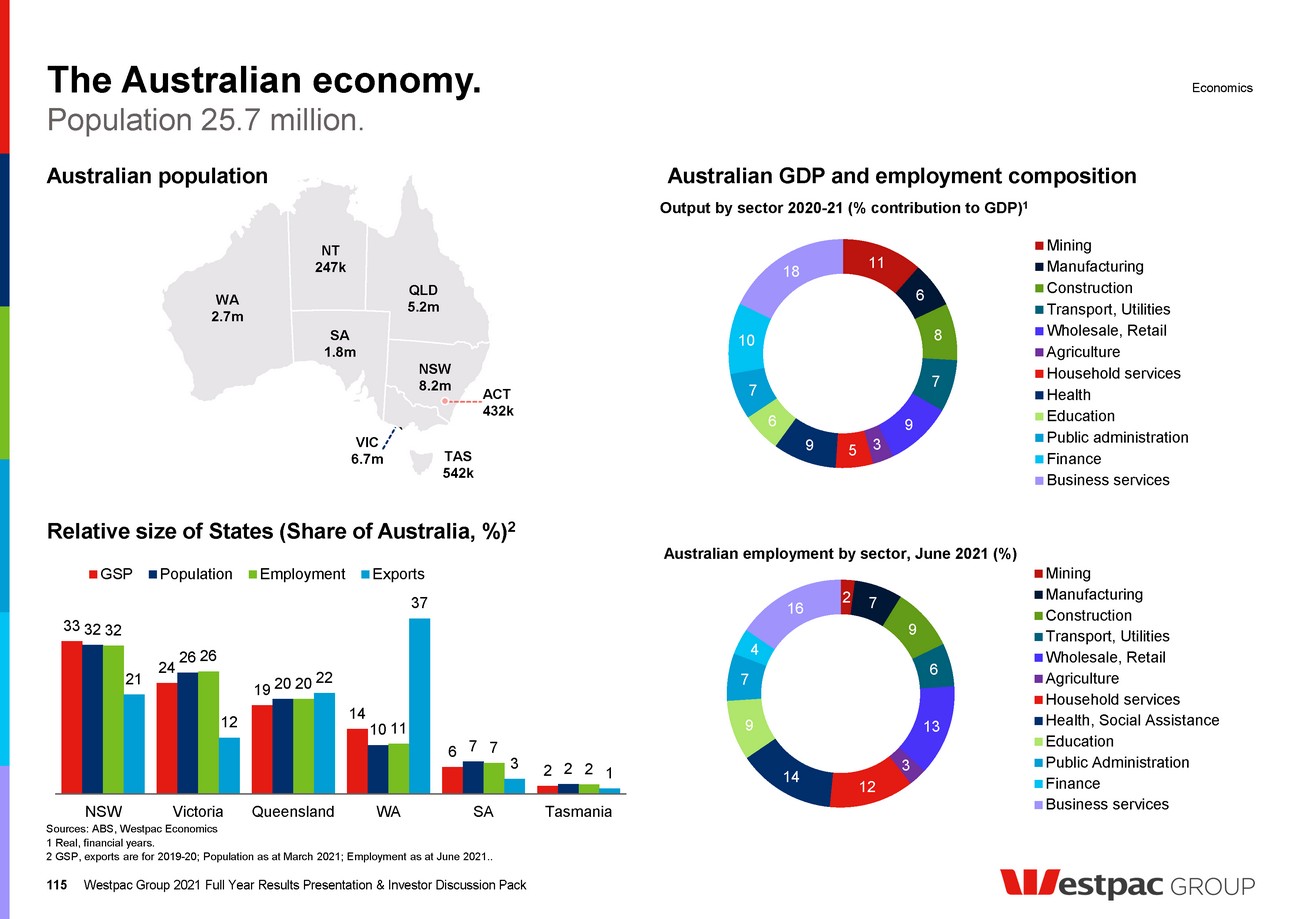
| The New Zealand economy overview. Westpac Group 2021 Full Year Results Presentation & Investor Discussion Pack 116 New Zealand GDP Unemployment rate Sources: Stats NZ, Westpac Economics. Economics Sources: Stats NZ, Westpac Economics. Sources: RBNZ, Westpac Economics 2 3 4 5 6 7 8 2 3 4 5 6 7 8 2006 2009 2012 2015 2018 2021 Pre-Covid forecast Current forecast Westpac forecasts % % The recovery has been faster than expected and interest rates are on the rise. 55 60 65 70 75 55 60 65 70 75 2018 2020 2022 Pre-Covid trend Current forecast $bn $bn Westpac forecasts 0 1 2 3 4 0 1 2 3 4 2010 2012 2014 2016 2018 2020 2022 2024 Westpac forecasts % % Official Cash Rate Consumer prices 0 1 2 3 4 5 6 0 1 2 3 4 5 6 2005 2008 2011 2014 2017 2020 2023 RBNZ target band Westpac forecasts %yr %yr Sources: Stats NZ, Westpac Economics. |
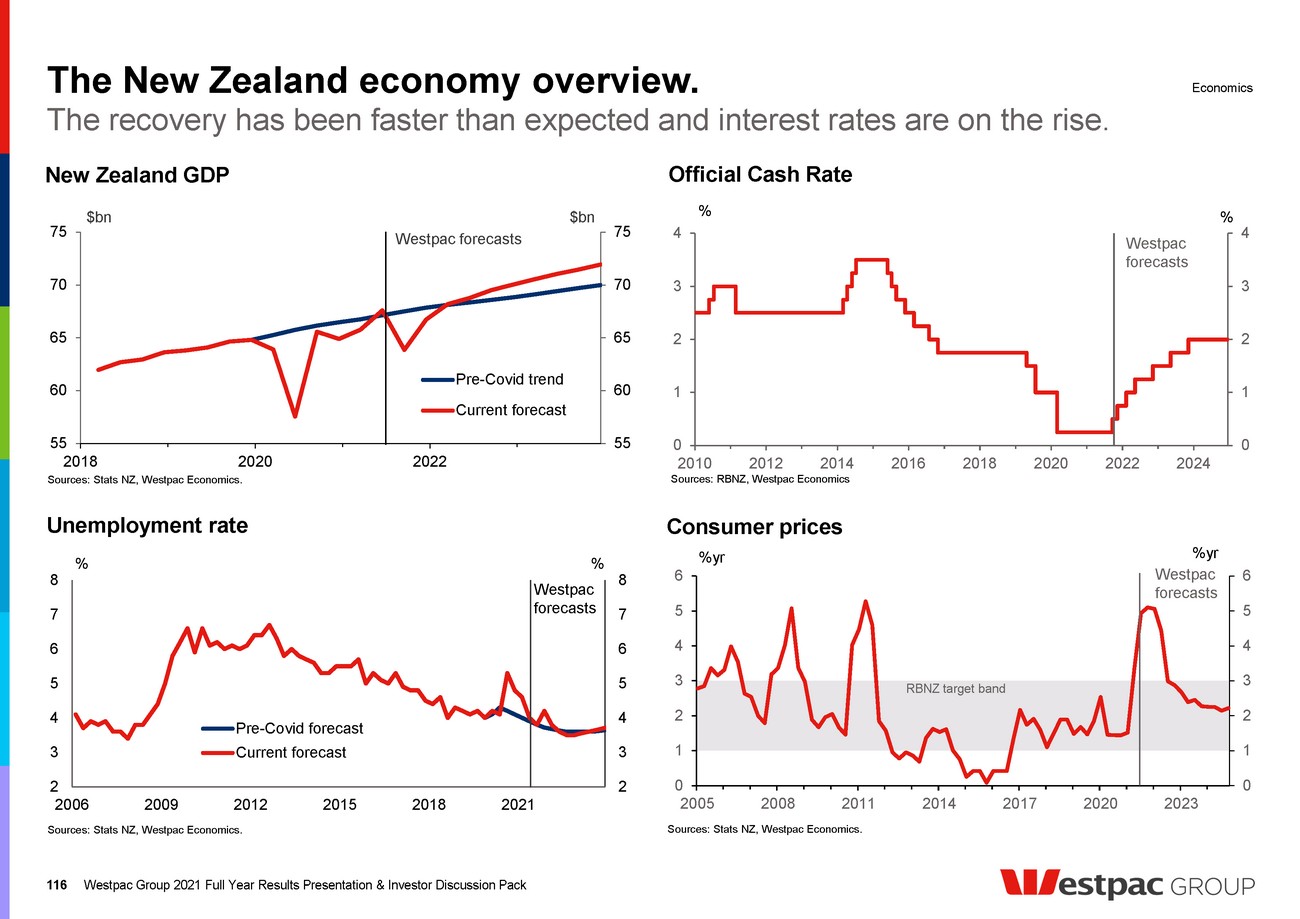
| New Zealand economic outlook. 117 Weekly retail spending by region Lockdown conditions are dampening activity, but the medium-term outlook remains firm. Sources: MBIE, Westpac Economics. Economics Westpac Group 2021 Full Year Results Presentation & Investor Discussion Pack • The increase in the Covid Alert Level in August has continued for longer than expected. This is weighing on activity in parts of the country, especially Auckland • However, demand remains firm in other parts of the country. Labour demand and business confidence have proven to be resilient • While the lockdown may be drawn out, conditions are expected to recover to firm levels further ahead when restrictions are eventually relaxed, as has it has done following previous lockdowns Monetary and fiscal policy remains supportive The housing market remains strong The labour market is in good health Filled jobs 250 500 750 1000 1250 250 500 750 1000 1250 Feb-20 Aug-20 Feb-21 Aug-21 Index Index Rest of NZ Auckland Periods of heightened Alert Levels highlighted 2,000 2,200 2,400 2,000 2,200 2,400 2018 2019 2020 2021 Number (000s) Number (000s) Initial Covid outbreak Delta outbreak Sources: Stats NZ, Westpac Economics. Sources: NZIER. Investment and hiring intentions -60 -40 -20 0 20 40 -60 -40 -20 0 20 40 Jan-05 Jan-09 Jan-13 Jan-17 Jan-21 Net % of businesses planning on hiring more staff Net % of businesses planning on increasing investment spending Net % Net % |
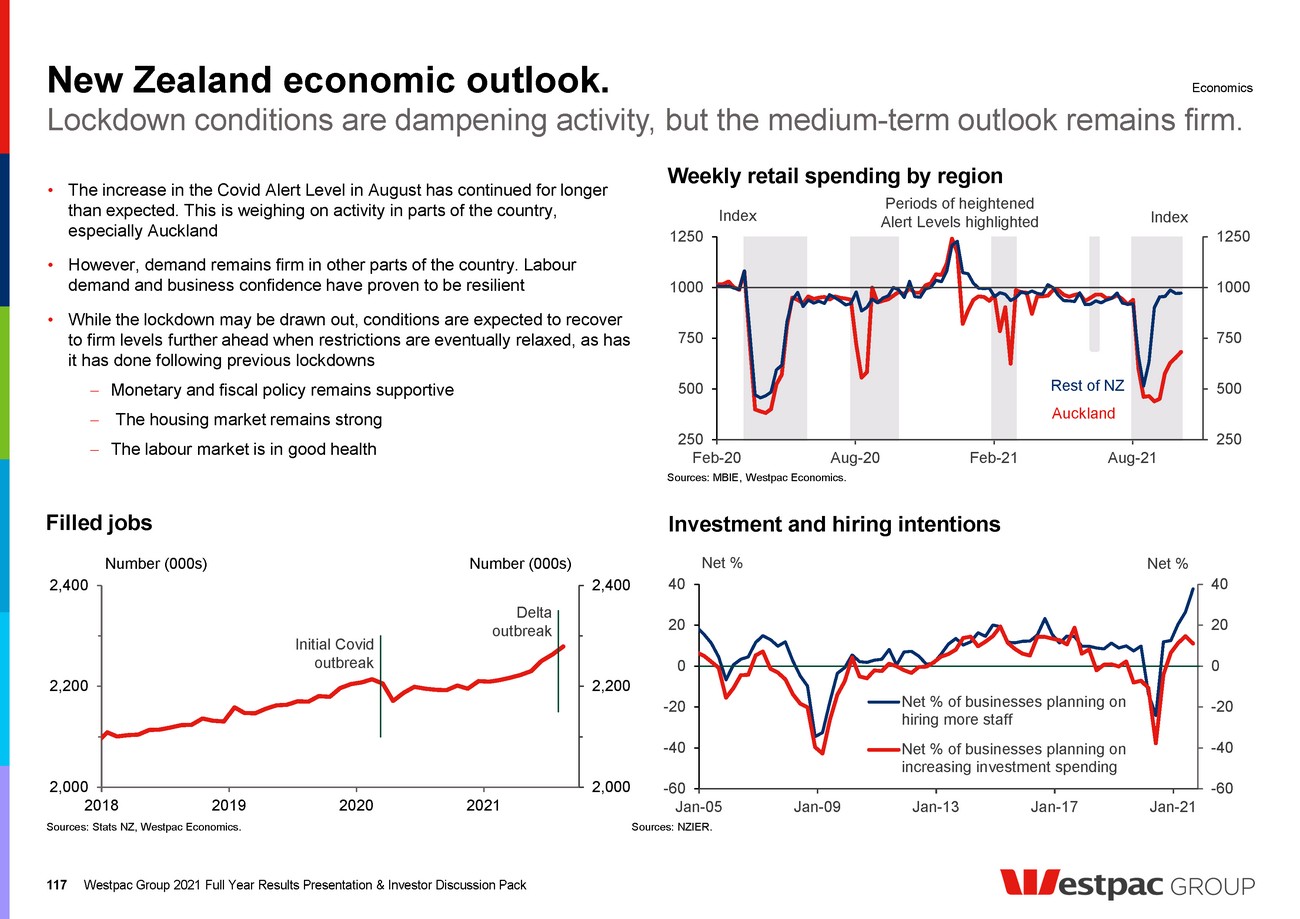
| New Zealand policy outlook and COVID response. 118 COVID-19 response The approach to COVID is shifting to management, while interest rates are on the rise. Economics Westpac Group 2021 Full Year Results Presentation & Investor Discussion Pack Monetary policy • The RBNZ increased the Official Cash Rate to 0.50% in October. Westpac Economics expects follow up 25bp hikes in November, February and May. Further ahead, the cash rate is expected to gradually rise to 2% by the end of 2023 • Near-term inflation is being boosted by domestic and global cost pressures • Even when current cost pressures eventually ease, inflation is expected to remain firm, underpinned by strength in domestic demand • While the current elevated Alert Level in parts of the country may moderate some of the strength in demand in the short term, activity is expected to recover when the Alert Level is eventually dialled back (as it has after previous lockdowns) • With strong demand, despite Covid-related headwinds, the RBNZ has assessed the economy no longer needs the degree of stimulus currently in place Factors constraining business activity Sources: NZIER, Westpac Economics. • New Zealand’s approach to managing COVID is shifting away from elimination and lockdowns • Once the vaccination rate reaches a high enough level (90% of the eligible population), the Government will roll out a ‘traffic light’ system. This framework outlines what activity will be permitted and what restrictions are necessary. This will be supported by measures such as vaccination passports • As at October 2021, 86% of the eligible population have had their first dose and 68% are fully vaccinated Vaccination rates (as at 19 October 2021) 86% 72% 68% 57% 0 25 50 75 100 0 25 50 75 100 Elgible population Total population % First dose Two doses % 0 5 10 15 20 25 0 20 40 60 80 100 2000 2005 2010 2015 2020 2001 2006 2011 2016 2021 % % % of business highlighting a lack of demand as a constraint % of business highlighting a lack of supplies as a constraint Sources: NZ Ministry of Health |

| New Zealand housing market. 119 New Zealand dwelling prices (index, Jan 2007 = 1000) Higher interest rates expected to cool the market. Sources: REINZ, Westpac Economics. Economics Sources:REINZ, Stats NZ. Westpac Group 2021 Full Year Results Presentation & Investor Discussion Pack Dwelling prices % change over period Region Pop’n Last 3 mths (to Sep-21) Last 12 mths (Sep-21) Last 5 years (to Sep-21) Auckland 1.7m Up 5.3% Up 25.6% Up 40.6% Wellington 0.5m Up 3.1% Up 35.0% Up 102.1% Canterbury 0.6m Up 11.5% Up 36.2% Up 49.8% Nationwide 5.1m Up 5.5% Up 30.5% Up 61.9% • The Delta outbreak is weighing on house sales, but price growth remains firm • Westpac Economics expect that house prices will continue to rise over the coming year, but that the pace of increase will slow as mortgage rates lift from recent lows • Longer term, mortgage rates are set to continue rising, back towards more average levels. After the recent period of very low mortgage rates, that is likely to see some easing back in prices. However, this would still leave prices at elevated levels • Changes in tax policy targeting residential property investors are expected to have a dampening impact on the housing market over time. However, to date the impact of these changes has been more limited than expected. While investors have stepped back from the market, demand from owner- occupiers remains firm. Investor demand for newly built homes has been resilient 750 1250 1750 2250 2750 750 1250 1750 2250 2750 2007 2009 2011 2013 2015 2017 2019 2021 Auckland Canterbury Wellington Other regions Index Index House price forecasts (ann. % change) -20 -10 0 10 20 30 40 50 0 1000 2000 3000 4000 2004 2008 2012 2016 2020 2024 Annual % change (left axis) Level (right axis) Westpac f/c’s Index = 1000 in 2003 Sources: Stats NZ, Westpac Economics. |
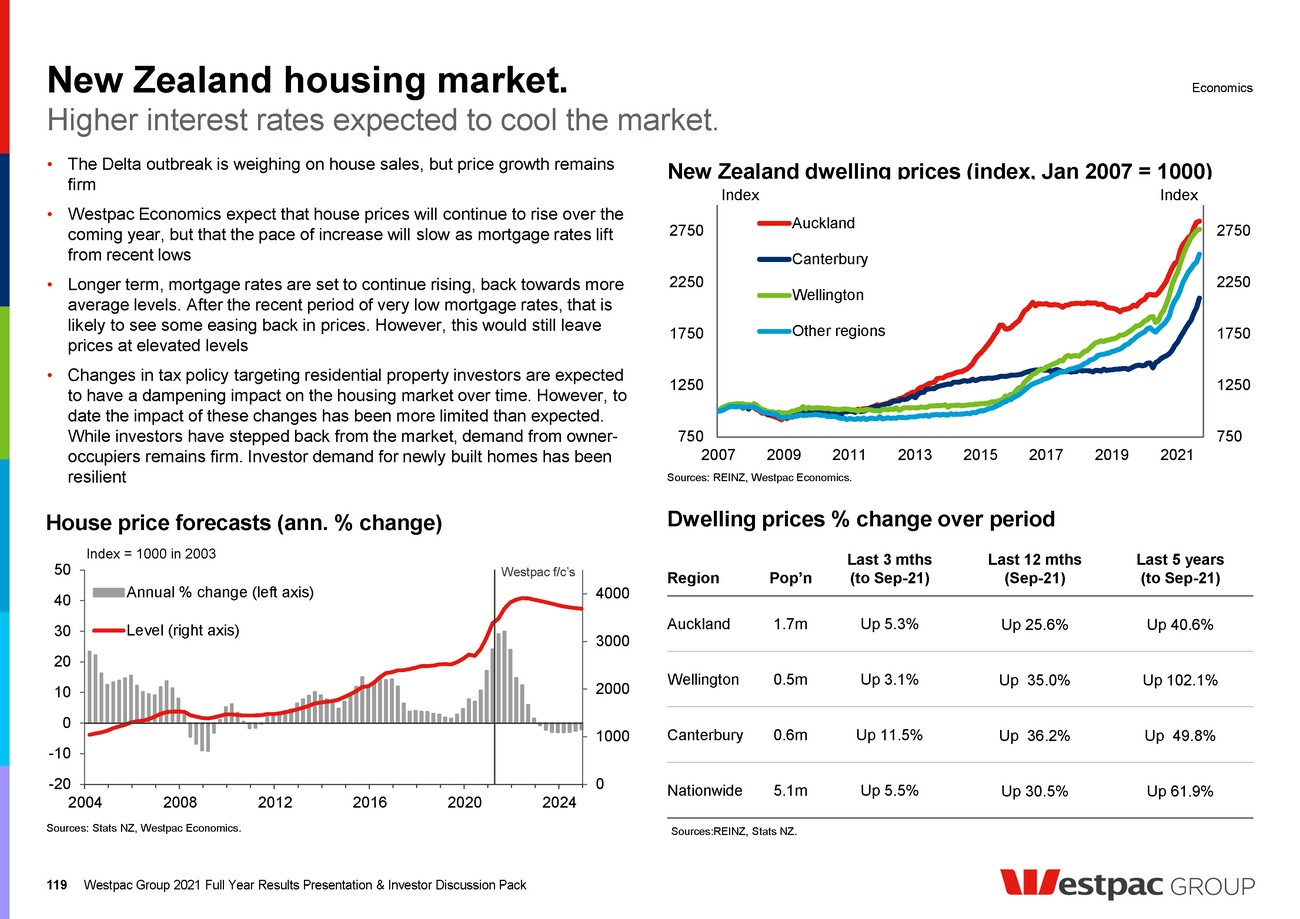
| 6 6 3 9 12 3 35 5 10 11 Primary industries Construction Electricity, gas, and water Manufacturing Wholesale, retail and accommodation Transport Financial and professional services Public administration Social services (incl. health and education) Other The New Zealand economy. 120 Economy Regional GDP Population 5.1 million. Sources: Stats NZ, Westpac Economics. Nationwide GDP and employment figures are for the year to March 2021, regional figure are for the year to March 2020. Economics NZ employment by sector 2021 (%) Output 2021 - sector shares of GDP (%) Total nominal GDP 2020: $322 bn Charts may not add to 100 due to rounding. Westpac Group 2021 Full Year Results Presentation & Investor Discussion Pack 6 10 1 9 18 4 19 6 19 7 Primary industries Construction Electricity, gas, and water Manufacturing Wholesale, retail and accommodation Transport Financial and professional services Public administration Social services (incl. health and education) Other Total nominal GDP 2019: $303bn Northland, $8bn 4% of population Auckland, $122bn 35% of population Waikato, $28bn 10% of population Taranaki, Whanganui/Manawatu, $21bn 7% of population Wellington, $40bn 11% of population Bay of Plenty, $19bn 6% of population Southland, $7bn 2% of population Otago, $14bn 5% of population Canterbury, $40bn 13% of population West Coast, $2bn 1% of population Tasman/Nelson, $6bn 2% of population Marlborough, $3bn 1% of population Gisborne/Hawke’s Bay, $11bn 4% of population |
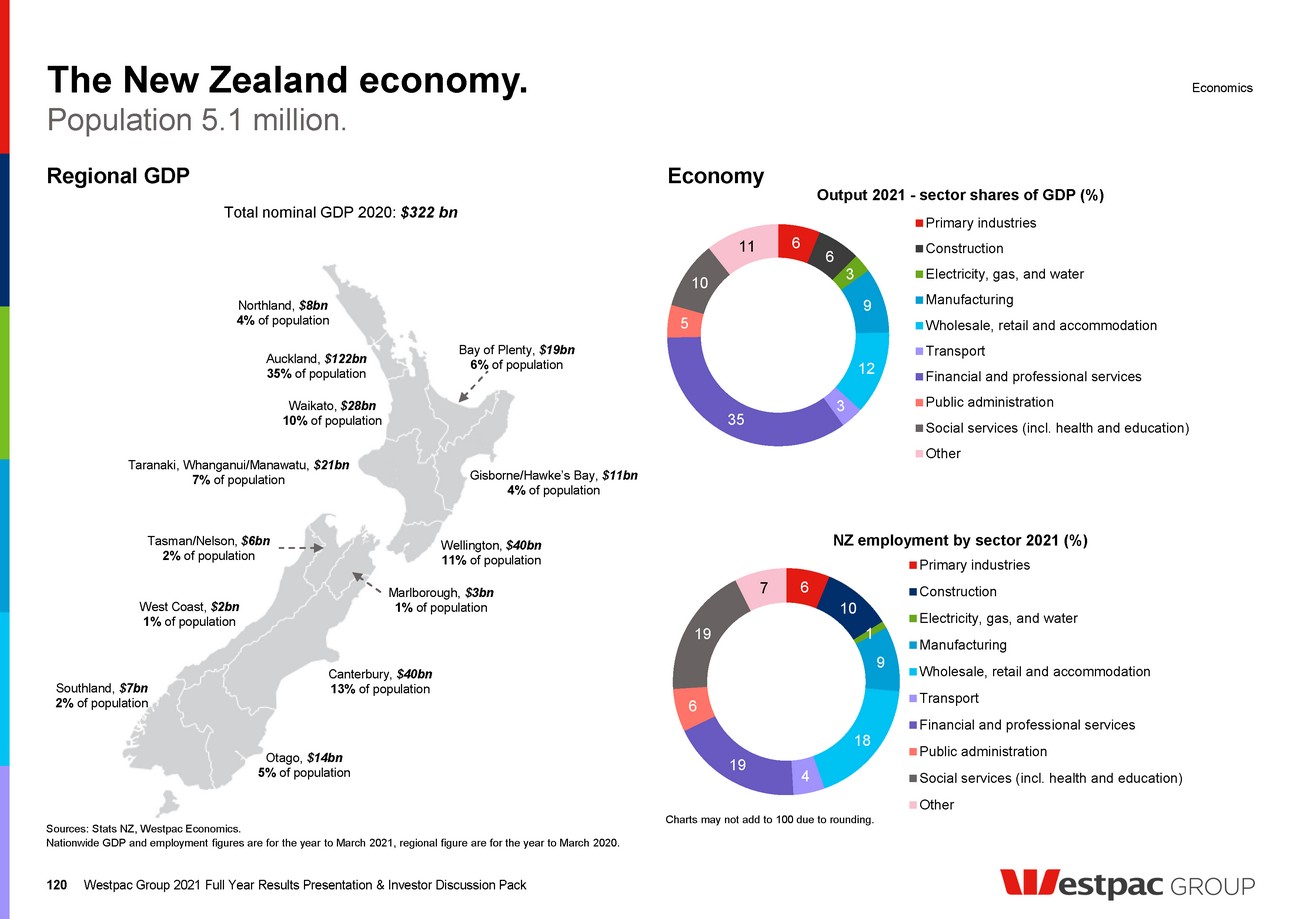
| Appendix and disclaimer ,11estpac GROUP |
| Appendix 1: 122 Cash earnings adjustments. Appendix Appendix Cash earnings adjustment ($m) 2H20 1H21 2H21 Description Reported net profit 1,100 3,443 2,015 Net profit attributable to owners of Westpac Banking Corporation Fair value (gain)/loss on economic hedges 581 46 (184) Fair value on economic hedges (which do not qualify for hedge accounting under AAS) comprise: • The unrealised fair value (gain)/loss on foreign exchange hedges of future New Zealand earnings impacting non- interest income is reversed in deriving cash earnings as they may create a material timing difference on reported results but do not affect the Group’s cash earnings over the life of the hedge. Westpac has ceased this activity, and at this stage no further adjustments will be recognised; and • The unrealised fair value (gain)/loss on hedges of accrual accounted term funding transactions are reversed in deriving cash earnings as they may create a material timing difference on reported results but do not affect the Group’s cash earnings over the life of the hedge Ineffective hedges (37) 48 (16) The unrealised (gain)/loss on ineffective hedges is reversed in deriving cash earnings because the gain or loss arising from the fair value movement in these hedges reverses over time and does not affect the Group’s profits over time Adjustments related to Pendal Group (32) -- Consistent with prior periods, this item has been treated as a cash earnings adjustment given its size and that it does not reflect ongoing operations. The adjustment relates to the mark-to-market of the shares. Westpac disposed of its holdings in Full Year 2020. As a result, no further adjustments will be recognised Treasury shares 3 -- Under AAS, Westpac shares held by the Group in the managed funds and life businesses are deemed to be Treasury shares and the results of holding these shares cannot be recognised in the reported results. In deriving cash earnings, these results are included to ensure there is no asymmetrical impact on the Group’s profits because the Treasury shares support policyholder liabilities and equity derivative transactions which are revalued in determining income. At 30 September 2021, there are no Treasury shares Cash earnings 1,615 3,537 1,815 Westpac Group 2021 Full Year Results Presentation & Investor Discussion Pack |
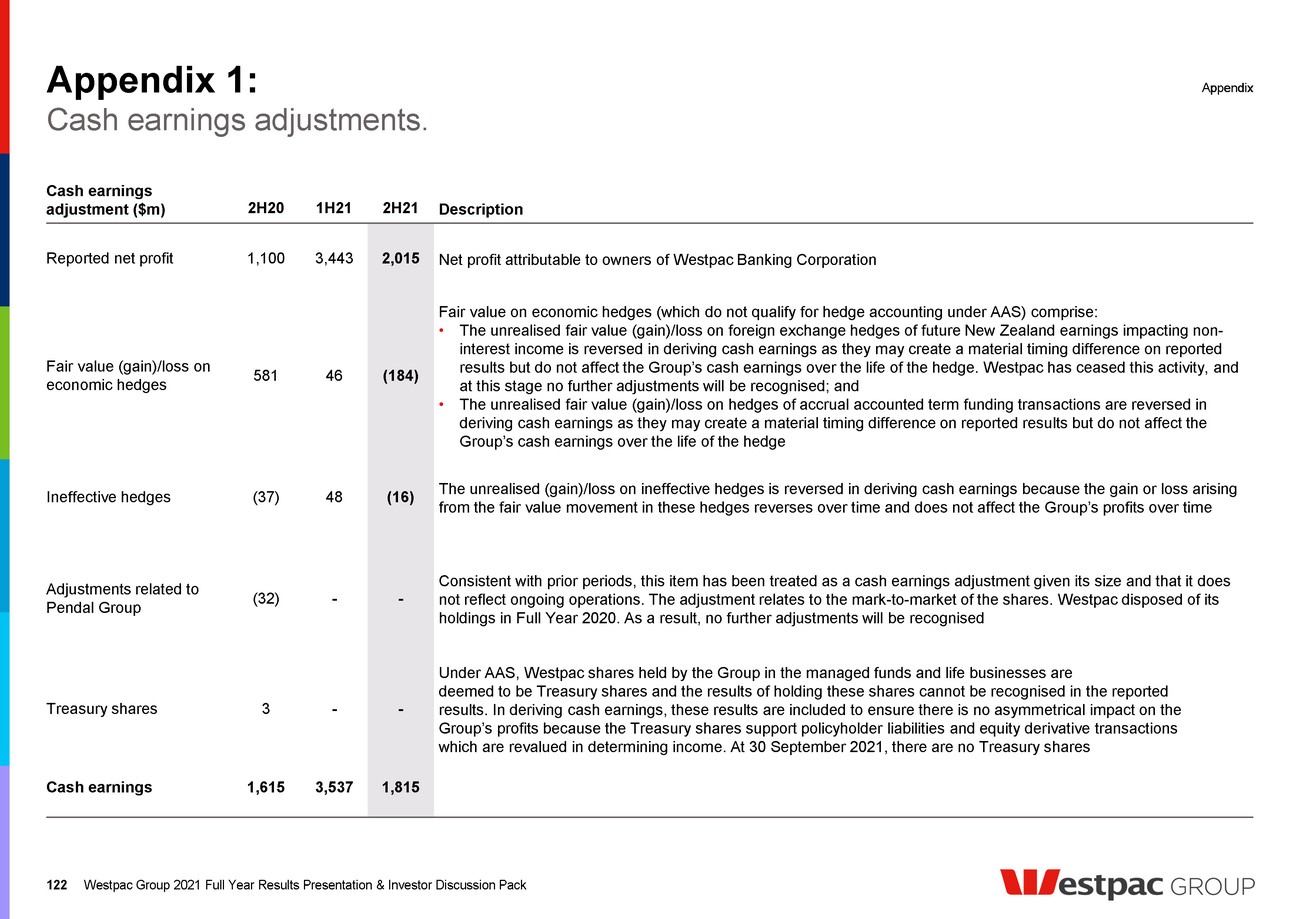
| 123 Transactions completed Announced Completed Expected divestment CET1 benefit (bps) Zip Co Ltd. Oct 2020 Oct 2020 Realised 8 Coinbase Inc. May 2021 May 2021 Realised 7 Westpac General Insurance Dec 2020 Jul 2021 Realised 12 Vendor Finance Aug 2020 Jul 2021 - Westpac LMI Mar 2021 Aug 2021 Realised 7 Transactions announced Announced Completion expected Motor Vehicle Finance Jun 2021 First half of FY22 6 Westpac Life-NZ Jul 2021 First half of FY22 7 Westpac Life Insurance 1 Aug 2021 Second half of FY22 16 Expected divestment benefit 29 Operations within Specialist Businesses division (a range of options under consideration) Superannuation Platforms and Investments Westpac Pacific 2 Auto Finance Appendix 123 Appendix 2: 1 Reflects the remaining CET1 impact expected upon completion in Second Half 2022. The accounting loss on sale in Westpac Life Insurance included in Second Half 2021 notable items impacted the CET1 ratio for September 21. In total, the sale of Westpac Life Insurance is expected to add approximately 12bps to Westpac’s Common Equity Tier 1 capital ratio. 2 On 22 September 2021, Westpac announced that the previously announced proposed sale of Westpac Pacific to Kina Bank was terminated by mutual agreement. Westpac Group 2021 Full Year Results Presentation & Investor Discussion Pack Portfolio simplification progress. |
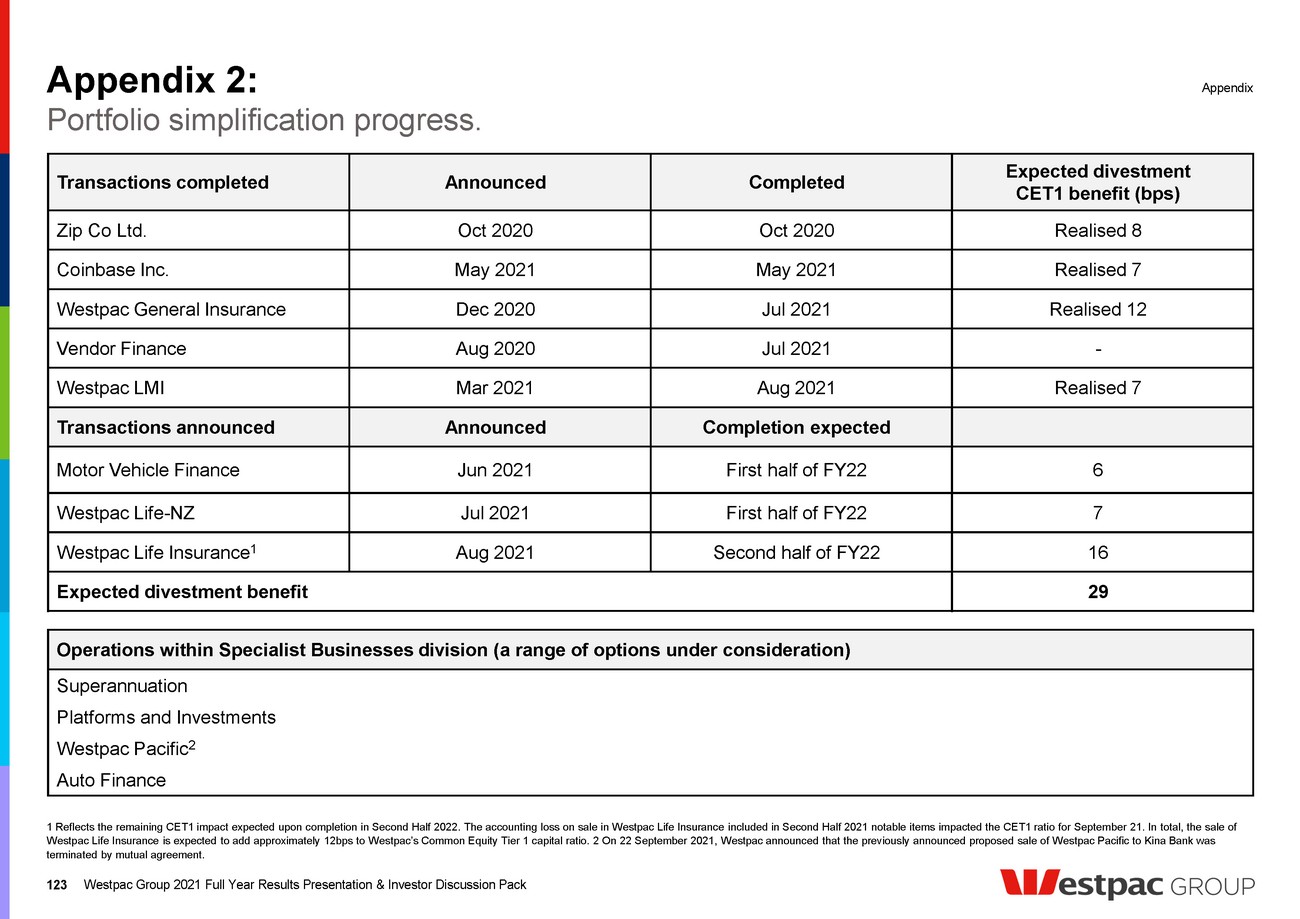
| Appendix 3: New business models 124 New technology capabilities Data, AI and analytics 1 Logos are of the respective companies. Appendix A natural language AI system for data analysis targeting relatively simple business queries that comprise 70% of an analyst’s work in a large organisation Open Banking API platform that provides connectivity to over 100 financial sources across Australia and NZ Comprehensive cloud-based human resources and employee benefits platform to streamline HR processes Full stack payments platform Enterprise cyber security company that protects businesses from malicious bot attacks Enabling software development teams to scale processes and improve code quality Digitised debt collection, leveraging modern communications, automation and machine learning Uses data to shed light on high volume crimes, improving prevention and detection A fund of funds for cryptocurrency and blockchain technology Peer-to-peer (P2P) online lending platform connecting borrowers and investors Helps home sellers make decisions about who they choose to sell their property Business loan marketplace that matches SMEs to the best lender based on their characteristics and needs A payment app for customers when dining out or grabbing a coffee on the go AI company that integrates neuroscience into their platform creating capability that not only manages complex problems but is able to form intrinsic relationships with humans Smart receipts that automatically link purchase receipts to customers’ bank accounts AI-powered, context-as-a-service platform, to deliver personalised experiences to customers B2B platform for physical retail stores that provides insights through their AI engine and in-store sensors A consumer digital lending platform Pioneering a new asset class called Tradeable Income Based Securities (TIBS) Creating real-game assets for developers, using blockchain technology Conversational voice-based AI for digital interviewing, powered by machine learning Turning buildings into community-centric dwellings Westpac has committed $150m in fintech venture capital funds, managed by Reinventure. Reinventure enables Westpac to access insights and adjacent business opportunities, both in Australia and offshore. The model also helps Westpac to source commercial partnerships that create value for customers Reinventure – Investing in fintech businesses 1. A leading digital credit platform in Indonesia Westpac Group 2021 Full Year Results Presentation & Investor Discussion Pack Empowering banks to connect seamlessly with merchants and their customers Providing digital mortgage broking Helps banks and fintechs make better decisions using a single API and dashboard to manage KYC/AML and fraud Helping Australians create their wills online |
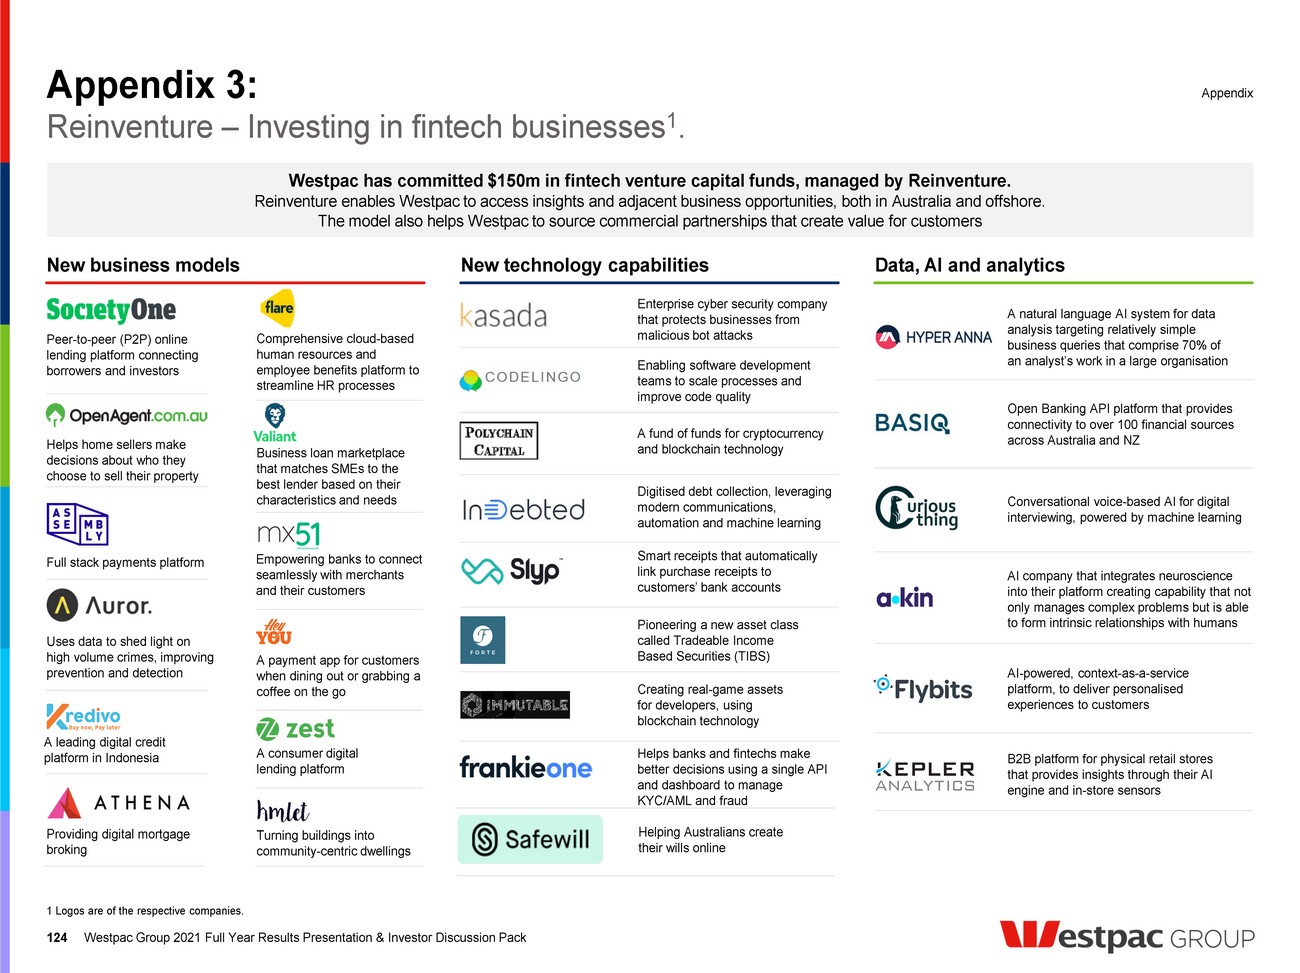
| Appendix 4: Industry recognition 125 Sustainability indexes Inclusion and diversity recognition Sustainability. Appendix Rated Prime status of “C” by ISS ESG (formerly ISS-oekom) Achieved highest ISS QualityScore for Environment and Social dimensions Member of the DJSI Indices since 2002 Recognised as Silver Tier Employer in 2020 in the Australian Workplace Equality Index Awards Westpac Group 2021 Full Year Results Presentation & Investor Discussion Pack Received “B” rating in the 2020 CDP for our response to Climate Change, announced December 2020 As of April 2021, Westpac received an ESG Risk Rating of 27.3 from Sustainalytics and was assessed to be at Medium risk of experiencing material financial impacts from ESG factors 1 Member of the FTSE4Good Index Series, of which Westpac has been a member since 2001 As of 2021, Westpac received an MSCI ESG Rating of A 2 Recognised by the Bloomberg Gender Equality Index for the 5 th consecutive year Accredited as Level 1 Activate as a Carer Friendly Employer under the CarersNSW Carers + Employers Program in 2020 1 Copyright ©2021 Sustainalytics. All rights reserved. This section contains information developed by Sustainalytics (www.sustainalytics.com). Such information and data are proprietary of Sustainalytics and/or its third party suppliers (Third Party Data) and are provided for informational purposes only. They do not constitute an endorsement of any product or project, nor an investment advice and are not warranted to be complete, timely, accurate or suitable for a particular purpose. Their use is subject to conditions available at https://www.sustainalytics.com/legal-disclaimers. 2 The use by Westpac of any MSCI ESG Research LLC or its affiliates (“MSCI”) data, and the use of MSCI logos, trademarks, service marks or index names herein, do not constitute a sponsorship, endorsement, recommendation, or promotion of Westpac by MSCI. MSCI services and data are the property of MSCI or its information providers, and are provided ‘as-is’ and without warranty. MSCI names and logos are trademarks or service marks of MSCI. Received the 2020 Advancement Award in recognition of Westpac’s innovative autism hiring program, Tailored Talent Ranked #1 in the ASX-50 and #2 in the world for transparency and effectiveness of our standalone sustainability Reporting, according to the Global ESG Monitor Report |
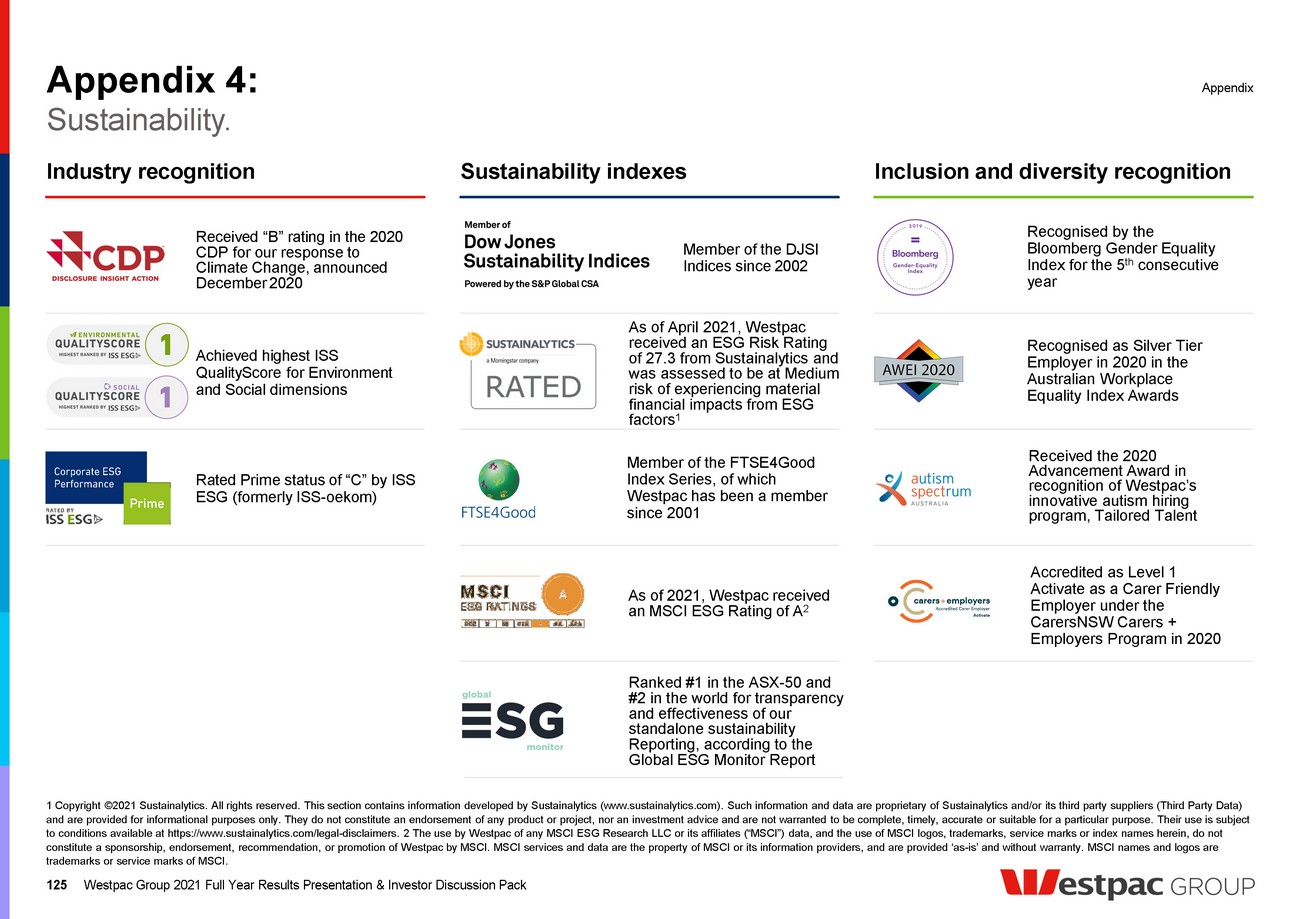
| Appendix 4: 126 Key commitments and partnerships Sustainability. Appendix Carbon Markets Institute Corporate Member UN Environment Program Finance Initiative Founding Member (1991) Commitment to United Nations Global Compact Signatory (2002), Global Compact Network Australia Founding Member (2009) Principles for Responsible Investment Signatory (2007) Supply Nation (for Indigenous owned businesses) Founding member (2010) Australian Business Roundtable for Disaster Resilience & Safer Communities Founding member (2012) Global Investor Statement to Government on the Climate Crisis Signatory (2021) Social Traders (for social enterprises) (2016) Financial Stability Board’s Task Force on Climate-related Financial Disclosures Align with and support UN Sustainable Development Goals CEO Statement of Commitment (2015) Climate Action 100+ Signatory (2017) The Montreal Carbon Pledge Signatory (2014) Paris Climate Agreement Supporter (2015) United Nations Tobacco-Free Finance pledge Founding signatory (2018) Australian Sustainable Finance Initiative Steering Committee Member The Equator Principles Founding Adopter, First Australian Bank (2003) Climate Bonds Initiative Partner Carbon Neutral Certification Since 2012 (previously NCOS) Principles for Responsible Banking Signatory 2019 RE100, an initiative of The Climate Group in partnership with CDP Member (2019) Westpac Group 2021 Full Year Results Presentation & Investor Discussion Pack |
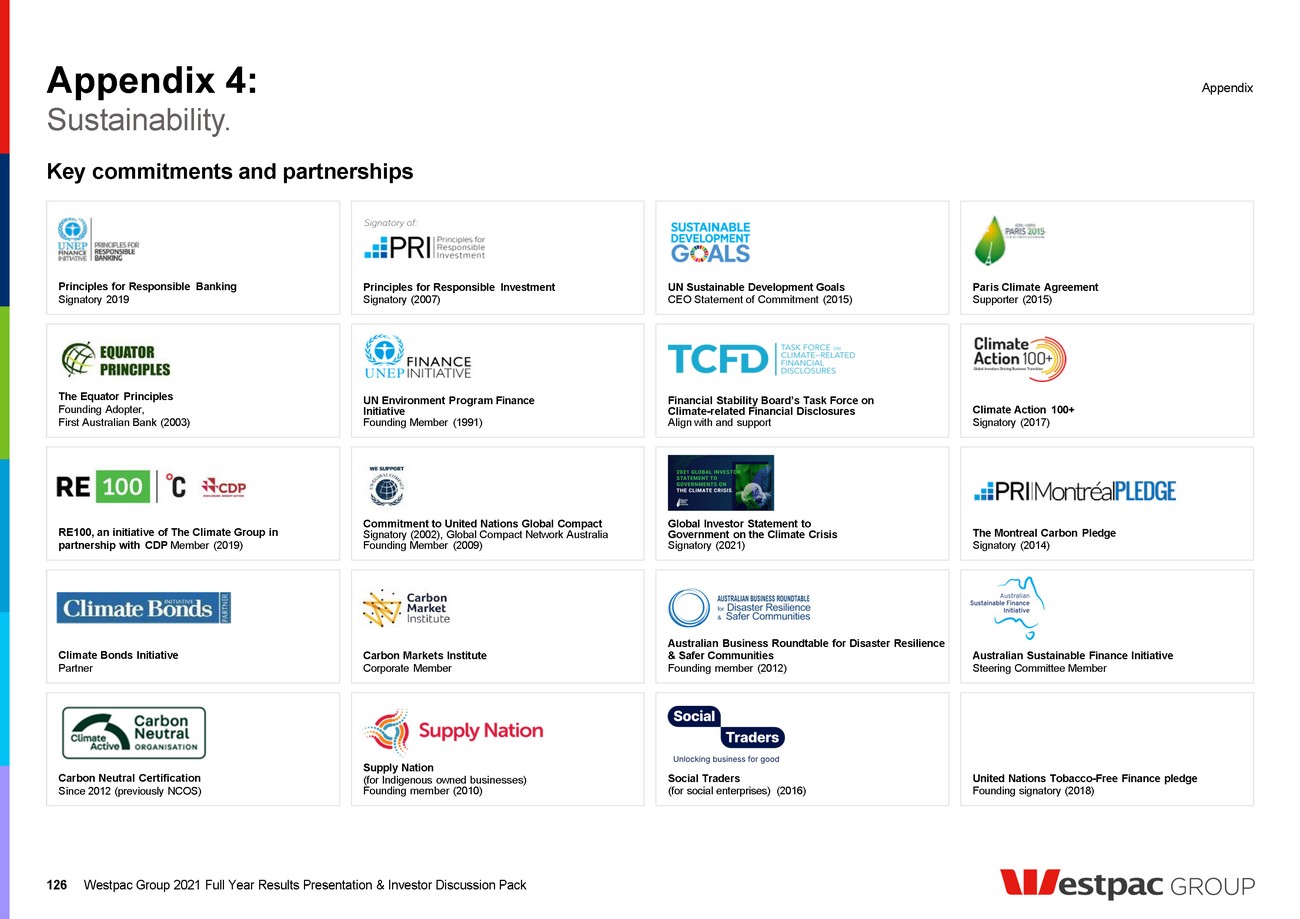
| Appendix 5: 127 Definitions – Credit quality. Appendix 90 days past due and not impaired Includes facilities where: • contractual payments of interest and / or principal are 90 or more calendar days overdue, including overdrafts or other revolving facilities that remain continuously outside approved limits by material amounts for 90 or more calendar days (including accounts for customers who have been granted hardship assistance); or • an order has been sought for the customer’s bankruptcy or similar legal action has been instituted which may avoid or delay repayment of its credit obligations; and • the estimated net realisable value of assets / security to which Westpac has recourse is sufficient to cover repayment of all principal and interest, or where there are otherwise reasonable grounds to expect payment in full and interest is being taken to profit on an accrual basis. These facilities, while in default, are not treated as impaired for accounting purposes Provision for expected credit losses (ECL) Expected credit losses (ECL) are a probability-weighted estimate of the cash shortfalls expected to result from defaults over the relevant timeframe. They are determined by evaluating a range of possible outcomes and taking into account the time value of money, past events, current conditions and future economic conditions Collectively assessed provisions (CAPs) CAPs for expected credit loss under AASB 9 represent the Expected Credit Loss (ECL) which is collectively assessed in pools of similar assets with similar risk characteristics. This incorporates forward looking information and does not require an actual loss event to have occurred for an impairment provision to be recognised Individually assessed provisions (IAPs) Provisions raised for losses that are known to be impaired and are assessed on an individual basis. The estimated losses on these impaired loans is based on expected future cash flows discounted to their present value and, as this discount unwinds, interest will be recognised in the income statement Stage 1: 12 months ECL – performing For financial assets where there has been no significant increase in credit risk since origination a provision for 12 months expected credit losses is recognised. Interest revenue is calculated on the gross carrying amount of the financial asset Stage 2: Lifetime ECL – performing For financial assets where there has been a significant increase in credit risk since origination but where the asset is still performing a provision for lifetime expected losses is recognised. Interest revenue is calculated on the gross carrying amount of the financial asset Stage 3 Lifetime ECL – non-performing For financial assets that are non-performing a provision for lifetime expected losses is recognised. Interest revenue is calculated on the carrying amount net of the provision for ECL rather than the gross carrying amount Impaired assets Includes exposures that have deteriorated to the point where full collection of interest and principal is in doubt, based on an assessment of the customer’s outlook, cashflow, and the net realisation of value of assets to which recourse is held: • facilities 90 days or more past due, and full recovery is in doubt: exposures where contractual payments are 90 or more days in arrears and the net realisable value of assets to which recourse is held may not be sufficient to allow full collection of interest and principal, including overdrafts or other revolving facilities that remain continuously outside approved limits by material amounts for 90 or more calendar days; • non-accrual facilities: exposures with individually assessed impairment provisions held against them, excluding restructured loans; • restructured assets: exposures where the original contractual terms have been formally modified to provide for concessions of interest or principal for reasons related to the financial difficulties of the customer; • other assets acquired through security enforcement (includes other real estate owned): includes the value of any other assets acquired as full or partial settlement of outstanding obligations through the enforcement of security arrangements; and • any other facility where the full collection of interest and principal is in doubt Stressed exposures Watchlist and substandard, 90 days past due and not impaired and impaired exposures. Stressed exposures do not include stressed exposures which are on an active COVID-19 deferral package as of 30 September 2020 Total committed exposures (TCE) Represents the sum of the committed portion of direct lending (including funds placement overall and deposits placed), contingent and pre-settlement risk plus the committed portion of secondary market trading and underwriting risk Watchlist and substandard Loan facilities where customers are experiencing operating weakness and financial difficulty but are not expected to incur loss of interest or principal Westpac Group 2021 Full Year Results Presentation & Investor Discussion Pack |
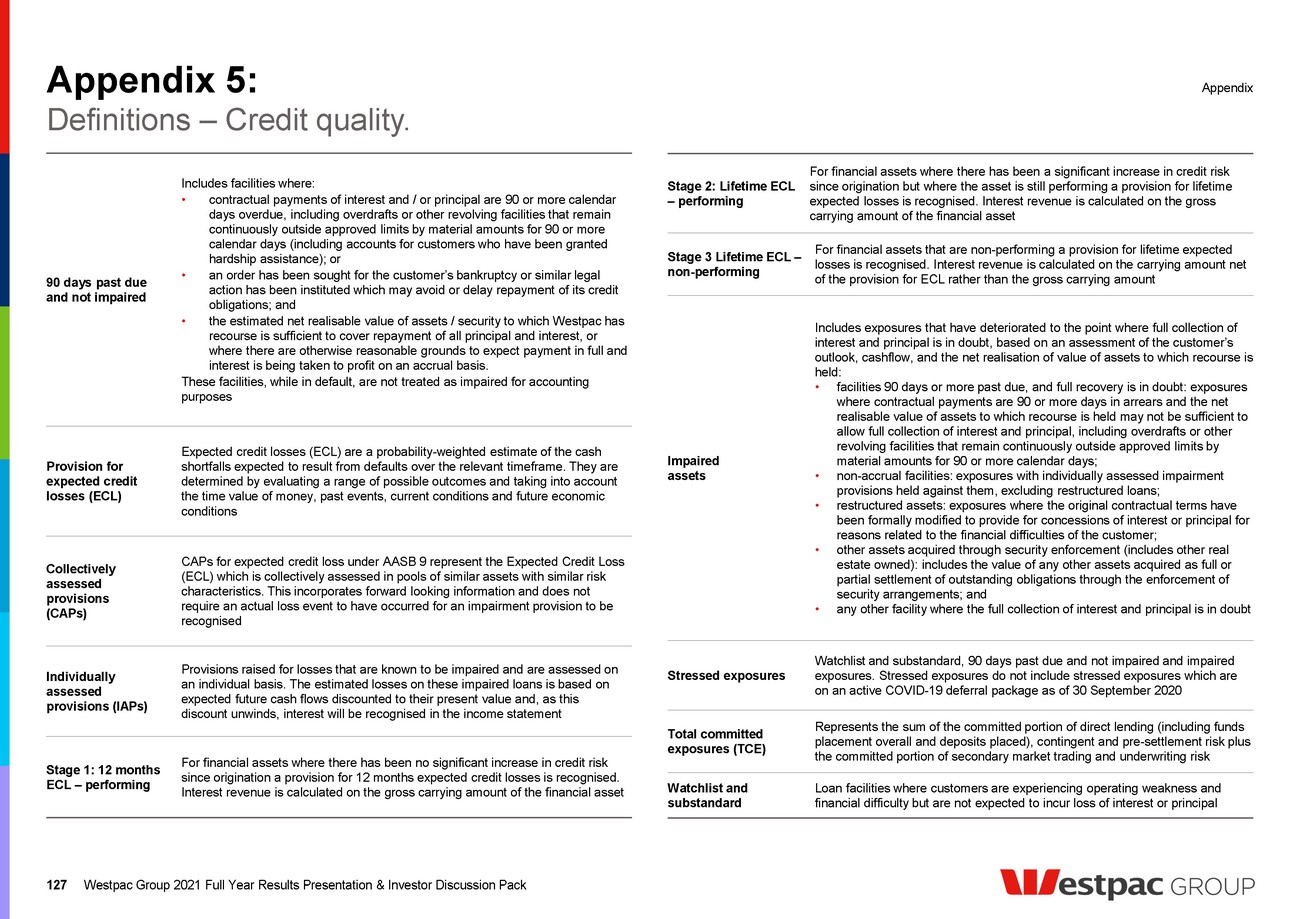
| Appendix 5: 128 Definitions – Divisions, earnings drivers, capital and liquidity. Appendix Capital and liquidity Capital ratios As defined by APRA (unless stated otherwise) Committed liquidity facility (CLF) The RBA makes available to Australian Authorised Deposit-taking Institutions a CLF that, subject to qualifying conditions, can be accessed to meet LCR requirements under APS210 Liquidity. In September 2021, APRA announced it expects locally-incorporated ADIs subject to the LCR to reduce their reliance on the CLF to zero by the end of 2022 subject to financial market conditions. High quality liquid assets (HQLA) Assets which meet APRA’s criteria for inclusion as HQLA in the numerator of the LCR Internationally comparable ratios Internationally comparable regulatory capital ratios are Westpac’s estimated ratios after adjusting the capital ratios determined under APRA Basel III regulations for various items. Analysis aligns with the APRA study titled “International capital comparison study” dated 13 July 2015 Leverage ratio As defined by APRA (unless stated otherwise). Tier 1 capital divided by ‘exposure measure’ and expressed as a percentage. ‘Exposure measure’ is the sum of on- balance sheet exposures, derivative exposures, securities financing transaction exposures and other off-balance sheet exposures Liquidity coverage ratio (LCR) An APRA requirement to maintain an adequate level of unencumbered high quality liquid assets, to meet liquidity needs for a 30 calendar day period under an APRA- defined severe stress scenario. Absent a situation of financial stress, the value of the LCR must not be less than 100%, effective 1 January 2015. LCR is calculated as the percentage ratio of stock of HQLA and CLF over the total net cash out-flows in a modelled 30 day defined stressed scenario Net stable funding ratio (NSFR) The NSFR is defined as the ratio of the amount of available stable funding (ASF) to the amount of required stable funding (RSF) defined by APRA. The amount of ASF is the portion of an ADI’s capital and liabilities expected to be a reliable source of funds over a one year time horizon. The amount of RSF is a function of the liquidity characteristics and residual maturities of an ADI’s assets and off-balance sheet activities. ADI’s must maintain an NSFR of at least 100% Risk weighted assets or RWA Assets (both on and off-balance sheet) are risk weighted according to each asset’s inherent potential for default and what the likely losses would be in case of default. In the case of non-asset-backed risks (ie. market and operational risk), RWA is determined by multiplying the capital requirements for those risks by 12.5 Westpac Group 2021 Full Year Results Presentation & Investor Discussion Pack Divisions Consumer Consumer provides banking products and services to Australian personal customers, including mortgages, credit cards, personal loans, and savings and deposit products Business Business serves the banking needs of Australian SME and Commercial customers (including Agribusiness) and provides banking and advisory services to high net worth individuals through Private Wealth WIB Westpac Institutional Bank (WIB) provides a broad range of financial products and services to corporate, institutional and government customers Westpac NZ Westpac New Zealand provides banking, wealth and insurance products and services for consumer, business and institutional customers in New Zealand Specialist Businesses Specialist Businesses comprises the operations that Westpac ultimately plans to exit with agreements in place for the sale of Westpac Life Insurance and motor vehicle finance (Auto Finance) businesses. These sales are expected to finalise in 2022, subject to regulatory approvals. Other operations include investment product and services (including margin lending and equities broking), superannuation and retirement products as well as wealth administration platforms. It also manages Westpac Pacific which provides a full range of banking services in Fiji and Papua New Guinea. The division operates under the Westpac, St.George, BankSA, Bank of Melbourne, and BT brands. Specialist Businesses works with Consumer, Business and WIB in the provision of select financial services and products Group Businesses or GB Group Businesses includes the results of unallocated support functions such as Treasury, Technology and Operations, and Core Support. It also includes Group-wide elimination entries arising on consolidation, centrally raised provisions and other unallocated revenue and expenses Earnings drivers Average interest- earning assets (AIEA) The average balance of assets held by the Group that generate interest income. Where possible, daily balances are used to calculate the average balance for the period Cash earnings per ordinary share Cash earnings divided by the weighted average ordinary shares (cash earnings basis) Core earnings Net operating income less operating expenses Full-time equivalent employees (FTE) A calculation based on the number of hours worked by full and part-time employees as part of their normal duties. For example, the full-time equivalent of one FTE is 76 hours paid work per fortnight |
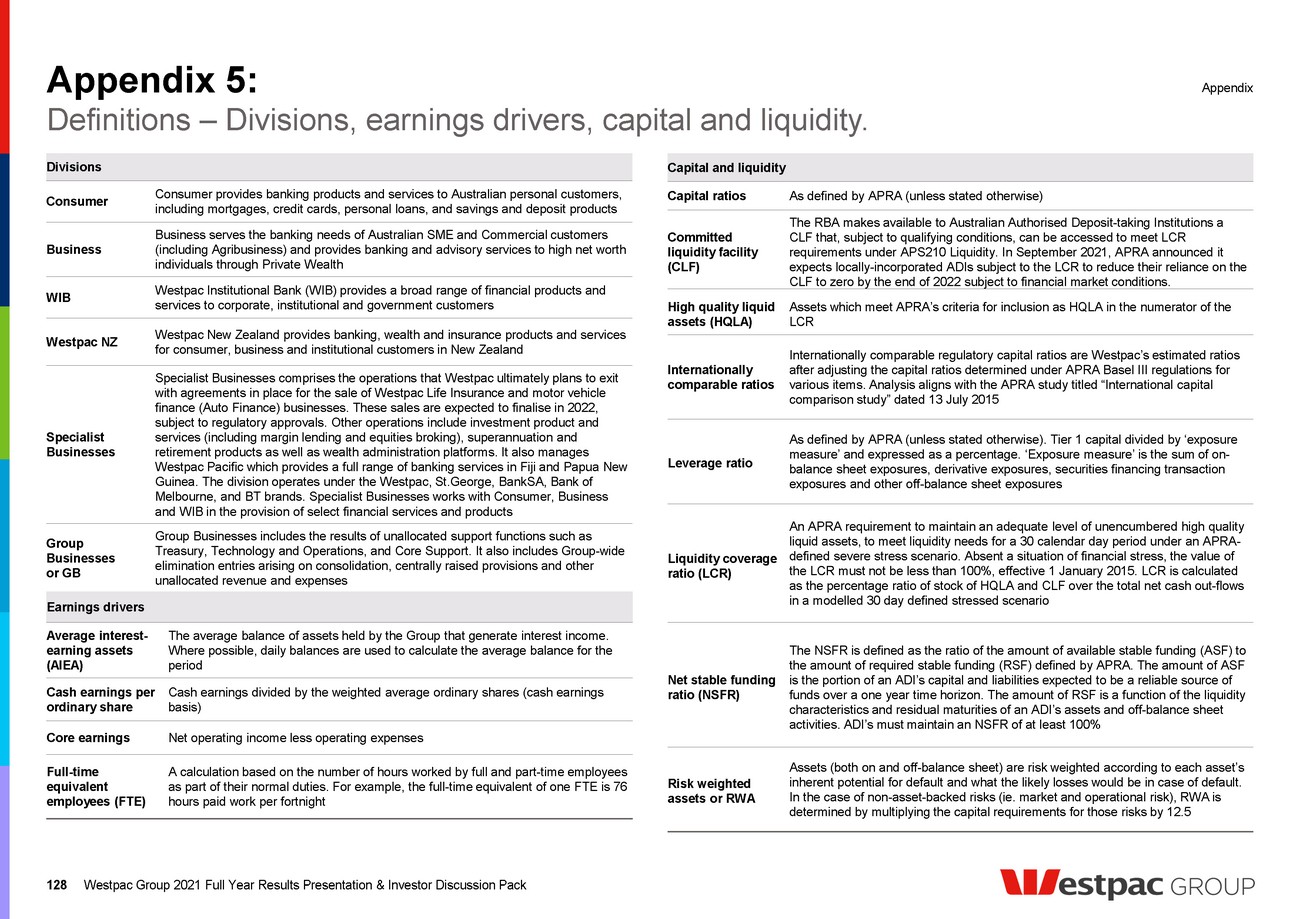
| Appendix 5: 129 Definitions – Other. Appendix Branch transactions Branch transactions are typically withdrawals, deposits, transfers and payments Customer satisfaction or CSat The Customer Satisfaction score is an average of customer satisfaction ratings of the customer’s main financial institution for consumer or business banking on a scale of 0 to 10 (0 means ‘extremely dissatisfied’ and 10 means ‘extremely satisfied’) CSAT (Main Bank Service Satisfaction) (Westpac NZ) Source: 3 month rolling Retail Market Monitor data (survey conducted by Camorra Research). Respondents are asked to rate the overall level of service they receive from their main bank (self-selected which ONE bank is their main provider of financial services) on a scale of 1 (Poor) to 5 (Excellent). The rating represents % of respondents who scored 4 (Very Good) or 5 (Excellent) CSat – overall consumer Source: DBM Consultants Consumer Atlas, February 2019 – August 2021, 6MMA. MFI customers CSat – overall business Source: DBM Consultants Business Atlas, February 2019 – August 2021, 6MMA. MFI customers, all businesses CSat – SME Source: DBM Consultants Business Atlas, 6 months to September 2020, February 2021 and August 2021. MFI customers, Total SME businesses. Total SME businesses are those organisations with annual turnover under $5 million (excluding Agribusinesses) Digitally active Australian consumer and business customers who have had an authenticated session (including Quickzone) on Westpac Group digital banking platforms in the prior 90 days Digital sales Sales refers to digital sales of consumer core products only. Sales with a funded deposit or activation constitute a quality sale Digital transactions Digital transactions including payment and transfers that occur on Westpac Live and Compass platforms (excludes payments on other platforms such as Corporate Online and Business Banking Online) MFI share MFI share results are based on the number of customers who have a Main Financial Institution (MFI) relationship with an institution, as a proportion of the number of customers that have a MFI relationship with any institution Consumer MFI share Source: DBM Consultants Consumer Atlas, 6 months to August 2021. MFI Banking Group customers Net Promoter Score or NPS Net Promoter Score measures the net likelihood of recommendation to others of the customer’s main financial institution for retail or business banking. Net Promoter Score SM is a trademark of Bain & Co Inc., Satmetrix Systems, Inc., and Mr Frederick Reichheld. Using a 11 point numerical scale where 10 is ‘Extremely likely’ and 0 is ‘Extremely unlikely’, Net Promoter Score is calculated by subtracting the percentage of Detractors (0-6) from the percentage of Promoters (9-10) NPS Agri (Westpac NZ) 6 month Agri Market Monitor data (survey conducted by Key Research). Respondents are asked about likelihood to recommend their main business bank to business colleagues, friends or family on a scale of 1 (extremely unlikely) to 10 (extremely likely). Net Promoter Score is represents % of Promoters (recommend score of 9 or 10) minus % of Detractors (recommend score of 1 to 6) NPS Business (Westpac NZ) Source: 6 month rolling Business Finance Monitor data (survey conducted by Kantar TNS among businesses with an annual turnover of $5 to $150 million). Respondents are asked about likelihood to recommend their main business bank to business colleagues and associates on a scale of 1 (extremely unlikely) to 10 (extremely likely). Net Promoter Score is represents % of Promoters (recommend score of 9 or 10) minus % of Detractors (recommend score of 1 to 6) NPS Consumer (Westpac NZ) Source: 3 month rolling Retail Market Monitor data (survey conducted by Camorra Research). Respondents are asked about likelihood to recommend their main bank to family and friends on a scale of 1 (extremely unlikely) to 10 (extremely likely). Net Promoter Score is represents % of Promoters (recommend score of 9 or 10) minus % of Detractors (recommend score of 1 to 6) NPS – overall consumer Source: DBM Consultants Consumer Atlas, February 2019 – August 2021, 6MMA. MFI customers NPS – overall business Source: DBM Consultants Business Atlas, February 2019 – August 2021, 6MMA. MFI customers, all businesses St.George (SGB) Brands SGB Brands (Consumer): St.George Bank, Bank of Melbourne, BankSA, RAMS, Dragondirect SGB Brands (Business): St.George Bank, Bank of Melbourne and BankSA Westpac Group 2021 Full Year Results Presentation & Investor Discussion Pack |
| For all shareholding enquiries relating to: • Address details and communication preferences • Instructions for dividends including: bank account, participation in the dividend reinvestment plan, or the dividend donation plan Investor Relations Contact Share Registry Contact For all matters relating to Westpac’s strategy, performance and results Westpac Group 2021 Full Year Results Presentation & Investor Discussion Pack 130 Contact us. Andrew Bowden Head of Investor Relations Louise Coughlan Head of Ratings Agencies and Analysis Arthur Petratos Manager, Shareholder Services Andrea Jaehne Director, Ratings Agencies and Analysis Jacqueline Boddy Head of Debt Investor Relations Neil Wesley Head of Institutional Investor Relations Alec Leithhead Manager, Investor Relations Rebecca Plackett Director, Corporate Reporting and ESG Contact us westpac@linkmarketservices.com.au investorcentre.linkmarketservices.com.au 1800 804 255 investorrelations@westpac.com.au westpac.com.au/investorcentre +61 2 8253 3143 Investor Relations Team. |
| Disclaimer The material contained in this presentation is intended to be general background information on Westpac Banking Corporation (Westpac) and its activities. The information is supplied in summary form and is therefore not necessarily complete. It is not intended that it be relied upon as advice to investors or potential investors, who should consider seeking independent professional advice depending upon their specific investment objectives, financial situation or particular needs. The material contained in this presentation may include information derived from publicly available sources that have not been independently verified. No representation or warranty is made as to the accuracy, completeness or reliability of the information. All amounts are in Australian dollars unless otherwise indicated. Unless otherwise noted, financial information in this presentation is presented on a cash earnings basis. Cash earnings is a non-GAAP measure. Refer to Westpac’s 2021 Full Year Financial Results (incorporating the requirements of Appendix 4E) for the twelve months ended 30 September 2021 available at www.westpac.com.au for details of the basis of preparation of cash earnings. Refer to page 38 for an explanation of cash earnings and Appendix 1 page 122 for a reconciliation of reported net profit to cash earnings. This presentation contains statements that constitute “forward-looking statements” within the meaning of Section 21E of the US Securities Exchange Act of 1934. Forward-looking statements are statements about matters that are not historical facts. Forward-looking statements appear in a number of places in this presentation and include statements regarding our intent, belief or current expectations with respect to our business and operations, macro and micro economic and market conditions, results of operations and financial condition, including, without limitation, future loan loss provisions, financial support to certain borrowers, indicative drivers, forecasted economic indicators and performance metric outcomes. We use words such as ‘will’, ‘may’, ‘expect’, ‘intend’, ‘seek’, ‘would’, ‘should’, ‘could’, ‘continue’, ‘plan’, ‘estimate’, ‘anticipate’, ‘believe’, ‘probability’, ‘risk’, ‘aim’, ‘outlook’, ‘forecast’ or other similar words to identify forward-looking statements. These forward-looking statements reflect our current views with respect to future events and are subject to change, certain risks, uncertainties and assumptions which are, in many instances, beyond our control, and have been made based upon management’s expectations and beliefs concerning future developments and their potential effect upon us. There can be no assurance that future developments will be in accordance with our expectations or that the effect of future developments on us will be those anticipated. Actual results could differ materially from those which we expect, depending on the outcome of various factors. Factors that may impact on the forward-looking statements made include, but are not limited to, those described in the section titled ‘Risk factors' in Westpac’s 2021 Annual Report available at westpac.com.au. When relying on forward-looking statements to make decisions with respect to us, investors and others should carefully consider such factors and other uncertainties and events. Except as required by law, we assume no obligation to update any forward-looking statements contained in this presentation, whether as a result of new information, future events or otherwise, after the date of this presentation. Disclaimer 131 Westpac Group 2021 Full Year Results Presentation & Investor Discussion Pack ,11estpac GROU P |