Exhibit 3
| 1Q22 Update Fix. Simplify. Perform. FOR THE 3 MONTHS ENDED 31 DECEMBER 2021 WESTPAC BANKING CORPORATION ABN 33 007 457 141 Financial results throughout this presentation are in Australian dollars and are based on cash earnings unless otherwise stated. Refer to page 14 for cash earnings definition. All results relating to 1Q22 are unaudited. This document should be read in conjunction with Westpac’s December 2021 Pillar 3 Report, incorporating the requirements of APS330. Results principally cover and compare the 1Q22 and 2H21 quarterly average periods unless otherwise stated. |

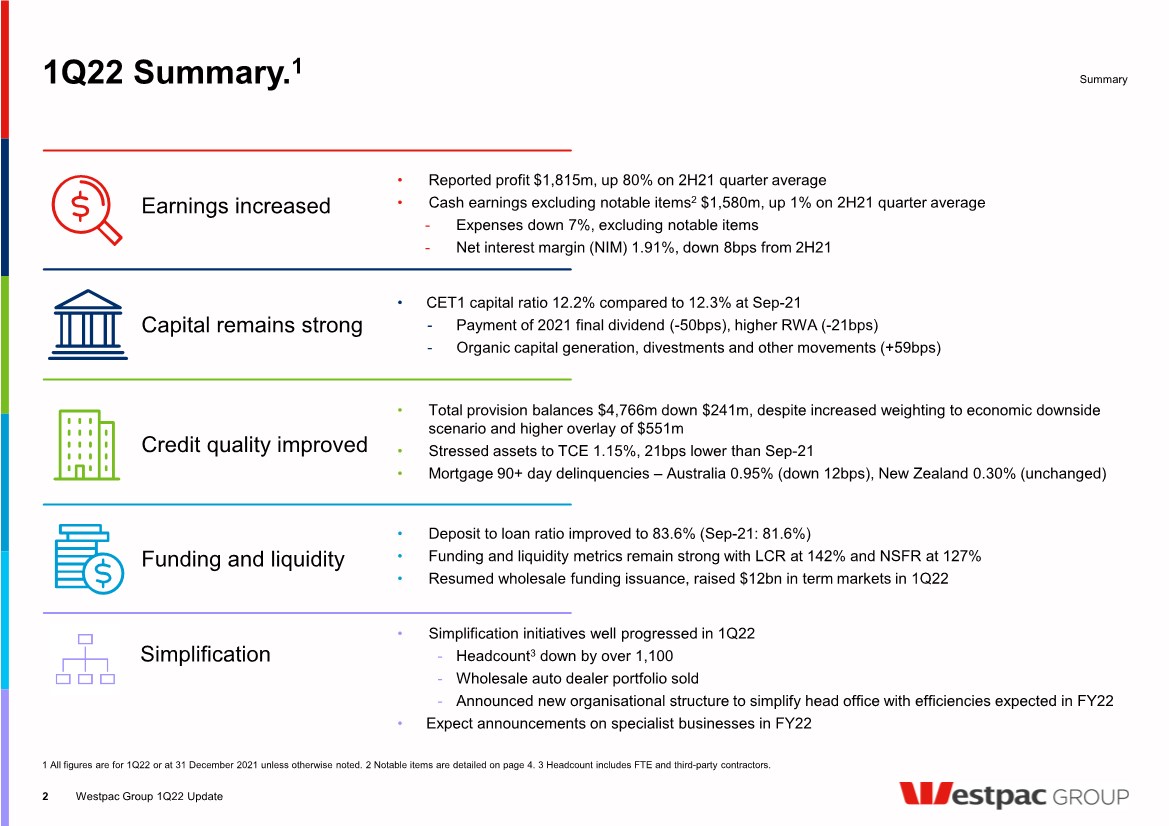
| 1Q22 Summary. 1 Summary • Total provision balances $4,766m down $241m, despite increased weighting to economic downside scenario and higher overlay of $551m • Stressed assets to TCE 1.15%, 21bps lower than Sep-21 • Mortgage 90+ day delinquencies – Australia 0.95% (down 12bps), New Zealand 0.30% (unchanged) • Reported profit $1,815m, up 80% on 2H21 quarter average • Cash earnings excluding notable items 2 $1,580m, up 1% on 2H21 quarter average - Expenses down 7%, excluding notable items - Net interest margin (NIM) 1.91%, down 8bps from 2H21 Credit quality improved Earnings increased Capital remains strong • CET1 capital ratio 12.2% compared to 12.3% at Sep-21 - Payment of 2021 final dividend (-50bps), higher RWA (-21bps) - Organic capital generation, divestments and other movements (+59bps) • Deposit to loan ratio improved to 83.6% (Sep-21: 81.6%) • Funding and liquidity metrics remain strong with LCR at 142% and NSFR at 127% • Resumed wholesale funding issuance, raised $12bn in term markets in 1Q22 Funding and liquidity Westpac Group 1Q22 Update 2 1 All figures are for 1Q22 or at 31 December 2021 unless otherwise noted. 2 Notable items are detailed on page 4. 3 Headcount includes FTE and third-party contractors. Simplification • Simplification initiatives well progressed in 1Q22 - Headcount 3 down by over 1,100 - Wholesale auto dealer portfolio sold - Announced new organisational structure to simplify head office with efficiencies expected in FY22 • Expect announcements on specialist businesses in FY22 |
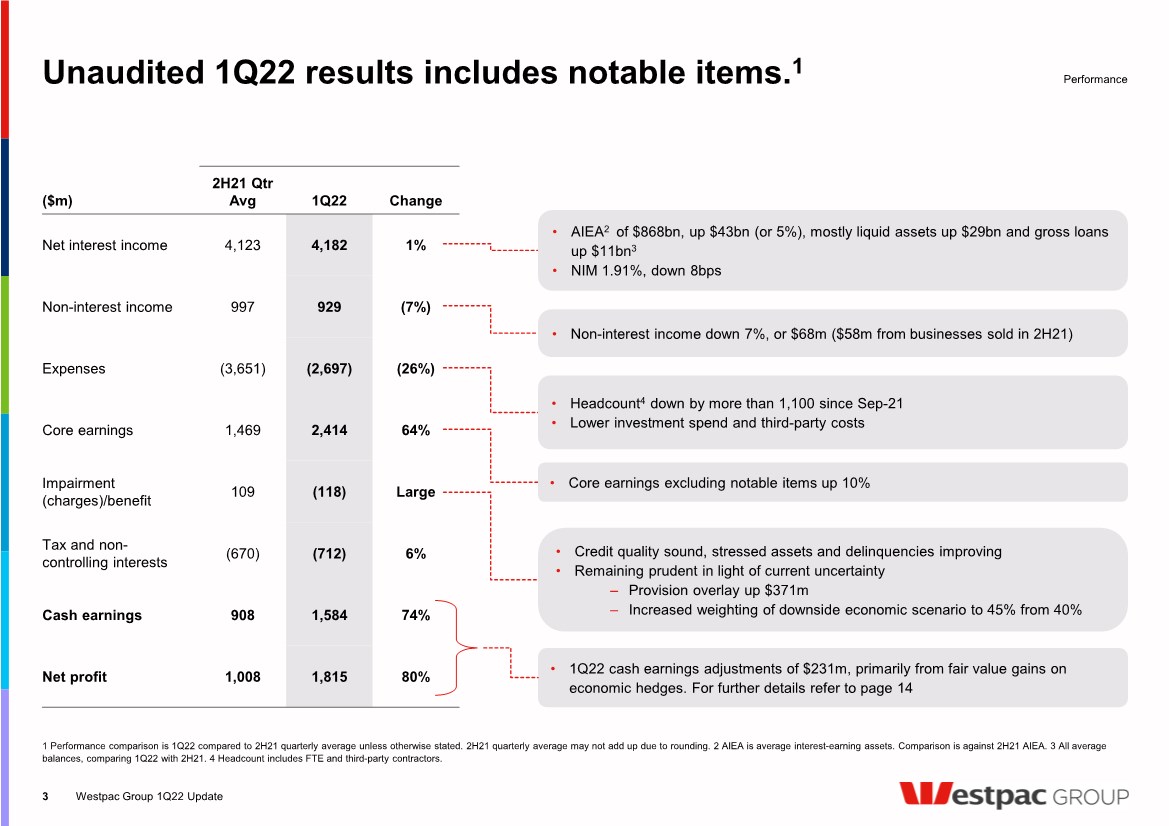
| ($m) 2H21 Qtr Avg 1Q22 Change Net interest income 4,123 4,182 1% Non-interest income 997 929 (7%) Expenses (3,651) (2,697) (26%) Core earnings 1,469 2,414 64% Impairment (charges)/benefit 109 (118) Large Tax and non- controlling interests (670) (712) 6% Cash earnings 908 1,584 74% Net profit 1,008 1,815 80% • Headcount 4 down by more than 1,100 since Sep-21 • Lower investment spend and third-party costs Unaudited 1Q22 results includes notable items. 1 1 Performance comparison is 1Q22 compared to 2H21 quarterly average unless otherwise stated. 2H21 quarterly average may not add up due to rounding. 2 AIEA is average interest-earning assets. Comparison is against 2H21 AIEA. 3 All average balances, comparing 1Q22 with 2H21. 4 Headcount includes FTE and third-party contractors. Performance Westpac Group 1Q22 Update 3 • AIEA 2 of $868bn, up $43bn (or 5%), mostly liquid assets up $29bn and gross loans up $11bn 3 • NIM 1.91%, down 8bps • Credit quality sound, stressed assets and delinquencies improving • Remaining prudent in light of current uncertainty ‒ Provision overlay up $371m ‒ Increased weighting of downside economic scenario to 45% from 40% • 1Q22 cash earnings adjustments of $231m, primarily from fair value gains on economic hedges. For further details refer to page 14 • Non-interest income down 7%, or $68m ($58m from businesses sold in 2H21) • Core earnings excluding notable items up 10% |
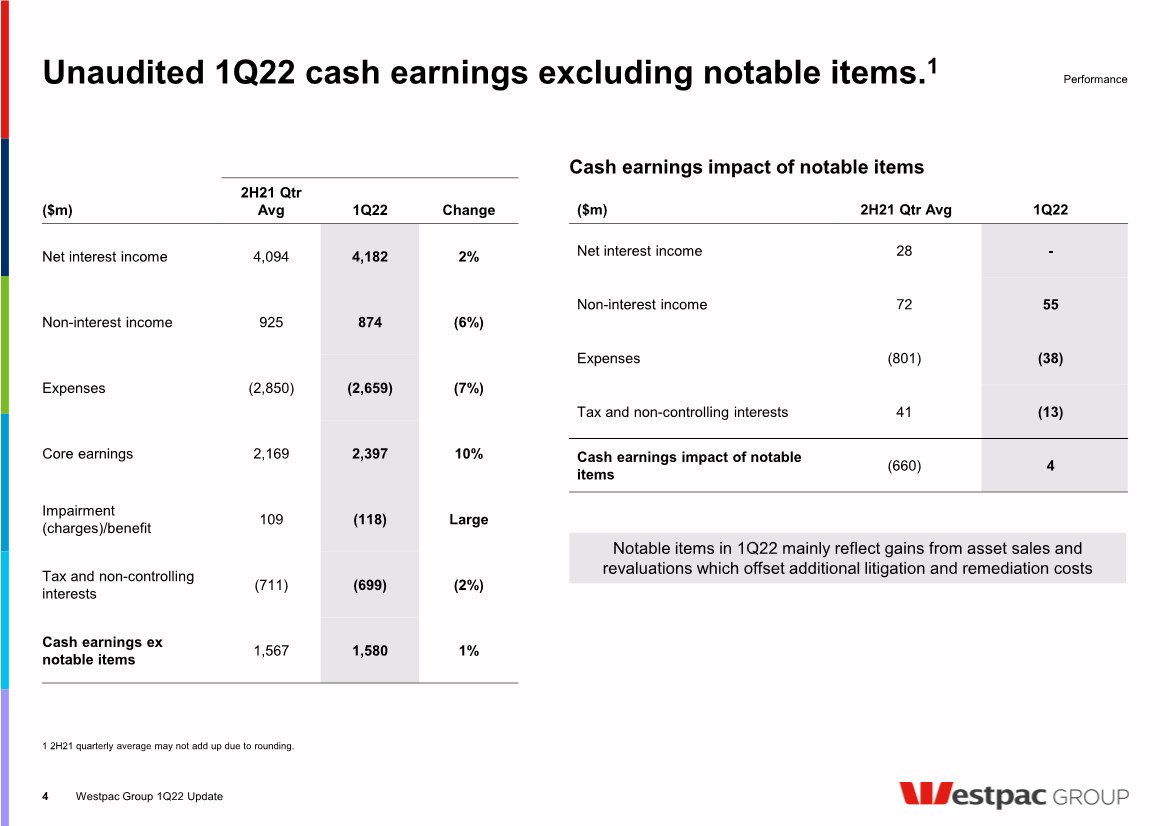
| Unaudited 1Q22 cash earnings excluding notable items.1 1 2H21 quarterly average may not add up due to rounding. Westpac Group 1Q22 Update 4 Performance ($m) 2H21 Qtr Avg 1Q22 Change Net interest income 4,094 4,182 2% Non-interest income 925 874 (6%) Expenses (2,850) (2,659) (7%) Core earnings 2,169 2,397 10% Impairment (charges)/benefit 109 (118) Large Tax and non-controlling interests (711) (699) (2%) Cash earnings ex notable items 1,567 1,580 1% ($m) 2H21 Qtr Avg 1Q22 Net interest income 28 - Non-interest income 72 55 Expenses (801) (38) Tax and non-controlling interests 41 (13) Cash earnings impact of notable items (660) 4 Cash earnings impact of notable items Notable items in 1Q22 mainly reflect gains from asset sales and revaluations which offset additional litigation and remediation costs |
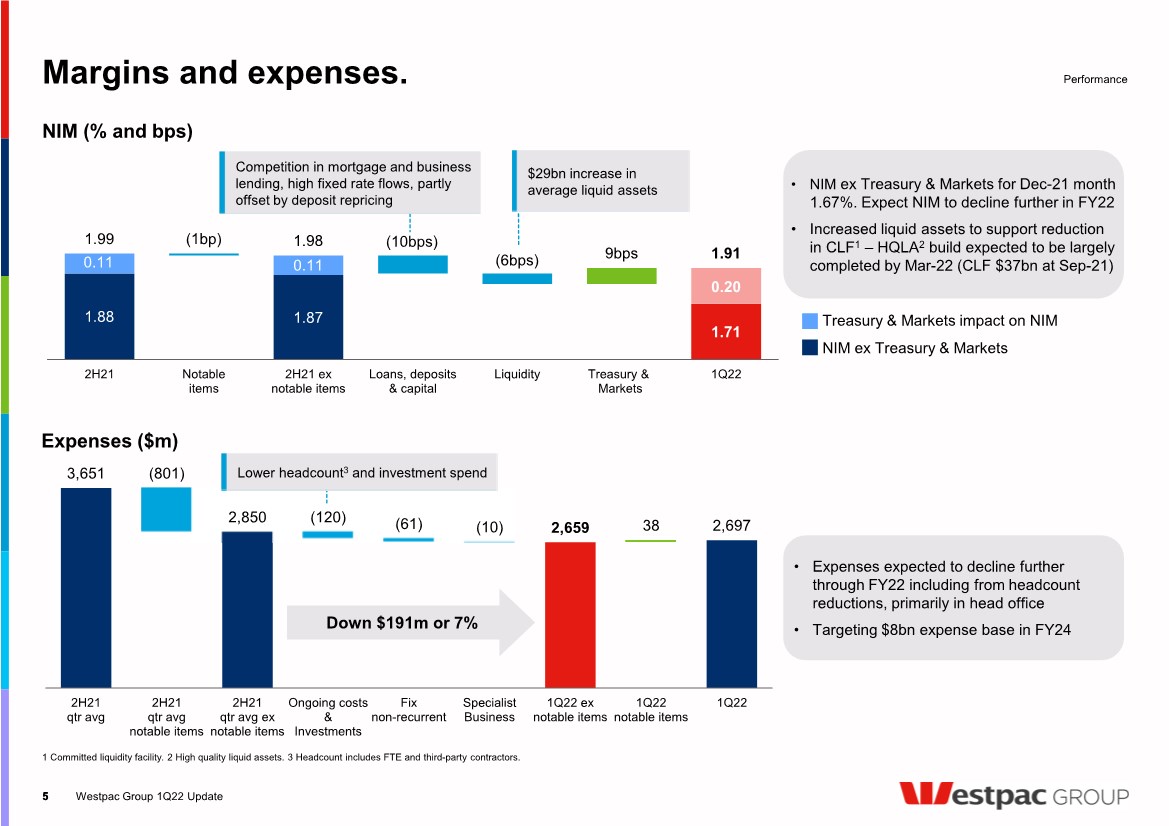
| 3,651 2,850 2,659 38 2,697 (801) (120) (61) (10) 2H21 qtr avg 2H21 qtr avg notable items 2H21 qtr avg ex notable items Ongoing costs & Investments Fix non-recurrent Specialist Business 1Q22 ex notable items 1Q22 notable items 1Q22 1.88 1.87 1.71 0.11 0.11 (10bps) (6bps) 0.20 1.99 (1bp) 1.98 9bps 1.91 2H21 Notable items 2H21 ex notable items Loans, deposits & capital Liquidity Treasury & Markets 1Q22 Margins and expenses. Westpac Group 1Q22 Update NIM (% and bps) 1 Committed liquidity facility. 2 High quality liquid assets. 3 Headcount includes FTE and third-party contractors. Performance 5 5 Competition in mortgage and business lending, high fixed rate flows, partly offset by deposit repricing $29bn increase in average liquid assets Down $191m or 7% • NIM ex Treasury & Markets for Dec-21 month 1.67%. Expect NIM to decline further in FY22 • Increased liquid assets to support reduction in CLF 1 – HQLA 2 build expected to be largely completed by Mar-22 (CLF $37bn at Sep-21) • Expenses expected to decline further through FY22 including from headcount reductions, primarily in head office • Targeting $8bn expense base in FY24 Lower headcount 3 and investment spend Treasury & Markets impact on NIM NIM ex Treasury & Markets Expenses ($m) |
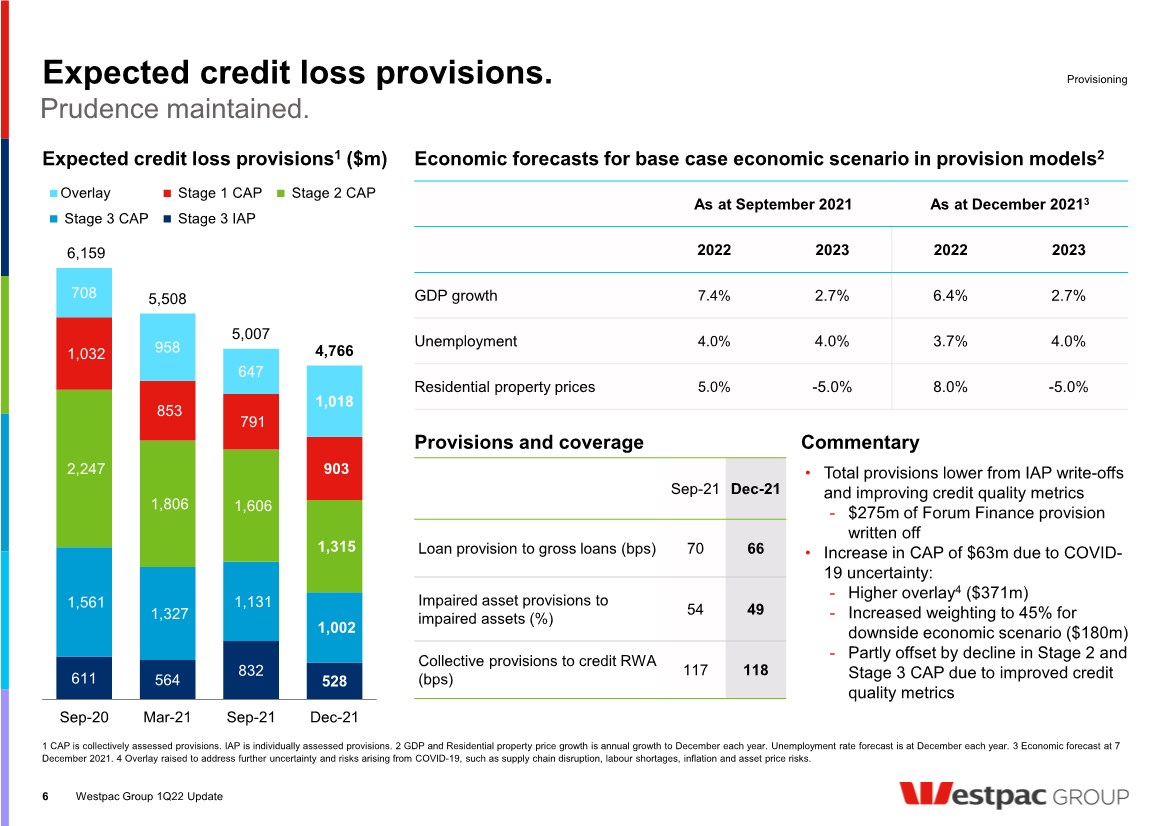
| Expected credit loss provisions. Westpac Group 1Q22 Update Expected credit loss provisions 1 ($m) Provisioning 6 As at September 2021 As at December 2021 3 2022 2023 2022 2023 GDP growth 7.4% 2.7% 6.4% 2.7% Unemployment 4.0% 4.0% 3.7% 4.0% Residential property prices 5.0% -5.0% 8.0% -5.0% Economic forecasts for base case economic scenario in provision models 2 Sep-21 Dec-21 Loan provision to gross loans (bps) 70 66 Impaired asset provisions to impaired assets (%) 54 49 Collective provisions to credit RWA (bps) 117 118 Provisions and coverage 1 CAP is collectively assessed provisions. IAP is individually assessed provisions. 2 GDP and Residential property price growth is annual growth to December each year. Unemployment rate forecast is at December each year. 3 Economic forecast at 7 December 2021. 4 Overlay raised to address further uncertainty and risks arising from COVID-19, such as supply chain disruption, labour shortages, inflation and asset price risks. • Total provisions lower from IAP write-offs and improving credit quality metrics - $275m of Forum Finance provision written off • Increase in CAP of $63m due to COVID- 19 uncertainty: - Higher overlay 4 ($371m) - Increased weighting to 45% for downside economic scenario ($180m) - Partly offset by decline in Stage 2 and Stage 3 CAP due to improved credit quality metrics Commentary 611 564 832 528 1,561 1,327 1,131 1,002 2,247 1,806 1,606 1,315 1,032 853 791 903 708 958 647 1,018 6,159 5,508 5,007 4,766 Sep-20 Mar-21 Sep-21 Dec-21 Overlay Stage 1 CAP Stage 2 CAP Stage 3 CAP Stage 3 IAP Prudence maintained. |
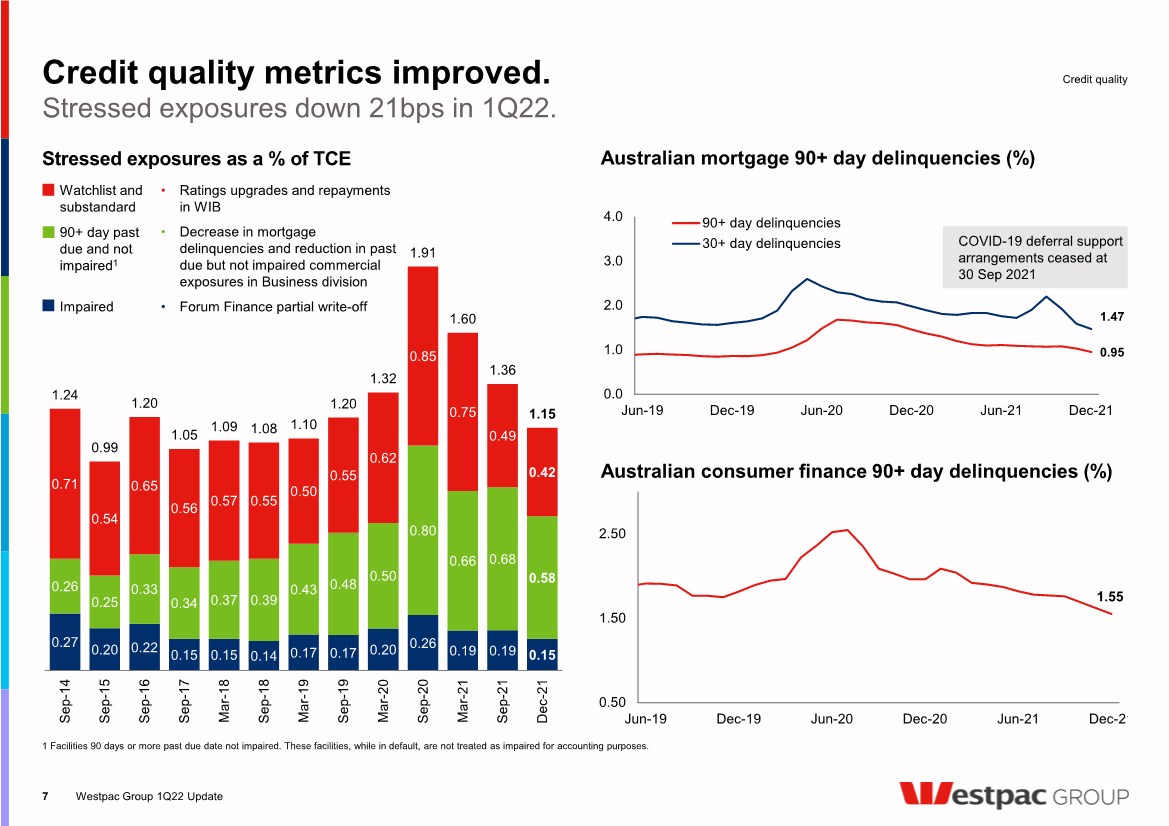
| 0.27 0.20 0.22 0.15 0.15 0.14 0.17 0.17 0.20 0.26 0.19 0.19 0.15 0.26 0.25 0.33 0.34 0.37 0.39 0.43 0.48 0.50 0.80 0.66 0.68 0.58 0.71 0.54 0.65 0.56 0.57 0.55 0.50 0.55 0.62 0.85 0.75 0.49 0.42 1.24 0.99 1.20 1.05 1.09 1.08 1.10 1.20 1.32 1.91 1.60 1.36 1.15 Sep-14 Sep-15 Sep-16 Sep-17 Mar-18 Sep-18 Mar-19 Sep-19 Mar-20 Sep-20 Mar-21 Sep-21 Dec-21 Watchlist and substandard • Ratings upgrades and repayments in WIB 90+ day past due and not impaired 1 • Decrease in mortgage delinquencies and reduction in past due but not impaired commercial exposures in Business division Impaired • Forum Finance partial write-off Credit quality metrics improved. Westpac Group 1Q22 Update 7 1 Facilities 90 days or more past due date not impaired. These facilities, while in default, are not treated as impaired for accounting purposes. Stressed exposures as a % of TCE Credit quality Australian mortgage 90+ day delinquencies (%) Australian consumer finance 90+ day delinquencies (%) 1.55 0.50 1.50 2.50 Jun-19 Dec-19 Jun-20 Dec-20 Jun-21 Dec-21 0.95 1.47 0.0 1.0 2.0 3.0 4.0 Jun-19 Dec-19 Jun-20 Dec-20 Jun-21 Dec-21 90+ day delinquencies 30+ day delinquencies Stressed exposures down 21bps in 1Q22. COVID-19 deferral support arrangements ceased at 30 Sep 2021 |
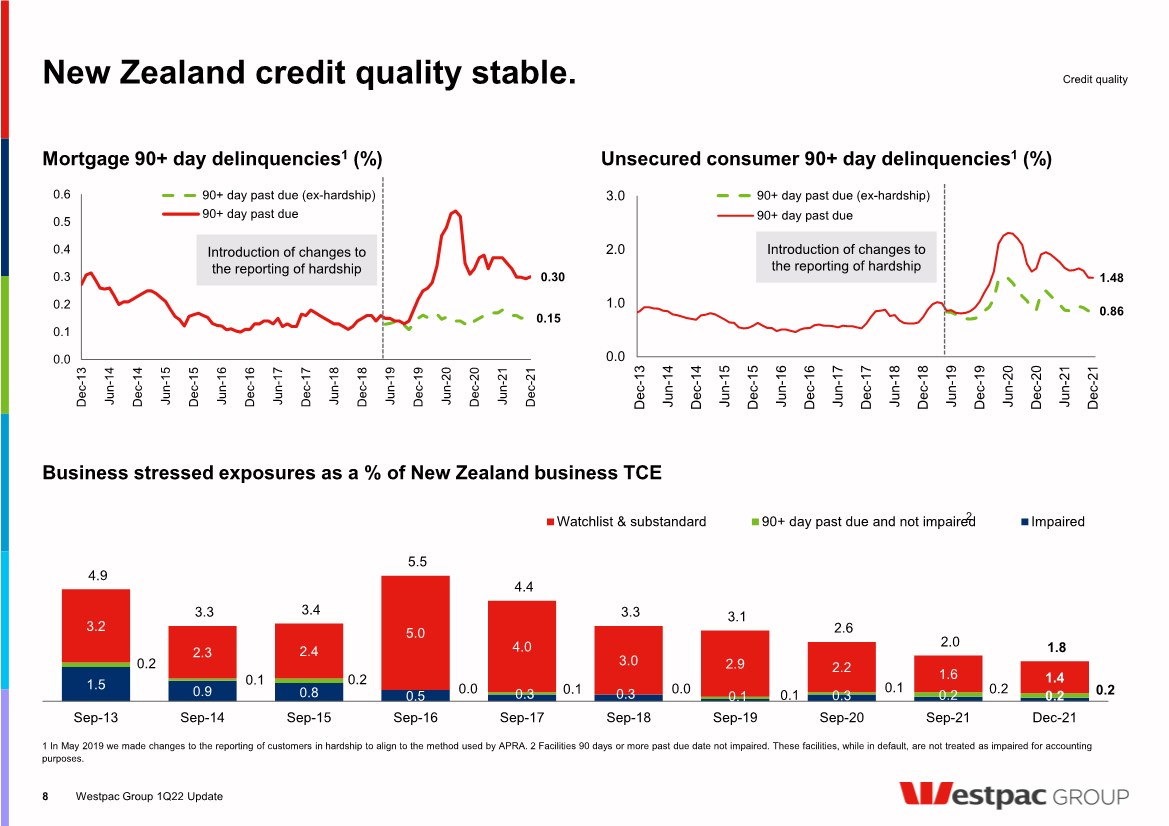
| 1.5 0.9 0.8 0.5 0.3 0.3 0.1 0.3 0.2 0.2 0.2 0.1 0.2 0.0 0.1 0.0 0.1 0.1 0.2 0.2 3.2 2.3 2.4 5.0 4.0 3.0 2.9 2.2 1.6 1.4 4.9 3.3 3.4 5.5 4.4 3.3 3.1 2.6 2.0 1.8 Sep-13 Sep-14 Sep-15 Sep-16 Sep-17 Sep-18 Sep-19 Sep-20 Sep-21 Dec-21 Watchlist & substandard 90+ day past due and not impaired Impaired New Zealand credit quality stable. Westpac Group 1Q22 Update Mortgage 90+ day delinquencies 1 (%) Unsecured consumer 90+ day delinquencies 1 (%) Business stressed exposures as a % of New Zealand business TCE 1 In May 2019 we made changes to the reporting of customers in hardship to align to the method used by APRA. 2 Facilities 90 days or more past due date not impaired. These facilities, while in default, are not treated as impaired for accounting purposes. 8 Credit quality 0.86 1.48 0.0 1.0 2.0 3.0 Dec-13 Jun-14 Dec-14 Jun-15 Dec-15 Jun-16 Dec-16 Jun-17 Dec-17 Jun-18 Dec-18 Jun-19 Dec-19 Jun-20 Dec-20 Jun-21 Dec-21 90+ day past due (ex-hardship) 90+ day past due 0.15 0.30 0.0 0.1 0.2 0.3 0.4 0.5 0.6 Dec-13 Jun-14 Dec-14 Jun-15 Dec-15 Jun-16 Dec-16 Jun-17 Dec-17 Jun-18 Dec-18 Jun-19 Dec-19 Jun-20 Dec-20 Jun-21 Dec-21 90+ day past due (ex-hardship) 90+ day past due Introduction of changes to the reporting of hardship Introduction of changes to the reporting of hardship 2 |
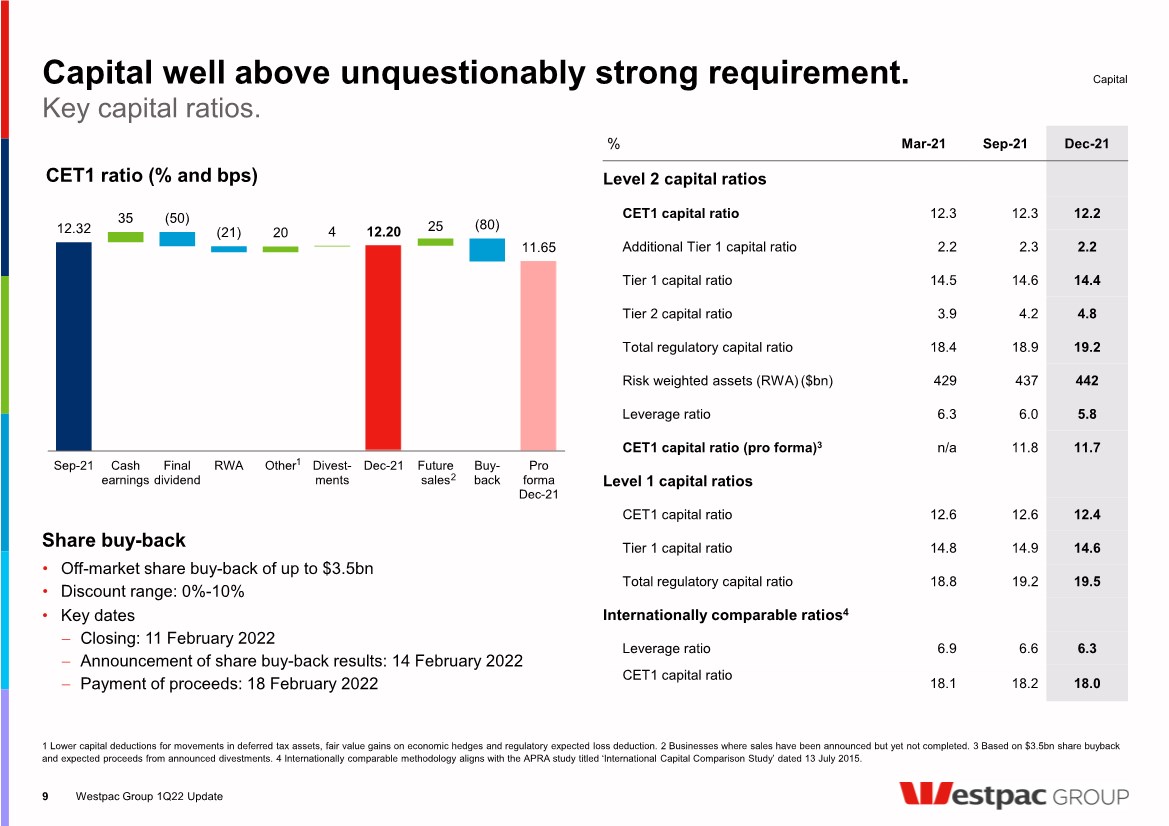
| Capital well above unquestionably strong requirement. Westpac Group 1Q22 Update 9 Key capital ratios. % Mar-21 Sep-21 Dec-21 Level 2 capital ratios CET1 capital ratio 12.3 12.3 12.2 Additional Tier 1 capital ratio 2.2 2.3 2.2 Tier 1 capital ratio 14.5 14.6 14.4 Tier 2 capital ratio 3.9 4.2 4.8 Total regulatory capital ratio 18.4 18.9 19.2 Risk weighted assets (RWA) ($bn) 429 437 442 Leverage ratio 6.3 6.0 5.8 CET1 capital ratio (pro forma) 3 n/a 11.8 11.7 Level 1 capital ratios CET1 capital ratio 12.6 12.6 12.4 Tier 1 capital ratio 14.8 14.9 14.6 Total regulatory capital ratio 18.8 19.2 19.5 Internationally comparable ratios 4 Leverage ratio 6.9 6.6 6.3 CET1 capital ratio 18.1 18.2 18.0 Share buy-back • Off-market share buy-back of up to $3.5bn • Discount range: 0%-10% • Key dates Closing: 11 February 2022 Announcement of share buy-back results: 14 February 2022 Payment of proceeds: 18 February 2022 Capital 1 Lower capital deductions for movements in deferred tax assets, fair value gains on economic hedges and regulatory expected loss deduction. 2 Businesses where sales have been announced but yet not completed. 3 Based on $3.5bn share buyback and expected proceeds from announced divestments. 4 Internationally comparable methodology aligns with the APRA study titled ‘International Capital Comparison Study’ dated 13 July 2015. 25 12.32 35 20 4 12.20 11.65 (50) (21) (80) Sep-21 Cash earnings Final dividend RWA Other Divest- ments Dec-21 Future sales Buy- back Pro forma Dec-21 CET1 ratio (% and bps) 2 1 |
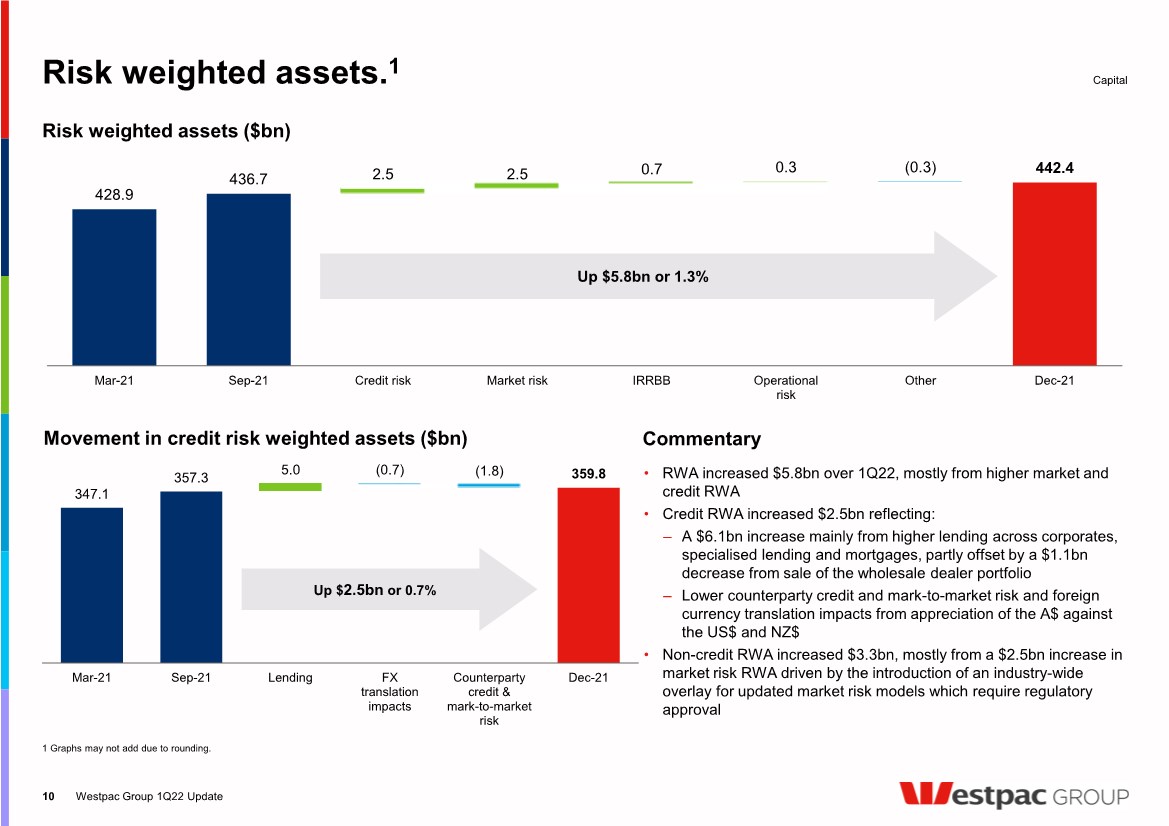
| 2.5 0.7 428.9 436.7 2.5 0.3 442.4 (0.3) Mar-21 Sep-21 Credit risk Market risk IRRBB Operational risk Other Dec-21 347.1 357.3 5.0 359.8 (0.7) (1.8) Mar-21 Sep-21 Lending FX translation impacts Counterparty credit & mark-to-market risk Dec-21 Risk weighted assets. 1 Westpac Group 1Q22 Update • RWA increased $5.8bn over 1Q22, mostly from higher market and credit RWA • Credit RWA increased $2.5bn reflecting: ‒ A $6.1bn increase mainly from higher lending across corporates, specialised lending and mortgages, partly offset by a $1.1bn decrease from sale of the wholesale dealer portfolio ‒ Lower counterparty credit and mark-to-market risk and foreign currency translation impacts from appreciation of the A$ against the US$ and NZ$ • Non-credit RWA increased $3.3bn, mostly from a $2.5bn increase in market risk RWA driven by the introduction of an industry-wide overlay for updated market risk models which require regulatory approval Up $5.8bn or 1.3% Risk weighted assets ($bn) Movement in credit risk weighted assets ($bn) Capital 10 Commentary 1 Graphs may not add due to rounding. Up $ 2.5bn or 0.7% |
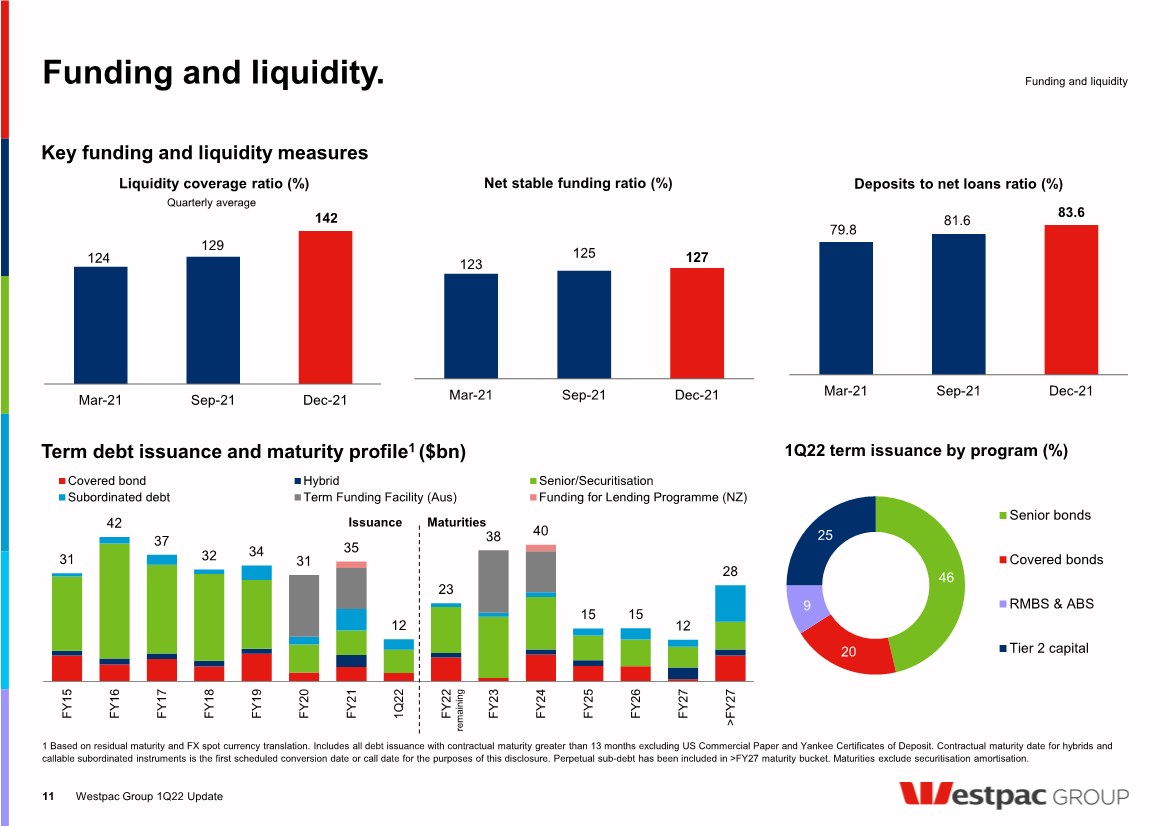
| 124 129 142 Mar-21 Sep-21 Dec-21 79.8 81.6 83.6 Mar-21 Sep-21 Dec-21 31 42 37 32 34 31 35 12 23 38 40 15 15 12 28 FY15 FY16 FY17 FY18 FY19 FY20 FY21 1Q22 FY22 FY23 FY24 FY25 FY26 FY27 >FY27 Covered bond Hybrid Senior/Securitisation Subordinated debt Term Funding Facility (Aus) Funding for Lending Programme (NZ) Funding and liquidity. Westpac Group 1Q22 Update Funding and liquidity 11 1 Based on residual maturity and FX spot currency translation. Includes all debt issuance with contractual maturity greater than 13 months excluding US Commercial Paper and Yankee Certificates of Deposit. Contractual maturity date for hybrids and callable subordinated instruments is the first scheduled conversion date or call date for the purposes of this disclosure. Perpetual sub-debt has been included in >FY27 maturity bucket. Maturities exclude securitisation amortisation. Term debt issuance and maturity profile 1 ($bn) Issuance Maturities Deposits to net loans ratio (%) Key funding and liquidity measures Quarterly average remaining 1Q22 term issuance by program (%) 46 20 9 25 Senior bonds Covered bonds RMBS & ABS Tier 2 capital 123 125 127 Mar-21 Sep-21 Dec-21 Net stable funding ratio (%) Liquidity coverage ratio (%) |
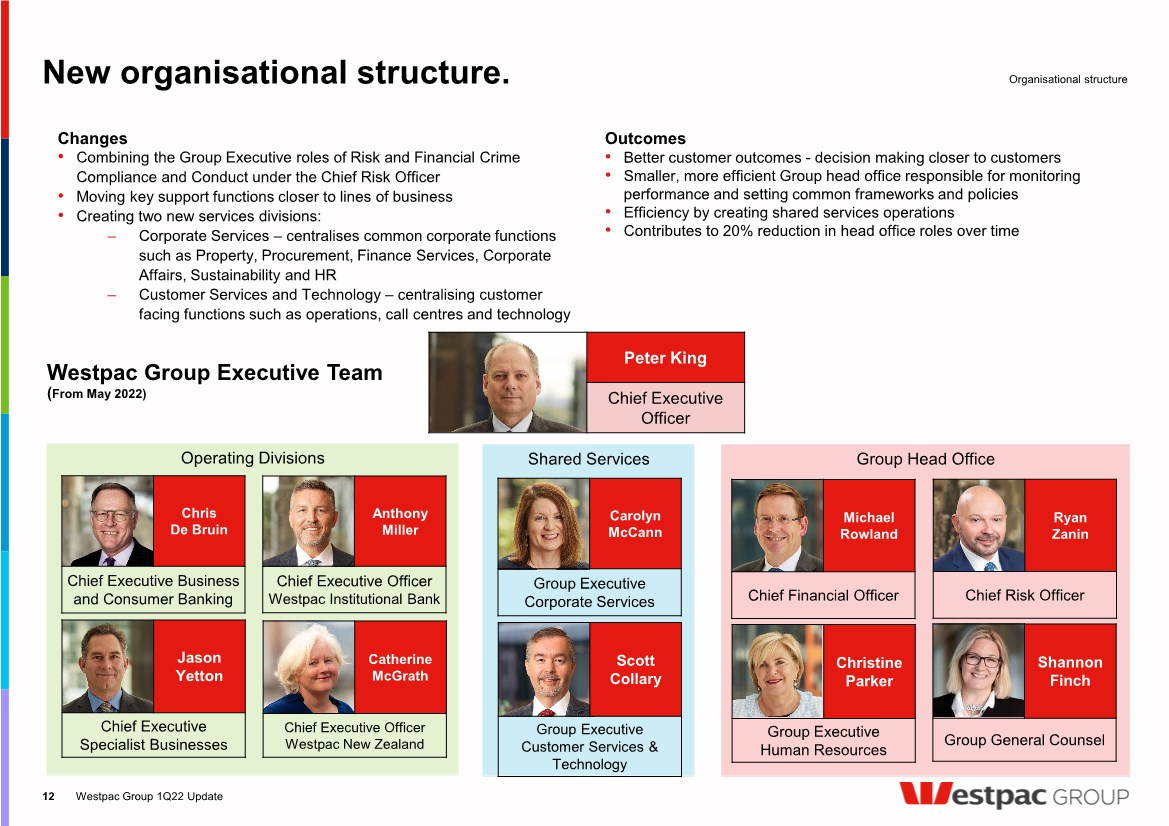
| Group Head Office Shared Services New organisational structure. 12 Changes • Combining the Group Executive roles of Risk and Financial Crime Compliance and Conduct under the Chief Risk Officer • Moving key support functions closer to lines of business • Creating two new services divisions: ‒ Corporate Services – centralises common corporate functions such as Property, Procurement, Finance Services, Corporate Affairs, Sustainability and HR ‒ Customer Services and Technology – centralising customer facing functions such as operations, call centres and technology Outcomes • Better customer outcomes - decision making closer to customers • Smaller, more efficient Group head office responsible for monitoring performance and setting common frameworks and policies • Efficiency by creating shared services operations • Contributes to 20% reduction in head office roles over time Organisational structure Shannon Finch Group General Counsel Scott Collary Group Executive Customer Services & Technology Carolyn McCann Group Executive Corporate Services Michael Rowland Chief Financial Officer Christine Parker Group Executive Human Resources Operating Divisions Jason Yetton Chief Executive Specialist Businesses Chris De Bruin Chief Executive Business and Consumer Banking Anthony Miller Chief Executive Officer Westpac Institutional Bank Catherine McGrath Chief Executive Officer Westpac New Zealand Peter King Chief Executive Officer Westpac Group Executive Team (From May 2022) Ryan Zanin Chief Risk Officer Westpac Group 1Q22 Update |
| Appendix Financial results throughout this presentation are in Australian dollars and are based on cash earnings unless otherwise stated. Refer to the 2021 Full Year Financial Results Presentation and Investor Discussion Pack for definition. All results relating to 1Q22 are on an unaudited basis. This document should be read in conjunction with Westpac’s December 2021 Pillar 3 Report, incorporating the requirements of APS330. Results principally cover and compare the 1Q22 and 2H21 quarterly average periods unless otherwise stated. |

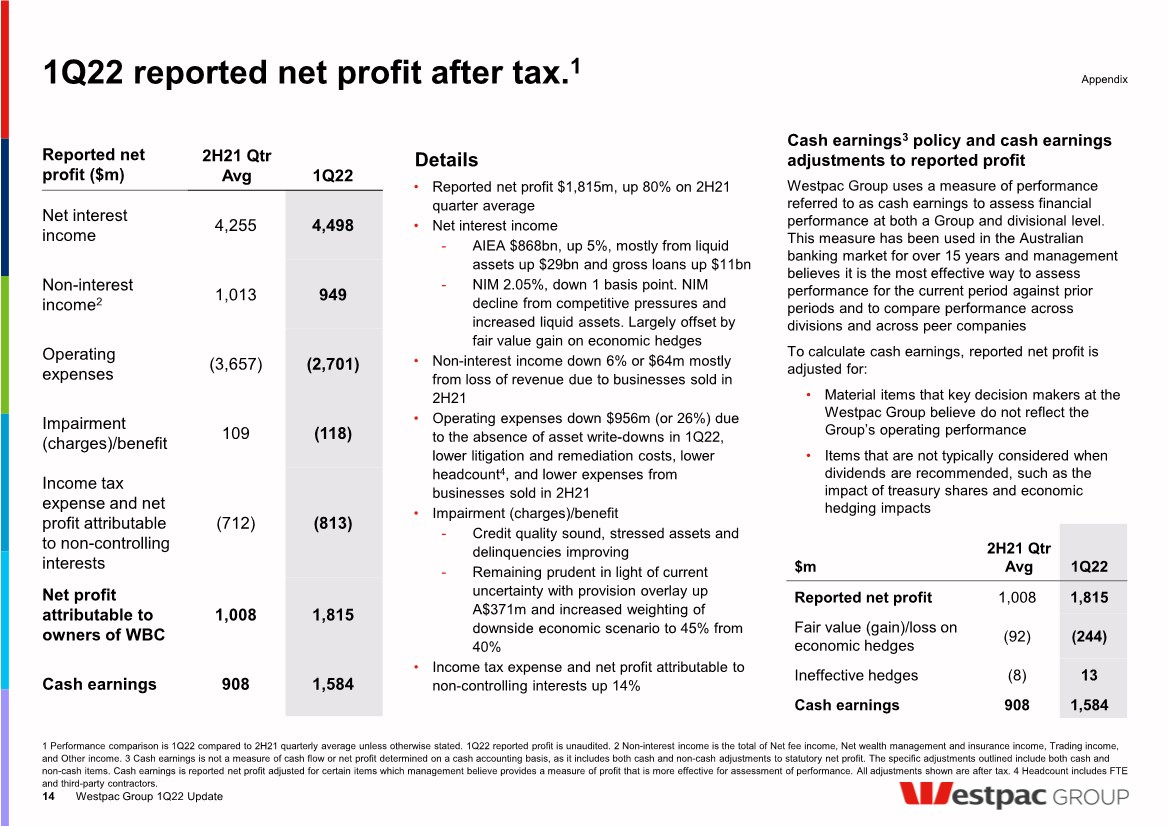
| 1Q22 reported net profit after tax. 1 Westpac Group 1Q22 Update 14 Details • Reported net profit $1,815m, up 80% on 2H21 quarter average • Net interest income - AIEA $868bn, up 5%, mostly from liquid assets up $29bn and gross loans up $11bn - NIM 2.05%, down 1 basis point. NIM decline from competitive pressures and increased liquid assets. Largely offset by fair value gain on economic hedges • Non-interest income down 6% or $64m mostly from loss of revenue due to businesses sold in 2H21 • Operating expenses down $956m (or 26%) due to the absence of asset write-downs in 1Q22, lower litigation and remediation costs, lower headcount 4, and lower expenses from businesses sold in 2H21 • Impairment (charges)/benefit - Credit quality sound, stressed assets and delinquencies improving - Remaining prudent in light of current uncertainty with provision overlay up A$371m and increased weighting of downside economic scenario to 45% from 40% • Income tax expense and net profit attributable to non-controlling interests up 14% Cash earnings 3 policy and cash earnings adjustments to reported profit Westpac Group uses a measure of performance referred to as cash earnings to assess financial performance at both a Group and divisional level. This measure has been used in the Australian banking market for over 15 years and management believes it is the most effective way to assess performance for the current period against prior periods and to compare performance across divisions and across peer companies To calculate cash earnings, reported net profit is adjusted for: • Material items that key decision makers at the Westpac Group believe do not reflect the Group’s operating performance • Items that are not typically considered when dividends are recommended, such as the impact of treasury shares and economic hedging impacts 1 Performance comparison is 1Q22 compared to 2H21 quarterly average unless otherwise stated. 1Q22 reported profit is unaudited. 2 Non-interest income is the total of Net fee income, Net wealth management and insurance income, Trading income, and Other income. 3 Cash earnings is not a measure of cash flow or net profit determined on a cash accounting basis, as it includes both cash and non-cash adjustments to statutory net profit. The specific adjustments outlined include both cash and non-cash items. Cash earnings is reported net profit adjusted for certain items which management believe provides a measure of profit that is more effective for assessment of performance. All adjustments shown are after tax. 4 Headcount includes FTE and third-party contractors. Appendix Reported net profit ($m) 2H21 Qtr Avg 1Q22 Net interest income 4,255 4,498 Non-interest income 2 1,013 949 Operating expenses (3,657) (2,701) Impairment (charges)/benefit 109 (118) Income tax expense and net profit attributable to non-controlling interests (712) (813) Net profit attributable to owners of WBC 1,008 1,815 Cash earnings 908 1,584 $m 2H21 Qtr Avg 1Q22 Reported net profit 1,008 1,815 Fair value (gain)/loss on economic hedges (92) (244) Ineffective hedges (8) 13 Cash earnings 908 1,584 |
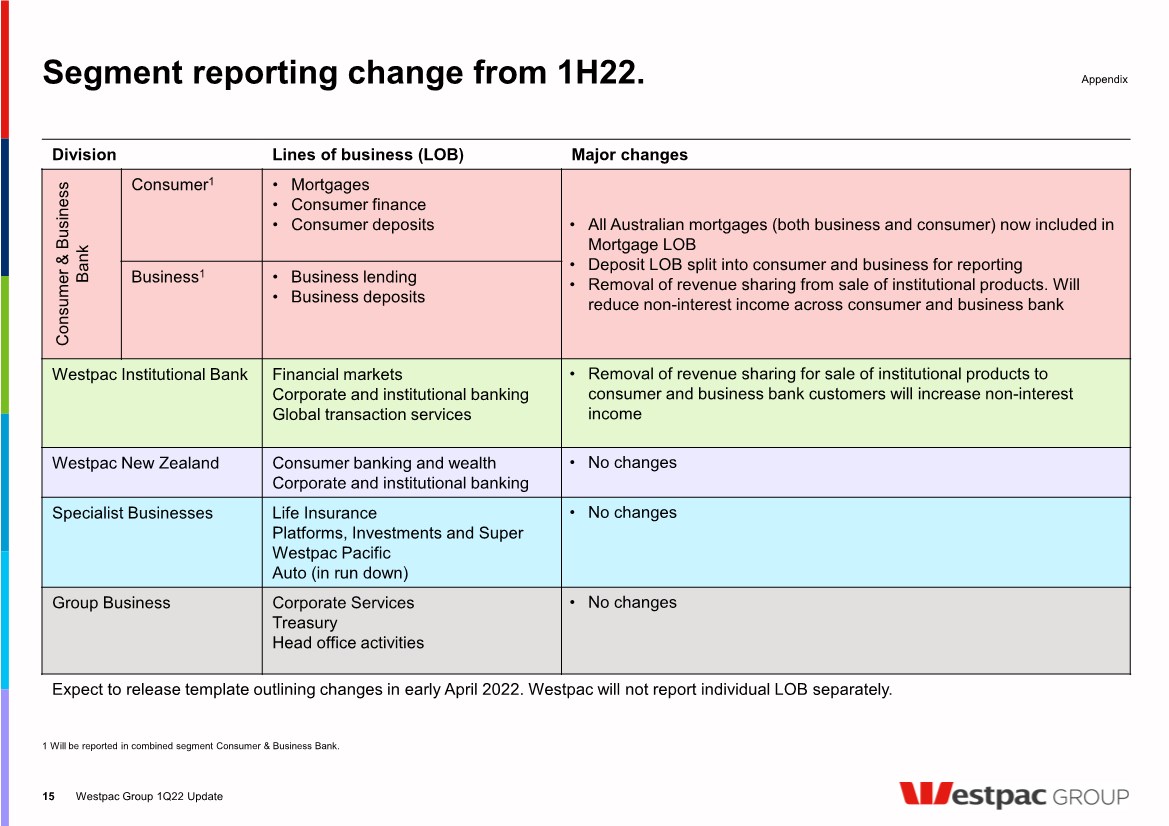
| Segment reporting change from 1H22. 1 Will be reported in combined segment Consumer & Business Bank. Westpac Group 1Q22 Update 15 Appendix Division Lines of business (LOB) Major changes Consumer & Business Bank Consumer 1 • Mortgages • Consumer finance • Consumer deposits • All Australian mortgages (both business and consumer) now included in Mortgage LOB • Deposit LOB split into consumer and business for reporting • Removal of revenue sharing from sale of institutional products. Will reduce non-interest income across consumer and business bank Business 1 • Business lending • Business deposits Westpac Institutional Bank Financial markets Corporate and institutional banking Global transaction services • Removal of revenue sharing for sale of institutional products to consumer and business bank customers will increase non-interest income Westpac New Zealand Consumer banking and wealth Corporate and institutional banking • No changes Specialist Businesses Life Insurance Platforms, Investments and Super Westpac Pacific Auto (in run down) • No changes Group Business Corporate Services Treasury Head office activities • No changes Expect to release template outlining changes in early April 2022. Westpac will not report individual LOB separately. |
| For all shareholding enquiries relating to: • Address details and communication preferences • Updating bank account details, and participation in the dividend reinvestment plan Investor Relations Contact Share Registry Contact For all matters relating to Westpac’s strategy, performance and results Westpac Group 1Q22 Update 16 Contact us. Andrew Bowden Head of Investor Relations Louise Coughlan Head of Ratings Agencies and Analysis Arthur Petratos Manager, Shareholder Services Andrea Jaehne Director, Ratings Agencies and Analysis Jacqueline Boddy Head of Debt Investor Relations Neil Wesley Head of Institutional Investor Relations Rebecca Plackett Director, Corporate Reporting and ESG Contact us westpac@linkmarketservices.com.au investorcentre.linkmarketservices.com.au 1800 804 255 investorrelations@westpac.com.au westpac.com.au/investorcentre +61 2 8253 3143 Investor Relations Team. |

| Disclaimer The material contained in this presentation is intended to be general background information on Westpac Banking Corporation (Westpac) and its activities. The information is supplied in summary form and is therefore not necessarily complete. It is not intended that it be relied upon as advice to investors or potential investors, who should consider seeking independent professional advice depending upon their specific investment objectives, financial situation or particular needs. The material contained in this presentation may include information derived from publicly available sources that have not been independently verified. No representation or warranty is made as to the accuracy, completeness or reliability of the information. All amounts are in Australian dollars unless otherwise indicated. Unless otherwise noted, financial information in this presentation is presented on a cash earnings basis. Cash earnings is a non-GAAP measure. Refer to Westpac’s 2021 Full Year Financial Results (incorporating the requirements of Appendix 4E) for the twelve months ended 30 September 2021 available at www.westpac.com.au for details of the basis of preparation of cash earnings. Refer to Westpac’s 2021 Full Year Financial Results Presentation and Investor Discussion Pack for an explanation of cash earnings and a reconciliation of reported net profit to cash earnings. The financial information for the three months ended 31 December 2021 has not been audited or reviewed by any independent registered public accounting firm and has been derived from the unaudited financial statements for the quarter ended 31 December 2021. Any other financial information provided as at a date after 31 December 2021 has not been audited or reviewed by any independent registered public accounting firm either. The information contained in this presentation is presented for information purposes only, is based on management’s current information and reflects management’s view of other factors, including a wide variety of significant business, economic and competitive risks and uncertainties, which may be heightened during the ongoing COVID- 19 pandemic. Certain data herein may involve underlying estimates, assumptions and judgments when applying accounting policies and preparing its financial statements, particularly in connection with the calculation of provisions. Any change in such estimates, assumptions and/or judgments resulting from new information or from changes in circumstances or experience could result in Westpac incurring losses greater than those anticipated or provided for. This presentation contains statements that constitute “forward-looking statements” within the meaning of Section 21E of the US Securities Exchange Act of 1934. Forward-looking statements are statements about matters that are not historical facts. Forward-looking statements appear in a number of places in this presentation and include statements regarding our intent, belief or current expectations with respect to our business and operations, macro and micro economic and market conditions, results of operations and financial condition, including, without limitation, future loan loss provisions, financial support to certain borrowers, indicative drivers, forecasted economic indicators and performance metric outcomes. We use words such as ‘will’, ‘may’, ‘expect’, ‘intend’, ‘seek’, ‘would’, ‘should’, ‘could’, ‘continue’, ‘plan’, ‘estimate’, ‘anticipate’, ‘believe’, ‘probability’, ‘risk’, ‘aim’, or other similar words to identify forward-looking statements. These forward-looking statements reflect our current views with respect to future events and are subject to change, certain risks, uncertainties and assumptions which are, in many instances, beyond our control, and have been made based upon management’s expectations and beliefs concerning future developments and their potential effect upon us. There can be no assurance that future developments will be in accordance with our expectations or that the effect of future developments on us will be those anticipated. Actual results could differ materially from those which we expect, depending on the outcome of various factors. Factors that may impact on the forward-looking statements made include, but are not limited to, those described in the section titled ‘Risk factors' in Westpac’s 2021 Annual Report for the twelve months ended 30 September 2021 available at www.westpac.com.au. When relying on forward-looking statements to make decisions with respect to us, investors and others should carefully consider such factors and other uncertainties and events. We are under no obligation to update any forward-looking statements contained in this presentation, whether as a result of new information, future events or otherwise, after the date of this presentation. Disclaimer 17 Westpac Group 1Q22 Update |