Exhibit 1
| ASX Release 9 MAY 2022 Westpac 2022 Interim Financial Results Announcement (incorporating requirements of Appendix 4D) Westpac Banking Corporation (“Westpac”) today provides the attached Westpac 2022 Interim Financial Results Announcement (incorporating requirements of Appendix 4D). For further information: Hayden Cooper Andrew Bowden Group Head of Media Relations Head of Investor Relations 0402 393 619 0438 284 863 This document has been authorised for release by Tim Hartin, Company Secretary. Level 18, 275 Kent Street Sydney, NSW, 2000 |
| This page has been intentionally left blank. |

| 2022 Interim Financial Results FOR THE SIX MONTHS ENDED 31 MARCH 2022 Incorporating the requirements of Appendix 4D Westpac Banking Corporation ABN 33 007 457 141 Cover image: 'Bank in a Box' Westpac employees at our portable branch in Lismore, NSW, after the floods. ,11estpac GROUP |
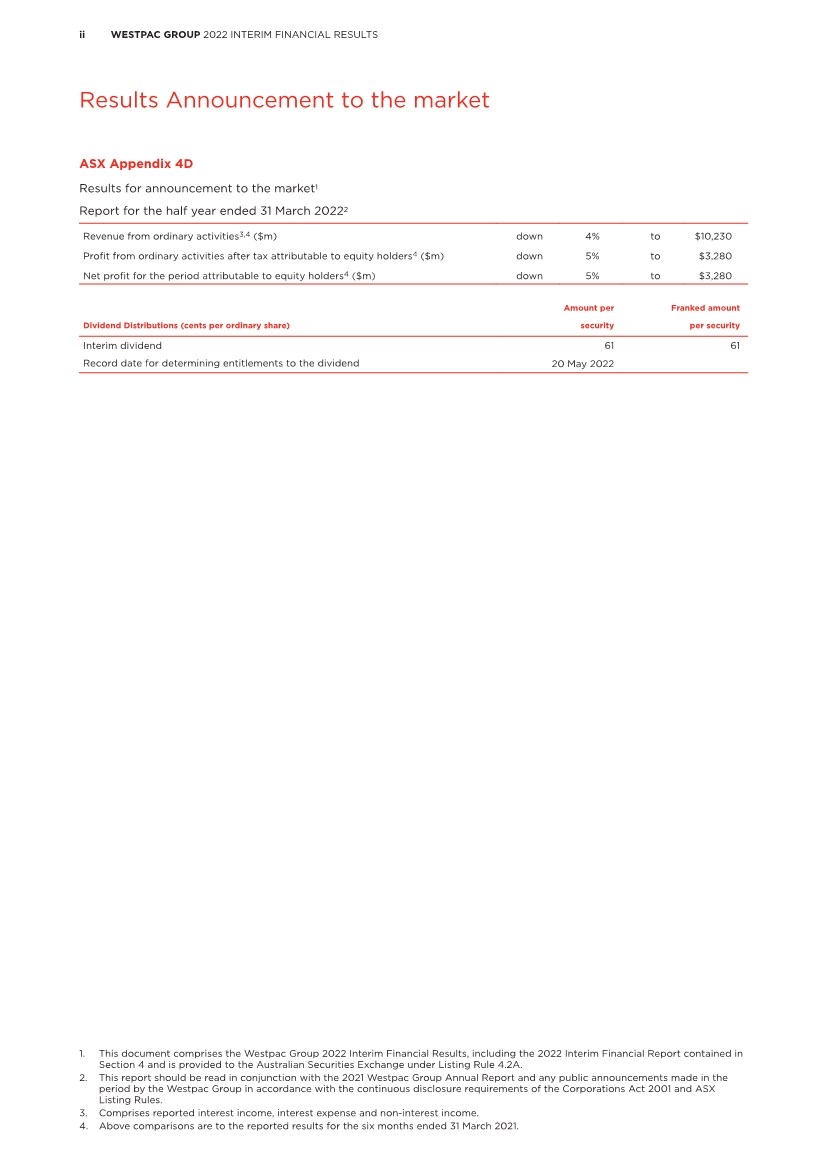
| ii WESTPAC GROUP 2022 INTERIM FINANCIAL RESULTS Results Announcement to the market ASX Appendix 4D Results for announcement to the market1 Report for the half year ended 31 March 20222 Revenue from ordinary activities3,4 ($m) down 4% to $10,230 Profit from ordinary activities after tax attributable to equity holders4 ($m) down 5% to $3,280 Net profit for the period attributable to equity holders4 ($m) down 5% to $3,280 Dividend Distributions (cents per ordinary share) Amount per security Franked amount per security Interim dividend 61 61 Record date for determining entitlements to the dividend 20 May 2022 1. This document comprises the Westpac Group 2022 Interim Financial Results, including the 2022 Interim Financial Report contained in Section 4 and is provided to the Australian Securities Exchange under Listing Rule 4.2A. 2. This report should be read in conjunction with the 2021 Westpac Group Annual Report and any public announcements made in the period by the Westpac Group in accordance with the continuous disclosure requirements of the Corporations Act 2001 and ASX Listing Rules. 3. Comprises reported interest income, interest expense and non-interest income. 4. Above comparisons are to the reported results for the six months ended 31 March 2021. |
| 1 2 3 4 5 6 7 iii WESTPAC GROUP 2022 INTERIM FINANCIAL RESULTS Results Announcement to the market Index 1.0 Group results 1 1.1 Reported results 1 1.2 Key financial information 3 1.3 Cash earnings results 4 1.4 Market share and system multiple metrics 8 2.0 Review of Group operations 9 2.1 Performance overview 13 2.2 Review of earnings 17 2.3 Credit quality 33 2.4 Balance sheet and funding 35 2.5 Capital and dividends 41 2.6 Sustainability performance 47 3.0 Segment Reporting 52 3.1 Consumer and Business Banking 53 3.1.1 Consumer 54 3.1.2 Business 57 3.2 Westpac Institutional Bank 60 3.3 Westpac New Zealand 63 3.4 Specialist Businesses 67 3.5 Group Businesses 71 4.0 2022 Interim financial report 74 4.1 Directors’ report 74 4.2 Consolidated income statement 97 4.3 Consolidated statement of comprehensive income 98 4.4 Consolidated balance sheet 99 4.5 Consolidated statement of changes in equity 100 4.6 Consolidated cash flow statement 101 4.7 Notes to the consolidated financial statements 102 4.8 Statutory statements 134 5.0 Cash earnings financial information 137 6.0 Other information 148 6.1 Disclosure regarding forward-looking statements 148 6.2 References to websites 150 6.3 Credit ratings 150 6.4 Dividend reinvestment plan 150 6.5 Information on related entities 150 6.6 Financial calendar and Share Registry details 151 6.7 Exchange rates 154 7.0 Glossary 155 |
| iv WESTPAC GROUP 2022 INTERIM FINANCIAL RESULTS Results Announcement to the market In this Interim Financial Results Announcement (Results Announcement) references to ‘Westpac’, ‘WBC’, ‘Westpac Group’, ‘the Group’, ‘we’, ‘us’ and ‘our’ are to Westpac Banking Corporation and its controlled entities, unless it clearly means just Westpac Banking Corporation. All references to $ in this Results Announcement are to Australian dollars unless otherwise stated. Financial calendar Interim Results Announcement released 9 May 2022 Ex-dividend date for interim dividend 19 May 2022 Record date for interim dividend (Sydney) 20 May 2022 Interim dividend payable 24 June 2022 Final Results Announcement (scheduled) 7 November 2022 |

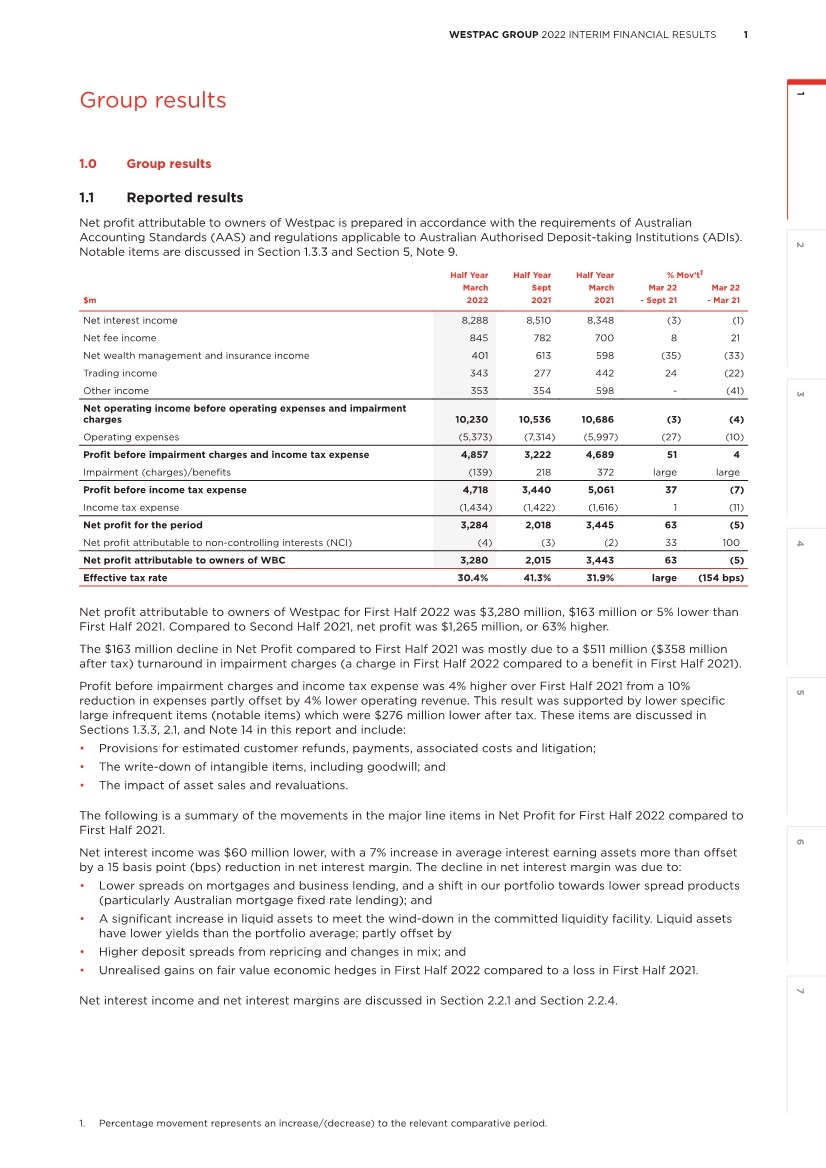
| 2 3 4 5 6 7 1 1 WESTPAC GROUP 2022 INTERIM FINANCIAL RESULTS Group results 1.0 Group results 1.1 Reported results Net profit attributable to owners of Westpac is prepared in accordance with the requirements of Australian Accounting Standards (AAS) and regulations applicable to Australian Authorised Deposit-taking Institutions (ADIs). Notable items are discussed in Section 1.3.3 and Section 5, Note 9. Half Year Half Year Half Year % Mov’t 1 March Sept March Mar 22 Mar 22 $m 2022 2021 2021 - Sept 21 - Mar 21 Net interest income 8,288 8,510 8,348 (3) (1) Net fee income 845 782 700 8 21 Net wealth management and insurance income 401 613 598 (35) (33) Trading income 343 277 442 24 (22) Other income 353 354 598 - (41) Net operating income before operating expenses and impairment charges 10,230 10,536 10,686 (3) (4) Operating expenses (5,373) (7,314) (5,997) (27) (10) Profit before impairment charges and income tax expense 4,857 3,222 4,689 51 4 Impairment (charges)/benefits (139) 218 372 large large Profit before income tax expense 4,718 3,440 5,061 37 (7) Income tax expense (1,434) (1,422) (1,616) 1 (11) Net profit for the period 3,284 2,018 3,445 63 (5) Net profit attributable to non-controlling interests (NCI) (4) (3) (2) 33 100 Net profit attributable to owners of WBC 3,280 2,015 3,443 63 (5) Effective tax rate 30.4% 41.3% 31.9% large (154 bps) Net profit attributable to owners of Westpac for First Half 2022 was $3,280 million, $163 million or 5% lower than First Half 2021. Compared to Second Half 2021, net profit was $1,265 million, or 63% higher. The $163 million decline in Net Profit compared to First Half 2021 was mostly due to a $511 million ($358 million after tax) turnaround in impairment charges (a charge in First Half 2022 compared to a benefit in First Half 2021). Profit before impairment charges and income tax expense was 4% higher over First Half 2021 from a 10% reduction in expenses partly offset by 4% lower operating revenue. This result was supported by lower specific large infrequent items (notable items) which were $276 million lower after tax. These items are discussed in Sections 1.3.3, 2.1, and Note 14 in this report and include: • Provisions for estimated customer refunds, payments, associated costs and litigation; • The write-down of intangible items, including goodwill; and • The impact of asset sales and revaluations. The following is a summary of the movements in the major line items in Net Profit for First Half 2022 compared to First Half 2021. Net interest income was $60 million lower, with a 7% increase in average interest earning assets more than offset by a 15 basis point (bps) reduction in net interest margin. The decline in net interest margin was due to: • Lower spreads on mortgages and business lending, and a shift in our portfolio towards lower spread products (particularly Australian mortgage fixed rate lending); and • A significant increase in liquid assets to meet the wind-down in the committed liquidity facility. Liquid assets have lower yields than the portfolio average; partly offset by • Higher deposit spreads from repricing and changes in mix; and • Unrealised gains on fair value economic hedges in First Half 2022 compared to a loss in First Half 2021. Net interest income and net interest margins are discussed in Section 2.2.1 and Section 2.2.4. 1. Percentage movement represents an increase/(decrease) to the relevant comparative period. |
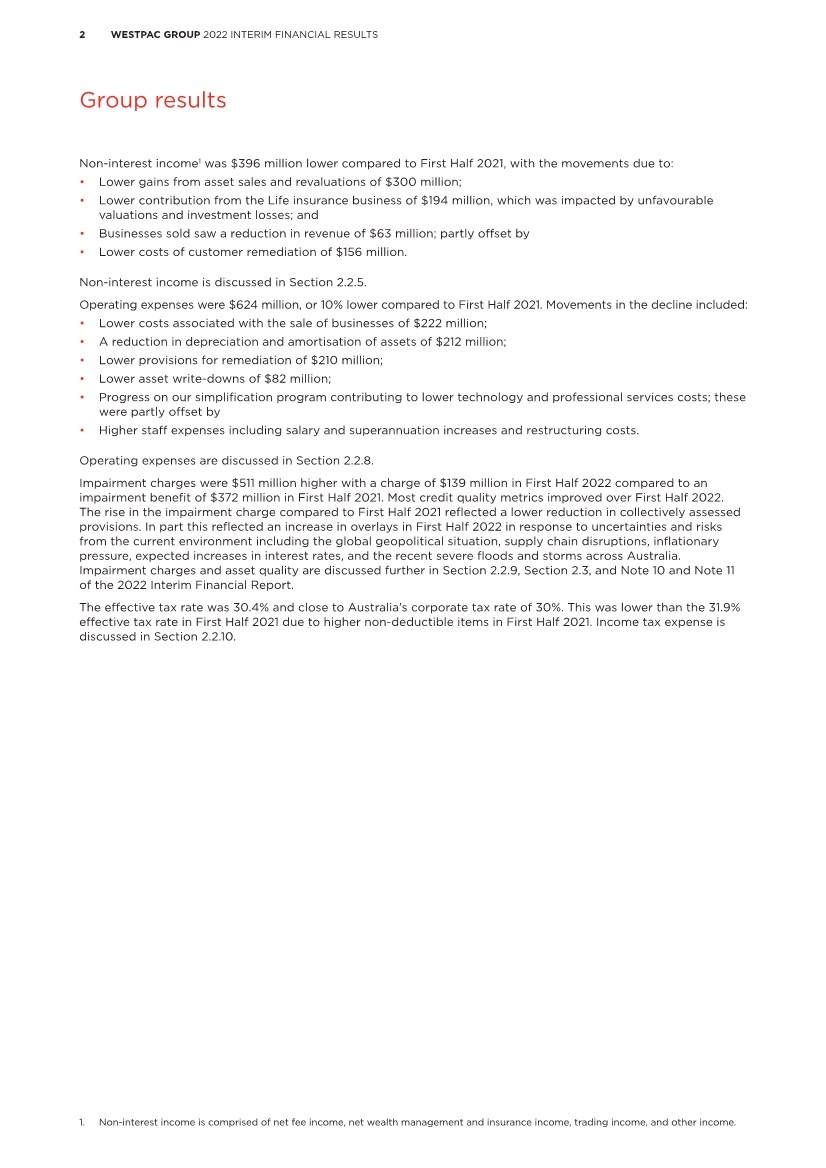
| 2 WESTPAC GROUP 2022 INTERIM FINANCIAL RESULTS Group results Non-interest income1 was $396 million lower compared to First Half 2021, with the movements due to: • Lower gains from asset sales and revaluations of $300 million; • Lower contribution from the Life insurance business of $194 million, which was impacted by unfavourable valuations and investment losses; and • Businesses sold saw a reduction in revenue of $63 million; partly offset by • Lower costs of customer remediation of $156 million. Non-interest income is discussed in Section 2.2.5. Operating expenses were $624 million, or 10% lower compared to First Half 2021. Movements in the decline included: • Lower costs associated with the sale of businesses of $222 million; • A reduction in depreciation and amortisation of assets of $212 million; • Lower provisions for remediation of $210 million; • Lower asset write-downs of $82 million; • Progress on our simplification program contributing to lower technology and professional services costs; these were partly offset by • Higher staff expenses including salary and superannuation increases and restructuring costs. Operating expenses are discussed in Section 2.2.8. Impairment charges were $511 million higher with a charge of $139 million in First Half 2022 compared to an impairment benefit of $372 million in First Half 2021. Most credit quality metrics improved over First Half 2022. The rise in the impairment charge compared to First Half 2021 reflected a lower reduction in collectively assessed provisions. In part this reflected an increase in overlays in First Half 2022 in response to uncertainties and risks from the current environment including the global geopolitical situation, supply chain disruptions, inflationary pressure, expected increases in interest rates, and the recent severe floods and storms across Australia. Impairment charges and asset quality are discussed further in Section 2.2.9, Section 2.3, and Note 10 and Note 11 of the 2022 Interim Financial Report. The effective tax rate was 30.4% and close to Australia’s corporate tax rate of 30%. This was lower than the 31.9% effective tax rate in First Half 2021 due to higher non-deductible items in First Half 2021. Income tax expense is discussed in Section 2.2.10. 1. Non-interest income is comprised of net fee income, net wealth management and insurance income, trading income, and other income. |
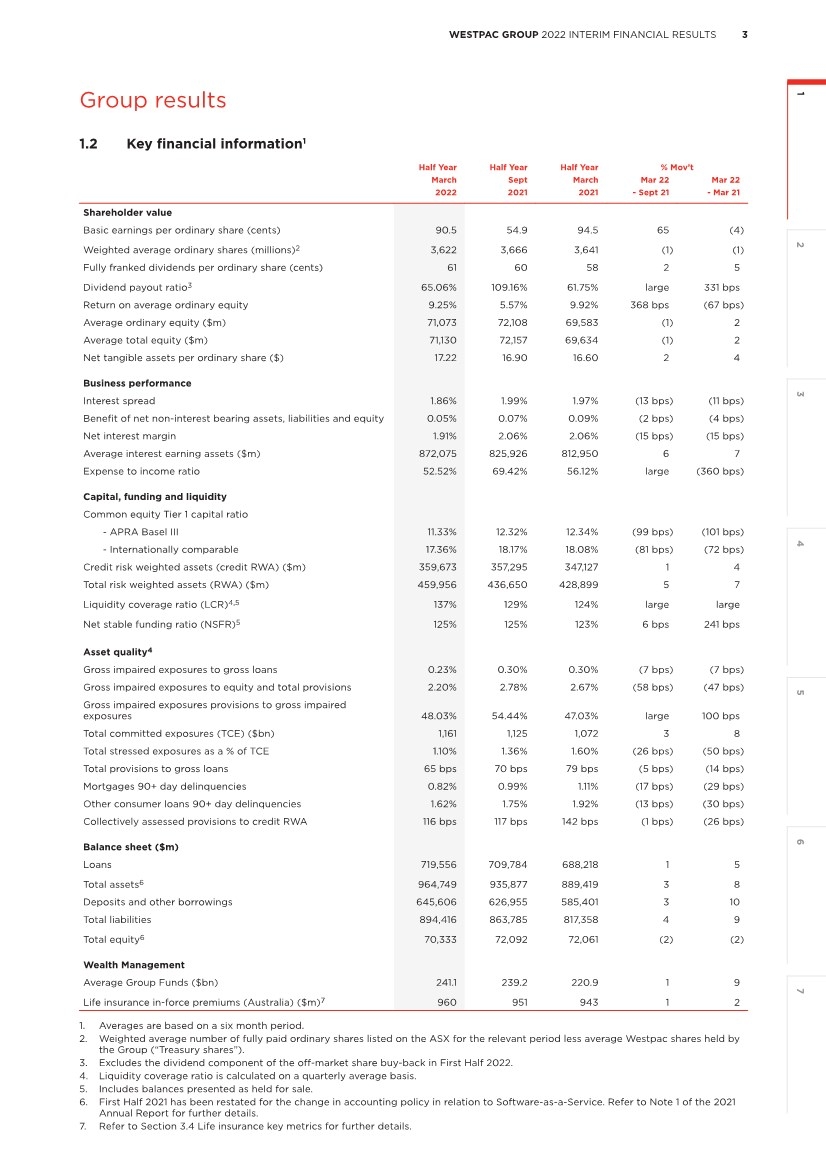
| 2 3 4 5 6 7 1 3 WESTPAC GROUP 2022 INTERIM FINANCIAL RESULTS Group results 1.2 Key financial information 1 Half Year Half Year Half Year % Mov’t March Sept March Mar 22 Mar 22 2022 2021 2021 - Sept 21 - Mar 21 Shareholder value Basic earnings per ordinary share (cents) 90.5 54.9 94.5 65 (4) Weighted average ordinary shares (millions) 2 3,622 3,666 3,641 (1) (1) Fully franked dividends per ordinary share (cents) 61 60 58 2 5 Dividend payout ratio 3 65.06% 109.16% 61.75% large 331 bps Return on average ordinary equity 9.25% 5.57% 9.92% 368 bps (67 bps) Average ordinary equity ($m) 71,073 72,108 69,583 (1) 2 Average total equity ($m) 71,130 72,157 69,634 (1) 2 Net tangible assets per ordinary share ($) 17.22 16.90 16.60 2 4 Business performance Interest spread 1.86% 1.99% 1.97% (13 bps) (11 bps) Benefit of net non-interest bearing assets, liabilities and equity 0.05% 0.07% 0.09% (2 bps) (4 bps) Net interest margin 1.91% 2.06% 2.06% (15 bps) (15 bps) Average interest earning assets ($m) 872,075 825,926 812,950 6 7 Expense to income ratio 52.52% 69.42% 56.12% large (360 bps) Capital, funding and liquidity Common equity Tier 1 capital ratio - APRA Basel III 11.33% 12.32% 12.34% (99 bps) (101 bps) - Internationally comparable 17.36% 18.17% 18.08% (81 bps) (72 bps) Credit risk weighted assets (credit RWA) ($m) 359,673 357,295 347,127 1 4 Total risk weighted assets (RWA) ($m) 459,956 436,650 428,899 5 7 Liquidity coverage ratio (LCR) 4,5 137% 129% 124% large large Net stable funding ratio (NSFR) 5 125% 125% 123% 6 bps 241 bps Asset quality 4 Gross impaired exposures to gross loans 0.23% 0.30% 0.30% (7 bps) (7 bps) Gross impaired exposures to equity and total provisions 2.20% 2.78% 2.67% (58 bps) (47 bps) Gross impaired exposures provisions to gross impaired exposures 48.03% 54.44% 47.03% large 100 bps Total committed exposures (TCE) ($bn) 1,161 1,125 1,072 3 8 Total stressed exposures as a % of TCE 1.10% 1.36% 1.60% (26 bps) (50 bps) Total provisions to gross loans 65 bps 70 bps 79 bps (5 bps) (14 bps) Mortgages 90+ day delinquencies 0.82% 0.99% 1.11% (17 bps) (29 bps) Other consumer loans 90+ day delinquencies 1.62% 1.75% 1.92% (13 bps) (30 bps) Collectively assessed provisions to credit RWA 116 bps 117 bps 142 bps (1 bps) (26 bps) Balance sheet ($m) Loans 719,556 709,784 688,218 1 5 Total assets 6 964,749 935,877 889,419 3 8 Deposits and other borrowings 645,606 626,955 585,401 3 10 Total liabilities 894,416 863,785 817,358 4 9 Total equity 6 70,333 72,092 72,061 (2) (2) Wealth Management Average Group Funds ($bn) 241.1 239.2 220.9 1 9 Life insurance in-force premiums (Australia) ($m) 7 960 951 943 1 2 1. Averages are based on a six month period. 2. Weighted average number of fully paid ordinary shares listed on the ASX for the relevant period less average Westpac shares held by the Group (“Treasury shares”). 3. Excludes the dividend component of the off-market share buy-back in First Half 2022. 4. Liquidity coverage ratio is calculated on a quarterly average basis. 5. Includes balances presented as held for sale. 6. First Half 2021 has been restated for the change in accounting policy in relation to Software-as-a-Service. Refer to Note 1 of the 2021 Annual Report for further details. 7. Refer to Section 3.4 Life insurance key metrics for further details. |
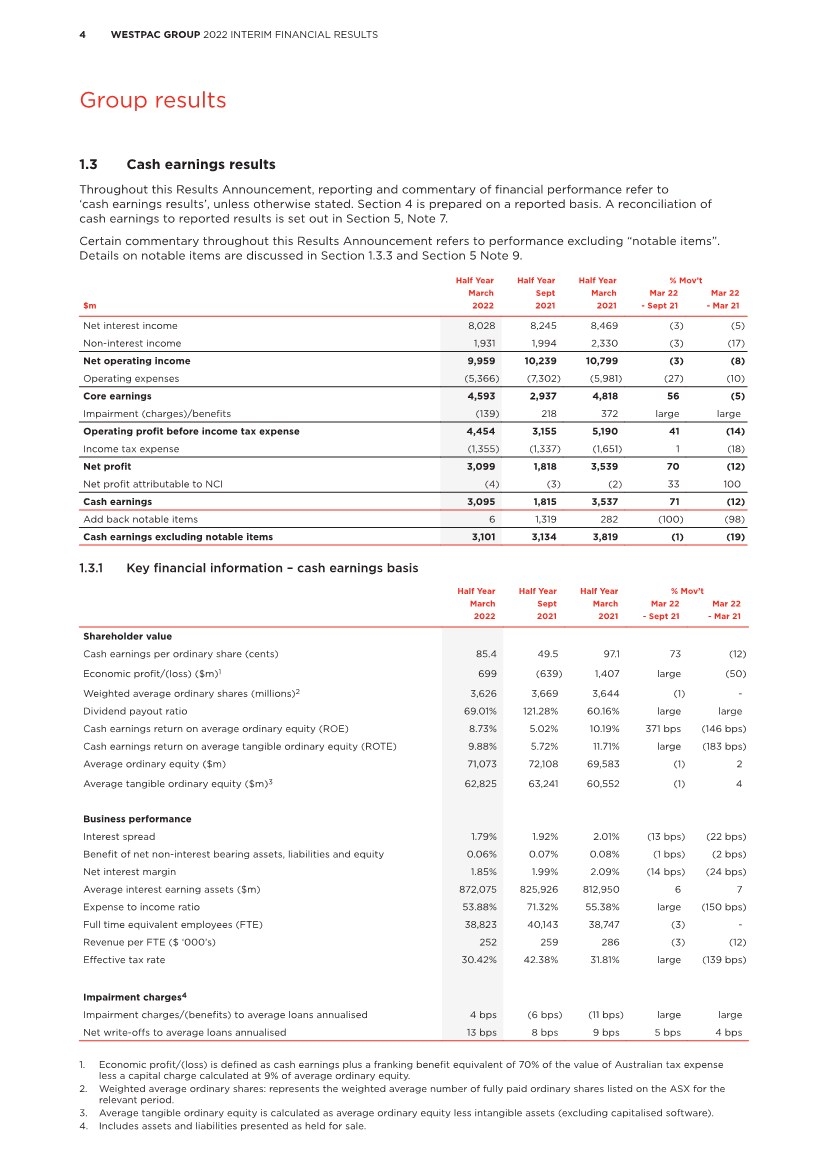
| 4 WESTPAC GROUP 2022 INTERIM FINANCIAL RESULTS Group results 1.3 Cash earnings results Throughout this Results Announcement, reporting and commentary of financial performance refer to ‘cash earnings results’, unless otherwise stated. Section 4 is prepared on a reported basis. A reconciliation of cash earnings to reported results is set out in Section 5, Note 7. Certain commentary throughout this Results Announcement refers to performance excluding “notable items”. Details on notable items are discussed in Section 1.3.3 and Section 5 Note 9. Half Year Half Year Half Year % Mov’t March Sept March Mar 22 Mar 22 $m 2022 2021 2021 - Sept 21 - Mar 21 Net interest income 8,028 8,245 8,469 (3) (5) Non-interest income 1,931 1,994 2,330 (3) (17) Net operating income 9,959 10,239 10,799 (3) (8) Operating expenses (5,366) (7,302) (5,981) (27) (10) Core earnings 4,593 2,937 4,818 56 (5) Impairment (charges)/benefits (139) 218 372 large large Operating profit before income tax expense 4,454 3,155 5,190 41 (14) Income tax expense (1,355) (1,337) (1,651) 1 (18) Net profit 3,099 1,818 3,539 70 (12) Net profit attributable to NCI (4) (3) (2) 33 100 Cash earnings 3,095 1,815 3,537 71 (12) Add back notable items 6 1,319 282 (100) (98) Cash earnings excluding notable items 3,101 3,134 3,819 (1) (19) 1.3.1 Key financial information – cash earnings basis Half Year Half Year Half Year % Mov’t March Sept March Mar 22 Mar 22 2022 2021 2021 - Sept 21 - Mar 21 Shareholder value Cash earnings per ordinary share (cents) 85.4 49.5 97.1 73 (12) Economic profit/(loss) ($m)1 699 (639) 1,407 large (50) Weighted average ordinary shares (millions)2 3,626 3,669 3,644 (1) - Dividend payout ratio 69.01% 121.28% 60.16% large large Cash earnings return on average ordinary equity (ROE) 8.73% 5.02% 10.19% 371 bps (146 bps) Cash earnings return on average tangible ordinary equity (ROTE) 9.88% 5.72% 11.71% large (183 bps) Average ordinary equity ($m) 71,073 72,108 69,583 (1) 2 Average tangible ordinary equity ($m)3 62,825 63,241 60,552 (1) 4 Business performance Interest spread 1.79% 1.92% 2.01% (13 bps) (22 bps) Benefit of net non-interest bearing assets, liabilities and equity 0.06% 0.07% 0.08% (1 bps) (2 bps) Net interest margin 1.85% 1.99% 2.09% (14 bps) (24 bps) Average interest earning assets ($m) 872,075 825,926 812,950 6 7 Expense to income ratio 53.88% 71.32% 55.38% large (150 bps) Full time equivalent employees (FTE) 38,823 40,143 38,747 (3) - Revenue per FTE ($ ‘000’s) 252 259 286 (3) (12) Effective tax rate 30.42% 42.38% 31.81% large (139 bps) Impairment charges4 Impairment charges/(benefits) to average loans annualised 4 bps (6 bps) (11 bps) large large Net write-offs to average loans annualised 13 bps 8 bps 9 bps 5 bps 4 bps 1. Economic profit/(loss) is defined as cash earnings plus a franking benefit equivalent of 70% of the value of Australian tax expense less a capital charge calculated at 9% of average ordinary equity. 2. Weighted average ordinary shares: represents the weighted average number of fully paid ordinary shares listed on the ASX for the relevant period. 3. Average tangible ordinary equity is calculated as average ordinary equity less intangible assets (excluding capitalised software). 4. Includes assets and liabilities presented as held for sale. |
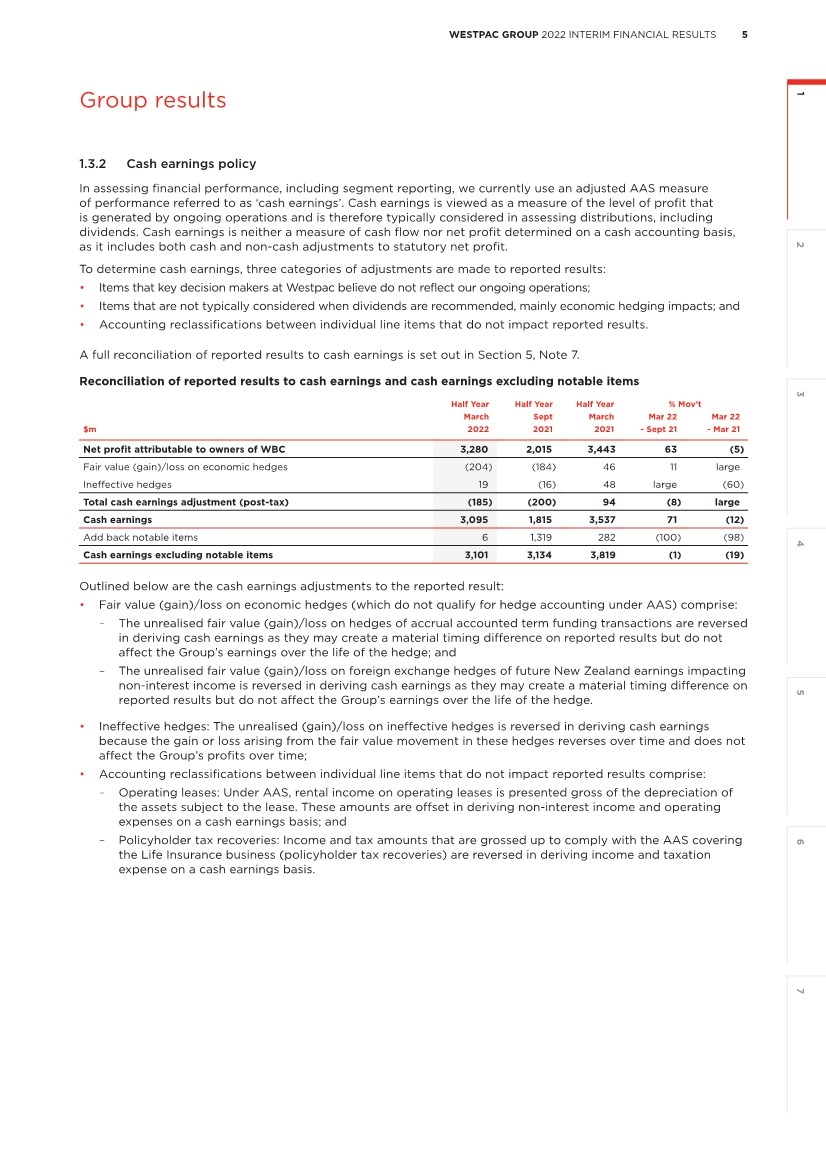
| 2 3 4 5 6 7 1 5 WESTPAC GROUP 2022 INTERIM FINANCIAL RESULTS Group results 1.3.2 Cash earnings policy In assessing financial performance, including segment reporting, we currently use an adjusted AAS measure of performance referred to as ‘cash earnings’. Cash earnings is viewed as a measure of the level of profit that is generated by ongoing operations and is therefore typically considered in assessing distributions, including dividends. Cash earnings is neither a measure of cash flow nor net profit determined on a cash accounting basis, as it includes both cash and non-cash adjustments to statutory net profit. To determine cash earnings, three categories of adjustments are made to reported results: • Items that key decision makers at Westpac believe do not reflect our ongoing operations; • Items that are not typically considered when dividends are recommended, mainly economic hedging impacts; and • Accounting reclassifications between individual line items that do not impact reported results. A full reconciliation of reported results to cash earnings is set out in Section 5, Note 7. Reconciliation of reported results to cash earnings and cash earnings excluding notable items Half Year Half Year Half Year % Mov’t March Sept March Mar 22 Mar 22 $m 2022 2021 2021 - Sept 21 - Mar 21 Net profit attributable to owners of WBC 3,280 2,015 3,443 63 (5) Fair value (gain)/loss on economic hedges (204) (184) 46 11 large Ineffective hedges 19 (16) 48 large (60) Total cash earnings adjustment (post-tax) (185) (200) 94 (8) large Cash earnings 3,095 1,815 3,537 71 (12) Add back notable items 6 1,319 282 (100) (98) Cash earnings excluding notable items 3,101 3,134 3,819 (1) (19) Outlined below are the cash earnings adjustments to the reported result: • Fair value (gain)/loss on economic hedges (which do not qualify for hedge accounting under AAS) comprise: – The unrealised fair value (gain)/loss on hedges of accrual accounted term funding transactions are reversed in deriving cash earnings as they may create a material timing difference on reported results but do not affect the Group’s earnings over the life of the hedge; and – The unrealised fair value (gain)/loss on foreign exchange hedges of future New Zealand earnings impacting non-interest income is reversed in deriving cash earnings as they may create a material timing difference on reported results but do not affect the Group’s earnings over the life of the hedge. • Ineffective hedges: The unrealised (gain)/loss on ineffective hedges is reversed in deriving cash earnings because the gain or loss arising from the fair value movement in these hedges reverses over time and does not affect the Group’s profits over time; • Accounting reclassifications between individual line items that do not impact reported results comprise: – Operating leases: Under AAS, rental income on operating leases is presented gross of the depreciation of the assets subject to the lease. These amounts are offset in deriving non-interest income and operating expenses on a cash earnings basis; and – Policyholder tax recoveries: Income and tax amounts that are grossed up to comply with the AAS covering the Life Insurance business (policyholder tax recoveries) are reversed in deriving income and taxation expense on a cash earnings basis. |
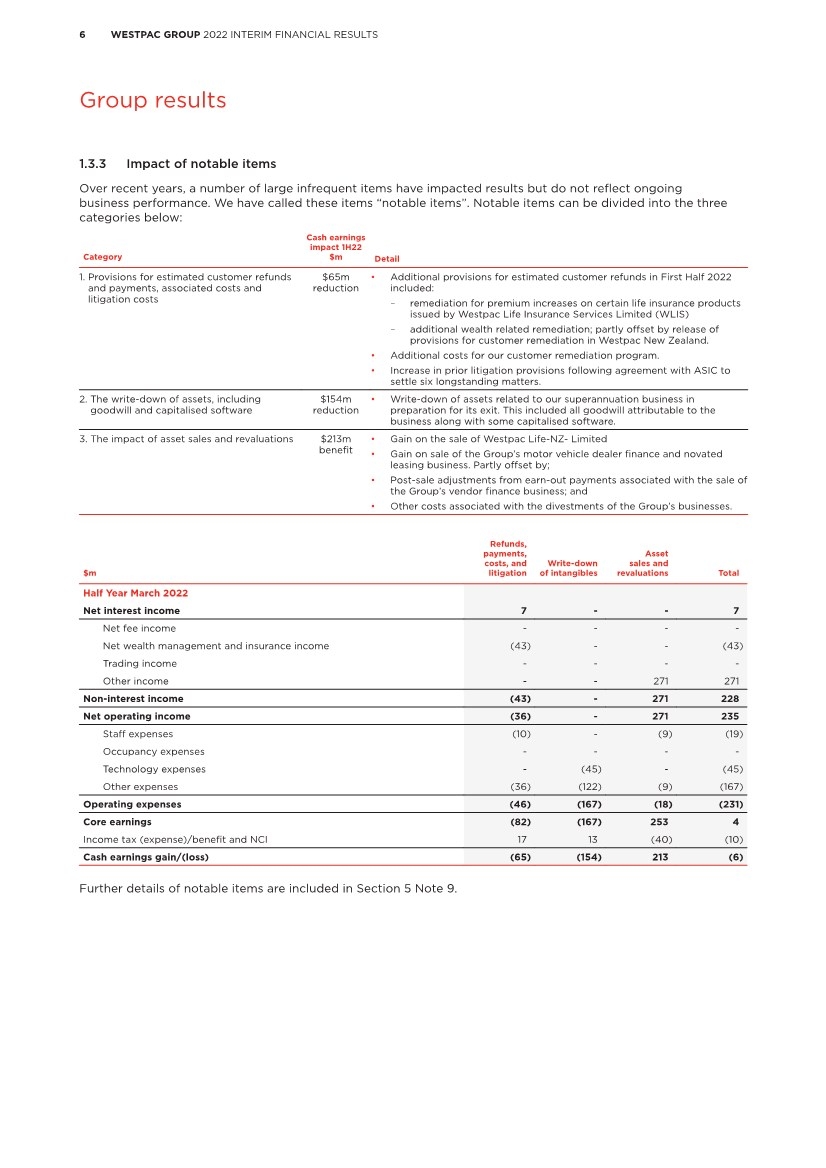
| 6 WESTPAC GROUP 2022 INTERIM FINANCIAL RESULTS Group results 1.3.3 Impact of notable items Over recent years, a number of large infrequent items have impacted results but do not reflect ongoing business performance. We have called these items “notable items”. Notable items can be divided into the three categories below: Category Cash earnings impact 1H22 $m Detail 1. Provisions for estimated customer refunds and payments, associated costs and litigation costs $65m reduction • Additional provisions for estimated customer refunds in First Half 2022 included: – remediation for premium increases on certain life insurance products issued by Westpac Life Insurance Services Limited (WLIS) – additional wealth related remediation; partly offset by release of provisions for customer remediation in Westpac New Zealand. • Additional costs for our customer remediation program. • Increase in prior litigation provisions following agreement with ASIC to settle six longstanding matters. 2. The write-down of assets, including goodwill and capitalised software $154m reduction • Write-down of assets related to our superannuation business in preparation for its exit. This included all goodwill attributable to the business along with some capitalised software. 3. The impact of asset sales and revaluations $213m benefit • Gain on the sale of Westpac Life-NZ- Limited • Gain on sale of the Group’s motor vehicle dealer finance and novated leasing business. Partly offset by; • Post-sale adjustments from earn-out payments associated with the sale of the Group’s vendor finance business; and • Other costs associated with the divestments of the Group’s businesses. $m Refunds, payments, costs, and litigation Write-down of intangibles Asset sales and revaluations Total Half Year March 2022 Net interest income 7 - - 7 Net fee income - - - - Net wealth management and insurance income (43) - - (43) Trading income - - - - Other income - - 271 271 Non-interest income (43) - 271 228 Net operating income (36) - 271 235 Staff expenses (10) - (9) (19) Occupancy expenses - - - - Technology expenses - (45) - (45) Other expenses (36) (122) (9) (167) Operating expenses (46) (167) (18) (231) Core earnings (82) (167) 253 4 Income tax (expense)/benefit and NCI 17 13 (40) (10) Cash earnings gain/(loss) (65) (154) 213 (6) Further details of notable items are included in Section 5 Note 9. |
| 2 3 4 5 6 7 1 7 WESTPAC GROUP 2022 INTERIM FINANCIAL RESULTS Group results 1.3.4 Presentation changes In First Half 2022, we changed our reporting segments following changes announced in 2021. We have also restated comparatives for changes in the allocations of certain revenue and expense items across segments to align with the change in the information presented to key decision makers. 1.3.5 This Results Announcement is unaudited PricewaterhouseCoopers has reviewed the financial statements and accompanying notes contained within Section 4 of this Results Announcement and has issued an unmodified review report. All other sections, including the Directors’ Report in Section 4 of the Results Announcement have not been subject to review by PricewaterhouseCoopers. The financial information contained in this Results Announcement includes information extracted from the reviewed financial statements together with information that has not been reviewed. The cash earnings disclosed as part of this Results Announcement have not been separately reviewed by PricewaterhouseCoopers. |
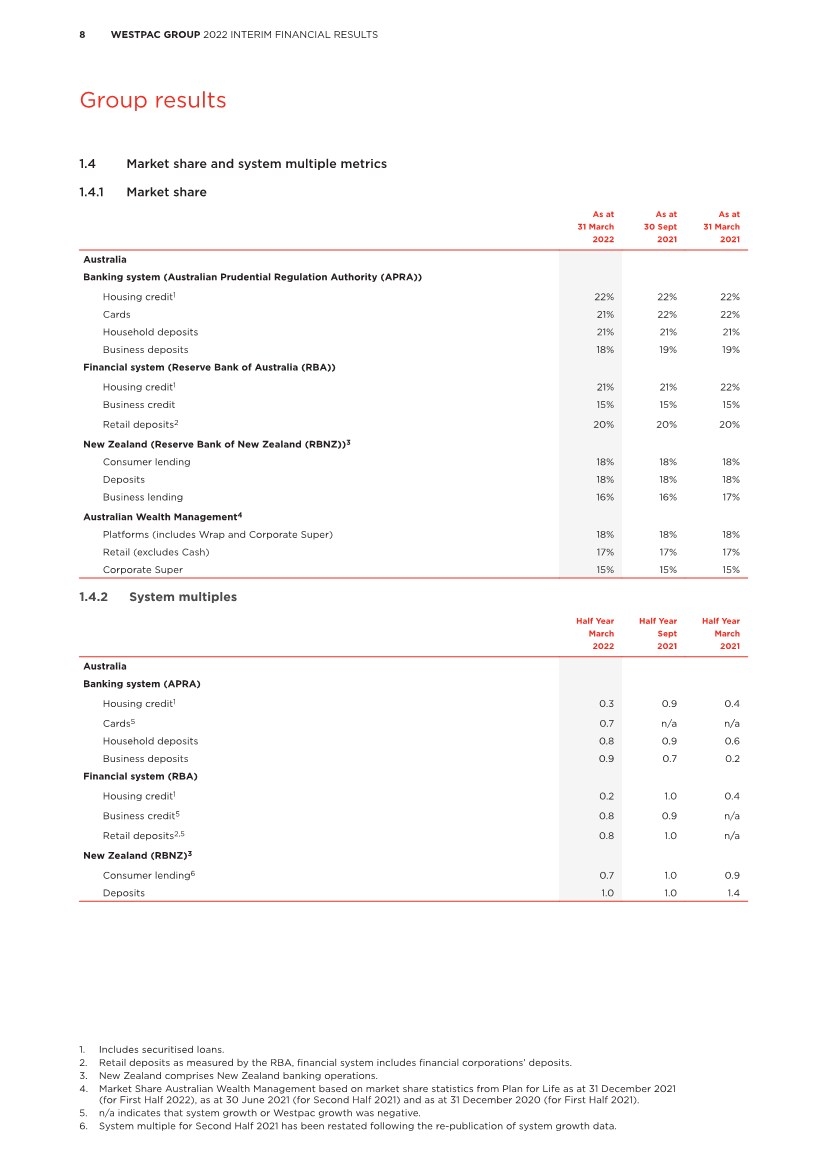
| 8 WESTPAC GROUP 2022 INTERIM FINANCIAL RESULTS Group results 1.4 Market share and system multiple metrics 1.4.1 Market share As at As at As at 31 March 30 Sept 31 March 2022 2021 2021 Australia Banking system (Australian Prudential Regulation Authority (APRA)) Housing credit1 22% 22% 22% Cards 21% 22% 22% Household deposits 21% 21% 21% Business deposits 18% 19% 19% Financial system (Reserve Bank of Australia (RBA)) Housing credit1 21% 21% 22% Business credit 15% 15% 15% Retail deposits2 20% 20% 20% New Zealand (Reserve Bank of New Zealand (RBNZ))3 Consumer lending 18% 18% 18% Deposits 18% 18% 18% Business lending 16% 16% 17% Australian Wealth Management4 Platforms (includes Wrap and Corporate Super) 18% 18% 18% Retail (excludes Cash) 17% 17% 17% Corporate Super 15% 15% 15% 1.4.2 System multiples Half Year Half Year Half Year March Sept March 2022 2021 2021 Australia Banking system (APRA) Housing credit1 0.3 0.9 0.4 Cards5 0.7 n/a n/a Household deposits 0.8 0.9 0.6 Business deposits 0.9 0.7 0.2 Financial system (RBA) Housing credit1 0.2 1.0 0.4 Business credit5 0.8 0.9 n/a Retail deposits2,5 0.8 1.0 n/a New Zealand (RBNZ)3 Consumer lending6 0.7 1.0 0.9 Deposits 1.0 1.0 1.4 1. Includes securitised loans. 2. Retail deposits as measured by the RBA, financial system includes financial corporations’ deposits. 3. New Zealand comprises New Zealand banking operations. 4. Market Share Australian Wealth Management based on market share statistics from Plan for Life as at 31 December 2021 (for First Half 2022), as at 30 June 2021 (for Second Half 2021) and as at 31 December 2020 (for First Half 2021). 5. n/a indicates that system growth or Westpac growth was negative. 6. System multiple for Second Half 2021 has been restated following the re-publication of system growth data. |
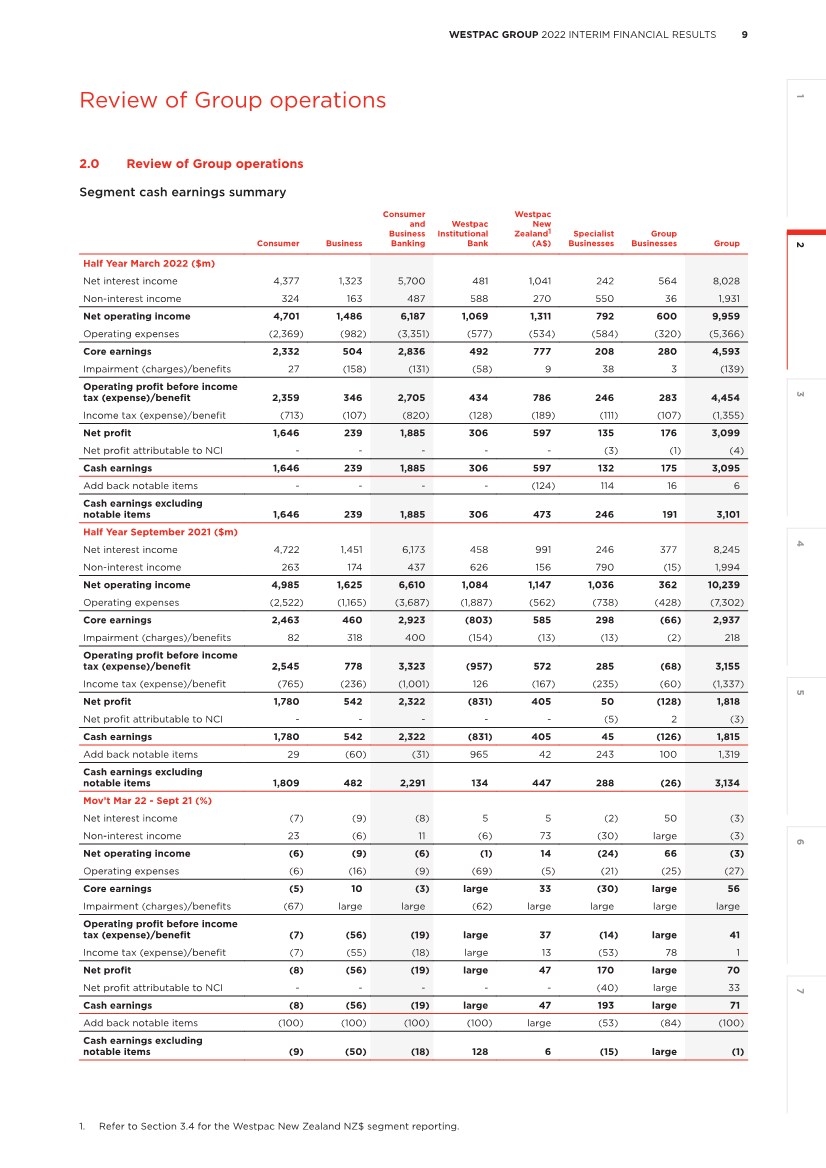
| 1 3 4 5 6 7 2 9 WESTPAC GROUP 2022 INTERIM FINANCIAL RESULTS Review of Group operations 2.0 Review of Group operations Segment cash earnings summary Consumer Business Consumer and Business Banking Westpac Institutional Bank Westpac New Zealand 1 (A$) Specialist Businesses Group Businesses Group Half Year March 2022 ($m) Net interest income 4,377 1,323 5,700 481 1,041 242 564 8,028 Non-interest income 324 163 487 588 270 550 36 1,931 Net operating income 4,701 1,486 6,187 1,069 1,311 792 600 9,959 Operating expenses (2,369) (982) (3,351) (577) (534) (584) (320) (5,366) Core earnings 2,332 504 2,836 492 777 208 280 4,593 Impairment (charges)/benefits 27 (158) (131) (58) 9 38 3 (139) Operating profit before income tax (expense)/benefit 2,359 346 2,705 434 786 246 283 4,454 Income tax (expense)/benefit (713) (107) (820) (128) (189) (111) (107) (1,355) Net profit 1,646 239 1,885 306 597 135 176 3,099 Net profit attributable to NCI - - - - - (3) (1) (4) Cash earnings 1,646 239 1,885 306 597 132 175 3,095 Add back notable items - - - - (124) 114 16 6 Cash earnings excluding notable items 1,646 239 1,885 306 473 246 191 3,101 Half Year September 2021 ($m) Net interest income 4,722 1,451 6,173 458 991 246 377 8,245 Non-interest income 263 174 437 626 156 790 (15) 1,994 Net operating income 4,985 1,625 6,610 1,084 1,147 1,036 362 10,239 Operating expenses (2,522) (1,165) (3,687) (1,887) (562) (738) (428) (7,302) Core earnings 2,463 460 2,923 (803) 585 298 (66) 2,937 Impairment (charges)/benefits 82 318 400 (154) (13) (13) (2) 218 Operating profit before income tax (expense)/benefit 2,545 778 3,323 (957) 572 285 (68) 3,155 Income tax (expense)/benefit (765) (236) (1,001) 126 (167) (235) (60) (1,337) Net profit 1,780 542 2,322 (831) 405 50 (128) 1,818 Net profit attributable to NCI - - - - - (5) 2 (3) Cash earnings 1,780 542 2,322 (831) 405 45 (126) 1,815 Add back notable items 29 (60) (31) 965 42 243 100 1,319 Cash earnings excluding notable items 1,809 482 2,291 134 447 288 (26) 3,134 Mov’t Mar 22 - Sept 21 (%) Net interest income (7) (9) (8) 5 5 (2) 50 (3) Non-interest income 23 (6) 11 (6) 73 (30) large (3) Net operating income (6) (9) (6) (1) 14 (24) 66 (3) Operating expenses (6) (16) (9) (69) (5) (21) (25) (27) Core earnings (5) 10 (3) large 33 (30) large 56 Impairment (charges)/benefits (67) large large (62) large large large large Operating profit before income tax (expense)/benefit (7) (56) (19) large 37 (14) large 41 Income tax (expense)/benefit (7) (55) (18) large 13 (53) 78 1 Net profit (8) (56) (19) large 47 170 large 70 Net profit attributable to NCI - - - - - (40) large 33 Cash earnings (8) (56) (19) large 47 193 large 71 Add back notable items (100) (100) (100) (100) large (53) (84) (100) Cash earnings excluding notable items (9) (50) (18) 128 6 (15) large (1) 1. Refer to Section 3.4 for the Westpac New Zealand NZ$ segment reporting. |
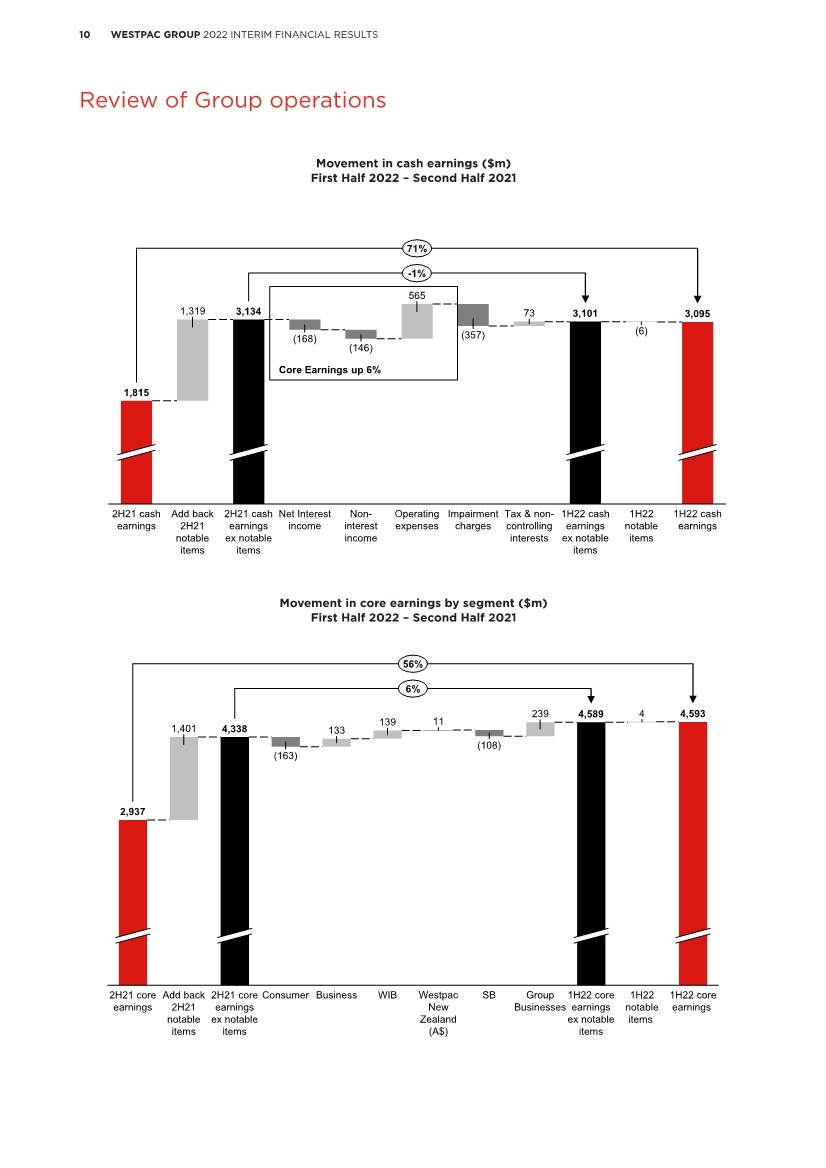
| 10 WESTPAC GROUP 2022 INTERIM FINANCIAL RESULTS Review of Group operations Movement in cash earnings ($m) First Half 2022 – Second Half 2021 1,319 565 73 (168) 1H22 cash earnings ex notable items 1H22 notable items 1H22 cash earnings (6) Non- interest income (146) Impairment charges Net Interest income 1,815 3,134 3,095 Tax & non- controlling interests (357) Operating expenses 2H21 cash earnings ex notable items 2H21 cash earnings 3,101 Add back 2H21 notable items 71% -1% Movement in cash earnings ($m) First Half 2022 – Second Half 2021 Core Earnings up 6% Movement in core earnings by segment ($m) First Half 2022 – Second Half 2021 1,401 133 139 11 239 2,937 Westpac New Zealand (A$) SB Group Businesses 1H22 core earnings ex notable items Business 4 1H22 core earnings 4,593 WIB (163) 4,589 Add back 2H21 notable items 1H22 notable items 2H21 core earnings ex notable items 4,338 Consumer 2H21 core earnings (108) 56% 6% Movement in core earnings by segment ($m) First Half 2022 – Second Half 2021 |
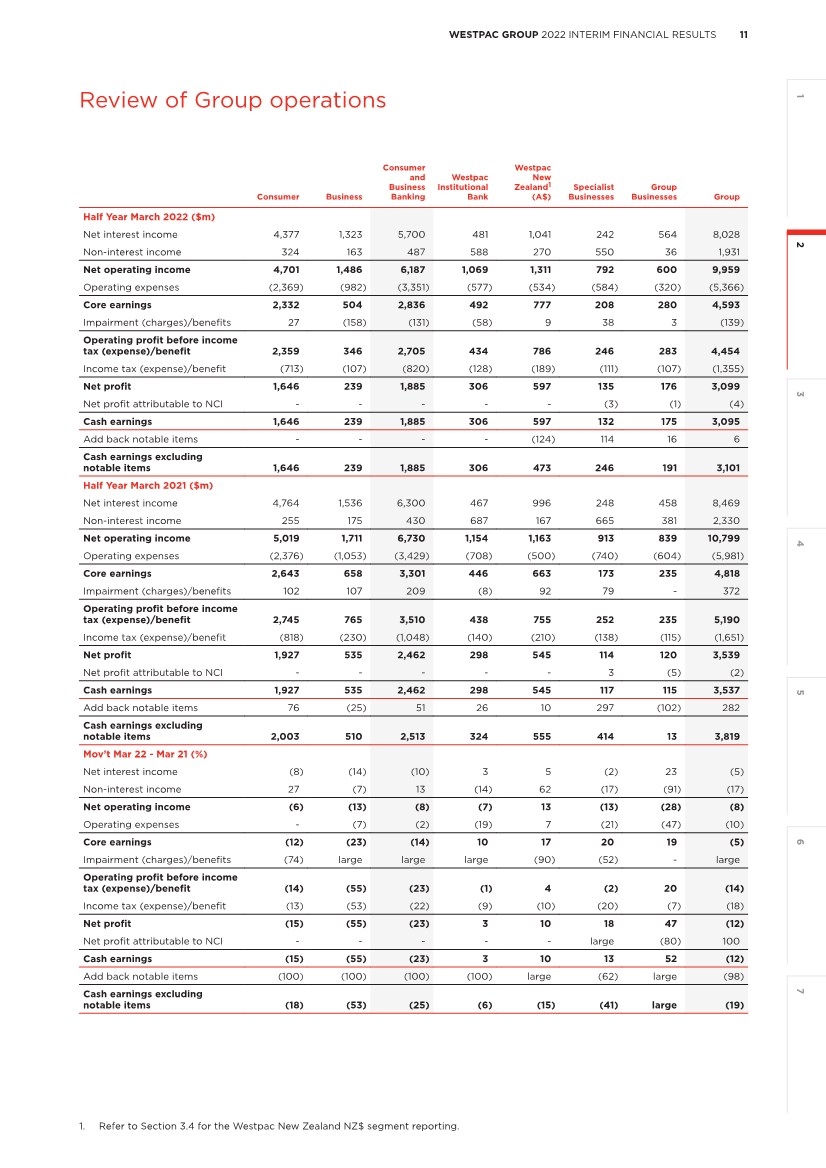
| 1 3 4 5 6 7 2 11 WESTPAC GROUP 2022 INTERIM FINANCIAL RESULTS Review of Group operations Consumer Business Consumer and Business Banking Westpac Institutional Bank Westpac New Zealand 1 (A$) Specialist Businesses Group Businesses Group Half Year March 2022 ($m) Net interest income 4,377 1,323 5,700 481 1,041 242 564 8,028 Non-interest income 324 163 487 588 270 550 36 1,931 Net operating income 4,701 1,486 6,187 1,069 1,311 792 600 9,959 Operating expenses (2,369) (982) (3,351) (577) (534) (584) (320) (5,366) Core earnings 2,332 504 2,836 492 777 208 280 4,593 Impairment (charges)/benefits 27 (158) (131) (58) 9 38 3 (139) Operating profit before income tax (expense)/benefit 2,359 346 2,705 434 786 246 283 4,454 Income tax (expense)/benefit (713) (107) (820) (128) (189) (111) (107) (1,355) Net profit 1,646 239 1,885 306 597 135 176 3,099 Net profit attributable to NCI - - - - - (3) (1) (4) Cash earnings 1,646 239 1,885 306 597 132 175 3,095 Add back notable items - - - - (124) 114 16 6 Cash earnings excluding notable items 1,646 239 1,885 306 473 246 191 3,101 Half Year March 2021 ($m) Net interest income 4,764 1,536 6,300 467 996 248 458 8,469 Non-interest income 255 175 430 687 167 665 381 2,330 Net operating income 5,019 1,711 6,730 1,154 1,163 913 839 10,799 Operating expenses (2,376) (1,053) (3,429) (708) (500) (740) (604) (5,981) Core earnings 2,643 658 3,301 446 663 173 235 4,818 Impairment (charges)/benefits 102 107 209 (8) 92 79 - 372 Operating profit before income tax (expense)/benefit 2,745 765 3,510 438 755 252 235 5,190 Income tax (expense)/benefit (818) (230) (1,048) (140) (210) (138) (115) (1,651) Net profit 1,927 535 2,462 298 545 114 120 3,539 Net profit attributable to NCI - - - - - 3 (5) (2) Cash earnings 1,927 535 2,462 298 545 117 115 3,537 Add back notable items 76 (25) 51 26 10 297 (102) 282 Cash earnings excluding notable items 2,003 510 2,513 324 555 414 13 3,819 Mov’t Mar 22 - Mar 21 (%) Net interest income (8) (14) (10) 3 5 (2) 23 (5) Non-interest income 27 (7) 13 (14) 62 (17) (91) (17) Net operating income (6) (13) (8) (7) 13 (13) (28) (8) Operating expenses - (7) (2) (19) 7 (21) (47) (10) Core earnings (12) (23) (14) 10 17 20 19 (5) Impairment (charges)/benefits (74) large large large (90) (52) - large Operating profit before income tax (expense)/benefit (14) (55) (23) (1) 4 (2) 20 (14) Income tax (expense)/benefit (13) (53) (22) (9) (10) (20) (7) (18) Net profit (15) (55) (23) 3 10 18 47 (12) Net profit attributable to NCI - - - - - large (80) 100 Cash earnings (15) (55) (23) 3 10 13 52 (12) Add back notable items (100) (100) (100) (100) large (62) large (98) Cash earnings excluding notable items (18) (53) (25) (6) (15) (41) large (19) 1. Refer to Section 3.4 for the Westpac New Zealand NZ$ segment reporting. |
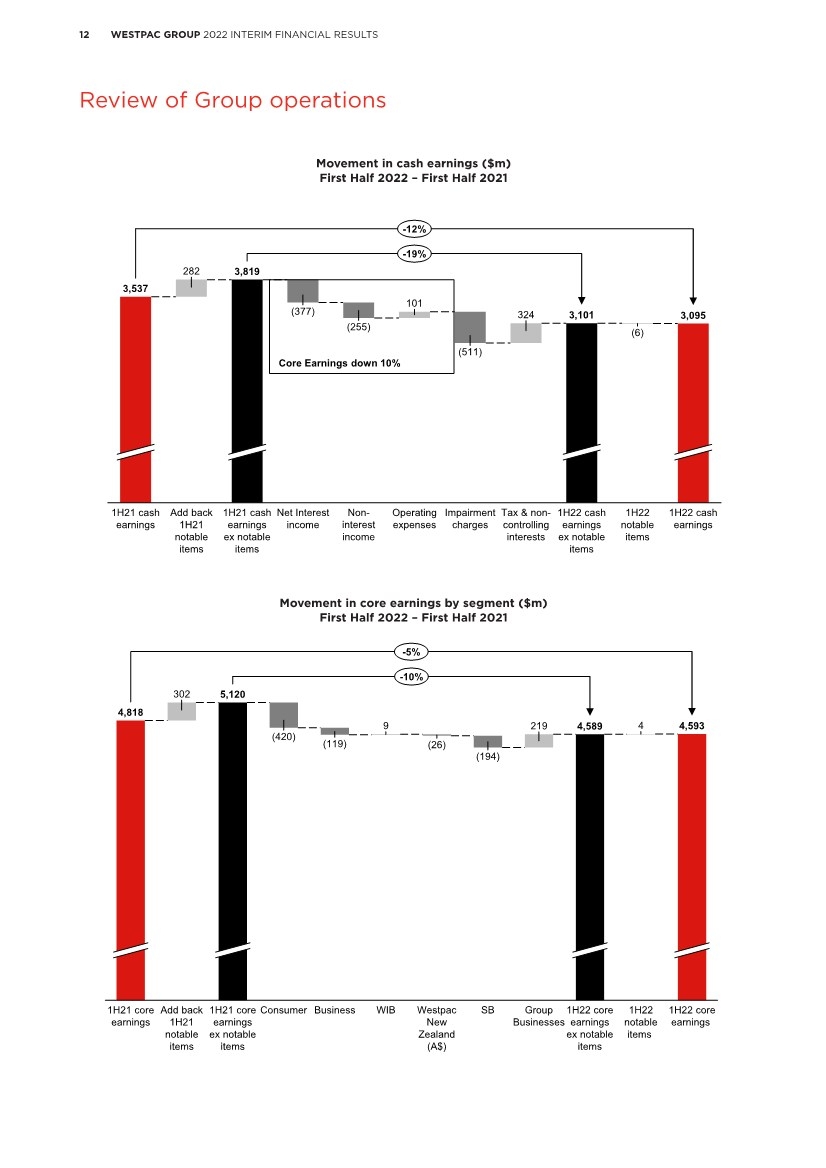
| 12 WESTPAC GROUP 2022 INTERIM FINANCIAL RESULTS Review of Group operations Movement in cash earnings ($m) First Half 2022 – First Half 2021 282 101 324 (255) Non- interest income Add back 1H21 notable items 1H22 cash earnings Net Interest income Tax & non- controlling interests (511) 1H21 cash earnings ex notable items 1H22 cash earnings ex notable items (6) 1H22 notable items 1H21 cash earnings Operating expenses (377) 3,537 3,101 3,095 Impairment charges 3,819 -12% -19% Movement in cash earnings ($m) First Half 2022 – First Half 2021 Core Earnings down 10% Movement in core earnings by segment ($m) First Half 2022 – First Half 2021 302 9 219 4 1H22 core earnings ex notable items Add back 1H21 notable items (194) SB Group Businesses 1H22 notable items 1H22 core earnings (26) WIB Westpac New Zealand (A$) (119) (420) 5,120 1H21 core earnings ex notable items 4,593 Consumer 1H21 core earnings 4,818 Business 4,589 -5% -10% Movement in core earnings by segment ($m) First Half 2022 – First Half 2021 |
| 1 2 3 4 5 6 7 13 WESTPAC GROUP 2022 INTERIM FINANCIAL RESULTS Review of Group operations 2.1 Performance overview Overview We have made progress in First Half 2022 with improved cash earnings over the prior half, maintaining a sound balance sheet and clearly delivering on our strategic priorities. We have also lived our purpose of “Helping Australians and New Zealanders succeed” by supporting customers and communities through devastating floods and by continuing to assist those affected by the ongoing economic impacts of COVID-19. Cash earnings for First Half 2022 were $3,095 million, up $1,280 million on Second Half 2021. The increase was predominantly due to lower notable items ($1,313 million lower) and lower expenses (down $565 million excluding notable items). These benefits were partly offset by a $357 million turnaround in impairments (a charge of $139 million in First Half 2022 compared to a benefit in Second Half 2021 of $218 million), lower operating income (down $280 million), mainly from a decline in net interest margins, and a reduction in cash earnings following the sale of businesses ($92 million). Compared to the prior corresponding period, cash earnings were 12% lower, mostly due to a $511 million turnaround in impairment charges and lower net interest margins. These declines were partly offset by lower notable items and a decline in expenses. The economic environment continued to improve though First Half 2022 with activity climbing, unemployment falling to generational lows and interest rates remaining at emergency low levels. These conditions have been supportive for our business although they have also contributed to strong competition. While conditions have been positive, some uncertainty remains. In particular, economic activity has been adversely affected by COVID-19 lockdowns, including supply chain disruptions and labour shortages while the world is also dealing with rising inflation and uncertainty linked to the war in Ukraine. We have no direct exposure to Ukraine and Russia although as a major bank we are monitoring potential second order impacts, across customers, sectors and markets. In First Half 2022 we raised additional credit provision overlays, partly in response to these uncertainties. Progress on strategic priorities We are delivering on our purpose through three linked and interdependent strategic priorities that will make us a simpler stronger bank. These priorities are: (1) Fix: This priority is about addressing our shortcomings, improving our control environment and responding to regulatory change. (2) Simplify: In simplifying the business we are focused on three dimensions: a) portfolio simplification – the businesses we operate, with a particular focus on banking and exiting our wealth and insurance businesses; b) geographic simplification – where we operate, particularly Australia and New Zealand; and c) banking simplification – how we operate, using digital to transform our operations. (3) Perform: In a low interest rate and highly competitive banking environment, it is vital that we improve our efficiency and effectiveness to improve shareholder returns and the sustainability of our dividends. This priority is also about improving the customer experience. In First Half 2022, developments under each of these priorities has included: Fix • Progressing our CORE (Customer Outcomes and Risk Excellence) program which was set up to materially improve our management of financial and non-financial risks. Over First Half 2022 we submitted 73 activities to the independent reviewer (Promontory Australia) for assessment. This sees a total of 194 activities out of the CORE program’s 343 activities submitted. We are now into the program’s implementation phase, which is the focus for 2022. The independent reports on the program’s progress confirm we are on track; • Largely completed the rectification of our processes and systems designed to better manage the security registers supporting business customer facilities; • Further upgrades to our AML/CTF systems including to improve our ability to block transactions in certain jurisdictions and to automate more of our threshold transaction reporting; • Agreeing with ASIC to settle a number of outstanding regulatory matters. Refer to Significant Developments Section 4.1 for further details; • In New Zealand we focused on implementing regulatory change, including the RBNZ’s BS11 requirements, and enhancing our risk governance and liquidity management; and • Updates to systems and processes for regulatory change including new design and distribution obligations, anti-hawking legislation, changes to Basel III risk weighted asset models and CCCFA (Credit Contracts and Consumer Finance Act) legislation in New Zealand. While making progress, we still have much to do before the changes we are implementing are embedded in our business as usual. At the same time, some regulatory investigations are still underway that could result in further litigation, fines, penalties or other regulatory action. Our Contingent liabilities disclosure in Note 14 to the Interim Financial Statements outlines these further. Review of Group operations |
| 14 WESTPAC GROUP 2022 INTERIM FINANCIAL RESULTS Review of Group operations Simplify • Under Portfolio Simplification, we completed the sale of two businesses in First Half 2022, Westpac Life-NZ- Limited (NZ Life) and Westpac’s motor vehicle dealer finance and novated leasing businesses. This brings to six the number of businesses exited. We entered into an agreement to sell Westpac Life Insurance Services Limited in 2021 and expect this to settle in 2022. For further details refer Note 17 Assets and Liabilities Held for Sale. Our remaining businesses for exit include our superannuation, platforms and investments operations, and Westpac Pacific comprising our Papua New Guinea and Fiji businesses where we are reviewing our options. • Geographic simplification progressed as we consolidate our presence in Asia from 5 locations to a single hub in Singapore. We closed our branches in Mumbai and Jakarta in 2021 and are working to exit Hong Kong, Shanghai and Beijing. • Banking simplification: – Reductions in the number of products and fees has contributed to a 9% decline in complaints; – In technology, we decommissioned 4% of the applications we planned to remove and increased the number of automated processes to 152 from 98 at 30 September 2021; and – Launched a new digital mortgage application process, reducing approval times and making it easier for both customers and bankers. Perform • Completed the roll-out of the Westpac mobile banking app to customers using android devices following the iOS roll-out in 2021. The new app is now providing over 2.5 million customers with improved speed and functionality of foundational banking services along with a range of new functions; • Further shifted decision making closer to customers by changing our organisational structure to slim down our head office and create shared services divisions for customer related activity and for corporate services; • Deploying next generation merchant terminals with enhanced functionality and mobility for our business customers; • Successfully launched our Banking as a Service model on a new cloud native technology platform; and • Reduced expenses by 10% (excluding notable items) including through: – Reduced the number of corporate office sites by 7%; – Consolidated 72 branches across Australia and New Zealand and reduced the ATM network by a further 8%; – Reduced headcount by over 4,000; and – Improving the efficiency of our supplier arrangements. Community Much of Eastern Australia has been affected by significant floods late in the half. We launched a $2 million flood support fund to provide emergency grants to customers, while also offering our natural disaster relief packages. With our Lismore branch directly impacted by the floods, we transported our “Bank in a Box” (a relocatable branch constructed from a shipping container) to restore critical services to the region when customers needed it most. Notable items Notable items had a small impact on First Half 2022, reducing cash earnings by $6 million. This compared to a $1,319 million reduction in Second Half 2021 and $282 million reduction in First Half 2021. While the net impact of notable items in First Half 2022 was small, they had a larger effect on individual line items. The main notable items in First Half 2022 included: • The gain on sale of Westpac Life-NZ- Limited and the Group’s motor vehicle dealer finance and novated leasing business; • A write-down of goodwill and capitalised software associated with the Group’s superannuation business; • An increase in provisions for customer refunds, repayments, associated costs and litigation penalties; and • Other costs associated with divestments. Details of notable items are in Section 1.3.3 Financial performance summary (First Half 2022 compared to Second Half 2021) Cash earnings for First Half 2022 were $3,095 million, up $1,280 million on Second Half 2021. Our cash return on equity was 8.73% while cash earnings per share were 85.4 cents per share. The higher cash earnings were predominantly due to a $1,313 reduction in notable items. Excluding notable items, cash earnings for First Half 2022 were $3,101 million, down $33 million or 1% on Second Half 2021. The decrease was mostly due to a $357 million turnaround in impairment charges (a charge of $139 million in First Half 2022 compared to an impairment benefit of $218 million in Second Half 2021). Core earnings, excluding notable items, of $4,589 million were 6% up on Second Half 2021. |
| 1 2 3 4 5 6 7 15 WESTPAC GROUP 2022 INTERIM FINANCIAL RESULTS Review of Group operations Net interest income of $8,028 million was down 3% over the six months with a 14 basis point decrease in net interest margin partly offset by a 6% increase in average interest-earning assets. Within average interest-earning assets, average lending increased 2% over the half while average liquid assets were 22% higher. Lower margins were due to intense competition across mortgages and business lending, and the mix impact of growing faster in lower spread lending products. The significant increase in liquid assets also impacted margins and was due to the wind-down in the Reserve Bank of Australia’s committed liquidity facility (“CLF” which is collateralised by self securitised mortgages) which necessitated a significant increase in high quality liquid assets. Partly offsetting these impacts were margin benefits from deposit repricing and a higher contribution from Treasury. Net interest income is discussed further in Section 2.2.1. Non-interest income of $1,931 million was down $63 million over the half. The impact of businesses sold reduced non-interest income by $131 million while notable items added $83 million, a net reduction of $48 million. Excluding these items, non-interest income was down $15 million. Lower wealth and insurance income from a reduced contribution from the revaluation of life policy liabilities was the key contributor to the decline. Trading income improved as increased market volatility in the half led to greater customer demand for fixed income and foreign exchange products. Fee income was also higher as increased economic activity flowed through to higher cards revenue. Non-interest income is discussed further in Section 2.2.5. Operating expenses of $5,366 million were $1,936 million, or 27%, lower than Second Half 2021. Excluding notable items operating expenses were $565 million, or 10%, lower. This reduction was supported by initiatives to achieve our target $8.0 billion cost base by Full Year 2024 including organisational redesign, consolidation of our corporate and branch networks and the completion of elements of our Fix agenda. Headcount was down by 7% as we reduced our use of third-party service providers. Lower software amortisation and lease costs (right of use asset) following the write-down of certain assets in Second Half 2021, along with greater use of leave provisions also contributed to the decline. Some of the expense decline was due to timing differences, with investment spending typically higher in the second half of each year. Operating expenses are discussed further in Section 2.2.8. First Half 2022 recorded an impairment charge of $139 million compared to an impairment benefit of $218 million in Second Half 2021. Relative to Second Half 2021, the rise in impairment charges was mostly due to an increase in the downside economic scenario weight, and an increase in overlay provisions which more than offset the impact of improving credit metrics. The additional overlays respond to increased uncertainty and risks arising from the current geopolitical environment and the potential for losses from recent climate events (floods) that are not captured in our modelled expected credit losses. Impairment charges are discussed further in Section 2.2.9. Balance sheet and credit quality The Group maintained its strong balance sheet with a common equity tier 1 (CET1) capital ratio of 11.3%, funding and liquidity metrics are all comfortably above regulatory minimums and most credit quality metrics improved. Net loans increased $8.8 billion, or 1%, mostly from an increase in Australian mortgages (up $2.7 billion) and Australian business loans (up $8.3 billion). Growth in Australian mortgages was concentrated in owner-occupied loans (up $5.2 billion), with investor and line of credit lending down $2.8 billion. Improved economic conditions and activity supported an increase in business lending, including merger and acquisition activity and higher utilisation of existing facilities. Lending to the agriculture and property sectors also contributed to the increase. Net loans in New Zealand increased NZ$1.4 billion (a decrease of $1.0 billion in A$). Loans are discussed further in Section 2.2.2. Customer deposits increased $20.6 billion, or 4%, over the half, more than double the increase in lending, leading to an almost 2 percentage point increase in the deposit to loan ratio to 83.5%. Increased liquidity in the financial system supported by government and central bank stimulus measures has led to an increase in deposits in both Australia and New Zealand. Low interest rates have also seen customers prefer to hold funds in at call accounts rather than term deposits. In Australia, at call accounts increased $16.2 billion, or 5%, over the half, with term deposits rising $2.1 billion, or 2%. With interest rates beginning to rise in New Zealand, we have begun to see an increased preference for term deposits which increased NZ$1.7 billion, or 6%, while at call deposits were little changed. Deposits are discussed further in Section 2.2.3. Credit quality continued to improve in First Half 2022 from the success of Government stimulus measures, stronger labour market conditions, low interest rates and the banking support provided to customers through the major COVID-19 related disruptions. Impaired assets to gross loans were 23 basis points at 31 March 2022 compared to 30 basis points at 30 September 2021. This was mostly due to a partial write-off and a reduction in new impaired assets, with no new impaired assets greater than $50 million emerging during the half. Stressed exposures to total committed exposures ended the six months at 1.10% compared to 1.36% at 30 September 2021. Delinquencies were also lower with mortgage 90+ day delinquencies down 17 basis points to 0.82% and other consumer 90+ day delinquencies down 13 basis points to 1.62%. |
| 16 WESTPAC GROUP 2022 INTERIM FINANCIAL RESULTS Review of Group operations Total provision balances were 6% lower over the half at $4.7 billion. Of the total, individually assessed provisions were lower from low new IAPs and the partial write-off of one large exposure. Collectively assessed provisions were little changed as the model outcomes from the improved conditions and outlook, were offset by an increased weight to the downside economic scenario and higher provision overlays. Our ratio of total provisions to credit risk weighted assets was 1.30% at 31 March 2022 down from 1.40% at 30 September 2021. Our ratio of impaired exposure provisions to impaired exposures was 48%. Credit quality is discussed further in Section 2.3. The Group reported a CET1 ratio of 11.3% at 31 March 2022, lower than the 12.3% reported at September 2021, mostly due to our $3.5 billion share buy-back. Our level of capital is comfortably above regulatory requirements and within our new preferred CET1 capital range of 11.0% to 11.5% that applies from 1 January 2023. Capital is discussed further in Section 2.5. Our funding and liquidity ratios remained comfortably above regulatory requirements with the average liquidity coverage ratio (LCR) for First Half 2022 of 137% and the net stable funding ratio (NSFR) ending the half at 125%. In First Half 2022, high quality liquid assets (HQLA) increased as we prepared for the progressive reduction in the CLF over the 2022 calendar year. This followed the decision by APRA to wind-down the facility used by certain Australian banks to meet their LCR requirements. During the half we also completed a $3.5 billion off-market share buy-back. The additional funding needs of these developments were largely met by customer deposit growth of 4% which was well above growth in loans of 1%. Funding and liquidity are discussed in Section 2.4.2 Shareholders Towards the end of the half, we completed a $3.5 billion off-market share buy-back (4.6% of shares on issue at that time), contributing to a 1% reduction in average shares on issue in First Half 2022. Our return on equity was 8.7% up 3.7 percentage points from Second Half 2021. Most of this increase was from the improved earnings, with a small contribution (10 basis points) from lower average equity. Earnings per share of 85.4 cents were up from 49.5 cents for Second Half 2021. Net tangible assets per ordinary share were $17.22 up 2% over the half. Given our cash earnings increase and strong capital levels we have determined to pay a First Half 2022 dividend of 61 cents per share. For further information on dividends refer to Capital and dividends Note 2.5. Financial performance First Half 2022 – First Half 2021 Cash earnings of $3,095 million were down $442 million or 12% over First Half 2021. Excluding notable items, cash earnings were $3,101 million, down $718 million, or 19%. This decrease was principally due to a $511 million movement in impairment charges ($358 million after tax) and a $377 million decrease in net interest income. Net interest income was 5% lower over the prior corresponding period, with net interest margin 24 basis points lower. The decline was due to lower interest rates, loan competition and the mix impact from an increase in lower yielding liquid assets. Average interest-earning assets increased 7% over the year, mostly from the rise in liquid assets and a 3% increase in average lending. Total spot lending was up $29.5 billion, or 4% over the year, with higher mortgage lending in Australia (up $14.7 billion) and higher New Zealand lending (up NZ$3.5 billion, A$4.3 billion) and a $13.8 billion increase (up 10%) in Australian business lending. Customer deposits increased $50.5 billion, lifting the customer deposit to loan ratio to 83.5%. Most of the deposit increase was in Australian at call and non-interest bearing accounts, which increased $46.4 billion and $5.4 billion respectively. These increases were partly offset by lower term deposits. Non-interest income was down $399 million, or 17% lower than the prior corresponding period. Excluding notable items and businesses sold, non-interest income was $192 million lower, largely from the impact of yield curve movements on the life insurance policyholder liability. Expenses were down 10% over the prior corresponding period due principally to lower notable items. Excluding notable items, expenses were down $101 million or 2%. The decrease (excluding notable items) was primarily due to lower software amortisation and reduced third party spending. This was partly offset by higher employee expenses linked to improving our management of risk. First Half 2022 recorded an impairment charge of $139 million compared to an impairment benefit of $372 million in First Half 2021. The impairment charge in First Half 2022 includes an increase in overlay provisions raised to address uncertainty and risks arising from geopolitical tensions and the potential impacts of recent floods. |
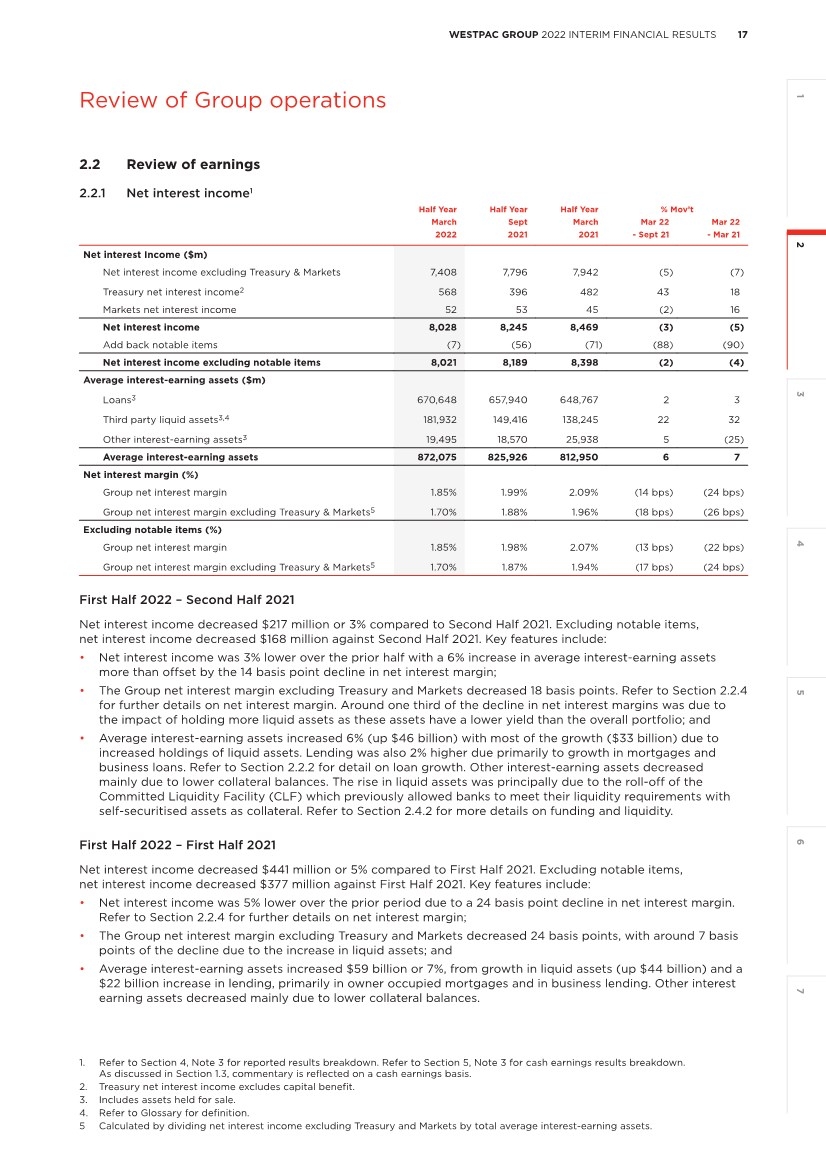
| 1 2 3 4 5 6 7 17 WESTPAC GROUP 2022 INTERIM FINANCIAL RESULTS Review of Group operations 2.2 Review of earnings 2.2.1 Net interest income 1 Half Year Half Year Half Year % Mov’t March Sept March Mar 22 Mar 22 2022 2021 2021 - Sept 21 - Mar 21 Net interest Income ($m) Net interest income excluding Treasury & Markets 7,408 7,796 7,942 (5) (7) Treasury net interest income 2 568 396 482 43 18 Markets net interest income 52 53 45 (2) 16 Net interest income 8,028 8,245 8,469 (3) (5) Add back notable items (7) (56) (71) (88) (90) Net interest income excluding notable items 8,021 8,189 8,398 (2) (4) Average interest-earning assets ($m) Loans 3 670,648 657,940 648,767 2 3 Third party liquid assets 3,4 181,932 149,416 138,245 22 32 Other interest-earning assets 3 19,495 18,570 25,938 5 (25) Average interest-earning assets 872,075 825,926 812,950 6 7 Net interest margin (%) Group net interest margin 1.85% 1.99% 2.09% (14 bps) (24 bps) Group net interest margin excluding Treasury & Markets 5 1.70% 1.88% 1.96% (18 bps) (26 bps) Excluding notable items (%) Group net interest margin 1.85% 1.98% 2.07% (13 bps) (22 bps) Group net interest margin excluding Treasury & Markets 5 1.70% 1.87% 1.94% (17 bps) (24 bps) First Half 2022 – Second Half 2021 Net interest income decreased $217 million or 3% compared to Second Half 2021. Excluding notable items, net interest income decreased $168 million against Second Half 2021. Key features include: • Net interest income was 3% lower over the prior half with a 6% increase in average interest-earning assets more than offset by the 14 basis point decline in net interest margin; • The Group net interest margin excluding Treasury and Markets decreased 18 basis points. Refer to Section 2.2.4 for further details on net interest margin. Around one third of the decline in net interest margins was due to the impact of holding more liquid assets as these assets have a lower yield than the overall portfolio; and • Average interest-earning assets increased 6% (up $46 billion) with most of the growth ($33 billion) due to increased holdings of liquid assets. Lending was also 2% higher due primarily to growth in mortgages and business loans. Refer to Section 2.2.2 for detail on loan growth. Other interest-earning assets decreased mainly due to lower collateral balances. The rise in liquid assets was principally due to the roll-off of the Committed Liquidity Facility (CLF) which previously allowed banks to meet their liquidity requirements with self-securitised assets as collateral. Refer to Section 2.4.2 for more details on funding and liquidity. First Half 2022 – First Half 2021 Net interest income decreased $441 million or 5% compared to First Half 2021. Excluding notable items, net interest income decreased $377 million against First Half 2021. Key features include: • Net interest income was 5% lower over the prior period due to a 24 basis point decline in net interest margin. Refer to Section 2.2.4 for further details on net interest margin; • The Group net interest margin excluding Treasury and Markets decreased 24 basis points, with around 7 basis points of the decline due to the increase in liquid assets; and • Average interest-earning assets increased $59 billion or 7%, from growth in liquid assets (up $44 billion) and a $22 billion increase in lending, primarily in owner occupied mortgages and in business lending. Other interest earning assets decreased mainly due to lower collateral balances. 1. Refer to Section 4, Note 3 for reported results breakdown. Refer to Section 5, Note 3 for cash earnings results breakdown. As discussed in Section 1.3, commentary is reflected on a cash earnings basis. 2. Treasury net interest income excludes capital benefit. 3. Includes assets held for sale. 4. Refer to Glossary for definition. 5 Calculated by dividing net interest income excluding Treasury and Markets by total average interest-earning assets. Review of Group operations |
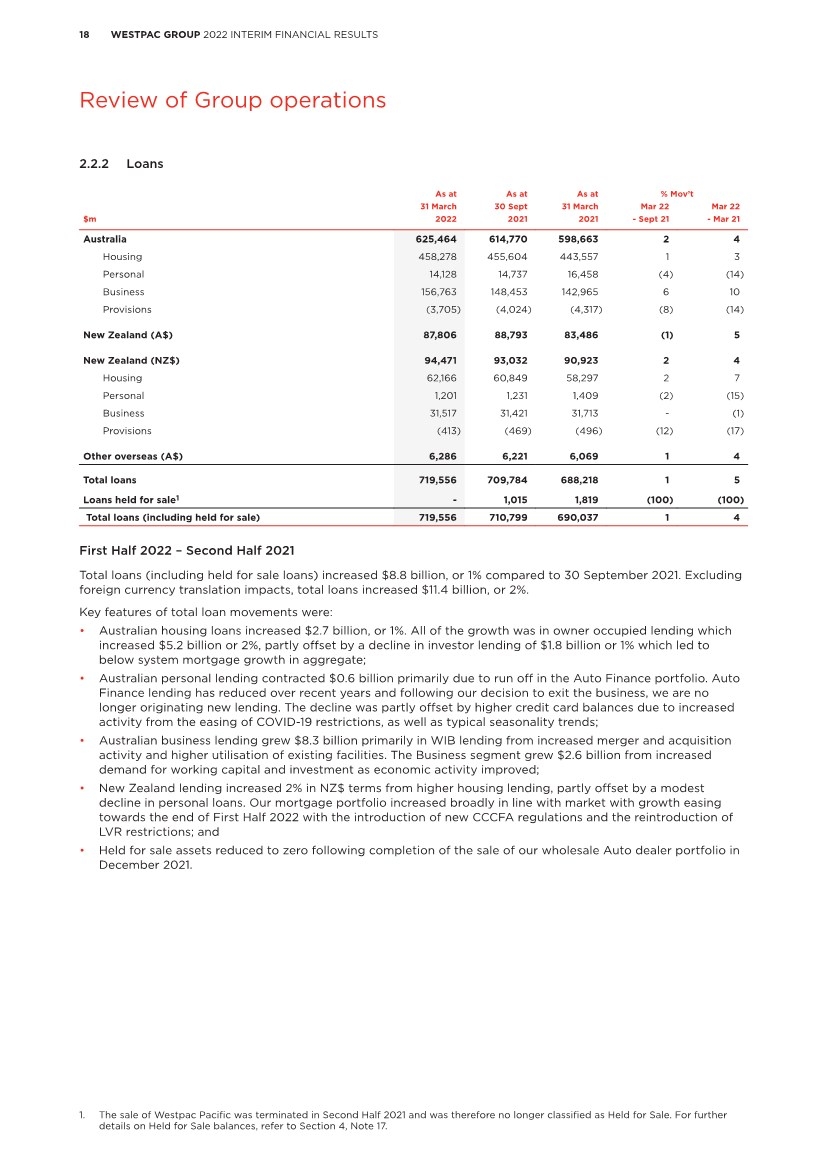
| 18 WESTPAC GROUP 2022 INTERIM FINANCIAL RESULTS Review of Group operations 2.2.2 Loans As at As at As at % Mov’t 31 March 30 Sept 31 March Mar 22 Mar 22 $m 2022 2021 2021 - Sept 21 - Mar 21 Australia 625,464 614,770 598,663 2 4 Housing 458,278 455,604 443,557 1 3 Personal 14,128 14,737 16,458 (4) (14) Business 156,763 148,453 142,965 6 10 Provisions (3,705) (4,024) (4,317) (8) (14) New Zealand (A$) 87,806 88,793 83,486 (1) 5 New Zealand (NZ$) 94,471 93,032 90,923 2 4 Housing 62,166 60,849 58,297 2 7 Personal 1,201 1,231 1,409 (2) (15) Business 31,517 31,421 31,713 - (1) Provisions (413) (469) (496) (12) (17) Other overseas (A$) 6,286 6,221 6,069 1 4 Total loans 719,556 709,784 688,218 1 5 Loans held for sale1 - 1,015 1,819 (100) (100) Total loans (including held for sale) 719,556 710,799 690,037 1 4 First Half 2022 – Second Half 2021 Total loans (including held for sale loans) increased $8.8 billion, or 1% compared to 30 September 2021. Excluding foreign currency translation impacts, total loans increased $11.4 billion, or 2%. Key features of total loan movements were: • Australian housing loans increased $2.7 billion, or 1%. All of the growth was in owner occupied lending which increased $5.2 billion or 2%, partly offset by a decline in investor lending of $1.8 billion or 1% which led to below system mortgage growth in aggregate; • Australian personal lending contracted $0.6 billion primarily due to run off in the Auto Finance portfolio. Auto Finance lending has reduced over recent years and following our decision to exit the business, we are no longer originating new lending. The decline was partly offset by higher credit card balances due to increased activity from the easing of COVID-19 restrictions, as well as typical seasonality trends; • Australian business lending grew $8.3 billion primarily in WIB lending from increased merger and acquisition activity and higher utilisation of existing facilities. The Business segment grew $2.6 billion from increased demand for working capital and investment as economic activity improved; • New Zealand lending increased 2% in NZ$ terms from higher housing lending, partly offset by a modest decline in personal loans. Our mortgage portfolio increased broadly in line with market with growth easing towards the end of First Half 2022 with the introduction of new CCCFA regulations and the reintroduction of LVR restrictions; and • Held for sale assets reduced to zero following completion of the sale of our wholesale Auto dealer portfolio in December 2021. 1. The sale of Westpac Pacific was terminated in Second Half 2021 and was therefore no longer classified as Held for Sale. For further details on Held for Sale balances, refer to Section 4, Note 17. |
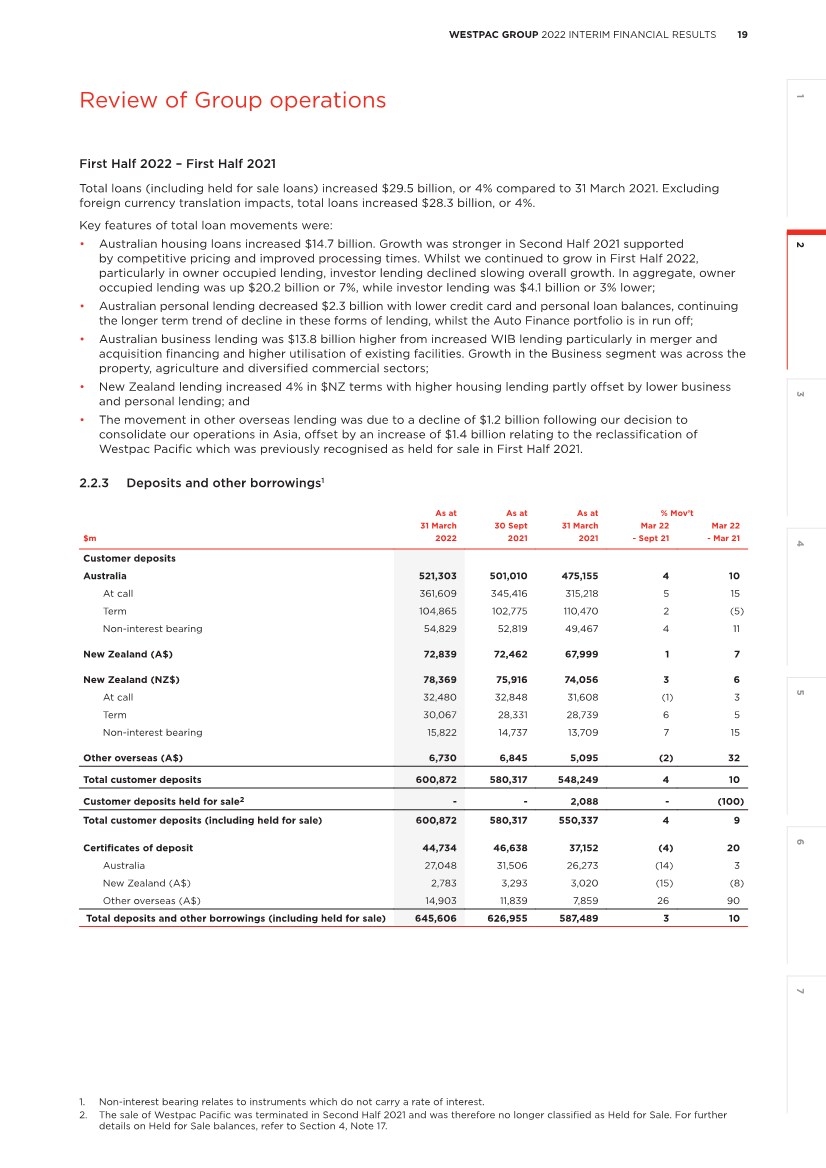
| 1 2 3 4 5 6 7 19 WESTPAC GROUP 2022 INTERIM FINANCIAL RESULTS Review of Group operations First Half 2022 – First Half 2021 Total loans (including held for sale loans) increased $29.5 billion, or 4% compared to 31 March 2021. Excluding foreign currency translation impacts, total loans increased $28.3 billion, or 4%. Key features of total loan movements were: • Australian housing loans increased $14.7 billion. Growth was stronger in Second Half 2021 supported by competitive pricing and improved processing times. Whilst we continued to grow in First Half 2022, particularly in owner occupied lending, investor lending declined slowing overall growth. In aggregate, owner occupied lending was up $20.2 billion or 7%, while investor lending was $4.1 billion or 3% lower; • Australian personal lending decreased $2.3 billion with lower credit card and personal loan balances, continuing the longer term trend of decline in these forms of lending, whilst the Auto Finance portfolio is in run off; • Australian business lending was $13.8 billion higher from increased WIB lending particularly in merger and acquisition financing and higher utilisation of existing facilities. Growth in the Business segment was across the property, agriculture and diversified commercial sectors; • New Zealand lending increased 4% in $NZ terms with higher housing lending partly offset by lower business and personal lending; and • The movement in other overseas lending was due to a decline of $1.2 billion following our decision to consolidate our operations in Asia, offset by an increase of $1.4 billion relating to the reclassification of Westpac Pacific which was previously recognised as held for sale in First Half 2021. 2.2.3 Deposits and other borrowings 1 As at As at As at % Mov’t 31 March 30 Sept 31 March Mar 22 Mar 22 $m 2022 2021 2021 - Sept 21 - Mar 21 Customer deposits Australia 521,303 501,010 475,155 4 10 At call 361,609 345,416 315,218 5 15 Term 104,865 102,775 110,470 2 (5) Non-interest bearing 54,829 52,819 49,467 4 11 New Zealand (A$) 72,839 72,462 67,999 1 7 New Zealand (NZ$) 78,369 75,916 74,056 3 6 At call 32,480 32,848 31,608 (1) 3 Term 30,067 28,331 28,739 6 5 Non-interest bearing 15,822 14,737 13,709 7 15 Other overseas (A$) 6,730 6,845 5,095 (2) 32 Total customer deposits 600,872 580,317 548,249 4 10 Customer deposits held for sale 2 - - 2,088 - (100) Total customer deposits (including held for sale) 600,872 580,317 550,337 4 9 Certificates of deposit 44,734 46,638 37,152 (4) 20 Australia 27,048 31,506 26,273 (14) 3 New Zealand (A$) 2,783 3,293 3,020 (15) (8) Other overseas (A$) 14,903 11,839 7,859 26 90 Total deposits and other borrowings (including held for sale) 645,606 626,955 587,489 3 10 1. Non-interest bearing relates to instruments which do not carry a rate of interest. 2. The sale of Westpac Pacific was terminated in Second Half 2021 and was therefore no longer classified as Held for Sale. For further details on Held for Sale balances, refer to Section 4, Note 17. |
| 20 WESTPAC GROUP 2022 INTERIM FINANCIAL RESULTS Review of Group operations First Half 2022 – Second Half 2021 Total customer deposits increased $20.6 billion, or 4% compared to 30 September 2021. Excluding foreign currency translation impacts, customer deposits increased $23.2 billion, or 4%. Growth in deposits has continued to be supported by government stimulus measures (in response to COVID-19) that has injected additional funding to the system. This has seen deposit growth consistently exceed loan growth over recent halves, contributing to a rise in the customer deposit to loan ratio to 83.5% from 81.6% from six months earlier. Key features of total customer deposits movements were: • Australian deposits increased $20.3 billion with growth across transaction, savings, mortgage offset accounts and term deposits. Growth in term products was in the institutional segment, whilst retail term deposits continued to decline in the low interest rate environment as customers are less inclined to hold their funds in fixed term accounts; and • New Zealand customer deposits increased in NZ$ terms with growth in the household segment. As interest rates have started to increase in New Zealand, we are seeing growth directed into term deposits. First Half 2022 – First Half 2021 Total customer deposits (including held for sale deposits) increased $50.5 billion, or 9% compared to 31 March 2021. Excluding foreign currency translation impacts, customer deposits increased $49.5 billion, or 9%. Customer deposit growth exceeded loan growth over the year with the deposit to loan ratio rising by around 4 percentage points. Key features of total customer deposits growth were: • In Australia, customer preference for at call products over term deposits continued with at call accounts increasing by $46.4 billion. Non-interest bearing deposits also increased $5.4 billion from growth in mortgage offset balances; • New Zealand customer deposits increased in the household segment with growth spread across term and at call products; and • Adjusting for Westpac Pacific deposits ($2.1 billion) which were previously classified as held for sale, other overseas deposits decreased as we continue to consolidate our operations in Asia. |
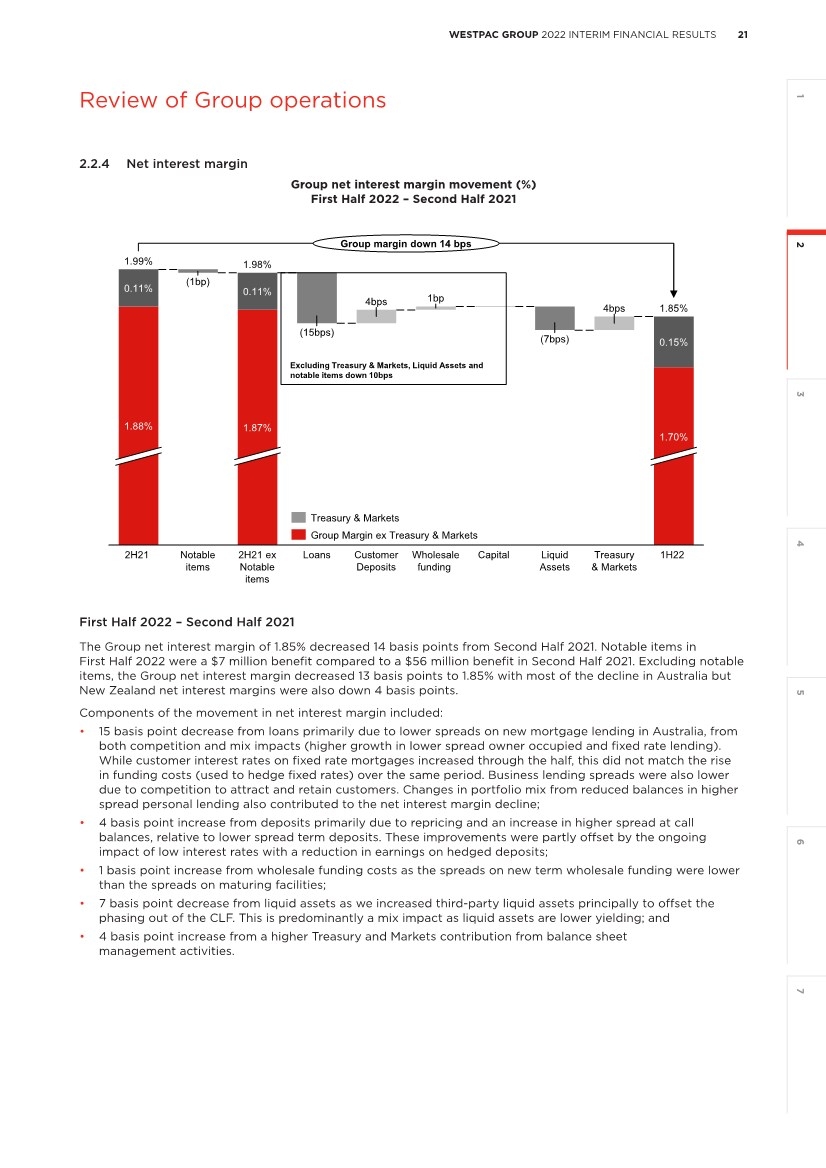
| 1 2 3 4 5 6 7 21 WESTPAC GROUP 2022 INTERIM FINANCIAL RESULTS Review of Group operations 2.2.4 Net interest margin Group net interest margin movement (%) First Half 2022 – Second Half 2021 Group net interest margin movement (%) (cash earnings) First Half 2022 – Second Half 2021 (1bp) Loans 1.87% 4bps 2H21 ex Notable items Customer Deposits 0.15% 1.85% Capital 1.70% (7bps) Liquid Assets 4bps 1bp 1H22 Wholesale funding 0.11% Notable items 0.11% 1.88% 1.99% 1.98% (15bps) 2H21 Treasury & Markets Group margin down 14 bps Treasury & Markets Group Margin ex Treasury & Markets Excluding Treasury & Markets, Liquid Assets and notable items down 10bps First Half 2022 – Second Half 2021 The Group net interest margin of 1.85% decreased 14 basis points from Second Half 2021. Notable items in First Half 2022 were a $7 million benefit compared to a $56 million benefit in Second Half 2021. Excluding notable items, the Group net interest margin decreased 13 basis points to 1.85% with most of the decline in Australia but New Zealand net interest margins were also down 4 basis points. Components of the movement in net interest margin included: • 15 basis point decrease from loans primarily due to lower spreads on new mortgage lending in Australia, from both competition and mix impacts (higher growth in lower spread owner occupied and fixed rate lending). While customer interest rates on fixed rate mortgages increased through the half, this did not match the rise in funding costs (used to hedge fixed rates) over the same period. Business lending spreads were also lower due to competition to attract and retain customers. Changes in portfolio mix from reduced balances in higher spread personal lending also contributed to the net interest margin decline; • 4 basis point increase from deposits primarily due to repricing and an increase in higher spread at call balances, relative to lower spread term deposits. These improvements were partly offset by the ongoing impact of low interest rates with a reduction in earnings on hedged deposits; • 1 basis point increase from wholesale funding costs as the spreads on new term wholesale funding were lower than the spreads on maturing facilities; • 7 basis point decrease from liquid assets as we increased third-party liquid assets principally to offset the phasing out of the CLF. This is predominantly a mix impact as liquid assets are lower yielding; and • 4 basis point increase from a higher Treasury and Markets contribution from balance sheet management activities. |
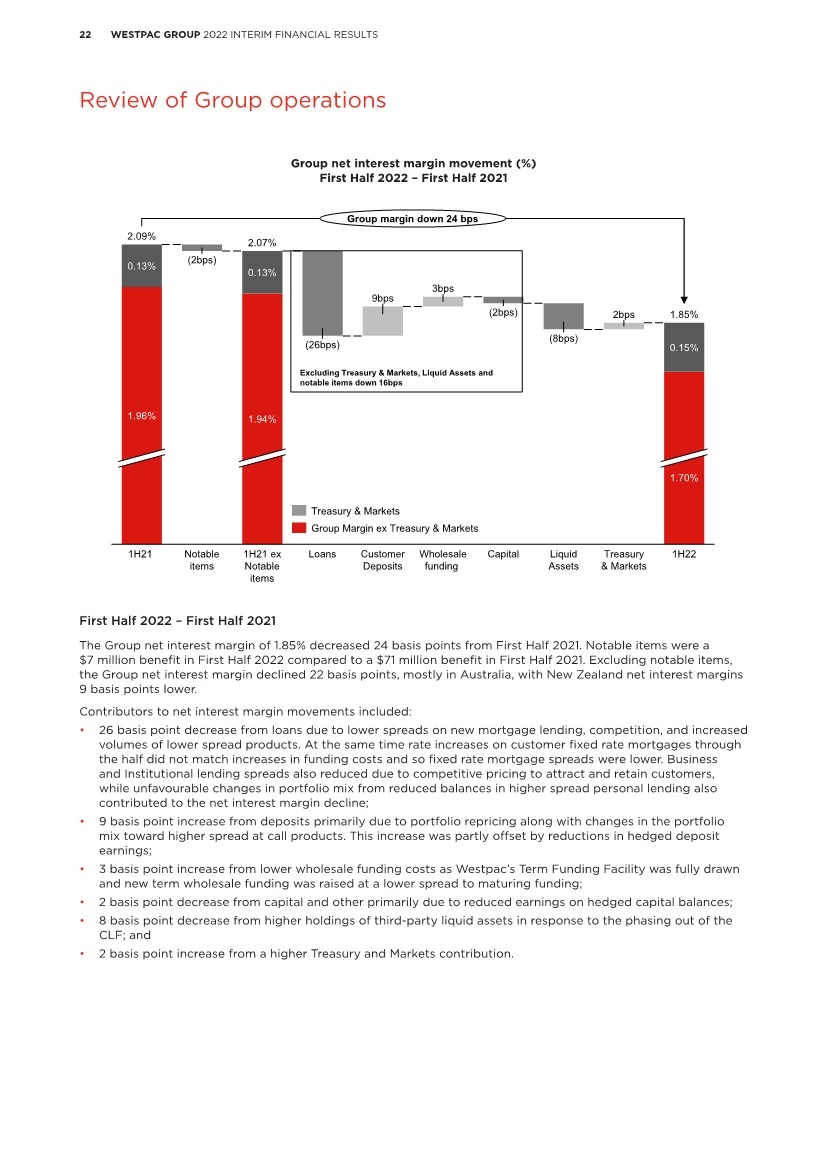
| 22 WESTPAC GROUP 2022 INTERIM FINANCIAL RESULTS Review of Group operations Group net interest margin movement (%) First Half 2022 – First Half 2021 9bps 0.15% 1H21 2bps (8bps) 1.85% Wholesale funding (2bps) Capital Customer Deposits Liquid Assets 3bps (26bps) 2.09% 1H21 ex Notable items 1.70% 1H22 1.94% Loans 0.13% Notable items 2.07% (2bps) 1.96% 0.13% Treasury & Markets Group margin down 24 bps Group net interest margin movement (%) (cash earnings) First Half 2022 – First Half 2021 Treasury & Markets Group Margin ex Treasury & Markets Excluding Treasury & Markets, Liquid Assets and notable items down 16bps First Half 2022 – First Half 2021 The Group net interest margin of 1.85% decreased 24 basis points from First Half 2021. Notable items were a $7 million benefit in First Half 2022 compared to a $71 million benefit in First Half 2021. Excluding notable items, the Group net interest margin declined 22 basis points, mostly in Australia, with New Zealand net interest margins 9 basis points lower. Contributors to net interest margin movements included: • 26 basis point decrease from loans due to lower spreads on new mortgage lending, competition, and increased volumes of lower spread products. At the same time rate increases on customer fixed rate mortgages through the half did not match increases in funding costs and so fixed rate mortgage spreads were lower. Business and Institutional lending spreads also reduced due to competitive pricing to attract and retain customers, while unfavourable changes in portfolio mix from reduced balances in higher spread personal lending also contributed to the net interest margin decline; • 9 basis point increase from deposits primarily due to portfolio repricing along with changes in the portfolio mix toward higher spread at call products. This increase was partly offset by reductions in hedged deposit earnings; • 3 basis point increase from lower wholesale funding costs as Westpac’s Term Funding Facility was fully drawn and new term wholesale funding was raised at a lower spread to maturing funding; • 2 basis point decrease from capital and other primarily due to reduced earnings on hedged capital balances; • 8 basis point decrease from higher holdings of third-party liquid assets in response to the phasing out of the CLF; and • 2 basis point increase from a higher Treasury and Markets contribution. |
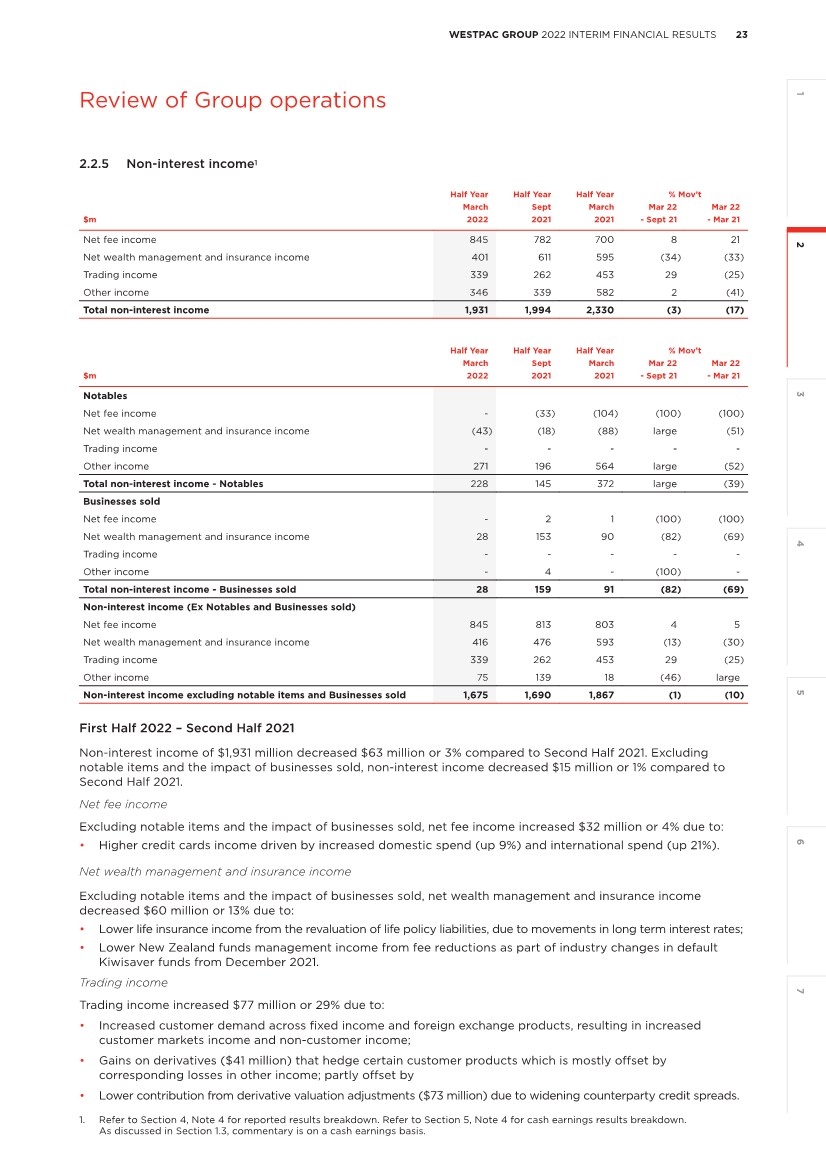
| 3 4 5 6 7 2 1 23 WESTPAC GROUP 2022 INTERIM FINANCIAL RESULTS Review of Group operations 2.2.5 Non-interest income 1 Half Year Half Year Half Year % Mov’t March Sept March Mar 22 Mar 22 $m 2022 2021 2021 - Sept 21 - Mar 21 Net fee income 845 782 700 8 21 Net wealth management and insurance income 401 611 595 (34) (33) Trading income 339 262 453 29 (25) Other income 346 339 582 2 (41) Total non-interest income 1,931 1,994 2,330 (3) (17) Half Year Half Year Half Year % Mov’t March Sept March Mar 22 Mar 22 $m 2022 2021 2021 - Sept 21 - Mar 21 Notables Net fee income - (33) (104) (100) (100) Net wealth management and insurance income (43) (18) (88) large (51) Trading income - - - - - Other income 271 196 564 large (52) Total non-interest income - Notables 228 145 372 large (39) Businesses sold Net fee income - 2 1 (100) (100) Net wealth management and insurance income 28 153 90 (82) (69) Trading income - - - - - Other income - 4 - (100) - Total non-interest income - Businesses sold 28 159 91 (82) (69) Non-interest income (Ex Notables and Businesses sold) Net fee income 845 813 803 4 5 Net wealth management and insurance income 416 476 593 (13) (30) Trading income 339 262 453 29 (25) Other income 75 139 18 (46) large Non-interest income excluding notable items and Businesses sold 1,675 1,690 1,867 (1) (10) First Half 2022 – Second Half 2021 Non-interest income of $1,931 million decreased $63 million or 3% compared to Second Half 2021. Excluding notable items and the impact of businesses sold, non-interest income decreased $15 million or 1% compared to Second Half 2021. Net fee income Excluding notable items and the impact of businesses sold, net fee income increased $32 million or 4% due to: • Higher credit cards income driven by increased domestic spend (up 9%) and international spend (up 21%). Net wealth management and insurance income Excluding notable items and the impact of businesses sold, net wealth management and insurance income decreased $60 million or 13% due to: • Lower life insurance income from the revaluation of life policy liabilities, due to movements in long term interest rates; • Lower New Zealand funds management income from fee reductions as part of industry changes in default Kiwisaver funds from December 2021. Trading income Trading income increased $77 million or 29% due to: • Increased customer demand across fixed income and foreign exchange products, resulting in increased customer markets income and non-customer income; • Gains on derivatives ($41 million) that hedge certain customer products which is mostly offset by corresponding losses in other income; partly offset by • Lower contribution from derivative valuation adjustments ($73 million) due to widening counterparty credit spreads. 1. Refer to Section 4, Note 4 for reported results breakdown. Refer to Section 5, Note 4 for cash earnings results breakdown. As discussed in Section 1.3, commentary is on a cash earnings basis. Review of Group operations |
| 24 WESTPAC GROUP 2022 INTERIM FINANCIAL RESULTS Review of Group operations Other income Other income increased $7 million or 2% primarily due to higher notable items compared to Second Half 2021. First Half 2022 included a gain on sale of the Wholesale Auto finance business ($169 million) and New Zealand Life Insurance ($119 million), partly offset by a post-sale adjustment to earn-out payments associated with the sale of Vendor Finance ($18 million). Excluding notable items and the impact of businesses sold, other income decreased by $64 million or 46%, driven by: • Fair value losses on markets related customer products ($42 million), with the risk associated with these instruments hedged and gains reported in trading income; • Lower revaluations of fintech investments; partly offset by • A one-off payment related to achieving specific milestones under the General Insurance distribution arrangement ($25 million). First Half 2022 – First Half 2021 Non-interest income of $1,931 million decreased $399 million or 17% compared to First Half 2021. Excluding notable items and impact of businesses sold, non-interest income decreased $192 million or 10% compared to First Half 2021. Net fee income Excluding notable items and the impact of businesses sold, net fee income increased $42 million or 5% due to: • Higher credit cards fees from increased international spend (up 36%); • Higher mortgage fees due to increased market activity; partly offset by • Lower net merchant revenue from higher transaction costs; • Lower fee income due to the simplification initiatives including the removal of certain account keeping fees. Net wealth management and insurance income Excluding notable items and the impact of businesses sold, net wealth management and insurance income decreased $177 million or 30% due to: • Lower life insurance income driven by the revaluation of life policy liabilities due to movements in long term interest rates; • Lower wealth income driven by the continued migration of customers from legacy platforms to the lower fee Panorama platform. This was partly offset by a 5% increase in funds under administration to $230 billion from higher equity markets; • Lower New Zealand funds management income from fee reductions as part of industry changes in default Kiwisaver funds from December 2021. Trading income Trading income decreased $114 million or 25% due to: • Lower contribution from derivative valuation adjustments ($86 million) due to widening counterparty credit spreads; partly offset by • Increased customer demand across fixed income and foreign exchange products, resulting in increased customer markets income. Other income Other income decreased $236 million or 41% primarily due to lower notable items compared to First Half 2021. First Half 2022 includes a gain on sale of the Wholesale Auto finance business ($170 million) and New Zealand Life Insurance ($119 million), partly offset by a post-sale adjustment to earn-out payments associated with the sale of Vendor Finance ($18 million). Excluding notable items and the impact of businesses sold, other income increased $57 million, driven by a one-off payment related to achieving specific milestones under the General Insurance distribution arrangement ($25 million), and higher revaluations of fintech investments. |
| 3 4 5 6 7 2 1 25 WESTPAC GROUP 2022 INTERIM FINANCIAL RESULTS Review of Group operations 2.2.6 Group funds As at As at % Mov’t As at % Mov’t 31 March Net Other 30 Sept Mar 22 31 March Mar 22 $bn 2022 Inflows Outflows flows Mov’t 2021 Sept 21 2021 Mar 21 Superannuation 41.8 1.9 (2.9) (1.0) (2.6) 45.4 (8) 42.3 (1) Platforms 140.2 9.6 (9.5) 0.1 0.8 139.3 1 128.2 9 Packaged Funds 45.9 6.4 (7.4) (1.0) (0.5) 47.4 (3) 45.4 1 Total Australia funds 227.9 17.9 (19.8) (1.9) (2.3) 232.1 (2) 215.9 6 Total NZ funds (A$) 10.9 1.6 (1.5) 0.1 (0.7) 11.5 (5) 10.9 - Total Group funds 238.8 19.5 (21.3) (1.8) (3.0) 243.6 (2) 226.8 5 Total NZ funds (NZ$) 11.7 1.8 (1.6) 0.2 (0.5) 12.0 (3) 11.9 (2) Group funds comprises non-superannuation and superannuation regulated products provided to Australian and New Zealand customers through advised and direct channels. This includes wealth products distributed to Australian and New Zealand customers. Group funds decreased by $4.8 billion (or 2%) over the First Half 2022, primarily driven by market movements. Inflows of $19.5 billion were offset by outflows of $21.3 billion. 2.2.7 Markets related income 1 Half Year Half Year Half Year % Mov’t March Sept March Mar 22 Mar 22 $m 2022 2021 2021 - Sept 21 - Mar 21 Net interest income 52 54 45 (4) 16 Non-interest income 323 355 418 (9) (23) Total Markets income 375 409 463 (8) (19) Customer income 370 340 335 9 10 Non-customer income 34 25 75 36 (55) Derivatives valuation adjustments (29) 44 53 large large Total Markets income 375 409 463 (8) (19) Markets income comprises sales and risk management revenue derived from the creation, pricing and distribution of risk management products to the Group’s consumer, business, corporate and institutional customers. Dedicated relationship specialists provide product solutions to these customers to help manage their interest rate, foreign exchange, commodity, credit and structured products risk exposures. First Half 2022 – Second Half 2021 Total markets income decreased by $34 million, or 8%, compared to Second Half 2021 primarily due to lower contribution from derivative valuation adjustments as a result of credit spread widening (First Half 2022: $29 million loss; Second Half 2021: $44 million gain), partly offset by higher customer and non-customer income (up $39 million). Customer income increased 9% compared to Second Half 2021 from higher customer demand for hedging across fixed income and foreign exchange. Non-customer income increased $9 million compared to Second Half 2021, primarily from higher foreign exchange and commodities trading income reflecting greater market volatility. First Half 2022 – First Half 2021 Total markets income decreased by $88 million, or 19%, primarily due to a lower contribution from derivative valuation adjustments (down $82 million). Customer income increased by $35 million as a result from increased customer demand for fixed income hedging and higher foreign exchange volumes. Non-customer income decreased by 55%, largely from lower fixed income trading due to widening credit spreads in First Half 2022 compared to First Half 2021 which benefited from a tightening of credit spreads. 1. Markets income includes WIB, Specialist Businesses and Westpac New Zealand markets. Review of Group operations |
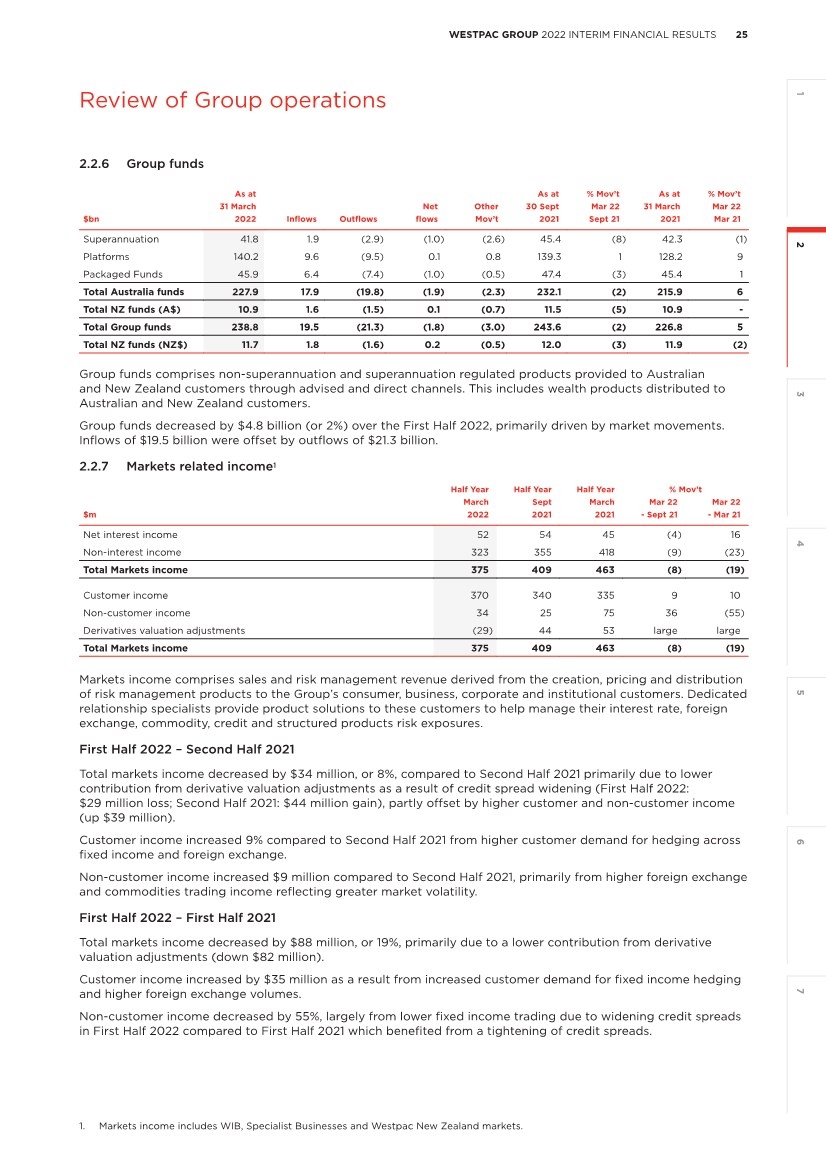
| 26 WESTPAC GROUP 2022 INTERIM FINANCIAL RESULTS Review of Group operations Markets Value at Risk (VaR) $m Average High Low Half Year 31 March 2022 5.0 11.0 3.1 Half Year 30 September 2021 5.7 8.5 4.1 Half Year 31 March 2021 23.5 34.7 4.6 The Components of Markets VaR are as follows: Average Half Year Half Year Half Year March Sept March $m 2022 2021 2021 Interest rate risk 3.6 3.5 8.0 Foreign exchange risk 1.3 1.4 1.6 Equity risk - - 0.4 Commodity risk 2.1 0.9 1.5 Credit and other market risks1 3.3 4.5 16.9 Diversification benefit (5.3) (4.6) (4.9) Net market risk 5.0 5.7 23.5 1. Includes pre-payment risk and credit spread risk (exposures to generic credit rating bonds). |
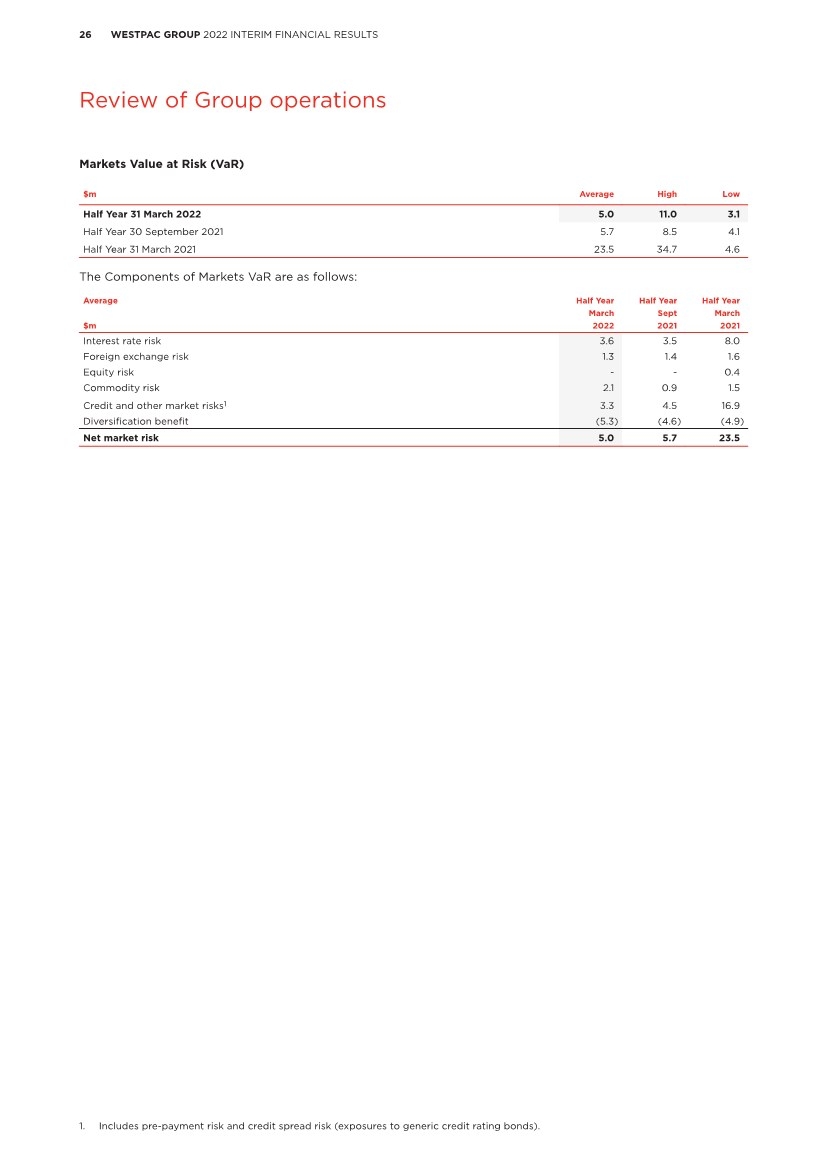
| 27 WESTPAC GROUP 2022 INTERIM FINANCIAL RESULTS 1 3 4 5 6 7 2 Review of Group operations 2.2.8 Operating expenses1 Half Year Half Year Half Year % Mov’t March Sept March Mar 22 Mar 22 $m 2022 2021 2021 - Sept 21 - Mar 21 Staff expenses (2,982) (3,263) (2,771) (9) 8 Occupancy expenses (391) (655) (543) (40) (28) Technology expenses (1,125) (1,723) (1,405) (35) (20) Other expenses (868) (1,661) (1,262) (48) (31) Total operating expenses (5,366) (7,302) (5,981) (27) (10) Excluding notables Staff expenses (2,963) (3,055) (2,688) (3) 10 Occupancy expenses (391) (462) (461) (15) (15) Technology expenses (1,080) (1,251) (1,227) (14) (12) Other expenses (701) (932) (860) (25) (18) Total operating expenses excluding notable items (5,135) (5,700) (5,236) (10) (2) Full Time Equivalent (FTE) employees As at As at As at % Mov’t 31 March 30 Sept 31 March Mar 22 Mar 22 Number of FTE 2022 2021 2021 - Sept 21 - Mar 21 Permanent employees 34,637 34,975 33,607 (1) 3 Temporary employees 4,186 5,168 5,140 (19) (19) FTE 38,823 40,143 38,747 (3) - Average FTE2 39,517 39,553 37,714 - 5 First Half 2022 – Second Half 2021 Operating expenses were $1,936 million (or 27%) lower compared to Second Half 2021. Excluding notable items, operating expenses were $565 million (or 10%) lower. The decline, excluding notable items reflects the execution of our plans to reset our cost base. FTE were 1,320 lower over the half as we continued to implement changes in our organisational structure progressively including the impacts from businesses sold, and from a reduction in resources required to manage COVID-19 activities. Total headcount including third-party providers and outsourced partners declined more significantly as a number of Fix strategic priority projects completed including the initial design phase of our CORE program. Staff expenses were $281 million (or 9%) lower. Excluding notable items, staff expenses were down by $92 million (or 3%) due to: • Impact of businesses sold; • Higher utilisation of leave provisions; and • These decreases were partly offset by the full period impact from the increase in the superannuation guarantee from 1 July 2021, annual salary increases from 1 January 2022 and costs associated with our organisational restructure. Occupancy expenses were $264 million (or 40%) lower. Excluding notable items, occupancy expenses were down $71 million (or 15%) from: • Corporate site rationalisation from consolidation of two CBD sites to one in both Adelaide and Melbourne; • Lower network costs from branch consolidation and ATM closures (70 branches consolidated and 117 ATMs were closed in Australia, 2 branches consolidated, and 18 ATMs were closed in New Zealand); and • Lower depreciation from the impact of property lease write-downs in Second Half 2021. Technology expenses were $598 million (or 35%) lower. Excluding notable items, technology expenses decreased $171 million (or 14%). Contributors to the decline were: • Lower software amortisation following write-downs in Second Half 2021; • Reduced investment spend, as we complete certain initiatives; and • Lower third-party spend as we move more services in-house. 1. Refer to Section 4, Note 5 for reported results breakdown. Refer to Section 5, Note 5 for cash earnings breakdown. As discussed in Section 1.3, commentary is on a cash earnings basis. 2. Averages are based on a six month period. Review of Group operations |
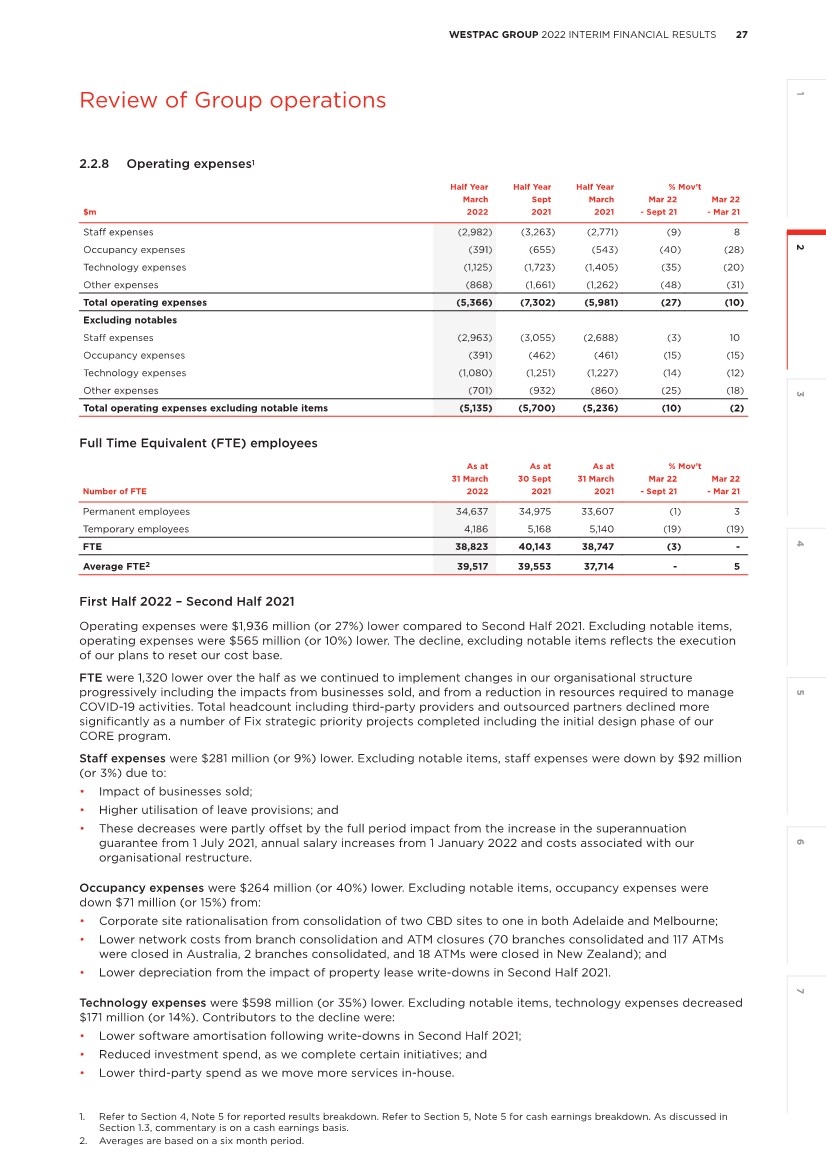
| 28 WESTPAC GROUP 2022 INTERIM FINANCIAL RESULTS Review of Group operations Other expenses were $793 million (or 48%) lower. Excluding notable items, other expenses decreased $231 million (or 25%) including: • Lower third-party spending from contract renegotiations and more disciplined use of third-party suppliers; and • A reduction in non-lending losses due to the decline in litigation costs. First Half 2022 – First Half 2021 Operating expenses were $615 million (or 10%) lower compared to First Half 2021. Excluding notable items, operating expenses were $101 million (or 2%) lower. Ongoing productivity initiatives and lower software and amortisation costs in Property and Technology are partly offset by the addition of over 500 FTE to support our strategic priorities. Staff expenses increased $211 million (or 8%). Excluding notable items, staff expenses were $275 million (or 10%) higher due to: • Additional resources to improve risk management and compliance, and support our Fix strategic priority; • Responding to higher mortgage volumes and bringing roles back to Australia; • The increase in the superannuation guarantee from 1 July 2021, and annual salary increases; and • Cost associated with our organisational restructure. Occupancy expenses were $152 million (or 28%) lower. Excluding notable items, occupancy expenses were $70 million (or 15%) lower with the main components including: • Corporate site rationalisation; • Lower network distribution costs; and • Lower depreciation from property lease write-downs in Second Half 2021. Technology expenses were $280 million (or 20%) lower. Excluding notable items, technology expenses decreased $147 million (or 12%) from: • A reduction in software amortisation following asset write-downs in Second Half 2021; and • Lower third-party spend as we move more services in-house. Other expenses decreased $394 million (or 31%). Excluding notable items, other expenses decreased $159 million (or 18%) mainly from lower third-party spend. |
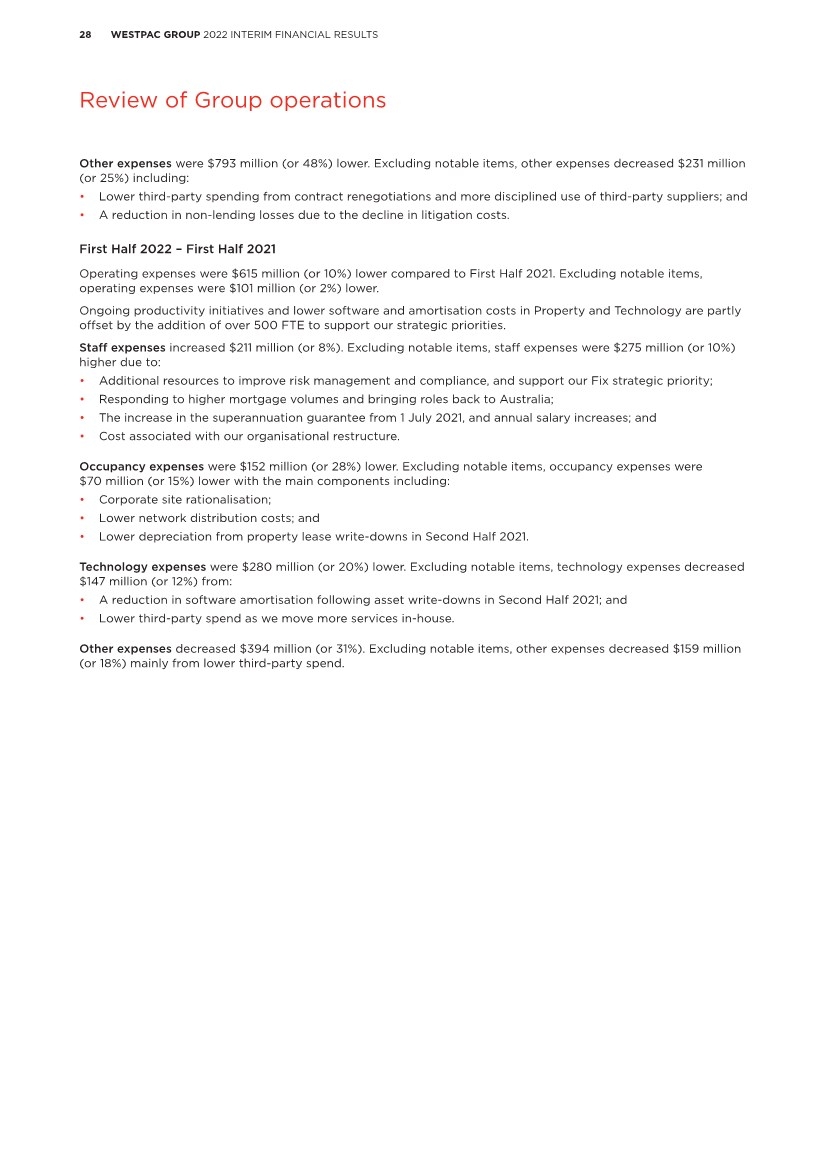
| 29 WESTPAC GROUP 2022 INTERIM FINANCIAL RESULTS 1 3 4 5 6 7 2 Review of Group operations Investment spend Half Year Half Year Half Year % Mov’t March Sept March Mar 22 Mar 22 $m 2022 2021 2021 - Sept 21 - Mar 21 Expensed 528 720 502 (27) 5 Capitalised software, fixed assets and prepayments 419 443 354 (5) 18 Total 947 1,163 856 (19) 11 Fix 653 859 572 (24) 14 Simplify 153 144 100 6 53 Perform 141 160 184 (12) (23) Total 947 1,163 856 (19) 11 In First Half 2022 we invested $947 million across the Group, this was $216 million down on Second Half 2021, and $91 million higher than First Half 2021. The movement in investment spending over recent half years largely reflects the timing of projects and some seasonality (more investment in the second half of the year) rather than a change in our investment appetite. Most investment spending (69% in First Half 2022) was directed to our Fix strategic priorities with 16% to Simplify and 15% to Perform. Investment under our three strategic priorities are described below. Fix Under the Fix strategic priority, we are improving our management of financial and non-financial risks and our risk culture. Investment in First Half 2022 included: • The CORE program includes a total of 82 deliverables and 343 activities. In First Half 2022 we submitted a further 73 activities (submitted to the independent reviewer for assessment) taking the total number of activities submitted to 194. Work undertaken included: – Completed systems and training to establish and document risk accountabilities for senior leaders; – We closed 82% of the high rated risk issues which were open at the beginning of Full Year 2021; and – Updated our key risk frameworks to ensure we are managing and capturing more risks in a consistent way. • Further updates to our AML/CTF systems including: – Improving ability to block transactions in certain jurisdictions to enhance our sanctions controls; – Automation of more threshold transaction reporting, with enhanced audit trails; and – Re-engineered 31 financial crime and fraud prevention processes. • Largely completed the rectification of our electronic security register for around 250,000 Business customers. • Expanded our open banking capability so it is available to customers across all brands and wealth products. • System and process updates for various regulatory changes including: – Design and distribution obligations; – Anti-Hawking legislation; – Basel III - new mortgage loss given default models; – Managing the transition away from LIBOR1; and – Uplifted the quality of our critical data which materially impacts our ability to serve our customers, effectively manage our risks and meet our regulatory obligations. 1 London inter-bank Offered Rate. Review of Group operations |
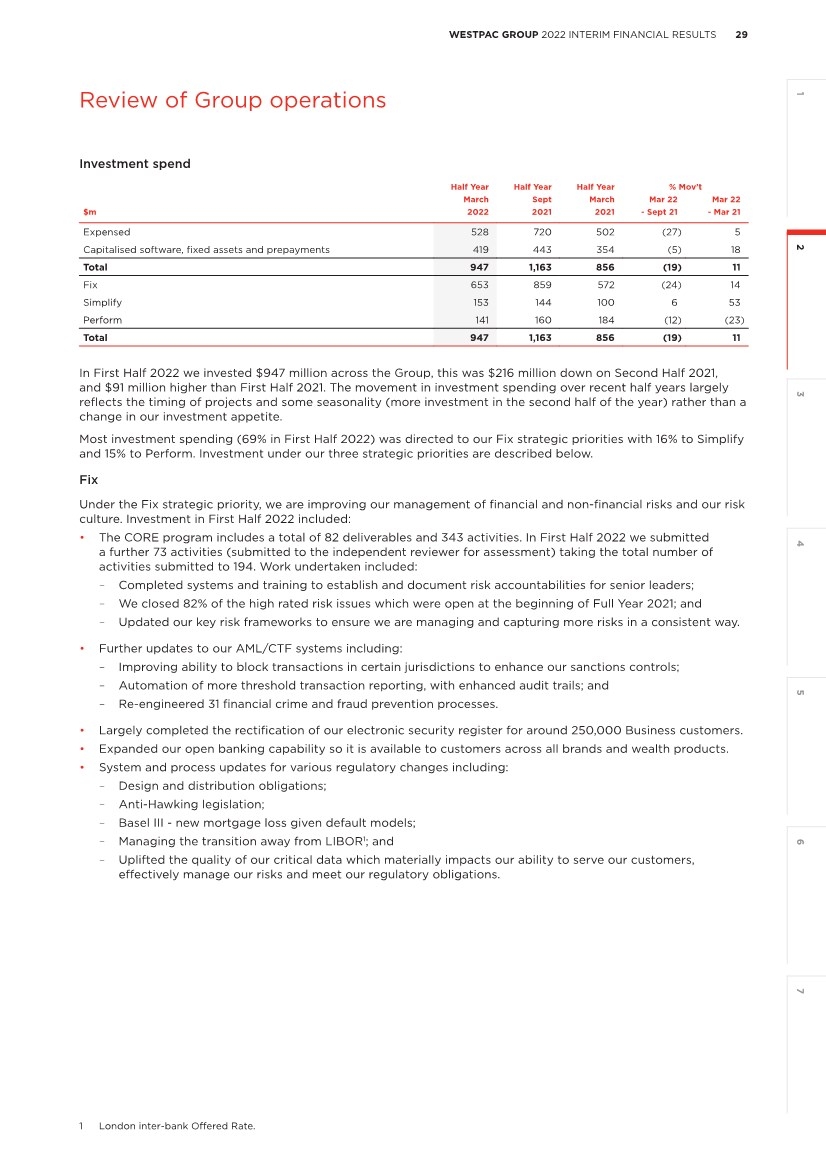
| 30 WESTPAC GROUP 2022 INTERIM FINANCIAL RESULTS Review of Group operations Simplify We have increased our simplification investment in First Half 2022 over the prior half with a particular focus on digitising more activity across Australia and New Zealand. Initiatives over the half included: • Continue to simplify our offering by rationalising products available and eliminating fees across a number of products. • We have commenced the development of a new digital mortgage process that will enable the customers to originate a mortgage with no manual intervention or paper documents. This will make it easier for customers to apply for mortgages, aims to reduce approval times and supports compliance. • Launched the Digital Credit Assessment Tool, which makes it easier for our SME, Commercial and Private Wealth customers by significantly improving the assessment and decisioning processes. The tool aims to save approximately one week of work per year for each banker and will support compliance. • Digitised a number of processes across several products including mortgage redraw, consumer card balance transfer with straight through processing, credit card notices of nominations, credit card product switch and term deposits. Perform Launched a range of new products and digital capabilities including: • Completed the rollout of the new mobile experience with 2.5 million customers actively using across iOS and Android devices; • Through the acquisition of Money Brilliant in December 2021, and when integrated into our applications, we will continue to accelerate our data and personal financial management strategy; • Increased self-serve options for customers including to increase daily payment limits, enabled customers to activate new credit or debit cards by tapping their card on the back of their phone, and launched the Flex Card, our first digitally originated credit card; • Deployed next generation merchant terminals. The devices bring a range of new functions to Business customers with more mobility, instant settlement, the ability send receipts and improved options for the visually impaired. The roll-out has been accompanied with a simpler fee structure to make banking easier. Capitalised software Half Year Half Year Half Year % Mov’t March Sept March Mar 22 Mar 22 $m 2022 2021 2021 - Sept 21 - Mar 21 Balance as at beginning of period 1,840 2,171 2,430 (15) (24) Total additions1 424 392 348 8 22 Amortisation expense (283) (371) (384) (24) (26) Impairment expense (54) (352) (133) (85) (59) Other adjustments2 (6) - (90) - (93) Balance as at end of period 1,921 1,840 2,171 4 (12) Average amortisation period (years) 3.1 2.6 3.0 0.5 years 0.1 years Capitalised software increased $81 million (or 4%) compared to 30 September 2021, and was $250 million lower (or 12%) compared to 31 March 2021. The increase over the half was primarily due to additions exceeding amortisation following the write-down of capitalised software in WIB in Second Half 2021. 1 Includes capitalised borrowing costs and card scheme. 2. Second Half 2021 and First Half 2021 has been restated for the accounting policy change in relation to Software-as-a-Service. Refer to Note 1 of the 2021 Annual Report for further details. |
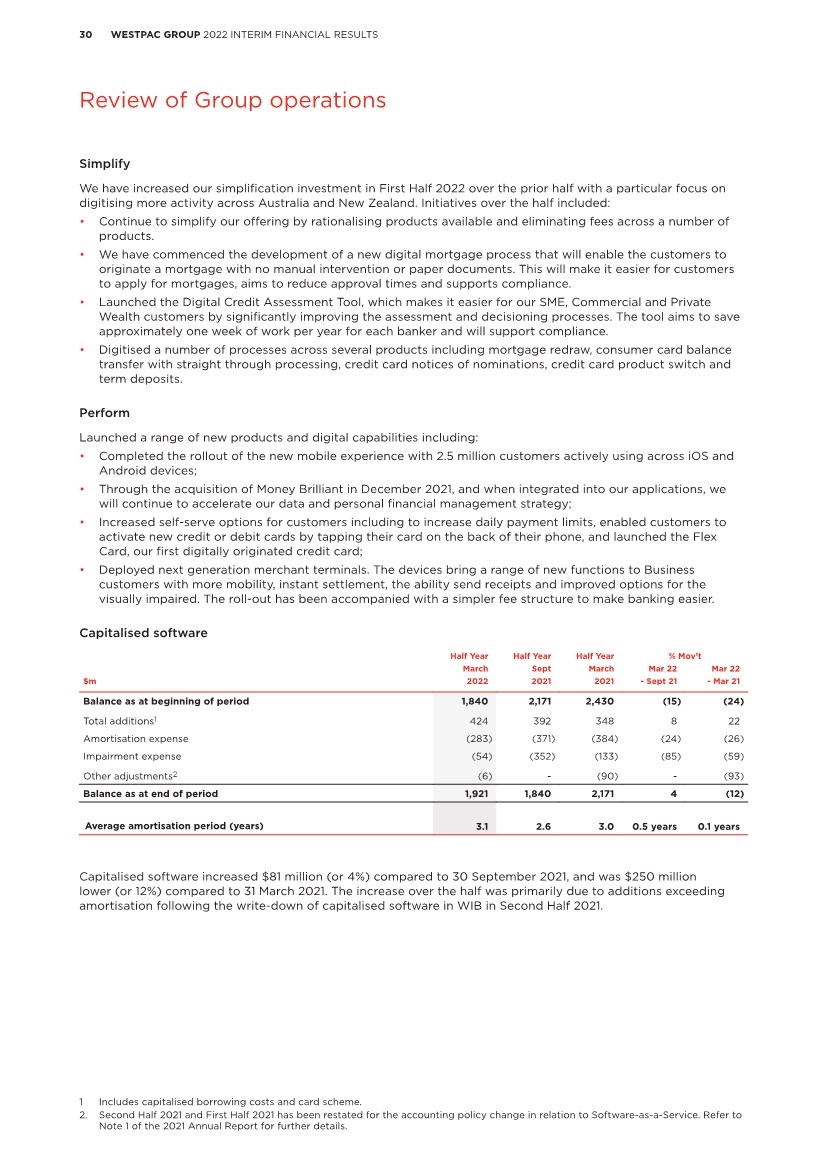
| 31 WESTPAC GROUP 2022 INTERIM FINANCIAL RESULTS 3 4 5 6 7 2 1 Review of Group operations 2.2.9 Credit impairment (charges)/benefits Half Year Half Year Half Year % Mov’t March Sept March Mar 22 Mar 22 $m 2022 2021 2021 - Sept 21 - Mar 21 Individually assessed provisions (IAPs) New IAPs (97) (466) (144) (79) (33) Write-backs 64 93 62 (31) 3 Recoveries 102 110 132 (7) (23) Total IAPs, write-backs and recoveries 69 (263) 50 large 38 Collectively assessed provisions (CAPs) Write-offs (218) (296) (318) (26) (31) Other changes in CAPs 10 777 640 (99) (98) Total new CAPs (208) 481 322 large large Total credit impairment (charges)/benefits (139) 218 372 large large First Half 2022 impairment charge was $139 million, compared to a Second Half 2021 impairment benefit of $218 million, a $357 million turnaround. While asset quality metrics have continued to improve and new IAPs were significantly lower than Second Half 2021, we have considered the operating environment and increased our portfolio overlays and changed the weights applied to our three economic scenarios. This contributed to the First Half 2022 charge. More specifically, overlays were increased $489 million through the half to reflect the current uncertainty from supply chain disruption, labour shortages, and inflation. This includes risks bought about by the more tense geopolitical environment and the lingering economic impacts from COVID-19 (although some COVID-19 related overlays were partly released). In addition, we added a new overlay for the potential impact on customers of recent flooding in New South Wales and Queensland. While our exposure to certain flood prone areas has declined over recent years, flooding in First Half 2022 has been more severe alongside estimated lower levels of insurance coverage. In reviewing our economic scenarios we have increased the weight to the downside scenario to 45% (from 40%) and decreased the weight to our base case scenario to 50% (from 55%). The increase in weighting to the downside reflects an elevated level of uncertainty in potential credit losses driven by new geopolitical and economic headwinds that have emerged associated with the war in Ukraine, supply chain disruptions, capacity constraints, rising inflation and interest rates. The following table indicates the weightings applied by the Group at 31 March 2022, 30 September 2021 and 31 March 2021: As at As at As at 31 March 30 Sept 31 March Economic scenario weightings (%) 2022 2021 2021 Upside 5 5 5 Base 50 55 55 Downside 45 40 40 Review of Group operations |
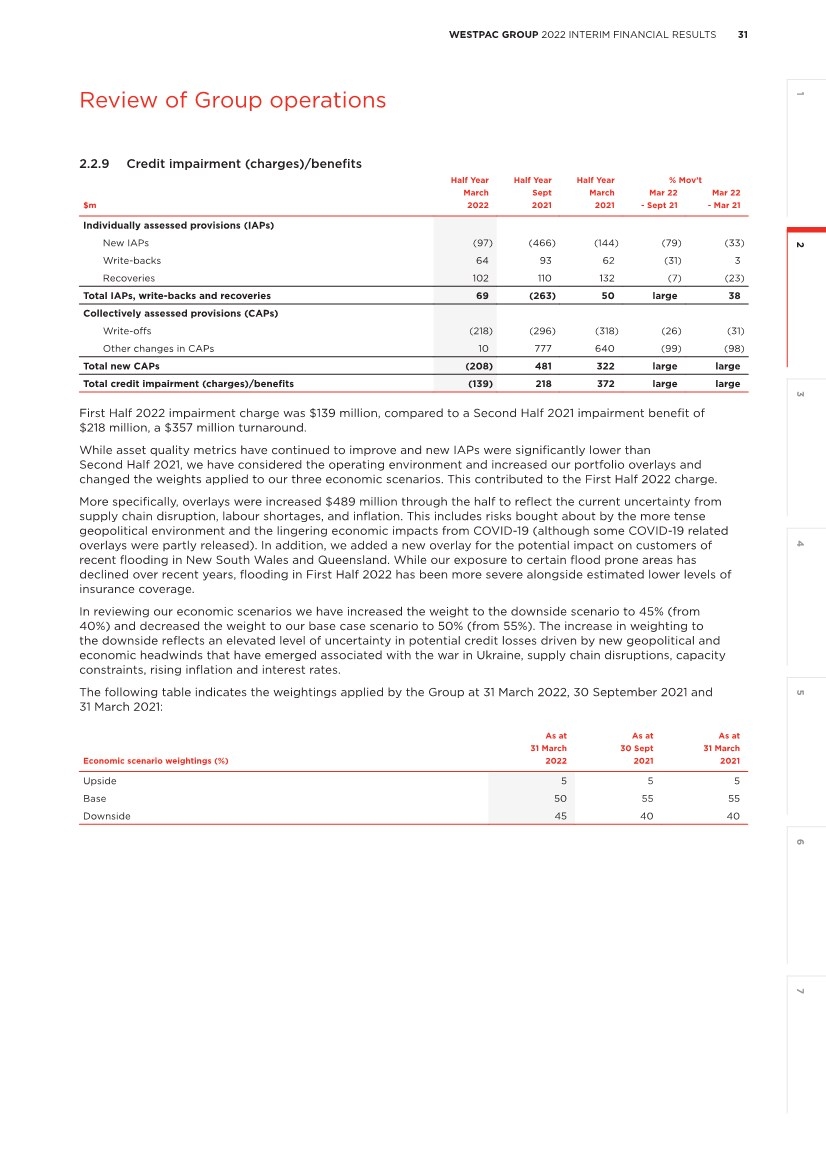
| 32 WESTPAC GROUP 2022 INTERIM FINANCIAL RESULTS Review of Group operations First Half 2022 – Second Half 2021 First Half 2022 impairment charge was $139 million, compared to an impairment benefit of $218 million in Second Half 2021. Total new CAPs was a charge of $208 million compared with a benefit of $481 million in Second Half 2021. The charge was driven by: • increase in downside economic scenario weight to 45% (from 40%); • increase in portfolio overlays; partly offset by • improvement in credit quality metrics, mostly in the mortgage portfolio; and • lower write-offs, predominately from lower delinquencies and a reduction in our consumer unsecured portfolios. Total IAPs, write-backs and recoveries were a $69 million benefit, compared to a $263 million charge in Second Half 2021. In First Half 2022 we recorded very low new IAPs ($97 million) and Second Half 2021 included an IAP related to the Forum Finance exposure. Write-backs and recoveries were lower in First Half 2022, predominately in New Zealand. First Half 2022 – First Half 2021 First Half 2022 impairment charge was $139 million compared to an impairment benefit of $372 million in First Half 2021. Total new CAPs was a charge of $208 million compared with a benefit of $322 million in First Half 2021. The CAPs charge was due to: • increase in downside economic scenario weight to 45% (from 40%); • increase in portfolio overlays; • a moderation of forward looking economic inputs in the provisioning calculation; partly offset by • lower write-offs, predominately from lower delinquencies and a reduction in our consumer unsecured portfolios. Total IAPs, write-backs and recoveries was a $69 million benefit, compared to a $50 million benefit in First Half 2021. This reflected low levels of new IAPs in both periods. 2.2.10 Income tax expense First Half 2022 – Second Half 2021 The effective tax rate of 30.4% in First Half 2022 was significantly lower than the Second Half 2021 effective tax rate of 42.4% mainly due to a reduction in the non-deductible goodwill impairments, and a number of insurance divestment adjustments recognised in Second Half 2021 that are not repeated in First Half 2022. The effective tax rate is above the Australian corporate tax rate of 30%. First Half 2022 – First Half 2021 The effective tax rate of 30.4% in First Half 2022 was lower than the effective tax rate of 31.8% in First Half 2021 mainly due to write-downs in Westpac Pacific recognised in First Half 2021 that are not repeated in First Half 2022, along with the accounting gain on the sale of our NZ Life Insurance business that is non-taxable in First Half 2022, and a release of centrally held tax provisions, also in First Half 2022. 2.2.11 Non-controlling interests Non-controlling interests represent results of non-wholly owned subsidiaries attributable to shareholders other than Westpac. These include profits attributable to the 10.1% shareholding in Westpac Bank-PNG-Limited and the 25% shareholding in St.George Motor Finance Limited that are not owned by Westpac. |
| 33 WESTPAC GROUP 2022 INTERIM FINANCIAL RESULTS 3 4 5 6 7 2 1 Review of Group operations 2.3 Credit quality Credit quality improved through First Half 2022 with most metrics back to levels experienced pre COVID-19. Stressed exposures as a percentage of Total Committed Exposures (TCE) were 26 basis points lower at 1.10%. This reduction comprised: • a 9 basis point reduction in watchlist and substandard exposures, mostly from rating upgrades and refinancing of some higher risk institutional facilities; • a 12 basis point reduction in 90 days past due and not impaired exposures, mostly related to mortgages; and • a 5 basis point reduction in impaired exposures, from low levels of new impaired assets and the partial write-off of the Forum Finance exposure. Lower impaired exposures saw the ratio of gross impaired exposures to gross loans reduced 7 basis points over the last six months to 0.23%. The impaired portfolio was also well provisioned and at 31 March 2022, the ratio of gross impaired provisions to gross impaired exposures was 48% (down from 54% at 30 September 2021). This reduction was due to the partial write-off of the Forum Finance exposure during the half. Portfolio segments The WIB segment has seen a decrease in stress, with stressed exposures to TCE falling 24 basis points, or more than two thirds, over the last six months to 0.11%. This was predominately driven by a reduction in impaired exposures from the partial write-off of the Forum Finance exposure and from a reduction in watchlist exposures from upgrades and refinancing. The Australian business segment, comprising Australian commercial and SME customers, has seen stressed exposures to TCE fall 72 basis points over the prior half to 4.87%. This was predominately driven by a reduction in watchlist and substandard exposures. Australian mortgage 90+ day delinquencies were 19 basis points lower than 30 September 2021 at 0.88%. This improvement included a reduction in the hardship portfolio as facilities completed their serviceability period (remained performing for 6 months after exiting hardship) and as customers successfully exited COVID-19 assistance packages. Properties in possession at 31 March 2022 were 201, 21 lower than 30 September 2021 with less properties moving to possession. Realised Australian mortgage losses were $27 million for First Half 2022 compared to $28 million for Second Half 2021. Other Australian consumer 90+ day delinquencies were 12 basis points lower compared to 30 September 2021 at 1.64%. The reduction was due to a 15 basis point decline from the underlying performance of the portfolio, partly offset by a 3 basis point increase related to lower lending. Most of the reduction in 90+ day delinquencies was in the credit card portfolio, from reductions in hardship. The New Zealand business portfolio has seen improved credit quality with stressed exposures to TCE 5 basis points lower than 30 September 2021 at 1.14%. This reduction was due to lower impaired exposures including the partial write-off of the Forum Finance exposure. New Zealand mortgage 90+ day delinquencies were little changed compared to 30 September 2021 at 0.30%, but remain relatively low. New Zealand other consumer 90+ day delinquencies were 23 basis points lower than 30 September 2021 at 1.42%. Provisions Total provisions were $4,682 million at 31 March 2022, $325 million lower than 30 September 2021. CAPs was relatively flat with IAPs driving the reduction. The flat CAP outcome was due to improving credit quality offset by increased overlays and a greater weight placed on the downside economic scenario. The higher overlays and more conservative economic expectations reflect concerns over geopolitical and economic headwinds that have emerged from the war in Ukraine and from the lingering economic effects of COVID-19. These include supply chain disruptions, capacity constraints, skilled labour shortages, increased inflation and inflationary expectations and from the prospect of higher interest rates. Overlays were also increased for risks associated with Australian floods and storms. In aggregate, overlays increased $489 million. We also increased the downside economic scenario weight to 45% from 40% increasing CAPs by $184 million. The ratio of collectively assessed provisions to credit RWA at 31 March 2022 was 1.16%, 1 basis point lower than 30 September 2021. IAPs were $501 million at 31 March 2022, $331 million lower than 31 September 2021, mostly due to a partial write-off of the Forum Finance exposure. |
| 34 WESTPAC GROUP 2022 INTERIM FINANCIAL RESULTS Review of Group operations 2.3.1 Credit quality key metrics¹ As at As at As at 31 March 30 Sept 31 March 2022 2021 2021 Stressed exposures by credit grade as a % of TCE: Impaired 0.14% 0.19% 0.19% 90 days past due and not impaired 0.56% 0.68% 0.66% Watchlist and substandard 0.40% 0.49% 0.75% Total stressed exposures 1.10% 1.36% 1.60% Gross impaired exposures to TCE for business and institutional: Business Australia 0.60% 0.72% 0.88% Business New Zealand 0.16% 0.20% 0.44% Institutional 0.07% 0.16% 0.08% Mortgage 90+ day delinquencies: Group 0.82% 0.99% 1.11% Australia 0.88% 1.07% 1.20% New Zealand 0.30% 0.30% 0.33% Other consumer loans 90+ day delinquencies: Group 1.62% 1.75% 1.92% Australia 1.64% 1.76% 1.92% New Zealand 1.42% 1.65% 1.91% Other: Gross impaired exposures to gross loans 0.23% 0.30% 0.30% Gross impaired exposure provisions to gross impaired exposures 48.03% 54.44% 47.03% Total provisions to gross loans 65 bps 70 bps 79 bps Collectively assessed provisions to credit risk weighted assets 116 bps 117 bps 142 bps Total provisions to credit risk weighted assets 130 bps 140 bps 159 bps Impairment charges/(benefits) to average gross loans annualised2 4 bps (6 bps) (11 bps) Net write-offs to average gross loans annualised2 13 bps 8 bps 9 bps 2.3.2 Movement in gross impaired exposures1 Half Year Half Year Half Year % Mov’t March Sept March Mar 22 Mar 22 $m 2022 2021 2021 - Sept 21 - Mar 21 Balance as at beginning of period 2,142 2,071 2,779 3 (23) New and increased - individually managed 222 614 222 (64) - Write-offs (566) (405) (431) 40 31 Returned to performing or repaid (221) (222) (369) - (40) Portfolio managed - new/increased/returned/repaid 89 65 (104) 37 large Exchange rate and other adjustments (13) 19 (26) large (50) Balance as at end of period 1,653 2,142 2,071 (23) (20) 1. Includes balances presented as held for sale. 2. Averages are based on a six month period. |
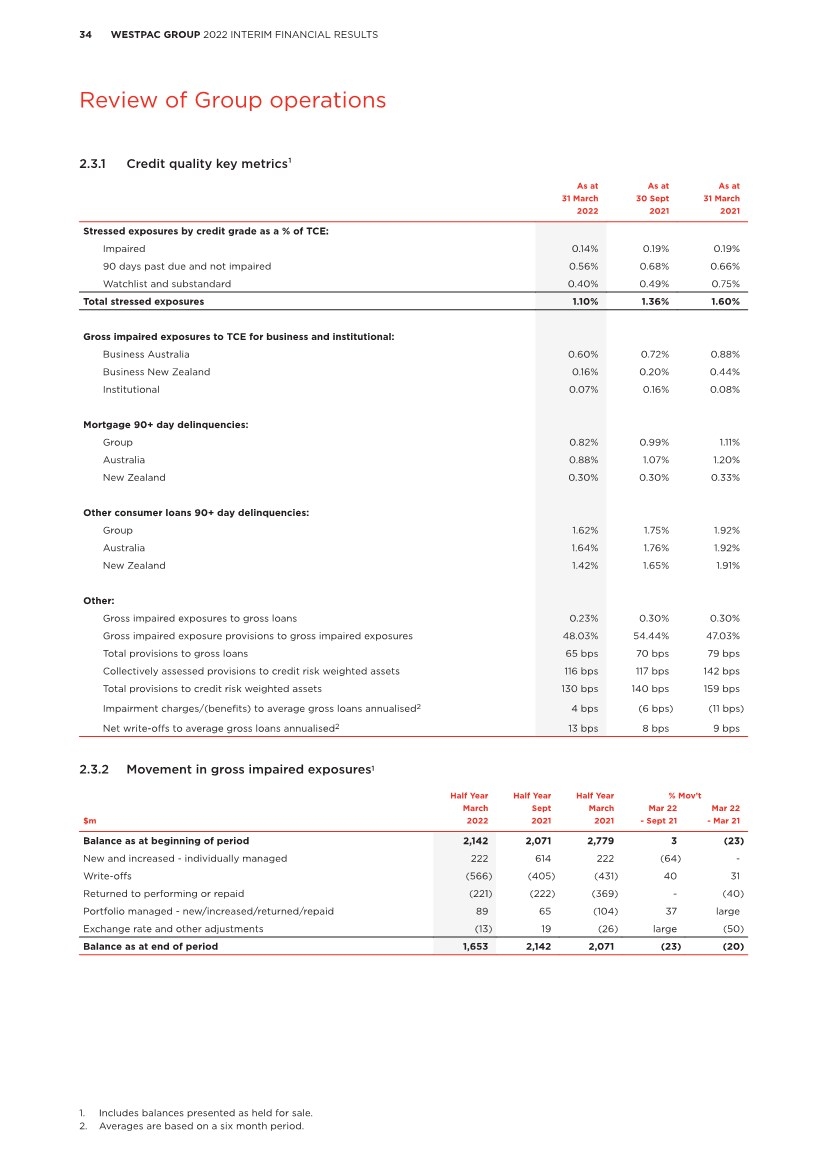
| 35 WESTPAC GROUP 2022 INTERIM FINANCIAL RESULTS 1 3 4 5 6 7 2 Review of Group operations 2.4 Balance sheet and funding 2.4.1 Balance sheet As at As at As at % Mov’t 31 March 30 Sept 31 March Mar 22 Mar 22 $m 2022 2021 2021 - Sept 21 - Mar 21 Assets Cash and balances with central banks 102,410 71,353 33,877 44 large Collateral paid 7,374 4,232 3,917 74 88 Trading securities and financial assets measured at fair value through income statement (FVIS) and investment securities 94,180 104,518 112,231 (10) (16) Derivative financial instruments 18,269 19,353 22,373 (6) (18) Loans 719,556 709,784 688,218 1 5 Life insurance assets - - 3,416 - (100) Assets held for sale 2,700 4,188 4,359 (36) (38) All other assets1 20,260 22,449 21,028 (10) (4) Total assets1 964,749 935,877 889,419 3 8 Liabilities Collateral received 2,170 2,368 2,504 (8) (13) Deposits and other borrowings 645,606 626,955 585,401 3 10 Other financial liabilities 51,345 50,309 42,996 2 19 Derivative financial instruments 25,347 18,059 20,303 40 25 Debt issues 133,629 128,779 127,850 4 5 Life insurance liabilities - - 1,070 - (100) Loan capital 29,036 29,067 26,294 - 10 Liabilities held for sale 684 837 3,049 (18) (78) All other liabilities 6,599 7,411 7,891 (11) (16) Total liabilities 894,416 863,785 817,358 4 9 Equity Total equity attributable to owners of WBC1 70,279 72,035 72,012 (2) (2) NCI 54 57 49 (5) 10 Total equity1 70,333 72,092 72,061 (2) (2) 1. First Half 2021 has been restated for the accounting policy change in relation to Software-as-a-Service. Refer to Note 1 of the 2021 Annual Report for further details. |
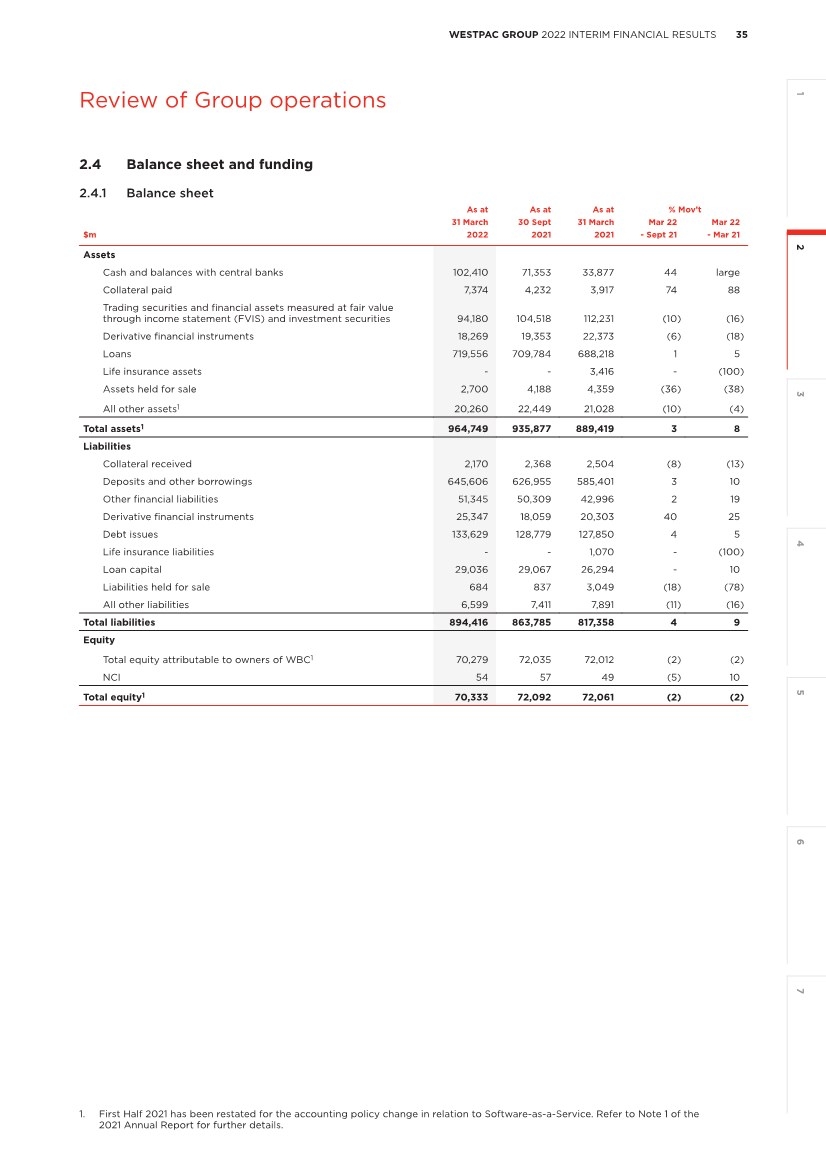
| 36 WESTPAC GROUP 2022 INTERIM FINANCIAL RESULTS Review of Group operations First Half 2022 – Second Half 2021 Total assets increased $28.9 billion to $964.7 billion, or 3%, since September 2021 primarily driven by increased liquid assets (cash and balances with central banks) and loans. Total liabilities increased $30.6 billion to $894.4 billion, or 4%, since September 2021 mostly from higher deposits and derivative financial instruments. Equity was lower mostly from the off-market buy-back completed in February 2022. Liquid assets increased as we prepared for the progressive reduction of the CLF over the 2022 calendar year. This followed the decision by APRA to wind-down the facility used by certain Australian banks to meet their LCR requirement. During the half we also completed a $3.5 billion off-market share buy-back. The additional funding needs of these developments were met by strong customer deposit growth, well above loan growth. Key movements included: Assets • Cash and balances with central banks increased $31.1 billion or 44% reflecting higher liquid assets to address the wind-down in the CLF; • Collateral paid increased $3.1 billion or 74% reflecting higher collateralised derivative balances; • Trading securities and other financial assets measured at fair value through income statement (FVIS) and investment securities decreased $10.3 billion or 10% mainly due to the sale of government investment securities; • Derivative assets decreased $1.1 billion or 6% mainly driven by movements in interest rate and cross currency swaps, partly offset by foreign currency forward contracts; • Loans increased $9.8 billion or 1% (including held for sale, loans increased $8.8 billion or 1%). Refer to Section 2.2.2 Loans for further information; • Assets held for sale decreased $1.5 billion or 36% reflecting the settlement of the Group’s motor vehicle dealer finance and novated leasing business and Westpac Life-NZ- Limited; and • All other assets decreased $2.2 billion or 10% due to reductions in securities sold not delivered, and interbank loans included in other financial assets, and deferred tax assets. Liabilities • Deposits and other borrowings increased $18.7 billion or 3%. Refer to Section 2.2.3 Deposits and other borrowings for further information; • Other financial liabilities increased $1.0 billion or 2% mainly due to securities sold under agreements to repurchase and interbank deposits, partly offset by a decrease in securities sold short; • Derivative liabilities increased $7.3 billion or 40% mainly driven by cross currency swaps and foreign currency forward contracts due to volatility in exchange rates; • Debt issues increased $4.9 billion or 4% ($9.7 billion or 8% increase excluding foreign currency impacts). Refer to Section 2.4.2 Funding and liquidity risk management for further information; • Liabilities held for sale decreased $0.2 billion or 18% reflecting the settlement of the Group’s motor vehicle dealer finance and novated leasing business and Westpac Life-NZ- Limited; and • All other liabilities decreased $0.8 billion or 11% mainly due to provision utilisation and lease liabilities included in other liabilities. Equity attributable to owners of Westpac Banking Corporation decreased $1.8 billion or 2% mainly attributable to the off-market share buy-back (refer to Note 15 for the details), partly offset by retained profits. |
| 37 WESTPAC GROUP 2022 INTERIM FINANCIAL RESULTS 1 3 4 5 6 7 2 Review of Group operations First Half 2022 – First Half 2021 Total assets increased $75.3 billion to $964.7 billion, or 8%, since March 2021 primarily driven by increased liquid assets (cash and balances with central banks) and loans. Total liabilities increased $77.1 billion to $894.4 billion, or 9%, since March 2021 mostly from higher deposits and derivative financial instruments. Equity was lower mostly from the off-market buy-back completed in February 2022. Liquid assets increased as we prepared for the progressive reduction of the CLF over the 2022 calendar year. This followed the decision by APRA to wind-down the facility used by certain Australian banks to meet their LCR requirement. During the half we also completed a $3.5 billion off-market share buy-back. The additional funding needs of these developments were met by strong customer deposit growth, well above loan growth and wholesale funding. Key movements included: Assets • Cash and balances with central banks increased $68.5 billion reflecting higher liquid assets to address the wind-down in the CLF; • Collateral paid increased $3.5 billion or 88% reflecting higher collateralised derivative balances; • Trading securities and other financial assets measured at FVIS and investment securities decreased $18.1 billion or 16% mainly due to the sale of government and semi-government investment securities; • Derivative assets decreased $4.1 billion or 18% mainly driven by movements in interest rate and cross currency swaps, partly offset by foreign currency forward contracts; • Loans increased $31.3 billion or 5% (including held for sale, loans increased $29.5 billion or 4%). Refer to Section 2.2.2 Loans for further information; • Life insurance assets decreased $3.4 billion or 100% as the balance was reclassified to assets held for sale; • Assets held for sale as at 31 March 2022 relate to Westpac Australian Life Insurance business, while the balance as at 31 March 2021 relates to Westpac General Insurance Limited and Westpac General Insurance Services Limited, Westpac Vendor Finance business, Westpac Lenders Mortgage Insurance Limited and Westpac Pacific; and • All other assets decreased $0.8 billion or 4% due to reductions in intangible assets mainly from goodwill impairment, property and equipment and deferred tax assets, partly offset by an increase in securities sold not delivered included in other financial assets. Liabilities • Deposits and other borrowings increased $60.2 billion or 10% (including held for sale, deposits increased $58.1 billion or 10%). Refer to Section 2.2.3 Deposits and other borrowings for further information; • Other financial liabilities increased $8.3 billion or 19% mainly due to securities sold under agreements to repurchase, securities sold short, securities purchased not delivered and interbank deposits; • Derivative liabilities increased $5.0 billion or 25% mainly driven by cross currency swaps and foreign currency forward contracts, partly offset by a decrease in interest rate swaps; • Debt issues increased $5.8 billion or 5% ($6.0 billion or 5% increase excluding foreign currency impacts). Refer to Section 2.4.2 Funding and liquidity risk management for further information; • Life insurance liabilities decreased $1.1 billion or 100% as the balance was reclassified to liabilities held for sale; • Loan capital increased $2.7 billion or 10% due to $3.8 billion net issuance of Additional Tier 1 and Tier 2 instruments, partly offset by $1.1 billion fair value hedge adjustments; • Liabilities held for sale as at 31 March 2022 relate to Westpac Australian Life Insurance business, while the balance as at 31 March 2021 relates to Westpac General Insurance Limited and Westpac General Insurance Services Limited, Westpac Vendor Finance business, Westpac Lenders Mortgage Insurance Limited and Westpac Pacific; and • All other liabilities decreased $1.3 billion or 16% due to a decline in provisions and other liabilities primarily relating to lease liabilities and reclassification of outstanding life insurance claims to liabilities held for sale in Second Half 2021. Equity attributable to owners of Westpac Banking Corporation decreased $1.7 billion or 2% mainly attributable to the off-market share buy-back (refer to Note 15 for the details), partly offset by retained profits. |
| 38 WESTPAC GROUP 2022 INTERIM FINANCIAL RESULTS Review of Group operations 2.4.2 Funding and liquidity risk management Liquidity risk is the risk that the Group will be unable to fund assets and meet obligations as they become due. This risk is inherent for all banks as intermediaries between depositors and borrowers. The Group has a liquidity risk management framework which seeks to meet our cash flow obligations under a wide range of market conditions and scenarios, as well as meeting the requirements of the Liquidity Coverage Ratio (LCR) and Net Stable Funding Ratio (NSFR). The Group maintained funding and liquidity metrics comfortably above regulatory minimums throughout First Half 2022. The Group’s March 2022 quarterly average LCR was 137% and its NSFR at 31 March 2022 was 125%, both above the 100% regulatory minimums. Liquidity The Group has a number of sources of liquidity that provide a buffer against periods of liquidity stress. These include High Quality Liquid Assets (HQLA) and the Committed Liquidity Facility (CLF), both of which are used to meet the Group’s LCR requirements. In September 2021, APRA announced that Authorised Deposit-taking Institutions (ADIs) subject to the LCR should reduce their CLF usage to zero by the end of calendar year 2022, subject to financial market conditions, as APRA and the RBA expect there will be sufficient HQLA for ADIs to meet their LCR requirements without the need to utilise the CLF. APRA also announced that no ADI should rely on the CLF to meet the minimum 100% LCR requirement from 1 January 2022. The CLF will be phased out throughout 2022, with the first reduction having occurred on 1 January 2022. Westpac’s CLF allocation at 31 March 2022 was $27.75 billion and will reduce by a further $9.25 billion on 1 May 2022. In response to the phasing out of the CLF, Westpac increased its holdings of HQLA over the half. At 31 March 2022, Westpac held $161.9 billion in HQLA (30 September 2021: $148.6 billion). HQLA include cash, deposits with central banks, government and semi-government securities. The Group also has access to non-HQLA and other assets that are eligible for re-purchase with a central bank under certain conditions. These include private securities and self-originated AAA-rated mortgage-backed securities. In March 2020, the RBA announced the establishment of the Term Funding Facility (TFF). The TFF provided fixed rate funding to eligible ADIs for a maximum of three years. The facility closed to new drawdowns on 30 June 2021, by which time Westpac had fully drawn our total available TFF allowance of $30 billion. TFF maturities will commence from June 2023 and the Group will manage its refinancing requirements using the full range of its funding sources. LCR The LCR is designed to enhance banks’ short-term resilience, by measuring the level of HQLA, as defined, held against its liquidity needs for a 30 calendar day period under a regulator-defined stress scenario. In addition to HQLA, Australian ADIs including Westpac also have access to the CLF, as set out above, to meet the requirements of the LCR. Westpac’s average LCR for the quarter ended 31 March 2022 was 137% (Westpac’s average LCR for the quarter ended 30 September 2021 was: 129%). The lift in the LCR compared to the quarterly average for September 2021 was mainly due to the increase in HQLA. Westpac’s LCR excluding the CLF as at 31 March 2022 was 118%. Westpac’s LCR also includes a 10% overlay to net cash outflows. The overlay, effective since 1 January 2021, has been required by APRA in response to breaches of the prudential standards on liquidity. The overlay reduces the average LCR for the quarter ended 31 March 2022 by 14 percentage points. Further details are set out in the Significant Developments section of the 2022 Interim Financial Results. NSFR The NSFR is designed to encourage banks’ longer-term funding resilience. To comply, banks are required to maintain an NSFR of at least 100% at all times. Westpac’s NSFR was 125% at 31 March 2022 (30 September 2021: 125%). Funding The Group monitors the composition and stability of its funding so that it remains within the Group’s funding risk appetite. This includes compliance with both the LCR and NSFR. Review of Group operations |
| 39 WESTPAC GROUP 2022 INTERIM FINANCIAL RESULTS 1 3 4 5 6 7 2 Review of Group operations Customer deposits Customer deposits accounted for 65.7% of the Group’s total funding (including equity) at 31 March 2022 (30 September 2021: 65.0%). During the half, customer deposits increased by $20.6 billion, fully funding the bank’s new lending growth and lifting the Group’s customer deposit to loan ratio to 83.5% from 81.6% at 30 September 2021. Long term wholesale funding Long term funding with a residual maturity greater than 12 months made up 15.2% of the Group’s total funding at 31 March 2022 (30 September 2021: 15.6%). The Group raised $21.8 billion of long term wholesale funding in the First Half of 2022, bringing forward some planned issuance due to favourable funding conditions in First Quarter 2022. In First Half 2022, new issuance comprised senior unsecured bonds (64%), covered bonds (17%), Tier 2 capital securities (14%) and securitisation (5%) and was well diversified across tenors and currencies, including USD, AUD, EUR, GBP, NZD and others. At 31 March 2022, funding from securitisation accounted for 0.5% of total funding (30 September 2021: 0.6%). Short term wholesale funding Wholesale funding with a residual maturity less than 12 months accounted for 11.0% of the Group’s total funding at 31 March 2022 (30 September 2021: 10.8%). This portfolio, including long term to short term scroll6, had a weighted average maturity of 144 days (30 September 2021: 138 days). Equity Funding from equity made up 7.6% of total funding at 31 March 2022 (30 September 2021: 8.0%), with the decrease over the half mainly reflecting the off-market share buy-back which was completed in February 2022. Liquidity coverage ratio Quarter Quarter Quarter % Mov’t March Sept March Mar 22 Mar 22 $m 2022 2021 2021 - Sept 21 - Mar 21 High Quality Liquid Assets (HQLA)1,3 169,346 136,525 117,759 24 44 Committed Liquidity Facility (CLF)3 27,750 37,000 37,000 (25) (25) Term Funding Facility (TFF)2,3 - - 10,321 - (100) Total LCR liquid assets 197,096 173,525 165,080 14 19 Cash outflows in a modelled 30-day APRA defined stressed scenario Customer deposits1 96,351 89,628 85,282 8 13 Wholesale funding 11,526 10,003 13,024 15 (12) Other flows4 36,412 34,447 35,281 6 3 Total 144,289 134,078 133,587 8 8 LCR1,5 137% 129% 124% large large Net stable funding ratio As at As at As at % Mov’t 31 March 30 Sept 31 March Mar 22 Mar 22 $m 2022 2021 2021 - Sept 21 - Mar 21 Available stable funding1 669,655 651,216 625,185 3 7 Required stable funding 536,022 521,499 510,287 3 5 Net stable funding ratio 125% 125% 123% 6 bps 241 bps 1. Includes balances presented as held for sale. 2. Represents the Group’s average undrawn TFF allowance as per APRA guidance. 3. Refer to Glossary for definition. 4. Other flows include credit and liquidity facilities, collateral outflows and inflows from customers. 5. Calculated on a quarterly average basis. 6. Scroll represents wholesale funding with an original maturity greater than 12 months that now has a residual maturity less than 12 months. |
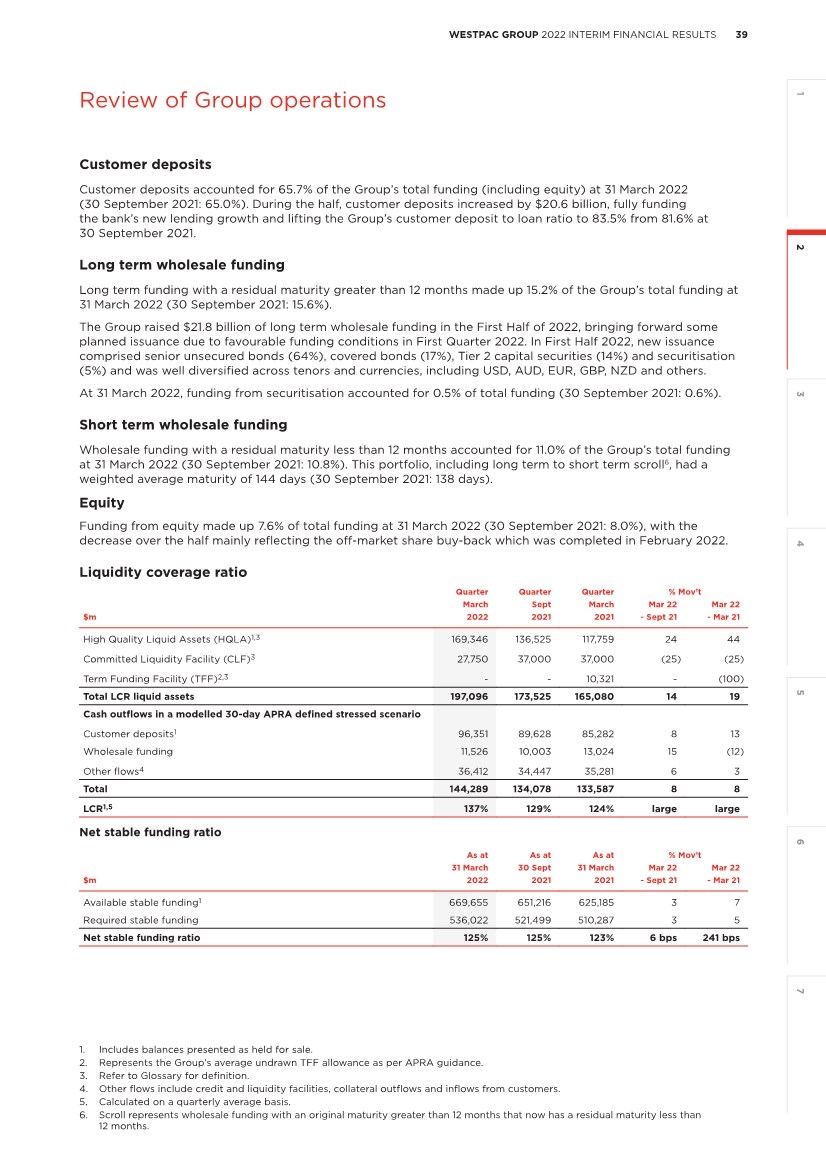
| 40 WESTPAC GROUP 2022 INTERIM FINANCIAL RESULTS Review of Group operations Funding by residual maturity As at 31 March 2022 As at 30 Sept 2021 As at 31 March 2021 $m Ratio % $m Ratio % $m Ratio % Wholesale funding Less than 6 months 59,044 6.5 54,512 6.1 45,415 5.4 6 to 12 months 15,241 1.6 15,232 1.7 11,951 1.4 Long term to short term scroll1 26,527 2.9 26,760 3.0 27,631 3.3 Wholesale funding - residual maturity less than 12 months 100,812 11.0 96,504 10.8 84,997 10.1 Securitisation 4,968 0.5 5,000 0.6 6,687 0.8 Greater than 12 months 138,108 15.2 138,817 15.6 124,050 14.8 Wholesale funding - residual maturity greater than 12 months 143,076 15.7 143,817 16.2 130,737 15.6 Customer deposits2 600,872 65.7 580,317 65.0 550,337 65.7 Equity3,4 69,244 7.6 71,614 8.0 71,837 8.6 Total funding4 914,004 100.0 892,252 100.0 837,908 100.0 Deposits to net loans ratio As at 31 March 2022 As at 30 Sept 2021 As at 31 March 2021 $m Ratio % $m Ratio % $m Ratio % Customer deposits2 600,872 580,317 550,337 Net customer loans2 719,556 83.5 710,799 81.6 690,037 79.8 Funding view of the balance sheet² $m Total liquid assets Customer deposits Wholesale funding Customer franchise Market inventory Total As at 31 March 2022 Total assets 244,113 - - 667,250 53,386 964,749 Total liabilities - (600,872) (243,888) - (49,656) (894,416) Total equity - - - (69,244) (1,089) (70,333) Total 244,113 (600,872) (243,888) 598,006 2,641 - Net loans5 65,830 - - 653,726 - 719,556 As at 30 September 2021 Total assets 227,553 - - 658,123 50,201 935,877 Total liabilities - (580,317) (240,321) - (43,147) (863,785) Total equity - - - (71,614) (478) (72,092) Total 227,553 (580,317) (240,321) 586,509 6,576 - Net loans5 66,610 - - 644,189 - 710,799 As at 31 March 2021 Total assets4 195,177 - - 643,492 50,750 889,419 Total liabilities - (550,337) (215,734) - (51,287) (817,358) Total equity4 - - - (71,837) (224) (72,061) Total4,5 195,177 (550,337) (215,734) 571,655 (761) - Net loans5 60,894 - - 629,143 - 690,037 1. Scroll represents wholesale funding with an original maturity greater than 12 months that now has a residual maturity less than 12 months. 2. Includes balances presented as held for sale. 3. Includes total share capital, share-based payment reserve and retained profits. 4. First Half 2021 has been restated for the accounting policy change in relation to Software-as-a-Service. Refer to Note 1 of the 2021 Annual Report for further details. 5. Liquid assets in net loans include internally securitised assets that are eligible for repurchase agreements with the RBA/RBNZ. |
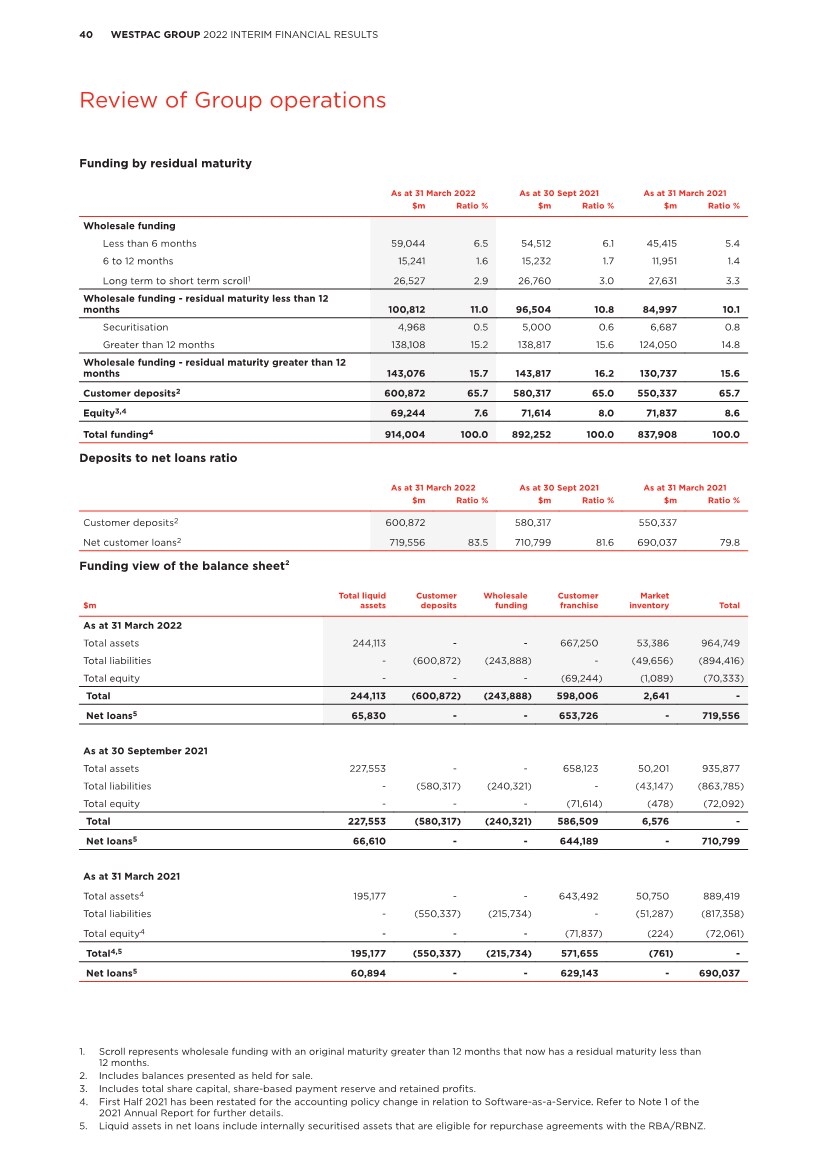
| 41 WESTPAC GROUP 2022 INTERIM FINANCIAL RESULTS 1 3 4 5 6 7 2 Review of Group operations 2.5 Capital and dividends As at As at As at % Mov’t 31 March 30 Sept 31 March Mar 22 Mar 22 2022 2021 2021 - Sept 21 - Mar 21 Level 2 regulatory capital structure Common equity Tier 1 (CET 1) capital after deductions ($m) 52,126 53,808 52,932 (3) (2) Risk weighted assets (RWA) ($m) 459,956 436,650 428,899 5 7 CET 1 capital ratio 11.33% 12.32% 12.34% (99 bps) (101 bps) Additional Tier 1 capital ratio 2.08% 2.33% 2.21% (25 bps) (13 bps) Tier 1 capital ratio 13.41% 14.65% 14.55% (124 bps) (114 bps) Tier 2 capital ratio 4.30% 4.21% 3.88% 9 bps 42 bps Total regulatory capital ratio 17.71% 18.86% 18.43% (115 bps) (72 bps) APRA leverage ratio1 5.60% 5.99% 6.27% (39 bps) (67 bps) Level 1 regulatory capital structure CET 1 capital after deductions ($m) 48,684 54,314 53,313 (10) (9) Risk weighted assets ($m) 433,643 431,422 424,656 1 2 Level 1 CET 1 capital ratio 11.23% 12.59% 12.55% (136 bps) (132 bps) APRA announcements on capital In First Half 2022 APRA made the following announcements relevant to their capital framework: • On 29 November 2021, APRA released the final revised standards for APS110 Capital Adequacy, APS112 Capital Adequacy: Standardised Approach to Credit Risk and APS113 Capital Adequacy: Internal Ratings-based Approach to Credit Risk which will become effective from 1 January 2023. Under the revised standards, the capital conservation buffer will be increased from 2.5% to 3.75% and a base level for the countercyclical capital buffer of 1.0% will be introduced. As a result, the CET1 capital ratio requirement for Domestic Systemically Important Banks (D-SIBs) will increase from 8% to 10.25% from 1 January 2023. • On 2 December 2021, APRA announced a requirement for D-SIBs (including Westpac) to increase their total capital requirements by 4.5 percentage points of risk weighted assets (RWA) under the current capital adequacy framework to be met by 1 January 2026. This is a 1.5 percentage point increase on the prior announcement on 9 July 2019. The additional total capital is expected to be met through additional Tier 2 Capital. In Westpac’s funding, this increase in total capital is likely to be offset by a decrease in long-term wholesale funding. • On 2 December 2021, APRA released two draft prudential standards for consultation. CPS 190 Financial Contingency Planning will require banks (including Westpac) to develop plans for responding to financial stress and CPS 900 Resolution Planning will require some banks (including Westpac) to prepare for resolution with limited adverse impacts on the community and financial system, in the event of their failure. Both standards are proposed to come into effect from 1 January 2024. Further details of regulatory changes are set out in the Significant Developments section of the 2022 Interim Financial Results. Capital management strategy Westpac evaluates its approach to capital management through an Internal Capital Adequacy Assessment Process (ICAAP), the key features of which include: • The development of a capital management strategy, including consideration of regulatory minimums, capital buffers and contingency plans. The current regulatory capital minimums together with the capital conservation buffer (CCB) are the Total CET1 Requirement. The Total CET1 Requirement for Westpac is at least 8.0%, based on an industry minimum CET1 requirement of 4.5% plus a capital buffer of at least 3.5% applicable to D-SIBs2,3; • Consideration of both regulatory and economic capital requirements and the perspectives of external stakeholders including rating agencies as well as equity and debt investors; and • A stress testing framework that challenges the capital measures, coverage and requirements including the impact of adverse economic scenarios. APRA’s final revised standards for capital, as noted above, indicated that the Total CET1 Requirement for D-SIBs will be 10.25% from 1 January 2023. This requirement includes a CCB of 3.75% and a base level for the countercyclical capital buffer of 1.0%. APRA also indicated4 that it expects that D-SIBs (including Westpac) will likely operate with CET1 above 11% under the new framework. Given the above Westpac will seek to operate with a CET1 capital ratio of between 11.0% and 11.5% (operating capital range) as measured under the new capital framework from 1 January 2023. Review of Group operations 1. Refer to Glossary for definition. 2. Noting that APRA may apply higher CET1 requirements for an individual ADI. 3. If an ADI’s CET1 ratio falls below the Total CET1 Requirement (at least 8%), they face restrictions on the distribution of earnings, such as dividends, distribution payments on AT1 capital instruments and discretionary staff bonuses. 4. APRA Information paper, An unquestionably strong framework for bank capital, November 2021. |
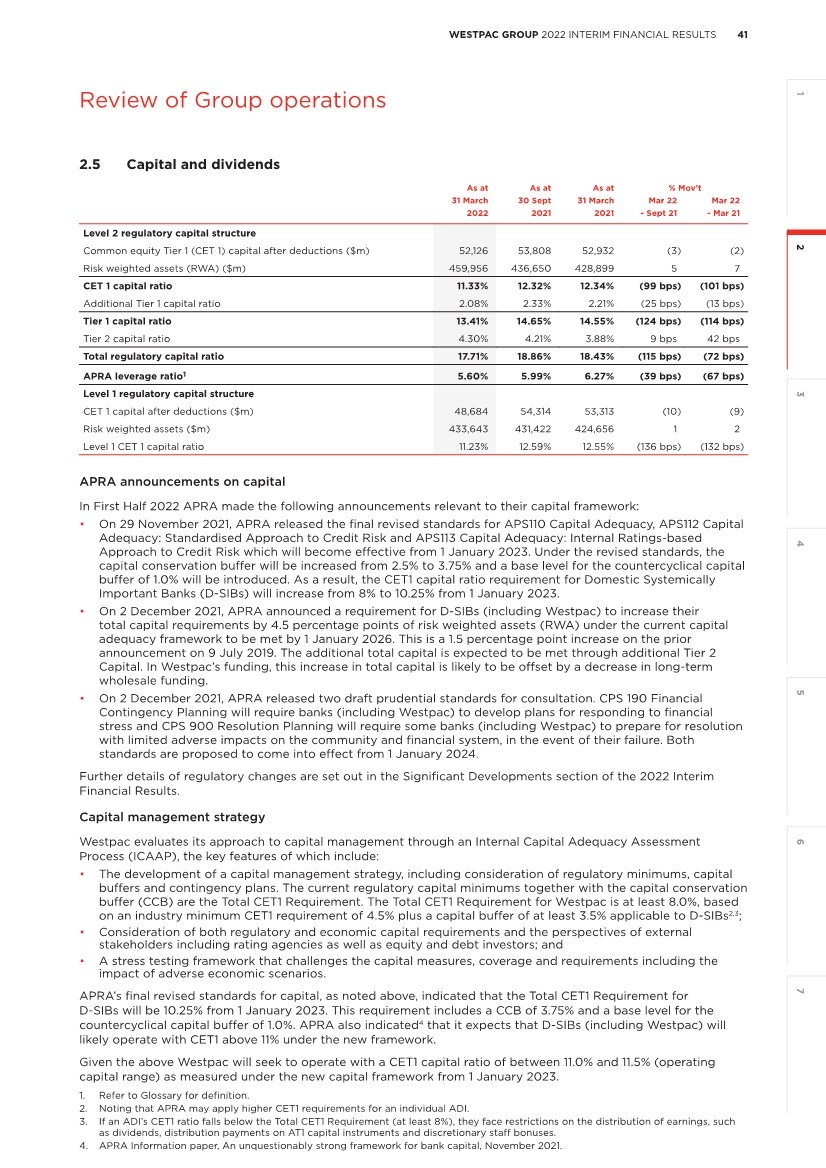
| 42 WESTPAC GROUP 2022 INTERIM FINANCIAL RESULTS Review of Group operations CET1 capital ratio movement for First Half 2022 (%, basis points) 12.32% 11.33% 67 (48) (76) (70) 14 1 13 Sep-21 Cash earnings 2H21 Dividend Off-Market Share Buy- back RWA movement Capital deduction and other items FX translation impact Divestments Mar-22 s2.5 Capital and dividends - ASX Westpac’s Level 2 CET1 capital ratio was 11.33% at 31 March 2022, 99bps lower than 30 September 2021. Key movements in the CET1 capital ratio over the half were: • First Half 2022 cash earnings (67bps increase); • Payment of the 2021 final dividend (48bps decrease). Shares for the 2021 final dividend DRP were purchased on market so had no impact on capital ratios; • A $3.5 billion off-market share buy-back in February 2022 (76bps decrease); • An increase in RWA (70bps decrease) mostly from higher interest rate risk in the banking book (IRRBB) from increased market volatility (44bps decrease), an increase in lending (16bps decrease) and higher operational risk following the adoption of the standardised measurement approach in January 2022 (5bps decrease); • Capital deductions and other capital movements (14bps increase) from lower deferred tax assets (14bps increase), movements in fair value on economic hedges recognised in net profit (4bps increase) and remeasurement of the defined benefit superannuation obligation (1bp increase). These were partly offset by revaluation of debt securities in other comprehensive income (5bps decrease); • Foreign currency impacts from the appreciation of the A$ against the US$ and NZ$ (1bp increase)1; and • Divestment including Westpac Life-NZ- Limited (7bps) and Westpac’s motor vehicle dealer finance and novated leasing business (6bps). Westpac’s Level 1 CET1 capital ratio was 11.23% at 31 March 2022, 136 basis points lower than 30 September 2021. In addition to the key movements outlined above, the Level 1 CET1 ratio decreased by 18bps following implementation of the final revised standards for APS111 Capital Adequacy Measurement of Capital and APS222 Associations with Related Entities from 1 January 2022. 1. Reflecting the net impact of movements in the foreign currency translation reserve and RWA |
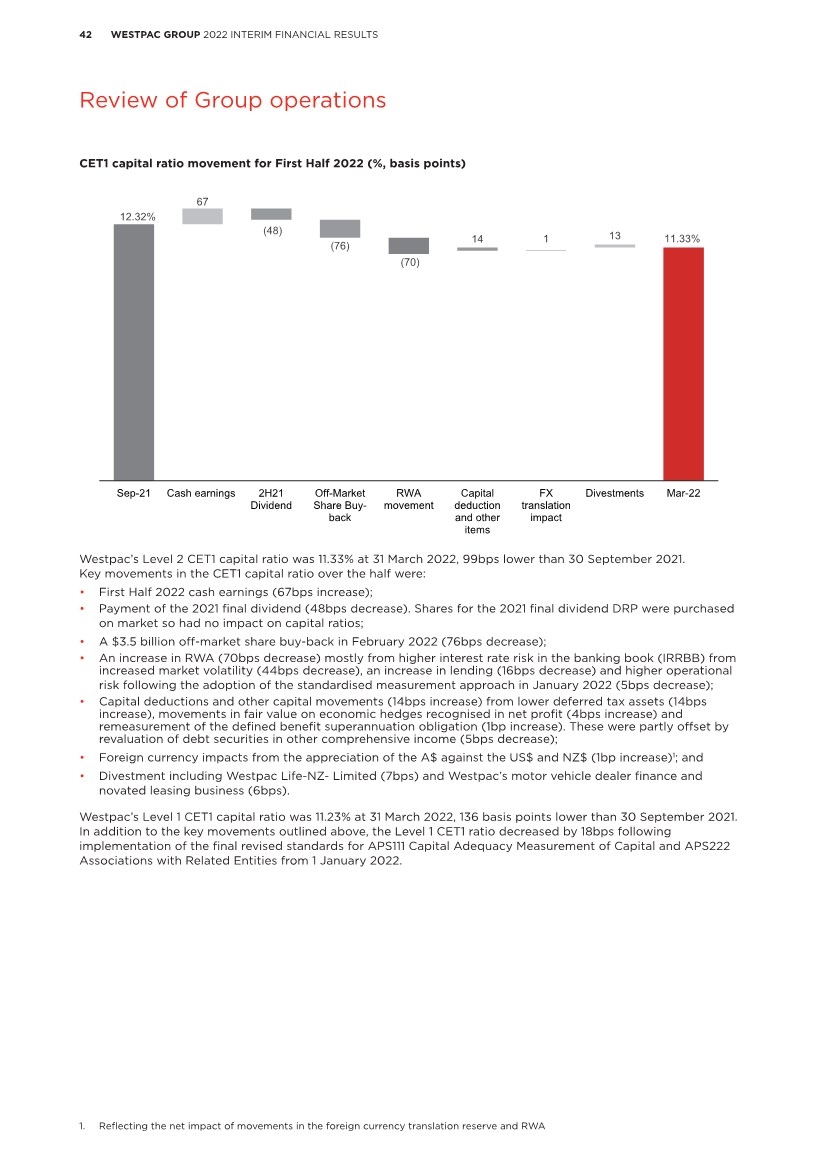
| 43 WESTPAC GROUP 2022 INTERIM FINANCIAL RESULTS 1 3 4 5 6 7 2 Review of Group operations Additional Tier 1 and Tier 2 capital movement for First Half 2022 On 20 December 2021, we redeemed approximately $0.55 billion of Westpac Capital Notes 4 (WCN 4) that remained on issue1, which decreased Tier 1 capital by 12bps. During the half, we issued US$2.25 billion (approximately A$3.2 billion) of Tier 2 capital instruments and redeemed A$0.35 billion and JPY 8000 billion (approximately A$0.1 billion) of Tier 2 capital instruments. The net impact was to increase the total regulatory capital ratio by 59bps. Leverage ratio The leverage ratio represents the amount of Tier 1 capital relative to exposure2. At 31 March 2022, Westpac’s leverage ratio was 5.60%, down 39bps since 30 September 2021 due to a decrease in Tier 1 capital and higher on balance sheet exposures. Internationally comparable capital ratios The APRA Basel III capital adequacy requirements are more conservative than those of the Basel Committee on Banking Supervision (BCBS), leading to lower reported capital ratios when compared to international peers. APRA conducted a study in July 2015 outlining its methodology for measuring international comparable capital ratios. The table below calculates the Group’s reported capital ratios consistent with this methodology. As at As at As at % Mov’t 31 March 30 Sept 31 March Mar 22 Mar 22 % 2022 2021 2021 - Sept 21 - Mar 21 Internationally comparable capital ratios CET 1 capital ratio 17.36% 18.17% 18.08% (81 bps) (72 bps) Tier 1 capital ratio 20.23% 21.23% 20.98% (100 bps) (75 bps) Total regulatory capital ratio 26.16% 26.61% 25.94% (45 bps) 22 bps Leverage ratio 6.10% 6.59% 6.87% (49 bps) (77 bps) 1. On 15 September 2021, Westpac issued $1.75 billion of Additional Tier 1 capital (Westpac Capital Notes 8), of which approximately $1.15 billion comprised reinvestment by the holder of WCN 4. The remaining $0.55 billion of WCN 4 were redeemed on 20 December 2021. 2. As defined under Attachment D of APS110: Capital Adequacy. |
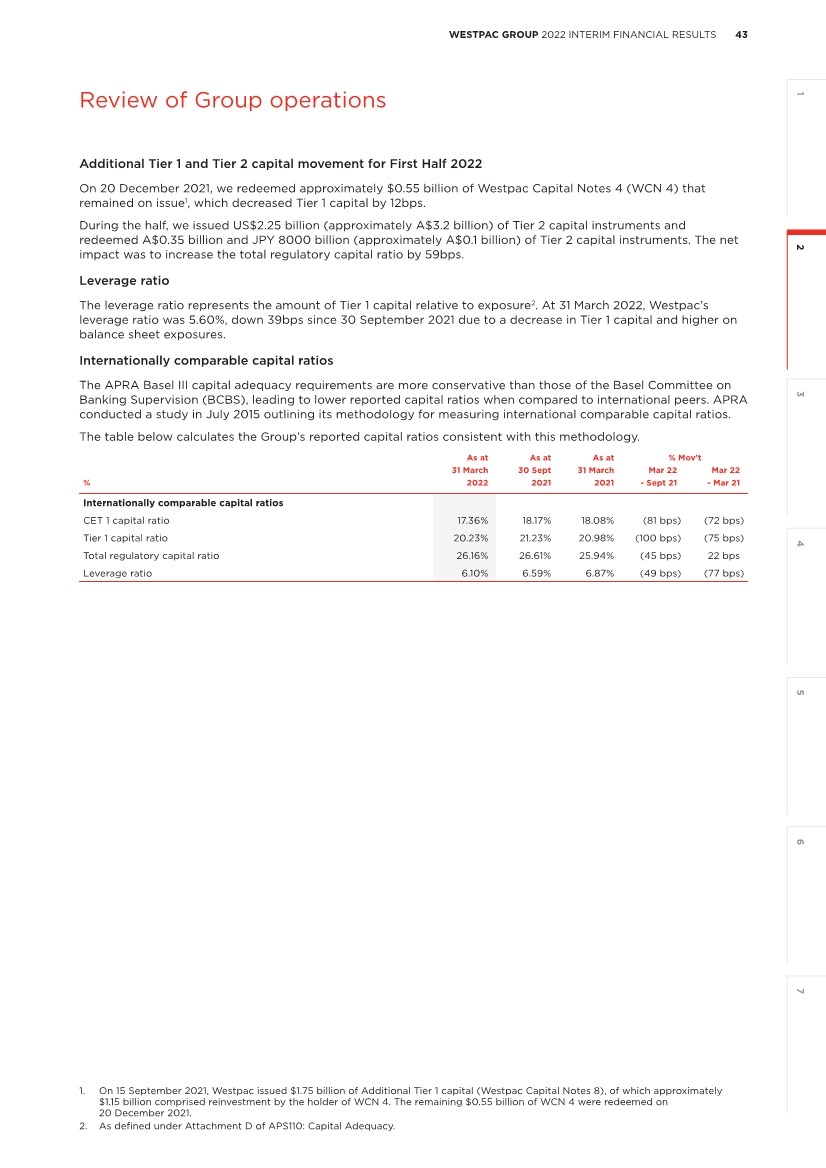
| 44 WESTPAC GROUP 2022 INTERIM FINANCIAL RESULTS Review of Group operations Risk Weighted Assets (RWA) As at As at As at % Mov’t 31 March 30 Sept 31 March Mar 22 Mar 22 $m 2022 2021 2021 - Sept 21 - Mar 21 Credit risk: Corporate1 69,391 68,715 66,086 1 5 Business lending2 32,686 32,559 34,061 - (4) Sovereign3 2,270 2,508 2,355 (9) (4) Bank4 4,960 5,104 5,708 (3) (13) Residential mortgages 146,448 145,534 133,938 1 9 Australian credit cards 3,951 4,001 4,279 (1) (8) Other retail 7,785 8,272 9,266 (6) (16) Small business5 14,401 15,187 16,097 (5) (11) Specialised lending: Property and project finance6 58,334 55,372 55,314 5 5 Securitisation7 6,306 5,881 5,513 7 14 Standardised 7,450 7,884 8,091 (6) (8) Mark-to-market related credit risk 5,691 6,278 6,419 (9) (11) Total credit risk 359,673 357,295 347,127 1 4 Market risk 9,596 6,662 9,490 44 1 Operational risk8 57,875 55,875 54,090 4 7 Interest rate risk in the banking book (IRRBB) 27,710 11,446 11,998 142 131 Other 5,102 5,372 6,194 (5) (18) Total risk weighted assets 459,956 436,650 428,899 5 7 Total RWA increased $23.3 billion or 5.3% over the half with most of the increase in non-credit risk RWA. Non-credit risk RWA was $20.9 billion, higher from: • IRRBB RWA increased from $11.4 billion to $27.7 billion over the half (up $16.3 billion or 142%). Westpac currently invests its capital over a 3-year term. Due to the interest rate volatility observed over the half, in particular the more recent significant increases in two and three year market swap rates, the amount of IRRBB RWA has increased, mainly reflecting the valuation differences to capital invested over a one-year term; • A $2.9 billion increase in market risk RWA mainly due to the introduction of an industry-wide overlay for updates required to market risk models which require regulatory approval; and • A $2.0 billion increase in operational risk RWA from adopting the standardised measurement approach for calculating operational risk RWA. The $2.4 billion increase in credit risk RWA included: • A $5.9 billion increase from specialised lending, residential mortgages and corporate lending; • Modelling, and methodology and overlay changes9, which together increased RWA by $0.7 billion partly offset by; • Foreign currency translation impacts which reduced RWA by $1.7 billion mostly from the appreciation of the A$ against the US$ and NZ$; • A $1.4 billion decrease from improved credit quality metrics with lower stressed assets across business lending and specialised lending; and • A decrease in credit RWA associated with derivative exposures (counterparty credit risk and mark-to-market related credit risk) of $1.1 billion. 1. Corporate – typically includes exposure where the borrower has annual turnover greater than $50 million and other business exposures not captured under the definitions of either Business lending or Small business. 2. Business lending – includes exposures not captured elsewhere where the borrower has annual turnover less than or equal to $50 million. 3. Sovereign – includes exposures to governments themselves and other non-commercial enterprises that are owned or controlled by them. 4. Bank – includes exposures to licensed banks and their owned or controlled subsidiaries, and overseas central banks. 5. Small business – program managed business lending exposures. 6. Specialised lending – property and project finance – includes exposures to entities created to finance and/or operates specific assets where, apart from the income received from the assets being financed, the borrower has little or no independent capacity to repay from other activities or assets. 7. Securitisation – exposures reflect Westpac’s involvement in activities ranging from originator to investor and include the provision of securitisation services for clients wishing to access capital markets. 8. Operational risk – the risk of loss resulting from inadequate or failed internal processes, people and systems or from external events, including legal risk but excluding strategic or reputational risk. 9. Modelling changes included updates to model estimates for Australian retail and mortgage PD, credit card LGD and unsecured LGD. The impact of these changes were partially offset by a reduction in RWA overlays upon implementation of updated model estimates. |
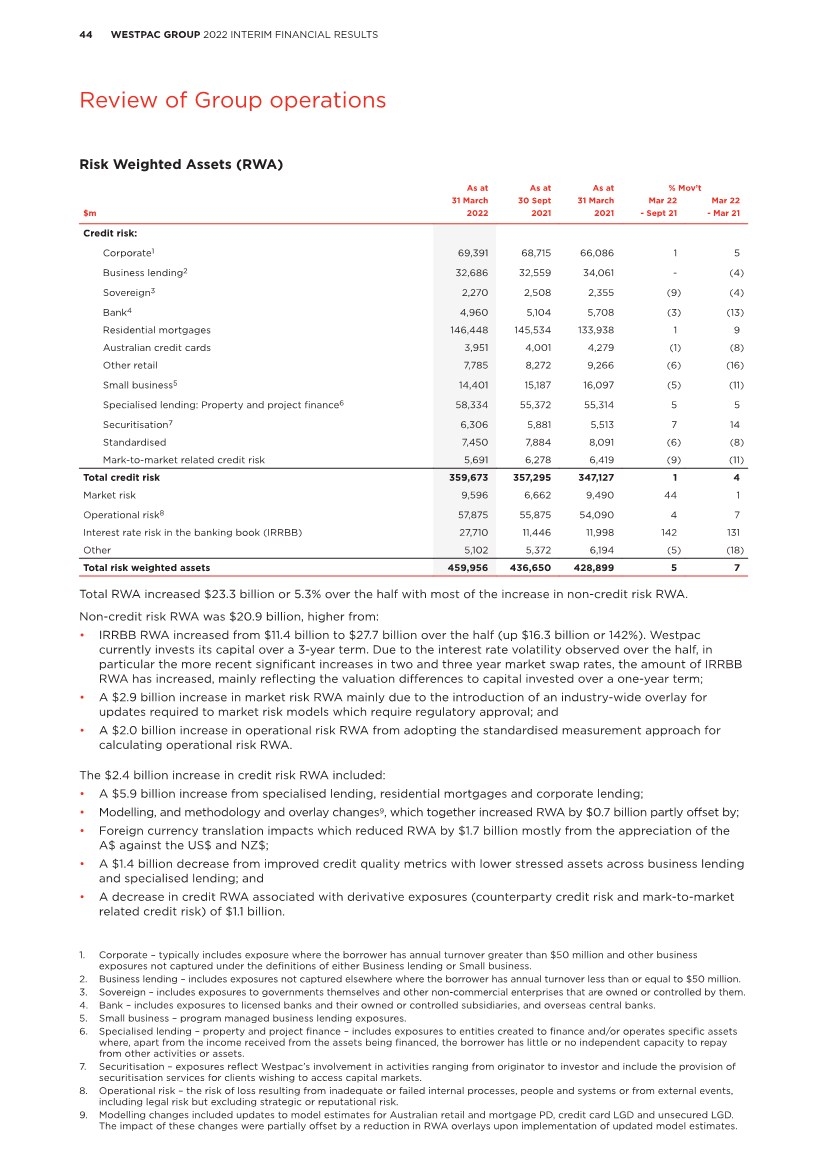
| 45 WESTPAC GROUP 2022 INTERIM FINANCIAL RESULTS 1 3 4 5 6 7 2 Review of Group operations Capital adequacy As at As at As at 31 March 30 Sept 31 March $m 2022 2021 2021 Tier 1 capital CET 1 capital Paid up ordinary capital 39,667 41,601 41,604 Treasury shares (708) (663) (660) Equity based remuneration 1,824 1,753 1,731 Foreign currency translation reserve (445) (266) (519) Accumulated other comprehensive income 183 402 507 Non-controlling interests - other 54 57 49 Retained earnings1 28,362 28,813 29,097 Less retained earnings in life and general insurance, funds management and securitisation entities (1,144) (1,118) (1,680) Deferred fees 265 238 230 Total CET 1 capital 68,058 70,817 70,359 Deductions from CET 1 capital Goodwill (excluding funds management entities) (7,935) (8,060) (8,529) Deferred tax assets1 (1,812) (2,429) (2,260) Goodwill in life and general insurance, funds management and securitisation entities (209) (209) (451) Capitalised expenditure (2,013) (1,951) (1,749) Capitalised software1 (1,914) (1,840) (2,049) Investments in subsidiaries not consolidated for regulatory purposes (1,541) (2,044) (2,063) Regulatory expected downturn loss in excess of eligible provisions (164) (225) (93) Defined benefit superannuation fund surplus (60) (64) (69) Equity investments (161) (163) (162) Regulatory adjustments to fair value positions (123) (24) (1) Other Tier 1 deductions - - (1) Total deductions from CET 1 capital (15,932) (17,009) (17,427) Total CET 1 capital after deductions 52,126 53,808 52,932 Additional Tier 1 capital Basel III complying instruments 9,566 10,180 9,493 Total Additional Tier 1 capital 9,566 10,180 9,493 Deductions from Additional Tier 1 capital Holdings of own and other financial institutions Additional Tier 1 capital instruments (25) (25) (25) Total deductions from Additional Tier 1 capital (25) (25) (25) Net Additional Tier 1 regulatory capital 9,541 10,155 9,468 Net Tier 1 regulatory capital 61,667 63,963 62,400 Tier 2 capital Basel III complying instruments 20,147 18,228 16,373 Basel III transitional instruments - 487 462 Eligible general reserve for credit loss 158 51 161 Total Tier 2 capital 20,305 18,766 16,996 Deductions from Tier 2 capital Investments in subsidiaries not consolidated for regulatory purposes (60) (140) (140) Holdings of own and other financial institutions Tier 2 capital instruments (445) (221) (199) Total deductions from Tier 2 capital (505) (361) (339) Net Tier 2 regulatory capital 19,800 18,405 16,657 Total regulatory capital 81,467 82,368 79,057 Risk weighted assets 459,956 436,650 428,899 CET 1 capital ratio 11.33% 12.32% 12.34% Additional Tier 1 capital ratio 2.08% 2.33% 2.21% Tier 1 capital ratio 13.41% 14.65% 14.55% Tier 2 capital ratio 4.30% 4.21% 3.88% Total regulatory capital ratio 17.71% 18.86% 18.43% 1. First Half 2021 balances have not been restated for the changes in accounting policy in relation to Software-as-a-Service. Refer to Note 1 of the 2021 Annual Report for further details |
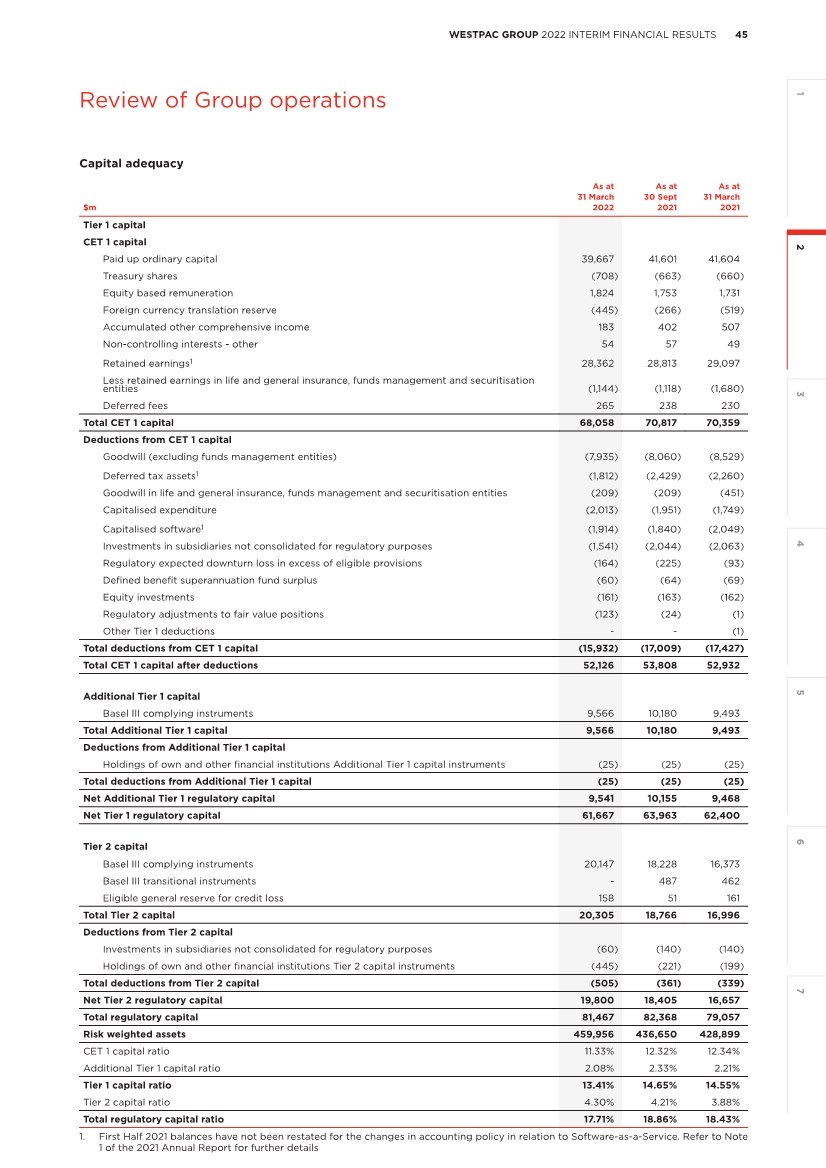
| 46 WESTPAC GROUP 2022 INTERIM FINANCIAL RESULTS Review of Group operations Review of Group operations Dividends Half Year Half Year Half Year % Mov’t March Sept March Mar 22 Mar 22 Ordinary dividend (cents per share) 2022 2021 2021 - Sept 21 - Mar 21 Interim (fully franked) 61 - 58 - 5 Final (fully franked) - 60 - (100) - Total ordinary dividend 61 60 58 2 5 Payout ratio (reported)1 65.06% 109.16% 61.75% large 331.00 Payout ratio (cash earnings)1 69.01% 121.28% 60.16% large large Adjusted franking credit balance ($m) 3,135 3,857 3,560 (19) (12) Imputation credit (cents per share - NZ) 8.0 7.0 7.0 14 14 The Board has determined an interim fully franked dividend of 61 cents per share, to be paid on 24 June 2022 to shareholders on the register at the record date of 20 May 2022. The 2022 interim dividend represents a payout ratio on a cash earnings basis of 69.01%. In addition to being fully franked, the dividend will also carry NZ$0.08 in New Zealand imputation credits that may be used by New Zealand tax residents. The Board has determined to satisfy the DRP for the 2022 interim dividend by arranging for the purchase of existing shares by a third party. The Market Price used to determine the number of shares allocated to DRP participants will be set over the 10 trading days commencing on 25 May 2022 and will not include a discount. Capital deduction for regulatory expected credit loss For capital adequacy purposes APRA requires the amount of regulatory expected credit losses in excess of eligible provisions to be deducted from CET1 capital. The table below shows the calculation of this capital deduction. As at As at As at 31 March 30 Sept 31 March $m 2022 2021 2021 Provisions associated with eligible portfolios Total provisions for expected credit losses 4,682 5,007 5,508 plus provisions associated with partial write-offs 304 40 20 less ineligible provisions2 (101) (104) (106) Total eligible provisions 4,885 4,943 5,422 Regulatory expected downturn loss 4,947 5,168 5,419 (Excess)/shortfall in eligible provisions compared to regulatory expected downturn loss 62 225 (3) CET 1 capital deduction for regulatory expected downturn loss in excess of eligible provisions3 (164) (225) (93) 1. Payout ratio excludes the dividend component of completed off-market share buy-back announced on 14 February 2022. 2. Provisions associated with portfolios subject to the Basel standardised approach to credit risk are not eligible. 3. Regulatory expected loss is calculated for portfolios subject to the Basel advanced capital IRB approach to credit risk. The comparison between regulatory expected loss and eligible provisions is performed separately for defaulted and non-defaulted exposures. |
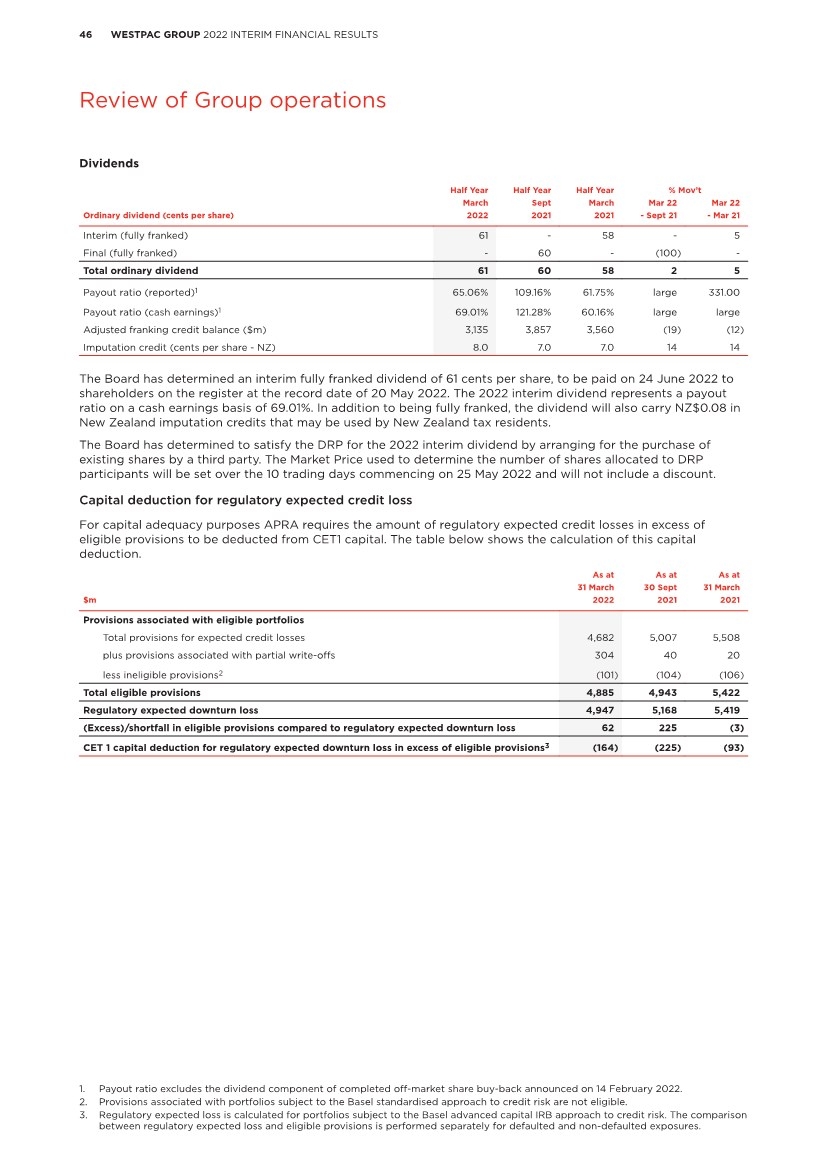
| 47 WESTPAC GROUP 2022 INTERIM FINANCIAL RESULTS 1 3 4 5 6 7 2 Review of Group operations 2.6 Sustainability performance Helping Australians and New Zealanders succeed: Our Sustainability Strategy Our 2021-2023 Sustainability Strategy is centred around three pillars: • Helping when it matters most; • Backing a stronger Australia; and • Collaborating for impact. Further information on our Sustainability Strategy is available at westpac.com.au/sustainability. This also includes our annual sustainability performance reporting and position statements. Helping when it matters most; Supporting customers and businesses through times of change and hardship, and supporting financial wellbeing. During First Half 2022, we: • Supported over 1,500 customers with a natural disaster relief package; • Approved $1.3 million in payments to almost 450 small business customers impacted by the floods in New South Wales and Queensland, as part of our dedicated $2 million fund; • Provided more than 100,000 people with access to our Recovery Hub, which brings together resources to help users manage financial stress; • Assisted over 12,000 cases through our specialist vulnerability teams; • Extended our partnership with Head Start Homes, a not-for-profit organisation working to provide secure and stable homes to those living in community housing; • Offered a variety of financial education resources, including live events, through Westpac’s Davidson Institute, with those attending reporting a high level of confidence in being able to apply their learnings1; and • Improved banking accessibility for more than 9,200 Indigenous and remote Australians since the beginning of FY21 through Yuri Ingkarninthi, our Indigenous Connection Team. Backing a stronger Australia; Backing people, jobs and ideas that shape Australia’s future, and helping Australians respond to climate change. During First Half 2022, we: • Continued support for Indigenous-owned businesses, including spend on carbon credits from savannah fire management projects in Arnhem Land; • Westpac Scholars Trust2 awarded 100 new scholarships; • Westpac Foundation’s3 job creation grants to social enterprises helped created 769 jobs for vulnerable Australians; • Participated in 39 transactions, with a total volume of $35.9 billion, to support Westpac Institutional Bank customers with sustainable finance solutions4. $7.7 billion is attributable in direct lending and capital markets distribution capability; • Achieved $2.8 billion in new lending to climate change solutions5 (TCE) since 2020, towards our target of $3.5 billion by 2023; • Completed a $250m structured auto finance facility to fund electric vehicles and related features such as recharge equipment for consumer fintech lender, Plenti; and • Remained on track to reduce scope 1 and 2 emissions by 65% by the end of FY22 and to reduce scope 3 supply chain emissions by 35% by 2030, against 2016 baselines. Review of Group operations 1. Average score of 4.5/5, with 5 representing highest level of confidence. 2. Westpac Scholars Trust (ABN 35 600 251 071) is administered by Westpac Scholars Limited (ABN 72 168 847 041) as trustee for the Westpac Scholars Trust. Westpac Scholars Trust is a private charitable trust and neither the Trust nor the Trustee are part of the Westpac Group. Westpac provides administrative support, skilled volunteering, and funding for operational costs of Westpac Scholars Trust. 3. Westpac Foundation is administered by Westpac Community Limited (ABN 34 086 862 795) as trustee for Westpac Community Trust (ABN 53 265 036 982). The Westpac Community Trust is a Public Ancillary Fund, endorsed by the ATO as a Deductible Gift Recipient. None of Westpac Foundation, Westpac Community Trust Limited nor the Westpac Community Trust are part of Westpac Group. Westpac provides administrative support, skilled volunteering, donations and funding for operational costs of Westpac Foundation. Jobs created through the Westpac Foundation job creation grants to social enterprises are for the six months ended 31 December 2021. 4. Sustainable finance transactions include green, social, sustainability, sustainability-linked and re-linked loans and bonds. 5. Refer to 2021 Sustainability Appendix for glossary. |
| 48 WESTPAC GROUP 2022 INTERIM FINANCIAL RESULTS Review of Group operations Collaborating for impact; Respecting human rights, amplifying Indigenous voices and supporting the transition to a climate resilient future. During First Half 2022, we: • Published our 2021 Modern Slavery Statement in response to the Australian Modern Slavery Act 2018 (Cth) and the United Kingdom’s Modern Slavery Act 2015 (UK); • Completed a Group-wide survey of our employees to better understand the diversity of our workforce, and their experiences of inclusion and diversity; • Published our Child Safeguarding Position Statement as we work to embed a child safe culture within our organisation; • Progressed the development of financing strategies and portfolio targets to support a net zero economy by 2050; • Engaged agribusiness customers to explore impacts of climate change on farm productivity and the role of adaptation measures to improve climate resilience; • Joined the Australian Industry Energy Transitions Initiative convened by Climateworks Centre and Climate-KIC Australia to coordinate learning and action on net zero emissions supply chains; • Joined the Taskforce on Nature-related Financial Disclosures (TNFD) Forum to support the development of a nature-related financial disclosure framework; • Progressed development of Westpac’s fifth Reconciliation Action Plan (RAP); and • Partnered with The Economist Impact to publish an inaugural survey of the sustainable finance market in Asia Pacific, which showed that the issuance of sustainable finance solutions more than doubled over the last few years and that 91% of investors surveyed have begun to decarbonise, or have plans to decarbonise, one or more portfolios. |
| 49 WESTPAC GROUP 2022 INTERIM FINANCIAL RESULTS 1 3 4 5 6 7 2 Review of Group operations 2.6.1 Climate-related financial disclosures We continue to embed consideration of climate-related risks and opportunities into our business operations. A half-year summary of Westpac Group’s progress against the four core thematic areas from the recommendations of the Task Force on Climate-related Financial Disclosures (TCFD) is provided below. Governance and oversight The Board has oversight of the Group’s approach to and management of climate change. Our Climate Change Position Statement and Action Plan (Climate Action Plan) is approved by the Board every three years. Updates on progress are provided at least twice a year. Implementation and management of the Climate Action Plan is led by Group Executives. The ESG and Reputation Committee oversees the Climate Action Plan, ESG program and wider sustainability agenda. This Committee meets at least four times a year and is chaired by the CEO, who has overall responsibility for our Group approach and management of climate change. The Board Risk Committee (BRC) considers and approves Westpac’s Sustainability Risk Management Framework (SRMF), which includes climate change risk, at least every two years. The Group Head - Risk Frameworks, Risk Culture & ESG Risk has accountability for the SRMF. The Climate Change Financial Risk Committee is a management sub-committee of the Group Credit Risk Committee and focuses on identifying and managing climate-related financial risks, including the potential impact on credit exposures from climate change-related transition and physical risks. The Committee meets at least three times a year and is chaired by the Group Chief Credit Officer. Divisional risk committees consider the climate change dimensions of business activities as required. The Westpac Institutional Bank Customer Transaction and Risk Escalation Committee also considers transactions requiring enhanced ESG due diligence, including climate change risk. The overall environmental performance of our operations is managed by Group Property, overseen by the General Manager – Property, Procurement and Protective Services. This includes setting strategies and tracking initiatives to reduce our direct environmental footprint. Strategy Climate change response and a focus on net zero has been elevated to a company-wide strategic priority. The Climate Action Plan identifies three areas where we are expected to direct our attention over the short, medium and long-term: • help customers and communities respond to climate change; • improve the climate change performance of our operations; and • support initiatives and policies to achieve the goals of the Paris Agreement. The key highlights of our progress during First Half 2022 on our Climate Action Plan are: • Participated in 39 transactions with a total volume of $35.9 billion to support Westpac Institutional Bank customers with sustainable finance solutions1. $7.7 billion is attributable in direct lending and capital markets distribution capability; • Continued our analysis to develop Paris-aligned decarbonisation financing strategies and portfolio targets; • Continued to engage customers in high emitting sectors on their ambitions for climate change mitigation and their transition plans to align with a 1.5 degrees Celsius scenario; • Engaged agribusiness customers to explore impacts of climate change on farm productivity and the role of adaptation measures to improve climate resilience; • On track to achieve 50% renewable energy sourcing for our operational electricity use by end of FY22; and • On track to maintain carbon neutrality for our operations for FY22. Risk management overview Climate change risks are managed in accordance with the Group’s Risk Management Framework, which is supported by the SRMF, Group ESG Credit Risk Policy and Board Risk Appetite Statement (RAS) and aligned with the Three Lines of Defence model. We seek to understand the potential for climate-related transition, physical and litigation risks that impact our business, including their possible impact on credit risk, regulatory and reporting obligations, and our reputation. Climate change is included in our Group Risk Taxonomy under the Credit Risk Class, and Reputational and Sustainability Risk Class. The Group regularly reviews its approach to managing climate change risks, including frameworks, policies, risk taxonomy and RAS measures, to assist with the integration of the criteria set out in the Group’s Climate Action Plan. 1. Sustainable finance transactions includes green, social, sustainability, sustainability-linked and re-linked loans and bonds. |
| 50 WESTPAC GROUP 2022 INTERIM FINANCIAL RESULTS Review of Group operations The Climate Action Plan sets out specific climate-related lending criteria, which are applied at the portfolio and customer level where appropriate. If climate-related risks associated with a transaction are not within appetite then the application of conditions to sufficiently manage the risks will be considered, or the transaction may be declined. Climate-related risks may be escalated to relevant divisional and Group risk committees in accordance with the SRMF. During First Half 2022, we trained 2,985 employees on ESG fundamentals to build climate and ESG risk management capabilities across the business. We also developed an immersive ESG training program with Monash University and Climateworks Centre, which 209 employees, including frontline bankers, have completed to date. In November 2021, APRA released the Prudential Practice Guide – CPG 229 Climate Change Financial Risks. Westpac continues to participate in APRA’s Climate Vulnerability Assessment (CVA) with four other Australian banks. APRA is expected to publish the CVA findings in 2022. Westpac will continue to review its climate risk management approach in alignment with CPG 229, incorporating insights from the CVA as they become available. Scenario analysis In line with our Climate Action Plan, we used scenario analysis to inform our identification of industries exposed to climate-related risks over short, medium and long-term horizons1 and physical risk analysis in our Australian mortgage book, the summary results of which are shown in the Metrics and Targets section below. We progressed analysis to further understand material climate-related risks: net-zero pathways for a number of high-emitting sectors and physical risk in the Australian mortgage and agribusiness portfolios. Net-zero pathways for high-emitting sectors In the half year, we continued our analysis to develop Paris-aligned financing strategies and portfolio targets, focusing on a number of sectors representing the majority of our financed emissions. This required collaboration with customers and industry experts. Our analysis has considered the IEA’s Net Zero by 2050, A Roadmap for the Global Energy Sector report, the UNEP FI Net Zero Banking Alliance framework and the impact on the bank and customers, including in hard-to-abate sectors. We will continue to provide annual updates on our progress. We continue to engage with our customers on climate change risks and opportunities as part of our efforts to support climate adaptation and a transition towards a net zero economy. In First Half 2022, we continued to collaborate with customers more specifically on their ambitions for climate change mitigation and their respective transition plans to align with a 1.5 degrees Celsius scenario. We will aim to continue to provide updates on the progress of this customer engagement. Physical risk in the Australian mortgage book This half year, we refreshed the physical risk analysis to assess locations in our residential portfolio2. The analysis suggests that while climate change may drive an ongoing increase in annual average losses over time, Westpac’s exposure in the Australian mortgage portfolio, to locations identified as likely to be exposed to higher physical risks under an RCP8.53 scenario is around 2.7% of the current portfolio, and is projected to increase to around 3.8% by 2050. Under an RCP2.63 scenario, the exposure of the current portfolio is around 2.6% and 3.3% by 2050. We understand the importance of both climate mitigation and adaptation efforts, including government planning measures, and the benefits of climate-resilient building characteristics to reduce property damage and impacts on customers and communities. Physical risk in the Australian Agribusiness portfolio We recognise the potential impact that systemic changes in climate could have on agribusiness customers. In FY21 a scenario analysis was carried out to model potential impacts of long-term changes in rainfall and weather conditions due to climate change on farm productivity. The analysis modelled productivity under different climate change scenarios, both with and without adaptation measures, which farmers may adopt to address their risks. Modelling work was completed in First Half 2022, and the results show that impacts on productivity, to 2050, are highly dependent on the extent to which farms adapt to the changing climate. Whilst for some regions the modelling revealed significant productivity upside based on adaptation measures, for other regions adaptation was found to be crucial to maintaining current productivity levels. It is already common practice for our agribusiness customers to seek and adopt innovative solutions to adjust to climate challenges and improve the resilience and long-term viability of their operations. Following from this scenario analysis, we have started to engage with customers across Australia to discuss the results of the analysis as well as current and emerging adaptation measures. By listening to and consulting with customers, we will enrich the analysis with a deeper understanding of the reality experienced by agribusinesses in Australia. We will continue to consolidate the outcomes of this engagement and look to understand how we can help customers in their ongoing adaptation journey. We will continue to provide annual updates on our progress. 1. Further details explaining the Group’s approach to scenario analysis can be found in our 2021 Sustainability Supplement. 2. The calculation of percentage mortgage portfolio exposed to higher risk locations is based on scenario analysis assessing locations on the portfolio as at 28 February 2022. The mortgage balances of this portfolio are at 28 February 2022. Details on our approach to physical risk scenario analysis on the Australian mortgages portfolio can be found in the 2021 Sustainability Supplement. 3. Intergovernmental Panel on Climate Change (IPCC) Representative Concentration Pathways (RCP) represent global warming scenarios to 2100. An RCP2.6 represents a lower warming scenario and IPCC RCP 8.5 represents a higher warming scenario. |
| 51 WESTPAC GROUP 2022 INTERIM FINANCIAL RESULTS 1 3 4 5 6 7 2 Review of Group operations Metrics Metrics Half Year 2022 performance Support for climate solutions1 • New lending to climate change solutions (TCE) • Total lending to climate change solutions (TCE) • $2.8 billion (cumulative since 2020) vs. 2023 target of $3.5 billion • $10.7 billion Energy generation2 • Emission intensity of electricity generation portfolio • Energy mix of electricity generation exposure (Westpac Institutional Bank only) • 0.26 (tCO2-e/MWh) vs. 2023 target of 0.23 (tCO2-e/MWh) • 79% renewable vs. 21% non-renewables. Mining and coal exposure • Lending to mining (TCE) • Lending to coal mining (metallurgical and thermal) (TCE) • Lending to thermal coal mining % of coal mining3 • Thermal coal mining portfolio quality thresholds • Oil and gas extraction (TCE) • $8.4 billion mining exposure representing 0.72% of Group TCE • $0.6 billion lending to coal mining representing 0.05% of Group TCE • 36% of lending to coal mining is to thermal coal mining vs. 2030 target of 0%3 • Coal quality – Existing projects > 5,700 kCal/kg – Consistent with Climate Action Plan4 – New projects > 6,300 kCal/kg – Consistent with Climate Action Plan4 • $2.4 billion lending to oil and gas extraction representing 0.21% of Group TCE Climate change portfolio resilience – scenario analysis Transition risk5 • 1.1% of current Australian Business and Institutional portfolio exposed to sectors which by 2030 may face relatively higher growth constraints under a 1.5 degrees Celsius scenario • 2.4% of current Australian Business and Institutional portfolio exposed to sectors which by 2050 may face relatively higher growth constraints under a 1.5 degrees Celsius scenario • 0.8% of current Australian Business and Institutional portfolio exposed to sectors which by 2030 may face relatively higher growth constraints under a 2 degrees Celsius scenario • 1.9% of current Australian Business and Institutional portfolio exposed to sectors which by 2050 may face relatively higher growth constraints under a 2 degrees Celsius scenario Physical risk • 3.3% of current Australian mortgage portfolio6 which by 2050 may be exposed to higher physical risks under a RCP2.6 scenario • 3.8% of current Australian mortgage portfolio6 which by 2050 may be exposed to higher physical risks under a RCP8.5 scenario Financed emissions – emissions intensity estimates of top five highest-emitting sectors7 • Manufacturing • Utilities • Mining • Agriculture • Trade • 0.257 kgCO2-e per $ lent • 0.248 kgCO2-e per $ lent • 0.227 kgCO2-e per $ lent • 0.151 kgCO2-e per $ lent • 0.094 kgCO2-e per $ lent 1. Refer to 2021 Sustainability Appendix for glossary. 2. Data updated annually. Data as at 30 September 2021. 3. Thermal coal mining exposure as % of coal mining – Westpac Institutional Bank only. We continue to support our existing thermal coal customers, managing our portfolio in line with a commitment to reduce our exposure to zero by 2030. Existing thermal coal customers include subsidiaries of existing customers, with thermal coal customers defined as those generating more than 25% of revenues from thermal coal, or in the case of a stand-alone mine, more than 35% of volumes from thermal coal. All other coal customers or mines are deemed as metallurgical. 4. The Climate Action Plan specifies coal quality criteria of average calorific value on a Gross As Received basis must be at least 5,700 kCal/kg for existing mines; and at least 6,300 kCal/kg Gross As Received for new mines. 5. Excludes retail, sovereign, and bank exposures. Sectors whose medium (2030) and long-term (2050) performance under a scenario deviated by more than one standard deviation below average GDP growth, were classified as ‘may face relatively higher growth constraints’. 6. Excludes Equity Access. Please see the 2021 Sustainability Supplement for more information. Higher risk were locations where insurance may become more expensive or unavailable. 7. Data updated annually. Data as at 30 September 2021. Financed emissions is an estimate of emissions attributable to customer loans in our Australian business, institutional and residential mortgage portfolios (‘financed emissions’). Refer to Westpac 2021 Financed Emissions Methodology on our website for more information. |
| 52 WESTPAC GROUP 2022 INTERIM FINANCIAL RESULTS Segment reporting 3.0 Segment reporting Notable items The table below shows the impact of notable items on the segments by the relevant period. Notable items are discussed in Section 1.3.3 and Section 5, Note 9. $m Consumer Business Consumer and Business Banking Westpac Institutional Bank Westpac New Zealand (A$) Specialist Businesses Group Businesses Group Half Year March 2022 Net interest income - - - - 7 - - 7 Net fee income - - - - - - - - Net wealth management and insurance income - - - - - (43) - (43) Trading income - - - - - - - - Other income - - - - 119 152 - 271 Non-interest income - - - - 119 109 - 228 Operating expenses - - - - - (215) (16) (231) Core earnings - - - - 126 (106) (16) 4 Income tax (expense)/benefit and NCI - - - - (2) (8) - (10) Cash earnings - - - - 124 (114) (16) (6) Half Year Sept 2021 Net interest income 3 103 106 - (32) (18) - 56 Net fee income - - - - (7) - (26) (33) Net wealth management and insurance income - - - - - (4) (14) (18) Trading income - - - - - - - - Other income - - - - 1 202 (7) 196 Non-interest income - - - - (6) 198 (47) 145 Operating expenses (35) (14) (49) (1,156) (17) (304) (76) (1,602) Core earnings (32) 89 57 (1,156) (55) (124) (123) (1,401) Income tax (expense)/benefit and NCI 3 (29) (26) 191 13 (119) 23 82 Cash earnings (29) 60 31 (965) (42) (243) (100) (1,319) Half Year March 2021 Net interest income - 74 74 - (3) - - 71 Net fee income (3) 1 (2) - (5) 8 (105) (104) Net wealth management and insurance income - - - - - - (88) (88) Trading income - - - - - - - - Other income - - - - - (7) 571 564 Non-interest income (3) 1 (2) - (5) 1 378 372 Operating expenses (106) (40) (146) (37) (6) (336) (220) (745) Core earnings (109) 35 (74) (37) (14) (335) 158 (302) Income tax (expense)/benefit and NCI 33 (10) 23 11 4 38 (56) 20 Cash earnings (76) 25 (51) (26) (10) (297) 102 (282) Segment reporting |
| 53 WESTPAC GROUP 2022 INTERIM FINANCIAL RESULTS 2 4 5 6 7 3 1 Segment reporting 3.1 Consumer and Business Banking Half Year Half Year Half Year % Mov’t March Sept March Mar 22 Mar 22 $m 2022 2021 2021 - Sept 21 - Mar 21 Net interest income 5,700 6,173 6,300 (8) (10) Non-interest income 487 437 430 11 13 Net operating income 6,187 6,610 6,730 (6) (8) Operating expenses (3,351) (3,687) (3,429) (9) (2) Core earnings 2,836 2,923 3,301 (3) (14) Impairment (charges)/benefits (131) 400 209 large large Profit before income tax expense 2,705 3,323 3,510 (19) (23) Income tax expense and non-controlling interests (NCI) (820) (1,001) (1,048) (18) (22) Cash earnings 1,885 2,322 2,462 (19) (23) Add back notable items - (31) 51 (100) (100) Cash earnings excluding notable items 1,885 2,291 2,513 (18) (25) Expense to income ratio 54.16% 55.78% 50.95% (162 bps) 321 bps Net interest margin 2.29% 2.49% 2.59% (20 bps) (30 bps) As at As at As at % Mov’t 31 March 30 Sept 31 March Mar 22 Mar 22 $bn 2022 2021 2021 - Sept 21 - Mar 21 Customer deposits Term deposits 75.6 76.5 85.6 (1) (12) Other 335.3 318.5 292.1 5 15 Total customer deposits 410.9 395.0 377.7 4 9 Net loans Mortgages 458.4 455.7 443.6 1 3 Business 82.4 79.8 79.5 3 4 Other 9.0 8.8 10.0 2 (10) Provisions (3.2) (3.2) (3.8) - (16) Total net loans 546.6 541.1 529.3 1 3 Deposit to loan ratio 75.16% 73.00% 71.36% 216 bps 380 bps Total assets 561.0 555.4 544.6 1 3 TCE 660.6 653.9 642.0 1 3 Average interest earning assets1 499.9 493.9 487.7 1 3 Average allocated equity1 33.1 33.0 33.0 - - Credit quality Impairment charges/(benefits) to average loans annualised1 0.05% (0.15%) (0.08%) large large Total stressed exposures to TCE 1.49% 1.74% 2.01% (25 bps) (52 bps) 1. Averages are based on a six month period. |
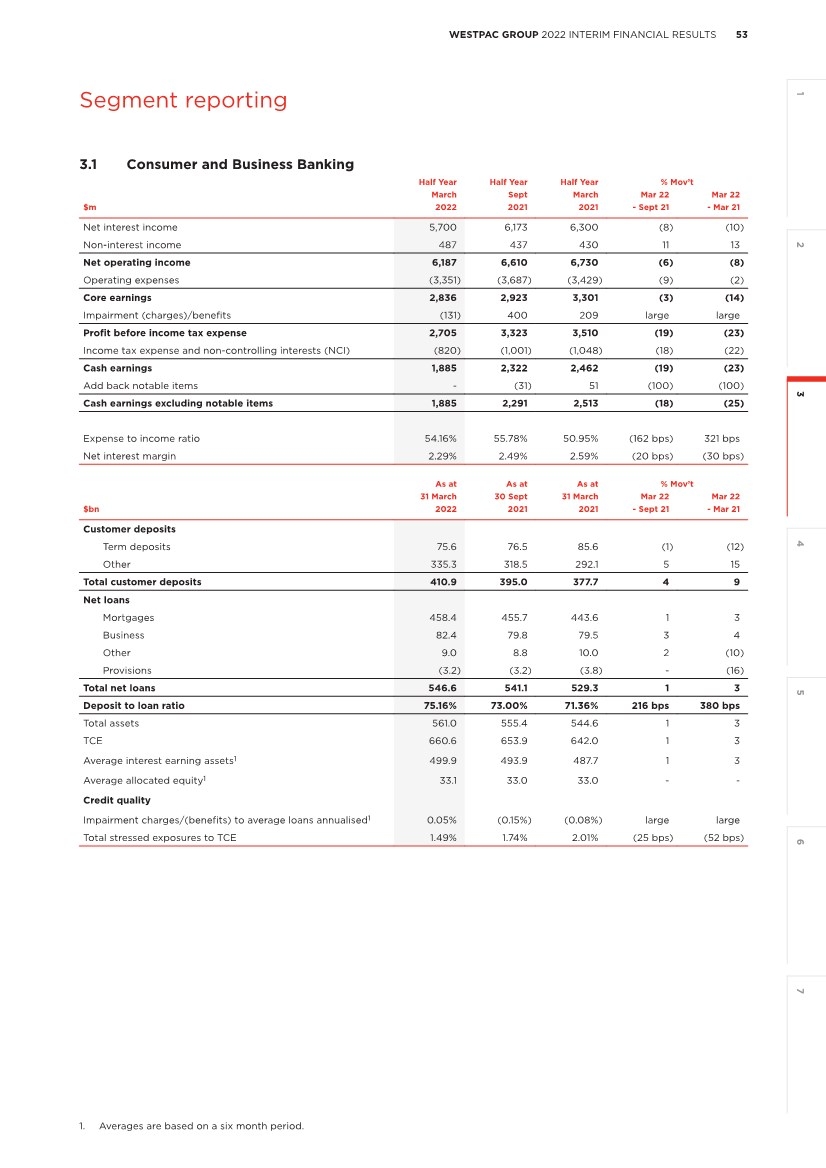
| 54 WESTPAC GROUP 2022 INTERIM FINANCIAL RESULTS Segment reporting 3.1.1 Consumer Consumer provides a range of banking products and services, including mortgages, credit cards, personal loans, and savings and at call deposits to customers in Australia. Products and services are provided under the Westpac, St.George, BankSA, Bank of Melbourne, and RAMS brands. Half Year Half Year Half Year % Mov’t March Sept March Mar 22 Mar 22 $m 2022 2021 2021 - Sept 21 - Mar 21 Net interest income 4,377 4,722 4,764 (7) (8) Non-interest income 324 263 255 23 27 Net operating income 4,701 4,985 5,019 (6) (6) Operating expenses (2,369) (2,522) (2,376) (6) - Core earnings 2,332 2,463 2,643 (5) (12) Impairment (charges)/benefits 27 82 102 (67) (74) Profit before income tax expense 2,359 2,545 2,745 (7) (14) Income tax expense and non-controlling interests (NCI) (713) (765) (818) (7) (13) Cash earnings 1,646 1,780 1,927 (8) (15) Add back notable items - 29 76 (100) (100) Cash earnings excluding notable items 1,646 1,809 2,003 (9) (18) Expense to income ratio 50.39% 50.59% 47.34% (20 bps) 305 bps Net interest margin 2.09% 2.27% 2.34% (18 bps) (25 bps) As at As at As at % Mov’t 31 March 30 Sept 31 March Mar 22 Mar 22 $bn 2022 2021 2021 - Sept 21 - Mar 21 Customer deposits Term deposits 50.5 50.2 55.5 1 (9) Other 225.7 216.2 198.5 4 14 Total customer deposits 276.2 266.4 254.0 4 9 Net loans Mortgages 458.4 455.7 443.6 1 3 Other 9.0 8.8 10.0 2 (10) Provisions (1.7) (1.8) (2.0) (6) (15) Total net loans 465.7 462.7 451.6 1 3 Deposit to loan ratio 59.30% 57.58% 56.25% 172 bps 305 bps Total assets 479.9 476.9 466.8 1 3 TCE 554.0 551.8 540.0 - 3 Average interest earning assets1 420.3 415.4 408.0 1 3 Average allocated capital1 25.2 24.8 24.8 2 2 Credit quality Impairment charges/(benefits) to average loans annualised1 (0.01%) (0.04%) (0.05%) 3 bps 4 bps Mortgage 90+ day delinquencies 0.88% 1.07% 1.20% (19 bps) (32 bps) Other consumer loans 90+ day delinquencies 1.48% 1.60% 1.60% (12 bps) (12 bps) Total stressed exposures to TCE 0.81% 0.98% 1.06% (17 bps) (25 bps) 1. Averages are based on a six month period. |
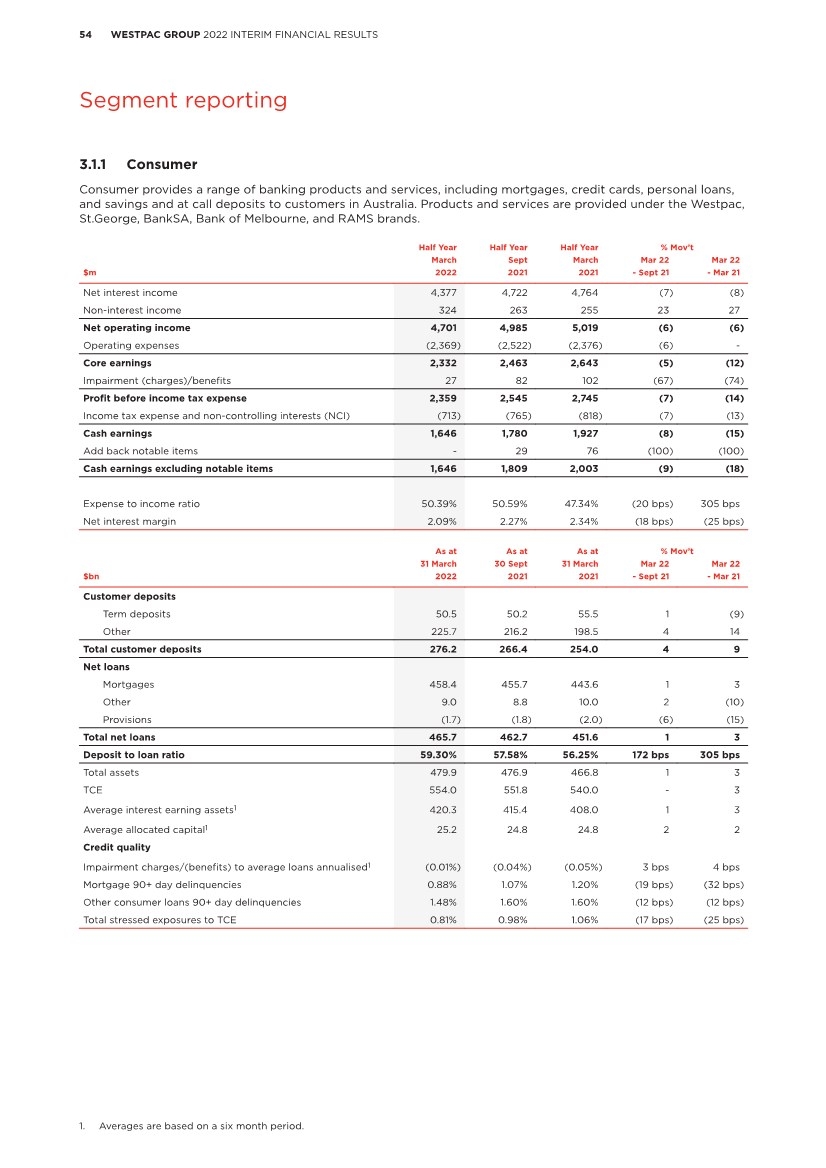
| 55 WESTPAC GROUP 2022 INTERIM FINANCIAL RESULTS 2 4 5 6 7 3 1 Segment reporting Financial performance First Half 2022 – Second Half 2021 Cash earnings of $1,646 million was $134 million or 8% lower ($163 million or 9% lower excluding notable items) mostly due to lower net interest income from an 18 basis point reduction in net interest margin and a lower impairment benefit. These were partly offset by a reduction in expenses, and a rise in non-interest income. There were no notable items in Consumer in First Half 2022, and minimal notable items in Second Half 2021 (mostly in expenses). Net interest income down $345m, 7% • Net loans increased $3.0 billion (or 1%) over the half. Mortgages increased $2.7 billion with a 2% increase in owner occupied mortgages partly offset by a reduction in investor lending. Other lending increased $0.2 billion (or 2%) mostly from credit cards as consumers increased spending over the holiday period and following the cessation of COVID-19 related lockdowns; • Deposits increased $9.8 billion (or 4%), with most growth in savings and transaction accounts (including mortgage offset accounts). Term deposits balances were little changed over the prior half as customers elected to hold their funds at call; and • Net interest margin was 18 basis points lower mainly from mortgage competition and growth in lower spread products (owner occupied, fixed rate mortgage lending) while balances in higher spread products (investor and interest only lending) declined. Funding costs also contributed to lower margins as loan interest rate pricing did not keep pace as the yield curve steepened. These declines were partly offset by higher deposit spreads from both repricing and changes in deposit mix. Non-interest income up $61m, 23% • Non-interest income benefitted from a $25 million one-off payment related to achieving a milestone under the new distribution arrangements for general insurance; and • Excluding this, non-interest income was up $36 million (or 14%), mostly from higher card fees consistent with increased economic activity and higher international spending. Expenses down $153m, 6% • Expenses excluding notable items were down $118 million (or 5%) mostly from our simplification initiatives including changes in our organisational structure, and reduced network expenses as we closed 70 branches and 117 ATMs; and • Costs for programs to improve our management of risk were also lower. Impairment benefit of $27m compared to impairment benefit of $82m • The lower benefit was driven by an increase in portfolio overlays related to supply chain disruptions, labour shortages, inflation, and recent flood events in Eastern Australia; and • Credit quality metrics improved with stressed exposures to TCE down 17 basis points to 0.81%. Mortgage 90+ day delinquencies were down 19 basis points to 0.88%, mainly due to a reduction in the hardship portfolio as customers completed their serviceability period as well as exiting COVID-19 assistance packages. Other consumer 90+ day delinquencies were down 12 basis points to 1.48% driven predominately by an improvement in the cards portfolio. |
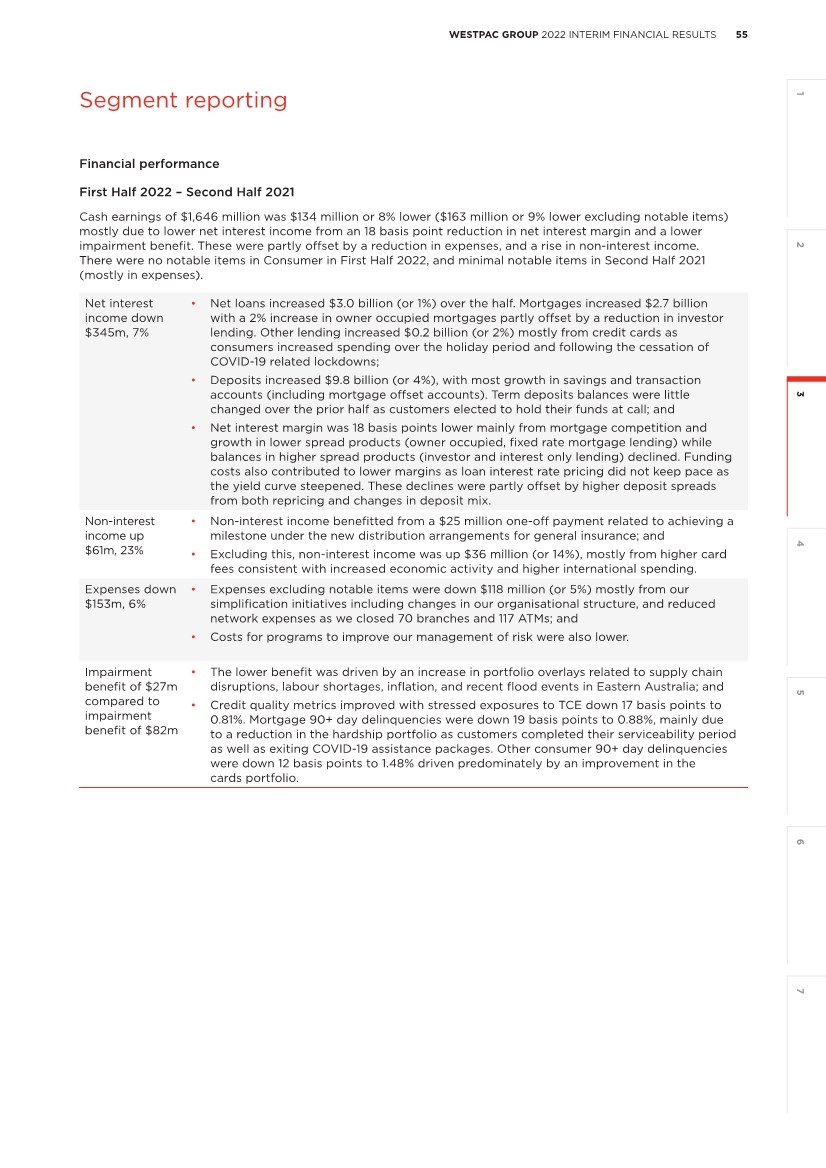
| 56 WESTPAC GROUP 2022 INTERIM FINANCIAL RESULTS Segment reporting First Half 2022 – First Half 2021 Cash earnings of $1,646 million was $281 million or 15% lower mostly due to a decline in net interest income and a lower impairment benefit. These decreases were offset by higher non-interest income and a small reduction in expenses. Notable items reduced cash earnings by $76 million in First Half 2021 with almost all the impact in expenses. Net interest income down $387m, 8% • Net loans were $14.1 billion (or 3%) higher compared to First Half 2021, with mortgage growth of $14.8 billion partly offset by a $1.0 billion decline in other lending; • Deposits increased $22.2 billion (or 9%), with all growth in savings and transaction accounts partly offset by a reduction in term deposits; and • Net interest margin was 25 basis points lower from mortgage competition and portfolio mix effects including a decline in relatively higher spread investor mortgages along with lower cards and personal loan balances. This decline was partly offset by higher deposit spreads from mix changes (switching from term deposits to at call) and from repricing. Non-interest income up $69m, 27% • Non-interest income benefitted from a $25 million one-off payment following achieving milestone under the new distribution arrangements for general insurance. Excluding this item, non-interest income was up $44 million (or 17%) mainly due to: – Higher cards fees from increased transactions and more international activity as COVID-19 restrictions eased; and – Higher mortgage fees from the increase in lending activity. • Partly offset by the loss of fee income from the removal of certain account-keeping fees and other simplification initiatives ($5 million). Expenses down $7m, flat • Expenses excluding notable items increased $99 million (or 4%) mostly from: – Higher spending on risk and compliance programs; – Additional resources to support customers; – Annual salary increases; and – An increase in software amortisation as certain projects became operational. • Partly offset by cost savings from greater use of digital channels and a reduction in the branch and ATM network. A net 110 branches and 199 ATMs were closed over the year. Impairment benefit of $27m compared to an impairment benefit of $102m • Impairment benefit was $75 million lower driven by an increase in portfolio overlays related to supply chain disruptions, labour shortages, inflation, and recent flood events in Eastern Australia; and • Credit quality metrics improved with stressed exposures to TCE down 25 basis points to 0.81%. Mortgage 90+ day delinquencies were down 32 basis points to 0.88% and other Consumer 90+ day delinquencies were down 12 basis points to 1.48% driven predominately by an improvement in the cards portfolio. |
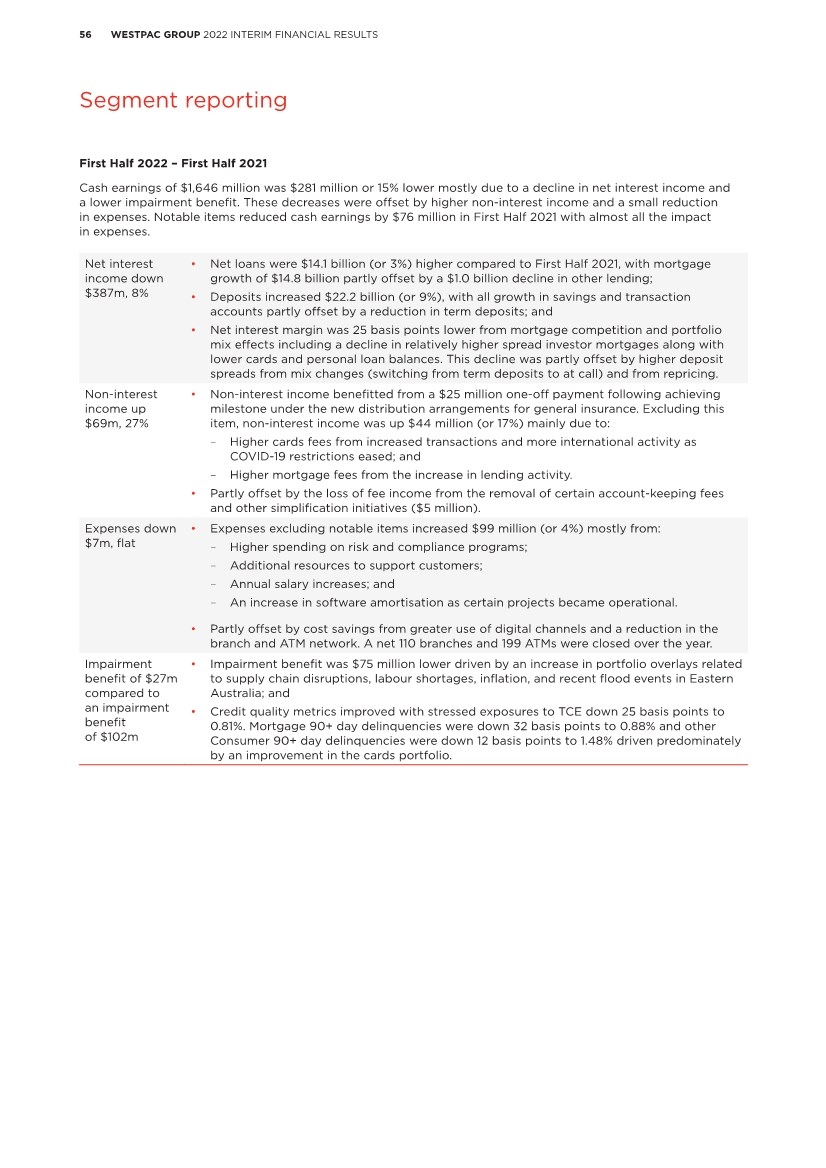
| 57 WESTPAC GROUP 2022 INTERIM FINANCIAL RESULTS 2 4 5 6 7 3 1 Segment reporting 3.1.2 Business Business provides banking services and products to Australian small business, Agribusiness and Commercial businesses generally up to $200 million in exposure. The segment offers savings, transaction and lending products including specialist services such as cash flow finance, equipment finance and property finance. Business operates under the Westpac, St.George, BankSA, and Bank of Melbourne brands. Half Year Half Year Half Year % Mov’t March Sept March Mar 22 Mar 22 $m 2022 2021 2021 - Sept 21 - Mar 21 Net interest income 1,323 1,451 1,536 (9) (14) Non-interest income 163 174 175 (6) (7) Net operating income 1,486 1,625 1,711 (9) (13) Operating expenses (982) (1,165) (1,053) (16) (7) Core earnings 504 460 658 10 (23) Impairment (charges)/benefits (158) 318 107 large large Profit before income tax expense 346 778 765 (56) (55) Income tax expense and NCI (107) (236) (230) (55) (53) Cash earnings 239 542 535 (56) (55) Add back notable items - (60) (25) (100) (100) Cash earnings excluding notable items 239 482 510 (50) (53) Expense to income ratio 66.08% 71.69% 61.54% large large Net interest margin 3.33% 3.69% 3.86% (36 bps) (53 bps) As at As at As at % Mov’t 31 March 30 Sept 31 March Mar 22 Mar 22 $bn 2022 2021 2021 - Sept 21 - Mar 21 Customer deposits Term deposits 25.1 26.3 30.1 (5) (17) Other 109.6 102.3 93.6 7 17 Total customer deposits 134.7 128.6 123.7 5 9 Net loans Business 82.4 79.8 79.5 3 4 Provisions (1.5) (1.4) (1.8) 7 (17) Total net loans 80.9 78.4 77.7 3 4 Deposit to loan ratio 166.42% 164.00% 159.22% 242 bps large Total assets 81.1 78.5 77.8 3 4 TCE 106.6 102.1 102.0 4 5 Average interest earning assets1 79.6 78.5 79.7 1 - Average allocated capital1 7.9 8.2 8.2 (4) (4) Credit quality Impairment charges/(benefits) to average loans annualised1 0.40% (0.80%) (0.27%) large large Business: impaired exposures to TCE 0.60% 0.72% 0.87% (12 bps) (27 bps) Total stressed exposures to TCE 5.07% 5.90% 7.02% (83 bps) (195 bps) 1. Averages are based on a six month period. |
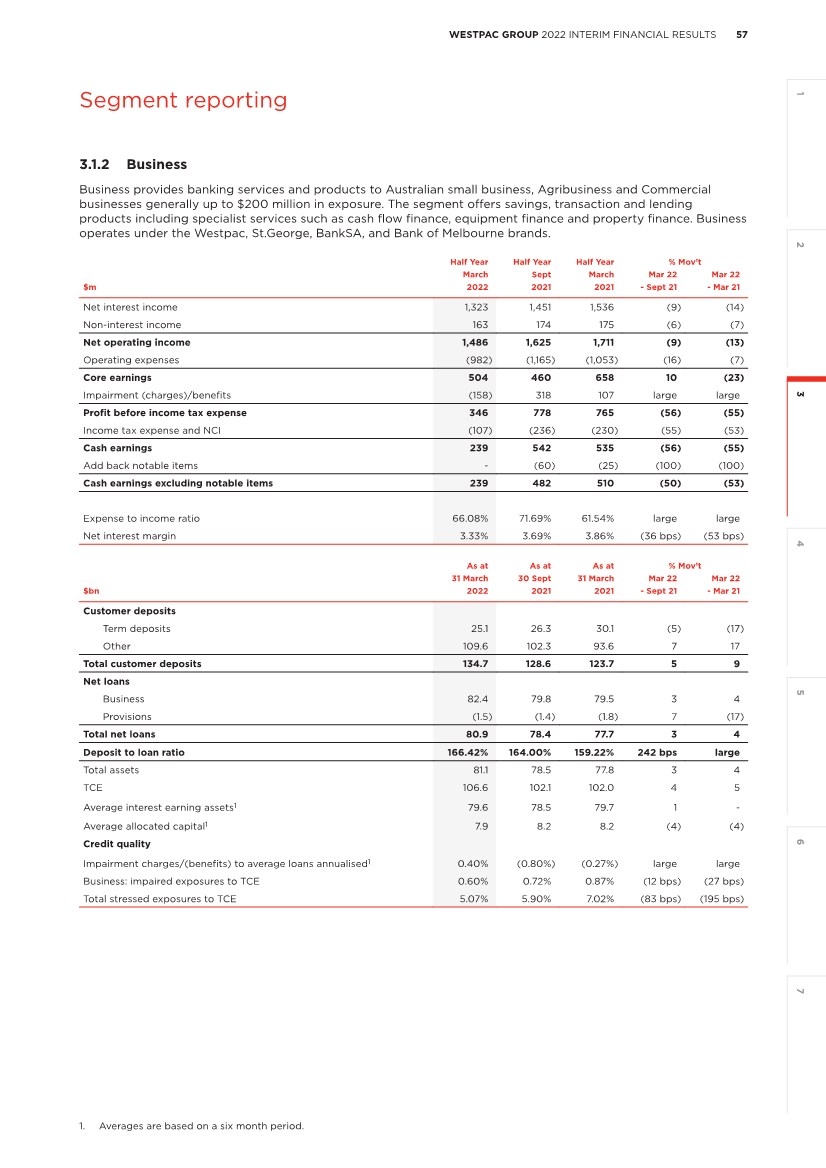
| 58 WESTPAC GROUP 2022 INTERIM FINANCIAL RESULTS Segment reporting Financial performance First Half 2022 – Second Half 2021 Cash earnings of $239 million was $303 million or 56% lower than Second Half 2021 ($243 million lower excluding notable items) mostly from a $476 million turnaround in impairment charges (a benefit to a charge). There were no notable items in First Half 2022 but excluding their impact from Second Half 2021, core earnings increased $133 million, or 36%, from lower expenses. Net interest income down $128m, 9% • Excluding notable items, net interest income was down $25 million (or 2%); • Net loans were $2.5 billion (or 3%) higher over the half with growth across the commercial property and agriculture sectors; • Deposits were up $6.1 billion (or 5%) including a $3.8 billion rise in transaction accounts and $3.5 billion rise in savings accounts as customers elected to hold more funds at call. Term deposits were $1.2 billion lower; and • Net interest margin was down 36 basis points (10 basis points excluding notable items as Second Half 2021 included a benefit of $103 million) mostly from competition for new lending and to retain business and lower returns on hedged deposits. These reductions were partly offset by deposit repricing and changes in the deposit mix (more transaction balances). Non-interest income down $11m, 6% • The decrease was mostly from higher card scheme fees received in Second Half 2021 and lower merchant fees in First Half 2022. Expenses down $183m, 16% • Excluding notable items of $14 million in Second Half 2021, expenses were down $169 million (or 15%). The decline was due to; – Simplification of our operating structure; and – Costs for programs to improve our management of risk were also lower. Impairment charge of $158m compared to an impairment benefit of $318m • The impairment charge was mostly due to an increase in CAP related to supply chain disruptions, labour shortages, inflation and asset price risks; and • Credit quality metrics improved with stressed exposures to TCE down 83 basis points to 5.07%, with significant reduction in stress in accommodation and agricultural sectors. |
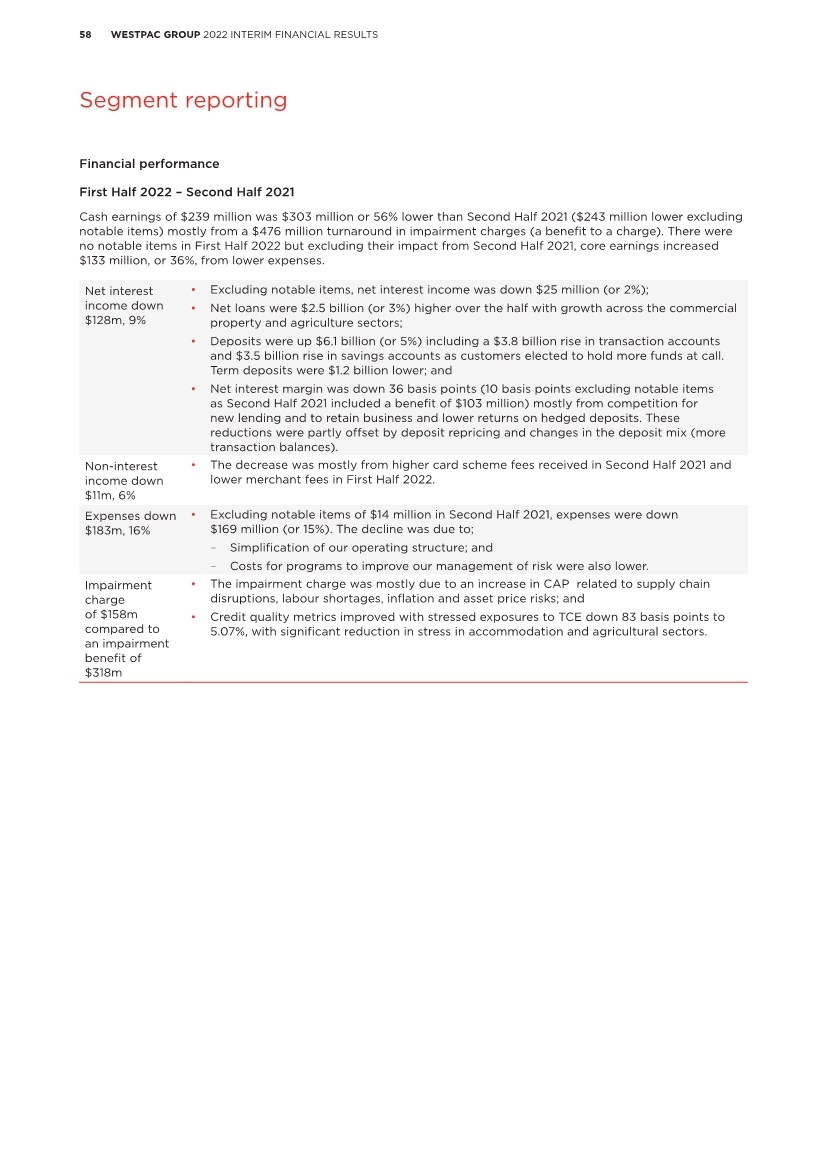
| 59 WESTPAC GROUP 2022 INTERIM FINANCIAL RESULTS 2 4 5 6 7 3 1 Segment reporting First Half 2022 – First Half 2021 Cash earnings of $239 million was $296 million or 55% ($271 million lower excluding notable items) mostly from a $265 million turnaround in impairment charges (from an impairment benefit in First Half 2021). Excluding notable items, core earnings were $119 million or 19% lower mostly from the 35 basis point (ex notable items) reduction in net interest margin. Net interest income down $213m, 14% • Excluding notable items, net interest income was down $139 million (or 10%); • Net loans increased $3.2 billion (or 4%) over the year with most growth in commercial property and agriculture sectors; • Deposits were up $11.0 billion (or 9%) with a $16.0 billion increase in at call accounts, including a $9.1 billion rise in transaction balances, while term deposits declined $5.0 billion as customers elected to hold more funds at call; and • Net interest margin declined 53 basis points (35 basis points lower excluding notable items). The decline was mostly from lower loan spreads due to competitive pricing and lower returns on hedged deposits. This was partly offset by higher deposit spreads from repricing and portfolio mix benefits. Non-interest income down $12m, 7% • The decline was mainly due to lower payment and merchant related fees including higher interchange costs and some higher one-off scheme payments in First Half 2021; and • These declines were partly offset by higher guarantee and overdraft fees. Expenses down $71m, 7% • Notable items were $40 million in First Half 2021, excluding this impact, expenses were $31 million lower driven by simplification initiatives including changes in our organisational structure partly offset by increased risk and compliance costs and annual salary increases. Impairment charge of $158m compared to an impairment benefit of $107m • The impairment charge was mostly due to an increase in CAP related to supply chain disruptions, labour shortages, inflation and asset price risks; and • Credit quality metrics improved with stressed exposures to TCE down 195 basis points to 5.07%, with a reduction in stress in the accommodation, agricultural, trade and property sectors. |

| 60 WESTPAC GROUP 2022 INTERIM FINANCIAL RESULTS Segment reporting 3.2 Westpac Institutional Bank (WIB) Westpac Institutional Bank (WIB) delivers a broad range of financial products and services to corporate, institutional and government customers operating in, or with connections to, Australia and New Zealand. WIB operates through dedicated industry relationship and specialist product teams, with expert knowledge in financing, transactional banking, and financial and debt capital markets. Customers are supported throughout Australia and via branches and subsidiaries located in New Zealand, New York, London and Singapore. WIB works with all the Group’s operating segments in the provision of markets’ related financial needs including foreign exchange and fixed interest solutions. Half Year Half Year Half Year % Mov’t March Sept March Mar 22 Mar 22 $m 2022 2021 2021 - Sept 21 - Mar 21 Net interest income 481 458 467 5 3 Non-interest income 588 626 687 (6) (14) Net operating income 1,069 1,084 1,154 (1) (7) Operating expenses (577) (1,887) (708) (69) (19) Core earnings 492 (803) 446 large 10 Impairment (charges)/benefits (58) (154) (8) (62) large Profit before income tax expense 434 (957) 438 large (1) Income tax expense and NCI (128) 126 (140) large (9) Cash earnings 306 (831) 298 large 3 Add back notable items - 965 26 (100) (100) Cash earnings excluding notable items 306 134 324 128 (6) Expense to income ratio 53.98% 174.08% 61.35% large large Net interest margin 1.17% 1.24% 1.26% (7 bps) (9 bps) As at As at As at % Mov’t 31 March 30 Sept 31 March Mar 22 Mar 22 $bn 2022 2021 2021 - Sept 21 - Mar 21 Customer deposits 104.7 99.3 92.7 5 13 Net loans Loans 74.3 68.3 63.4 9 17 Provisions (0.3) (0.6) (0.3) (50) - Total net loans 74.0 67.7 63.1 9 17 Deposit to loan ratio 141.53% 146.64% 146.84% large large Total assets 94.0 82.8 75.5 14 25 TCE 190.8 179.7 174.7 6 9 Average interest earning assets1 82.6 73.7 74.1 12 11 Average allocated capital1 7.7 7.5 8.1 3 (5) Impairment charges to average loans annualised1 0.16% 0.48% 0.03% (32 bps) 13 bps Impaired exposures to TCE 0.14% 0.29% 0.14% (15 bps) - Total stressed exposures to TCE 0.20% 0.64% 0.56% (44 bps) (36 bps) Revenue contribution Half Year Half Year Half Year % Mov’t March Sept March Mar 22 Mar 22 $m 2022 2021 2021 - Sept 21 - Mar 21 Lending and deposit revenue 710 673 642 5 11 Markets, sales and fee income 417 400 423 4 (1) Total customer revenue 1,127 1,073 1,065 5 6 Derivative valuation adjustments (29) 44 53 large large Trading revenue 34 25 75 36 (55) Other2 (63) (58) (39) 9 62 Total WIB revenue 1,069 1,084 1,154 (1) (7) 1. Averages are based on a six month period. 2. Includes capital benefit and the Bank Levy. |
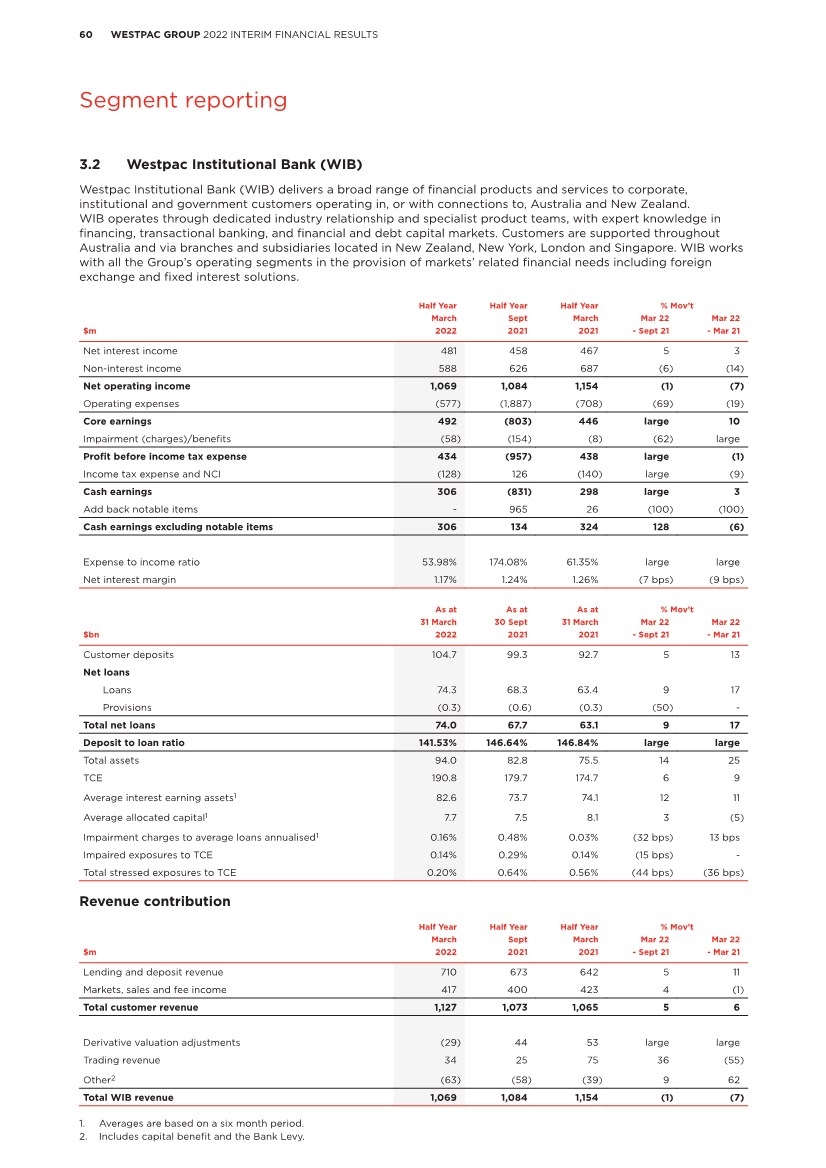
| 61 WESTPAC GROUP 2022 INTERIM FINANCIAL RESULTS 2 4 5 6 7 3 1 Segment reporting Financial performance First Half 2022 – Second Half 2021 Cash earnings of $306 million were $1,137 million higher than Second Half 2021, primarily due to the absence of notable items. Excluding notable items in Second Half 2021, cash earnings were $172 million or 128% higher from a 5% increase in customer revenue, lower expenses and a decline in impairment charges. Net interest income up $23m, 5% • Net loans were up 9%, or $6.3 billion with growth across the property and non-bank financial sectors and from supporting increased merger and acquisition activity. Existing customers also increased utilisation of their credit facilities, with loans to TCE up 1 percentage point over the half; • Deposits were $5.4 billion, or 5% higher largely in corporate term deposits and higher yield at call products, partly offset by lower government deposits; and • Net interest margin declined 7 basis points. The decline was mostly due to the mix impact from growth in market inventory. Loan and deposit spreads were little changed over the half. Non-interest income down $38m, 6% • A significant turnaround in derivative valuation adjustments from a gain of $44 million in Second Half 2021 compared to a loss of $29 million in First Half 2022 as counterparty credit spreads widened, partly offset by; • Higher markets income (up $39 million) due to higher market volatility in rates and FX markets. These conditions resulted in more customer activity including hedging their positions which supported a $30 million increase in customer markets income mostly across fixed income, and a $9 million increase in non-customer markets income. Expenses down $1,310m, 69% • Excluding notable items, expenses decreased $154 million, or 21% reflecting: – Benefits from international consolidation and simplification initiatives; – Lower risk and compliance costs as some programs were completed; and – Lower software amortisation and property costs following the write-down of certain assets in Second Half 2021. Impairment charges down $96m, 62% • The impairment charge was $96 million lower (Second Half 2021 included the Forum Finance IAP). This was partly offset by higher overlays in First Half 2022; and • Credit quality metrics improved with stressed exposures to TCE down 44 basis points to 0.20% mostly due to a reduction in watchlist and impaired exposures. |
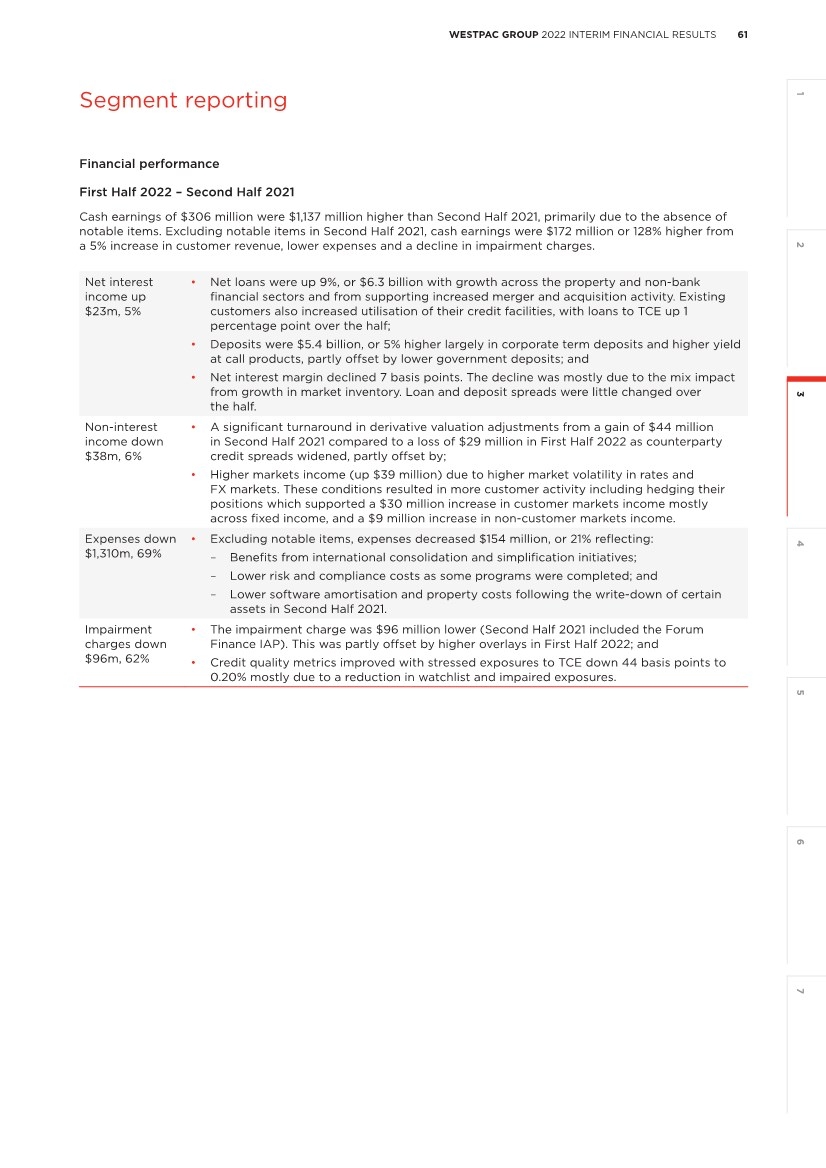
| 62 WESTPAC GROUP 2022 INTERIM FINANCIAL RESULTS Segment reporting First Half 2022 – First Half 2021 Cash earnings of $306 million were $8 million or 3% higher than First Half 2021. Excluding notable items, cash earnings were $18 million or 6% lower, primarily from a 7% decline in operating income and an increase in impairment charges. This was partly offset by a 14% reduction in operating expenses. Net interest income up $14m, 3% • Net loans increased $10.9 billion, or 17% with growth spread across most sectors; • Deposits were up $12.0 billion, or 13%, mostly from increased corporate term deposits and higher yield at call products as clients sought improved returns in the low rate environment; and • Net interest margin was down 9 basis points driven by the impact of low interest rate and mix impact from growth in market inventory. Improved deposit spreads were offset from a decline in loan spreads due to competition. Non-interest income down $99m, 14% • A significant turnaround in derivative valuation adjustments from a gain of $53 million in First Half 2021 compared to a loss of $29 million in First Half 2022 as counterparty credit spreads widened; partly offset by; • Excluding this impact, non-interest income was $17 million lower from: – A $41 million decline in non-customer markets income, mostly from fixed income; – Lower payments revenue from reduced transaction volumes and from exiting some non-core activities; – Partly offset by higher customer markets income ($35 million) across fixed income and FX due to higher market volatility; and – Increased origination and syndication activity. Expenses down $131m, 19% • Excluding notable items, expenses decreased $94 million, or 14% reflecting: – Simplification benefits, mostly from the full period benefit of international consolidation, product and process simplification and operating model changes; – Lower software amortisation expenses and property costs due to the write-down of certain assets in Second Half 2021; and – Partly offset by an increase in staff expenses. Impairment charges up $50m, large • The impairment charge was $50 million higher, driven by an increase in CAP mainly related to supply chain disruptions, labour shortages, inflation and asset price risks; and • Credit quality metrics improved with stressed exposures to TCE down 36 basis points to 0.20% predominately due to a reduction in watchlist exposures. Impaired exposures to TCE were flat at 0.14%. |
| 63 WESTPAC GROUP 2022 INTERIM FINANCIAL RESULTS 2 4 5 6 7 3 1 Segment reporting 3.3 Westpac New Zealand Westpac New Zealand provides banking, wealth and insurance products and services for consumer, business and institutional customers in New Zealand. Westpac conducts its business through: Westpac New Zealand Limited, which is incorporated in New Zealand, and Westpac Banking Corporation (New Zealand Branch), which is incorporated in Australia. Westpac New Zealand operates through a network of branches and ATMs across the North and South Islands. Business and institutional customers are also served through relationship and specialist product teams. New Zealand maintains its own infrastructure, including technology, operations and treasury. All figures are in NZ$ unless noted otherwise. Half Year Half Year Half Year % Mov’t March Sept March Mar 22 Mar 22 NZ$m 2022 2021 2021 - Sept 21 - Mar 21 Net interest income 1,102 1,052 1,066 5 3 Non-interest income 287 166 179 73 60 Net operating income 1,389 1,218 1,245 14 12 Operating expenses (564) (596) (536) (5) 5 Core earnings 825 622 709 33 16 Impairment (charges)/benefits 10 (15) 99 large (90) Profit before income tax expense 835 607 808 38 3 Income tax expense and NCI (200) (177) (225) 13 (11) Cash earnings 635 430 583 48 9 Add back notable items (131) 44 10 large large Cash earnings excluding notable items 504 474 593 6 (15) Expense to income ratio 40.60% 48.93% 43.05% large (245 bps) Net interest margin 1.98% 1.94% 2.06% 4 bps (8 bps) As at As at As at % Mov’t 31 March 30 Sept 31 March Mar 22 Mar 22 NZ$bn 2022 2021 2021 - Sept 21 - Mar 21 Customer deposits Term deposits 30.1 28.3 28.7 6 5 Other 48.3 47.6 45.4 1 6 Total customer deposits 78.4 75.9 74.1 3 6 Net loans Mortgages 62.2 60.9 58.4 2 7 Business 31.0 31.0 31.3 - (1) Other 1.2 1.2 1.4 - (14) Provisions (0.4) (0.5) (0.5) (20) (20) Total net loans 94.0 92.6 90.6 2 4 Deposit to loan ratio 83.40% 81.97% 81.79% 143 bps 161 bps Total assets 116.5 112.4 107.6 4 8 TCE 141.8 136.7 131.1 4 8 Third party liquid assets 19.3 15.8 14.1 22 37 Average interest earning assets1 111.8 108.0 103.8 4 8 Average allocated capital1 7.0 7.0 6.9 - 1 Total funds 11.7 12.0 11.9 (3) (2) Credit quality Impairment charges/(benefits) to average loans annualised1 (0.02%) 0.03% (0.22%) large 20 bps Mortgage 90+ day delinquencies 0.30% 0.30% 0.33% - (3 bps) Other consumer loans 90+ day delinquencies 1.42% 1.65% 1.91% (23 bps) (49 bps) Impaired exposures to TCE 0.06% 0.11% 0.13% (5 bps) (7 bps) Total stressed exposures to TCE 1.14% 1.19% 1.56% (5 bps) (42 bps) 1. Averages are based on a six month period. |
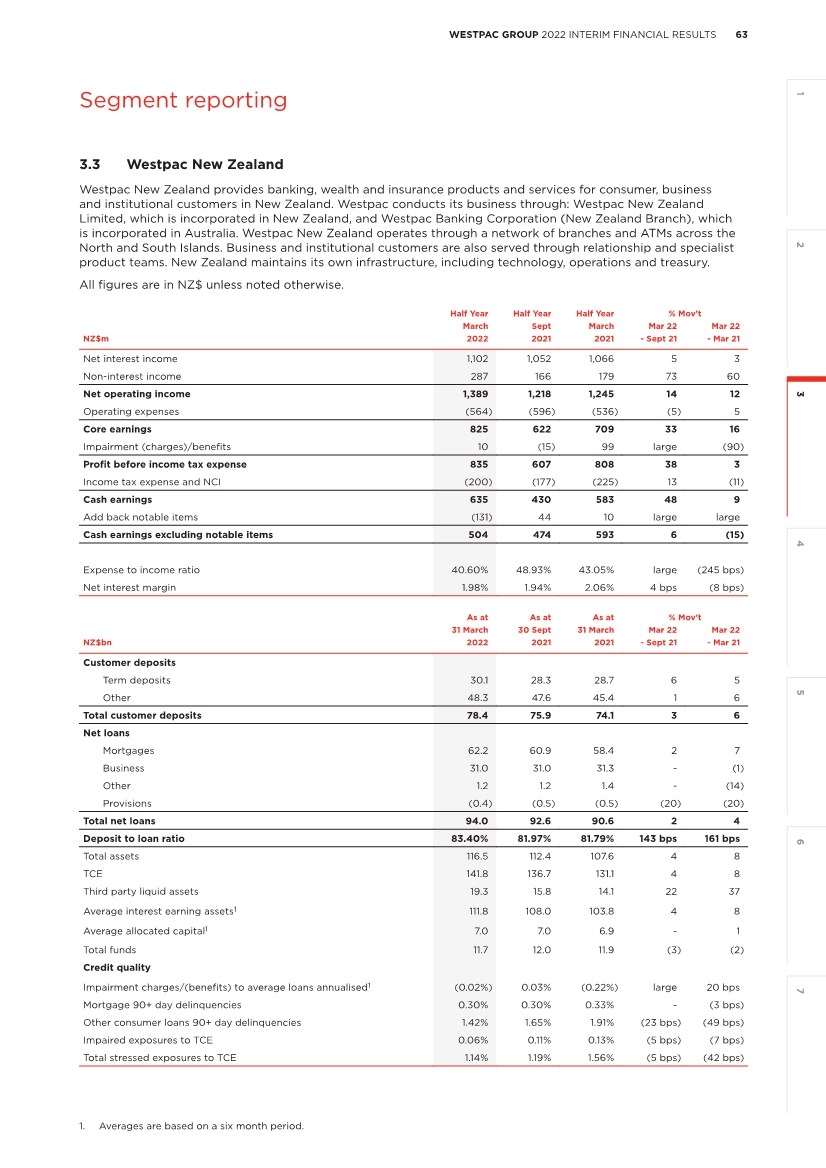
| 64 WESTPAC GROUP 2022 INTERIM FINANCIAL RESULTS Segment reporting Financial performance (NZ$) First Half 2022 – Second Half 2021 Cash earnings of $635 million were $205 million or 48% higher, largely from the gain on sale of Westpac Life-NZ- Limited (NZ Life), $126 million, treated as a notable item in First Half 2022. Excluding notable items, cash earnings increased $30 million, or 6%, from a reduction in expenses and an impairment benefit. Net interest income up $50m, 5% • Excluding the impact of notable items, net interest income was $10 million higher; • Net loans increased $1.4 billion, or 2%, with most growth in mortgages; • Deposits were up $2.5 billion, or 3%, with most of the growth in term deposits as customers shift preference in a rising rate environment; and • Net interest margin was 4 basis points higher (4 basis points lower excluding notable items). Excluding notable items, the decline was due to lower spreads on new mortgages and the impact of portfolio mix (more lower yielding products). This was partly offset by higher deposit spreads from rising interest rates. The 22% increase in third party liquid assets had less than 1 basis point impact on the net interest margin. Non-interest income up $121m, 73% • Excluding a $126 million gain (a notable item) on the sale of NZ Life in February 2022, non-interest income was $12 million lower. Most of the decline was due to lower investment income following repricing of our funds including KiwiSaver funds and lower banking fee income due to reduced activity. The loss of income following the divestment of NZ Life was partly offset by distribution fees received. Expenses down $32m, 5% • Excluding notable items, expenses were $15 million, or 3% lower mostly from the timing of risk and compliance spending with more investment typically in the second half of the year. Impairment benefit of $10m compared to an impairment charge of $15m • Asset quality has generally improved with stressed exposures to TCE down 5 basis points and other consumer 90+ day delinquencies down 23 basis points. Mortgage 90+ day delinquencies of 30 basis points were unchanged over the half; and • The impairment benefit mostly reflects lower collectively assessed provisions from improved credit quality metrics. The Second Half 2021 impairment charge was mostly due to an IAP raised for Forum Finance. |
| 65 WESTPAC GROUP 2022 INTERIM FINANCIAL RESULTS 2 4 5 6 7 3 1 Segment reporting First Half 2022 – First Half 2021 Cash earnings of $635 million were $52 million or 9% higher than First Half 2021, largely from the gain on sale of NZ Life partly offset by a lower impairment benefit. Excluding notable items, cash earnings decreased $89 million, or 15%, mostly due to higher spending on risk and compliance projects and a lower impairment benefit. Net interest income up $36m, 3% • Excluding the impact of notable items, net interest income was $26 million higher; • Net loans increased $3.4 billion, or 4%, with $3.8 billion of mortgage growth partly offset by $0.3 billion decrease in business loans; • Deposits increased $4.3 billion, or 6%, fully funding loan growth and lifting the deposit to loan ratio to 83.4%. Growth in at call accounts was mainly across households, while the increase in term deposits was across businesses and households; and • Net interest margin decreased 8 basis points (11 basis points lower excluding notable items) mostly from lower lending spreads on new mortgages and portfolio mix changes. This was partly offset by higher deposit spreads due to repricing and the impact of rising interest rates. The 37% increase in third party liquid assets had less than 1 basis point impact on the net interest margin. Non-interest income up $108m, 60% • Excluding notable items mostly relating to the gain on the sale of NZ Life in February 2022, non-interest income decreased $24 million; • Investment income was lower from the repricing of our funds including KiwiSaver funds. Lower cards revenue also contributed to the decline; • The loss of income following the divestment of NZ Life was partly offset by distribution fees received; and • First Half 2021 included a gain on sale of the Wealth Advisory business ($8 million). Expenses up $28m, 5% • Excluding notable items, expenses increased $34 million, primarily due to increased investment in technology resilience and data capability along with risk and compliance projects including RBNZ’s BS11 Outsourcing Policy and Section 95 requirements on liquidity and risk governance. The number of FTE increased by 299 over the year. Impairment benefit of $10m compared to impairment benefit of $99m • Impairment benefit in First Half 2022 was mostly due to improved credit metrics. • Stressed exposures to TCE down 42 basis points to 1.14% due to reduction in watchlist exposures. Mortgage 90+ day delinquencies were 3 basis points lower at 0.30%. Other consumer 90+ day delinquencies of 1.42%, down 49 basis points over the half, with most of the decrease due to an improvement in customers in hardship. |
| 66 WESTPAC GROUP 2022 INTERIM FINANCIAL RESULTS Segment reporting 3.3.1 Westpac New Zealand segment performance (A$ Equivalent) Results have been translated into Australian dollars (A$) at the average exchange rates for each reporting period, First Half 2022: $1.0593 (Second Half 2021: $1.0626; First Half 2021: $1.0698). Unless otherwise stated, assets and liabilities have been translated at spot rates as at the end of the period, 31 March 2022: $1.0759 (30 September 2021: $1.0477; 31 March 2021: $1.0891). Half Year Half Year Half Year % Mov’t March Sept March Mar 22 Mar 22 $m 2022 2021 2021 - Sept 21 - Mar 21 Net interest income 1,041 991 996 5 5 Non-interest income 270 156 167 73 62 Net operating income 1,311 1,147 1,163 14 13 Operating expenses (534) (562) (500) (5) 7 Core earnings 777 585 663 33 17 Impairment (charges)/benefits 9 (13) 92 large (90) Profit before income tax expense 786 572 755 37 4 Income tax expense and NCI (189) (167) (210) 13 (10) Cash earnings 597 405 545 47 10 Add back notable items (124) 42 10 large large Cash earnings excluding notable items 473 447 555 6 (15) Expense to income ratio1 40.60% 48.93% 43.05% large (245 bps) Net interest margin1 1.98% 1.94% 2.06% 4 bps (8 bps) As at As at As at % Mov’t March Sept March Mar 22 Mar 22 $bn 2022 2021 2021 - Sept 21 - Mar 21 Customer deposits 72.8 72.5 68.0 - 7 Net loans 87.4 88.4 83.2 (1) 5 Deposit to loan ratio1 83.40% 81.97% 81.79% 143 bps 161 bps Total assets 108.2 107.1 98.8 1 10 TCE 131.8 130.5 120.3 1 10 Third party liquid assets 18.0 15.1 12.9 19 40 Average interest earning assets2 105.6 101.7 97.0 4 9 Average allocated capital2 6.6 6.6 6.5 - 2 Total funds 10.9 11.5 10.9 (5) - 1. Ratios calculated using NZ$. 2. Averages are based on a six month period and are translated at average rates. |
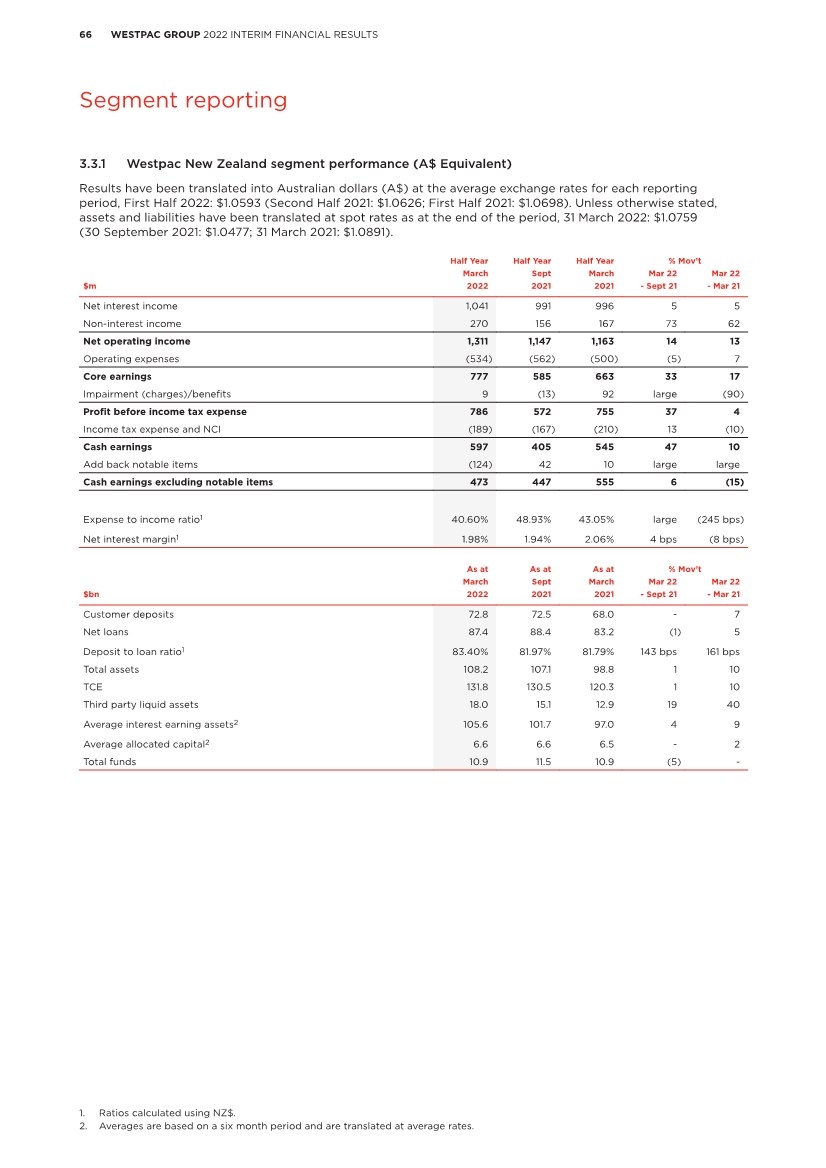
| 67 WESTPAC GROUP 2022 INTERIM FINANCIAL RESULTS 2 4 5 6 7 3 1 Segment reporting 3.4 Specialist Businesses (SB) Specialist Businesses comprises the operations that Westpac has decided to exit. An agreement was completed in 2021 for the sale of Westpac Life Insurance Limited. Regulatory approvals have been obtained and this sale is expected to finalise in 2022. Other operations yet to be sold, include investment product and services, superannuation and retirement products as well as wealth administration platforms. It also manages Westpac Pacific which provides a full range of banking services in Fiji and Papua New Guinea. Specialist Businesses operates under the Westpac, St.George, BankSA, Bank of Melbourne, and BT brands. Half Year Half Year Half Year % Mov’t March Sept March Mar 22 Mar 22 $m 2022 2021 2021 - Sept 21 - Mar 21 Net interest income 242 246 248 (2) (2) Non-interest income 550 790 665 (30) (17) Net operating income 792 1,036 913 (24) (13) Operating expenses (584) (738) (740) (21) (21) Core earnings 208 298 173 (30) 20 Impairment (charges)/benefits 38 (13) 79 large (52) Profit before income tax expense 246 285 252 (14) (2) Income tax expense and NCI (114) (240) (135) (53) (16) Cash earnings 132 45 117 193 13 Add back notable items 114 243 297 (53) (62) Cash earnings excluding notable items 246 288 414 (15) (41) Expense to income ratio 73.74% 71.24% 81.05% 250 bps large Net interest margin 3.45% 3.15% 3.06% 30 bps 39 bps As at As at As at % Mov’t 31 March 30 Sept 31 March Mar 22 Mar 22 $bn 2022 2021 2021 - Sept 21 - Mar 21 Deposits1 8.4 8.7 6.7 (3) 25 Net loans1 Loans 12.0 14.0 14.9 (14) (19) Provisions (0.3) (0.4) (0.4) (25) (25) Total net loans 11.7 13.6 14.5 (14) (19) Deposit to loan ratio1 71.29% 64.46% 46.09% large large Total funds 222.9 227.4 211.7 (2) 5 TCE 15.4 18.1 19.2 (15) (20) Average allocated capital2 4.1 4.6 4.6 (11) (11) Average funds2 224.9 223.8 205.6 - 9 Credit quality Auto Finance 90 day+ delinquencies 2.00% 1.97% 2.45% 3 bps (45 bps) Total stressed exposures to TCE 6.98% 6.41% 7.11% 57 bps (13 bps) Cash earnings excluding notable items Half Year Half Year Half Year % Mov’t March Sept March Mar 22 Mar 22 $m 2022 2021 2021 - Sept 21 - Mar 21 Held-for-sale 34 70 132 (51) (74) Businesses sold 5 94 54 (95) (91) Other businesses 207 124 228 67 (9) Total cash earnings (ex notable items) 246 288 414 (15) (41) 1. Includes assets and liabilities presented as held for sale. 2. Averages are based on a six month period. |
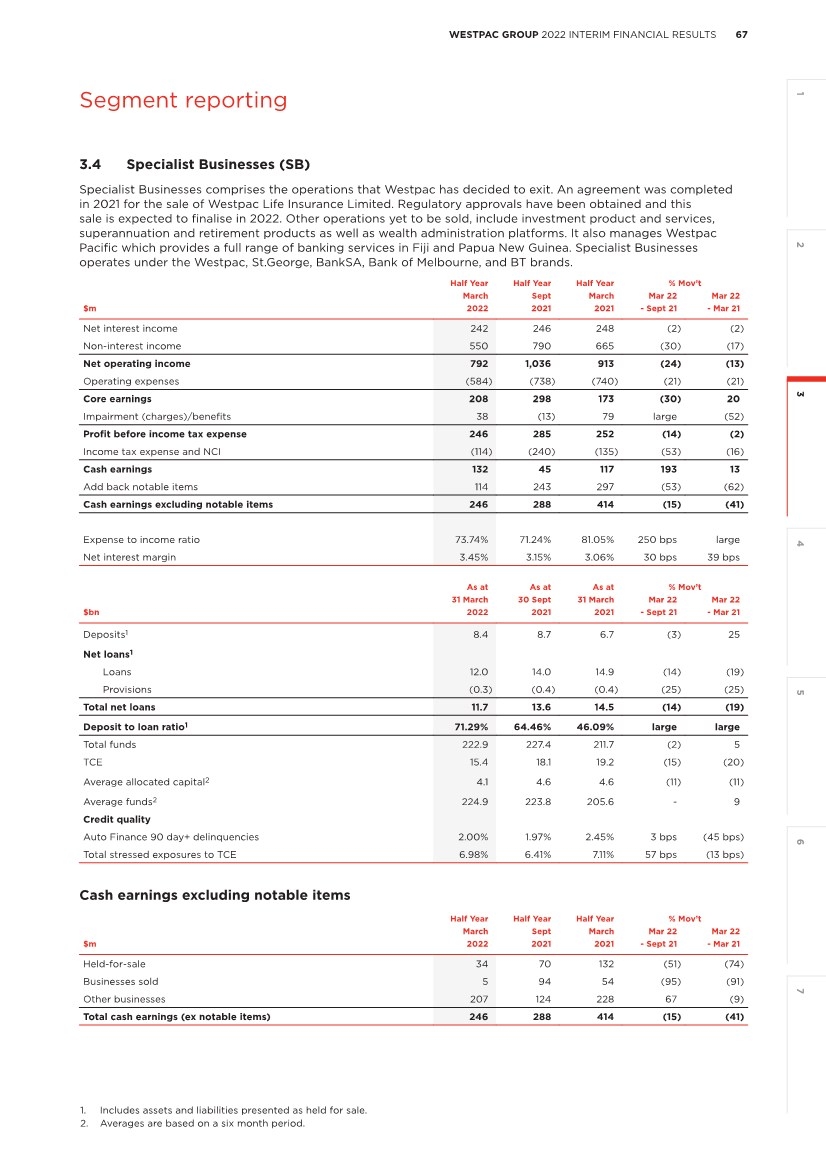
| 68 WESTPAC GROUP 2022 INTERIM FINANCIAL RESULTS Segment reporting Financial performance First Half 2022 – Second Half 2021 Cash earnings of $132 million was $87 million or 193% higher. Excluding notable items, cash earnings were $42 million or 15% lower mostly from the impact of businesses sold ($89 million) and lower life insurance revenue, partly offset by an impairment benefit in First Half 2022. Notable items reduced cash earnings by $114 million in First Half 2022, predominantly due to expenses associated with the write-down of goodwill and capitalised software in the unitised superannuation business, along with additional provisions for customer refunds, payments, litigation and associated costs. These were partly offset by the net gain on sale of the Auto Finance wholesale dealer and retail distribution business. As certain items were not tax deductible the effective tax rate was 45% in First Half 2022. The cash earnings contribution of divested businesses and businesses held for sale is in section 5, Note 8 of this report. Net interest income down $4m, 2% • Excluding the impact of notable items and businesses sold, net interest income decreased $12 million, or 5%; • Excluding the impact of businesses sold, net loans decreased $0.9 billion, or 7%. The run-off of the residual retail auto loan portfolio contributed $0.7 billion to the decline and lending in Westpac Pacific was also lower; • Deposits decreased $0.3 billion, or 3%, from lower deposits on Platforms; and • Excluding the impact of notable items, the net interest margin was up 6 basis points, mostly from lower funding costs in the Auto Finance portfolio. Non-interest income down $240m, 30% • Excluding the impact of notable items and businesses sold, non-interest income decreased $23 million, or 5%; • Life Insurance income was $51 million, or 51% lower, largely from the impact of yield curve movements on policyholder liabilities and loss recognition relating to disability income products; • The contribution from Superannuation, Platforms and Investments was $5 million, or 2%, lower from margin compression and MySuper fee reductions; and • Other income was up $33 million mostly from transition service payments related to businesses sold. Expenses down $154m, 21% • Excluding the impact of notable items and businesses sold, expenses decreased $50 million, or 12%. Most of the decrease related to lower investment spending from the completion of some activities and simplification initiatives. Impairment benefit of $38m compared to an impairment charge of $13m • The impairment benefit was driven by lower new IAPs, predominately in Westpac Pacific; and • Stressed exposures to TCE of 6.98%, up 57 basis points mainly due to portfolio run-off following the sale of the motor vehicle dealer finance and novated leasing businesses in First Half 2022. |
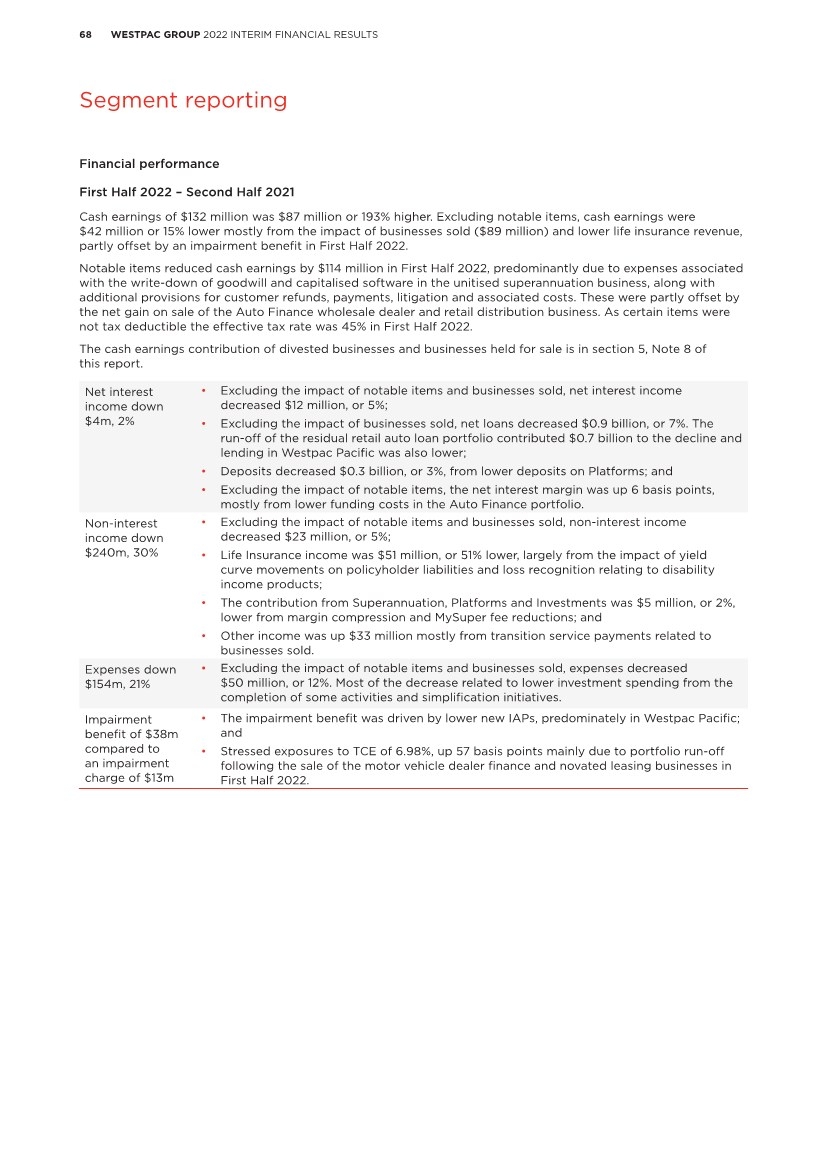
| 69 WESTPAC GROUP 2022 INTERIM FINANCIAL RESULTS 2 4 5 6 7 3 1 Segment reporting First Half 2022 – First Half 2021 Cash earnings of $132 million in First Half 2022 was $15 million, or 13% higher. Excluding notable items, First Half 2022 cash earnings were $246 million, $168 million or 41% lower than First Half 2021, mostly from the impact of businesses sold, lower life insurance revenue, a reduction in platforms income and a lower impairment benefit. Net interest income down $6m, 2% • Excluding the impact of businesses sold, net interest income increased $11 million, or 5%; • Excluding the impact of businesses sold, net loans decreased $1.5 billion, or 11%. The run-off of the remaining retail auto loan portfolio contributed $0.8 billion of the decline and lending in Westpac Pacific was also lower; • Deposits increased $1.7 billion, or 25%, mostly from the migration of funds to Panorama term deposits; and • Net interest margin was up 39 basis points mostly from lower funding costs in the Auto Finance portfolio. There were no notable items impacting net interest income in First Half 2022 or First Half 2021. Non-interest income down $115m, 17% • Excluding the impact of notable items and businesses sold, non-interest income decreased $159 million, or 27%; • Life insurance income was $148 million, or 75%, lower largely from yield curve movements on the Life Insurance policyholder liabilities and changes in reinsurance conditions on income protection products; • Superannuation, Platforms and Investments contribution decreased $31 million, or 9%, from margin compression due to repricing and the migration of customers from legacy platforms to Panorama. This was partly offset by an increase in funds under administration to $223 billion; and • Other income was up $20 million mostly from income associated with the transition service agreements related to businesses sold. Expenses down $156m, 21% • Excluding the impact of notable items and businesses sold, expenses decreased $17 million, or 4%. Most of the decrease related to lower investment spend as projects were completed and benefits from simplification initiatives. Impairment benefit of $38m compared to an impairment benefit of $79m • The impairment benefit mostly reflects lower collectively assessed provisions from improved credit quality metrics; and • The level of stressed exposures decreased 13 basis points to 6.98%, mostly reflecting decrease in Auto delinquencies down 45 basis points over the year. |
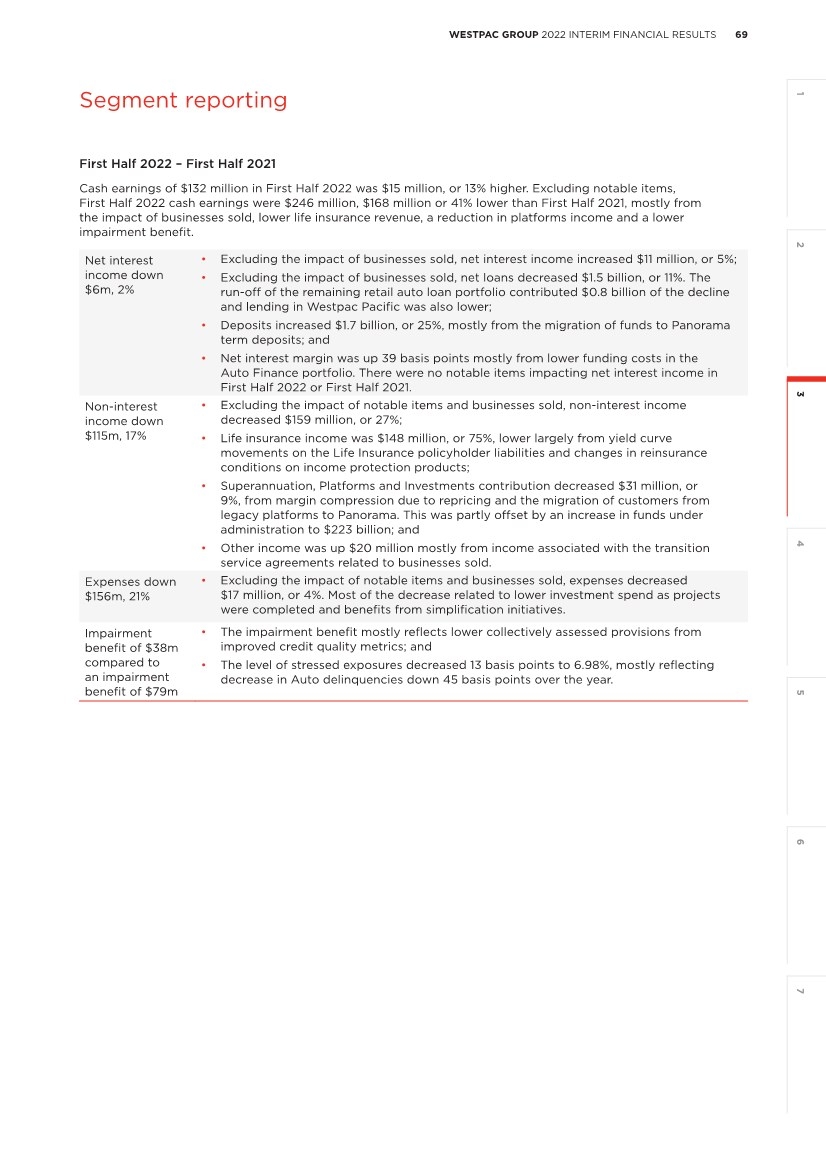
| 70 WESTPAC GROUP 2022 INTERIM FINANCIAL RESULTS Segment reporting Life insurance key metrics Half Year Half Year Half Year % Mov’t March Sept March Mar 22 Mar 22 2022 2021 2021 - Sept 21 - Mar 21 Life Insurance in-force premiums ($m) Balance as at beginning of period 951 943 953 1 - Sales / New Business 73 90 57 (19) 28 Lapses (64) (82) (67) (22) (4) Balance as at end of period1 960 951 943 1 2 Life insurance claims ratio (%)2 64 64 63 - 2 Superannuation, Platforms and Investments As at As at % Mov’t As at % Mov’t 31 March Net Net 30 Sept Mar 22 Mar 22 Mar 22 $bn 2022 Inflows Outflows Flows Mov’t1 2021 - Sept 21 2021 - Mar 21 Superannuation 41.8 1.9 (2.9) (1.0) (2.6) 45.4 (8) 42.3 (1) Platforms 135.2 8.9 (9.1) (0.2) 0.8 134.6 - 124.0 9 Packaged funds 45.9 6.4 (7.4) (1.0) (0.5) 47.4 (3) 45.4 1 Total funds 222.9 17.2 (19.4) (2.2) (2.3) 227.4 (2) 211.7 5 1. The life insurance in-force premium is comprised of: Retail as at 31 March 2022 of $960 million (as at 30 September 2021: $951 million, as at 31 March 2021: $938 million); and Group Life Insurance as at 31 March 2022 of $nil million (as at 30 September 2021: $nil million, as at 31 March 2021: $5 million). 2. Claims ratios are claims over earned premium plus reinsurance rebate. |
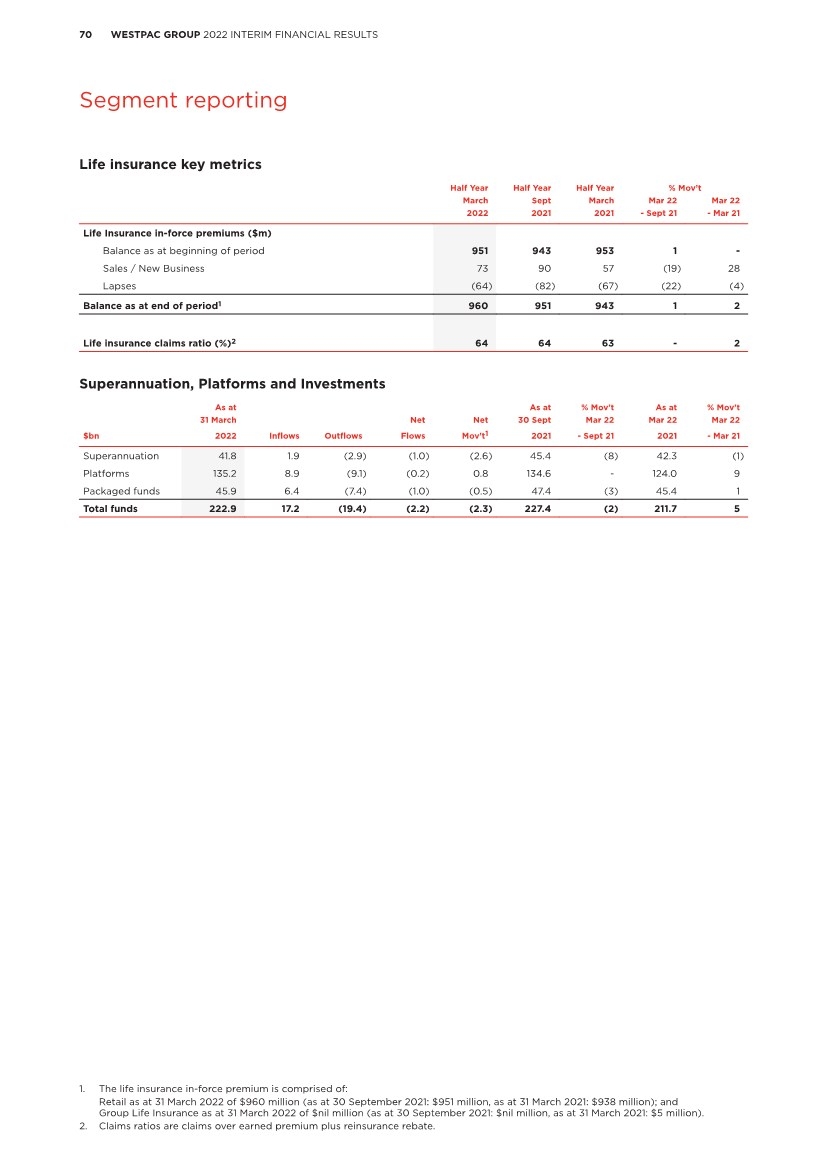
| 71 WESTPAC GROUP 2022 INTERIM FINANCIAL RESULTS 2 4 5 6 7 3 1 Segment reporting 3.5 Group Businesses This segment comprises: • Treasury which is responsible for the management of the Group’s balance sheet including wholesale funding, capital and management of liquidity. Treasury also manages interest rate risk and foreign exchange risks inherent in the balance sheet, including managing the mismatch between Group assets and liabilities. Treasury’s earnings are primarily sourced from managing the Group’s balance sheet and interest rate risk, (excluding Westpac New Zealand) within set risk limits. • Customer Services & Technology1, which includes operations, call centres and technology; and • Corporate Services2, which comprises common corporate functions such as property, procurement, finance services, corporate affairs, sustainability and HR services. • Group Businesses also includes enterprise services, earnings on capital not allocated to segments, certain intra-group transactions that facilitate presentation of performance, gains/losses from some asset sales, earnings and costs associated with the Group’s fintech investments, costs associated with customer remediation for the Advice business and certain other head office items such as centrally-held provisions. Half Year Half Year Half Year % Mov’t March Sept March Mar 22 Mar 22 $m 2022 2021 2021 - Sept 21 - Mar 21 Net interest income 564 377 458 50 23 Non-interest income 36 (15) 381 large (91) Net operating income 600 362 839 66 (28) Operating expenses (320) (428) (604) (25) (47) Core earnings 280 (66) 235 large 19 Impairment (charges)/benefits 3 (2) - large - Profit/(loss) before income tax expense 283 (68) 235 large 20 Income tax expense and NCI (108) (58) (120) 86 (10) Cash earnings 175 (126) 115 large 52 Add back notable items 16 100 (102) (84) large Cash earnings excluding notable items 191 (26) 13 large large Treasury Half Year Half Year Half Year % Mov’t March Sept March Mar 22 Mar 22 $m 2022 2021 2021 - Sept 21 - Mar 21 Net interest income 554 376 462 47 20 Non-interest income 12 - 8 - 50 Net operating income 566 376 470 51 20 Cash earnings 368 223 298 65 23 Treasury Value at Risk (VaR)3 $m Average High Low Half Year March 2022 64.4 72.8 54.6 Half Year Sept 2021 68.7 83.1 58.9 Half Year March 2021 197.8 232.0 70.5 1. Customer Services and Technology costs are fully allocated to other segments in the Group. 2. Corporate Services costs are partly allocated to other segments, while Group head office costs are retained in Group Businesses. 3. VaR includes trading book and banking book exposures. The banking book component includes interest rate risk, credit spread risk in liquid assets and other basis risks as used for internal management purposes. |
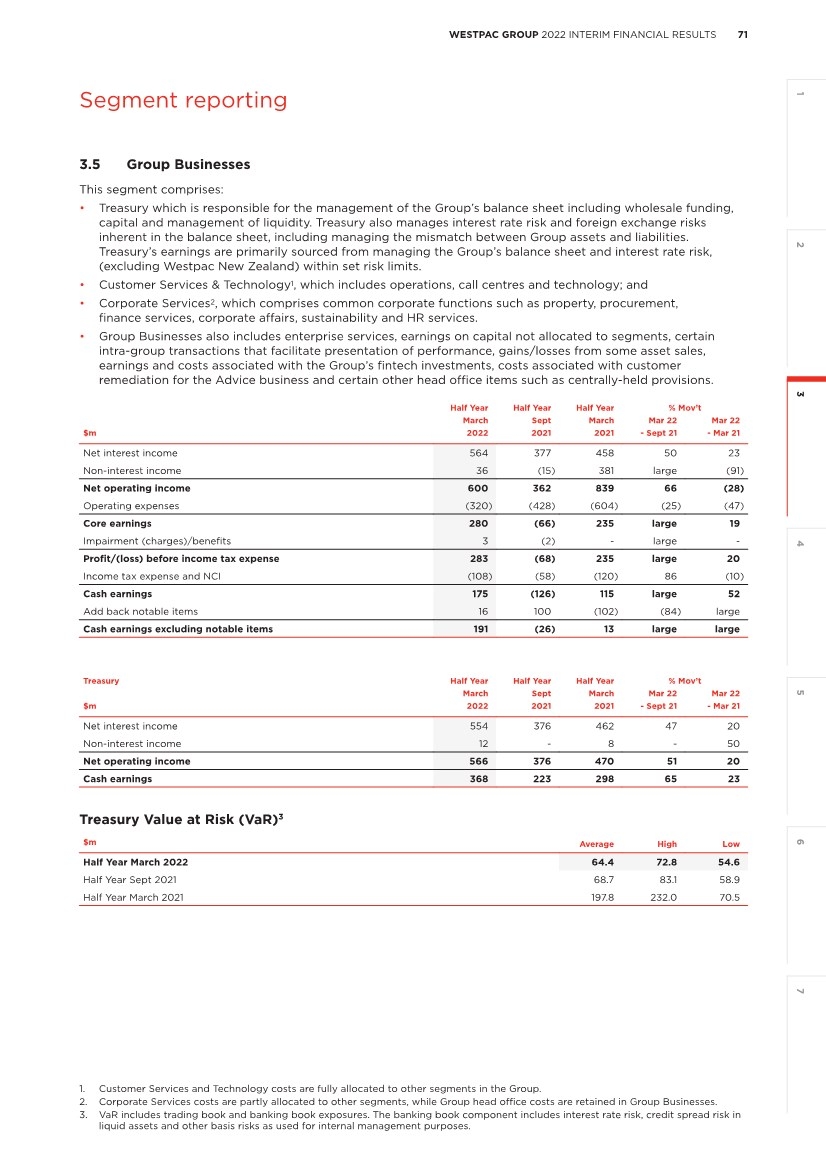
| 72 WESTPAC GROUP 2022 INTERIM FINANCIAL RESULTS Segment reporting Financial performance First Half 2022 - Second Half 2021 Cash earnings were a $175 million profit, compared with a loss of $126 million for Second Half 2021. Excluding notable items, cash earnings were a $191 million profit compared with a loss of $26 million for Second Half 2021. Net operating income up $238m, 66% • Income was higher mainly due to an improved contribution from Treasury mainly driven by managing risk well through a volatile period and gains on sale of liquid assets; and • There were no customer remediation provisions impacting net operating income in First Half 2022. Second Half 2021 included provisions for estimated customer refunds and payments ($38 million). Operating expenses down $108m, 25% • Expenses were lower mainly due to lower provisions for estimated customer refunds and payments ($16 million in First Half 2022, $78 million in Second Half 2021); and • A reduction in employee related provisions. First Half 2022 - First Half 2021 Cash earnings were $175 million, compared with $115 million in First Half 2021. Excluding notable items, cash earnings were a $191 million profit compared with $13 million for First Half 2021. Net operating income down $239m, 28% • Income was lower mainly due to revaluation gains on our investment in Coinbase Inc. in First Half 2021 ($546 million); and • First Half 2021 included provisions for estimated customer refunds and payments ($193 million); and • Higher Treasury income driven by managing risk well through a volatile period and gains on sale of liquid assets. Operating expenses down $284m, 47% • Expenses were lower mainly due to a performance fee related to gains on our investment in Coinbase Inc. in First Half 2021 ($122 million); • Lower provisions for estimated customer refunds and payments ($16 million in First Half 2022, $98 million in First Half 2021); and • Lower CORE program expenses due to a reallocation of centrally held expenses to the operating segments; partly offset by • Higher costs from our investment in the Banking as a Service platform. |
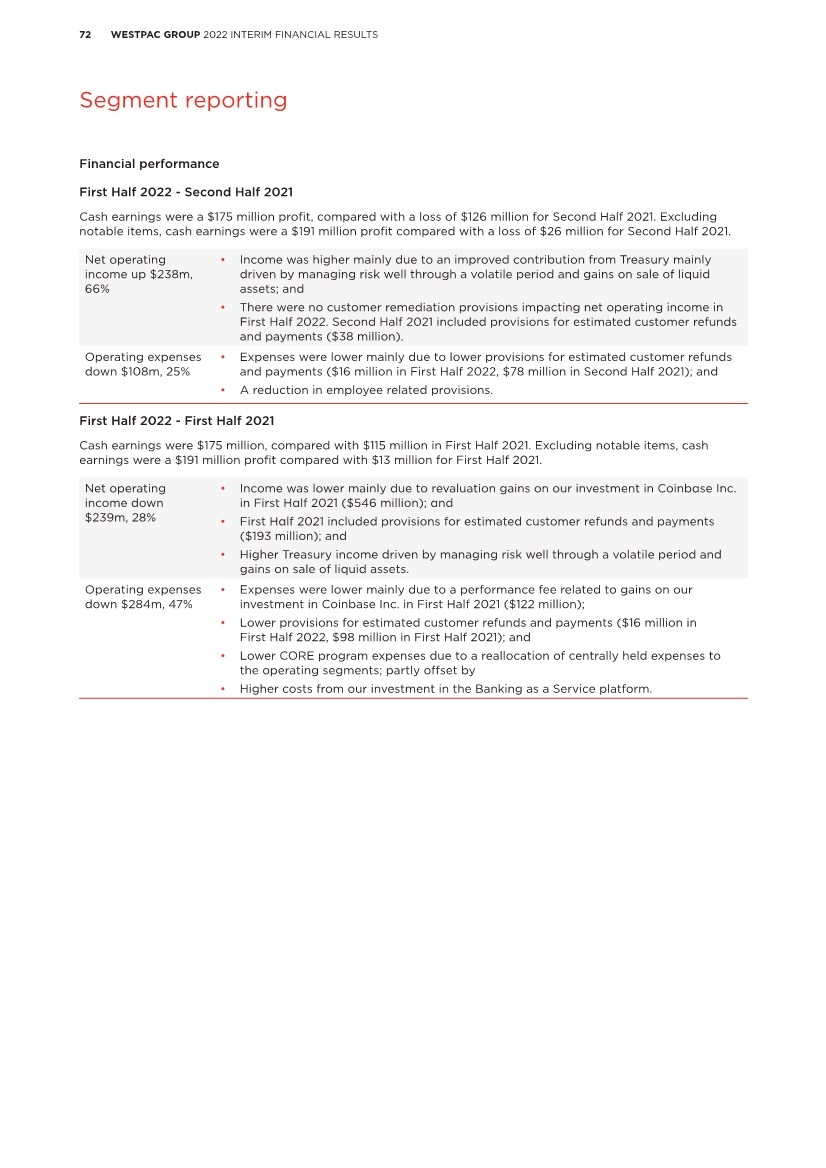
| 73 WESTPAC GROUP 2022 INTERIM FINANCIAL REPORT 4 2 3 1 5 6 7 Table of contents 4.0 2022 Interim financial report 4.1 Directors’ report 74 4.2 Consolidated income statement 97 4.3 Consolidated statement of comprehensive income 98 4.4 Consolidated balance sheet 99 4.5 Consolidated statement of changes in equity 100 4.6 Consolidated cash flow statement 101 4.7 Notes to the consolidated financial statements 102 Note 1 Financial statements preparation 102 Note 2 Segment reporting 103 Note 3 Net interest income 106 Note 4 Non-interest income 107 Note 5 Operating expenses 108 Note 6 Income tax 109 Note 7 Earnings per share 109 Note 8 Average balance sheet and interest rates 110 Note 9 Loans 111 Note 10 Provision for expected credit losses 111 Note 11 Credit quality 115 Note 12 Deposits and other borrowings 117 Note 13 Fair values of financial assets and financial liabilities 118 Note 14 Provisions, contingent liabilities, contingent assets and credit commitments 123 Note 15 Shareholders’ equity 128 Note 16 Notes to the consolidated cash flow statement 130 Note 17 Assets and liabilities held for sale 132 Note 18 Subsequent events 133 4.8 Statutory statements 134 Table of contents |
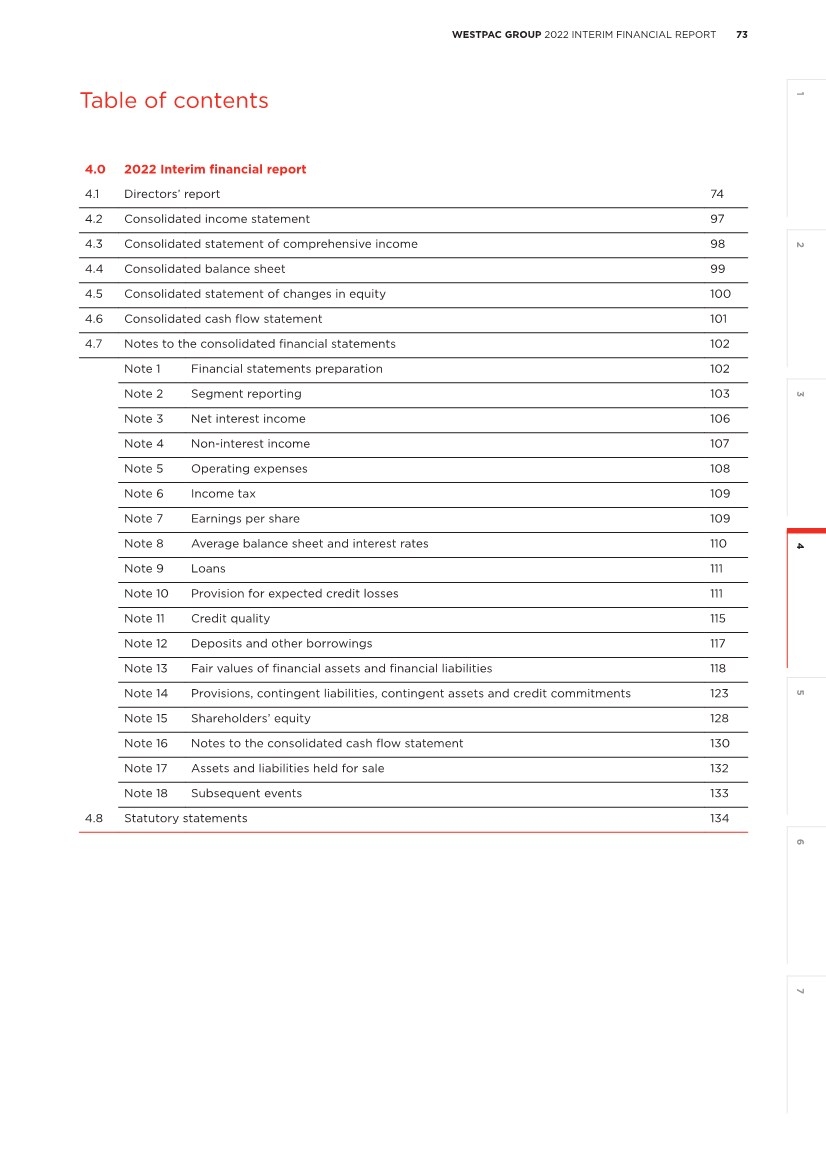
| 74 WESTPAC GROUP 2022 INTERIM FINANCIAL REPORT Directors’ report 4.0 2022 Interim financial report 4.1 Directors’ report The Directors of Westpac present their report together with the financial statements of Westpac and its controlled entities (collectively referred to as ‘the Group’) for the half year ended 31 March 2022. Directors The names of the Directors of Westpac holding office at any time during, and since the end of, the half year and the period for which each has served as a Director are set out below: Name Position John McFarlane Director since February 2020 and Chairman since April 2020. Peter King Managing Director and Chief Executive Officer since December 2019. Nerida Caesar Director since September 2017. Audette Exel AO Director since September 2021. Michael Hawker AM Director since December 2020. Christopher Lynch Director since September 2020. Peter Marriott Director since June 2013. Peter Nash Director since March 2018. Nora Scheinkestel Director since March 2021. Margaret Seale Director since March 2019. Craig Dunn Retired 15 December 2021. Director since June 2015. Steven Harker Retired 26 October 2021. Director since March 2019. Review and results of the Group’s operations Net Profit attributable to owners of Westpac for First Half 2022 was $3,280 million, $163 million or 5% lower than First Half 2021. Compared to Second Half 2021, net profit was $1,265 million, or 63% higher. The $163 million decline in Net Profit compared to First Half 2021 was mostly due to a $511 million ($358 million after tax) turnaround in impairment charges (a charge in First Half 2022 compared to a benefit in First Half 2021). Profit before impairment charges and income tax expense was 4% higher over First Half 2021 from a 10% reduction in expenses partly offset by 4% lower operating revenue. This result was supported by lower specific large infrequent items (notable items) which were $276 million lower after tax. These items include: • Provisions for estimated customer refunds, payments, associated costs and litigation; • The write-down of intangible items, including goodwill; and • The impact of asset sales and revaluations. The following is a summary of the movements in the major line items in Net Profit for First Half 2022 compared to First Half 2021. Net interest income was $60 million lower, with a 7% increase in average interest earning assets more than offset by a 15 basis point (bps) reduction in net interest margin. The decline in net interest margin was due to: • Lower spreads on mortgages and business lending, and a shift in our portfolio towards lower spread products (particularly Australian fixed rate lending); and • A significant increase in liquid assets to meet the wind-down in the committed liquidity facility. Liquid assets have lower yields than the portfolio average; partly offset by • Higher deposit spreads from repricing and changes in mix; and • Unrealised gains on fair value economic hedges in First Half 2022 compared to a loss in First Half 2021. Non-interest income1 was $396 million lower compared to First Half 2021, with the movements due to: • Lower gains from asset sales and revaluations of $300 million; • Lower contribution from the Life insurance business of $194 million, which was impacted by unfavourable valuations and investment losses; and • Businesses sold saw a reduction in revenue of $63 million; partly offset by • Lower costs of customer remediation of $156 million. Directors’ report 1. Non-interest income is comprised of net fee income, net wealth management and insurance income, trading income, and other income. |
| 75 WESTPAC GROUP 2022 INTERIM FINANCIAL REPORT 4 2 3 1 5 6 7 Directors’ report Operating expenses were $624 million, or 10% lower compared to First Half 2021. Movements in the decline included: • Lower costs associated with the sale of businesses of $222 million; • A reduction in depreciation and amortisation of assets of $212 million; • Lower provisions for remediation of $210 million; • Lower asset write-downs of $82 million; • Progress on our simplification program contributing to lower technology and professional services costs; these were partly offset by • Higher staff expenses including salary and superannuation increases and restructuring costs. Impairment charges were $511 million higher with a charge of $139 million in First Half 2022 compared to an impairment benefit of $372 million in First Half 2021. Most credit quality metrics improved compared to First Half 2021. The rise in the impairment charge in First Half 2022 compared to First Half 2021 reflected a lower reduction in collectively assessed provisions. In part this reflected an increase in overlays in First Half 2022 in response to uncertainties and risks from the current environment including the global geopolitical situation, supply chain disruptions, inflationary pressure, expected increases in interest rates, and the recent severe floods and storms across Australia. The effective tax rate was 30.4% and close to Australia’s corporate tax rate of 30%. This was lower than the 31.9% effective tax rate in First Half 2021 due to higher non-deductible items in First Half 2021. The Board has determined an interim dividend of 61 cents per share, which will be fully franked. A review of the operations and results of the Group and its segments for the half year ended 31 March 2022 is set out in Section 2 and Section 3 (see pages 9 to 72) of this interim results announcement and in ‘Risk factors’, which forms part of the Directors’ Report. Further information about our financial position and financial results is included in the financial statements and accompanying notes, which form part of the 2022 Interim Financial Report. Significant developments COVID-19 impacts The continued social and economic effects of COVID-19 over this half year have been shaped by the emergence and spread of new variants, the continued rollout of vaccines, including booster vaccinations, and the evolving approaches of governments to social and travel restrictions. Westpac has continued to assist customers affected by the ongoing economic impacts of the COVID-19 pandemic. Further information on the impacts of COVID-19 are set out in Section 2 ‘Review of Group operations’, ‘Risk factors’ in the Directors’ report and Note 10 to the financial statements in this Results Announcement. Westpac significant developments – Australia Off-market buy-back Westpac completed a $3.5 billion off-market share buy-back on 14 February 2022, with approximately 167.5 million Westpac shares, equating to approximately 4.6% of the shares on issue at that time, being bought back at the buy-back price of $20.90 per Westpac share. The buy-back led to a 79-basis point reduction in Westpac’s CET1 ratio, based on the 31 December 2021 capital position. Changes to structure and executive team On 3 February 2022, Westpac announced changes to the Group’s structure and executive team as part of initiatives to simplify the Group’s operations and improve accountability. The restructure involved moving certain services to the lines of business they support, the creation of two shared services segments to achieve benefits of scale across common processes, and a leaner Group head office responsible for setting strategy, policies and frameworks for the Group. Westpac also confirmed the restructure of its management team, including combination of the roles of Chief Risk Officer and Group Executive, Financial Crime, Compliance and Conduct, with Ryan Zanin commencing as Group Chief Risk Officer on 29 April 2022. In addition, on 16 March 2022, Westpac announced the appointment of Yianna Papanikolaou as the Chief Transformation Officer, reporting to the CEO. The role will have responsibility for major change and investment programs and accountability for the Customer Outcomes and Risk Excellence (CORE) program. Directors’ report |
| 76 WESTPAC GROUP 2022 INTERIM FINANCIAL REPORT Directors’ report Exit of businesses within the specialist businesses segment Following a review of the specialist businesses segment in 2020, Westpac determined it would look to exit businesses in this segment over time. Since then, a number of these businesses have been sold, and work continues on preparing the remaining businesses for exit. The following transactions have completed this half year: • Sale of Westpac’s motor vehicle dealer finance and novated leasing business; and • Sale of Westpac Life-NZ- Limited to Fidelity Life Assurance Company Limited. Westpac’s announced sale of Westpac Life Insurance Services Limited to TAL Dai-ichi Life Australia Pty Limited is anticipated to complete this year. Further detail in relation to these transactions is available in Note 17 to the financial statements in this Results Announcement. Approvals may be required from regulators or other stakeholders in order to divest businesses and assets, and there is a risk that these approvals may not be received or that the purchaser does not complete these transactions for other reasons. In addition, some of these transactions have involved the giving of warranties and indemnities in favour of the buyer for certain pre-completion matters and risks. Further information is set out in ‘Risk factors’ in the Directors’ report and Note 14 to the financial statements in this Results Announcement. First strike against the remuneration report At Westpac’s Annual General Meeting (AGM) on 15 December 2021, Westpac incurred a first strike against its remuneration report. A strike occurs where 25% or more of votes are cast against a company’s remuneration report. If Westpac receives a second strike at its 2022 AGM, a ‘spill resolution’ will be put to shareholders at that AGM. If 50% or more of votes cast are in favour of that spill resolution, a general meeting (a ‘spill meeting’) is required to be held within 90 days. At the spill meeting, certain directors will need to seek re-election to remain as directors. Regulatory and risk developments Enforceable undertaking on risk governance remediation, Integrated Plan and CORE program On 3 December 2020, following APRA’s risk governance review, Westpac confirmed it had entered into an enforceable undertaking (EU) with APRA in relation to Westpac’s risk governance remediation which, among other things, required it to develop an Integrated Plan outlining all major risk governance remediation activities in relation to both financial and non-financial risk and provide independent assurance over the implementation of the Integrated Plan. Westpac’s CORE program is delivering the Integrated Plan and supporting the strengthening of Westpac’s risk governance, accountability, and culture. Execution of the CORE program is ongoing and over half of the activities in the Integrated Plan have been completed and submitted for independent assurance. Promontory Australia was appointed as the Independent Reviewer to provide regular updates to APRA on Westpac’s compliance with the EU and the Integrated Plan. Promontory Australia has provided four reports to APRA so far, with its next report due in May 2022. These reports are provided quarterly and published on our website every six months at https://www.westpac.com.au/about-westpac/media/core/. Risk management Westpac is continuing to strengthen its end-to-end management of risk. A range of shortcomings and areas for improvement in Westpac’s risk governance have been highlighted in reviews, including embedding of its risk management framework, policies and systems, regulatory reporting, data quality and management, product governance, prudential compliance plans and associated control frameworks and its risk capabilities. The Group has a number of risks currently considered outside of risk appetite or that do not meet the expectations of regulators. The CORE program, discussed above, is designed to deliver improvements in many of these areas, including embedding a more proactive risk culture, embedding clear risk management accountabilities, improving the control environment, and uplifting risk awareness, capability and capacity for ongoing risk management. Other areas of improvement such as operational risk, compliance, financial crime, stress testing, modelling, regulatory reporting and data quality and management are being addressed through investment in risk management expertise. Further information about risk management is set out in the ‘Risk management’ section in our 2021 Annual Report. |
| 77 WESTPAC GROUP 2022 INTERIM FINANCIAL REPORT 4 2 3 1 5 6 7 Directors’ report APRA action against Westpac for breaches of liquidity requirements On 1 December 2020, APRA announced it was taking action for breaches by Westpac of APRA’s prudential standards on liquidity. A program of work is underway to address APRA’s requirements, including APRA mandated reviews and remediation of shortcomings identified as part of these reviews. From 1 January 2021, APRA has required the Group to increase the value of its net cash outflows by 10% for the purpose of calculating the liquidity coverage ratio (LCR). This overlay will be in place until we meet APRA’s requirements, and reduced the average LCR for the quarter ended 31 March 2022 by 14 percentage points. APRA phasing out reliance on Committed Liquidity Facility On 10 September 2021, APRA announced it expects authorised deposit-taking institutions (ADIs) to reduce their Committed Liquidity Facility (CLF) usage to zero in stages and no ADI should rely on the CLF to meet its minimum 100% LCR requirement from the beginning of 2022. Westpac has complied with APRA’s announcement to date. In line with APRA’s expectations, Westpac expects to reduce its CLF allocation to zero by 1 January 2023. To replace the reduction in the CLF, we have increased our holdings of High Quality Liquid Assets. This is also expected to increase the capital required for Interest Rate Risk in the Banking Book to be held by the Group. As at 31 March 2022, Westpac’s CLF allocation was $27.75 billion, and this was subsequently reduced to $18.5 billion on 1 May 2022. Financial crime Westpac continues to make progress on improving its financial crime risk management program, as it implements a significant multi-year program of work (including AML/CTF, Sanctions, Anti-Bribery and Corruption, Foreign Account Tax Compliance Act (FATCA) and Common Reporting Standards (CRS)). Through this work, Westpac continues to undertake activities to remediate and improve its financial crime controls in multiple areas including initial, enhanced and ongoing customer due diligence and associated record keeping, upgrading customer and payment screening and transaction monitoring solutions, improving Electronic Funds Transfer Instruction processes, establishing data reconciliations and checks to ensure the completeness of data feeding into its financial crime systems, and improving regulatory reporting including in relation to International Funds Transfer Instructions, Threshold Transaction Reports, Suspicious Matter Reports (including ‘tipping off’ controls), and FATCA and CRS reporting. With increased focus on financial crime, further issues requiring attention have been and may be identified, and Westpac has continued to liaise with AUSTRAC as appropriate. Details about the consequences of failing to comply with financial crime obligations are set out in ‘Risk Factors’ in the Directors’ report. Life insurance premium review On 12 October 2021, Westpac announced the Group was reviewing premium increases on certain life insurance products issued by Westpac Life Insurance Services Limited (WLIS). The review relates to life insurance products sold under Product Disclosure Statements, in particular those issued in the years 2010 to 2017. During this half year, Westpac raised a provision of $48 million to refund to customers certain premium increases made in 2016 and 2017, and is continuing its review of other premium increases. As such, the amount provisioned may change. See Note 14 to the financial statements in this Results Announcement for further information. APRA capital requirements APRA announcements affecting capital As part of its response to COVID-19, APRA made the following announcements on capital: • On 15 December 2020, APRA issued revised capital management guidance to all ADIs and insurers that from 1 January 2021, APRA will no longer hold ADIs to a minimum level of earnings retention (previously 50% of net profit after tax in 2020). However, APRA has stated it expects banks to moderate dividend payout ratios, consider the use of dividend reinvestment plans and/or other capital management initiatives to offset the impact from dividends and conduct regular stress testing; • Deferral of APRA’s implementation of the Basel III capital reforms by a year to January 2023; and • Deferral of changes to APS 222 Associations with Related Entities by a year to 1 January 2022. APRA’s final revised standards for capital indicated that the total CET1 requirement for D-SIBs will be 10.25% from 1 January 2023. This requirement includes a capital conservation buffer of 3.75%, and a base level for the countercyclical capital buffer of 1.0%. APRA also indicated that it expects D-SIBs (including Westpac) will likely operate with CET1 above 11% under the new framework. Board approved CET1 capital operating range On 9 May 2022, Westpac announced that it will seek to operate with a CET1 ratio of between 11.0% and 11.5% effective from 1 January 2023. |
| 78 WESTPAC GROUP 2022 INTERIM FINANCIAL REPORT Directors’ report Operational risk capital overlays The following additional capital overlays are currently applied by APRA to Westpac’s operational risk capital requirement: • $500 million in response to Westpac’s Culture, Governance and Accountability self-assessment. The overlay has applied from 30 September 2019. • $500 million in response to the magnitude and nature of issues that were the subject of the AUSTRAC proceedings. The overlay has applied from 31 December 2019. Both overlays have been applied through an increase in RWA. The impact on Westpac’s Level 2 common equity Tier 1 (CET1) capital ratio at 31 March 2022 was a reduction of 32 basis points. APRA’s revisions to subsidiary capital investment treatment On 5 August 2021, APRA released the final revised standard for APS 111 Capital Adequacy: Measurement of Capital which came into effect on 1 January 2022. The final standard includes changes to the parent ADI’s (Level 1) treatment of equity investments in banking and insurance subsidiaries including: • equity investments in subsidiaries (including any Additional Tier 1 and Tier 2 capital investments in subsidiaries) will be risk weighted at 250%, up to a limit of 10% of Level 1 CET1 capital per investment; and • any equity investments in excess of the 10% limit will be fully deducted from Level 1 CET1 capital in determining Level 1 capital ratios. Westpac’s Level 1 CET1 capital ratio was 11.23% at 31 March 2022. The Level 1 CET1 ratio was reduced by 18bps from 30 September 2021 as a result of implementation of the final revised standards for APS 111 Capital Adequacy Measurement of Capital and APS 222 Associations with Related Entities from 1 January 2022. Additional loss absorbing capacity On 2 December 2021, APRA announced a requirement for D-SIBs (including Westpac) to increase their total capital requirements by 4.5 percentage points of RWA under the current capital adequacy framework to be met by 1 January 2026. This is a 1.5 percentage point increase on the prior announcement on 9 July 2019. The additional total capital is expected to be met through additional Tier 2 Capital. In Westpac’s funding, this increase in total capital is likely to be offset by a decrease in long-term wholesale funding. Financial Contingency and Resolution Planning On 2 December 2021, APRA released two draft prudential standards for consultation. CPS 190 Financial Contingency Planning will require banks (including Westpac) to develop plans for responding to financial stress and CPS 900 Resolution Planning will require some banks (including Westpac) to prepare for resolution with limited adverse impacts on the community and financial system, in the event of their failure. Both standards are proposed to come into effect from 1 January 2024. Westpac significant developments – New Zealand Reviews required under section 95 of the Reserve Bank of New Zealand Act 1989 On 23 March 2021, the RBNZ issued two notices to Westpac New Zealand Limited (WNZL) under section 95 of the Reserve Bank of New Zealand Act 1989 (NZ) requiring WNZL to supply two external reviews to the RBNZ (the Risk Governance Review and the Liquidity Review). These reviews only apply to WNZL and not to Westpac in Australia or its New Zealand branch. The Risk Governance Review related to the effectiveness of WNZL’s risk governance, with a focus on the role played by the WNZL Board. This review was undertaken by Oliver Wyman Limited (Oliver Wyman) and completed in November 2021. The review identified deficiencies in WNZL’s risk governance practices and operations which impacted the WNZL Board’s effectiveness in governing risk. These deficiencies are likely to have contributed to issues of non-compliance with some of WNZL’s conditions of registration, and technology resiliency issues. WNZL has a programme of work underway to address the issues raised, which is being overseen by the WNZL Board. WNZL has engaged Oliver Wyman to provide independent assurance that WNZL’s remediation has been delivered to an appropriate standard. The Liquidity Review relates to the effectiveness of WNZL’s actions to improve liquidity risk management and the associated risk culture. This follows previously identified breaches of the RBNZ’s Liquidity Policy (BS13) and non- compliances with condition of registration 14 identified through the RBNZ’s liquidity thematic review (which the RBNZ subsequently concluded constituted non-compliance with condition of registration 14 in a material respect, when considered collectively). Deloitte Touche Tohmatsu’s final report is due to the RBNZ by 13 May 2022. From 31 March 2021, the RBNZ amended WNZL’s conditions of registration, requiring WNZL to discount the value of its liquid assets by approximately 14% which at 31 March 2022 was NZ$3.1 billion. This overlay will apply until the RBNZ is satisfied that: • the RBNZ’s concerns regarding liquidity risk controls have been resolved; and • sufficient progress has been made to address risk culture issues in WNZL’s Treasury and Market and Liquidity Risk functions. |
| 79 WESTPAC GROUP 2022 INTERIM FINANCIAL REPORT 4 2 3 1 5 6 7 Directors’ report Separate to the section 95 reviews outlined above, WNZL has also committed to the RBNZ and Financial Markets Authority (FMA) to address its technology issues, and to engage Deloitte to monitor progress. While work has been underway to address these areas for some time, more work is required to meet WNZL’s expectations and those of the regulator. RBNZ review of overseas bank branches On 20 October 2021, the RBNZ announced it is reviewing its policy for branches of overseas banks (including Westpac Banking Corporation’s New Zealand branch), with a view to creating a simple, coherent and transparent policy framework for branches of overseas banks. The period for responding to the first consultation paper, which sought feedback on high level policy questions and the options for addressing the risks that branches present to the New Zealand financial system, has closed. A second consultation paper, setting out the RBNZ’s proposed approach for the regulation of branches of overseas banks is expected in the first half of calendar year 2022. General regulatory changes affecting our businesses Enhanced breach reporting regime From 1 October 2021, Westpac commenced operating under the enhanced ASIC breach reporting regime that applies to Australian financial services licensees and credit licensees. This regime seeks to increase transparency and better standardise breach reporting by introducing mandatory breach reporting for credit licensees and significantly changing the requirements for financial services licensees, including to: • deem a large number of regulatory provisions to be automatically reportable if breached, or potentially breached, notwithstanding the nature or impact of the breach; • create an obligation to report an investigation into whether a matter is a reportable breach (where the investigation continues for more than 30 days); and • require licensees to lodge reports in a required form and within 30 days. The expanded reporting regime has led to a significant increase in the Group’s breach reporting to ASIC, with ASIC expected to publish industry-wide data about breach reporting by the end of 2022. Reforms to critical infrastructure laws and cyber resilience As part of its Cyber Security Strategy 2020, the Security of Critical Infrastructure Act 2018 (Cth) has been amended to strengthen the security and resilience of critical infrastructure. This includes critical infrastructure assets used to provide secure banking and financial services. As a result of these amendments, Westpac will be subject to new obligations relating to the security of its critical infrastructure assets, including new reporting and incident notification requirements. The Act also gives the Government broad powers, including powers to issue directions and intervention requests to Westpac (and other operators of critical infrastructure assets) in response to a cyber security incident. In addition, APRA, ASIC, and the Australian Government have continued their focus on cyber resilience, given the increasing number of cyber-related incidents. APRA is seeking to ensure that regulated entities improve their cyber resilience practices and has been focusing on the effective implementation of Prudential Standard CPS 234 Information Security. Westpac continues to enhance its systems and processes to mitigate cybersecurity risks, including in relation to third parties. APRA prudential standard CPS 511: Remuneration On 27 August 2021, APRA released its final revised Prudential Standard CPS 511 Remuneration. The new standard has an effective date of 1 January 2023 for significant financial institutions that are authorised deposit-taking institutions (which includes Westpac). The objective of the Standard is to ensure that APRA-regulated entities maintain remuneration arrangements which appropriately incentivise individuals to prudently manage the risks they are responsible for, and that there are appropriate consequences for poor risk outcomes. Westpac is reviewing its remuneration arrangements in line with the new requirements. Proposed changes to lending laws and regulatory requirements In October 2021 APRA released a letter to ADIs regarding strengthening residential mortgage lending assessments and increased the minimum interest rate buffer that it expects ADI’s to use when assessing home loan serviceability, to at least 3 percentage points above the loan product rate. The letter also outlines APRA’s intention to keep the level of the buffer under review and to review risk appetites for lending at high debt-to-income ratios. In November 2021, APRA released an Information Paper outlining its framework for macroprudential policy. In conjunction with the information paper, APRA commenced a consultation into an update to APS 220 Credit Risk Management that would require banks to ensure they could implement limits on higher risk residential mortgages and commercial property lending in a timely and effective manner. With the consultation period now over, APRA has stated that it expects to finalise its response to the consultation in the first half of calendar year 2022, with the update to take effect shortly after. On 25 September 2020, the government announced a proposed simplification of Australia’s consumer credit regulatory regime. The proposed legislation did not pass, and the Bill has now lapsed following the calling of the Federal election to be held on 21 May 2022. |
| 80 WESTPAC GROUP 2022 INTERIM FINANCIAL REPORT Directors’ report Focus on superannuation Two BT MySuper products (AESA MySuper and BT Super MySuper) failed the annual MySuper performance test for the year ended 30 June 2021 and the BT trustee has notified relevant members of this outcome. The 2021 annual performance assessment was based on a combined seven-year performance of the products and from this year onwards the test applies to a historical performance period of eight years. In late 2021, the AESA MySuper product closed, and members were transferred to the BT Super MySuper product. If the BT Super MySuper product fails the next annual performance test, which may occur, the BT trustee cannot accept new BT Super MySuper members until it passes a subsequent annual performance test and APRA permits reopening of the product to new members. Consistent with its obligations and APRA’s expectations, the BT trustee is assessing the potential implications of these circumstances and exploring options to ensure the financial interests of members continue to be promoted. This includes investigating whether a potential transfer of MySuper and personal super members (non-platform) and their assets to an external superannuation fund, as permitted by the Superannuation legislation, is in members’ best financial interests. This is well advanced, and through a competitive process the BT Trustee is expected to reach a decision on a preferred receiving fund and sign a Heads of Agreement by the end of the financial year. If this process does not result in a transfer to another fund, APRA could further review the annual performance assessment outcomes of the BT Super MySuper product. ASIC and APRA are continuing their supervisory focus on superannuation providers, including BT, with an emphasis on member outcomes. BT’s superannuation trustee is continuing with a program of work on enhancement of member outcomes and accelerating its remediation programs. With increased regulatory focus on superannuation, including a number of inquiries and investigations into BT’s superannuation business, further issues requiring attention may be identified. Litigation and regulatory proceedings Our entities are parties from time to time in legal proceedings arising from the conduct of our business. Material legal proceedings are described below and in Note 14 to the financial statements in this Results Announcement. Fraud Westpac’s proceedings against Forum Finance Pty Ltd On 28 June 2021, Westpac commenced proceedings in the Federal Court of Australia against Forum Finance Pty Ltd (Forum Finance). This followed the discovery of a significant fraud relating to a portfolio of equipment leases with Westpac customers, arranged by Forum Finance. Westpac obtained asset freezing and search orders to seek to preserve available assets and relevant information. It continues to support external administrators appointed to companies associated with the directors of Forum Finance, and to pursue its legal rights to preserve fraudulently obtained funds, with a view to making some recovery. Westpac also continues to assist New South Wales Police. Completed matters During the half year, a number of litigation matters have been finalised, including: ASIC’s consumer credit insurance proceedings On 7 April 2021, ASIC commenced proceedings in the Federal Court against Westpac in relation to the sale of consumer credit insurance (CCI) products to certain customers who ASIC alleged had not requested this product. Westpac ceased selling CCI products in 2019. On 7 April 2022, the Federal Court made orders, as agreed between Westpac and ASIC, and ordered Westpac to pay a $1.5 million penalty. Regulatory matters agreed between Westpac and ASIC On 30 November 2021, Westpac announced that it had reached agreement with ASIC to resolve six separate longstanding matters through agreed civil penalty proceedings in the Federal Court. These matters follow regulatory investigations conducted by ASIC, many instigated by self-reporting of issues by Westpac. Westpac and ASIC agreed proposed penalties for each of the proceedings, totalling $113 million, plus agreed costs. The agreed civil penalties proposed by Westpac and ASIC for these matters have now been ordered by the Court, and are provisioned for in Note 14 to the financial statements in this Results Announcement. Regulatory proceedings ASIC’s civil proceedings relating to interest rate hedging activity On 5 May 2021, ASIC filed civil proceedings against Westpac alleging that it had engaged in insider trading and unconscionable conduct and failed to comply with its Australian Financial Services Licence obligations. The allegations relate to interest rate hedging activity during Westpac’s involvement in the 2016 Ausgrid privatisation transaction. Westpac has filed its Response to ASIC’s Concise Statement. A hearing date for this matter has been set down for 18 March 2024. |
| 81 WESTPAC GROUP 2022 INTERIM FINANCIAL REPORT 4 2 3 1 5 6 7 Directors’ report Class actions Class action relating to cash in superannuation On 5 September 2019, a class action against BT Funds Management Limited (BTFM) and WLIS was commenced in the Federal Court of Australia in relation to aspects of BTFM’s BT Super for Life cash investment option. A number of similar class actions have been filed against other industry participants. It is alleged that BTFM failed to adhere to a number of obligations under the general law, the relevant trust deed and the Superannuation Industry (Supervision) Act 1993 (Cth), and that WLIS was knowingly concerned with BTFM’s alleged contraventions. BTFM and WLIS are defending the proceedings. Class action relating to consumer credit insurance On 28 February 2020, a class action was commenced against Westpac Banking Corporation, Westpac General Insurance Limited and WLIS in the Federal Court of Australia in relation to Westpac’s sale of CCI products to customers. A number of similar class actions have been filed against other industry participants. It is alleged the three entities failed to adhere to a number of obligations in selling CCI in conjunction with credit cards, personal loans and flexi loans. The damages sought by the claim are unspecified. The three entities are defending the proceedings. The matter has been set down for an initial trial commencing in November 2022. Class action relating to payment of flex commissions to auto dealers On 16 July 2020, a class action was commenced against Westpac Banking Corporation and St.George Finance Limited (SGF) in the Supreme Court of Victoria in relation to flex commissions paid to auto dealers from 1 March 2013 to 31 October 2018. This proceeding is one of two class actions commenced against a number of lenders in the auto finance industry. It is alleged Westpac and SGF are liable for the unfair conduct of dealers acting as credit representatives and engaged in misleading or deceptive conduct. The damages sought are unspecified. Westpac and SGF are defending the proceedings. Westpac has not paid flex commissions since 1 November 2018 following an industry-wide ban issued by ASIC. Australian AUSTRAC related class action Westpac is defending a class action proceeding which was commenced in December 2019 in the Federal Court of Australia on behalf of certain investors who acquired an interest in Westpac securities between 16 December 2013 and 19 November 2019. The proceeding involves allegations relating to market disclosure issues connected to Westpac’s monitoring of financial crime over the relevant period, and matters which were the subject of the AUSTRAC civil proceedings. The damages sought are unspecified. However, given the time period in question and the nature of the claims, it is likely any alleged damages will be significant. Potential class actions Westpac is aware from media reports and other publicly available material that at least one other class action (and possibly more) against Westpac entities is being investigated. For example, in July 2020, a law firm publicly stated that it intends to commence a class action against BTFM alleging that since 2014, BTFM did not act in the best interests of members of certain superannuation funds when obtaining group insurance policies. Westpac has not been served with a claim in relation to this matter and has no information about the scope of the proposed claim beyond the public statements issued by the law firm involved. Risk factors Our business is subject to risks that can adversely impact our financial performance, financial condition and future performance. If any of the following risks occur, our business, prospects, reputation, financial performance or financial condition could be materially adversely affected, with the result that the trading price of our securities could decline and as a security holder you could lose all, or part, of your investment. You should carefully consider the risks described and the other information in this Results Announcement and in our 2021 Annual Report before investing in, or continuing to own our securities. The risks and uncertainties described below are not the only ones we face. Additional risks and uncertainties that we are unaware of, or that we currently deem to be immaterial, may also become important factors that affect us. Risks relating to our business We have suffered, and could in the future suffer, information security risks, including cyberattacks The Group (and its external service providers) is subject to information security risks. These risks are heightened by: new technologies and increased digital service options; increased use of the internet and telecommunications to conduct financial transactions; the growing sophistication of attackers, and the global increase in cyber- crime; the COVID-19 pandemic, which has resulted in many Westpac employees (and staff of service providers) and customers working remotely or from other sites; ongoing geo-political tensions associated with the Russia/ Ukraine conflict; and other external events such as biological hazards, climate change, natural disasters or acts of terrorism, which could interrupt the usual operations of the Group, its customers, suppliers, and counterparties, potentially providing increased opportunities for cyber threat actors to exploit. |
| 82 WESTPAC GROUP 2022 INTERIM FINANCIAL REPORT Directors’ report These risks could result in information security risks such as cyberattacks, espionage and/or errors happening at an unprecedented pace, scale and reach. Cyberattacks have the potential to cause financial system instability and could result in serious disruption to customer banking services, or compromise data privacy of customers, shareholders, employees and others. While Westpac has systems in place to protect against, detect and respond to cyberattacks, these systems have not always been, and may not always be, effective. Westpac, its customers, shareholders, employees, suppliers, counterparties or others could suffer losses from cyberattacks, information security breaches or ineffective cyber resilience. The Group may not be able to anticipate and prevent a cyberattack, effectively respond to a cyberattack and/or rectify or minimise damage resulting from a cyberattack. Our suppliers and counterparties, and other parties that facilitate our activities, financial platforms and infrastructure (such as payment systems and exchanges) are also subject to the risk of cyberattacks, which could in turn impact Westpac. Our operations rely on the secure processing, storage and transmission of information on our computer systems and networks, and the systems and networks of external suppliers. Although we implement measures to protect the confidentiality and integrity of our information, there is a risk that the computer systems, software and networks on which we, or our customers, shareholders, employees, suppliers, counterparties or others rely, may be subject to security breaches, unauthorised access, malicious software, external attacks or internal breaches that could have an adverse impact on our and their confidential information. A range of potential consequences could arise from a successful cyberattack, such as: damage to technology infrastructure; the potential use of incident response and intervention powers by the Australian Government under the Security of Critical Infrastructure Act 2018 (Cth); disruptions or other adverse impacts to network access, operations or availability of services; loss of customers and market share or reputational damage; loss of data or information; customer remediation and/or claims for compensation; breach of applicable privacy laws or data protection regulations (including reporting obligations); increased vulnerability to fraud and scams; litigation and adverse regulatory action including fines or penalties and increased regulatory scrutiny; and increased need for significant additional resources to modify or enhance our systems or to investigate and remediate any vulnerabilities or incidents. All these potential consequences could have regulatory impacts and negatively affect our business, prospects, reputation, financial performance or financial condition. As cyber threats evolve, we may need to spend significant resources to modify or enhance our systems or investigate and remediate any vulnerabilities or incidents. We could be adversely affected by legal or regulatory change The Group’s business, prospects, reputation, financial performance and financial condition have been, and could in the future be, adversely affected by changes to law, regulation, policies, supervisory activities and the expectations of our regulators. The Group operates in an environment where there is increased regulation and scrutiny of financial services providers. Regulatory changes may affect how we operate and have altered the way we provide our products and services, in some cases requiring us to change or discontinue our offerings. Regulation could also limit our flexibility, require us to incur substantial costs, impact the profitability of our businesses, require the Group to retain additional capital, result in the Group being unable to increase or maintain market share and/or create pressure on margins and fees. Regulation impacting our business may not always be released in a timely manner and the Group may not be able to effectively manage its compliance design in the timeframes available. Further, increases in the volume of regulatory change being managed simultaneously has, and will continue to, create risk through challenging our ability to access required subject matter expertise and the execution risks associated with implementing simultaneous change. A failure to manage regulatory change effectively has resulted in, and could in the future result in, the Group not meeting its compliance obligations. We expect that we will continue to invest significantly in compliance and the management and implementation of regulatory change. Significant management attention, costs and resources may be required to update existing, or implement new, processes to comply with such regulatory changes. The availability of skilled personnel required to implement changes may be limited. There is additional information on certain aspects of regulatory changes affecting the Group in ‘Significant developments’ in the Directors’ report and the sections ‘Critical accounting assumptions and estimates’ and ‘Future developments in accounting standards’ in Note 1 to the financial statements in this Results Announcement. We have been and could be adversely affected by failing to comply with laws, regulations or regulatory policy We are responsible for ensuring that we comply with all applicable legal and regulatory requirements and industry codes of practice in the jurisdictions in which we operate or obtain funding. The Group is subject to conduct and compliance risk. These risks are exacerbated by the increasing complexity and volume of regulation, including where we interpret our obligations and rights differently to regulators or a Court, tribunal or other body. The potential for this is heightened when regulation is new, untested or is not accompanied by extensive regulatory guidance. |
| 83 WESTPAC GROUP 2022 INTERIM FINANCIAL REPORT 4 2 3 1 5 6 7 Directors’ report The Group’s compliance management system is designed to identify, assess and manage compliance risk. However, this system has not always been, and may not always be, effective. Breakdowns have occurred, and may in the future occur, due to flaws in the design or implementation of controls or processes. This has resulted in, and may in the future result in, potential breaches of compliance obligations as well as poor customer outcomes which in turn have exposed, and may continue to expose, the Group to litigation, penalties and remediation obligations. As reviews and change programs are progressed, compliance issues have been, and will likely continue to be, identified. Conduct risk could occur through the provision of products and services to customers that do not meet their needs or do not meet the expectations of the market, as well as the poor conduct of our employees, contractors, agents, authorised representatives and external services providers. This could occur through a failure to meet professional obligations to specific clients (including fiduciary and suitability requirements), weakness in risk culture, corporate governance or organisational culture, poor product design and implementation, failure to adequately consider customer needs or selling products and services outside of customer target markets. This could include deliberate, reckless or negligent actions by such individuals that could result in the circumvention of Westpac’s controls, processes and procedures. The Group depends on its people to ‘do the right thing’ to meet its compliance obligations and abide by its Code of Conduct. Inappropriate or poor conduct by these individuals such as not following a policy or engaging in misconduct has resulted, and could result, in poor customer outcomes and a failure by the Group to meet its compliance obligations. While we have frameworks, policies, processes and controls that are designed to manage poor conduct outcomes, these frameworks, policies, processes and controls have been, and may be, ineffective. This could result in financial losses (including incurring substantial remediation costs and as a result of litigation by regulators and customers) and reputational damage, which could adversely affect our business, prospects, financial performance or financial condition. The Group’s failure, or suspected failure, to comply with a compliance obligation has in the past and could in the future lead to a regulator commencing surveillance or an investigation. ASIC’s expanded breach reporting regime, which commenced on 1 October 2021, has led to a significant increase in our reporting to ASIC of certain breaches (or likely breaches), which could give rise to additional regulatory scrutiny. Past compliance failures may increase the likelihood or severity of regulatory action for subsequent failures. The Group is currently subject to a number of investigations and reviews by regulators and is responding to a number of regulatory requests from APRA, ASIC and other regulators. The Group has devoted (and will likely need to continue to devote) significant resources and has incurred (and will continue to incur) costs for these reviews and investigations, which may adversely affect Westpac’s business, operations, reputation and financial performance. Depending on the circumstances, regulatory reviews and investigations have in the past and may in the future result in a regulator taking administrative or enforcement action against the Group and/or its representatives. Regulators have broad powers, and in certain circumstances, can issue directions to us (such as a direction to take remedial action). Regulators could also pursue civil or criminal proceedings, seeking substantial fines, civil penalties or other enforcement outcomes. For example, in 2021 ASIC commenced an action against Westpac relating to its involvement in the 2016 Ausgrid privatisation transaction; and in 2021 reached an agreement with Westpac to resolve seven separate investigations and proceedings, with final penalty orders subsequently made by the Federal Court in the amounts agreed with ASIC in 2022. Penalties can be (and have been) more significant where it has taken some time to identify contraventions, or to investigate, correct or remediate contraventions, where there are patterns of similar conduct, or where there has been awareness of contraventions. In addition, regulatory investigations may lead to adverse findings against directors and management, including potential disqualification. APRA can also require the Group to hold additional capital either through a capital overlay or higher risk weighted assets. In 2019, APRA imposed a $500 million overlay to our operational risk capital requirement following the completion of our self-assessment into our frameworks and practices in relation to culture, governance and accountability, and a further $500 million overlay following the commencement of civil penalty proceedings by AUSTRAC (both overlays were applied through an increase in risk-weighted assets). Both overlays continue to be imposed. If the Group incurs additional capital overlays, it may need to raise additional capital, which could have an adverse impact on our financial performance and financial condition. The political and regulatory environment that the Group operates in has seen (and may in the future see) our regulators (including any new regulator) receive new powers along with materially increased penalties for corporate and financial sector misconduct. For example, ASIC can commence civil penalty proceedings and seek civil penalties (currently up to $555 million per contravention) against an Australian Financial Services licensee (such as Westpac) for failing to do all things necessary to ensure that financial services provided under the licence are provided efficiently, honestly and fairly. The Group may also face significant civil or criminal penalties for failing to comply with other obligations, and a failure by the Group may result in multiple contraventions leading to large penalties. The significance of, and regulatory response to, a failure may take some time to determine. There may also be a shift in the type and focus of enforcement proceedings commenced by regulators in the future. Regulators may seek to refer investigations to the Commonwealth Department of Public Prosecutions or other prosecutorial bodies for potential criminal prosecution. This may result in an increase in criminal prosecutions against institutions and/or their employees or representatives. With the expansion of civil penalty regimes in 2019, and significant increases in applicable penalties, it is possible that civil penalty proceedings may |
| 84 WESTPAC GROUP 2022 INTERIM FINANCIAL REPORT Directors’ report also be brought more frequently by regulators. Given the size of Westpac, regulatory investigations could result in findings of a significant number of breaches of obligations, which could lead to significant financial and other penalties. This could also result in reputational damage and impact the willingness of customers, investors and other stakeholders to deal with Westpac. Regulatory action commenced against the Group has exposed, and may in the future expose, the Group to an increased risk of litigation brought by third parties (including through class action proceedings), which may require the Group to pay compensation to third parties and/or undertake further remediation activities. In some cases, the amounts claimed and/or to be paid may be substantial. Regulatory investigations, inquiries, litigation, fines, penalties, infringement notices, revocation, suspension or variation of conditions of regulatory licences or other enforcement or administrative action or agreements (such as enforceable undertakings) have and could, either individually or in aggregate with other regulatory action, adversely affect our business, prospects, reputation, financial performance or financial condition. There is additional information on certain aspects of regulatory matters that may affect the Group in ‘Significant developments’ in the Directors’ report and in Note 14 to the financial statements in this Results Announcement. We have suffered, and in the future could suffer, losses and be adversely affected by the failure to implement effective risk management Our risk management framework has not always been, or may not in the future prove to be, effective, and the resources we have in place for identifying, measuring, evaluating, monitoring, reporting and controlling or mitigating material risks, may not always be adequate. This could be because the design of the framework is inadequate or that key risk management policies, controls and processes may be ineffective, due to inadequacies in their design, technology failures or incomplete implementation or embedment. The potential for these types of failings is heightened if the Group does not have appropriately skilled, trained and qualified people in key positions or does not have sufficient capacity, including people, process and technology, to appropriately manage risks. There are also inherent limitations with any risk management framework as risks may exist, or emerge in the future, that we have not anticipated or identified, and our controls may not be effective. Further, the design or operation of our remuneration structures may not always encourage prudent risk management as intended, potentially resulting in staff engaging in excessive risk-taking behaviours. The risk management framework may also prove ineffective because of weaknesses in risk culture or risk governance practices and policies, which may result in risks and control weaknesses not being identified, escalated or acted upon. The Group is required to periodically review its risk management framework to determine if it remains appropriate. Past analysis and reviews, in addition to regulatory feedback, have highlighted that while there have been improvements the framework is still not operating satisfactorily in a number of respects and needs continued focus. The Group has a number of risks which sit outside our risk appetite or do not meet the expectations of regulators, including, for example, change management, risk identification, issues and incident management, control identification and control assessment, the implementation of data governance as well as control weaknesses in respect of our liquidity risk management framework. Many of these areas requiring improvement relate to the enforceable undertaking entered into with APRA by Westpac in December 2020. As part of the Group’s risk management framework, the Group measures and monitors risks against its risk appetite. When a risk is out-of-appetite (as some risks are), the Group needs to take steps to bring this risk back into appetite in a timely way. This may include steps to improve the design of our risk class frameworks and supporting policies. However, the Group may not always be able to bring a risk back within appetite within proposed timeframes or institute effective improvements. This may occur because, for example, the Group experiences delays in enhancing its information technology systems or in recruiting sufficient numbers of appropriately trained staff for required activities. It is also possible that due to external factors beyond our control, certain risks may be inherently outside of appetite for periods of time. If the Group is unable to bring risks into appetite, or if it is determined that the Group’s risk management framework or risk governance practices and policies are no longer appropriate, the Group may incur unexpected losses and be required to undertake considerable remedial work, including incurring substantial costs. The failure to remedy this situation could result in further increased scrutiny from regulators, who could require (amongst other things) that the Group hold additional capital or direct the Group to spend money to enhance its risk management systems and controls. Weaknesses in risk management systems and controls may result in regulatory action. For example, APRA requiring Westpac to hold additional capital following both: the completion of its Culture, Governance and Accountability self-assessment; and the payment of a civil penalty of $1.3 billion as a result of the civil penalty proceedings brought by AUSTRAC against Westpac. In December 2020, APRA accepted an Enforceable Undertaking from Westpac, reflecting the crystallisation of many of the risks discussed above. APRA has approved Westpac’s Integrated Plan in relation to risk governance and remediation. |
| 85 WESTPAC GROUP 2022 INTERIM FINANCIAL REPORT 4 2 3 1 5 6 7 Directors’ report In March 2021 the RBNZ raised concerns in relation to WNZL’s risk governance practices and policies and as a result, external reviews are being conducted of WNZL’s risk governance and liquidity management. The RBNZ also amended WNZL’s conditions of registration in March 2021, requiring WNZL to discount the value of its liquid assets by approximately 14%. If any of our governance or risk management processes and procedures prove ineffective or inadequate or are otherwise not appropriately implemented, as has occurred, we could be exposed to higher levels of risk than expected which may result in losses, imposition of capital requirements, breaches of compliance obligations and reputational damage which could adversely affect our business, prospects, financial performance or financial condition. For a discussion of our risk management procedures, refer to the ‘Risk management’ section in our 2021 Annual Report. COVID-19 has had, and may continue to have (and a pandemic like COVID-19 could in the future have), an adverse effect on the Group The Group is vulnerable to the impacts of a communicable disease outbreak or a pandemic. The COVID-19 pandemic has had, and may continue to have, a negative impact on our customers, shareholders, employees, third party suppliers and financial performance, among other adverse effects. The COVID-19 pandemic also heightens other risks described in this ‘Risk Factors’ section. The COVID-19 pandemic has disrupted, and may continue to disrupt, numerous industries and global supply chains leading to shortages of materials and labour and/or cost increases. There continues to be uncertainty associated with the COVID-19 pandemic. Some Westpac customers have, and may in the future have, associated financial stress which may increase impairments, defaults and write-offs. In addition, some of Westpac’s suppliers have, and may in the future have, financial stress which could affect their ability to supply goods or services. For more information refer to Note 10 to the financial statements in this Results Announcement and Note 13 and Note 21 to the financial statements in our 2021 Annual Report. Westpac has supported customers through various initiatives that have had, and may continue to have, a negative impact on the Group’s financial performance and may see the Group assume greater risk than it would have normally. There is also the potential for further government or regulator intervention to support the economy which may require banks (including Westpac) to support those interventions. When outbreaks or pandemics occur, Westpac has adjusted and may need to adjust its risk appetite, policies or controls to respond to outbreaks or pandemics (like the COVID-19 pandemic) and protect the well-being of staff and customers who visit our premises. These changes could have unforeseen consequences and expose the Group to increased regulatory focus, media scrutiny and an increased risk of litigation. Further, to respond to the COVID-19 pandemic, Westpac has implemented (and may in the future implement) new measures in very short periods of time. Taking this type of action may increase the risk that an operational or compliance breakdown occurs, potentially leading to financial losses, impacts on customer service or regulatory and/or legal action. It is possible that the COVID-19 pandemic, or another communicable disease outbreak or pandemic, will negatively impact the Group’s performance or result in government or regulatory intervention, which could impact the Group’s ability to pay future dividends or make capital distributions. It could also impact the Group’s ability to raise capital and have an adverse impact on our financial position. We could suffer losses due to geopolitical risks, environmental factors or external events We and our customers operate businesses and hold assets in a diverse range of geographic locations. Geopolitical risks, including those arising from conflicts, strategic competition, trade tension and/or the imposition of trade tariffs, sanctions, terrorist activity, and acts of civil or international hostility, are increasing. Any significant environmental change or external event (including climate change, biodiversity loss and ecosystem degradation, drought, fire, storm, flood, earthquake, outbreaks or pandemics of communicable diseases such as the COVID-19 pandemic, civil unrest, war, heightened tension, terrorism or other geopolitical risks) in any of these locations has the potential to disrupt business activities and supply chains, damage property, affect asset values and impact our ability to recover amounts owing to us. In addition, such an event could have an adverse impact on economic activity, consumer and investor confidence, price volatility in metals and other commodities, or the levels of volatility in financial markets, all of which could adversely affect our business, prospects, financial performance or financial condition. The high dependency of the global economy on nature means loss of biodiversity and ecosystem degradation represent a risk to Westpac, primarily through its exposure to customers in sectors that are materially dependent on biodiversity and ecosystem services. Biodiversity loss and ecosystem degradation can also contribute to, and be accelerated by, climate change. Increasing recognition and market-based responses to this risk also create expectations on Westpac. We acknowledge the goal of the Taskforce of the Nature-related Financial Disclosures is to provide a framework for organisations to report on risks from biodiversity loss and ecosystem degradation. |
| 86 WESTPAC GROUP 2022 INTERIM FINANCIAL REPORT Directors’ report The failure to comply with financial crime obligations has had, and could have further, adverse effects on our business and reputation The Group is subject to anti-money laundering and counter-terrorism financing (AML/CTF) laws, anti-bribery and corruption laws, economic and trade sanctions laws and tax transparency laws in the jurisdictions in which it operates (Financial Crime Laws). These laws can be complex and, in some circumstances, impose a diverse range of obligations. As a result, regulatory, operational and compliance risks are heightened. Financial Crime Laws require Westpac to report certain matters and transactions to regulators (such as international funds transfer instructions, threshold transaction reports and suspicious matter reports) and ensure that certain information is not disclosed to third parties in a way that would contravene the ‘tipping off’ provisions in AML/CTF legislation. The failure to comply with some of these laws has had, and in the future could have, adverse impacts for the Group. The Group operates within a landscape that is constantly changing, particularly with the emergence of new payment technologies, increased regulatory focus on digital assets (e.g. cryptocurrency) and increasing reliance on economic and trade sanctions to manage issues of international concern. These developments bring with them new financial crime risks for the Group (as well as other risks discussed in this Risk Factors section), which may require adjustments to the Group’s systems, policies, processes and controls. In recent years there has been, and there continues to be, increased focus on compliance with financial crime obligations, with regulators globally commencing large-scale investigations and taking enforcement action for identified non-compliance (often seeking significant penalties). Further, due to the Group’s large number of customers and transaction volumes, the undetected failure or the ineffective implementation, monitoring or remediation of a system, policy, process or control (including a regulatory reporting obligation) has resulted, and could in the future result, in a significant number of breaches of AML/CTF or other financial crime obligations. This in turn could lead to significant financial penalties and other adverse impacts for the Group, such as reputational damage. While the Group has systems, policies, processes and controls in place designed to manage its financial crime obligations (including reporting obligations), these have not always been, and may not in the future always be, effective. This could be for a range of reasons, including, for example, a deficiency in the design of a control or a technology failure or a change in financial crime risks or typologies. Our analysis and reviews, in addition to regulator feedback, have highlighted that our systems, policies, processes and controls are not always operating satisfactorily in a number of respects and require improvement. The Group continues to progress a significant multi-year program of work to strengthen areas of control weakness in its financial crime risk management program and to seek to rectify the management of this risk. In recent years, the Group has increased dedicated financial crime risk expertise and resources to deliver the financial crime program of work. With increased focus on financial crime, further issues requiring attention have been identified and may continue to be identified. Although the Group provides updates to AUSTRAC, the ATO and other regulators on its remediation and other program activities, there is no assurance that AUSTRAC, the ATO or other regulators will agree that its remediation and program update activities will be adequate or effectively enhance the Group’s compliance programs. If we fail to comply with these financial crime obligations, we could face regulatory enforcement action such as litigation, significant fines, penalties and/or the revocation, suspension or variation of licence conditions. For example, previous enforcement action by AUSTRAC has resulted in a range of outcomes, depending on the nature and severity of the relevant conduct and its consequences, including severe financial penalties (such as the $1.3 billion civil penalty we paid as a result of civil proceedings brought by AUSTRAC in November 2019), restrictions and other regulator-imposed conditions. There is additional information on financial crime matters in ‘Significant developments’ in the Directors’ report in this Results Announcement. Non-compliance or alleged non-compliance with our financial crime obligations has also resulted in, and could lead to, regulatory investigations, reviews, inquiries, proceedings or other litigation commenced by third parties (including Australian, US or other class actions), and regulatory action in non-Australian jurisdictions where we operate. Any such litigation or proceedings could cause significant financial and reputational damage to us. Reputational damage could result in the loss of customers or restrict the Group’s ability to efficiently access capital markets, which could have a material adverse effect on the Group’s business, reputation, prospects, financial performance and financial condition. Furthermore, any such effect could harm the Group’s credit ratings. Climate change may have adverse effects on our business There are significant uncertainties inherent in accurately identifying and modelling climate-related risks over short-, medium- and long-term time horizons and in assessing their impact on the Group’s business. We, our customers, external suppliers and communities in which we operate, have been and may be adversely affected by the physical risks of climate change, including increases and variability in temperatures, changes in precipitation patterns, rising sea levels, loss of biodiversity and ecosystem degradation and the frequency and severity of adverse climatic events including fires, storms, floods and droughts. These effects, whether acute or |
| 87 WESTPAC GROUP 2022 INTERIM FINANCIAL REPORT 4 2 3 1 5 6 7 Directors’ report chronic in nature, may directly impact us and our customers through, for example, disruptions to business and economic activity, inability to access insurance and/or impacts on income and asset values. Adverse impacts on our customers may lead to human rights risk, and negatively impact loan serviceability and security values, as well as our profitability. Westpac is exposed to risk arising from initiatives and trends associated with climate change mitigation (transition risks). Changes in supervisory expectations of banks, other regulatory changes and changes in investor appetite could directly impact Westpac, for example, by giving rise to higher compliance and/or funding costs and the contraction of revenue from sectors materially exposed to transition risk. Examples of regulatory change in this space include: APRA’s Climate Vulnerability Assessment involving major Australian banks including Westpac; APRA’s Prudential Practice Guide on climate change financial risks and Climate Risk Self-Assessment Survey; the EU’s introduction of Sustainability Financial Disclosure Regulations and changes to Basel Pillar 3 disclosure obligations; international policy consideration of capital regulatory requirement updates to account for climate- and sustainability-related prudential risks; the International Sustainability Standards Board’s proposed introduction of IFRS S1 General Requirements for Disclosure of Sustainability-related Financial Information and IFRS S2 Climate-related Disclosures; the US SEC’s proposed introduction of enhanced and standardised mandatory climate-related disclosures; and the introduction of legislation in New Zealand to require mandatory climate-risk reporting for the financial sector. Westpac is also exposed to transition risk indirectly through its lending to higher risk sectors or regions. Technological developments, regulatory changes, stakeholder pressure, climate activism and shifting customer preferences may place additional pressure on certain customer sectors to reduce greenhouse gas emissions, which could in turn result in additional credit risk, or loss of revenues due to changes in markets. Conversely, Westpac may not be able to reduce its lending to higher risk sectors or regions, in line with any targets, as a result of possible stakeholder requirements to continue to lend to certain customer sectors. Westpac’s commitment to managing our business in alignment with our support for the Paris Climate Agreement and the need to transition to a net zero emissions economy by 2050 may require ongoing changes to the Group’s lending policies, and present execution risk. A failure to adapt the Group’s strategy, governance, procedures, systems and controls to manage evolving climate- and sustainability-related risks and opportunities may present business, reputational and legal risks, including financial and credit risks that may impact on our profitability and outlooks. We may be subject, from time to time, to legal and business challenges due to actions instituted by activist shareholders or others. An example of areas which have attracted shareholder activism in Australia includes avoiding financing or interacting with businesses that are not perceived to demonstrate responsible management of environmental and social issues, and human risks or administrative law-based challenges to project proposals or expansions. Should the Group be required to respond to these challenges, this could give rise to increased costs, reputational risk and additional disclosures associated with such matters. In addition, there could be heightened litigation risk due to varying shareholder expectations or additional disclosures or commitments made by Westpac to shareholders. Perceived uncertainties as to our future direction as a result of shareholder activism may lead to the perception of a change in the direction of the business or other instability. Further, any failure or perceived failure by Westpac or its customers to proactively manage or disclose physical and/or transition risks associated with climate change appropriately (including for example, perceived failure to meet its commitments and/or targets) may in turn increase reputational, financial legal and regulatory risk. Legal and regulatory risks include third party and shareholder litigation, or regulatory action, with these types of climate-related actions becoming more common in Australia and globally. Further, we expect scrutiny from shareholders and regulators on the climate-related risk management practices and lending policies of banks and other financial institutions to remain high in Australia in coming years. Westpac is also exposed to broader geopolitical and macro-economic impacts of climate change given its international portfolio. Climate change may remove stability from both domestic and international economic conditions and may impact customer confidence in these markets. Failure to effectively manage and disclose direct and indirect climate-related risks including nature-related risks such as biodiversity loss and ecosystem degradation could adversely affect our business, prospects, reputation, financial performance or financial condition. Please refer to our 2021 Sustainability Supplement and Section 2.6 (‘Sustainability Performance’) of this Results Announcement for further details on the identification, assessment and management of risks relating to climate change. Reputational damage has harmed, and could in the future harm, our business and prospects Reputational risk arises where there are differences between stakeholders’ current and emerging perceptions, beliefs and expectations and our past, current and planned activities, processes, performance and behaviours. There are various potential sources of reputational damage. For example, where our actions cause, or are perceived to cause, a negative outcome for customers, shareholders, stakeholders or the community. Reputational damage could also arise from the failure to effectively manage risks, failure to comply with legal and regulatory |
| 88 WESTPAC GROUP 2022 INTERIM FINANCIAL REPORT Directors’ report requirements, enforcement or supervisory action by regulators, adverse findings from regulatory reviews, failure or perceived failure to adequately respond to community, environmental, social and ethical issues, and inadequate record keeping, which may prevent Westpac from demonstrating that, or determining if, a past decision was appropriate at the time it was made. Westpac also recognises the potential reputational consequences (together with other potential commercial and operational consequences) of failing to appropriately identify, assess and manage environmental, social and governance related risks such as climate change risk, human rights risk including customer vulnerability, modern slavery and child safety risk, or respond effectively to evolving standards and stakeholder expectations. Our reputation could also be adversely affected by the actions of customers, suppliers, joint-venture partners, strategic partners, or other counterparties. Failure, or perceived failure, to address issues that could or do give rise to reputational risk, has created, and could in the future create additional legal risk, subject us to regulatory investigations, regulatory enforcement actions, fines and penalties or litigation or other actions brought by third parties (including class actions), and the requirement to remediate and compensate customers, including prospective customers, investors and the market. This could adversely affect our business, prospects, financial performance or financial condition. We have and could suffer losses due to litigation From time to time, the Group is involved in legal proceedings (including class actions), regulatory actions or arbitration. Such litigation has been, and could in the future be, commenced by a range of plaintiffs, such as customers, shareholders, employees, suppliers, counterparties and regulators. In recent years, there has been an increase in class action proceedings, many of which have resulted in significant monetary settlements. The risk of class actions has been heightened by a number of factors, including regulatory enforcement actions (such as the civil penalty proceedings brought by AUSTRAC), an increase in the number of regulatory investigations and inquiries (such as the Royal Commission), a greater willingness on the part of regulators to commence court proceedings, more intense media scrutiny and the growth of third-party litigation funding and other funding arrangements. Class actions commenced against a competitor could also lead to similar proceedings against Westpac. Litigation (including class actions) may, either individually or in aggregate, adversely affect the Group’s business, operations, prospects, reputation or financial condition. This risk is heightened by increases in the severity of penalties for certain breaches of the law. Such matters are subject to many uncertainties and the outcome may not be predicted accurately. Furthermore, the Group’s ability to respond to and defend litigation may be adversely affected by inadequate record keeping. Depending on the outcome of any litigation, the Group has been, and may in the future be, required to comply with broad court orders, including compliance orders, enforcement orders or otherwise pay significant damages, fines, penalties or legal costs. There is a risk that the actual penalty or damages paid following a settlement or determination by a Court for any legal proceedings may be materially higher or lower than any relevant provision (where applicable) or that any contingent liability may be larger than anticipated. There is also a risk that additional litigation or contingent liabilities arise, all of which could adversely affect our business, prospects, reputation, financial performance or financial condition. There is additional information on certain legal proceedings that may affect the Group in ‘Significant developments’ in the Directors’ report and in Note 14 to the financial statements in this Results Announcement. We could suffer losses due to technology failures Maintaining the reliability, integrity and security of our information and technology is crucial to our business. While the Group has a number of processes in place to preserve and monitor the availability and recovery of our systems, there is a risk that our information and technology systems might fail to operate properly or result in outages, including from events wholly or partially beyond our control. If we incur a technology failure, we may fail to meet a compliance obligation (such as retaining records and data for a certain period), or our customers may be adversely affected, including through the inability for them to access our products and services, privacy breaches or the loss of personal data. This could result in reputational damage, remediation costs and a regulator commencing an investigation and/or taking action against us. The use of legacy systems, as well as the work underway to uplift our technological capabilities, may heighten the risk of a technology failure. We need to regularly renew and enhance our technology to deliver new products and services, comply with regulatory obligations and meet our customers’ and regulators’ expectations. Consequently, we are constantly managing new technology projects. Failure to effectively implement these projects could result in cost overruns, reduced productivity, outages, operational instability, compliance failures, reputational damage and/or the loss of market share. This could place us at a competitive disadvantage and adversely affect our business, prospects, financial performance or financial condition. |
| 89 WESTPAC GROUP 2022 INTERIM FINANCIAL REPORT 4 2 3 1 5 6 7 Directors’ report We are exposed to adverse funding market conditions We rely on deposits, money markets and capital markets to fund our business and source liquidity. Our liquidity and costs of obtaining funding are related to funding market conditions. Funding markets can be unpredictable and experience extended periods of extreme volatility, disruption and decreased liquidity. The main risks we face are damage to market confidence, changes to the access and cost of funding, a slowing in global economic activity or other impacts on customers or counterparties. A shift in investment preferences could result in deposit withdrawals which could increase our need for funding from other, potentially less stable, or more expensive sources. In addition, APRA’s announcement on 10 September 2021 that ADIs should reduce their usage of the Committed Liquidity Facility to zero by the end of 2022 has increased our need for funding in the calendar year ending 31 December 2022 and thereafter. If market conditions deteriorate due to economic, financial, political, geopolitical or other reasons, there may also be a loss of confidence in bank deposits leading to unexpected withdrawals. This could increase funding costs and our liquidity, funding and lending activities may be constrained and our financial solvency threatened. If our current sources of funding prove to be insufficient, we may need to seek alternatives which will depend on factors such as market conditions, our credit ratings and market capacity. Even if available, these alternatives may be more expensive or on unfavourable terms, which could adversely affect our financial performance, liquidity, capital resources or financial condition. If Westpac is unable to source appropriate funding, we may be forced to reduce lending or liquidity. This may adversely impact our business, prospects, liquidity, capital resources, financial performance or financial condition. If Westpac is unable to source appropriate funding for an extended period, or if it can no longer realise liquidity, Westpac may not be able to pay its debts as and when they fall due or meet other contractual obligations. Westpac enters into collateralised derivative obligations, which may require Westpac to post additional collateral based on market movements, which has the potential to adversely affect Westpac’s liquidity or ability to use derivative obligations to hedge its interest rate, currency and other financial instrument risks. For a more detailed description of liquidity risk, refer to ‘Funding and liquidity risk’ in Note 21 to the financial statements in our 2021 Annual Report. We could be adversely affected by the risk of inadequate capital levels under stressed conditions The Group is subject to the risk of an inadequate level or composition of capital to support normal business activities and to meet regulatory capital requirements under normal operating environments or stressed conditions (for example the COVID-19 pandemic). Regulatory change over the years has led banks to progressively build capital. Management buffers have been built to assist in maintaining capital adequacy during stressed times and ahead of the implementation of APRA’s finalised Capital Framework, which comes into effect from 1 January 2023. Westpac determines its internal management buffers taking into consideration various factors, including bank specific balance sheet, portfolio mix, implications of the Basel III implementation, potential capital headwinds and stressed outcomes. Capital distribution constraints apply when an ADI’s Common Equity Tier 1 Capital ratio is within the capital buffer range (consisting of the Capital Conservation Buffer plus any Countercyclical Capital Buffer) in line with regulatory requirements. Such constraints could have an impact on Westpac’s ability to pay future dividends or make capital distributions. Stressed conditions and/or regulatory change could impact Westpac’s capital adequacy, trigger capital distribution constraints, threaten our financial viability and/or require us to make a highly dilutive capital raising. Sovereign risk may destabilise financial markets adversely Sovereign risk is the risk that governments will default on their debt obligations, fail to perform contractual obligations or be unable to refinance their debts as they fall due. Potential sovereign contractual defaults, sovereign debt defaults and the risk that governments will nationalise parts of their economy including assets of financial institutions such as Westpac could negatively impact the value of our holdings of liquid assets. Such an event could destabilise global financial markets, adversely affecting our liquidity, financial performance or financial condition. There may also be a cascading effect to other markets and countries, the consequences of which, while difficult to predict, may be similar to, or worse than, those experienced during the Global Financial Crisis. We could be adversely affected by the failure to maintain our credit ratings Credit ratings are independent opinions on our creditworthiness. Our credit ratings can affect the cost and availability of our funding and may be important to certain customers or counterparties when evaluating our products and services. Credit ratings assigned to us by rating agencies are based on an evaluation of several factors, including the structure of Australia’s financial system, the economy and Australia’s Sovereign credit rating, as well as our financial strength, the quality of our governance and risk appetite. A rating downgrade could be driven by a downgrade of Australia’s Sovereign credit rating, or one or more of the risks identified in this section or by other events including changes to the methodologies rating agencies use to determine credit ratings. A credit rating or rating outlook could be downgraded or revised, where credit rating agencies believe there is a very high level of uncertainty on the impact to key rating factors from a significant event. |
| 90 WESTPAC GROUP 2022 INTERIM FINANCIAL REPORT Directors’ report A downgrade to our credit ratings could have an adverse effect on our cost of funds, collateral requirements, liquidity, competitive position, our access to capital markets and our financial stability. The extent and nature of these impacts would depend on various factors, including the extent of any rating change, differences across agencies (split ratings) and whether competitors or the sector are also impacted. Our business is substantially dependent on the Australian and New Zealand economies, and could be adversely affected by a shock to these economies or other financial systems Our revenues and earnings are dependent on domestic and international economic activity, business conditions and the level of financial services our customers require. Most of our business is conducted in Australia and New Zealand so our performance is influenced by the level and cyclical nature of activity in these countries. The financial services industry and capital markets have been, and may continue to be, adversely affected by volatility, global economic conditions (including inflation), external events, geopolitical instability, political developments or a major systemic shock. Market and economic disruptions could cause consumer and business spending to decrease, unemployment to rise and demand for our products and services to decline, thereby reducing our earnings. These events could also undermine confidence in the financial system, reduce liquidity, impair access to funding and adversely affect our customers and counterparties. In addition, any significant decrease in housing and commercial property valuations could adversely impact lending activities, possibly leading to higher credit losses. Due to the economic relationship between Australia/New Zealand and China, particularly in the mining, resources and agricultural sectors, a slowdown in China’s economic growth and foreign government policies (including the adoption of protectionist trade measures or sanctions) could negatively impact the Australian economy. This could result in a reduced demand for our products and services and affect the level of economic activity and the ability of our borrowers to repay their loans. All these factors could adversely affect our business, prospects, financial performance or financial condition. The nature and consequences of any such event are difficult to predict and there is a risk that our response may be ineffective. Declines in asset markets could adversely affect our operations or profitability Potential declines in Australian, New Zealand or other asset markets, including equity, residential and commercial property markets, have adversely affected, and could in the future adversely affect, our operations and profitability. Declining asset prices could also impact customers and counterparties and the value of security (including residential and commercial property) we hold. This may impact our ability to recover amounts owing to us if customers or counterparties default. It may also affect our impairment charges and provisions, in turn impacting our financial performance and financial condition. Declining asset prices also impact our wealth management business as its earnings partly depend on fees based on the value of securities and/or assets held or managed. An increase in defaults could further adversely affect our financial performance or financial condition We establish provisions for credit impairment based on current information and our expectations. If economic conditions deteriorate beyond our expectations, some customers and/or counterparties could experience higher financial stress, leading to an increase in defaults and write-offs, and higher provisioning. Such events could adversely affect our liquidity, capital resources, financial performance or financial condition. These risks have been heightened by the COVID-19 pandemic, which has negatively impacted economic activity and caused a range of customers to experience financial stress. In Australia, floods in the first half of 2022 had a devastating impact across parts of Queensland and NSW is also likely to lead to additional financial stress for some customers. Credit risk also arises from certain derivative, clearing and settlement contracts we enter into, and from our dealings in, and holdings of, debt securities issued by other institutions, the financial conditions of which may be affected to varying degrees by economic conditions in global financial markets. For a discussion of our risk management, including the management of credit risk, refer to the ‘Risk management’ section in our 2021 Annual Report and Note 21 to the financial statements in our 2021 Annual Report. We face intense competition in all aspects of our business The financial services industry is highly competitive. We compete with a range of firms, including retail and commercial banks, investment banks, other financial service companies, fintech companies and businesses in other industries with financial services aspirations. This includes those competitors who are not subject to the same capital and regulatory requirements as us, which may allow those competitors to operate more flexibly. Emerging competitors are increasingly altering the competitive environment by adopting new business models or seeking to use new technologies to disrupt existing business models. The competitive environment may also change as a result of increased scrutiny by regulators in the sector and legislative reforms such as ‘Open Banking’, which will stimulate competition, improve customer choice and likely give rise to increased competition from new and existing firms. |
| 91 WESTPAC GROUP 2022 INTERIM FINANCIAL REPORT 4 2 3 1 5 6 7 Directors’ report Competition in the various markets in which we operate has led, and may continue to lead, to a decline in our margins or market share. Deposits fund a significant portion of our balance sheet and have been a relatively stable source of funding. If we are not able to successfully compete for deposits this could increase our cost of funding, lead us to seek access to other types of funding or result in us reducing our lending. Our ability to compete depends on our ability to offer products and services that meet evolving customer preferences. Not responding to changes in customer preferences could see us lose customers. This could adversely affect our business, prospects, financial performance or financial condition. For more detail on how we address competitive pressures refer to ‘Competition’ in Section 1 in our 2021 Annual Report. We have and could suffer losses due to operational risks Operational risk includes, among other things, reputational risk, technology risk, model risk and outsourcing risk, as well as the risk of business disruption due to external events such as natural disasters, or outbreaks of communicable diseases, environmental hazards, damage to critical utilities and targeted activism and protest activity. While we have policies, processes and controls in place to manage these risks, these have not always been, or may not be, effective. Ineffective processes and controls have resulted in, and could result in, adverse outcomes for Westpac’s customers. For example, a process breakdown or a failure to have appropriate product governance and monitoring processes in place could result in a customer not receiving a product on the terms, conditions, or pricing they agreed to, potentially to the detriment of the customer. Failed processes could also result in Westpac incurring losses because we cannot enforce our expected contractual rights. These types of operational failures may also result in financial losses, customer remediation, regulatory scrutiny and intervention and, depending on the nature of the failure, result in class action proceedings. We have and could in the future, incur losses from fraudulent applications for loans or from incorrect or fraudulent payments and settlements. Fraudulent conduct can also arise from external parties seeking to access the bank’s systems or customer accounts. If systems, procedures and protocols for managing fraud fail, or are ineffective, they could lead to losses which could adversely affect our customers, business, prospects, reputation, financial performance or financial condition. Westpac is also exposed to model risk, being the risk of loss arising from errors or inadequacies in data or a model, or in the control and use of a model. Financial services entities have been increasingly sharing data with third parties, such as suppliers and regulators, to conduct their business and meet regulatory obligations. Each third party can give rise to a variety of risks, including financial crime compliance, information security, cyber, privacy, regulatory compliance, reputation, environmental and business continuity risks. Westpac also relies on suppliers, both in Australia and overseas, to provide services to it and its customers. Failures by these third-party contractors and suppliers to deliver services as required could disrupt Westpac’s ability to provide its products and services and adversely impact our operations, financial performance or reputation. Westpac is also exposed to change risk through delivery of regulatory and technology programs, being the risk that a change program fails to deliver the desired goals, or fails to reduce, pre-empt, mitigate and manage the challenges associated with transformation or leads to further regulatory scrutiny. Westpac has embarked on significant change program plans including in response to the APRA Enforceable Undertaking. Driving improvements in risk culture and risk maturity may increase costs and absorb management attention while change is being embedded. Another possible source of disruption to the Group is central banks adopting negative interest rates. If this occurred, the technology systems used by the Group, its counterparties and/or financial infrastructure providers may not operate correctly, and this may cause loss or damage to the Group and/or its counterparties. For a discussion of our risk management procedures, including the management of operational risk, refer to the ‘Risk management’ section in our 2021 Annual Report. We could suffer losses due to market volatility We are exposed to market risk due to our financial markets businesses, our defined benefit plan and through asset and liability management (including through volatility in prices of equity securities we hold or are exposed to). Market risk is the risk of an adverse impact on the Group’s financial position resulting from changes in market factors, such as foreign exchange rates, commodity prices, equity prices, and interest rates (including low or negative interest rates and any resulting pressure placed on the Group’s interest margins). This includes interest rate risk in the banking book due to a mismatch between the duration of assets and liabilities arising from the normal course of business activities. Changes in markets could be driven by numerous developments resulting in market volatility which could lead to substantial losses (including changes in the return on, value of or market for securities or other instruments). |
| 92 WESTPAC GROUP 2022 INTERIM FINANCIAL REPORT Directors’ report This may adversely affect our business, prospects, liquidity, ability to hedge exposures, capital resources, financial performance or financial condition. Any future changes in the administration of the London Inter-bank Offered Rate (‘LIBOR’) or other market benchmarks could have adverse consequences for the return on, value of and market for securities and other instruments linked to any such benchmark, including securities or other instruments issued by the Group. While we are monitoring our exposure to LIBOR, we remain dependent on market developments in relation to the LIBOR transition, which may have an impact on market pricing for, or valuations of, our LIBOR exposures and migrated alternative reference rate exposures. For further information on the Group’s LIBOR exposure, refer to Note 21 to the financial statements in our 2021 Annual Report. For a discussion of our risk management procedures, including the management of market risk, refer to the ‘Risk management’ section in our 2021 Annual Report. Poor data quality and records management could adversely affect our business and operations Accurate, complete and reliable data, along with appropriate data control, retention and access frameworks and processes, is critical to Westpac’s business. Data plays a key role in how we provide products and services to customers, our systems, our risk management framework and our decision-making and strategic planning. In some areas of our business, we are affected by poor data quality. This has occurred, and could arise in the future, in a number of ways, including through inadequacies in systems, processes and policies, or the ineffective implementation of data management frameworks. Poor data quality could lead to poor customer service, negative risk management outcomes, and deficiencies in credit systems and processes. Any deficiency in credit systems and processes could, in turn, have a negative impact on Westpac’s decision making in the provision of credit and the terms on which it is provided. Westpac also needs accurate data for financial and other reporting. Poor data or poor records management has affected, currently affects and may in the future continue to affect Westpac’s ability to monitor our business, comply with production notices, respond to regulatory notices and conduct remediation. In addition, poor data or poor data retention, and control gaps and weaknesses, has affected, currently affects and may in the future continue to affect Westpac’s ability to meet its compliance obligations (including its regulatory reporting obligations) which could lead to a regulator taking action against us. For example, APRA has raised concerns regarding Westpac’s data quality, including missing data and its increasing trend of resubmissions of regulatory reporting. The RBA and ABS also footnote that they exclude Westpac data from certain economic and financial statistics reports. Due to the importance of data, the Group has and will likely continue to incur substantial costs and devote significant effort to improving the quality of data and data frameworks and processes and remediating deficiencies where necessary. The consequences and effects arising from poor data quality or poor data retention could have an adverse impact on the Group’s business, operations, prospects, reputation, financial performance and/or financial condition. Breakdowns in processes and procedures have required, and could in the future require, us to undertake remediation activity Breakdowns in Westpac’s processes and procedures have led to, and could in the future lead to, adverse outcomes for customers, employees or other third parties which Westpac is required to remediate. The Group has, on a number of occasions, incurred significant remediation costs (including compensation payments and costs of correcting the issue), and there is a risk that similar or new issues will arise or be identified in the future requiring remediation. These may be identified as we implement the Group’s Fix and Simplify strategic priorities. There are significant challenges and risks involved in remediation activities. Westpac’s ability to investigate the underlying issue could be impeded if the issue is old and occurred beyond our record retention period, or our records are inadequate. It may also be difficult and take significant time to properly quantify and scope a remediation activity. Determining how to compensate customers, employees or third parties properly and fairly can also be complicated, involving numerous stakeholders. The Group’s proposed approach to a remediation may be affected by a number of events, such as affected customers commencing a class action, or a regulator requiring a remediation to be done in a specific way or within a specific timeframe. These factors could delay Westpac in completing the remediation and may lead to a regulator commencing enforcement action against the Group. In turn, this could result in increased reputational risk, and we could be challenged by regulators, affected customers, the media and other stakeholders. The Group has had, and may continue to have, issues in effectively scoping, quantifying, implementing or completing remediation activities in a timely way, and if this occurs there could be an adverse impact on our business, prospects, reputation, financial performance or financial condition and could lead to further regulatory action and/or oversight. Remediation programs may not prevent regulatory action, litigation or other proceedings from being pursued, or sanctions being imposed. |
| 93 WESTPAC GROUP 2022 INTERIM FINANCIAL REPORT 4 2 3 1 5 6 7 Directors’ report Our failure to recruit and retain key executives, employees and Directors may have adverse effects on our business Key executives, employees and Directors play an integral role in the operation of Westpac’s business and its pursuit of its strategic objectives. The unexpected departure of an individual in a key role, or the Group’s failure to recruit and retain appropriately skilled and qualified persons into these roles, could each have an adverse effect on our business, prospects, reputation, financial performance or financial condition. In addition, macro environmental factors such as low unemployment, restricted migration levels, on-shoring of work, new ways of working and the competitive talent market are all emerging risk factors. These factors can have an adverse impact on attraction of specialist skills for the Group. Certain strategic decisions may have adverse effects on our business The Group routinely evaluates and implements strategic decisions and objectives including simplification, diversification, innovation, divestment, acquisitions or business expansion initiatives. Each of these activities can be complex, costly and may not proceed in a timely manner. For example, they may cause reputational damage, or we may experience difficulties in completing certain transactions, separating or integrating businesses in the scheduled timeframe or at all, disruptions to operations, diversion of management resources or higher than expected transaction costs. Multiple divestments and/or acquisitions at the same time may intensify these risks. Furthermore, approvals may be required from shareholders, regulators or other stakeholders in order to divest businesses and assets, and there is a risk that these approvals may not be received, as seen in 2021 with the attempted sale of Westpac Pacific, or that the purchaser does not complete these transactions for other reasons. In addition, our failure to successfully divest businesses or assets could result in interested parties taking action against the Group. We may not receive the anticipated business benefits or cost saving and the Group could otherwise be adversely affected. In addition, as part of the Specialist Businesses transactions we have given a number of warranties and indemnities in favour of counterparties relating to certain pre-completion matters, and made certain other contractual commitments (including in relation to transitional services). Claims under these warranties, indemnities and other contractual commitments may result in Westpac being liable to make significant payments to these counterparties. Additional operating risk capital is expected to be required to be held against the risk pursuant to APRA’s recently published guidance. The Group’s contingent liabilities are described in Note 14 to the financial statements in this Results Announcement. Westpac also acquires and invests in businesses. These transactions involve a number of risks and costs. A business Westpac invests in may not perform as anticipated or may ultimately prove to have been overvalued when the transaction was entered into. Operational, cultural, governance, compliance and risk appetite differences between Westpac and an acquired business may lead to lengthier and more costly integration exercises. There are also risks involved in failing to identify, understand or respond effectively to changes in the Group’s internal factors or external business environment (including economic, geopolitical, regulatory, technological, environmental, social and competitive factors). This could have a range of adverse effects on Westpac, such as being unable to increase or maintain market share or resulting pressure on margins and fees. Any of these risks could have a negative impact on the Group’s business, prospects, reputation, engagement with regulators, financial performance or financial condition. We could suffer losses due to impairment of capitalised software, goodwill and other intangible assets that may adversely affect our business, operations or financial condition In certain circumstances Westpac may incur a reduction in the value of intangible assets. Westpac is required to assess the recoverability of goodwill and other intangible asset balances at least annually or wherever an indicator of impairment exists. For this purpose, Westpac uses a discounted cash flow calculation. Changes in the methodology or assumptions in calculations together with changes in expected cash flows, could materially impact this assessment. Estimates and assumptions used in assessing the useful life of an asset can also be affected by a range of factors including changes in strategy, changes in technology and regulatory requirements. In the event that an asset is no longer in use, or its value has been reduced or that its estimated useful life has declined, an impairment will be recorded, adversely impacting the Group’s financial performance. |
| 94 WESTPAC GROUP 2022 INTERIM FINANCIAL REPORT Directors’ report We could suffer losses due to insurance risk Insurance risk is the risk in our licensed life insurance business of lapses being greater than expected, or the costs of claims being greater than expected due to a failure in product design, underwriting or reinsurance arrangements. There is also a risk of policyholders or a Court interpreting policy wording differently to the way the Group or the industry has applied it, or policy wording not being sufficiently clear. In life insurance, risk arises primarily through mortality and morbidity (illness and injury) risks, the costs of claims relating to those risks being greater than was anticipated and policy lapses. Due to the long-term nature of the life insurance business, any future adverse variation in these risks or our capacity to adjust premiums on account of these variations would be reflected in the current period. Where the business does not have adequate future profitability to offset these variations then there is a risk that accounting losses could impact our financial position. If our reinsurance arrangements are ineffective, this could lead to more retained losses than anticipated. The Group has been unable to, and may in the future be unable to, renew reinsurance arrangements on similar terms, including in relation to the cost, duration and amount of reinsurance cover provided. There is also a risk that we will not be able to obtain and have not obtained appropriate reinsurance or insurance coverage for the risks that the Group may be exposed to. Changes in critical accounting estimates and judgements could expose the Group to losses The Group is required to make estimates, assumptions and judgements when applying accounting policies and preparing its financial statements, particularly in connection with the calculation of provisions (including remediation and expected credit losses) and the determination of the fair value of financial instruments. A change in a critical accounting estimate, assumption and/or judgement resulting from new information or from changes in circumstances or experience could result in the Group incurring losses greater than those anticipated or provided for. This could have an adverse effect on the Group’s financial performance, financial condition and reputation. The Group’s financial performance and financial condition may also be impacted by changes to accounting standards or to generally accepted accounting principles. We could suffer losses if we fail to syndicate or sell down underwritten securities As a financial intermediary, we underwrite listed and unlisted debt and equity securities. We could suffer losses if we fail to syndicate or sell down this risk to others. This risk is more pronounced in times of heightened market volatility. Rounding of amounts ASIC Corporations (Rounding in Financial/Directors’ Reports) Instruments 2016/191 applies to Westpac and in accordance with that Legislative Instrument all amounts have been rounded to the nearest million dollars unless otherwise stated. |
| 95 WESTPAC GROUP 2022 INTERIM FINANCIAL REPORT 4 2 3 1 5 6 7 Directors’ report Auditor’s independence declaration PricewaterhouseCoopers, ABN 52 780 433 757 One International Towers Sydney, Watermans Quay, Barangaroo, GPO BOX 2650, SYDNEY NSW 2001 T: +61 2 8266 0000, F: +61 2 8266 9999, www.pwc.com.au Liability limited by a scheme approved under Professional Standards Legislation. Auditor’s Independence Declaration As lead auditor for the review of Westpac Banking Corporation for the half-year ended 31 March 2022, I declare that to the best of my knowledge and belief, there have been: (a) no contraventions of the auditor independence requirements of the Corporations Act 2001 in relation to the review; and (b) no contraventions of any applicable code of professional conduct in relation to the review. This declaration is in respect of Westpac Banking Corporation and the entities it controlled during the period. Colin Heath Sydney Partner PricewaterhouseCoopers 8 May 2022 |
| 96 WESTPAC GROUP 2022 INTERIM FINANCIAL REPORT Directors’ report Responsibility statement The Directors of Westpac Banking Corporation confirm that to the best of their knowledge: (i) the interim financial statements have been prepared in accordance with AASB 134 Interim Financial Reporting and are in compliance with IAS 34 Interim Financial Reporting issued by the International Accounting Standards Board; and (ii) the Directors’ report includes a fair review of the information required by DTR 4.2.7 R of the Disclosure Guidance and Transparency Rules of the United Kingdom Financial Conduct Authority. The Directors’ report is signed in accordance with a resolution of the Board of Directors. John McFarlane Peter King Chairman Managing Director and Chief Executive Officer Sydney, Australia 8 May 2022 |
| 97 WESTPAC GROUP 2022 INTERIM FINANCIAL REPORT 2 5 6 7 4 1 3 Consolidated financial statements 4.2 Consolidated income statement Westpac Banking Corporation and its controlled entities Half Year Half Year Half Year % Mov’t March Sept March Mar 22 Mar 22 $m Note 2022 2021 2021 - Sept 21 - Mar 21 Interest income: Calculated using the effective interest rate method 3 10,109 10,721 11,411 (6) (11) Other 3 96 123 23 (22) large Total interest income 10,205 10,844 11,434 (6) (11) Interest expense 3 (1,917) (2,334) (3,086) (18) (38) Net interest income 8,288 8,510 8,348 (3) (1) Net fee income 4 845 782 700 8 21 Net wealth management and insurance income 4 401 613 598 (35) (33) Trading income 4 343 277 442 24 (22) Other income 4 353 354 598 - (41) Net operating income before operating expenses and impairment charges 10,230 10,536 10,686 (3) (4) Operating expenses 5 (5,373) (7,314) (5,997) (27) (10) Impairment (charges)/benefits 10 (139) 218 372 large large Profit before income tax expense 4,718 3,440 5,061 37 (7) Income tax expense 6 (1,434) (1,422) (1,616) 1 (11) Net profit 3,284 2,018 3,445 63 (5) Net profit attributable to non-controlling interests (NCI) (4) (3) (2) 33 100 Net profit attributable to owners of Westpac Banking Corporation (WBC) 3,280 2,015 3,443 63 (5) Earnings per share (cents) Basic 7 90.5 54.9 94.5 65 (4) Diluted 7 85.7 53.2 86.4 61 (1) The above consolidated income statement should be read in conjunction with the accompanying notes. Consolidated financial statements |
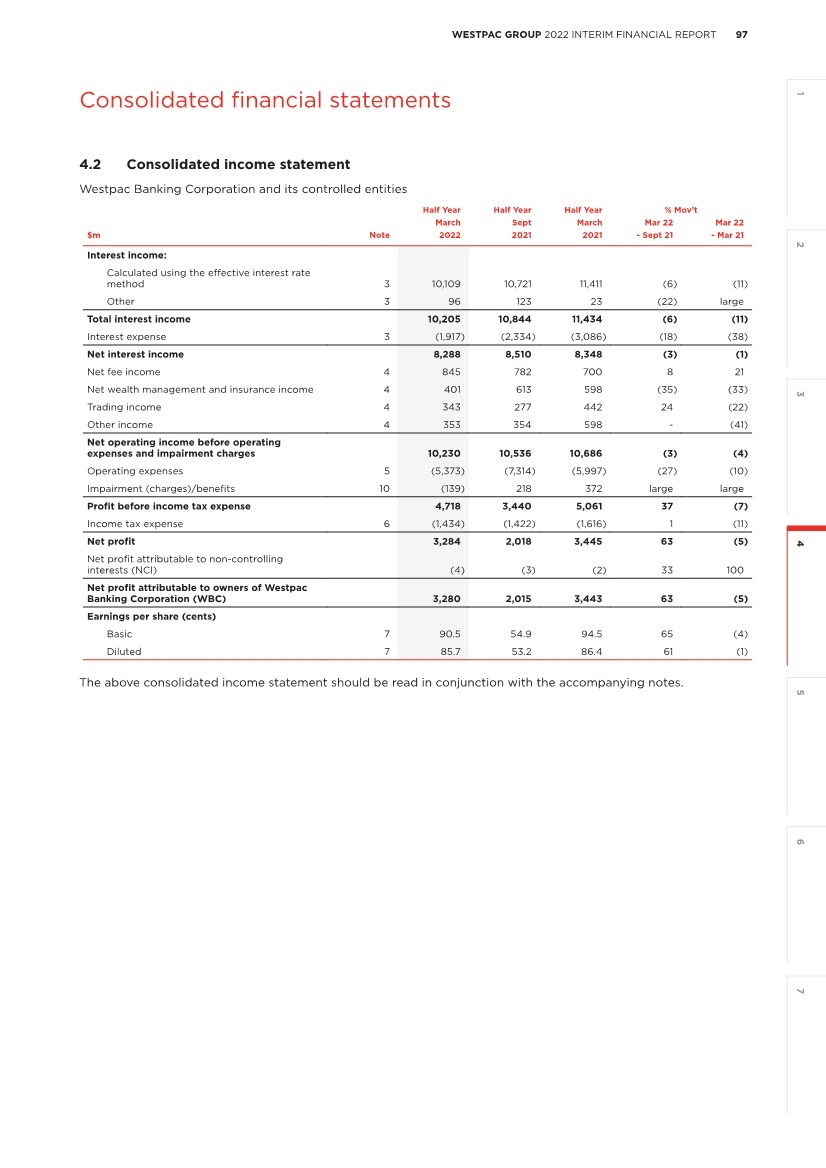
| 98 WESTPAC GROUP 2022 INTERIM FINANCIAL REPORT Consolidated financial statements 4.3 Consolidated statement of comprehensive income Westpac Banking Corporation and its controlled entities Half Year Half Year Half Year % Mov’t March Sept March Mar 22 Mar 22 $m 2022 2021 2021 - Sept 21 - Mar 21 Net profit 3,284 2,018 3,445 63 (5) Other comprehensive income Items that may be reclassified subsequently to profit or loss Gains/(losses) recognised in equity on: Debt securities measured at fair value through other comprehensive income (FVOCI) (140) (72) 650 94 large Cash flow hedging instruments 1,222 175 121 large large Transferred to income statement: Debt securities measured at FVOCI (205) (97) (98) 111 109 Cash flow hedging instruments (10) (33) 72 (70) large Loss allowance on debt securities measured at FVOCI (2) 1 1 large large Exchange differences on translation of foreign operations (net of associated hedges) (166) 261 (210) large (21) Income tax on items taken to or transferred from equity: Debt securities measured at FVOCI 100 49 (168) 104 large Cash flow hedging instruments (359) (41) (56) large large Items that will not be reclassified subsequently to profit or loss Gains/(losses) on equity securities measured at FVOCI (net of tax) 146 4 44 large large Own credit adjustment on financial liabilities designated at fair value (net of tax) 45 (10) - large - Remeasurement of defined benefit obligation recognised in equity (net of tax) 58 (122) 241 large (76) Other comprehensive income (net of tax) 689 115 597 large 15 Total comprehensive income 3,973 2,133 4,042 86 (2) Attributable to: Owners of WBC 3,970 2,128 4,043 87 (2) NCI 3 5 (1) (40) large Total comprehensive income 3,973 2,133 4,042 86 (2) The above consolidated statement of comprehensive income should be read in conjunction with the accompanying notes. |
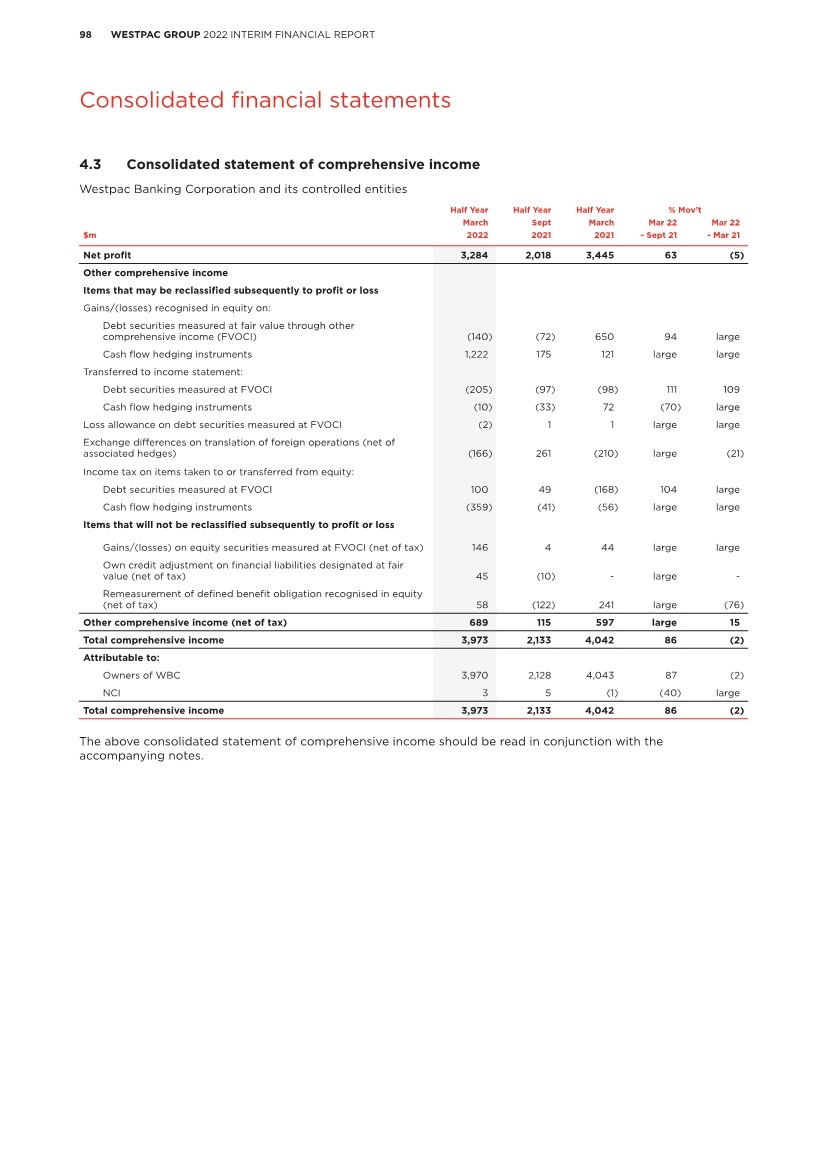
| 99 WESTPAC GROUP 2022 INTERIM FINANCIAL REPORT 2 5 6 7 4 1 3 Consolidated financial statements 4.4 Consolidated balance sheet Westpac Banking Corporation and its controlled entities As at As at As at % Mov’t 31 March 30 Sept 31 March Mar 22 Mar 22 $m Note 2022 2021 2021 - Sept 21 - Mar 21 Assets Cash and balances with central banks 102,410 71,353 33,877 44 large Collateral paid 7,374 4,232 3,917 74 88 Trading securities and financial assets measured at fair value through income statement (FVIS) 23,738 21,101 20,928 12 13 Derivative financial instruments 18,269 19,353 22,373 (6) (18) Investment securities 70,442 83,417 91,303 (16) (23) Loans 9 719,556 709,784 688,218 1 5 Other financial assets 4,896 6,394 3,312 (23) 48 Current tax assets 214 31 221 large (3) Life insurance assets - - 3,416 - (100) Investment in associates 41 58 78 (29) (47) Property and equipment 2,614 2,853 3,337 (8) (22) Deferred tax assets 1,831 2,437 2,352 (25) (22) Intangible assets 10,064 10,109 10,908 - (8) Other assets 600 567 820 6 (27) Assets held for sale 17 2,700 4,188 4,359 (36) (38) Total assets 964,749 935,877 889,419 3 8 Liabilities Collateral received 2,170 2,368 2,504 (8) (13) Deposits and other borrowings 12 645,606 626,955 585,401 3 10 Other financial liabilities 51,345 50,309 42,996 2 19 Derivative financial instruments 25,347 18,059 20,303 40 25 Debt issues 133,629 128,779 127,850 4 5 Current tax liabilities 21 71 26 (70) (19) Life insurance liabilities - - 1,070 - (100) Provisions 14 3,035 3,571 3,820 (15) (21) Deferred tax liabilities 164 90 107 82 53 Other liabilities 3,379 3,679 3,938 (8) (14) Liabilities held for sale 17 684 837 3,049 (18) (78) Total liabilities excluding loan capital 865,380 834,718 791,064 4 9 Loan capital 29,036 29,067 26,294 - 10 Total liabilities 894,416 863,785 817,358 4 9 Net assets 70,333 72,092 72,061 (2) (2) Shareholders’ equity Share capital: Ordinary share capital 15 39,667 41,601 41,604 (5) (5) Treasury shares 15 (651) (606) (603) 7 8 Reserves 15 2,901 2,227 1,954 30 48 Retained profits 28,362 28,813 29,057 (2) (2) Total equity attributable to owners of WBC 70,279 72,035 72,012 (2) (2) NCI 54 57 49 (5) 10 Total shareholders’ equity and NCI 70,333 72,092 72,061 (2) (2) The above consolidated balance sheet should be read in conjunction with the accompanying notes. |
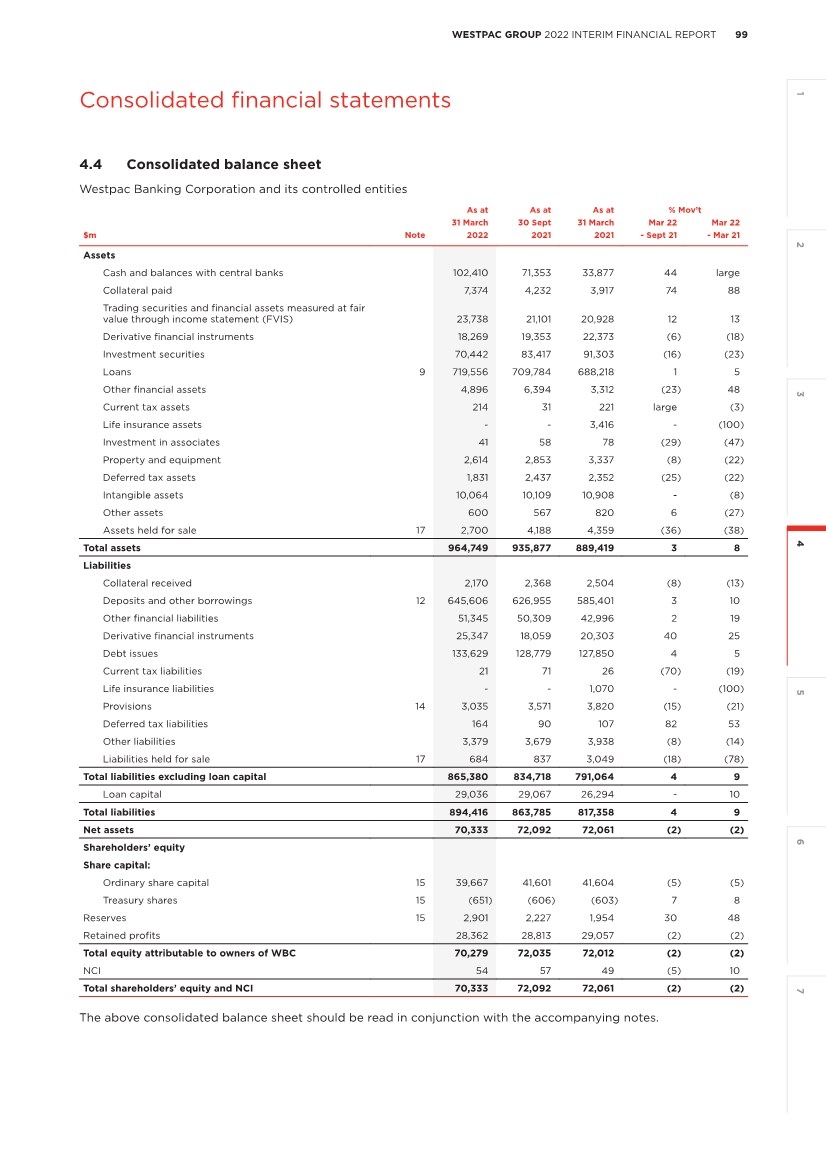
| 100 WESTPAC GROUP 2022 INTERIM FINANCIAL REPORT Consolidated financial statements 4.5 Consolidated statement of changes in equity Westpac Banking Corporation and its controlled entities $m Share capital (Note 15) Reserves (Note 15) Retained profits Total equity attributable to owners of WBC NCI Total shareholders’ equity and NCI Balance as at 30 September 2020 39,946 1,544 26,533 68,023 51 68,074 Impact from a change in accounting policy - - (40) (40) - (40) Restated opening balance 39,946 1,544 26,493 67,983 51 68,034 Net profit - - 3,443 3,443 2 3,445 Net other comprehensive income/(expense) - 359 241 600 (3) 597 Total comprehensive income - 359 3,684 4,043 (1) 4,042 Transactions in capacity as equity holders Dividends on ordinary shares1 - - (1,120) (1,120) - (1,120) Dividend reinvestment plan 401 - - 401 - 401 Dividend reinvestment plan underwrite 719 - - 719 - 719 Other equity movements: Share-based payment arrangements - 59 - 59 - 59 Purchase of shares (25) - - (25) - (25) Net acquisition of treasury shares (40) - - (40) - (40) Other - (8) - (8) (1) (9) Total contributions and distributions 1,055 51 (1,120) (14) (1) (15) Balance as at 31 March 2021 41,001 1,954 29,057 72,012 49 72,061 Net profit - - 2,015 2,015 3 2,018 Net other comprehensive income/(expense) - 245 (132) 113 2 115 Total comprehensive income - 245 1,883 2,128 5 2,133 Transactions in capacity as equity holders Dividends on ordinary shares1 - - (2,127) (2,127) - (2,127) Other equity movements: Share-based payment arrangements - 27 - 27 - 27 Purchase of shares (3) - - (3) - (3) Net acquisition of treasury shares (3) - - (3) - (3) Other - 1 - 1 3 4 Total contributions and distributions (6) 28 (2,127) (2,105) 3 (2,102) Balance as at 30 September 2021 40,995 2,227 28,813 72,035 57 72,092 Net profit - - 3,280 3,280 4 3,284 Net other comprehensive income/(expense) - 587 103 690 (1) 689 Total comprehensive income - 587 3,383 3,970 3 3,973 Transactions in capacity as equity holders: Dividends on ordinary shares1 - - (2,201) (2,201) - (2,201) Other equity movements: Off-market share buy-back2 (1,901) - (1,601) (3,502) - (3,502) Share-based payment arrangements - 60 - 60 - 60 Purchase of shares (33) - - (33) - (33) Net acquisition of treasury shares (45) - - (45) - (45) Other - 27 (32) (5) (6) (11) Total contributions and distributions (1,979) 87 (3,834) (5,726) (6) (5,732) Balance as at 31 March 2022 39,016 2,901 28,362 70,279 54 70,333 The above consolidated statement of changes in equity should be read in conjunction with the accompanying notes. 1. First Half 2022 related to the 2021 final dividend of 60 cents per share ($2,201 million) (Second Half 2021: 2021 interim dividend of 58 cents per share ($2,127 million), First Half 2021: 2020 final dividend of 31 cents per share ($1,120 million)), all fully franked at 30%. 2. On 14 February 2022, the Group announced the successful completion of its $3.5 billion off-market share buy-back of Westpac ordinary shares. 167,464,114 ordinary shares were bought back at $20.90, and comprised a fully franked dividend component of $9.56 per share ($1,601 million) and a capital component of $11.34 per share ($1,901 million including transaction costs). The shares bought back were subsequently cancelled. |
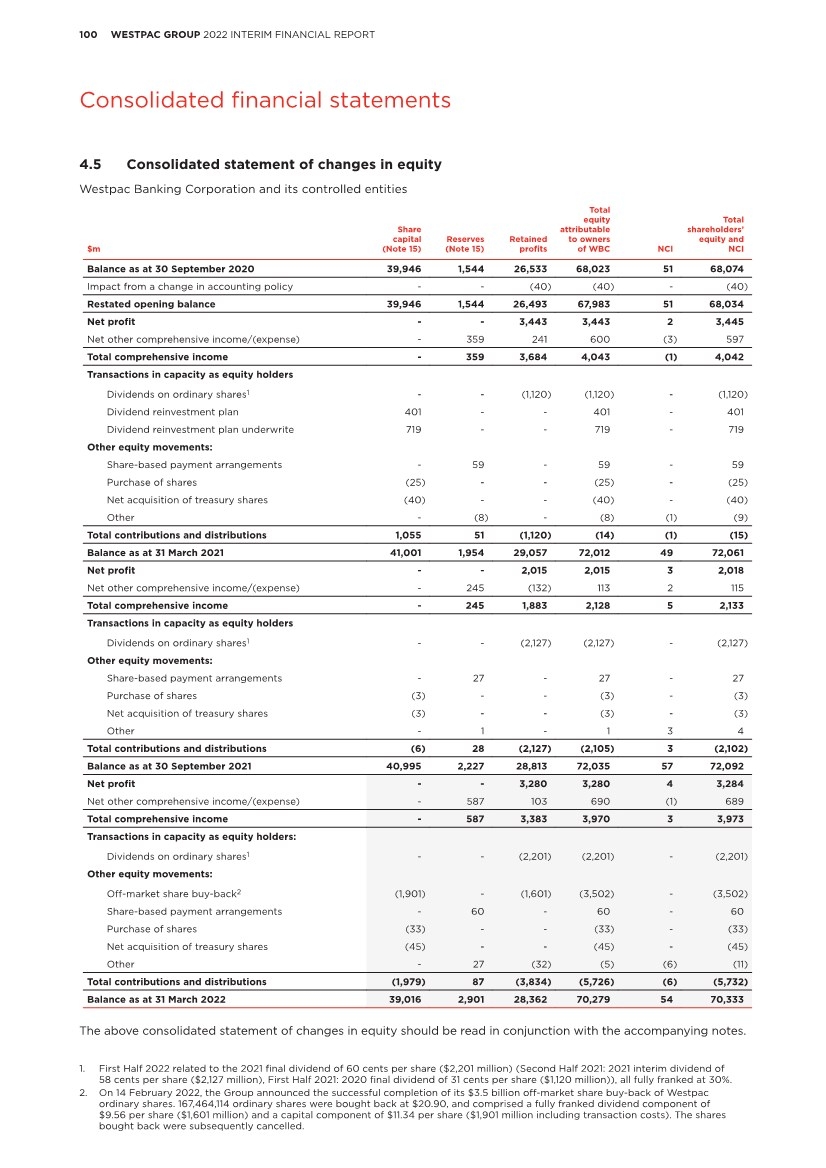
| 101 WESTPAC GROUP 2022 INTERIM FINANCIAL REPORT 2 5 6 7 4 1 3 Consolidated financial statements 4.6 Consolidated cash flow statement Westpac Banking Corporation and its controlled entities Half Year Half Year Half Year % Mov’t March Sept March Mar 22 Mar 22 $m Note 2022 2021 2021 - Sept 21 - Mar 21 Cash flows from operating activities Interest received 10,091 10,840 11,590 (7) (13) Interest paid (1,779) (2,354) (3,323) (24) (46) Dividends received excluding life business 3 2 2 50 50 Other non-interest income received 1,686 1,361 1,979 24 (15) Operating expenses paid (5,139) (4,748) (6,193) 8 (17) Income tax paid excluding life business (1,282) (1,158) (1,481) 11 (13) Life business: Receipts from policyholders and customers 466 510 466 (9) - Interest and other items of similar nature 1 13 9 (92) (89) Dividends received 8 9 3 (11) 167 Payments to policyholders and suppliers (312) (497) (671) (37) (54) Income tax paid (51) - (49) - 4 Cash flows from operating activities before changes in operating assets and liabilities 3,692 3,978 2,332 (7) 58 Net (increase)/decrease in: Collateral paid (3,293) (166) 471 large large Trading securities and financial assets measured at FVIS (2,106) (574) 19,890 large large Derivative financial instruments 3,004 4,610 (7,030) (35) large Loans (12,636) (17,066) 1,968 (26) large Other financial assets 726 (702) 428 large 70 Life insurance assets and liabilities 133 (216) (377) large large Other assets (17) 72 (66) large (74) Net increase/(decrease) in: Collateral received (184) (251) 344 (27) large Deposits and other borrowings 21,758 35,347 (1,610) (38) large Other financial liabilities 1,382 5,268 3,768 (74) (63) Other liabilities 3 (35) 27 large (89) Net cash provided by/(used in) operating activities 16 12,462 30,265 20,145 (59) (38) Cash flows from investing activities Proceeds from investment securities 19,145 16,413 17,653 17 8 Purchase of investment securities (9,837) (7,642) (21,198) 29 (54) Proceeds from disposal of controlled entities and other businesses, net of cash disposed 16 1,388 1,272 - 9 - Purchase of controlled entities (14) - - - - Proceeds from disposal of associates - 36 9 (100) (100) Purchase of associates - (1) (7) (100) (100) Proceeds from disposal of property and equipment 24 42 20 (43) 20 Purchase of property and equipment (69) (131) (103) (47) (33) Purchase of intangible assets (422) (392) (348) 8 21 Net cash provided by/(used in) investing activities 10,215 9,597 (3,974) 6 large Cash flows from financing activities Proceeds from debt issues (net of issue costs) 39,912 22,482 24,317 78 64 Redemption of debt issues (26,785) (25,925) (39,347) 3 (32) Payments for the principal portion of lease liabilities (236) (247) (260) (4) (9) Issue of loan capital (net of issue costs) 3,016 2,169 5,459 39 (45) Redemption of loan capital (1,039) (379) (1,169) 174 (11) Payment for off-market share buy-back (3,502) - - - - Proceeds from dividend reinvestment plan underwrite - - 719 - (100) Purchase of shares relating to share-based payment arrangements (33) (3) (25) large 32 Purchase of Restricted Share Plan (RSP) treasury shares (45) (3) (40) large 13 Payment of dividends (2,201) (2,127) (719) 3 large Payment of dividends to NCI (5) - (2) - 150 Net cash provided by/(used in) financing activities 9,082 (4,033) (11,067) large large Net increase/(decrease) in cash and balances with central banks 31,759 35,829 5,104 (11) large Effect of exchange rate changes on cash and balances with central banks (701) 862 (564) large 24 Net (increase)/decrease in cash and balances with central banks included in assets held for sale 17 (1) 785 (792) large (100) Cash and balances with central banks as at beginning of the period 71,353 33,877 30,129 111 137 Cash and balances with central banks as at end of the period 102,410 71,353 33,877 44 large The above consolidated cash flow statement should be read in conjunction with the accompanying notes. |
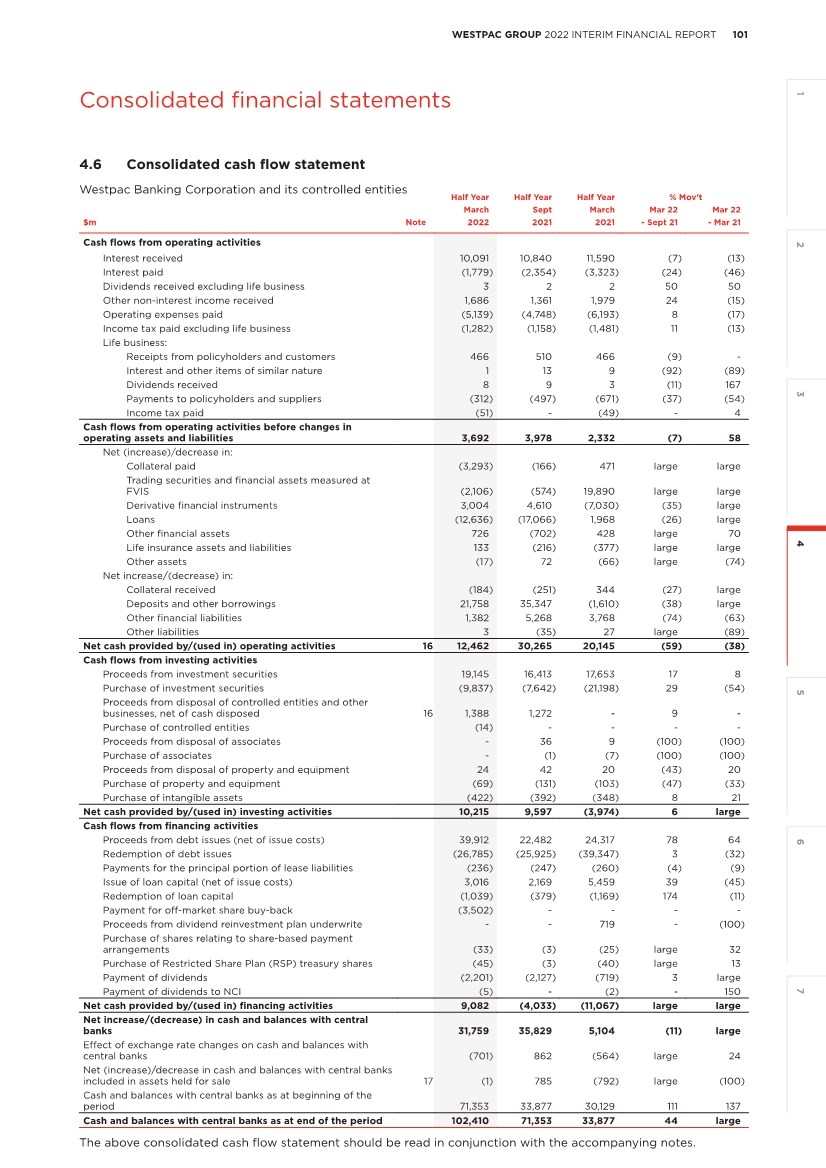
| 102 WESTPAC GROUP 2022 INTERIM FINANCIAL REPORT Notes to the consolidated financial statements 4.7 Notes to the consolidated financial statements Note 1. Financial statements preparation This general purpose Interim Financial Report for the half year ended 31 March 2022 has been prepared in accordance with Australian Accounting Standard AASB 134 Interim Financial Reporting and the Corporations Act 2001 (Cth) and is also compliant with International Accounting Standard IAS 34 Interim Financial Reporting. The Interim Financial Report does not include all the notes of the type normally included in an Annual Financial Report. Accordingly, this Interim Financial Report is to be read in conjunction with the Annual Financial Report for the year ended 30 September 2021 and any relevant public announcements made by Westpac during the interim reporting period in accordance with the continuous disclosure requirements of the Corporations Act 2001 (Cth) and the ASX Listing Rules. The Interim Financial Report complies with current Australian Accounting Standards (AAS) as they relate to interim financial reports. The Interim Financial Report was authorised for issue by the Board of Directors on 8 May 2022. All amounts have been rounded in accordance with ASIC Corporations (Rounding in Financial/Directors’ Reports) Instrument 2016/191, to the nearest million dollars, unless otherwise stated. Accounting policies The accounting policies adopted in the preparation of this Interim Financial Report are consistent with those in the Annual Financial Report for the year ended 30 September 2021. As such, balances as at 31 March 2021 for deferred income tax assets, intangibles, other assets and retained profits has been restated for changes in accounting policy in relation to Software-as-a-Service (refer to Note 1 of the 2021 Annual Report for further details). Critical accounting assumptions and estimates In preparing the Interim Financial Report, the application of the Group’s accounting policies requires the use of judgement, assumptions and estimates. The areas of judgement, assumptions and estimates in the Interim Financial Report, including the key sources of estimation uncertainty, are consistent with those in the Annual Financial Report for the year ended 30 September 2021. Details on specific judgements in relation to the calculation of provisions for ECL including overlays are included in Note 10. Amendments to Accounting Standards effective this period No new accounting standards have been adopted by the Group for the half year ended 31 March 2022. There have been no amendments to existing accounting standards that have had a material impact to the Group. Future developments in accounting standards AASB 17 Insurance Contracts (AASB 17) was issued on 19 July 2017 and will be effective for the 30 September 2024 year end unless early adopted. This will replace AASB 4 Insurance Contracts (AASB 4), AASB 1023 General Insurance Contracts and AASB 1038 Life Insurance Contracts. However, the Group’s remaining insurance businesses are classified as held for sale with the sale transactions expected to complete prior to AASB 17 taking effect. As a result, we do not anticipate the standard having any impact on the Group. Other amendments to existing standards that are not yet effective are not expected to have a material impact to the Group. Interest rate benchmark reform (IBOR) The IBOR reform and the enterprise-wide IBORs Transition Programme the Group has established to manage the impacts of this reform are detailed in Note 21 of the Group’s 2021 Annual Report. A number of IBORs had a 31 December 2021 cessation date. The Group ceased to enter into new contracts referencing these rates and the Group’s existing exposures at 30 September 2021 have either matured or transitioned to an alternative reference rate (ARR) with the exception of a small number of trades with immaterial balances. These remaining balances will be valued using synthetic rates, however no new trades will be entered into referencing these synthetic rates. Certain US LIBOR tenors have not yet transitioned to an ARR as they have a cessation date of 30 June 2023. The Group has monitoring controls in place to assess US LIBOR exposures on a regular basis. These include assessing customers and counterparties for readiness to transition or the inclusion of fallback provisions as well as compliance with an overall Programme objective to transition away from USD LIBOR transactions. In addition, the Group’s exposure to new contracts referencing these rates is limited by regulatory guidelines whereby transactions from 31 December 2021 can only be entered into for risk management purposes. Notes to the consolidated financial statements |
| 103 WESTPAC GROUP 2022 INTERIM FINANCIAL REPORT 2 5 6 7 4 1 3 Notes to the consolidated financial statements Note 2. Segment reporting Operating segments are presented on a basis consistent with information provided internally to Westpac’s key decision makers and reflects the management of the business, rather than the legal structure of the Group. Internally, Westpac uses an adjusted AAS measure of performance referred to as ‘cash earnings’ in assessing the financial performance of its segments. Cash earnings is viewed as a measure of the level of profit that is generated by ongoing operations and is therefore typically considered in assessing distributions, including dividends. Cash earnings is neither a measure of cash flow nor net profit determined on a cash accounting basis, as it includes both cash and non-cash adjustments to statutory net profit. To determine cash earnings, three categories of adjustments are made to statutory results: • Items that key decision makers at Westpac believe do not reflect ongoing operations; • Items that are not typically considered when dividends are recommended, mainly economic hedging impacts; and • Accounting reclassifications between individual line items that do not impact statutory results. Segment restatements On 17 March 2021, Westpac announced that it was bringing together the leadership of its Consumer and Business segments into a new Consumer and Business segment. For the 2022 Interim Financial Report we have updated our reporting and restated comparatives for this change and changes in the allocations of certain revenue and expense items across segments, to align with changes in the information presented internally to key decision makers. The key changes include: • All Australian mortgages (both business and consumer) are now included in the Mortgage line of business (LOB). • Revenue sharing ceased from the sale of certain institutional products (i.e. Foreign exchange and interest rate hedging). This reduces non-interest income across Consumer and Business segments with all income for these products recorded in WIB. • The addition of the share broking business in Consumer from Specialist Businesses. Reportable operating segments We are one of Australia’s leading providers of banking and selected financial services, operating under multiple brands, and predominantly in Australia and New Zealand, with a small presence in Europe, North America and Asia. We operate through a significant online capability supported by an extensive branch and ATM network, call centres and specialist relationship and product managers. Our operations comprise the following key segments: • Consumer and Business Banking: – Consumer provides banking products and services, including mortgages, credit cards, personal loans, and savings and deposit products to Australian retail customers. – Business serves the banking needs of Australian small business, Agribusiness and Commercial customers. • Westpac Institutional Bank (WIB) provides a broad range of financial products and services to corporate, institutional and government customers. • Westpac New Zealand provides banking, wealth and insurance products and services for consumer, business and institutional customers in New Zealand. • Specialist Businesses comprises the operations that Westpac ultimately plans to exit. We have entered into a sales agreement for Westpac Life Insurance which is expected to finalise in 2022 (regulatory approvals have been obtained). Other operations include investment product and services, superannuation and retirement products as well as wealth administration platforms. It also manages Westpac Pacific which provides a full range of banking services in Fiji and Papua New Guinea. • Group Businesses includes support functions such as Treasury, Customer Services and Technology, Corporate Services and Enterprise Services. It also includes Group-wide elimination entries arising on consolidation, centrally raised provisions and other unallocated revenue and expenses. |
| 104 WESTPAC GROUP 2022 INTERIM FINANCIAL REPORT Notes to the consolidated financial statements The tables present the segment results on a cash earnings basis for the Group: $m Consumer Business Consumer and Business Banking Westpac Institutional Bank Westpac New Zealand (A$) Specialist Businesses Group Businesses Group Half Year March 2022 Net interest income 4,377 1,323 5,700 481 1,041 242 564 8,028 Net fee income 265 162 427 302 86 29 1 845 Net wealth management and insurance income 26 - 26 - 39 336 - 401 Trading income - - - 267 25 20 27 339 Other income 33 1 34 19 120 165 8 346 Net operating income before operating expenses and impairment charges 4,701 1,486 6,187 1,069 1,311 792 600 9,959 Operating expenses1 (2,369) (982) (3,351) (577) (534) (584) (320) (5,366) Impairment (charges)/benefits 27 (158) (131) (58) 9 38 3 (139) Profit before income tax expense 2,359 346 2,705 434 786 246 283 4,454 Income tax (expense)/benefit (713) (107) (820) (128) (189) (111) (107) (1,355) Net profit attributable to NCI - - - - - (3) (1) (4) Cash earnings 1,646 239 1,885 306 597 132 175 3,095 Net cash earnings adjustments - - - - 5 - 180 185 Net profit attributable to owners of WBC 1,646 239 1,885 306 602 132 355 3,280 Balance sheet Loans2 465,697 80,949 546,646 73,950 87,361 11,730 (131) 719,556 Deposits and other borrowings2 276,161 134,716 410,877 104,661 75,622 8,362 46,084 645,606 1. Impairment of assets (including goodwill and other intangible assets) were insignificant for all segments except for the following: - Specialist Businesses: First Half 2022: $167 million (Second Half 2021: $52 million, First Half 2021: $89 million); - Westpac Institutional Bank: First Half 2022 $nil (Second Half 2021: $1,156 million, First Half 2021: $36 million). 2. Specialist Businesses excludes balances presented as held for sale (refer to Note 17 for further details). Note 2. Segment reporting (continued) Half Year Sept 2021 Net interest income 4,722 1,451 6,173 458 991 246 377 8,245 Net fee income 232 172 404 312 67 25 (26) 782 Net wealth management and insurance income 25 - 25 - 69 536 (19) 611 Trading income - - - 229 15 18 - 262 Other income 6 2 8 85 5 211 30 339 Net operating income before operating expenses and impairment charges 4,985 1,625 6,610 1,084 1,147 1,036 362 10,239 Operating expenses1 (2,522) (1,165) (3,687) (1,887) (562) (738) (428) (7,302) Impairment (charges)/benefits 82 318 400 (154) (13) (13) (2) 218 Profit before income tax expense 2,545 778 3,323 (957) 572 285 (68) 3,155 Income tax (expense)/benefit (765) (236) (1,001) 126 (167) (235) (60) (1,337) Net profit attributable to NCI - - - - - (5) 2 (3) Cash earnings 1,780 542 2,322 (831) 405 45 (126) 1,815 Net cash earnings adjustments - - - - 1 - 199 200 Net profit attributable to owners of WBC 1,780 542 2,322 (831) 406 45 73 2,015 Balance sheet Loans2 462,699 78,385 541,084 67,749 88,409 12,550 (8) 709,784 Deposits and other borrowings2 266,445 128,550 394,995 99,349 75,756 8,744 48,111 626,955 |
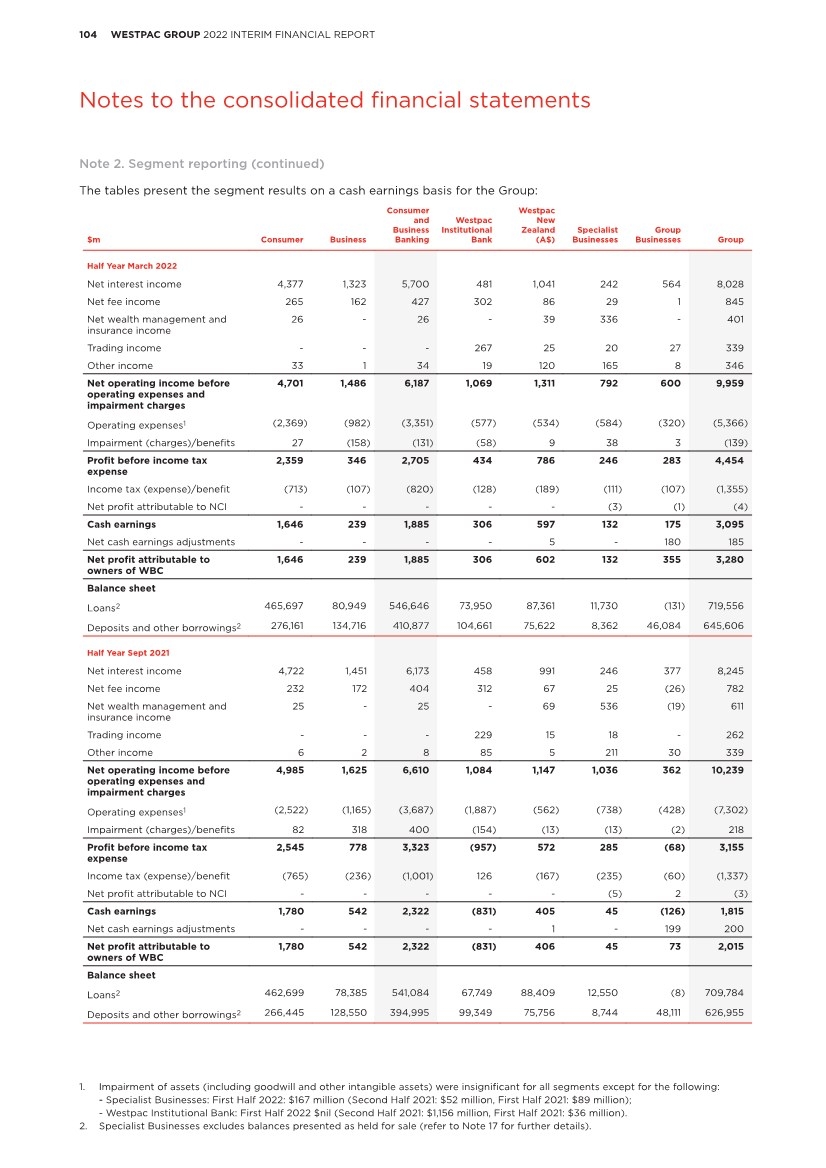
| 105 WESTPAC GROUP 2022 INTERIM FINANCIAL REPORT 2 5 6 7 4 1 3 Notes to the consolidated financial statements $m Consumer Business Consumer and Business Banking Westpac Institutional Bank Westpac New Zealand (A$) Specialist Businesses Group Businesses Group Half Year March 2021 Net interest income 4,764 1,536 6,300 467 996 248 458 8,469 Net fee income 217 173 390 302 73 40 (105) 700 Net wealth management and insurance income 27 - 27 - 44 609 (85) 595 Trading income - - - 379 43 15 16 453 Other income 11 2 13 6 7 1 555 582 Net operating income before operating expenses and impairment charges 5,019 1,711 6,730 1,154 1,163 913 839 10,799 Operating expenses1 (2,376) (1,053) (3,429) (708) (500) (740) (604) (5,981) Impairment (charges)/benefits 102 107 209 (8) 92 79 - 372 Profit before income tax expense 2,745 765 3,510 438 755 252 235 5,190 Income tax (expense)/benefit (818) (230) (1,048) (140) (210) (138) (115) (1,651) Net profit attributable to NCI - - - - - 3 (5) (2) Cash earnings 1,927 535 2,462 298 545 117 115 3,537 Net cash earnings adjustments - - - - (3) - (91) (94) Net profit attributable to owners of WBC 1,927 535 2,462 298 542 117 24 3,443 Balance sheet Loans2 451,595 77,662 529,257 63,125 83,151 12,687 (2) 688,218 Deposits and other borrowings2 254,025 123,654 377,679 92,692 71,019 4,598 39,413 585,401 Reconciliation of cash earnings to reported results Half Year Half Year Half Year % Mov’t March Sept March Mar 22 Mar 22 $m 2022 2021 2021 - Sept 21 - Mar 21 Cash earnings 3,095 1,815 3,537 71 (12) Fair value (gain)/loss on economic hedges 204 184 (46) 11 large Ineffective hedges (19) 16 (48) large (60) Total cash earnings adjustment (post-tax) 185 200 (94) (8) large Net profit attributable to owners of WBC 3,280 2,015 3,443 63 (5) 1. Impairment of assets (including goodwill and other intangible assets) were insignificant for all segments except for the following: - Specialist Businesses: First Half 2022: $167 million (Second Half 2021: $52 million, First Half 2021: $89 million); - Westpac Institutional Bank: First Half 2022 $nil (Second Half 2021: $1,156 million, First Half 2021: $36 million). 2. Specialist Businesses excludes balances presented as held for sale (refer to Note 17 for further details). Note 2. Segment reporting (continued) |
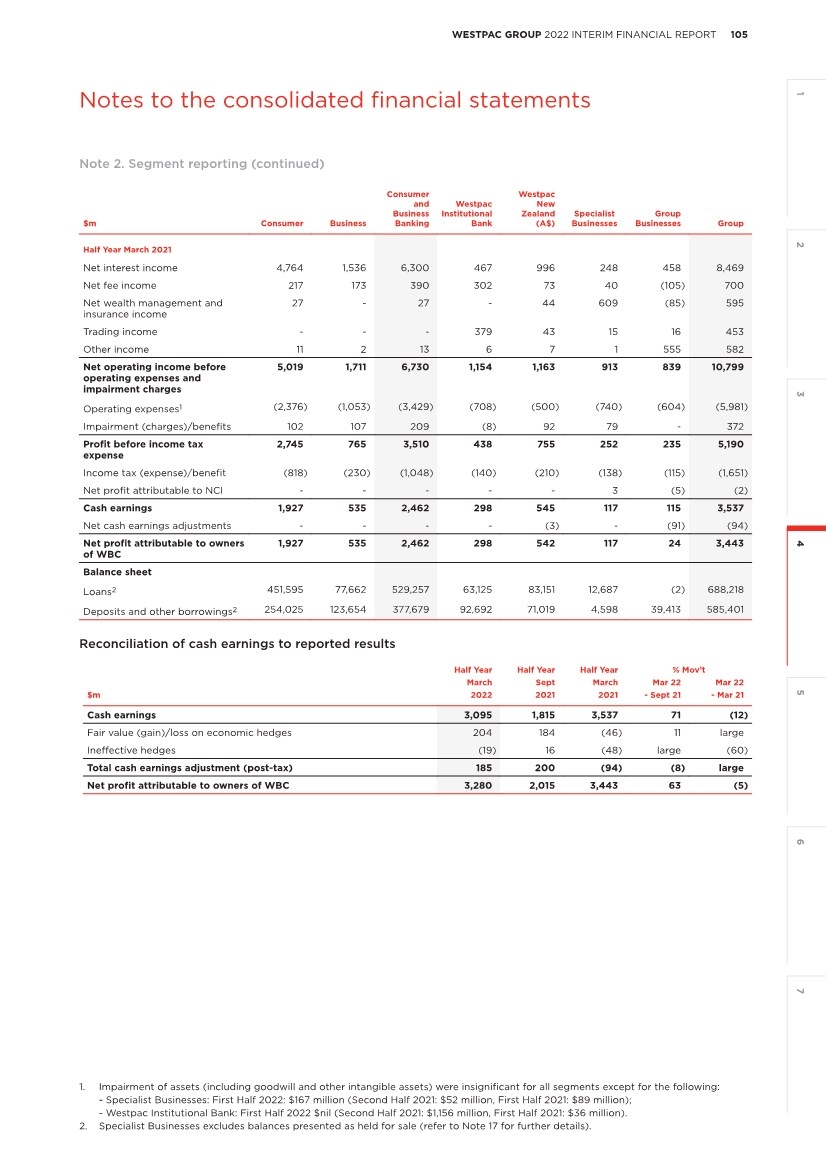
| 106 WESTPAC GROUP 2022 INTERIM FINANCIAL REPORT Notes to the consolidated financial statements Note 3. Net interest income Half Year Half Year Half Year % Mov’t March Sept March Mar 22 Mar 22 $m 2022 2021 2021 - Sept 21 - Mar 21 Interest income1 Calculated using the effective interest rate method Cash and balances with central banks 46 15 15 large large Collateral paid 4 6 10 (33) (60) Investment securities 506 574 626 (12) (19) Loans 9,547 10,063 10,693 (5) (11) Other financial assets - - 2 - (100) Assets held for sale 6 63 65 (90) (91) Total interest income calculated using the effective interest rate method 10,109 10,721 11,411 (6) (11) Other Net ineffectiveness on qualifying hedges (27) 22 (68) large (60) Trading securities and financial assets measured at FVIS and loans 123 101 91 22 35 Assets held for sale - - - - - Total other 96 123 23 (22) large Total interest income 10,205 10,844 11,434 (6) (11) Interest expense Calculated using the effective interest rate method Collateral received (4) (2) (2) 100 100 Deposits and other borrowings (712) (730) (1,071) (2) (34) Debt issues (851) (904) (957) (6) (11) Loan capital (440) (440) (409) - 8 Other financial liabilities (45) (83) (29) (46) 55 Liabilities held for sale - (3) (8) (100) (100) Total interest expense calculated using the effective interest rate method (2,052) (2,162) (2,476) (5) (17) Other Deposits and other borrowings (49) (31) (36) 58 36 Trading liabilities2 452 157 (279) 188 large Debt issues (31) (35) (29) (11) 7 Bank levy (177) (197) (195) (10) (9) Other interest expense (60) (66) (70) (9) (14) Liabilities held for sale - - (1) - (100) Total other 135 (172) (610) large large Total interest expense (1,917) (2,334) (3,086) (18) (38) Net interest income 8,288 8,510 8,348 (3) (1) 1. In First Half 2022, interest income was increased by $9 million in relation to compliance, regulation and remediation costs for provisions no longer required. In Second Half 2021, interest income was reduced by $57 million (First Half 2021: $49 million reduced) for these costs. Refer to Note 14 for further details. 2. Includes net impact of Treasury balance sheet management activities. |
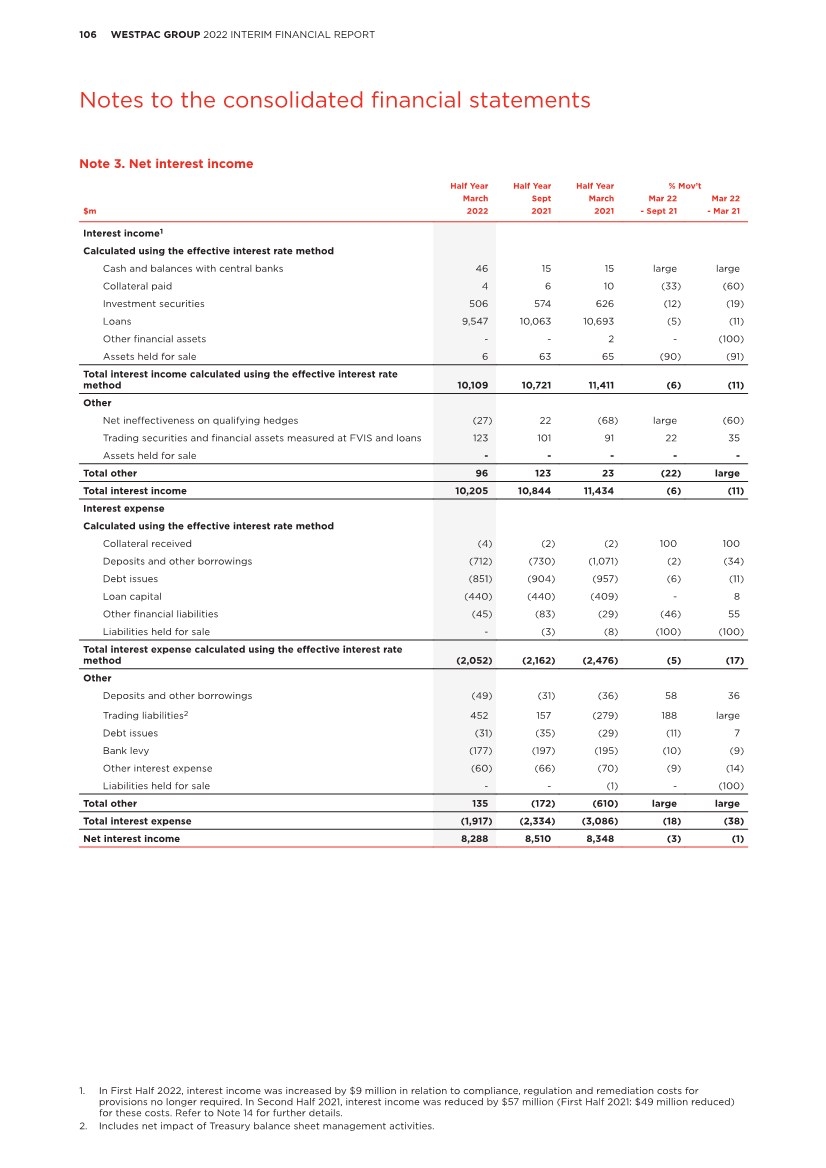
| 107 WESTPAC GROUP 2022 INTERIM FINANCIAL REPORT 2 5 6 7 4 1 3 Notes to the consolidated financial statements Note 4. Non-interest income1 Half Year Half Year Half Year % Mov’t March Sept March Mar 22 Mar 22 $m 2022 2021 2021 - Sept 21 - Mar 21 Net fee income Facility fees 344 348 369 (1) (7) Transaction fees 556 501 492 11 13 Other non-risk fee income 72 47 (47) 53 large Fee income 972 896 814 8 19 Credit card loyalty programs (60) (46) (55) 30 9 Transaction fee related expenses (67) (68) (59) (1) 14 Fee expenses (127) (114) (114) 11 11 Net fee income 845 782 700 8 21 Net wealth management and insurance income Wealth management income 361 346 311 4 16 Life insurance premium income 520 548 529 (5) (2) General insurance and lenders mortgage insurance (LMI) net premium earned - 131 256 (100) (100) Life insurance investment and other income2 (129) 36 23 large large General insurance and LMI investment and other income - 39 37 (100) (100) Total insurance premium, investment and other income 391 754 845 (48) (54) Life insurance claims, changes in life insurance liabilities and other expenses (351) (439) (328) (20) 7 General insurance and LMI claims and other expenses - (48) (230) (100) (100) Total insurance claims, changes in insurance liabilities and other expenses (351) (487) (558) (28) (37) Net wealth management and insurance income 401 613 598 (35) (33) Trading income 343 277 442 24 (22) Other income Dividends received from other entities 3 2 2 50 50 Net gain/(loss) on sale/de-recognition of associates 13 36 7 (64) 86 Net gain/(loss) on disposal of assets (2) (3) 10 (33) large Net gain/(loss) on hedging of overseas operations (1) (2) (6) (50) (83) Net gain/(loss) on derivatives held for risk management purposes3 7 - 4 - 75 Net gain/(loss) on financial instruments measured at fair value 16 75 580 (79) (97) Net gain/(loss) on disposal of controlled entities and other businesses 289 188 - 54 - Rental income on operating leases 9 19 22 (53) (59) Share of associates’ net profit/(loss) (3) (3) (3) - - Other 22 42 (18) (48) large Total other income 353 354 598 - (41) Total non-interest income 1,942 2,026 2,338 (4) (17) 1. Non-interest income included items relating to compliance, regulation and remediation costs recognised as a reduction of non-risk fee income, net wealth management income and other income of $8 million (Second Half 2021: $89 million, First Half 2021: $231 million). Refer to Note 14 for further details. 2. Includes policyholder tax recoveries. 3. Income from derivatives held for risk management purposes reflects the impact of economic hedges on earnings. |
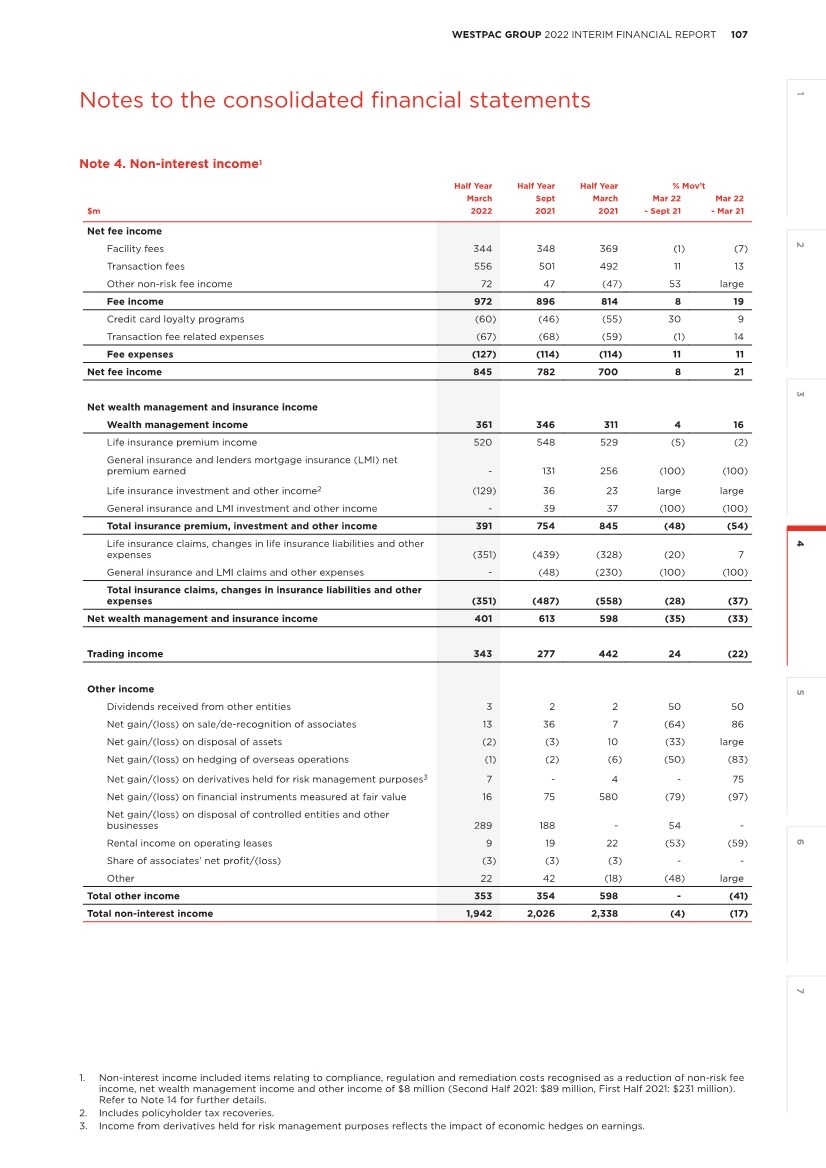
| 108 WESTPAC GROUP 2022 INTERIM FINANCIAL REPORT Notes to the consolidated financial statements Note 5. Operating expenses1 Half Year Half Year Half Year % Mov’t March Sept March Mar 22 Mar 22 $m 2022 2021 2021 - Sept 21 - Mar 21 Staff expenses Employee remuneration, entitlements and on-costs 2,584 2,897 2,472 (11) 5 Superannuation expense 278 244 231 14 20 Share-based payments 46 51 46 (10) - Restructuring costs 74 71 22 4 large Total staff expenses 2,982 3,263 2,771 (9) 8 Occupancy expenses Operating lease rentals 79 91 73 (13) 8 Depreciation and impairment of property and equipment 261 526 429 (50) (39) Other 58 50 57 16 2 Total occupancy expenses 398 667 559 (40) (29) Technology expenses Amortisation and impairment of software assets2 337 723 517 (53) (35) Depreciation and impairment of IT equipment 85 142 118 (40) (28) Technology services 342 422 398 (19) (14) Software maintenance and licences 248 297 234 (16) 6 Telecommunications 72 88 93 (18) (23) Data processing 41 51 45 (20) (9) Total technology expenses 1,125 1,723 1,405 (35) (20) Other expenses Professional and processing services 460 682 728 (33) (37) Amortisation and impairment of intangible assets and deferred expenditure 122 509 90 (76) 36 Postage and stationery 74 82 74 (10) - Advertising 81 104 116 (22) (30) Non-lending losses 45 156 78 (71) (42) Other expenses 86 128 176 (33) (51) Total other expenses 868 1,661 1,262 (48) (31) Total operating expenses 5,373 7,314 5,997 (27) (10) 1. Included in operating expense are costs related to compliance, regulation and remediation of $17 million (Second Half 2021: $161 million; First Half 2021: $198 million). Refer to Note 14 for further details. 2. These balances included impairment of capitalised software assets for First Half 2022 of $54 million (Second Half 2021: $352 million, First Half 2021: $133 million). |
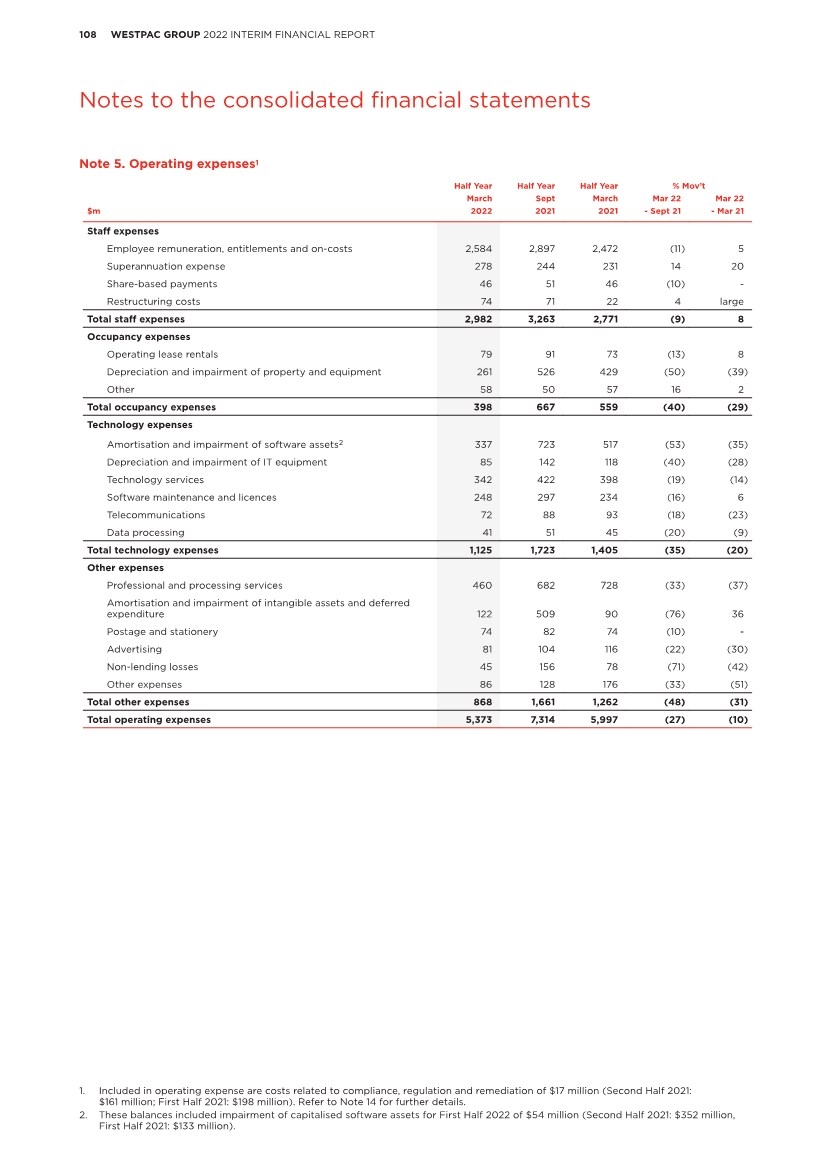
| 109 WESTPAC GROUP 2022 INTERIM FINANCIAL REPORT 2 5 6 7 4 1 3 Notes to the consolidated financial statements Note 6. Income tax The income tax expense is reconciled to the profit before income tax as follows: Half Year Half Year Half Year % Mov’t March Sept March Mar 22 Mar 22 $m 2022 2021 2021 - Sept 21 - Mar 21 Profit before income tax 4,718 3,440 5,061 37 (7) Tax at the Australian company tax rate of 30% 1,415 1,032 1,518 37 (7) The effect of amounts which are not deductible/(assessable) in calculating taxable income: Hybrid capital distributions 28 31 28 (10) - Life insurance: Tax adjustment on policyholder earnings - 1 2 (100) (100) Adjustment for life business tax rates - - - - - Other non-assessable items (34) (4) (2) large large Other non-deductible items 47 176 76 (73) (38) Adjustment for overseas tax rates (15) (6) (10) 150 50 Income tax (over)/under provided in prior periods 7 1 2 large large Other items (14) 191 2 large large Total income tax expense1 1,434 1,422 1,616 1 (11) Effective income tax rate 30.39% 41.34% 31.93% large (154 bps) Note 7. Earnings per share Basic earnings per share (EPS) is calculated by dividing the net profit attributable to shareholders by the weighted average number of ordinary shares on issue during the period, adjusted for treasury shares. Diluted EPS is calculated by adjusting the basic EPS by assuming all dilutive potential ordinary shares are converted. Half Year March 2022 Half Year Sept 2021 Half Year March 2021 Basic Diluted Basic Diluted Basic Diluted Net profit attributable to shareholders ($m) 3,280 3,280 2,015 2,015 3,443 3,443 Adjustment for RSP dividends2 (2) - (1) - (1) - Adjustment for potential dilution: Distributions to convertible loan capital holders3 - 100 - 109 - 109 Adjusted net profit attributable to shareholders 3,278 3,380 2,014 2,124 3,442 3,552 Weighted average number of ordinary shares (millions) Weighted average number of ordinary shares on issue 3,626 3,626 3,669 3,669 3,644 3,644 Treasury shares (including RSP share rights)2 (4) (4) (3) (3) (3) (3) Adjustment for potential dilution: Share-based payments - 3 - 4 - 3 Convertible loan capital3 - 321 - 323 - 468 Adjusted weighted average number of ordinary shares 3,622 3,946 3,666 3,993 3,641 4,112 Earnings per ordinary share (cents) 90.5 85.7 54.9 53.2 94.5 86.4 1. As the Bank levy is not a levy on income, it is not included in income tax. It is included in Note 3. 2. Some shares under the RSP have not vested and are not outstanding ordinary shares but do receive dividends. These RSP dividends are deducted to show the profit attributable to ordinary shareholders. 3. The Group has issued convertible loan capital which may convert into ordinary shares in the future. These convertible loan capital instruments are potentially dilutive instruments, and diluted EPS is therefore calculated as if the instruments had been converted at the beginning of the respective period or, if later, the instruments’ issue date. |
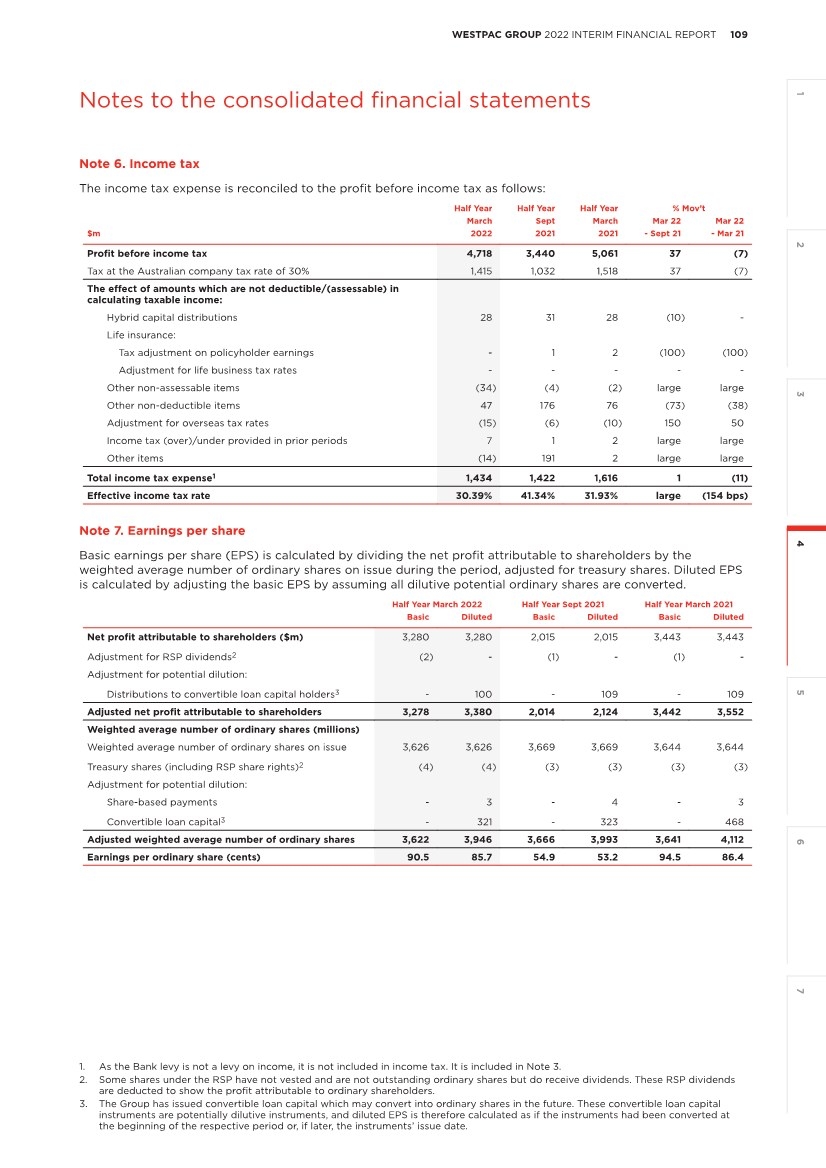
| 110 WESTPAC GROUP 2022 INTERIM FINANCIAL REPORT Notes to the consolidated financial statements Note 8. Average balance sheet and interest rates Half Year March 2022 Half Year Sept 2021 Half Year March 2021 Average Average Average Average Average Average balance Interest rate balance Interest rate balance Interest rate $m $m % $m $m % $m $m % Assets Interest earning assets Collateral paid 6,261 4 0.1 9,762 6 0.1 14,708 10 0.1 Trading securities and financial assets measured at FVIS 22,243 123 1.1 20,428 101 1.0 27,172 91 0.7 Investment securities 77,779 506 1.3 87,790 574 1.3 87,628 626 1.4 Loans and other receivables1 764,946 9,566 2.5 702,821 10,100 2.9 680,286 10,642 3.1 Assets held for sale 846 6 1.4 5,125 63 2.5 3,156 65 4.1 Total interest earning assets and interest income 872,075 10,205 2.3 825,926 10,844 2.6 812,950 11,434 2.8 Non-interest earning assets Derivative financial instruments 18,283 18,740 21,879 Life insurance assets - (3,105) 3,575 Assets held for sale 3,048 7,895 1,267 All other assets2 64,427 61,198 61,760 Total non-interest earning assets 85,758 84,728 88,481 Total assets 957,833 910,654 901,431 Liabilities Interest bearing liabilities Collateral received 4,239 4 0.2 5,891 2 0.1 6,483 2 0.1 Repurchased agreements 35,740 38 0.2 37,106 30 0.2 30,047 26 0.2 Deposits and other borrowings 570,842 761 0.3 537,943 761 0.3 524,723 1,107 0.4 Loan capital 30,504 440 2.9 27,642 440 3.2 25,540 409 3.2 Other interest bearing liabilities3 145,068 674 0.9 133,426 1,098 1.6 141,162 1,533 2.2 Liabilities held for sale - - - 1,338 3 0.4 1,332 9 1.4 Total interest bearing liabilities and interest expense 786,393 1,917 0.5 743,346 2,334 0.6 729,287 3,086 0.8 Non-interest bearing liabilities Deposits and other borrowings 69,413 63,569 60,473 Derivative financial instruments 19,035 17,142 24,101 Life insurance liabilities - (783) 1,295 Liabilities held for sale 775 3,840 1,610 All other liabilities4 11,087 11,383 15,031 Total non-interest bearing liabilities 100,310 95,151 102,510 Total liabilities 886,703 838,497 831,797 Shareholders’ equity 71,073 72,108 69,583 NCI 57 49 51 Total equity 71,130 72,157 69,634 Total liabilities and equity 957,833 910,654 901,431 Loans and other receivables1 Australia 648,399 7,986 2.5 594,388 8,696 2.9 576,394 9,163 3.2 New Zealand 97,814 1,486 3.0 93,882 1,336 2.8 89,570 1,411 3.2 Other overseas 18,733 94 1.0 14,551 68 0.9 14,322 68 1.0 Deposits and other borrowings Australia 489,642 489 0.2 463,114 558 0.2 452,206 842 0.4 New Zealand 61,263 243 0.8 60,482 182 0.6 59,648 236 0.8 Other overseas 19,937 29 0.3 14,347 21 0.3 12,869 29 0.5 1. Loans and other receivables are net of Stage 3 provision for ECL, where interest income is determined based on their carrying value. Stage 1 and 2 provisions for ECL are not included in the average interest earning assets balance, as interest income is determined based on the gross value of loans and other receivables. 2. Includes property and equipment, intangible assets, deferred tax assets, non-interest bearing loans relating to mortgage offset accounts and all other non-interest earning financial assets. 3. Includes net impact of Treasury balance sheet management activities and the Bank Levy. 4. Includes other financial liabilities, provisions, current and deferred tax liabilities and all other non-interest bearing liabilities. |
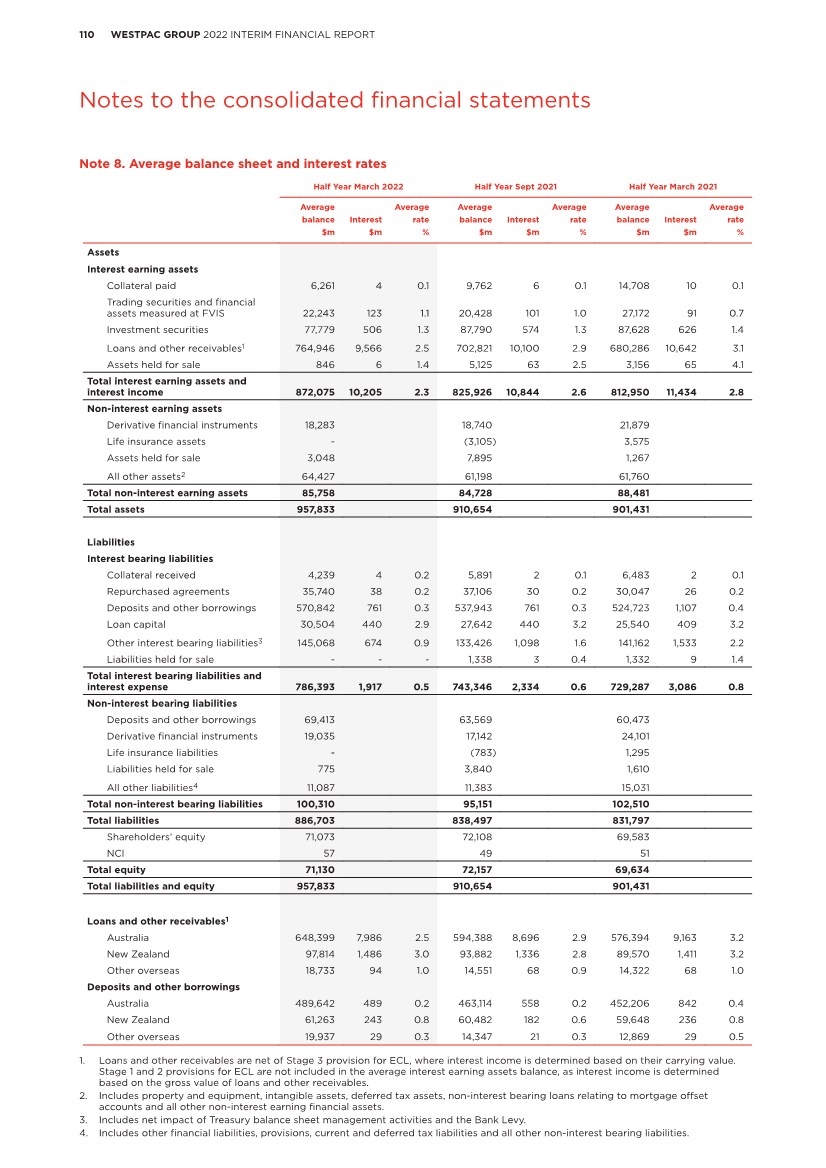
| 111 WESTPAC GROUP 2022 INTERIM FINANCIAL REPORT 2 5 6 7 4 1 3 Notes to the consolidated financial statements Note 9. Loans As at As at As at % Mov’t 31 March 30 Sept 31 March Mar 22 Mar 22 $m 2022 2021 2021 - Sept 21 - Mar 21 Australia Housing 458,278 455,604 443,557 1 3 Personal 14,128 14,737 16,458 (4) (14) Business 156,763 148,453 142,965 6 10 Total Australia 629,169 618,794 602,980 2 4 New Zealand Housing 57,780 58,081 53,530 (1) 8 Personal 1,116 1,175 1,293 (5) (14) Business 29,294 29,991 29,119 (2) 1 Total New Zealand 88,190 89,247 83,942 (1) 5 Total other overseas 6,392 6,332 6,209 1 3 Total loans 723,751 714,373 693,131 1 4 Provision for expected credit losses (ECL) on loans (Note 10) (4,195) (4,589) (4,913) (9) (15) Total net loans1,2 719,556 709,784 688,218 1 5 Note 10. Provision for expected credit losses Loans and credit commitments The following table shows the provision for ECL on loans and credit commitments by stage: As at As at As at % Mov’t 31 March 30 Sept 31 March Mar 22 Mar 22 $m 2022 2021 2021 - Sept 21 - Mar 21 Performing - Stage 1 1,078 936 1,022 15 5 Performing - Stage 2 2,107 2,091 2,568 1 (18) Non-performing - Stage 3 1,490 1,972 1,892 (24) (21) Total provisions for ECL on loans and credit commitments 4,675 4,999 5,482 (6) (15) Presented as: Provision for ECL on loans (Note 9) 4,195 4,589 4,913 (9) (15) Provision for ECL on loans included in assets held for sale (Note 17) - 7 85 (100) (100) Provision for ECL on credit commitments (Note 14) 480 401 477 20 1 Provision for ECL on credit commitments included in liabilities held for sale (Note 17) - 2 7 (100) (100) Total provisions for ECL on loans and credit commitments 4,675 4,999 5,482 (6) (15) Of which: Individually assessed provisions 501 832 564 (40) (11) Collectively assessed provisions 4,174 4,167 4,918 - (15) Total provisions for ECL on loans and credit commitments 4,675 4,999 5,482 (6) (15) Gross loans and credit commitments 924,937 915,486 893,738 1 3 Coverage ratio on loans (%) 0.58% 0.64% 0.72% (6 bps) (14 bps) Coverage ratio on loans and credit commitments (%) 0.51% 0.55% 0.61% (4 bps) (10 bps) Movement in provisions for ECL on loans and credit commitments The reconciliation of the provision for ECL tables for loans and credit commitments has been determined by an aggregation of monthly movements over the year. The key line items in the reconciliation represent the following: • “Transfers between stages” lines represent transfers between Stage 1, Stage 2 and Stage 3 prior to remeasurement of the provision for ECL; 1. Total net loans included securitised loans of $4,808 million as at 31 March 2022 (30 September 2021: $4,829 million, 31 March 2021: $6,144 million). The level of securitised loans excludes loans where Westpac is the holder of related debt securities. 2. Total net loans included assets pledged for the covered bond programs of $35,052 million as at 31 March 2022 (30 September 2021: $26,921 million, 31 March 2021: $33,841 million). |
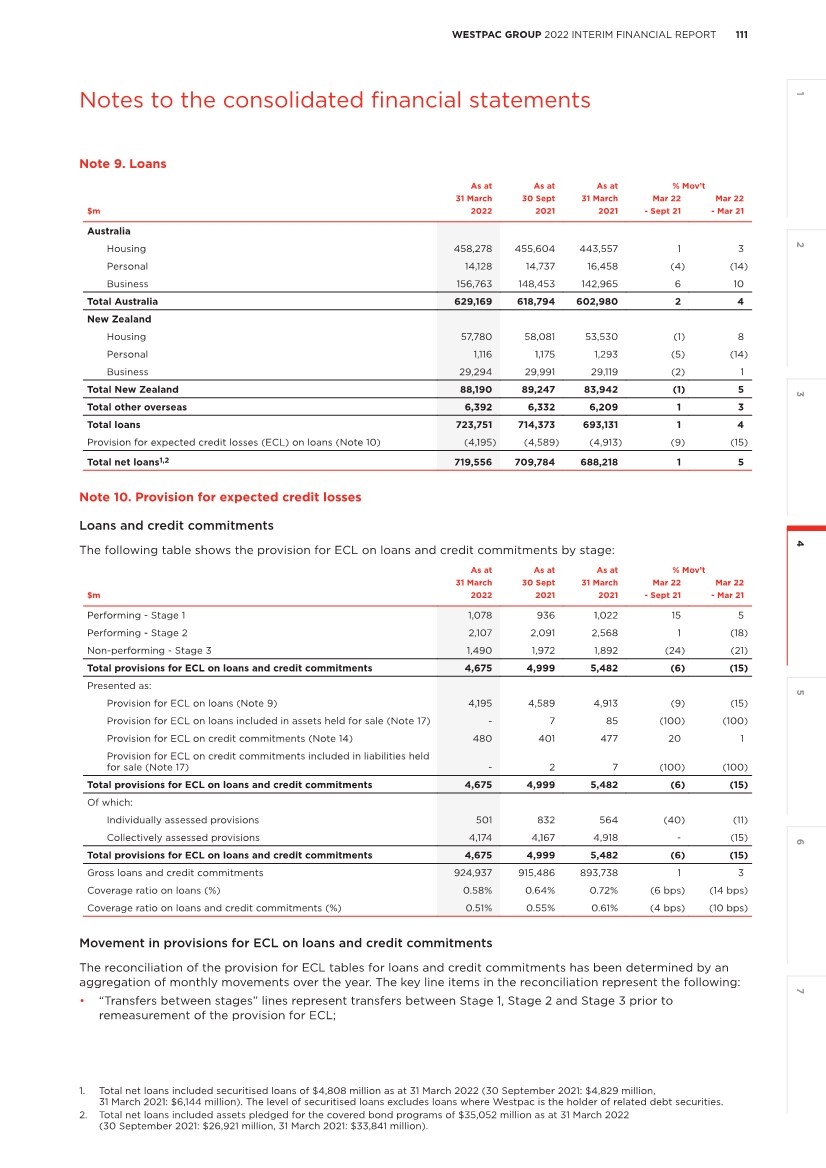
| 112 WESTPAC GROUP 2022 INTERIM FINANCIAL REPORT Notes to the consolidated financial statements • “Business activity during the year” line represents new accounts originated during the year net of those that were de-recognised due to final repayments during the year; • “Net remeasurement of provision for ECL” line represents the impact on the provision for ECL due to changes in credit quality during the year (including transfers between stages), changes in portfolio overlays, changes due to forward-looking economic scenarios and partial repayments and additional draw-downs on existing facilities over the year; and • “Write-offs” represent a reduction in the provision for ECL as a result of de-recognition of exposures where there is no reasonable expectation of full recovery. Consolidated Performing Non- performing $m Stage 1 Stage 2 Stage 3 Total Balance as at 30 September 2020 1,084 2,875 2,173 6,132 Transfers to Stage 1 695 (662) (33) - Transfers to Stage 2 (112) 719 (607) - Transfers to Stage 3 (3) (244) 247 - Business activity during the period 52 (107) (171) (226) Net remeasurement of provision for ECL (689) (8) 688 (9) Write-offs - - (431) (431) Exchange rate and other adjustments (5) (5) 26 16 Balance as at 31 March 2021 1,022 2,568 1,892 5,482 Transfers to Stage 1 551 (466) (85) - Transfers to Stage 2 (88) 571 (483) - Transfers to Stage 3 (5) (263) 268 - Business activity during the period 70 (116) (172) (218) Net remeasurement of provision for ECL (595) (192) 915 128 Write-offs - - (405) (405) Exchange rate and other adjustments (19) (11) 42 12 Balance as at 30 September 2021 936 2,091 1,972 4,999 Transfers to Stage 1 461 (398) (63) - Transfers to Stage 2 (102) 509 (407) - Transfers to Stage 3 (8) (198) 206 - Business activity during the period 255 (149) (200) (94) Net remeasurement of provision for ECL (463) 264 535 336 Write-offs - - (566) (566) Exchange rate and other adjustments (1) (12) 13 - Balance as at 31 March 2022 1,078 2,107 1,490 4,675 The following table provides further details of the provision for ECL by class and stage: Performing Non- performing $m Stage 1 Stage 2 Stage 3 Total Housing 180 704 830 1,714 Personal 184 331 208 723 Business 658 1,533 854 3,045 Balance as at 31 March 2021 1,022 2,568 1,892 5,482 Housing 160 741 607 1,508 Personal 153 355 174 682 Business 623 995 1,191 2,809 Balance as at 30 September 2021 936 2,091 1,972 4,999 Housing 264 680 498 1,442 Personal 124 315 150 589 Business 690 1,112 842 2,644 Balance as at 31 March 2022 1,078 2,107 1,490 4,675 Note 10. Provision for expected credit losses (continued) |
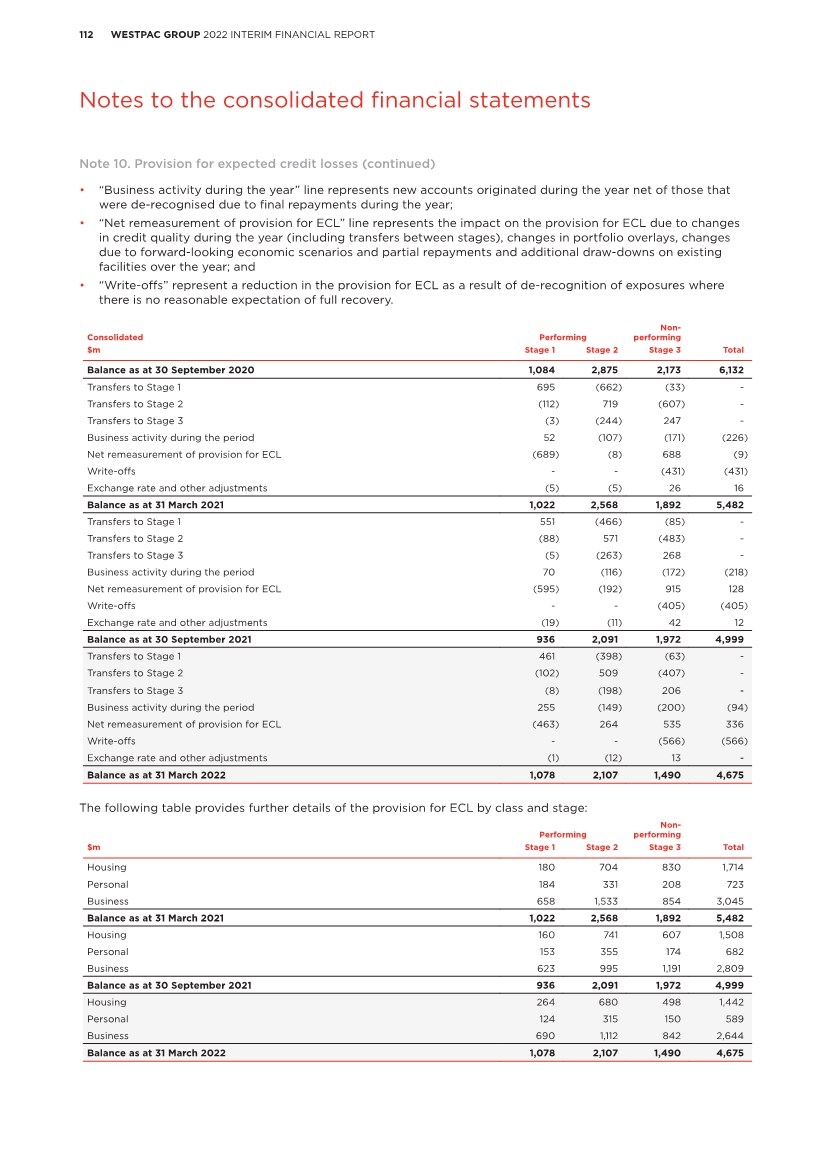
| 113 WESTPAC GROUP 2022 INTERIM FINANCIAL REPORT 2 5 6 7 4 1 3 Notes to the consolidated financial statements Impact of overlays on the provision for ECL The following table attributes the provision for ECL between modelled ECL and portfolio overlays. Portfolio overlays are used to capture risk of increased uncertainty relating to forward-looking economic conditions , or areas of potential risk and uncertainty in the portfolio, that are not captured in the underlying modelled ECL. As at As at As at 31 March 30 Sept 31 March $m 2022 2021 2021 Modelled provision for ECL 3,539 4,352 4,580 Overlays 1,136 647 902 Total provision for ECL 4,675 4,999 5,482 Details of changes related to forward-looking economic inputs and portfolio overlays, based on reasonable and supportable information up to the date of this report, are provided below. Modelled provision for ECL The modelled provision for ECL is a probability weighted estimate based on three scenarios which together represent the Group’s view of the forward-looking distribution of potential loss outcomes. The change in provisions as a result of changes in modelled ECL are reflected through the “net remeasurement of provision for ECL” line. Portfolio overlays are used to capture potential risk and uncertainty in the portfolio, that are not captured in the underlying modelled ECL. The base case scenario uses Westpac Economics forecasts which estimates a rebound in the economy as it emerges from COVID-19 restrictions. Westpac Economics forecasts used for the different reporting periods are as follows: Key economic assumptions for base case scenario 31 March 20221 30 September 2021 31 March 2021 Annual GDP Forecast growth of 5.5% for calendar year 2022 and 2.7% for calendar year 2023 Forecast growth of 0.1% for calendar year 2021 and 7.4% for calendar year 2022 Forecast growth of 4% for calendar year 2021 and 3% for calendar year 2022. Commercial property index Forecast price contraction of 3.1% for calendar year 2022 and growth of 2.1% for calendar year 2023 Forecast price contraction of 0.7% for calendar year 2021 and 4.7% for calendar year 2022 Forecast price contraction of 15% for calendar year 2021. Residential property prices Forecast price appreciation of 1.6% for calendar year 2022 and contraction of 7.0% for calendar year 2023 Forecast price appreciation of 11.8% for calendar year 2021 and 5.0% for calendar year 2022 Forecast annualised price growth of 10% for both calendar years 2021 and 2022. Cash rate Forecast to increase to 50bps by December 2022 and then to 150bps by December 2023 Forecast to remain at 10bps over calendar years 2021 and 2022 Forecast to remain at 10 bps over calendar years 2021 and 2022. Unemployment rate: Australia Forecast rate of 3.8% at December 2022 and 3.9% at December 2023 Forecast rate of 5.4% at December 2021 and 4% at December 2022 Forecast rate of 6% at December 2021. New Zealand Forecast rate of 3.0% at December 2022 and 3.3% at December 2023 Forecast rate of 4.2% at December 2021 and 3.5% at December 2022 Forecast rate of 4.9% at December 2021. The downside scenario is a more severe scenario with expected credit losses higher than the base case. The more severe loss outcome for the downside is generated under a recession in which the combination of negative GDP growth, declines in commercial and residential property prices and an increase in the unemployment rate simultaneously impact expected credit losses across all portfolios from the reporting date. The assumptions in this scenario and relativities to the base case will be monitored having regard to the emerging economic conditions and updated where necessary. The upside scenario represents a modest improvement to the base case. 1. The ECL at 31 March 2022 has been calculated using Westpac Economic forecasts at 21 February 2022. Westpac has monitored subsequent updates from this date, noting revised cash rate forecasts of 2% for December 2023 and 2024. These updates have not resulted in a significant change to the modelled ECL. Note 10. Provision for expected credit losses (continued) |
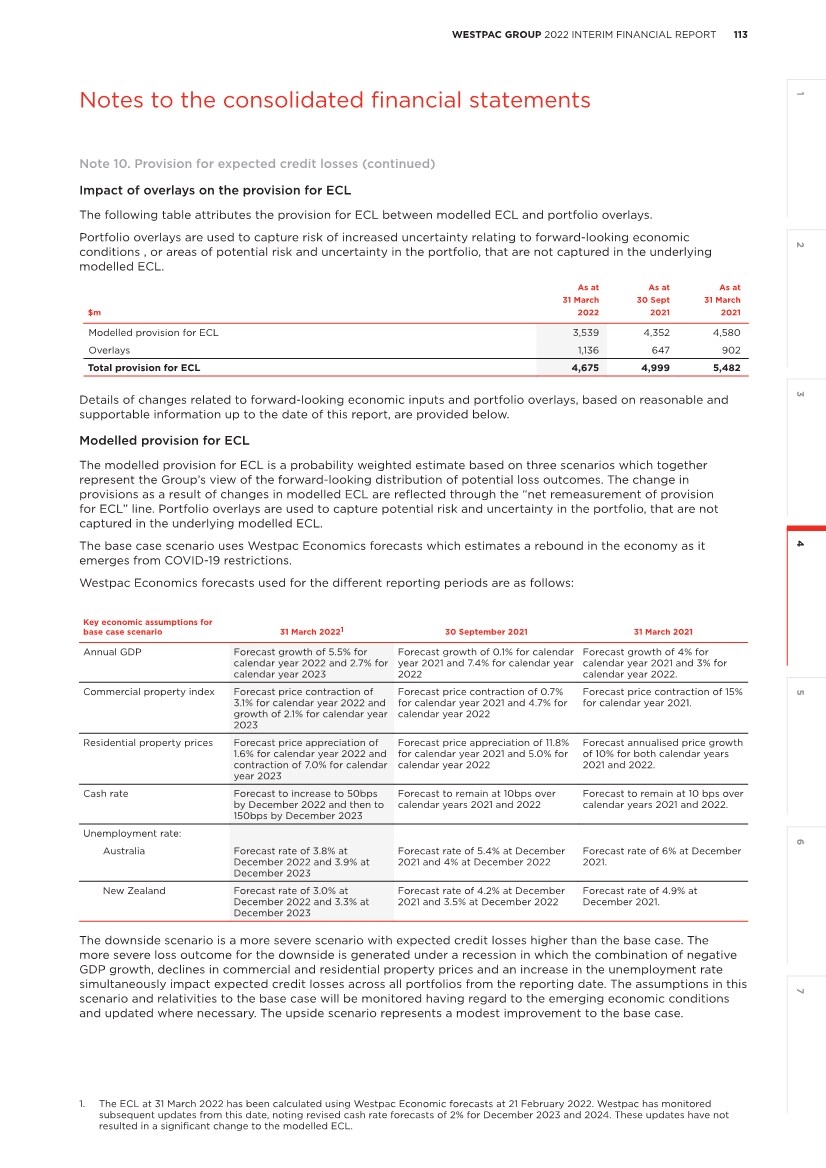
| 114 WESTPAC GROUP 2022 INTERIM FINANCIAL REPORT Notes to the consolidated financial statements The following sensitivity table shows the reported provision for ECL based on the probability weighted scenarios and what the provisions for ECL would be assuming a 100% weighting to the base case scenario and to the downside scenario (with all other assumptions, held constant). As at As at As at 31 March 30 Sept 31 March $m 2022 2021 2021 Reported probability-weighted ECL 4,675 4,999 5,482 100% base case ECL 2,993 3,411 3,902 100% downside ECL 6,752 7,399 7,865 If 1% of the Stage 1 gross exposure from loans and credit commitments (calculated on a 12 month ECL) was reflected in Stage 2 (calculated on a lifetime ECL) the provision for ECL would increase by $205 million (30 September 2021: $252 million, 31 March 2021: $244 million) for the Group based on applying the average provision coverage ratios by stage to the movement in the gross exposure by stage. The following table indicates the economic weights applied by the Group at 31 March 2022, 30 September 2021 and 31 March 2021: As at As at As at 31 March 30 Sept 31 March Economic scenario weightings (%) 2022 2021 2021 Upside 5 5 5 Base 50 55 55 Downside 45 40 40 The increase in weighting to the downside reflects an elevated level of uncertainty in potential credit losses driven by new geopolitical and economic headwinds, supply chain disruptions, capacity constraints and rising inflation. Portfolio overlays Portfolio overlays are used to address areas of risk, including significant uncertainties that are not captured in the underlying modelled ECL. Determination of portfolio overlays requires expert judgement and is thoroughly documented and subject to comprehensive internal governance and oversight. Overlays are continually reassessed and if the risk is judged to have changed (increased or decreased), or is subsequently captured in the modelled ECL, the overlay will be released or remeasured. Portfolio overlays were increased by $489 million due to additional uncertainty arising from the current geopolitical and economic environment and the recent flooding events in Queensland and New South Wales. The Group’s total overlays at 31 March 2022 were $1,136 million (30 September 2021: $647 million; 31 March 2021: $902 million) and comprises: • $549 million relating to COVID-19 impacts, primarily relating to the risk of an expected emergence of losses as conditions continue to normalise (30 September 2021: $557 million; 31 March 2021: $827 million); • $247 million overlay relating to certain industries reflecting expected impacts primarily due to supply chain disruptions and labour shortages (nil at 30 September 2021 and 31 March 2021); • $270 million overlay for consumers reflecting serviceability concerns from the expected economic environment, including the potential for falling house prices and other inflationary pressures ($90 million at 30 September 2021 and $7 million 31 March 2021); and • $70 million for extreme weather events reflecting the expected impact on customers of recent flooding in Queensland and New South Wales (30 September 2021: nil; 31 March 2021: $68 million relating to the impact of drought conditions). The change in provisions as a result of changes in portfolio overlays are reflected through the “net remeasurement of provision for ECL” line in Movement in provisions for ECL table. Note 10. Provision for expected credit losses (continued) |

| 115 WESTPAC GROUP 2022 INTERIM FINANCIAL REPORT 2 5 6 7 4 1 3 Notes to the consolidated financial statements Reconciliation of impairment charges Half Year Half Year Half Year March Sept March $m 2022 2021 2021 Loans and credit commitments: Business activity during the period (94) (218) (226) Net remeasurement of the provision for ECL 336 128 (9) Impairment charges for debt securities at amortised cost 1 (19) (6) Impairment charges for debt securities at FVOCI (2) 1 1 Recoveries (102) (110) (132) Impairment charges/(benefits) 139 (218) (372) Note 11. Credit quality Credit risk ratings system The principal objective of the credit risk rating system is to reliably assess the credit risk to which the Group is exposed. The Group has two main approaches to this assessment. Transaction-managed customers Transaction managed customers are generally customers with business lending exposures. They are individually assigned a Customer Risk Grade (CRG), corresponding to their expected probability of default (PD). Each facility is assigned a loss given default (LGD). The Group’s risk rating system has a tiered scale of risk grades for both non-defaulted customers and defaulted customers. Non-defaulted CRGs are mapped to Moody’s and S&P Global Ratings (S&P) external senior unsecured ratings. The table below shows Westpac’s high level CRGs for transaction-managed portfolios mapped to the Group’s credit quality disclosure categories and to their corresponding external rating. Transaction-managed Financial statement disclosure Westpac CRG Moody’s Rating S&P Rating Strong A Aaa – Aa3 AAA – AA– B A1 – A3 A+ – A– C Baa1 – Baa3 BBB+ – BBB– Good/satisfactory D Ba1 – B1 BB+ – B+ Westpac Rating Weak E Watch list F Special Mention Weak/default/non-performing G Substandard/Default H Default Note 10. Provision for expected credit losses (continued) |
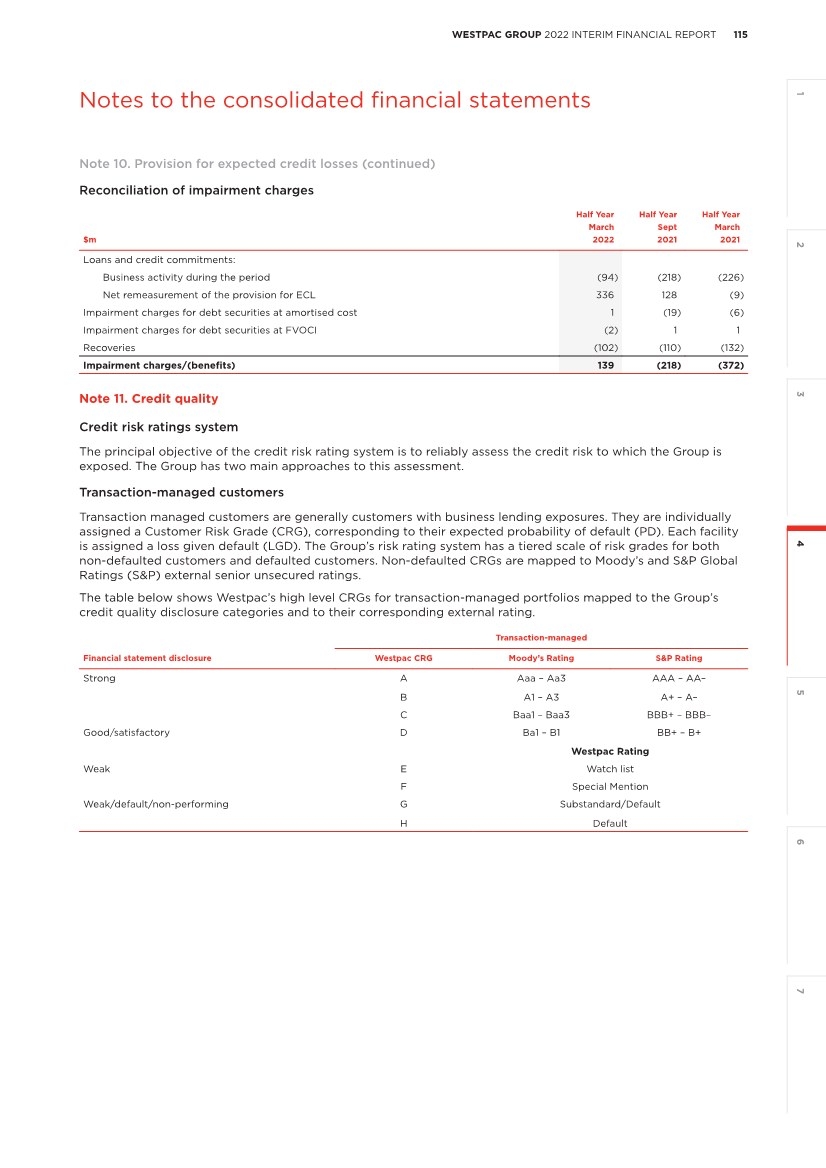
| 116 WESTPAC GROUP 2022 INTERIM FINANCIAL REPORT Notes to the consolidated financial statements Note 11. Credit quality (continued) Program-managed portfolio The program-managed portfolio generally includes retail products including mortgages, personal lending (including credit cards) as well as SME lending. These customers are grouped into pools of similar risk. Pools are created by analysing similar risk characteristics that have historically predicted that an account is likely to go into default. Customers grouped according to these predictive characteristics are assigned a PD and LGD relative to their pool. The credit quality of these pools is based on a combination of behavioural factors, delinquency trends, PD estimates and loan to valuation ratio (housing loans only). The following table shows the credit quality of loans and undrawn credit commitments. As at 31 March 2022 As at 30 Sept 21 As at 31 March 2021 $m Stage 1 Stage 2 Stage 3 Total Stage 1 Stage 2 Stage 3 Total Stage 1 Stage 2 Stage 3 Total Loans - housing Strong 401,201 24,367 - 425,568 398,043 21,165 - 419,208 394,406 6,679 - 401,085 Good/satisfactory 48,746 24,248 - 72,994 55,631 17,851 - 73,482 62,371 14,499 - 76,870 Weak 2,057 11,216 4,568 17,841 3,245 12,659 5,461 21,365 4,509 8,912 5,722 19,143 Total loans - housing 452,004 59,831 4,568 516,403 456,919 51,675 5,461 514,055 461,286 30,090 5,722 497,098 Loans - personal Strong 4,890 84 - 4,974 4,608 69 - 4,677 5,020 105 - 5,125 Good/satisfactory 8,092 1,113 - 9,205 8,780 1,327 - 10,107 10,188 1,034 - 11,222 Weak 288 530 253 1,071 310 539 286 1,135 464 606 334 1,404 Total loans - personal 13,270 1,727 253 15,250 13,698 1,935 286 15,919 15,672 1,745 334 17,751 Loans - business Strong 76,014 784 - 76,798 71,336 446 - 71,782 62,004 1,947 - 63,951 Good/satisfactory 94,954 13,197 - 108,151 93,457 10,674 - 104,131 91,049 13,761 - 104,810 Weak 185 3,897 3,067 7,149 175 4,562 3,749 8,486 188 6,544 2,789 9,521 Total loans - business 171,153 17,878 3,067 192,098 164,968 15,682 3,749 184,399 153,241 22,252 2,789 178,282 Held for sale loans Strong - - - - 180 - - 180 48 5 - 53 Good/satisfactory - - - - 786 56 - 842 1,229 243 - 1,472 Weak - - - - - - - - 12 266 101 379 Total held for sale loans - - - - 966 56 - 1,022 1,289 514 101 1,904 Undrawn credit commitments1 Strong 154,459 2,590 - 157,049 153,712 1,546 - 155,258 150,965 2,741 - 153,706 Good/satisfactory 37,519 5,369 - 42,888 38,377 5,119 - 43,496 38,891 4,484 - 43,375 Weak 116 812 321 1,249 130 933 274 1,337 133 1,253 236 1,622 Total undrawn credit commitments 192,094 8,771 321 201,186 192,219 7,598 274 200,091 189,989 8,478 236 198,703 Total strong 636,564 27,825 - 664,389 627,879 23,226 - 651,105 612,443 11,477 - 623,920 Total good/ satisfactory 189,311 43,927 - 233,238 197,031 35,027 - 232,058 203,728 34,021 - 237,749 Total weak 2,646 16,455 8,209 27,310 3,860 18,693 9,770 32,323 5,306 17,581 9,182 32,069 Total loans and undrawn credit commitments 828,521 88,207 8,209 924,937 828,770 76,946 9,770 915,486 821,477 63,079 9,182 893,738 1. Includes credit commitments on held for sale assets of nil as at 31 March 2022 (30 September 2021: $828 million, 31 March 2021: $439 million). |
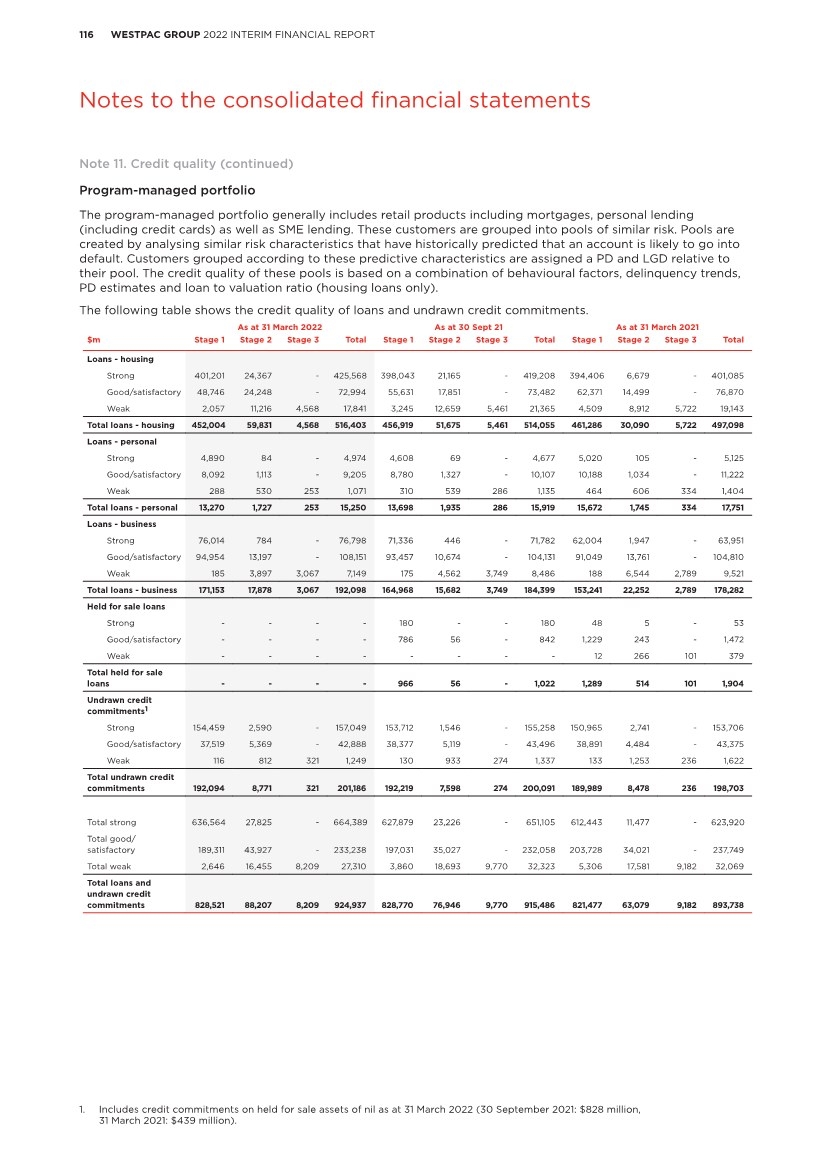
| 117 WESTPAC GROUP 2022 INTERIM FINANCIAL REPORT 2 5 6 7 4 1 3 Notes to the consolidated financial statements As at As at As at % Mov’t 31 March 30 Sept 31 March Mar 22 Mar 22 $m 2022 2021 2021 - Sept 21 - Mar 21 Australia Certificates of deposit 27,048 31,506 26,273 (14) 3 Non-interest bearing, repayable at call 54,829 52,819 49,467 4 11 Other interest bearing at call 361,609 345,416 315,218 5 15 Other interest bearing term 104,865 102,775 110,470 2 (5) Total Australia 548,351 532,516 501,428 3 9 New Zealand Certificates of deposit 2,783 3,293 3,020 (15) (8) Non-interest bearing, repayable at call 14,706 14,066 12,588 5 17 Other interest bearing at call 30,188 31,354 29,022 (4) 4 Other interest bearing term 27,945 27,042 26,389 3 6 Total New Zealand 75,622 75,755 71,019 - 6 Other overseas Certificates of deposit 14,903 11,839 7,859 26 90 Non-interest bearing, repayable at call 1,008 919 - 10 - Other interest bearing at call 1,696 1,751 753 (3) 125 Other interest bearing term 4,026 4,175 4,342 (4) (7) Total other overseas 21,633 18,684 12,954 16 67 Total deposits and other borrowings 645,606 626,955 585,401 3 10 Note 12. Deposits and other borrowings1 1. Non-interest bearing relates to instruments which do not carry a rate of interest. |
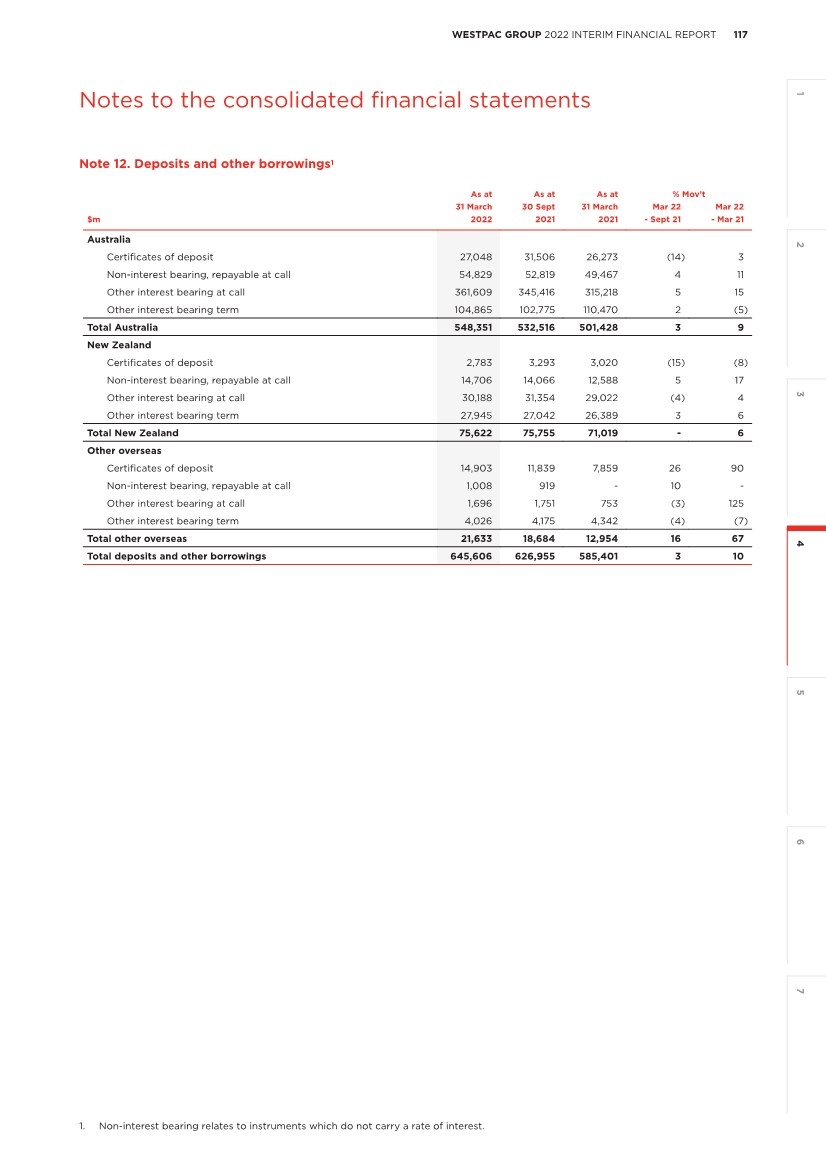
| 118 WESTPAC GROUP 2022 INTERIM FINANCIAL REPORT Notes to the consolidated financial statements Note 13. Fair values of financial assets and financial liabilities Fair Valuation Control Framework The Group uses a Fair Valuation Control Framework where the fair value is either determined or validated by a function independent of the transaction. This framework formalises the policies and procedures used to achieve compliance with relevant accounting, industry and regulatory standards. The framework includes specific controls relating to: • The revaluation of financial instruments; • Independent price verification; • Fair value adjustments; and • Financial reporting. A key element of the framework is the Revaluation Committee, comprising senior valuation specialists from within the Group. The Revaluation Committee reviews the application of the agreed policies and procedures to assess that a fair value measurement basis has been applied. The method of determining fair value differs depending on the information available. Fair value hierarchy A financial instrument’s categorisation within the valuation hierarchy is based on the lowest level input that is significant to the fair value measurement. The Group categorises all fair value instruments according to the hierarchy described below. Valuation techniques The Group applies market accepted valuation techniques in determining the fair valuation of over the counter (OTC) derivatives. This includes Credit Value Adjustment (CVA) and Funding Value Adjustment (FVA), which incorporate credit risk and funding costs and benefits that arise in relation to uncollateralised derivative positions, respectively. The specific valuation techniques, the observability of the inputs used in valuation models and the subsequent classification for each significant product category are outlined as follows: Level 1 instruments (Level 1) The fair value of financial instruments traded in active markets is based on recent unadjusted quoted prices. These prices are based on actual arm’s length basis transactions. The valuations of Level 1 instruments require little or no management judgement. Instrument Balance sheet category Includes Valuation Exchange traded products Derivatives Exchange traded interest rate futures and options and commodity and carbon futures All these instruments are traded in liquid, active markets where prices are readily observable. No modelling or assumptions are used in the valuation. FX products Derivatives FX spot and futures contracts Equity products Derivatives Trading securities and financial assets measured at FVIS Other financial liabilities Listed equities and equity indices Debt instruments Trading securities and financial assets measured at FVIS Investment securities Other financial liabilities Australian Commonwealth and New Zealand government bonds Life insurance assets Life insurance assets included in assets held for sale Listed equities, exchange traded derivatives and short sale of listed equities within controlled managed investment schemes |
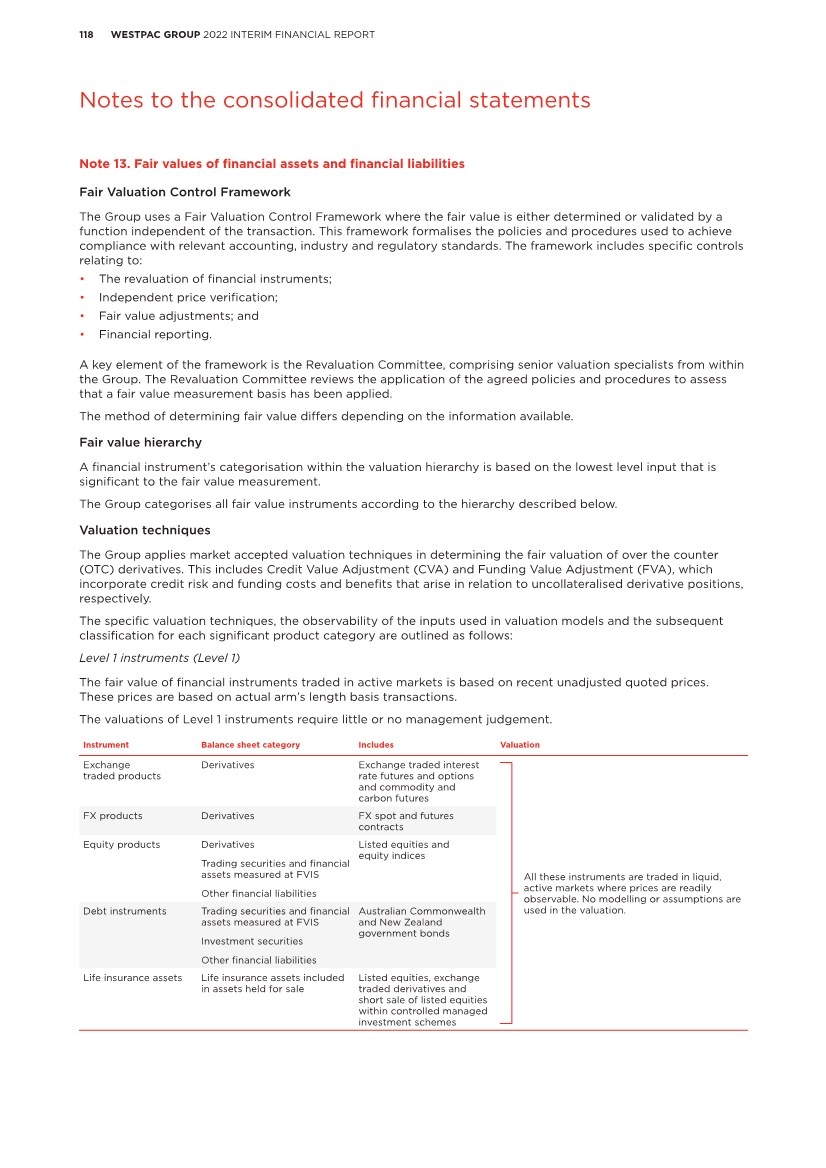
| 119 WESTPAC GROUP 2022 INTERIM FINANCIAL REPORT 2 5 6 7 4 1 3 Notes to the consolidated financial statements Level 2 instruments (Level 2) The fair value for financial instruments that are not actively traded is determined using valuation techniques which maximise the use of observable market prices. Valuation techniques include: • The use of market standard discounting methodologies; • Option pricing models; and • Other valuation techniques widely used and accepted by market participants. Instrument Balance sheet category Includes Valuation Interest rate products Derivatives Interest rate and inflation swaps, swaptions, caps, floors, collars and other non-vanilla interest rate derivatives Industry standard valuation models are used to calculate the expected future value of payments by product, which is discounted back to a present value. The model’s interest rate inputs are benchmark and active quoted interest rates in the swap, bond and futures markets. Interest rate volatilities are sourced from brokers and consensus data providers. If consensus prices are not available, these are classified as Level 3 instruments. FX products Derivatives FX swap, FX forward contracts, FX options and other non-vanilla FX derivatives Derived from market observable inputs or consensus pricing providers using industry standard models. Other credit products Derivatives Single name and index credit default swaps (CDS) Valued using an industry standard model that incorporates the credit spread as its principal input. Credit spreads are obtained from consensus data providers. If consensus prices are not available, these are classified as Level 3 instruments. Commodity products Derivatives Commodity derivatives Valued using industry standard models. The models calculate the expected future value of deliveries and payments and discount them back to a present value. The model inputs include forward curves, volatilities implied from market observable inputs, discount curves and underlying spot and futures prices. The significant inputs are market observable or available through a consensus data service. If consensus prices are not available, these are classified as Level 3 instruments. Equity products Derivatives Exchange traded equity options, OTC equity options and equity warrants Due to low liquidity, exchange traded options are Level 2. Valued using industry standard models based on observable parameters such as stock prices, dividends, volatilities and interest rates. Asset backed debt instruments Trading securities and financial assets measured at FVIS Investment securities Australian residential mortgage backed securities (RMBS) and other asset backed securities (ABS) Valued using an industry approach to value floating rate debt with prepayment features. Australian RMBS are valued using prices sourced from a consensus data provider. If consensus prices are not available these are classified as Level 3 instruments. Non-asset backed debt instruments Trading securities and financial assets measured at FVIS Investment securities Other financial liabilities State and other government bonds, corporate bonds and commercial paper Repurchase agreements and reverse repurchase agreements over non-asset backed debt securities Valued using observable market prices, which are sourced from independent pricing services, broker quotes or inter-dealer prices. Loans at fair value Loans Fixed rate bills and syndicated loans Discounted cash flow approach, using a discount rate which reflects the terms of the instrument and the timing of cash flows, adjusted for creditworthiness, or expected sale amount. Certificates of deposit Deposits and other borrowings Certificates of deposit Discounted cash flow using market rates offered for deposits of similar remaining maturities. Debt issues at fair value Debt issues Debt issues Discounted cash flows, using a discount rate which reflects the terms of the instrument and the timing of cash flows adjusted for market observable changes in Westpac’s implied credit worthiness. Note 13. Fair values of financial assets and financial liabilities (continued) |
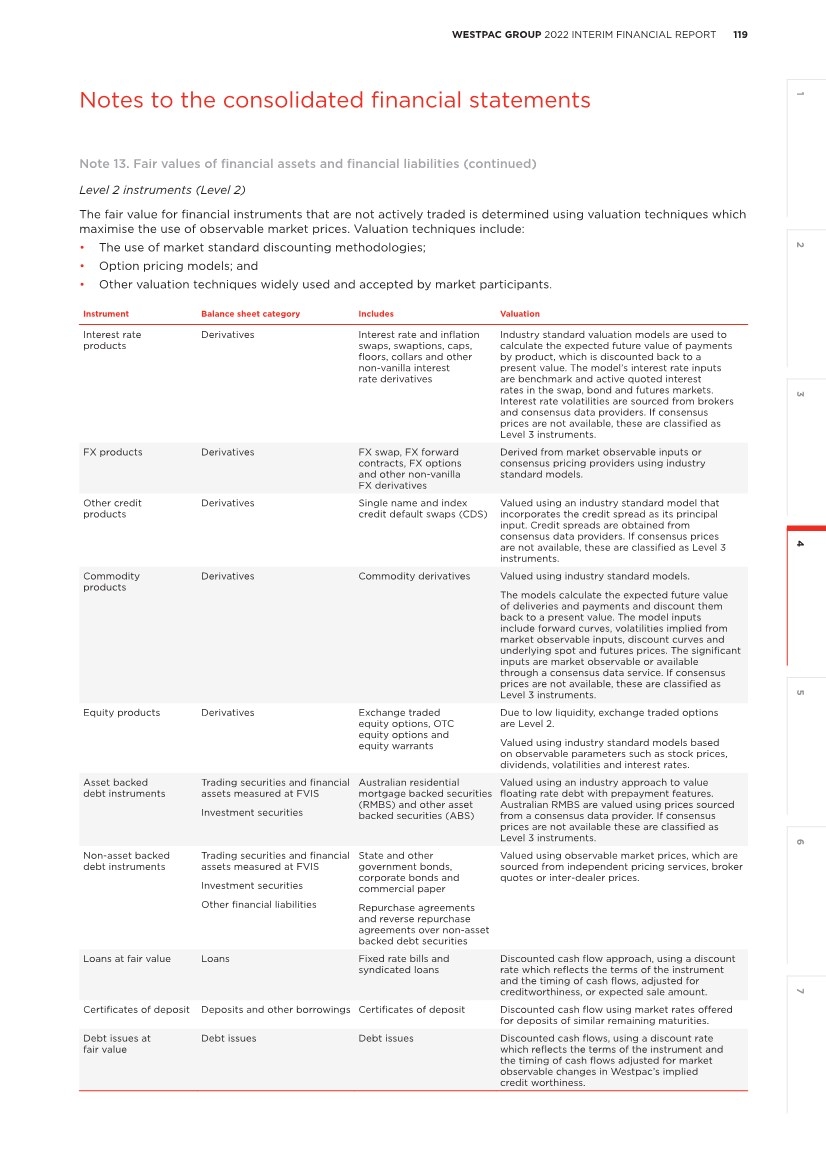
| 120 WESTPAC GROUP 2022 INTERIM FINANCIAL REPORT Notes to the consolidated financial statements Instrument Balance sheet category Includes Valuation Life insurance assets and liabilities Life insurance assets included in assets held for sale Life insurance liabilities included in liabilities held for sale Corporate bonds, OTC derivatives, units in unlisted unit trusts, life insurance contract liabilities, life investment contract liabilities and external liabilities of managed investment schemes controlled by statutory life funds Valued using observable market prices or other widely used and accepted valuation techniques utilising observable market input. Level 3 instruments (Level 3) Financial instruments valued where at least one input that could have a significant effect on the instrument’s valuation is not based on observable market data due to illiquidity or complexity of the product. These inputs are generally derived and extrapolated from other relevant market data and calibrated against current market trends and historical transactions. These valuations are calculated using a high degree of management judgement. Instrument Balance sheet category Includes Valuation Debt instruments Trading securities and financial assets measured at FVIS Investment securities Certain debt securities with low observability, usually issued via private placement These securities are evaluated by an independent pricing service or based on third party revaluations. Due to their illiquidity and/or complexity these are classified as Level 3 assets. Equity instruments Trading securities and financial assets measured at FVIS Investment securities Strategic equity investments Valued using valuation techniques appropriate to the instrument, including the use of recent arm’s length transactions where available, discounted cash flow approach or reference to the net assets of the entity. Due to their illiquidity, complexity and/or use of unobservable inputs into valuation models, they are classified as Level 3 assets. The following tables summarise the attribution of financial instruments measured at fair value to the fair value hierarchy. $m Level 1 Level 2 Level 3 Total As at 31 March 2022 Financial assets measured at fair value on a recurring basis Trading securities and financial assets measured at FVIS 5,474 18,260 4 23,738 Derivative financial instruments 38 18,204 27 18,269 Investment securities 11,838 57,287 439 69,564 Loans - 217 32 249 Assets held for sale 1,057 1,422 - 2,479 Total financial assets measured at fair value on a recurring basis 18,407 95,390 502 114,299 Financial liabilities measured at fair value on a recurring basis Deposits and other borrowings - 44,743 - 44,743 Other financial liabilities 1,090 5,767 - 6,857 Derivative financial instruments 26 25,288 33 25,347 Debt issues - 6,294 - 6,294 Liabilities held for sale - 414 - 414 Total financial liabilities measured at fair value on a recurring basis 1,116 82,506 33 83,655 Note 13. Fair values of financial assets and financial liabilities (continued) |
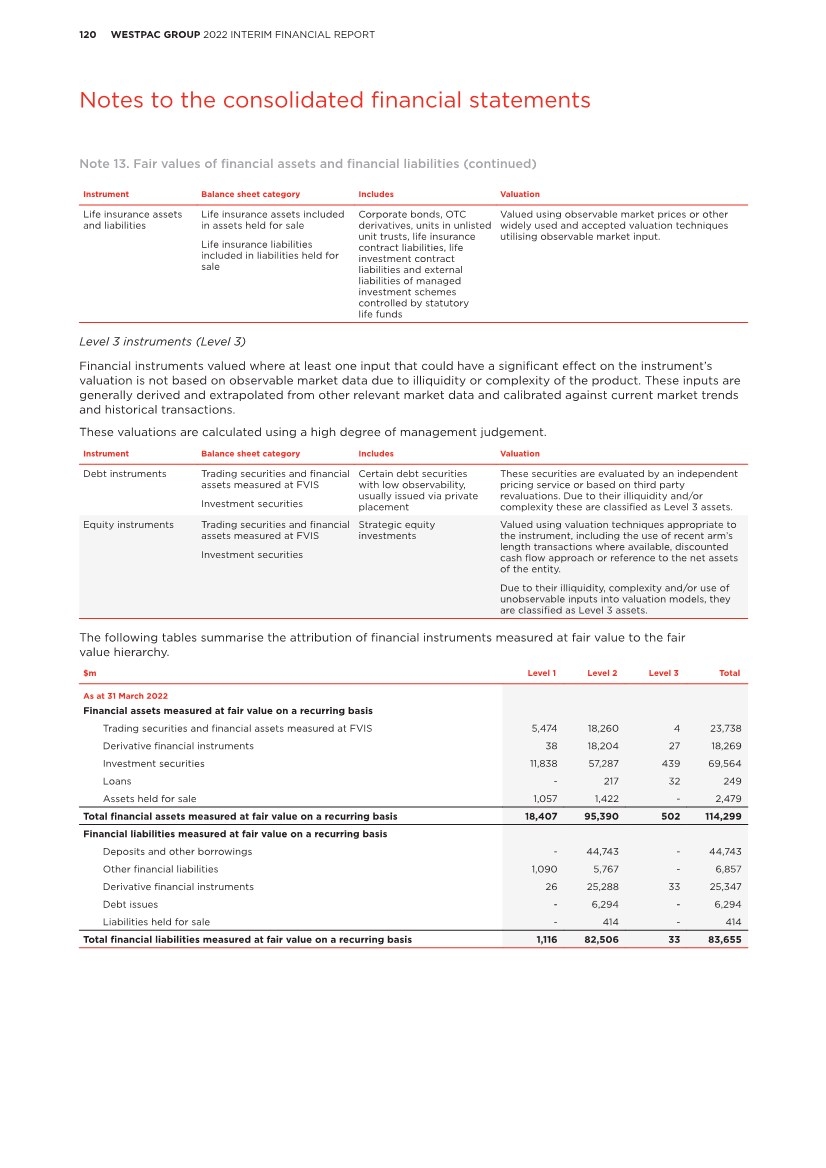
| 121 WESTPAC GROUP 2022 INTERIM FINANCIAL REPORT 2 5 6 7 4 1 3 Notes to the consolidated financial statements $m Level 1 Level 2 Level 3 Total As at 30 September 2021 Financial assets measured at fair value on a recurring basis Trading securities and financial assets measured at FVIS 6,221 14,875 5 21,101 Derivative financial instruments 22 19,305 26 19,353 Investment securities 19,282 62,923 277 82,482 Loans - 74 36 110 Assets held for sale 1,309 1,663 - 2,972 Total financial assets measured at fair value on a recurring basis 26,834 98,840 344 126,018 Financial liabilities measured at fair value on a recurring basis Deposits and other borrowings - 46,665 - 46,665 Other financial liabilities 1,478 4,968 - 6,446 Derivative financial instruments 35 17,992 32 18,059 Debt issues - 5,514 - 5,514 Liabilities held for sale - 447 - 447 Total financial liabilities measured at fair value on a recurring basis 1,513 75,586 32 77,131 As at 31 March 2021 Financial assets measured at fair value on a recurring basis Trading securities and financial assets measured at FVIS 5,579 14,749 600 20,928 Derivative financial instruments 26 22,335 12 22,373 Investment securities 17,792 72,778 368 90,938 Loans - 108 20 128 Life insurance assets 119 3,297 - 3,416 Assets held for sale - 282 7 289 Total financial assets measured at fair value on a recurring basis 23,516 113,549 1,007 138,072 Total financial assets measured at fair value on a non-recurring basis Assets held for sale - - 376 376 Total financial assets measured at fair value 23,516 113,549 1,383 138,448 Financial liabilities measured at fair value on a recurring basis Deposits and other borrowings - 37,212 - 37,212 Other financial liabilities 225 3,632 - 3,857 Derivative financial instruments 31 20,253 19 20,303 Debt issues - 5,639 - 5,639 Life insurance liabilities - 1,070 - 1,070 Liabilities held for sale - - 6 6 Total financial liabilities measured at fair value on a recurring basis 256 67,806 25 68,087 Note 13. Fair values of financial assets and financial liabilities (continued) |
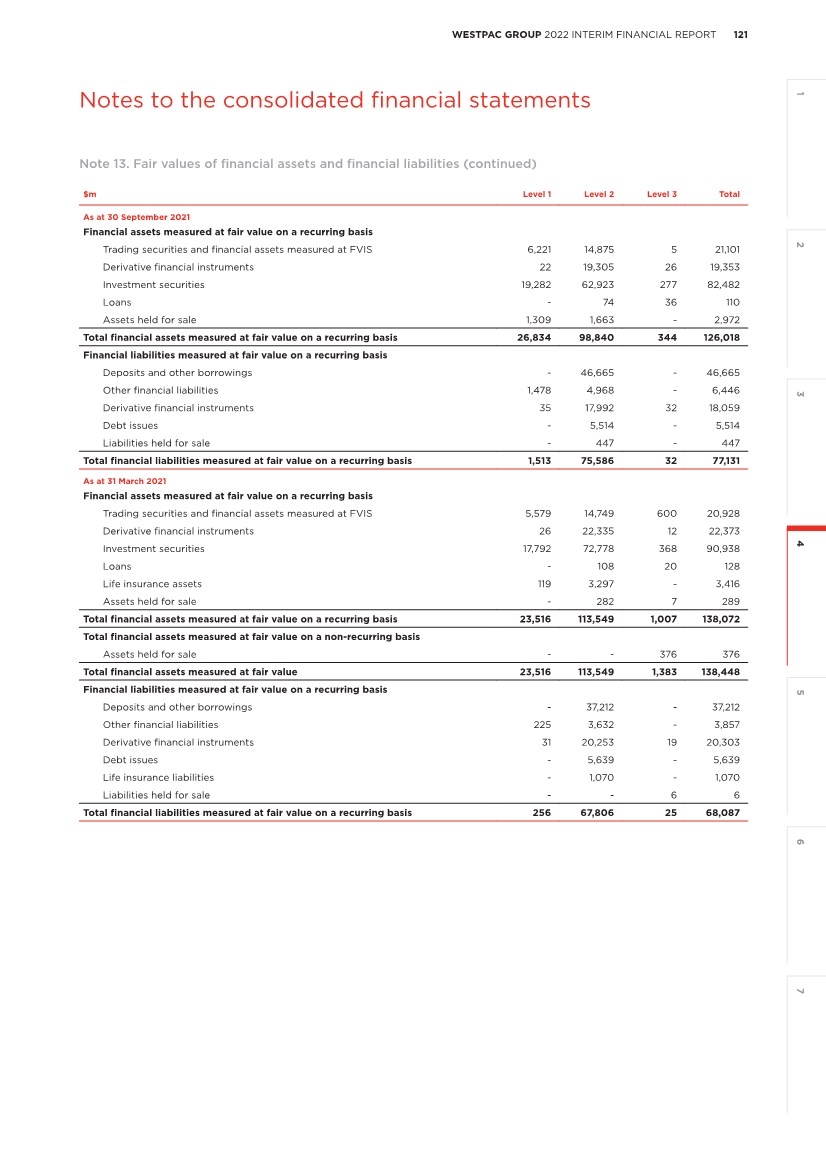
| 122 WESTPAC GROUP 2022 INTERIM FINANCIAL REPORT Notes to the consolidated financial statements Reconciliation of non-market observables The following table summarises the changes in financial instruments measured at fair value derived from non-market observable valuation techniques (Level 3). Half Year March 2022 $m Trading securities and financial assets measured at FVIS Investment Securities Other1 Total Level 3 assets Derivatives Total Level 3 liabilities Balance as at beginning of period 5 277 62 344 32 32 Gains/(losses) on assets / (gains)/losses on liabilities recognised in: Income statement - - 3 3 7 7 Other comprehensive income - 146 - 146 - - Acquisitions and issues - 33 3 36 - - Disposals and settlements (1) (17) (8) (26) (1) (1) Transfer into or out of non-market observables - - - - (5) (5) Foreign currency translation impacts - - (1) (1) - - Balance as at end of period 4 439 59 502 33 33 Unrealised gains/(losses) recognised in the income statement for financial instrument held as at end of period - - 4 4 (7) (7) Transfers into and out of Level 3 have occurred due to changes in observability in the significant inputs into the valuation models used to determine the fair value of the related financial instruments. Transfers in and transfers out are reported using the end of period fair values. Day one profit or loss The closing balance of unrecognised day one profit for the period was $1 million (30 September 2021: $1 million profit, 31 March 2021: $3 million). Financial instruments not measured at fair value The following table summarises the estimated fair value of financial instruments not measured at fair value for the Group. As at 31 March 2022 As at 30 Sept 2021 As at 31 March 2021 $m Carrying amount Fair value Carrying amount Fair value Carrying amount Fair value Financial assets not measured at fair value Cash and balances with central banks 102,410 102,410 71,353 71,353 33,877 33,877 Collateral paid 7,374 7,374 4,232 4,232 3,917 3,917 Investment securities 878 878 935 935 365 365 Loans 719,307 716,281 709,674 710,284 688,090 689,606 Other financial assets 4,896 4,896 6,394 6,394 3,312 3,312 Assets held for sale 26 26 1,041 1,041 3,208 3,208 Total financial assets not measured at fair value 834,891 831,865 793,629 794,239 732,769 734,285 Financial liabilities not measured at fair value Collateral received 2,170 2,170 2,368 2,368 2,504 2,504 Deposits and other borrowings 600,863 600,982 580,290 580,112 548,189 548,167 Other financial liabilities 44,488 44,488 43,863 43,863 39,139 39,139 Debt issues2 127,335 127,247 123,265 124,569 122,211 123,576 Loan capital2 29,036 29,413 29,067 30,147 26,294 27,137 Liabilities held for sale 17 17 28 28 2,208 2,208 Total financial liabilities not measured at fair value 803,909 804,317 778,881 781,087 740,545 742,731 A detailed description of how fair value is derived for financial instruments not measured at fair value is disclosed in Note 22 of the 2021 Annual Report. Note 13. Fair values of financial assets and financial liabilities (continued) 1. Other is comprised of derivative financial assets and certain loans. 2. The estimated fair values of debt issues and loan capital include the impact of changes in Westpac’s credit spreads since origination. |
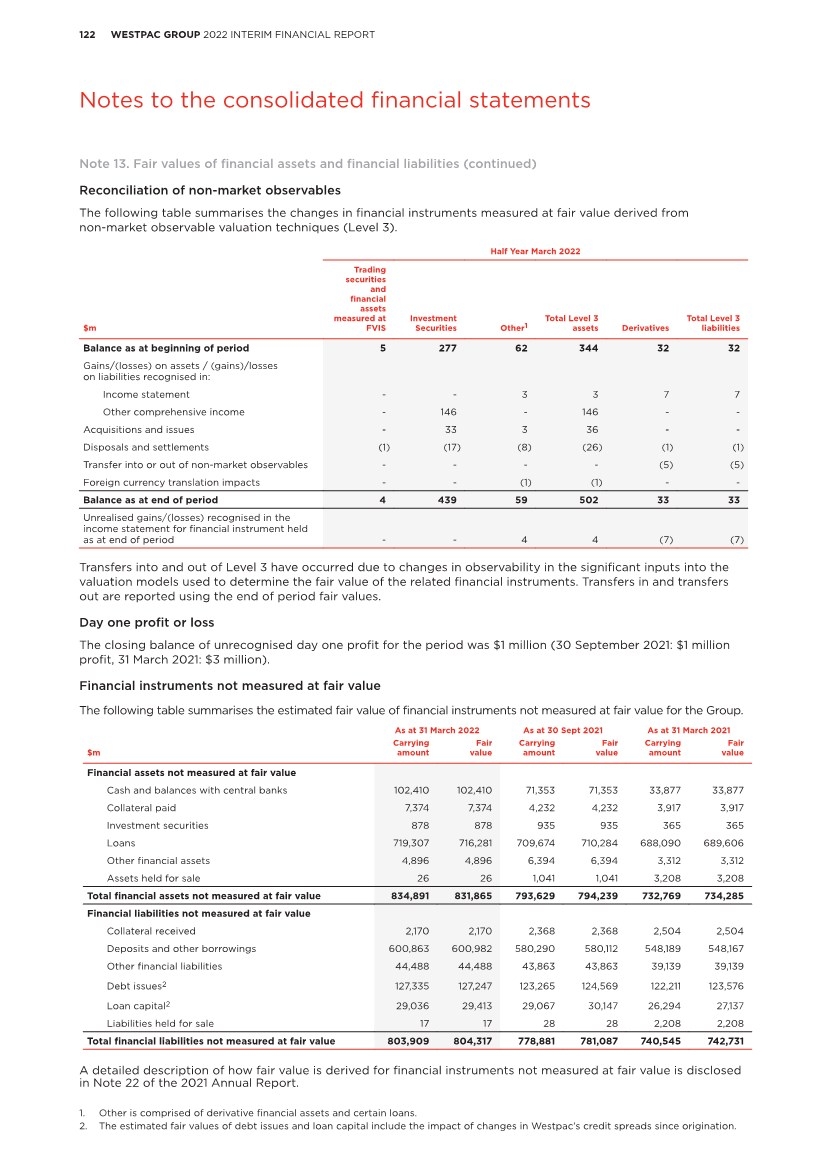
| 123 WESTPAC GROUP 2022 INTERIM FINANCIAL REPORT 4 2 3 1 5 6 7 Notes to the consolidated financial statements Note 14. Provisions, contingent liabilities, contingent assets and credit commitments Provisions are recognised for present obligations arising from past events where a payment (or other economic transfer) is likely to be necessary to settle the obligation and can be reliably estimated. Provisions raised by the Group are set out in the table in the “Provisions” section below. Where it is not probable there will be an outflow of economic resources or where a liability cannot be reliably estimated a contingent liability may exist. Provisions As at 31 March 2022 $m Long service leave Annual leave and other employee benefits Litigation and non- lending losses Provision for impairment on credit commitments Lease restoration obligations Restructuring and other provisions Compliance, regulation and remediation provisions Total Balance as at beginning of period 531 803 117 401 201 376 1,142 3,571 Additions 43 560 40 79 4 79 130 935 Utilisation (27) (740) (36) - (8) (97) (379) (1,287) Reversal of unutilised provisions (38) (7) (12) - - (13) (114) (184) Balance as at end of period 509 616 109 480 197 345 779 3,035 Compliance, regulation and remediation provisions Provisions for the Half Year 2022 in respect of compliance, regulation and remediation include estimates of: • Customer refunds associated with matters of potential historical misconduct; • Costs of completing remediation programs; and • Potential non-lending losses and costs connected with certain litigation and regulatory investigations. It is possible that the actual outcome for these matters may differ from the assumptions used in estimating the provision. Remediation processes may change over time as further facts emerge and such changes could result in a change to the final exposure. Life insurance premium increases The Group has raised a provision for customer remediation to refund certain premium increases made in 2016 and 2017, following a review by the Group in relation to certain life insurance products issued by Westpac Life Insurance Services Limited (WLIS), with Product Disclosure Statements issued in the years 2010 to 2017. This is a complex review, the remediation plan is in its early stages (including consultations with regulators), and some aspects remain uncertain. As such, there is a risk that additional customer remediation may be required in the future in relation to other premium increases, and the amount provisioned may change. Further information is set out below in ‘Contingent Liabilities’. Certain litigation and regulatory proceedings As at 31 March 2022, the Group held provisions in respect of potential non-lending losses and costs connected with certain litigation including: • an ongoing class action against BT Funds Management Limited (BTFM) and WLIS in the Federal Court of Australia in relation to aspects of BTFM’s BT Super for Life former cash investment option; • the agreed resolution of ASIC’s proceedings against Westpac in the Federal Court of Australia in relation to the sale of consumer credit insurance (CCI) products to certain customers who Westpac has accepted did not request this product; and • the resolution of six separate longstanding matters with ASIC, through agreed civil penalty proceedings in the Federal Court of Australia, in relation to: – the continued charging of advice service fees to customer accounts following the death of the relevant account holder; – the sale and assignment of credit card and flexi loan debts to third party debt purchasers; – Westpac’s systems and processes for accounts held by deregistered companies and Westpac’s approach to rectification and remediation of the relevant issues; – the adequacy of disclosure of contribution fees charged to customers for certain of our products and services; – the provision of home and contents insurance, including where some customers received duplicate policies or were issued policies without their consent; and – arrangements concerning the provision of insurance to some superannuation customers (including the charging of adviser insurance commissions in superannuation). Notes to the consolidated financial statements |
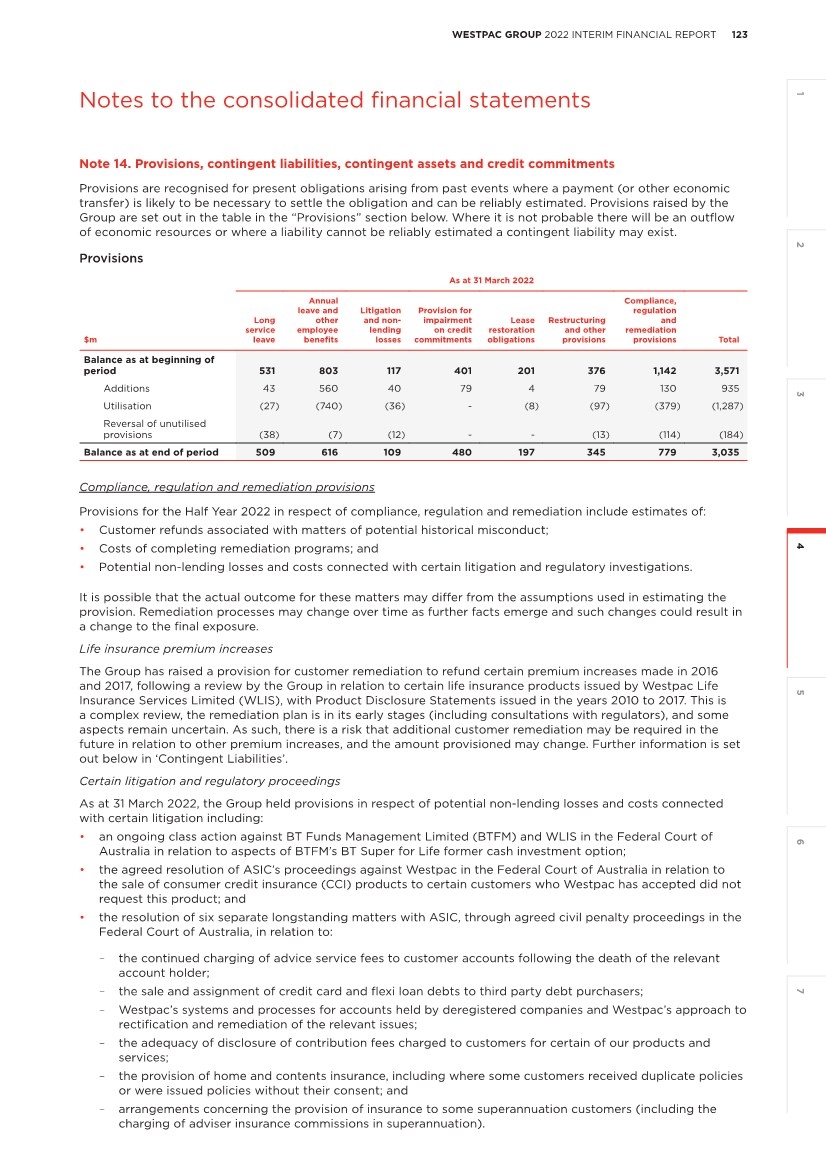
| 124 WESTPAC GROUP 2022 INTERIM FINANCIAL REPORT Notes to the consolidated financial statements Subsequent to 31 March 2022 the Federal Court made final penalty orders in respect of the seven ASIC matters referred to above. The provisions held reflect these final penalties and ASIC’s costs, which Westpac is required to pay. There remains considerable uncertainty as to the expenses that may be associated with matters that are yet to be determined by a Court and, in particular, the approach a Court may take in assessing any appropriate awards, penalties or damages. This includes where the parties may agree a proposed settlement amount and submit it to the Court on an agreed basis (which the Court would have regard to but not be obliged to accept). The actual aggregate expense to Westpac associated with either an agreed or court determined resolution of the matters may be materially higher or lower than any provision. Restructuring provisions The Group carries restructuring provisions in relation to changes in business restructures primarily for separation and redundancy costs. The balance primarily relates to business sales entered into or completed during the current or prior reporting period. Refer to Note 17 for further details. Contingent liabilities Contingent liabilities are possible obligations whose existence will be confirmed only by uncertain future events and present obligations where the transfer of economic resources is not probable or cannot be reliably measured. Contingent liabilities are not recognised on the balance sheet but are disclosed unless the outflow of economic resource is remote. Regulatory investigations, reviews and inquiries Regulators, statutory authorities and other bodies routinely conduct investigations, reviews and inquiries involving the financial services sector, both in Australia and overseas. These regulatory actions may consider a range of subject matters, and in Australia, a number of regulatory investigations and reviews are currently considering potential misconduct in relation to credit and financial services. Matters the subject of regulatory reviews are also assessed for their impact on customers, with customer remediation undertaken where appropriate in accordance with the Group’s Customer Remediation Policy. Domestic regulators such as ASIC, APRA, AUSTRAC, the OAIC, the ATO and the Fair Work Ombudsman, as well as certain international regulators such as the Reserve Bank of New Zealand, Financial Markets Authority and Commerce Commission in New Zealand, and Hong Kong Monetary Authority, are currently conducting investigations, reviews or inquiries, covering a range of matters involving the Group, that may include potential civil, civil penalty and criminal contraventions. These include: • investigations by the OAIC in relation to certain practices and systems for compliance with the Privacy Act 1988 (Cth); • the provision of superannuation (including the adequacy of arrangements for the provision of written reasons to complainants about the payment of death benefits, and insurance in superannuation); and • other areas such as: risk governance; RBNZ liquidity policy and associated risk culture; credit portfolio management; prudential standards compliance; conflicts management; hardship processes in relation to consumer / equipment finance; and anti-money laundering and counter-terrorism financing processes and procedures (including reporting). It is uncertain what (if any) actions will result following the conclusion of these investigations or matters. No provisions have yet been made in relation to any financial penalty that might arise in the event proceedings are pursued in relation to the matters outlined above, as any potential future liability of that kind cannot be reliably estimated at this time. These investigations may result (or have resulted) in litigation (including class action proceedings and criminal proceedings), significant fines and penalties, infringement notices, enforceable undertakings, referral to the relevant Commonwealth or State Director of Public Prosecutions for consideration for criminal prosecution, imposition of capital or liquidity requirements, licence revocation or variation, or other action being taken by regulators or other parties. Given the size of Westpac, these investigations have in some instances resulted, and could in the future result, in findings of a significant number of breaches of obligations. This in turn could lead to significant financial and other penalties. Prior penalties and contraventions by Westpac in relation to similar issues can also affect penalties that may be imposed. Litigation There are ongoing Court proceedings, claims and possible claims against the Group. Contingent liabilities exist in respect of actual and potential claims and proceedings, including those listed below. An assessment of the Group’s likely loss has been made on a case-by-case basis for the purpose of the financial statements but cannot always be reliably estimated, including in relation to those listed below. No provision has been recognised for potential losses that may arise in relation to the matters below because liability is not certain and cannot be reliably estimated. Note 14. Provisions, contingent liabilities, contingent assets and credit commitments (continued) |
| 125 WESTPAC GROUP 2022 INTERIM FINANCIAL REPORT 4 2 3 1 5 6 7 Notes to the consolidated financial statements Regulatory litigation • On 5 May 2021, ASIC filed civil proceedings against Westpac alleging that it had engaged in insider trading and unconscionable conduct and failed to comply with its Australian Financial Services Licence obligations. The allegations relate to interest rate hedging activity during Westpac’s involvement in the 2016 Ausgrid privatisation transaction. Westpac has filed its Response to ASIC’s Concise Statement. A hearing date for this matter has been set down for 18 March 2024. Class actions • Westpac is defending a class action proceeding which was commenced in December 2019 in the Federal Court of Australia on behalf of certain investors who acquired an interest in Westpac securities between 16 December 2013 and 19 November 2019. The proceeding involves allegations relating to market disclosure issues connected to Westpac’s monitoring of financial crime over the relevant period, and matters which were the subject of the AUSTRAC civil proceedings. The damages sought are unspecified. However, given the time period in question and the nature of the claims, it is likely that any alleged damages will be significant. • On 28 February 2020, a class action was commenced against Westpac Banking Corporation, Westpac General Insurance Limited and WLIS in the Federal Court of Australia in relation to Westpac’s sale of CCI products to customers. A number of similar class actions have been filed against other industry participants. It is alleged the three entities failed to adhere to a number of obligations in selling CCI in conjunction with credit cards, personal loans and flexi loans. The damages sought by the claim are unspecified. The three entities are defending the proceedings. The matter has been set down for an initial trial commencing in November 2022. • On 16 July 2020, a class action was commenced against Westpac Banking Corporation and St.George Finance Limited (SGF) in the Supreme Court of Victoria in relation to flex commissions paid to auto dealers from 1 March 2013 to 31 October 2018. This proceeding is one of two class actions commenced against a number of lenders in the auto finance industry. It is alleged Westpac and SGF are liable for the unfair conduct of dealers acting as credit representatives and engaged in misleading or deceptive conduct. The damages sought are unspecified. Westpac and SGF are defending the proceedings. Westpac has not paid flex commissions since 1 November 2018 following an industry-wide ban issued by ASIC. Westpac is aware from media reports and other publicly available material that at least one other class action (and possibly more) against Westpac entities is being investigated. For example, in July 2020, a law firm publicly stated that it intends to commence a class action against BTFM alleging that since 2014, BTFM did not act in the best interests of members of certain superannuation funds when obtaining group insurance policies. Westpac has not been served with a claim in relation to this matter and has no further information about the scope of the proposed claim beyond the public statements issued by the law firm involved. Internal reviews and remediation As in prior periods, Westpac is continuing to undertake a number of reviews to identify and resolve issues that have the potential to impact our customers, employees, reputation and other relevant stakeholders. These internal reviews continue to identify issues in respect of which we are taking steps or will take steps to put things right so that our customers and employees (as applicable) are not disadvantaged from certain past practices, including making compensation/remediation payments and providing refunds where appropriate. These issues include, among other things, compliance with lending obligations (including responsible lending); payroll processes; regulatory reporting; sufficiency of training, policies and procedures; product disclosure; tax withholding processes for persons under 16; international funds transfer instruction reporting; storage and use of tax file numbers and other personal information; and impacts from inadequate product governance, including the way some product terms and conditions are operationalised. The Group is reviewing premium increases on certain life insurance products following several customer complaints. This review relates to life insurance products issued by WLIS, with Product Disclosure Statements issued in the years 2010 to 2017. Although a provision has been raised for some remediation aspects, this is a complex review where a number of the outcomes remain uncertain. There remains a risk that customer remediation may be required (over and above what has been provided for) as well as a risk of regulatory or other action against WLIS or other entities in the Group. The review is also considering the premium increases that can and should be made in the future, and there is a risk that the outcomes of the review, or regulatory responses to the review, could significantly impact the financial and/or capital position of WLIS. In addition, our New Zealand business is reviewing its processes for some products relating to the requirements of the New Zealand Credit Contracts and Consumer Finance Act 2003. The outcome of this complex review is uncertain and could result in customer remediation, regulatory action, litigation, and reputational damage. By undertaking these reviews, we can also improve our processes and controls. An assessment of the Group’s likely loss has been made on a case-by-case basis for the purpose of the financial statements but cannot always be reliably estimated. Even where Westpac has remediated or compensated customers and employees, there can still be the risk of regulators challenging the basis or scope of remediation, imposing penalties, enforceable Note 14. Provisions, contingent liabilities, contingent assets and credit commitments (continued) |
| 126 WESTPAC GROUP 2022 INTERIM FINANCIAL REPORT Notes to the consolidated financial statements undertakings or other sanctions. Contingent liabilities may exist in respect of actual or potential claims or proceedings (which could be brought by customers, regulators or criminal prosecutors), compensation/ remediation payments and/or refunds identified as part of these reviews. Australian Financial Complaints Authority Contingent liabilities also exist in relation to customer complaints brought before the Australian Financial Complaints Authority (AFCA). AFCA has the power to make determinations about complaints and can award compensation up to certain thresholds. Financial Claims Scheme Under the Financial Claims Scheme (FCS), the Australian Government provides depositors a free guarantee of deposits in eligible ADIs of up to and including $250,000, per account holder, per protected account in an eligible ADI. The FCS applies to an eligible ADI if APRA has applied for the winding up of the ADI or a Banking Act statutory manager is in control of the ADI’s business, and the responsible Australian Government minister has declared that the FCS applies to the ADI. The Financial Claims Scheme (ADIs) Levy Act 2008 (Cth) provides for the imposition of a levy to fund the excess of certain APRA FCS costs connected to an ADI, including payments by APRA to deposit holders in a failed ADI. The levy would be imposed on liabilities of eligible ADIs to their depositors and cannot be more than 0.5% of the amount of those liabilities. A contingent liability may exist in respect of any levy imposed under the FCS. Contingent tax risk Tax and regulatory authorities in Australia and in other jurisdictions are reviewing the taxation treatment of certain transactions (both historical and present-day transactions) undertaken by the Group in the course of normal business activities and the claiming of tax incentives and indirect taxes such as GST. The Group also responds to various notices and requests for information it receives from tax and regulatory authorities. These reviews, notices and requests may result in additional tax liabilities (including interest and penalties). The Group has assessed these and other taxation claims arising in Australia and elsewhere, including seeking independent advice. Settlement risk The Group is subject to a credit risk exposure in the event that another counterparty fails to settle for its payments clearing activities (including foreign exchange). The Group seeks to minimise credit risk arising from settlement risk in the payments system by aligning our processing method with the legal certainty of settlement in the relevant clearing mechanism. Exposures to third parties relating to divested businesses The Group has potential exposures relating to warranties, indemnities, and other commitments it has provided to third parties in connection with various divestments of businesses and assets and other transactions. The warranties, indemnities and other commitments cover a range of matters and risks, including certain compliance, regulatory investigations and litigation matters outlined in this Note 14. Parent entity guarantees and undertakings to subsidiaries Westpac Banking Corporation, as the parent entity of the Group makes the following guarantees and undertakings to its subsidiaries: • letters of comfort for certain subsidiaries which recognise that Westpac has a responsibility that those subsidiaries continue to meet their obligations; and • guarantees to certain wholly owned subsidiaries which are Australian financial services or credit licensees to comply with legislative requirements. All but two guarantees are capped at $20 million per year (with an automatic reinstatement for another $20 million) and two specific guarantees are capped at $2 million (with an automatic reinstatement for another $2 million). Contingent assets The credit commitments shown in the following table also constitute contingent assets. These commitments would be classified as loans in the balance sheet on the contingent event occurring. Note 14. Provisions, contingent liabilities, contingent assets and credit commitments (continued) |
| 127 WESTPAC GROUP 2022 INTERIM FINANCIAL REPORT 4 2 3 1 5 6 7 Notes to the consolidated financial statements Undrawn credit commitments The Group enters into various arrangements with customers which are only recognised in the balance sheet when called upon. These arrangements include commitments to extend credit, bill endorsements, financial guarantees, standby letters of credit and underwriting facilities. They expose the Group to liquidity risk when called upon and also to credit risk if the customer fails to repay the amounts owed at the due date. The maximum exposure to credit loss is the contractual or notional amount of the instruments. Some of the arrangements can be cancelled by the Group at any time and a significant portion is expected to expire without being drawn. The actual liquidity and credit risk exposure varies in line with amounts drawn and may be less than the amounts disclosed. The Group uses the same credit policies when entering into these arrangements as it does for on-balance sheet instruments. Refer to Note 21 of the 2021 Annual Report for further details of liquidity risk and credit risk management. Undrawn credit commitments excluding derivatives are as follows: As at As at As at % Mov’t 31 March 30 Sept 31 March Mar 22 Mar 22 $m 2022 2021 2021 - Sept 21 - Mar 21 Undrawn credit commitments Letters of credit and guarantees1 11,716 11,323 11,528 3 2 Commitments to extend credit2 189,415 188,768 187,106 - 1 Other 55 - 69 - (20) Total undrawn credit commitments3 201,186 200,091 198,703 1 1 1. Standby letters of credit are undertakings to pay, against presentation documents, an obligation in the event of a default by a customer. Guarantees are unconditional undertakings given to support the obligations of a customer to third parties. The Group may hold cash as collateral for certain guarantees issued. 2. Commitments to extend credit include all obligations on the part of the Group to provide credit facilities. As facilities may expire without being drawn upon, the notional amounts do not necessarily reflect future cash requirements. In addition to the commitments disclosed above, at 31 March 2022 the Group had offered $9.5 billion (30 September 2021: $9.7 billion, 31 March 2021: $9.6 billion) of facilities to customers, which had not yet been accepted. 3. Includes nil (30 September 2021: $0.8 billion, 31 March 2021: $0.4 billion) of undrawn credit commitments related to facilities which are held for sale. Note 14. Provisions, contingent liabilities, contingent assets and credit commitments (continued) |
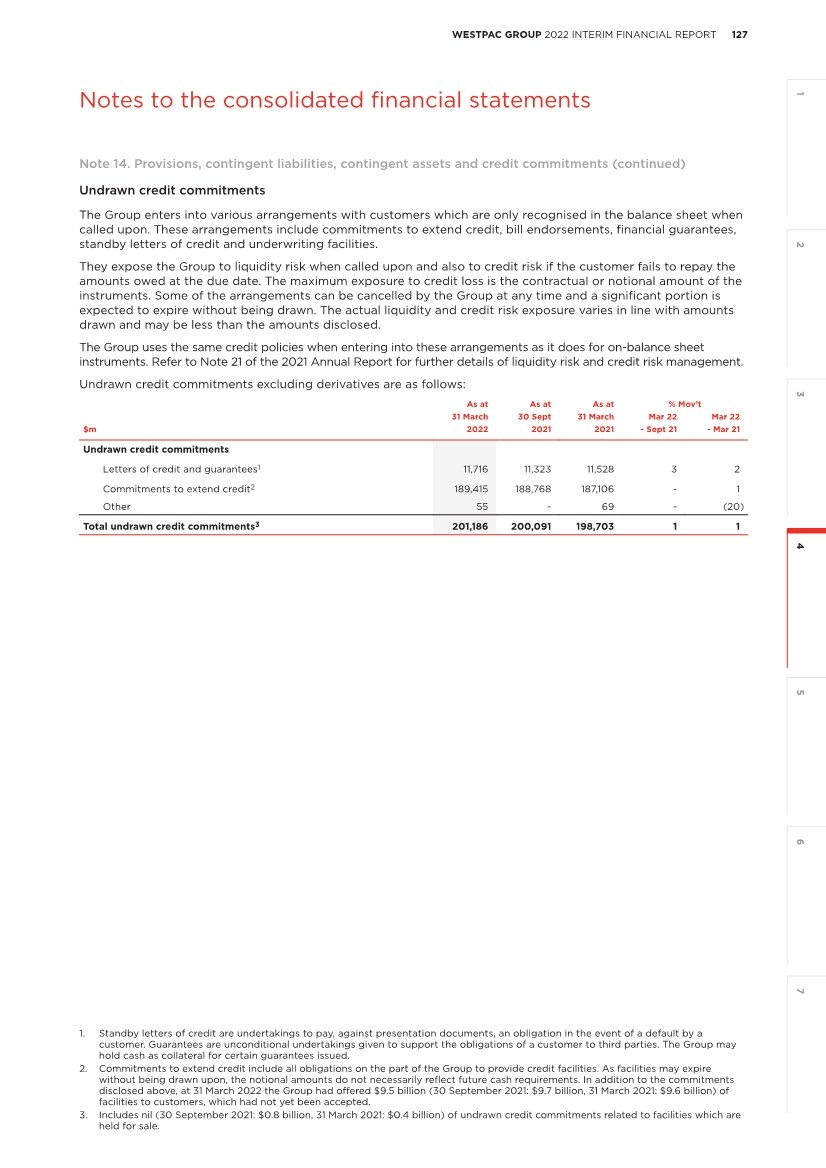
| 129 128 WESTPAC GROUP 2022 INTERIM FINANCIAL REPORT WESTPAC GROUP 2022 INTERIM FINANCIAL REPORT Notes to the consolidated financial statements Note 15. Shareholders’ equity As at As at As at 31 March 30 Sept 31 March $m 2022 2021 2021 Share capital Ordinary share capital, fully paid 39,667 41,601 41,604 Treasury shares1 (651) (606) (603) Total share capital 39,016 40,995 41,001 NCI 54 57 49 Ordinary Shares Westpac does not have authorised capital and the ordinary shares have no par value. Ordinary shares entitle the holder to participate in dividends and, in the event of Westpac winding up, to a share of the proceeds in proportion to the number of and amounts paid on the shares held. Each ordinary share entitles the holder to one vote, either in person or by proxy, at a shareholder meeting. Reconciliation of movement in number of ordinary shares Half Year Half Year Half Year March Sept March 2022 2021 2021 Balance as at beginning of period 3,668,591,808 3,668,591,808 3,611,684,870 Dividend reinvestment plan2 - - 20,213,205 Dividend reinvestment plan underwrite3 - - 36,693,733 Issued shares for the period - - 56,906,938 Off-market share buy-back4 (167,464,114) - - Balance as at end of period 3,501,127,694 3,668,591,808 3,668,591,808 Ordinary shares purchased on market Half Year March 2022 Average price Consolidated Number ($) For share-based payment arrangements: Employee share plan (ESP) 1,236,092 22.83 RSP5 2,175,190 21.20 Westpac Performance Plan (WPP) - share rights exercised 223,497 23.72 Westpac Long Term Variable Reward Plan (LTVR) - share rights exercised 2,148 23.85 Net number of ordinary shares purchased/(sold) on market 3,636,927 1. 31 March 2022: 5,076,534 unvested RSP treasury shares held (30 September 2021: 4,363,329, 31 March 2021: 4,322,935). 2. The DRP for the 2021 final dividend had no impact on the number of ordinary shares on issue as Westpac arranged for the purchase of the necessary shares from the market and transfer to participants of 10,286,188 ordinary shares (2021 interim dividend: 9,085,937 ordinary shares) at an average price of $22.34 (2021 interim dividend: $25.98). The price per share for the issuance of shares in relation to the dividend reinvestment plan for the 2020 final dividend was $19.83. 3. The Group entered to an arrangement to fully underwrite the 2020 final dividend, referred to as a DRP underwrite. This arrangement ensured that the capital impact of the dividend was negated as new shares of equivalent value to the amount of the dividend that was paid to shareholders in cash were purchased by the DRP underwriter. The price per share for the issuance of shares in relation to the 2020 DRP underwrite was $19.59. 4. On 14 February 2022, the Group announced the successful completion of its $3.5 billion off-market share buy-back of Westpac ordinary shares. 167,464,114 ordinary shares were bought back at $20.90, and comprised a fully franked dividend component of $9.56 per share ($1,601 million) and a capital component of $11.34 per share ($1,901 million including transaction costs). The shares bought back were subsequently cancelled. 5. Ordinary shares allocated to employees under the RSP are classified as treasury shares until the shares vest. Notes to the consolidated financial statements |
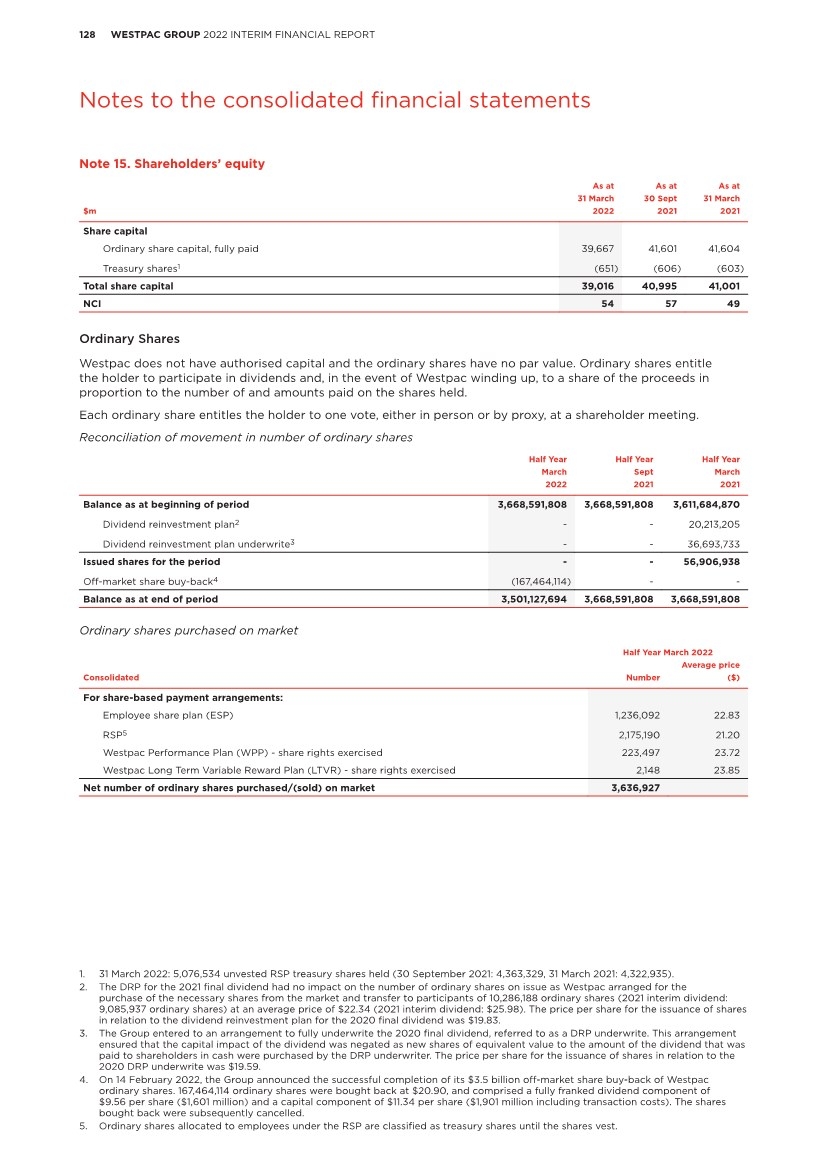
| 129 128 WESTPAC GROUP 2022 INTERIM FINANCIAL REPORT WESTPAC GROUP 2022 INTERIM FINANCIAL REPORT 4 2 3 1 5 6 7 Notes to the consolidated financial statements Reconciliation of movement in reserves Half Year Half Year Half Year March Sept March $m 2022 2021 2021 Debt securities at FVOCI reserve Balance as at beginning of period 443 562 177 Net gains/(losses) from changes in fair value (142) (71) 649 Income tax effect 38 20 (197) Transferred to income statement (205) (97) (98) Income tax effect 62 29 29 Loss allowance on debt securities measured at FVOCI (2) 1 1 Other 29 (1) 1 Balance as at end of period 223 443 562 Equity securities at FVOCI reserve Balance as at beginning of period 44 40 (4) Net gains/(losses) from changes in fair value 146 7 43 Income tax effect - (3) 1 Balance as at end of period 190 44 40 Share-based payment reserve Balance as at beginning of period 1,806 1,779 1,720 Share-based payment expense 60 27 59 Balance as at end of period 1,866 1,806 1,779 Cash flow hedge reserve Balance as at beginning of period 196 95 (42) Net gains/(losses) from changes in fair value 1,222 175 121 Income tax effect (362) (51) (35) Transferred to income statement (10) (33) 72 Income tax effect 3 10 (21) Balance as at end of period 1,049 196 95 Foreign currency translation reserve Balance as at beginning of period (241) (502) (292) Exchange differences on translation of foreign operations (367) 515 (266) Gains/(losses) on net investment hedges 201 (254) 56 Balance as at end of period (407) (241) (502) Other reserves Balance as at beginning of period (21) (20) (15) Transactions with owners 1 (1) (5) Balance as at end of period (20) (21) (20) Total reserves 2,901 2,227 1,954 Note 15. Shareholders’ equity (continued) |
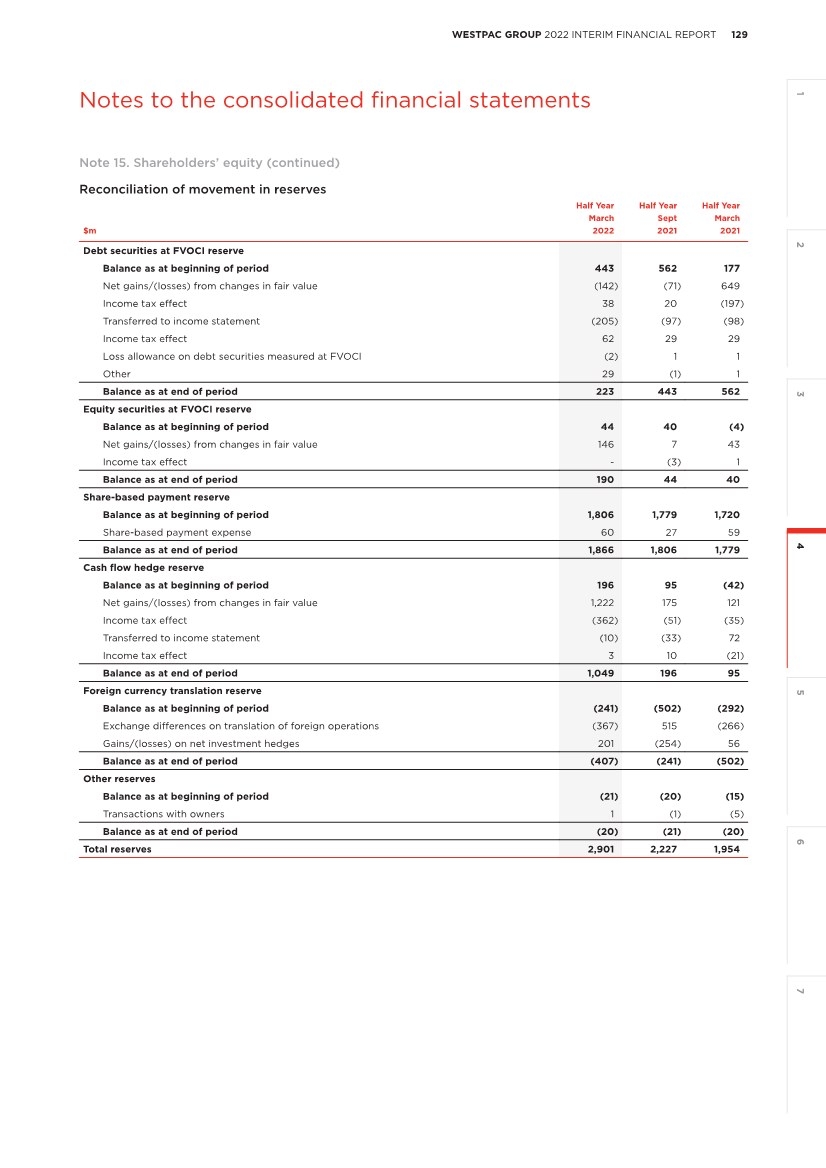
| 131 130 WESTPAC GROUP 2022 INTERIM FINANCIAL REPORT WESTPAC GROUP 2022 INTERIM FINANCIAL REPORT Notes to the consolidated financial statements Note 16. Notes to the consolidated cash flow statement Half Year Half Year Half Year % Mov’t March Sept March Mar 22 Mar 22 $m 2022 2021 2021 - Sept 21 - Mar 21 Reconciliation of net cash provided by/(used in) operating activities to net profit for the period Net profit 3,284 2,018 3,445 63 (5) Adjustments: Depreciation, amortisation and impairment 805 1,900 1,154 (58) (30) Impairment charges/(benefits) 241 (108) (240) large large Net decrease/(increase) in current and deferred tax 101 264 86 (62) 17 (Increase)/decrease in accrued interest receivable (59) 102 81 large large (Decrease)/increase in accrued interest payable 25 (84) (339) large large (Decrease)/increase in provisions (536) (249) (1,467) 115 (63) Other non-cash items (169) 135 (388) large (56) Cash flows from operating activities before changes in operating assets and liabilities 3,692 3,978 2,332 (7) 58 Net (increase)/decrease in: Collateral paid (3,293) (166) 471 large large Trading securities and financial assets measured at FVIS (2,106) (574) 19,890 large large Derivative financial instruments 3,004 4,610 (7,030) (35) large Loans (12,636) (17,066) 1,968 (26) large Other financial assets 726 (702) 428 large 70 Life insurance assets and liabilities 133 (216) (377) large large Other assets (17) 72 (66) large (74) Net increase/(decrease) in: Collateral received (184) (251) 344 (27) large Deposits and other borrowings 21,758 35,347 (1,610) (38) large Other financial liabilities 1,382 5,268 3,768 (74) (63) Other liabilities 3 (35) 27 large (89) Net cash provided by/(used in) operating activities 12,462 30,265 20,145 (59) (38) |
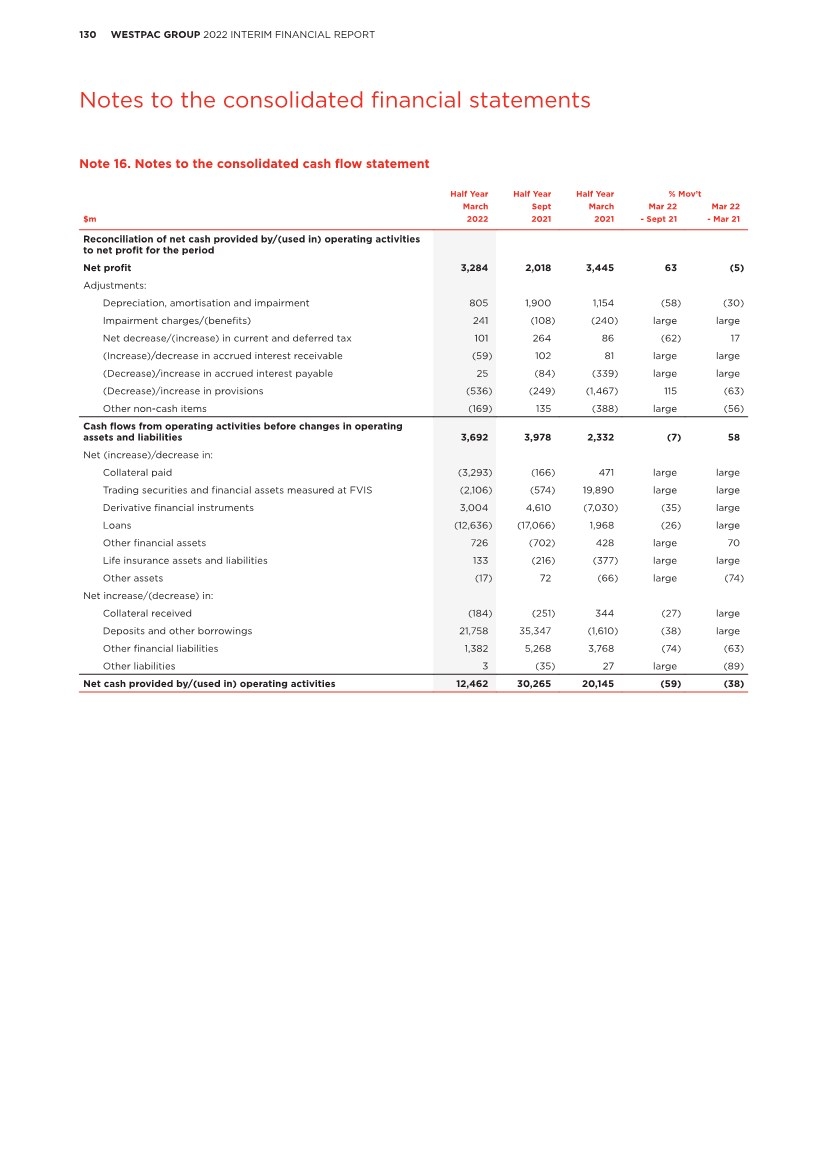
| 131 130 WESTPAC GROUP 2022 INTERIM FINANCIAL REPORT WESTPAC GROUP 2022 INTERIM FINANCIAL REPORT 4 2 3 1 5 6 7 Notes to the consolidated financial statements Details of the assets and liabilities over which control ceased Details of the businesses over which control ceased are provided in Note 17 and Note 37 of the 2021 Annual Report. Half Year Half Year Half Year March Sept March $m 2022 2021 2021 Assets: Cash and balances with central banks - 50 - Trading securities and other financial assets measured at FVIS - 409 - Loans 965 369 - Other financial assets 12 688 - Life insurance assets 186 - - Property and equipment - 29 - Deferred tax assets - 4 - Intangible assets - 243 - Other assets 12 226 - Total assets 1,175 2,018 - Liabilities: Other financial liabilities 2 110 - Current tax liabilities 2 - - Life insurance liabilities (115) - - Provisions 4 9 - Deferred tax liabilities 34 - - Other liabilities 36 720 - Total liabilities (37) 839 - Total equity attributable to owners of WBC 1,212 1,179 - Cash proceeds received (net of transaction costs) 1,388 1,322 - Expected receivable (completion settlement)/(payable) (5) 8 - Deferred consideration 118 37 - Total consideration 1,501 1,367 - Gain/(loss) on disposal 289 188 - Reconciliation of cash proceeds from disposal: Cash proceeds received (net of transaction costs) 1,388 1,322 - Less: Cash deconsolidated - (50) - Cash consideration received (net of transaction costs and cash held) 1,388 1,272 - Non-cash financing activities Half Year Half Year Half Year % Mov’t March Sept March Mar 22 Mar 22 $m 2022 2021 2021 - Sept 21 - Mar 21 Shares issued under the dividend reinvestment plan - - 401 - (100) Increase in lease liabilities 98 55 144 78 (32) On 15 September 2021, $1,152 million of Westpac Capital Notes (WCN) 4 were transferred to the WCN4 nominated party for $100 each pursuant to the WCN8 reinvestment offer. Those WCN4 were subsequently redeemed and cancelled by Westpac. On 20 December 2021, Westpac redeemed the remaining outstanding WCN4. Businesses acquired During Half Year March 2022, Westpac acquired MoneyBrilliant Pty Ltd (100% interest on 13 December 2021). Restricted cash Certain of our foreign operations are required to maintain reserves or minimum balances with central banks in their respective countries of operation, totalling $480 million (30 September 2021: $445 million, 31 March 2021: $236 million) which are included in cash and balances with central banks. Included in assets held for sale are restricted cash balances with central banks totalling nil (30 September 2021: nil, 31 March 2021: $174 million). Note 16. Notes to the consolidated cash flow statement (continued) |
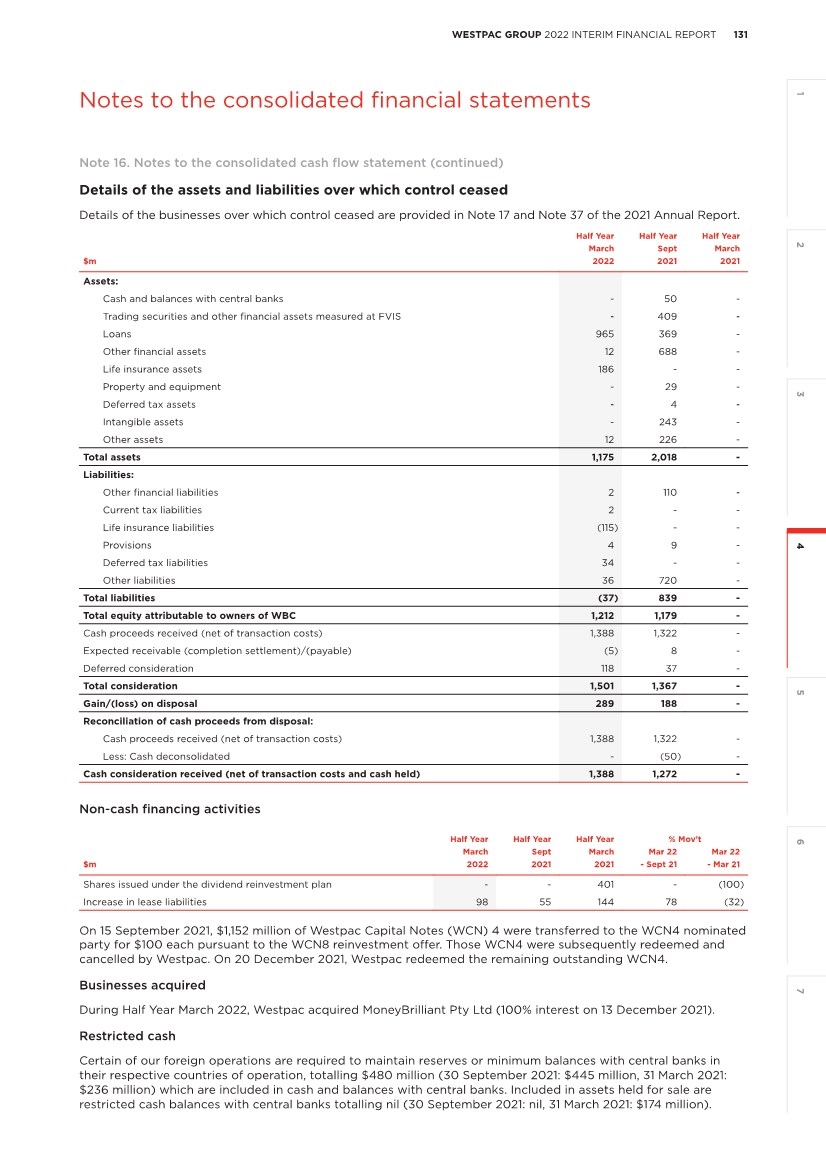
| 133 132 WESTPAC GROUP 2022 INTERIM FINANCIAL REPORT WESTPAC GROUP 2022 INTERIM FINANCIAL REPORT Notes to the consolidated financial statements Note 17. Assets and liabilities held for sale The businesses classified as held for sale during First Half 2022 do not constitute a major line of business, and therefore have not been classified as discontinued operations. Businesses held for sale as at 31 March 2022 Westpac Australian Life Insurance business On 9 August 2021, the Group announced that it would sell Westpac Life Insurance Services Limited to TAL Dai- ichi Life Australia Pty Limited (TAL) and enter into an exclusive 20-year strategic alliance for the provision of life insurance products to Westpac’s Australian customers. This entity is currently included in the Group’s Specialist Businesses segment. The sale price is $900 million and is estimated to result in a pre-tax loss on sale of $1.3 billion. For the year ended 30 September 2021, a loss of $224 million was recognised in operating expenses reflecting expected separation and transaction costs. The remaining loss will be recognised on completion of the sale. The transaction also includes ongoing payments to Westpac in accordance with the distribution agreement. Westpac will retain responsibility for certain pre-completion matters and provide protection to TAL through a combination of provisions, warranties and indemnities. Required regulatory approvals have been obtained, and the transaction remains on track to complete in the second half of the 2022 calendar year. Transactions completed during First Half 2022 Westpac Motor Vehicle Dealer Finance and Novated Leasing business On 28 June 2021, the Group announced that it would sell its motor vehicle dealer finance and novated leasing business to Angle Auto Finance Pty Ltd, L.P. As part of the sale, Westpac would transfer: • Auto dealer and introducer agreements together with wholesale dealer loans of approximately $1 billion; • Strategic alliance agreements with vehicle manufacturers; and • Novated lease origination capability and related agreements. Completion of the transaction occurred over several stages in First Half 2022, with wholesale dealer loans of approximately $1 billion transferred on 20 December 2021, and final completion occurring on 24 March 2022. A pre-tax gain on sale of $170 million was recognised during the period in non-interest income. Westpac has retained auto loans of around $9 billion. The loans will run down over the life of those loans. Westpac has also ceased new retail auto loan originations from these three channels with customers still able to use the Group’s Consumer and Business lending products to help buy motor vehicles. The business was included in Specialist Businesses. Westpac New Zealand Life Insurance business On 6 July 2021, the Group announced that it had entered into an agreement to sell Westpac Life-NZ- Limited to Fidelity Life Assurance Company Limited and enter into an exclusive 15-year agreement for the distribution of life insurance products to Westpac’s New Zealand customers. The sale was completed on 28 February 2022 for NZ$417 million resulting in a pre-tax gain on sale of A$119 million recognised in non-interest income. Ongoing payments to Westpac will be received in accordance with the distribution agreement. This entity was included in Westpac New Zealand. |
| 133 132 WESTPAC GROUP 2022 INTERIM FINANCIAL REPORT WESTPAC GROUP 2022 INTERIM FINANCIAL REPORT 4 2 3 1 5 6 7 Notes to the consolidated financial statements Balance sheet presentation Details of the assets and liabilities that have been presented as held for sale are as follows: As at As at As at 31 March 30 Sept 31 March $m 2022 2021 2021 Assets held for sale Cash and balances with central banks 8 7 792 Trading securities and financial assets measured at FVIS - - 282 Derivative financial instruments - - 7 Investment securities - - 550 Loans - 1,015 1,819 Other financial assets 18 19 423 Life insurance assets 2,479 2,972 - Property and equipment - - 23 Deferred tax assets 43 8 25 Intangible assets - - 243 Other assets 152 167 195 Total assets held for sale 2,700 4,188 4,359 Liabilities held for sale Deposits and other borrowings - - 2,088 Other financial liabilities 17 28 120 Derivative financial instruments - - 6 Current tax liabilities - 14 1 Life insurance liabilities 414 447 - Provisions 65 35 20 Deferred tax liabilities 3 44 - Other liabilities 185 269 814 Total liabilities held for sale 684 837 3,049 Note 18. Subsequent events Since 31 March 2022, the Board has determined to pay a fully franked interim dividend of 61 cents per fully paid ordinary share. The dividend is expected to be $2,136 million. The dividend is not recognised as a liability at 31 March 2022. The proposed payment date of the dividend is 24 June 2022. The Board has determined to satisfy the DRP for the 2022 interim dividend by arranging for the purchase of existing shares by a third party. The Market Price used to determine the number of shares allocated to DRP participants will be set over the 10 trading days commencing on 25 May 2022 and will not include a discount. No other matters have arisen since the half year ended 31 March 2022, which are not otherwise dealt with in this 2022 Interim Financial Report, that have significantly affected or may significantly affect the operations of the Group, the results of its operations or the state of affairs of the Group in subsequent periods. Note 17. Assets and liabilities held for sale (continued) |
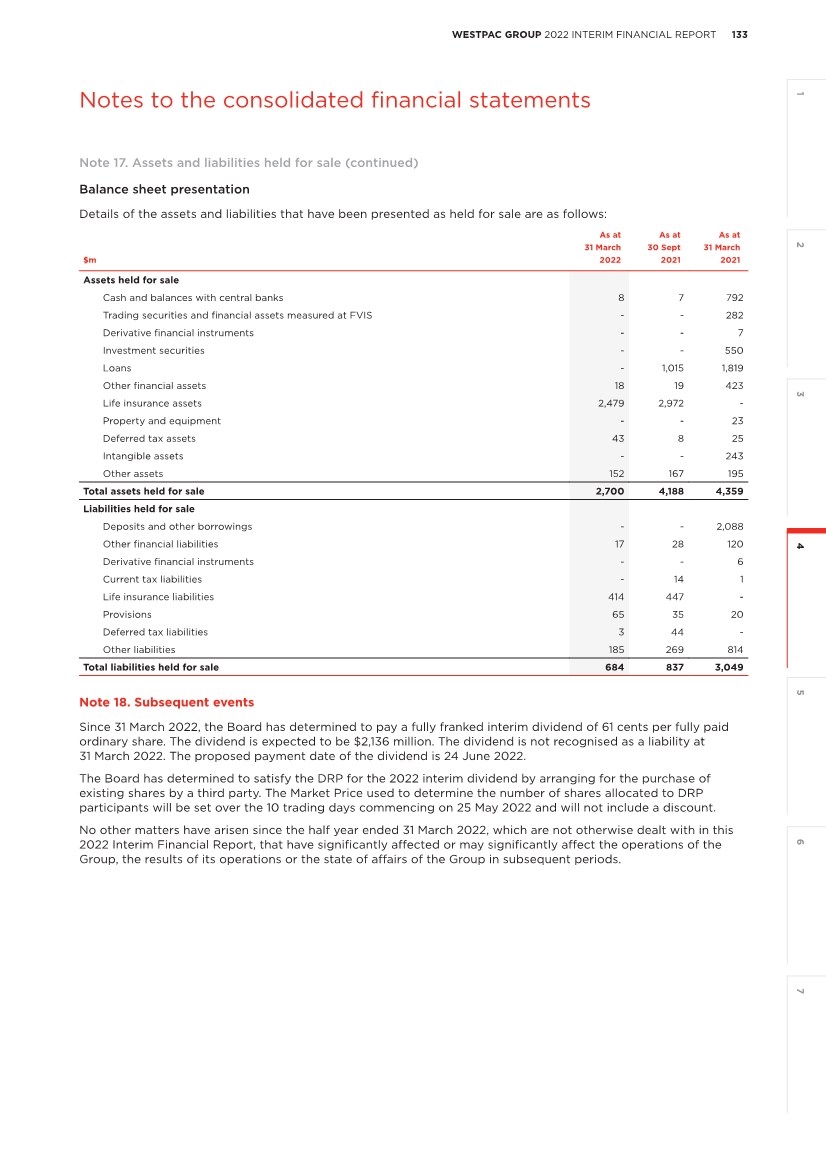
| 135 134 WESTPAC GROUP 2022 INTERIM FINANCIAL REPORT WESTPAC GROUP 2022 INTERIM FINANCIAL REPORT Statutory Statements 4.8 Statutory statements Directors’ declaration In the Directors’ opinion (i) the interim financial statements and notes set out on pages 97 to 133 are in accordance with the Corporations Act 2001, including that they: a. comply with Australian Accounting Standards, the Corporations Regulations 2001 and other mandatory professional reporting requirements; and b. give a true and fair view of the Group’s financial position as at 31 March 2022 and of its performance for the six months ended 31 March 2022; and (ii) there are reasonable grounds to believe that Westpac will be able to pay its debts as and when they become due and payable. This declaration is made in accordance with a resolution of the Directors. For and on behalf of the Board John McFarlane Peter King Chairman Managing Director and Sydney Australia Chief Executive Officer 8 May 2022 Statutory Statements |
| 135 134 WESTPAC GROUP 2022 INTERIM FINANCIAL REPORT WESTPAC GROUP 2022 INTERIM FINANCIAL REPORT 4 2 3 1 5 6 7 Statutory Statements PricewaterhouseCoopers, ABN 52 780 433 757 One International Towers Sydney, Watermans Quay, Barangaroo, GPO BOX 2650, SYDNEY NSW 2001 T: +61 2 8266 0000, F: +61 2 8266 9999 Liability limited by a scheme approved under Professional Standards Legislation. Independent auditor's review report to the members of Westpac Banking Corporation Report on the interim financial report Conclusion We have reviewed the interim financial report of Westpac Banking Corporation (the Company) and the entities it controlled during the half-year (together the Group), which comprises the consolidated balance sheet as at 31 March 2022, the consolidated statement of comprehensive income, consolidated statement of changes in equity, consolidated cash flow statement and consolidated income statement for the half-year ended on that date, significant accounting policies and explanatory notes and the directors' declaration. Based on our review, which is not an audit, we have not become aware of any matter that makes us believe that the accompanying interim financial report of Westpac Banking Corporation does not comply with the Corporations Act 2001 including: 1. giving a true and fair view of the Group's financial position as at 31 March 2022 and of its performance for the half-year ended on that date 2. complying with Accounting Standard AASB 134 Interim Financial Reporting and the Corporations Regulations 2001. Basis for conclusion We conducted our review in accordance with ASRE 2410 Review of a Financial Report Performed by the Independent Auditor of the Entity (ASRE 2410). Our responsibilities are further described in the Auditor’s responsibilities for the review of the interim financial report section of our report. We are independent of the Group in accordance with the auditor independence requirements of the Corporations Act 2001 and the ethical requirements of the Accounting Professional & Ethical Standards Board’s APES 110 Code of Ethics for Professional Accountants (including Independence Standards) (the Code) that are relevant to the audit of the annual financial report in Australia. We have also fulfilled our other ethical responsibilities in accordance with the Code. Responsibilities of the directors for the interim financial report The directors of the Company are responsible for the preparation of the interim financial report that gives a true and fair view in accordance with Australian Accounting Standards and the Corporations Act 2001 and for such internal control as the directors determine is necessary to enable the preparation of the interim financial report that gives a true and fair view and is free from material misstatement whether due to fraud or error. Auditor's responsibilities for the review of the interim financial report Our responsibility is to express a conclusion on the interim financial report based on our review. ASRE 2410 requires us to conclude whether we have become aware of any matter that makes us believe that the interim financial report is not in accordance with the Corporations Act 2001 including giving a true |
| PB 136 WESTPAC GROUP 2022 INTERIM FINANCIAL REPORT WESTPAC GROUP 2022 INTERIM FINANCIAL REPORT Statutory Statements and fair view of the Group's financial position as at 31 March 2022 and of its performance for the half- year ended on that date, and complying with Accounting Standard AASB 134 Interim Financial Reporting and the Corporations Regulations 2001. A review of an interim financial report consists of making enquiries, primarily of persons responsible for financial and accounting matters, and applying analytical and other review procedures. A review is substantially less in scope than an audit conducted in accordance with Australian Auditing Standards and consequently does not enable us to obtain assurance that we would become aware of all significant matters that might be identified in an audit. Accordingly, we do not express an audit opinion. PricewaterhouseCoopers Colin Heath Sydney Partner 8 May 2022 |
| 137 WESTPAC GROUP 2022 INTERIM FINANCIAL RESULTS 2 3 4 6 7 5 1 Cash earnings financial information 5.0 Cash earnings financial information Note 1 Interest spread and margin analysis (cash earnings basis) 138 Note 2 Average balance sheet and interest rates (cash earnings basis) 139 Note 3 Net interest income (cash earnings basis) 140 Note 4 Non-interest income (cash earnings basis) 141 Note 5 Operating expenses (cash earnings basis) 142 Note 6 Earnings per share (cash earnings basis) 142 Note 7 Group earnings reconciliation 143 Note 8 Cash earnings contribution of businesses settled and held for sale 145 Note 9 Impact of notable items on cash earnings 147 Cash earnings financial information |
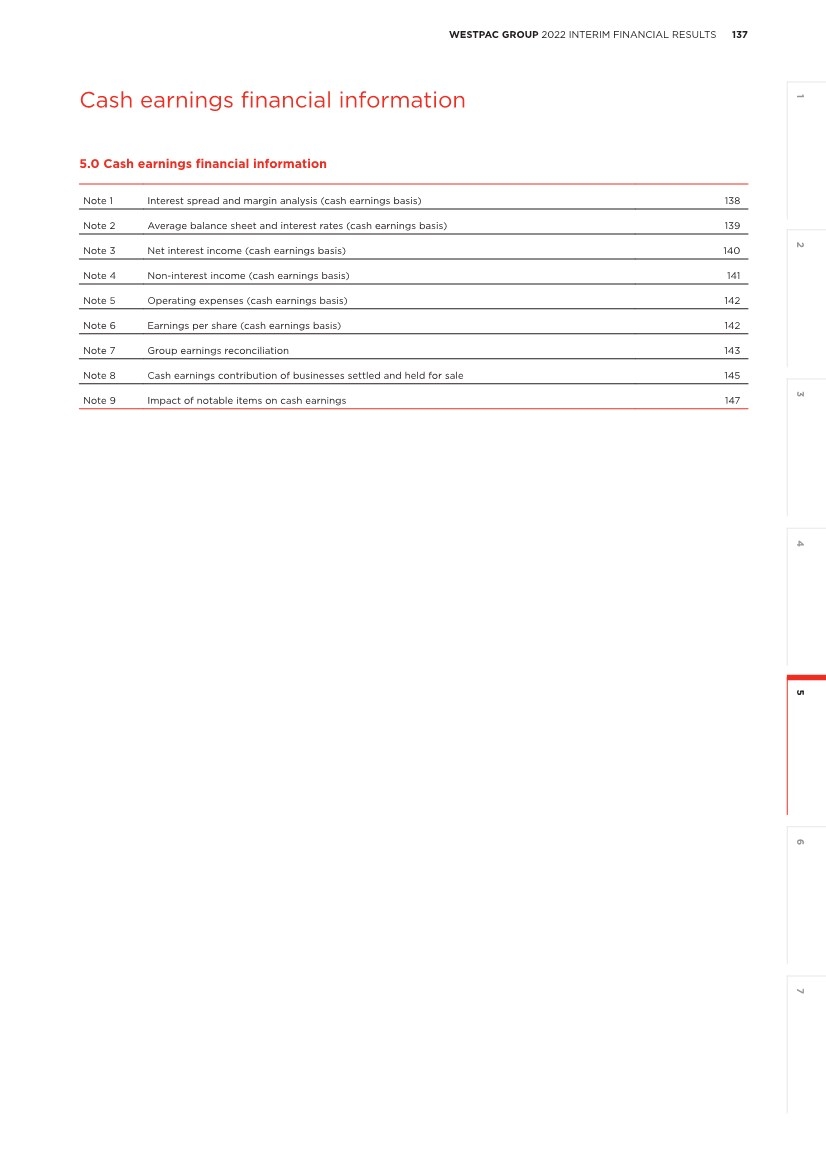
| 138 WESTPAC GROUP 2022 INTERIM FINANCIAL RESULTS Cash earnings financial information Note 1. Interest spread and margin analysis (cash earnings basis) Half Year Half Year Half Year March Sept March 2022 2021 2021 Group Average interest earning assets ($m) 872,075 825,926 812,950 Net interest income ($m) 8,028 8,245 8,469 Interest spread 1.79% 1.92% 2.01% Benefit of net non-interest bearing assets, liabilities and equity 0.06% 0.07% 0.08% Net interest margin 1.85% 1.99% 2.09% Analysis by segment Average interest earning assets ($m) Consumer 420,302 415,432 408,001 Business 79,607 78,499 79,735 Westpac Institutional Bank 82,614 73,683 74,137 Westpac New Zealand (A$) 105,574 101,694 97,001 Specialist Businesses1 14,067 15,555 16,279 Group Businesses 169,911 141,063 137,797 Group total 872,075 825,926 812,950 Westpac New Zealand (NZ$) 111,819 108,047 103,761 Net interest income ($m)2 Consumer 4,377 4,722 4,764 Business 1,323 1,451 1,536 Westpac Institutional Bank 481 458 467 Westpac New Zealand (A$) 1,041 991 996 Specialist Businesses 242 246 248 Group Businesses 564 377 458 Group total 8,028 8,245 8,469 Westpac New Zealand (NZ$) 1,102 1,052 1,066 Interest margin Consumer 2.09% 2.27% 2.34% Business 3.33% 3.69% 3.86% Westpac Institutional Bank 1.17% 1.24% 1.26% Westpac New Zealand (NZ$) 1.98% 1.94% 2.06% Specialist Businesses 3.45% 3.15% 3.06% Group Businesses 0.67% 0.53% 0.67% Group total 1.85% 1.99% 2.09% 1. Includes balances presented as held for sale. 2. Includes capital benefit. Capital benefit represents the notional revenue earned on capital allocated to segments under Westpac’s economic capital framework. |
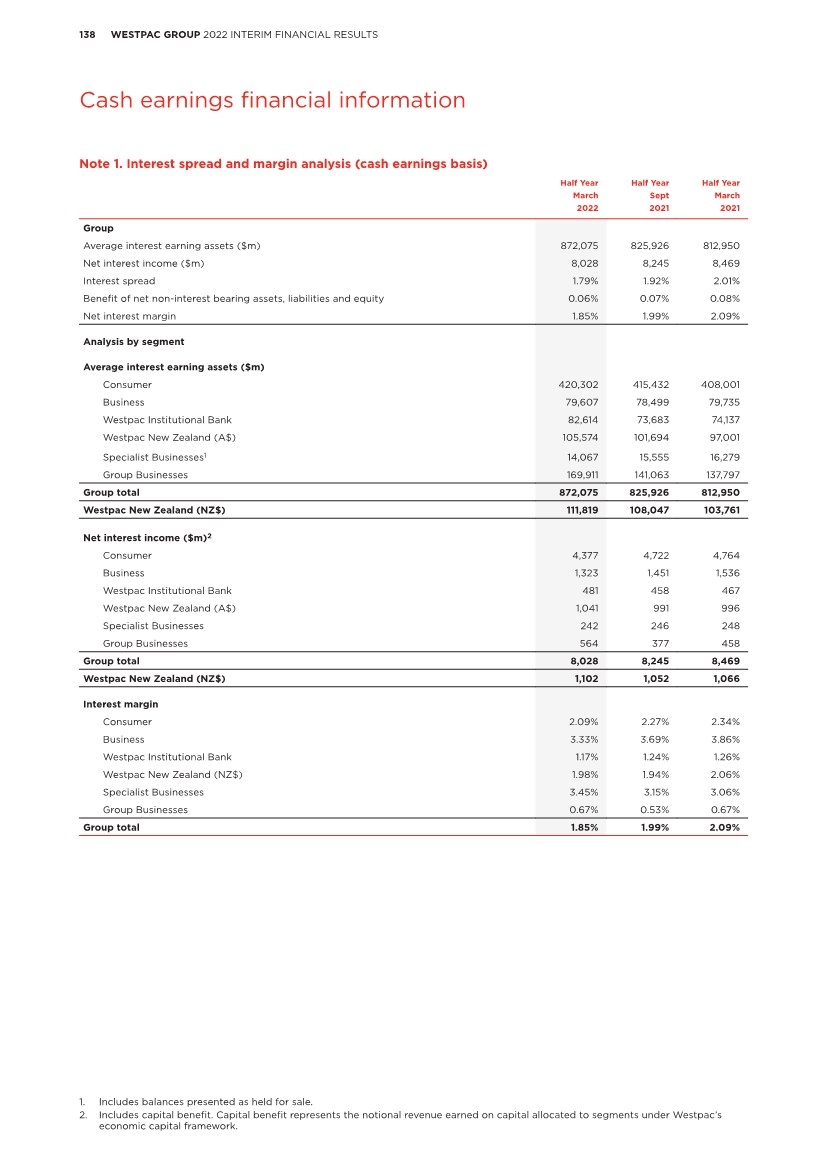
| 139 WESTPAC GROUP 2022 INTERIM FINANCIAL RESULTS 2 3 4 6 7 5 1 Cash earnings financial information Note 2. Average balance sheet and interest rates (cash earnings basis) Half Year Mar 22 Half Year Sept 21 Half Year Mar 21 Average Average Average Average Average Average balance Interest rate balance Interest rate balance Interest rate $m $m % $m $m % $m $m % Assets Interest earning assets Collateral paid 6,261 4 0.1 9,762 6 0.1 14,708 10 0.1 Trading securities and financial assets measured at FVIS 22,243 123 1.1 20,428 101 1.0 27,172 91 0.7 Investment securities 77,779 506 1.3 87,790 574 1.3 87,628 626 1.4 Loans and other receivables1 764,946 9,593 2.5 702,821 10,078 2.9 680,286 10,710 3.2 Assets held for sale 846 6 1.4 5,125 63 2.5 3,156 65 4.1 Total interest earning assets and interest income 872,075 10,232 2.4 825,926 10,822 2.6 812,950 11,502 2.8 Non-interest earning assets Derivative financial instruments 18,283 18,740 21,879 Life insurance assets - (3,105) 3,575 Assets held for sale 3,048 7,895 1,267 All other assets2 64,427 61,198 61,760 Total non-interest earning assets 85,758 84,728 88,481 Total assets 957,833 910,654 901,431 Liabilities Interest bearing liabilities Collateral received 4,239 4 0.2 5,891 2 0.1 6,483 2 0.1 Repurchased agreements 35,740 38 0.2 37,106 30 0.2 30,047 26 0.2 Deposits and other borrowings 570,842 761 0.3 537,943 761 0.3 524,723 1,107 0.4 Loan capital 30,504 440 2.9 27,642 440 3.2 25,540 409 3.2 Other interest bearing liabilities3 145,068 961 1.3 133,426 1,341 2.0 141,162 1,480 2.1 Liabilities held for sale - - - 1,338 3 0.4 1,332 9 1.4 Total interest bearing liabilities and interest expense 786,393 2,204 0.6 743,346 2,577 0.7 729,287 3,033 0.8 Non-interest bearing liabilities Deposits and other borrowings 69,413 63,569 60,473 Derivative financial instruments 19,035 17,142 24,101 Life insurance liabilities - (783) 1,295 Liabilities held for sale 775 3,840 1,610 All other liabilities4 11,087 11,383 15,031 Total non-interest bearing liabilities 100,310 95,151 102,510 Total liabilities 886,703 838,497 831,797 Shareholders’ equity 71,073 72,108 69,583 NCI 57 49 51 Total equity 71,130 72,157 69,634 Total liabilities and equity 957,833 910,654 901,431 Loans and other receivables1 Australia 648,399 8,019 2.5 594,388 8,675 2.9 576,394 9,226 3.2 New Zealand 97,814 1,480 3.0 93,882 1,335 2.8 89,570 1,416 3.2 Other overseas 18,733 94 1.0 14,551 68 0.9 14,322 68 1.0 Deposits and other borrowings Australia 489,642 489 0.2 463,114 558 0.2 452,206 842 0.4 New Zealand 61,263 243 0.8 60,482 182 0.6 59,648 236 0.8 Other overseas 19,937 29 0.3 14,347 21 0.3 12,869 29 0.5 1. Loans and other receivables are net of Stage 3 provision for ECL, where interest income is determined based on their carrying value. Stages 1 and 2 provisions for ECL are not included in the average interest earning assets balance, as interest income is determined based on the gross value of loans and other receivables. 2. Includes property and equipment, intangible assets, deferred tax assets, non-interest bearing loans relating to mortgage offset accounts and all other non-interest earning financial assets. 3. Includes net impact of Treasury balance sheet management activities and the Bank Levy. 4. Includes other financial liabilities, provisions, current and deferred tax liabilities and other non-interest bearing liabilities. |
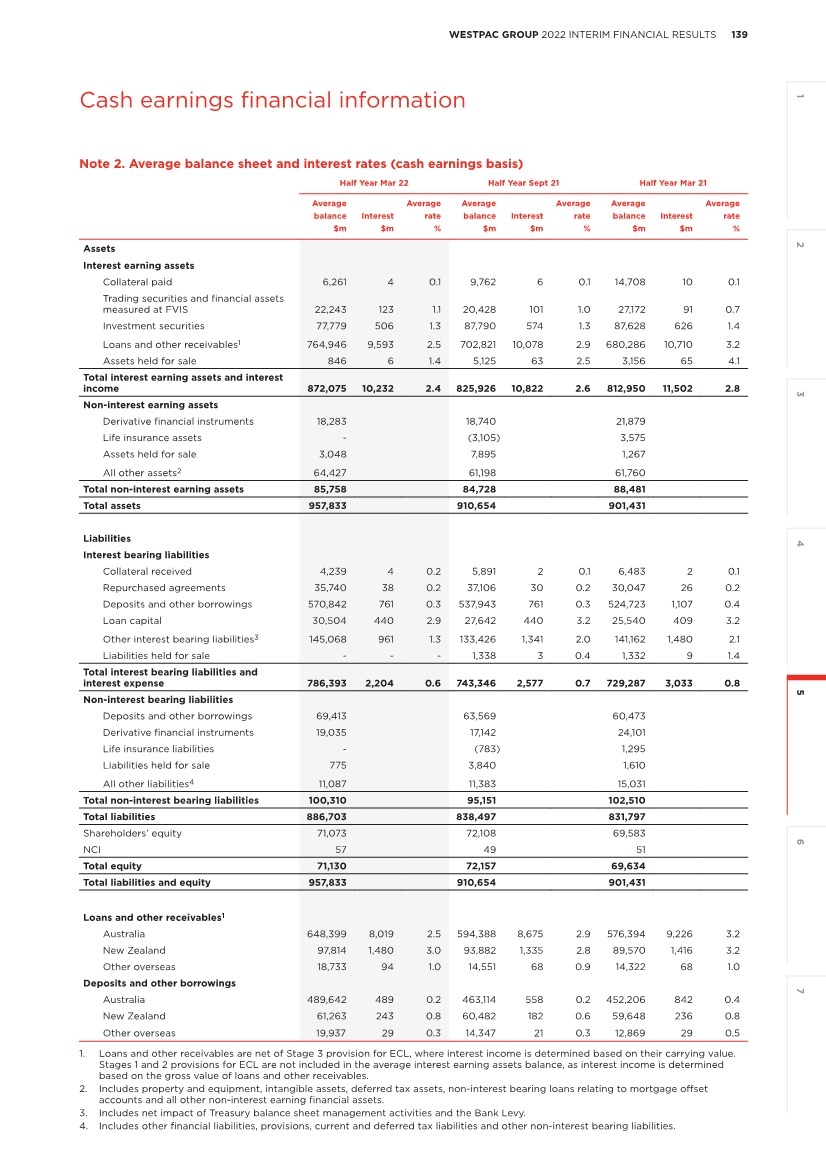
| 140 WESTPAC GROUP 2022 INTERIM FINANCIAL RESULTS Cash earnings financial information Note 3. Net interest income (cash earnings basis) Half Year Half Year Half Year % Mov’t March Sept March Mar 22 Mar 22 $m 2022 2021 2021 - Sept 21 - Mar 21 Interest income Cash and balances with central banks 46 15 15 large large Collateral paid 4 6 10 (33) (60) Net ineffectiveness on qualifying hedges - - - - - Trading securities and financial assets measured at FVIS 123 101 91 22 35 Investment securities 506 574 626 (12) (19) Loans 9,547 10,063 10,693 (5) (11) Other financial assets - - 2 - (100) Assets held for sale 6 63 65 (90) (91) Total interest income 10,232 10,822 11,502 (5) (11) Interest expense Collateral received (4) (2) (2) 100 100 Deposits and other borrowings (761) (761) (1,107) - (31) Trading liabilities1 165 (86) (226) large large Debt issues (882) (939) (986) (6) (11) Loan capital (440) (440) (409) - 8 Bank Levy (177) (197) (195) (10) (9) Other interest expense (105) (149) (99) (30) 6 Liabilities held for sale - (3) (9) (100) (100) Total interest expense (2,204) (2,577) (3,033) (14) (27) Net interest income 8,028 8,245 8,469 (3) (5) 1. Includes the net impact of Treasury balance sheet management activities. |
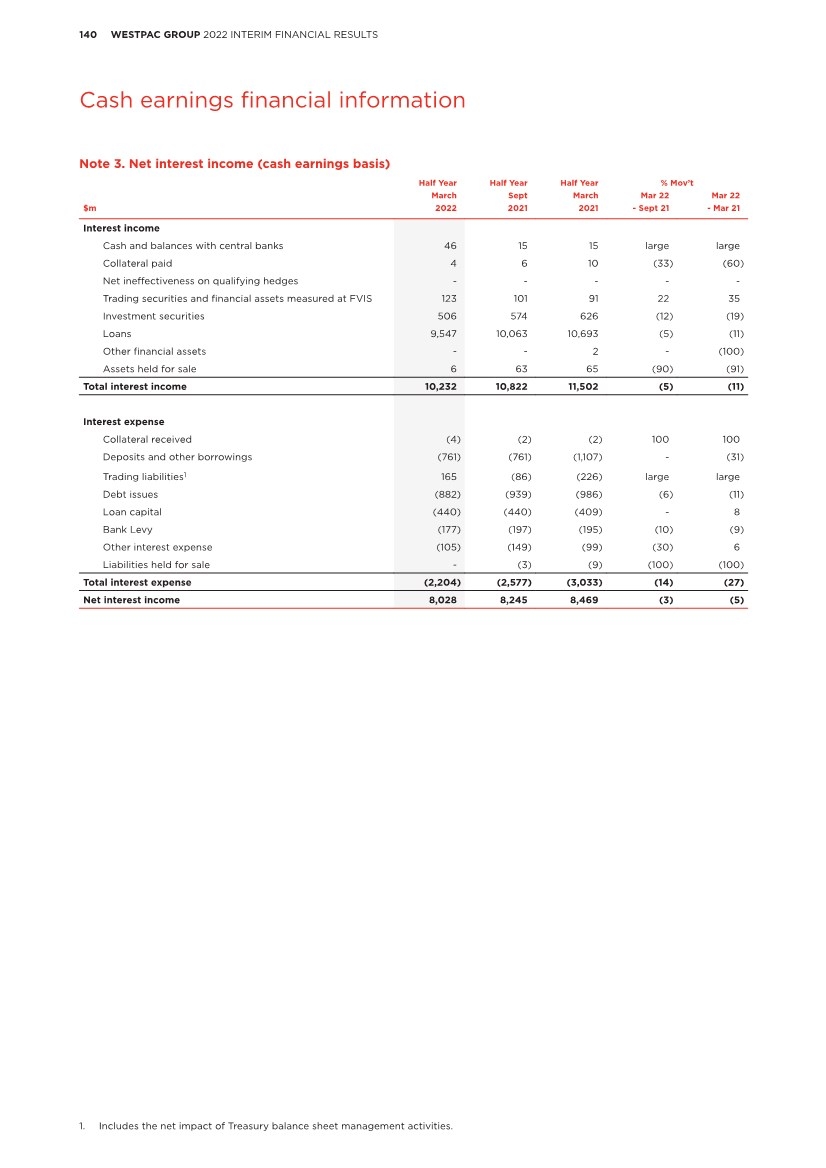
| 141 WESTPAC GROUP 2022 INTERIM FINANCIAL RESULTS 2 3 4 6 7 5 1 Cash earnings financial information Note 4. Non-interest income (cash earnings basis) Half Year Half Year Half Year % Mov’t March Sept March Mar 22 Mar 22 $m 2022 2021 2021 - Sept 21 - Mar 21 Net fee income Facility fees 344 348 369 (1) (7) Transaction fees 556 501 492 11 13 Other non-risk fee income 72 47 (47) 53 large Fee income 972 896 814 8 19 Credit card loyalty programs (60) (46) (55) 30 9 Transaction fee related expenses (67) (68) (59) (1) 14 Fee expenses (127) (114) (114) 11 11 Net fee income 845 782 700 8 21 Net wealth management and insurance income Wealth management income 361 346 311 4 16 Life insurance premium income 520 548 529 (5) (2) General insurance and lenders mortgage insurance (LMI) net premiums earned - 131 256 (100) (100) Life insurance investment and other income (129) 34 20 large large General insurance and LMI investment and other income - 39 37 (100) (100) Total insurance premium, investment and other income 391 752 842 (48) (54) Life insurance claims, changes in life insurance liabilities and other expenses (351) (439) (328) (20) 7 General insurance and LMI claims and other expenses - (48) (230) (100) (100) Total insurance claims, changes in insurance liabilities and other expenses (351) (487) (558) (28) (37) Net wealth management and insurance income 401 611 595 (34) (33) Trading income1 339 262 453 29 (25) Other income Dividends received from other entities 3 2 2 50 50 Net gain/(loss) on sale/derecognition of associates 13 36 7 (64) 86 Net gain/(loss) on disposal of assets (2) (3) 10 (33) large Net gain/(loss) on hedging of overseas operations (1) (2) (6) (50) (83) Net gain/(loss) on derivatives held for risk management purposes2 7 (3) 4 large 75 Net gain/(loss) on financial instruments measured at fair value 16 75 580 (79) (97) Net gain/(loss) on disposal of controlled entities and other businesses 289 188 - 54 - Rental income on operating leases 2 7 6 (71) (67) Share of associates’ net profit/(loss) (3) (3) (3) - - Other 22 42 (18) (48) large Total other income 346 339 582 2 (41) Total non-interest income 1,931 1,994 2,330 (3) (17) 1. Trading income represents a component of total markets income from our WIB markets business, Westpac Pacific, Westpac New Zealand and Treasury foreign exchange operations in Australia and New Zealand. 2. Net gain/(loss) on derivatives held for risk management purposes reflects the impact of economic hedges of earnings. |
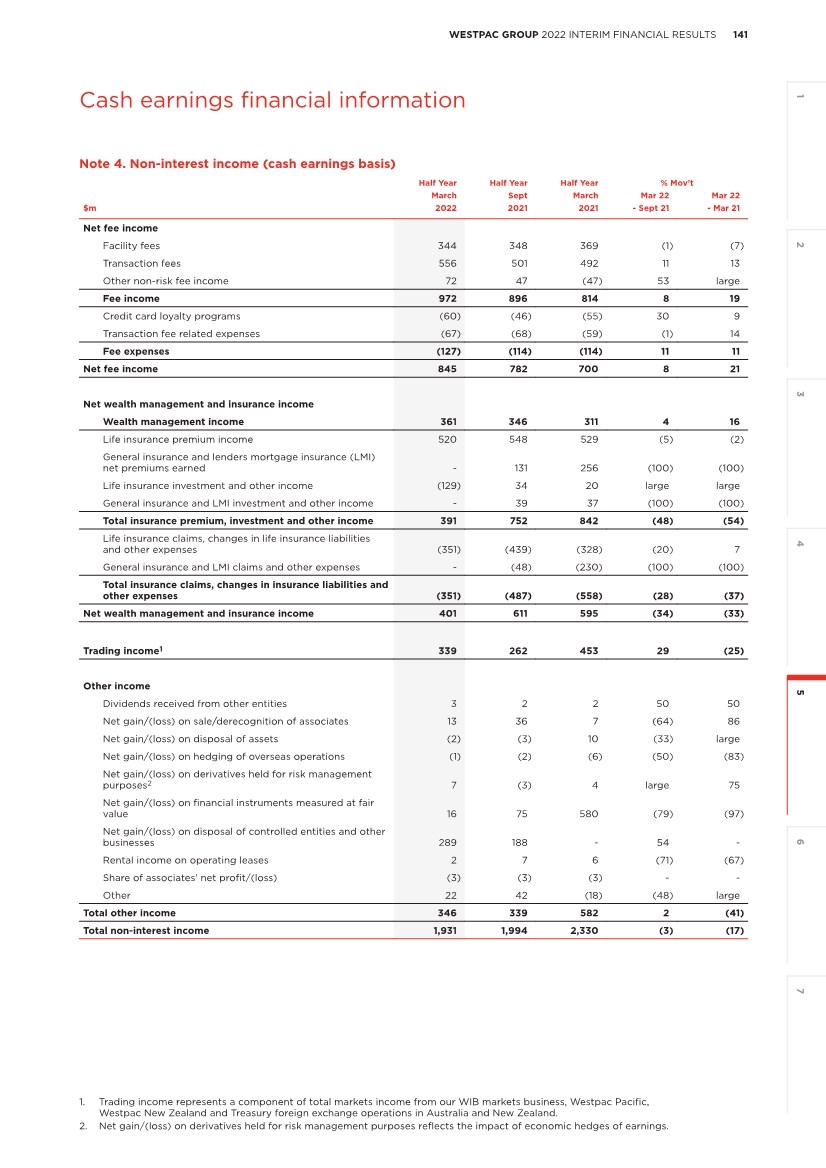
| 142 WESTPAC GROUP 2022 INTERIM FINANCIAL RESULTS Cash earnings financial information Note 5. Operating expenses (cash earnings basis) Half Year Half Year Half Year % Mov’t March Sept March Mar 22 Mar 22 $m 2022 2021 2021 - Sept 21 - Mar 21 Staff expenses Employee remuneration, entitlements and on-costs 2,584 2,897 2,472 (11) 5 Superannuation expense 278 244 231 14 20 Share-based payments 46 51 46 (10) - Restructuring costs 74 71 22 4 large Total staff expenses 2,982 3,263 2,771 (9) 8 Occupancy expenses Operating lease rentals 79 91 73 (13) 8 Depreciation and impairment of property and equipment 254 514 413 (51) (38) Other 58 50 57 16 2 Total occupancy expenses 391 655 543 (40) (28) Technology expenses Amortisation and impairment of software assets 337 723 517 (53) (35) Depreciation and impairment of IT equipment 85 142 118 (40) (28) Technology services 342 422 398 (19) (14) Software maintenance and licences 248 297 234 (16) 6 Telecommunications 72 88 93 (18) (23) Data processing 41 51 45 (20) (9) Total technology expenses 1,125 1,723 1,405 (35) (20) Other expenses Professional and processing services 460 682 728 (33) (37) Amortisation and impairment of intangible and deferred expenditure 122 509 90 (76) 36 Postage and stationery 74 82 74 (10) - Advertising 81 104 116 (22) (30) Non-lending losses 45 156 78 (71) (42) Other expenses 86 128 176 (33) (51) Total other expenses 868 1,661 1,262 (48) (31) Total operating expenses 5,366 7,302 5,981 (27) (10) Note 6. Earnings per share (cash earnings basis) Half Year Half Year Half Year % Mov’t March Sept March Mar 22 Mar 22 2022 2021 2021 - Sept 21 - Mar 21 Cash earnings ($m) 3,095 1,815 3,537 71 (12) Weighted average number of fully paid ordinary shares (millions) 3,626 3,669 3,644 (1) - Cash earnings per ordinary share (cents) 85.4 49.5 97.1 73 (12) Half Year Half Year Half Year Reconciliation of ordinary shares on issue before the effect of own shares held March Sept March (millions) 2022 2021 2021 Balance as at beginning of period 3,669 3,669 3,612 Number of shares bought back (168) - - Number of shares issued under the Dividend Reinvestment Plan (DRP) - - 20 Number of shares issued under the DRP underwrite - - 37 Balance as at end of period 3,501 3,669 3,669 |

| 143 WESTPAC GROUP 2022 INTERIM FINANCIAL RESULTS 2 3 4 6 7 5 1 Cash earnings financial information Note 7. Group earnings reconciliation Fair value (gain)/loss Policyholder Reported on economic Ineffective Operating tax Cash $m results hedges hedges leases recoveries earnings Half Year March 2022 Net interest income 8,288 (287) 27 - - 8,028 Net fee income 845 - - - - 845 Net wealth management and insurance income 401 - - - - 401 Trading income 343 (4) - - - 339 Other income 353 - - (7) - 346 Non-interest income 1,942 (4) - (7) - 1,931 Net operating income 10,230 (291) 27 (7) - 9,959 Staff expenses (2,982) - - - - (2,982) Occupancy expenses (398) - - 7 - (391) Technology expenses (1,125) - - - - (1,125) Other expenses (868) - - - - (868) Operating expenses (5,373) - - 7 - (5,366) Core earnings 4,857 (291) 27 - - 4,593 Impairment (charges)/benefits (139) - - - - (139) Profit before income tax 4,718 (291) 27 - - 4,454 Income tax expense (1,434) 87 (8) - - (1,355) Net profit 3,284 (204) 19 - - 3,099 Net profit attributable to NCI (4) - - - - (4) Net profit attributable to owners of WBC 3,280 (204) 19 - - 3,095 Cash earnings adjustments: Fair value (gain)/loss on economic hedges (204) 204 - - - - Ineffective hedges 19 - (19) - - - Cash earnings 3,095 - - - - 3,095 Half Year Sept 2021 Net interest income 8,510 (243) (22) - - 8,245 Net fee income 782 - - - - 782 Net wealth management and insurance income 613 - - - (2) 611 Trading income 277 (15) - - - 262 Other income 354 (3) - (12) - 339 Non-interest income 2,026 (18) - (12) (2) 1,994 Net operating income 10,536 (261) (22) (12) (2) 10,239 Staff expenses (3,263) - - - - (3,263) Occupancy expenses (667) - - 12 - (655) Technology expenses (1,723) - - - - (1,723) Other expenses (1,661) - - - - (1,661) Operating expenses (7,314) - - 12 - (7,302) Core earnings 3,222 (261) (22) - (2) 2,937 Impairment (charges)/benefits 218 - - - - 218 Profit before income tax 3,440 (261) (22) - (2) 3,155 Income tax expense (1,422) 77 6 - 2 (1,337) Net profit 2,018 (184) (16) - - 1,818 Net profit attributable to NCI (3) - - - - (3) Net profit attributable to owners of WBC 2,015 (184) (16) - - 1,815 Cash earnings adjustments: Fair value (gain)/loss on economic hedges (184) 184 - - - - Ineffective hedges (16) - 16 - - - Cash earnings 1,815 - - - - 1,815 |
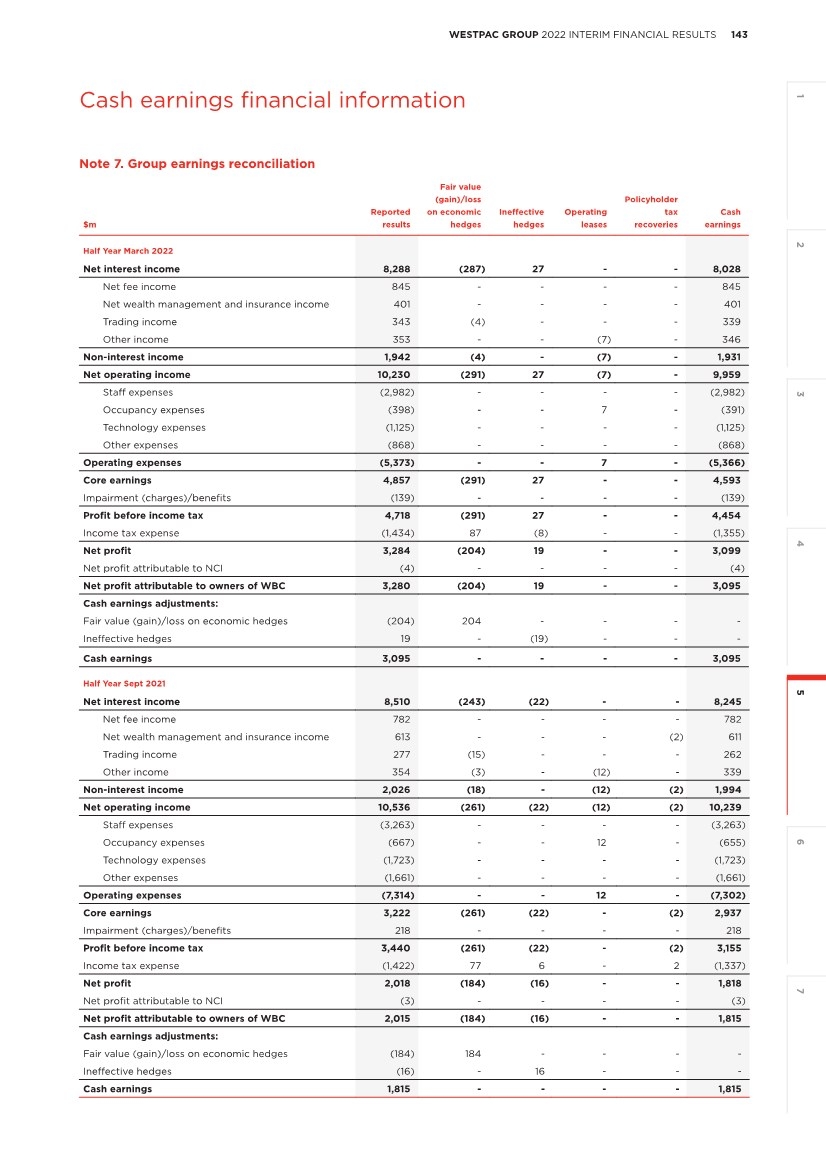
| 144 WESTPAC GROUP 2022 INTERIM FINANCIAL RESULTS Cash earnings financial information Note 7. Group earnings reconciliation (continued) Fair value (gain)/loss Policyholder Reported on economic Ineffective Operating tax Cash $m results hedges hedges leases recoveries earnings Half Year March 2021 Net interest income 8,348 53 68 - - 8,469 Net fee income 700 - - - - 700 Net wealth management and insurance income 598 - - - (3) 595 Trading income 442 11 - - - 453 Other income 598 - - (16) - 582 Non-interest income 2,338 11 - (16) (3) 2,330 Net operating income 10,686 64 68 (16) (3) 10,799 Staff expenses (2,771) - - - - (2,771) Occupancy expenses (559) - - 16 - (543) Technology expenses (1,405) - - - - (1,405) Other expenses (1,262) - - - - (1,262) Operating expenses (5,997) - - 16 - (5,981) Core earnings 4,689 64 68 - (3) 4,818 Impairment (charges)/benefits 372 - - - - 372 Profit before income tax 5,061 64 68 - (3) 5,190 Income tax expense (1,616) (18) (20) - 3 (1,651) Net profit 3,445 46 48 - - 3,539 Net profit attributable to NCI (2) - - - - (2) Net profit attributable to owners of WBC 3,443 46 48 - - 3,537 Cash earnings adjustments: Fair value (gain)/loss on economic hedges 46 (46) - - - - Ineffective hedges 48 - (48) - - - Cash earnings 3,537 - - - - 3,537 |
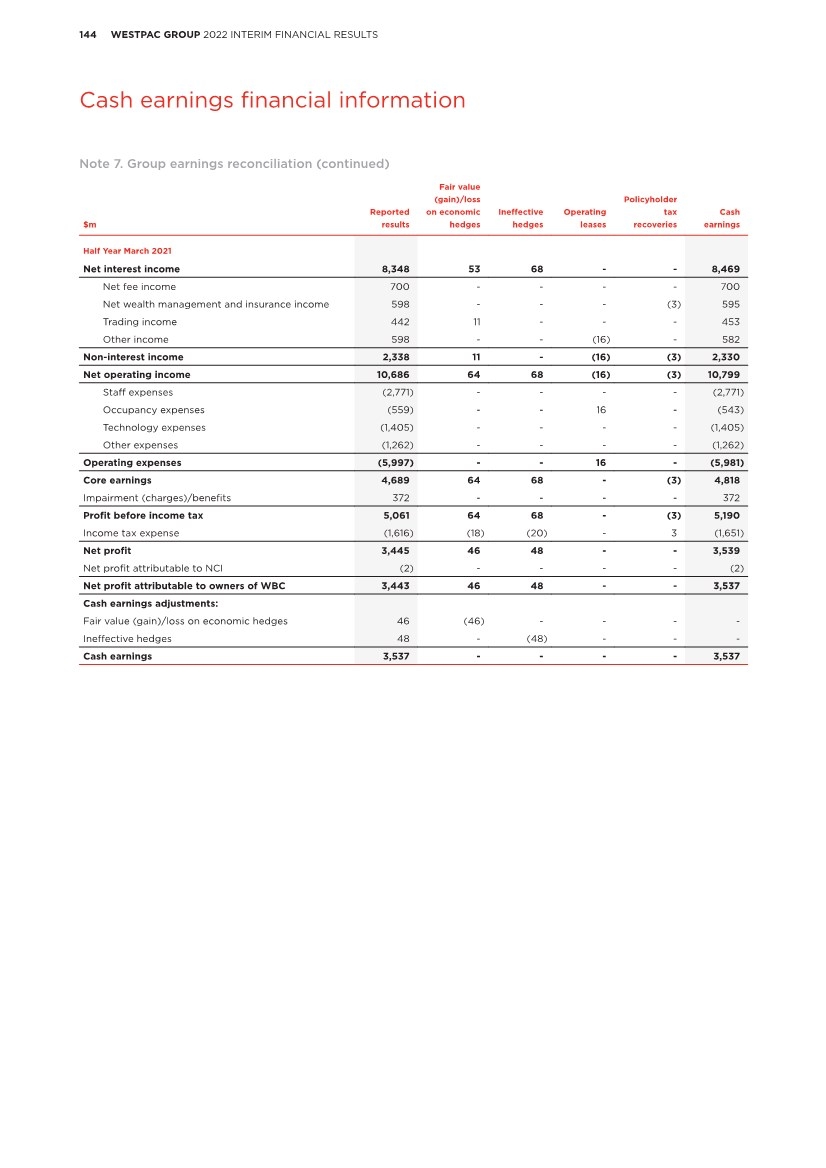
| 145 WESTPAC GROUP 2022 INTERIM FINANCIAL RESULTS 2 3 4 6 7 5 1 Cash earnings financial information Note 8. Cash earnings contribution of businesses settled and held for sale In First Half 2022, Westpac announced and completed the sale of certain businesses. To assist in understanding the contribution of these businesses the following tables provide the earnings (excluding notable items), and loans and deposits attributable to the entities within the transaction perimeter. Businesses included in these disclosures were either “held for sale” as at 31 March 2022 or sold during First Half 2022. For the businesses that were sold, earnings attributed to each business reflect its contribution up to completion of sale date, while balance sheet data is at completion date. The following businesses were sold in First Half 2022: • Motor vehicle dealer finance and novated leasing was transferred on 20 December 2021. Final completion of the sales transaction occurred on 24 March 2022. • Westpac Life-NZ- Limited occurred on 28 February 2022. The following business is held for sale as at 31 March 2022: • Westpac Life Insurance Services Limited. Businesses sold Westpac Motor Vehicle Westpac Westpac Contribution Westpac Life-NZ- Finance and General Lenders Westpac of Life-NZ- $m Limited (A$) Novated Leasing Insurance Ltd Mortgage Insurance Vendor Finance businesses sold Limited (NZ$) Half Year March 2022 Net interest income - 6 - - - 6 - Non-interest income 28 - - - - 28 30 Operating expenses (3) (6) - - - (9) (3) Impairment charges - 7 - - - 7 - Income tax expense and NCI (7) (2) - - - (9) (8) Cash earnings excluding notable items 18 5 - - - 23 19 Subtract notable items - - - - - - - Cash earnings 18 5 - - - 23 19 Half Year Sept 2021 Net interest income - 11 - - 5 16 - Non-interest income 31 - 70 56 2 159 33 Operating expenses (2) (15) (3) (3) - (23) (2) Impairment charges - 14 - - - 14 - Income tax expense and NCI (8) (3) (23) (15) (2) (51) (8) Cash earnings excluding notable items 21 7 44 38 5 115 23 Subtract notable items - - - - - - - Cash earnings 21 7 44 38 5 115 23 Half Year March 2021 Net interest income - 14 - - 9 23 - Non-interest income 27 - 10 53 1 91 29 Operating expenses (2) (15) (4) (5) - (26) (2) Impairment charges - 15 - - - 15 - Income tax expense and NCI (7) (4) (2) (15) (3) (31) (7) Cash earnings excluding notable items 18 10 4 33 7 72 20 Subtract notable items - - - - - - - Cash earnings 18 10 4 33 7 72 20 |
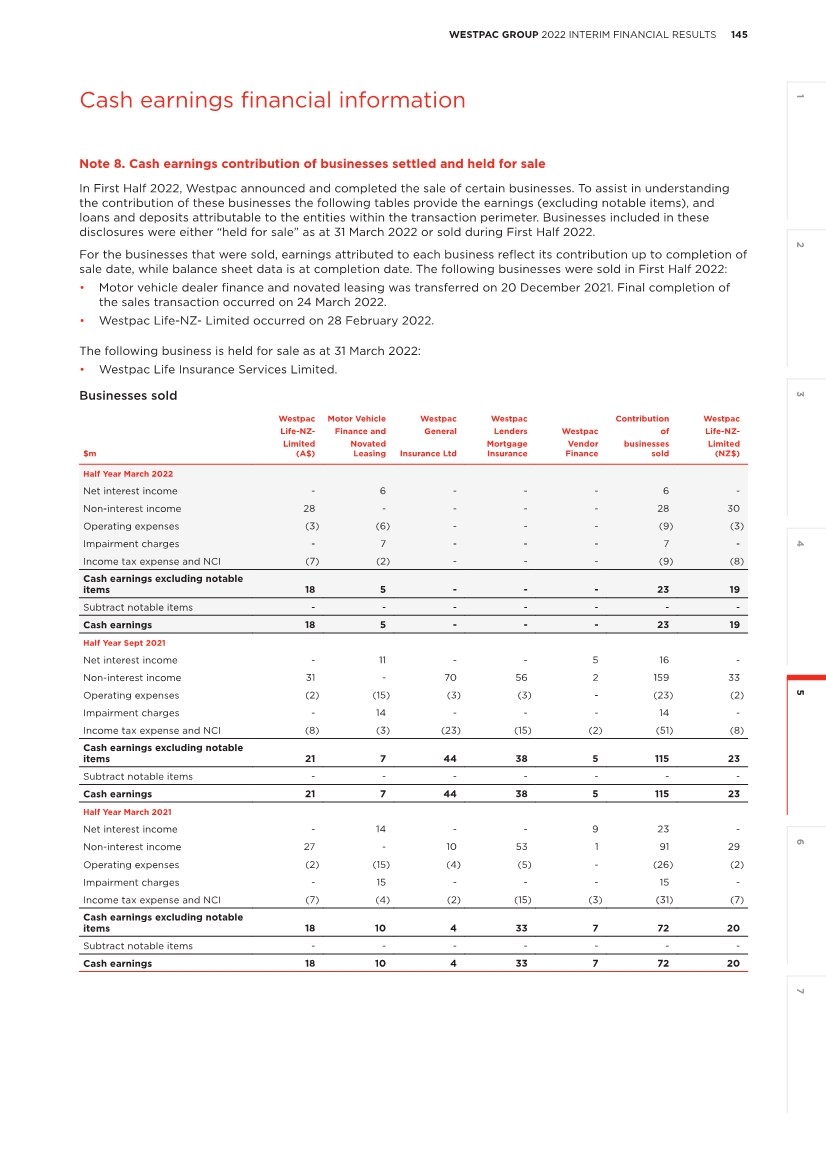
| 146 WESTPAC GROUP 2022 INTERIM FINANCIAL RESULTS Cash earnings financial information Note 8. Cash earnings contribution of businesses settled and held for sale (continued) Westpac Motor Vehicle Westpac Westpac Contribution Westpac Life-NZ- Finance and General Lenders Westpac of Life-NZ- $bn Limited (A$) Novated Leasing Insurance Ltd Mortgage Insurance Vendor Finance businesses sold Limited (NZ$) As at 31 March 2022 Total net loans - 1.0 - - - 1.0 - Total assets 0.2 1.0 - - - 1.2 0.2 Risk weighted assets - 0.8 - - - 0.8 - Average interest-earning assets - 0.8 - - - 0.8 - As at 30 Sept 2021 Total net loans - 1.0 - - 0.4 1.4 - Total assets 0.2 1.0 1.1 0.5 0.4 3.2 0.3 Risk weighted assets - 1.1 - - 0.5 1.6 - Average interest-earning assets - 1.0 0.1 - 0.5 1.6 - Businesses held for sale as at 31 March 2022 Westpac Life $m Insurance Ltd. Half Year March 2022 Net interest income - Non-interest income 62 Operating expenses (13) Impairment charges - Income tax expense and NCI (15) Cash earnings excluding notable items 34 Subtract notable items (34) Cash earnings - Half Year Sept 2021 Net interest income - Non-interest income 116 Operating expenses (30) Impairment charges - Income tax expense and NCI (16) Cash earnings excluding notable items 70 Subtract notable items - Cash earnings 70 Half Year March 2021 Net interest income - Non-interest income 215 Operating expenses (26) Impairment charges - Income tax expense and NCI (57) Cash earnings excluding notable items 132 Subtract notable items (1) Cash earnings 131 Westpac Life $bn Insurance Ltd. As at 31 March 2022 Total assets 2.7 As at 30 Sept 2021 Total assets 2.9 As at 31 March 2021 Total assets 3.4 |
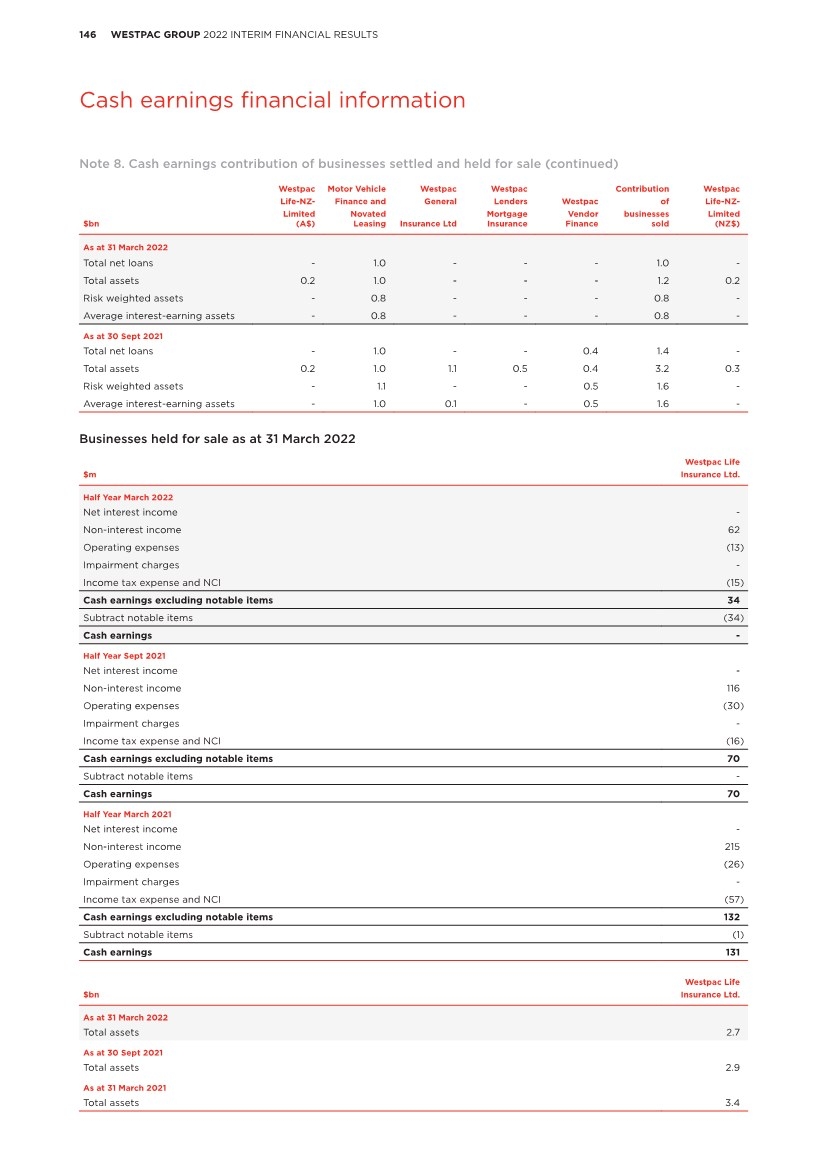
| 147 WESTPAC GROUP 2022 INTERIM FINANCIAL RESULTS 2 3 4 6 7 5 1 Cash earnings financial information Note 9. Impact of notable items on cash earnings $m Refunds, payments, costs, and litigation Write-down of intangibles Asset sales and revaluations Total Half Year March 2022 Net interest income 7 - - 7 Net fee income - - - - Net wealth management and insurance income (43) - - (43) Trading income - - - - Other income - - 271 271 Non-interest income (43) - 271 228 Net operating income (36) - 271 235 Staff expenses (10) - (9) (19) Occupancy expenses - - - - Technology expenses - (45) - (45) Other expenses (36) (122) (9) (167) Operating expenses (46) (167) (18) (231) Core earnings (82) (167) 253 4 Income tax (expense)/benefit and NCI 17 13 (40) (10) Cash earnings (65) (154) 213 (6) Half Year Sept 2021 Net interest income 60 - (4) 56 Net fee income (33) - - (33) Net wealth management and insurance income (18) - - (18) Trading income - - - - Other income 3 - 193 196 Non-interest income (48) - 193 145 Net operating income 12 - 189 201 Staff expenses (33) - (175) (208) Occupancy expenses - (232) 39 (193) Technology expenses (2) (414) (56) (472) Other expenses (180) (510) (39) (729) Operating expenses (215) (1,156) (231) (1,602) Core earnings (203) (1,156) (42) (1,401) Income tax (expense)/benefit and NCI 31 191 (140) 82 Cash earnings (172) (965) (182) (1,319) Half Year March 2021 Net interest income 71 - - 71 Net fee income (104) - - (104) Net wealth management and insurance income (88) - - (88) Trading income - - - - Other income (7) - 571 564 Non-interest income (199) - 571 372 Net operating income (128) - 571 443 Staff expenses (83) - - (83) Occupancy expenses - - (82) (82) Technology expenses (1) (165) (12) (178) Other expenses (172) (84) (146) (402) Operating expenses (256) (249) (240) (745) Core earnings (384) (249) 331 (302) Income tax (expense)/benefit and NCI 108 50 (138) 20 Cash earnings (276) (199) 193 (282) |
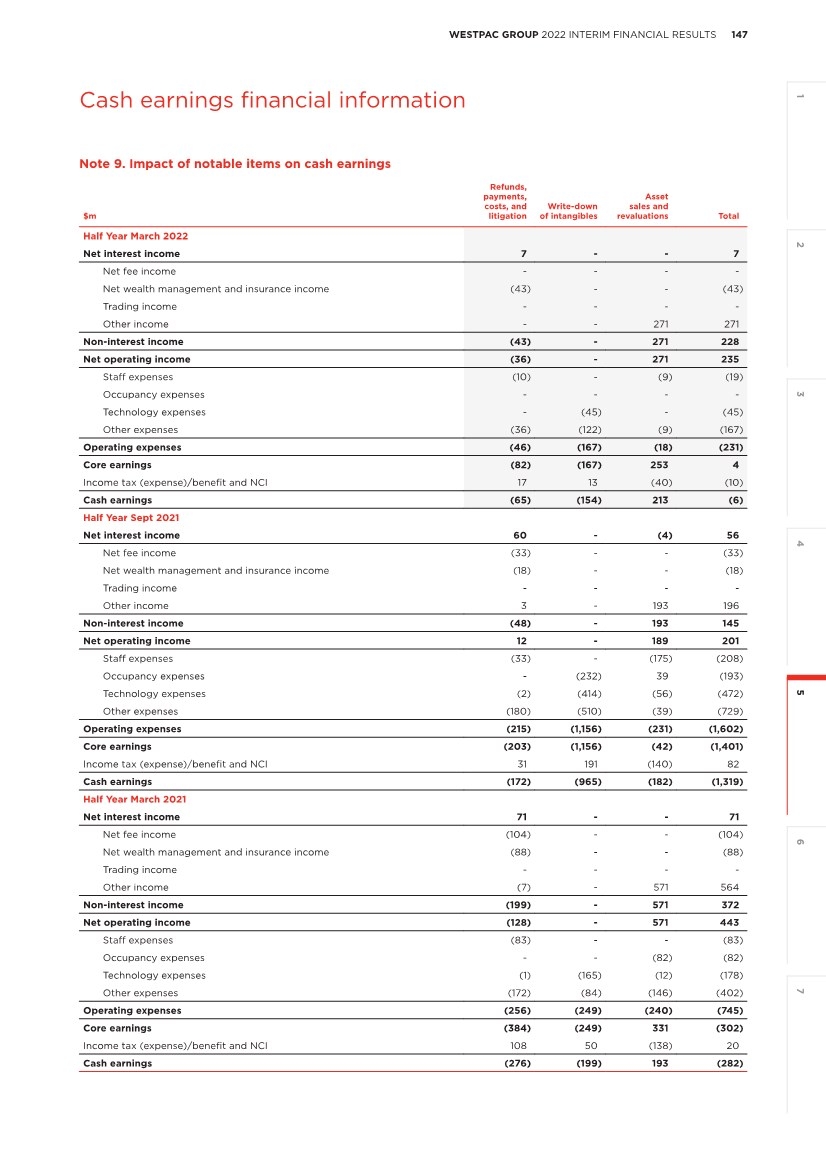
| 149 148 WESTPAC GROUP 2022 INTERIM FINANCIAL RESULTS WESTPAC GROUP 2022 INTERIM FINANCIAL RESULTS Other information 6.0 Other information 6.1 Disclosure regarding forward-looking statements This Results Announcement contains statements that constitute ‘forward-looking statements’ within the meaning of Section 21E of the US Securities Exchange Act of 1934. Forward-looking statements are statements that are not historical facts. Forward-looking statements appear in a number of places in this Results Announcement and include statements regarding Westpac’s intent, belief or current expectations on its business and operations, market conditions, results of operations and financial condition, including, without limitation, future loan loss provisions and financial support to certain borrowers. Words such as ‘will’, ‘may’, ‘expect’, ‘intend’, ‘seek’, ‘would’, ‘should’, ‘could’, ‘continue’, ‘plan’, ‘estimate’, ‘anticipate’, ‘believe’, ‘probability’, ‘risk’, ‘aim’, ‘outlook’, ‘forecast’ or other similar words are used to identify forward-looking statements. These statements reflect our current views on future events and are subject to change, certain risks, uncertainties and assumptions which are, in many instances, beyond our control, and have been made based on management’s expectations and beliefs concerning future developments and their potential effect upon Westpac. There can be no assurance that future developments will align with Westpac’s expectations or that future developments on Westpac will be those anticipated. Actual results could differ materially from expected, depending on various factors, including, but not limited to: • information security breaches, including cyber attacks; • the effect of, and changes in, laws, regulations, taxation or accounting standards or practices and government policy, particularly changes to liquidity, leverage and capital requirements; • regulatory investigations, reviews and other actions, inquiries, litigation, fines, penalties, restrictions or other regulator imposed conditions, including from our actual or alleged failure to comply with laws, regulations or regulatory policy; • the effectiveness of our risk management policies, including our processes, systems and employees, and operational risks resulting from ineffective processes and controls, as well as breakdowns in processes and procedures requiring remediation activity; • the effect of the COVID-19 pandemic, which has had, and may continue to have, a negative impact on our business and economic conditions, adversely affect a wide-range of our suppliers, third-party contractors and customers, create increased volatility in financial markets and result in increased impairments, defaults and write-offs; • environmental change (including from climate change) or external events or geopolitical risks in countries in which Westpac or its customers or counterparties operate; • the failure to comply with financial crime obligations, which has had, and could further have, adverse effects on our business and reputation; • internal and external events which may adversely impact our reputation; • litigation and other legal proceedings and regulator investigations and enforcement actions; • reliability and security of Westpac’s technology and risks associated with changes to technology systems; • the stability of financial systems and disruptions to financial markets and any losses or business impacts us or our customers or counterparties may experience; • market volatility, including uncertain conditions in funding, equity and asset markets; • the incidence of inadequate capital levels under stressed conditions; • the risk that governments will default on their debt obligations or be unable to refinance their debts; • changes to Westpac’s credit ratings or the methodology used by credit rating agencies; • changes in political, social or economic conditions in any of the major markets in which Westpac or its customers or counterparties operate; • changes in economic conditions, consumer spending, saving and borrowing habits in Australia, New Zealand and other countries in which we or our customers or counterparties operate and our ability to maintain or to increase market share, margins and fees, and control expenses; • adverse asset, credit or capital market conditions; • an increase in defaults because of a deterioration in economic conditions; • an increase in defaults, write-offs and provisions for credit impairments; • the effects of competition in the areas in which we operate; • levels of inflation, interest rates, exchange rates and market and monetary fluctuations and volatility; • poor data quality, poor data retention or poor records management; • strategic decisions including diversification, innovation, divestment, acquisitions, expansion activity and integration; • changes to our critical accounting estimates and judgements and changes to the value of our intangible assets; • the incidence or severity of Westpac-insured events; • the inability to syndicate or sell down underwritten securities, particularly in times of heightened volatility; and • various other factors beyond Westpac’s control. Other information |
| 149 148 WESTPAC GROUP 2022 INTERIM FINANCIAL RESULTS WESTPAC GROUP 2022 INTERIM FINANCIAL RESULTS 6 2 3 1 5 4 7 Other information The above list is not exhaustive. For certain other factors that may impact on forward-looking statements made by Westpac, refer to ‘Risk factors’ in the Directors’ report in this Results Announcement. When relying on forward-looking statements to make decisions with respect to Westpac, investors and others should carefully consider the foregoing factors and other uncertainties and events. Westpac is under no obligation to update any forward-looking statements in this Results Announcement, whether from new information, future events or otherwise, after the date of this Results Announcement. |

| 150 WESTPAC GROUP 2022 INTERIM FINANCIAL RESULTS Other information 6.2 References to websites Information contained in or accessible through the websites mentioned in this Results Announcement does not form part of this Results Announcement unless we specifically state that it is incorporated by reference and forms part of this Results Announcement. All references in this Results Announcement to websites are inactive textual references and are for information only. 6.3 Credit ratings1 Rating agency Short. Term Long Term Outlook Fitch Ratings F1 A+ Stable Moody’s Investor Services P-1 Aa3 Stable S&P Global Ratings A-1+ AA- Stable 6.4 Dividend reinvestment plan Westpac operates a dividend reinvestment plan (DRP) that is available to holders of fully paid ordinary shares who are resident in, and whose address on the register of shareholders is in Australia or New Zealand. As noted in Section 2.5, the Directors have made certain determinations in relation to the calculation of the market price which will apply to the DRP for the 2022 interim dividend only. Shareholders who wish to commence participation in the DRP, or to vary their current participation election, must do so by 5.00pm (AEST) on 23 May 2022. Shareholders can provide these instructions: • Online for shareholders with holdings that have a market value of less than $1,000,000 within your Link Market Services portfolio, login into or create your Portfolio via Westpac share registrar’s at linkmarketservices.com.au and electing the DRP or amending their existing instructions online; or • By completing and returning a DRP application or Variation form to Westpac’s share registry. Registry contact details are listed in Section 6.6. 6.5 Information on related entities a. Changes in control of Group entities During the six months ended 31 March 2022 the following non-controlled entities were acquired, formed, or incorporated: • MoneyBrilliant Pty Ltd (acquired 13 December 2021) During the six months ended 31 March 2022 the following controlled entities ceased to be controlled: • Capital Finance (NZ) Pty Limited (deregistered 10 November 2021) • Capital Fleetlease Pty Limited (deregistered 10 November 2021) • Capital Rent Group Pty Limited (deregistered 10 November 2021) • SIE-LEASE (Australia) Pty Limited (deregistered 10 November 2021) • Westpac Custodian Nominees Pty Limited (deregistered 26 December 2021) • Series 2012-1 WST Trust (terminated 1 January 2022) • St. George Commercial Credit Corporation Pty Limited (deregistered 23 January 2022) • EQR Securities Pty Limited (deregistered 10 February 2022) • Westpac Life-NZ- Limited (sold 28 February 2022) • St. George Equity Finance Pty Limited (deregistered 28 March 2022) b. Associates As at 31 March 2022 Ownership Interest Held (%) mx51 Group Pty Ltd 33.06% Akahu Technologies Ltd 29.60% Lygon 1B Pty Ltd 18.24% Hey You Pty Ltd (Formerly Beat The Q Holdings Pty Ltd) 23.48% OpenAgent Pty Ltd 22.55% 1. As at 31 March 2022. Other information Other information |
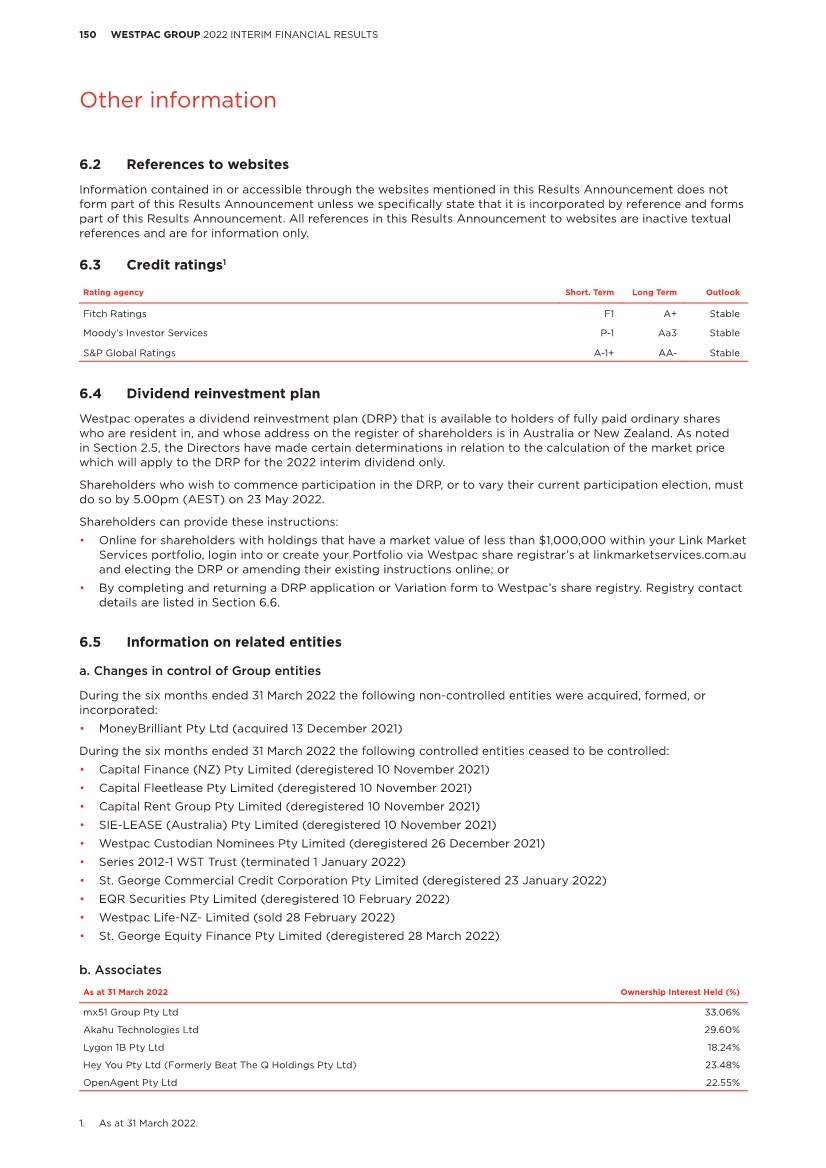
| 151 WESTPAC GROUP 2022 INTERIM FINANCIAL RESULTS 6 2 3 1 5 4 7 Other information 6.6 Financial calendar and Share Registry details Westpac shares are listed on the securities exchanges in Australia (ASX) and New Zealand (NZX). Westpac Capital Notes 2, Westpac Capital Notes 5, Westpac Capital Notes 6, Westpac Capital Notes 7 and Westpac Capital Notes 8 are listed on the ASX. Important dates to note are set out below, subject to change. Payment of any distribution, dividend or interest payment is subject to the relevant payment conditions and the key dates for each payment will be confirmed to the ASX for securities listed on the ASX. Westpac Ordinary Shares (ASX code: WBC, NZX code: WBC) Interim results and dividend announcement 9 May 2022 Ex-dividend date for interim dividend 19 May 2022 Record date for interim dividend 20 May 2022 Interim dividend payable 24 June 2022 Financial Year end 30 September 2022 Closing date for receipt of director nominations before Annual General Meeting 26 October 2022 Final results and dividend announcement 7 November 2022 Ex-dividend date for final dividend 17 November 2022 Record date for final dividend 18 November 2022 Annual General Meeting 14 December 20221 Final dividend payable 20 December 2022 Westpac Capital Notes 2 (ASX code: WBCPE) Ex-date for quarterly distribution 14 June 2022 Record date for quarterly distribution 15 June 2022 Payment date for quarterly distribution 23 June 2022 Ex-date for quarterly distribution 14 September 2022 Record date for quarterly distribution 15 September 2022 Payment date for quarterly distribution 23 September 2022 Ex-date for quarterly distribution 14 December 2022 Record date for quarterly distribution 15 December 2022 Payment date for quarterly distribution 23 December 2022 Westpac Capital Notes 5 (ASX code: WBCPH) Ex-date for quarterly distribution 10 June 2022 Record date for quarterly distribution 14 June 2022 Payment date for quarterly distribution 22 June 2022 Ex-date for quarterly distribution 13 September 2022 Record date for quarterly distribution 14 September 2022 Payment date for quarterly distribution 22 September 2022 Ex-date for quarterly distribution 13 December 2022 Record date for quarterly distribution 14 December 2022 Payment date for quarterly distribution 22 December 2022 1. Details regarding the location of the meeting and the business to be dealt with will be contained in a Notice of Meeting sent to shareholders in the November before the meeting. Other information |
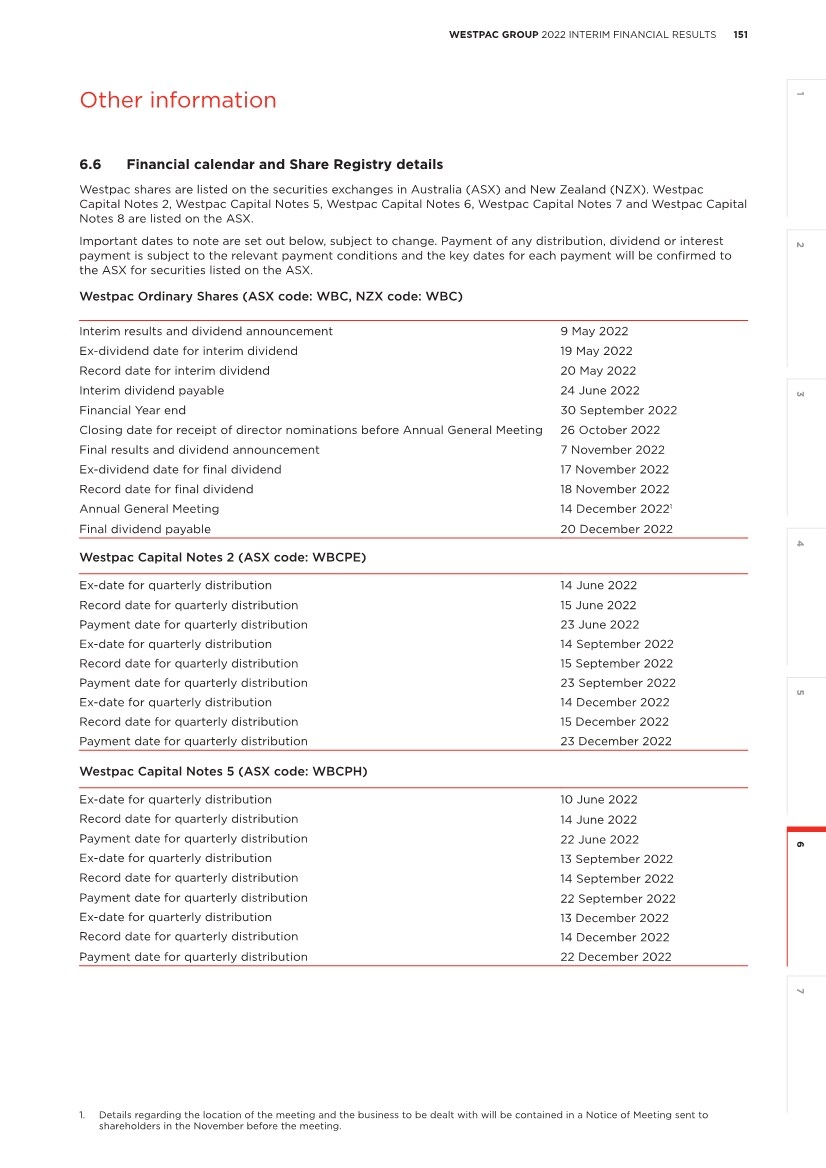
| 152 WESTPAC GROUP 2022 INTERIM FINANCIAL RESULTS Other information Westpac Capital Notes 6 (ASX code: WBCPI) Ex-date for quarterly distribution 9 June 2022 Record date for quarterly distribution 10 June 2022 Payment date for quarterly distribution 20 June 2022¹ Ex-date for quarterly distribution 8 September 2022 Record date for quarterly distribution 9 September 2022² Payment date for quarterly distribution 19 September 2022¹ Ex-date for quarterly distribution 8 December 2022 Record date for quarterly distribution 9 December 2022² Payment date for quarterly distribution 19 December 2022¹ Westpac Capital Notes 7 (ASX code: WBCPJ) Ex-date for quarterly distribution 10 June 2022 Record date for quarterly distribution 14 June 2022 Payment date for quarterly distribution 22 June 2022 Ex-date for quarterly distribution 13 September 2022 Record date for quarterly distribution 14 September 2022 Payment date for quarterly distribution 22 September 2022 Ex-date for quarterly distribution 13 December 2022 Record date for quarterly distribution 14 December 2022 Payment date for quarterly distribution 22 December 2022 Westpac Capital Notes 8 (ASX code: WBCPK) Ex-date for quarterly distribution 9 June 2022 Record date for quarterly distribution 10 June 2022² Payment date for quarterly distribution 21 June 2022 Ex-date for quarterly distribution 12 September 2022 Record date for quarterly distribution 13 September 2022 Payment date for quarterly distribution 21 September 2022 Ex-date for quarterly distribution 12 December 2022 Record date for quarterly distribution 13 December 2022 Payment date for quarterly distribution 21 December 2022 1. Adjusted to next business day as payment date falls on a non-ASX business day or a date on which banks are not open for general business in Sydney, Australia. 2. Adjusted to immediately preceding business day as record date falls on a non-ASX business day or a date on which banks are not open for general business in Sydney. |
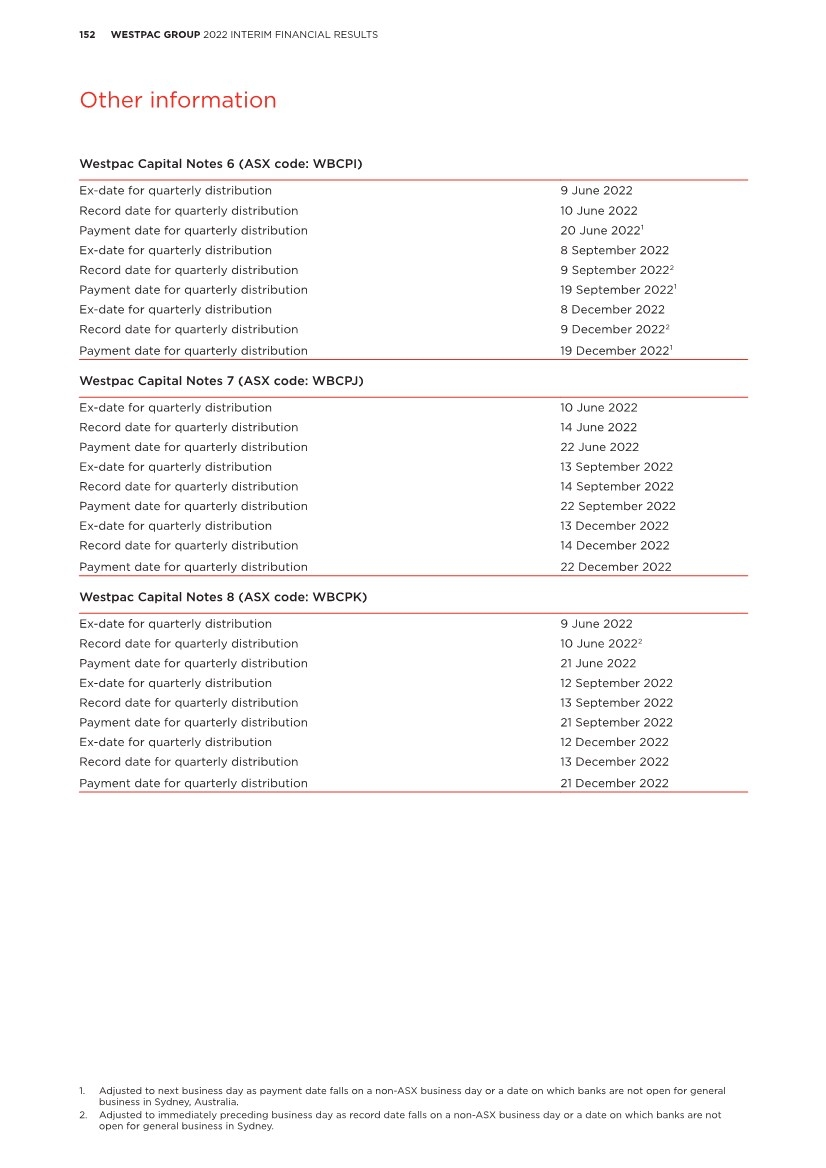
| 153 WESTPAC GROUP 2022 INTERIM FINANCIAL RESULTS 6 2 3 1 5 4 7 Other information Registered Office Level 18, 275 Kent Street Sydney NSW 2000 Australia Telephone: +61 2 9155 7713 Facsimile: +61 2 8253 4128 International: +61 2 9155 7700 Website: www.westpac.com.au/westpacgroup Share Registries Australia New Zealand Ordinary shares on the main register, Westpac Capital Notes 2, Westpac Capital Notes 5, Westpac Capital Notes 6, Westpac Capital Notes 7, and Westpac Capital Notes 8. Ordinary shares on the New Zealand branch register. Link Market Services Limited Level 12, 680 George Street Sydney NSW 2000 Australia Postal Address: Locked Bag A6015, Sydney South NSW 1235, Australia Link Market Services Limited Level 30, PwC Tower 15 Customs Street West Auckland 1010 New Zealand Postal Address: P.O. Box 91976, Auckland 1142, New Zealand Website: www.linkmarketservices.com.au Email: westpac@linkmarketservices.com.au Website: www.linkmarketservices.co.nz Email: enquiries@linkmarketservices.co.nz Telephone: 1800 804 255 (toll free in Australia) International: +61 1800 804 255 Facsimile: +61 2 9287 0303 Telephone: 09 375 5998 International: +64 9 375 5998 Facsimile: +64 9 375 5990 For further information contact: Media: Hayden Cooper Group Head of Media Relations +61 402 393 619 Analysts and Investors: Andrew Bowden Group Head of Investor Relations +61 438 284 863 |
| 154 WESTPAC GROUP 2022 INTERIM FINANCIAL RESULTS Other information 6.7 Exchange rates 6.7.1 Exchange rates against A$ Six months to/as at Half Year March 2022 Half Year Sept 2021 Half Year March 2021 Currency Average Spot Average Spot Average Spot US$ 0.7262 0.7480 0.7522 0.7204 0.7515 0.7595 GBP 0.5401 0.5704 0.5418 0.5359 0.5569 0.5536 NZ$ 1.0593 1.0759 1.0626 1.0477 1.0698 1.0891 6.7.2 Impact of exchange rate movements on Group results Half Year March 2022 vs Half Year September 2021 Half Year March 2022 vs Half Year March 2021 Cash earnings growth FX impact $m Growth ex-FX Cash earnings growth FX impact $m Growth ex-FX Net interest income (3%) 6 (3%) (5%) 13 (5%) Non-interest income (3%) 11 (4%) (17%) 5 (17%) Net operating income (3%) 17 (3%) (8%) 18 (8%) Operating expenses (27%) (6) (27%) (10%) (9) (10%) Core Earnings 56% 11 56% (5%) 9 (5%) Impairment charges large - large large - large Operating profit before tax 41% 11 41% (14%) 9 (14%) Income tax expense 1% (3) 1% (18%) (3) (18%) Net Profit 70% 8 70% (12%) 6 (13%) Profit attributable to NCI 33% - 33% 100% - 100% Cash earnings 71% 8 70% (12%) 6 (13%) 6.7.3 Exchange rate risk on future NZ$ earnings Westpac’s policy in relation to the hedging of the future earnings of the Group’s New Zealand segment is to manage the economic risk for volatility of the NZ$ against A$. Westpac manages these flows over a time horizon under which up to 100% of the expected earnings for the following 12 months and 50% of the expected earnings for the subsequent 12 months can be hedged. At 31 March 2022, Westpac has hedges in place for forecasts up to April 2022, with an average rate of $1.04. Other information |
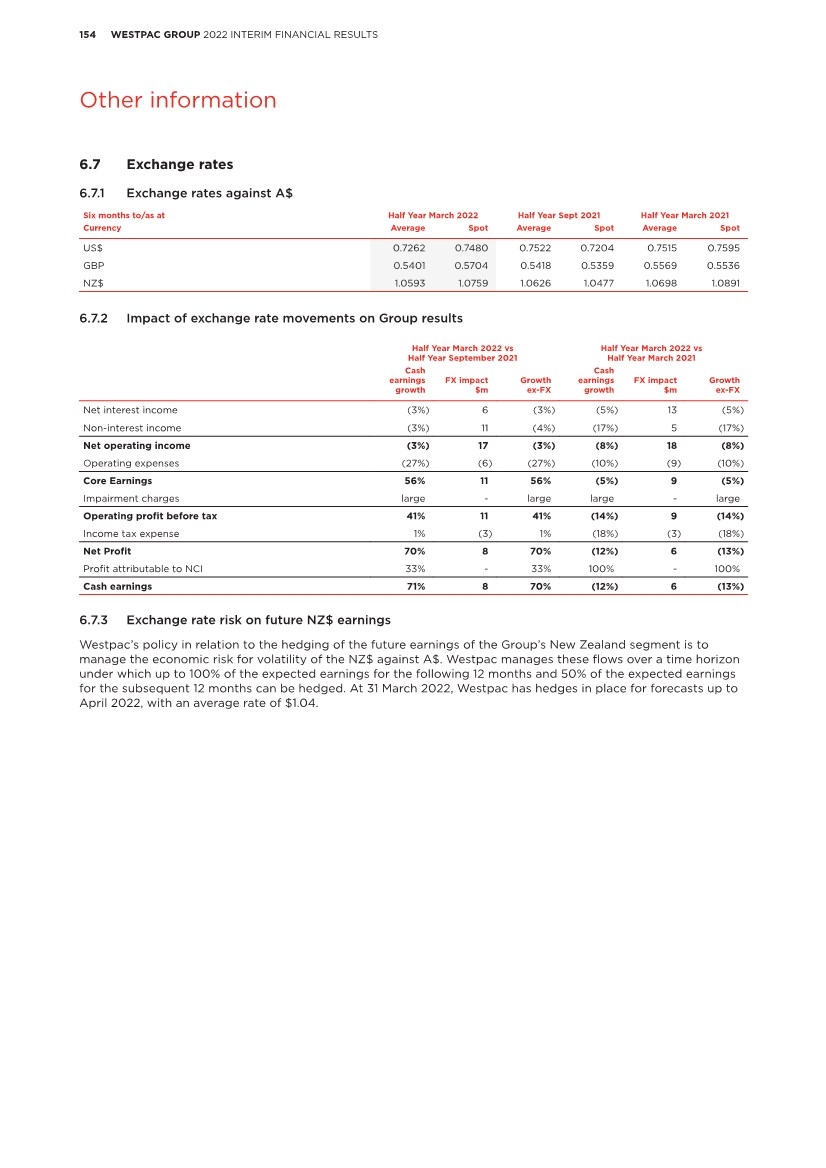
| 155 WESTPAC GROUP 2022 INTERIM FINANCIAL RESULTS 2 3 1 5 4 Glossary 7 6 7.0 Glossary Shareholder value Average ordinary equity Average total equity less average non-controlling interests. Average tangible ordinary equity Average ordinary equity less average goodwill and other intangible assets (excluding capitalised software). Cash earnings per ordinary share Cash earnings divided by the weighted average ordinary shares (cash earnings basis). Cash earnings to average tangible equity (ROTE) Cash earnings divided by average tangible ordinary equity. Cash ROE Cash earnings divided by average ordinary equity. Dividend payout ratio – cash earnings Ordinary dividend paid/declared calculated on issued shares divided by cash earnings. Dividend payout ratio – net profit Ordinary dividend paid/declared on issued shares (net of Treasury shares) divided by the net profit attributable to owners of WBC. Earnings per ordinary share Net profit attributable to the owners of WBC divided by the weighted average ordinary shares (reported). Economic profit – Group Cash earnings less a capital charge calculated at 9% of average ordinary equity plus a value on franking credits calculated as 70% of the Group’s Australian tax expense. Fully franked dividends per ordinary share (cents) Dividends paid out of retained profits which carry a credit for Australian company income tax paid by Westpac. Net tangible assets per ordinary share Net tangible assets (total equity less goodwill and other intangible assets less minority interests) divided by the number of ordinary shares on issue (less Treasury shares held). Return on equity (ROE) Net profit attributable to the owners of WBC (adjusted for RSP dividends) divided by average ordinary equity. Weighted average ordinary shares (cash earnings) Weighted average number of fully paid ordinary shares listed on the ASX for the relevant period. Weighted average ordinary shares (reported) Weighted average number of fully paid ordinary shares listed on the ASX for the relevant period less Westpac shares held by the Group (‘Treasury shares’). Productivity and efficiency Expense to income ratio Operating expenses divided by net operating income. Full-time equivalent employees (FTE) A calculation based on the number of hours worked by full and part-time employees as part of their normal duties. For example, the full-time equivalent of one FTE is 76 hours paid work per fortnight. Revenue per FTE Total operating income divided by the average number of FTE for the period. Business Performance Average interest-bearing liabilities The average balance of liabilities owed by the Group that incur an interest expense. Where possible, daily balances are used to calculate the average balance for the period Average interest-earning assets The average balance of assets held by the Group that generate interest income. Where possible, daily balances are used to calculate the average balance for the period. Interest spread The difference between the average yield on all interest-earning assets and the average rate paid on interest bearing liabilities. Net interest margin Calculated by dividing net interest income by average interest-earning assets. Segment margin Net interest income (including capital benefit) for a segment as a percentage of the average interest earning assets for that segment. Capital Adequacy APRA leverage ratio Tier 1 capital divided by ‘exposure measure’ and expressed as a percentage. ‘Exposure measure’ is the sum of on-balance sheet exposures, derivative exposures, securities financing transaction exposures and other off- balance sheet exposures. Common equity tier 1 (CET1) capital ratio Total common equity capital divided by risk weighted assets, as defined by APRA. Credit risk weighted assets (Credit RWA) Credit risk weighted assets represent risk weighted assets (on-balance sheet and off-balance sheet) that relate to credit exposures and therefore exclude market risk, operational risk, interest rate risk in the banking book and other assets. Internationally comparable capital ratios Internationally comparable regulatory capital ratios are Westpac’s estimated ratios after adjusting the capital ratios determined under APRA Basel III regulations for various items. Analysis aligns with the APRA study titled “International capital comparison study” dated 13 July 2015. Glossary |
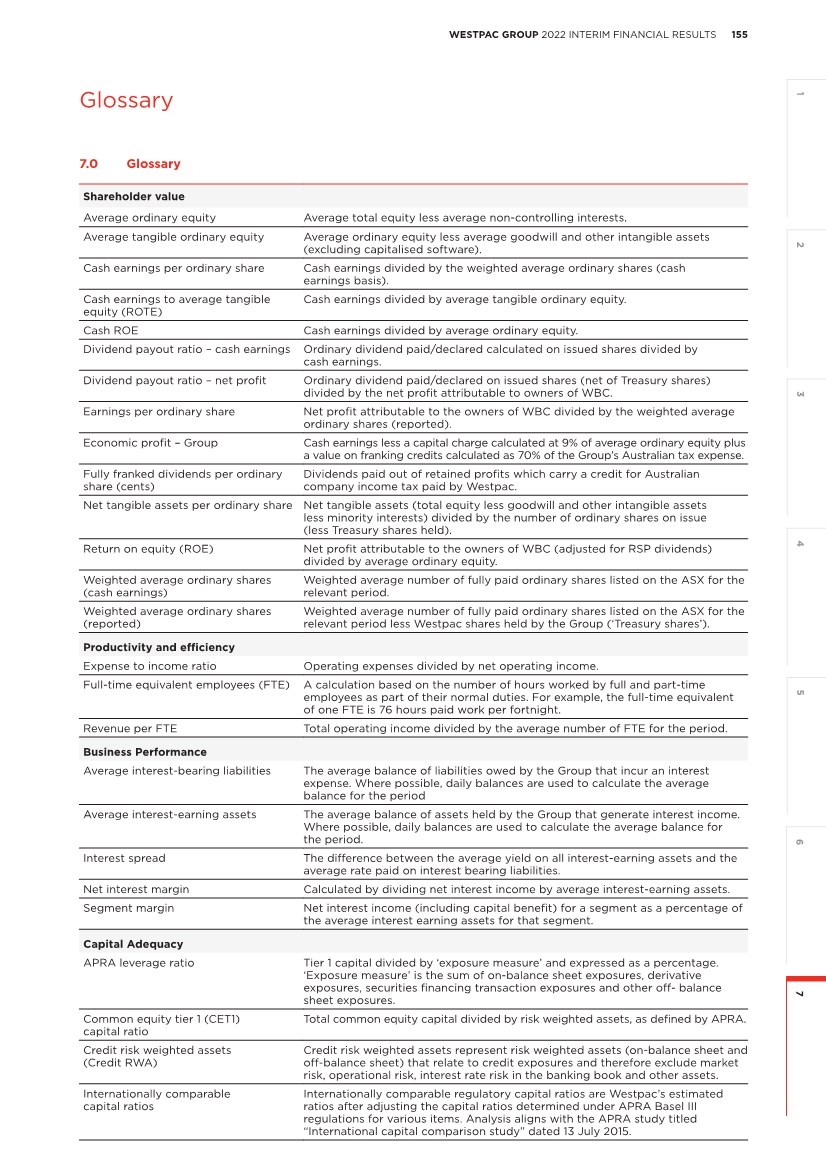
| 156 WESTPAC GROUP 2022 INTERIM FINANCIAL RESULTS Glossary Capital Adequacy (continued) Risk weighted assets (RWA) Assets (both on and off-balance sheet) are risk weighted according to each asset’s inherent potential for default and what the likely losses would be in case of default. In the case of non-asset backed risks (i.e. market and operational risk), RWA is determined by multiplying the capital requirements for those risks by 12.5. Tier 1 capital ratio Total Tier 1 capital divided by risk weighted assets, as defined by APRA. Total regulatory capital ratio Total regulatory capital divided by risk weighted assets, as defined by APRA. Funding and liquidity Committed Liquidity Facility (CLF) The RBA makes available to Australian Authorised Deposit-taking Institutions (ADIs) a CLF that, subject to qualifying conditions, can be accessed to meet LCR requirements under APS210 Liquidity. Deposit to loan ratio Customer deposits divided by total loans. High Quality Liquid Assets (HQLA) Assets which meet APRA’s criteria for inclusion as HQLA in the numerator of the LCR. Liquidity Coverage Ratio (LCR) An APRA requirement to maintain an adequate level of unencumbered high quality liquid assets, to meet liquidity needs for a 30 calendar day period under an APRA-defined severe stress scenario. Absent a situation of financial stress, the value of the LCR must not be less than 100%, effective 1 January 2015. LCR is calculated as the percentage ratio of stock of HQLA and CLF over the total net cash out-flows in a modelled 30 day defined stressed scenario. Net Stable Funding Ratio (NSFR) The NSFR is defined as the ratio of the amount of available stable funding (ASF) to the amount of required stable funding (RSF) defined by APRA. The amount of ASF is the portion of an ADI’s capital and liabilities expected to be a reliable source of funds over a one year time horizon. The amount of RSF is a function of the liquidity characteristics and residual maturities of an ADI’s assets and off-balance sheet activities. ADI’s must maintain an NSFR of at least 100%. Term Funding Facility (TFF) A facility that was established by the RBA in March 2020 to provide 3 year term funding to Australian ADIs via repurchase transactions, subject to qualifying conditions, to help support lending to Australian businesses. The facility closed to new drawdowns in June 2021. Third party liquid assets HQLA and non LCR qualifying liquid assets, but excludes internally securitised assets that are eligible for a repurchase agreement with the RBA and RBNZ. Total liquid assets Third party liquid assets and internally securitised assets that are eligible for a repurchase agreement with a central bank. Asset quality 90 days past due and not impaired Includes facilities where: • contractual payments of interest and / or principal are 90 or more calendar days overdue, including overdrafts or other revolving facilities that remain continuously outside approved limits by material amounts for 90 or more calendar days (including accounts for customers who have been granted hardship assistance); or • an order has been sought for the customer’s bankruptcy or similar legal action has been instituted which may avoid or delay repayment of its credit obligations; and • the estimated net realisable value of assets / security to which Westpac has recourse is sufficient to cover repayment of all principal and interest, or where there are otherwise reasonable grounds to expect payment in full and interest is being taken to profit on an accrual basis. These facilities, while in default, are not treated as impaired for accounting purposes. Collectively assessed provisions (CAPs) Collectively assessed provisions for expected credit loss under AASB 9 represent the Expected Credit Loss (ECL) which is collectively assessed in pools of similar assets with similar risk characteristics. This incorporates forward looking information and does not require an actual loss event to have occurred for an impairment provision to be recognised. Default For accounting purposes, a default occurs when Westpac considers that the customer is unlikely to repay its credit obligations in full, without recourse by the Group to action such as realising security, or the customer is more than 90 days past due on any material credit obligation. This definition of default is aligned to the APRA regulatory definition of default. Exposure at default (EAD) The estimated outstanding amount of credit exposure at the time of the default. |
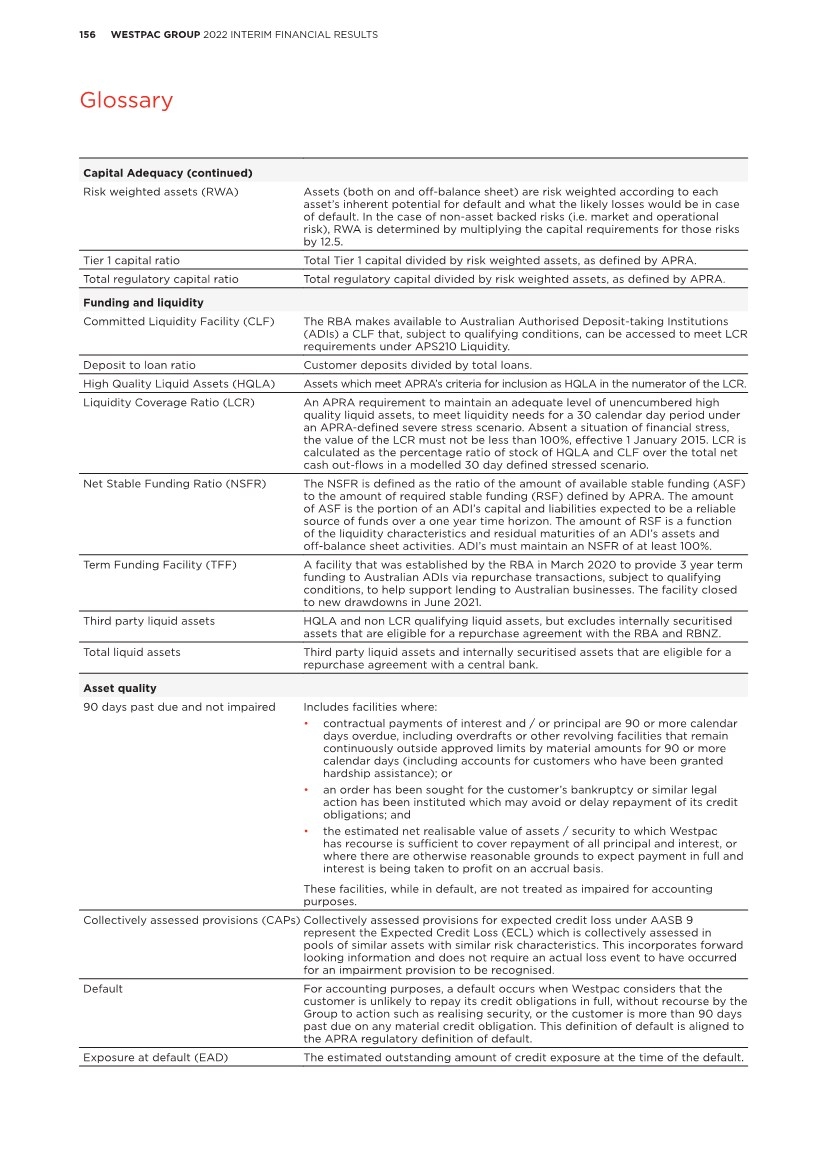
| 157 WESTPAC GROUP 2022 INTERIM FINANCIAL RESULTS 2 3 1 5 4 Glossary 7 6 Impaired exposures Includes exposures that have deteriorated to the point where full collection of interest and principal is in doubt, based on an assessment of the customer’s outlook, cash flow, and the net realisation of value of assets to which recourse is held: • facilities 90 days or more past due, and full recovery is in doubt: exposures where contractual payments are 90 or more days in arrears and the net realisable value of assets to which recourse is held may not be sufficient to allow full collection of interest and principal, including overdrafts or other revolving facilities that remain continuously outside approved limits by material amounts for 90 or more calendar days; • non-accrual facilities: exposures with individually assessed impairment provisions held against them, excluding restructured loans; • restructured facilities: exposures where the original contractual terms have been formally modified to provide for concessions of interest or principal for reasons related to the financial difficulties of the customer; • other assets acquired through security enforcement (includes other real estate owned): includes the value of any other assets acquired as full or partial settlement of outstanding obligations through the enforcement of security arrangements; or • any other facilities where the full collection of interest and principal is in doubt. Individually assessed provisions (IAPs) Provisions raised for losses on loans that are known to be impaired and are assessed on an individual basis. The estimated losses on these impaired loans is based on expected future cash flows discounted to their present value and, as this discount unwinds, interest will be recognised in the income statement. Loss given default (LGD) The loss that is expected to arise in the event of a default. Non-performing exposures Exposures which are in default. Performing exposures Exposures which are not in default. Probability of default (PD) The probability that a counterparty will default. Provision for expected credit losses (ECL) Expected credit losses (ECL) are a probability-weighted estimate of the cash shortfalls expected to result from defaults over the relevant timeframe. They are determined by evaluating a range of possible outcomes and taking into account the time value of money, past events, current conditions and forecasts of future economic conditions. Stage 1: 12 months ECL - performing For financial assets where there has been no significant increase in credit risk since origination a provision for 12 months expected credit losses is recognised. Interest revenue is calculated on the gross carrying amount of the financial asset. Stage 2: Lifetime ECL - performing For financial assets where there has been a significant increase in credit risk since origination but where the asset is still performing a provision for lifetime expected losses is recognised. Interest revenue is calculated on the gross carrying amount of the financial asset. Stage 3: Lifetime ECL - non-performing For financial assets that are non-performing a provision for lifetime expected losses is recognised. Interest revenue is calculated on the carrying amount net of the provision for ECL rather than the gross carrying amount. Stressed exposures Watchlist and substandard, 90 days past due and not impaired and impaired exposures. Total committed exposure (TCE) Represents the sum of the committed portion of direct lending (including funds placement overall and deposits placed), contingent and pre-settlement risk plus the committed portion of secondary market trading and underwriting risk. Watchlist and substandard Loan facilities where customers are experiencing operating weakness and financial difficulty but are not expected to incur loss of interest or principal. Asset quality (continued) |
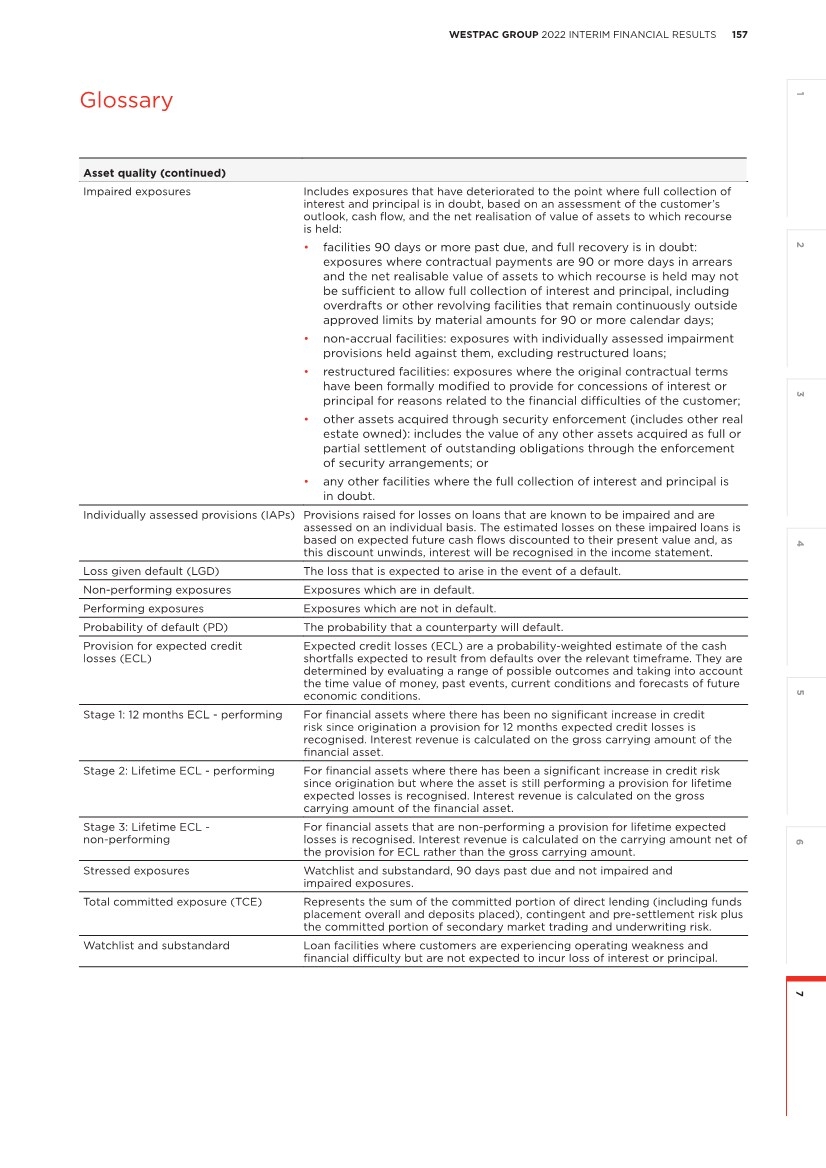
| 158 WESTPAC GROUP 2022 INTERIM FINANCIAL RESULTS Glossary Other COVID-19 A viral disease, declared as a pandemic by the World Health Organisation on 12 March 2020. Credit Value Adjustment (CVA) CVA adjusts the fair value of over-the-counter derivatives for credit risk. CVA is employed on the majority of derivative positions and reflects the market view of the counterparty credit risk. A Debit Valuation Adjustment (DVA) is employed to adjust for our own credit risk. Funding Value Adjustment (FVA) FVA relates to the funding cost or benefit associated with the uncollateralised portion of the derivative portfolio. First Half 2021 Six months ended 31 March 2021. First Half 2022 Six months ended 31 March 2022. Prior corresponding period Refers to the six months ended 31 March 2021. Prior half / Prior period Refers to the six months ended 30 September 2021. Run-off Scheduled and unscheduled repayments and debt repayments (from for example property sales and external refinancing), net of redraws. Second Half 2021 Six months ended 30 September 2021. Segment reporting Segment reporting are presented on a management reporting basis. Internal charges and transfer pricing adjustments are included in the performance of each segment reflecting the management structure rather than the legal entity (these results cannot be compared to results for individual legal entities). Where management reporting structures or accounting classifications have changed, financial results for comparative periods have been restated and may differ from results previously reported. Overhead costs are allocated to revenue generating segments. The Group’s internal transfer pricing frameworks facilitate risk transfer, profitability measurement, capital allocation and segment alignment, tailored to the jurisdictions in which the Group operates. Transfer pricing allows the Group to measure the relative contribution of products and segments to the Group’s interest margin and other dimensions of performance. Key components of the Group’s transfer pricing frameworks are funds transfer pricing for interest rate and liquidity risk and allocation of basis and contingent liquidity costs, including capital allocation. SME Small to medium sized enterprises. Value at Risk (VaR) A statistical estimate of the potential loss in earnings over a specified period of time and to a given level of confidence based on historical market movements. Women in Leadership Women in Leadership refers to the proportion of women (permanent and maximum term) in leadership roles across the Group. It includes the CEO, Group Executive, General Managers, senior leaders with significant influence on business outcomes (direct reports to General Managers and their direct reports), large (3+) team people leaders three levels below General Manager, and Bank and Assistant Bank Managers. |
