Exhibit 1
| ASX Release 15 AUGUST 2022 Pillar 3 Report as at 30 June 2022 Westpac Banking Corporation (“Westpac”) today provides the attached Pillar 3 Report (June 2022). For further information: Hayden Cooper Andrew Bowden Group Head of Media Relations General Manager Investor Relations 0402 393 619 0438 284 863 This document has been authorised for release by Tim Hartin, Company Secretary. Level 18, 275 Kent Street Sydney, NSW, 2000 |
|
| Pillar 3 report Table of contents 2 | Westpac Group June 2022 Pillar 3 Report Structure of Pillar 3 report Executive summary 3 Introduction 5 Group structure 6 Capital overview 8 Leverage ratio 12 Credit risk exposures 13 Securitisation 18 Liquidity coverage ratio 21 Appendix Appendix I | APS330 Quantitative requirements 22 Disclosure regarding forward-looking statements 23 In this report references to ‘Westpac’, ‘Westpac Group’, ‘the Group’, ‘we’, ‘us’ and ‘our’ are to Westpac Banking Corporation and its controlled entities (unless the context indicates otherwise). In this report, unless otherwise stated or the context otherwise requires, references to ‘$’, ‘AUD’ or ‘A$’ are to Australian dollars. Any discrepancies between totals and sums of components in tables contained in this report are due to rounding. In this report, unless otherwise stated, disclosures reflect the Australian Prudential Regulation Authority’s (APRA) implementation of Basel III. Information contained in or accessible through the websites mentioned in this report does not form part of this report unless we specifically state that it is incorporated by reference and forms part of this report. All references in this report to websites are inactive textual references and are for information only. |
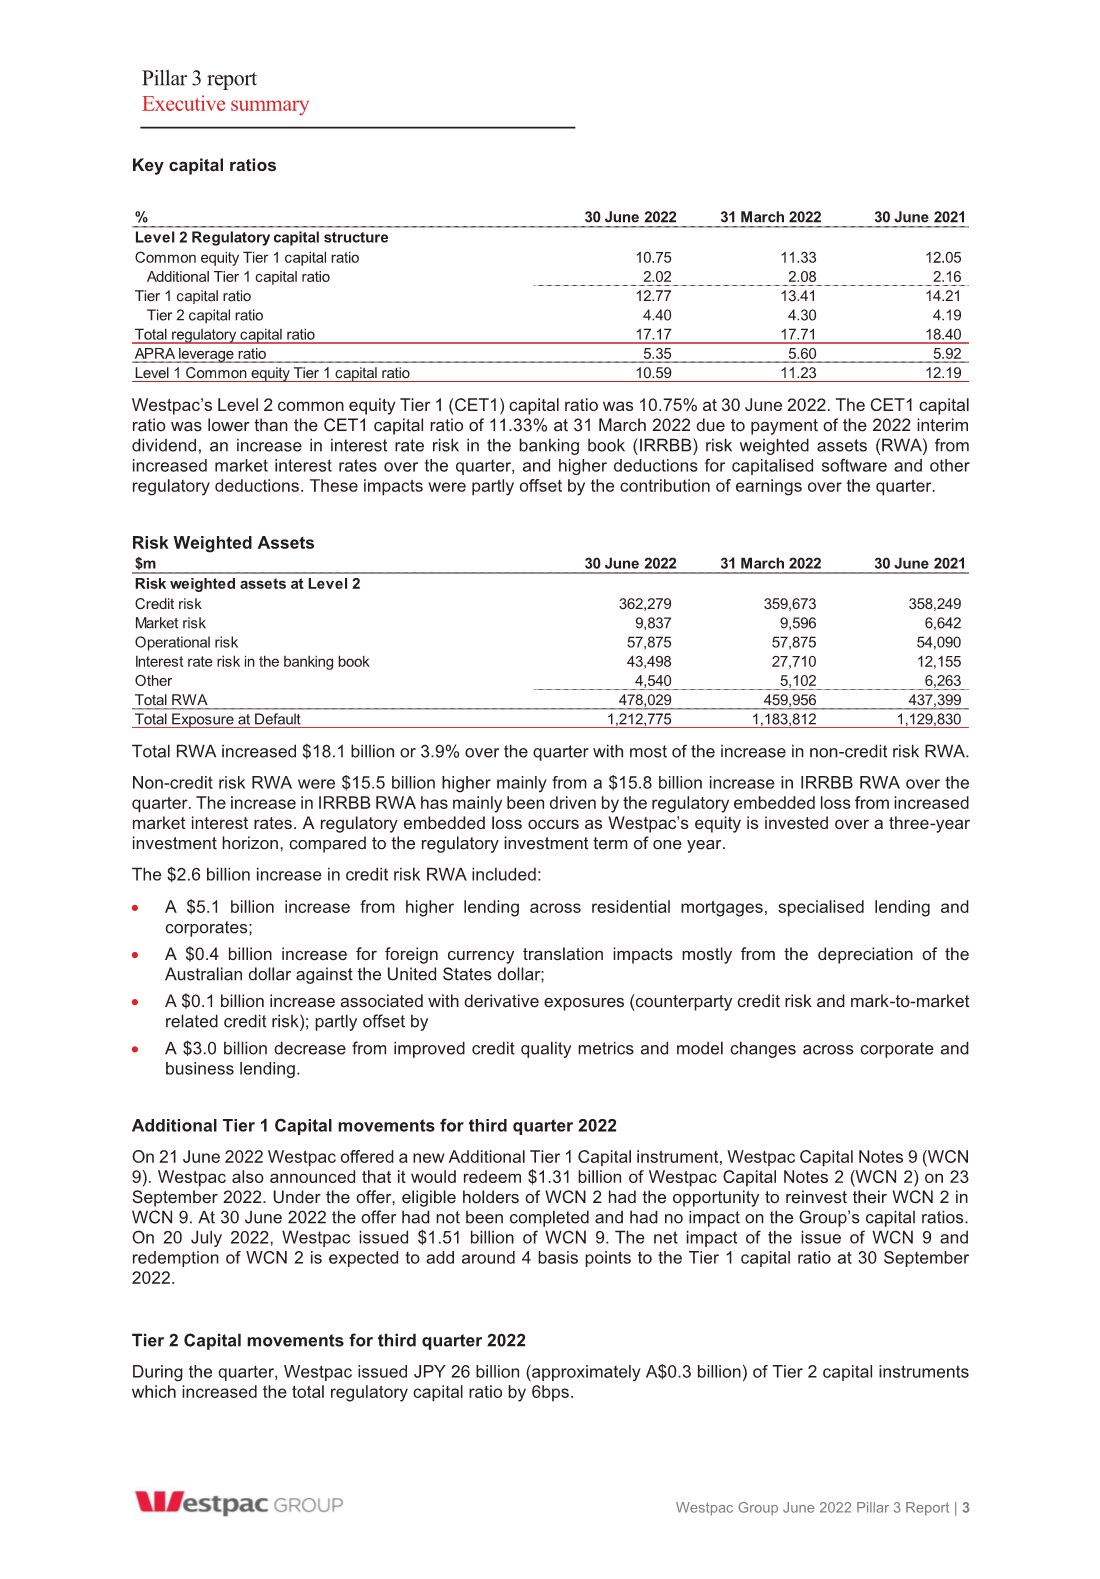
| Pillar 3 report Executive summary Westpac Group June 2022 Pillar 3 Report | 3 Key capital ratios Westpac’s Level 2 common equity Tier 1 (CET1) capital ratio was 10.75% at 30 June 2022. The CET1 capital ratio was lower than the CET1 capital ratio of 11.33% at 31 March 2022 due to payment of the 2022 interim dividend, an increase in interest rate risk in the banking book (IRRBB) risk weighted assets (RWA) from increased market interest rates over the quarter, and higher deductions for capitalised software and other regulatory deductions. These impacts were partly offset by the contribution of earnings over the quarter. Risk Weighted Assets Total RWA increased $18.1 billion or 3.9% over the quarter with most of the increase in non-credit risk RWA. Non-credit risk RWA were $15.5 billion higher mainly from a $15.8 billion increase in IRRBB RWA over the quarter. The increase in IRRBB RWA has mainly been driven by the regulatory embedded loss from increased market interest rates. A regulatory embedded loss occurs as Westpac’s equity is invested over a three-year investment horizon, compared to the regulatory investment term of one year. The $2.6 billion increase in credit risk RWA included: x A $5.1 billion increase from higher lending across residential mortgages, specialised lending and corporates; x A $0.4 billion increase for foreign currency translation impacts mostly from the depreciation of the Australian dollar against the United States dollar; x A $0.1 billion increase associated with derivative exposures (counterparty credit risk and mark-to-market related credit risk); partly offset by x A $3.0 billion decrease from improved credit quality metrics and model changes across corporate and business lending. Additional Tier 1 Capital movements for third quarter 2022 On 21 June 2022 Westpac offered a new Additional Tier 1 Capital instrument, Westpac Capital Notes 9 (WCN 9). Westpac also announced that it would redeem $1.31 billion of Westpac Capital Notes 2 (WCN 2) on 23 September 2022. Under the offer, eligible holders of WCN 2 had the opportunity to reinvest their WCN 2 in WCN 9. At 30 June 2022 the offer had not been completed and had no impact on the Group’s capital ratios. On 20 July 2022, Westpac issued $1.51 billion of WCN 9. The net impact of the issue of WCN 9 and redemption of WCN 2 is expected to add around 4 basis points to the Tier 1 capital ratio at 30 September 2022. Tier 2 Capital movements for third quarter 2022 During the quarter, Westpac issued JPY 26 billion (approximately A$0.3 billion) of Tier 2 capital instruments which increased the total regulatory capital ratio by 6bps. % 30 June 2022 31 March 2022 30 June 2021 Level 2 Regulatory capital structure Common equity Tier 1 capital ratio 10.75 11.33 12.05 Additional Tier 1 capital ratio 2.02 2.08 2.16 Tier 1 capital ratio 12.77 13.41 14.21 Tier 2 capital ratio 4.40 4.30 4.19 Total regulatory capital ratio 17.17 17.71 18.40 APRA leverage ratio 5.35 5.60 5.92 Level 1 Common equity Tier 1 capital ratio 10.59 11.23 12.19 $m 30 June 2022 31 March 2022 30 June 2021 Risk weighted assets at Level 2 Credit risk 362,279 359,673 358,249 Market risk 9,837 9,596 6,642 Operational risk 57,875 57,875 54,090 Interest rate risk in the banking book 43,498 27,710 12,155 Other 4,540 5,102 6,263 Total RWA 478,029 459,956 437,399 Total Exposure at Default 1,212,775 1,183,812 1,129,830 |
| Pillar 3 report Executive summary 4 | Westpac Group June 2022 Pillar 3 Report Exposure at Default Exposure at default (EAD) increased $29.0 billion over the quarter primarily due to: x A $10.2 billion increase in sovereign exposures due to an increase in liquid assets; x A $8.5 billion increase in corporate exposures mainly from an increase in market-related off-balance sheet exposures; and x A $5.1 billion increase from residential mortgages. Leverage Ratio The leverage ratio represents the amount of Tier 1 capital relative to exposure1. At 30 June 2022, Westpac’s leverage ratio was 5.35%, down 25 basis points since 31 March 2022. The decrease in the leverage ratio reflected higher balance sheet exposures and lower Tier 1 capital as a result of payment of the 2022 interim dividend. Liquidity Coverage Ratio (LCR) Westpac’s average LCR for the quarter ending 30 June 2022 was 130% (31 March 2022: 137%)2 and continues to be comfortably above the regulatory minimum of 100%. The LCR decrease was mainly driven by a second reduction to Westpac’s allocation of the Committed Liquidity Facility (CLF). 1 As defined under Attachment D of APS110: Capital Adequacy. 2 Calculated as a simple average of the daily observations over the quarter. |
| Pillar 3 report Introduction Westpac Group June 2022 Pillar 3 Report | 5 Westpac Banking Corporation is an Authorised Deposit-taking Institution (ADI) subject to regulation by APRA. APRA has accredited Westpac to apply advanced models permitted by the Basel III global capital adequacy regime to the measurement of its regulatory capital requirements. Westpac uses the Advanced Internal Ratings-Based approach (Advanced IRB) for credit risk and the Standardised Measurement Approach (SMA) for operational risk1. In accordance with APS330 Public Disclosure, financial institutions that have received the Advanced IRB accreditation, including Westpac, are required to disclose prudential information about their risk management practices on a semi-annual basis. A subset of this information must be disclosed quarterly. In addition to this report, the regulatory disclosures section of the Westpac website2 contains the reporting requirements for: x Capital instruments under Attachment B of APS330; and x The identification of potential Global-Systemically Important Banks (G-SIB) under Attachment H of APS330 (disclosed annually). Capital instruments disclosures are updated when: x A new capital instrument is issued that will form part of regulatory capital; or x A capital instrument is redeemed, converted into CET1 capital, written off, or its terms and conditions are changed. 1 From 1 January 2022, Westpac has adopted the Standardised Measurement Approach (SMA) to Operational Risk Capital as permitted by Prudential Standard APS115 Capital Adequacy: Standardised Measurement Approach to Operational Risk. 2 http://www.westpac.com.au/about-westpac/investor-centre/financial-information/regulatory-disclosures/ |
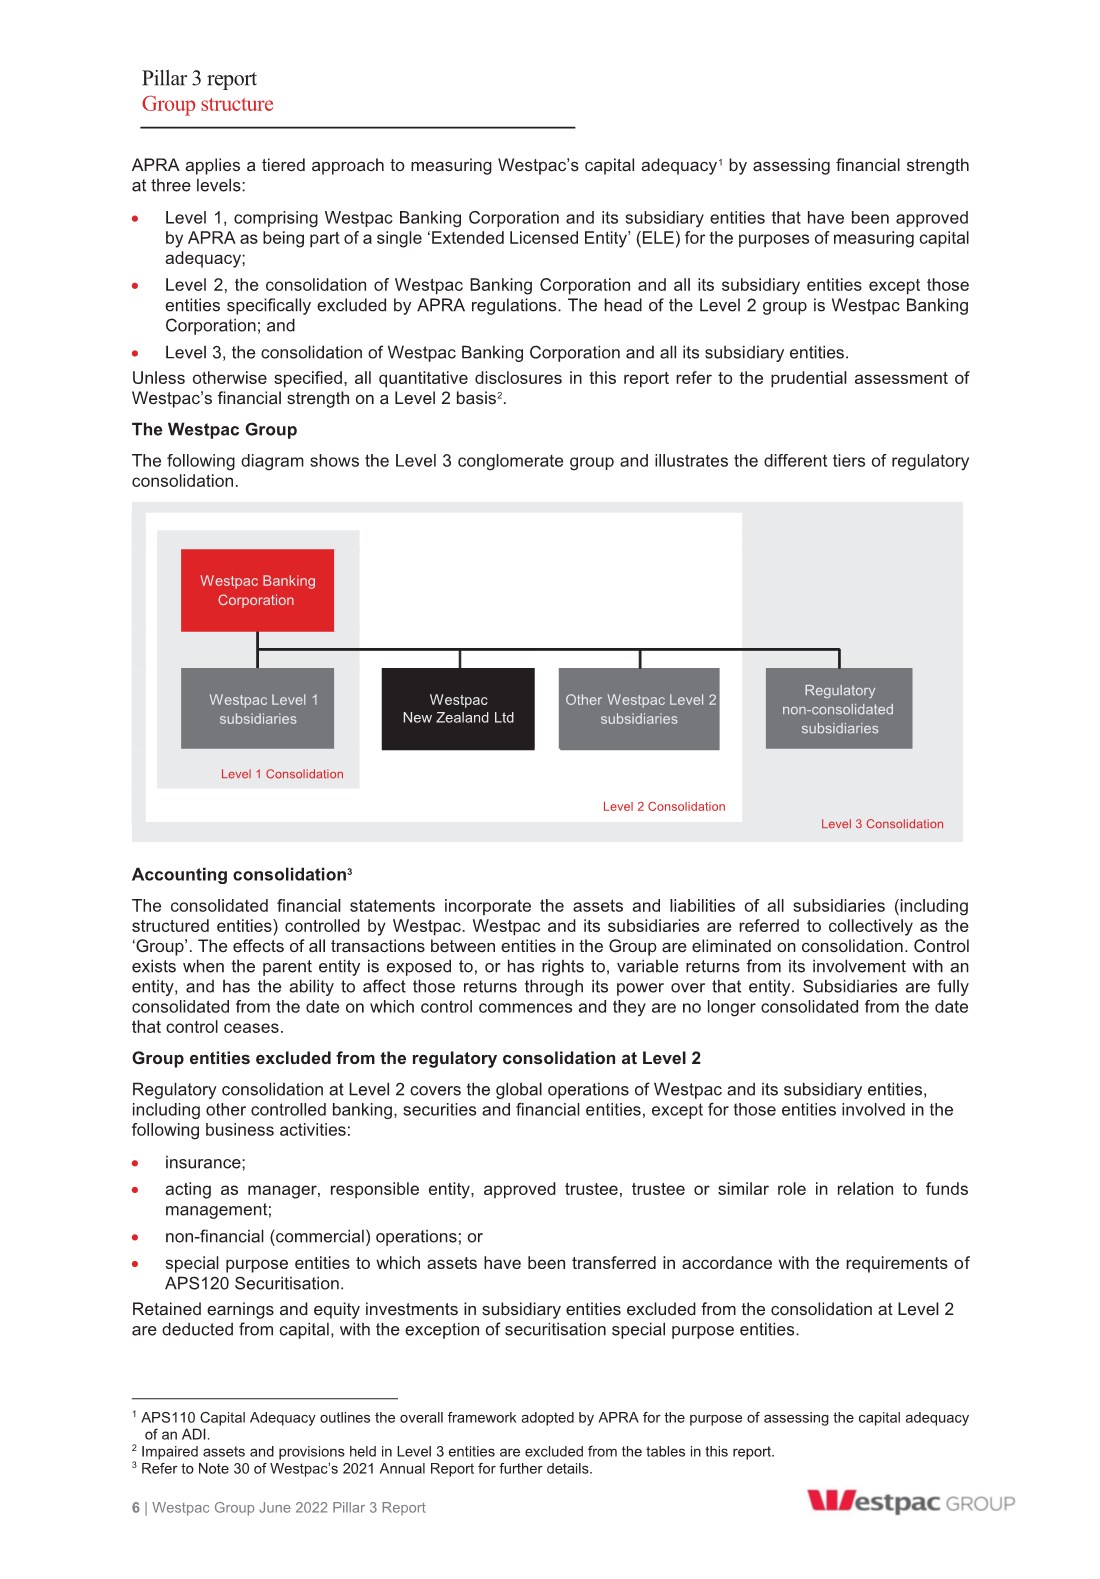
| Pillar 3 report Group structure 6 | Westpac Group June 2022 Pillar 3 Report APRA applies a tiered approach to measuring Westpac’s capital adequacy1 by assessing financial strength at three levels: x Level 1, comprising Westpac Banking Corporation and its subsidiary entities that have been approved by APRA as being part of a single ‘Extended Licensed Entity’ (ELE) for the purposes of measuring capital adequacy; x Level 2, the consolidation of Westpac Banking Corporation and all its subsidiary entities except those entities specifically excluded by APRA regulations. The head of the Level 2 group is Westpac Banking Corporation; and x Level 3, the consolidation of Westpac Banking Corporation and all its subsidiary entities. Unless otherwise specified, all quantitative disclosures in this report refer to the prudential assessment of Westpac’s financial strength on a Level 2 basis2. The Westpac Group The following diagram shows the Level 3 conglomerate group and illustrates the different tiers of regulatory consolidation. Accounting consolidation3 The consolidated financial statements incorporate the assets and liabilities of all subsidiaries (including structured entities) controlled by Westpac. Westpac and its subsidiaries are referred to collectively as the ‘Group’. The effects of all transactions between entities in the Group are eliminated on consolidation. Control exists when the parent entity is exposed to, or has rights to, variable returns from its involvement with an entity, and has the ability to affect those returns through its power over that entity. Subsidiaries are fully consolidated from the date on which control commences and they are no longer consolidated from the date that control ceases. Group entities excluded from the regulatory consolidation at Level 2 Regulatory consolidation at Level 2 covers the global operations of Westpac and its subsidiary entities, including other controlled banking, securities and financial entities, except for those entities involved in the following business activities: x insurance; x acting as manager, responsible entity, approved trustee, trustee or similar role in relation to funds management; x non-financial (commercial) operations; or x special purpose entities to which assets have been transferred in accordance with the requirements of APS120 Securitisation. Retained earnings and equity investments in subsidiary entities excluded from the consolidation at Level 2 are deducted from capital, with the exception of securitisation special purpose entities. 1 APS110 Capital Adequacy outlines the overall framework adopted by APRA for the purpose of assessing the capital adequacy of an ADI. 2 Impaired assets and provisions held in Level 3 entities are excluded from the tables in this report. 3 Refer to Note 30 of Westpac’s 2021 Annual Report for further details. Level 1 Consolidation Level 2 Consolidation Level 3 Consolidation Regulatory non-consolidated subsidiaries Westpac New Zealand Ltd Other Westpac Level 2 subsidiaries Westpac Banking Corporation Westpac Level 1 subsidiaries |
| Pillar 3 report Group structure Westpac Group June 2022 Pillar 3 Report | 7 Subsidiary banking entities Westpac New Zealand Limited (WNZL), a wholly owned subsidiary entity, is a registered bank incorporated in New Zealand and regulated by the Reserve Bank of New Zealand (RBNZ). WNZL uses the Advanced IRB approach for credit risk and the Advanced Measurement Approach (AMA) for operational risk. Other subsidiary banking entities in the Group include Westpac Bank PNG-Limited and Westpac Europe Limited. For the purposes of determining Westpac’s capital adequacy subsidiary banking entities are consolidated at Level 2. Restrictions and major impediments on the transfer of funds or regulatory capital within the Group Minimum capital (‘thin capitalisation’) rules Tax legislation in most jurisdictions in which the Group operates prescribes minimum levels of capital that must be retained in that jurisdiction to avoid a portion of the interest costs incurred in the jurisdiction ceasing to be tax deductible. Capital for these purposes includes both contributed capital and non-distributed retained earnings. Westpac seeks to maintain sufficient capital/retained earnings to comply with these rules. Tax costs associated with repatriation Repatriation of retained earnings (and capital) may result in tax being payable in either the jurisdiction from which the repatriation occurs or Australia on receipt of the relevant amounts. This cost would reduce the amount actually repatriated. Intra-group exposure limits Exposures to related entities are managed within the prudential limits prescribed by APRA in APS222 Associations with Related Entities1. Westpac has an internal limit structure and approval process governing credit exposures to related entities. This limit structure and approval process, combined with APRA’s prudential limits, is designed to reduce the potential for unacceptable contagion risk. Prudential regulation of subsidiary entities On 23 March 2021, the RBNZ issued two notices to WNZL under section 95 of the Reserve Bank of New Zealand Act 1989 (NZ) requiring WNZL to supply two external reviews to the RBNZ (the Risk Governance Review and the Liquidity Review). These reviews only apply to WNZL and not to Westpac in Australia or its New Zealand branch. The Risk Governance Review related to the effectiveness of WNZL’s risk governance, with a focus on the role played by the WNZL Board. The Risk Governance Review was completed in November 2021. WNZL has a programme of work underway to address the issues raised. This is being overseen by the WNZL Board. The Liquidity Review related to the effectiveness of WNZL’s actions to improve liquidity risk management and the associated risk culture. The Liquidity Review was completed in May 2022. Recommendations for improvement arising from the review will be implemented as part of WNZL’s continuous improvement activity. From 31 March 2021, the RBNZ amended WNZL’s conditions of registration, requiring WNZL to discount the value of its liquid assets by approximately 14% which at 30 June 2022 was NZ$2.8 billion. From 15 August 2022, the overlay has been reduced to approximately 7%. The remaining overlay will remain in place until the RBNZ is satisfied that control assurance has been completed. 1 For the purposes of APS222, subsidiaries controlled by Westpac, other than subsidiaries that form part of the ELE, represent ‘related entities’. Prudential and internal limits apply to intra-group exposures between the ELE and related entities, both on an individual and aggregate basis. |
| Pillar 3 report Capital overview 8 | Westpac Group June 2022 Pillar 3 Report Capital management strategy Westpac evaluates its approach to capital management through an Internal Capital Adequacy Assessment Process (ICAAP), the key features of which include: x The development of a capital management strategy, including consideration of regulatory minimums, capital buffers and contingency plans. The current regulatory capital minimums together with the capital conservation buffer (CCB) are the Total CET1 Requirement. The Total CET1 Requirement for Westpac is at least 8.0%, based on an industry minimum CET1 requirement of 4.5% plus a capital buffer of at least 3.5% applicable to D-SIBs1,2; x Consideration of regulatory capital requirements and the perspectives of external stakeholders including rating agencies as well as equity and debt investors; and x A stress testing framework that challenges the capital measures, coverage and requirements including the impact of adverse economic scenarios. As part of APRA’s revised capital framework effective from 1 January 2023, APRA has set a Total CET1 Requirement for D-SIBs of 10.25%. This requirement includes a CCB of 4.75% applicable to D-SIBs and a base level for the countercyclical capital buffer of 1.0%. APRA has also indicated3 that it expects that D-SIBs (including Westpac) will likely operate with CET1 above 11% in normal operating conditions under the new framework. Westpac will seek to operate with a CET1 capital ratio of between 11.0% and 11.5% (operating capital range) in normal operating conditions as measured under the new capital framework from 1 January 2023. 1 Noting that APRA may apply higher CET1 requirements for an individual ADI. 2 If an ADI’s CET1 ratio falls below the Total CET1 Requirement (at least 8%), it faces restrictions on the distribution of earnings, such as dividends, distribution payments on AT1 capital instruments and discretionary staff bonuses. 3 APRA Prudential Practice Guide APG 110 Capital Adequacy, July 2022. |
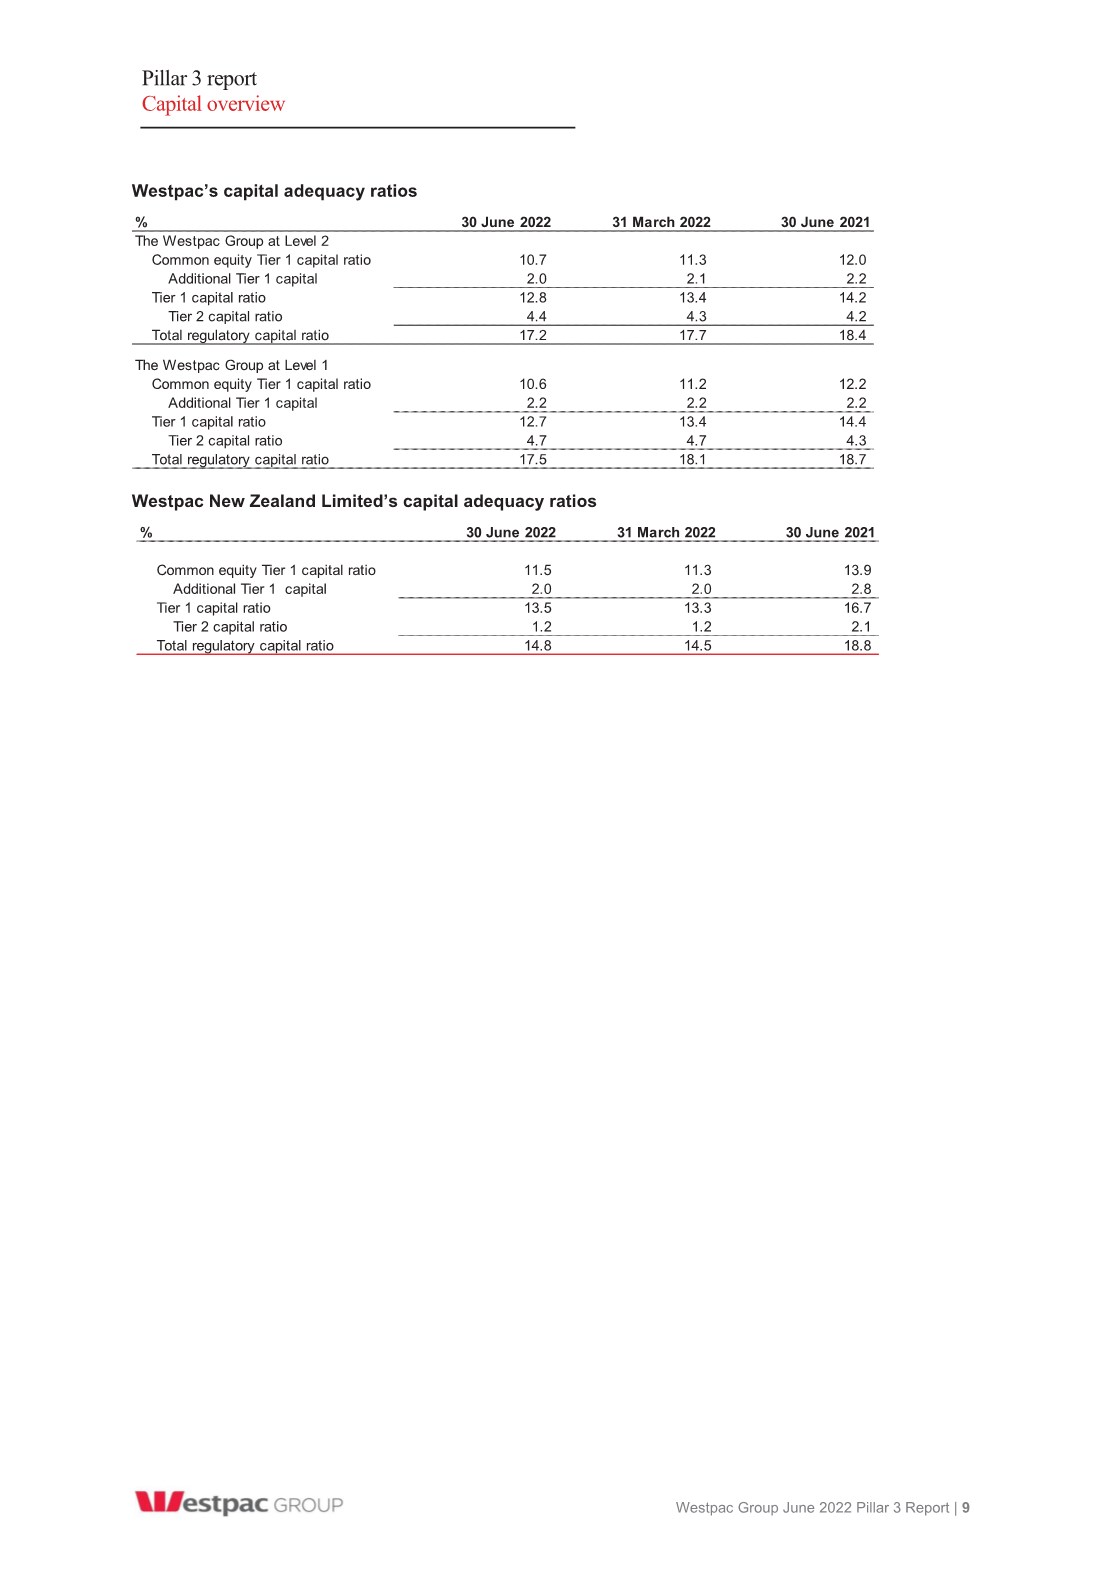
| Pillar 3 report Capital overview Westpac Group June 2022 Pillar 3 Report | 9 Westpac’s capital adequacy ratios Westpac New Zealand Limited’s capital adequacy ratios % 30 June 2022 31 March 2022 30 June 2021 The Westpac Group at Level 2 Common equity Tier 1 capital ratio 10.7 11.3 12.0 Additional Tier 1 capital 2.0 2.1 2.2 Tier 1 capital ratio 12.8 13.4 14.2 Tier 2 capital ratio 4.4 4.3 4.2 Total regulatory capital ratio 17.2 17.7 18.4 The Westpac Group at Level 1 Common equity Tier 1 capital ratio 10.6 11.2 12.2 Additional Tier 1 capital 2.2 2.2 2.2 Tier 1 capital ratio 12.7 13.4 14.4 Tier 2 capital ratio 4.7 4.7 4.3 Total regulatory capital ratio 17.5 18.1 18.7 % 30 June 2022 31 March 2022 30 June 2021 Common equity Tier 1 capital ratio 11.5 11.3 13.9 Additional Tier 1 capital 2.0 2.0 2.8 Tier 1 capital ratio 13.5 13.3 16.7 Tier 2 capital ratio 1.2 1.2 2.1 Total regulatory capital ratio 14.8 14.5 18.8 |
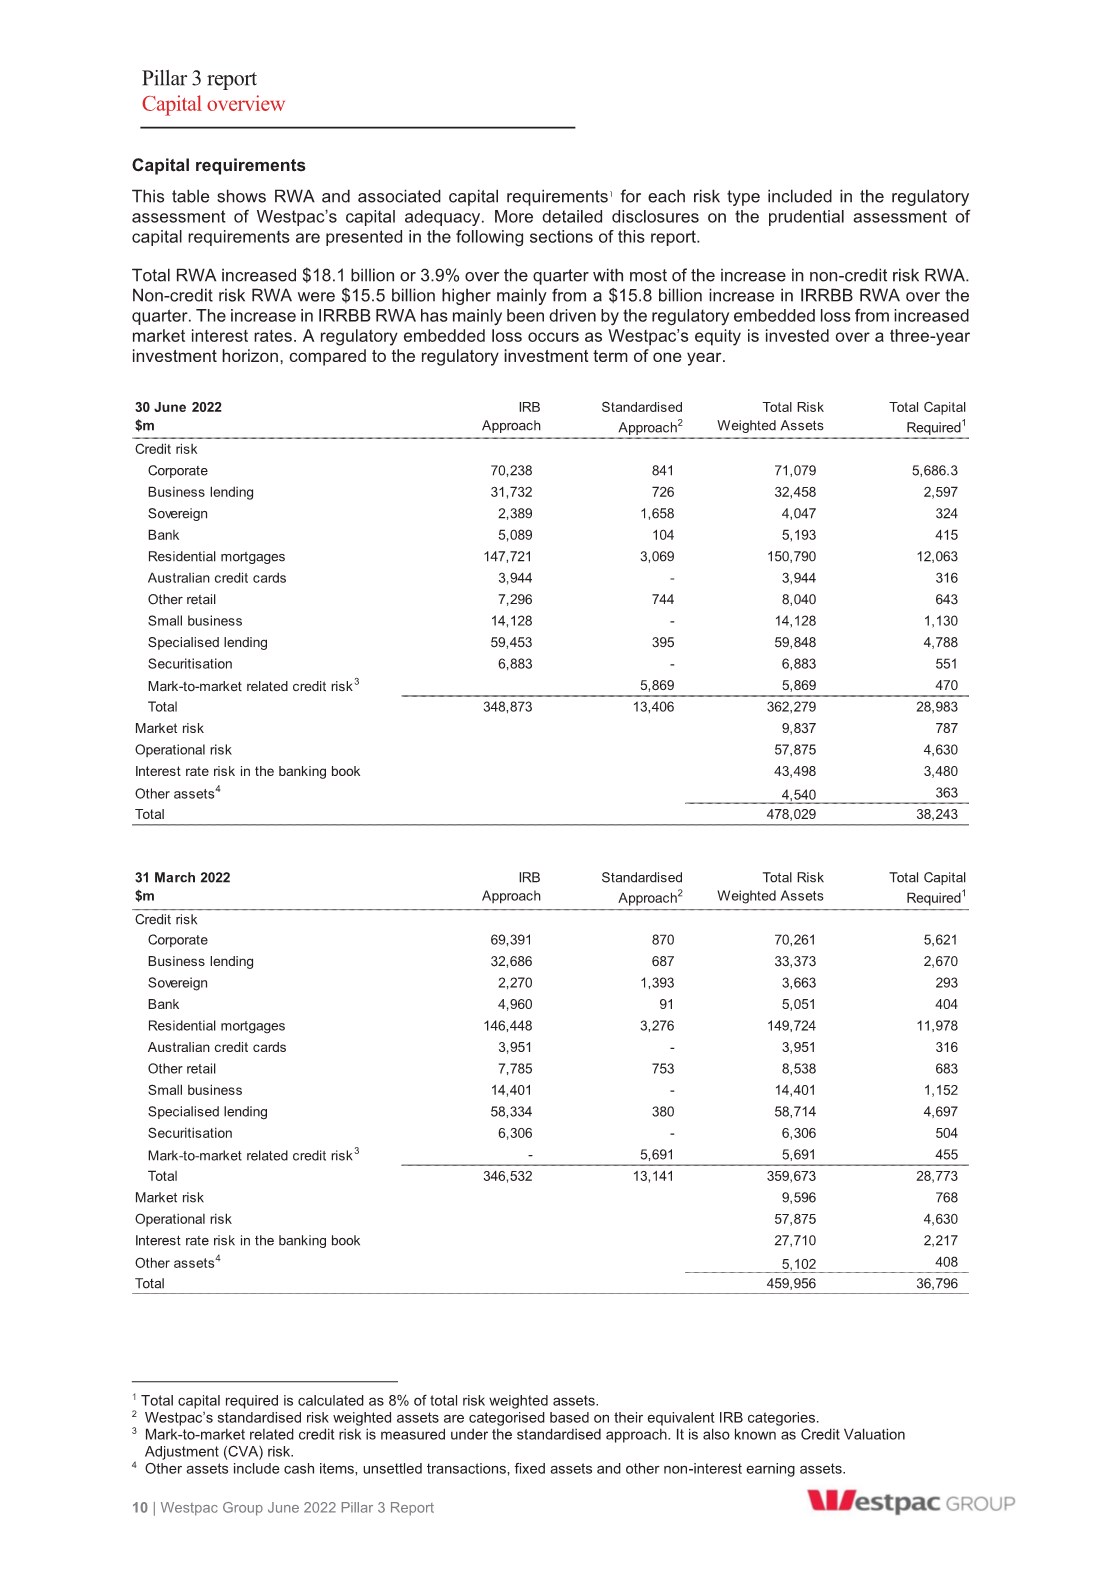
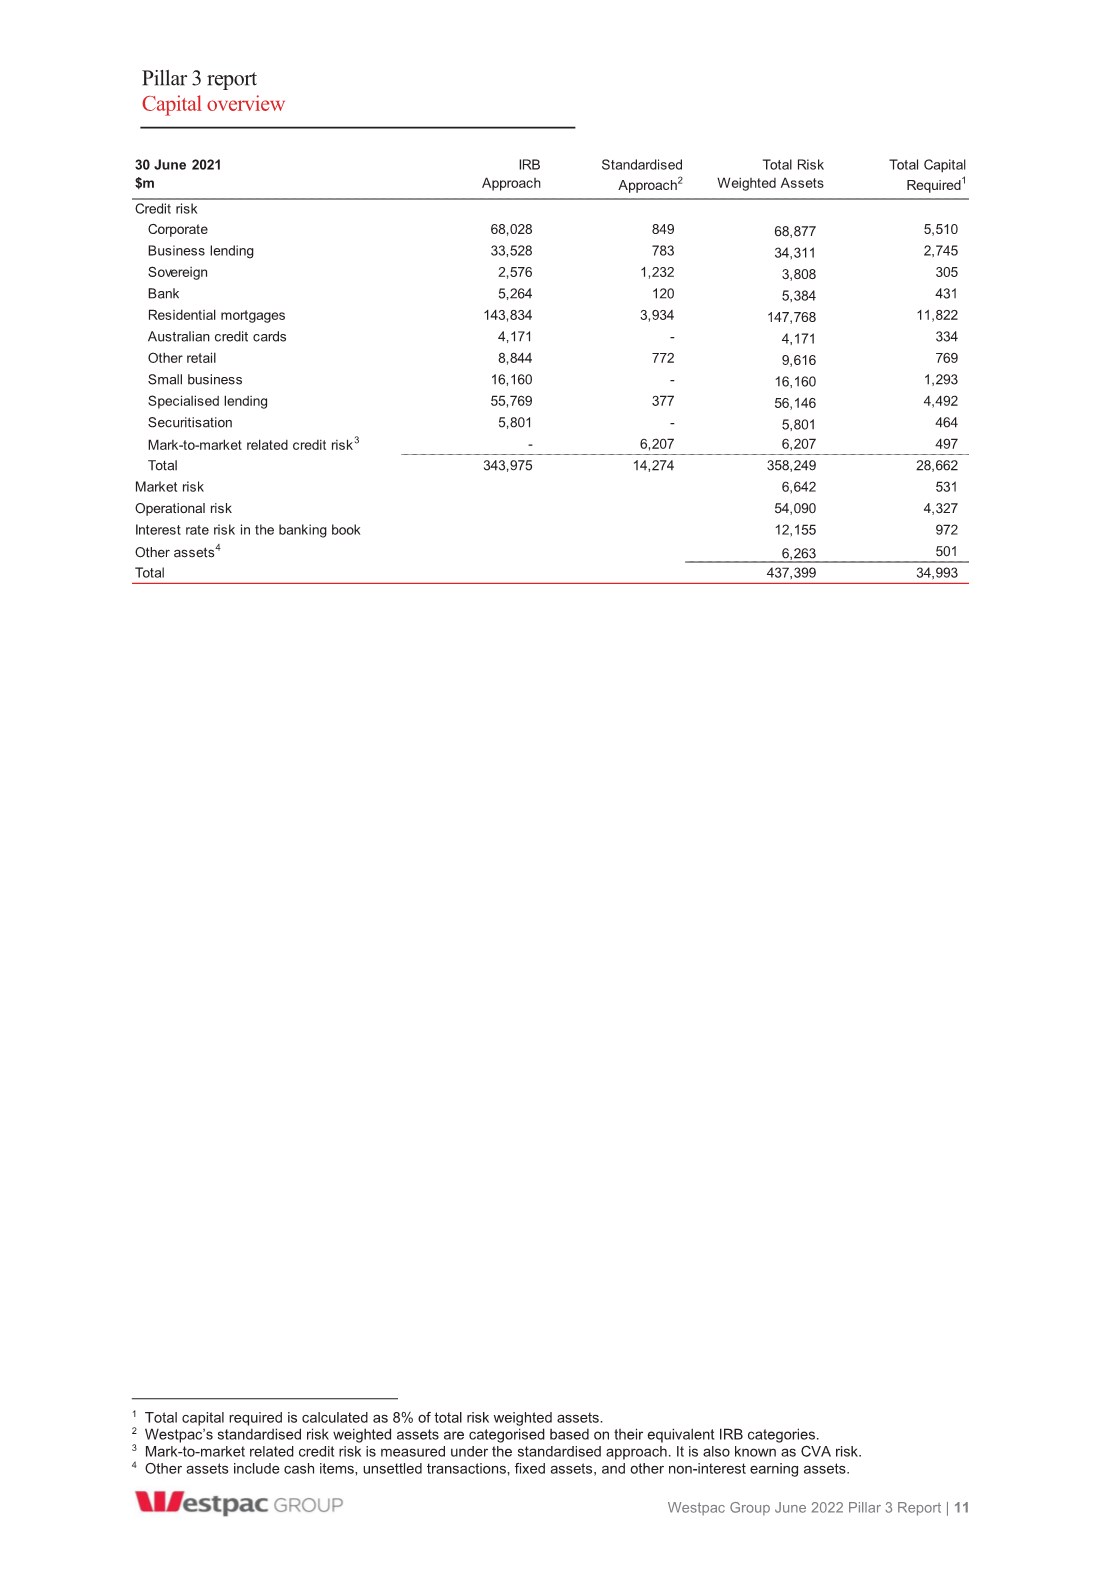
| Pillar 3 report Capital overview 10 | Westpac Group June 2022 Pillar 3 Report Capital requirements This table shows RWA and associated capital requirements1 for each risk type included in the regulatory assessment of Westpac’s capital adequacy. More detailed disclosures on the prudential assessment of capital requirements are presented in the following sections of this report.123 Total RWA increased $18.1 billion or 3.9% over the quarter with most of the increase in non-credit risk RWA. Non-credit risk RWA were $15.5 billion higher mainly from a $15.8 billion increase in IRRBB RWA over the quarter. The increase in IRRBB RWA has mainly been driven by the regulatory embedded loss from increased market interest rates. A regulatory embedded loss occurs as Westpac’s equity is invested over a three-year investment horizon, compared to the regulatory investment term of one year. 1 Total capital required is calculated as 8% of total risk weighted assets. 2 Westpac’s standardised risk weighted assets are categorised based on their equivalent IRB categories. 3 Mark-to-market related credit risk is measured under the standardised approach. It is also known as Credit Valuation Adjustment (CVA) risk. 4 Other assets include cash items, unsettled transactions, fixed assets and other non-interest earning assets. 30 June 2022 IRB Standardised Total Risk Total Capital $m Approach Approach2 Weighted Assets Required1 Credit risk Corporate 70,238 841 71,079 5,686.3 Business lending 31,732 726 32,458 2,597 Sovereign 2,389 1,658 4,047 324 Bank 5,089 104 5,193 415 Residential mortgages 147,721 3,069 150,790 12,063 Australian credit cards 3,944 - 3,944 316 Other retail 7,296 744 8,040 643 Small business 14,128 - 14,128 1,130 Specialised lending 59,453 395 59,848 4,788 Securitisation 6,883 - 6,883 551 Mark-to-market related credit risk3 5,869 5,869 470 Total 348,873 13,406 362,279 28,983 Market risk 9,837 787 Operational risk 57,875 4,630 Interest rate risk in the banking book 43,498 3,480 Other assets4 4,540 363 Total 478,029 38,243 31 March 2022 IRB Standardised Total Risk Total Capital $m Approach Approach2 Weighted Assets Required1 Credit risk Corporate 69,391 870 70,261 5,621 Business lending 32,686 687 33,373 2,670 Sovereign 2,270 1,393 3,663 293 Bank 4,960 91 5,051 404 Residential mortgages 146,448 3,276 149,724 11,978 Australian credit cards 3,951 - 3,951 316 Other retail 7,785 753 8,538 683 Small business 14,401 - 14,401 1,152 Specialised lending 58,334 380 58,714 4,697 Securitisation 6,306 - 6,306 504 Mark-to-market related credit risk3 - 5,691 5,691 455 Total 346,532 13,141 359,673 28,773 Market risk 9,596 768 Operational risk 57,875 4,630 Interest rate risk in the banking book 27,710 2,217 Other assets4 5,102 408 Total 459,956 36,796 |
| Pillar 3 report Capital overview Westpac Group June 2022 Pillar 3 Report | 11 1234 1 Total capital required is calculated as 8% of total risk weighted assets. 2 Westpac’s standardised risk weighted assets are categorised based on their equivalent IRB categories. 3 Mark-to-market related credit risk is measured under the standardised approach. It is also known as CVA risk. 4 Other assets include cash items, unsettled transactions, fixed assets, and other non-interest earning assets. 30 June 2021 IRB Standardised Total Risk Total Capital $m Approach Approach2 Weighted Assets Required1 Credit risk Corporate 68,028 849 68,877 5,510 Business lending 33,528 783 34,311 2,745 Sovereign 2,576 1,232 3,808 305 Bank 5,264 120 5,384 431 Residential mortgages 143,834 3,934 147,768 11,822 Australian credit cards 4,171 - 4,171 334 Other retail 8,844 772 9,616 769 Small business 16,160 - 16,160 1,293 Specialised lending 55,769 377 56,146 4,492 Securitisation 5,801 - 5,801 464 Mark-to-market related credit risk3 - 6,207 6,207 497 Total 343,975 14,274 358,249 28,662 Market risk 6,642 531 Operational risk 54,090 4,327 Interest rate risk in the banking book 12,155 972 Other assets4 6,263 501 Total 437,399 34,993 |
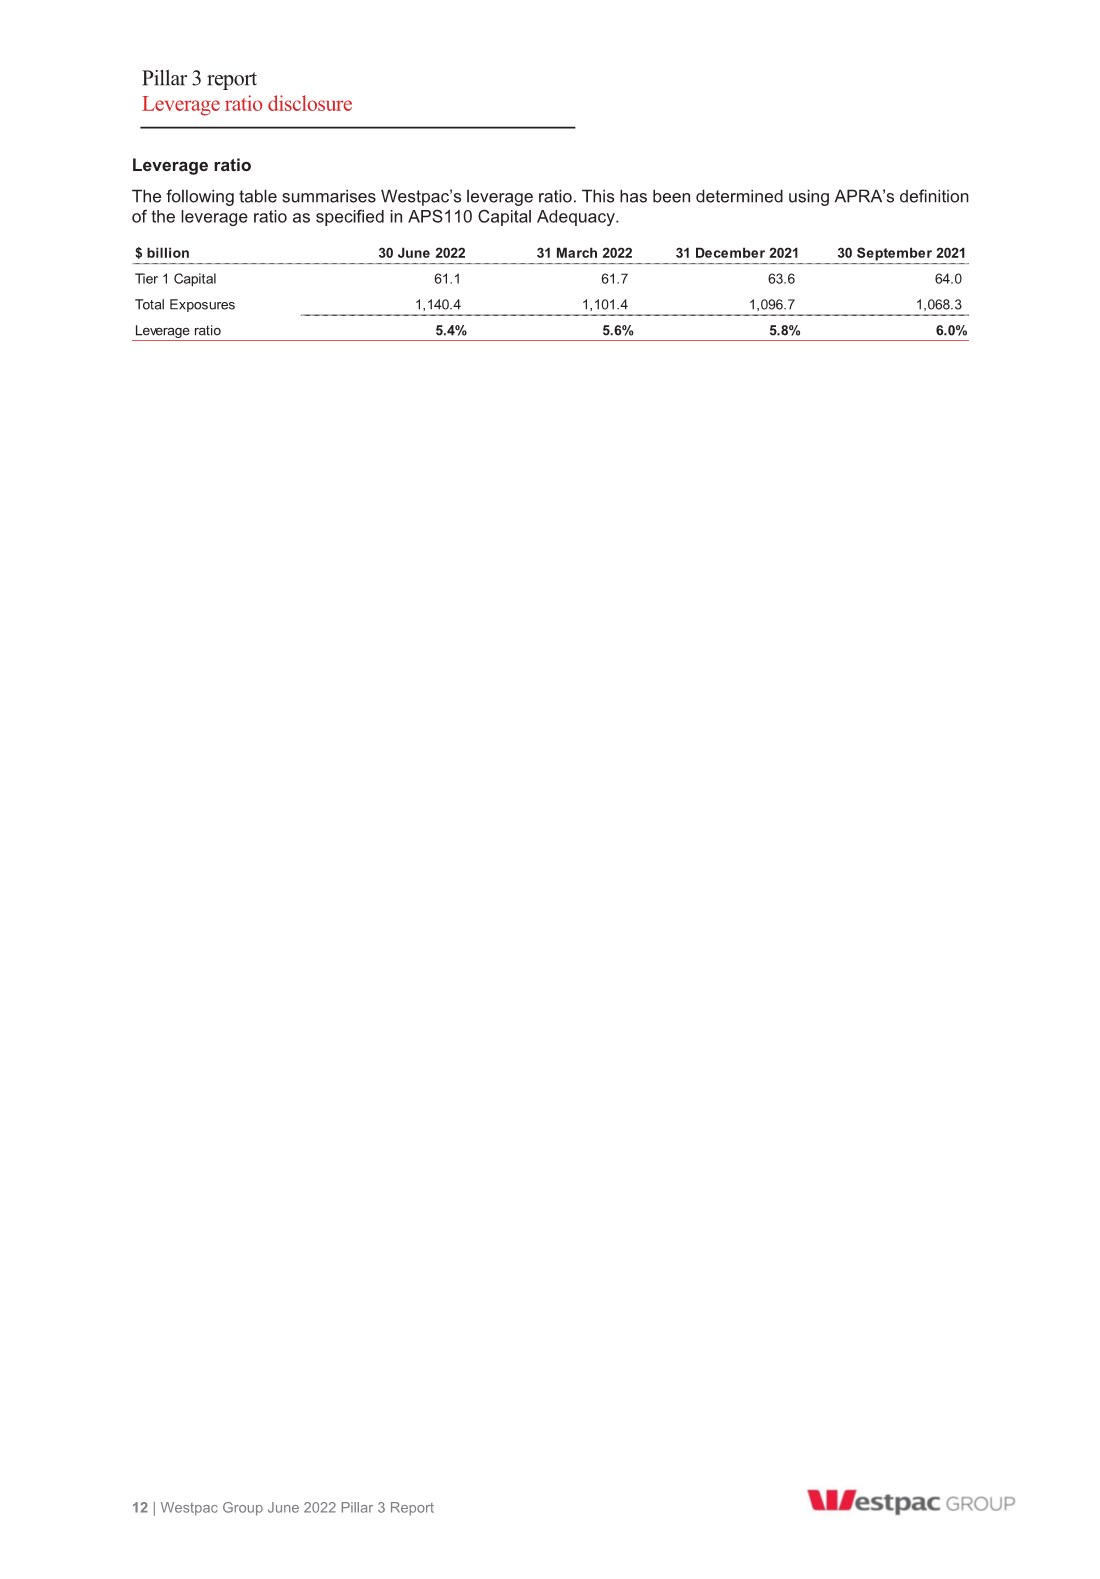
| Pillar 3 report Leverage ratio disclosure 12 | Westpac Group June 2022 Pillar 3 Report Leverage ratio The following table summarises Westpac’s leverage ratio. This has been determined using APRA’s definition of the leverage ratio as specified in APS110 Capital Adequacy. $ billion 30 June 2022 31 March 2022 31 December 2021 30 September 2021 Tier 1 Capital 61.1 61.7 63.6 64.0 Total Exposures 1,140.4 1,101.4 1,096.7 1,068.3 Leverage ratio 5.4% 5.6% 5.8% 6.0% |
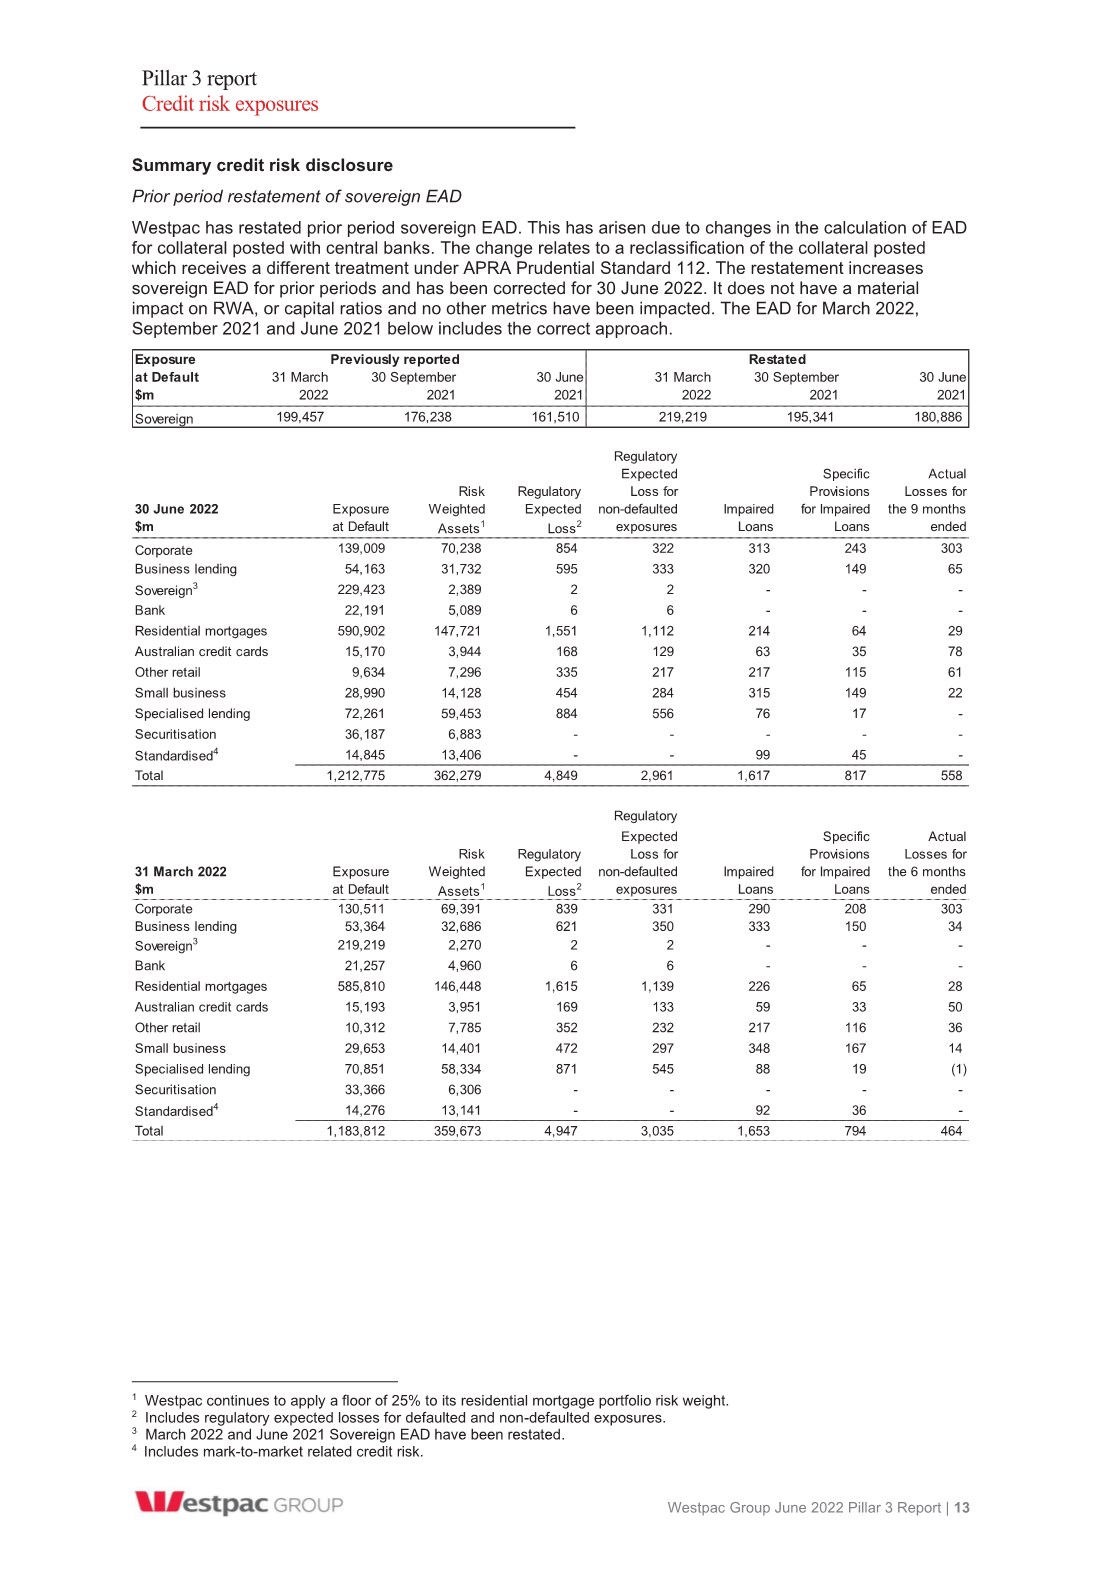
| Pillar 3 report Credit risk exposures Westpac Group June 2022 Pillar 3 Report | 13 Summary credit risk disclosure123 Prior period restatement of sovereign EAD Westpac has restated prior period sovereign EAD. This has arisen due to changes in the calculation of EAD for collateral posted with central banks. The change relates to a reclassification of the collateral posted which receives a different treatment under APRA Prudential Standard 112. The restatement increases sovereign EAD for prior periods and has been corrected for 30 June 2022. It does not have a material impact on RWA, or capital ratios and no other metrics have been impacted. The EAD for March 2022, September 2021 and June 2021 below includes the correct approach. 1 Westpac continues to apply a floor of 25% to its residential mortgage portfolio risk weight. 2 Includes regulatory expected losses for defaulted and non-defaulted exposures. 3 March 2022 and June 2021 Sovereign EAD have been restated. 4 Includes mark-to-market related credit risk. Exposure at Default $m Sovereign 199,457 176,238 161,510 219,219 195,341 180,886 Restated Previously reported 31 March 2022 30 September 2021 30 June 2021 31 March 2022 30 September 2021 30 June 2021 Regulatory Expected Specific Actual Risk Regulatory Loss for Provisions Losses for 30 June 2022 Exposure Weighted Expected non-defaulted Impaired for Impaired the 9 months $m at Default Assets1 Loss2 exposures Loans Loans ended Corporate 139,009 70,238 854 322 313 243 303 Business lending 54,163 31,732 595 333 320 149 65 Sovereign3 229,423 2,389 2 2 - - - Bank 22,191 5,089 6 6 - - - Residential mortgages 590,902 147,721 1,551 1,112 214 64 29 Australian credit cards 15,170 3,944 168 129 63 35 78 Other retail 9,634 7,296 335 217 217 115 61 Small business 28,990 14,128 454 284 315 149 22 Specialised lending 72,261 59,453 884 556 76 17 - Securitisation 36,187 6,883 - - - - - Standardised4 14,845 13,406 - - 99 45 - Total 1,212,775 362,279 4,849 2,961 1,617 817 558 Regulatory Expected Specific Actual Risk Regulatory Loss for Provisions Losses for 31 March 2022 Exposure Weighted Expected non-defaulted Impaired for Impaired the 6 months $m at Default Assets1 Loss2 exposures Loans Loans ended Corporate 130,511 69,391 839 331 290 208 303 Business lending 53,364 32,686 621 350 333 150 34 Sovereign3 219,219 2,270 2 2 - - - Bank 21,257 4,960 6 6 - - - Residential mortgages 585,810 146,448 1,615 1,139 226 65 28 Australian credit cards 15,193 3,951 169 133 59 33 50 Other retail 10,312 7,785 352 232 217 116 36 Small business 29,653 14,401 472 297 348 167 14 Specialised lending 70,851 58,334 871 545 88 19 (1) Securitisation 33,366 6,306 - - - - - Standardised4 14,276 13,141 - - 92 36 - Total 1,183,812 359,673 4,947 3,035 1,653 794 464 |
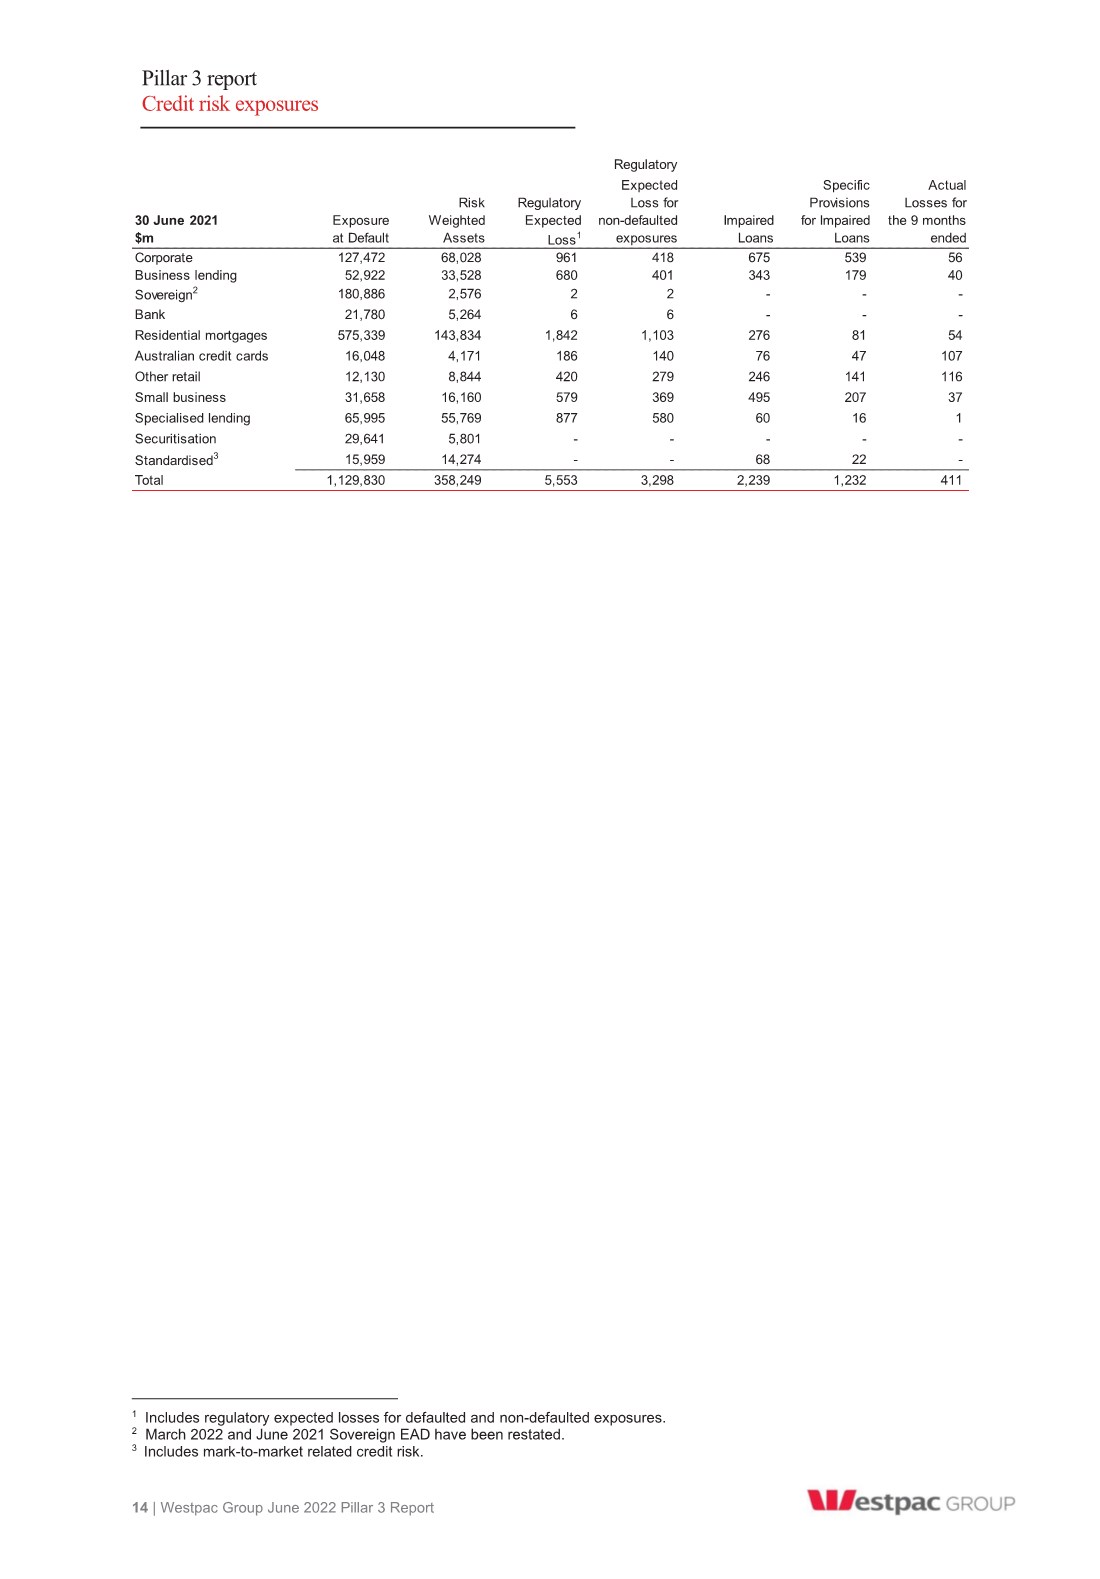
| Pillar 3 report Credit risk exposures 14 | Westpac Group June 2022 Pillar 3 Report 12 1 Includes regulatory expected losses for defaulted and non-defaulted exposures. 2 March 2022 and June 2021 Sovereign EAD have been restated. 3 Includes mark-to-market related credit risk. Regulatory Expected Specific Actual Risk Regulatory Loss for Provisions Losses for 30 June 2021 Exposure Weighted Expected non-defaulted Impaired for Impaired the 9 months $m at Default Assets Loss1 exposures Loans Loans ended Corporate 127,472 68,028 961 418 675 539 56 Business lending 52,922 33,528 680 401 343 179 40 Sovereign2 180,886 2,576 2 2 - - - Bank 21,780 5,264 6 6 - - - Residential mortgages 575,339 143,834 1,842 1,103 276 81 54 Australian credit cards 16,048 4,171 186 140 76 47 107 Other retail 12,130 8,844 420 279 246 141 116 Small business 31,658 16,160 579 369 495 207 37 Specialised lending 65,995 55,769 877 580 60 16 1 Securitisation 29,641 5,801 - - - - - Standardised3 15,959 14,274 - - 68 22 - Total 1,129,830 358,249 5,553 3,298 2,239 1,232 411 |
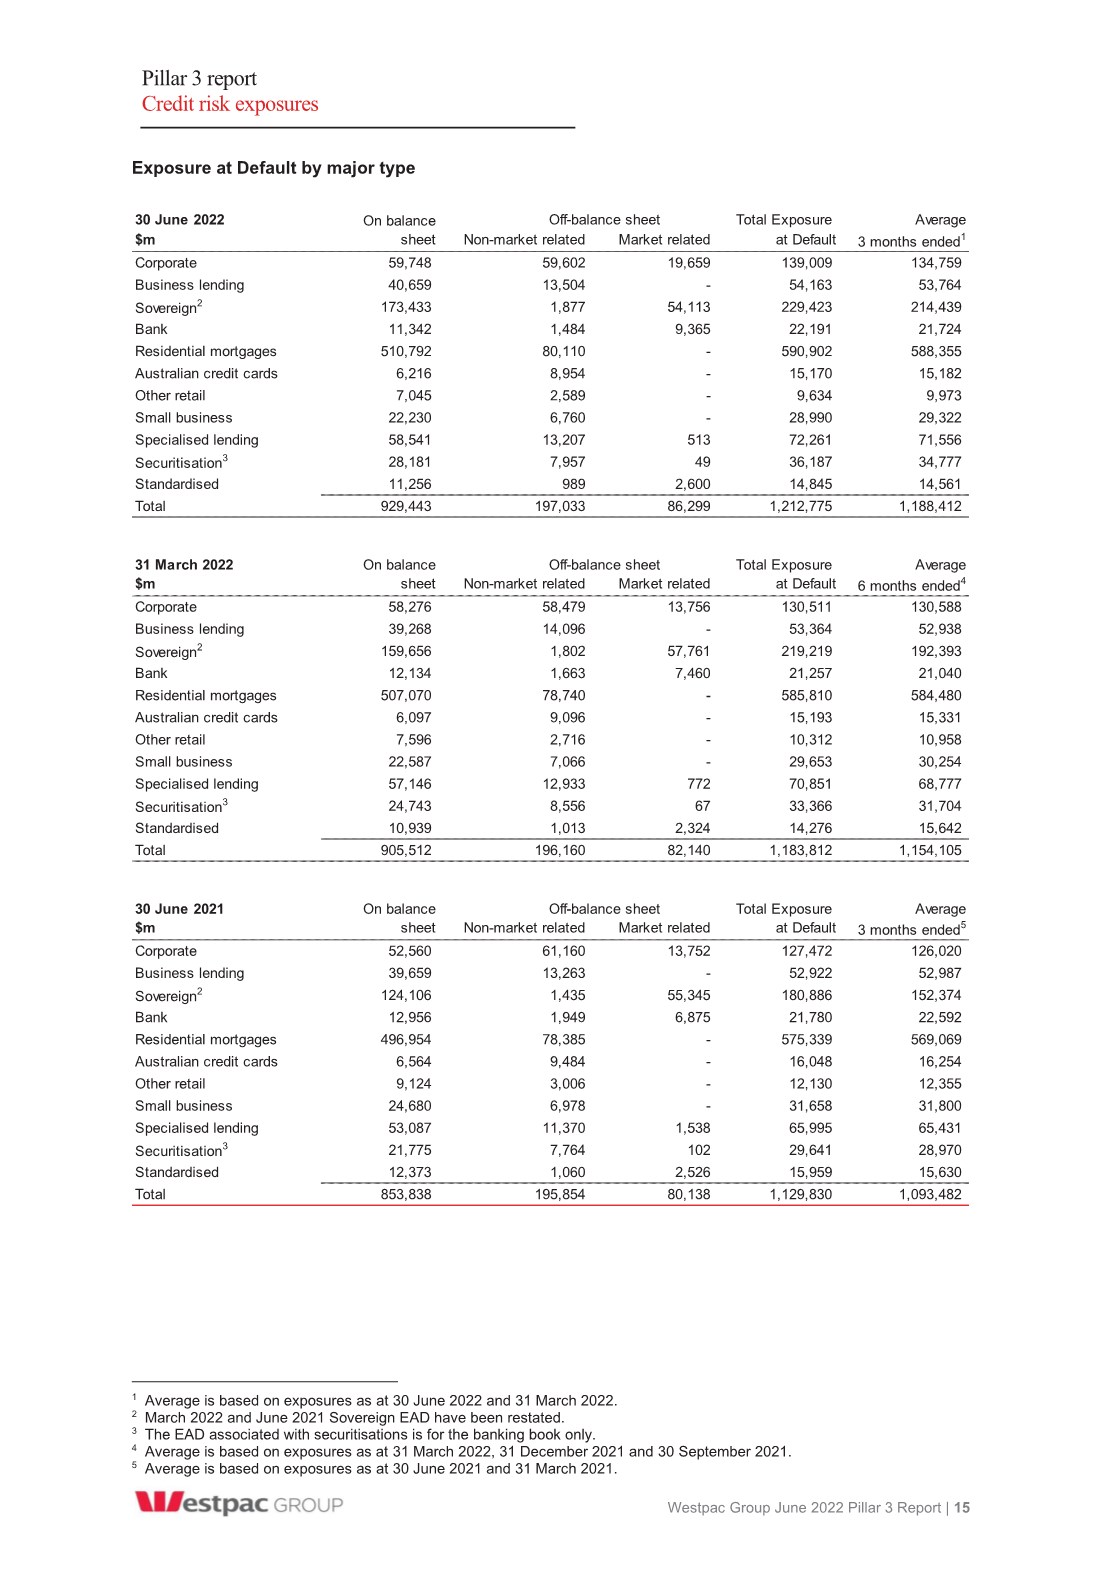
| Pillar 3 report Credit risk exposures Westpac Group June 2022 Pillar 3 Report | 15 Exposure at Default by major type123 1 Average is based on exposures as at 30 June 2022 and 31 March 2022. 2 March 2022 and June 2021 Sovereign EAD have been restated. 3 The EAD associated with securitisations is for the banking book only. 4 Average is based on exposures as at 31 March 2022, 31 December 2021 and 30 September 2021. 5 Average is based on exposures as at 30 June 2021 and 31 March 2021. 30 June 2022 On balance Total Exposure Average $m sheet Non-market related Market related at Default 3 months ended1 Corporate 59,748 59,602 19,659 139,009 134,759 Business lending 40,659 13,504 - 54,163 53,764 Sovereign2 173,433 1,877 54,113 229,423 214,439 Bank 11,342 1,484 9,365 22,191 21,724 Residential mortgages 510,792 80,110 - 590,902 588,355 Australian credit cards 6,216 8,954 - 15,170 15,182 Other retail 7,045 2,589 - 9,634 9,973 Small business 22,230 6,760 - 28,990 29,322 Specialised lending 58,541 13,207 513 72,261 71,556 Securitisation3 28,181 7,957 49 36,187 34,777 Standardised 11,256 989 2,600 14,845 14,561 Total 929,443 197,033 86,299 1,212,775 1,188,412 31 March 2022 On balance Total Exposure Average $m sheet Non-market related Market related at Default 6 months ended4 Corporate 58,276 58,479 13,756 130,511 130,588 Business lending 39,268 14,096 - 53,364 52,938 Sovereign2 159,656 1,802 57,761 219,219 192,393 Bank 12,134 1,663 7,460 21,257 21,040 Residential mortgages 507,070 78,740 - 585,810 584,480 Australian credit cards 6,097 9,096 - 15,193 15,331 Other retail 7,596 2,716 - 10,312 10,958 Small business 22,587 7,066 - 29,653 30,254 Specialised lending 57,146 12,933 772 70,851 68,777 Securitisation3 24,743 8,556 67 33,366 31,704 Standardised 10,939 1,013 2,324 14,276 15,642 Total 905,512 196,160 82,140 1,183,812 1,154,105 30 June 2021 On balance Total Exposure Average $m sheet Non-market related Market related at Default 3 months ended5 Corporate 52,560 61,160 13,752 127,472 126,020 Business lending 39,659 13,263 - 52,922 52,987 Sovereign2 124,106 1,435 55,345 180,886 152,374 Bank 12,956 1,949 6,875 21,780 22,592 Residential mortgages 496,954 78,385 - 575,339 569,069 Australian credit cards 6,564 9,484 - 16,048 16,254 Other retail 9,124 3,006 - 12,130 12,355 Small business 24,680 6,978 - 31,658 31,800 Specialised lending 53,087 11,370 1,538 65,995 65,431 Securitisation3 21,775 7,764 102 29,641 28,970 Standardised 12,373 1,060 2,526 15,959 15,630 Total 853,838 195,854 80,138 1,129,830 1,093,482 Off-balance sheet Off-balance sheet Off-balance sheet |
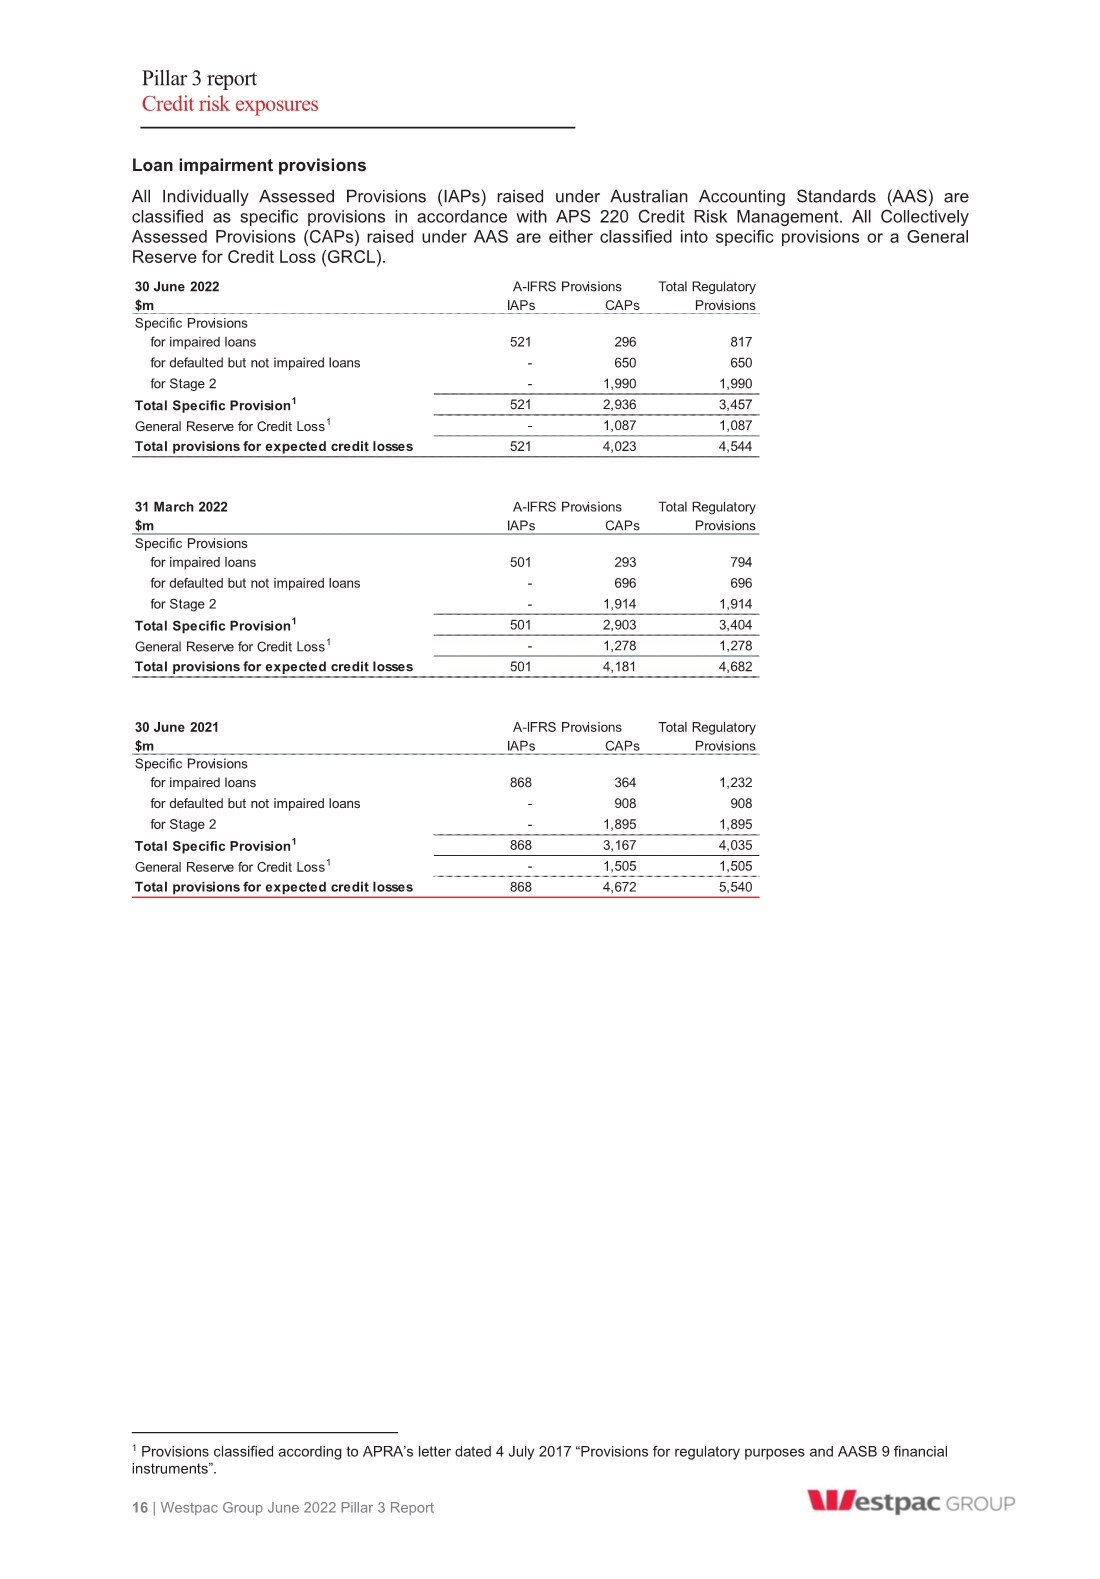
| Pillar 3 report Credit risk exposures 16 | Westpac Group June 2022 Pillar 3 Report Loan impairment provisions All Individually Assessed Provisions (IAPs) raised under Australian Accounting Standards (AAS) are classified as specific provisions in accordance with APS 220 Credit Risk Management. All Collectively Assessed Provisions (CAPs) raised under AAS are either classified into specific provisions or a General Reserve for Credit Loss (GRCL).1 1 Provisions classified according to APRA’s letter dated 4 July 2017 “Provisions for regulatory purposes and AASB 9 financial instruments”. 30 June 2022 Total Regulatory $m IAPs CAPs Provisions Specific Provisions for impaired loans 521 296 817 for defaulted but not impaired loans - 650 650 for Stage 2 - 1,990 1,990 Total Specific Provision1 521 2,936 3,457 General Reserve for Credit Loss1 -1,087 1,087 Total provisions for expected credit losses 521 4,023 4,544 31 March 2022 Total Regulatory $m IAPs CAPs Provisions Specific Provisions for impaired loans 501 293 794 for defaulted but not impaired loans - 696 696 for Stage 2 - 1,914 1,914 Total Specific Provision1 501 2,903 3,404 General Reserve for Credit Loss1 -1,278 1,278 Total provisions for expected credit losses 501 4,181 4,682 30 June 2021 Total Regulatory $m IAPs CAPs Provisions Specific Provisions for impaired loans 868 364 1,232 for defaulted but not impaired loans - 908 908 for Stage 2 - 1,895 1,895 Total Specific Provision1 868 3,167 4,035 General Reserve for Credit Loss1 -1,505 1,505 Total provisions for expected credit losses 868 4,672 5,540 A-IFRS Provisions A-IFRS Provisions A-IFRS Provisions |
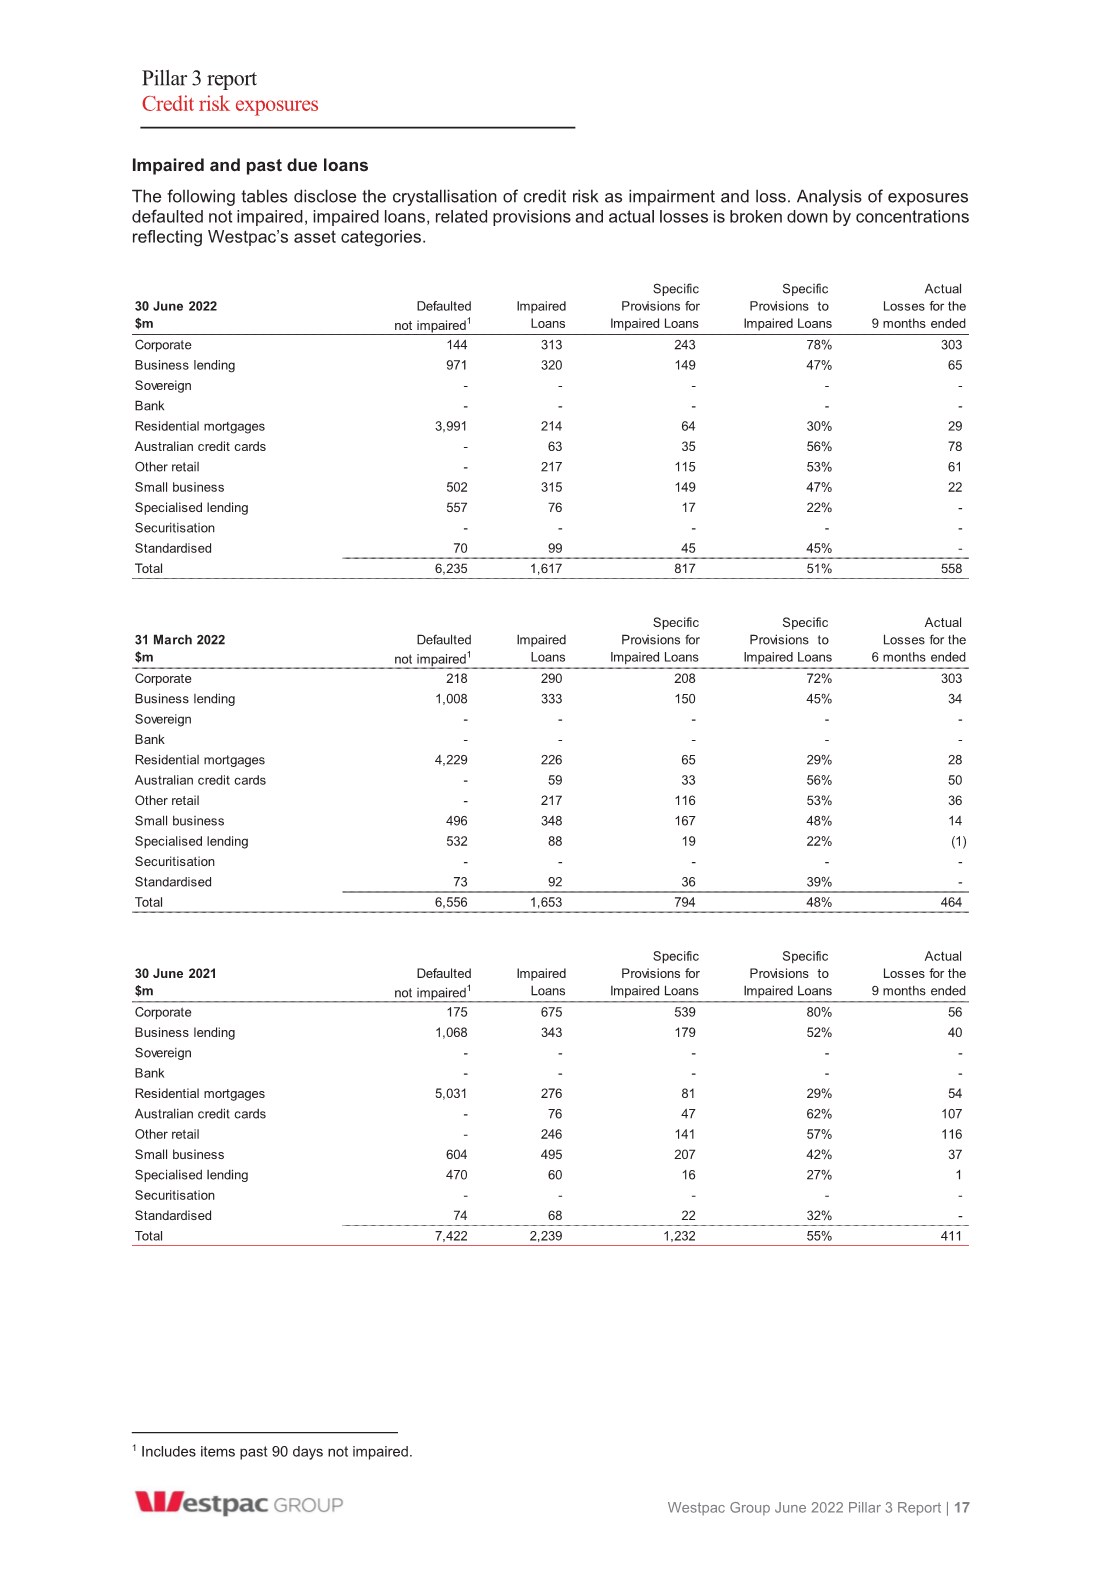
| Pillar 3 report Credit risk exposures Westpac Group June 2022 Pillar 3 Report | 17 Impaired and past due loans The following tables disclose the crystallisation of credit risk as impairment and loss. Analysis of exposures defaulted not impaired, impaired loans, related provisions and actual losses is broken down by concentrations reflecting Westpac’s asset categories.1 2 1 Includes items past 90 days not impaired. Specific Specific Actual 30 June 2022 Defaulted Impaired Provisions for Provisions to Losses for the $m not impaired1 Loans Impaired Loans Impaired Loans 9 months ended Corporate 144 313 243 78% 303 Business lending 971 320 149 47% 65 Sovereign -- - - - Bank -- - - - Residential mortgages 3,991 214 64 30% 29 Australian credit cards -63 35 56% 78 Other retail - 217 115 53% 61 Small business 502 315 149 47% 22 Specialised lending 557 76 17 22% - Securitisation -- - - - Standardised 70 99 45 45% - Total 6,235 1,617 817 51% 558 Specific Specific Actual 31 March 2022 Defaulted Impaired Provisions for Provisions to Losses for the $m not impaired1 Loans Impaired Loans Impaired Loans 6 months ended Corporate 218 290 208 72% 303 Business lending 1,008 333 150 45% 34 Sovereign -- - - - Bank -- - - - Residential mortgages 4,229 226 65 29% 28 Australian credit cards -59 33 56% 50 Other retail - 217 116 53% 36 Small business 496 348 167 48% 14 Specialised lending 532 88 19 22% (1) Securitisation -- - - - Standardised 73 92 36 39% - Total 6,556 1,653 794 48% 464 Specific Specific Actual 30 June 2021 Defaulted Impaired Provisions for Provisions to Losses for the $m not impaired1 Loans Impaired Loans Impaired Loans 9 months ended Corporate 175 675 539 80% 56 Business lending 1,068 343 179 52% 40 Sovereign ----- Bank - - - - - Residential mortgages 5,031 276 81 29% 54 Australian credit cards - 76 47 62% 107 Other retail - 246 141 57% 116 Small business 604 495 207 42% 37 Specialised lending 470 60 16 27% 1 Securitisation - - - - - Standardised 74 68 22 32% - Total 7,422 2,239 1,232 55% 411 |
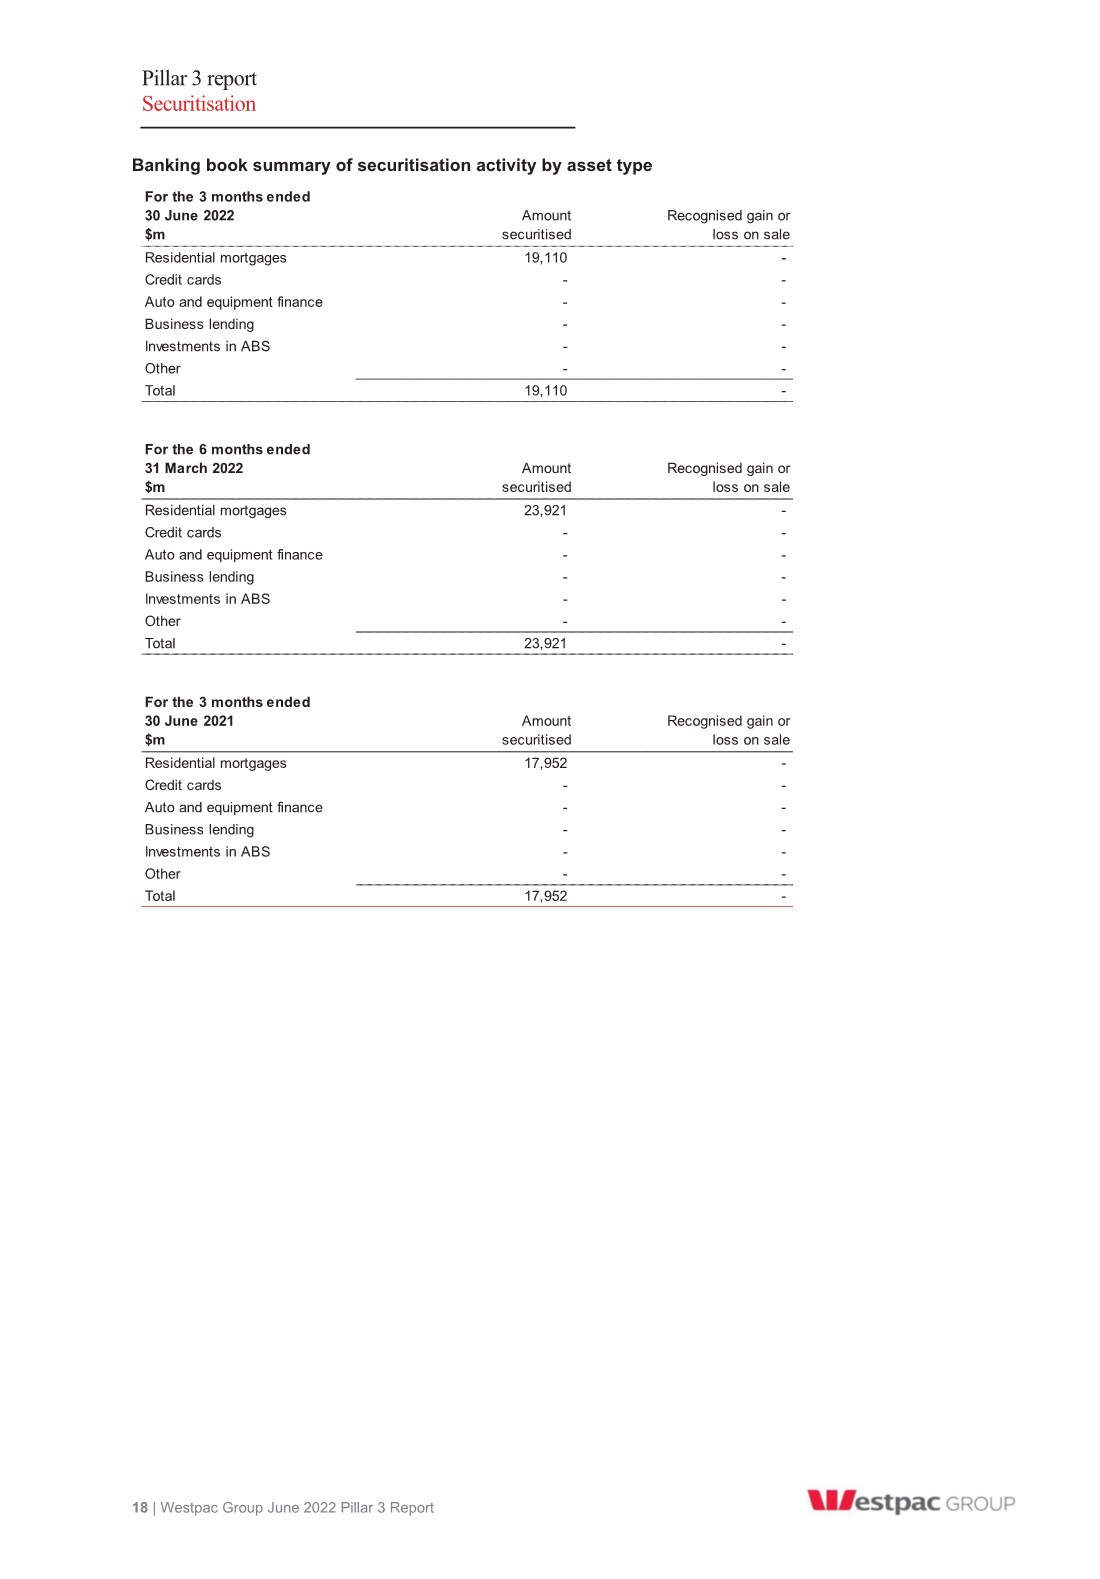
| Pillar 3 report Securitisation 18 | Westpac Group June 2022 Pillar 3 Report Banking book summary of securitisation activity by asset type For the 3 months ended 30 June 2022 Amount Recognised gain or $m securitised loss on sale Residential mortgages 19,110 - Credit cards - - Auto and equipment finance - - Business lending - - Investments in ABS - - Other - - Total 19,110 - For the 6 months ended 31 March 2022 Amount Recognised gain or $m securitised loss on sale Residential mortgages 23,921 - Credit cards - - Auto and equipment finance - - Business lending - - Investments in ABS - - Other - - Total 23,921 - For the 3 months ended 30 June 2021 Amount Recognised gain or $m securitised loss on sale Residential mortgages 17,952 - Credit cards - - Auto and equipment finance - - Business lending - - Investments in ABS - - Other - - Total 17,952 - |
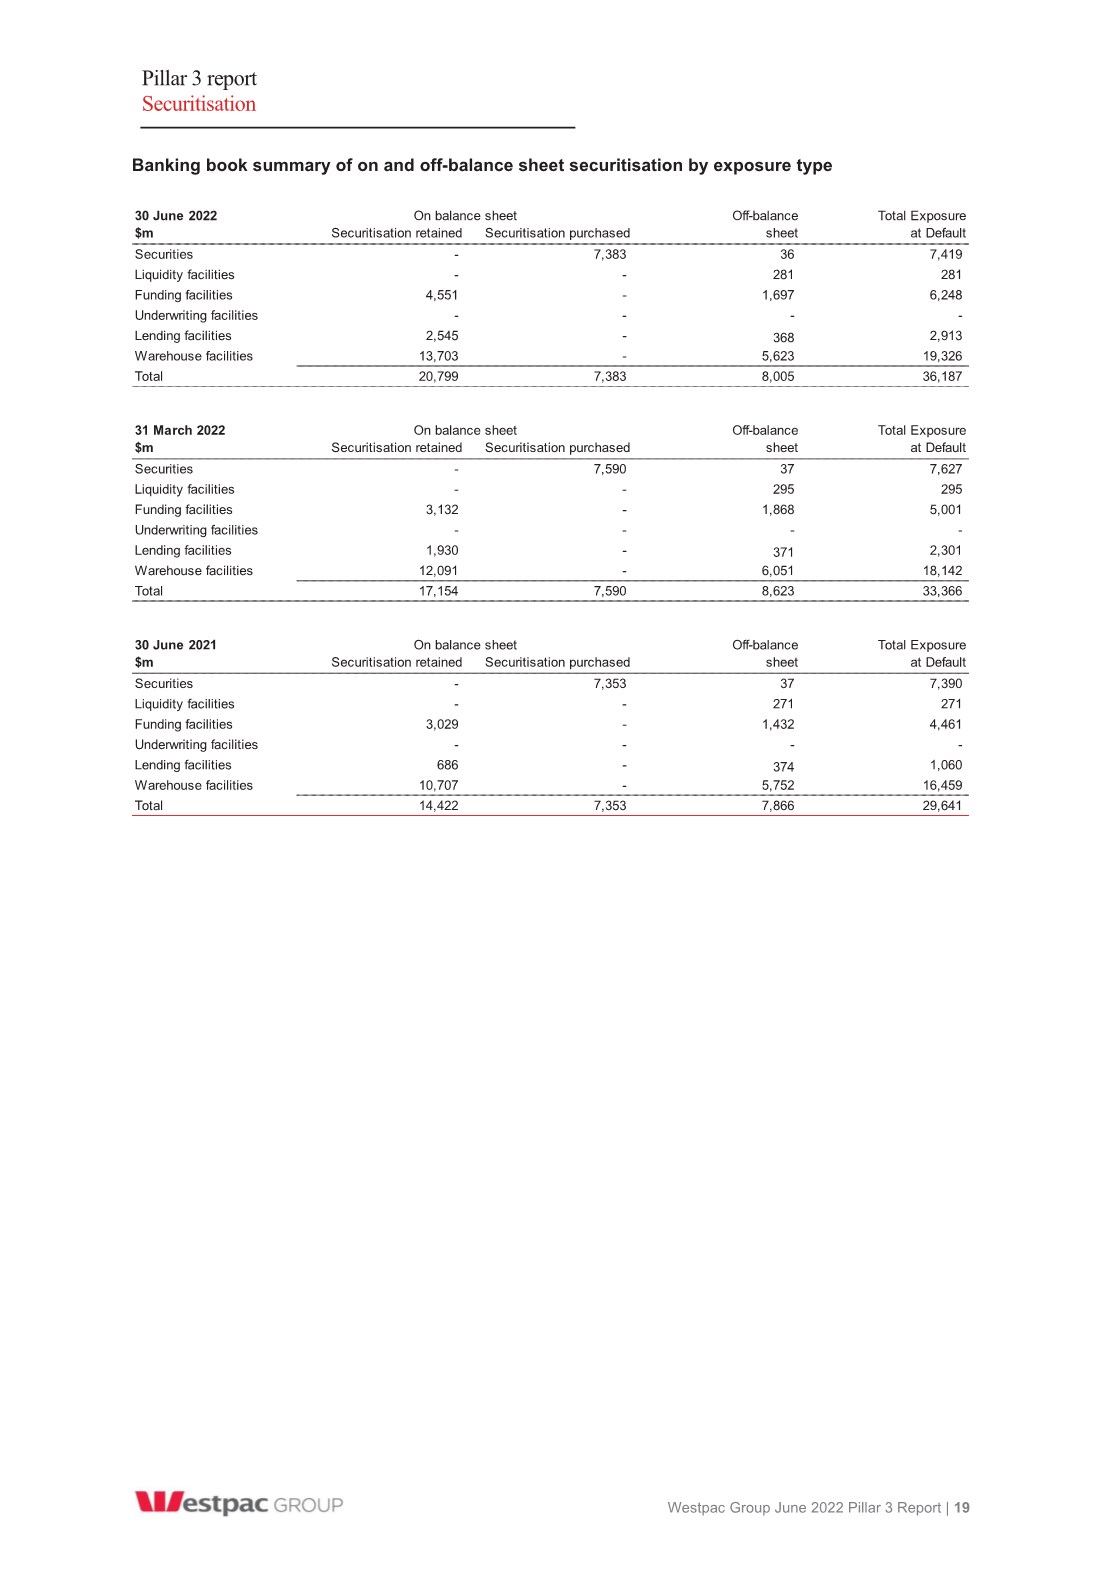
| Pillar 3 report Securitisation Westpac Group June 2022 Pillar 3 Report | 19 Banking book summary of on and off-balance sheet securitisation by exposure type 30 June 2022 Off-balance Total Exposure $m Securitisation retained Securitisation purchased sheet at Default Securities - 7,383 36 7,419 Liquidity facilities - - 281 281 Funding facilities 4,551 - 1,697 6,248 Underwriting facilities - - - - Lending facilities 2,545 - 368 2,913 Warehouse facilities 13,703 - 5,623 19,326 Total 20,799 7,383 8,005 36,187 31 March 2022 Off-balance Total Exposure $m Securitisation retained Securitisation purchased sheet at Default Securities - 7,590 37 7,627 Liquidity facilities - - 295 295 Funding facilities 3,132 - 1,868 5,001 Underwriting facilities - - - - Lending facilities 1,930 - 371 2,301 Warehouse facilities 12,091 - 6,051 18,142 Total 17,154 7,590 8,623 33,366 30 June 2021 Off-balance Total Exposure $m Securitisation retained Securitisation purchased sheet at Default Securities - 7,353 37 7,390 Liquidity facilities - - 271 271 Funding facilities 3,029 - 1,432 4,461 Underwriting facilities - - - - Lending facilities 686 - 374 1,060 Warehouse facilities 10,707 - 5,752 16,459 Total 14,422 7,353 7,866 29,641 On balance sheet On balance sheet On balance sheet |
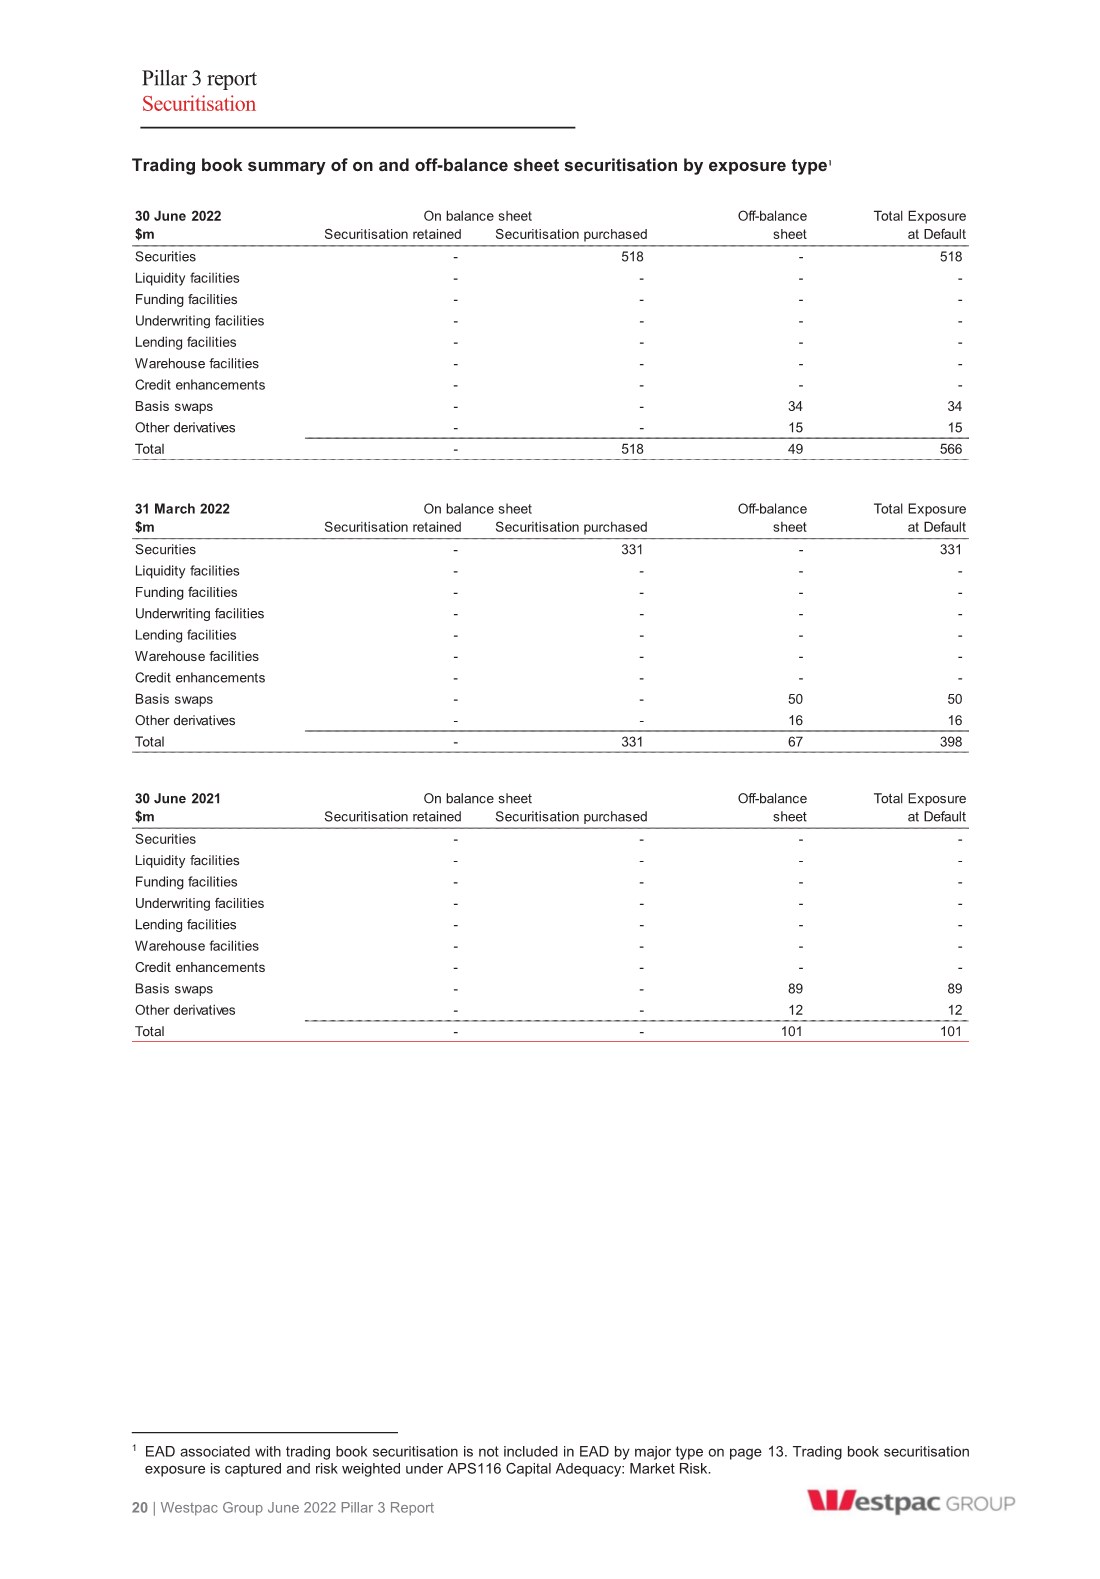
| Pillar 3 report Securitisation 20 | Westpac Group June 2022 Pillar 3 Report Trading book summary of on and off-balance sheet securitisation by exposure type1 1 EAD associated with trading book securitisation is not included in EAD by major type on page 13. Trading book securitisation exposure is captured and risk weighted under APS116 Capital Adequacy: Market Risk. 30 June 2022 Off-balance Total Exposure $m Securitisation retained Securitisation purchased sheet at Default Securities - 518 - 518 Liquidity facilities - - - - Funding facilities - - - - Underwriting facilities - - - - Lending facilities - - - - Warehouse facilities - - - - Credit enhancements - - - - Basis swaps - - 34 34 Other derivatives - - 15 15 Total - 518 49 566 31 March 2022 Off-balance Total Exposure $m Securitisation retained Securitisation purchased sheet at Default Securities - 331 - 331 Liquidity facilities - - - - Funding facilities - - - - Underwriting facilities - - - - Lending facilities - - - - Warehouse facilities - - - - Credit enhancements - - - - Basis swaps - - 50 50 Other derivatives - - 16 16 Total - 331 67 398 30 June 2021 Off-balance Total Exposure $m Securitisation retained Securitisation purchased sheet at Default Securities - - - - Liquidity facilities - - - - Funding facilities - - - - Underwriting facilities - - - - Lending facilities - - - - Warehouse facilities - - - - Credit enhancements - - - - Basis swaps - - 89 89 Other derivatives - - 12 12 Total - - 101 101 On balance sheet On balance sheet On balance sheet |
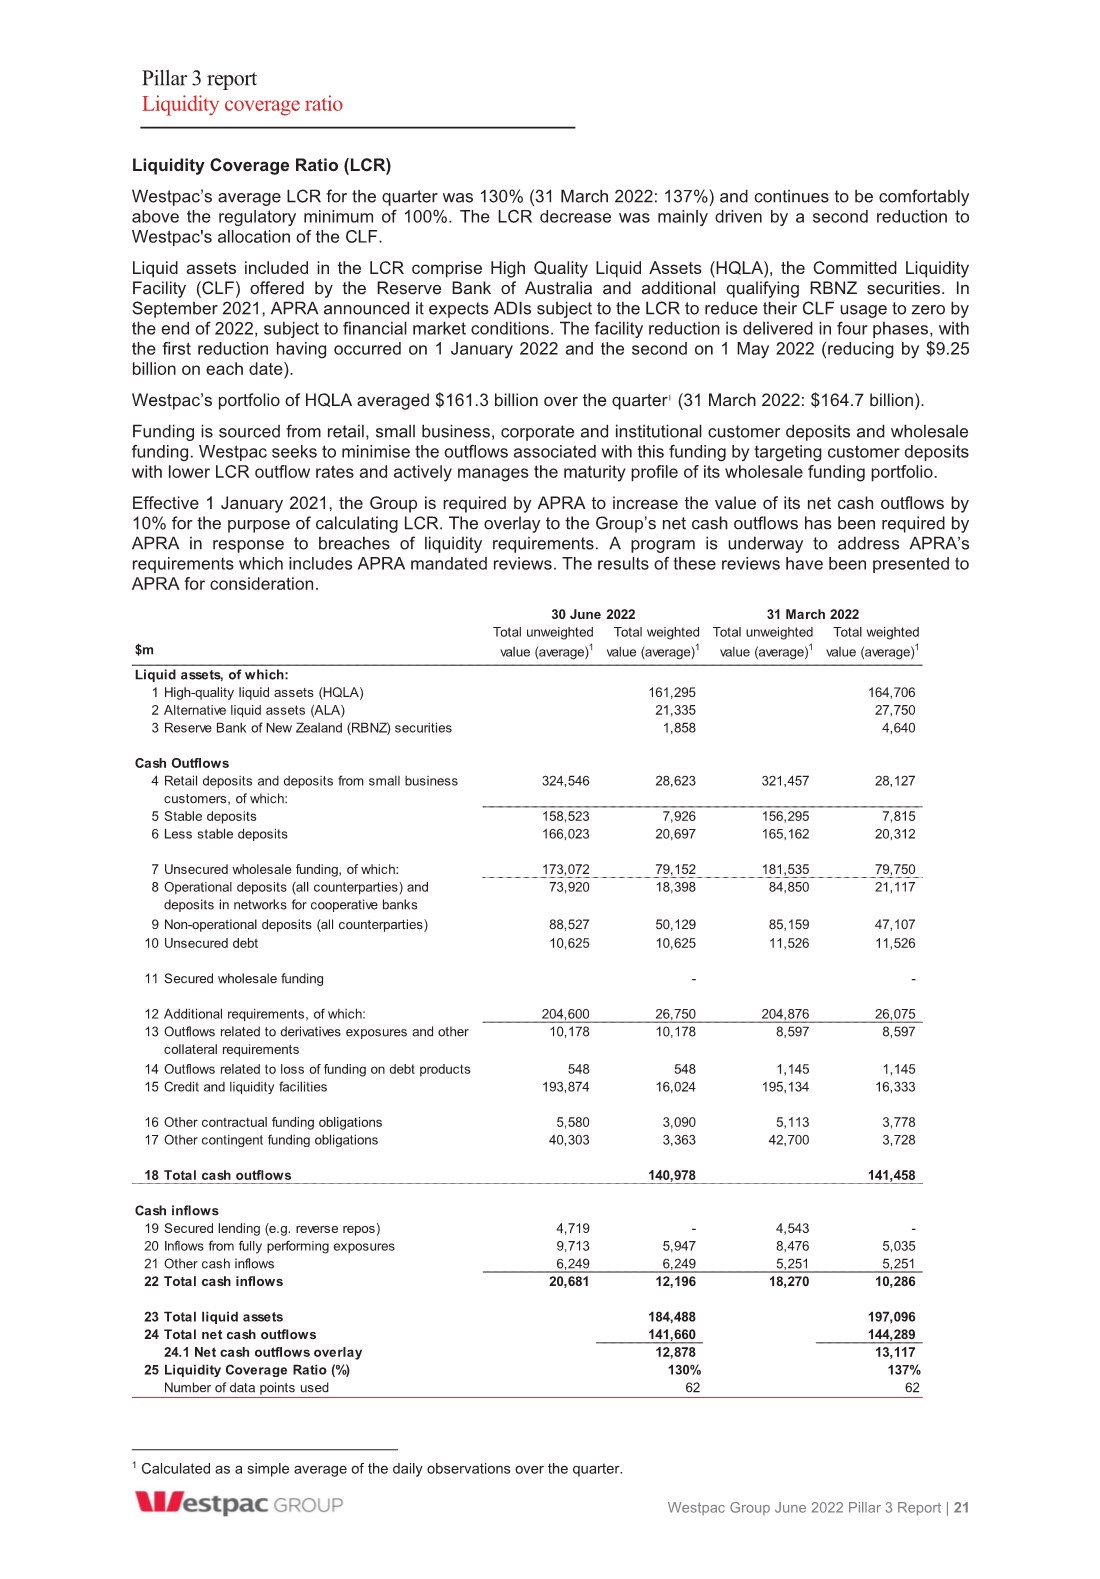
| Pillar 3 report Liquidity coverage ratio Westpac Group June 2022 Pillar 3 Report | 21 Liquidity Coverage Ratio (LCR) Westpac’s average LCR for the quarter was 130% (31 March 2022: 137%) and continues to be comfortably above the regulatory minimum of 100%. The LCR decrease was mainly driven by a second reduction to Westpac's allocation of the CLF. Liquid assets included in the LCR comprise High Quality Liquid Assets (HQLA), the Committed Liquidity Facility (CLF) offered by the Reserve Bank of Australia and additional qualifying RBNZ securities. In September 2021, APRA announced it expects ADIs subject to the LCR to reduce their CLF usage to zero by the end of 2022, subject to financial market conditions. The facility reduction is delivered in four phases, with the first reduction having occurred on 1 January 2022 and the second on 1 May 2022 (reducing by $9.25 billion on each date). Westpac’s portfolio of HQLA averaged $161.3 billion over the quarter1 (31 March 2022: $164.7 billion). Funding is sourced from retail, small business, corporate and institutional customer deposits and wholesale funding. Westpac seeks to minimise the outflows associated with this funding by targeting customer deposits with lower LCR outflow rates and actively manages the maturity profile of its wholesale funding portfolio. Effective 1 January 2021, the Group is required by APRA to increase the value of its net cash outflows by 10% for the purpose of calculating LCR. The overlay to the Group’s net cash outflows has been required by APRA in response to breaches of liquidity requirements. A program is underway to address APRA’s requirements which includes APRA mandated reviews. The results of these reviews have been presented to APRA for consideration. 1 Calculated as a simple average of the daily observations over the quarter. Total unweighted value (average)1 Total weighted value (average)1 Total unweighted value (average)1 Total weighted value (average)1 Liquid assets, of which: 1 High-quality liquid assets (HQLA) 161,295 164,706 2 Alternative liquid assets (ALA) 21,335 27,750 3 Reserve Bank of New Zealand (RBNZ) securities 1,858 4,640 Cash Outflows 4 Retail deposits and deposits from small business customers, of which: 324,546 28,623 321,457 28,127 5 Stable deposits 158,523 7,926 156,295 7,815 6 Less stable deposits 166,023 20,697 165,162 20,312 7 Unsecured wholesale funding, of which: 173,072 79,152 181,535 79,750 8 Operational deposits (all counterparties) and deposits in networks for cooperative banks 73,920 18,398 84,850 21,117 9 Non-operational deposits (all counterparties) 88,527 50,129 85,159 47,107 10 Unsecured debt 10,625 10,625 11,526 11,526 11 Secured wholesale funding - - 12 Additional requirements, of which: 204,600 26,750 204,876 26,075 13 Outflows related to derivatives exposures and other collateral requirements 10,178 10,178 8,597 8,597 14 Outflows related to loss of funding on debt products 548 548 1,145 1,145 15 Credit and liquidity facilities 193,874 16,024 195,134 16,333 16 Other contractual funding obligations 5,580 3,090 5,113 3,778 17 Other contingent funding obligations 40,303 3,363 42,700 3,728 18 Total cash outflows 140,978 141,458 Cash inflows 19 Secured lending (e.g. reverse repos) 4,719 - 4,543 - 20 Inflows from fully performing exposures 9,713 5,947 8,476 5,035 21 Other cash inflows 6,249 6,249 5,251 5,251 22 Total cash inflows 20,681 12,196 18,270 10,286 23 Total liquid assets 184,488 197,096 24 Total net cash outflows 141,660 144,289 24.1 Net cash outflows overlay 12,878 13,117 25 Liquidity Coverage Ratio (%) 130% 137% Number of data points used 62 62 30 June 2022 $m 31 March 2022 |
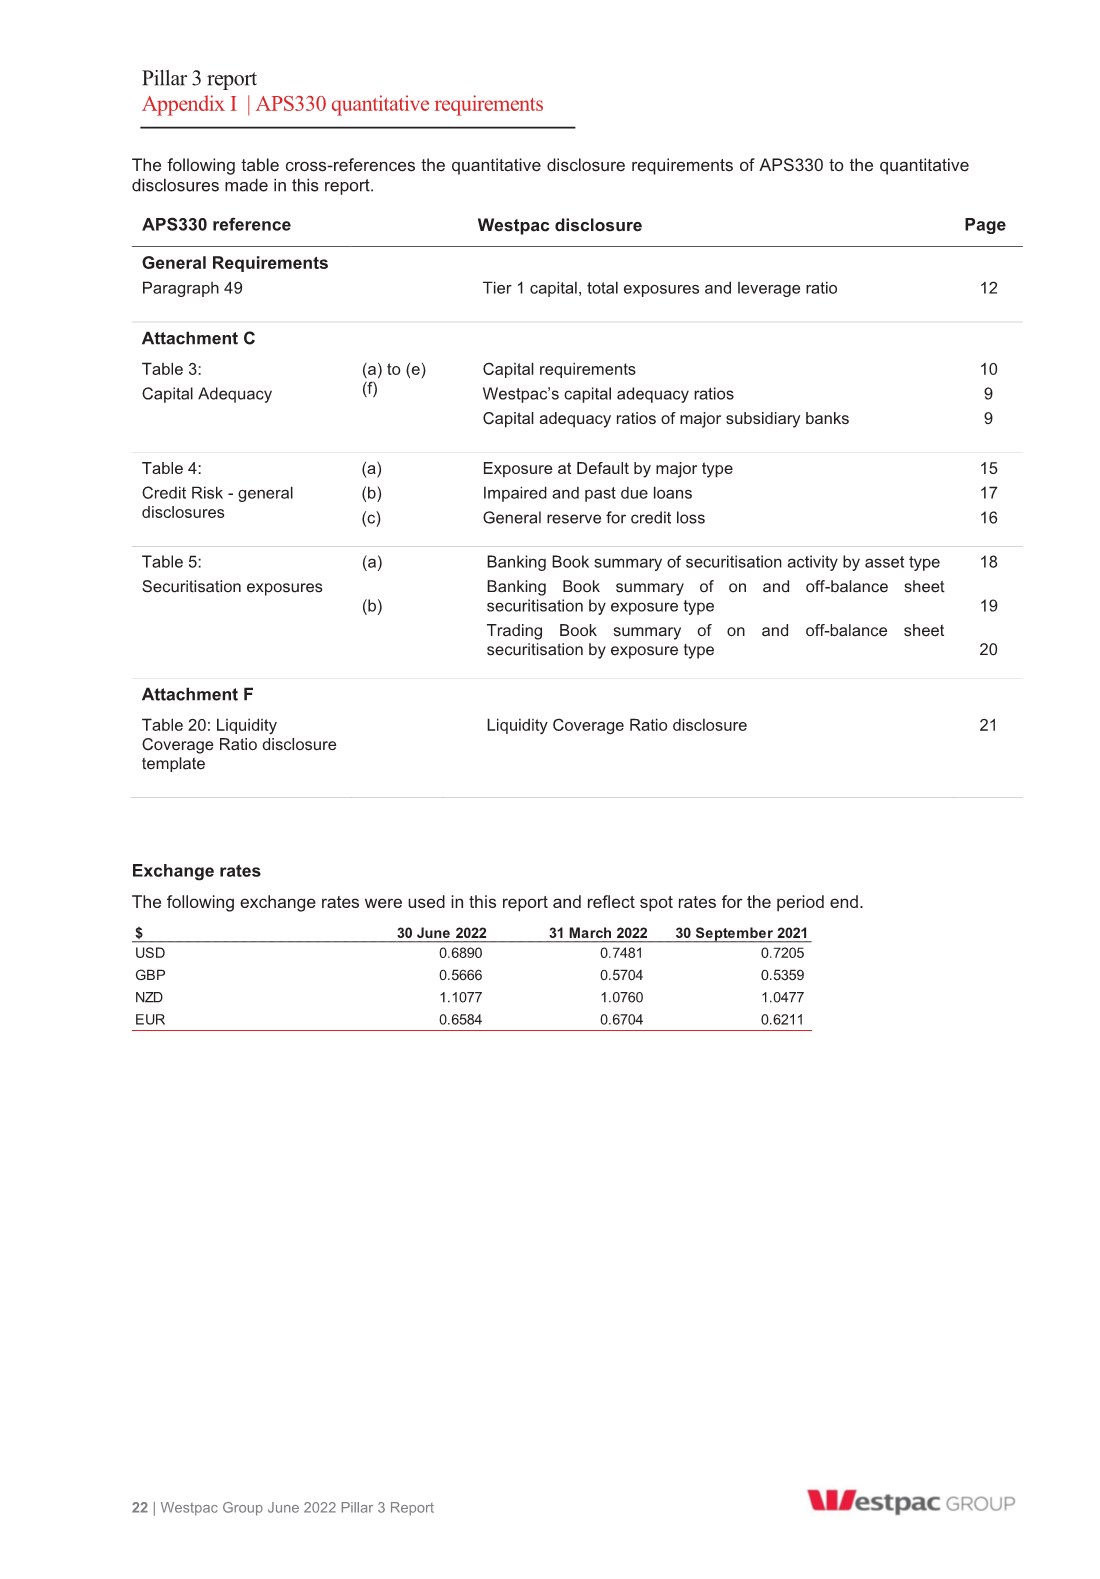
| Pillar 3 report Appendix I | APS330 quantitative requirements 22 | Westpac Group June 2022 Pillar 3 Report The following table cross-references the quantitative disclosure requirements of APS330 to the quantitative disclosures made in this report. APS330 reference Westpac disclosure Page General Requirements Paragraph 49 Tier 1 capital, total exposures and leverage ratio 12 Attachment C Table 3: Capital Adequacy (a) to (e) (f) Capital requirements Westpac’s capital adequacy ratios Capital adequacy ratios of major subsidiary banks 10 9 9 Table 4: Credit Risk - general disclosures (a) (b) (c) Exposure at Default by major type Impaired and past due loans General reserve for credit loss 15 17 16 Table 5: Securitisation exposures (a) (b) Banking Book summary of securitisation activity by asset type Banking Book summary of on and off-balance sheet securitisation by exposure type Trading Book summary of on and off-balance sheet securitisation by exposure type 18 19 20 Attachment F Table 20: Liquidity Coverage Ratio disclosure template Liquidity Coverage Ratio disclosure 21 Exchange rates The following exchange rates were used in this report and reflect spot rates for the period end. $ 30 June 2022 31 March 2022 30 September 2021 USD 0.6890 0.7481 0.7205 GBP 0.5666 0.5704 0.5359 NZD 1.1077 1.0760 1.0477 EUR 0.6584 0.6704 0.6211 |
| Pillar 3 report Disclosure regarding forward-looking statements Westpac Group June 2022 Pillar 3 Report | 23 The information contained in this report contains statements that constitute “forward-looking statements” within the meaning of section 21E of the U.S. Securities Exchange Act of 1934. Forward-looking statements are statements about matters that are not historical facts. Forward-looking statements appear in a number of places in this report and include statements regarding Westpac’s intent, belief or current expectations with respect to its business and operations, macro and micro economic and market conditions, results of operations and financial condition. Words such as ‘will’, ‘may’, ‘expect’, ‘indicative’, ‘intend’, ‘seek’, ‘would’, ‘should’, ‘could’, ‘continue’, ‘plan’, ‘aim’, ‘probability’, ‘risk’, ‘forecast’, ‘likely’, ‘estimate’, ‘anticipate’, ‘believe’ or other similar words are used to identify forward-looking statements. These forward-looking statements reflect Westpac’s current views with respect to future events and are subject to change, certain risks, uncertainties and assumptions which are, in many instances, beyond Westpac’s control and have been made based upon management’s expectations and beliefs concerning future developments and their potential effect upon Westpac. There can be no assurance that future developments will be in accordance with Westpac’s expectations or that the effect of future developments on Westpac will be those anticipated. Should one or more of the risks or uncertainties materialise, or should underlying assumptions prove incorrect, actual results could differ materially from the expectations described in this report. Factors that may impact on the forward-looking statements made include, but are not limited to, those described in the section entitled ‘Risk factors’ in the Directors’ report included in Westpac’s 2022 Interim Financial Results Announcement, as well as the ongoing impact of COVID-19. When relying on forward-looking statements to make decisions with respect to Westpac, investors and others should carefully consider such factors and other uncertainties and events. Westpac is under no obligation, and does not intend, to update any forward-looking statements contained in this report, whether as a result of new information, future events or otherwise, after the date of this report. |