0.020.010.02

Introduction
Our interim period refers to the six months ended 31 March 2023 (First Half 2023). Throughout this Interim Financial Results Announcement, we also refer to the six months ended 31 March 2022 (First Half 2022) and the six months ended 30 September 2022 (Second Half 2022).
The selected financial information for First Half 2023, First Half 2022 and Second Half 2022 contained in this Interim Financial Results Announcement is based on the financial statements contained in the unaudited consolidated Interim Financial Report for Westpac Banking Corporation (Westpac) and its controlled entities (collectively referred to as ‘the Group’) for the six months ended 31 March 2023. The Interim Financial Report has been prepared and presented in accordance with Australian Accounting Standards (AAS) as they relate to interim financial reports. The Interim Financial Report also complies with International Financial Reporting Standards (IFRS) as issued by the International Accounting Standards Board (IASB) as they relate to interim financial reports.
This report contains statements that constitute ‘forward-looking statements’. For an explanation of forward- looking statements and the risks, uncertainties and assumptions to which they are subject, see ‘Other information’ in Section 4. Please consider those important disclaimers when reading the forward-looking statements in this report.
All dollar values in this Interim Financial Results Announcement are in Australian dollars unless otherwise noted. References to ‘dollars’, ‘dollar amounts’, ‘$’, ‘AUD’ or ‘A$’ are to Australian dollars, references to ‘US$’, ‘USD’ or ‘US dollars’ are to United States dollars, references to ‘NZ$’, ‘NZD’ or ‘NZ dollars’ are to New Zealand dollars and references to GBP are to British Pound Sterling. Refer to Section 4.7 for information regarding the rates of exchange between the Australian dollar and the US dollar applied by the Group as part of its operating activities for First Half 2023, Second Half 2022 and First Half 2022.
Information on terms, acronyms and calculations used in this report are provided in the Glossary within Section 5 of the document.
Non-AAS financial measures
The Group’s statutory results are prepared in accordance with AAS and are also compliant with IFRS.
In assessing the Group’s performance and that of our operating segments we use a number of financial measures, including amounts, measures and ratios that are presented on a non-AAS basis, as described below.
Non-AAS financial measures and ratios do not have standardised meanings under AAS. As such they are unlikely to be directly comparable to similar measures presented by other companies and should not be viewed in isolation from, or as a substitute for, the AAS results.
Our non-AAS measures fall within the following categories:
| | |||
|---|---|---|---|---|
Measure/ratio |
| Description |
| Further |
Performance measures excluding the impact of Notable Items, businesses sold and/or held-for-sale profit | | The net interest income, non-interest income, operating expenses and segment reporting sections of this report include performance measures that exclude Notable Items, businesses sold and/or held-for-sale profit. Notable Items are items that management believes are not reflective of the Group’s ongoing business performance. Details of Notable Items are included in Section 1.4. Businesses sold reflect the contribution to the Group’s results in the period of businesses sold prior to their sale. It also includes any gains/ losses related to their sale but excludes items that have been identified as Notable Items. Held-for-sale profit reflects the contribution to the Group’s results in the period of businesses that are held-for-sale. For the period ending 31 March 2023 there were no businesses held-for-sale and therefore no held-for-sale profit. Performance measures which are adjusted for one or more of these items include: ● Net interest income ● Non-interest income (including net fee income, net wealth management and insurance income, trading income and other income) ● Operating expenses (including staff expenses, occupancy expenses, technology expenses and other expenses) ● Pre-provision profit Management considers this information useful as these measures provide a view that reflects the Group’s ongoing business performance. | | Sections 1.4, |
| | |||
|---|---|---|---|---|
Measure/ratio |
| Description |
| Further |
Pre-provision profit | | Pre-provision profit is net profit/(loss) excluding credit impairment (charges)/benefits and income tax (expense)/benefit. This is calculated as net interest income plus non-interest income less operating expenses. This includes (charges)/benefits relating to provisions and impairment other than from expected credit losses. Management considers this information useful as this measure provides readers with a view of the impact of the operating performance of the Group. | | Section 2.0 |
Core net interest income and Core NIM | | Core net interest income is calculated as net interest income excluding Notable Items, and Treasury and Markets. Core NIM is calculated as Core net interest income (annualised where applicable) divided by average interest earning assets. Management considers this information useful as this measure provides a view of the underlying performance of the Group’s net interest margin for lending, deposit and funding. | | Sections 1.3 |
Dividend payout ratio (excluding Notable Items) | | Calculated as ordinary dividend paid/declared on issued shares (net of Treasury shares) divided by the net profit attributable to owners of WBC excluding Notable Items. Management considers this information useful as this measure provides a view of the dividend payout ratio based on the ongoing business performance of the Group. | | Section 1.1 |
Expense to income ratio (excluding Notable Items) | | Calculated as operating expenses excluding Notable Items divided by net operating income excluding Notable Items. Management considers this information useful as this measure provides a view of the efficiency of the ongoing business performance of the Group. | | Sections 1.3 |
Average tangible ordinary equity and Return on average tangible ordinary equity (ROTE) | | Average tangible ordinary equity is calculated as average ordinary equity less, average goodwill and other intangible assets (excluding capitalised software). Return on average tangible ordinary equity is calculated as net profit attributable to owners of WBC (annualised where applicable) divided by average tangible ordinary equity. Management considers this information useful as these measures are commonly used internally as well as by investors, analysts and others in assessing the Group’s use of equity. | | Sections 1.3 |
iv | WESTPAC GROUP 2023 INTERIM FINANCIAL RESULTS |
Results Announcement to the market
Presentation changes
In 2022 and earlier reporting periods the Group reported a non-AAS measure of profit referred to as “cash earnings” in internal management reporting. Since AASB 8 Segment Reporting requires the measure of financial performance reported internally to the Group’s key decision makers to be reported in the segment disclosures of the financial statements, cash earnings were presented in segment related disclosures in Section 2.0 Segment Reporting and in Note 2 Segment reporting of the interim financial statements.
In addition to cash earnings, the Group also reported “Notable Items” and a further non-AAS profit measure excluding Notable Items in both internal management reporting and external segment reporting. Cash earnings excluding Notable Items were historically reported in Section 2.0 Segment Reporting.
In First Half 2023 the Group ceased reporting cash earnings and cash earnings excluding Notable Items in internal reporting to key decision makers, with net profit attributable to owners of WBC after tax (net profit) now the Group’s key measure of performance.
Comparatives in section 2.0 Segment Reporting and in Note 2 Segment reporting of the Interim financial statements have been revised accordingly.
To assist in explaining the Group’s financial performance, the Group will continue to report Notable Items which represent certain items that management believe are not reflective of the Group’s ongoing business performance.
Cash earnings adjustments to segment net profit in prior periods included:
| ● | Fair value (gain)/loss on economic hedges (which do not qualify for hedge accounting under AAS) which may create a material timing difference on reported results but do not affect the Group’s earnings over the life of the hedge. |
| ● | The net ineffectiveness on qualifying hedges arises from the fair value movement in these hedges which reverses over time and therefore does not affect the Group’s profits over time. |
These items are now reported as Notable Items and comparatives have been revised accordingly. Notable Items are explained further in Section 1.4.
v |
Results Announcement to the market
Index
1 | ||
| 1 | |
| 5 | |
| 5 | |
| 7 | |
| 9 | |
| 24 | |
| 27 | |
| 31 | |
| 37 | |
40 | ||
| 43 | |
| 46 | |
| 49 | |
| 52 | |
| 56 | |
| 60 | |
62 | ||
| 63 | |
| 82 | |
| 83 | |
| 84 | |
| 85 | |
| 86 | |
| 87 | |
| 119 | |
122 | ||
| 122 | |
| 124 | |
| 124 | |
| 124 | |
| 124 | |
| 125 | |
| 128 | |
| 129 | |
| 130 | |
132 |
vi | WESTPAC GROUP 2023 INTERIM FINANCIAL RESULTS |
Results Announcement to the market
In this Interim Financial Results Announcement (Results Announcement) references to ‘Westpac’, ‘WBC’, ‘Westpac Group’, ‘the Group’, ‘we’, ‘us’ and ‘our’ are to Westpac Banking Corporation and its controlled entities, unless it clearly means just Westpac Banking Corporation.
Financial calendar
| | |
Interim Results Announcement released |
| 8 May 2023 |
Ex-dividend date for interim dividend | | 11 May 2023 |
Record date for interim dividend | | 12 May 2023 |
Interim dividend payable | | 27 June 2023 |
Final Results Announcement (scheduled) | | 6 November 2023 |
1.0 | Review of Group operations |
1.1 | Performance overview |
Financial highlights
| | |
$4,001m Net profit, up 22% on 1H22 | | 11.3% ROE, up 205bps on 1H22 |
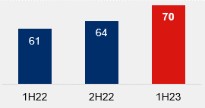
70 cents Dividend per share, fully | | 12.3% CET1 capital ratio, up 95bps on Mar-22 |
1H23 results overview1
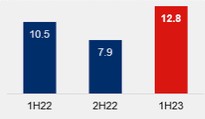
The Group delivered a net profit of $4,001 million, up 22% on the prior corresponding period. Our improved financial performance reflects the benefit of a higher net interest margin, growth in home and business loans together with ongoing cost discipline. This was tempered by a rise in provisions for loan losses. Our performance drove a material improvement in both ROE and ROTE, which rose 205 basis points to 11.3% and 229 basis points to 12.8% respectively.
Our interim dividend of 70 cents per share was up 15%, representing a payout ratio of 61%. Excluding Notable Items, the payout ratio was 64% which is marginally below the sustainable payout ratio range of 65% to 75%.
Our balance sheet position was strengthened, which positions us well for the more challenging economic environment with capacity for growth. Our CET1 capital ratio of 12.3% provides $3.6 billion of capital above the top end of the target range of 11.5%. The liquidity coverage ratio (LCR) and net stable funding ratio (NSFR) were 135% and 119% respectively, well above regulatory minimums. Our deposit to loan ratio increased to 83.7%, supported by deposit growth of $26.7 billion which funded most of the $30.4 billion increase in loans. In addition, impairment provisions of $4.9 billion were approximately $1.5 billion above the expected losses of our base case economic scenario.
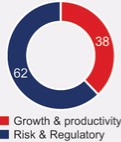
Investment spend was $868 million with 38% directed towards growth and productivity initiatives, up from 31%. This included the roll-out of our mortgage origination platform, enhancing digital capability, as well as the continued development of our corporate cash management platform. Our regulatory compliance agenda remains a priority and was a significant proportion of spend. As we have made progress, risk and regulatory investment spend decreased 18%.
Outlook
The rising cost of living, including the impact of higher interest rates is being increasingly felt by households and businesses across Australia and New Zealand. As Australia’s first bank, we are supporting customers facing these headwinds.
Westpac is navigating this environment from a position of strength. Our balance sheet, and the Australian financial system more broadly, is in a sound position. We are strongly capitalised with liquidity and funding to support household and business customers.
The Australian economy remains resilient with unemployment at 50-year lows, population growth supported by accelerating immigration and stabilising house prices. While interest rates are nearing their expected peak in both Australia and New Zealand, the lagged impact of rapid monetary policy tightening is yet to be felt fully. This is particularly the case for customers transitioning from fixed to variable rate mortgages in coming periods.
Economic growth is expected to be positive, however it is likely to slow further during the remainder of 2023. Unemployment is likely to rise and we expect credit growth, both household and business, to slow further.
1. | Unless otherwise stated, all figures relate to the half year ended March 2023 with the comparative period the half year ended 31 March 2022. |
Improved financial performance1
Pre-provision profit was $6,015 million, up 24% compared to the prior corresponding period, driven by an 8% increase in operating income and a 7% reduction in operating expenses.
| | |
Pre-provision profit | | ● Group net interest margin (Group NIM) was up 5 basis points to 1.96%. – Core NIM expanded 20 basis points to 1.90% from wider deposit spreads and higher return on capital balances. This was partly offset by tighter loan spreads due to intense competition as well as the significant increase in lower returning liquid assets as we accumulated additional High Quality Liquidity Assets (HQLA) in response to the phase-out of the RBA’s Committed Liquidity Facility (CLF); – Lower Treasury and Markets income reduced Group NIM by 7 basis points; and – The impact of Notable Items decreased Group NIM by 8 basis points. ● Net interest income increased 10% to $9,113 million. This reflects the increase in Group NIM and a 7% increase in average interest earning assets. Growth was driven by owner occupied mortgages, loans to business customers across the commercial property and agriculture sectors and all sectors in institutional banking. Average liquid assets were also 15% higher. ● Non interest income of $1,890 million was 3% lower driven by Notable Items and the impact of businesses sold. Excluding these items, non-interest income increased 3% to $1,529 million, driven by higher Markets income. ● Operating expenses of $4,988 million were 7% lower, driven in part by businesses sold. Operating expenses excluding Notable Items and the impact of businesses sold were $5,006 million, down 1%, reflecting benefits of our simpler organisation and reduced use of third party service providers. We absorbed inflationary pressures on wages and third party vendor costs. |
1.96% Group NIM, | | |
1.90% Core NIM, | |

Strong balance sheet
Capital |
| Funding and liquidity |
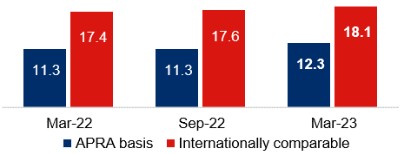
Our CET1 capital ratio of 12.3% was above our target range of 11.0% to 11.5%, providing $3.6 billion of capital above the top end of the target range. The increase of 99 basis points this half reflects the impact of: ● Net profit added 88 basis points; ● Adoption of APRA’s revised capital framework, added 62 basis points; ● Lower risk weighted assets (RWA) added 7 basis points; ● Dividend utilised 45 basis points; and ● Capital deductions and other items, 13 basis points decrease. | | Our quarterly average LCR was 135% and NSFR was 119%, both well above regulatory minimums. Customer deposit growth supported most of our funding requirements this half, with our deposit to loan ratio up 84 basis points to 83.7%. We maintained access to global funding markets, raising $20.0 billion of new long-term wholesale funding in the half. |
| |
Common equity tier 1 capital ratio (%) | |
| 135% LCR, above 100% regulatory |
1.Unless otherwise stated, all figures relate to the half year ended March 2023 with the comparative period the half year ended 31 March 2022.
3 |
Review of Group operations
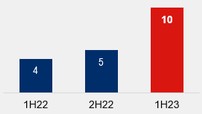
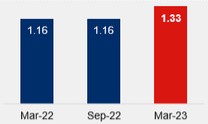
Provisioning positioned for slow down and potential deterioration in credit quality. ● Credit impairment charges were $390 million or 10 basis points of average loans, compared to 4 basis points of average loans in the prior corresponding period. The charge was driven by higher Collectively Assessed Provisions (CAP), a function of weaker forward-looking economic inputs, a rise in early cycle consumer delinquencies and some increased stress in New Zealand business portfolios. The charge was moderated by a benefit from write-backs and recoveries. ● Credit quality metrics were little changed with stressed exposures to total committed exposures (TCE) unchanged at 1.10%. ● Impairment provisions of $4,923 million were up 5% due to higher CAP. The ratio of CAP to credit risk weighted assets (credit RWA) was 1.33%, an increase of 17 basis points due to both higher CAP and lower RWA following the adoption of APRA’s revised capital framework. With provisions more than $1.5 billion above the expected losses of our base case economic scenario, the Group is well positioned for potential deterioration in credit quality. |
| Impairment charges to average loans (bps)
CAP to Credit RWA (%)
|
| | |
Investment spend Investment spend was down 8% to $868 million compared to the prior corresponding period. ● Spend on growth and productivity increased 13% reflecting roll-out of our mortgage origination platform to third party brokers, investment in digital capability, and continued development of the corporate cash management platform. ● Delivery of our regulatory compliance agenda remains a priority and was a significant proportion of spend. As we have made progress, risk and regulatory spend decreased 18%. |
| Investment spend (%)
|
| | |
Improved shareholder returns Our strong capital position and improved financial performance has provided scope for improved returns to shareholders. The Board determined an interim dividend of 70 cents per share, fully franked, an increase of 15% or 9 cents on the prior corresponding period. This reflects a payout ratio of 61%. Notable Items had limited impact on regulatory capital and the dividend determination. The payout ratio excluding Notable Items was 64% which is marginally below the sustainable payout ratio range of 65% to 75%. No discount will be offered to shareholders who elect to participate in the Dividend Reinvestment Plan (DRP). An equivalent number of shares are expected to be purchased on market to offset the shares transferred under the DRP. ROE rose 205 basis points to 11.3% and ROTE was up 229 basis points to 12.8%. Earnings per ordinary share were 114.2 cents, up 26%. Net tangible assets per share were $17.67, up 3%. |
| Dividend (cents)
Return on tangible equity (%)
|
4 | WESTPAC GROUP 2023 INTERIM FINANCIAL RESULTS |
Review of Group operations
Refreshed purpose and strategy
As a simpler and stronger bank, we are entering our next strategic phase and turning our focus towards improving our market position and returns.
We will be guided by our refreshed strategy and new purpose: creating better futures together.
Our strategy is framed by four pillars: Customer, Easy, Expert, Advocate.
Everything starts and ends with customers. We are focusing on service that is consistently great, supporting customers through good and bad times and recognising those who choose us as their bank.
We are making banking easier, intuitive and digital.
Sharing our expertise to help customers is how we differentiate. Whether that’s through bankers, thought leadership in finance or supporting customers to transition to net-zero.
As Australia’s first bank and company – we have been advocating for change for centuries. We are focusing on three key areas: safety and security, financial inclusion and climate.
How we deliver value
| |
|
70 cents Interim dividend per share | | $215 million+ Stopped or recovered in customer scam losses1 |
11.3% Return on equity | $750 billion in lending | |
114.2 cents Earnings per ordinary share | 12.8 million Customers | |
| |
|
38,503 | | $1.8 billion Income tax expense, including the bank levy #6 largest taxpayer3 Net-Zero Banking Alliance member 2030 targets set for 5 emissions-intensive sectors Westpac Australia will source equivalent of 100% of energy consumption from renewables from 2H23 onwards |
Employees2 | ||
$2.9 billion | ||
Paid to our people | ||
75 | ||
Organisational Health Index, |


1.Over calendar year 2022.
2.Full time equivalent employees at March 2023.
3.Based on the ATO’s Corporate Tax Transparency Report for the 2020-21 Income Year, published November 2022.
5 |
Review of Group operations
1.2 | Performance summary |
| | | | | | | | | | |
| | Half Year | | Half Year | | Half Year | | % Mov’t1 | ||
| | March | | Sept | | March | | Mar 23 | | Mar 23 |
$m |
| 2023 |
| 2022 |
| 2022 |
| - Sept 22 |
| - Mar 22 |
Net interest income |
| 9,113 |
| 8,873 |
| 8,288 |
| 3 |
| 10 |
Non-interest income |
| 1,890 |
| 503 |
| 1,942 |
| large |
| (3) |
Net operating income |
| 11,003 |
| 9,376 |
| 10,230 |
| 17 |
| 8 |
Operating expenses |
| (4,988) |
| (5,429) |
| (5,373) |
| (8) |
| (7) |
Pre-provision profit | | 6,015 | | 3,947 | | 4,857 | | 52 | | 24 |
Impairment (charges)/benefits |
| (390) |
| (196) |
| (139) |
| 99 |
| 181 |
Profit before income tax expense |
| 5,625 |
| 3,751 |
| 4,718 |
| 50 |
| 19 |
Income tax expense |
| (1,620) |
| (1,336) |
| (1,434) |
| 21 |
| 13 |
Profit after income tax expense |
| 4,005 |
| 2,415 |
| 3,284 |
| 66 |
| 22 |
Profit attributable to non-controlling interests (NCI) |
| (4) |
| (1) |
| (4) |
| large |
| |
Net profit attributable to owners of WBC |
| 4,001 |
| 2,414 |
| 3,280 |
| 66 |
| 22 |
Notable Items (post tax) | | 178 | | (1,053) | | 179 | | large | | (1) |
Effective tax rate |
| 28.8% | | 35.6% | | 30.4% | | large |
| (159 bps) |
1.3 | Key financial information2 |
| | | | | | | | | | |
| | Half Year | | Half Year | | Half Year | | % Mov’t | ||
| | March | | Sept | | March | | Mar 23 | | Mar 23 |
|
| 2023 |
| 2022 | | 2022 | | - Sept 22 |
| - Mar 22 |
Shareholder value | | | | | | | | |
|
|
Basic earnings per ordinary share (cents) |
| 114.2 |
| 69.0 | | 90.5 | | 66 |
| 26 |
Diluted earnings per ordinary share (cents) | | 107.7 | | 66.0 | | 85.7 | | 63 | | 26 |
Weighted average ordinary shares (millions) |
| 3,501 |
| 3,496 | | 3,622 | | - |
| (3) |
Fully franked dividends per ordinary share (cents) |
| 70 |
| 64 | | 61 | | 9 |
| 15 |
Dividend payout ratio3 | | 61.33% | | 92.73% | | 65.06% | | large | | (373 bps) |
Return on average ordinary equity | | 11.30% | | 6.93% | | 9.25% | | large | | 205 bps |
ROTE |
| 12.76% | | 7.85% | | 10.47% | | large |
| 229 bps |
Average ordinary equity ($m) | | 70,947 | | 69,467 | | 71,073 | | 2 | | - |
Average tangible ordinary equity ($m) |
| 62,864 |
| 61,335 | | 62,825 | | 2 |
| - |
Average total equity ($m) |
| 70,994 |
| 69,520 | | 71,130 | | 2 |
| - |
Net tangible asset per ordinary share ($) |
| 17.67 |
| 17.18 | | 17.22 | | 3 |
| 3 |
1.Percentage (%) movements are shown as % unless otherwise stated. This applies to all the tables in this document.
2.Reconciliations of Non-AAS financial measures included in this table are provided in Sections 1.5.2 and 4.9.
3.Excludes the dividend component of the off-market share buy-back in First Half 2022.
6 | WESTPAC GROUP 2023 INTERIM FINANCIAL RESULTS |
Review of Group operations
1.3 | Key financial information (continued) |
| | | | | | | | | | |
| | Half Year | | Half Year | | Half Year | | % Mov’t | ||
| | March | | Sept | | March | | Mar 23 | | Mar 23 |
|
| 2023 |
| 2022 | | 2022 | | - Sept 22 |
| - Mar 22 |
Business performance |
|
|
|
| |
| |
|
|
|
Group NIM |
| 1.96% | | 1.96% | | 1.91% | | - |
| 5 bps |
Core NIM |
| 1.90% | | 1.80% | | 1.70% | | 10 bps |
| 20 bps |
Treasury & Markets impact on NIM | | 0.08% | | 0.10% | | 0.15% | | (2 bps) | | (7 bps) |
Notable Items impact on NIM | | (0.02%) | | 0.06% | | 0.06% | | large | | large |
Average interest earning assets ($m) | | 934,208 | | 901,786 | | 872,075 | | 4 | | 7 |
Expense to income ratio | | 45.33% | | 57.90% | | 52.52% | | large | | large |
Expense to income ratio (ex Notable Items) |
| 45.88% | | 49.53% | | 52.84% | | large |
| large |
Full time equivalent employees (FTE) |
| 38,503 |
| 37,476 | | 38,823 | | 3 |
| (1) |
Revenue per FTE ($ ‘000’s) |
| 291 | | 249 | | 259 | | 17 |
| 12 |
| | | | | | | | | | |
Capital, funding and liquidity |
|
| |
| |
| |
|
|
|
Level 2 common equity Tier 1 capital ratio |
|
| |
| |
| |
|
|
|
- Australian Prudential Regulation Authority (APRA) |
| 12.28% | | 11.29% | | 11.33% | | 99 bps |
| 95 bps |
- Internationally comparable |
| 18.14% | | 17.57% | | 17.36% | | 57 bps |
| 78 bps |
Credit RWA ($m) | | 340,558 | | 362,098 | | 359,673 | | (6) | | (5) |
Total risk weighted assets (RWA) ($m) |
| 452,946 | | 477,620 | | 459,956 | | (5) |
| (2) |
LCR1 |
| 135% | | 132% | | 137% | | 396 bps |
| (111 bps) |
NSFR1 |
| 119% | | 121% | | 125% | | (159 bps) |
| large |
Deposit to loan ratio |
| 83.7% | | 82.9% | | 83.5% | | 84 bps |
| 18 bps |
| | | | | | | | | | |
Credit quality and impairment charges1 |
|
| |
| |
| |
|
|
|
Gross impaired exposures to gross loans |
| 0.20% | | 0.20% | | 0.23% | | - |
| (3 bps) |
Gross impaired exposures provisions to gross impaired exposures |
| 42.80% | | 47.95% | | 48.03% | | large |
| large |
Collectively assessed provisions to credit RWA |
| 133 bps | | 116 bps | | 116 bps | | 17 bps |
| 17 bps |
Total provisions to credit RWA |
| 145 bps | | 128 bps | | 130 bps | | 17 bps |
| 15 bps |
TCE ($bn) |
| 1,220 | | 1,186 | | 1,161 | | 3 |
| 5 |
Total stressed exposures as a % of TCE2 |
| 1.10% | | 1.07% | | 1.10% | | 3 bps |
| - |
Mortgages 90+ day delinquencies |
| 0.68% | | 0.69% | | 0.82% | | (1 bps) |
| (14 bps) |
Other consumer loans 90+ day delinquencies |
| 1.54% | | 1.56% | | 1.62% | | (2 bps) |
| (8 bps) |
Impairment charges/(benefits) to average loans |
| 10 bps |
| 5 bps | | 4 bps | | 5 bps |
| 6 bps |
| | | | | | | | | | |
Balance sheet ($m) |
|
|
|
| |
| | |
|
|
Loans |
| 749,931 |
| 739,647 | | 719,556 | | 1 |
| 4 |
Total assets |
| 1,019,108 |
| 1,014,198 | | 964,749 | | - |
| 6 |
Customer deposits |
| 627,585 |
| 612,834 | | 600,872 | | 2 |
| 4 |
| 1. | Includes balances presented as held for sale. |
| 2. | Westpac applied amendments to APS 220 Credit Risk Management in relation to the definition of non-performing loans. As a result, the ratio at 31 March 2023 is not directly comparable to past periods. On adoption of the new definition, the impact to the ratio was a 4bps increase, largely due to changes relating to an extension of the period over which exposures remain classified as non-performing before potential reclassification to performing. |
7 |
Review of Group operations
1.4Impact of Notable Items
As noted in the Presentation changes section of the Introduction to this Results Announcement, in First Half 2023 the Group ceased to report cash earnings and cash earnings excluding Notable Items for internal reporting to key decision makers. To assist in explaining the Group’s financial performance, the Group will continue to report Notable Items which represent certain items that are not considered to be reflective of the Group’s ongoing business performance.
Notable Items broadly fall into the following categories:
– | Unrealised fair value gains and losses on economic hedges that do not qualify for hedge accounting |
– | Net ineffectiveness on qualifying hedges |
– | Large items that are not reflective of the Group’s ordinary operations. In individual reporting periods large items may include: |
– | Provisions for remediation, litigation, fines and penalties |
– | The impact of asset sales and revaluations |
– | The write-down of assets (including goodwill and capitalised software) |
– | Restructuring costs |
In determining dividends the impact of Notable Items is typically excluded.
The impact of Notable Items (post tax) in First Half 2023 was a benefit of $178 million (Second Half 2022: $1,053 million reduction; First Half 2022: $179 million benefit).
Details of Notable Items (post tax) impacting on the First Half 2023 result are:
Category |
| Net profit |
| Detail |
Unrealised fair value gains and losses on economic hedges that do not qualify for hedge accounting | | $121m reduction | | • The unrealised fair value (gain)/loss on hedges of accrual accounted term funding transactions for the period was $121 million. This represents a timing difference for the statutory results but does not affect the Group’s profits over the life of the hedge. |
Net ineffectiveness on qualifying hedges | | $43m benefit | | • The net ineffectiveness on qualifying hedges of $43 million for the period arises from the fair value movement in these hedges which reverses over time and therefore does not affect the Group’s profits over time. |
The impact of asset sales and revaluations | | $256m benefit | | • Gain on the sale of Advance Asset Management Limited (AAML). This also includes a tax benefit related to transaction and separation costs. |
For detailed explanations of Notable Items for Second Half 2022 and First Half 2022, refer to the 2022 Annual Report.
8 | WESTPAC GROUP 2023 INTERIM FINANCIAL RESULTS |
Review of Group operations
| | | | | | | | | | | | |
|
| |
| |
| Provisions |
| |
| |
| |
| | | | | | for litigation, | | Asset | | The write- | | |
| | Economic | | Hedge | | fines and | | sales and | | down of | | |
$m | | hedges | | ineffectiveness | | penalties | | revaluations | | assets | | Total |
Half Year March 2023 |
|
|
|
|
|
|
|
|
|
|
|
|
Net interest income |
| (151) |
| 62 |
| - |
| - |
| - |
| (89) |
Non-interest income |
| (22) |
| - |
| - |
| 243 |
| - |
| 221 |
Net operating income |
| (173) |
| 62 |
| - |
| 243 |
| - |
| 132 |
Operating expenses |
| - |
| - |
| - |
| - |
| - |
| - |
Income tax (expense)/benefit and NCI |
| 52 |
| (19) |
| - |
| 13 |
| - |
| 46 |
Net profit/(loss) |
| (121) |
| 43 |
| - |
| 256 |
| - |
| 178 |
Half Year Sept 2022 |
|
|
|
|
|
|
|
|
|
|
|
|
Net interest income |
| 346 |
| (50) |
| (8) |
| - |
| - |
| 288 |
Non-interest income1 |
| 35 |
| - |
| (9) |
| (1,112) |
| - |
| (1,086) |
Net operating income |
| 381 |
| (50) |
| (17) |
| (1,112) |
| - |
| (798) |
Operating expenses |
| - |
| - |
| (80) |
| (126) |
| (184) |
| (390) |
Income tax (expense)/benefit and NCI |
| (115) |
| 17 |
| 29 |
| 149 |
| 55 |
| 135 |
Net profit/(loss) |
| 266 |
| (33) |
| (68) |
| (1,089) |
| (129) |
| (1,053) |
Half Year March 2022 |
|
|
|
|
|
|
|
|
|
|
|
|
Net interest income |
| 287 |
| (27) |
| 7 |
| - |
| - |
| 267 |
Non-interest income |
| 4 |
| - |
| (43) |
| 271 |
| - |
| 232 |
Net operating income |
| 291 |
| (27) |
| (36) |
| 271 |
| - |
| 499 |
Operating expenses |
| - |
| - |
| (46) |
| (18) |
| (167) |
| (231) |
Income tax (expense)/benefit and NCI |
| (87) |
| 8 |
| 17 |
| (40) |
| 13 |
| (89) |
Net profit/(loss) |
| 204 |
| (19) |
| (65) |
| 213 |
| (154) |
| 179 |
| 1. | Second Half 2022 asset sales and revaluations relates to the loss on sale of Westpac Life Insurance Services Limited. |
9 |
Review of Group operations
1.5 | Review of earnings |
1.5.1Net interest margin
Group net interest margin movement (%)
First Half 2023 – First Half 2022
First Half 2023 – First Half 2022
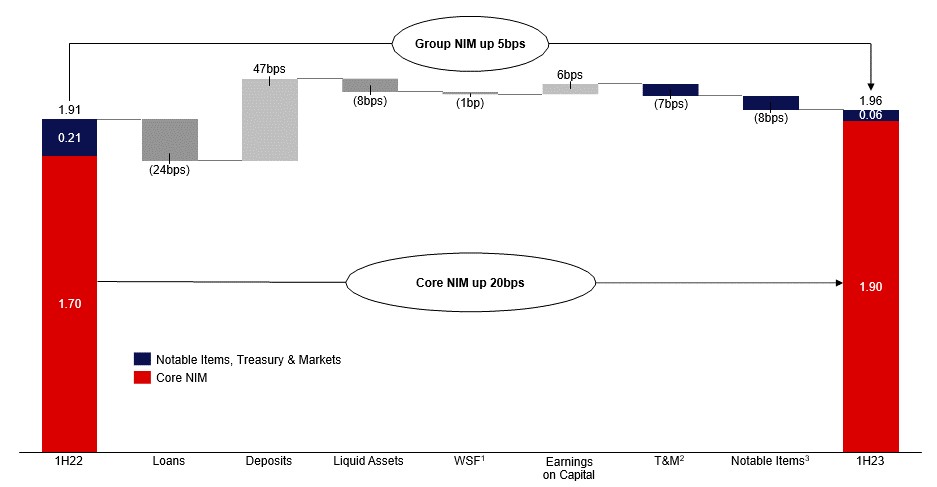
•The Group NIM increased by 5 basis points to 1.96%. Key movements included:
–Core NIM: 20 basis point increase with key drivers described below;
– | Treasury and Markets: 7 basis point decrease largely driven by market volatility in Treasury and lower realised gains on the sale of liquid assets; and |
–Notable Items: 8 basis point decline reflecting unrealised fair value losses related to economic hedges of term funding.
•The 20 basis point increase in Core NIM was driven by:
– | Loan interest spread: 24 basis point decrease due to tighter spreads on mortgage lending in Australia and New Zealand relating to price competition for new and existing loans and from growth in tighter spread owner occupied lending. This impact was partly mitigated by managing the margin-volume trade off. Business lending spreads were also tighter reflecting increased competition to attract new, and retain existing customers; |
– | Deposit interest spread: 47 basis point increase from higher deposit spreads and higher earnings on hedged deposits. A mix shift towards lower spread term deposits as customers responded to higher interest rates reduced margin slightly; |
– | Liquid assets: 8 basis point decline from the cost of holding higher HQLA to support the reduction of the CLF; |
– | Wholesale funding: 1 basis point decrease from higher wholesale funding costs as spreads on new term wholesale funding were wider than the spreads on maturing facilities; and |
–Earnings on capital: 6 basis point increase from higher earnings on capital balances as a result of rising interest rates.
1.Wholesale Funding Cost.
2.Treasury & Markets contribution.
3.Notable Items are described in Section 1.4.
Group net interest margin movement (%)
First Half 2023 – Second Half 2022
First Half 2023 – Second Half 2022
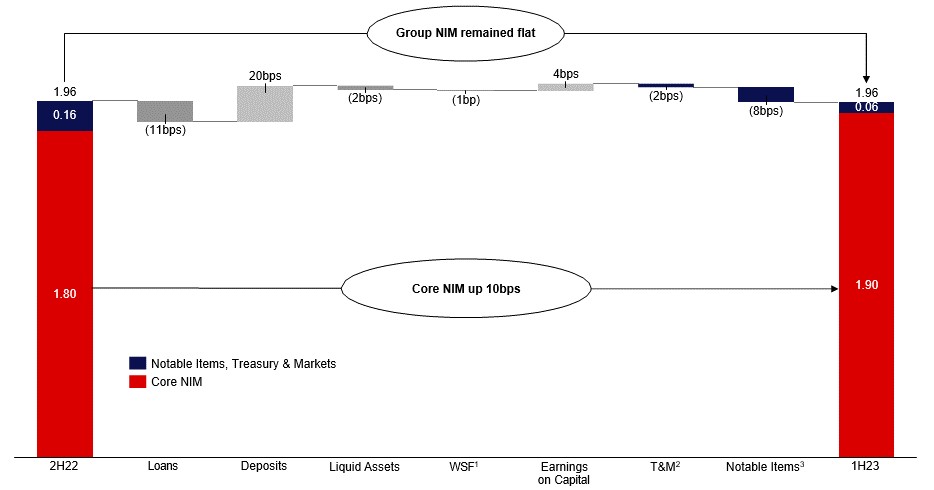
| ● | The Group NIM was flat at 1.96%. Key movements included: |
–Core NIM: 10 basis point increase with key movements described below;
–Treasury and Markets: 2 basis point decrease driven by market volatility in Treasury; and
– | Notable Items: 8 basis point decline due to unrealised fair value losses related to economic hedges of term funding. |
| ● | The 10 basis point increase in Core NIM was driven by: |
– | Loan interest spread: 11 basis point decrease predominantly due to tighter spreads on mortgage lending in Australia from price competition for new and existing customers, and from growth in lower spread owner- occupied lending. This impact was partly mitigated by managing the margin-volume trade off. Business lending spreads were also slightly tighter from increased competition to attract new, and retain existing customers; |
– | Deposit interest spread: 20 basis point increase from higher deposit spreads and higher earnings on hedged deposits. A mix shift towards lower spread term deposits as customers responded to higher interest rates reduced margin slightly; |
– | Liquid assets: 2 basis point decrease from the cost of holding higher HQLA to support the reduction of the CLF; |
– | Wholesale funding: 1 basis point decrease from higher wholesale funding costs as spreads on new term wholesale funding were wider than the spreads on maturing facilities; and |
– | Earnings on capital: 4 basis point increase from higher earnings on capital balances as a result of rising interest rates. |
1.Wholesale Funding Cost.
2.Treasury & Markets contribution.
3.Notable Items are described in Section 1.4.
1.5.2Net interest income
| | | | | | | | | | |
| | Half Year | | Half Year | | Half Year | | % Mov’t | ||
| | March | | Sept | | March | | Mar 23 | | Mar 23 |
|
| 2023 |
| 2022 |
| 2022 |
| - Sept 22 |
| - Mar 22 |
Net interest Income ($m) |
| | | | | | | | | |
Net interest income | | 9,113 | | 8,873 | | 8,288 | | 3 | | 10 |
Core net interest income | | 8,855 | | 8,131 | | 7,401 | | 9 | | 20 |
Notable Items | | (89) | | 288 | | 267 | | large | | large |
Treasury1 | | 266 | | 383 | | 568 | | (31) | | (53) |
Markets | | 81 | | 71 | | 52 | | 14 | | 56 |
Average interest earning assets ($m)2 | | | | | | | | | | |
Loans | | 699,735 | | 683,786 | | 670,648 | | 2 | | 4 |
Housing | | 481,538 | | 472,098 | | 468,207 | | 2 | | 3 |
Personal | | 13,485 | | 14,471 | | 15,618 | | (7) | | (14) |
Business | | 204,712 | | 197,217 | | 186,823 | | 4 | | 10 |
Liquid assets | | 208,467 | | 201,512 | | 181,932 | | 3 | | 15 |
Other interest-earning assets | | 26,006 | | 16,488 | | 19,495 | | 58 | | 33 |
Average interest earning assets |
| 934,208 |
| 901,786 |
| 872,075 |
| 4 |
| 7 |
NIM (%) | | | | | | | | | | |
Group NIM | | 1.96% | | 1.96% | | 1.91% | | - | | 5 bps |
Core NIM |
| 1.90% | | 1.80% | | 1.70% | | 10 bps |
| 20 bps |
First Half 2023 – First Half 2022
Net interest income increased 10% to $9,113 million with core net interest income growing by 20% to $8,855 million. Key features included:
| ● | Core NIM increased 20 basis points. The rise in interest rates supported deposit spreads and earnings on hedged deposits and capital. Lending competition, particularly in Australian mortgages, and higher liquid asset balances drove asset spread compression; and |
| ● | The Group’s average interest earning assets increased 7% to $934.2 billion. Growth in average loans of 4% was primarily attributable to mortgages and business lending. Average liquid assets were 15% higher as a result of increased holdings of HQLA to support the reduction of the CLF. Other interest-earning assets increased by 33% due to the appreciation of the AUD against USD in First Half 2023, resulting in additional collateral paid to derivative counterparties to offset the decline in the valuation of derivatives. |
First Half 2023 – Second Half 2022
Net interest income increased 3% to $9,113 million with core net interest income increasing by 9% to $8,855 million. Key features included:
| ● | Core NIM improved 10 basis points. The rise in interest rates benefited deposit spreads and earnings on hedged deposits and capital. Lending competition, particularly in Australian mortgages drove asset spread compression; and |
| ● | The Group’s average interest earning assets increased by 4% to $934.2 billion. Growth in average loans of 2% was primarily attributable to mortgages and business lending. Liquid assets, up 3%, from increased holdings of HQLA to support the reduction of the CLF. Other interest-earning assets increased by 58% due to the appreciation of the AUD against USD in First Half 2023, resulting in additional collateral paid to derivative counterparties to offset the decline in the valuation of derivatives. |
1.Treasury net interest income excludes capital benefit.
2.Includes assets held for sale.
12 | WESTPAC GROUP 2023 INTERIM FINANCIAL RESULTS |
Review of Group operations
1.5.3Loans
| | | | | | | | | | |
| | As at | | As at | | As at | | % Mov’t | ||
| | 31 March | | 30 Sept | | 31 March | | Mar 23 | | Mar 23 |
$m |
| 2023 |
| 2022 |
| 2022 |
| - Sept 22 |
| - Mar 22 |
Australia |
| 650,639 |
| 647,122 |
| 625,464 |
| 1 |
| 4 |
Housing |
| 472,570 |
| 467,382 |
| 458,278 |
| 1 |
| 3 |
Personal |
| 12,028 |
| 12,832 |
| 14,128 |
| (6) |
| (15) |
Business |
| 169,891 |
| 170,636 |
| 156,763 |
| - |
| 8 |
Provisions |
| (3,850) |
| (3,728) |
| (3,705) |
| 3 |
| 4 |
| | | | | | | | | | |
New Zealand (A$) |
| 92,359 |
| 85,772 |
| 87,806 |
| 8 |
| 5 |
| | | | | | | | | | |
New Zealand (NZ$) |
| 98,623 |
| 97,393 |
| 94,471 |
| 1 |
| 4 |
Housing |
| 65,224 |
| 63,827 |
| 62,166 |
| 2 |
| 5 |
Personal |
| 1,192 |
| 1,202 |
| 1,201 |
| (1) |
| (1) |
Business |
| 32,748 |
| 32,764 |
| 31,517 |
| - |
| 4 |
Provisions |
| (541) |
| (400) |
| (413) |
| 35 |
| 31 |
| | | | | | | | | | |
Other overseas (A$) |
| 6,933 |
| 6,753 |
| 6,286 |
| 3 |
| 10 |
Total loans |
| 749,931 |
| 739,647 |
| 719,556 |
| 1 |
| 4 |
Market share and system multiple metrics
Market share
| | | | | | |
|
| As at |
| As at |
| As at |
| | 31 March | | 30 Sept | | 31 March |
| | 2023 | | 2022 | | 2022 |
Australia |
|
|
|
|
|
|
Banking system (APRA) |
|
|
|
|
|
|
Housing credit1 |
| 21% | | 22% | | 22% |
Cards |
| 21% | | 21% | | 21% |
Financial system (Reserve Bank of Australia (RBA)) |
|
| |
| |
|
Housing credit1 |
| 20% | | 21% | | 21% |
Business credit2,3 |
| 16% | | 15% | | 15% |
New Zealand (Reserve Bank of New Zealand (RBNZ))4 |
|
| |
| | |
Consumer lending |
| 18% | | 18% | | 18% |
Business lending |
| 16% | | 16% | | 16% |
System multiples
| | | | | | |
|
| Half Year |
| Half Year |
| Half Year |
| | March | | Sept | | March |
| | 2023 | | 2022 | | 2022 |
Australia |
|
|
|
|
|
|
Banking system (APRA) |
|
|
|
|
|
|
Housing credit1 |
| 0.5 |
| 0.8 |
| 0.3 |
Cards |
| 0.5 |
| 0.3 |
| 0.7 |
Financial system (RBA) |
|
|
|
|
|
|
Housing credit1 |
| 0.6 |
| 0.7 |
| 0.2 |
Business credit2,3,5 |
| n/a |
| 0.9 |
| 0.8 |
New Zealand (RBNZ)4 |
|
|
|
|
|
|
Consumer lending |
| 1.2 |
| 1.6 |
| 0.7 |
| 1. | Includes securitised loans. |
| 2. | Westpac Group’s business credit growth rate and multiples are based on Financial System as published in the RBA Lending and Credit Aggregates, inclusive of Westpac Institutional Bank. |
| 3. | For the half year ended March 2023, the RBA’s interpretations on the financial aggregates and business lending statistics changed to remove the effect of lending to warehouse trusts in business credit. Including lending to warehouse trusts in business credit double counts loans from non-banks that are separately recorded in housing or business credit. Westpac Group’s financial results will apply this change prospectively from the March 2023 period. |
| 4. | New Zealand comprises New Zealand banking operations. |
| 5. | n/a indicates that system growth or Westpac growth was negative. |
13 |
Review of Group operations
First Half 2023 – First Half 2022
Loans increased by 4% to $749.9 billion. Lending movements included:
| ● | Increase in Australian housing loans of 3% to $472.6 billion, predominantly in owner occupied variable rate mortgages with investor lending declining 1%. This resulted in a change in the portfolio as fixed rate fell to 34% from 40% while investor fell to 32% from 33%; |
| ● | Contraction in Australian personal lending of 15% to $12.0 billion, due to the continued auto loan portfolio run- off following our exit from this business. Excluding this run-off, personal lending balances were flat with higher cards balances offset by a decline in other personal lending; |
| ● | Growth in Australian business lending of 8% to $169.9 billion, mostly from broad-based growth in WIB, including higher utilisation of credit facilities while the Business segment’s loans grew in the commercial property and agriculture sectors; and |
| ● | Increase in New Zealand lending of 4% to $98.6 billion in NZ$ terms with growth across housing, from above system growth, and business, primarily in the utilities and wholesale trade sectors. |
First Half 2023 – Second Half 2022
Loans increased 1% to $749.9 billion. Lending movements included:
| ● | Increase in Australian housing loans of 1% to $472.6 billion. This was achieved with growth in owner occupied variable rate mortgages, partly offset with a decline in the fixed rate portfolio reflecting the impact of higher interest rates on customer decisions; |
| ● | Contraction in Australian personal lending of 6%, due to continued run-off in the auto loan portfolio. Excluding this run-off, personal lending balances were marginally higher with growth in both cards and other personal lending; |
| ● | Australian business lending was stable partly reflecting the continued run-off in the auto finance portfolio. Excluding this run-off, Australian business lending balances were slightly higher. Modest growth in the business segment was offset by a contraction in WIB due to a reduction in utilisation of credit facilities and higher refinancing activity; and |
| ● | Increase in New Zealand lending by 1% in NZ$ terms primarily in housing which achieved above system growth. |
14 | WESTPAC GROUP 2023 INTERIM FINANCIAL RESULTS |
Review of Group operations
1.5.4Deposits and other borrowings
| | | | | | | | | | |
| | As at | | As at | | As at | | % Mov’t | ||
| | 31 March | | 30 Sept | | 31 March | | Mar 23 | | Mar 23 |
$m |
| 2023 |
| 2022 |
| 2022 |
| - Sept 22 |
| - Mar 22 |
Customer deposits | | | | | | | | | | |
Australia | | 545,090 | | 535,645 | | 521,303 | | 2 | | 5 |
At call | | 349,419 | | 352,544 | | 361,609 | | (1) | | (3) |
Term | | 140,704 | | 127,921 | | 104,865 | | 10 | | 34 |
Non-interest bearing | | 54,967 | | 55,180 | | 54,829 | | - | | - |
| | | | | | | | | | |
New Zealand (A$) | | 74,703 | | 68,614 | | 72,839 | | 9 | | 3 |
| | | | | | | | | | |
New Zealand (NZ$) | | 79,769 | | 77,910 | | 78,369 | | 2 | | 2 |
At call | | 30,320 | | 31,246 | | 32,480 | | (3) | | (7) |
Term | | 36,367 | | 32,273 | | 30,067 | | 13 | | 21 |
Non-interest bearing | | 13,082 | | 14,391 | | 15,822 | | (9) | | (17) |
| | | | | | | | | | |
Other overseas (A$) | | 7,792 | | 8,575 | | 6,730 | | (9) | | 16 |
Total customer deposits | | 627,585 | | 612,834 | | 600,872 | | 2 | | 4 |
| | | | | | | | | | |
Certificates of deposit | | 48,767 | | 46,295 | | 44,734 | | 5 | | 9 |
Australia | | 32,227 | | 30,507 | | 27,048 | | 6 | | 19 |
New Zealand (A$) | | 2,618 | | 2,588 | | 2,783 | | 1 | | (6) |
Other overseas (A$) | | 13,922 | | 13,200 | | 14,903 | | 5 | | (7) |
Total deposits and other borrowings (including held for sale) | | 676,352 | | 659,129 | | 645,606 | | 3 | | 5 |
Market share and system multiple metrics
Market share
| | | | | | | |
|
| As at |
| As at |
| As at |
|
| | 31 March | | 30 Sept | | 31 March |
|
| | 2023 | | 2022 | | 2022 |
|
Australia |
|
|
|
|
|
| |
Banking system (APRA) |
|
|
|
|
|
| |
Household deposits |
| 20% | | 20% | | 21% | |
Business deposits1 |
| 18% | | 18% | | 18% | |
Financial system (RBA) |
|
| |
| |
| |
Retail deposits2 |
| 19% | | 20% | | 20% | |
New Zealand (RBNZ)3 |
|
| |
| |
| |
Deposits |
| 18% | | 18% | | 18% | |
System multiples
| | | | | | |
|
| Half Year |
| Half Year |
| Half Year |
| | March | | Sept | | March |
| | 2023 | | 2022 | | 2022 |
Australia |
|
|
|
|
|
|
Banking system (APRA) |
|
|
|
|
|
|
Household deposits |
| 1.3 |
| 0.6 |
| 0.8 |
Business deposits1,4 |
| n/a |
| 0.7 |
| 0.9 |
Financial system (RBA) |
|
|
|
|
|
|
Retail deposits2 |
| 0.4 |
| 0.7 |
| 0.8 |
New Zealand (RBNZ)3 |
|
|
|
|
|
|
Deposits4 |
| 5.9 |
| n/a |
| 1.0 |
| 1. | Westpac Group’s business deposit growth rate and multiples are based on ADI System as published in the Monthly ADI statistics by APRA, inclusive of Westpac Institutional Bank. |
| 2. | Retail deposits as measured by the RBA, financial system includes financial corporations’ deposits. |
| 3. | New Zealand comprises New Zealand banking operations. |
| 4. | n/a indicates that system growth or Westpac growth was negative. |
15 |
Review of Group operations
First Half 2023 – First Half 2022
Deposits increased by 4% to $627.6 billion. Deposit growth was underpinned by the movements in:
| ● | Australian deposits up 5% to $545.1 billion, mostly from Consumer and Institutional customers. In line with rising interest rates, customers continued to switch to higher interest bearing term deposit accounts across all segments while at call deposits reduced by 3%. Non-interest bearing deposits were flat with mortgage offset account balances stable; |
| ● | New Zealand deposits up 2% to $79.8 billion in NZ$ terms with customers opting for higher interest rate bearing term deposits across all segments; and |
| ● | Other overseas deposits up 16% to $7.8 billion, mostly from the AUD depreciation. Excluding FX movements, deposits grew $0.2 billion. |
The Group’s deposit to loan ratio improved to 83.7% from 83.5% at 31 March 2022, as deposit growth broadly funded loan growth over the last 12 months.
First Half 2023 – Second Half 2022
Deposits increased by 2% to $627.6 billion. Deposit movements included:
| ● | Increase in Australian deposits of 2% to $545.1 billion fully funding loan growth. Growth was predominantly in higher interest bearing term deposits reflecting changed customer preferences. At call deposits declined by 1% primarily in our Business and Institutional transaction account balances; |
| ● | Increase in New Zealand deposits of 2% to $79.8 billion in $NZ terms with customers continuing to move to higher interest bearing term deposit accounts; and |
| ● | Decrease in other overseas deposits of 9%, mostly in WIB due to the appreciation of the AUD. Excluding FX movements, overseas deposits were down $0.7 billion. |
The Group’s deposit to loan ratio strengthened to 83.7% from 82.9% due to deposit growth outpacing lending growth in the half.
16 | WESTPAC GROUP 2023 INTERIM FINANCIAL RESULTS |
Review of Group operations
1.5.5Non-interest income1
| | | | | | | | | | |
| | Half Year | | Half Year | | Half Year | | % Mov’t | ||
| | March | | Sept | | March | | Mar 23 | | Mar 23 |
$m |
| 2023 |
| 2022 |
| 2022 |
| - Sept 22 |
| - Mar 22 |
Net fee income |
| 827 |
| 826 |
| 845 |
| - |
| (2) |
Net wealth management and insurance income |
| 347 |
| 407 |
| 401 |
| (15) |
| (13) |
Trading income |
| 387 |
| 321 |
| 343 |
| 21 |
| 13 |
Other income |
| 329 |
| (1,051) |
| 353 |
| large |
| (7) |
Total non-interest income |
| 1,890 |
| 503 |
| 1,942 |
| large |
| (3) |
Non-interest income is composed of:
| | | | | | | | | | |
|
| Half Year |
| Half Year |
| Half Year |
| % Mov’t | ||
| | March | | Sept | | March | | Mar 23 |
| Mar 23 |
$m | | 2023 | | 2022 | | 2022 | | - Sept 22 | | - Mar 22 |
Notable Items |
|
|
|
|
|
|
|
|
|
|
Net fee income |
| - |
| (1) |
| - |
| (100) |
| - |
Net wealth management and insurance income |
| - |
| (8) |
| (43) |
| (100) |
| (100) |
Trading income |
| (22) |
| 40 |
| 4 |
| large |
| large |
Other income |
| 243 |
| (1,117) |
| 271 |
| large |
| (10) |
Total non-interest income - Notable Items |
| 221 |
| (1,086) |
| 232 |
| large |
| (5) |
Businesses sold1 |
|
|
|
|
|
|
|
|
|
|
Net wealth management and insurance income |
| 115 |
| 167 |
| 225 |
| (31) |
| (49) |
Other income |
| 25 |
| - |
| - |
| - |
| - |
Total non-interest income - Businesses sold |
| 140 |
| 167 |
| 225 |
| (16) |
| (38) |
Non interest income (Ex Notable Items and Businesses sold) |
|
|
|
|
|
|
|
|
|
|
Net fee income |
| 827 |
| 827 |
| 845 |
| - |
| (2) |
Net wealth management and insurance income |
| 232 |
| 248 |
| 219 |
| (6) |
| 6 |
Trading income |
| 409 |
| 281 |
| 339 |
| 46 |
| 21 |
Other income |
| 61 |
| 66 |
| 82 |
| (8) |
| (26) |
Non-interest income excluding Notable Items and Businesses sold | | 1,529 | | 1,422 | | 1,485 | | 8 | | 3 |
Total non-interest income |
| 1,890 |
| 503 |
| 1,942 |
| large |
| (3) |
First Half 2023 – First Half 2022
Non-interest income declined by 3% to $1,890 million. Excluding Notable Items and the impact of businesses sold, non-interest income increased by 3% to $1,529 million.
Net fee income
Net fee income declined by 2% to $827 million. Movements included:
| ● | Lower card interchange fees of $6 million in New Zealand due to regulatory changes which came into effect in November 2022; |
| ● | Lower payments revenue of $8 million due to remediation charges; and |
| ● | Lower institutional undrawn financing line fees of $4 million as credit facility utilisation increased. |
| ● | Higher origination and syndication fees of $10 million from elevated activity and higher cards revenue of $9 million. |
Net wealth management and insurance income
Net wealth management and insurance income declined by 13% to $347 million due to Notable Items and the impact of businesses sold. Excluding these impacts, net wealth management and insurance income increased by 6% to $232 million. Drivers included:
| ● | Higher margins on duration cash balances of $22 million benefiting from higher interest rates; and |
| ● | Reduced wealth income of $14 million due to lower funds under administration. |
| 1. | Comparatives have been restated to incorporate the results of AAML and BT Superannuation funds successor fund transfer (SFT). |
17 |
Review of Group operations
Trading income
Trading income increased 13% to $387 million. Excluding Notable Items, trading income increased by 21% to $409 million. Movements included:
| ● | Improved Fixed Income and FX performance driven largely by credit spreads tightening and higher sales volumes providing a net benefit of $53 million; and |
| ● | Derivative valuation adjustments (DVA) which contributed $57 million from tightening counterparty credit spreads, compared to a charge of $10 million in the prior corresponding period. |
Other income
Other income of $329 million, including the $243 million gain on sale of AAML, decreased by 7% on the prior corresponding period. Other income in First Half 2022 included the gains on sale of the Wholesale Auto finance and New Zealand Life Insurance businesses for $170 million and $119 million respectively.
Excluding Notable Items and the impact of businesses sold, other income decreased by 26% to $61 million as the prior corresponding period included a $25 million benefit for achieving specific milestones under the General Insurance distribution arrangement.
Businesses sold
The contribution from the businesses sold was $140 million in First Half 2023. For further details of the contribution of each business refer to section 4.8.
First Half 2023 – Second Half 2022
The increase in non-interest income to $1,890 million predominantly reflects the impact of Notable Items and the impact of businesses sold. Excluding these items, non-interest income increased by 8% to $1,529 million.
Net fee income
Net fee income was flat with offsetting movements primarily due to:
| ● | Lower undrawn financing line fees of $4 million in WIB as credit facility utilisation increased; |
| ● | Lower interchange fees of $10 million in New Zealand mostly due to regulatory changes; |
| ● | Lower card income of $4 million from a combination of higher scheme incentives and loyalty provisions; |
| ● | Lower remediation charges of $22 million; and |
| ● | Higher origination and syndication fees in WIB of $13 million. |
Net wealth management and insurance income
Net wealth management and insurance income declined by 15% to $347 million due to Notable Items and the impact of businesses sold. Excluding these items, net wealth management and insurance income decreased by 6% to $232 million. The key movements included:
| ● | Lower custody fees from a reclassification impact of $17 million and lower regulatory related recoveries; and |
| ● | Higher net wealth income of $7 million benefited from improving market conditions over the half which resulted in higher fund balances offsetting the impact from lower opening fund balances and net outflows. |
Trading income
Trading income increased by 21% to $387 million. Excluding Notable Items, trading income increased by 46% to $409 million primarily due to:
| ● | Increased fixed income and FX performance of $74 million driven largely by credit spreads tightening and higher volumes; and |
| ● | Higher contribution from DVA from tightening counterparty credit spreads generating a $57 million contribution compared to a charge of $17 million in the prior period. |
Other income
Other income of $329 million includes the $243 million gain on sale of AAML. This compares to a loss of $1,051 million in the prior period mostly from the loss on sale of Australian life insurance of $1,112 million.
Excluding Notable Items and businesses sold, other income decreased by 8% to $61 million predominantly due to a one-off deferred payment of $3 million received in the prior period as part of the sale of the Westpac LMI business.
Businesses sold
The contribution from the businesses sold was $140 million in First Half 2023. For further details of the contribution of each business refer to section 4.8.
18 | WESTPAC GROUP 2023 INTERIM FINANCIAL RESULTS |
Review of Group operations
1.5.6Group funds
| | | | | | | | | | | | | | | | | | |
| | As at | | | | | | | | | | As at | | % Mov’t | | As at | | % Mov’t |
| | 31 March | | | | | | Net | | Other | | 30 Sept | | Mar 23 | | 31 March | | Mar 23 |
$bn |
| 2023 |
| Inflows |
| Outflows |
| flows |
| Mov’t |
| 2022 |
| Sept 22 |
| 2022 |
| Mar 22 |
Superannuation |
| 33.4 |
| 1.5 |
| (3.9) |
| (2.4) |
| (1.2) |
| 37.0 |
| (10) |
| 41.8 |
| (20) |
Platforms |
| 136.7 |
| 7.9 |
| (10.0) |
| (2.1) |
| 12.1 |
| 126.7 |
| 8 |
| 140.2 |
| (2) |
Packaged Funds |
| 1.8 |
| 2.2 |
| (5.0) |
| (2.8) |
| (35.8) |
| 40.4 |
| (96) |
| 45.9 |
| (96) |
Total Australia funds |
| 171.9 |
| 11.6 |
| (18.9) |
| (7.3) |
| (24.9) |
| 204.1 |
| (16) |
| 227.9 |
| (25) |
Total NZ funds (A$) |
| 10.7 |
| 0.9 |
| (0.9) |
| - |
| 1.1 |
| 9.6 |
| 11 |
| 10.9 |
| (2) |
Total Group funds |
| 182.6 |
| 12.5 |
| (19.8) |
| (7.3) |
| (23.8) |
| 213.7 |
| (15) |
| 238.8 |
| (24) |
Total NZ funds (NZ$) |
| 11.5 |
| 1.0 |
| (1.0) |
| - |
| 0.6 |
| 10.9 |
| 6 |
| 11.7 |
| (2) |
Group funds comprises non-superannuation and superannuation regulated products provided to Australian and New Zealand customers through advised and direct channels. This includes wealth products distributed to Australian and New Zealand customers.
Group funds decreased by 15% compared to the prior period, primarily driven by $38.5 billion related to the sale of AAML which was partly offset by favourable market movements of $14.7 billion. Inflows of $12.5 billion were more than offset by outflows of $19.8 billion.
On 1 April 2023, the SFT of the members and benefits of BT Funds Management Limited’s personal and corporate (non-platform) superannuation of $33.4 billion to Mercer Super Trust was completed. This will be reflected in Second Half 2023.
1.5.7Markets related income1,2
| | | | | | | | | | |
| | Half Year | | Half Year | | Half Year | | % Mov’t | ||
| | March | | Sept | | March | | Mar 23 | | Mar 23 |
$m |
| 2023 |
| 2022 |
| 2022 |
| - Sept 22 |
| - Mar 22 |
Net interest income |
| 81 |
| 71 |
| 52 |
| 14 |
| 56 |
Non-interest income |
| 445 |
| 296 |
| 323 |
| 50 |
| 38 |
Markets income |
| 526 |
| 367 |
| 375 |
| 43 |
| 40 |
| | | | | | | | | | |
Sales and risk management income |
| 474 |
| 387 |
| 386 |
| 22 |
| 23 |
DVA |
| 52 |
| (20) |
| (11) |
| large |
| large |
Markets income |
| 526 |
| 367 |
| 375 |
| 43 |
| 40 |
Markets income comprises sales and risk management revenue derived from the creation, pricing and distribution of risk management products to the Group's customers. Dedicated relationship specialists provide product solutions to these customers to help manage their interest rate, foreign exchange, commodity, credit and structured products risk exposures.
First Half 2023 – First Half 2022
Markets income increased by 40% to $526 million.
Sales and risk management income increased by 23% to $474 million. More favourable market conditions compared to the prior corresponding period benefitted credit products with credit spread tightening and higher volumes. FX also had increased customer sales.
DVA contributed $52 million, reflecting tighter counterparty credit spreads. This compared to a negative impact of $11 million in the prior corresponding period.
First Half 2023 – Second Half 2022
Markets income increased by 43% to $526 million.
Sales and risk management income increased by 22% to $474 million. More favourable market conditions resulted in credit spread tightening and higher credit volumes.
DVA contributed $52 million, reflecting tighter counterparty credit spreads. This compared to a negative impact of $20 million in the prior period.
| 1. | Markets income includes WIB, Specialist Businesses and Westpac New Zealand markets. |
| 2. | In First Half 2023, the presentation of Markets related income has been revised: |
| a. | Derivative Valuation Adjustment (DVA) has been revised to include Funding Value Adjustment (FVA) and Credit Value Adjustment (CVA). Previously DVA included only CVA. |
| b. | Sales and risk management income includes both customer and non-customer income. |
Comparatives have been restated.
19 |
Review of Group operations
Markets Value at Risk (VaR)
| | | | | | |
$m |
| Average |
| High |
| Low |
Half Year 31 March 2023 |
| 9.9 |
| 15.4 |
| 5.5 |
Half Year 30 September 2022 |
| 6.5 |
| 11.3 |
| 4.4 |
Half Year 31 March 2022 |
| 5.0 |
| 11.0 |
| 3.1 |
The Components of Markets VaR are as follows:
| | | | | | |
Average | | Half Year | | Half Year | | Half Year |
| | March | | Sept | | March |
$m |
| 2023 |
| 2022 |
| 2022 |
Interest rate risk |
| 7.5 |
| 4.7 |
| 3.6 |
Foreign exchange risk |
| 1.7 |
| 1.5 |
| 1.3 |
Commodity risk |
| 2.5 |
| 2.8 |
| 2.1 |
Credit and other market risks1 |
| 6.2 |
| 4.7 |
| 3.3 |
Diversification benefit |
| (8.0) |
| (7.2) |
| (5.3) |
Net market risk |
| 9.9 |
| 6.5 |
| 5.0 |
| 1. | Includes pre-payment risk and credit spread risk (exposures to generic credit rating bonds). |
20 | WESTPAC GROUP 2023 INTERIM FINANCIAL RESULTS |
Review of Group operations
1.5.8Operating expenses
| | | | | | | | | | |
| | Half Year | | Half Year | | Half Year | | % Mov’t | ||
| | March | | Sept | | March | | Mar 23 | | Mar 23 |
$m |
| 2023 |
| 2022 |
| 2022 |
| - Sept 22 |
| - Mar 22 |
Staff expenses |
| (2,892) |
| (2,884) |
| (2,982) |
| - |
| (3) |
Occupancy expenses |
| (372) |
| (516) |
| (398) |
| (28) |
| (7) |
Technology expenses |
| (1,054) |
| (1,157) |
| (1,125) |
| (9) |
| (6) |
Other expenses |
| (670) |
| (872) |
| (868) |
| (23) |
| (23) |
Total operating expenses |
| (4,988) |
| (5,429) |
| (5,373) |
| (8) |
| (7) |
Excluding Notable Items | | | | | | | | | | |
Staff expenses | | (2,892) | | (2,795) | | (2,963) | | 3 | | (2) |
Occupancy expenses | | (372) | | (390) | | (398) | | (5) | | (7) |
Technology expenses | | (1,054) | | (1,105) | | (1,080) | | (5) | | (2) |
Other expenses | | (670) | | (749) | | (701) | | (11) | | (4) |
Total operating expenses excluding Notable Items | | (4,988) | | (5,039) | | (5,142) | | (1) | | (3) |
Operating expenses - Businesses sold1 | | 18 | | (49) | | (78) | | large | | large |
Operating expenses excluding Notable Items and Business sold |
| (5,006) |
| (4,990) |
| (5,064) |
| - |
| (1) |
Full Time Equivalent (FTE) employees
| | | | | | | | | | |
| | As at | | As at | | As at | | % Mov’t | ||
| | 31 March | | 30 Sept | | 31 March | | Mar 23 | | Mar 23 |
Number of FTE |
| 2023 |
| 2022 |
| 2022 |
| - Sept 22 |
| - Mar 22 |
Permanent employees |
| 34,749 |
| 33,774 |
| 34,637 |
| 3 |
| - |
Temporary employees |
| 3,754 |
| 3,702 |
| 4,186 |
| 1 |
| (10) |
FTE | | 38,503 | | 37,476 | | 38,823 | | 3 | | (1) |
Average FTE |
| 37,821 |
| 37,629 |
| 39,517 |
| 1 |
| (4) |
First Half 2023 – First Half 2022
Operating expenses declined by 7% to $4,988 million primarily reflecting the absence of Notable Items in First Half 2023 and benefits from businesses sold.
Excluding Notable Items, operating expenses decreased by 3% to $4,988 million reflecting cost discipline especially in light of inflationary pressures on wages and third party vendor services. The cost reduction was largely achieved through efficiencies derived from the implementation of the Group’s simplification activities, including cost reset actions. This has led to a reduction of the cost to income ratio from 52.8% to 45.9%.
Staff expenses declined 3% to $2,892 million. Excluding Notable Items staff expenses decreased by 2% reflecting lower FTE from simplification measures which offset continued pressure from wage growth. FTE was 1% lower, mainly from fewer temporary employees. In addition to business exits, efficiencies were realised from the progression of cost reset actions. Restructuring costs were also lower.
Occupancy expenses reduced by 7% to $372 million following the reduction in corporate space requirements and the consolidation of the branch network including the closure of 115 branches and the establishment of 36 co-locations over the year.
Technology expenses declined 6% to $1,054 million. Excluding Notable Items technology expenses decreased by 2%, reflecting lower amortisation and depreciation costs, partly offset by higher software maintenance and licence costs.
Other expenses declined 23% to $670 million. Excluding Notable Items other expenses decreased by 4%, a result of lower consulting and third party spend and lower non-lending losses.
Businesses sold provided an $18 million benefit in First Half 2023 due to the reimbursement of costs related to the SFT which more than offset the run costs of the businesses sold. For further details of the contribution of each business refer to section 4.8.
| 1. | Comparatives have been restated to incorporate the results of AAML and SFT. |
21 |
Review of Group operations
First Half 2023 – Second Half 2022
Operating expenses declined by 8% to $4,988 million primarily reflecting the absence of Notable Items in First Half 2023 and benefits from businesses sold.
Excluding Notable Items, operating expenses declined by 1% to $4,988 million, reflecting cost discipline against the backdrop of an inflationary environment. The reduction in third party vendor and property costs partly offset the increase in staff expenses.
Staff expenses were flat to the prior period at $2,892 million. Excluding Notable Items staff expenses increased by 3% as higher average FTE was compounded by wage pressure. FTE increased by 3% to 38,503 reflecting sustained regulatory requirements in WNZL and increased customer supporting roles due to heightened mortgage refinancing activity.
Occupancy expenses decreased 28% to $372 million. Excluding Notable Items occupancy expenses decreased 5% as the Group’s footprint was reduced. This included a reduction in corporate office requirements and the benefit from the continued consolidation of the branch network, including the closure of 66 branches and the opening of 19 new co-locations in the half.
Technology expenses declined 9% to $1,054 million. Excluding Notable Items technology expenses decreased by 5%. Amortisation and depreciation costs were lower. Third party vendor costs were higher, particularly from inflationary pressure.
Other expenses declined 23% to $670 million. Excluding Notable Items other expenses fell by 11%, reflecting lower consulting and third party spend.
Businesses sold provided an $18 million benefit in First Half 2023 due to the reimbursement of costs related to the SFT which more than offset the run costs of the businesses sold. For further details of the contribution of each business refer to section 4.8.
Investment spend
| | | | | | | | | | |
| | Half Year | | Half Year | | Half Year | | % Mov’t | ||
|
| March |
| Sept |
| March |
| Mar 23 |
| Mar 23 |
$m | | 2023 | | 2022 | | 2022 | | - Sept 22 | | - Mar 22 |
Expensed |
| 287 |
| 355 |
| 528 |
| (19) |
| (46) |
Capitalised software, fixed assets and prepayments |
| 581 |
| 685 |
| 419 |
| (15) |
| 39 |
Total |
| 868 |
| 1,040 |
| 947 |
| (17) |
| (8) |
Risk & regulatory |
| 536 |
| 659 |
| 653 |
| (19) |
| (18) |
Growth and Productivity |
| 332 |
| 381 |
| 294 |
| (13) |
| 13 |
Total |
| 868 |
| 1,040 |
| 947 |
| (17) |
| (8) |
There was $868 million of investment across the Group in First Half 2023. This was $79 million lower than the prior corresponding period and $172 million lower than the prior period with the latter movement reflecting both the completion of projects and seasonality.
Of the investment spend, 38% was directed towards growth and productivity initiatives and 62% was focused on risk and compliance.
Growth and productivity investments included:
| ● | The rollout of OBP to third party brokers. This consolidates mortgage origination across all brands and channels onto one platform; |
| ● | Rollout of several new features in the Westpac App. These included: |
| - | Enhanced personal financial management features; |
| - | New voice search functionality enabling greater accessibility; |
| - | Enhanced digital fixed rate mortgage refinancing capability where customers can make applications and accept offers via the app; and |
| - | Expense splitter, allowing customers to split and track shared payments with others. |
| ● | Launch of EFTPOS Air to allow small business customers to take payments through Android phones. The simple set up and digital onboarding experience means businesses can set up and take payments within a few hours on their own device; |
| ● | Further functionality improvements to the Digital Mortgage, allowing joint borrower applications. Approximately $200 million of Digital Mortgages were settled with upward momentum in settlement volumes through the period; |
| ● | Deployment of approximately 28,000 next generation merchant terminals with features to support accessibility, assistance and sustainability; |
| ● | Digitisation of 146 paper forms which further simplified service requests in Consumer and Business Banking; and |
| ● | Continued development of the Corporate Cash Management platform, in line with the Group’s aspiration to be the number one transactional banking partner for Australian institutional customers. |
22 | WESTPAC GROUP 2023 INTERIM FINANCIAL RESULTS |
Review of Group operations
Risk and regulatory spend included:
| ● | The Customer Outcomes and Risk Excellence (CORE program) which was established to improve our management of risk and culture. Of the Program’s 353 activities, 306 or 87% have been completed while 264 or 75% have been assessed by the independent reviewer as complete and effective. The Program continues into Second Half 2023, with a focus on demonstrating risk and culture changes have been embedded into the business in a consistent, integrated, and sustainable manner; |
| ● | Implementation of APRA’s revised Basel III Capital Adequacy Prudential Standards APS112, APS113 and APS115; |
| ● | Implementation of ISO 20022, a new standard format for international and high value domestic payments messaging between banks, providing a common language for payments data around the world that will see faster and more reliable payments; |
| ● | Expansion of scam protections through the introduction of Westpac Verify and automated push notifications to customers for suspected fraud and scams. Westpac Verify is a feature which alerts customers when there is a potential mismatch in payment details. These enhancements help stop payments to suspect accounts; and |
| ● | Progress on requirements to comply with the RBNZ’s revised outsourcing policy, BS11. |
Capitalised software
| | | | | | | | | | |
| | Half Year | | Half Year | | Half Year | | % Mov’t | ||
| | March |
| Sept |
| March |
| Mar 23 |
| Mar 23 |
$m |
| 2023 | | 2022 | | 2022 | | - Sept 22 | | - Mar 22 |
Balance as at beginning of period |
| 2,264 |
| 1,921 |
| 1,840 |
| 18 |
| 23 |
Total additions |
| 595 |
| 677 |
| 424 |
| (12) |
| 40 |
Amortisation expense |
| (250) |
| (262) |
| (283) |
| (5) |
| (12) |
Impairment expense |
| - |
| (56) |
| (54) |
| (100) |
| (100) |
Other adjustments |
| 23 |
| (16) |
| (6) |
| large |
| large |
Balance as at end of period | | 2,632 | | 2,264 | | 1,921 | | 16 | | 37 |
Average amortisation period (years) |
| 4.5 |
| 3.6 |
| 3.1 |
| 0.9 years |
| 1.4 years |
Capitalised software increased by 37% on the prior corresponding period, and by 16% on the prior period, to $2,632 million. The increase was driven by capitalisation of investments associated with the Group’s strategic priorities. Additions included investment in One Banking Platform, WNZL regulatory requirements and our payments infrastructure. Amortisation was lower and the average amortisation period longer as most of these programs continue to be in the build phase.
23 |
Review of Group operations
1.5.9Credit impairment charges
| | | | | | | | | | |
| | Half Year | | Half Year | | Half Year | | % Mov’t | ||
| | March |
| Sept |
| March |
| Mar 23 |
| Mar 23 |
$m |
| 2023 | | 2022 | | 2022 | | - Sept 22 | | - Mar 22 |
Individually assessed provisions (IAPs) | | | | | | | | | | |
New IAPs |
| (76) |
| (123) |
| (97) |
| (38) |
| (22) |
Write-backs |
| 86 |
| 51 |
| 64 |
| 69 |
| 34 |
Recoveries |
| 128 |
| 87 |
| 102 |
| 47 |
| 25 |
Total IAPs, write-backs and recoveries |
| 138 |
| 15 |
| 69 |
| large |
| 100 |
Collectively assessed provisions (CAPs) |
| |
| |
| |
| |
| |
Write-offs |
| (218) |
| (228) |
| (218) |
| (4) |
| - |
Other changes in CAPs |
| (310) |
| 17 |
| 10 |
| large |
| large |
Total new CAPs |
| (528) |
| (211) |
| (208) |
| 150 |
| 154 |
Total credit impairment (charges)/benefits |
| (390) |
| (196) |
| (139) |
| 99 |
| 181 |
First Half 2023 – First Half 2022
The impairment charge of $390 million represents 10 basis points of average loans, up from 4 basis points. The rise in impairment charges was driven by a higher CAP charge more than offsetting an IAP benefit. This compared to a CAP charge of $208 million and an IAP benefit of $69 million in the prior corresponding period.
The CAP charge of $528 million comprised other changes in CAP of $310 million and write-offs of $218 million. The other changes in CAP were due to:
| ● | Weakening forward-looking economic indicators; |
| ● | Rising early cycle delinquencies in consumer portfolios due to higher interest rates and inflationary pressures on household budgets; and |
| ● | An increase in stress within New Zealand business portfolios reflecting higher interest rates, inflation and recent weather events. |
The IAP benefit of $138 million comprised:
| ● | Recoveries of $128 million, including a benefit from a large exposure which had been previously written off; |
| ● | Write-backs of $86 million mainly due to rating upgrades following restructurings and refinancing externally; and |
| ● | New IAPs of $76 million, with no new IAP greater than $10 million. |
First Half 2023 – Second Half 2022
The impairment charge increased to $390 million and was 10 basis points of average loans compared to 5 basis points. The key driver of the higher charge was a 150% increase in CAP to $528 million offset by an IAP benefit of $138 million reflecting the factors noted above.
1.5.10Income tax expense
First Half 2023 – First Half 2022
The effective tax rate of 28.8% in First Half 2023 was lower than the effective tax rate of 30.4% in First Half 2022 due to the sale of AAML which resulted in an accounting gain, but a loss for tax purposes in First Half 2023.
First Half 2023 – Second Half 2022
The effective tax rate of 28.8% in First Half 2023 was significantly lower than the Second Half 2022 effective tax rate of 35.6% mainly due to:
| ● | The sale of AAML which resulted in an accounting gain, but a tax loss in First Half 2023; compared to |
| ● | Second Half 2022 which included the sale of Australian life insurance which resulted in an accounting loss, that was not deductible for tax purposes. |
The effective tax rate is below the Australian corporate tax rate of 30%.
1.5.11Non-controlling interests
Non-controlling interests represent results of non-wholly owned subsidiaries attributable to shareholders other than Westpac. This predominantly include profits attributable to the 10.1% shareholding in Westpac Bank-PNG- Limited that are not owned by Westpac.
24 | WESTPAC GROUP 2023 INTERIM FINANCIAL RESULTS |
Review of Group operations
1.6 | Credit quality |
Credit quality key metrics
| | | | | | | |
| | As at | | As at | | As at |
|
| | 31 March | | 30 Sept | | 31 March |
|
|
| 2023 |
| 2022 |
| 2022 |
|
Stressed exposures by credit grade as a % of TCE: | | | | | | | |
Impaired |
| 0.12% | | 0.13% | | 0.14% | |
Non-performing not impaired1 |
| 0.55% | | 0.51% | | 0.56% | |
Watchlist and substandard |
| 0.43% | | 0.43% | | 0.40% | |
Total stressed exposures |
| 1.10% | | 1.07% | | 1.10% | |
| | | | | | | |
Gross impaired exposures to TCE for business and institutional: |
|
|
|
| |
| |
Business Australia |
| 0.53% | | 0.55% | | 0.60% | |
Business New Zealand |
| 0.20% | | 0.16% | | 0.16% | |
Institutional |
| 0.03% | | 0.05% | | 0.07% | |
| | | | | | | |
Mortgage 90+ day delinquencies: |
|
| |
| |
| |
Group |
| 0.68% | | 0.69% | | 0.82% | |
Australia |
| 0.73% | | 0.75% | | 0.88% | |
New Zealand |
| 0.29% | | 0.22% | | 0.30% | |
| | | | | | | |
Other consumer loans 90+ day delinquencies: |
|
| |
| |
| |
Group |
| 1.54% | | 1.56% | | 1.62% | |
Australia |
| 1.58% | | 1.60% | | 1.64% | |
New Zealand |
| 1.13% | | 1.03% | | 1.42% | |
| | | | | | | |
Other: |
|
| |
| |
| |
Gross impaired exposures to gross loans |
| 0.20% | | 0.20% | | 0.23% | |
Gross impaired exposure provisions to gross impaired exposures |
| 42.80% | | 47.95% | | 48.03% | |
Total provisions to gross loans |
| 65 bps |
| 62 bps |
| 65 bps | |
Collectively assessed provisions to credit risk weighted assets |
| 133 bps |
| 116 bps |
| 116 bps | |
Total provisions to credit risk weighted assets |
| 145 bps |
| 128 bps |
| 130 bps | |
Impairment charges/(benefits) to average loans |
| 10 bps |
| 5 bps |
| 4 bps | |
Net write-offs to average gross loans |
| 4 bps |
| 8 bps |
| 13 bps | |
Movement in gross impaired exposures
| | | | | | | | | | |
| | Half Year | | Half Year | | Half Year | | % Mov’t | ||
| | March | | Sept | | March | | Mar 23 | | Mar 23 |
$m |
| 2023 |
| 2022 |
| 2022 |
| - Sept 22 |
| - Mar 22 |
Balance as at beginning of period |
| 1,514 |
| 1,653 |
| 2,142 |
| (8) |
| (29) |
New and increased - individually managed |
| 174 |
| 208 |
| 222 |
| (16) |
| (22) |
Write-offs |
| (271) |
| (368) |
| (566) |
| (26) |
| (52) |
Returned to performing or repaid |
| (282) |
| (215) |
| (221) |
| 31 |
| 28 |
Portfolio managed - new/increased/returned/repaid |
| 385 |
| 207 |
| 89 |
| 86 |
| large |
Exchange rate and other adjustments |
| 1 |
| 29 |
| (13) |
| (97) |
| large |
Balance as at end of period |
| 1,521 |
| 1,514 |
| 1,653 |
| - |
| (8) |
1. | Previously disclosed as 90 day past due and not impaired. In First Half 2023, Westpac applied amendments to APS 220 Credit Risk Management in relation to the definition of non-performing loans. As a result, the ratio in Half Year 2023 is not directly comparable to past periods. On adoption of the new definition, the impact to the ratio was a 4bps increase, largely due to changes relating to an extension of the period over which exposures remain classified as non-performing before potential reclassification to performing. |
25 |
Review of Group operations
Credit quality First Half 2023 – Second Half 2022
Portfolios continued to perform well with stressed exposures as a percentage of TCE increasing by a modest 3 basis points to 1.10% at 31 March 2023, predominantly from a regulatory reporting change as described below. The composition and drivers of stressed exposures were:
| ● | Impaired exposures of 12 basis points, a decline of 1 basis point reflecting lower impaired exposures in WIB; |
| ● | Non-performing not impaired exposures of 55 basis points, an increase of 4 basis points predominantly from the impact of regulatory changes relating to an extension of the period over which exposures remain classified as non-performing before potential reclassification to performing. Prior periods have not been restated; and |
| ● | Watchlist and substandard exposures of 43 basis points, stable compared to the prior period. |
Gross impaired exposures to gross loans remained steady at 0.20%. The provision coverage of the impaired portfolio was 43%, down from 48% due in part to write-backs of a small number of large exposures with high coverage in Business and WIB. Impaired exposures have an appropriate level of provision cover.
Portfolio segments First Half 2023 – Second Half 2022
Stressed exposures in WIB declined 7 basis points to 0.28% of TCE. This improvement was driven by a reduction of watchlist and impaired exposures, partly due to some of these exposures being externally refinanced.
Stressed exposures in the Australian Business segment fell by 19 basis points to 4.74% of TCE. This reflected a reduction in watchlist, substandard and impaired exposures. The accommodation, café and restaurant sector saw a sizeable reduction in stressed exposure. The reduction in stressed TCE in the service sector partly reflected the upgrade of one large exposure. The commercial real estate portfolio experienced an increase in stressed exposures, up 31 basis points to 2.38% of TCE. The rise in stress has been most evident in the retail and industrial sectors. Positively, the weighted average loan to value ratio for the property portfolio remains below 50%.
Australian mortgage 90+ day delinquencies continued to reduce. The 2 basis point decline to 0.73% was due to a reduction in the hardship portfolio as customers completed their serviceability period. There was an increase in early cycle consumer lending delinquencies driven by rising interest rates and inflationary pressures on customers.
Properties in possession were 227, an increase of only 3 despite the slowdown in the property market.
Realised Australian mortgage losses remained low at $11 million, accounting for less than 1 basis point of Australian mortgages.
Australian other consumer 90+ day delinquencies declined by 2 basis points to 1.58%. An improvement in arrears performance across the portfolio of 11 basis points was partly offset by 9 basis points decline from the run-off in certain portfolios, in particular, auto finance. There was an increase in early cycle delinquencies due to higher interest rates and inflation.
In New Zealand, credit quality remains sound, although credit quality metrics are showing early signs of deterioration across all portfolios. Stressed exposures to TCE rose by 36 basis points to 1.33%. The increase in stress was driven by downgrades across watchlist and substandard exposures in the agriculture, forestry and fishing, and property sectors while impaired exposures to TCE were little changed.
New Zealand 90+ day mortgage delinquencies were up 7 basis to 0.29%. Other consumer 90+ day delinquencies increased by 10 basis points to 1.13%. The higher delinquencies in both portfolios reflected seasonal factors alongside the impact of increasing interest rates and inflationary pressures on customers.
26 | WESTPAC GROUP 2023 INTERIM FINANCIAL RESULTS |
Review of Group operations
Provisioning First Half 2023 – Second Half 2022
| | | | | | | | | | |
| | As at | | As at | | As at | | % Mov’t | ||
| | 31 March | | 30 Sept | | 31 March | | Mar 23 | | Mar 23 |
$m | | 2023 | | 2022 | | 2022 | | - Sept 22 | | - Mar 22 |
Provision for ECL on loans and credit commitments |
|
|
|
|
|
|
|
|
|
|
Collectively assessed provisions |
|
|
|
|
|
|
|
|
|
|
Modelled provision |
| 3,810 |
| 3,473 |
| 3,038 |
| 10 |
| 25 |
Overlays |
| 720 |
| 700 |
| 1,136 |
| 3 |
| (37) |
Total collectively assessed provisions |
| 4,530 |
| 4,173 |
| 4,174 |
| 9 |
| 9 |
Individually assessed provisions |
| 382 |
| 452 |
| 501 |
| (15) |
| (24) |
Total provision for ECL on loans and credit commitments |
| 4,912 |
| 4,625 |
| 4,675 |
| 6 |
| 5 |
Provision for ECL on debt securities at amortised cost |
| 6 |
| 6 |
| 4 |
| - |
| 50 |
Provision for ECL on debt securities at FVOCI1 |
| 5 |
| 4 |
| 3 |
| 25 |
| 67 |
Total provision for ECL |
| 4,923 |
| 4,635 |
| 4,682 |
| 6 |
| 5 |
Total provisions increased 6% to $4,923 million. The increase was driven by higher CAP of $358 million, partly offset by an IAP release of $70 million.
The increase in CAP was due to:
| ● | Weakening of forward-looking economic inputs in the provisioning calculation; |
| ● | A rise in the consumer portfolios early cycle delinquencies; and |
| ● | Higher watchlist and substandard exposures in New Zealand portfolios. |
The $20 million increase in overlays captures the projected impact of weather-related events on New Zealand portfolios. A portion of the Australian construction sector overlay was released as the risk is now covered under modelled CAP.
The IAP release of $70 million reflected write-backs in WIB and Business portfolios more than offsetting new IAP.
The economic scenario weights, which underpin the provisions for expected credit losses, remain unchanged:
| | | | | | |
|
| As at |
| As at |
| As at |
| | 31 March | | 30 Sept | | 31 March |
Scenario weightings (%) | | 2023 | | 2022 | | 2022 |
Upside |
| 5 |
| 5 |
| 5 |
Base |
| 50 |
| 50 |
| 50 |
Downside |
| 45 |
| 45 |
| 45 |
The elevated downside weight of 45% reflects the continuing uncertainty and downside risks including the impact of rising interest rates, high inflation and geopolitical risks.
| 1. | FVOCI represents fair value through other comprehensive income. |
27 |
Review of Group operations
1.7 | Balance sheet and funding |
1.7.1Balance sheet
| | | | | | | | | | |
| | As at | | As at | | As at | | % Mov’t | ||
| | 31 March | | 30 Sept | | 31 March | | Mar 23 | | Mar 23 |
$m |
| 2023 |
| 2022 |
| 2022 |
| - Sept 22 |
| - Mar 22 |
Assets | | | | | | | | | | |
Loans |
| 749,931 |
| 739,647 |
| 719,556 |
| 1 |
| 4 |
Housing | | 534,021 | | 523,952 | | 516,403 | | 2 | | 3 |
Personal | | 13,151 | | 13,897 | | 15,250 | | (5) | | (14) |
Business | | 207,229 | | 206,004 | | 192,098 | | 1 | | 8 |
Provision for expected credit losses (ECL) | | (4,470) | | (4,206) | | (4,195) | | 6 | | 7 |
Liquid assets1 | | 210,463 | | 194,058 | | 178,275 | | 8 | | 18 |
Assets held for sale |
| - |
| 75 |
| 2,700 |
| (100) |
| (100) |
All other assets | | 58,714 | | 80,418 | | 64,218 | | (27) | | (9) |
Total assets |
| 1,019,108 |
| 1,014,198 |
| 964,749 |
| - |
| 6 |
Liabilities |
| |
| |
| |
| |
| |
Customer deposits | | 627,585 | | 612,834 | | 600,872 | | 2 | | 4 |
Non-interest bearing, repayable at call |
| 68,558 |
| 69,032 |
| 70,543 |
| (1) |
| (3) |
Other interest bearing at call |
| 379,861 |
| 381,944 |
| 393,493 |
| (1) |
| (3) |
Other interest bearing term |
| 179,166 |
| 161,858 |
| 136,836 |
| 11 |
| 31 |
Certificates of deposit |
| 48,767 |
| 46,295 |
| 44,734 |
| 5 |
| 9 |
Debt issues |
| 148,952 |
| 144,868 |
| 133,629 |
| 3 |
| 11 |
Term funding from central banks | | 34,523 | | 33,277 | | 31,732 | | 4 | | 9 |
Liabilities held for sale |
| - |
| 32 |
| 684 |
| (100) |
| (100) |
All other liabilities | | 86,613 | | 106,383 | | 82,765 | | (19) | | 5 |
Total liabilities |
| 946,440 |
| 943,689 |
| 894,416 |
| - |
| 6 |
Equity |
| |
| |
| |
| |
| |
Total equity attributable to owners of WBC |
| 72,624 |
| 70,452 |
| 70,279 |
| 3 |
| 3 |
NCI |
| 44 |
| 57 |
| 54 |
| (23) |
| (19) |
Total equity |
| 72,668 |
| 70,509 |
| 70,333 |
| 3 |
| 3 |
| 1. | Excludes assets held for sale. |
28 | WESTPAC GROUP 2023 INTERIM FINANCIAL RESULTS |
Review of Group operations
1.7.2Funding and liquidity risk management
Liquidity risk is the risk that the Group will be unable to fund assets and meet obligations as they become due. This risk is inherent for all banks as intermediaries between depositors and borrowers. The Group has a Liquidity Risk Management Framework which seeks to meet our cash flow obligations under a wide range of market conditions and scenarios, as well as meeting the requirements of the LCR and NSFR.
The Group’s Liquidity Risk Management Framework is approved by the Board and sets out the Group’s funding and liquidity risk appetite. It also determines the roles and responsibilities of key people managing funding and liquidity risk, risk reporting and control processes. In addition, it sets out the limits and targets used to manage Westpac’s balance sheet, including wholesale funding limits, liquidity risk limits and stress testing.
LCR
| | | | | | | | | | |
| | Quarter | | Quarter | | Quarter | | % Mov’t | ||
| | March | | Sept | | March | | Mar 23 | | Mar 23 |
$m | | 2023 | | 2022 | | 2022 | | - Sept 22 | | - Mar 22 |
High Quality Liquid Assets (HQLA)1 |
| 186,480 |
| 175,595 |
| 169,346 |
| 6 |
| 10 |
Committed Liquidity Facility (CLF) |
| - |
| 15,512 |
| 27,750 |
| (100) |
| (100) |
Total LCR liquid assets |
| 186,480 |
| 191,107 |
| 197,096 |
| (2) |
| (5) |
Cash outflows in a modelled 30-day APRA defined stressed scenario |
|
|
|
|
|
|
|
|
|
|
Customer deposits |
| 96,839 |
| 101,271 |
| 96,351 |
| (4) |
| 1 |
Wholesale funding |
| 14,990 |
| 12,975 |
| 11,526 |
| 16 |
| 30 |
Other flows2 |
| 25,807 |
| 31,051 |
| 36,412 |
| (17) |
| (29) |
Total |
| 137,636 |
| 145,297 |
| 144,289 |
| (5) |
| (5) |
LCR1 |
| 135% | | 132% | | 137% | | 396 bps |
| (111 bps) |
The LCR is designed to enhance banks’ short-term resilience, by measuring the level of HQLA, as defined, held against its liquidity needs for a 30 calendar day period under a regulator-defined stress scenario.
Westpac’s average LCR for the quarter ended 31 March 2023 was 135%. The increase in the ratio compared to the quarter ended 30 September 2022 was mainly due to a reduction in net cash outflows. The removal of the 10% net cash outflow overlay in September 2022 was the largest driver of the reduction.
Average LCR-qualifying liquid assets were lower in the March quarter, with an increase in HQLA more than offset by the reduction in the CLF. The CLF was fully phased-out by 1 January 2023.
Westpac held an average of $186.5 billion in HQLA in the March 2023 quarter, an increase of $10.9 billion on the September 2022 quarterly average of $175.6 billion. This includes approximately $49 billion in HQLA above the 100% LCR minimum. The Group’s portfolio of HQLA provides a buffer against periods of liquidity stress, as well as meeting regulatory requirements. HQLA include cash, deposits with central banks, government and semi- government securities, and are recognised in the LCR calculation at market value.
Westpac uses derivatives to hedge the interest rate risk of the liquid asset portfolio and reduce exposure to changes in fair value. Changes in the fair value of liquid assets are recognised in Other Comprehensive Income (OCI) through the relevant equity reserve or the income statement.
The Group also has access to non-HQLA and other assets that are eligible for re-purchase with a central bank under certain conditions and provide a source of additional liquidity for the Group. These assets include private securities and self-originated AAA-rated mortgage-backed securities.
| 1. | Includes balances presented as held for sale. |
| 2. | Other flows include credit and liquidity facilities, collateral outflows and inflows from customers. |
29 |
Review of Group operations
NSFR
| | | | | | | | | | |
| | As at | | As at | | As at | | % Mov’t | ||
| | 31 March | | 30 Sept | | 31 March | | Mar 23 | | Mar 23 |
$m | | 2023 | | 2022 | | 2022 | | - Sept 22 | | - Mar 22 |
Available stable funding |
| 701,432 |
| 687,442 |
| 669,655 |
| 2 |
| 5 |
Required stable funding |
| 589,569 |
| 570,185 |
| 536,022 |
| 3 |
| 10 |
Net stable funding ratio |
| 119% | | 121% | | 125% | | (159 bps) |
| large |
The NSFR is designed to encourage banks’ longer-term funding resilience. To comply, banks are required to maintain an NSFR of at least 100% at all times. Westpac’s NSFR was 119% at 31 March 2023, down from 121% at 30 September 2022. The decrease in the ratio over the half was mainly due to the impact of APRA’s changes to APS 112 Capital Adequacy which resulted in a higher stable funding requirement for certain mortgages.
Funding
The Group monitors the composition and stability of its funding so that it remains within its funding risk appetite and meets the regulatory requirements of both the LCR and NSFR. During First Half 2023, the Group maintained its strong funding position.
Funding by residual maturity
| | | | | | | | | | | | | |
| | As at 31 March 2023 | | As at 30 Sept 2022 | | As at 31 March 2022 |
| ||||||
|
| $m |
| Ratio % |
| $m |
| Ratio % |
| $m |
| Ratio % |
|
Wholesale funding | | | | | | | | | | | | | |
Less than 12 months |
| 78,430 |
| 8.1 |
| 79,098 |
| 8.4 |
| 74,285 |
| 8.1 | |
Long term to short term scroll1 |
| 44,431 |
| 4.6 |
| 38,896 |
| 4.1 |
| 26,527 |
| 2.9 | |
Wholesale funding - residual maturity less than 12 months |
| 122,861 |
| 12.7 |
| 117,994 |
| 12.5 |
| 100,812 |
| 11.0 | |
Securitisation |
| 4,342 |
| 0.4 |
| 4,973 |
| 0.5 |
| 4,968 |
| 0.5 | |
Greater than 12 months |
| 139,964 |
| 14.5 |
| 136,586 |
| 14.5 |
| 138,108 |
| 15.2 | |
Wholesale funding - residual maturity greater than 12 months |
| 144,306 |
| 14.9 |
| 141,559 |
| 15.0 |
| 143,076 |
| 15.7 | |
Customer deposits |
| 627,585 |
| 65.0 |
| 612,834 |
| 65.1 |
| 600,872 |
| 65.7 | |
Equity2 |
| 71,759 |
| 7.4 |
| 69,967 |
| 7.4 |
| 69,244 |
| 7.6 | |
Total funding |
| 966,511 |
| 100.0 |
| 942,354 |
| 100.0 |
| 914,004 |
| 100.0 | |
Deposit to loan ratio
| | | | | | | | | | | | | |
| | As at 31 March 2023 |
| As at 30 Sept 2022 |
| As at 31 March 2022 |
| ||||||
|
| $m |
| Ratio % |
| $m |
| Ratio % |
| $m |
| Ratio % |
|
Customer deposits |
| 627,585 |
| | | 612,834 |
|
| | 600,872 |
|
| |
Loans |
| 749,931 |
| 83.7 | | 739,647 |
| 82.9 | | 719,556 |
| 83.5 | |
Customer deposits
Customer deposits accounted for 65.0% of the Group’s total funding at 31 March 2023, a moderate decrease compared to 65.1% at 30 September 2022. During the half, customer deposits grew strongly, up $14.8 billion, ahead of loan growth of $10.3 billion. The Group’s deposit to loan ratio increased to 83.7% from 82.9% at 30 September 2022 reflecting the stronger deposit growth.
1.Scroll represents wholesale funding with an original maturity greater than 12 months that now has a residual maturity less than 12 months.
2.Includes total share capital, share-based payment reserve and retained profits.
30 | WESTPAC GROUP 2023 INTERIM FINANCIAL RESULTS |
Review of Group operations
Long term wholesale funding
Long term funding with a residual maturity greater than 12 months made up 14.5% of the Group’s total funding at 31 March 2023, unchanged on 30 September 2022. Funding from securitisation accounted for a further 0.4% of total funding, a small decrease compared to 0.5% at 30 September 2022.
The Group maintained good access to global capital markets throughout First Half 2023, despite periods of significant dislocation in March 2023. The Group raised $20.0 billion of long term wholesale funding, leveraging the scale and diversity of its wholesale funding franchise. New issuance included senior and covered bonds in a range of tenors and currencies, including AUD, USD, EUR, GBP and others. During the First Half, the Group’s New Zealand subsidiary also re-established its US Medium Term Note Programme under Rule 144A and Reg S, adding further diversity to the Group’s funding profile. The Group also drew down on the RBNZ’s Funding for Lending Programme through its New Zealand subsidiary.
Short term wholesale funding
Wholesale funding with a residual maturity less than 12 months accounted for 12.7% of the Group’s total funding at 31 March 2023, up from 12.5% at 30 September 2022. The increase in short term funding reflects a higher proportion of long term funding where the residual maturity is less than one year, referred to as scroll. This includes $22 billion of maturities relating to the Term Funding Facility. The short term wholesale funding portfolio, including long term to short term scroll, had a weighted average maturity of 128 days, up from 104 days at 30 September 2022.
Equity
Funding from equity made up 7.4% of total funding at 31 March 2023 and was unchanged on the prior half.
31 |
Review of Group operations
1.8 | Capital and dividends |
| | | | | | | | | | |
| | As at | | As at | | As at | | % Mov’t | ||
| | 31 March | | 30 Sept | | 31 March | | Mar 23 | | Mar 23 |
|
| 2023 |
| 2022 |
| 2022 |
| - Sept 22 |
| - Mar 22 |
Level 2 regulatory capital structure | | | | | | | | | | |
Common equity Tier 1 (CET1) capital after deductions ($m) |
| 55,644 |
| 53,943 |
| 52,126 |
| 3 |
| 7 |
Risk weighted assets (RWA) ($m) |
| 452,946 |
| 477,620 |
| 459,956 |
| (5) |
| (2) |
CET1 capital ratio |
| 12.28% | | 11.29% | | 11.33% | | 99 bps |
| 95 bps |
Additional Tier 1 capital ratio |
| 2.20% | | 2.10% | | 2.08% | | 10 bps |
| 12 bps |
Tier 1 capital ratio |
| 14.48% | | 13.39% | | 13.41% | | 109 bps |
| 107 bps |
Tier 2 capital ratio |
| 5.27% | | 5.01% | | 4.30% | | 26 bps |
| 97 bps |
Total regulatory capital ratio |
| 19.75% | | 18.40% | | 17.71% | | 135 bps |
| 204 bps |
APRA leverage ratio |
| 5.46% | | 5.61% | | 5.60% | | (15 bps) |
| (14 bps) |
Level 1 regulatory capital structure |
| | | | | | | |
| |
CET1 capital after deductions ($m) |
| 52,021 | | 50,722 | | 48,684 | | 3 |
| 7 |
Risk weighted assets ($m) |
| 416,254 | | 447,010 | | 433,643 | | (7) |
| (4) |
Level 1 CET1 capital ratio |
| 12.50% | | 11.35% | | 11.23% | | 115 bps |
| 127 bps |
APRA’s revised capital framework
APRA’s revised capital framework (Basel III) became effective on 1 January 2023 and included updated prudential standards for capital adequacy and credit risk capital. The objectives of the revised capital framework are to provide flexibility for banks to operate in all environments including in times of stress, enhance risk sensitivity and improve comparability including with international standards. Revisions include:
| ● | Capital requirements: Total CET1 Requirement for domestic systemically important banks (D-SIBs) (including Westpac), is 10.25%1. This comprises: |
– | Minimum CET1 of 4.5%; |
– | Capital conservation buffer (CCB) of 4.75%; and |
– | Countercyclical capital buffer of 1.0%. |
| ● | Calculation of Credit RWA: Several changes with the most significant including: |
– | Asset classifications used to determine RWA; |
– | Greater use of internal modelling within property finance and mortgages which reduced risk weightings; |
– | Higher capital requirements for higher risk segments such as interest only and investor mortgages; |
– | Revised credit conversion factors (CCFs) for the calculation of off-balance sheet exposures which has reduced exposure at default. CCFs are percentage values used to convert an off-balance sheet exposure into an on-balance sheet equivalent; and |
– | New Zealand RWA largely determined by the Reserve Bank of New Zealand (RBNZ) requirements which increased RWA compared to prior periods. |
| ● | Introduction of a capital floor which limits the capital benefit available to advanced banks to no more than 72.5% of the RWA outcomes available under the standardised approach; and |
| ● | Introduction of a minimum leverage ratio of 3.5% and amendments of the leverage exposure calculation. |
In addition, APRA stated that it expects D-SIBs, including Westpac, to operate with a CET1 capital ratio above 11% in normal operating conditions.
These revisions are reflected in the disclosed capital ratios at 31 March 2023. Prior periods have not been restated with capital reported under APRA’s, then applicable, capital framework.
| 1. | Noting that APRA may apply higher CET1 requirements for an individual ADI. |
32 | WESTPAC GROUP 2023 INTERIM FINANCIAL RESULTS |
Review of Group operations
Capital management strategy
Westpac evaluates its approach to capital management through an Internal Capital Adequacy Assessment Process (ICAAP). Key features include:
| ● | The development of a capital management strategy, including consideration of regulatory capital minimums, capital buffers and contingency plans; |
| ● | Consideration of regulatory capital requirements and the perspectives of external stakeholders including rating agencies as well as equity and debt investors; and |
| ● | A stress testing framework that challenges the capital measures, coverage and capital requirements including the impact of adverse economic scenarios. |
The Board has determined that Westpac will target a CET1 operating capital range of between 11.0% and 11.5%, in normal operating conditions.
CET1 capital ratio movement for First Half 2023 (basis points)
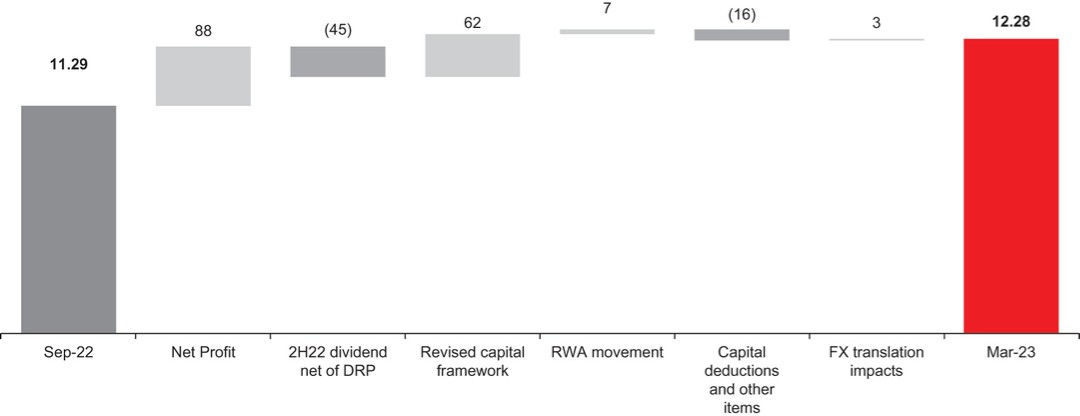
Westpac’s Level 2 CET1 capital ratio was 12.28% at 31 March 2023, 99 basis points higher than 30 September 2022. Key movements included:
| ● | First Half 2023 net profit: 88 basis points increase; |
| ● | Payment of the 2022 final dividend net of the DRP: 45 basis points reduction; |
| ● | APRA’s revised capital framework: 62 basis points addition; |
| ● | Other RWA: 7 basis points increase with a reduction in Interest Rate Risk in the Banking Book (IRRBB) RWA more than offsetting an increase in market RWA; |
| ● | Capital deductions and other capital movements: reduced the ratio by 16 basis points. The main drivers were: |
–Higher deduction for deferred tax assets, 7 basis points decrease;
–Higher deductions for capitalised software and expenditure, 10 basis points decrease; and
–Other capital deductions, 1 basis point increase;
| ● | Foreign currency impacts added 3 basis points1. |
The net profit and capital deductions outlined above include the divestment of AAML of 8 basis points.
Westpac’s Level 1 CET1 capital ratio was 12.50% at 31 March 2023, 115 basis points higher than 30 September 2022 with movements in line with Level 2 and a slightly higher impact from the revised capital framework as Level 1 excludes New Zealand.
| 1. | Reflecting the net impact of movements in the foreign currency translation reserve and RWA. |
33 |
Review of Group operations
Additional Tier 1 and Tier 2 capital movement for First Half 2023
The redemption of an A$0.25 billion Tier 2 capital note during the half decreased the total regulatory capital ratio by 6 basis points. There were no Additional Tier 1 or Tier 2 capital instruments issued.
On 2 December 2021, APRA announced a requirement for D-SIBs, including Westpac, to increase total capital requirements by 4.5 percentage points of RWA under its capital adequacy framework to be met by 1 January 2026. The increase in total capital is expected to be met through additional Tier 2 capital.1
Leverage ratio
The leverage ratio represents the amount of Tier 1 capital relative to exposure2. At 31 March 2023, Westpac’s leverage ratio was 5.46%, down 15 basis points from 30 September 2022 mostly due to the increase in total exposures under the revised capital framework which was partly offset by higher Tier 1 capital.
Internationally comparable capital ratios
APRA’s revised capital adequacy requirements are more conservative than those of the Basel Committee on Banking Supervision, leading to lower reported capital ratios when compared to international peers. In line with the revised capital framework, the internationally comparable ratio methodology has also been updated. On 10 March 2023 the Australian Banking Association released its study on the comparability of APRA’s new capital framework and finalised Basel reforms.
The table below calculates the Group’s reported capital ratios with reference to this study.
| | | | | | | | | | |
| | As at | | As at | | As at | | % Mov’t | ||
| | 31 March | | 30 Sept | | 31 March | | Mar 23 | | Mar 23 |
% |
| 2023 |
| 2022 |
| 2022 |
| - Sept 22 |
| - Mar 22 |
Internationally comparable capital ratios |
|
|
|
|
|
|
|
|
|
|
CET1 capital ratio |
| 18.14% | | 17.57% | | 17.36% | | 57 bps |
| 78 bps |
Tier 1 capital ratio |
| 21.07% | | 20.57% | | 20.23% | | 50 bps |
| 84 bps |
Total regulatory capital ratio |
| 28.24% | | 27.75% | | 26.16% | | 49 bps |
| 208 bps |
Leverage ratio |
| 5.91% | | 6.00% | | 6.10% | | (9 bps) |
| (19 bps) |
| 1. | Within Westpac’s funding, this increase in total capital is likely to be offset by a decrease in long-term wholesale funding. |
| 2. | As defined under Attachment D of APS110: Capital Adequacy. |
34 | WESTPAC GROUP 2023 INTERIM FINANCIAL RESULTS |
Review of Group operations
Risk Weighted Assets
APRA's new capital framework commenced 1 January 2023 requires a revised credit asset classes. The revised credit asset classes do not align to prior period asset classes, and therefore prior period RWA's have not been included in the table below.
| | | | | | | | | | |
| | As at | | As at | | As at | | % Mov’t | ||
| | 31 March | | 30 Sept | | 31 March | | Mar 23 | | Mar 23 |
$m |
| 2023 |
| 2022 |
| 2022 |
| - Sept 22 |
| - Mar 22 |
Credit risk1: | | | | | | | | | | |
Corporate |
| 24,309 |
| | | | | | | |
Business lending |
| 25,928 |
| | | | | | | |
Property finance |
| 31,234 |
| | | | | | | |
Large corporate |
| 21,228 |
| | | | | | | |
Sovereign |
| 2,357 |
| | | | | | | |
Financial institution |
| 15,057 |
| | | | | | | |
Residential mortgages |
| 109,164 |
| | | | | | | |
Australian credit cards |
| 3,957 |
| | | | | | | |
Other retail |
| 5,304 |
| | | | | | | |
Small business |
| 18,219 |
| | | | | | | |
Specialised lending |
| 2,931 |
| | | | | | | |
Securitisation | | 6,400 | | | | | | | | |
Standardised | | 29,139 | | | | | | | | |
New Zealand1 |
| 45,331 |
| | | | | | | |
Total credit risk |
| 340,558 |
| 362,098 |
| 359,673 |
| (6) |
| (5) |
Market risk |
| 15,168 |
| 9,290 |
| 9,596 |
| 63 |
| 58 |
Operational risk |
| 56,900 |
| 59,063 |
| 57,875 |
| (4) |
| (2) |
Interest rate risk in the banking book (IRRBB) |
| 34,748 |
| 42,782 |
| 27,710 |
| (19) |
| 25 |
Other |
| 5,572 |
| 4,387 |
| 5,102 |
| 27 |
| 9 |
Total risk weighted assets |
| 452,946 |
| 477,620 |
| 459,956 |
| (5) |
| (2) |
Total RWA decreased by 5.2% to $452.9 billion from both lower credit and non-credit RWA.
Credit RWA decreased by $21.5 billion. Key movements included:
| ● | Implementation of the revised capital framework reduced credit RWA by $23.7 billion. Key drivers were: |
– | Property Finance: Internal modelling has reduced the risk weight of property finance from 85% to 61%. These exposures were formerly calculated using the IRB slotting approach; |
– | Mortgages: Revisions to mortgage models reduced RWA, although additional capital was required for higher risk segments, including standardised risk weights for some exposures. Overall, this change resulted in a reduction in the mortgage risk weight by 110 basis points to 23.9%; and |
– | Off-balance sheet exposures: EAD has reduced by $40.4 billion mainly related to changes in CCFs for non- retail exposures. |
| ● | A $1.0 billion benefit from improved credit quality in corporate and property finance exposures which more than offset higher early cycle delinquencies in consumer portfolios; |
| ● | A $2.4 billion decrease from counterparty credit risk and mark-to-market related credit risk primarily due to decreases in the mark-to-market value of derivatives from changes in underlying foreign currency rates; |
| ● | A $3.6 billion increase from higher lending across residential mortgages, specialised lending and corporates; and |
| ● | A $2.0 billion increase from foreign currency translation impacts, predominantly the depreciation of the A$ against the NZ$. |
Non-credit RWA were $3.1 billion lower. Key movements included:
| ● | IRRBB RWA: $8.0 billion decrease due to a lower regulatory embedded loss. This occurred as the spread between the average rate on capital hedges and market rates have narrowed; |
| ● | Operational RWA: $2.2 billion decrease from APRA’s revised annual SMA2. This was mainly driven by lower operational losses; and |
| ● | Market RWA: $5.9 billion increase from a combination of market risk exposure changes and higher market volatility. |
| 1. | Covers credit and securitisation exposures regulated under RBNZ prudential requirements. |
| 2. | Westpac adopted the SMA to calculate operational risk capital from 1 January 2022. Under the revised standard, operational risk is calculated annually based on annual audited financial statements. |
35 |
Review of Group operations
Capital adequacy
| | | | | | | |
| | As at | | As at | | As at |
|
| | 31 March | | 30 Sept | | 31 March |
|
$m |
| 2023 |
| 2022 |
| 2022 |
|
Tier 1 capital | | | | | | | |
CET1 capital | | | | | | | |
Paid up ordinary capital |
| 39,824 |
| 39,666 |
| 39,667 | |
Treasury shares |
| (759) |
| (712) |
| (708) | |
Equity based remuneration |
| 1,907 |
| 1,843 |
| 1,824 | |
Foreign currency translation reserve |
| (160) |
| (537) |
| (445) | |
Accumulated other comprehensive income |
| (38) |
| 28 |
| 183 | |
Non-controlling interests - other |
| 44 |
| 57 |
| 54 | |
Retained earnings |
| 30,686 |
| 29,063 |
| 28,362 | |
Less retained earnings in life and general insurance, funds management and securitisation entities |
| (343) |
| (300) |
| (1,144) | |
Deferred fees |
| 276 |
| 300 |
| 265 | |
Total CET1 capital |
| 71,437 |
| 69,408 |
| 68,058 | |
Deductions from CET1 capital |
| |
| |
| | |
Goodwill (excluding funds management entities) |
| (7,943) |
| (7,914) |
| (7,935) | |
Deferred tax assets |
| (2,065) |
| (1,746) |
| (1,812) | |
Goodwill in life and general insurance, funds management and securitisation entities |
| (149) |
| (204) |
| (209) | |
Capitalised expenditure |
| (2,250) |
| (2,148) |
| (2,013) | |
Capitalised software |
| (2,631) |
| (2,263) |
| (1,914) | |
Investments in subsidiaries not consolidated for regulatory purposes |
| (201) |
| (316) |
| (1,541) | |
Regulatory expected downturn loss in excess of eligible provisions |
| (2) |
| (144) |
| (164) | |
Defined benefit superannuation fund surplus |
| (67) |
| (219) |
| (60) | |
Equity investments |
| (209) |
| (187) |
| (161) | |
Regulatory adjustments to fair value positions |
| (276) |
| (324) |
| (123) | |
Total deductions from CET1 capital |
| (15,793) |
| (15,465) |
| (15,932) | |
Total CET1 capital after deductions |
| 55,644 |
| 53,943 |
| 52,126 | |
| | | | | | | |
Additional Tier 1 capital |
| |
| |
| | |
Basel III complying instruments |
| 9,958 |
| 10,021 |
| 9,566 | |
Total Additional Tier 1 capital |
| 9,958 |
| 10,021 |
| 9,566 | |
Deductions from Additional Tier 1 capital |
| |
| |
| | |
Holdings of own and other financial institutions Additional Tier 1 capital instruments |
| (25) |
| (25) |
| (25) | |
Total deductions from Additional Tier 1 capital |
| (25) |
| (25) |
| (25) | |
Net Additional Tier 1 regulatory capital |
| 9,933 |
| 9,996 |
| 9,541 | |
Net Tier 1 regulatory capital |
| 65,577 |
| 63,939 |
| 61,667 | |
| | | | | | | |
Tier 2 capital |
|
|
|
|
|
| |
Basel III complying instruments |
| 23,160 |
| 23,791 |
| 20,147 | |
Eligible general reserve for credit loss |
| 1,103 |
| 411 |
| 158 | |
Total Tier 2 capital |
| 24,263 |
| 24,202 |
| 20,305 | |
Deductions from Tier 2 capital |
| |
| |
| | |
Investments in subsidiaries not consolidated for regulatory purposes |
| - |
| - |
| (60) | |
Holdings of own and other financial institutions Tier 2 capital instruments |
| (367) |
| (243) |
| (445) | |
Total deductions from Tier 2 capital |
| (367) |
| (243) |
| (505) | |
Net Tier 2 regulatory capital |
| 23,896 |
| 23,959 |
| 19,800 | |
Total regulatory capital |
| 89,473 |
| 87,898 |
| 81,467 | |
Risk weighted assets |
| 452,946 |
| 477,620 |
| 459,956 | |
CET1 capital ratio |
| 12.28% | | 11.29% | | 11.33% | |
Additional Tier 1 capital ratio |
| 2.20% | | 2.10% | | 2.08% | |
Tier 1 capital ratio |
| 14.48% | | 13.39% | | 13.41% | |
Tier 2 capital ratio |
| 5.27% | | 5.01% | | 4.30% | |
Total regulatory capital ratio |
| 19.75% | | 18.40% | | 17.71% | |
36 | WESTPAC GROUP 2023 INTERIM FINANCIAL RESULTS |
Review of Group operations
Dividends
| | | | | | | | | | |
| | Half Year | | Half Year | | Half Year | | % Mov’t | ||
| | March | | Sept | | March | | Mar 23 | | Mar 23 |
|
| 2023 |
| 2022 |
| 2022 |
| - Sept 22 |
| - Mar 22 |
Ordinary dividend - Interim (cents per share) |
| 70 |
| - |
| 61 |
| - |
| 15 |
Ordinary dividend - Final (cents per share) |
| - |
| 64 |
| - |
| (100) |
| - |
Payout ratio1 |
| 61.33% | | 92.73% | | 65.06% | | large |
| (373.00) |
Adjusted franking credit balance ($m) |
| 3,396 |
| 3,298 |
| 3,135 |
| 3 |
| 8 |
The Board has determined an interim fully franked dividend of 70 cents per share, to be paid on 27 June 2023 to shareholders on the register at the record date of 12 May 2023. The 2023 interim dividend represents a payout ratio of 61.33%. In addition to being fully franked, the dividend will also carry NZ$0.07 in New Zealand imputation credits that may be used by New Zealand tax residents.
The Board has determined to satisfy the DRP for the 2023 interim ordinary dividend by arranging for the purchase of shares in the market by a third party. The market price used to determine the number of shares transferred under the DRP will be set over the 10 trading days commencing 17 May 2023, with no discount applied.
Capital deduction for regulatory expected credit loss
For capital adequacy purposes APRA requires the amount of regulatory expected credit losses in excess of eligible provisions to be deducted from CET1 capital. The table below shows the calculation of this capital deduction.
| | | | | | |
| | As at | | As at | | As at |
| | 31 March | | 30 Sept | | 31 March |
$m |
| 2023 |
| 2022 |
| 2022 |
Provisions associated with eligible portfolios |
|
|
|
|
|
|
Total provisions for expected credit losses |
| 4,923 |
| 4,635 |
| 4,682 |
plus provisions associated with partial write-offs |
| 381 |
| 377 |
| 304 |
less ineligible provisions2 |
| (181) |
| (143) |
| (101) |
Total eligible provisions |
| 5,123 |
| 4,869 |
| 4,885 |
Regulatory expected downturn loss |
| 4,101 |
| 4,690 |
| 4,947 |
Excess/(shortfall) in eligible provisions compared to regulatory expected downturn loss |
| 1,022 |
| 179 |
| (62) |
CET1 capital deduction for regulatory expected downturn loss in excess of eligible provisions3 |
| (2) |
| (144) |
| (164) |
| 1. | Payout ratio excludes the dividend component of completed off-market share buy-back announced on 14 February 2022. |
| 2. | Provisions associated with portfolios subject to the Basel standardised approach to credit risk are not eligible. |
| 3. | Regulatory expected loss is calculated for portfolios subject to the Basel advanced capital IRB approach to credit risk. The comparison between regulatory expected loss and eligible provisions is performed separately for defaulted and non-defaulted exposures. |
37 |
Review of Group operations
1.9Sustainability performance summary
Westpac’s sustainability approach
Westpac’s purpose is creating better futures together. We believe that we have a role to play in helping to create positive social, economic and environmental impact. Our 2021-2023 Sustainability Strategy sets out how we can best serve our stakeholders and contribute to solving global challenges. It focuses on three priority areas: helping when it matters most; backing a stronger Australia and New Zealand; and collaborating for impact.
We have a long history of sustainability disclosure, having produced our first Sustainability Report in 2002. Progress against our 2021-2023 Sustainability Strategy with a focus on First Half 2023 is available in our Investor Discussion Pack, with this report focusing on our climate change progress.
Progress on our Climate Action Plan
Our Climate Change Position Statement and Action Plan (Climate Action Plan), was updated in November 2022 and defines our ambition to become a net-zero, climate resilient bank.
The Climate Action Plan identifies three priority areas:
| ● | Net-zero, climate resilient operations; |
| ● | Supporting customers’ transition to net-zero and to build their climate resilience; and |
| ● | Collaborate for impact on initiatives towards net-zero and climate resilience. |
Progress in First Half 2023 has included:
1. Net-zero, climate resilient operations
We are committed to reducing the climate change impacts of our direct operations, aligned with a 1.5°C pathway1. Our approach is to reduce emissions from our own operations2 and purchase carbon credits to offset our residual emissions. In 2022, we updated our operational emissions targets against a 2021 baseline and to increase our supply chain emissions reduction ambition. Our targets are:
| ● | Scope 1 and 2 absolute emissions reduction of 64% by 2025 and 76% by 2030; and |
| ● | Scope 3 supply chain (non-financed) absolute emissions reduction of 50% by 2030. |
Initiatives to support these targets in First Half 2023 include:
| ● | Delivered the second phase3 of our renewables transition program to enable the equivalent of 100% of Westpac’s Australian electricity demand to be sourced from renewables from Second Half 2023; |
| ● | Planning and delivery underway to source renewable electricity for our international operations by 2025; |
| ● | Operational go-live of electric vehicle charging stations in our new Western Sydney headquarters; |
| ● | Purchased Australian Carbon Credit Units (ACCUs) to offset residual emissions to support Westpac’s intention to obtain carbon neutral certification for its direct Australian operations and supply chain (non-financed) emissions under the Climate Active Carbon Neutral Standard for Organisations for Full Year 2023; |
| ● | Planning underway to assess the physical risks to our property portfolio resulting from climate change; and |
| ● | Developing a program to support employees reduce their home emissions. |
| | | | | | | | |
|
| First Half |
| Second Half |
| First Half |
| 2021 |
| | 2023 | | 2022 | | 2022 | | baseline |
Market-based direct operational Scope 1 and Scope 2 greenhouse gas (GHG) emissions4 before carbon credits (tCO₂ - e) |
| 16,860 |
| 21,288 |
| 22,743 |
| 62,630 |
% reduction to 2021 baseline (Half Year annualised) |
| (46%) |
| (32%) |
| (27%) |
| n/a |
Share (%) of global operational electricity demand sourced from renewables5 |
| 59% | | 53% | | 52% | | n/a |
| 1. | A pathway to net-zero by mid-century, or sooner, including CO2-e emissions reaching net-zero at the latest by 2050, consistent with a maximum temperature rise of 1.5°C above pre-industrial levels by 2100. |
| 2. | Includes Westpac Group direct operations in Australia, New Zealand, United Kingdom, United States, Germany, China, Singapore, Fiji and Papua New Guinea. |
| 3. | The second phase consists of a virtual power purchase agreement (i.e. generation exported to grid and distributed to sites through the national transmission and distribution network) with Flow Power to source renewable electricity from Ararat Wind Farm in Victoria and Berri Solar Farm + Battery in South Australia. The third phase will seek to deliver the remainder of the transition to source the equivalent of 100% of our global electricity consumption from renewables sources by the end of 2025. |
| 4. | The market-based accounting method provides a picture of Westpac’s electricity emissions in the context of its renewable energy procurement represented by the retirement of eligible renewable energy attribute certificates. |
| 5. | Committed to sourcing the equivalent of 100% of our global electricity consumption from renewable sources by 2025. Renewables percentage is supported by the surrender of large-scale generation certificates (LGCs) directly by, or on behalf of, Westpac at year-end that represent 59% of Westpac’s direct First Half 2023 electricity consumption. This figure differs from the higher renewables percentage reported under Westpac’s Climate Active Public Disclosure Statement due to the Climate Active Standard Electricity Accounting methodology recognising jurisdictional renewable energy targets and the large-scale renewable energy target |
38 | WESTPAC GROUP 2023 INTERIM FINANCIAL RESULTS |
Review of Group operations
2. Supporting customers’ transition to net-zero and to build their climate resilience
Under this priority area, we are working towards:
| ● | reducing our financed emissions; |
| ● | providing products and services that support customers to transition and build their climate resilience; and |
| ● | mobilising capital to incentivise development of transition technologies and climate adaptation measures. |
In First Half 2023, work has included:
Progress on reducing our financed emissions
We joined the Net-Zero Banking Alliance (NZBA) in July 2022 and are committed to aligning our lending portfolios with net-zero emissions by 2050, consistent with a 1.5°C pathway. Under our commitment we have now set interim 2030 emission reduction targets for five sectors: upstream oil and gas, thermal coal mining, power generation, cement production, and Australian commercial real estate (large customers with office properties)1.
In First Half 2023, progress has included:
| ● | Setting sector targets |
We are continuing work to set additional sector targets and expand our existing sector targets to increase the target coverage across our portfolio - in line with our NZBA commitment.
As part of this process, we are working to build our understanding of high-emitting sectors to allow us to set and better inform the additional targets. This work includes:
| ● | determining appropriate 1.5°C-aligned pathways for high-emitting sectors for additional targets; |
| ● | engaging with customers and industry bodies in high-emitting sectors for additional targets to understand their decarbonisation transition plans; and |
| ● | conducting research to better understand both the emissions profiles and targets of these sectors (including production and emissions data) and the opportunities for transition planning and decarbonisation. |
| ● | Operationalising sector targets |
Work to help achieve the targets already set includes:
| ● | building capabilities with an aim to ensure transaction assessments align with our Climate Action Plan; |
| ● | developing sector models to monitor and manage our targets, including decision-making frameworks for new and existing facilities; |
| ● | improving the ways we capture, store, and use the data required to monitor and manage our targets; |
| ● | including net-zero considerations into our environment, social and governance (ESG) risk assessment tools; |
| ● | adding fossil fuel-related sector thresholds into divisional and board risk appetite statements; and |
| ● | continuing to build capability with new expert employees and training for our bankers. |
Looking to continue to improve the quality of our targets and plans, we have been reviewing and testing the methodologies, sector boundaries, and baselines of our existing targets, and will consider updates to maintain the effectiveness and relevance of the targets.
As part of the capability uplift in Consumer and Business Banking (CBB), we established a Climate and Rural Engagement Team to support our customers’ transition to net-zero. The team comprises individuals from a variety of backgrounds to collaborate with stakeholders to help reduce the division’s financed emissions. The team has a particularly important role in better supporting our bankers and customers to understand climate risks and opportunities.
| 1. | Refer to our Net-Zero 2030 Targets and Financed Emissions – our methodology and approach on our website for detail on our sector targets, including scope, sector boundary and target definitions. This methodology document includes the FY21 baselines from which our targets will be measured and discusses some of the complexities and challenges involved in setting targets and calculating baselines. |
39 |
Review of Group operations
| ● | Engaging customers |
In WIB, we have continued to engage customers in sectors where we have set targets and seek to support their businesses through the transition. During First Half 2023, engagement has focused on:
| ● | transition plans; |
| ● | implemented and planned emission reduction initiatives; and |
| ● | sustainable finance. |
CBB supports a large, more diversified customer base. To be effective, this requires a portfolio approach to customer engagement. For example, we seek to work with customers alongside industry bodies.
We recognise that reducing emissions will not be easy for some customers, however decarbonisation will create opportunities as well as help make businesses more resilient. Supporting customers with this transition is key to our engagement with them.
We will seek to provide progress reports against our NZBA targets, as well as updates on any additional sector targets, in our full year disclosures.
Progress on becoming the transition partner of choice
We recognise the significant role we can play in the transition to a net-zero economy by supporting customers and mobilising capital.
In First Half 2023, progress has included:
| ● | Sustainable finance |
| ● | Supported customers across 23 sustainable finance transactions1 with a total notional value of $19.7 billion; and |
| ● | Of the 23 sustainable finance transactions, Westpac contributed $2.1 billion of direct lending and assisted (together with other joint lead managers) with the distribution of $7.3 billion of bonds into the capital markets. Of these transactions, 15 were loans and 8 were bonds. |
| ● | Climate change solutions |
| ● | Achieved a cumulative $1.9 billion in new lending2 to climate change solutions3 to take us to over $5.7 billion since 2020 and exceed our target of $3.5 billion in new lending from 2020 to 2023. Our total committed exposure to climate change solutions has increased to $12.0 billion. |
| | | | | | | |
|
| At |
| At |
| |
|
|
| 31 March |
| 30 Sept |
| % | |
$bn |
| 2023 |
| 2022 | | change | |
Climate change solutions - total committed exposure |
| 12.0 |
| 10.8 |
| 11% | |
Climate change solutions - new lending since 1 October 2020 |
| 5.7 |
| 3.8 |
| 50% | |
As part of our Climate Action Plan, we are developing a sustainable finance taxonomy and aim to announce a new sustainable financing target with our Full Year 2023 results.
3. Collaborate for impact on initiatives towards net-zero and climate resilience
Addressing climate change requires collective action. We recognise the important role we can play by supporting and participating in international, national, and industry-based initiatives to progress action on climate change.
In First Half 2023, we collaborated with Australia’s emissions-intensive industry and related businesses as part of the Australian Industry Energy Transitions Initiative (ETI), co-convened by ClimateWorks Centre and Climate- KIC Australia. The Australian Industry ETI released its report Pathways to industrial decarbonisation: Positioning Australian industry to prosper in a net zero global economy on 20 February 2023. This report outlines a potential pathway for heavy industry decarbonisation consistent with limiting global warming to 1.5°C by 2050.
We are a founding member of the Australian Sustainable Finance Institute (ASFI), and provide input on initiatives in the Australian Sustainable Finance Roadmap. In First Half 2023 we continued our participation, through ASFI, in the Sustainable Finance Taxonomy Project.
We are part of a global pilot testing led by United Nations Environment Programme Finance Initiative (UNEP FI) with the private finance sector to test the draft risk management and disclosure framework from the Taskforce on Nature-related Financial Disclosures (TNFD). The outcomes of this pilot have been fed back into the development of the TNFD. Westpac is a forum member of the TNFD.
In First Half 2023, we have also been participating in Australian Banking Association (ABA) working groups on improving industry practices in climate risk, climate disclosures, and financed emissions.
| 1. | Sustainable finance transactions refers to green, social, sustainability, sustainability-linked and re-linked loans and bonds. Westpac's approach to sustainable finance is aligned with several relevant industry guidelines and principles, such as those issued by the Loan Market Association, International Capital Markets Association and the Climate Bond Initiative. |
| 2. | New lending represents the total of new and increases in lending commitments, excluding refinances. |
| 3. | Climate change solutions activities are defined in the Glossary section in our 2022 Sustainability Index and Datasheet. |
2.0 | Segment reporting |
In the current period, the Group has changed its internal and external reporting from reporting cash earnings to reporting statutory net profit. Internally, Westpac separately identifies the impact of Notable Items on income and expenses and includes a sub-total titled “Pre-provision profit”. Pre-provision profit represents profit before impairment charges and income tax expenses.
As segment reporting is to be consistent with the reporting internally to the Group’s key decision makers, the segment reporting below reflects this basis of preparation and prior period balances have been restated.
| | | | | | | | | | | | | | | | |
|
| |
| |
| Consumer |
| |
| Westpac |
| |
| |
| |
| | | | |
| and |
| Westpac |
| New |
| |
| | | |
| | | | |
| Business |
| Institutional |
| Zealand1 | | Specialist | | Group | | |
| | Consumer | | Business |
| Banking | | Bank |
| (A$) | | Businesses | | Businesses | | Group |
Half Year March 2023 ($m) |
|
|
|
|
|
|
|
|
|
|
|
|
|
|
|
|
Net interest income |
| 4,693 |
| 2,043 |
| 6,736 |
| 712 |
| 1,145 |
| 216 |
| 393 |
| 9,202 |
Non-interest income |
| 297 |
| 165 |
| 462 |
| 704 |
| 116 |
| 393 |
| (6) |
| 1,669 |
Notable Items |
| - |
| - |
| - |
| - |
| - |
| 243 |
| (111) |
| 132 |
Net operating income |
| 4,990 |
| 2,208 |
| 7,198 |
| 1,416 |
| 1,261 |
| 852 |
| 276 |
| 11,003 |
Operating expenses |
| (2,301) |
| (914) |
| (3,215) |
| (617) |
| (574) |
| (280) |
| (302) |
| (4,988) |
Notable Items |
| - |
| - |
| - |
| - |
| - |
| - |
| - |
| - |
Total operating expenses |
| (2,301) |
| (914) |
| (3,215) |
| (617) |
| (574) |
| (280) |
| (302) |
| (4,988) |
Pre-provision profit |
| 2,689 |
| 1,294 |
| 3,983 |
| 799 |
| 687 |
| 572 |
| (26) |
| 6,015 |
Impairment (charges)/benefits |
| (170) |
| (78) |
| (248) |
| 4 |
| (142) |
| (2) |
| (2) |
| (390) |
Profit before income tax (expense)/benefit |
| 2,519 |
| 1,216 |
| 3,735 |
| 803 |
| 545 |
| 570 |
| (28) |
| 5,625 |
Income tax (expense)/benefit and NCI2 |
| (756) |
| (365) |
| (1,121) |
| (229) |
| (154) |
| (77) |
| (43) |
| (1,624) |
Net profit/(loss) |
| 1,763 |
| 851 |
| 2,614 |
| 574 |
| 391 |
| 493 |
| (71) |
| 4,001 |
Net profit includes impact of: |
|
|
|
|
|
|
|
|
|
|
|
|
|
|
|
|
| | | | | | | | | | | | | | | | |
Notable Items (post tax)2 |
| - |
| - |
| - |
| - |
| - |
| 256 |
| (78) |
| 178 |
Profit/(loss) attributable to businesses sold3 |
| - |
| - |
| - |
| - |
| - |
| 111 |
| - |
| 111 |
| | | | | | | | | | | | | | | | |
Half Year September 2022 ($m) |
|
|
|
|
|
|
|
|
|
|
|
|
|
|
|
|
Net interest income |
| 4,608 |
| 1,704 |
| 6,312 |
| 629 |
| 1,073 |
| 232 |
| 339 |
| 8,585 |
Non-interest income |
| 288 |
| 167 |
| 455 |
| 554 |
| 128 |
| 418 |
| 34 |
| 1,589 |
Notable Items |
| - |
| - |
| - |
| - |
| (12) |
| (1,120) |
| 334 |
| (798) |
Net operating income |
| 4,896 |
| 1,871 |
| 6,767 |
| 1,183 |
| 1,189 |
| (470) |
| 707 |
| 9,376 |
Operating expenses |
| (2,254) |
| (915) |
| (3,169) |
| (607) |
| (538) |
| (313) |
| (412) |
| (5,039) |
Notable Items |
| (66) |
| - |
| (66) |
| - |
| - |
| (150) |
| (174) |
| (390) |
Total operating expenses |
| (2,320) |
| (915) |
| (3,235) |
| (607) |
| (538) |
| (463) |
| (586) |
| (5,429) |
Pre-provision profit |
| 2,576 |
| 956 |
| 3,532 |
| 576 |
| 651 |
| (933) |
| 121 |
| 3,947 |
Impairment (charges)/benefits |
| (228) |
| 15 |
| (213) |
| (27) |
| 16 |
| 29 |
| (1) |
| (196) |
Profit before income tax (expense)/benefit |
| 2,348 |
| 971 |
| 3,319 |
| 549 |
| 667 |
| (904) |
| 120 |
| 3,751 |
Income tax (expense)/benefit and NCI2 |
| (703) |
| (292) |
| (995) |
| (168) |
| (192) |
| 49 |
| (31) |
| (1,337) |
Net profit/(loss) |
| 1,645 |
| 679 |
| 2,324 |
| 381 |
| 475 |
| (855) |
| 89 |
| 2,414 |
Net profit includes impact of: |
|
|
|
|
|
|
|
|
|
|
|
|
|
|
|
|
| | | | | | | | | | | | | | | | |
Notable Items (post tax)2 |
| (47) |
| - |
| (47) |
| - |
| (10) |
| (1,112) |
| 116 |
| (1,053) |
Profit/(loss) attributable to businesses sold3 |
| - |
| - |
| - |
| - |
| - |
| 74 |
| - |
| 74 |
| 1. | Refer to section 2.3 for the Westpac New Zealand NZ$ segment reporting. |
| 2. | The tax impact of Notable Items was a reduction to income tax (expense)/benefit of $46 million in First Half 2023 (Second Half 2022: $135 million reduction, First Half 2022: $89 million addition). |
| 3. | Refer to section 4.8 for further details. |
| | | | | | | | | | | | | | | | |
|
| |
| |
| Consumer |
| |
| Westpac |
| |
| |
| |
| | |
| |
| and |
| Westpac |
| New |
| | | | | |
| | |
| |
| Business |
| Institutional | | Zealand1 | | Specialist | | Group | | |
| | Consumer |
| Business | | Banking |
| Bank | | (A$) | | Businesses | | Businesses | | Group |
Half Year 31 March 2022 ($m) |
|
|
|
|
|
|
|
|
|
|
|
|
|
|
|
|
Net interest income |
| 4,377 |
| 1,323 |
| 5,700 |
| 481 |
| 1,034 |
| 242 |
| 564 |
| 8,021 |
Non-interest income |
| 324 |
| 165 |
| 489 |
| 592 |
| 151 |
| 442 |
| 36 |
| 1,710 |
Notable Items |
| - |
| - |
| - |
| - |
| 132 |
| 109 |
| 258 |
| 499 |
Net operating income |
| 4,701 |
| 1,488 |
| 6,189 |
| 1,073 |
| 1,317 |
| 793 |
| 858 |
| 10,230 |
Operating expenses |
| (2,369) |
| (984) |
| (3,353) |
| (581) |
| (534) |
| (370) |
| (304) |
| (5,142) |
Notable Items |
| - |
| - |
| - |
| - |
| - |
| (215) |
| (16) |
| (231) |
Total operating expenses |
| (2,369) |
| (984) |
| (3,353) |
| (581) |
| (534) |
| (585) |
| (320) |
| (5,373) |
Pre-provision profit |
| 2,332 |
| 504 |
| 2,836 |
| 492 |
| 783 |
| 208 |
| 538 |
| 4,857 |
Impairment (charges)/benefits |
| 27 |
| (158) |
| (131) |
| (58) |
| 9 |
| 38 |
| 3 |
| (139) |
Profit before income tax (expense)/benefit |
| 2,359 |
| 346 |
| 2,705 |
| 434 |
| 792 |
| 246 |
| 541 |
| 4,718 |
Income tax (expense)/benefit and NCI2 |
| (713) |
| (107) |
| (820) |
| (128) |
| (190) |
| (114) |
| (186) |
| (1,438) |
Net profit/(loss) |
| 1,646 |
| 239 |
| 1,885 |
| 306 |
| 602 |
| 132 |
| 355 |
| 3,280 |
Net profit includes impact of: |
|
|
|
|
|
|
|
|
|
|
|
|
|
|
|
|
Notable Items (post tax)2 |
| - |
| - |
| - |
| - |
| 129 |
| (114) |
| 164 |
| 179 |
Profit/(loss) attributable to businesses sold3 |
| - |
| - |
| - |
| - |
| 18 |
| 94 |
| - |
| 112 |
| 1. | Refer to section 2.3 for the Westpac New Zealand NZ$ segment reporting. |
| 2. | The tax impact of Notable Items was a reduction to income tax (expense)/benefit of $46 million in First Half 2023 (Second Half 2022: $135 million reduction, First Half 2022: $89 million addition). |
| 3. | Refer to section 4.8 for further details. |
42 | WESTPAC GROUP 2023 INTERIM FINANCIAL RESULTS |
Segment reporting
Businesses sold
The table below shows the profit/(loss) attributable to businesses sold on the segments by the relevant period.
Further details are provided in Section 4.8.
| | | | | | | | | | | | | | | | |
|
| |
| |
| |
| |
| Westpac |
| |
| |
| |
| | | | |
| Consumer |
| Westpac |
| New |
| |
| | | |
| | | | |
| and Business |
| Institutional |
| Zealand | | Specialist | | Group | | |
$m | | Consumer | | Business | | Banking | | Bank |
| (A$) | | Businesses | | Businesses | | Group |
Half Year March 2023 |
|
|
|
|
|
|
|
|
|
|
|
|
|
|
|
|
Net interest income |
| - |
| - |
| - |
| - |
| - |
| - |
| - |
| - |
Non-interest income |
| - |
| - |
| - |
| - |
| - |
| 140 |
| - |
| 140 |
Net operating income |
| - |
| - |
| - |
| - |
| - |
| 140 |
| - |
| 140 |
Operating expenses |
| - |
| - |
| - |
| - |
| - |
| 18 |
| - |
| 18 |
Pre-provision profit |
| - |
| - |
| - |
| - |
| - |
| 158 |
| - |
| 158 |
Impairment (charges)/benefits |
| - |
| - |
| - |
| - |
| - |
| - |
| - |
| - |
Profit before income tax (expense)/benefit |
| - |
| - |
| - |
| - |
| - |
| 158 |
| - |
| 158 |
Income tax (expense)/benefit and NCI |
| - |
| - |
| - |
| - |
| - |
| (47) |
| - |
| (47) |
Net profit |
| - |
| - |
| - |
| - |
| - |
| 111 |
| - |
| 111 |
Half Year Sept 2022 |
|
|
|
|
|
|
|
|
|
|
|
|
|
|
|
|
Net interest income |
| - |
| - |
| - |
| - |
| - |
| - |
| - |
| - |
Non-interest income |
| - |
| - |
| - |
| - |
| - |
| 167 |
| - |
| 167 |
Net operating income |
| - |
| - |
| - |
| - |
| - |
| 167 |
| - |
| 167 |
Operating expenses |
| - |
| - |
| - |
| - |
| - |
| (49) |
| - |
| (49) |
Pre-provision profit |
| - |
| - |
| - |
| - |
| - |
| 118 |
| - |
| 118 |
Impairment (charges)/benefits |
| - |
| - |
| - |
| - |
| - |
| - |
| - |
| - |
Profit before income tax (expense)/benefit |
| - |
| - |
| - |
| - |
| - |
| 118 |
| - |
| 118 |
Income tax (expense)/benefit and NCI |
| - |
| - |
| - |
| - |
| - |
| (44) |
| - |
| (44) |
Net profit |
| - |
| - |
| - |
| - |
| - |
| 74 |
| - |
| 74 |
Half Year March 2022 |
|
|
|
|
|
|
|
|
|
|
|
|
|
|
|
|
Net interest income |
| - |
| - |
| - |
| - |
| - |
| 6 |
| - |
| 6 |
Non-interest income |
| - |
| - |
| - |
| - |
| 28 |
| 197 |
| - |
| 225 |
Net operating income |
| - |
| - |
| - |
| - |
| 28 |
| 203 |
| - |
| 231 |
Operating expenses |
| - |
| - |
| - |
| - |
| (3) |
| (75) |
| - |
| (78) |
Pre-provision profit |
| - |
| - |
| - |
| - |
| 25 |
| 128 |
| - |
| 153 |
Impairment (charges)/benefits |
| - |
| - |
| - |
| - |
| - |
| 7 |
| - |
| 7 |
Profit before income tax (expense)/benefit |
| - |
| - |
| - |
| - |
| 25 |
| 135 |
| - |
| 160 |
Income tax (expense)/benefit and NCI |
| - |
| - |
| - |
| - |
| (7) |
| (41) |
| - |
| (48) |
Net profit |
| - |
| - |
| - |
| - |
| 18 |
| 94 |
| - |
| 112 |
43 |
Segment reporting
2.1.1Consumer
The Consumer segment provides a range of banking products and services including mortgages, credit cards, personal loans and deposits to customers in Australia. These products and services are provided through a portfolio of brands comprising Westpac, St.George, BankSA, Bank of Melbourne and RAMS.
| | | | | | | | | | |
|
| Half Year |
| Half Year |
| Half Year |
| % Mov’t | ||
| | March | | Sept | | March | | Mar 23 |
| Mar 23 |
$m | | 2023 | | 2022 | | 2022 | | - Sept 22 | | - Mar 22 |
Net interest income |
| 4,693 |
| 4,608 |
| 4,377 |
| 2 |
| 7 |
Non-interest income |
| 297 |
| 288 |
| 324 |
| 3 |
| (8) |
Net operating income |
| 4,990 |
| 4,896 |
| 4,701 |
| 2 |
| 6 |
Operating expenses |
| (2,301) |
| (2,254) |
| (2,369) |
| 2 |
| (3) |
Notable Items |
| - |
| (66) |
| - |
| (100) |
| - |
Total operating expenses |
| (2,301) |
| (2,320) |
| (2,369) |
| (1) |
| (3) |
Pre-provision profit |
| 2,689 |
| 2,576 |
| 2,332 |
| 4 |
| 15 |
Impairment (charges)/benefits |
| (170) |
| (228) |
| 27 |
| (25) |
| large |
Profit before income tax expense |
| 2,519 |
| 2,348 |
| 2,359 |
| 7 |
| 7 |
Income tax expense and NCI |
| (756) |
| (703) |
| (713) |
| 8 |
| 6 |
Net profit |
| 1,763 |
| 1,645 |
| 1,646 |
| 7 |
| 7 |
Notable Items (post tax) |
| - |
| (47) |
| - |
| (100) |
| - |
| | | | | | | | | | |
Expense to income ratio (Ex Notable Items) |
| 46.11% |
| 46.04% |
| 50.39% |
| 7 bps |
| large |
Net interest margin (Ex Notable Items) |
| 2.18% | | 2.16% | | 2.09% | | 2 bps |
| 9 bps |
| | | | | | | | | | |
|
| As at |
| As at |
| As at |
| % Mov’t | ||
| | 31 March | | 30 Sept | | 31 March | | Mar 23 |
| Mar 23 |
$bn | | 2023 | | 2022 | | 2022 | | - Sept 22 | | - Mar 22 |
Customer deposits |
|
|
|
|
|
|
|
|
|
|
At call |
| 175.3 |
| 164.1 |
| 172.2 |
| 7 |
| 2 |
Term |
| 64.3 |
| 62.2 |
| 50.5 |
| 3 |
| 27 |
Non-interest bearing |
| 54.0 |
| 54.3 |
| 53.5 |
| (1) |
| 1 |
Total customer deposits |
| 293.6 |
| 280.6 |
| 276.2 |
| 5 |
| 6 |
Loans |
| |
| |
| |
| |
| |
Mortgages |
| 472.7 |
| 467.6 |
| 458.4 |
| 1 |
| 3 |
Other |
| 9.0 |
| 8.9 |
| 9.0 |
| 1 |
| - |
Provisions |
| (1.9) |
| (1.9) |
| (1.7) |
| - |
| 12 |
Total loans |
| 479.8 |
| 474.6 |
| 465.7 |
| 1 |
| 3 |
Deposit to loan ratio | | 61.19% | | 59.12% | | 59.30% | | 207 bps | | 189 bps |
Total assets | | 492.7 | | 486.9 | | 477.8 | | 1 | | 3 |
TCE | | 569.8 | | 564.4 | | 554.0 | | 1 | | 3 |
Average interest earning assets | | 432.2 | | 425.1 | | 420.3 | | 2 | | 3 |
Average allocated capital | | 25.7 | | 25.2 | | 25.2 | | 2 | | 2 |
Credit quality | | | | | | | | | | |
Impairment charges/(benefits) to average loans | | 0.07% | | 0.10% | | (0.01%) | | (3 bps) | | large |
Mortgage 90+ day delinquencies | | 0.73% | | 0.75% | | 0.88% | | (2 bps) | | (15 bps) |
Other consumer loans 90+ day delinquencies | | 1.26% | | 1.35% | | 1.48% | | (9 bps) | | (22 bps) |
Total stressed exposures to TCE |
| 0.76% |
| 0.68% |
| 0.81% |
| 8 bps |
| (5 bps) |
44 | WESTPAC GROUP 2023 INTERIM FINANCIAL RESULTS |
Segment reporting
Financial performance
First Half 2023 – First Half 2022
Net profit grew 7% to $1,763 million.
Pre-provision profit grew 15% to $2,689 million. This was driven by a 6% increase in net operating income, supported by higher net interest margins, and a 3% decline in operating expenses, reflecting disciplined cost management.
Net interest income up 7% |
| ● Net loans increased by 3% to $479.8 billion. Mortgage growth of 3% was entirely driven by owner occupied mortgages. The mortgage origination platform was operational for our bankers and broker network towards the end of the period with 92% of loans settled on the platform in March 2023. Customer preference continued to shift towards variable rate mortgages which accounted for 95% of new mortgages during the period, up from 61% in the prior corresponding period. Other consumer lending was flat with a rise in card balances offset by a decline in other personal lending; ● Deposits grew by 6% to $293.6 billion, reflecting competitive positioning. With higher interest rates, customers showed increased preference for term deposits and higher interest bearing savings accounts. Term deposits increased by 27% and comprised 22% of total deposits, up from 18% in March 2022. At call deposits increased by 2%, accounting for 60% of total deposits. Mortgage offset balances increased 1%; and ● The net interest margin expanded 9 basis points with higher interest rates widening deposit spreads and returns on both capital balances and hedged deposits. This more than offset contracting loan spreads which remained under pressure from intense competition for both new mortgages and the retention of existing customers, and portfolio mix changes with growth concentrated in lower spread owner occupied lending. |
Non-interest income down 8% |
| ● Non-interest income declined by 8% to $297 million reflecting: – The non-recurrence of a $25 million milestone payment received from the distribution agreement for general insurance in First Half 2022; and – Lower mortgage discharge settlement fees due to the slowing property market. This was partly offset by lower remediation payments. |
Expenses down 3% |
| ● Operating expenses reduced by 3% to $2,301 million from: –The benefit of a simpler organisational structure; – A smaller branch footprint supported by our branch transformation program which included the closure of 115 branches and the establishment of 36 new co-located branches; and – The completion of risk and regulatory programs. |
Impairment charge of $170m |
| ● The impairment charge was 7 basis points of average loans, compared to a 1 basis point impairment benefit in the prior corresponding period. The charge reflected the increase in CAP due to some deterioration in early cycle delinquencies in the mortgage and consumer finance portfolios. In contrast, the impairment benefit in prior corresponding period was due to significant improvement in 90+ day delinquencies following a reduction in the hardship portfolio as customers completed their serviceability period while others exited COVID-19 support. ● Credit quality metrics improved with stressed exposures to TCE down 5 basis points. Mortgage 90+ day delinquencies were down 15 basis points to 0.73%, reflecting the reduction in the hardship portfolio as customers completed their serviceability period. |
45 |
Segment reporting
First Half 2023 – Second Half 2022
Net profit grew 7% to $1,763 million.
Pre-provision profit increased 4% to $2,689 million. Excluding Notable Items, all of which were in the prior period, pre-provision profit increased by 2%. This was driven by a 2% increase in net operating income from higher net interest margins, partly offset by a 2% increase in operating expenses.
Net interest income up 2% |
| ● Net loans increased by 1% to $479.8 billion, entirely driven by mortgage growth in owner occupied lending. This reflected mortgage system growth of 0.5 times for the period. The slower mortgage growth relative to prior periods was attributable to a combination of slowing system credit growth with new lending declining $7 billion, given uncertainty in the housing market following a cumulative rise in the cash rate of 3.5% since May 2022, and decisions taken to manage the impacts of intense competition. Customers’ preference for variable rate mortgages remained elevated, comprising 95% of new mortgage flow, up from 89% in the prior period. This has taken the proportion of variable rate mortgages within the portfolio to 67%, up from 63% in the prior period. Despite the rise, the overall proportion of variable rate mortgages is yet to return to pre 2020 levels. Personal loans and consumer credit cards increased 1%; ● Deposits increased by 5% to $293.6 billion, supported by competitive positioning. Growth in higher interest bearing at call savings and term deposits offset the decline in transaction account balances and reflected changing customer preferences in a rising rate environment; and ● The net interest margin was up 2 basis points with higher interest rates supporting wider deposit spreads and returns on both capital balances and hedged deposits. These improvements were partly offset by lower mortgage spreads reflecting competitive pressures for both retaining existing customers and attracting new customers. |
Non-interest income up 3% |
| ● Non-interest income increased by 3% to $297 million. Lower remediation payments more than offset a reduction in mortgage discharge settlement fees due to a slowing property market. |
Expenses down 1% |
| ● Operating expenses declined by 1% to $2,301 million. Excluding Notable Items, all of which occurred in the prior half, expenses increased by 2% driven by branch transformation costs and higher staff expenses reflecting salary increases and additional FTE to enhance service levels; and ● The increase in expenses excluding Notable Items was partly mitigated by cost savings achieved from the branch transformation program and our simplified organisation structure. This included expanding co-located branches to 46 while closing 66 branches. |
Impairment charge of $170m |
| ● The impairment charge was 7 basis points of average loans compared to 10 basis points in the prior period. The charge was driven by CAP reflecting some deterioration in early cycle mortgage and consumer finance portfolio delinquencies, notwithstanding an improvement in 90+ day delinquencies. The higher charge in the prior period was due to an update to modelled economic scenarios for the mortgage portfolio. ● The increase in stressed exposures to TCE of 8 basis points to 0.76% was due to a regulatory change requiring an extension to the period over which exposures remain classified as non-performing before potential reclassification to performing, which we have not restated prior periods for. ● Mortgage 90+ day delinquencies improved by 2 basis points to 0.73% due to a reduction in the hardship portfolio as customers completed their serviceability period. Other consumer 90+ day delinquencies improved 9 basis points with the personal loan portfolio generating most of the improvement. |
46 | WESTPAC GROUP 2023 INTERIM FINANCIAL RESULTS |
Segment reporting
2.1.2Business
The Business segment provides a range of banking services and products to Australian small and commercial businesses, generally up to $200 million in exposure. This includes specialist services such as cash flow finance, equipment finance and property finance. Business operates under the Westpac, St.George, and Bank of Melbourne brands.
| | | | | | | | | | |
| | Half Year | | Half Year | | Half Year | | % Mov’t | ||
| | March | | Sept | | March | | Mar 23 | | Mar 23 |
$m |
| 2023 |
| 2022 |
| 2022 |
| - Sept 22 |
| - Mar 22 |
Net interest income |
| 2,043 |
| 1,704 |
| 1,323 |
| 20 |
| 54 |
Non-interest income |
| 165 |
| 167 |
| 165 |
| (1) |
| - |
Net operating income |
| 2,208 |
| 1,871 |
| 1,488 |
| 18 |
| 48 |
Operating expenses |
| (914) |
| (915) |
| (984) |
| - |
| (7) |
Total operating expenses | | (914) | | (915) | | (984) | | - | | (7) |
Pre-provision profit |
| 1,294 |
| 956 |
| 504 |
| 35 |
| 157 |
Impairment (charges)/benefits |
| (78) |
| 15 |
| (158) |
| large |
| (51) |
Profit before income tax expense |
| 1,216 |
| 971 |
| 346 |
| 25 |
| large |
Income tax expense and NCI |
| (365) |
| (292) |
| (107) |
| 25 |
| large |
Net profit |
| 851 |
| 679 |
| 239 |
| 25 |
| large |
| | | | | | | | | | |
Expense to income ratio (Ex Notable Items) | | 41.39% | | 48.90% | | 66.13% | | large | | large |
Net interest margin (Ex Notable Items) |
| 4.78% | | 4.07% | | 3.33% | | 71 bps |
| 145 bps |
| | | | | | | | | | |
| | As at | | As at | | As at | | % Mov’t | ||
| | 31 March | | 30 Sept | | 31 March | | Mar 23 |
| Mar 23 |
$bn |
| 2023 |
| 2022 |
| 2022 |
| - Sept 22 |
| - Mar 22 |
Customer deposits | | | | | | | | | | |
At call | | 95.1 | | 104.2 | | 109.5 | | (9) | | (13) |
Term |
| 38.2 |
| 29.0 |
| 25.1 |
| 32 |
| 52 |
Non-interest bearing |
| 0.1 |
| 0.1 |
| 0.1 |
| - |
| - |
Total customer deposits |
| 133.4 |
| 133.3 |
| 134.7 |
| - |
| (1) |
Loans |
| |
| |
| |
| |
| |
Business |
| 87.0 |
| 86.3 |
| 82.4 |
| 1 |
| 6 |
Provisions |
| (1.4) |
| (1.4) |
| (1.5) |
| - |
| (7) |
Total loans |
| 85.6 |
| 84.9 |
| 80.9 |
| 1 |
| 6 |
Deposit to loan ratio | | 155.95% | | 157.06% | | 166.42% | | (111 bps) | | large |
Total assets | | 87.8 | | 87.1 | | 83.2 | | 1 | | 6 |
TCE | | 113.1 | | 111.1 | | 106.6 | | 2 | | 6 |
Average interest earning assets | | 85.8 | | 83.5 | | 79.6 | | 3 | | 8 |
Average allocated capital | | 8.4 | | 8.2 | | 7.9 | | 2 | | 6 |
Credit quality | | | | | | | | | | |
Impairment charges/(benefits) to average loans | | 0.18% | | (0.04%) | | 0.40% | | large | | (22 bps) |
Business: impaired exposures to TCE | | 0.49% | | 0.52% | | 0.60% | | (3 bps) | | (11 bps) |
Total stressed exposures to TCE |
| 4.85% |
| 5.05% |
| 5.07% |
| (20 bps) |
| (22 bps) |
47 |
Segment reporting
Financial performance
First Half 2023 – First Half 2022
Net profit grew to $851 million.
Pre-provision profit grew 157% to $1,294 million. The increase was driven by a 48% growth in net operating income to $2,208 million as higher interest rates supported deposit spreads, and a 7% reduction in operating expenses to $914 million following the completion of several regulatory and compliance programs.
|
|
|
|
Net interest income up 54% | · | Net loans increased by 6% to $85.6 billion with most of the growth in commercial property and agriculture lending; | |
· | Deposits decreased by 1% to $133.4 billion reflecting the initial impacts felt by business from higher interest rates and inflation. There was a shift to term deposits which now comprise 29% of total customer deposits, up from 19% in the prior corresponding period. Conversely, there were declines in both savings accounts and low rate transaction accounts; and | ||
· | The net interest margin was up 145 basis points supported by the larger deposit portfolio relative to lending, reflected in a deposit to loan ratio of 156%. Rising interest rates supported higher deposit spreads and returns on both capital and hedged deposits. This was partly offset by loan spreads continuing to narrow due to ongoing competition. | ||
Non-interest income flat | · | Non-interest income was flat at $165 million. Lower remediation charges were offset by lower merchant income from higher interchange fees paid to card scheme providers. | |
Expenses down 7% | · | A 7% reduction in operating expenses to $914 million was achieved from: | |
| | - The completion of several regulatory and compliance programs, reducing overall regulatory spend, particularly the reliance on third parties; and | |
| | - Benefits of a simpler organisational structure, particularly head office functions and the reduction of corporate office space. | |
| ● | Staff costs remained flat as we reinvested savings to improve service levels. Continued wage growth also impacted staff costs. | |
Impairment charge of $78m | · | The impairment charge was 18 basis points of average loans compared to 40 basis points in the prior corresponding period. The charge reflected higher CAP due to deteriorating forward-looking economic forecasts to the prior period in particular the commercial property outlook, partly offset by the release of a portion of the construction overlay. The impairment charge was higher in the prior corresponding period primarily due to increased overlays for the construction sector to address inflationary pressures in light of supply chain and labour difficulties, along with the increase in the downside scenario weighting in First Half 2022. | |
· | Credit quality metrics improved with stressed exposures to TCE down 22 basis points to 4.85%, mostly reflecting a reduction in impaired and substandard exposures mostly within accommodation, cafes and restaurants and property services. | ||
48 | WESTPAC GROUP 2023 INTERIM FINANCIAL RESULTS |
Segment reporting
First Half 2023 – Second Half 2022
Net profit grew 25% to $851 million.
Pre-provision profit grew 35% to $1,294 million. The 18% increase in net operating income to $2,208 million reflected wider deposit margins, supported by higher interest rates, while operating expenses were stable at $914 million, highlighting disciplined cost management in an inflationary environment.
Net interest income up 20% | · | Net loans increased by 1% with growth in the commercial property sector; |
· | Deposits were flat with a significant mix shift from savings and low-rate transaction accounts towards higher rate term deposits. Term deposits accounted for 29% of total customer deposits compared to 22% in the prior period; and | |
· | The net interest margin increased by 71 basis points driven by higher deposit spreads and returns on capital and hedged deposits as interest rates increased. Ongoing lending competition resulted in continued loan spread compression. The large rise in the net interest margin was supported by the larger deposit portfolio relative to lending. | |
Non-interest income down 1% | · | The 1% decline in non-interest income to $165 million reflects: |
- Lower merchant income due to higher interchange fees; and | ||
- Higher scheme incentives from increased spend absorbed some of the decline in merchant income. | ||
Expenses flat | · | Operating expenses were flat at $914 million. Movements included: |
| | - Lower staff expenses from a simplified organisational structure as head office functions were simplified; and |
| | - Increased investment spend across regulatory and operational risk management programs, and capabilities to improve service levels. |
Impairment charge of $78m | · | The impairment charge was 18 basis points of average loans compared to a 4 basis point benefit in the prior period. The charge reflected higher CAP due to the deteriorating forward-looking economic forecasts partly offset by the release of a portion of the overlay. |
· | Credit quality metrics improved with stressed exposures to TCE down 20 basis points to 4.85%, reflecting a reduction in stressed exposures within the accommodation, cafes and restaurants, and services sectors. |
49 |
Segment reporting
2.2 Westpac Institutional Bank (WIB)
WIB delivers a broad range of financial products and services to corporate, institutional and government customers. WIB operates through dedicated industry relationship and specialist product teams, with expert knowledge including in financial and debt capital markets. Customers are supported throughout Australia and via branches and subsidiaries located in New Zealand, New York, London and Singapore. WIB works with all operating divisions in the provision of markets related financial needs including foreign exchange and fixed interest solutions.
| | | | | | | | | | |
|
| Half Year |
| Half Year |
| Half Year |
| % Mov’t | ||
|
| March |
| Sept |
| March |
| Mar 23 |
| Mar 23 |
$m |
| 2023 |
| 2022 |
| 2022 |
| - Sept 22 |
| - Mar 22 |
Net interest income |
| 712 |
| 629 |
| 481 |
| 13 |
| 48 |
Non-interest income |
| 704 |
| 554 |
| 592 |
| 27 |
| 19 |
Net operating income |
| 1,416 |
| 1,183 |
| 1,073 |
| 20 |
| 32 |
Operating expenses |
| (617) |
| (607) |
| (581) |
| 2 |
| 6 |
Total operating expenses |
| (617) |
| (607) |
| (581) |
| 2 |
| 6 |
Pre-provision profit |
| 799 |
| 576 |
| 492 |
| 39 |
| 62 |
Impairment (charges)/benefits |
| 4 |
| (27) |
| (58) |
| large |
| large |
Profit before income tax expense |
| 803 |
| 549 |
| 434 |
| 46 |
| 85 |
Income tax expense and NCI |
| (229) |
| (168) |
| (128) |
| 36 |
| 79 |
Net profit |
| 574 |
| 381 |
| 306 |
| 51 |
| 88 |
| | | | | | | | | | |
Expense to income ratio (Ex Notable Items) |
| 43.57% | | 51.31% | | 54.15% | | large |
| large |
Net interest margin (Ex Notable Items) |
| 1.46% | | 1.34% | | 1.17% | | 12 bps |
| 29 bps |
| | | | | | | | | | |
|
| As at |
| As at |
| As at |
| % Mov’t | ||
|
| 31 March |
| 30 Sept |
| 31 March |
| Mar 23 |
| Mar 23 |
$bn |
| 2023 |
| 2022 |
| 2022 |
| - Sept 22 |
| - Mar 22 |
Customer deposits |
|
|
|
|
|
|
|
|
|
|
At call |
| 72.5 |
| 75.7 |
| 71.9 |
| (4) |
| 1 |
Term |
| 39.3 |
| 40.1 |
| 31.7 |
| (2) |
| 24 |
Non-interest bearing |
| 0.9 |
| 0.8 |
| 1.1 |
| 13 |
| (18) |
Total customer deposits |
| 112.7 |
| 116.6 |
| 104.7 |
| (3) |
| 8 |
Loans |
|
|
|
|
|
|
|
|
|
|
Loans |
| 85.0 |
| 85.5 |
| 74.3 |
| (1) |
| 14 |
Provisions |
| (0.3) |
| (0.3) |
| (0.3) |
| - |
| - |
Total loans |
| 84.7 |
| 85.2 |
| 74.0 |
| (1) |
| 14 |
Deposit to loan ratio |
| 133.02% | | 136.83% | | 141.53% | | (381 bps) |
| large |
Total assets |
| 99.9 | | 106.1 | | 94.0 | | (6) |
| 6 |
TCE |
| 205.6 | | 199.3 | | 190.8 | | 3 |
| 8 |
Average interest earning assets |
| 98.0 | | 93.7 | | 82.6 | | 5 |
| 19 |
Average allocated capital |
| 8.3 | | 7.9 | | 7.7 | | 5 |
| 8 |
Credit quality |
|
| |
| |
| |
|
|
|
Impairment charges to average loans |
| (0.01%) | | 0.07% | | 0.16% | | large |
| large |
Impaired exposures to TCE |
| 0.06% | | 0.10% | | 0.14% | | (4 bps) |
| (8 bps) |
Total stressed exposures to TCE |
| 0.28% | | 0.35% | | 0.20% | | (7 bps) |
| 8 bps |
50 | WESTPAC GROUP 2023 INTERIM FINANCIAL RESULTS |
Segment reporting
Revenue contribution1
| | | | | | | | | | |
|
| Half Year |
| Half Year |
| Half Year |
| % Mov’t | ||
|
| March |
| Sept |
| March |
| Mar 23 |
| Mar 23 |
$m |
| 2023 |
| 2022 |
| 2022 |
| - Sept 22 |
| - Mar 22 |
Lending and deposit revenue |
| 970 |
| 913 |
| 799 |
| 6 |
| 21 |
Sales and risk management income |
| 435 |
| 348 |
| 348 |
| 25 |
| 25 |
DVA |
| 52 |
| (20) |
| (11) |
| large |
| large |
Other2 |
| (41) |
| (58) |
| (63) |
| (29) |
| (35) |
Total WIB revenue |
| 1,416 |
| 1,183 |
| 1,073 |
| 20 |
| 32 |
Financial performance
First Half 2023 – First Half 2022
Net profit grew 88% to $574 million.
Pre-provision profit increased by 62% to $799 million reflecting average interest earning asset growth, higher net interest margins and increased customer activity contributing to a better Markets performance. This resulted in a rise in net operating income of 32% to $1,416 million. Operating expenses grew 6% reflecting investments in our payments platform and customer service levels.
Net interest income up 48% | · | Net loans increased by 14% to $84.7 billion. Growth was from deepening relationships with existing customers and higher utilisation of credit facilities. There was also a benefit from increased corporate activity during 2022, including mergers and acquisitions. Loan growth was achieved across all sectors; |
· | Deposits increased by 8% to $112.7 billion, predominantly in corporate higher yielding term deposits; and | |
· | The net interest margin was up 29 basis points reflecting improved deposit spreads, returns on capital and higher Markets income. Loan spreads remained under competitive pressure. | |
Non-interest income up 19% | · | Non-interest income increased by 19% to $704 million supported by a $57 million positive impact from DVA reflecting tighter counterparty credit spreads earlier in the half. Excluding this benefit, non-interest income increased by 7% due to: |
- Improved Markets income from credit products which benefitted from tighter spreads and higher volumes due to more favourable market conditions, and higher customer volumes in FX; and | ||
- Increased origination and syndication fees reflecting elevated activity. | ||
| · | Following the increase in utilisation of lending facilities, lending fees declined although this fall was offset by higher net interest income. |
Expenses up 6% | · | Operating expenses increased 6% to $617 million reflecting: |
| | - Higher software amortisation costs; |
| | - Increased investment spend due to an increase in capability uplift investments such as the Corporate Cash Management Platform was partly offset by a reduction of Fix related investments; and |
| | - Higher employee expenses from maintaining customer service levels and continued wage pressure. |
Impairment benefit of $4m | · | The impairment benefit was 1 basis point of average loans compared to an impairment charge of 16 basis points in the prior corresponding period. The impairment benefit was due to higher write-backs and recoveries which more than offset the increase in CAP and new IAPs. The impairment charge was higher in the prior corresponding period primarily due to increased portfolio overlays and an increase to the downside scenario weight. |
· | Stressed exposures to TCE increased by 8 basis points to 0.28% mostly driven by higher watchlist and substandard exposures, while impaired exposures declined due write-backs. |
1.In First Half 2023, the presentation of markets related income has been revised:
a.DVA has been revised to include Funding Value Adjustment (FVA) and Credit Value Adjustment (CVA). Previously DVA included only CVA.
b.Sales and risk management income includes both customer and non-customer income. Comparatives have been restated.
2.Includes capital benefit and the Bank Levy.
51 |
Segment reporting
First Half 2023 – Second Half 2022
Net profit grew 51% to $574 million.
Pre-provision profit grew by 39% to $799 million. Net operating income increased by 20% to $1,416 million, supported by an improved Markets performance and higher interest rates. Operating expenses increased by 2% reflecting inflationary and wage pressure and ongoing investments.
Net interest income up 13% | · | Net loans decreased by 1% although average interest earning assets were up by 5% reflecting increased corporate activity in the prior half. The small decline in net loans was due to a reduction in the utilisation of credit facilities and refinancing activity, partly offset by new loan growth; |
· | Deposits decreased by 3% as customers chose to pay down debt in response to higher interest rates; and | |
· | The net interest margin widened by 12 basis points from a lift in Markets income, returns on capital and improved lending mix. | |
Non-interest income up 27% | · | Non-interest income was boosted by a $57 million benefit from derivative valuation adjustments reflecting tighter counterparty credit spreads. Excluding this benefit, non- interest income increased by 13% due to: |
- Improved Markets income, predominantly from tighter credit spreads reflecting more favourable conditions for most of the half and higher volumes; and | ||
- Increased origination and syndication activity from supportive market conditions. | ||
Expenses up 2% | · | Operating expenses increased by 2% to $617 million. Movements included: |
| | - Higher software amortisation costs; |
| | - Increased investment spend due to an increase in capability uplift investments partly offset by a reduction of risk and regulatory related investments; and |
| | - Higher employee expenses from wage pressure and an increase in FTE to maintain customer service levels. |
| ● | Benefits from cost reset activities such as simplification and operating model changes partly offset the increases. |
Impairment benefit of $4m | · | The impairment benefit was 1 basis point of average loans compared to an impairment charge of 7 basis points in the prior period. The benefit was driven by higher write-backs and recoveries which fully offset the increase in CAP and new IAPs; and |
· | Stressed exposures to TCE decreased by 7 basis points to 0.28%, mainly due to a reduction in impaired exposures within manufacturing and watchlist exposures within the services sector. |
52 | WESTPAC GROUP 2023 INTERIM FINANCIAL RESULTS |
Segment reporting
2.3 Westpac New Zealand
Westpac New Zealand provides banking and wealth products and services for consumer, business and institutional customers in New Zealand. New Zealand maintains its own infrastructure, including technology, operations and treasury.
All figures are in NZ$ unless noted otherwise.
| | | | | | | | | | |
|
| Half Year |
| Half Year |
| Half Year |
| % Mov’t | ||
|
| March |
| Sept |
| March |
| Mar 23 |
| Mar 23 |
NZ$m |
| 2023 |
| 2022 |
| 2022 |
| - Sept 22 |
| - Mar 22 |
Net interest income |
| 1,246 |
| 1,185 |
| 1,095 |
| 5 |
| 14 |
Non-interest income |
| 126 |
| 145 |
| 161 |
| (13) |
| (22) |
Notable Items |
| - |
| (13) |
| 140 |
| (100) |
| (100) |
Net operating income |
| 1,372 |
| 1,317 |
| 1,396 |
| 4 |
| (2) |
Operating expenses |
| (624) |
| (594) |
| (564) |
| 5 |
| 11 |
Total operating expenses |
| (624) |
| (594) |
| (564) |
| 5 |
| 11 |
Pre-provision profit |
| 748 |
| 723 |
| 832 |
| 3 |
| (10) |
Impairment (charges)/benefits |
| (154) |
| 17 |
| 10 |
| large |
| large |
Profit before income tax expense |
| 594 |
| 740 |
| 842 |
| (20) |
| (29) |
Income tax expense and NCI |
| (168) |
| (212) |
| (202) |
| (21) |
| (17) |
Net profit |
| 426 |
| 528 |
| 640 |
| (19) |
| (33) |
Notable Items (post tax) |
| - |
| (9) |
| 136 |
| (100) |
| (100) |
Profit/(loss) attributable to businesses sold |
| - |
| - |
| 19 |
| - |
| (100) |
| | | | | | | | | | |
Expense to income ratio (Ex Notable Items) |
| 45.48% | | 44.66% | | 44.90% | | 82 bps |
| 58 bps |
Net interest margin (Ex Notable Items) |
| 2.10% | | 2.04% | | 1.96% | | 6 bps |
| 14 bps |
| | | | | | | | | | |
|
| As at |
| As at |
| As at |
| % Mov’t | ||
|
| 31 March |
| 30 Sept |
| 31 March |
| Mar 23 |
| Mar 23 |
NZ$bn |
| 2023 |
| 2022 |
| 2022 |
| - Sept 22 |
| - Mar 22 |
Customer deposits |
|
|
|
|
|
|
|
|
|
|
At call |
| 30.3 |
| 31.2 |
| 32.5 |
| (3) |
| (7) |
Term |
| 36.4 |
| 32.3 |
| 30.1 |
| 13 |
| 21 |
Non-interest bearing |
| 13.1 |
| 14.4 |
| 15.8 |
| (9) |
| (17) |
Total customer deposits |
| 79.8 |
| 77.9 |
| 78.4 |
| 2 |
| 2 |
Loans |
|
|
|
|
|
|
|
|
|
|
Mortgages |
| 65.2 |
| 63.8 |
| 62.2 |
| 2 |
| 5 |
Business |
| 32.3 |
| 32.2 |
| 31.0 |
| - |
| 4 |
Other |
| 1.2 |
| 1.2 |
| 1.2 |
| - |
| - |
Provisions |
| (0.5) |
| (0.4) |
| (0.4) |
| 25 |
| 25 |
Total loans |
| 98.2 |
| 96.8 |
| 94.0 |
| 1 |
| 4 |
Deposit to loan ratio |
| 81.26% | | 80.48% | | 83.40% | | 78 bps |
| (214 bps) |
Total assets |
| 122.0 | | 118.9 | | 116.5 | | 3 |
| 5 |
TCE |
| 147.3 | | 144.6 | | 141.8 | | 2 |
| 4 |
Liquid assets |
| 20.5 | | 18.4 | | 19.3 | | 11 |
| 6 |
Average interest earning assets |
| 118.8 | | 115.8 | | 111.8 | | 3 |
| 6 |
Average allocated capital |
| 7.5 | | 7.4 | | 7.0 | | 1 |
| 7 |
Total funds |
| 11.5 | | 10.9 | | 11.7 | | 6 |
| (2) |
Credit quality |
|
| |
| |
| |
|
|
|
Impairment charges/(benefits) to average loans |
| 0.32% | | (0.04%) | | (0.02%) | | large |
| large |
Mortgage 90+ day delinquencies |
| 0.29% | | 0.22% | | 0.30% | | 7 bps |
| (1 bps) |
Other consumer loans 90+ day delinquencies |
| 1.13% | | 1.03% | | 1.42% | | 10 bps |
| (29 bps) |
Impaired exposures to TCE |
| 0.07% | | 0.06% | | 0.06% | | 1 bps |
| 1 bps |
Total stressed exposures to TCE |
| 1.33% | | 0.97% | | 1.14% | | 36 bps |
| 19 bps |
53 |
Segment reporting
Financial performance (NZ$)
First Half 2023 – First Half 2022
Net profit decreased 33% to $426 million.
Pre-provision profit decreased by 10% to $748 million. Notable Items impacted pre-provision profit in the First Half 2022 which included the gain on the sale of NZ life insurance. Excluding Notable Items, pre-provision profit grew by 8% with higher margins and balance sheet growth driving a 14% increase in net interest income. This offset an 11% increase in operating expenses due to higher risk and regulatory spend.
● ● | ||
Net interest income up 14% |
| ● Net loans increased by 4% to $98.2 billion. Mortgage growth of 5% to $65 billion was 1.4x system. Growth was primarily driven in fixed rate owner occupied mortgages, reflecting New Zealand’s mortgage market being largely fixed rate. Business loans increased by 4% to $32 billion with growth largely in the utilities and wholesale trade sectors; ● Deposits grew by 2% to $79.8 billion. Growth was driven from an increase in term deposits as customer preferences shifted towards higher rate accounts as interest rates increased. As a result, savings and transaction accounts both declined. Term deposits now account for 46% of customer deposits, up from 38% in the prior corresponding period, but down on pre COVID-19 levels of ~50%; and ● The net interest margin was up 14 basis points with rising interest rates improving deposit spreads and returns on capital balances. Loan spreads continued to decline due to a competitive mortgage market. |
Non-interest income down 22% |
| ● The 22% reduction in non-interest income to $126 million was due to: – The loss of income following the divestment of NZ life insurance; and – Lower card income of $7 million from a reduction in interchange fees reflecting regulatory changes which came into effect in November 2022, impacting nearly 5 months of the period. |
Expenses up 11% |
| ● Operating expenses increased by 11% to $624 million reflecting: – Higher investments in risk and regulatory projects, including RBNZ’s BS11 outsourcing policy; and – A 12% increase in FTE to support these projects and the continued strengthening of our technology foundations along with inflationary pressures. |
Impairment charge of $154m |
| ● The impairment charge was 32 basis points of average loans compared to a 2 basis point benefit in the prior corresponding period. The charge reflected higher CAP attributable to a weather related portfolio overlay of $66 million, along with a deterioration in the economic outlook and early cycle consumer delinquencies. ● Stress exposures to TCE increased 19 basis points due to downgrade of a small number of exposures to stressed. |
54 | WESTPAC GROUP 2023 INTERIM FINANCIAL RESULTS |
Segment reporting
First Half 2023 – Second Half 2022
Net profit declined by 19% to $426 million.
Pre-provision profit increased by 3% to $748 million. Excluding Notable Items, pre-provision profit was up by 2%. Net operating income rose by 4% to $1,372 million which more than offset the 5% growth in operating expenses to $624 million.
Net interest income up 5% |
| ● Net loans grew by 1%. Mortgage growth of 2% was 1.3x of system and primarily in fixed rate owner occupied loans. Business loans were flat; ● Deposits increased by 2% fully funding new loan growth. The growth was well above system which was relatively flat. The shift in customer preference towards higher rate products saw term deposits grow by 13% while at call deposits contracted in the period. Term deposits accounted for 46% of customer deposits, up from 41% in the prior period; and ● The net interest margin improved by 6 basis points. The increase was driven by higher deposit spreads and larger returns on capital. Loan spreads continued to remain under pressure from mortgage competition. |
Non-interest income down 13% |
| ● The 13% reduction in non-interest income to $126 million predominantly reflects declining card income due to lower interchange fees following new credit card regulation effective November 2022. |
Expenses up 5% |
| ● Operating expenses increased by 5% to $624 million reflecting investments in risk and regulatory projects including RBNZ’s BS11 outsourcing policy and a 6% increase in FTE to support technology enhancements and other projects. |
Impairment charge of $154m |
| ● The impairment charge was 32 basis points of average loans compared to 4 basis points benefit in the prior period. The charge was driven by higher CAP attributable to a weather related portfolio overlay of $66 million, along with a deterioration in the economic outlook and an increase in consumer delinquencies. ● Stress exposures to TCE increased by 36 basis points to 1.33% due to downgrades to watchlist exposures along with a rise in consumer 90+ day delinquencies reflecting the impact of higher inflation and interest rates on customers. |
55 |
Segment reporting
2.3.1Westpac New Zealand segment performance (A$ Equivalent)
Results have been translated into Australian dollars (A$) at the average exchange rates for each reporting period, First Half 2023: $1.0876 (Second Half 2022: $1.1067; First Half 2022: $1.0593). Unless otherwise stated, assets and liabilities have been translated at spot rates as at the end of the period, 31 March 2023: $1.0678 (30 September 2022: $1.1354; 31 March 2022: $1.0759).
| | | | | | | | | | |
|
| Half Year |
| Half Year |
| Half Year |
| % Mov’t | ||
|
| March |
| Sept |
| March |
| Mar 23 |
| Mar 23 |
$m |
| 2023 |
| 2022 |
| 2022 |
| - Sept 22 |
| - Mar 22 |
Net interest income |
| 1,145 |
| 1,073 |
| 1,034 |
| 7 |
| 11 |
Non-interest income |
| 116 |
| 128 |
| 151 |
| (9) |
| (23) |
Notable Items |
| - |
| (12) |
| 132 |
| (100) |
| (100) |
Net operating income |
| 1,261 |
| 1,189 |
| 1,317 |
| 6 |
| (4) |
Operating expenses |
| (574) |
| (538) |
| (534) |
| 7 |
| 7 |
Total operating expenses |
| (574) |
| (538) |
| (534) |
| 7 |
| 7 |
Pre-provision profit |
| 687 |
| 651 |
| 783 |
| 6 |
| (12) |
Impairment (charges)/benefits |
| (142) |
| 16 |
| 9 |
| large |
| large |
Profit before income tax expense |
| 545 |
| 667 |
| 792 |
| (18) |
| (31) |
Income tax expense and NCI |
| (154) |
| (192) |
| (190) |
| (20) |
| (19) |
Net profit |
| 391 |
| 475 |
| 602 |
| (18) |
| (35) |
Notable Items (post tax) |
| - |
| (10) |
| 129 |
| (100) |
| (100) |
Profit/(loss) attributable to businesses sold |
| - |
| - |
| 18 |
| - |
| (100) |
| | | | | | | | | | |
Expense to income ratio (Ex Notable Items)1 |
| 45.48% | | 44.66% | | 44.90% | | 82 bps |
| 58 bps |
Net interest margin (Ex Notable Items)1 |
| 2.10% | | 2.04% | | 1.96% | | 6 bps |
| 14 bps |
| | | | | | | | | | |
| | As at | | As at | | As at | | % Mov’t | ||
| | March | | Sept | | March | | Mar 23 |
| Mar 23 |
$bn |
| 2023 |
| 2022 |
| 2022 |
| - Sept 22 |
| - Mar 22 |
Customer deposits |
| 74.7 | | 68.6 | | 72.8 | | 9 | | 3 |
Loans |
| 91.9 | | 85.3 | | 87.4 | | 8 | | 5 |
Deposit to loan ratio1 | | 81.26% | | 80.48% | | 83.40% | | 78 bps | | (214 bps) |
Total assets | | 114.2 | | 104.7 | | 108.2 | | 9 | | 6 |
TCE | | 137.9 | | 127.3 | | 131.8 | | 8 | | 5 |
Liquid assets | | 19.2 | | 16.2 | | 18.0 | | 19 | | 7 |
Average interest earning assets2 | | 109.3 | | 104.6 | | 105.6 | | 4 | | 4 |
Average allocated capital2 |
| 6.9 | | 6.6 | | 6.6 | | 5 | | 5 |
Total funds |
| 10.7 | | 9.6 | | 10.9 | | 11 | | (2) |
1. | Ratios calculated using NZ$. |
2. | Averages are converted at applicable average rates. |
56 | WESTPAC GROUP 2023 INTERIM FINANCIAL RESULTS |
Segment reporting
2.4 | Specialist Businesses |
Specialist Businesses was established in May 2020 by combining the operations that Westpac identified to be exited as part of its portfolio simplification agenda. Since its formation, nine business divestments, including two in 2023, have been completed. The merger of BT’s personal and corporate superannuation funds with Mercer Super Trust through an SFT and the sale of its AAML business to Mercer (Australia) were completed. The remaining operations include BT Platforms, Westpac Pacific, margin lending and the retail auto finance business (which is in run-off).
| | | | | | | | | | |
|
| Half Year |
| Half Year |
| Half Year |
| % Mov’t | ||
| | March | | Sept | | March | | Mar 23 | | Mar 23 |
$m | | 2023 | | 2022 | | 2022 | | - Sept 22 |
| - Mar 22 |
Net interest income |
| 216 |
| 232 |
| 242 |
| (7) |
| (11) |
Non-interest income |
| 393 |
| 418 |
| 442 |
| (6) |
| (11) |
Notable Items |
| 243 |
| (1,120) |
| 109 |
| large |
| 123 |
Net operating income |
| 852 |
| (470) |
| 793 |
| large |
| 7 |
Operating expenses |
| (280) |
| (313) |
| (370) |
| (11) |
| (24) |
Notable Items |
| - |
| (150) |
| (215) |
| (100) |
| (100) |
Total operating expenses |
| (280) |
| (463) |
| (585) |
| (40) |
| (52) |
Pre-provision profit |
| 572 |
| (933) |
| 208 |
| large |
| 175 |
Impairment (charges)/benefits |
| (2) |
| 29 |
| 38 |
| large |
| large |
Profit before income tax expense |
| 570 |
| (904) |
| 246 |
| large |
| 132 |
Income tax expense and NCI |
| (77) |
| 49 |
| (114) |
| large |
| (32) |
Net profit/(loss) |
| 493 |
| (855) |
| 132 |
| large |
| large |
Notable Items (post tax) |
| 256 |
| (1,112) |
| (114) |
| large |
| large |
Profit/(loss) attributable to businesses sold |
| 111 |
| 74 |
| 94 |
| 50 |
| 18 |
| | | | | | | | | | |
Expense to income ratio (Ex Notable Items) |
| 45.98% | | 48.15% | | 54.09% | | (217 bps) |
| large |
Net interest margin (Ex Notable Items) |
| 4.07% | | 3.70% | | 3.45% | | 37 bps |
| 62 bps |
| | | | | | | | | | |
| | As at | | As at | | As at | | % Mov’t | ||
| | 31 March | | 30 Sept | | 31 March | | Mar 23 | | Mar 23 |
$bn |
| 2023 |
| 2022 |
| 2022 |
| - Sept 22 |
| - Mar 22 |
Deposits |
| 10.0 |
| 9.5 |
| 8.4 |
| 5 |
| 19 |
Loans |
|
|
|
|
|
|
|
|
|
|
Loans |
| 8.4 |
| 10.2 |
| 12.0 |
| (18) |
| (30) |
Provisions |
| (0.3) |
| (0.3) |
| (0.3) |
| - |
| - |
Total loans |
| 8.1 |
| 9.9 |
| 11.7 |
| (18) |
| (31) |
Deposit to loan ratio |
| 124.24% | | 95.85% | | 71.29% | | large |
| large |
Total funds |
| 166.2 |
| 198.8 |
| 222.9 |
| (16) |
| (25) |
TCE |
| 12.2 |
| 13.8 |
| 15.4 |
| (12) |
| (21) |
Average interest earning assets |
| 10.7 |
| 12.5 |
| 14.1 |
| (14) |
| (24) |
Average allocated capital |
| 1.8 |
| 3.2 |
| 4.1 |
| (44) |
| (56) |
Average funds |
| 199.3 |
| 209.5 |
| 224.9 |
| (5) |
| (11) |
Credit quality |
|
|
|
|
|
|
|
|
|
|
Auto Finance 90 day+ delinquencies |
| 2.85% | | 2.33% | | 2.00% | | 52 bps |
| 85 bps |
Total stressed exposures to TCE |
| 9.20% | | 9.08% | | 6.98% | | 12 bps |
| 222 bps |
Net profit/(loss)
| | | | | | | | | | |
| | Half Year | | Half Year | | Half Year | | % Mov’t | ||
| | March | | Sept | | March | | Mar 23 | | Mar 23 |
$m |
| 2023 |
| 2022 |
| 2022 |
| - Sept 22 |
| - Mar 22 |
Businesses sold1,2 |
| 111 |
| 74 |
| 94 |
| 50 |
| 18 |
Remaining businesses1 |
| 126 |
| 183 |
| 152 |
| (31) |
| (17) |
Notable Items |
| 256 |
| (1,112) |
| (114) |
| large |
| large |
Net profit/(loss) |
| 493 |
| (855) |
| 132 |
| large |
| large |
1. | Excludes Notable Items. |
2. | First Half 2023 includes a completion adjustment of $18 million (post tax) in relation to the sale of WLIS and $37 million (post tax) in relation to the reimbursement of costs for the SFT. |
57 |
Segment reporting
Financial performance
First Half 2023 – First Half 2022
Net profit of $493 million compared to $132 million in the prior corresponding period.
Pre-provision profit of $572 million was $364 million higher, predominantly due to the positive impact of Notable Items, including the gain on sale of AAML in this half and asset write downs incurred in the prior corresponding period.
Excluding Notable Items and the impact of businesses sold, pre-provision profit decreased by 8% to $171 million. Net operating income decreased by 2% while operating expenses increased by 1%.
Net interest income down 11% |
| ● Excluding the impact of businesses sold, net interest income was down 8%. ● Net loans decreased by 31% to $8.1 billion primarily due to the run-off of the retail auto portfolio. Margin loans were also lower while loans in Westpac Pacific were slightly up. ● Deposits increased by 19% to $10.0 billion due to increased deposits on Platforms. Rising interest rates resulted in customers shifting their asset allocation on Platforms towards higher interest earning term deposits; and ● The net interest margin was up 62 basis points mostly from lower funding costs in the retail auto portfolio and higher Platforms deposit spreads as interest rates increased. |
Non-interest income down 11% |
| ● Non-interest income declined by 11% to $393 million; ● The reduction in income from businesses sold was $57 million due to: – Reduced funds under management income in Superannuation and AAML, $20 million; and – Lower income from businesses that were exited in the prior corresponding period, $37 million. ● Excluding businesses sold, non-interest income increased by 3% to $253 million. Movements included: – Higher merchant and FX transaction fees in Westpac Pacific from increased tourism; – Higher contributions from Platforms reflecting higher revenue from duration managed cash balances partly offset by lower funds under administration; and – Declining retail auto finance income from the run-off in loan balances. |
Expenses down 24% |
| ● Operating expenses declined by 24% to $280 million. Excluding the impact of businesses sold, expenses increased by 1% to $298 million predominantly due to spend required to prepare businesses for sale, partly offset by lower investment spend. |
Impairment charge of $2m |
| ● The impairment charge was 4 basis points of average loans compared to a 59 basis points benefit in the prior corresponding period. The charge reflected write-off directs in the auto finance portfolio which more than offset a CAP release. ● There was a rise in stressed exposures over the year, driven by an increase in watchlist exposures in Westpac Pacific. The rise in stressed exposures to TCE also reflects the impact of the run off in the auto finance portfolio. |
58 | WESTPAC GROUP 2023 INTERIM FINANCIAL RESULTS |
Segment reporting
First Half 2023 – Second Half 2022
Net profit of $493 million compared to a $855 million loss in the prior period.
Pre-provision profit of $572 million compared to a pre-provision loss of $933 million in the prior period. The turnaround was driven by the absence of the $1.1 billion loss on sale of Australian life insurance in the prior half and a gain on sale of AAML in this half.
Excluding Notable Items and the impact of businesses sold, pre-provision profit decreased by 22% to $171 million reflecting a 13% growth in operating expenses and a 3% decrease in net operating income.
Net interest income down 7% |
| ● Net loans declined by 18% reflecting the run-off of the retail auto portfolio; ● Deposits increased by 5% driven by higher deposits on Platforms. Rising interest rates saw a shift in customer preference towards higher interest rate term deposits which accounted for 31% of total deposits, up from 22% in the prior period. At call deposits declined by 6%; and ● The net interest margin was up 37 basis points due to wider deposit spreads in Platforms. |
Non-interest income down 6% |
| ● Non-interest income declined by 6% to $393 million; ● The reduction in income from businesses sold was $27 million due to: – Reduced funds under management income in Superannuation and AAML, $7 million; and – Lower income from businesses that were exited in the prior period, $20 million. ● Excluding businesses sold, non-interest income increased by 1% to $253 million. Drivers included: – Higher merchant income in Westpac Pacific from increased tourism and favourable FX translation impacts; – Reduced Platforms income partly offset by higher revenue from duration managed cash balances and impacts of higher equity markets; and – Lower income from auto finance due to a decline in fee income as the portfolio is in run-off. |
Expenses down 11% |
| ● Operating expenses declined by 11% to $280 million. Excluding the impact of businesses sold, operating expenses increased by 13% to $298 million reflecting spend required to prepare businesses for sale. Excluding these expenses, ongoing businesses were broadly flat. |
Impairment charge of $2m |
| ● The small impairment charge was 4 basis points of average loans compared to 52 basis points benefit in the prior period. The charge reflected write-off directs in the auto finance portfolio which more than offset a CAP release. ● Stressed exposures to TCE deteriorated by 12 basis points to 9.20%, mainly reflecting a reduction in the auto finance portfolio. |
59 |
Segment reporting
Superannuation, Platforms and Investments
| | | | | | | | | | | | | | | | | | |
| | As at | |
| |
| |
| |
| | As at | | % Mov’t | | As at | | % Mov’t |
| | 31 March | | | | | | Net | | Net | | 30 Sept | | Mar 23 | | 31 March | | Mar 23 |
$bn |
| 2023 |
| Inflows |
| Outflows |
| Flows |
| Mov’t |
| 2022 |
| - Sept 22 |
| 2022 |
| - Mar 22 |
Superannuation |
| 33.4 |
| 1.5 |
| (3.9) |
| (2.4) |
| (1.2) |
| 37.0 |
| (10) |
| 41.8 |
| (20) |
Platforms |
| 131.0 |
| 7.2 |
| (9.7) |
| (2.5) |
| 12.1 |
| 121.4 |
| 8 |
| 135.2 |
| (3) |
Packaged funds |
| 1.8 |
| 2.2 |
| (5.0) |
| (2.8) |
| (35.8) |
| 40.4 |
| (96) |
| 45.9 |
| (96) |
Total funds |
| 166.2 |
| 10.9 |
| (18.6) |
| (7.7) |
| (24.9) |
| 198.8 |
| (16) |
| 222.9 |
| (25) |
Packaged funds decreased by $38.6 billion compared to the prior period, primarily driven by $38.5 billion related to the sale of AAML.
On 31 March 2023, the Group entered into an agreement relating to the transition of its private portfolio management business (with funds under management of $1.9 billion as at 31 March 2023). This is expected to complete in calendar year 2023.
On 1 April 2023, the transfer of the members and benefits of BT Funds Management Limited’s personal and corporate (non-platform) superannuation of $33.4 billion to Mercer Super Trust was completed.
60 | WESTPAC GROUP 2023 INTERIM FINANCIAL RESULTS |
Segment reporting
2.5 | Group Businesses |
This segment comprises:
| ● | Treasury, which is responsible for the management of the Group’s balance sheet including wholesale funding, capital, and liquidity. Treasury also manages interest rate risk and foreign exchange risks inherent in the balance sheet, including managing the mismatch between Group assets and liabilities. Treasury’s earnings are primarily sourced from managing the Group’s Australian balance sheet and interest rate risk; |
| ● | Customer Services & Technology, which includes operations, call centres and technology. These costs are allocated to segments across the Group; |
| ● | Corporate Services1, which provides shared corporate functions such as property, procurement, finance services, corporate affairs, sustainability, and HR services. These costs are allocated to other segments across the Group; and |
| ● | Enterprise services, which includes earnings on capital not allocated to segments, certain intra-group transactions and gains/losses from asset sales, earnings and costs associated with the Group’s fintech investments, costs associated with customer remediation for the Advice business and other corporate expenses including centrally held provisions. |
| | | | | | | | | | |
| | Half Year | | Half Year | | Half Year | | % Mov’t | ||
| | March | | Sept | | March | | Mar 23 |
| Mar 23 |
$m |
| 2023 |
| 2022 |
| 2022 |
| - Sept 22 | | - Mar 22 |
Net interest income |
| 393 |
| 339 |
| 564 |
| 16 |
| (30) |
Non-interest income | | (6) | | 34 | | 36 | | large | | large |
Notable Items |
| (111) |
| 334 |
| 258 |
| large |
| large |
Net operating income |
| 276 |
| 707 |
| 858 |
| (61) |
| (68) |
Operating expenses | | (302) | | (412) | | (304) | | (27) | | (1) |
Notable Items |
| - |
| (174) |
| (16) |
| (100) |
| (100) |
Total operating expenses |
| (302) |
| (586) |
| (320) |
| (48) |
| (6) |
Pre-provision profit |
| (26) |
| 121 |
| 538 |
| large |
| large |
Impairment (charges)/benefits |
| (2) |
| (1) |
| 3 |
| 100 |
| large |
Profit before income tax expense |
| (28) |
| 120 |
| 541 |
| large |
| large |
Income tax expense and NCI |
| (43) |
| (31) |
| (186) |
| 39 |
| (77) |
Net profit/(loss) |
| (71) |
| 89 |
| 355 |
| large |
| large |
Notable Items (post tax) | | (78) | | 116 | | 164 | | large | | large |
Treasury
| | | | | | | | | | |
| | Half Year | | Half Year | | Half Year | | % Mov’t | ||
| | March | | Sept | | March | | Mar 23 |
| Mar 23 |
$m |
| 2023 |
| 2022 |
| 2022 |
| - Sept 22 | | - Mar 22 |
Net interest income |
| 220 |
| 335 |
| 554 |
| (34) |
| (60) |
Non-interest income |
| 6 |
| 9 |
| 12 |
| (33) |
| (50) |
Notable Items |
| (89) |
| 299 |
| 254 |
| large |
| large |
Net operating income |
| 137 |
| 643 |
| 820 |
| (79) |
| (83) |
Net profit |
| 66 |
| 422 |
| 547 |
| (84) |
| (88) |
Treasury Value at Risk (VaR)2
| | | | | | |
$m |
| Average |
| High |
| Low |
Half Year March 2023 |
| 60.8 |
| 73.0 |
| 50.6 |
Half Year Sept 2022 |
| 65.4 |
| 74.4 |
| 58.3 |
Half Year March 2022 |
| 64.4 |
| 72.8 |
| 54.6 |
| 1. | Corporate Services costs are partly allocated to other segments, while Group head office costs are retained in Group Businesses. |
| 2. | VaR includes trading book and banking book exposures. The banking book component includes interest rate risk, credit spread risk in liquid assets and other basis risks. |
61 |
Segment reporting
Financial performance
First Half 2023 - First Half 2022
Net loss of $71 million compared to $355 million profit in the prior corresponding period.
Pre-provision loss of $26 million, compared with $538 million pre-provision profit in the prior corresponding period. Excluding Notable Items, pre-provision profit was $85 million compared with $296 million profit in the prior corresponding period.
Net operating income down 36% | Excluding Notable Items, income was down 36% or $213 million, driven by: | |
· Market volatility impacting Treasury earnings; | ||
| | · Higher gains on sale of liquid assets in the prior corresponding period; and |
| | · Higher returns on capital balances partly offset the decline. |
Operating expenses down 1% | | Excluding Notable Items, expenses were down 1% or $2 million. Movements, primarily included: |
| | · Lower consulting and third party costs, as several strategic projects completed; and |
| · Largely offset by higher employee benefits remediation costs. |
First Half 2023 - Second Half 2022
Net loss of $71 million compared to $89 million profit in the prior period.
There was a pre-provision loss of $26 million, compared with $121 million pre-provision profit for the prior half. Excluding Notable Items, pre-provision profit was $85 million compared with $39 million loss in the prior period.
Net operating income up 4%% | | Excluding Notable Items, income was up 4% or $14 million. Movements included: |
| · Higher interest rates increasing returns on capital balances. | |
| · Lower Treasury earnings from market volatility partly offset this benefit. | |
Operating expenses down 27% | | Excluding Notable Items, expenses were down 27% or $110 million, driven by: |
| · A reduction in costs for the Banking as a Service (BaaS) platform following the partial impairment in the prior period; and | |
| · Lower consulting and third party spend driven by completion of activities within the CORE program. |
Table of contents
3.0 | 2023 Interim financial report |
| | | |
63 | |||
| | | |
82 | |||
| | | |
83 | |||
| | | |
84 | |||
| | | |
85 | |||
| | | |
86 | |||
| | | |
87 | |||
| | | |
| 87 | ||
| | | |
| 88 | ||
| | | |
| Net interest income and average balance sheet and interest rates | 92 | |
| | | |
| 94 | ||
| | | |
| 95 | ||
| | | |
| 96 | ||
| | | |
| 96 | ||
| | | |
| 97 | ||
| | | |
| 97 | ||
| | | |
| 101 | ||
| | | |
| 103 | ||
| | | |
| 104 | ||
| | | |
| Provisions, contingent liabilities, contingent assets and credit commitments | 109 | |
| | | |
| 114 | ||
| | | |
| 116 | ||
| | | |
| 118 | ||
| | | |
| 118 | ||
| | | |
119 | |||
3.1Directors’ report
The Directors of Westpac present their report together with the financial statements of Westpac and its controlled entities (collectively referred to as ‘the Group’) for the half year ended 31 March 2023.
Directors
The names of the Directors of Westpac holding office at any time during, and since the end of, the half year and the period for which each has served as a Director are set out below:
| | |
Name |
| Position |
John McFarlane |
| Director since February 2020 and Chairman since April 2020. |
Peter King |
| Managing Director and Chief Executive Officer since December 2019. |
Tim Burroughs | | Director since March 2023. |
Nerida Caesar |
| Director since September 2017. |
Audette Exel AO |
| Director since September 2021. |
Michael Hawker AM | | Director since December 2020. |
Christopher Lynch |
| Director since September 2020. |
Peter Nash |
| Director since March 2018. |
Nora Scheinkestel |
| Director since March 2021. |
Margaret Seale |
| Director since March 2019. |
Michael Ullmer AO | | Director since April 2023. |
Peter Marriott |
| Retired 14 December 2022. Director since June 2013. |
Review and results of the Group’s operations
Net Profit attributable to owners of Westpac for First Half 2023 was $4,001 million, 22% higher than First Half 2022. Compared to Second Half 2022, net profit was 66% higher.
Before impairment charges and income tax expense, profit was 24% higher than First Half 2022 from an 8% increase in operating revenue and a 7% reduction in expenses. This reflects the benefit of higher net interest margin and growth in mortgages and business lending along with continued cost discipline and lower asset write-downs.
A summary of the movements in the major line items in Net Profit for First Half 2023 compared to First Half 2022 is discussed below.
Net interest income was $825 million higher, with a 7% increase in average interest earning assets and a 5 basis point (bps) increase in net interest margin. Contributors to the movement in net interest margin included:
| ● | Higher deposit spreads from higher interest rates and higher earnings on hedged deposits; |
| ● | Increased benefits on capital balances as a result of higher interest rates; |
| ● | Lower spreads on mortgages and business lending due to competition to attract new and retain existing customers; |
| ● | An increase in liquid assets which have lower yields to support the reduction of the committed liquidity facility; |
| ● | Unrealised losses on fair value economic hedges in First Half 2023 compared to gains in First Half 2022; and |
| ● | A decrease in Treasury and Markets income reflecting a contraction in short-term funding spreads, lower realised gains on liquid assets. |
Non-interest income was $52 million lower compared to First Half 2022, mostly due to a reduction in revenue from businesses sold.
Operating expenses were $385 million, or 7% lower compared to First Half 2022. The decrease was due to:
| ● | Asset write-downs were $177 million lower due to the elevated write-downs in First Half 2022; |
| ● | A reduction in depreciation and amortisation of assets of $92 million; and |
| ● | Lower staff costs of $90 million from a reduction in average FTE and lower restructuring costs. This was partly offset by higher average salaries. |
Impairment charges were $390 million compared to $139 million in First Half 2022, impacted by a weakening forward-looking economic indicators, rising early cycle delinquencies and an increase in stress in the New Zealand business portfolio in First Half 2023. Most credit quality metrics improved compared to First Half 2022.
The effective tax rate was 28.8%. This was lower than the 30.4% effective tax rate in First Half 2022 due to tax losses in First Half 2023 compared to tax gains in First Half 2022 from businesses sold.
The Board has determined an interim dividend of 70 cents per share, which will be fully franked.
A review of the operations and results of the Group and its segments for the half year ended 31 March 2023 is set out in Section 1 and Section 2 (see pages 1 to 61) of this Interim results announcement and in ‘Risk factors’, which forms part of the Directors’ Report.
Further information about our financial position and financial results is included in the financial statements and accompanying notes, which form part of the 2023 Interim Financial Report.
Significant developments
Westpac significant developments – Australia
Changes to Board of Directors
On 14 December 2022, John McFarlane, Chairman of the Board, announced his intention to retire in December 2023 at the conclusion of the 2023 AGM.
On 10 March 2023, Tim Burroughs commenced as a Non-executive Director of the Board, and on 3 April 2023, Michael Ullmer AO commenced as a Non-executive Director of the Board, replacing retired directors Steven Harker and Peter Marriott.
Reset of Strategy
As a simpler and stronger bank, Westpac is entering the next strategic phase, focusing on improving market position and returns. The Group is guided by its refreshed strategy and new purpose: creating better futures together.
Exit of businesses within Specialist Businesses segment
Following a review in 2020, we determined we would seek to exit the non-core businesses in the Specialist Businesses Division over time. Since then, a number of these businesses have been sold, or transactions undertaken, including the following which completed in 2023:
| ● | Transfer of the members and benefits of BT Funds Management Limited’s personal and corporate (non- platform) superannuation members, via a successor fund transfer, to Mercer Super Trust; and |
| ● | Sale of Westpac’s Advance Asset Management business (AAML) to Mercer (Australia) Pty Ltd. We have also agreed to divest the Private Portfolio Management business to Mercer, which is expected to complete in the second half of 2023. |
Further detail in relation to these transactions is available in Note 17 to the financial statements in this Interim Financial Results Announcement.
Work continues on a sale of the Group’s Platforms business. However, should we be unable to reach an acceptable agreement, we will likely retain it and continue to invest in the business.
In relation to our businesses in the Pacific, we continue to explore strategic options.
Some of the completed transactions have involved the giving of warranties and capped and time–bound indemnities in favour of the acquirer for certain conduct matters, remediation, and other risks.
Further information is set out in the ‘Risk factors’ section in the Directors Report and Note 13 to the financial statements in this Interim Financial Results Announcement.
Regulatory and risk developments
Enforceable undertaking on risk governance remediation, Integrated Plan and CORE program
Our CORE program is delivering the Integrated Plan required by the enforceable undertaking (EU) entered into with APRA in December 2020 in relation to our risk governance remediation and supporting the strengthening of our risk governance, accountability and culture. Execution of the CORE program is ongoing and 75% of the activities in the Integrated Plan have been assessed as complete and effective by the Independent Reviewer.
Promontory Australia, as the appointed Independent Reviewer, provides quarterly reports to APRA on our compliance with the EU and Integrated Plan. Promontory Australia has provided nine reports to APRA so far, with its next report due in July 2023. These reports are published on our website every six months at https://www.westpac.com.au/about-westpac/media/core/ with the latest reports released on 8 May 2023.
Risk management
We are continuing to invest in strengthening our end-to-end management of risk. A range of shortcomings and areas for improvement in our risk governance have been highlighted in reviews concluded in prior years. These include embedding our risk management framework, policies, systems, and the three lines of defence model, data quality and management, product governance, prudential compliance management and associated control frameworks and our risk capabilities. Further information about our risk management is set out in the ‘Risk Management’ section in our 2022 Annual Report.
65 |
Directors’ report
APRA phasing out reliance on Committed Liquidity Facility
On 10 September 2021, APRA announced its expectation that authorised deposit-taking institutions (ADIs) reduce their Committed Liquidity Facility (CLF) usage to zero in stages. In line with APRA’s expectations, on 1 January 2023, our CLF allocation had been reduced to zero. To replace the reduction in the CLF, we have increased our holdings of HQLA. Further information is set out in section 1.7 ‘Balance sheet and funding’ in this Interim Financial Results Announcement.
APRA releases final Prudential Standard CPS190 Recovery and Exit Planning
On 1 December 2022, APRA released final Prudential Standard CPS 190 Recovery and Exit Planning (CPS 190) which will come into effect from 1 January 2024 for banks and insurers, and from 1 January 2025 for Registrable Superannuation Entity licensees. CPS 190 will require these entities to develop and maintain a recovery and exit plan, and capabilities to anticipate, manage and respond to periods of stress.
Financial crime
We continue to make progress on improving our financial crime risk management, as we implement a significant multi-year program of work (including AML/CTF, Sanctions, Anti-Bribery and Corruption, the US Foreign Account Tax Compliance Act (FATCA) and Common Reporting Standard (CRS)).
Through this work, we continue to undertake activities to remediate and improve our financial crime controls in multiple areas including initial, enhanced and ongoing customer due diligence and associated record keeping, upgrading customer and payment screening and transaction monitoring solutions, improving Electronic Funds Transfer Instruction processes, establishing data reconciliations and checks to ensure the completeness of data feeding into our financial crime systems, and improving regulatory reporting including in relation to International Funds Transfer Instructions, Threshold Transaction Reports, Suspicious Matter Reports (including ‘tipping off’ controls), and FATCA and CRS reporting and equivalent reports in jurisdictions outside Australia.
With increased focus on financial crime, further issues requiring attention have been and may be identified, and we have continued to liaise with AUSTRAC, and local regulators in jurisdictions outside Australia, as appropriate. Details about the consequences of failing to comply with financial crime obligations are set out in the ‘Risk factors’ section in the Directors Report in this Interim Financial Results Announcement.
APRA capital requirements
Operational risk capital overlays
The following additional capital overlays are currently applied by APRA to our operational risk capital requirement:
| ● | $500 million in response to Westpac’s Culture, Governance and Accountability self-assessment. The overlay has applied from 30 September 2019. |
| ● | $500 million in response to the magnitude and nature of issues that were the subject of the AUSTRAC proceedings. The overlay was applied from 31 December 2019. |
These overlays have been applied through an increase in risk weighted assets. The impact on our Level 2 common equity Tier 1 (CET1) capital ratio at 31 March 2023 was a reduction of 35 basis points.
Additional loss absorbing capacity
On 2 December 2021, APRA announced a requirement for D-SIBs (including Westpac) to increase their total capital requirements by 4.5 percentage points of RWA under the current capital adequacy framework to be met by 1 January 2026. The additional total capital is expected to be met through additional Tier 2 Capital. In our funding, this increase in total capital is likely to be offset by a decrease in long-term wholesale funding.
APRA Consultation: Interest Rate Risk in the Banking Book
In November 2022, APRA released a consultation paper on changes to the calculation of interest rate risk in the banking book (IRRBB) RWA which are currently expected to come into effect from 1 January 2025. As the changes remain in consultation, it is too soon to determine their impact on the Group.
66 | WESTPAC GROUP 2023 INTERIM FINANCIAL RESULTS |
Directors’ report
Westpac significant developments – New Zealand
Reviews required under section 95 of the Banking (Prudential Supervision) Act 1989
On 23 March 2021, the Reserve Bank of New Zealand (RBNZ) issued two notices to Westpac New Zealand Limited (WNZL) under section 95 of the Banking (Prudential Supervision) Act 1989 (NZ) requiring WNZL to supply two external reviews to the RBNZ (the Risk Governance Review and the Liquidity Review). These reviews only applied to WNZL and not to Westpac in Australia nor its New Zealand branch.
The Risk Governance Review related to the effectiveness of WNZL’s risk governance. This review, completed by Oliver Wyman Limited (Oliver Wyman) in November 2021, identified deficiencies in WNZL’s risk governance practices and operations which WNZL sought to address through a programme of work overseen by the WNZL Board. Oliver Wyman (on engagement from WNZL) delivered an independent assurance report on WNZL’s remediation to WNZL and the RBNZ in December 2022. In April 2023, the RBNZ acknowledged the decision of WNZL’s Board to approve the closure of the Risk Governance programme of work, noted the improvements made by WNZL to date and that any remaining activity will be overseen by WNZL’s Board Risk and Compliance Committee.
The Liquidity Review related to the effectiveness of WNZL’s actions to improve liquidity risk management and associated risk culture. This review, completed by Deloitte Touche Tohmatsu (Deloitte) in May 2022, did not identify any material control gaps or issues and made some recommendations for improvement, which are being implemented as part of WNZL’s continuous improvement activity. Since then, WNZL has undertaken further assurance work and continues to review and enhance the control framework.
From 31 March 2021, the RBNZ amended WNZL’s conditions of registration, requiring WNZL to discount the value of its liquid assets by approximately 14%. From 15 August 2022, the RBNZ reduced the overlay quantum to approximately 7%, which at 31 March 2023 was NZ$1.7 billion. The overlay will remain in place until the RBNZ is satisfied that control assurance work has been completed.
Technology programme
Separate to the section 95 reviews outlined above, WNZL has also committed to the RBNZ, APRA and Financial Markets Authority (FMA) to address various technology issues, and engaged Deloitte to monitor progress. While work has been underway to address these issues for some time, more work is required to meet WNZL’s expectations and those of the regulators.
RBNZ’s Outsourcing Policy
Condition of registration 22 requires WNZL to comply with those provisions of the RBNZ’s Outsourcing Policy that are currently in force, and to be fully compliant with all provisions of the policy by 1 October 2023. WNZL is continuing to undertake a large- scale, multi-year, complex programme of work to become fully compliant by the compliance date. WNZL continuously monitors its progress and, while it considers that it has a pathway to achieve compliance, significant risks remain in relation to the delivery of its plan by the compliance date.
RBNZ review of overseas bank branches
On 20 October 2021, the RBNZ announced it is reviewing its policy for branches of overseas banks (including Westpac Banking Corporation’s New Zealand branch), with a view to creating a simple, coherent and transparent policy framework for branches of overseas banks. On 24 August 2022, the RBNZ released a second and final consultation paper, outlining its preferred approach to the regulation of branches, including:
| ● | restricting overseas bank branches to engaging in wholesale business only (meaning they could not take retail deposits or offer products or services to retail customers), and limiting the maximum size of a branch to NZ$15 billion in total assets; and |
| ● | requiring dual-registered branches (such as Westpac’s New Zealand branch) to only conduct business with customers with a consolidated turnover greater than NZ$50 million. In addition, the branch must be sufficiently separate from the relevant subsidiary with any risks mitigated by specific conditions of registration. |
Westpac’s New Zealand branch currently provides financial markets, trade finance and international payment products and services to customers referred by WNZL. The consultation period closed on 16 November 2022. Final policy decisions are expected to be announced in the second half of 2023.
Deposit Takers Bill
The Deposit Takers Bill 2022 was introduced into the New Zealand Parliament on 22 September 2022. If passed, the Bill will create a single regulatory regime for banks and non-bank deposit takers in New Zealand and introduce a depositor compensation scheme to protect up to NZ$100,000 per eligible depositor, per institution, if a payout event is triggered. The scheme is expected to be fully funded by levies and with a Crown backstop. If the Bill is passed, initial implementation of the depositor compensation scheme is expected in 2024, with the remainder of the Bill following the development of secondary legislation.
67 |
Directors’ report
General regulatory changes affecting our businesses
Cyber resilience
Regulators have continued their focus on cyber resilience, given the increasing number of high profile cyber- related incidents. APRA is seeking to ensure that regulated entities improve their cyber resilience practices and has been focusing on the effective implementation of Prudential Standard CPS 234 Information Security. We will continue to engage with regulators as it relates to cyber–related regulations (including proposals and the 2023-2030 Australian Cyber Security Strategy Discussion Paper). We continue to enhance our systems and processes to mitigate cyber security risks, including in relation to third parties.
Reforms to the Privacy Act
The Australian Attorney-General’s Department is continuing to review the Privacy Act 1988 (Cth) with a view to implementing reforms to better empower consumers, protect their data and support the digital economy. As part of this review, the Attorney-General’s Department publicly released the Privacy Act Review Report on 16 February 2023. The Report contains 116 proposals for reform of the Privacy Act, including the proposed introduction of:
| ● | amendments to clarify the definition of personal information; |
| ● | the regulation of the use, disclosure and protection of de-identified information; |
| ● | a ‘fair and reasonable’ test for the collection, use and disclosure of personal information; |
| ● | new privacy rights for individuals, such as a right to request erasure of personal information held by an entity; and |
| ● | a direct right of action in relation to interferences with privacy and a statutory tort for serious invasions of privacy. |
In addition, the Privacy Legislation Amendment (Enforcement and Other Measures) Act 2022 was enacted and commenced in December 2022. This Act amended the Privacy Act to include:
| ● | a significant increase in penalties for serious or repeated breaches of privacy for bodies corporate to the greater of $50 million, three times the value of the benefit obtained through any contravention (if attributable), or 30% of adjusted turnover during the breach period (if a court cannot determine the value of the benefit obtained); and |
| ● | greater enforcement and information sharing powers for the Australian Information Commissioner, such as expanding the types of declarations it could make at the conclusion of an investigation. |
Litigation and regulatory proceedings
Our entities are parties from time to time in legal proceedings arising from the conduct of our business. Material legal proceedings are described below and as required in Note 13 to the financial statements in this Interim Financial Results Announcement.
Regulatory proceedings
Information on ASIC’s civil proceedings against Westpac relating to interest rate hedging activity in relation to the 2016 Ausgrid privatisation transaction is set out in Note 13 to the financial statements in this Interim Financial Results Announcement.
Class actions
Information relating to class actions (including settled class actions and potential class actions) is set out in Note 13 to the financial statements in this Interim Financial Results Announcement.
Risk factors
Our business is subject to risks that can adversely impact our financial performance, financial condition and future performance. If any of the following risks occur, our business, prospects, reputation, financial performance or financial condition could be materially adversely affected, with the result that the trading price of our securities or the level of dividends could decline and, as a security holder, you could lose all, or part, of your investment. You should carefully consider the risks described (individually and in combination) and the other information in this Interim Financial Results Announcement and in our 2022 Annual Report before investing in, or continuing to own, our securities. The risks and uncertainties described below can emerge together or quickly in succession in a fashion that is uncorrelated with the order in which they are presented below, and they are not the only ones we face. Additional risks and uncertainties that we are unaware of, or that we currently deem to be immaterial, may also become important factors that affect us.
68 | WESTPAC GROUP 2023 INTERIM FINANCIAL RESULTS |
Directors’ report
Risks relating to our business
We have suffered, and could in the future suffer, information security risks, including cyberattacks
We (and other third parties that we engage with, including our external service providers, business partners, customers and organisations that we acquire or invest in) face information security risks. These risks are heightened by a range of factors including: the inherent risks in existing and new technologies; increasing digitisation of business processes within, and transactions among, organisations; the increased volume of data, including sensitive data, that organisations collect, generate, hold, use and disclose; the global increase in the sophistication, severity and volume of cyber crime (including the increased occurrence of cyberattacks globally); supply chain disruptions; the prevalence of remote and hybrid working for employees, staff of service providers, and customers; ongoing geo-political tensions or wars (including the military invasion of Ukraine by Russia); and other external events such as acts of terrorism and attacks from State sponsored actors, which could compromise our information assets and interrupt our usual operations and those of our customers, suppliers and counterparties.
As a result of these factors, adverse information security events such as data breaches, cyberattacks, espionage and/or errors are occurring at an unprecedented pace, scale and reach. Cyberattacks and other information security breaches have the potential to cause: financial system instability; reputational damage; serious disruption to customer banking services; economic and non-economic losses to us, our customers, shareholders, suppliers, counterparties and others; compromise data privacy of customers, shareholders, employees and others; and exposure to contagion risk. While we have systems in place to protect against, detect, contain and respond to cyberattacks and other information security threats, these systems have not always been, and may not always be, effective.
Westpac, its customers, shareholders, employees, suppliers, counterparties or others could suffer losses from cyberattacks, information security breaches or ineffective cyber resilience. The risks for Westpac may be heightened where Westpac is holding customer data in breach of legal or regulatory obligations, and that data is compromised as part of a cyberattack or other information security incident. We may not be able to anticipate and prevent a cyberattack or other information security incident, or effectively respond to and/or rectify the resulting damage. Our suppliers and counterparties, and other parties that facilitate our activities, financial platforms and infrastructure (such as payment systems and exchanges that hold data in relation to our existing or potential customers) as well as our customers’ suppliers and counterparties are also subject to the risk of cyberattacks and other information security breaches, which could in turn impact us. Furthermore, as the scale and volume of cyberattacks increases globally, there is an increased likelihood of enforcement action from global and domestic regulators and other action from customers or shareholders, such as class action litigation, for information security risk management failures, for failing to protect our information assets (including customer and other data), for misleading statements made about our information security practices or for deficiencies in our response to cyberattacks and information security threats (including for any delayed, deficient or misleading notifications).
Our operations rely on the secure processing, storage and transmission of information on our computer systems and networks, and the systems and networks of external suppliers. Although we implement measures to protect the confidentiality, availability and integrity of our information, there is a risk that our information assets (including the computer systems, software and networks on which we, or our customers, shareholders, employees, suppliers, counterparties or others rely), may be subject to security breaches, unauthorised access, malicious software, external attacks or internal breaches that could have an adverse impact on our and their confidential information.
A range of potential consequences could arise from a successful cyberattack or information security breach (whether targeting Westpac or third parties), such as: damage to technology infrastructure; the potential use of incident response and intervention powers by the Australian Government under the Security of Critical Infrastructure Act 2018 (Cth); disruptions or other adverse impacts to network access, operations or availability of services; loss of customers, suppliers and market share or reputational damage; loss of data or information; cyber extortion; customer remediation and/or claims for compensation; breach of applicable laws and regulations (including those relating to privacy, data protection and reporting obligations); increased vulnerability to fraud and scams; litigation and adverse regulatory action including fines or penalties and increased regulatory scrutiny and enforcement action; and additional costs and increased need for significant additional resources to modify or enhance our systems and processes or to investigate and remediate any vulnerabilities or incidents.
All these potential consequences could have regulatory impacts and negatively affect our business, prospects, reputation, financial performance or financial condition. As cyber threats evolve, we may need to spend significant resources to modify or enhance our systems or investigate and remediate any vulnerabilities or incidents.
69 |
Directors’ report
We could be adversely affected by legal or regulatory change
We operate in an environment of sustained legal and regulatory change and ongoing scrutiny of financial services providers. Our business, prospects, reputation, financial performance and financial condition have been, and could in the future be, adversely affected by changes to law, regulation, policies, supervisory activities, the expectations of our regulators, and the requirements of industry codes of practice, such as the Banking Code of Practice.
Such changes may affect how we operate and have altered the way we provide our products and services, in some cases requiring us to change or discontinue our offerings. These changes have in the past limited, and could continue to limit, our flexibility, require us to incur substantial costs (such as costs of systems changes, or the levies associated with the proposed Compensation Scheme of Last Resort), impact the profitability of our businesses, require us to retain additional capital, impact our ability to pursue strategic initiatives, result in us being unable to increase or maintain market share and/or create pressure on margins and fees.
A failure to manage legal or regulatory changes effectively and in the timeframes required (which may be short) has resulted, and could in the future result, in the Group not meeting its compliance obligations. It could also result in enforcement action, penalties, fines, capital impacts and ultimately loss of business licences. Managing large volumes of regulatory change simultaneously has created, and will continue to create, execution risk. While we update our technology, systems and processes to keep pace with regulatory change, these steps may not always be successful. Systems changes can also increase the risk of human error or unintended consequences (or system flaws) and this risk is exacerbated by frequent requirements for change. We expect that we will continue to invest significantly in compliance and the management and implementation of legal and regulatory changes (including, for example, in response to any changes arising from the recently announced public consultation on proposed reforms to Australia’s anti-money laundering and counter-terrorism financing regime). Significant management attention, costs and resources may be required to update existing, or implement new, processes to comply with such changes. The availability of skilled personnel required to implement changes may be limited.
There is additional information on certain aspects of regulatory changes affecting the Group in the ‘Significant developments’ section in the Directors’ report and the ‘Critical accounting assumptions and estimates’ and ‘Future developments in accounting standards’ sections in Note 1 to the financial statements in this Interim Financial Results Announcement.
We have been and could be adversely affected by failing to comply with laws, regulations or regulatory policy
We are responsible for ensuring that we comply with all applicable legal and regulatory requirements and industry codes of practice in the jurisdictions in which we operate or obtain funding.
We are subject to conduct and compliance risks. These risks are exacerbated by the complexity and volume of regulation, including where we interpret our obligations and rights differently to regulators or a Court, tribunal or other body, or where applicable laws in different jurisdictions conflict. The potential for this is heightened when regulation is new, untested or is not accompanied by extensive regulatory guidance.
Our compliance management system (which is designed to identify, assess and manage compliance risk) has not always been, and may not always be, effective. Breakdowns have occurred, and may in the future occur, due to flaws in the design or implementation of controls or processes, or when new measures are implemented in short periods of time. This has resulted in, and may in the future result in, potential breaches of compliance obligations as well as poor customer outcomes which have exposed, and may continue to expose, the Group to regulatory action, litigation (including class actions), damages, penalties and remediation obligations. As reviews and change programs are progressed, compliance issues have been, and will likely continue to be, identified.
Conduct risk has occurred, and could continue to occur, through the provision of products and services to customers (including vulnerable customers and customers in hardship) that do not meet their needs or do not meet the expectations of the market. It has occurred, and could continue to occur, through the deliberate, reckless, negligent, accidental or unintentional conduct of our employees, contractors, agents, authorised representatives, credit representatives (for example, in our RAMs franchise networks) and/or external services providers that results in the circumvention or inadequate implementation of our controls, processes, policies or procedures. This could occur through a failure to meet professional obligations to specific clients (including fiduciary and suitability requirements), weakness in risk culture, corporate governance or organisational culture, poor product design and implementation, failure to adequately consider customer needs or selling products and services outside of customer target markets.
These factors have resulted, and could continue to result, in poor customer outcomes (including for vulnerable customers and customers in hardship),a failure by the Group to meet its compliance obligations (or to promptly detect or remedy non-compliance) and other outcomes including reputational damage. This has in the past led (and could in the future lead) to increased regulatory surveillance or investigation. We are currently subject to a number of investigations and reviews by, and are responding to a number of requests from, regulators including APRA, ASIC, the OAIC, the ATO, the ACCC, BPNG and the Fair Work Ombudsman, involving significant resources and costs.
70 | WESTPAC GROUP 2023 INTERIM FINANCIAL RESULTS |
Directors’ report
Regulatory reviews and investigations have in the past, and may in the future, result in a regulator taking administrative or enforcement action against the Group and/or its representatives. Regulators have broad powers, and in certain circumstances, can issue directions to us (including in relation to product design and distribution and remedial action). Regulators could also pursue civil or criminal proceedings, seek substantial fines, civil penalties or other enforcement outcomes. For example, the payment of civil penalties of $114.5 million in 2022 relating to seven proceedings which were settled with ASIC. Penalties can be (and have been) more significant where it has taken some time to identify contraventions, or to investigate, correct or remediate contraventions, where there are patterns of similar conduct, or where there has been awareness of contraventions. In addition, regulatory investigations may lead to adverse findings against Directors and management, including potential disqualification.
APRA can also require the Group to hold additional capital either through a capital overlay or higher risk weighted assets (including in response to a failure to comply with prudential standards and/or expectations including in relation to, for example, stress testing and liquidity management). Following the commencement of civil penalty proceedings, APRA imposed a $500 million Culture, Governance and Accountability Review overlay and a further $500 million Risk Governance overlay to our required operational risk capital in 2019. Both overlays continue to apply.
If the Group incurs additional capital overlays, we may need to raise additional capital, which could have an adverse impact on our financial performance.
The political and regulatory environment that we operate in has seen (and may continue to see) the expansion of powers of regulators along with materially increased civil penalties for corporate and financial sector misconduct or non-compliance and an increase in criminal prosecutions against institutions and/or their employees and representatives (including where there is no fault element). For example, recent increases in civil penalties for serious or repeated breaches of privacy (as discussed in the ‘Significant Developments’ section in the Directors’ report in this Interim Financial Results Announcement) to the greater of $50 million; three times the value of the benefit obtained; or where the value of the benefit cannot be determined, 30% of adjusted turnover during the breach period. Given the size of Westpac and scale of its activities, a failure by the Group may result in multiple contraventions, which could lead to significant financial and other penalties. This could also result in reputational damage and impact the willingness of customers, investors and other stakeholders to deal with Westpac.
Regulatory investigations or actions commenced against the Group have exposed, and may in the future expose, the Group to an increased risk of litigation brought by third parties (including through class action proceedings), which may require us to pay compensation to third parties and/or to undertake further remediation activities. In some cases, the amounts claimed and/or to be paid may be substantial. Market developments suggest the scope and nature of potential claims is expanding, including in relation to cyber incidents, financial crime and environmental, social and governance issues. We have incurred significant remediation costs on a number of occasions (including compensation payments and costs of correcting issues) and new issues may arise requiring remediation. We have faced, and may continue to face, challenges in effectively and reliably scoping, quantifying and implementing remediation activities, including determining how to compensate impacted parties properly, fairly and in a timely way. Remediation activities may be affected or delayed by a number of factors including the number of customers (or other parties) affected, the commencement of litigation (including class action proceedings), requirements of regulators (including as to the method or timeframe for remediation) or difficulties in locating or contacting affected parties. Investigation of the underlying issue may be impeded due to the passage of time, technical system constraints, or inadequacy of records. Remediation programs may not prevent regulatory action, litigation or other proceedings from being pursued, or sanctions being imposed.
Regulatory investigations, inquiries, litigation, fines, penalties, infringement notices, revocation, suspension or variation of conditions of regulatory licences or other enforcement or administrative action or agreements (such as enforceable undertakings) have and could, either individually or in aggregate with other regulatory action, adversely affect our business, prospects, reputation, financial performance or financial condition. There is additional information on certain regulatory and other matters that may affect the Group (including class actions) in the ’Significant Developments’ section in the Directors’ report and in Note 13 to the financial statements in this Interim Financial Results Announcement.
We have suffered, and in the future could suffer, losses and be adversely affected by the failure to implement effective risk management
Our risk management framework has not always been (and may not in the future be) effective, and the resources we have in place for identifying, escalating, measuring, evaluating, monitoring, reporting and controlling or mitigating material risks may not always be adequate. This may arise due to inadequacies in the design of the framework or key risk management policies, controls and processes, the design or operation of our remuneration structures and consequence management processes, technology failures, incomplete implementation or embedment, or failure by our people (including contractors, agents, authorised representatives and credit representatives) to comply with or properly implement our policies and processes. The potential for these types of failings is heightened if we do not have appropriately skilled, trained and qualified people in key positions or we do not have sufficient capacity, including people, processes and technology, to appropriately manage risks.
There are also inherent limitations with any risk management framework as risks may exist, or emerge in the future, that we have not anticipated or identified.
71 |
Directors’ report
The risk management framework may also prove ineffective because of weaknesses in risk culture or risk governance practices and policies (for example, where there is a lack of awareness of our policies, controls and processes or where they are not adequately monitored, audited or enforced). This may result in poor decision- making or risks and control weaknesses not being identified, escalated or acted upon.
We are required to periodically review our risk management framework to determine if it remains appropriate. Past analysis and reviews, in addition to regulatory feedback, have highlighted that while there have been improvements, the framework is still not operating satisfactorily in a number of respects and needs continued focus. We have risks which sit outside of our risk appetite or do not meet the expectations of regulators (including, for example records management and customer conduct) and we have been taking steps to seek to bring these risks into appetite.
As part of our risk management framework, we measure and monitor risks against our risk appetite. When a risk is out of appetite (as some risks are), the Group takes steps to bring this risk back into appetite in a timely way. This may include improving the design of our risk class frameworks and supporting policies. However, we may not always be able to bring a risk back within appetite within proposed timeframes or institute effective improvements. This may occur because, for example, the Group experiences delays in enhancing our information technology systems, in recruiting sufficient appropriately trained staff for required activities or operational failure. It is also possible that due to external factors beyond our control, certain risks may be inherently outside of appetite for periods of time.
Weaknesses in risk culture and risk management systems and controls have resulted, and may continue to result, in regulatory action. We continue to implement our Integrated Plan in relation to risk governance and remediation, with Promontory Australia as Independent Reviewer providing regular updates to APRA. Promontory Australia’s reports are published on our website every six months at https://www.westpac.com.au/about-westpac/media/ core/. As the implementation of the Integrated Plan enters its final stages, there remains a risk that some aspects of the plan may not be achieved by the December 2023 target date and/or that a lengthy transition period may be required by APRA. This could have implications for the timing of any removal of the operational risk capital overlay.
If any of our governance or risk management processes and procedures prove ineffective or inadequate or are otherwise not appropriately implemented or we do not bring risks into appetite as has occurred, we could be exposed to higher levels of risk than expected and sustained or increased regulatory scrutiny and action. This may result in losses, imposition of capital requirements, breaches of compliance obligations, fines and reputational damage which could adversely affect our business, prospects, financial performance or financial condition or require remediation.
We could suffer losses due to geopolitical risks, environmental and social risk factors, or other external events
The Group continues to face changes in the external business environment including competitive, regulatory, economic, geopolitical, technological, social and environmental changes. There is a risk that the Group does not identify, understand or respond effectively to such changes or that these changes have an adverse impact on the Group’s ability to pursue its strategic agenda.
We, our customers and our suppliers operate businesses and hold assets in a diverse range of geographic locations. Significant geopolitical risks remain, including those arising from geopolitical instability, conflicts, strategic competition, trade tensions, trade tariffs, sanctions, social disruption (including civil unrest, war and terrorist activity), acts of civil or international hostility, and complicity with or reluctance to take action against certain types of crimes. We are also exposed to risks arising from environmental changes or other external events including climate change, natural capital loss, water scarcity, rising sea levels, extreme weather events (such as drought, bushfire, flood and storm), and outbreaks or pandemics.
Such events have the potential to affect domestic and international economic stability and adversely impact economic activity, and could impact consumer and investor confidence and/or disrupt numerous industries, businesses, service providers and supply chains. This could lead to shortages of materials and labour and/or cost increases in commodities (including metals and energy), volatility in financial markets, damage to property, affect asset values and impact our customers’ ability to repay amounts owing to us, and ability to recover amounts owing to us. All of these impacts could adversely affect our business, prospects, financial performance or financial condition.
Climate change and other sustainability factors such as human rights and natural capital may have adverse effects on our business
Climate and other sustainability-related risks have had, and are likely to have, adverse effects on us, our customers, external suppliers, and the communities in which we operate. There are significant uncertainties in accurately identifying and modelling climate- and other sustainability-related risks and opportunities over short-, medium- and long-term time horizons and in assessing their impact.
Climate related risks may manifest as physical risks, both acute and chronic, transition risks, and risks related to legal liability and regulatory action.
Physical risks include increases and variability in temperatures, changes in precipitation patterns, rising sea levels, loss of natural capital, and increased frequency and severity of adverse climatic events, including fires, storms, floods and droughts. These may impact us, our customers and our suppliers through, for example, disruptions to business and economic activity, inability to access insurance and/or impacts on income and asset values. Adverse impacts on our customers may also, in turn, increase human rights risk, increase the number of people in vulnerable circumstances, and negatively impact loan serviceability and security values, as well as our profitability.
72 | WESTPAC GROUP 2023 INTERIM FINANCIAL RESULTS |
Directors’ report
Transition risks may arise from initiatives and trends associated with climate change mitigation and the transition to a low carbon economy, changes in investor appetite, shifting customer preferences, technology developments, changes in supervisory expectations, and other regulatory and policy changes. Transition risks could directly impact Westpac by, for example, giving rise to higher compliance and/or funding costs, lower revenue from sectors materially exposed to transition risk, and potential legal or regulatory risk. We are also exposed to transition risks through our lending to higher risk sectors or regions and our own transition pathway. Transition risks may place additional pressure on customers, including pressure to reduce greenhouse gas emissions, that could result in loss of revenue and increased credit risk. In addition, Westpac may not be able to reduce lending to higher risk sectors or regions, as a result of possible stakeholder requirements and/or regulation to continue to lend to certain sectors.
Our ambition to become a net-zero, climate resilient bank, including joining the NZBA and setting interim 2030 sector targets has, and will, require changes to our lending and operational policies and processes which may present execution risk. Our ability to meet our commitments and targets is in part dependent on the orderly transition of the economy towards net-zero, which may be impacted by external factors including government climate policy, levels of public and private investment, electricity grid capacity, and constraints in the development and supply of technology, infrastructure and skilled labour required to deliver new renewable projects, including power generation.
The high dependency of the global economy on nature means natural capital loss represents a risk to us, primarily through our exposure to customers in sectors that are materially dependent or impact on nature. Natural capital refers to the stock of renewable and non-renewable natural resources (e.g. plants, animals, air, water, soils, minerals) that combine to yield a flow of benefits to people. Natural capital loss can also contribute to, and be accelerated by, climate change and these risks can be interdependent. Increasing recognition and market- based responses to this risk also create heightened regulatory and stakeholder expectations on Westpac.
Our business may be exposed to social and human rights risks through our activities and relationships including in our operations, supply chain and provision of financial services. If we fail to adequately identify and manage these risks, we may cause, contribute to, or be directly linked to adverse social and human rights impacts including a risk that we may provide financial services to institutional, business and retail customers involved in human rights abuses or who exploit our financial platforms and products for criminal purposes.
While we seek to manage and assess social risks and act if we identify risks, we cannot be certain that our assessment will uncover these risks and enable us to act. This could be because our data and monitoring systems have not kept pace with change and/or because of the increasing sophistication of perpetrators.
Data sources relevant to our assessment and management of climate, environmental and social risks continue to mature. In some cases, we are reliant on data from third parties (in particular, regarding our scope 3 emissions) which presents additional risks in terms of availability, accuracy and reliability. If those data sources do not mature at sufficient pace, or are not sufficiently available or reliable, there is a risk that our decision making (including target setting and reporting) in areas reliant on this data could be affected, such as by outdated or incorrect assumptions or modelling.
Failure or perceived failure to adapt the Group’s strategy, governance, procedures, systems and/or controls to proactively manage or disclose evolving climate- and other sustainability-related risks and opportunities (including, for example, perceived misstatement of, or failure to adequately implement or meet, sustainability claims, commitments and/or targets) may give rise to business, reputational, legal and regulatory risks. This includes financial and credit risks that may impact our profitability and outlook, and the risk of regulatory action or third party and shareholder litigation (including class actions) against us and/or our customers.
We may also be subject, from time to time, to legal and business challenges due to actions instituted by activist shareholders or others. Examples of areas which have attracted activism and challenges include: the finance of, or interaction with businesses that are perceived to be at greater risk from physical and transition risks of climate change or are perceived to not demonstrate responsible management of climate change, environmental and social issues; disclosure of climate- and sustainability-related risks; and setting and implementing appropriate climate change and sustainability strategies (including net-zero or emissions reductions strategies, targets and policies).
Scrutiny from Australian, New Zealand and global regulators, shareholders and other stakeholders on the climate- related risk management practices, lending policies, targets and commitments, and other sustainability products, claims and marketing practices will likely remain high in coming years.
Increased focus by and collaboration between local and global regulators on climate change and other sustainability factors increases compliance, legal and regulatory risks, and costs. Applicable legal and regulatory regimes, policies, and reporting and other standards are also evolving in the regions where we operate (alongside science, technology, research and development) and are likely to continue to do so over time. For example, in Australia, the government is consulting on the introduction of mandatory climate-risk reporting legislation, and there is increased compliance and enforcement focus by ASIC, ACCC and other regulators on a range of issues related to sustainability and sustainable finance, including monitoring and investigation of related claims.
Please refer to ‘Sustainability’ (‘Climate Change’) for further details on the identification, assessment and management of climate-related risks, ‘Sustainability’ (‘Natural Capital’) for further details on the identification, assessment and management of Natural capital risks and ‘Sustainability’ (‘Human Rights’) for further details on the identification, assessment and management of Human Rights risks, each in Section 1 of our 2022 Annual Report.
73 |
Directors’ report
The failure to comply with financial crime obligations has had, and could have further, adverse effects on our business and reputation
The Group is subject to anti-money laundering and counter-terrorism financing (AML/CTF) laws, anti-bribery and corruption laws, economic and trade sanctions laws and tax transparency laws in the jurisdictions in which it operates (Financial Crime Laws). These laws can be complex and, in some circumstances, impose a diverse range of obligations. As a result, regulatory, operational and compliance risks are heightened.
Financial Crime Laws require us to report certain matters and transactions to regulators (such as international funds transfer instructions, threshold transaction reports and suspicious matter reports) and ensure that we know who our customers are and that we have appropriate ongoing customer due diligence in place. The failure to comply with some of these laws has had, and in the future could have, adverse impacts for the Group.
The Group operates within a landscape that is constantly changing, particularly with the emergence of new payment technologies, increased regulatory focus on digital assets (e.g. cryptocurrency), increasing reliance on economic and trade sanctions to manage issues of international concern, and the rapid increase of ransomware and cyber extortion attacks. These developments bring with them new financial crime risks for the Group (as well as other risks), which may require adjustments to the Group’s systems, policies, processes and controls.
There has been, and continues to be, a focus on compliance with financial crime obligations, with regulators globally commencing investigations and taking enforcement action for identified non-compliance (often seeking significant penalties). Further, due to the Group’s scale of operations, an undetected failure or the ineffective implementation, monitoring or remediation of a system, policy, process or control (including a regulatory reporting obligation) has resulted, and could in the future result, in a significant number of breaches of AML/CTF or other financial crime obligations. This in turn could lead to significant financial penalties and other adverse impacts for the Group, such as reputational damage and litigation risk.
While the Group has systems, policies, processes and controls in place designed to manage its financial crime obligations (including reporting obligations), these have not always been, and may not in the future always be, effective. This could be for a range of reasons including, for example, a deficiency in the design of a control or a technology failure or a change in financial crime risks or typologies. Our analysis and reviews, in addition to regulator feedback, have highlighted that our systems, policies, processes and controls are not always operating satisfactorily in a number of respects and require improvement. We continue to have an increased focus on financial crime risk management and, as such, further issues requiring attention have been identified and may continue to be identified.
Although the Group provides updates to AUSTRAC, the ATO, BPNG, RBNZ and other regulators on its remediation and other program activities, there is no assurance that those or other regulators will agree that its remediation and program update activities will be adequate or effectively enhance the Group’s compliance programs.
If we fail to comply with our financial crime obligations, we have faced, and could in the future face, significant regulatory enforcement action and other consequences (as discussed in the risk factor entitled ‘We have been and could be adversely affected by failing to comply with laws, regulations or regulatory policy’) and increased reputational risks (as discussed in the risk factor entitled ‘Reputational damage has harmed, and could in the future harm, our business and prospects’). There is additional information on financial crime matters in the ‘Significant developments’ section in the Directors’ report in this Interim Financial Results Announcement.
Reputational damage has harmed, and could in the future harm, our business and prospects
Reputational risk arises where there are differences between stakeholders’ current and emerging perceptions, beliefs and expectations and our past, current and planned activities, processes, performance and behaviours.
There are various potential sources of reputational damage. For example, where our actions (or those of our contractors, agents, authorised representatives and credit representatives) cause, or are perceived to cause, a negative outcome for customers, shareholders, stakeholders or the community. Reputational damage could also arise from the failure to effectively manage risks, failure to comply with legal and regulatory requirements, enforcement or supervisory action by regulators, adverse findings from regulatory reviews, failure or perceived failure to adequately prevent or respond to community, environmental, social and ethical issues and cyber incidents, and inadequate record-keeping, which may prevent Westpac from demonstrating that, or determining if, a past decision was appropriate at the time it was made. We are also exposed to contagion risk from incidents in (or affecting) other financial institutions and/or the financial sector more broadly.
Westpac also recognises the potential reputational consequences (together with other potential commercial and operational consequences) of failing to appropriately identify, assess and manage environmental, social and governance related risks, or to respond effectively to evolving standards and stakeholder expectations. Our reputation could also be adversely affected by the actions of customers, suppliers, contractors, authorised representatives, credit representatives, joint-venture partners, strategic partners or other counterparties.
Failure, or perceived failure, to address issues that could or do give rise to reputational risk, has created, and could in the future create, additional legal risk, subject us to regulatory investigations, regulatory enforcement actions, fines and penalties or litigation or other actions brought by third parties (including class actions), and the requirement to remediate and compensate customers, including prospective customers, investors and the market. It could also result in the loss of customers or restrict the Group’s ability to efficiently access capital markets. This could adversely affect our business, prospects, financial performance or financial condition.
74 | WESTPAC GROUP 2023 INTERIM FINANCIAL RESULTS |
Directors’ report
We could suffer losses due to technology failures
Maintaining the reliability, availability, integrity, confidentiality, security and resilience of our information and technology is crucial to our business. While the Group has a number of processes in place to preserve and monitor the availability, and facilitate the recovery, of our systems, there is a risk that our information and technology systems may be inadequate, fail to operate properly or result in outages, including from events wholly or partially beyond our control.
If we experience a technology failure, we may fail to meet a compliance obligation (such as a requirement to retain records and/or data for a certain period, or to destroy records and/or data after a certain period, or other risk management, privacy, business continuity management or outsourcing obligations), or our employees and our customers may be adversely affected, including through the inability for them to access our products and services, privacy breaches, or the loss of personal data. This could result in reputational damage, remediation costs and a regulator commencing an investigation and/or taking action, or others commencing litigation, against us.
The use of legacy systems, as well as the work underway to uplift our technological capabilities, may heighten the risk of a technology failure and also the risk of non-compliance with our regulatory obligations.
Failure to regularly renew and enhance our technology to deliver new products and services, comply with regulatory obligations and ongoing regulatory changes, improve automation of our systems and controls, and meet our customers’ and regulators’ expectations, or to effectively implement new technology projects, could result in cost overruns, technology failures (including due to human error in implementation), reduced productivity, outages, operational failures or instability, compliance failures, reputational damage and/or the loss of market share. This could place us at a competitive disadvantage and also adversely affect our business, prospects, financial performance or financial condition.
We have and could suffer losses due to litigation
Litigation has been, and could in the future be, commenced against us by a range of plaintiffs, such as customers, shareholders, employees, suppliers, counterparties and regulators and may, either individually or in aggregate, adversely affect the Group’s business, operations, prospects, reputation or financial condition.
In recent years, there has been an increase in class action proceedings, many of which have resulted in significant monetary settlements. The risk of class actions has been heightened by a number of factors, including regulatory enforcement actions (such as the civil penalty proceedings brought by AUSTRAC), an increase in the number of regulatory investigations and inquiries, a greater willingness on the part of regulators to commence court proceedings, more intense media scrutiny, the increasing prospect of regulatory reforms which might eliminate some of the current barriers to such litigation, and the growth of third party litigation funding and other funding arrangements. Class actions commenced against a competitor could also lead to similar proceedings against Westpac.
Litigation is subject to many uncertainties and the outcome may not be predicted accurately. Furthermore, the Group’s ability to respond to and defend litigation may be adversely affected by inadequate record keeping.
Depending on the outcome of any litigation, the Group has been, and may in the future be, required to comply with broad court orders, including compliance orders, enforcement orders or otherwise pay significant damages, fines, penalties or legal costs. There is a risk that the actual penalty or damages paid following a settlement or determination by a Court for any legal proceedings may be materially higher or lower than any relevant provision (where applicable) or that any contingent liability may be larger than anticipated. There is also a risk that additional litigation or contingent liabilities arise, all of which could adversely affect our business, prospects, reputation, financial performance or financial condition.
There is additional information on certain legal proceedings that may affect the Group in the ‘Significant Developments’ section in the Directors’ report and in Note 13 to the financial statements in this Interim Financial Results Announcement.
We are exposed to adverse funding market conditions
We rely on deposits, money markets and capital markets to fund our business and source liquidity. Our liquidity and costs of obtaining funding are related to funding market conditions, in addition to our creditworthiness and credit profile.
Funding markets can be unpredictable and experience extended periods of extreme volatility, disruption and decreased liquidity. Market conditions, and the behaviour of market participants, can shift significantly over very short periods of time. The main risks we face are damage to market confidence, changes to the access and cost of funding, a slowing in global economic activity, the effects of monetary policy outcomes, the interest rate cycle, other impacts on customers or counterparties and reduction in appetite for exposure to Westpac.
A shift in investment preferences could result in deposit withdrawals. This would increase our need for funding from other sources. These may offer lower levels of liquidity and increased cost.
75 |
Directors’ report
If market conditions deteriorate due to economic, financial, political, geopolitical, regulatory, fiscal or monetary policy, or other reasons (including those idiosyncratic to Westpac), there may also be a loss of confidence in bank deposits leading to unexpected withdrawals. These events can transpire quickly and be exacerbated by information transmission on social media. This could increase funding costs, our liquidity, funding and lending activities may be constrained and our financial solvency threatened. In such events, even robust levels of capital may not be sufficient to safeguard Westpac against detrimental loss of funding.
If our current sources of funding prove to be insufficient, we may need to seek alternatives which will depend on factors such as market conditions, our credit ratings and market capacity. Even if available, these alternatives may be more expensive or on unfavourable terms, which could adversely affect our financial performance, liquidity, capital resources or financial condition.
If we are unable to source appropriate funding, we may be forced to reduce business activities (e.g. lending) or operate with smaller liquidity buffers. This may adversely impact our business, prospects, liquidity, capital resources, financial performance or financial condition. If we are unable to source appropriate funding for an extended period, or if we can no longer realise liquidity, we may not be able to pay our debts as and when they fall due or meet other contractual obligations.
We enter into collateralised derivative obligations, which may require us to post additional collateral based on market movements. This has the potential to adversely affect our liquidity or ability to use derivative obligations to hedge interest rate, currency and other financial instrument risks.
We could be adversely affected by the risk of inadequate capital levels under stressed conditions
The Group is subject to the risk of an inadequate level or composition of capital to support normal business activities, meet regulatory capital requirements under normal operating environments or stressed conditions, and to maintain our solvency. Even robust levels of capital may not be sufficient to ensure the ongoing sustainability of Westpac in the event of a liquidity run.
Regulatory change over the years has led banks to progressively build capital. Our capital levels and risk appetite are informed by stress testing. Buffers have been built to assist in maintaining capital adequacy during stressed times and ahead of regulatory change such as the implementation of APRA’s finalised Capital Framework, which came into effect from 1 January 2023. We determine our internal management buffers taking into consideration various factors. These include our balance sheet, portfolio mix, potential capital headwinds (including real estate valuations, inflation and rising rates) and stressed outcomes, also noting that models and assumptions may or may not be accurate in predicting the nature and magnitude of particular stress events.
Capital distribution constraints apply when an ADI’s Common Equity Tier 1 Capital ratio is within the capital buffer range (consisting of the Capital Conservation Buffer plus any Countercyclical Capital Buffer) in line with regulatory requirements. Such constraints could have an impact on our ability to pay future dividends, make capital distributions or continue lending. The macro-economic environment, stressed conditions and/or regulatory change or regulatory policy could result in a material increase to risk weighted assets or impact our capital adequacy, trigger capital distribution constraints, threaten our financial viability and/or require us to make a highly dilutive capital raising. In addition, should convertible securities that we have on issue be converted into ordinary shares (for example where our CET 1 ratio falls below a certain level or APRA determines we would become non-viable without conversion or some other equivalent support), this could significantly dilute the relative value of existing ordinary shares.
Our business is substantially dependent on the Australian and New Zealand economies, and could be adversely affected by a material downturn or shock to these economies or other financial systems
Our revenues and earnings are dependent on domestic and international economic activity, business conditions and the level of financial services our customers require. Most of our business is conducted in Australia and New Zealand so our performance is influenced by the level and cyclical nature of activity in these countries. The financial services industry and capital markets have been, and may continue to be, adversely affected by volatility, global economic conditions (including inflation and rising interest rates), external events, geopolitical instability, political developments, cyberattacks or a major systemic shock.
Market and economic disruptions could cause consumer and business spending to decrease, unemployment to rise, demand for our products and services to decline and credit losses to increase, thereby reducing our earnings. These events could also undermine confidence in the financial system, reduce liquidity, impair access to funding and adversely affect our customers and counterparties. In addition, any significant decrease in housing and commercial property valuations, significant increases in inflation or significant increases in interest rates could adversely impact lending activities, possibly leading to higher credit losses.
Approximately 35% of Australian exports go to China, particularly in the mining, resources and agricultural sectors. A slowdown in China’s economic growth and foreign policies (including the adoption of protectionist trade measures or sanctions) could negatively impact the Australian economy. This could result in a reduced demand for our products and services and affect supply chains, the level of economic activity and the ability of our borrowers to repay their loans.
The nature and consequences of any such event are difficult to predict but each of these factors could adversely affect our business, prospects, financial performance or financial condition.
76 | WESTPAC GROUP 2023 INTERIM FINANCIAL RESULTS |
Directors’ report
Declines in asset markets could adversely affect our operations or profitability and an increase in impairments and provisioning could adversely affect our financial performance or financial condition
Declines in Australian, New Zealand or other asset markets, including equity, bond, residential and commercial property markets, have adversely affected, and could in the future adversely affect, our operations and profitability. Declining asset prices could also impact customers and counterparties and the value of security (including residential and commercial property) we hold. This may impact our ability to recover amounts owing to us if customers or counterparties default. It may also affect our impairment charges and provisions, in turn impacting our financial performance, financial condition and capital levels. Declining asset prices also impact our wealth management business as its earnings partly depend on fees based on the value of securities and/or assets held or managed.
We establish provisions for credit impairment based on accounting standards using current information and our expectations. If economic conditions deteriorate beyond our expectations, some customers and/or counterparties could experience higher financial stress, leading to an increase in impairments, defaults and write-offs, and higher provisioning. Changes in regulatory expectations in relation to the treatment of customers in hardship could lead to increased impairments and/or higher provisioning. Such events could adversely affect our liquidity, capital resources, financial performance or financial condition.
Credit risk also arises from certain derivative, clearing and settlement contracts we enter into, and from our dealings in, and holdings of, debt securities issued by other institutions and government agencies, the financial conditions of which may be affected to varying degrees by economic conditions in global financial markets.
Sovereign risk may destabilise financial markets adversely
Sovereign risk is the risk that governments will default on their debt obligations, fail to perform contractual obligations or be unable to refinance their debts as they fall due. Potential sovereign contractual defaults, sovereign debt defaults and the risk that governments will nationalise parts of their economy including assets of financial institutions (such as Westpac) could negatively impact the value of our holdings of assets. Such an event could destabilise global financial markets, adversely affecting our liquidity, financial performance or financial condition. There may also be a cascading effect to other markets and countries, the consequences of which, while difficult to predict, may be similar to, or worse than, those experienced during the Global Financial Crisis.
We could be adversely affected by the failure to maintain our credit ratings
Credit ratings are independent opinions on our creditworthiness. Our credit ratings can affect the cost and availability of our funding and may be important to certain customers or counterparties when evaluating our products and services.
Credit ratings assigned to us by rating agencies are based on an evaluation of several factors, including the structure of Australia’s financial system, the economy and Australia’s sovereign credit rating, as well as our financial strength, the quality of our governance and risk appetite. A rating downgrade could be driven by a downgrade of Australia’s sovereign credit rating, or one or more of the risks identified in this section or by other events including changes to the methodologies rating agencies use to determine credit ratings. A credit rating or rating outlook could be downgraded or revised where credit rating agencies believe there is a very high level of uncertainty on the impact to key rating factors from a significant event.
A downgrade to our credit ratings could have an adverse effect on our cost of funds, collateral requirements, liquidity, competitive position, our access to capital markets and our financial stability. The extent and nature of these impacts would depend on various factors, including the extent of any rating change, differences across agencies (split ratings) and whether competitors or the sector are also impacted.
We face intense competition in all aspects of our business
The financial services industry is highly competitive. We compete with a range of firms, including retail and commercial banks, investment banks, other financial service companies, fintech companies and businesses in other industries with financial services aspirations. This includes those competitors who are not subject to the same capital and regulatory requirements as us, which may allow those competitors to operate more flexibly.
Emerging competitors are increasingly altering the competitive environment by adopting new business models or seeking to use new technologies to disrupt existing business models.
The competitive environment may also change as a result of increased scrutiny by regulators in the sector (such as in the payments space) and legislative reforms such as ‘Open Banking’, which will stimulate competition, improve customer choice and likely give rise to increased competition from new and existing firms.
Competition in the various markets in which we operate has led, and may continue to lead, to a decline in our margins or market share.
Deposits fund a significant portion of our balance sheet and have been a relatively stable source of funding. If we are not able to successfully compete for deposits this could increase our cost of funding, lead us to seek access to other types of funding, or result in us reducing our lending.
Our ability to compete depends on our ability to offer products and services that meet evolving customer preferences. Not responding to changes in customer preferences could see us lose customers. This could adversely affect our business, prospects, financial performance or financial condition.
For more detail on how we address competitive pressures refer to ‘Our Operating Environment’ (under ‘Competition’) in Section 1 of our 2022 Annual Report.
77 |
Directors’ report
We have suffered, and could continue to suffer, losses due to operational risk
Operational risk is the risk of loss resulting from inadequate or failed internal processes, people and systems as well as the risk of business disruption due to external events such as those discussed under the relevant risk factor above. It includes, among other things, technology risk, model risk and third party risk. While we have policies, processes and controls in place to manage these risks, these have not always been, or may not be, effective.
Ineffective processes and controls (including those of our contractors, agents, authorised representatives and credit representatives) have resulted in, and could continue to result in, adverse outcomes for customers (including vulnerable customers), employees or other third parties. This has included, and could continue to include, process breakdowns or failing to have appropriate product governance and monitoring processes in place (including under our design and distribution obligations) resulting in a customer not receiving a product on the terms, conditions, or pricing they agreed to or are entitled to, potentially to the detriment of the customer. Failed processes could also result in us incurring losses because we cannot enforce our expected contractual rights.
The risk of operational breakdowns occurring is heightened where measures are implemented quickly in response to external events, such as the COVID-19 pandemic. These types of operational failures may also result in financial losses, customer remediation, regulatory scrutiny and intervention, fines, penalties and capital overlays and, depending on the nature of the failure, result in litigation, including class action proceedings.
We have incurred, and could in the future incur, losses from scams and fraud (including fraudulent applications for loans, or from incorrect or fraudulent payments and settlements). Such losses could increase if our liability for scams is impacted by regulatory change. Fraudulent conduct can also arise from external parties seeking to access our systems or customer accounts. These risks are heightened by real-time transaction capability, and we are also exposed to contagion risk from incidents in (or affecting) other financial institutions. If systems, procedures and protocols for preventing and managing scams, fraud or improper access to our systems and customer accounts fail, or are inadequate or ineffective, they could lead to losses which could adversely affect our customers, business, prospects, reputation, financial performance or financial condition. Regulatory and compliance requirements can impede the ability to swiftly identify or respond to a scam or fraud, or to communicate with affected parties.
Westpac could also incur losses if there was a failure to adequately implement and monitor effective records management policies and processes, as this could impact Westpac’s ability to safeguard or locate relevant records, respond to production and regulatory notices, conduct remediation, and generally meet its compliance obligations, for example under the Privacy Act 1988 (Cth) (including recent – and proposed – changes to that legislation). Where there are inadequacies or complexities in our data management systems, there is a heightened risk that we may fail to meet a compliance obligation (such as a requirement to retain records and data for a certain period, or to destroy or de-identify records and data after a certain period).
As we increase the adoption of artificial intelligence to support our customers and business processes, we may become more exposed to associated AI risks, such as lack of transparency, risk of biased or inaccurate outputs or outcomes, breaches of confidentiality and privacy obligations, and third party IP rights infringement, inaccurate decisions or unintended consequences that are inconsistent with our policies or values. These could have financial, regulatory, conduct and reputational impacts.
Westpac is also exposed to model risk, being the risk of loss arising from errors or inadequacies in a model (or data or other inputs to it), or in the processes around, or control and use of, a model. This has resulted, and could continue to result, in scrutiny of our models (and underlying processes and controls) from regulators including APRA.
Financial services entities have been increasingly sharing data with third parties, such as suppliers, fintechs, and regulators, to conduct their business and meet regulatory obligations. Each third party can give rise to a variety of risks, including financial crime compliance, information security, cyber, privacy, regulatory compliance, reputation, environmental and business continuity risks.
Westpac also relies on suppliers, both in Australia and overseas, to provide services to it and its customers. Failures by these third-party contractors and suppliers (including our authorised representatives and credit representatives) to deliver services as required could disrupt Westpac’s ability to provide its products and services and adversely impact our operations, financial performance or reputation.
Westpac is also exposed to change risk through delivery of technology and other change programs, being the risk that a change program fails to deliver the desired goals, or fails to reduce, pre-empt, mitigate and manage the challenges associated with transformation or leads to further regulatory scrutiny. If the technology systems used by the Group, its counterparties and/or financial infrastructure providers do not operate correctly, this may also cause loss or damage to the Group, its customers and/or its counterparties. This can also arise from complexities in our systems, and the interaction between those systems.
There is also a risk that we will not be able to obtain and/or have not obtained appropriate insurance coverage for the risks that the Group may be exposed to.
78 | WESTPAC GROUP 2023 INTERIM FINANCIAL RESULTS |
Directors’ report
We could suffer losses due to market volatility
We are exposed to market risk due to our financial markets businesses, asset and liability management (including through volatility in prices of equity securities we hold or are exposed to), our holdings in liquid asset securities and our defined benefit plan.
Market risk is the risk of an adverse impact on the Group’s financial performance or financial position resulting from changes in market factors, such as foreign exchange rates, commodity prices, equity prices, credit spreads and interest rates. This includes interest rate risk in the banking book arising from a mismatch between the duration of assets and liabilities that have not been appropriately hedged.
Changes in market price factors could be driven by a variety of developments including economic disruption and geopolitical events. The resulting market volatility could potentially lead to losses and may adversely affect our financial performance (business, prospects, liquidity, ability to hedge exposures and capital).
As a financial intermediary, we underwrite listed and unlisted debt securities. We could suffer losses if we fail to syndicate or sell down this risk to others. This risk is more pronounced in times of heightened market volatility.
Poor data quality could adversely affect our business and operations
Accurate, complete and reliable data, along with appropriate data control, retention, destruction and access frameworks and processes, is critical to Westpac’s business. Data plays a key role in how we provide products and services to customers, our systems, our risk management framework and our decision-making and strategic planning.
In some areas of our business, we are affected by poor data quality or data availability. This has occurred, and could arise in the future, in a number of ways, including through inadequacies in systems, processes and policies, or the ineffective implementation of data management frameworks.
Poor data quality could lead to poor customer service, negative risk management outcomes, and deficiencies in credit systems and processes. Any deficiency in credit systems and processes could, in turn, have a negative impact on Westpac’s decision making in the provision of credit and the terms on which it is provided. Westpac also needs accurate data for financial and other reporting.
Poor data has affected, currently affects, and may in the future continue to affect, Westpac’s ability to monitor and manage its business, comply with production notices, respond to regulatory notices and conduct remediation.
In addition, poor data or poor data retention/destruction controls, and control gaps and weaknesses, has affected, currently affects, and may in the future continue to affect, Westpac’s ability to meet its compliance obligations (including its regulatory reporting obligations) which has led, and could continue to lead, to regulatory investigations or actions against us. For example, APRA has previously raised concerns regarding Westpac’s data quality, including missing data and the number of resubmissions of regulatory reporting. Further substantial regulatory change programs (and regulatory focus) are anticipated, including in response to APRA’s data collection roadmap, and privacy law reform, and we are yet to ascertain the scope, cost and resourcing required to implement and manage these changes. Due to the importance of data, we have and will likely continue to incur substantial costs, and devote significant effort, to improving the quality of data and data frameworks and processes, remediating deficiencies where necessary, and compliance generally.
The consequences and effects arising from poor data quality or poor data retention/destruction controls could have an adverse impact on the Group’s business, operations, prospects, reputation, financial performance or financial condition.
Our failure to recruit and retain key executives, employees and Directors may have adverse effects on our business
Key executives, employees and Directors play an integral role in the operation of Westpac’s business and our pursuit of our strategic objectives. Our failure to recruit and retain appropriately skilled and qualified people into key roles could have an adverse effect on our business, prospects, reputation, financial performance or financial condition. Macro-environmental factors such as low unemployment, restricted migration levels, on-shoring of work, the prevalence of remote and hybrid working for employees and the competitive talent market, may also have an adverse impact on attracting specialist skills for the Group.
79 |
Directors’ report
Certain strategic decisions may have adverse effects on our business
The Group routinely evaluates and implements strategic decisions and objectives including simplification, diversification, innovation, divestment, acquisitions or business expansion initiatives. Each of these activities can be complex, costly and may not proceed in a timely manner. For example, they may cause reputational damage, or we may experience difficulties in completing certain transactions, separating or integrating businesses in the scheduled timeframe or at all, disruptions to operations, diversion of management resources or higher than expected transaction costs.
Furthermore, approvals may be required from shareholders, regulators or other stakeholders for transactions, and there is a risk that these approvals may not be received or that transactions do not complete for other reasons. Any failure to successfully divest businesses means that we may have sustained exposure to higher operating costs and to the higher inherent risks in those businesses. for example, our Pacific businesses face a number of risks including heightened operational risk, sovereign risk, financial crime and exchange control risks which could adversely affect our customers, business, prospects, reputation, financial performance or financial condition. A failure to divest businesses or assets could also result in interested parties taking action against the Group. We may not receive the anticipated business benefits or cost savings and the Group could otherwise be adversely affected.
In addition, as part of the Specialist Businesses transactions, we have given a number of warranties and indemnities in favour of counterparties relating to certain pre-completion matters, and made certain other contractual commitments (including in relation to transitional services). Claims under these warranties, indemnities and other contractual commitments may result in Westpac being liable to make significant payments to these counterparties. Additional operational risk capital is required to be held against the risk pursuant to APRA’s published guidance. Our contingent liabilities are described in Note 13 to the financial statements in this Interim Financial Results Announcement.
Westpac also acquires and invests in businesses. These transactions involve a number of risks and costs. A business we invest in may not perform as anticipated or may ultimately prove to have been overvalued when the transaction was entered into.
Operational, cultural, governance, compliance and risk appetite differences between Westpac and an acquired business may lead to lengthier and more costly integration exercises.
There are also risks involved in failing to identify, understand or respond effectively to changes in our internal factors or external business environment (including economic, geopolitical, regulatory, consumer sentiment, technological, environmental, social and competitive factors). This could have a range of adverse effects on Westpac, such as being unable to increase or maintain market share or resulting pressure on margins and fees.
Any of these risks could have a negative impact on our business, growth prospects, reputation, engagement with regulators, financial performance or financial condition.
We could suffer losses due to impairment of capitalised software, goodwill and other intangible assets that may adversely affect our business, operations or financial condition
In certain circumstances Westpac may incur a reduction in the value of intangible assets. Westpac is required to assess the recoverability of goodwill and other intangible asset balances at least annually or wherever an indicator of impairment exists.
For this purpose, Westpac uses a discounted cash flow calculation. Changes in the methodology or assumptions in calculations, together with changes in expected cash flows, could materially impact this assessment. Estimates and assumptions used in assessing the useful life of an asset can also be affected by a range of factors including changes in strategy, changes in technology and regulatory requirements. In the event that an asset is no longer in use, or its value has been reduced or its estimated useful life has declined, an impairment will be recorded, adversely impacting our financial performance.
Changes in critical accounting estimates and judgements could expose the Group to losses
We are required to make estimates, assumptions and judgements when applying accounting policies and preparing financial statements, particularly in connection with the calculation of provisions (including remediation and expected credit losses) and the determination of the fair value of financial instruments. A change in a critical accounting estimate, assumption and/or judgement resulting from new information or from changes in circumstances or experience could result in the Group incurring losses greater than those anticipated or provided for. This could have an adverse effect on our financial performance, financial condition and reputation. Our financial performance and financial condition may also be impacted by changes to accounting standards or to generally accepted accounting principles.
Rounding of amounts
ASIC Corporations (Rounding in Financial/Directors’ Reports) Instruments 2016/191 applies to Westpac and in accordance with that Legislative Instrument all amounts have been rounded to the nearest million dollars unless otherwise stated.
80 | WESTPAC GROUP 2023 INTERIM FINANCIAL RESULTS |
Directors’ report
Auditor’s independence declaration

Auditor’s Independence Declaration
As lead auditor for the review of Westpac Banking Corporation for the half-year ended 31 March 2023, I declare that to the best of my knowledge and belief, there have been:
| (a) | no contraventions of the auditor independence requirements of the Corporations Act 2001 in relation to the review; and |
| (b) | no contraventions of any applicable code of professional conduct in relation to the review. |
This declaration is in respect of Westpac Banking Corporation and the entities it controlled during the period.
| |
| |
| |
CJ Heath | Sydney |
Partner | 7 May 2023 |
PricewaterhouseCoopers | |

PricewaterhouseCoopers, ABN 52 780 433 757
One International Towers Sydney, Watermans Quay, Barangaroo, GPO BOX 2650, SYDNEY NSW 2001
T: +61 2 8266 0000, F: +61 2 8266 9999, www.pwc.com.au
Liability limited by a scheme approved under Professional Standards Legislation.
81 |
Directors’ report
Responsibility statement
The Directors of Westpac Banking Corporation confirm that to the best of their knowledge:
| (i) | the interim financial statements have been prepared in accordance with AASB 134 Interim Financial Reporting and are in compliance with IAS 34 Interim Financial Reporting issued by the International Accounting Standards Board; and |
| (ii) | the Directors’ report includes a fair review of the information required by DTR 4.2.7 R of the Disclosure Guidance and Transparency Rules of the United Kingdom Financial Conduct Authority. |
The Directors’ report is signed in accordance with a resolution of the Board of Directors.
| |
| |
| |
|
|
| |
John McFarlane | Peter King |
| |
Chairman | Managing Director and |
| |
| Chief Executive Officer |
| |
Sydney, Australia | |
| |
7 May 2023 | |


3.2 | Consolidated income statement |
Westpac Banking Corporation and its controlled entities
| | | | | | | | | | | | |
| | | | Half Year | | Half Year | | Half Year | | % Mov’t | ||
| | | | March | | Sept | | March | | Mar 23 |
| Mar 23 |
$m |
| Note |
| 2023 |
| 2022 |
| 2022 |
| - Sept 22 |
| - Mar 22 |
Interest income: |
| | | |
| | | | | | | |
Calculated using the effective interest method | | 3 | | 19,279 | | 12,872 | | 10,109 | | 50 | | 91 |
Other | | 3 | | 560 | | 174 | | 96 | | large | | large |
Total interest income | | | | 19,839 | | 13,046 | | 10,205 | | 52 | | 94 |
Interest expense |
| 3 | | (10,726) |
| (4,173) | | (1,917) | | 157 | | large |
Net interest income |
| | | 9,113 |
| 8,873 | | 8,288 | | 3 | | 10 |
Non-interest income | | | | | | | | | | | | |
Net fees |
| 4 | | 827 |
| 826 | | 845 | | - | | (2) |
Net wealth management and insurance |
| 4 | | 347 |
| 407 | | 401 | | (15) | | (13) |
Trading | | 4 | | 387 | | 321 | | 343 | | 21 | | 13 |
Other |
| 4 | | 329 |
| (1,051) | | 353 | | large | | (7) |
Total non-interest income | | | | 1,890 | | 503 | | 1,942 | | large | | (3) |
Net operating income |
| | | 11,003 |
| 9,376 | | 10,230 | | 17 | | 8 |
Operating expenses |
| 5 | | (4,988) |
| (5,429) | | (5,373) | | (8) | | (7) |
Impairment (charges)/benefits |
| 9 | | (390) |
| (196) | | (139) | | 99 | | 181 |
Profit before income tax expense |
| | | 5,625 |
| 3,751 | | 4,718 | | 50 | | 19 |
Income tax expense |
| 6 | | (1,620) |
| (1,336) | | (1,434) | | 21 | | 13 |
Profit after income tax expense |
| | | 4,005 |
| 2,415 | | 3,284 | | 66 | | 22 |
Net profit attributable to non-controlling interests (NCI) |
| | | (4) |
| (1) | | (4) | | large | | - |
Net profit attributable to owners of Westpac Banking Corporation (WBC) |
| | | 4,001 |
| 2,414 |
| 3,280 |
| 66 |
| 22 |
Earnings per share (cents) |
|
|
| |
| |
| |
| |
| |
Basic |
| 7 |
| 114.2 |
| 69.0 |
| 90.5 |
| 66 |
| 26 |
Diluted |
| 7 |
| 107.7 |
| 66.0 |
| 85.7 |
| 63 |
| 26 |
The above consolidated income statement should be read in conjunction with the accompanying notes.
3.3 | Consolidated statement of comprehensive income |
Westpac Banking Corporation and its controlled entities
| | | | | | | | | | |
| | Half Year | | Half Year | | Half Year | | % Mov’t | ||
| | March | | Sept | | March | | Mar 23 |
| Mar 23 |
$m |
| 2023 |
| 2022 |
| 2022 |
| - Sept 22 |
| - Mar 22 |
Profit after income tax expense | | 4,005 | | 2,415 | | 3,284 | | 66 | | 22 |
Other comprehensive income/(expense) |
| |
| |
| |
| |
| |
Items that may be reclassified subsequently to profit or loss |
| |
| |
| |
| |
| |
Gains/(losses) recognised in equity on: |
| |
| |
| |
| |
| |
Debt securities measured at fair value through other comprehensive income (FVOCI) |
| (2) |
| (178) |
| (140) |
| (99) |
| (99) |
Cash flow hedging instruments |
| 522 |
| 82 |
| 1,222 |
| large |
| (57) |
Transferred to income statement: |
| |
| | | | | | | |
Debt securities measured at FVOCI |
| (65) |
| (49) |
| (205) |
| 33 |
| (68) |
Cash flow hedging instruments |
| (418) |
| (424) |
| (10) |
| (1) |
| large |
Loss allowance on debt securities measured at FVOCI | | 1 | | - | | (2) | | - | | large |
Exchange differences on translation of foreign operations (net of associated hedges) |
| 378 |
| (98) |
| (166) |
| large |
| large |
Income tax on items taken to or transferred from equity: |
| | | | | | | | | |
Debt securities measured at FVOCI |
| 21 |
| 66 |
| 100 |
| (68) |
| (79) |
Cash flow hedging instruments | | (32) | | 106 | | (359) | | large | | (91) |
Items that will not be reclassified subsequently to profit or loss |
| | | | | | | | | |
Gains/(losses) on equity securities measured at FVOCI (net of tax) |
| (25) |
| (54) |
| 146 |
| (54) |
| large |
Own credit adjustment on financial liabilities designated at fair value (net of tax) |
| 43 |
| 35 |
| 45 |
| 23 |
| (4) |
Remeasurement of defined benefit obligation recognised in equity (net of tax) |
| (181) |
| 388 |
| 58 |
| large |
| large |
Net other comprehensive income/(expense) (net of tax) |
| 242 |
| (126) |
| 689 |
| large |
| (65) |
Total comprehensive income |
| 4,247 |
| 2,289 |
| 3,973 |
| 86 |
| 7 |
Attributable to: |
| |
| |
| |
| |
| |
Owners of WBC |
| 4,243 |
| 2,287 |
| 3,970 |
| 86 |
| 7 |
NCI |
| 4 |
| 2 |
| 3 |
| 100 |
| 33 |
Total comprehensive income |
| 4,247 |
| 2,289 |
| 3,973 |
| 86 |
| 7 |
The above consolidated statement of comprehensive income should be read in conjunction with the accompanying notes.
84 | WESTPAC GROUP 2023 INTERIM FINANCIAL RESULTS |
Consolidated financial statements
3.4 | Consolidated balance sheet |
Westpac Banking Corporation and its controlled entities
| | | | | | | | | | | | |
| | | | As at | | As at | | As at | | % Mov’t | ||
| | | | 31 March | | 30 Sept | | 31 March | | Mar 23 |
| Mar 23 |
$m |
| Note |
| 2023 |
| 2022 |
| 2022 |
| - Sept 22 |
| - Mar 22 |
Assets |
|
|
|
|
|
|
|
|
|
|
|
|
Cash and balances with central banks |
|
|
| 117,886 |
| 105,257 |
| 102,410 |
| 12 |
| 15 |
Collateral paid |
|
|
| 4,093 |
| 6,216 |
| 7,374 |
| (34) |
| (44) |
Trading securities and financial assets measured at fair value through income statement (FVIS) |
|
|
| 30,474 |
| 24,332 |
| 23,738 |
| 25 |
| 28 |
Derivative financial instruments |
|
|
| 20,346 |
| 41,283 |
| 18,269 |
| (51) |
| 11 |
Investment securities |
|
|
| 73,552 |
| 76,465 |
| 70,442 |
| (4) |
| 4 |
Loans |
| 8 |
| 749,931 |
| 739,647 |
| 719,556 |
| 1 |
| 4 |
Other financial assets |
|
|
| 7,343 |
| 5,626 |
| 4,896 |
| 31 |
| 50 |
Current tax assets | | | | 25 | | 16 | | 214 | | 56 | | (88) |
Investment in associates |
|
|
| 34 |
| 37 |
| 41 |
| (8) |
| (17) |
Property and equipment |
|
|
| 2,415 |
| 2,429 |
| 2,614 |
| (1) |
| (8) |
Deferred tax assets |
|
|
| 1,703 |
| 1,754 |
| 1,831 |
| (3) |
| (7) |
Intangible assets |
|
|
| 10,724 |
| 10,327 |
| 10,064 |
| 4 |
| 7 |
Other assets |
|
|
| 582 |
| 734 |
| 600 |
| (21) |
| (3) |
Assets held for sale | | 17 | | - | | 75 | | 2,700 | | (100) | | (100) |
Total assets |
|
|
| 1,019,108 |
| 1,014,198 |
| 964,749 |
| - |
| 6 |
Liabilities |
|
|
| |
| |
| |
| | | |
Collateral received |
|
|
| 3,577 |
| 6,371 |
| 2,170 |
| (44) |
| 65 |
Deposits and other borrowings |
| 11 |
| 676,352 |
| 659,129 |
| 645,606 |
| 3 |
| 5 |
Other financial liabilities |
|
|
| 60,102 |
| 56,360 |
| 51,345 |
| 7 |
| 17 |
Derivative financial instruments |
|
|
| 20,791 |
| 39,568 |
| 25,347 |
| (47) |
| (18) |
Debt issues |
|
|
| 148,952 |
| 144,868 |
| 133,629 |
| 3 |
| 11 |
Current tax liabilities |
|
|
| 363 |
| 219 |
| 21 |
| 66 |
| large |
Provisions |
| 13 |
| 2,424 |
| 2,950 |
| 3,035 |
| (18) |
| (20) |
Deferred tax liabilities |
|
|
| - |
| - |
| 164 |
| - |
| (100) |
Other liabilities |
|
|
| 2,854 |
| 2,938 |
| 3,379 |
| (3) |
| (16) |
Liabilities held for sale | | 17 | | - | | 32 | | 684 | | (100) | | (100) |
Total liabilities excluding loan capital |
|
|
| 915,415 |
| 912,435 |
| 865,380 |
| - |
| 6 |
Loan capital |
|
|
| 31,025 |
| 31,254 |
| 29,036 |
| (1) |
| 7 |
Total liabilities |
|
|
| 946,440 |
| 943,689 |
| 894,416 |
| - |
| 6 |
Net assets |
|
|
| 72,668 |
| 70,509 |
| 70,333 |
| 3 |
| 3 |
Shareholders’ equity |
|
|
| |
| |
| |
| |
| |
Share capital: |
|
|
| |
| |
| |
| |
| |
Ordinary share capital |
| 14 |
| 39,824 |
| 39,666 |
| 39,667 |
| - |
| - |
Treasury shares |
| 14 |
| (702) |
| (655) |
| (651) |
| 7 |
| 8 |
Reserves |
| 14 |
| 2,816 |
| 2,378 |
| 2,901 |
| 18 |
| (3) |
Retained profits |
|
|
| 30,686 |
| 29,063 |
| 28,362 |
| 6 |
| 8 |
Total equity attributable to owners of WBC | | | | 72,624 | | 70,452 | | 70,279 | | 3 | | 3 |
NCI | | | | 44 | | 57 | | 54 | | (23) | | (19) |
Total shareholders’ equity and NCI | | | | 72,668 | | 70,509 | | 70,333 | | 3 | | 3 |
The above consolidated balance sheet should be read in conjunction with the accompanying notes.
85 |
Consolidated financial statements
3.5 | Consolidated statement of changes in equity |
Westpac Banking Corporation and its controlled entities
| | | | | | | | | | | | |
| | | | | | | | Total equity | | | | |
| | Share | | | | | | attributable | | | | Total |
| | capital | | Reserves | | Retained | | to owners of | | | | shareholders’ |
$m |
| (Note 14) |
| (Note 14) |
| profits |
| WBC |
| NCI |
| equity and NCI |
Balance as at 30 September 2021 |
| 40,995 |
| 2,227 |
| 28,813 |
| 72,035 |
| 57 |
| 72,092 |
Profit after income tax expense |
| - |
| - |
| 3,280 | | 3,280 |
| 4 |
| 3,284 |
Net other comprehensive income/(expense) |
| - |
| 587 |
| 103 | | 690 |
| (1) |
| 689 |
Total comprehensive income/(expense) |
| - |
| 587 |
| 3,383 |
| 3,970 |
| 3 |
| 3,973 |
Transactions in capacity as equity holders |
|
|
|
|
|
|
| |
|
|
|
|
Dividends on ordinary shares1 |
| - |
| - |
| (2,201) |
| (2,201) |
| - |
| (2,201) |
Other equity movements: |
|
|
| |
|
|
|
|
| |
|
|
Off-market share buy-back (net of transaction costs)2 | | (1,901) | | - | | (1,601) | | (3,502) | | - | | (3,502) |
Share-based payment arrangements |
| - |
| 60 |
| - |
| 60 |
| - |
| 60 |
Purchase of shares |
| (33) |
| - |
| - |
| (33) |
| - |
| (33) |
Net acquisition of treasury shares |
| (45) |
| - |
| - |
| (45) |
| - |
| (45) |
Other |
| - |
| 27 |
| (32) |
| (5) |
| (6) |
| (11) |
Total contributions and distributions |
| (1,979) |
| 87 |
| (3,834) |
| (5,726) |
| (6) |
| (5,732) |
Balance as at 31 March 2022 |
| 39,016 |
| 2,901 |
| 28,362 |
| 70,279 |
| 54 |
| 70,333 |
Profit after income tax expense |
| - |
| - |
| 2,414 | | 2,414 |
| 1 |
| 2,415 |
Net other comprehensive income/(expense) |
| - |
| (550) |
| 423 | | (127) |
| 1 |
| (126) |
Total comprehensive income/(expense) |
| - |
| (550) |
| 2,837 |
| 2,287 |
| 2 |
| 2,289 |
Transactions in capacity as equity holders |
|
|
|
|
|
|
|
|
|
|
|
|
Dividends on ordinary shares1 |
| - |
| - |
| (2,136) |
| (2,136) |
| - |
| (2,136) |
Other equity movements: |
|
|
| |
|
|
|
|
| |
|
|
Off-market share buy-back (net of transaction costs)2 | | (1) | | - | | - | | (1) | | - | | (1) |
Share-based payment arrangements |
| - |
| 27 |
| - |
| 27 |
| - |
| 27 |
Net acquisition of treasury shares |
| (4) |
| - |
| - |
| (4) |
| - |
| (4) |
Other |
| - |
| - |
| - |
| - |
| 1 |
| 1 |
Total contributions and distributions |
| (5) |
| 27 |
| (2,136) |
| (2,114) |
| 1 |
| (2,113) |
Balance as at 30 September 2022 |
| 39,011 |
| 2,378 |
| 29,063 |
| 70,452 |
| 57 |
| 70,509 |
Profit after income tax expense |
| - |
| - |
| 4,001 | | 4,001 |
| 4 |
| 4,005 |
Net other comprehensive income/(expense) |
| - |
| 380 |
| (138) | | 242 |
| - |
| 242 |
Total comprehensive income/(expense) |
| - |
| 380 |
| 3,863 |
| 4,243 |
| 4 |
| 4,247 |
Transactions in capacity as equity holders: |
|
|
|
|
|
|
|
|
|
|
|
|
Dividends on ordinary shares1 |
| - |
| - |
| (2,240) |
| (2,240) |
| - |
| (2,240) |
Dividend reinvestment plan | | 190 | | - | | - | | 190 | | - | | 190 |
Other equity movements: |
|
|
|
|
|
|
|
|
|
|
|
|
Share-based payment arrangements |
| - |
| 58 |
| - |
| 58 |
| - |
| 58 |
Purchase of shares |
| (32) |
| - |
| - |
| (32) |
| - |
| (32) |
Net acquisition of treasury shares |
| (47) |
| - |
| - |
| (47) |
| - |
| (47) |
Other |
| - |
| - |
| - |
| - |
| (17) |
| (17) |
Total contributions and distributions |
| 111 |
| 58 |
| (2,240) |
| (2,071) |
| (17) |
| (2,088) |
Balance as at 31 March 2023 |
| 39,122 |
| 2,816 |
| 30,686 |
| 72,624 |
| 44 |
| 72,668 |
The above consolidated statement of changes in equity should be read in conjunction with the accompanying notes.
| 1. | First Half 2023 related to the 2022 final dividend of 64 cents per share ($2,240 million) (Second Half 2022: 2022 interim dividend of 61 cents per share ($2,136 million), First Half 2022: 2021 final dividend of 60 cents per share ($2,201 million)), all fully franked at 30%. |
| 2. | On 14 February 2022, the Group completed its $3.5 billion off-market share buy-back of Westpac ordinary shares. Refer to Note 14 for further details. |
86 | WESTPAC GROUP 2023 INTERIM FINANCIAL RESULTS |
Consolidated financial statements
3.6 | Consolidated cash flow statement |
Westpac Banking Corporation and its controlled entities
| | | | | | | | | | | | |
| | | | Half Year | | Half Year | | Half Year | | % Mov’t | ||
| | | | March | | Sept | | March | | Mar 23 |
| Mar 23 |
$m |
| Note |
| 2023 |
| 2022 |
| 2022 |
| - Sept 22 |
| - Mar 22 |
Cash flows from operating activities |
|
|
|
|
| | |
| | |
|
|
Interest received |
|
|
| 18,818 |
| 12,332 | | 10,091 | | 53 |
| 86 |
Interest paid |
|
|
| (9,091) |
| (3,312) | | (1,779) | | 174 |
| large |
Dividends received excluding life business |
|
|
| - |
| 1 | | 3 | | (100) |
| (100) |
Other non-interest income received |
|
|
| 2,067 |
| 2,522 | | 1,686 | | (18) |
| 23 |
Operating expenses paid |
|
|
| (4,436) |
| (4,585) | | (5,139) | | (3) |
| (14) |
Income tax paid excluding life business |
|
|
| (1,364) |
| (996) | | (1,282) | | 37 |
| 6 |
Life business: |
|
|
| |
| | | | | | | |
Receipts from policyholders and customers |
|
|
| - |
| 379 | | 466 | | (100) |
| (100) |
Interest and other items of similar nature |
|
|
| - |
| - | | 1 | | - |
| (100) |
Dividends received |
|
|
| - |
| 17 | | 8 | | (100) |
| (100) |
Payments to policyholders and suppliers |
|
|
| - |
| (307) | | (312) | | (100) |
| (100) |
Income tax paid |
|
|
| - |
| (14) | | (51) | | (100) |
| (100) |
Cash flows from operating activities before changes in operating assets and liabilities |
|
|
| 5,994 |
| 6,037 | | 3,692 | | (1) |
| 62 |
Net (increase)/decrease in: |
|
|
| |
| | | | | |
| |
Collateral paid |
|
|
| 1,898 |
| 1,769 | | (3,293) | | 7 | | large |
Trading securities and financial assets measured at FVIS |
|
|
| (4,967) |
| (1,644) | | (2,106) | | large | | 136 |
Derivative financial instruments |
|
|
| (165) |
| (553) | | 3,004 | | (70) | | large |
Loans |
|
|
| (5,074) |
| (23,709) | | (12,636) | | (79) | | (60) |
Other financial assets |
|
|
| (148) | | (447) | | 726 | | (67) | | large |
Life insurance assets and liabilities |
|
|
| - |
| 133 | | 133 | | (100) | | (100) |
Other assets |
|
|
| 26 |
| 37 | | (17) | | (30) | | large |
Net increase/(decrease) in: |
|
|
| |
| | | | | | | |
Collateral received |
|
|
| (2,781) |
| 3,827 | | (184) | | large |
| large |
Deposits and other borrowings |
|
|
| 13,464 |
| 13,296 | | 21,758 | | 1 |
| (38) |
Other financial liabilities |
|
|
| (328) |
| 5,738 | | 1,382 | | large |
| large |
Other liabilities |
|
|
| (4) |
| 8 | | 3 | | large |
| large |
Net cash provided by/(used in) operating activities |
| 15 |
| 7,915 |
| 4,492 | | 12,462 | | 76 |
| (36) |
Cash flows from investing activities |
|
|
|
|
| |
| |
| |
| |
Proceeds from investment securities |
|
|
| 20,299 |
| 16,877 |
| 19,145 |
| 20 |
| 6 |
Purchase of investment securities |
|
|
| (15,619) |
| (24,239) |
| (9,837) |
| (36) |
| 59 |
Proceeds from disposal of controlled entities and other businesses, net of cash disposed | | 15 | | 293 | | 727 | | 1,388 | | (60) | | (79) |
Purchase of controlled entities | | | | - | | - | | (14) | | - | | (100) |
Proceeds from disposal of property and equipment |
|
|
| 7 |
| 1 |
| 24 |
| large |
| (71) |
Purchase of property and equipment |
|
|
| (103) |
| (97) |
| (69) |
| 6 |
| 49 |
Purchase of intangible assets |
|
|
| (595) |
| (677) |
| (422) |
| (12) |
| 41 |
Net cash provided by/(used in) investing activities |
|
|
| 4,282 |
| (7,408) |
| 10,215 |
| large |
| (58) |
Cash flows from financing activities |
|
|
|
|
| |
| |
| |
| |
Proceeds from debt issues (net of issue costs) |
|
|
| 41,825 |
| 33,397 |
| 39,912 |
| 25 |
| 5 |
Redemption of debt issues |
|
|
| (38,989) |
| (29,114) |
| (26,785) |
| 34 |
| 46 |
Payments for the principal portion of lease liabilities | | | | (205) | | (191) | | (236) | | 7 |
| (13) |
Issue of loan capital (net of issue costs) |
|
|
| - |
| 3,511 |
| 3,016 |
| (100) |
| (100) |
Redemption of loan capital |
|
|
| (285) |
| (1,305) |
| (1,039) |
| (78) |
| (73) |
Payment for off-market share buy-back | | | | - | | (1) | | (3,502) | | (100) |
| (100) |
Purchase of shares relating to share-based payment arrangements |
|
|
| (32) |
| - |
| (33) |
| - |
| (3) |
Purchase of Restricted Share Plan (RSP) treasury shares |
|
|
| (47) |
| (4) |
| (45) |
| large |
| 4 |
Payment of dividends |
|
|
| (2,050) |
| (2,136) |
| (2,201) |
| (4) |
| (7) |
Dividends paid to NCI |
|
|
| (17) |
| - |
| (5) |
| - |
| large |
Net cash provided by/(used in) financing activities |
|
|
| 200 |
| 4,157 |
| 9,082 |
| (95) |
| (98) |
Net increase/(decrease) in cash and balances with central banks |
|
|
| 12,397 |
| 1,241 |
| 31,759 |
| large |
| (61) |
Effect of exchange rate changes on cash and balances with central banks |
|
|
| 232 |
| 1,598 |
| (701) |
| (85) |
| large |
Net (increase)/decrease in cash and balances with central banks included in assets held for sale | | 17 | | - | | 8 | | (1) | | (100) | | (100) |
Cash and balances with central banks as at beginning of the period |
|
|
| 105,257 |
| 102,410 |
| 71,353 |
| 3 |
| 48 |
Cash and balances with central banks as at end of the period |
| |
| 117,886 |
| 105,257 |
| 102,410 |
| 12 |
| 15 |
The above consolidated cash flow statement should be read in conjunction with the accompanying notes.
3.7 | Notes to the consolidated financial statements |
Note 1. Financial statements preparation
This general purpose Interim Financial Report for the half year ended 31 March 2023 has been prepared in accordance with Australian Accounting Standard AASB 134 Interim Financial Reporting and the Corporations Act 2001 (Cth) and is also compliant with International Accounting Standard IAS 34 Interim Financial Reporting.
The Interim Financial Report does not include all the notes of the type normally included in an Annual Financial Report. Accordingly, this Interim Financial Report is to be read in conjunction with the Annual Financial Report for the year ended 30 September 2022 and any relevant public announcements made by Westpac during the interim reporting period in accordance with the continuous disclosure requirements of the Corporations Act 2001 (Cth) and the ASX Listing Rules.
The Interim Financial Report complies with current Australian Accounting Standards (AAS) as they relate to interim financial reports.
The Interim Financial Report was authorised for issue by the Board of Directors on 7 May 2023.
All amounts have been rounded in accordance with ASIC Corporations (Rounding in Financial/Directors’ Reports) Instrument 2016/191, to the nearest million dollars, unless otherwise stated.
Accounting policies
The accounting policies adopted in the preparation of this Interim Financial Report are consistent with those in the Annual Financial Report for the year ended 30 September 2022.
Critical accounting assumptions and estimates
In preparing the Interim Financial Report, the application of the Group’s accounting policies requires the use of judgement, assumptions and estimates.
The areas of judgement, assumptions and estimates in the Interim Financial Report, including the key sources of estimation uncertainty, are consistent with those in the Annual Financial Report for the year ended 30 September 2022. Details on specific judgements in relation to the calculation of provision for ECL including overlays are included in Note 9.
Amendments to Accounting Standards effective this period
No new accounting standards have been adopted by the Group for the half year ended 31 March 2023. There have been no amendments to existing accounting standards that have had a material impact to the Group.
Future developments in accounting standards
There are no new standards or amendments to existing standards that are not yet effective that are expected to have a material impact on the Group.
Interest rate benchmark reform
The IBOR reform and the enterprise-wide IBORs Transition Programme the Group has established to manage the impacts of this reform are detailed in Note 22.4 of the Group’s 2022 Annual Report.
A number of IBORs had a 31 December 2021 cessation date. The Group ceased to enter into new contracts referencing these rates and the Group’s exposures to contracts which reference these rates have either matured or transitioned to an alternative reference rate (ARR) with the exception of a small number of trades with immaterial balances.
Certain US LIBOR tenors have not yet transitioned to an ARR as they have a cessation date of 30 June 2023. The Group has monitoring controls in place to assess US LIBOR exposures on a regular basis and an overall Programme objective to transition away from USD LIBOR transactions.
For the Group’s derivative exposures, almost all have bilateral adherence from our counterparties to the fallback clauses issued by the International Swaps and Derivatives Association (ISDA) in the ISDA 2020 IBOR Fallbacks Protocol which provides a standardised process to identify the appropriate ARR at the relevant benchmark transition date.
For the Group’s non-derivative exposures, the Group is engaging with its customers and counterparties to transition or include appropriate fallback provisions. Due to the nature of these contracts, these fallback provisions will be determined bilaterally with the customer or counterparty rather than the standardised basis provided by the ISDA protocols applicable to our derivative contracts.
In addition, the Group’s exposure to new contracts referencing these rates is limited by regulatory guidelines whereby transactions from 31 December 2021 can only be entered into for risk management purposes.
Note 2. Segment reporting
Operating segments are presented on a basis consistent with information provided internally to Westpac’s key decision makers and reflect the management of the business, rather than the legal structure of the Group.
In prior periods the information provided internally to Westpac’s key decision makers presented an adjusted measure of profit that was referred to as “cash earnings” in assessing the financial performance of the Group.
Cash earnings adjustments to statutory profit after tax in prior periods included:
| ● | Fair value (gain)/loss on economic hedges (which do not qualify for hedge accounting under AAS) which may create a material timing difference on reported results but do not affect the Group’s earnings over the life of the hedge. |
| ● | The net ineffectiveness on qualifying hedges arises from the fair value movement in these hedges which reverses over time and therefore does not affect the Group’s profits over time. |
The Group ceased reporting this adjusted measure of profit in the current period and instead reports the Group and segments statutory profit after tax internally to Westpac’s key decision makers. The statutory amount of the net operating income and operating expenses segment line items are separated to show the balances excluding Notable Items and the total Notable Items for each of these categories. This is consistent with the information provided internally to Westpac’s key decision makers.
Notable Items are items that management believes are not reflective of the Group’s ongoing business performance and are grouped into the following broad categories:
| ● | Unrealised fair value gains and losses on economic hedges that do not qualify for hedge accounting |
| ● | Net ineffectiveness on qualifying hedges |
| ● | Large items that are not reflective of the Group’s ordinary operations. In individual reporting periods large items may include |
| - | Provisions for remediation, litigation, fines and penalties |
| - | The impact of asset sales and revaluations |
| - | The write-down of assets (including goodwill and capitalised software) |
| - | Restructuring costs |
Cash earnings adjustments which reclassified amounts between individual line items but did not impact on net cash earnings have also ceased. In prior periods these included:
| ● | Operating leases: Under AAS rental income on operating leases is presented gross of the depreciation of the assets subject to the lease. In prior periods, these amounts were offset in deriving non-interest income and operating expenses on a cash earnings basis; and |
| ● | Policyholder tax recoveries: Income and tax amounts that are grossed up to comply with the AAS covering Life Insurance Business (policyholder tax recoveries) were reversed in deriving income and taxation expense on a cash earnings basis. As the sale of the Group’s life insurance business was finalised in Full Year 2022 this adjustment is no longer relevant to the Group. |
For the 2023 Interim Financial Report we have updated our reporting and restated comparatives for this change.
Reportable operating segments
We are one of Australia’s leading providers of banking and selected financial services, operating under multiple brands, and predominantly in Australia and New Zealand, with a small presence in Europe, North America and Asia. We operate through a significant online capability supported by an extensive branch and ATM network, call centres and specialist relationship and product managers. Our operations comprise the following key segments:
| ● | Consumer and Business Banking: |
| – | Consumer provides banking products and services, including mortgages, credit cards, personal loans, and savings and deposit products to retail customers in Australia. |
| – | Business serves the banking needs of Australian small and commercial businesses, generally up to $200 million in exposure. |
| ● | Westpac Institutional Bank (WIB) delivers a broad range of financial products and services to corporate, institutional and government customers. |
| ● | Westpac New Zealand provides banking, and wealth products and services for consumer, business and institutional customers in New Zealand. |
| ● | Specialist Businesses was established in May 2020 by combining the operations that Westpac identified to be exited as part of its simplification agenda. Since its formation, nine business divestments have been completed. The remaining operations include Platforms, Westpac Pacific, margin lending and the retail auto finance business which is in run-off. |
| ● | Group Businesses includes support functions such as Treasury, Customer Services and Technology, Corporate Services and Enterprise Services. It also includes Group-wide elimination entries arising on consolidation, centrally raised provisions and other unallocated revenue and expenses. |
89 |
Notes to the consolidated financial statements
Note 2. Segment reporting (continued)
The tables present the segment results for the Group:
| | | | | | | | | | | | | | | | | | | | |
| | | | | | Consumer | | | | Westpac | | | | | | | | | | |
| | | | | | and | | Westpac | | New | | | | | | | | Notable | |
|
| | | | | | Business | | Institutional | | Zealand | | Specialist | | Group | | | | Items | | Income |
$m |
| Consumer |
| Business |
| Banking |
| Bank |
| (A$) |
| Businesses |
| Businesses |
| Total |
| (pre-tax) |
| statement |
Half Year March 2023 | | | | | | | | | | | | | | | | | | | | |
Net interest income |
| 4,693 |
| 2,043 |
| 6,736 | | 712 |
| 1,145 | | 216 |
| 393 | | 9,202 | | (89) |
| 9,113 |
Net fee income |
| 266 |
| 163 |
| 429 | | 296 |
| 82 | | 22 |
| (2) | | 827 | | - |
| 827 |
Net wealth management and insurance income | | 22 | | - | | 22 | | - | | 17 | | 308 | | - | | 347 | | - | | 347 |
Trading income | | - | | - | | - | | 375 | | 18 | | 22 | | (6) | | 409 | | (22) | | 387 |
Other income | | 9 | | 2 | | 11 | | 33 | | (1) | | 41 | | 2 | | 86 | | 243 | | 329 |
Notable Items | | - | | - | | - | | - | | - | | 243 | | (111) | | 132 | | (132) | | - |
Net operating income |
| 4,990 |
| 2,208 |
| 7,198 | | 1,416 |
| 1,261 | | 852 |
| 276 | | 11,003 | | - |
| 11,003 |
Operating expenses1 |
| (2,301) | | (914) | | (3,215) | | (617) | | (574) | | (280) | | (302) | | (4,988) | | - | | (4,988) |
Notable Items | | - | | - | | - | | - | | - | | - | | - | | - | | - | | - |
Total operating expenses | | (2,301) | | (914) | | (3,215) | | (617) | | (574) | | (280) | | (302) | | (4,988) | | - | | (4,988) |
Pre-provision profit | | 2,689 | | 1,294 | | 3,983 | | 799 | | 687 | | 572 | | (26) | | 6,015 | | - | | 6,015 |
Impairment (charges)/benefits |
| (170) | | (78) | | (248) | | 4 | | (142) | | (2) | | (2) | | (390) | | - | | (390) |
Profit before income tax expense |
| 2,519 |
| 1,216 |
| 3,735 | | 803 |
| 545 | | 570 |
| (28) | | 5,625 | | - |
| 5,625 |
Income tax (expense)/benefit2 |
| (756) | | (365) | | (1,121) | | (229) | | (154) | | (73) | | (43) | | (1,620) | | - | | (1,620) |
Net profit attributable to NCI |
| - |
| - |
| - | | - |
| - | | (4) |
| - | | (4) | | - |
| (4) |
Net profit attributable to owners of WBC |
| 1,763 |
| 851 |
| 2,614 | | 574 |
| 391 | | 493 |
| (71) | | 4,001 | | - |
| 4,001 |
Notable Items (post-tax)2 | | - | | - | | - | | - | | - | | 256 | | (78) | | 178 | | | | |
Balance sheet | | | | | | | | | | | | | | | | | | | | |
Loans | | 479,761 | | 85,568 | | 565,329 | | 84,697 | | 91,943 | | 8,086 | | (124) | | 749,931 | | | | |
Deposits and other borrowings | | 293,565 | | 133,442 | | 427,007 | | 112,662 | | 77,321 | | 10,046 | | 49,316 | | 676,352 | | | | |
| 1. | Impairment of assets (including goodwill and other intangible assets) were insignificant for all segments except for the following: |
| - | Specialist Businesses: First Half 2023: nil (Second Half 2022: nil, First Half 2022: $167 million); |
| - | Group Businesses: First Half 2023: nil (Second Half 2022: $159 million, First Half 2022: $7 million). |
| 2. | The tax impact of Notable Items was a reduction to income tax (expense)/benefit of $46 million in First Half 2023 (Second Half 2022: $135 million reduction, First Half 2022: $89 million addition). |
90 | WESTPAC GROUP 2023 INTERIM FINANCIAL RESULTS |
Notes to the consolidated financial statements
Note 2. Segment reporting (continued)
| | | | | | | | | | | | | | | | | | | | |
| | | | | | Consumer and | | Westpac | | Westpac New | | | | | | | | Notable | |
|
| | | | | | Business | | Institutional | | Zealand | | Specialist | | Group | | | | Items | | Income |
$m |
| Consumer |
| Business |
| Banking |
| Bank |
| (A$) |
| Businesses |
| Businesses |
| Total |
| (pre-tax) |
| statement |
Half Year Sept 2022 | | | | | | | | | | | | | | | | | | | | |
Net interest income |
| 4,608 |
| 1,704 |
| 6,312 | | 629 |
| 1,073 | | 232 |
| 339 | | 8,585 | | 288 |
| 8,873 |
Net fee income |
| 248 |
| 165 |
| 413 | | 303 |
| 99 | | 17 |
| (5) | | 827 | | (1) |
| 826 |
Net wealth management and insurance income | | 25 | | - | | 25 | | - | | 15 | | 375 | | - | | 415 | | (8) | | 407 |
Trading income | | - | | - | | - | | 249 | | 18 | | 21 | | (7) | | 281 | | 40 | | 321 |
Other income | | 15 | | 2 | | 17 | | 2 | | (4) | | 5 | | 46 | | 66 | | (1,117) | | (1,051) |
Notable Items | | - | | - | | - | | - | | (12) | | (1,120) | | 334 | | (798) | | 798 | | - |
Net operating income |
| 4,896 |
| 1,871 |
| 6,767 | | 1,183 |
| 1,189 | | (470) |
| 707 | | 9,376 | | - |
| 9,376 |
Operating expenses1 |
| (2,254) |
| (915) |
| (3,169) | | (607) |
| (538) | | (313) |
| (412) | | (5,039) | | (390) |
| (5,429) |
Notable Items | | (66) | | - | | (66) | | - | | - | | (150) | | (174) | | (390) | | 390 | | - |
Total operating expenses | | (2,320) | | (915) | | (3,235) | | (607) | | (538) | | (463) | | (586) | | (5,429) | | - | | (5,429) |
Pre-provision profit | | 2,576 | | 956 | | 3,532 | | 576 | | 651 | | (933) | | 121 | | 3,947 | | - | | 3,947 |
Impairment (charges)/benefits |
| (228) | | 15 | | (213) | | (27) | | 16 | | 29 | | (1) | | (196) | | - | | (196) |
Profit before income tax expense |
| 2,348 |
| 971 |
| 3,319 | | 549 |
| 667 | | (904) |
| 120 | | 3,751 | | - |
| 3,751 |
Income tax (expense)/benefit2 |
| (703) |
| (292) |
| (995) | | (168) |
| (192) | | 50 |
| (31) | | (1,336) | | - |
| (1,336) |
Net profit attributable to NCI |
| - | | - | | - | | - | | - | | (1) | | - | | (1) | | - | | (1) |
Net profit attributable to owners of WBC |
| 1,645 |
| 679 |
| 2,324 | | 381 |
| 475 | | (855) |
| 89 | | 2,414 | | - |
| 2,414 |
Notable Items (post-tax)2 | | (47) | | - | | (47) | | - | | (10) | | (1,112) | | 116 | | (1,053) | | | | |
Balance sheet | | | | | | | | | | | | | | | | | | | | |
Loans | | 474,604 | | 84,897 | | 559,501 | | 85,182 | | 85,285 | | 9,866 | | (187) | | 739,647 | | | | |
Deposits and other borrowings | | 280,574 | | 133,335 | | 413,909 | | 116,552 | | 71,202 | | 9,457 | | 48,009 | | 659,129 | | | | |
| 1. | Impairment of assets (including goodwill and other intangible assets) were insignificant for all segments except for the following: |
| - | Specialist Businesses: First Half 2023: nil (Second Half 2022: nil, First Half 2022: $167 million); |
| - | Group Businesses: First Half 2023: nil (Second Half 2022: $159 million, First Half 2022: $7 million). |
| 2. | The tax impact of Notable Items was a reduction to income tax (expense)/benefit of $46 million in First Half 2023 (Second Half 2022: $135 million reduction, First Half 2022: $89 million addition). |
91 |
Notes to the consolidated financial statements
Note 2. Segment reporting (continued)
| | | | | | | | | | | | | | | | | | | | |
| | | | | | Consumer | | | | Westpac | | | | | | | | | |
|
| | | | | | and | | Westpac | | New | | | | | | | | Notable | |
|
| | | | | | Business | | Institutional | | Zealand | | Specialist | | Group | | | | Items | | Income |
$m |
| Consumer |
| Business |
| Banking |
| Bank |
| (A$) |
| Businesses |
| Businesses |
| Total |
| (pre-tax) |
| statement |
Half Year March 2022 | | | | | | | | | | | | | | | | | | | | |
Net interest income |
| 4,377 |
| 1,323 |
| 5,700 | | 481 |
| 1,034 | | 242 |
| 564 | | 8,021 | | 267 |
| 8,288 |
Net fee income |
| 265 |
| 162 |
| 427 | | 302 |
| 86 | | 29 |
| 1 | | 845 | | - |
| 845 |
Net wealth management and insurance income | | 26 | | - | | 26 | | - | | 39 | | 379 | | - | | 444 | | (43) | | 401 |
Trading income | | - | | - | | - | | 267 | | 25 | | 20 | | 27 | | 339 | | 4 | | 343 |
Other income | | 33 | | 3 | | 36 | | 23 | | 1 | | 14 | | 8 | | 82 | | 271 | | 353 |
Notable Items | | - | | - | | - | | - | | 132 | | 109 | | 258 | | 499 | | (499) | | - |
Net operating income |
| 4,701 |
| 1,488 |
| 6,189 | | 1,073 |
| 1,317 | | 793 |
| 858 | | 10,230 | | - |
| 10,230 |
Operating expenses1 |
| (2,369) |
| (984) |
| (3,353) | | (581) |
| (534) | | (370) |
| (304) | | (5,142) | | (231) |
| (5,373) |
Notable Items | | - | | - | | - | | - | | - | | (215) | | (16) | | (231) | | 231 | | - |
Total operating expenses |
| (2,369) |
| (984) |
| (3,353) | | (581) |
| (534) | | (585) |
| (320) | | (5,373) | | - |
| (5,373) |
Pre-provision profit | | 2,332 | | 504 | | 2,836 | | 492 | | 783 | | 208 | | 538 | | 4,857 | | - | | 4,857 |
Impairment (charges)/benefits |
| 27 |
| (158) |
| (131) | | (58) |
| 9 | | 38 |
| 3 | | (139) | | - | | (139) |
Profit before income tax expense |
| 2,359 |
| 346 |
| 2,705 | | 434 |
| 792 | | 246 |
| 541 | | 4,718 | | - | | 4,718 |
Income tax (expense)/benefit2 |
| (713) |
| (107) |
| (820) | | (128) |
| (190) | | (111) |
| (185) | | (1,434) | | - | | (1,434) |
Net profit attributable to NCI |
| - |
| - |
| - | | - |
| - | | (3) |
| (1) | | (4) | | - | | (4) |
Net profit attributable to owners of WBC |
| 1,646 |
| 239 |
| 1,885 | | 306 |
| 602 | | 132 |
| 355 | | 3,280 | | - | | 3,280 |
Notable Items (post-tax)2 | | - | | - | | - | | - | | 129 | | (114) | | 164 | | 179 | | | | |
Balance sheet | | | | | | | | | | | | | | | | | | | | |
Loans | | 465,697 | | 80,949 | | 546,646 | | 73,950 | | 87,361 | | 11,730 | | (131) | | 719,556 | | | | |
Deposits and other borrowings | | 276,161 | | 134,716 | | 410,877 | | 104,661 | | 75,622 | | 8,362 | | 46,084 | | 645,606 | | | | |
| 1. | Impairment of assets (including goodwill and other intangible assets) were insignificant for all segments except for the following: |
| - | Specialist Businesses: First Half 2023: nil (Second Half 2022: nil, First Half 2022: $167 million); |
| - | Group Businesses: First Half 2023: nil (Second Half 2022: $159 million, First Half 2022: $7 million). |
| 2. | The tax impact of Notable Items was a reduction to income tax (expense)/benefit of $46 million in First Half 2023 (Second Half 2022: $135 million reduction, First Half 2022: $89 million addition). |
| | | | | | | | | | |
|
| Half Year |
| Half Year |
| Half Year |
| % Mov’t | ||
| | March | | Sept | | March | | Mar 23 |
| Mar 23 |
$m | | 2023 | | 2022 | | 2022 | | - Sept 22 |
| - Mar 22 |
Notable Items after tax |
| | | | | | | | | |
Economic hedges |
| (121) | | 266 | | 204 | | large |
| large |
Hedge ineffectiveness | | 43 | | (33) | | (19) | | large | | large |
Provisions for litigation, fines and penalties3 |
| - | | (68) | | (65) | | (100) |
| (100) |
Asset sales and revaluations |
| 256 | | (1,089) | | 213 | | large |
| 20 |
The write-down of assets |
| - | | (129) | | (154) | | (100) |
| (100) |
Total Notable Items after tax |
| 178 | | (1,053) | | 179 | | large |
| (1) |
| 3. | Second Half 2022 and First Half 2022 also included provisions for estimated customer refunds and payments and associated costs. |
92 | WESTPAC GROUP 2023 INTERIM FINANCIAL RESULTS |
Notes to the consolidated financial statements
Note 3. Net interest income and average balance sheet and interest rates
Net interest income
| | | | | | | | | | |
|
| Half Year |
| Half Year |
| Half Year |
| % Mov’t | ||
| | March | | Sept | | March | | Mar 23 |
| Mar 23 |
$m | | 2023 | | 2022 | | 2022 | | - Sept 22 |
| - Mar 22 |
Interest income1 |
| |
|
|
| |
|
|
|
|
Calculated using the effective interest method | | | | | | | | | | |
Cash and balances with central banks |
| 1,806 |
| 637 |
| 46 |
| 184 |
| large |
Collateral paid |
| 269 |
| 64 |
| 4 |
| large |
| large |
Investment securities |
| 918 |
| 620 |
| 506 |
| 48 |
| 81 |
Loans |
| 16,276 |
| 11,549 |
| 9,547 |
| 41 |
| 70 |
Other financial assets |
| 10 |
| 2 |
| - |
| large |
| - |
Assets held for sale | | - | | - | | 6 | | - | | (100) |
Total interest income calculated using the effective interest method | | 19,279 | | 12,872 | | 10,109 | | 50 | | 91 |
Other |
| |
| |
| |
| |
| |
Net ineffectiveness on qualifying hedges |
| 62 |
| (50) |
| (27) |
| large |
| large |
Trading securities and financial assets measured at FVIS |
| 498 |
| 224 |
| 123 |
| 122 |
| large |
Total other |
| 560 |
| 174 |
| 96 |
| large |
| large |
Total interest income |
| 19,839 |
| 13,046 |
| 10,205 |
| 52 |
| 94 |
Interest expense |
| |
| |
| |
| |
| |
Calculated using the effective interest method | | | | | | | | | | |
Collateral received |
| (142) |
| (60) |
| (4) |
| 137 |
| large |
Deposits and other borrowings |
| (6,151) |
| (2,098) |
| (712) |
| 193 |
| large |
Debt issues |
| (2,268) |
| (1,406) |
| (851) |
| 61 |
| 167 |
Loan capital |
| (620) |
| (586) |
| (440) |
| 6 |
| 41 |
Other financial liabilities |
| (234) |
| (117) |
| (45) |
| 100 |
| large |
Total interest expense calculated using the effective interest method |
| (9,415) |
| (4,267) |
| (2,052) |
| 121 |
| large |
Other |
| |
| |
| |
| |
| |
Deposits and other borrowings |
| (801) |
| (350) |
| (49) |
| 129 |
| large |
Trading liabilities2 |
| (188) |
| 717 |
| 452 |
| large |
| large |
Debt issues |
| (116) |
| (62) |
| (31) |
| 87 |
| large |
Bank levy |
| (164) |
| (163) |
| (177) |
| 1 |
| (7) |
Other interest expense | | (42) | | (48) | | (60) | | (13) | | (30) |
Total other |
| (1,311) |
| 94 |
| 135 |
| large |
| large |
Total interest expense |
| (10,726) |
| (4,173) |
| (1,917) |
| 157 |
| large |
Net interest income |
| 9,113 |
| 8,873 |
| 8,288 |
| 3 |
| 10 |
| 1. | Included items relating to compliance, regulation and remediation costs recognised as a $9 million addition to net interest income (Second Half 2022: $8 million reduction, First Half 2022: $9 million addition). Refer to Note 13 for further details. |
| 2. | Includes net impact of Treasury balance sheet management activities. |
93 |
Notes to the consolidated financial statements
Average balance sheet and interest rates
| | | | | | | | | | | | | | | | | | |
| | Half Year March 2023 | | Half Year Sept 2022 | | Half Year March 2022 | ||||||||||||
|
| Average |
| |
| Average |
| Average |
| |
| Average |
| Average |
| |
| Average |
| | balance | | Interest | | rate | | balance | | Interest | | rate | | balance | | Interest | | rate |
| | $m | | $m | | % | | $m | | $m | | % | | $m | | $m | | % |
Assets |
|
|
|
|
|
|
|
|
|
|
|
|
|
|
|
|
|
|
Interest earning assets |
|
|
|
|
|
|
|
|
|
|
|
|
|
|
|
|
|
|
Loans1 |
| 699,735 | | 16,276 | | 4.7 | | 683,786 | | 11,549 | | 3.4 | | 669,815 | | 9,547 | | 2.9 |
Housing | | 481,538 | | 10,174 | | 4.2 | | 472,098 | | 7,349 | | 3.1 | | 468,207 | | 6,317 | | 2.7 |
Personal | | 13,485 | | 556 | | 8.3 | | 14,471 | | 582 | | 8.0 | | 15,618 | | 618 | | 7.9 |
Business | | 204,712 | | 5,546 | | 5.4 | | 197,217 | | 3,618 | | 3.7 | | 185,990 | | 2,612 | | 2.8 |
Trading securities and financial assets measured at FVIS |
| 29,044 | | 498 | | 3.4 | | 23,426 | | 224 | | 1.9 | | 22,243 | | 123 | | 1.1 |
Investment securities |
| 76,015 | | 918 | | 2.4 | | 77,783 | | 620 | | 1.6 | | 77,779 | | 506 | | 1.3 |
Other interest earning assets2 | | 129,414 | | 2,147 | | 3.3 | | 116,786 | | 653 | | 1.1 | | 101,392 | | 23 | | - |
Assets held for sale | | - | | - | | - | | 5 | | - | | - | | 846 | | 6 | | 1.4 |
Total interest earning assets and interest income |
| 934,208 | | 19,839 | | 4.3 | | 901,786 | | 13,046 | | 2.9 | | 872,075 | | 10,205 | | 2.3 |
Non-interest earning assets |
| |
| | | |
| |
| |
| |
| |
| | | |
Derivative financial instruments |
| 25,290 |
| | | |
| 28,479 |
| | | |
| 18,283 |
| | | |
Assets held for sale | | 60 |
| | | | | 1,843 | | | | | | 3,048 |
| | | |
All other assets3 |
| 58,365 |
| | | |
| 59,492 |
| | | |
| 64,427 |
| | | |
Total non-interest earning assets |
| 83,715 |
| | | |
| 89,814 |
| | | |
| 85,758 |
| | | |
Total assets |
| 1,017,923 |
| | | |
| 991,600 |
| | | |
| 957,833 |
| | | |
Liabilities | | | | | | | | | | | | | | | | | | |
Interest bearing liabilities |
| | | | | |
| |
| |
| |
| | | | | |
Deposits and other borrowings |
| 599,545 |
| 6,952 | | 2.3 |
| 581,038 |
| 2,448 |
| 0.8 |
| 570,842 |
| 761 | | 0.3 |
Certificates of deposit | | 45,447 | | 799 | | 3.5 | | 48,068 | | 347 | | 1.4 | | 46,544 | | 48 | | 0.2 |
At call | | 386,455 | | 3,520 | | 1.8 | | 389,417 | | 1,158 | | 0.6 | | 391,719 | | 342 | | 0.2 |
Term | | 167,643 | | 2,633 | | 3.1 | | 143,553 | | 943 | | 1.3 | | 132,579 | | 371 | | 0.6 |
Repurchase agreements |
| 41,310 |
| 228 | | 1.1 |
| 39,807 |
| 112 |
| 0.6 |
| 35,740 |
| 38 | | 0.2 |
Loan capital |
| 33,649 |
| 620 | | 3.7 |
| 30,910 |
| 586 |
| 3.8 |
| 30,504 |
| 440 | | 2.9 |
Other interest bearing liabilities4 |
| 174,925 |
| 2,926 | | 3.4 |
| 167,147 |
| 1,027 |
| 1.2 |
| 149,307 |
| 678 | | 0.9 |
Total interest bearing liabilities and interest expense |
| 849,429 |
| 10,726 | | 2.5 |
| 818,902 |
| 4,173 |
| 1.0 |
| 786,393 |
| 1,917 | | 0.5 |
Non-interest bearing liabilities |
| |
| | | |
| |
| |
| |
| |
| | | |
Deposits and other borrowings |
| 68,678 |
| | | |
| 69,082 |
| | | |
| 69,413 |
| | | |
Derivative financial instruments |
| 29,765 |
| | | |
| 30,434 |
| | | |
| 19,035 |
| | | |
Liabilities held for sale | | 26 |
| | | | | 590 | | | | | | 775 |
| | | |
All other liabilities5 |
| (969) |
| | | |
| 3,072 |
| | | |
| 11,087 |
| | | |
Total non-interest bearing liabilities |
| 97,500 |
| | | |
| 103,178 |
| | | |
| 100,310 |
| | | |
Total liabilities |
| 946,929 |
| | | |
| 922,080 |
| | | |
| 886,703 |
| | | |
Shareholders’ equity |
| 70,947 |
| | | |
| 69,467 |
| | | |
| 71,073 |
| | | |
NCI |
| 47 |
| | | |
| 53 |
| | | |
| 57 |
| | | |
Total equity |
| 70,994 |
| | | |
| 69,520 |
| | | |
| 71,130 |
| | | |
Total liabilities and equity | | 1,017,923 | | | | | | 991,600 | | | | | | 957,833 | | | | |
Loans |
| |
| | | |
| |
| |
| |
| |
| | | |
Australia |
| 602,493 |
| 13,791 | | 4.6 |
| 590,428 |
| 9,679 |
| 3.3 |
| 574,439 |
| 8,015 | | 2.8 |
New Zealand |
| 90,605 |
| 2,304 | | 5.1 |
| 86,989 |
| 1,755 |
| 4.0 |
| 89,021 |
| 1,448 | | 3.3 |
Other overseas |
| 6,637 |
| 181 | | 5.5 |
| 6,369 |
| 115 |
| 3.6 |
| 6,355 |
| 84 | | 2.7 |
Deposits and other borrowings |
| |
| | | |
| |
| |
| |
| |
| | | |
Australia |
| 516,397 |
| 5,547 | | 2.2 |
| 498,319 |
| 1,760 |
| 0.7 |
| 489,642 |
| 489 | | 0.2 |
New Zealand |
| 63,422 |
| 1,017 | | 3.2 |
| 60,312 |
| 522 |
| 1.7 |
| 61,263 |
| 243 | | 0.8 |
Other overseas |
| 19,726 |
| 388 | | 3.9 |
| 22,407 |
| 166 |
| 1.5 |
| 19,937 |
| 29 | | 0.3 |
| 1. | Loans are net of Stage 3 provision for ECL, where interest income is determined based on their carrying value. Stage 1 and 2 provisions for ECL are not included in the average interest earning assets balance, as interest income is determined based on the gross value of loans and other receivables. |
| 2. | Interest income includes net ineffectiveness on qualifying hedges. |
| 3. | Includes property and equipment, intangible assets, deferred tax assets, non-interest bearing loans relating to mortgage offset accounts and all other non-interest earning assets. |
| 4. | Includes net impact of Treasury balance sheet management activities and the Bank Levy. |
| 5. | Includes other financial liabilities, provisions, current and deferred tax liabilities and all other non-interest bearing liabilities. |
94 | WESTPAC GROUP 2023 INTERIM FINANCIAL RESULTS |
Notes to the consolidated financial statements
Note 4. Non-interest income1
| | | | | | | | | | |
|
| Half Year | | Half Year | | Half Year |
| % Mov’t | ||
| | March | | Sept | | March | | Mar 23 |
| Mar 23 |
$m | | 2023 | | 2022 | | 2022 | | - Sept 22 |
| - Mar 22 |
Net fees |
|
|
| | |
|
|
|
|
|
Facility fees |
| 338 |
| 342 | | 344 |
| (1) |
| (2) |
Transaction fees |
| 589 |
| 576 | | 556 |
| 2 |
| 6 |
Other non-risk fee income |
| 68 |
| 50 | | 72 |
| 36 |
| (6) |
Fee income |
| 995 |
| 968 | | 972 |
| 3 |
| 2 |
Credit card loyalty programs |
| (81) |
| (66) | | (60) |
| 23 |
| 35 |
Transaction fee related expenses |
| (87) |
| (76) | | (67) |
| 14 |
| 30 |
Fee expenses |
| (168) |
| (142) | | (127) |
| 18 |
| 32 |
Net fees |
| 827 |
| 826 | | 845 |
| - |
| (2) |
| | | | | | | | | | |
Net wealth management and insurance |
| |
| |
| |
| |
| |
Net wealth management income |
| 347 |
| 365 |
| 361 |
| (5) |
| (4) |
Life insurance premium income |
| - |
| 314 |
| 520 |
| (100) |
| (100) |
Life insurance investment and other income2 |
| - |
| (12) |
| (129) |
| (100) |
| (100) |
Total insurance premium, investment and other income |
| - |
| 302 |
| 391 |
| (100) | | (100) |
Life insurance claims, changes in life insurance liabilities and other expenses |
| - |
| (260) |
| (351) |
| (100) |
| (100) |
Total insurance claims, changes in insurance liabilities and other expenses |
| - |
| (260) |
| (351) |
| (100) |
| (100) |
Net wealth management and insurance |
| 347 |
| 407 |
| 401 |
| (15) |
| (13) |
| | | | | | | | | | |
Trading |
| 387 |
| 321 |
| 343 |
| 21 |
| 13 |
| | | | | | | | | | |
Other | | | | | | | | | | |
Dividends received from other entities |
| - |
| 1 |
| 3 |
| (100) |
| (100) |
Net gain/(loss) on sale/derecognition of associates |
| 1 |
| 12 |
| 13 |
| (92) |
| (92) |
Net gain/(loss) on disposal of assets |
| - |
| (1) |
| (2) |
| (100) |
| (100) |
Net gain/(loss) on hedging of overseas operations |
| - |
| 1 |
| (1) |
| (100) |
| (100) |
Net gain/(loss) on derivatives held for risk management purposes3 |
| - |
| 2 |
| 7 |
| (100) |
| (100) |
Net gain/(loss) on financial instruments measured at fair value |
| 29 |
| (4) |
| 16 |
| large |
| 81 |
Net gain/(loss) on disposal of controlled entities and other businesses4 | | 268 | | (1,112) | | 289 | | large | | (7) |
Rental income on operating leases |
| 5 |
| 7 |
| 9 |
| (29) |
| (44) |
Share of associates’ net profit/(loss) |
| (3) |
| (4) |
| (3) |
| (25) |
| - |
Other |
| 29 |
| 47 |
| 22 |
| (38) |
| 32 |
Total other |
| 329 |
| (1,051) |
| 353 |
| large |
| (7) |
Total non-interest income |
| 1,890 |
| 503 |
| 1,942 |
| large |
| (3) |
| 1. | Includes items relating to compliance, regulation and remediation costs recognised as an addition in non-risk fee income, net wealth management income and other income totalled $8 million for First Half 2023 (Second Half 2022: $56 million reduction, First Half 2022: $8 million reduction). Refer to Note 13 for further details. |
| 2. | Includes policyholder tax recoveries. |
| 3. | Income from derivatives held for risk management purposes reflects the impact of economic hedges of earnings. |
4. | First Half 2023 included a profit on sale of $243 million for AAML, Second Half 2022 included $1,112 million loss on sale of Australian life insurance business, while First Half 2022 included $170 million gain on sale of auto finance and $119 million gain on sale of NZ life insurance. |
95 |
Notes to the consolidated financial statements
Note 5. Operating expenses1
| | | | | | | | | | |
|
| Half Year | | Half Year | | Half Year |
| % Mov’t | ||
| | March | | Sept | | March | | Mar 23 |
| Mar 23 |
$m | | 2023 | | 2022 | | 2022 | | - Sept 22 |
| - Mar 22 |
Staff |
|
|
| | |
| |
|
|
|
Employee remuneration, entitlements and on-costs |
| 2,545 |
| 2,527 | | 2,584 | | 1 |
| (2) |
Superannuation |
| 270 |
| 255 | | 278 | | 6 |
| (3) |
Share-based payments |
| 44 |
| 42 | | 46 | | 5 |
| (4) |
Restructuring costs |
| 33 |
| 60 | | 74 | | (45) |
| (55) |
Total staff |
| 2,892 |
| 2,884 | | 2,982 | | - |
| (3) |
Occupancy |
| |
| | | | | |
| |
Operating lease rentals |
| 81 |
| 91 | | 79 | | (11) |
| 3 |
Depreciation and impairment of property and equipment2 |
| 227 |
| 365 | | 261 | | (38) |
| (13) |
Other |
| 64 |
| 60 | | 58 | | 7 |
| 10 |
Total occupancy |
| 372 |
| 516 | | 398 | | (28) |
| (7) |
Technology |
| |
| | | | | |
| |
Amortisation and impairment of software assets2 |
| 250 |
| 318 | | 337 | | (21) |
| (26) |
Depreciation and impairment of IT equipment |
| 58 |
| 92 | | 85 | | (37) |
| (32) |
Technology services |
| 352 |
| 377 | | 342 | | (7) |
| 3 |
Software maintenance and licences |
| 296 |
| 258 | | 248 | | 15 |
| 19 |
Telecommunications |
| 59 |
| 72 | | 72 | | (18) |
| (18) |
Data processing |
| 39 |
| 40 | | 41 | | (3) |
| (5) |
Total technology |
| 1,054 |
| 1,157 | | 1,125 | | (9) |
| (6) |
Other |
| |
| | | | | |
| |
Professional and processing services |
| 413 |
| 554 | | 460 | | (25) |
| (10) |
Amortisation and impairment of other intangible assets and deferred expenditure2 |
| 1 |
| 1 | | 122 | | - |
| (99) |
Postage and stationery |
| 67 |
| 70 | | 74 | | (4) |
| (9) |
Advertising |
| 79 |
| 77 | | 81 | | 3 |
| (2) |
Non-lending losses |
| 1 |
| 59 | | 45 | | (98) |
| (98) |
Other expenses |
| 109 |
| 111 | | 86 | | (2) |
| 27 |
Total other |
| 670 |
| 872 | | 868 | | (23) |
| (23) |
Total operating expenses |
| 4,988 |
| 5,429 | | 5,373 | | (8) |
| (7) |
| 1. | Operating expenses included items relating to compliance, regulation and remediation costs were a reduction of $6 million (Second Half 2022: $46 million addition; First Half 2022: $17 million addition). Refer to Note 13 for further details. |
| 2. | Nil impairment expenses for the First Half 2023. Significant impairment expenses in comparative periods included: |
| ● | Property and equipment (Second Half 2022: $116 million, First Half 2022: $1 million); |
| ● | Capitalised software assets (Second Half 2022: $56 million, First Half 2022: $54 million); |
| ● | Goodwill and other intangible assets (Second Half 2022: nil, First Half 2022: $122 million). |
96 | WESTPAC GROUP 2023 INTERIM FINANCIAL RESULTS |
Notes to the consolidated financial statements
Note 6. Income tax
The following table reconciles income tax expense to the profit before income tax:
| | | | | | | | | | |
|
| Half Year |
| Half Year |
| Half Year |
| % Mov’t | ||
| | March | | Sept | | March | | Mar 23 |
| Mar 23 |
$m | | 2023 | | 2022 | | 2022 | | - Sept 22 |
| - Mar 22 |
Profit before income tax |
| 5,625 | | 3,751 | | 4,718 | | 50 |
| 19 |
Tax at the Australian company tax rate of 30% |
| 1,688 | | 1,126 | | 1,415 | | 50 |
| 19 |
The effect of amounts which are not deductible/(assessable) in calculating taxable income: |
| | | | |
| | |
| |
Hybrid capital distributions |
| 54 | | 39 | | 28 | | 38 |
| 93 |
Life insurance: |
| | | | |
| | |
|
|
Tax adjustment on policyholder earnings |
| - | | (1) | | - | | (100) |
| - |
Other non-assessable items |
| (1) | | (63) | | (34) | | (98) |
| (97) |
Other non-deductible items |
| 10 | | 362 | | 47 | | (97) |
| (79) |
Adjustment for overseas tax rates |
| (16) | | (16) | | (15) | | - |
| 7 |
Income tax (over)/under provided in prior periods |
| - | | (84) | | 7 | | (100) |
| (100) |
Other items1 |
| (115) | | (27) | | (14) | | large |
| large |
Total income tax expense2 |
| 1,620 | | 1,336 | | 1,434 | | 21 |
| 13 |
Effective income tax rate |
| 28.80% | | 35.62% | | 30.39% | | large |
| (159 bps) |
1.First Half 2023 included $86 million related to tax losses on sale of AAML.
2.As the Bank levy is not a levy on income, it is not included in income tax. It is included in interest expense in Note 3.
Note 7. Earnings per share
Basic earnings per share (EPS) is calculated by dividing the net profit attributable to owners of WBC by the weighted average number of ordinary shares on issue during the period, adjusted for treasury shares. Diluted EPS is calculated by adjusting the basic EPS by assuming all dilutive potential ordinary shares are converted.
| | | | | | | | | | | | |
|
| Half Year March 2023 |
| Half Year Sept 2022 |
| Half Year March 2022 | ||||||
|
| Basic |
| Diluted |
| Basic |
| Diluted |
| Basic |
| Diluted |
Net profit attributable to owners of WBC ($m) |
| 4,001 |
| 4,001 |
| 2,414 |
| 2,414 |
| 3,280 |
| 3,280 |
Adjustment for RSP dividends3 |
| (2) |
| - |
| (1) |
| - |
| (2) |
| - |
Adjustment for potential dilution: |
| |
| |
| |
| |
| |
| |
Distributions to convertible loan capital holders4 |
| - |
| 186 |
| - |
| 133 |
| - |
| 100 |
Adjusted net profit attributable to owners of WBC |
| 3,999 | | 4,187 | | 2,413 | | 2,547 | | 3,278 | | 3,380 |
Weighted average number of ordinary shares (millions) |
| | | | | | | | | | | |
Weighted average number of ordinary shares on issue |
| 3,506 | | 3,506 | | 3,501 | | 3,501 | | 3,626 | | 3,626 |
Treasury shares (including RSP share rights)3 |
| (5) | | (5) | | (5) | | (5) | | (4) | | (4) |
Adjustment for potential dilution: |
| | | | | | | | | | | |
Share-based payments |
| - | | 3 | | - | | 4 | | - | | 3 |
Convertible loan capital4 |
| - | | 384 | | - | | 361 | | - | | 321 |
Adjusted weighted average number of ordinary shares |
| 3,501 | | 3,888 | | 3,496 | | 3,861 | | 3,622 | | 3,946 |
Earnings per ordinary share (cents) |
| 114.2 | | 107.7 | | 69.0 | | 66.0 | | 90.5 | | 85.7 |
3. | Some shares under the RSP have not vested and are not outstanding ordinary shares but do receive dividends. These RSP dividends are deducted to show the profit attributable to ordinary shareholders. |
4. | The Group has issued convertible loan capital which may convert into ordinary shares in the future. These convertible loan capital instruments are potentially dilutive instruments, and diluted EPS is therefore calculated as if the instruments had been converted at the beginning of the respective period or, if later, the instruments’ issue date. |
97 |
Notes to the consolidated financial statements
Note 8. Loans
| | | | | | | | | | |
|
| As at |
| As at |
| As at |
| % Mov’t | ||
| | 31 March | | 30 Sept | | 31 March | | Mar 23 |
| Mar 23 |
$m | | 2023 | | 2022 | | 2022 | | - Sept 22 |
| - Mar 22 |
Australia |
|
|
| | |
| |
|
|
|
Housing |
| 472,570 |
| 467,382 | | 458,278 | | 1 |
| 3 |
Personal |
| 12,028 |
| 12,832 | | 14,128 | | (6) |
| (15) |
Business |
| 169,891 |
| 170,636 | | 156,763 | | - |
| 8 |
Total Australia |
| 654,489 |
| 650,850 | | 629,169 | | 1 |
| 4 |
New Zealand |
| |
| | | | | |
| |
Housing |
| 61,081 |
| 56,211 | | 57,780 | | 9 |
| 6 |
Personal |
| 1,116 |
| 1,058 | | 1,116 | | 5 |
| - |
Business |
| 30,668 |
| 28,855 | | 29,294 | | 6 |
| 5 |
Total New Zealand |
| 92,865 |
| 86,124 | | 88,190 | | 8 |
| 5 |
Total other overseas |
| 7,047 |
| 6,879 | | 6,392 | | 2 |
| 10 |
Gross loans |
| 754,401 |
| 743,853 | | 723,751 | | 1 |
| 4 |
Provision for ECL on loans (Note 9) | | (4,470) | | (4,206) | | (4,195) | | 6 | | 7 |
Total loans1,2 |
| 749,931 |
| 739,647 |
| 719,556 |
| 1 |
| 4 |
| 1. | Total loans included securitised loans of $4,019 million as at 31 March 2023 (30 September 2022: $4,747 million, 31 March 2022: $4,808 million). The level of securitised loans excludes loans where Westpac is the holder of related debt securities. |
| 2. | Total loans included assets pledged for the covered bond programs of $40,483 million as at 31 March 2023 (30 September 2022: $38,455 million, 31 March 2022: $35,052 million). |
Note 9. Provision for expected credit losses
Loans and credit commitments
The following table shows the provision for ECL on loans and credit commitments by stage:
| | | | | | | | | | |
| | As at | | As at | | As at | | % Mov’t | ||
| | 31 March | | 30 Sept | | 31 March | | Mar 23 |
| Mar 23 |
$m |
| 2023 |
| 2022 |
| 2022 |
| - Sept 22 |
| - Mar 22 |
Performing - Stage 1 |
| 891 |
| 885 |
| 1,078 |
| 1 |
| (17) |
Performing - Stage 2 |
| 2,628 |
| 2,341 |
| 2,107 |
| 12 |
| 25 |
Non-performing - Stage 3 |
| 1,393 |
| 1,399 |
| 1,490 |
| - |
| (7) |
Total provision for ECL on loans and credit commitments |
| 4,912 |
| 4,625 |
| 4,675 |
| 6 |
| 5 |
Presented as: |
| |
| |
| |
| |
| |
Provision for ECL on loans (Note 8) |
| 4,470 |
| 4,206 |
| 4,195 |
| 6 |
| 7 |
Provision for ECL on credit commitments (Note 13) |
| 442 |
| 419 |
| 480 |
| 5 |
| (8) |
Total provision for ECL on loans and credit commitments |
| 4,912 |
| 4,625 |
| 4,675 |
| 6 |
| 5 |
Of which: |
| |
| | | |
| |
| |
Individually assessed provisions |
| 382 |
| 452 |
| 501 |
| (15) |
| (24) |
Collectively assessed provisions |
| 4,530 |
| 4,173 |
| 4,174 |
| 9 |
| 9 |
Total provision for ECL on loans and credit commitments |
| 4,912 |
| 4,625 |
| 4,675 |
| 6 |
| 5 |
Gross loans and credit commitments | | 962,804 | | 943,952 | | 924,937 | | 2 | | 4 |
Coverage ratio on loans (%) | | 0.59% | | 0.57% | | 0.58% | | 2 bps | | 1 bps |
Coverage ratio on loans and credit commitments (%) | | 0.51% | | 0.49% | | 0.51% | | 2 bps |
| - |
98 | WESTPAC GROUP 2023 INTERIM FINANCIAL RESULTS |
Notes to the consolidated financial statements
Note 9. Provision for expected credit losses (continued)
Movement in provision for ECL on loans and credit commitments
The reconciliation of the provision for ECL tables for loans and credit commitments has been determined by an aggregation of monthly movements over the year. The key line items in the reconciliation represent the following:
| ● | “Transfers between stages” lines represent transfers between Stage 1, Stage 2 and Stage 3 prior to remeasurement of the provision for ECL; |
| ● | “Business activity during the period” line represents new accounts originated during the period net of those that were de-recognised due to final repayments during the period; |
| ● | “Net remeasurement of provision for ECL” line represents the impact on the provision for ECL due to changes in credit quality during the year (including transfers between stages), changes in portfolio overlays, changes due to forward-looking economic scenarios and partial repayments and additional draw-downs on existing facilities during the period; and |
| ● | “Write-offs” represent a reduction in the provision for ECL as a result of de-recognition of exposures where there is no reasonable expectation of full recovery. |
| | | | | | | | |
| | | | | | Non- | | |
Consolidated | | Performing | | performing | | | ||
$m |
| Stage 1 |
| Stage 2 | | Stage 3 |
| Total |
Balance as at 30 September 2021 | | 936 | | 2,091 | | 1,972 | | 4,999 |
Transfers to Stage 1 | | 461 | | (398) | | (63) | | - |
Transfers to Stage 2 | | (102) | | 509 | | (407) | | - |
Transfers to Stage 3 | | (8) | | (198) | | 206 | | - |
Business activity during the period | | 255 | | (149) | | (200) | | (94) |
Net remeasurement of provision for ECL | | (463) | | 264 | | 535 | | 336 |
Write-offs | | - | | - | | (566) | | (566) |
Exchange rate and other adjustments | | (1) | | (12) | | 13 | | - |
Balance as at 31 March 2022 | | 1,078 | | 2,107 | | 1,490 | | 4,675 |
Transfers to Stage 1 | | 451 | | (394) | | (57) | | - |
Transfers to Stage 2 | | (133) | | 493 | | (360) | | - |
Transfers to Stage 3 | | (6) | | (185) | | 191 | | - |
Business activity during the period | | 99 | | (95) | | (140) | | (136) |
Net remeasurement of provision for ECL | | (603) | | 425 | | 594 | | 416 |
Write-offs | | - | | - | | (368) | | (368) |
Exchange rate and other adjustments | | (1) | | (10) | | 49 | | 38 |
Balance as at 30 September 2022 | | 885 | | 2,341 | | 1,399 | | 4,625 |
Transfers to Stage 1 | | 694 | | (619) | | (75) | | - |
Transfers to Stage 2 | | (159) | | 408 | | (249) | | - |
Transfers to Stage 3 | | (4) | | (247) | | 251 | | - |
Business activity during the period | | 136 | | 54 | | (136) | | 54 |
Net remeasurement of provision for ECL | | (670) | | 677 | | 456 | | 463 |
Write-offs | | - | | - | | (271) | | (271) |
Exchange rate and other adjustments | | 9 | | 14 | | 18 | | 41 |
Balance as at 31 March 2023 | | 891 | | 2,628 | | 1,393 | | 4,912 |
The following table provides further details of the provision for ECL on loans and credit commitments by class and stage:
| | | | | | | | |
|
| |
| |
| Non- |
| |
| | Performing | | performing | | | ||
$m | | Stage 1 | | Stage 2 | | Stage 3 | | Total |
Housing |
| 264 |
| 680 |
| 498 |
| 1,442 |
Personal |
| 124 |
| 315 |
| 150 |
| 589 |
Business |
| 690 |
| 1,112 |
| 842 |
| 2,644 |
Balance as at 31 March 2022 |
| 1,078 |
| 2,107 |
| 1,490 |
| 4,675 |
Housing |
| 143 |
| 1,095 |
| 415 |
| 1,653 |
Personal |
| 99 |
| 250 |
| 123 |
| 472 |
Business |
| 643 |
| 996 |
| 861 |
| 2,500 |
Balance as at 30 September 2022 |
| 885 |
| 2,341 |
| 1,399 |
| 4,625 |
Housing |
| 171 | | 1,123 | | 454 | | 1,748 |
Personal |
| 91 | | 268 | | 127 | | 486 |
Business |
| 629 | | 1,237 | | 812 | | 2,678 |
Balance as at 31 March 2023 |
| 891 | | 2,628 | | 1,393 | | 4,912 |
99 |
Notes to the consolidated financial statements
Note 9. Provision for expected credit losses (continued)
Impact of overlays on the provision for ECL on loans and credit commitments
The following table attributes the provision for ECL on loans and credit commitments between modelled ECL and portfolio overlays.
Portfolio overlays are used to capture risk of increased uncertainty relating to forward-looking economic conditions, or areas of potential risk and uncertainty in the portfolio, that are not captured in the underlying modelled ECL.
| | | | | | |
| | As at | | As at | | As at |
| | 31 March | | 30 Sept | | 31 March |
$m |
| 2023 |
| 2022 |
| 2022 |
Modelled provision for ECL on loans and credit commitments |
| 4,192 | | 3,925 | | 3,539 |
Overlays |
| 720 | | 700 | | 1,136 |
Total provision for ECL on loans and credit commitments | | 4,912 | | 4,625 | | 4,675 |
Details of changes related to forward-looking economic inputs and portfolio overlays, based on reasonable and supportable information up to the date of this report, are provided below.
Modelled provision for ECL on loans and credit commitments
The modelled provision for ECL on loans and credit commitments is a probability weighted estimate based on three scenarios which together represent the Group’s view of the forward-looking distribution of potential loss outcomes. The change in provisions as a result of changes in modelled ECL are reflected through the “net remeasurement of provision for ECL” line item. Portfolio overlays are used to capture potential risk and uncertainty in the portfolio that are not captured in the underlying modelled ECL.
The base case scenario uses Westpac Economic forecasts which forecast further interest rate rises and residential/ commercial price reductions due to the current high inflationary environment.
Economic forecasts (from Westpac Economics) used for the different reporting periods are as follows:
| | | | | | |
Key economic assumptions |
| 31 March 2023 |
| 30 September 2022 |
| 31 March 2022 |
Annual GDP | | Forecast growth of 1.0% for calendar year 2023 and 1.5% for calendar year 2024 | | Forecast growth of 3.4% for calendar year 2022 and 1.0% for calendar year 2023 | | Forecast growth of 5.5% for calendar year 2022 and 2.7% for calendar year 2023 |
Commercial property index | | Forecast price contraction of 9.4% for calendar year 2023 and forecast growth of 1.4% for calendar year 2024 | | Forecast price contraction of 4.7% for calendar year 2022 and 3.0% for calendar year 2023 | | Forecast price contraction of 3.1% for calendar year 2022 and growth of 2.1% for calendar year 2023 |
Residential property prices | | Forecast price contraction of 7.8% for calendar year 2023 and forecast growth of 2.0% for calendar year 2024 | | Forecast price contraction of 6.5% for calendar year 2022 and 7.8% for calendar year 2023 | | Forecast price appreciation of 1.6% for calendar year 2022 and contraction of 7.0% for calendar 2023 |
Cash rate | | Forecast cash rate of 3.85% at December 2023 and 2.85% at December 2024 | | Forecast cash rate of 3.35% at December 2022 and 3.6% at December 2023 | | Forecast to increase to 50 bps by December 2022 and then to 150bps by December 2023 |
Unemployment rate: Australia | | Forecast rate of 4.7% at December 2023 and 5.1% at December 2024 | | Forecast rate of 3.1% at December 2022 and 4.4% at December 2023 | | Forecast rate of 3.8% at December 2022 and 3.9% at December 2023 |
New Zealand | | Forecast rate of 4.0% at December 2023 and 5.1% at December 2024 | | Forecast rate of 3.4% at December 2022 and 3.8% at December 2023 | | Forecast rate of 3.0% at December 2022 and 3.3% at December 2023. |
The downside scenario is a more severe scenario with expected credit losses higher than the base case. The more severe loss outcome for the downside is generated under a recession in which the combination of negative GDP growth, declines in commercial and residential property prices and an increase in the unemployment rate simultaneously impact expected credit losses across all portfolios from the reporting date. The assumptions in this scenario and relativities to the base case will be monitored having regard to the emerging economic conditions and updated where necessary. The upside scenario represents a modest improvement to the base case.
100 | WESTPAC GROUP 2023 INTERIM FINANCIAL RESULTS |
Notes to the consolidated financial statements
Note 9. Provision for expected credit losses (continued)
The following sensitivity table shows the reported provision for ECL on loans and credit commitments based on the probability weighted scenarios and what the provision for ECL on loans and credit commitments would be assuming a 100% weighting to the base case scenario and to the downside scenario (with all other assumptions held constant).
| | | | | | |
| | As at | | As at | | As at |
| | 31 March | | 30 Sept | | 31 March |
$m |
| 2023 |
| 2022 |
| 2022 |
Reported probability-weighted ECL |
| 4,912 | | 4,625 | | 4,675 |
100% base case ECL |
| 3,391 | | 2,983 | | 2,993 |
100% downside ECL |
| 6,836 | | 6,680 | | 6,752 |
If 1% of the Stage 1 gross exposure from loans and credit commitments (calculated on a 12 month ECL) was reflected in Stage 2 (calculated on a lifetime ECL) the provision for ECL on loans and credit commitments would increase by $95 million (30 September 2022: $113 million, 31 March 2022: $205 million) for the Group based on applying the average provision coverage ratios by stage to the movement in the gross exposure by stage.
The following table indicates the economic weights applied by the Group at 31 March 2023, 30 September 2022 and 31 March 2022:
| | | | | | |
| | As at | | As at | | As at |
| | 31 March | | 30 Sept | | 31 March |
Scenario weightings (%) |
| 2023 |
| 2022 |
| 2022 |
Upside |
| 5 |
| 5 |
| 5 |
Base |
| 50 |
| 50 |
| 50 |
Downside |
| 45 |
| 45 |
| 45 |
The Group’s definition of default is aligned to APRA’s regulatory definition of default, which is contained in Prudential Standard APS 220 Credit Risk Management.
The Group applied APRA’s amendments to this definition in the period, which resulted in an increase in non- performing exposures. This was primarily due to the extension of the period over which certain credit exposures remain classified as non-performing before reclassification to performing. There was no material impact on the provision for ECL.
Portfolio overlays
Portfolio overlays are used to address areas of risk, including significant uncertainties that are not captured in the underlying modelled ECL. Determination of portfolio overlays requires expert judgement and is thoroughly documented and subject to comprehensive internal governance and oversight. Overlays are continually reassessed and if the risk is judged to have changed (increased or decreased), or is subsequently captured in the modelled ECL, the overlay will be released or remeasured.
The Group’s total overlays as at 31 March 2023 were $720 million (30 September 2022: $700 million; 31 March 2022: $1,136 million) and comprise:
| ● | $489 million for consumers reflecting potential high consumer stress primarily from rising interest rates, higher inflation, higher unemployment and other risks (30 September 2022: $480 million; 31 March 2022: $270 million); |
| ● | $100 million relating to certain industries reflecting potential supply chain disruptions and labour shortages (30 September 2022: $150 million; 31 March 2022: $247 million); |
| ● | $131 million for extreme weather events including the expected impact on customers of recent flooding and cyclones in NZ; (30 September 2022: $70 million; 31 March 2022: $70 million); and |
| ● | Nil relating to COVID-19 impacts. Overlay has been removed as modelled outcomes now capture the risks (30 September 2022: nil; 31 March 2022: $549 million). |
The change in provisions as a result of changes in portfolio overlays are reflected through the “net remeasurement of provision for ECL” line in Movement in provision for ECL on loans and credit commitments table.
101 |
Notes to the consolidated financial statements
Note 9. Provision for expected credit losses (continued)
Total provision for ECL
| | | | | | |
|
| As at |
| As at |
| As at |
| | 31 March | | 30 Sept | | 31 March |
$m | | 2023 | | 2022 | | 2022 |
Provision for ECL on loans and credit commitments |
| 4,912 |
| 4,625 |
| 4,675 |
Provision for ECL on debt securities at amortised cost1 |
| 6 |
| 6 |
| 4 |
Provision for ECL on debt securities at FVOCI2 |
| 5 |
| 4 |
| 3 |
Total provision for ECL |
| 4,923 |
| 4,635 |
| 4,682 |
1.Provision for ECL on debt securities at amortised cost is presented as part of investment securities.
2.Provision for ECL on debt securities at FVOCI forms part of equity reserves.
Reconciliation of impairment charges
| | | | | | |
| | Half Year | | Half Year | | Half Year |
| | March | | Sept | | March |
$m |
| 2023 | | 2022 | | 2022 |
Loans and credit commitments: | | | | | | |
Business activity during the period | | 54 | | (136) | | (94) |
Net remeasurement of the provision for ECL | | 463 | | 416 | | 336 |
Impairment charges for debt securities at amortised cost | | - | | 3 | | 1 |
Impairment charges for debt securities at FVOCI | | 1 | | - | | (2) |
Recoveries | | (128) | | (87) | | (102) |
Impairment charges/(benefits) | | 390 | | 196 | | 139 |
Note 10. Credit quality
Credit risk ratings system
The principal objective of the credit risk rating system is to reliably assess the credit risk to which the Group is exposed. The Group has two main approaches to this assessment.
Transaction-managed customers
Transaction managed customers are generally customers with business lending exposures. They are individually assigned a Customer Risk Grade (CRG), corresponding to their expected probability of default (PD). Each facility is assigned a loss given default (LGD). The Group’s risk rating system has a tiered scale of risk grades for both non-defaulted customers and defaulted customers. Non-defaulted CRGs are mapped to Moody’s and S&P Global Ratings (S&P) external senior unsecured ratings.
The table below shows Westpac’s high level CRGs for transaction-managed portfolios mapped to the Group’s credit quality disclosure categories and to their corresponding external rating.
| | | | | | |
| | Transaction-managed | ||||
Financial statement disclosure |
| Westpac CRG |
| Moody’s Rating |
| S&P Rating |
Strong |
| A |
| Aaa – Aa3 |
| AAA – AA– |
|
| B |
| A1 – A3 |
| A+ – A– |
|
| C |
| Baa1 – Baa3 |
| BBB+ – BBB– |
Good/satisfactory |
| D |
| Ba1 – B1 |
| BB+ – B+ |
| | |
| Westpac Rating | ||
Weak |
| E |
| Watch list | ||
|
| F |
| Special Mention | ||
Weak/default/non-performing |
| G |
| Substandard/Default | ||
|
| H |
| Default | ||
102 | WESTPAC GROUP 2023 INTERIM FINANCIAL RESULTS |
Notes to the consolidated financial statements
Note 10. Credit quality (continued)
Program-managed portfolio
The program-managed portfolio generally includes retail products including mortgages, personal lending (including credit cards) as well as SME lending. These customers are grouped into pools of similar risk. Pools are created by analysing similar risk characteristics that have historically predicted that an account is likely to go into default. Customers grouped according to these predictive characteristics are assigned a PD and LGD relative to their pool. The credit quality of these pools is based on a combination of behavioural factors, delinquency trends, PD estimates and loan to valuation ratio (housing loans only).
The following table shows the credit quality of loans and undrawn credit commitments.
| | | | | | | | | | | | | | | | | | | | | | | | |
| | | | As at 31 March 2023 | | | | | | As at 30 Sept 22 | | | | | | As at 31 March 2022 | | | ||||||
$m |
| Stage 1 |
| Stage 2 |
| Stage 3 |
| Total |
| Stage 1 |
| Stage 2 |
| Stage 3 |
| Total |
| Stage 1 |
| Stage 2 |
| Stage 3 |
| Total |
Loans - housing |
|
|
|
|
|
|
|
|
|
|
|
|
|
|
|
|
|
|
|
|
|
|
|
|
Strong |
| 403,099 | | 39,960 | | - | | 443,059 |
| 393,754 |
| 41,790 |
| - |
| 435,544 |
| 401,201 |
| 24,367 |
| - |
| 425,568 |
Good/satisfactory |
| 37,045 | | 36,023 | | - | | 73,068 |
| 36,862 |
| 35,581 |
| - |
| 72,443 |
| 48,746 |
| 24,248 |
| - |
| 72,994 |
Weak |
| 2,037 | | 11,436 | | 4,421 | | 17,894 |
| 1,916 |
| 10,133 |
| 3,916 |
| 15,965 |
| 2,057 |
| 11,216 |
| 4,568 |
| 17,841 |
Total loans - housing |
| 442,181 | | 87,419 | | 4,421 | | 534,021 |
| 432,532 |
| 87,504 |
| 3,916 |
| 523,952 |
| 452,004 |
| 59,831 |
| 4,568 |
| 516,403 |
Loans - personal |
|
|
|
|
|
|
|
|
| |
|
|
|
|
|
|
| |
| |
| |
| |
Strong |
| 4,854 | | 111 | | - | | 4,965 |
| 4,961 |
| 99 |
| - |
| 5,060 |
| 4,890 |
| 84 |
| - |
| 4,974 |
Good/satisfactory |
| 6,142 | | 1,153 | | - | | 7,295 |
| 6,903 |
| 1,056 |
| - |
| 7,959 |
| 8,092 |
| 1,113 |
| - |
| 9,205 |
Weak |
| 176 | | 475 | | 240 | | 891 |
| 232 |
| 433 |
| 213 |
| 878 |
| 288 |
| 530 |
| 253 |
| 1,071 |
Total loans - personal |
| 11,172 | | 1,739 | | 240 | | 13,151 |
| 12,096 |
| 1,588 |
| 213 |
| 13,897 |
| 13,270 |
| 1,727 |
| 253 |
| 15,250 |
Loans - business |
|
|
|
|
|
|
|
|
| |
|
|
|
|
|
|
| |
| |
| |
| |
Strong |
| 77,166 | | 11,397 | | - | | 88,563 |
| 82,280 |
| 5,704 |
| - |
| 87,984 |
| 76,014 |
| 784 |
| - |
| 76,798 |
Good/satisfactory |
| 81,213 | | 29,909 | | - | | 111,122 |
| 87,770 |
| 23,018 |
| - |
| 110,788 |
| 94,954 |
| 13,197 |
| - |
| 108,151 |
Weak |
| 72 | | 4,300 | | 3,172 | | 7,544 |
| 84 |
| 4,031 |
| 3,117 |
| 7,232 |
| 185 |
| 3,897 |
| 3,067 |
| 7,149 |
Total loans - business |
| 158,451 | | 45,606 | | 3,172 | | 207,229 |
| 170,134 |
| 32,753 |
| 3,117 |
| 206,004 |
| 171,153 |
| 17,878 |
| 3,067 |
| 192,098 |
Undrawn credit commitments |
|
|
|
|
|
|
|
|
|
|
|
|
|
|
|
|
|
|
|
|
|
|
|
|
Strong |
| 155,647 | | 9,800 | | - | | 165,447 |
| 150,424 |
| 7,235 |
| - |
| 157,659 |
| 154,459 |
| 2,590 |
| - |
| 157,049 |
Good/satisfactory |
| 32,907 | | 8,573 | | - | | 41,480 |
| 34,011 |
| 6,946 |
| - |
| 40,957 |
| 37,519 |
| 5,369 |
| - |
| 42,888 |
Weak |
| 113 | | 966 | | 397 | | 1,476 |
| 100 |
| 1,036 |
| 347 |
| 1,483 |
| 116 |
| 812 |
| 321 |
| 1,249 |
Total undrawn credit commitments |
| 188,667 | | 19,339 | | 397 | | 208,403 |
| 184,535 |
| 15,217 |
| 347 |
| 200,099 |
| 192,094 |
| 8,771 |
| 321 |
| 201,186 |
Total strong |
| 640,766 | | 61,268 | | - | | 702,034 |
| 631,419 |
| 54,828 |
| - |
| 686,247 |
| 636,564 |
| 27,825 |
| - |
| 664,389 |
Total good/ satisfactory |
| 157,307 | | 75,658 | | - | | 232,965 |
| 165,546 |
| 66,601 |
| - |
| 232,147 |
| 189,311 |
| 43,927 |
| - |
| 233,238 |
Total weak |
| 2,398 | | 17,177 | | 8,230 | | 27,805 |
| 2,332 |
| 15,633 |
| 7,593 |
| 25,558 |
| 2,646 |
| 16,455 |
| 8,209 |
| 27,310 |
Total loans and undrawn credit commitments |
| 800,471 | | 154,103 | | 8,230 | | 962,804 |
| 799,297 |
| 137,062 |
| 7,593 |
| 943,952 |
| 828,521 |
| 88,207 |
| 8,209 |
| 924,937 |
103 |
Notes to the consolidated financial statements
Note 11. Deposits and other borrowings1
| | | | | | | | | | |
|
| As at |
| As at |
| As at |
| % Mov’t | ||
| | 31 March | | 30 Sept | | 31 March | | Mar 23 | | Mar 23 |
$m | | 2023 | | 2022 | | 2022 | | - Sept 22 | | - Mar 22 |
Australia |
| |
|
|
| |
|
|
|
|
Certificates of deposit |
| 32,227 |
| 30,507 |
| 27,048 |
| 6 |
| 19 |
Non-interest bearing, repayable at call |
| 54,967 |
| 55,180 |
| 54,829 |
| - |
| - |
Other interest bearing at call |
| 349,419 |
| 352,544 |
| 361,609 |
| (1) |
| (3) |
Other interest bearing term |
| 140,704 |
| 127,921 |
| 104,865 |
| 10 |
| 34 |
Total Australia |
| 577,317 |
| 566,152 |
| 548,351 |
| 2 |
| 5 |
New Zealand |
| |
| |
| |
| |
| |
Certificates of deposit |
| 2,618 |
| 2,588 |
| 2,783 |
| 1 |
| (6) |
Non-interest bearing, repayable at call |
| 12,251 |
| 12,674 |
| 14,706 |
| (3) |
| (17) |
Other interest bearing at call |
| 28,395 |
| 27,517 |
| 30,188 |
| 3 |
| (6) |
Other interest bearing term |
| 34,057 |
| 28,423 |
| 27,945 |
| 20 |
| 22 |
Total New Zealand |
| 77,321 |
| 71,202 |
| 75,622 |
| 9 |
| 2 |
Other overseas |
| |
| |
| |
| |
| |
Certificates of deposit |
| 13,922 |
| 13,200 |
| 14,903 |
| 5 |
| (7) |
Non-interest bearing, repayable at call |
| 1,340 |
| 1,178 |
| 1,008 |
| 14 |
| 33 |
Other interest bearing at call |
| 2,047 |
| 1,883 |
| 1,696 |
| 9 |
| 21 |
Other interest bearing term |
| 4,405 |
| 5,514 |
| 4,026 |
| (20) |
| 9 |
Total other overseas |
| 21,714 |
| 21,775 |
| 21,633 |
| - |
| - |
Total deposits and other borrowings |
| 676,352 |
| 659,129 |
| 645,606 |
| 3 |
| 5 |
| 1. | Non-interest bearing relates to instruments which do not carry a rate of interest. |
104 | WESTPAC GROUP 2023 INTERIM FINANCIAL RESULTS |
Notes to the consolidated financial statements
Note 12. Fair values of financial assets and financial liabilities
Fair Valuation Control Framework
The Group uses a Fair Valuation Control Framework where the fair value is either determined or validated by a function independent of the transaction. This framework formalises the policies and procedures used to achieve compliance with relevant accounting, industry and regulatory standards. The framework includes specific controls relating to:
| ● | The revaluation of financial instruments; |
| ● | Independent price verification; |
| ● | Fair value adjustments; and |
| ● | Financial reporting. |
A key element of the framework is the Revaluation Committee, comprising senior valuation specialists from within the Group. The Revaluation Committee reviews the application of the agreed policies and procedures to assess that a fair value measurement basis has been applied.
The method of determining fair value differs depending on the information available.
Fair value hierarchy
A financial instrument’s categorisation within the valuation hierarchy is based on the lowest level input that is significant to the fair value measurement.
The Group categorises all fair value instruments according to the hierarchy described below.
Valuation techniques
The Group applies market accepted valuation techniques in determining the fair valuation of over the counter (OTC) derivatives. This includes CVA and FVA, which incorporate credit risk and funding costs and benefits that arise in relation to uncollateralised derivative positions, respectively.
The specific valuation techniques, the observability of the inputs used in valuation models and the subsequent classification for each significant product category are outlined as follows:
Level 1 instruments (Level 1)
The fair value of financial instruments traded in active markets is based on recent unadjusted quoted prices. These prices are based on actual arm’s length basis transactions.
The valuations of Level 1 instruments require little or no management judgement.
Instrument |
| Balance sheet category |
| Includes |
| Valuation | |||
| | | | | | | |
| |
Exchange traded products | | Derivatives | | Exchange traded interest rate futures and options and commodity and carbon futures | | | | | All these instruments are traded in liquid, active markets where prices are readily observable. No modelling or assumptions are used in the valuation. |
FX products | | Derivatives | | FX spot and futures contracts | | | | | |
Equity products | | Derivatives Trading securities and financial assets measured at FVIS Other financial liabilities | | Listed equities and equity indices | | | | | |
| | | | | | | | | |
Debt instruments | | Trading securities and financial assets measured at FVIS Investment securities Other financial liabilities | | Australian Commonwealth and New Zealand government bonds | | | | | |
Life insurance assets | | Life insurance assets included in assets held for sale | | Listed equities, exchange traded derivatives and short sale of listed equities within controlled managed investment schemes | | | | | |
| | | | | | | | | |
105 |
Notes to the consolidated financial statements
Note 12. Fair values of financial assets and financial liabilities (continued)
Level 2 instruments (Level 2)
The fair value for financial instruments that are not actively traded is determined using valuation techniques which maximise the use of observable market prices. Valuation techniques include:
| ● | The use of market standard discounting methodologies; |
| ● | Option pricing models; and |
| ● | Other valuation techniques widely used and accepted by market participants. |
| | | | |||||
Instrument |
| Balance sheet category |
| Includes |
| Valuation |
| |
Interest rate products | | Derivatives | | Interest rate and inflation swaps, swaptions, caps, floors, collars and other non-vanilla interest rate derivatives | | Industry standard valuation models are used to calculate the expected future value of payments by product, which is discounted back to a present value. The model’s interest rate inputs are benchmark and active quoted interest rates in the swap, bond and futures markets. Interest rate volatilities are sourced from brokers and consensus data providers. If consensus prices are not available, these are classified as Level 3 instruments. | | |
FX products | | Derivatives | | FX swaps, FX forward contracts, FX options and other non-vanilla FX derivatives | | Derived from market observable inputs or consensus pricing providers using industry standard models. If consensus prices are not available, these are classified as Level 3 instruments. | | |
Other credit products | | Derivatives | | Single name and index credit default swaps | | Valued using an industry standard model that incorporates the credit spread as its principal input. Credit spreads are obtained from consensus data providers. If consensus prices are not available, these are classified as Level 3 instruments. | | |
Commodity products | | Derivatives | | Commodity and carbon derivatives | | Valued using industry standard models. The models calculate the expected future value of deliveries and payments and discount them back to a present value. The model inputs include forward curves, volatilities implied from market observable inputs, discount curves and underlying spot and futures prices. The significant inputs are market observable or available through a consensus data service. If consensus prices are not available, these are classified as Level 3 instruments. | | |
Equity products | | Derivatives | | Exchange traded equity options, OTC equity options and equity warrants | | Due to low liquidity, exchange traded options are Level 2. Valued using industry standard models based on observable parameters such as stock prices, dividends, volatilities and interest rates. | | |
Asset backed debt instruments | | Trading securities and financial assets measured at FVIS Investment securities | | Australian residential mortgage backed securities (RMBS) and other asset backed securities (ABS) | | Valued using an industry approach to value floating rate debt with prepayment features. Australian RMBS are valued using prices sourced from a consensus data provider. If consensus prices are not available these are classified as Level 3 instruments. | | |
Non-asset backed debt instruments | | Trading securities and financial assets measured at FVIS Investment securities Other financial liabilities | | State and other government bonds, corporate bonds and commercial paper Repurchase agreements and reverse repurchase agreements over non-asset backed debt securities | | Valued using observable market prices, which are sourced from independent pricing services, broker quotes or inter-dealer prices. If prices are not available from these sources, these are classified as Level 3 instruments. | | |
Loans at fair value | | Loans | | Fixed rate bills and syndicated loans | | Discounted cash flow approach, using a discount rate which reflects the terms of the instrument and the timing of cash flows, adjusted for creditworthiness, or expected sale amount. | | |
Certificates of deposit | | Deposits and other borrowings | | Certificates of deposit | | Discounted cash flow using market rates offered for deposits of similar remaining maturities. | | |
Debt issues at fair value | | Debt issues | | Debt issues | | Discounted cash flows, using a discount rate which reflects the terms of the instrument and the timing of cash flows adjusted for market observable changes in Westpac’s implied credit worthiness. | | |
106 | WESTPAC GROUP 2023 INTERIM FINANCIAL RESULTS |
Notes to the consolidated financial statements
Note 12. Fair values of financial assets and financial liabilities (continued)
Instrument |
| Balance sheet category |
| Includes |
| Valuation | |
Life insurance assets and liabilities | | Life insurance assets included in assets held for sale Life insurance liabilities included in liabilities held for sale | | Corporate bonds, OTC derivatives, units in unlisted unit trusts, life insurance contract liabilities, life investment contract liabilities and external liabilities of managed investment schemes controlled by statutory life funds | | Valued using observable market prices or other widely used and accepted valuation techniques utilising observable market input. | |
Level 3 instruments (Level 3)
Financial instruments valued where at least one input that could have a significant effect on the instrument’s valuation is not based on observable market data due to illiquidity or complexity of the product. These inputs are generally derived and extrapolated from other relevant market data and calibrated against current market trends and historical transactions.
These valuations are calculated using a high degree of management judgement.
| | | ||||
Instrument |
| Balance sheet category |
| Includes |
| Valuation |
Debt instruments | | Trading securities and financial assets measured at FVIS Investment securities | | Certain debt securities with low observability, usually issued via private placement | | These securities are evaluated by an independent pricing service or based on third party revaluations. Due to their illiquidity and/or complexity these are classified as Level 3 assets. |
Equity instruments | | Trading securities and financial assets measured at FVIS Investment securities | | Strategic equity investments | | Valued using valuation techniques appropriate to the instrument, including the use of recent arm’s length transactions where available, discounted cash flow approach or reference to the net assets of the entity. Due to their illiquidity, complexity and/or use of unobservable inputs into valuation models, they are classified as Level 3 assets. |
The following tables summarise the attribution of financial instruments measured at fair value to the fair value hierarchy.
| | | | | | | | |
$m |
| Level 1 |
| Level 2 |
| Level 3 |
| Total |
As at 31 March 2023 | | | | | | | | |
Financial assets measured at fair value on a recurring basis | | | | | | | | |
Trading securities and financial assets measured at FVIS | | 10,885 | | 19,578 | | 11 | | 30,474 |
Derivative financial instruments | | 17 | | 20,317 | | 12 | | 20,346 |
Investment securities | | 2,905 | | 69,150 | | 414 | | 72,469 |
Loans | | - | | 106 | | 24 | | 130 |
Total financial assets measured at fair value on a recurring basis | | 13,807 | | 109,151 | | 461 | | 123,419 |
Financial liabilities measured at fair value on a recurring basis | | | | | | | | |
Deposits and other borrowings | | - | | 48,769 | | - | | 48,769 |
Other financial liabilities | | 1,361 | | 10,088 | | - | | 11,449 |
Derivative financial instruments | | 12 | | 20,725 | | 54 | | 20,791 |
Debt issues | | - | | 5,655 | | - | | 5,655 |
Total financial liabilities measured at fair value on a recurring basis | | 1,373 | | 85,237 | | 54 | | 86,664 |
107 |
Notes to the consolidated financial statements
Note 12. Fair values of financial assets and financial liabilities (continued)
| | | | | | | | |
$m | | Level 1 |
| Level 2 |
| Level 3 |
| Total |
As at 30 September 2022 | | | | | | | | |
Financial assets measured at fair value on a recurring basis | | | | | | | | |
Trading securities and financial assets measured at FVIS | | 2,039 | | 22,275 | | 18 | | 24,332 |
Derivative financial instruments | | 68 | | 41,202 | | 13 | | 41,283 |
Investment securities | | 12,634 | | 62,263 | | 387 | | 75,284 |
Loans | | - | | 45 | | 27 | | 72 |
Total financial assets measured at fair value on a recurring basis | | 14,741 | | 125,785 | | 445 | | 140,971 |
Financial liabilities measured at fair value on a recurring basis | | | | | | | | |
Deposits and other borrowings | | - | | 46,331 | | - | | 46,331 |
Other financial liabilities | | 2,006 | | 9,319 | | - | | 11,325 |
Derivative financial instruments | | 51 | | 39,494 | | 23 | | 39,568 |
Debt issues | | - | | 6,740 | | - | | 6,740 |
Total financial liabilities measured at fair value on a recurring basis | | 2,057 | | 101,884 | | 23 | | 103,964 |
| | | | | | | | |
As at 31 March 2022 | | | | | | | | |
Financial assets measured at fair value on a recurring basis | | | | | | | | |
Trading securities and financial assets measured at FVIS | | 5,474 | | 18,260 | | 4 | | 23,738 |
Derivative financial instruments | | 38 | | 18,204 | | 27 | | 18,269 |
Investment securities | | 11,838 | | 57,287 | | 439 | | 69,564 |
Loans | | - | | 217 | | 32 | | 249 |
Assets held for sale | | 1,057 | | 1,422 | | - | | 2,479 |
Total financial assets measured at fair value on a recurring basis | | 18,407 | | 95,390 | | 502 | | 114,299 |
Financial liabilities measured at fair value on a recurring basis | | | | | | | | |
Deposits and other borrowings | | - | | 44,743 | | - | | 44,743 |
Other financial liabilities | | 1,090 | | 5,767 | | - | | 6,857 |
Derivative financial instruments | | 26 | | 25,288 | | 33 | | 25,347 |
Debt issues | | - | | 6,294 | | - | | 6,294 |
Liabilities held for sale | | - | | 414 | | - | | 414 |
Total financial liabilities measured at fair value on a recurring basis | | 1,116 | | 82,506 | | 33 | | 83,655 |
108 | WESTPAC GROUP 2023 INTERIM FINANCIAL RESULTS |
Notes to the consolidated financial statements
Note 12. Fair values of financial assets and financial liabilities (continued)
Reconciliation of non-market observables
The following table summarises the changes in financial instruments measured at fair value derived from non-market observable valuation techniques (Level 3).
| | | | | | | | | | | | |
| | Half Year March 2023 | ||||||||||
| | Trading | | | | | | | | | | |
| | securities and | | | | | | | | | | |
| | financial assets | | | | | | | | | |
|
| | measured at | | Investment | | | | Total Level 3 | | | | Total Level 3 |
$m |
| FVIS |
| Securities |
| Other1 |
| assets |
| Derivatives |
| liabilities |
Balance as at beginning of period | | 18 | | 387 | | 40 | | 445 | | 23 | | 23 |
Gains/(losses) on assets / (gains)/losses on liabilities recognised in: | | | | | | | | | | | | |
Income statement | | - | | - | | (4) | | (4) | | (2) | | (2) |
Other comprehensive income | | - | | (32) | | - | | (32) | | - | | - |
Acquisitions and issues | | 21 | | 60 | | 25 | | 106 | | 43 | | 43 |
Disposals and settlements | | - | | (1) | | (18) | | (19) | | (3) | | (3) |
Transfer into or out of non-market observables | | (29) | | - | | (8) | | (37) | | (7) | | (7) |
Foreign currency translation impacts | | 1 | | - | | 1 | | 2 | | - | | - |
Balance as at end of period | | 11 | | 414 | | 36 | | 461 | | 54 | | 54 |
Unrealised gains/(losses) recognised in the income statement for financial instrument held as at end of period | | - | | - | | 8 | | 8 | | (41) | | (41) |
1.Other is comprised of derivative financial assets and certain loans.
Transfers into and out of Level 3 have occurred due to changes in observability in the significant inputs into the valuation models used to determine the fair value of the related financial instruments. Transfers in and transfers out are reported using the end of period fair values.
Significant unobservable inputs
Sensitivities to reasonably possible changes in non-market observable valuation assumptions would not have a material impact on the Group’s reported results.
Day one profit or loss
The closing balance of unrecognised day one profit was nil as at 31 March 2023 (30 September 2022: $1 million, 31 March 2022: $1 million).
Financial instruments not measured at fair value
The following table summarises the estimated fair value of financial instruments not measured at fair value for the Group.
| | | | | | | | | | | | |
| | As at 31 March 2023 | | As at 30 Sept 2022 | | As at 31 March 2022 | ||||||
| | Carrying | | Fair | | Carrying | | Fair | | Carrying | | Fair |
$m |
| amount |
| value |
| amount |
| value |
| amount | | value |
Financial assets not measured at fair value | | | | | | | | | | | | |
Cash and balances with central banks | | 117,886 | | 117,886 |
| 105,257 |
| 105,257 |
| 102,410 | | 102,410 |
Collateral paid | | 4,093 | | 4,093 |
| 6,216 |
| 6,216 |
| 7,374 | | 7,374 |
Investment securities | | 1,083 | | 1,083 | | 1,181 | | 1,179 | | 878 | | 878 |
Loans | | 749,801 | | 744,302 |
| 739,575 |
| 732,511 |
| 719,307 | | 716,281 |
Other financial assets | | 7,343 | | 7,343 | | 5,626 | | 5,626 | | 4,896 | | 4,896 |
Assets held for sale | | - | | - |
| 20 |
| 20 |
| 26 | | 26 |
Total financial assets not measured at fair value | | 880,206 | | 874,707 |
| 857,875 |
| 850,809 |
| 834,891 | | 831,865 |
Financial liabilities not measured at fair value | | | | | | | | | | | | |
Collateral received | | 3,577 | | 3,577 |
| 6,371 |
| 6,371 |
| 2,170 | | 2,170 |
Deposits and other borrowings | | 627,583 | | 627,823 |
| 612,798 |
| 613,134 |
| 600,863 | | 600,982 |
Other financial liabilities | | 48,653 | | 48,653 |
| 45,035 |
| 45,035 |
| 44,488 | | 44,488 |
Debt issues2 | | 143,297 | | 142,666 |
| 138,128 |
| 137,452 |
| 127,335 | | 127,247 |
Loan capital2 | | 31,025 | | 30,688 | | 31,254 | | 30,671 | | 29,036 | | 29,413 |
Liabilities held for sale | | - | | - |
| 31 |
| 31 |
| 17 | | 17 |
Total financial liabilities not measured at fair value | | 854,135 | | 853,407 |
| 833,617 |
| 832,694 |
| 803,909 | | 804,317 |
2.The estimated fair values of debt issues and loan capital include the impact of changes in Westpac’s credit spreads since origination.
A detailed description of how fair value is derived for financial instruments not measured at fair value is disclosed in Note 23 of the 2022 Annual Report.
109 |
Notes to the consolidated financial statements
Note 13. Provisions, contingent liabilities, contingent assets and credit commitments
Provisions are recognised for present obligations arising from past events where a payment (or other economic transfer) is likely to be necessary to settle the obligation and can be reliably estimated. Provisions raised by the Group are set out in the table in the “Provisions” section below. Where it is not probable there will be an outflow of economic resources or where a liability cannot be reliably estimated a contingent liability may exist.
Provisions
| | | | | | | | | | | | | | | | |
| | As at 31 March 2023 | ||||||||||||||
| | | | Annual | | | | | | | | | | Compliance, | | |
| | | | leave and | | Litigation | | Provision for | | | | | | regulation | | |
| | Long | | other | | and non- | | impairment | | Lease | | Restructuring | | and | | |
| | service | | employee | | lending | | on credit | | restoration | | and other | | remediation | | |
$m |
| leave |
| benefits |
| losses |
| commitments |
| obligations |
| provisions |
| provisions |
| Total |
Balance as at beginning of period | | 450 | | 922 | | 83 | | 419 | | 208 | | 355 | | 513 | | 2,950 |
Additions | | 45 | | 575 | | 12 | | 29 | | 1 | | 65 | | 59 | | 786 |
Utilisation | | (23) | | (859) | | (20) | | - | | (13) | | (128) | | (172) | | (1,215) |
Reversal of unutilised provisions | | - | | - | | (1) | | (6) | | - | | (8) | | (82) | | (97) |
Balance as at end of period | | 472 | | 638 | | 74 | | 442 | | 196 | | 284 | | 318 | | 2,424 |
Compliance, regulation and remediation provisions
Provisions for the Half Year 2023 in respect of compliance, regulation and remediation include estimates of:
| ● | Customer refunds associated with matters of potential historical misconduct; |
| ● | Costs of completing remediation programs; and |
| ● | Potential non-lending losses and costs connected with certain litigation and regulatory investigations. |
It is possible that the final outcome could be below or above the provision, if the actual outcome differs from the assumptions used in estimating the provision. Remediation processes may change over time as further facts emerge and such changes could result in a change to the final exposure.
Certain litigation
As at 31 March 2023, the Group held provisions in respect of potential non-lending losses and costs connected with certain litigation, including a class action against Westpac Banking Corporation and two former subsidiaries, Westpac General Insurance Limited (now known as Allianz Australia General Insurance Limited) and Westpac Life Insurance Services Limited (now known as TAL Life Insurance Services Limited) in the Federal Court of Australia in relation to Westpac’s sale of consumer credit insurance products to customers.
This class action has settled pending court approval. The settlement amount agreed between the parties is included in the 31 March 2023 provisions.
As at the date of this report, the proposed settlement has not yet been approved by the Court. Consequently, there remains some uncertainty in respect of the settlement and the actual aggregate expense to Westpac associated with this matter.
Certain of the entities mentioned above are no longer part of the Group following the sale of those entities. Westpac has provided warranties and indemnities to the acquirer for certain pre-completion matters, conduct and risks.
Restructuring provisions
The Group carries restructuring provisions for committed business restructures and branch closures. The provisions held primarily relate to separation costs and redundancies. The decrease in the current year mostly relates to the utilisation of provisions associated with completed business sales. Refer to Note 17 for further details.
Lease restoration obligations
The lease restoration provision reflects an estimate of the cost of making good leasehold premises at the end of the Group’s property leases.
110 | WESTPAC GROUP 2023 INTERIM FINANCIAL RESULTS |
Notes to the consolidated financial statements
Note 13. Provisions, contingent liabilities, contingent assets and credit commitments (continued)
Contingent liabilities
Contingent liabilities are possible obligations whose existence will be confirmed only by uncertain future events and present obligations where the transfer of economic resources is not probable or cannot be reliably measured. Contingent liabilities are not recognised on the balance sheet but are disclosed unless the outflow of economic resource is remote.
Regulatory investigations, reviews and inquiries
Regulators, statutory authorities and other bodies routinely conduct investigations, reviews and inquiries involving the financial services sector, both in Australia and overseas. These actions may consider a range of subject matters, and in Australia, a number of investigations and reviews are currently considering potential misconduct in relation to credit and financial services. Matters the subject of such reviews are also assessed for their impact on customers, with customer remediation undertaken where appropriate in accordance with the Group’s Customer Remediation Policy and Customer Remediation Standard.
Domestic regulators, statutory authorities and other bodies such as ASIC, ACCC, APRA, AUSTRAC, BCCC, the OAIC, the ATO and the Fair Work Ombudsman, as well as certain international regulators such as the Reserve Bank of New Zealand, Financial Markets Authority and Commerce Commission in New Zealand, Bank of Papua New Guinea, Monetary Authority of Singapore and Hong Kong Monetary Authority, from time to time conduct investigations, reviews or inquiries, (some of which may be industry wide), covering a range of matters (including potential contraventions and non-compliance) that involve, or may in the future, involve the Group.
These currently include investigations by the OAIC in relation to certain practices and systems for compliance with the Privacy Act 1988 (Cth) (including our processes and controls around user access, data retention and destruction), by ASIC in relation to our online hardship processes and controls and regulator investigations into other areas such as risk governance, prudential standards compliance, hardship, collections processes, and design and distribution obligations.
It is uncertain what (if any) actions will result following the conclusion of these investigations or matters. No provisions have yet been made in relation to any financial liability that might arise in the event proceedings are pursued in relation to the matters outlined above, as any potential future liability of that kind cannot be reliably estimated at this time.
Such investigations, reviews or inquiries have previously resulted, and may in the future result in litigation (including class action proceedings and criminal proceedings), significant fines and penalties, infringement notices, enforcement action including enforceable undertakings, requirement to undertake a review, referral to the relevant Commonwealth or State Director of Public Prosecutions for consideration for criminal prosecution, imposition of capital or liquidity requirements, licence revocation, suspension or variation, customer remediation or other sanctions or action being taken by regulators or other parties. Investigations have in some instances resulted, and could in the future result, in findings of a significant number of breaches of obligations. This in turn could lead to significant financial and other penalties. Prior penalties and contraventions by Westpac in relation to similar issues can also affect penalties that may be imposed.
Litigation
There are ongoing Court proceedings, claims and possible claims against the Group. Contingent liabilities exist in respect of actual and potential claims and proceedings, including those listed below. An assessment of the Group’s likely loss has been made on a case-by-case basis for the purpose of the financial statements but cannot always be reliably estimated, including in relation to those listed below. As at 31 March 2023, no provision is held for potential losses that may arise in relation to the matters below.
Regulatory litigation
| ● | On 5 May 2021, ASIC filed civil proceedings against Westpac alleging that it had engaged in insider trading and unconscionable conduct and failed to comply with its Australian financial services licence obligations. The allegations relate to interest rate hedging activity by Westpac during its involvement in the 2016 Ausgrid privatisation transaction. Westpac has filed its response to ASIC’s claim. A hearing date for this matter has been set down for 18 March 2024. |
111 |
Notes to the consolidated financial statements
Note 13. Provisions, contingent liabilities, contingent assets and credit commitments (continued)
Class actions
| ● | The class action against BT Funds Management Limited (BTFM) and a former subsidiary, Westpac Life Insurance Services Limited (now known as TAL Life Insurance Services Limited) (WLIS) (referred to as ‘the respondents’) in the Federal Court of Australia, in relation to aspects of BTFM’s BT Super for Life former cash investment option, has settled pending court approval. In December 2022, the respondents paid the agreed settlement amount to a trust account held by the solicitors for the applicant so no provision remains. As at the date of this Report, the proposed settlement has not yet been approved by the Court. Consequently, there remains some uncertainty in respect of the settlement and the actual aggregate expense to Westpac associated with this matter. |
Certain of the entities mentioned above are no longer part of the Group following the sale of those entities. Westpac has provided warranties and indemnities to the acquirer for certain pre-completion matters, conduct and risks.
| ● | Westpac is defending a class action proceeding which was commenced in December 2019 in the Federal Court of Australia on behalf of certain investors who acquired an interest in Westpac securities between 16 December 2013 and 19 November 2019. The proceeding involves allegations relating to market disclosure issues connected to Westpac’s monitoring of financial crime over the relevant period, and matters which were the subject of the AUSTRAC civil proceedings. The damages sought on behalf of members of the class have not yet been specified. However, in the course of a procedural hearing, the applicant indicated that a preliminary estimate of the losses that may be alleged in respect of a subset of potential group members exceeded $1 billion. While it remains unclear how the applicant will ultimately formulate their estimate of alleged damages claimed on behalf of group members, it is possible that the claim may be higher (or lower) than the amount referred to above. Given the time period and the nature of the claims alleged to be in question, along with the reduction in our market capitalisation at the time of the commencement of the AUSTRAC civil proceedings, it is likely that any total alleged damages (when, and if, ultimately articulated by the applicant) will be significant. Westpac continues to deny both that its disclosure was inappropriate and, as such, that any group member has incurred damage. |
| ● | On 15 July 2020, a class action was commenced against Westpac Banking Corporation and St.George Finance Limited (SGF) in the Supreme Court of Victoria in relation to flex commissions paid to auto dealers from 1 March 2013 to 31 October 2018. This proceeding is one of three class actions commenced against a number of lenders in the auto finance industry. It is alleged that Westpac and SGF are liable for the unfair conduct of dealers acting as credit representatives and engaged in misleading or deceptive conduct. The damages sought are unspecified. Westpac and SGF are defending the proceedings. Westpac no longer pays flex commissions following an industry wide ban issued by ASIC on 1 November 2018. |
Westpac is aware, including from media reports and other publicly available material, that at least one other class action (and possibly more) against Westpac entities is being investigated. For example, in July 2020 and again in October 2022, a law firm publicly stated that it is investigating a class action against Asgard and BTFM alleging that Asgard and BTFM did not act in the best interests of members of certain superannuation funds when obtaining group insurance policies. Westpac has not been served with a claim in relation to this matter and has no further information about the scope of the proposed claim beyond the public statements issued by the law firm involved.
Internal reviews and remediation
As in prior periods, Westpac is continuing to undertake a number of reviews to identify and resolve issues that have the potential to impact our customers, employees, other stakeholders and reputation. These internal reviews continue to identify issues in respect of which we are taking, or will take, steps to put things right, including so that our customers and employees (as applicable) are not disadvantaged from certain past practices, including by making compensation/remediation payments and providing refunds where appropriate. These issues include, among other things, compliance with lending obligations (including responsible lending); conflicts of interest; payroll processes, including as they relate to employee entitlements; regulatory reporting; oversight and sufficiency of training, policies and procedures; AML and CTF processes and procedures; product disclosure; destruction and retention of personal information; and impacts from inadequate product governance, including the way some product terms and conditions are operationalised. In relation to our New Zealand business, these issues include compliance with the requirements of the New Zealand Credit Contracts and Consumer Finance Act 2003.
In addition, Westpac is currently addressing uplifts required in relation to its compliance with the Common Reporting Standard.
112 | WESTPAC GROUP 2023 INTERIM FINANCIAL RESULTS |
Notes to the consolidated financial statements
Note 13. Provisions, contingent liabilities, contingent assets and credit commitments (continued)
By undertaking these reviews, we can also improve our processes and controls, including those of our contractors, agents, and authorised credit representatives. An assessment of the Group’s likely loss has been made on a case-by-case basis for the purpose of the financial statements but cannot always be reliably estimated. Even where Westpac has remediated or compensated customers, employees or issues, there can still be the risk of regulators challenging the basis, scope or pace of remediation, taking enforcement action (including enforceable undertakings and contrition payments), or imposing fines/penalties or other sanctions, including civil or criminal prosecutions. Contingent liabilities may exist in respect of actual or potential claims or proceedings (which could be brought by customers, employees/unions, regulators or criminal prosecutors), compensation/remediation payments and/or refunds identified as part of these reviews.
Australian Financial Complaints Authority
Contingent liabilities also exist in relation to customer complaints brought before the Australian Financial Complaints Authority (AFCA). AFCA has the power to make determinations about complaints and can award compensation up to certain thresholds.
Financial Claims Scheme
Under the Financial Claims Scheme (FCS), the Australian Government provides depositors a free guarantee of deposits in eligible ADIs of up to and including $250,000, per account holder for protected accounts in an eligible ADI. The FCS applies to an eligible ADI if APRA has applied for the winding up of the ADI or a statutory manager (under the Banking Act 1958 (Cth)) is in control of the ADI’s business, and the responsible Australian Government minister has declared that the FCS applies to the ADI.
The Financial Claims Scheme (ADIs) Levy Act 2008 (Cth) provides for the imposition of a levy to fund the excess of certain APRA FCS costs connected to an ADI, including payments by APRA to deposit holders in a failed ADI. The levy would be imposed on liabilities of eligible ADIs to their depositors and cannot be more than 0.5% of the amount of those liabilities. A contingent liability may exist in respect of any levy imposed under the FCS.
Exposures to third parties relating to divested businesses
The Group has potential exposures relating to warranties, indemnities and other commitments it has provided to third parties in connection with various divestments of businesses and assets. The warranties, indemnities and other commitments cover a range of matters, conduct and risks, including certain compliance, regulatory investigations and litigation matters outlined in this Note 13.
Contingent tax risk
Tax and regulatory authorities in Australia and in other jurisdictions review, in the normal course of business, the direct and indirect taxation treatment of transactions (both historical and present-day transactions) undertaken by the Group. The Group also responds to various notices and requests for information it receives from tax and regulatory authorities.
These reviews, notices and requests may result in additional tax liabilities (including interest and penalties).
The Group has assessed these and other taxation matters arising in Australia and elsewhere, including seeking independent advice.
Settlement risk
The Group is subject to a credit risk exposure in the event that another counterparty fails to settle for its payments clearing activities (including foreign exchange). The Group seeks to minimise credit risk arising from settlement risk in the payments system by aligning our processing method with the legal certainty of settlement in the relevant clearing mechanism.
Parent entity guarantees and undertakings to subsidiaries
Consistent with 2022, Westpac Banking Corporation, as the parent entity of the Group, makes the following guarantees and undertakings to its subsidiaries:
| ● | Letters of comfort for certain subsidiaries which recognise that Westpac has a responsibility that those subsidiaries continue to meet their obligations; and |
| ● | Guarantees to certain wholly owned subsidiaries which are Australian financial services or credit licensees to comply with legislative requirements. All but two guarantees are capped at $20 million per year (with an automatic reinstatement for another $20 million) and two specific guarantees are capped at $2 million (with an automatic reinstatement for another $2 million). |
113 |
Notes to the consolidated financial statements
Note 13. Provisions, contingent liabilities, contingent assets and credit commitments (continued)
Contingent assets
The credit commitments shown in the following table also constitute contingent assets. These commitments would be classified as loans in the balance sheet on the contingent event occurring.
Undrawn credit commitments
The Group enters into various arrangements with customers which are only recognised in the balance sheet when called upon. These arrangements include commitments to extend credit, bill endorsements, financial guarantees, standby letters of credit and underwriting facilities.
They expose the Group to liquidity risk when called upon and also to credit risk if the customer fails to repay the amounts owed at the due date. The maximum exposure to credit loss is the contractual or notional amount of the instruments. Some of the arrangements can be cancelled by the Group at any time and a significant portion is expected to expire without being drawn. The actual liquidity and credit risk exposure varies in line with amounts drawn and may be less than the amounts disclosed.
The Group uses the same credit policies when entering into these arrangements as it does for on-balance sheet instruments. Refer to Notes 12 and 22 of the 2022 Annual Report for further details of credit risk and liquidity risk management, respectively.
Undrawn credit commitments excluding derivatives are as follows:
| | | | | | | | | | |
| | As at | | As at | | As at | | % Mov’t | ||
| | 31 March | | 30 Sept | | 31 March | | Mar 23 | | Mar 23 |
$m |
| 2023 |
| 2022 |
| 2022 |
| - Sept 22 |
| - Mar 22 |
Undrawn credit commitments | | | | | | | | | | |
Letters of credit and guarantees1 | | 11,936 | | 11,868 | | 11,716 | | 1 | | 2 |
Commitments to extend credit2 | | 195,765 | | 188,183 | | 189,415 | | 4 | | 3 |
Other | | 702 | | 48 | | 55 | | large | | large |
Total undrawn credit commitments | | 208,403 | | 200,099 | | 201,186 | | 4 | | 4 |
| 1. | Standby letters of credit are undertakings to pay, against presentation documents, an obligation in the event of a default by a customer. Guarantees are unconditional undertakings given to support the obligations of a customer to third parties. The Group may hold cash as collateral for certain guarantees issued. |
| 2. | Commitments to extend credit include all obligations on the part of the Group to provide credit facilities. As facilities may expire without being drawn upon, the notional amounts do not necessarily reflect future cash requirements. In addition to the commitments disclosed above, as at March 2023, the Group had $7.4 billion of credit exposures that were offered and accepted but still revocable (September 2022: $8.6 billion; March 2022 $8.8 billion). These represent part of Westpac Group’s maximum exposure to credit risk. |
114 | WESTPAC GROUP 2023 INTERIM FINANCIAL RESULTS |
Notes to the consolidated financial statements
Note 14. Shareholders’ equity
| | | | | | |
| | As at | | As at | | As at |
| | 31 March | | 30 Sept | | 31 March |
$m |
| 2023 |
| 2022 |
| 2022 |
Share capital | | | | | | |
Ordinary share capital, fully paid | | 39,824 | | 39,666 | | 39,667 |
Treasury shares1 | | (702) | | (655) | | (651) |
Total share capital | | 39,122 | | 39,011 | | 39,016 |
NCI | | 44 | | 57 | | 54 |
| 1. | 31 March 2023: 5,396,087 unvested RSP treasury shares held (30 September 2022: 5,086,660, 31 March 2022: 5,076,534). |
Ordinary Shares
Westpac does not have authorised capital and the ordinary shares have no par value. Ordinary shares entitle the holder to participate in dividends and, in the event of Westpac winding up, to a share of the proceeds in proportion to the number of and amounts paid on the shares held.
Each ordinary share entitles the holder to one vote, either in person or by proxy, at a shareholder meeting.
Reconciliation of movement in number of ordinary shares
| | | | | | |
| | Half Year | | Half Year | | Half Year |
| | March | | Sept | | March |
|
| 2023 |
| 2022 |
| 2022 |
Balance as at beginning of period | | 3,501,127,694 | | 3,501,127,694 | | 3,668,591,808 |
Dividend reinvestment plan2 | | 7,949,266 | | - | | - |
Issued shares for the period | | 7,949,266 | | - | | - |
Off-market share buy-back3 | | - | | - | | (167,464,114) |
Balance as at end of period | | 3,509,076,960 | | 3,501,127,694 | | 3,501,127,694 |
| 2. | The price per share for the issuance of shares in relation to the DRP for the 2022 final dividend was $23.86. The DRP for the 2022 interim dividend (as well as 2021 final dividend) had no impact on the number of ordinary shares on issue as Westpac arranged for the purchase of the necessary shares from the market and transfer to participants of 9,971,443 ordinary shares (2021 final dividend: 10,286,188 ordinary shares) at an average price of $23.96 (2021 final dividend: $22.34). |
| 3. | On 14 February 2022, the Group announced the successful completion of its $3.5 billion off-market share buy-back of Westpac ordinary shares. 167,464,114 ordinary shares were bought back at $20.90, and comprised a fully franked dividend component of $9.56 per share ($1,601 million) and a capital component of $11.34 per share ($1,902 million including transaction costs). The shares bought back were subsequently cancelled. |
Ordinary shares purchased on market
| | | | |
| | Half Year March 2023 | ||
| | | | Average price |
Consolidated |
| Number |
| ($) |
For share-based payment arrangements: | | | | |
Employee share plan (ESP) | | 1,156,722 | | 23.79 |
RSP4 | | 2,061,377 | | 23.40 |
Westpac Performance Plan (WPP) - share rights exercised | | 170,226 | | 22.81 |
Net number of ordinary shares purchased on market | | 3,388,325 | | |
| 4. | Ordinary shares allocated to employees under the RSP are classified as treasury shares until the shares vest. |
115 |
Notes to the consolidated financial statements
Note 14. Shareholders’ equity (continued)
Reconciliation of movement in reserves
| | | | | | |
|
| Half Year |
| Half Year |
| Half Year |
| | March | | Sept | | March |
$m | | 2023 |
| 2022 |
| 2022 |
Debt securities at FVOCI reserve |
| |
| |
| |
Balance as at beginning of period |
| 62 | | 223 |
| 443 |
Net gains/(losses) from changes in fair value |
| 13 | | (187) |
| (142) |
Income tax effect |
| - | | 50 |
| 38 |
Transferred to income statement |
| (65) | | (49) |
| (205) |
Income tax effect |
| 21 | | 16 |
| 62 |
Loss allowance on debt securities measured at FVOCI | | 1 | | - | | (2) |
Other |
| (15) | | 9 |
| 29 |
Balance as at end of period |
| 17 | | 62 |
| 223 |
Equity securities at FVOCI reserve |
| | | |
| |
Balance as at beginning of period |
| 136 | | 190 |
| 44 |
Net gains/(losses) from changes in fair value |
| (34) | | (54) |
| 146 |
Income tax effect | | 9 | | - | | - |
Balance as at end of period |
| 111 | | 136 |
| 190 |
Share-based payment reserve |
| | | |
| |
Balance as at beginning of period |
| 1,893 | | 1,866 |
| 1,806 |
Share-based payment expense |
| 58 | | 27 |
| 60 |
Balance as at end of period |
| 1,951 | | 1,893 |
| 1,866 |
Cash flow hedge reserve |
| | | |
| |
Balance as at beginning of period |
| 813 | | 1,049 |
| 196 |
Net gains/(losses) from changes in fair value |
| 522 | | 82 |
| 1,222 |
Income tax effect |
| (156) | | (21) |
| (362) |
Transferred to income statement |
| (418) | | (424) |
| (10) |
Income tax effect |
| 124 | | 127 |
| 3 |
Balance as at end of period |
| 885 | | 813 |
| 1,049 |
Foreign currency translation reserve |
| | | |
| |
Balance as at beginning of period |
| (505) | | (407) |
| (241) |
Exchange differences on translation of foreign operations |
| 553 | | (133) |
| (367) |
Gains/(losses) on net investment hedges |
| (175) | | 35 |
| 201 |
Balance as at end of period |
| (127) | | (505) |
| (407) |
Other reserves |
| | | |
| |
Balance as at beginning of period |
| (21) | | (20) |
| (21) |
Transactions with owners |
| - | | (1) |
| 1 |
Balance as at end of period |
| (21) | | (21) |
| (20) |
Total reserves |
| 2,816 | | 2,378 |
| 2,901 |
116 | WESTPAC GROUP 2023 INTERIM FINANCIAL RESULTS |
Notes to the consolidated financial statements
Note 15. Notes to the consolidated cash flow statement
Reconciliation of net cash provided by/(used in) operating activities to profit after income tax expense for the period is set out below:
| | | | | | | | | | |
|
| Half Year |
| Half Year |
| Half Year |
| % Mov’t | ||
| | March | | Sept | | March | | Mar 23 | | Mar 23 |
$m | | 2023 |
| 2022 |
| 2022 | | - Sept 22 | | - Mar 22 |
Profit after income tax expense | | 4,005 | | 2,415 | | 3,284 | | 66 | | 22 |
Adjustments: | | | | | | | | | | |
Depreciation, amortisation and impairment | | 536 | | 776 | | 805 | | (31) | | (33) |
Impairment charges/(benefits) | | 518 | | 283 | | 241 | | 83 | | 115 |
Net decrease/(increase) in current and deferred tax | | 256 | | 326 | | 101 | | (21) | | 153 |
(Increase)/decrease in accrued interest receivable | | (558) | | (485) | | (59) | | 15 | | large |
(Decrease)/increase in accrued interest payable | | 1,350 | | 769 | | 25 | | 76 | | large |
(Decrease)/increase in provisions | | (526) | | (85) | | (536) | | large | | (2) |
Other non-cash items | | 413 | | 2,038 | | (169) | | (80) | | large |
Cash flows from operating activities before changes in operating assets and liabilities | | 5,994 | | 6,037 | | 3,692 | | (1) | | 62 |
Net (increase)/decrease in: | | | | | | | | | | |
Collateral paid | | 1,898 | | 1,769 | | (3,293) | | 7 | | large |
Trading securities and financial assets measured at FVIS | | (4,967) | | (1,644) | | (2,106) | | large | | 136 |
Derivative financial instruments | | (165) | | (553) | | 3,004 | | (70) | | large |
Loans | | (5,074) | | (23,709) | | (12,636) | | (79) | | (60) |
Other financial assets | | (148) | | (447) | | 726 | | (67) | | large |
Life insurance assets and liabilities | | - | | 133 | | 133 | | (100) | | (100) |
Other assets | | 26 | | 37 | | (17) | | (30) | | large |
Net increase/(decrease) in: | | | | | | | | | | |
Collateral received | | (2,781) | | 3,827 | | (184) | | large | | large |
Deposits and other borrowings | | 13,464 | | 13,296 | | 21,758 | | 1 | | (38) |
Other financial liabilities | | (328) | | 5,738 | | 1,382 | | large | | large |
Other liabilities | | (4) | | 8 | | 3 | | large | | large |
Net cash provided by/(used in) operating activities | | 7,915 | | 4,492 | | 12,462 | | 76 | | (36) |
117 |
Notes to the consolidated financial statements
Note 15. Notes to the consolidated cash flow statement (continued)
Details of the assets and liabilities over which control ceased
Details of the businesses over which control ceased are provided in Note 17.
| | | | | | |
| | Half Year | | Half Year | | Half Year |
| | March | | Sept | | March |
$m |
| 2023 |
| 2022 |
| 2022 |
Assets: |
|
|
|
|
|
|
Cash and balances with central banks |
| 18 |
| 169 |
| - |
Loans |
| - |
| - |
| 965 |
Other financial assets |
| 18 |
| 54 |
| 12 |
Life insurance assets | | - | | 2,180 | | 186 |
Deferred tax assets |
| - |
| 39 |
| - |
Intangible assets |
| 55 |
| - |
| - |
Other assets |
| - |
| 156 |
| 12 |
Total assets |
| 91 |
| 2,598 |
| 1,175 |
Liabilities: |
|
|
|
|
|
|
Other financial liabilities |
| 22 |
| 32 |
| 2 |
Current tax liabilities | | - | | - | | 2 |
Life insurance liabilities | | - | | 300 | | (115) |
Provisions |
| 1 |
| 48 |
| 4 |
Deferred tax liabilities | | - | | - | | 34 |
Other liabilities |
| - |
| 177 |
| 36 |
Total liabilities |
| 23 |
| 557 |
| (37) |
Total equity attributable to owners of WBC |
| 68 |
| 2,041 |
| 1,212 |
Cash proceeds received (net of transaction costs) |
| 311 |
| 896 |
| 1,388 |
Expected receivable (completion settlement)/deferred consideration |
| - |
| 33 |
| 113 |
Total consideration |
| 311 |
| 929 |
| 1,501 |
Gain/(loss) on disposal |
| 243 |
| (1,112) |
| 289 |
Reconciliation of cash proceeds from disposal: |
|
|
|
|
|
|
Cash proceeds received (net of transaction costs) |
| 311 |
| 896 |
| 1,388 |
Less: Cash deconsolidated |
| (18) |
| (169) |
| - |
Cash consideration received (net of transaction costs and cash held) |
| 293 |
| 727 |
| 1,388 |
Businesses disposed
During Half Year 2023, Westpac disposed of its 100% interest in AAML to Mercer (Australia). In addition, on 1 April 2023, Westpac merged its BT personal and corporate superannuation funds to Mercer Super Trust.
Non-cash financing activities
| | | | | | | | | | |
|
| Half Year | | Half Year | | Half Year |
| % Mov’t | ||
| | March | | Sept | | March | | Mar 23 | | Mar 23 |
$m | | 2023 | | 2022 | | 2022 | | - Sept 22 | | - Mar 22 |
Shares issued under the dividend reinvestment plan |
| 190 |
| - |
| - |
| - |
| - |
Increase in lease liabilities |
| 158 |
| 146 |
| 98 |
| 8 |
| 61 |
Restricted cash
Certain of our foreign operations are required to maintain reserves or minimum balances with central banks in their respective countries of operation, totalling $328 million (30 September 2022: $303 million, 31 March 2022: $480 million) which are included in cash and balances with central banks.
118 | WESTPAC GROUP 2023 INTERIM FINANCIAL RESULTS |
Notes to the consolidated financial statements
Note 16. Subsequent events
Since 31 March 2023, the Board has determined to pay a fully franked interim dividend of 70 cents per fully paid ordinary share. The dividend is expected to be $2,456 million. The dividend is not recognised as a liability at 31 March 2023. The proposed payment date of the dividend is 27 June 2023.
The Board has determined to satisfy the DRP for the 2023 interim dividend by arranging for the purchase of existing shares by a third party. The market price used to determine the number of shares allocated to DRP participants will be set over the 10 trading days commencing 17 May 2023 and will not include a discount.
No other matters have arisen since the half year ended 31 March 2023, which are not otherwise dealt with in this 2023 Interim Financial Report, that have significantly affected or may significantly affect the operations of the Group, the results of its operations or the state of affairs of the Group in subsequent periods.
Note 17. Assets and liabilities held for sale
The assets and liabilities of certain businesses were classified as held for sale. As these businesses do not constitute a major line of business for the Group, they have not been classified as discontinued operations.
Transactions completed during First Half 2023
Advance Asset Management Limited and BT Superannuation funds
The sale of Advance Asset Management Limited to Mercer (Australia) completed on 31 March 2023. This sale resulted in a pre-tax gain on sale of $243 million ($256 million post-tax). On 1 April 2023, Westpac merged its BT personal and corporate superannuation funds with Mercer Super Trust also. In Half Year 2023, an expense recovery of $53 million has been recognised in operating expenses. Both businesses included in the Specialist Business division.
Balance sheet presentation
Details of the assets and liabilities held for sale are as follows:
| | | | | | |
|
| As at |
| As at |
| As at |
| | 31 March |
| 30 Sept | | 31 March |
$m | | 2023 |
| 2022 | | 2022 |
Assets held for sale |
|
| | | | |
Cash and balances with central banks |
| - | | - | | 8 |
Other financial assets |
| - | | 20 | | 18 |
Life insurance assets | | - | | - | | 2,479 |
Deferred tax assets | | - | | - | | 43 |
Intangible assets |
| - | | 55 | | - |
Other assets |
| - | | - | | 152 |
Total assets held for sale | | - | | 75 | | 2,700 |
Liabilities held for sale |
| | | | | |
Other financial liabilities |
| - | | 31 | | 17 |
Life insurance liabilities | | - | | - | | 414 |
Provisions | �� | - | | 1 | | 65 |
Deferred tax liabilities | | - | | - | | 3 |
Other liabilities |
| - | | - | | 185 |
Total liabilities held for sale |
| - | | 32 | | 684 |
3.8 | Statutory statements |
Directors’ declaration
In the Directors’ opinion
(i) | the interim financial statements and notes set out on pages 82 to 118 are in accordance with the Corporations Act 2001, including that they: |
a. | comply with Australian Accounting Standards, the Corporations Regulations 2001 and other mandatory professional reporting requirements; and |
b. | give a true and fair view of the Group’s financial position as at 31 March 2023 and of its performance for the six months ended 31 March 2023; and |
(ii) | there are reasonable grounds to believe that Westpac will be able to pay its debts as and when they become due and payable. |
This declaration is made in accordance with a resolution of the Directors.
For and on behalf of the Board
| |
|
| ||
John McFarlane |
| Peter King |
| | |
Chairman |
| Managing Director and |
| | |
Sydney Australia |
| Chief Executive Officer |
| | |
7 May 2023 |
|
|
Independent auditor’s review report to the members of Westpac Banking Corporation
Report on the interim financial report
Conclusion
We have reviewed the interim financial report of Westpac Banking Corporation (the Company) and the entities it controlled during the half-year (together the Group), which comprises the consolidated balance sheet as at 31 March 2023, the consolidated statement of comprehensive income, consolidated statement of changes in equity, consolidated cash flow statement and consolidated income statement for the half-year ended on that date, significant accounting policies and explanatory notes and the directors’ declaration.
Based on our review, which is not an audit, we have not become aware of any matter that makes us believe that the accompanying interim financial report of Westpac Banking Corporation does not comply with the Corporations Act 2001 including:
1. | giving a true and fair view of the Group’s financial position as at 31 March 2023 and of its performance for the half-year ended on that date |
2. | complying with Accounting Standard AASB 134 Interim Financial Reporting and the Corporations Regulations 2001. |
Basis for conclusion
We conducted our review in accordance with ASRE 2410 Review of a Financial Report Performed by the Independent Auditor of the Entity (ASRE 2410). Our responsibilities are further described in the Auditor’s responsibilities for the review of the interim financial report section of our report.
We are independent of the Group in accordance with the auditor independence requirements of the Corporations Act 2001 and the ethical requirements of the Accounting Professional & Ethical Standards Board’s APES 110 Code of Ethics for Professional Accountants (including Independence Standards) (the Code) that are relevant to the audit of the annual financial report in Australia. We have also fulfilled our other ethical responsibilities in accordance with the Code.
Responsibilities of the directors for the interim financial report
The directors of the Company are responsible for the preparation of the interim financial report that gives a true and fair view in accordance with Australian Accounting Standards and the Corporations Act 2001 and for such internal control as the directors determine is necessary to enable the preparation of the interim financial report that gives a true and fair view and is free from material misstatement whether due to fraud or error.
PricewaterhouseCoopers, ABN 52 780 433 757
One International Towers Sydney, Watermans Quay, Barangaroo, GPO BOX 2650, SYDNEY NSW 2001
T:+61 2 8266 0000, F: +61 2 8266 9999, www.pwc.com.au
Liability limited by a scheme approved under Professional Standards Legislation
121 |
Statutory Statements
Auditor’s responsibilities for the review of the interim financial report
Our responsibility is to express a conclusion on the interim financial report based on our review. ASRE 2410 requires us to conclude whether we have become aware of any matter that makes us believe that the interim financial report is not in accordance with the Corporations Act 2001 including giving a true and fair view of the Group’s financial position as at 31 March 2023 and of its performance for the half- year ended on that date, and complying with Accounting Standard AASB 134 Interim Financial Reporting and the Corporations Regulations 2001.
A review of an interim financial report consists of making enquiries, primarily of persons responsible for financial and accounting matters, and applying analytical and other review procedures. A review is substantially less in scope than an audit conducted in accordance with Australian Auditing Standards and consequently does not enable us to obtain assurance that we would become aware of all significant matters that might be identified in an audit. Accordingly, we do not express an audit opinion.

PricewaterhouseCoopers
| |||
| | | |
|
|
| |
CJ Heath | |
| Sydney |
Partner | |
| 7 May 2023 |

4.0 | Other information |
4.1 | Disclosure regarding forward-looking statements |
This Interim Financial Results Announcement contains statements that constitute ‘forward-looking statements’ within the meaning of Section 21E of the US Securities Exchange Act of 1934.
Forward-looking statements are statements that are not historical facts. Forward-looking statements appear in a number of places in this Interim Financial Results Announcement and include statements regarding our intent, belief or current expectations with respect to our business and operations, macro and micro economic and market conditions, results of operations and financial condition, capital adequacy and risk management, including, without limitation, future loan loss provisions and financial support to certain borrowers, forecasted economic indicators and performance metric outcomes, indicative drivers, climate- and other sustainability-related statements, commitments, targets, projections and metrics, and other estimated and proxy data.
Words such as ‘will’, ‘may’, ‘expect’, ‘intend’, ‘seek’, ‘would’, ‘should’, ‘could’, ‘continue’, ‘plan’, ‘estimate’, ‘anticipate’, ‘believe’, ‘probability’, ‘indicative’, ‘risk’, ‘aim’, ‘outlook’, ‘forecast’, ‘assumption’, ‘projection’, ‘target’, ‘goal’, ‘guidance’, ‘ambition’ or other similar words, are used to identify forward-looking statements. These statements reflect our current views on future events and are subject to change, certain known and unknown risks, uncertainties and assumptions and other factors which are, in many instances, beyond our control (and the control of our officers, employees, agents, and advisors), and have been made based on management’s expectations or beliefs concerning future developments and their potential effect upon Westpac.
Forward-looking statements may also be made, verbally or in writing, by members of Westpac’s management or Board in connection with this Interim Financial Results Announcement. Such statements are subject to the same limitations, uncertainties, assumptions and disclaimers set out in this document.
There can be no assurance that future developments or performance will align with our expectations or that the effect of future developments on us will be those anticipated. Actual results could differ materially from those we expect or which are expressed or implied in forward-looking statements, depending on various factors including, but not limited to:
| ● | information security breaches, including cyber attacks |
| ● | the effect of, and changes in, laws, regulations, taxation or accounting standards or practices, and government and central bank monetary policies, particularly changes to liquidity, leverage and capital requirements |
| ● | regulatory investigations, reviews and other actions, inquiries, litigation, fines, penalties, restrictions or other regulator-imposed conditions, including from our actual or alleged failure to comply with laws, regulations or regulatory policy |
| ● | the effectiveness of our risk management practices, including our policies, processes, systems and employees |
| ● | changes to the external business environment, including geopolitical, social or environmental risks, events or other changes in countries in which Westpac or its customers or counterparties operate |
| ● | climate-related risks (including physical and transition risks) that may arise from initiatives and trends associated with climate change mitigation (including Westpac’s ambition to become a net-zero, climate resilient bank) or other sustainability factors such as human rights and natural capital |
| ● | the failure to comply with financial crime obligations, which has had, and could further have, adverse effects on our business and reputation |
| ● | internal and external events which may adversely impact our reputation |
| ● | reliability and security of Westpac’s technology and risks associated with changes to technology systems |
| ● | litigation and other legal proceedings and regulator investigations and enforcement actions |
| ● | market volatility and disruptions, including uncertain conditions in funding, equity and asset markets and any losses or business impacts we or our customers or counterparties may experience |
| ● | the incidence of inadequate capital levels under stressed conditions |
| ● | changes in economic conditions, consumer spending, saving and borrowing habits in Australia, New Zealand and other countries in which we or our customers or counterparties operate and our ability to maintain or to increase market share, margins and fees, and control expenses |
| ● | adverse asset, credit or capital market conditions or an increase in defaults, impairments and provisioning because of a deterioration in economic conditions |
| ● | sovereign risks, including the risk that governments will default on their debt obligations, fail to perform contractual obligations, or be unable to refinance their debts |
| ● | changes to Westpac’s credit ratings or the methodology used by credit rating agencies |
| ● | the effects of competition in the areas in which we operate |
| ● | operational risks resulting from ineffective processes and controls |
| ● | levels of inflation, interest rates, exchange rates and market and monetary fluctuations and volatility |
| ● | poor data quality, data availability or data retention |
| ● | failure to recruit and retain key executives, employees and Directors |
| ● | strategic decisions including diversification, innovation, divestment, acquisitions, expansion activity and integration |
| ● | changes to our critical accounting estimates and judgements and changes to the value of our intangible assets; and |
| ● | various other factors beyond Westpac’s control. |
The above list is not exhaustive. For certain other factors that may impact on forward-looking statements made by Westpac, refer to ‘Risk factors’ in the Directors’ report in this Interim Financial Results Announcement. When relying on forward-looking statements to make decisions with respect to Westpac, investors and others should carefully consider the foregoing factors and other uncertainties and events.
Except as required by law, we assume no obligation to revise or update any forward-looking statements in this Interim Financial Results Announcement, whether from new information, future events, conditions, or otherwise, after the date of this Interim Financial Results Announcement.
Further important information regarding climate change and sustainability-related statements
This Interim Financial Results Announcement contains forward-looking statements and other representations relating to ESG topics, including but not limited to climate change, net zero, climate resilience, natural capital, emissions intensity, human rights and other sustainability-related statements, commitments, targets, projections, scenarios, risk and opportunity assessments, pathways, forecasts, estimated projections and other proxy data. These are subject to known and unknown risks, and there are significant uncertainties, limitations, risks and assumptions in the metrics and modelling on which these statements rely.
In particular, the metrics, methodologies and data relating to climate and sustainability are rapidly evolving and maturing, including variations in approaches and common standards in estimating and calculating emissions, and uncertainty around future climate- and sustainability-related policy and legislation. There are inherent limits in the current scientific understanding of climate change and its impacts. Some material contained in this Interim Financial Results Announcement may include information including, without limitation, methodologies, modelling, scenarios, reports, benchmarks, tools and data, derived from publicly available or government or industry sources that have not been independently verified. No representation or warranty is made as to the accuracy, completeness or reliability of such information. There is a risk that the estimates, judgements, assumptions, views, models, scenarios or projections used may turn out to be incorrect. These risks may cause actual outcomes, including the ability to meet commitments and targets, to differ materially from those expressed or implied in this Interim Financial Results Announcement. The climate- and sustainability-related forward-looking statements made in this Interim Financial Results Announcement are not guarantees or predictions of future performance and Westpac gives no representation, warranty or assurance (including as to the quality, accuracy or completeness of these statements), nor guarantee that the occurrence of the events expressed or implied in any forward-looking statement will occur. There are usually differences between forecast and actual results because events and actual circumstances frequently do not occur as forecast and these differences may be material. Westpac will continue to review and develop its approach to ESG as this subject area matures.
124 | WESTPAC GROUP 2023 INTERIM FINANCIAL RESULTS |
Other information
4.2References to websites
Information contained in or accessible through the websites mentioned in this Results Announcement does not form part of this Results Announcement unless we specifically state that it is incorporated by reference and forms part of this Results Announcement. All references in this Results Announcement to websites are inactive textual references and are for information only.
4.3Credit ratings1
| | | | | | |
Rating agency |
| Short Term | | Long Term |
| Outlook |
Fitch Ratings |
| F1 | | A+ |
| Stable |
Moody’s Investor Services |
| P-1 | | Aa3 |
| Stable |
S&P Global Ratings |
| A-1+ | | AA- |
| Stable |
4.4Dividend reinvestment plan
The Board has determined an interim fully franked dividend of 70 cents per share, to be paid on 27 June 2023 to shareholders on the register at the record date of 12 May 2023. The 2023 interim dividend represents a payout ratio of 61.33%. In addition to being fully franked, the dividend will also carry NZ$0.07 in New Zealand imputation credits that may be used by New Zealand tax residents.
Westpac operates a DRP that is available to holders of fully paid ordinary shares who are resident in, and whose address on the register of shareholders is in Australia or New Zealand. As noted in Section 1.8, the Directors have made certain determinations in relation to the calculation of the market price which will apply to the DRP for the 2023 interim dividend only.
Shareholders who wish to commence participation in the DRP, or to vary their current participation election, must do so by 5.00pm (Sydney time) on 15 May 2023.
Shareholders can provide these instructions:
| ● | Online for shareholders with holdings that have a market value of less than $1,000,000 within your Link Market Services portfolio, login into or create your Portfolio via the Westpac share registrar’s at linkmarketservices.com.au and electing the DRP or amending their existing instructions online; or |
| ● | By completing and returning a DRP application or variation form to Westpac’s share registry. Registry contact details are listed in Section 4.6. |
4.5Information on related entities
a. Changes in control of Group entities
During the six months ended 31 March 2023 there were no controlled entities acquired, formed, or incorporated.
During the six months ended 31 March 2023 the following controlled entities ceased to be controlled:
●Belliston Pty Limited (deregistered 30 October 2022)
●Westpac Finance (HK) Limited (deregistered 11 November 2022)
●Westpac Financial Holdings Pty Limited (deregistered 4 December 2022)
●Westpac Digital Partnerships Pty Limited (deregistered 8 January 2023)
●Hastings Funds Management Pty Limited (deregistered 23 February 2023)
●Westpac Singapore Limited (dissolved 2 March 2023)
●Advance Asset Management Limited (sold 31 March 2023)
b. | Associates |
| | |
As at 31 March 2023 |
| Ownership Interest Held (%) |
Akahu Technologies Ltd |
| 29.63% |
OpenAgent Pty Ltd |
| 22.55% |
mx51 Group Pty Ltd |
| 20.99% |
1.As at 31 March 2023.
125 |
Other information
4.6Financial calendar and Share Registry details
Westpac shares are listed on the securities exchanges in Australia (ASX) and New Zealand (NZX). Westpac Capital Notes 5, Westpac Capital Notes 6, Westpac Capital Notes 7, Westpac Capital Notes 8 and Westpac Capital Notes 9 are listed on the ASX.
Important dates to note are set out below, subject to change. Payment of any distribution, dividend or interest payment is subject to the relevant payment conditions and the key dates for each payment will be confirmed to the ASX for securities listed on the ASX.
Westpac Ordinary Shares (ASX code: WBC, NZX code: WBC)
| | |
Interim results and dividend announcement |
| 8 May 2023 |
Ex-dividend date for interim dividend | | 11 May 2023 |
Record date for interim dividend | | 12 May 2023 |
Interim dividend payable | | 27 June 2023 |
Financial Year end | | 30 September 2023 |
Closing date for receipt of director nominations before Annual General Meeting | | 26 October 2023 |
Final results and dividend announcement | | 6 November 2023 |
Ex-dividend date for final dividend | | 9 November 2023 |
Record date for final dividend | | 10 November 2023 |
Annual General Meeting | | 14 December 20231 |
Final dividend payable | | 19 December 2023 |
Westpac Capital Notes 5 (ASX code: WBCPH)
| | |
Ex-date for quarterly distribution |
| 13 June 2023 |
Record date for quarterly distribution | | 14 June 2023 |
Payment date for quarterly distribution | | 22 June 2023 |
Ex-date for quarterly distribution | | 13 September 2023 |
Record date for quarterly distribution | | 14 September 2023 |
Payment date for quarterly distribution | | 22 September 2023 |
Ex-date for quarterly distribution | | 13 December 2023 |
Record date for quarterly distribution | | 14 December 2023 |
Payment date for quarterly distribution | | 22 December 2023 |
Westpac Capital Notes 6 (ASX code: WBCPI)
| | |
Ex-date for quarterly distribution |
| 8 June 2023 |
Record date for quarterly distribution | ��� | 9 June 20232 |
Payment date for quarterly distribution | | 19 June 2023³ |
Ex-date for quarterly distribution | | 7 September 2023 |
Record date for quarterly distribution | | 8 September 20232 |
Payment date for quarterly distribution | | 18 September 2023 |
Ex-date for quarterly distribution | | 7 December 2023 |
Record date for quarterly distribution | | 8 December 20232 |
Payment date for quarterly distribution | | 18 December 2023 |
| 1. | Details regarding the location of the meeting and the business to be dealt with will be contained in a Notice of Meeting sent to shareholders in the November before the meeting. |
| 2. | Adjusted to immediately preceding business day as record date falls on a non-ASX business day or a date on which banks are not open for general business in Sydney. |
| 3. | Adjusted to next business day as payment date falls on a non-ASX business day or a date on which banks are not open for general business in Sydney. |
126 | WESTPAC GROUP 2023 INTERIM FINANCIAL RESULTS |
Other information
Westpac Capital Notes 7 (ASX code: WBCPJ)
| | |
Ex-date for quarterly distribution |
| 13 June 2023 |
Record date for quarterly distribution | | 14 June 2023 |
Payment date for quarterly distribution | | 22 June 2023 |
Ex-date for quarterly distribution | | 13 September 2023 |
Record date for quarterly distribution | | 14 September 2023 |
Payment date for quarterly distribution | | 22 September 2023 |
Ex-date for quarterly distribution | | 13 December 2023 |
Record date for quarterly distribution | | 14 December 2023 |
Payment date for quarterly distribution | | 22 December 2023 |
Westpac Capital Notes 8 (ASX code: WBCPK)
| | |
Ex-date for quarterly distribution |
| 9 June 2023 |
Record date for quarterly distribution |
| 13 June 2023 |
Payment date for quarterly distribution | | 21 June 2023 |
Ex-date for quarterly distribution | | 12 September 2023 |
Record date for quarterly distribution | | 13 September 2023 |
Payment date for quarterly distribution | | 21 September 2023 |
Ex-date for quarterly distribution | | 12 December 2023 |
Record date for quarterly distribution | | 13 December 2023 |
Payment date for quarterly distribution | | 21 December 2023 |
Westpac Capital Notes 9 (ASX code: WBCPL)
| | |
Ex-date for quarterly distribution |
| 13 June 2023 |
Record date for quarterly distribution | | 14 June 2023 |
Payment date for quarterly distribution | | 22 June 2023 |
Ex-date for quarterly distribution | | 13 September 2023 |
Record date for quarterly distribution | | 14 September 2023 |
Payment date for quarterly distribution | | 22 September 2023 |
Ex-date for quarterly distribution | | 13 December 2023 |
Record date for quarterly distribution | | 14 December 2023 |
Payment date for quarterly distribution | | 22 December 2023 |
127 |
Other information
Registered Office
Level 18, 275 Kent Street
Sydney NSW 2000
Australia
Telephone: +61 2 9155 7713
Facsimile: +61 2 8253 4128
International: +61 2 9155 7700
Website: www.westpac.com.au/westpacgroup
Share Registries
Australia | New Zealand | |
Ordinary shares on the main register, | Ordinary shares on the | |
Link Market Services Limited Level 12, 680 George Street Postal Address: Locked Bag A6015, | Link Market Services Limited Level 30, PwC Tower 15 Customs Street West Postal Address: P.O. Box 91976, | |
Website: www.linkmarketservices.com.au Email: westpac@linkmarketservices.com.au | Website: www.linkmarketservices.co.nz Email: enquiries@linkmarketservices.co.nz | |
Telephone: 1800 804 255 (toll free in Australia) International: +61 1800 804 255 Facsimile: +61 2 9287 0303 | Telephone: 0800 002 727 (toll free in New Zealand) International: +64 9 375 5998 Facsimile: +64 9 375 5990 | |
For further information contact: | | |
Media: Hayden Cooper Group Head of Media Relations +61 402 393 619 Analysts and Investors: Justin McCarthy General Manager Investor Relations +61 422 800 321 | | |
128 | WESTPAC GROUP 2023 INTERIM FINANCIAL RESULTS |
Other information
4.7 | Exchange rates |
4.7.1 | Exchange rates against A$ |
| | | | | | | | | | | | |
Six months to/as at |
| Half Year March 2023 |
| Half Year Sept 2022 |
| Half Year March 2022 | ||||||
Currency |
| Average |
| Spot |
| Average |
| Spot |
| Average |
| Spot |
US$ | | 0.6708 | | 0.6709 |
| 0.6989 | | 0.6490 |
| 0.7262 | | 0.7480 |
GBP | | 0.5615 |
| 0.5418 | | 0.5748 |
| 0.5841 | | 0.5401 |
| 0.5704 |
NZ$ | | 1.0876 | | 1.0678 |
| 1.1067 | | 1.1355 |
| 1.0593 | | 1.0759 |
4.7.2 | Impact of exchange rate movements on Group results |
| | | | | | | | | | | | |
| | Half Year March 2023 vs | | Half Year March 2023 vs | ||||||||
| | Half Year September 2022 | | Half Year March 2022 | ||||||||
| | | | FX impact | | Growth | | | | FX impact | | Growth |
$m | | Growth | | $m | | ex- FX | | Growth | | $m | | ex- FX |
Net interest income |
| 3% | | 20 |
| 3% | | 10% | | (27) |
| 10% |
Non-interest income |
| 276% | | 3 |
| 275% | | (3%) | | (3) |
| (3%) |
Net operating income |
| 17% | | 23 |
| 17% | | 8% | | (30) |
| 8% |
Operating expenses |
| (8%) | | (12) |
| (8%) | | (7%) | | 13 |
| (7%) |
Impairment (charges)/benefits |
| 98% | | (2) |
| 97% | | 181% | | 4 |
| 184% |
Profit before income tax expense |
| 50% | | 8 |
| 50% | | 19% | | (13) |
| 20% |
Income tax expense |
| 21% | | (3) |
| 21% | | 13% | | 4 |
| 13% |
Profit after income tax expense |
| 66% | | 6 |
| 66% | | 22% | | (8) |
| 22% |
Profit attributable to non-controlling interests (NCI) |
| 300% | | - |
| 300% | | - | | - |
| - |
Net profit attributable to owners of WBC |
| 66% | | 6 |
| 66% | | 22% | | (8) |
| 22% |
4.7.3 | Exchange rate risk on future NZ$ earnings |
Westpac’s policy in relation to the hedging of the future earnings of the Group’s New Zealand division is to manage the economic risk for volatility of the NZ$ against A$. Westpac manages these flows over a time horizon under which up to 100% of the expected earnings for the following 12 months and 50% of the expected earnings for the subsequent 12 months can be hedged. NZ Future Earnings hedges are only implemented when AUD/NZD is trading at the low end of the range or is expected to move higher over the next 6 months. This has not been the case since March 2022. As at 31 March 2023, Westpac has no Future Earnings hedge contracts in place.
129 |
Other information
4.8 | Net profit contribution of businesses sold |
To assist in understanding the contribution of these businesses the following tables provide the earnings (excluding Notable Items), and loans and deposits attributable to the entities sold. Earnings attributed to each business reflect its contribution up to the sale date, and any other gains/losses on these transactions which were not identified as Notable Items. Balance sheet data is at completion date. The following businesses were sold in 2023:
| ● | Advance Asset Management Limited sold on 31 March 2023. |
| ● | BT Superannuation SFT1 completed on 1 April 2023. |
Businesses sold
| | | | | | | | | | | | | | | | |
| | | | | |
| |
| | Specialist | |
| |
| |
|
| | | | | | | | Motor | | Businesses | | | | | | |
| | | | BT Personal | | | | Vehicle | | contribution | | Westpac | | Contribution | | Westpac |
| | Advance | | and | | Westpac Life | | Finance and | | of | | Life-NZ- | | of | | Life-NZ- |
|
| Asset |
| Corporate |
| Insurance |
| Novated |
| businesses |
| Limited |
| businesses |
| Limited |
$m | | Management | | Super1 | | Ltd. | | Leasing | | sold | | (A$) | | sold | | (NZ$) |
Half Year March 2023 |
|
|
|
|
|
|
|
|
|
|
|
|
|
|
|
|
Non-interest income |
| 38 |
| 77 |
| 25 |
| - |
| 140 |
| - |
| 140 |
| - |
Operating expenses |
| (8) |
| 26 |
| - |
| - |
| 18 |
| - |
| 18 |
| - |
Income tax expense and NCI |
| (9) |
| (31) |
| (7) |
| - |
| (47) |
| - |
| (47) |
| - |
Net profit |
| 21 |
| 72 |
| 18 |
| - |
| 111 |
| - |
| 111 |
| - |
Half Year Sept 2022 |
|
|
|
|
|
|
|
|
|
|
|
|
|
|
|
|
Non-interest income |
| 38 |
| 84 |
| 45 |
| - |
| 167 |
| - |
| 167 |
| - |
Operating expenses |
| (9) |
| (30) |
| (10) |
| - |
| (49) |
| - |
| (49) |
| - |
Income tax expense and NCI |
| (9) |
| (16) |
| (19) |
| - |
| (44) |
| - |
| (44) |
| - |
Net profit |
| 20 |
| 38 |
| 16 |
| - |
| 74 |
| - |
| 74 |
| - |
Half Year March 2022 |
|
|
|
|
|
|
|
|
|
|
|
|
|
|
|
|
Net interest income |
| - |
| - |
| - |
| 6 |
| 6 |
| - |
| 6 |
| - |
Non-interest income |
| 42 |
| 93 |
| 62 |
| - |
| 197 |
| 28 |
| 225 |
| 30 |
Operating expenses |
| (9) |
| (47) |
| (13) |
| (6) |
| (75) |
| (3) |
| (78) |
| (3) |
Impairment charges |
| - |
| - |
| - |
| 7 |
| 7 |
| - |
| 7 |
| - |
Income tax expense and NCI |
| (10) |
| (14) |
| (15) |
| (2) |
| (41) |
| (7) |
| (48) |
| (8) |
Net profit |
| 23 |
| 32 |
| 34 |
| 5 |
| 94 |
| 18 |
| 112 |
| 19 |
| 1. | Transfer of the members and benefits of BT Funds Management Limited’s personal and corporate (non-platform) superannuation products, via an SFT, to Mercer Super Trust. |
130 | WESTPAC GROUP 2023 INTERIM FINANCIAL RESULTS |
Other information
4.8 Net profit contribution of businesses sold (continued)
| | | | | | | | | | | | | | | | |
| |
| |
| |
| |
| | Specialist | |
| |
| |
|
| | | | | | | | Motor | | Businesses | | | | | | |
| | | | BT Personal | | | | Vehicle | | contribution | | Westpac | | Contribution | | Westpac |
| | Advance | | and | | Westpac Life | | Finance and | | Of | | Life-NZ- | | of | | Life-NZ- |
|
| Asset |
| Corporate |
| Insurance |
| Novated |
| businesses |
| Limited |
| businesses |
| Limited |
$bn | | Management | | Super1 | | Ltd. | | Leasing | | sold | | (A$) | | sold | | (NZ$) |
As at 31 March 2023 |
|
|
|
|
|
|
|
|
|
|
|
|
|
|
|
|
Total loans |
| - |
| - |
| - |
| - |
| - |
| - |
| - |
| - |
Total assets |
| - |
| - |
| - |
| - |
| - |
| - |
| - |
| - |
Risk weighted assets |
| - |
| - |
| - |
| - |
| - |
| - |
| - |
| - |
Average interest earning assets |
| - |
| - |
| - |
| - |
| - |
| - |
| - |
| - |
As at 30 Sept 2022 |
|
|
|
|
|
|
|
|
|
|
|
|
|
|
|
|
Total loans |
| - |
| - |
| - |
| - |
| - |
| - |
| - |
| - |
Total assets |
| - |
| - |
| 2.6 |
| - |
| 2.6 |
| - |
| 2.6 |
| - |
Risk weighted assets |
| - |
| - |
| - |
| - |
| - |
| - |
| - |
| - |
Average interest earning assets |
| - |
| - |
| - |
| - |
| - |
| - |
| - |
| - |
As at 31 March 2022 |
|
|
|
|
|
|
|
|
|
|
|
|
|
|
|
|
Total loans |
| - |
| - |
| - |
| 1.0 |
| 1.0 |
| - |
| 1.0 |
| - |
Total assets |
| - |
| - |
| 2.7 |
| 1.0 |
| 3.7 |
| 0.2 |
| 3.9 |
| 0.2 |
Risk weighted assets |
| - |
| - |
| - |
| 0.8 |
| 0.8 |
| - |
| 0.8 |
| - |
Average interest earning assets |
| - |
| - |
| - |
| 0.8 |
| 0.8 |
| - |
| 0.8 |
| - |
4.9 | Additional information for Non-AAS financial measures |
Calculation of Non-AAS financial measures
Details of the calculation of non-AAS financial measures not disclosed elsewhere are provided below:
Expense to income ratio (excluding Notable Items)
| | | | | | |
|
| Half Year |
| Half Year | | Half Year |
| | March | | Sept | | March |
$m | | 2023 | | 2022 | | 2022 |
Operating expenses |
| 4,988 |
| 5,429 | | 5,373 |
less: Notable Items (operating expenses) |
| - |
| (390) | | (231) |
Operating expenses excluding Notable Items |
| 4,988 |
| 5,039 | | 5,142 |
Net operating income |
| 11,003 |
| 9,376 | | 10,230 |
less: Notable Items (net interest income) |
| 89 |
| (288) | | (267) |
less: Notable Items (non-interest income) |
| (221) |
| 1,086 | | (232) |
Net operating income excluding Notable Items |
| 10,871 |
| 10,174 | | 9,731 |
Expense to income ratio (excluding Notable Items) |
| 45.88% | | 49.53% | | 52.84% |
Average tangible ordinary equity and Return on average tangible ordinary equity (ROTE)
| | | | | | |
|
| Half Year |
| Half Year |
| Half Year |
| | March | | Sept | | March |
$m | | 2023 | | 2022 | | 2022 |
Net profit1 |
| 4,001 |
| 2,414 |
| 3,280 |
Average ordinary equity |
| 70,947 |
| 69,467 |
| 71,073 |
less: Intangible assets (average) |
| (10,483) |
| (10,170) |
| (10,194) |
add: Computer software (average) |
| 2,400 |
| 2,038 |
| 1,946 |
Average tangible ordinary equity |
| 62,864 |
| 61,335 |
| 62,825 |
Return on average tangible ordinary equity (ROTE)1 |
| 12.76% | | 7.85% | | 10.47% |
| 1. | Net profit is annualised before dividing by average tangible ordinary equity. |
131 |
Other information
4.9 Additional information for Non-AAS financial measures (continued)
Pre-provision profit
| | | | | | |
|
| Half Year |
| Half Year |
| Half Year |
| | March | | Sept | | March |
$m | | 2023 | | 2022 | | 2022 |
Net interest income |
| 9,113 |
| 8,873 |
| 8,288 |
Non-interest income |
| 1,890 |
| 503 |
| 1,942 |
Operating expenses |
| (4,988) |
| (5,429) |
| (5,373) |
Pre-provision profit |
| 6,015 |
| 3,947 |
| 4,857 |
Dividend payout ratio (excluding Notable Items)
| | | | | | |
|
| Half Year |
| Half Year |
| Half Year |
| | March | | Sept | | March |
$m | | 2023 | | 2022 | | 2022 |
Ordinary dividend paid/declared on issued shares (net of Treasury shares) |
| 2,453 |
| 2,237 |
| 2,133 |
Net profit attributable to owners of WBC |
| 4,001 |
| 2,414 |
| 3,280 |
Add/(less): Notable Items (post tax) |
| (178) |
| 1,053 |
| (179) |
Net profit attributable to owners of WBC (excluding Notable Items) |
| 3,823 |
| 3,467 |
| 3,101 |
Dividend payout ratio (excluding Notable Items) |
| 64% | | 65% | | 69% |
Segment pre-provision profit
| | | | | | | | | | | | | | | | |
|
| |
| |
| Consumer |
| |
| |
| |
| |
| |
| | | | | | and | | Westpac | | Westpac | | | | | | |
| | | | | | Business | | Institutional | | New Zealand | | Specialist | | Group | | |
$m | | Consumer | | Business | | Banking | | Bank | | (A$) | | Businesses | | Businesses | | Group |
Half Year March 2023 |
|
|
|
|
|
|
|
|
|
|
|
|
|
|
|
|
Pre-provision profit/(loss) |
| 2,689 |
| 1,294 |
| 3,983 |
| 799 |
| 687 |
| 572 |
| (26) |
| 6,015 |
add/(less): Notable Items |
| - |
| - |
| - |
| - |
| - |
| (243) |
| 111 |
| (132) |
Pre-provision profit/(loss) excluding Notable Items |
| 2,689 |
| 1,294 |
| 3,983 |
| 799 |
| 687 |
| 329 |
| 85 |
| 5,883 |
Half Year Sept 2022 |
|
|
|
|
|
|
|
|
|
|
|
|
|
|
|
|
Pre-provision profit/(loss) |
| 2,576 |
| 956 |
| 3,532 |
| 576 |
| 651 |
| (933) |
| 121 |
| 3,947 |
add/(less): Notable Items |
| 66 |
| - |
| 66 |
| - |
| 12 |
| 1,270 |
| (160) |
| 1,188 |
Pre-provision profit/(loss) excluding Notable Items |
| 2,642 |
| 956 |
| 3,598 |
| 576 |
| 663 |
| 337 |
| (39) |
| 5,135 |
Half Year March 2022 |
|
|
|
|
|
|
|
|
|
|
|
|
|
|
|
|
Pre-provision profit/(loss) |
| 2,332 |
| 504 |
| 2,836 |
| 492 |
| 783 |
| 208 |
| 538 |
| 4,857 |
add/(less): Notable Items |
| - |
| - |
| - |
| - |
| (132) |
| 106 |
| (242) |
| (268) |
Pre-provision profit/(loss) excluding Notable Items |
| 2,332 |
| 504 |
| 2,836 |
| 492 |
| 651 |
| 314 |
| 296 |
| 4,589 |
5.0 | Glossary |
Shareholder value |
|
Average ordinary equity | Average total equity less average non-controlling interests. |
Average tangible ordinary equity | Average ordinary equity less intangible assets (excluding capitalised software). |
Average total equity | The average balance of shareholders’ equity, including non-controlling interests. |
Dividend payout ratio | Ordinary dividend paid/declared on issued shares (net of Treasury shares) divided by the net profit attributable to owners of WBC. |
Earnings per ordinary share | ● Basic earnings per ordinary share is calculated by dividing the net profit attributable to owners of WBC by the weighted average number of ordinary shares on issue during the period, adjusted for treasury shares. ● Diluted earnings per ordinary share is calculated by adjusting the basic earnings per ordinary share by assuming all dilutive potential ordinary shares are converted. |
Fully franked dividends per ordinary share (cents) | Dividends paid out of retained profits which carry a credit for Australian company income tax paid by Westpac. |
Net tangible assets per share | Net tangible assets (total equity less goodwill and other intangible assets less minority interests) divided by the number of ordinary shares on issue (less Treasury shares held). |
Pre-provision profit | Net interest income plus non-interest income less operating expenses. |
Return on average ordinary equity (ROE) | Net profit attributable to the owners of WBC adjusted for RSP dividends (annualised where applicable) divided by average ordinary equity. |
Return on average tangible ordinary equity (ROTE) | Net profit attributable to the owners of WBC (annualised where applicable) divided by average tangible ordinary equity. |
Weighted average ordinary shares | Weighted average number of fully paid ordinary shares listed on the Australian Stock Exchange for the relevant period less Westpac shares held by the Group (‘Treasury shares’). |
Productivity and efficiency | |
Expense to income ratio | Operating expenses divided by net operating income. |
Expense to income ratio (ex Notable Items) | Operating expenses excluding Notable Items divided by net operating income excluding Notable Items. |
Full time equivalent employees (FTE) | A calculation based on the number of hours worked by full and part-time employees as part of their normal duties. For example, the full time equivalent of one FTE is 76 hours paid work per fortnight. |
Revenue per FTE | Total operating income divided by the average number of FTE for the period. |
Business Performance | |
Average | Where possible, daily balances are used to calculate the average balance for the period. |
Average interest bearing liabilities | The average balance of liabilities owed by the Group that incur an interest expense. Where possible, daily balances are used to calculate the average balance for the period |
Average interest earning assets | The average balance of assets held by the Group that generate interest income. Where possible, daily balances are used to calculate the average balance for the period. |
Core NIM | Calculated by dividing net interest income excluding Notable Items and Treasury & Markets (annualised where applicable) by average interest earning assets. |
Group NIM/Net interest margin | Calculated by dividing net interest income (annualised where applicable) by average interest earning assets. |
Net profit | Net profit attributable to owners of WBC. |
Capital Adequacy |
|
Australian Prudential Regulation Authority (APRA) leverage ratio | Tier 1 capital divided by ‘exposure measure’ and expressed as a percentage. ‘Exposure measure’ is the sum of on-balance sheet exposures, derivative exposures, securities financing transaction exposures and other off- balance sheet exposures. |
Common equity tier 1 (CET1) capital ratio | Total common equity capital divided by risk weighted assets, as defined by APRA. |
Internationally comparable capital ratios | Internationally comparable methodology references the ABA study on the comparability of APRA’s new capital framework and finalised reform released on 10 March 2023. |
Risk weighted assets (RWA) | Assets (both on and off-balance sheet) are risk weighted according to each asset’s inherent potential for default and what the likely losses would be in case of default. In the case of non-asset backed risks (i.e. market, IRRBB and operational risk), RWA is determined by multiplying the capital requirements for those risks by 12.5. |
Credit risk weighted assets (Credit RWA) | Credit risk weighted assets represent risk weighted assets (on-balance sheet and off-balance sheet) that relate to credit exposures and therefore exclude market risk, operational risk, interest rate risk in the banking book and other assets. |
Business lending | Includes credit exposures not captured elsewhere, and where the borrower’s annual turnover is below $75 million. |
Corporate | Exposures to corporate borrowers that do not fall within the definition of Large Corporate, Property Finance, Specialised Lending, Business Lending or Small Business exposures. |
Financial institution | Includes exposure to entities whose primary dealings relates to management of financial assets, lending, factoring, leasing provision of credit enhancements, securitisation, investments, financial custody, central counter party services and proprietary trading. |
Large corporate | Exposures to counter parties with consolidated annual revenue (of the counterparty or group that the counter party consolidates into) exceeding $750 million. |
New Zealand | Overseas banking subsidiary regulated by the RBNZ. |
Property finance | Exposures to borrowers where repayments depend primarily on the cash flows generated by the property or other real estate assets owned by the borrower. |
Securitisation | Exposures relating to Westpac’s involvement in securitisation activities range from a seller of its own assets to an investor in third party transactions and include the provision of securitisation services for its clients. |
Small business | Program-managed business exposures typically below $1.5 million in value. Program-managed exposures are managed on a statistical basis according to pre-determined objective criteria. |
Sovereign | Exposures to Australian and overseas central and sub-national governments, and central banks. |
Specialised lending | Includes exposures to project and object finance lending. Project finance and object finance rely primarily on the revenues generated by a project, or equipment asset respectively, both as a source of repayment and as security for the loan. Excludes Property Finance exposures. |
Operational risk | The risk of loss resulting from inadequate or failed internal processes, people and systems or from external events, including legal risk but excluding strategic or reputational risk. |
Tier 1 capital ratio | Total Tier 1 capital divided by risk weighted assets, as defined by APRA. |
Total regulatory capital ratio | Total regulatory capital divided by risk weighted assets, as defined by APRA. |
134 | WESTPAC GROUP 2023 INTERIM FINANCIAL RESULTS |
Glossary
Funding and liquidity | |
Committed Liquidity Facility (CLF) | Prior to 1 January 2023, the RBA made available to Australian Authorised Deposit-taking Institutions a CLF that, subject to qualifying conditions, can be accessed to meet LCR requirements under APS210 Liquidity. |
Deposit to loan ratio | Customer deposits divided by net loans. |
Funding for Lending Programme (FLP) | A facility that was established by the RBNZ in December 2020 to provide 3 year term funding to eligible New Zealand institutions via repurchase transactions, subject to qualifying conditions, to help support lending to New Zealand customers. The facility closed to new draw downs in December 2022. |
High Quality Liquid Assets (HQLA) | Assets which meet APRA’s criteria for inclusion as HQLA in the numerator of the LCR. |
Liquid assets | HQLA and non LCR qualifying liquid assets, but excludes internally securitised assets that are eligible for a repurchase agreement with the RBA and the RBNZ. |
Liquidity Coverage Ratio (LCR) | An APRA requirement to maintain an adequate level of unencumbered high quality liquid assets, to meet liquidity needs for a 30 calendar day period under an APRA-defined severe stress scenario. Absent a situation of financial stress, the value of the LCR must not be less than 100%. LCR is calculated as the percentage ratio of stock of HQLA, and qualifying RBNZ securities over the total net cash out-flows in a modelled 30 day defined stressed scenario. |
Net Stable Funding Ratio (NSFR) | The NSFR is defined as the ratio of the amount of available stable funding (ASF) to the amount of required stable funding (RSF) defined by APRA. The amount of ASF is the portion of an ADI’s capital and liabilities expected to be a reliable source of funds over a one year time horizon. The amount of RSF is a function of the liquidity characteristics and residual maturities of an ADI’s assets and off-balance sheet activities. ADIs must maintain an NSFR of at least 100%. |
Term Funding Facility (TFF) | A facility that was established by the RBA in March 2020 to provide 3 year term funding to Australian ADIs via repurchase transactions, subject to qualifying conditions, to help support lending to Australian businesses. The facility closed to new draw downs in June 2021. |
Term funding from central banks | Term funding from central banks includes the drawn balances of the RBA TFF and the RBNZ FLP and Term Lending Facility. |
Wholesale funding | Wholesale funding includes debt issues, loan capital, certificates of deposit, term funding from central banks and interbank placements. |
Credit quality | |
Collectively assessed provisions (CAPs) | Collectively assessed provisions for expected credit loss under AASB 9 represent the Expected Credit Loss (ECL) which is collectively assessed in pools of similar assets with similar risk characteristics. This incorporates forward- looking information and does not require an actual loss event to have occurred for an impairment provision to be recognised. |
Default | Credit exposures that are non-performing. |
Exposure at default (EAD) | The estimated outstanding amount of credit exposure at the time of the default. |
Gross impaired exposures provisions to gross impaired exposures | Impairment provisions relating to impaired exposures include individually assessed provisions plus the proportion of the collectively assessed provisions that relate to impaired exposures. |
Impaired exposures | Includes exposures that have deteriorated to the point where full collection of interest and principal is in doubt, based on an assessment of the customer’s outlook, cash flow, and the net realisation of value of assets to which recourse is held: ● Facilities 90 days or more past due, and full recovery is in doubt: exposures where contractual payments are 90 or more days in arrears and the net realisable value of assets to which recourse is held may not be sufficient to allow full collection of interest and principal, including overdrafts or other revolving facilities that remain continuously outside approved limits by material amounts for 90 or more calendar days; ● Non-accrual facilities: exposures with individually assessed impairment provisions held against them, excluding restructured loans; ● Restructured facilities: exposures where the original contractual terms have been formally modified to provide for concessions of interest or principal for reasons related to the financial difficulties of the customer; ● Other assets acquired through security enforcement (includes other real estate owned): includes the value of any other assets acquired as full or partial settlement of outstanding obligations through the enforcement of security arrangements; or ● Any other facilities where the full collection of interest and principal is in doubt. |
Impairment charges/(benefit) to average loans | Calculated as impairment charges (annualised where applicable) divided by average gross loans. |
135 |
Glossary
Credit quality (continued) | |
Individually assessed provisions (IAPs) | Provisions raised for losses on loans that are known to be impaired and are assessed on an individual basis. The estimated losses on these impaired loans is based on expected future cash flows discounted to their present value and, as this discount unwinds, interest will be recognised in the income statement. |
Loss given default (LGD) | The loss that is expected to arise in the event of a default. |
Non-performing not impaired exposures | Includes those credit exposures that are in default, but where it is expected that the full value of principal and accrued interest can be collected, generally by reference to the value of security held. |
Performing exposures | Credit exposures that are not non-performing. |
Probability of default (PD) | The probability that a counter party will default. |
Provision for expected credit losses (ECL) | Expected credit losses (ECL) are a probability-weighted estimate of the cash shortfalls expected to result from defaults over the relevant time frame. They are determined by evaluating a range of possible outcomes and taking into account the time value of money, past events, current conditions and forecasts of future economic conditions. |
Stage 1: 12 months ECL - performing | For financial assets where there has been no significant increase in credit risk since origination a provision for 12 months expected credit losses is recognised. Interest revenue is calculated on the gross carrying amount of the financial asset. |
Stage 2: Lifetime ECL - performing | For financial assets where there has been a significant increase in credit risk since origination but where the asset is still performing a provision for lifetime expected losses is recognised. Interest revenue is calculated on the gross carrying amount of the financial asset. |
Stage 3: Lifetime ECL - non-performing | For financial assets that are non-performing a provision for lifetime expected losses is recognised. Interest revenue is calculated on the carrying amount net of the provision for ECL rather than the gross carrying amount. |
Stressed exposures | Watchlist and substandard credit exposures plus non-performing exposures. |
Total committed exposure (TCE) | Represents the sum of the committed portion of direct lending (including funds placement overall and deposits placed), contingent and pre-settlement risk plus the committed portion of secondary market trading and underwriting risk. |
Watchlist and substandard | Loan facilities where customers are experiencing operating weakness and financial difficulty but are not expected to incur loss of interest or principal. |
Other | |
AAML | Advance Asset Management Limited |
AAS | Australian Accounting Standards |
AASB | Australian Accounting Standards Board |
ACCC | Australian Competition and Consumer Commission |
ADI | Authorised Deposit-taking Institution |
AGM | Annual General Meeting |
AML | Anti-money laundering |
APRA | Australian Prudential Regulation Authority |
APS | Australian Prudential Standard |
ASIC | Australian Securities and Investments Commission |
ASX | Australian Securities Exchange |
ATM | Automated Teller Machine |
ATO | Australian Taxation Office |
AUSTRAC | Australian Transaction Reports and Analysis Centre |
BCCC | The Banking Code Compliance Committee |
BPNG | Bank of Papua New Guinea |
bps | Basis points |
CBB | Consumer and Business Banking |
CORE program | Customer Outcomes and Risk Excellence |
Credit Value Adjustment (CVA) | CVA adjusts the fair value of over-the-counter derivatives for credit risk. CVA is employed on the majority of derivative positions and reflects the market view of the counter party credit risk. A Debit Valuation Adjustment is employed to adjust for our own credit risk. |
CTF | Counter-terrorism financing |
Derivative Valuation Adjustment (DVA) | DVA includes CVA and FVA. |
DRP | Dividend Reinvestment Plan |
D-SIB | Domestic systemically important bank |
136 | WESTPAC GROUP 2023 INTERIM FINANCIAL RESULTS |
Glossary
Other (continued) | |
ESG | Environment, social and governance |
FATCA | Foreign Account Tax Compliance Act |
First Half 2022 | Six months ended 31 March 2022 |
First Half 2023 | Six months ended 31 March 2023 |
Funding Value Adjustment (FVA) | FVA relates to the funding cost or benefit associated with the uncollateralised portion of the derivative portfolio. |
FVIS | Fair value through income statement |
FVOCI | Fair value through other comprehensive income |
FX | Foreign exchange |
IASB | International Accounting Standards Board |
IBOR | Inter-Bank Offered Rate |
IFRS | International Financial Reporting Standards |
IRRBB | Interest Rate Risk in the Banking Book |
LIBOR | London Inter-Bank Offered Rate |
NCI | Non-controlling interests |
Non-interest bearing | Instruments which do not carry a rate of interest. |
NZBA | Net-Zero Banking Alliance |
OAIC | The Office of the Australian Information Commissioner |
OCI | Other comprehensive income |
OTC | Over the counter |
Prior corresponding period | Refers to the six months ended 31 March 2022 |
Prior half / Prior period | Refers to the six months ended 30 September 2022 |
RBA | Reserve Bank of Australia |
RBNZ | Reserve Bank of New Zealand |
RSP | Restricted Share Plan |
Run-off | Scheduled and unscheduled repayments and debt repayments (from for example property sales and external refinancing), net of redraws. |
Second Half 2022 | Six months ended 30 September 2022. |
Segment reporting | Segment reporting are presented on a management reporting basis. Internal charges and transfer pricing adjustments are included in the performance of each segment reflecting the management structure rather than the legal entity (these results cannot be compared to results for individual legal entities). Where management reporting structures or accounting classifications have changed, financial results for comparative periods have been restated and may differ from results previously reported. Overhead costs are allocated to revenue generating segments. The Group’s internal transfer pricing frameworks facilitate risk transfer, profitability measurement, capital allocation and segment alignment, tailored to the jurisdictions in which the Group operates. Transfer pricing allows the Group to measure the relative contribution of products and segments to the Group’s interest margin and other dimensions of performance. Key components of the Group’s transfer pricing frameworks are funds transfer pricing for interest rate and liquidity risk and allocation of basis and contingent liquidity costs, including capital allocation. |
SFT | Successor fund transfer |
SME | Small to medium sized enterprises |
Value at Risk (VaR) | A statistical estimate of the potential loss in earnings over a specified period of time and to a given level of confidence based on historical market movements. |
WIB | Westpac Institutional Bank |
WNZL | Westpac New Zealand Limited |