Exhibit 1
| ASX Release 6 November 2023 Westpac 2023 Presentation and Investor Discussion Pack Westpac Banking Corporation (“Westpac”) today provides the attached Westpac 2023 Presentation and Investor Discussion Pack. For further information: Hayden Cooper Justin McCarthy Group Head of Media Relations General Manager, Investor Relations 0402 393 619 0422 800 321 This document has been authorised for release by Tim Hartin, Company Secretary. Level 18, 275 Kent Street Sydney, NSW, 2000 |
|

| WESTPAC 2023 FULL YEAR RESULTS INDEX 2023 Full Year Results Presentation 3 Investor Discussion Pack of 2023 Full Year Results 33 Earnings drivers 36 Credit quality and provisions 48 Non-credit risk management 69 Capital, Funding and Liquidity 76 Customer franchise 88 Sustainability 95 Segment results 106 Economics 115 Appendix 119 Contact us 133 Disclaimer 134 |
| PETER KING Chief Executive Officer |
| 4 Westpac Group 2023 Full Year Results Presentation & Investor Discussion Pack FY23 HIGHLIGHTS IMPROVED FINANCIAL RESULT BALANCE SHEET MOMENTUM ACCELERATING TECHNOLOGY SIMPLIFICATION STRENGTHENED CUSTOMER FRANCHISE COMPLETED PORTFOLIO SIMPLIFICATION |

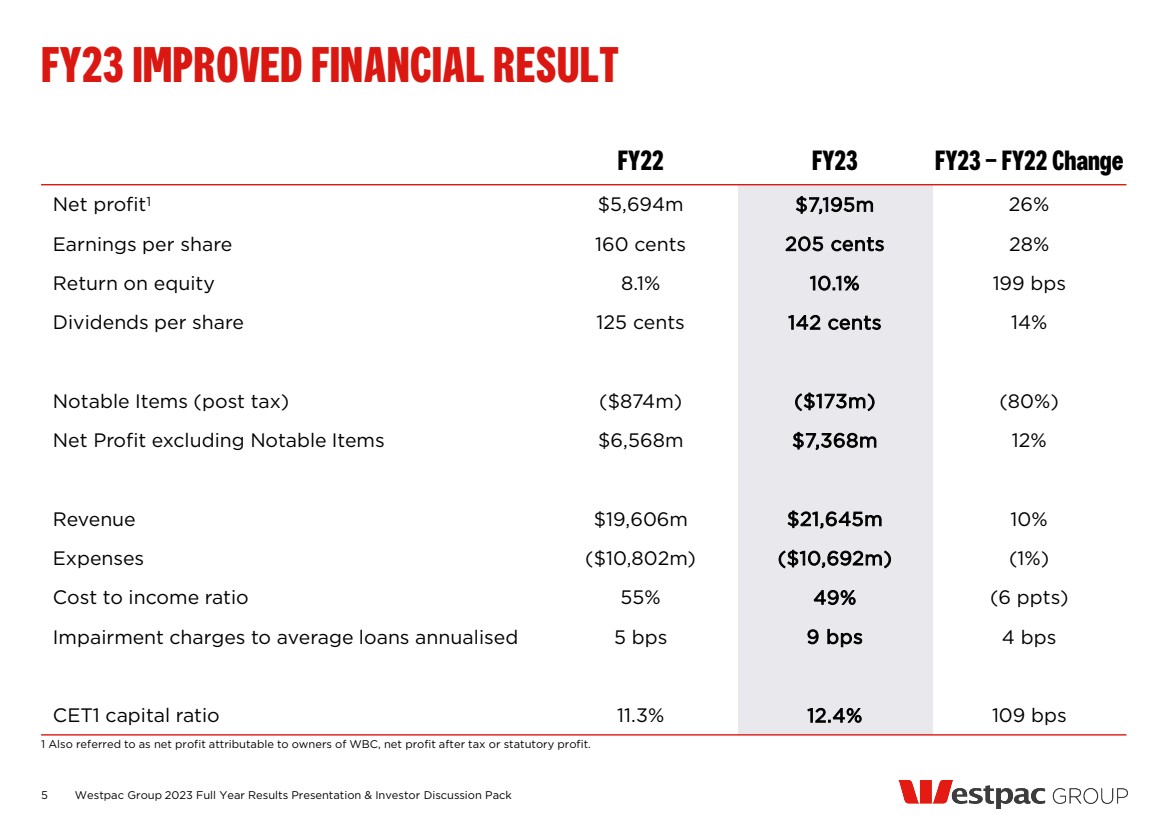
| FY22 FY23 FY23 – FY22 Change Net profit1 $5,694m $7,195m 26% Earnings per share 160 cents 205 cents 28% Return on equity 8.1% 10.1% 199 bps Dividends per share 125 cents 142 cents 14% Notable Items (post tax) ($874m) ($173m) (80%) Net Profit excluding Notable Items $6,568m $7,368m 12% Revenue $19,606m $21,645m 10% Expenses ($10,802m) ($10,692m) (1%) Cost to income ratio 55% 49% (6 ppts) Impairment charges to average loans annualised 5 bps 9 bps 4 bps CET1 capital ratio 11.3% 12.4% 109 bps FY23 IMPROVED FINANCIAL RESULT 1 Also referred to as net profit attributable to owners of WBC, net profit after tax or statutory profit. 5 Westpac Group 2023 Full Year Results Presentation & Investor Discussion Pack |
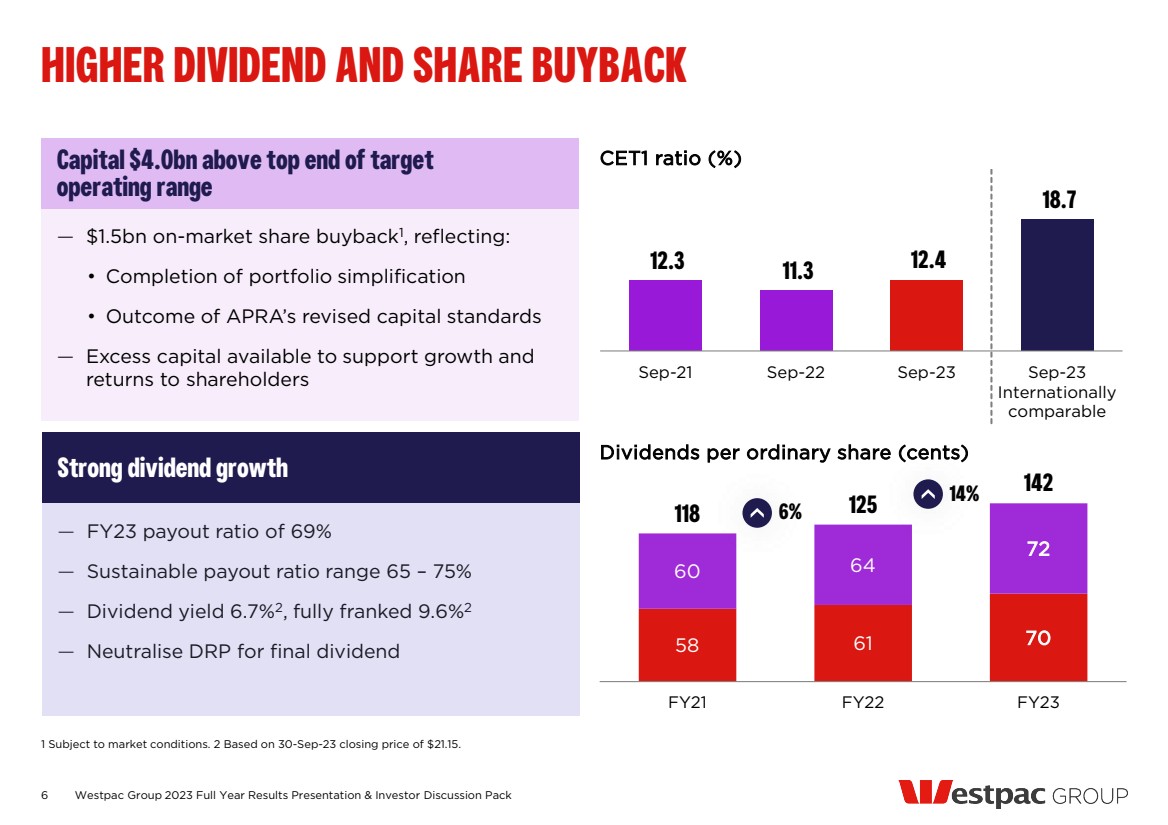
| — $1.5bn on-market share buyback1 , reflecting: • Completion of portfolio simplification • Outcome of APRA’s revised capital standards — Excess capital available to support growth and returns to shareholders Capital $4.0bn above top end of target operating range 6 CET1 ratio (%) 12.3 11.3 12.4 18.7 Sep-21 Sep-22 Sep-23 Sep-23 Internationally comparable Dividends per ordinary share (cents) 58 61 70 60 64 72 118 125 142 FY21 FY22 FY23 HIGHER DIVIDEND AND SHARE BUYBACK 1 Subject to market conditions. 2 Based on 30-Sep-23 closing price of $21.15. 14% 6% Westpac Group 2023 Full Year Results Presentation & Investor Discussion Pack — FY23 payout ratio of 69% — Sustainable payout ratio range 65 – 75% — Dividend yield 6.7%2, fully franked 9.6%2 — Neutralise DRP for final dividend Strong dividend growth |
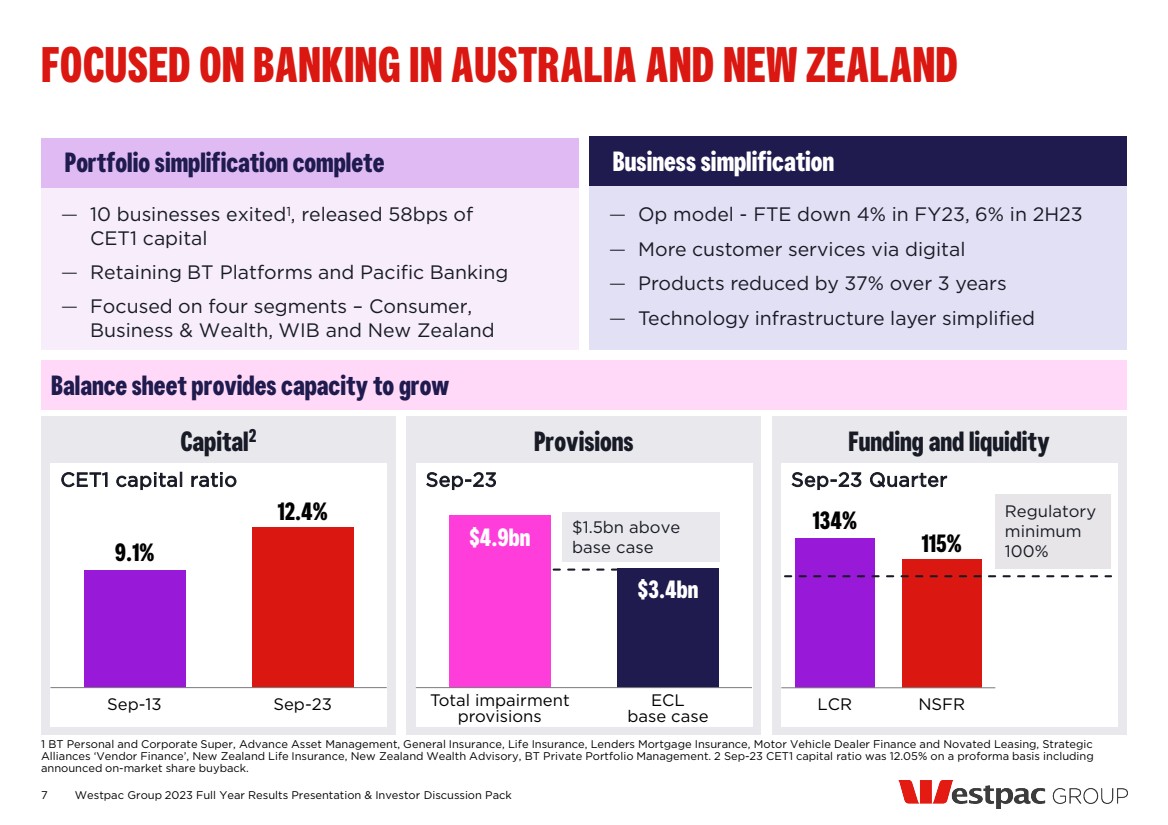
| Capital2 Provisions Funding and liquidity 7 Westpac Group 2023 Full Year Results Presentation & Investor Discussion Pack 1 BT Personal and Corporate Super, Advance Asset Management, General Insurance, Life Insurance, Lenders Mortgage Insurance, Motor Vehicle Dealer Finance and Novated Leasing, Strategic Alliances ‘Vendor Finance’, New Zealand Life Insurance, New Zealand Wealth Advisory, BT Private Portfolio Management. 2 Sep-23 CET1 capital ratio was 12.05% on a proforma basis including announced on-market share buyback. FOCUSED ON BANKING IN AUSTRALIA AND NEW ZEALAND — Op model - FTE down 4% in FY23, 6% in 2H23 — More customer services via digital — Products reduced by 37% over 3 years — Technology infrastructure layer simplified — 10 businesses exited1 , released 58bps of CET1 capital — Retaining BT Platforms and Pacific Banking — Focused on four segments – Consumer, Business & Wealth, WIB and New Zealand Portfolio simplification complete Business simplification Balance sheet provides capacity to grow CET1 capital ratio Sep-23 Sep-23 Quarter 9.1% 12.4% Sep-13 Sep-23 $4.9bn $3.4bn Total impairment provisions ECL base case 134% 115% LCR NSFR $1.5bn above base case Regulatory minimum 100% |
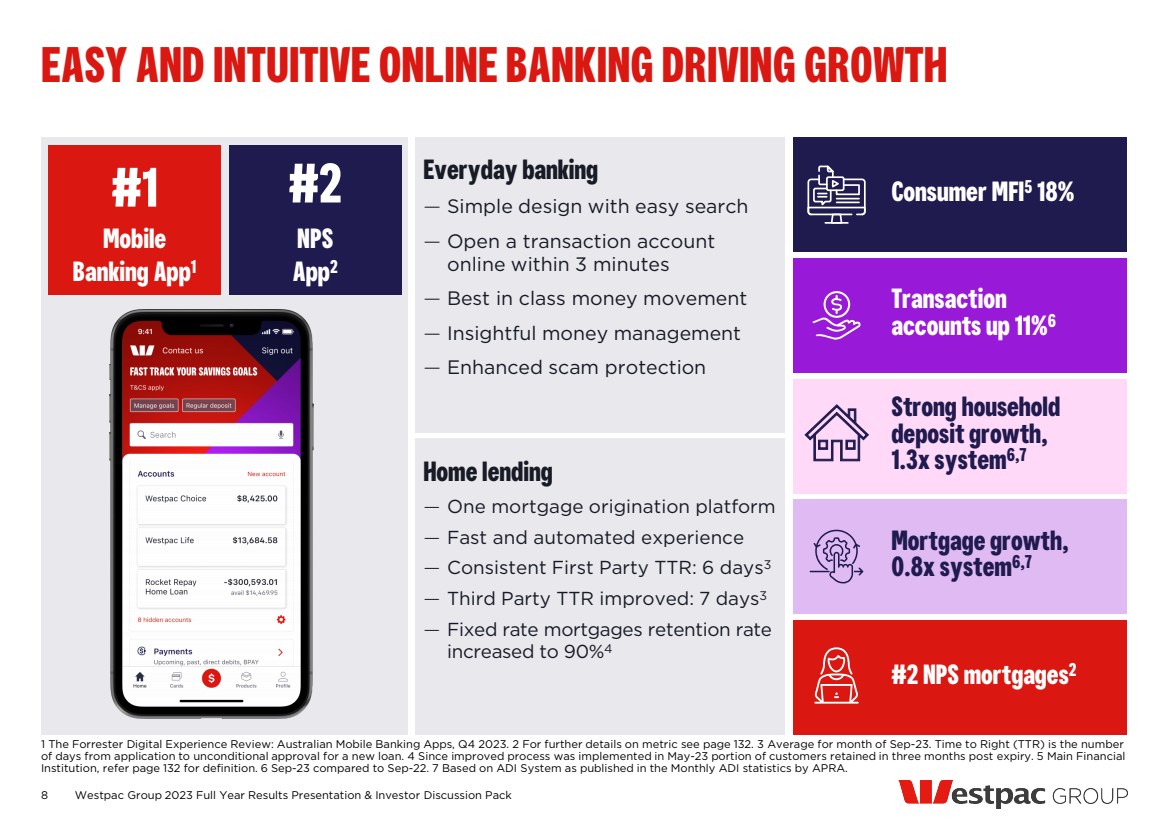
| 8 Westpac Group 2023 Full Year Results Presentation & Investor Discussion Pack 1 The Forrester Digital Experience Review: Australian Mobile Banking Apps, Q4 2023. 2 For further details on metric see page 132. 3 Average for month of Sep-23. Time to Right (TTR) is the number of days from application to unconditional approval for a new loan. 4 Since improved process was implemented in May-23 portion of customers retained in three months post expiry. 5 Main Financial Institution, refer page 132 for definition. 6 Sep-23 compared to Sep-22. 7 Based on ADI System as published in the Monthly ADI statistics by APRA. EASY AND INTUITIVE ONLINE BANKING DRIVING GROWTH #1 NPS App2 #2 Mobile Banking App1 Everyday banking — Simple design with easy search — Open a transaction account online within 3 minutes — Best in class money movement — Insightful money management — Enhanced scam protection Consumer MFI5 18% Home lending — One mortgage origination platform — Fast and automated experience — Consistent First Party TTR: 6 days3 — Third Party TTR improved: 7 days3 — Fixed rate mortgages retention rate increased to 90%4 Strong household deposit growth, 1.3x system6,7 Mortgage growth, 0.8x system6,7 #2 NPS mortgages2 Transaction accounts up 11%6 |
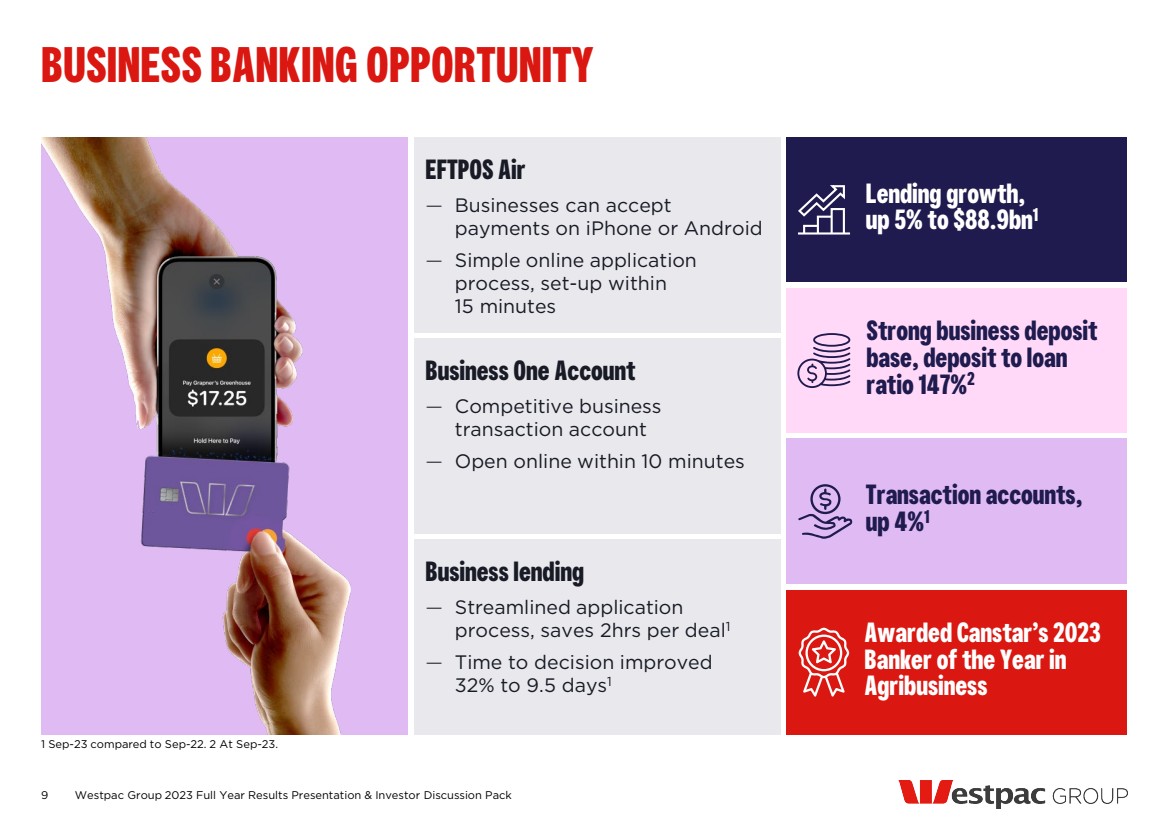
| 9 1 Sep-23 compared to Sep-22. 2 At Sep-23. BUSINESS BANKING OPPORTUNITY Lending growth, up 5% to $88.9bn1 Strong business deposit base, deposit to loan ratio 147%2 Transaction accounts, up 4%1 Awarded Canstar’s 2023 Banker of the Year in Agribusiness EFTPOS Air — Businesses can accept payments on iPhone or Android — Simple online application process, set-up within 15 minutes Business One Account — Competitive business transaction account — Open online within 10 minutes Business lending — Streamlined application process, saves 2hrs per deal1 — Time to decision improved 32% to 9.5 days1 Westpac Group 2023 Full Year Results Presentation & Investor Discussion Pack |
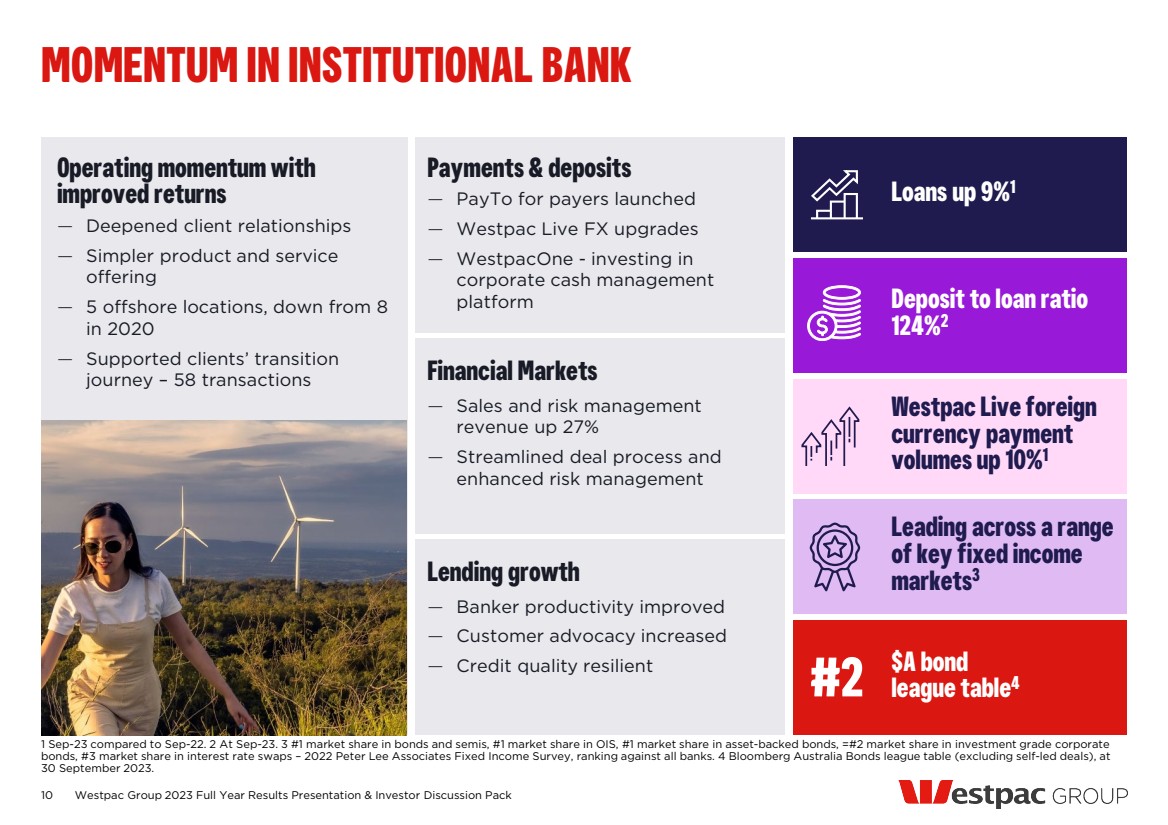
| 10 Westpac Group 2023 Full Year Results Presentation & Investor Discussion Pack 1 Sep-23 compared to Sep-22. 2 At Sep-23. 3 #1 market share in bonds and semis, #1 market share in OIS, #1 market share in asset-backed bonds, =#2 market share in investment grade corporate bonds, #3 market share in interest rate swaps – 2022 Peter Lee Associates Fixed Income Survey, ranking against all banks. 4 Bloomberg Australia Bonds league table (excluding self-led deals), at 30 September 2023. MOMENTUM IN INSTITUTIONAL BANK Operating momentum with improved returns — Deepened client relationships — Simpler product and service offering — 5 offshore locations, down from 8 in 2020 — Supported clients’ transition journey – 58 transactions Payments & deposits — PayTo for payers launched — Westpac Live FX upgrades — WestpacOne - investing in corporate cash management platform Financial Markets — Sales and risk management revenue up 27% — Streamlined deal process and enhanced risk management Lending growth — Banker productivity improved — Customer advocacy increased — Credit quality resilient Loans up 9%1 Westpac Live foreign currency payment volumes up 10%1 Leading across a range of key fixed income markets3 $A bond league table4 Deposit to loan ratio 124%2 #2 |
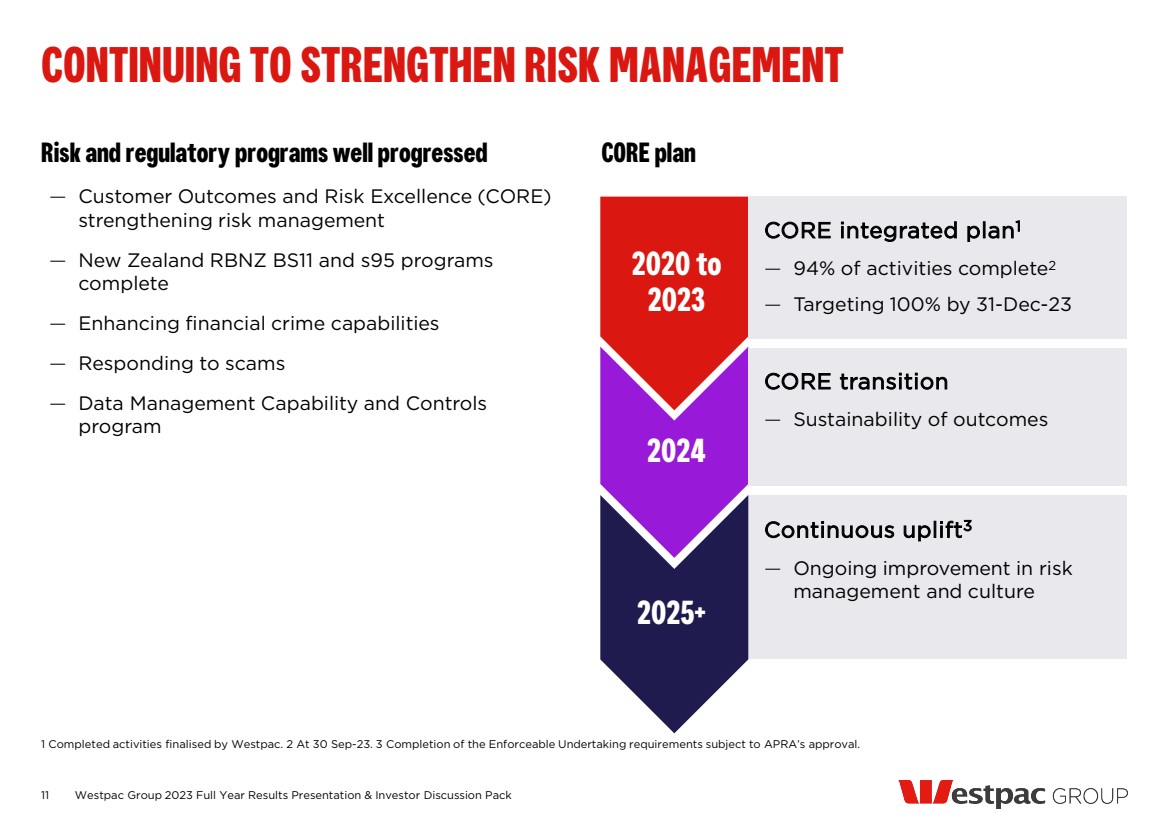
| CONTINUING TO STRENGTHEN RISK MANAGEMENT 11 Risk and regulatory programs well progressed — Customer Outcomes and Risk Excellence (CORE) strengthening risk management — New Zealand RBNZ BS11 and s95 programs complete — Enhancing financial crime capabilities — Responding to scams — Data Management Capability and Controls program CORE plan 1 Completed activities finalised by Westpac. 2 At 30 Sep-23. 3 Completion of the Enforceable Undertaking requirements subject to APRA’s approval. Continuous uplift3 — Ongoing improvement in risk management and culture 2020 to 2023 CORE integrated plan1 — 94% of activities complete2 — Targeting 100% by 31-Dec-23 2024 CORE transition — Sustainability of outcomes 2025+ Westpac Group 2023 Full Year Results Presentation & Investor Discussion Pack |
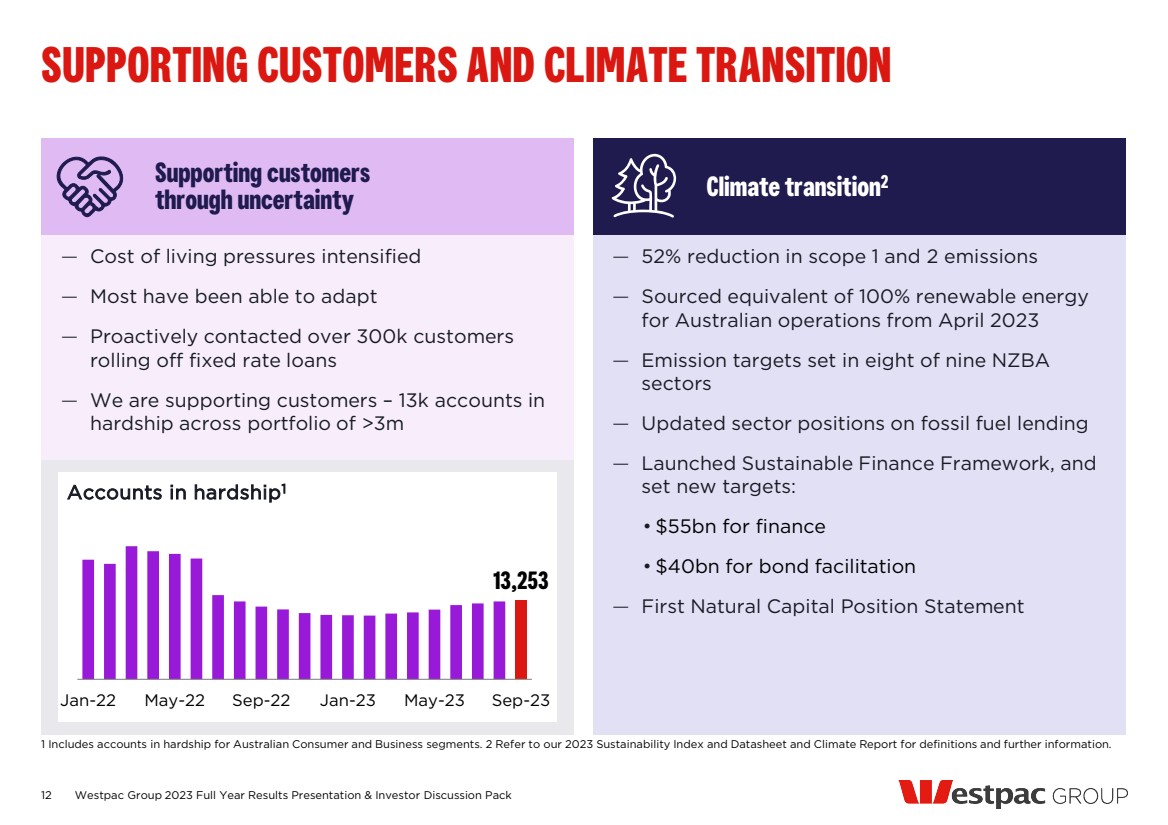
| 1 Includes accounts in hardship for Australian Consumer and Business segments. 2 Refer to our 2023 Sustainability Index and Datasheet and Climate Report for definitions and further information. 12 Westpac Group 2023 Full Year Results Presentation & Investor Discussion Pack SUPPORTING CUSTOMERS AND CLIMATE TRANSITION — 52% reduction in scope 1 and 2 emissions — Sourced equivalent of 100% renewable energy for Australian operations from April 2023 — Emission targets set in eight of nine NZBA sectors — Updated sector positions on fossil fuel lending — Launched Sustainable Finance Framework, and set new targets: • $55bn for finance • $40bn for bond facilitation — First Natural Capital Position Statement — Cost of living pressures intensified — Most have been able to adapt — Proactively contacted over 300k customers rolling off fixed rate loans — We are supporting customers – 13k accounts in hardship across portfolio of >3m Climate transition Supporting customers 2 through uncertainty 13,253 Jan-22 May-22 Sep-22 Jan-23 May-23 Sep-23 Accounts in hardship1 |
| MICHAEL ROWLAND Chief Financial Officer |
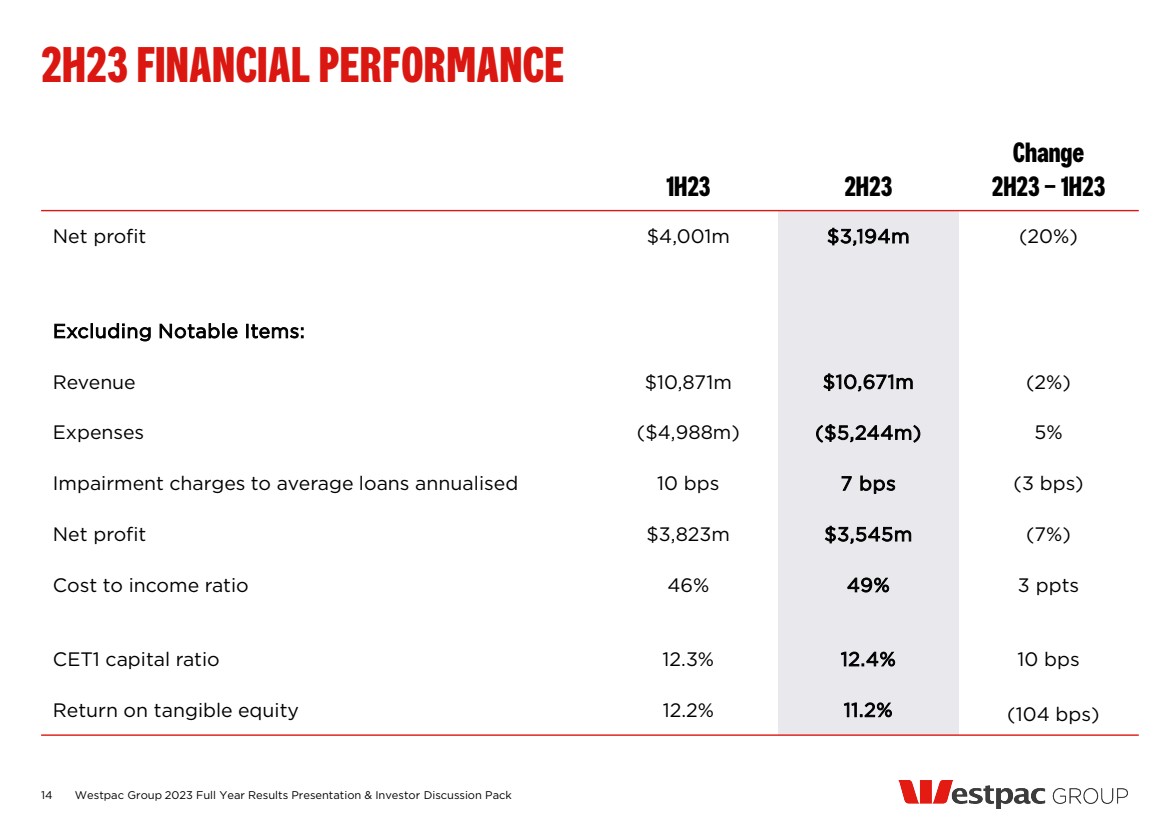
| 1H23 2H23 Change 2H23 – 1H23 Net profit $4,001m $3,194m (20%) Excluding Notable Items: Revenue $10,871m $10,671m (2%) Expenses ($4,988m) ($5,244m) 5% Impairment charges to average loans annualised 10 bps 7 bps (3 bps) Net profit $3,823m $3,545m (7%) Cost to income ratio 46% 49% 3 ppts CET1 capital ratio 12.3% 12.4% 10 bps Return on tangible equity 12.2% 11.2% (104 bps) 2H23 FINANCIAL PERFORMANCE 14 Westpac Group 2023 Full Year Results Presentation & Investor Discussion Pack |
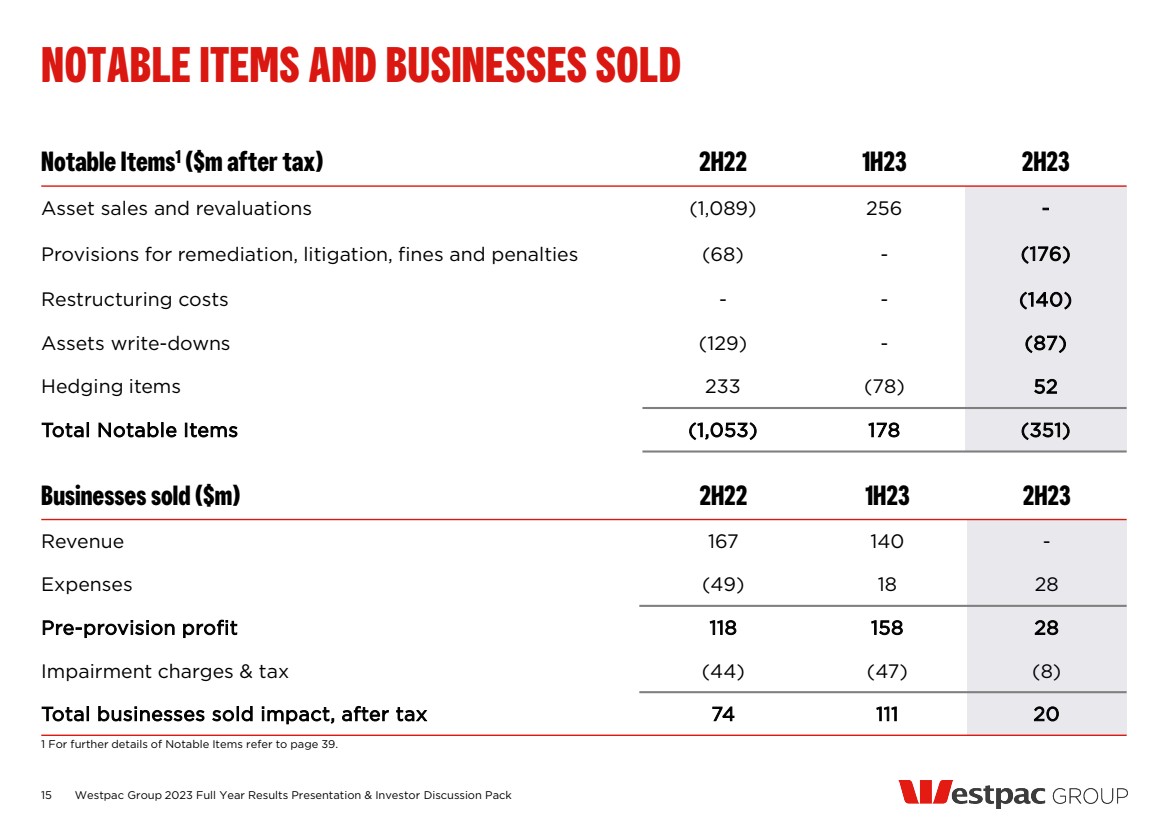
| Notable Items1 ($m after tax) 2H22 1H23 2H23 Asset sales and revaluations (1,089) 256 - Provisions for remediation, litigation, fines and penalties (68) - (176) Restructuring costs - - (140) Assets write-downs (129) - (87) Hedging items 233 (78) 52 Total Notable Items (1,053) 178 (351) 15 NOTABLE ITEMS AND BUSINESSES SOLD 1 For further details of Notable Items refer to page 39. Businesses sold ($m) 2H22 1H23 2H23 Revenue 167 140 - Expenses (49) 18 28 Pre-provision profit 118 158 28 Impairment charges & tax (44) (47) (8) Total businesses sold impact, after tax 74 111 20 Westpac Group 2023 Full Year Results Presentation & Investor Discussion Pack |
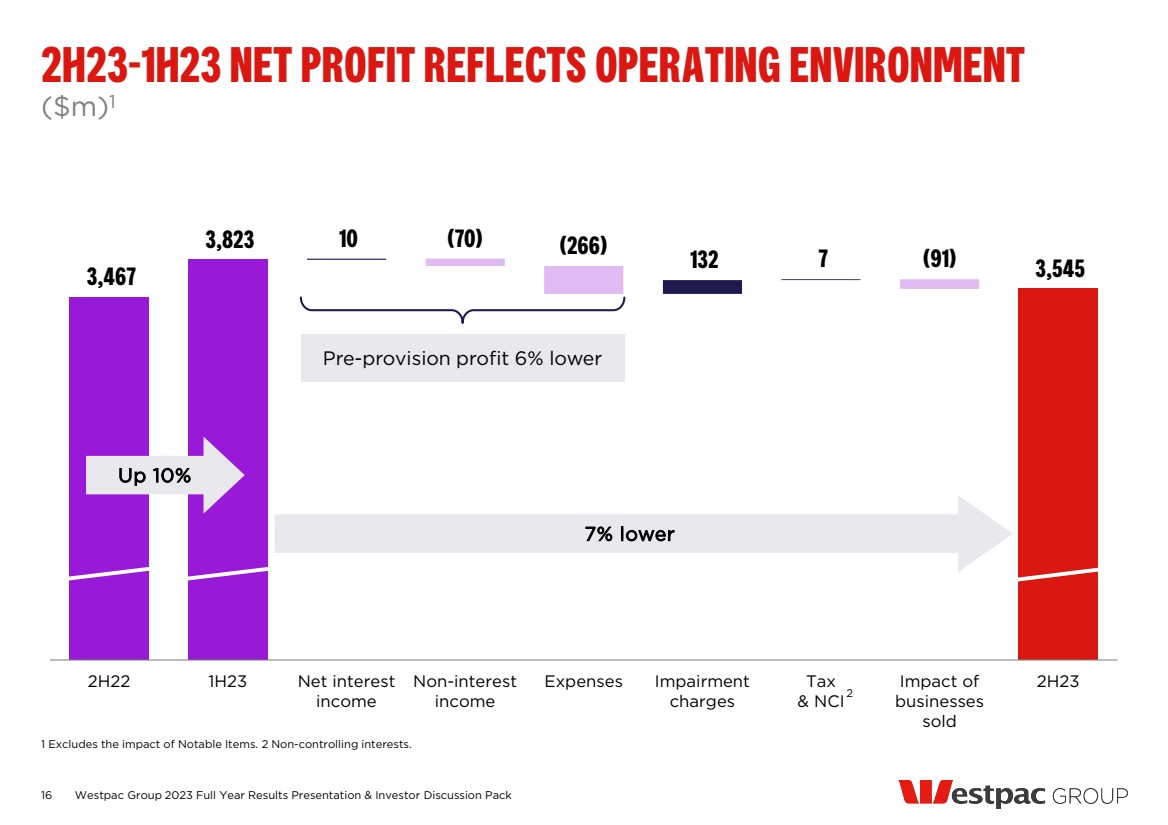
| 3,467 3,823 10 132 7 3,545 (70) (266) (91) 2H22 1H23 Net interest income Non-interest income Expenses Impairment charges Tax & NCI Impact of businesses sold 2H23 ($m)1 2H23-1H23 NET PROFIT REFLECTS OPERATING ENVIRONMENT 1 Excludes the impact of Notable Items. 2 Non-controlling interests. 2 Pre-provision profit 6% lower 7% lower Up 10% 16 Westpac Group 2023 Full Year Results Presentation & Investor Discussion Pack |
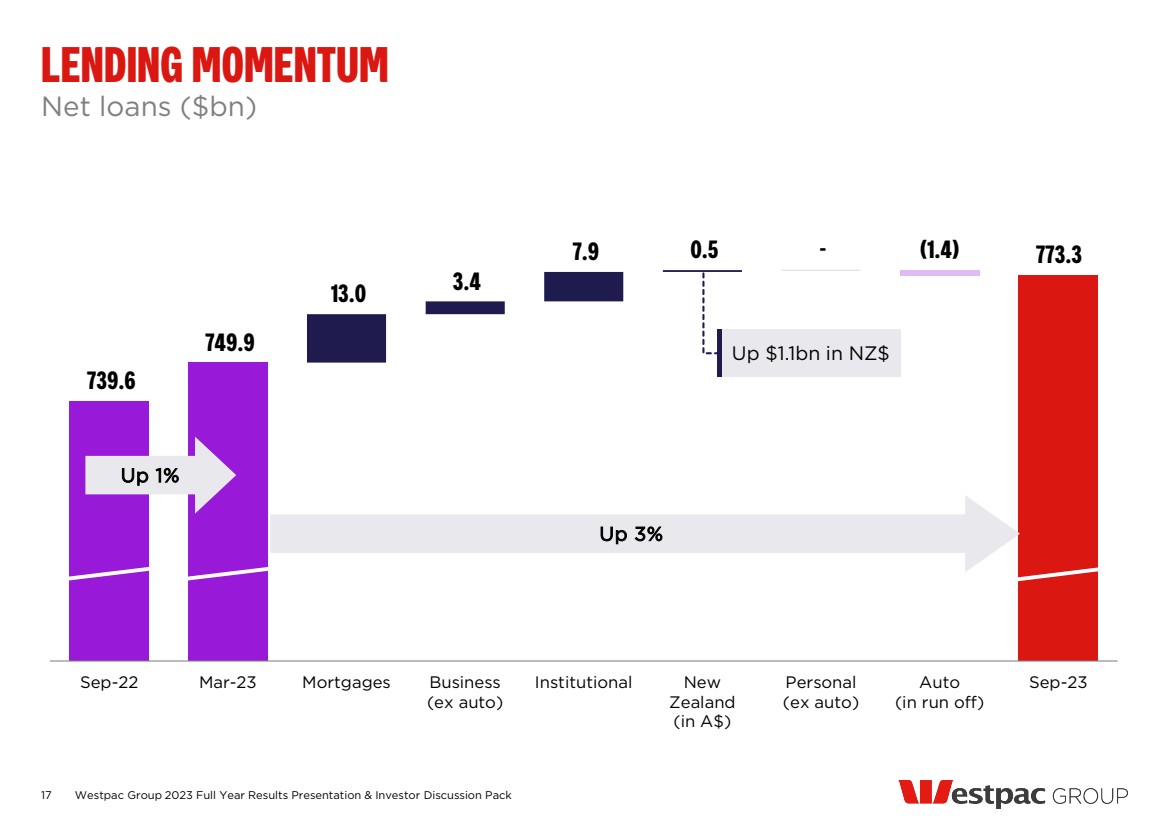
| 739.6 749.9 13.0 3.4 7.9 0.5 - 773.3 (1.4) Sep-22 Mar-23 Mortgages Business (ex auto) Institutional New Zealand (in A$) Personal (ex auto) Auto (in run off) Sep-23 Net loans ($bn) LENDING MOMENTUM Up $1.1bn in NZ$ Up 3% Up 1% 17 Westpac Group 2023 Full Year Results Presentation & Investor Discussion Pack |
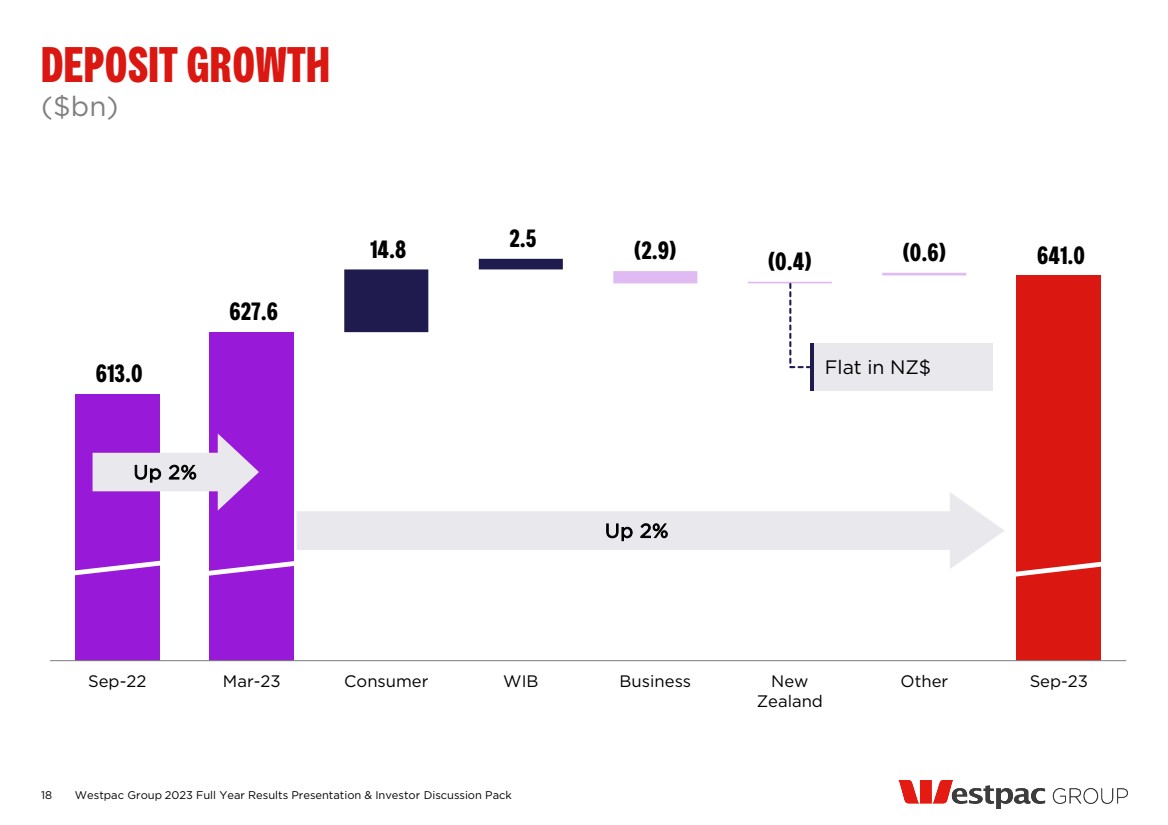
| 613.0 627.6 14.8 2.5 641.0 (2.9) (0.4) (0.6) Sep-22 Mar-23 Consumer WIB Business New Zealand Other Sep-23 ($bn) DEPOSIT GROWTH Up 2% Up 2% Flat in NZ$ 18 Westpac Group 2023 Full Year Results Presentation & Investor Discussion Pack |
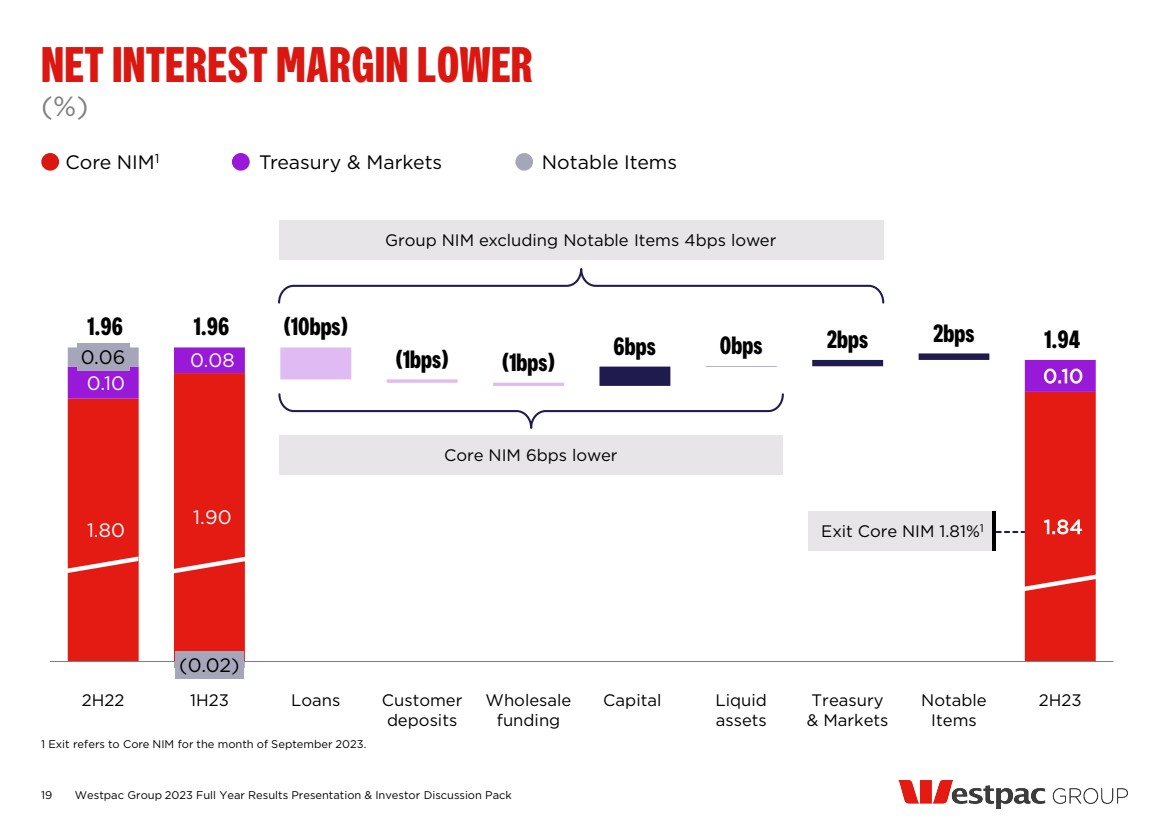
| 1.80 1.90 1.84 0.10 0.08 0.10 0.06 (0.02) 1.96 1.96 6bps 0bps 2bps 2bps 1.94 (10bps) (1bps) (1bps) 2H22 1H23 Loans Customer deposits Wholesale funding Capital Liquid assets Treasury & Markets Notable Items 2H23 (%) NET INTEREST MARGIN LOWER 1 Exit refers to Core NIM for the month of September 2023. Core NIM1 Treasury & Markets Notable Items Core NIM 6bps lower 19 Westpac Group 2023 Full Year Results Presentation & Investor Discussion Pack Exit Core NIM 1.81%1 Group NIM excluding Notable Items 4bps lower |
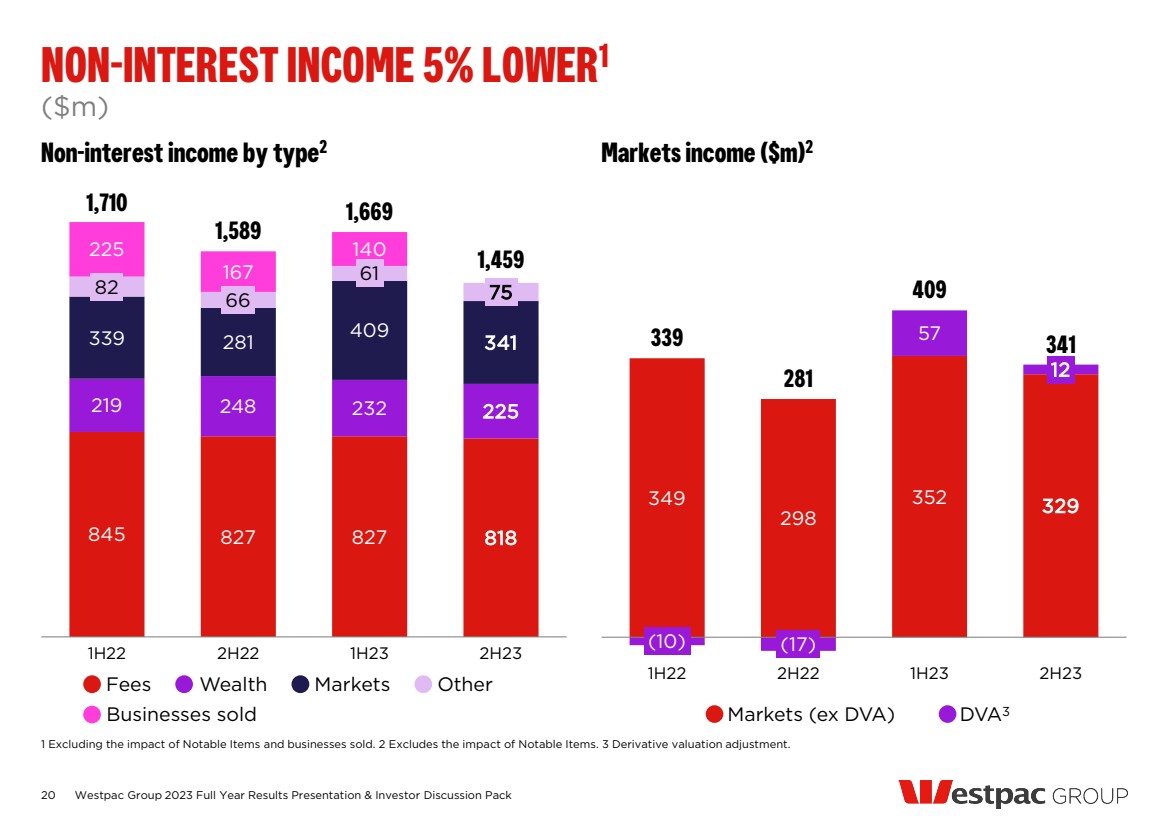
| NON-INTEREST INCOME 5% LOWER1 20 Non-interest income by type2 845 827 827 818 219 248 232 225 339 281 409 341 82 66 61 75 225 167 140 1,710 1,589 1,669 1,459 1H22 2H22 1H23 2H23 Markets income ($m)2 349 298 352 329 (10) (17) 57 12 339 281 409 341 1H22 2H22 1H23 2H23 ($m) 1 Excluding the impact of Notable Items and businesses sold. 2 Excludes the impact of Notable Items. 3 Derivative valuation adjustment. Westpac Group 2023 Full Year Results Presentation & Investor Discussion Pack Markets (ex DVA) DVA3 Fees Wealth Markets Other Businesses sold |
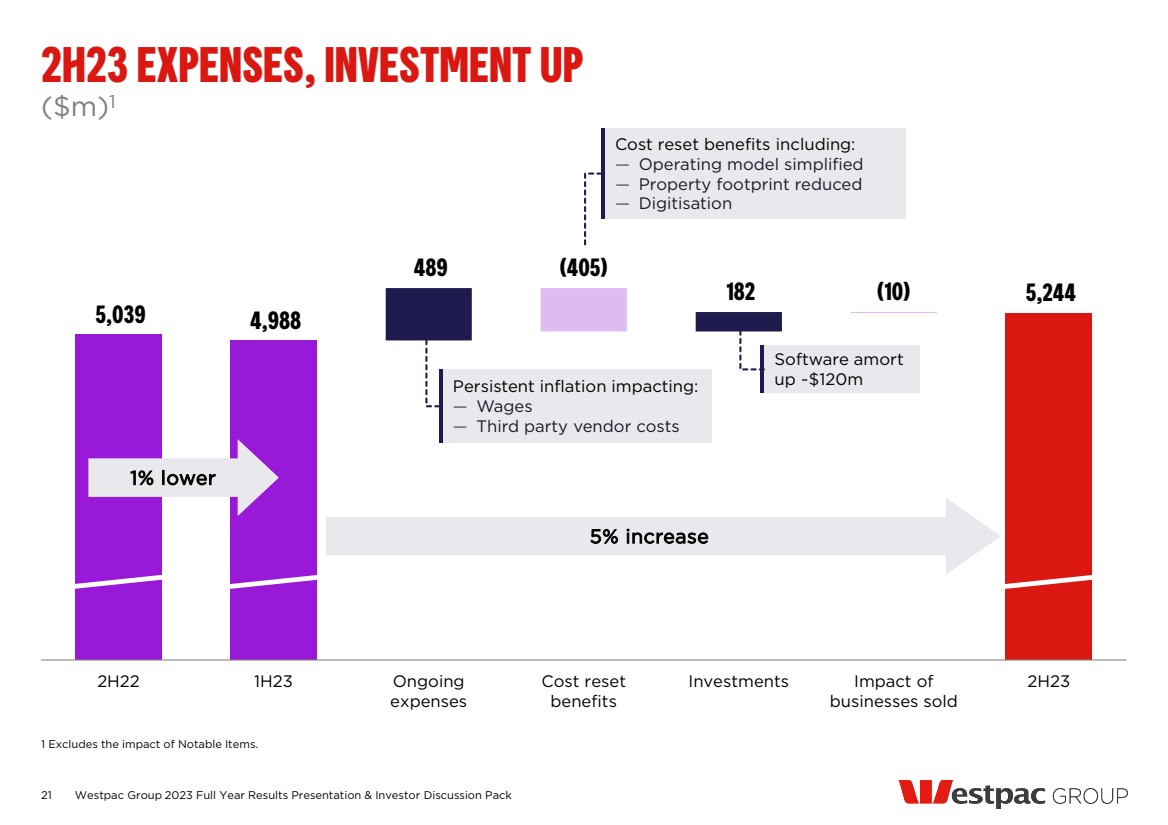
| 5,039 4,988 489 182 5,244 (405) (10) 2H22 1H23 Ongoing expenses Cost reset benefits Investments Impact of businesses sold 2H23 ($m)1 2H23 EXPENSES, INVESTMENT UP 1 Excludes the impact of Notable Items. 5% increase 1% lower Software amort up ~$120m Persistent inflation impacting: — Wages — Third party vendor costs Cost reset benefits including: — Operating model simplified — Property footprint reduced — Digitisation 21 Westpac Group 2023 Full Year Results Presentation & Investor Discussion Pack |
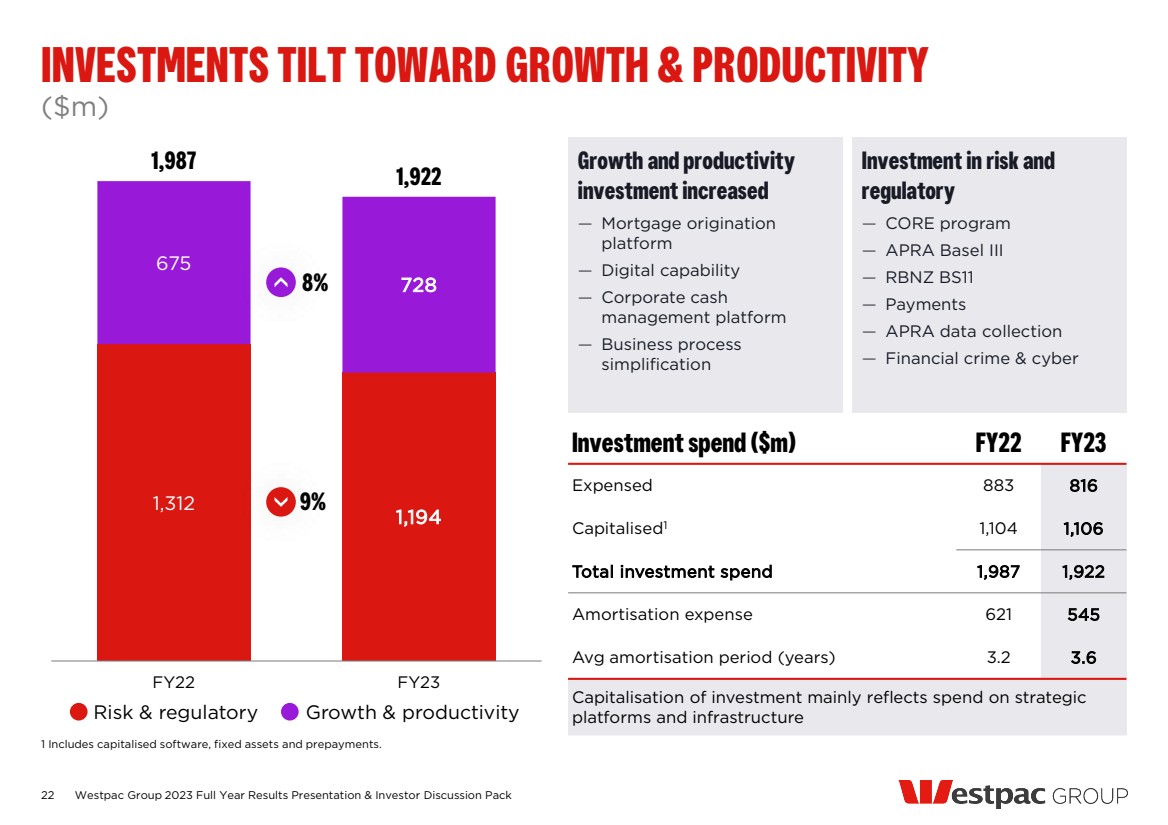
| Growth and productivity investment increased — Mortgage origination platform — Digital capability — Corporate cash management platform — Business process simplification Investment in risk and regulatory — CORE program — APRA Basel III — RBNZ BS11 — Payments — APRA data collection — Financial crime & cyber 1,312 1,194 675 728 1,987 1,922 FY22 FY23 ($m) INVESTMENTS TILT TOWARD GROWTH & PRODUCTIVITY 1 Includes capitalised software, fixed assets and prepayments. 8% 9% Investment spend ($m) FY22 FY23 Expensed 883 816 Capitalised1 1,104 1,106 Total investment spend 1,987 1,922 Amortisation expense 621 545 Avg amortisation period (years) 3.2 3.6 Capitalisation of investment mainly reflects spend on strategic platforms and infrastructure 22 Westpac Group 2023 Full Year Results Presentation & Investor Discussion Pack Risk & regulatory Growth & productivity |
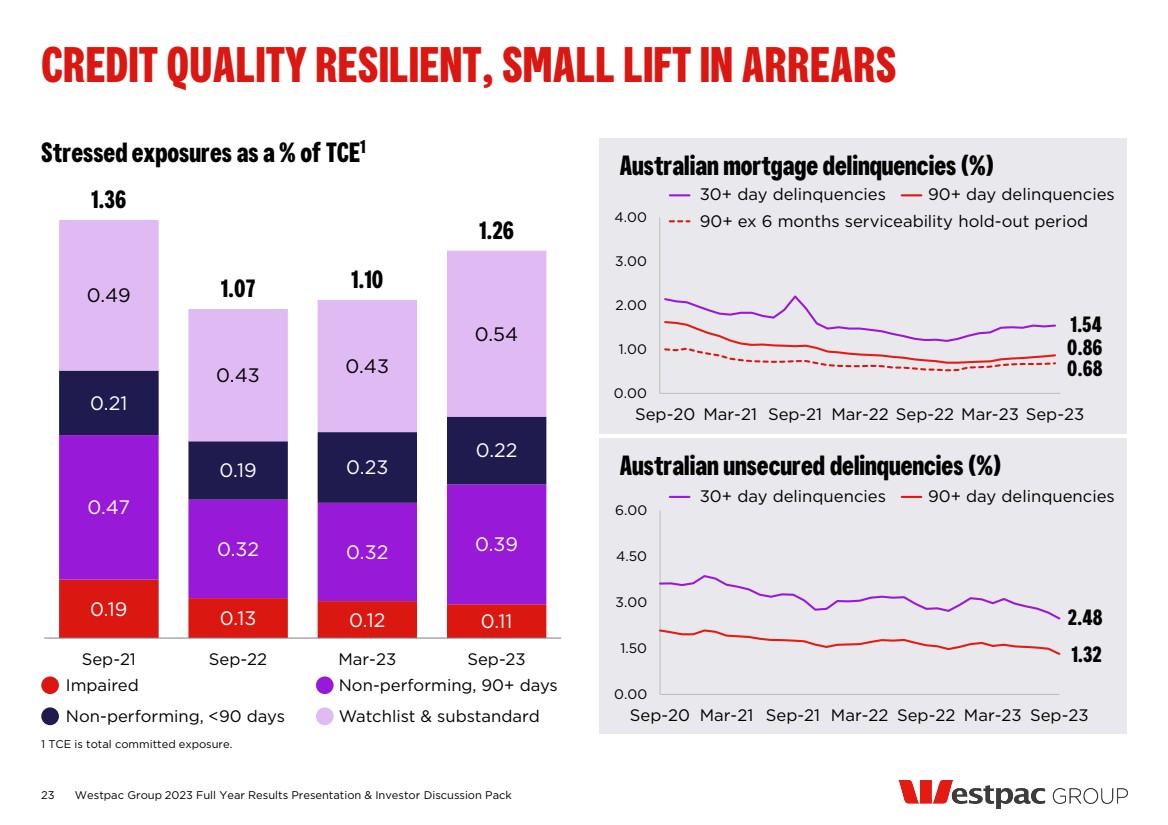
| 23 0.19 0.13 0.12 0.11 0.47 0.32 0.32 0.39 0.21 0.19 0.23 0.22 0.49 0.43 0.43 0.54 1.36 1.07 1.10 1.26 Sep-21 Sep-22 Mar-23 Sep-23 Stressed exposures as a % of TCE1 Westpac Group 2023 Full Year Results Presentation & Investor Discussion Pack CREDIT QUALITY RESILIENT, SMALL LIFT IN ARREARS 1 TCE is total committed exposure. Australian mortgage delinquencies (%) Australian unsecured delinquencies (%) 1.54 0.86 0.68 0.00 1.00 2.00 3.00 4.00 Sep-20 Mar-21 Sep-21 Mar-22 Sep-22 Mar-23 Sep-23 2.48 1.32 0.00 1.50 3.00 4.50 6.00 Sep-20 Mar-21 Sep-21 Mar-22 Sep-22 Mar-23 Sep-23 Impaired Non-performing, 90+ days Non-performing, <90 days Watchlist & substandard 30+ day delinquencies 90+ day delinquencies 90+ ex 6 months serviceability hold-out period 30+ day delinquencies 90+ day delinquencies |
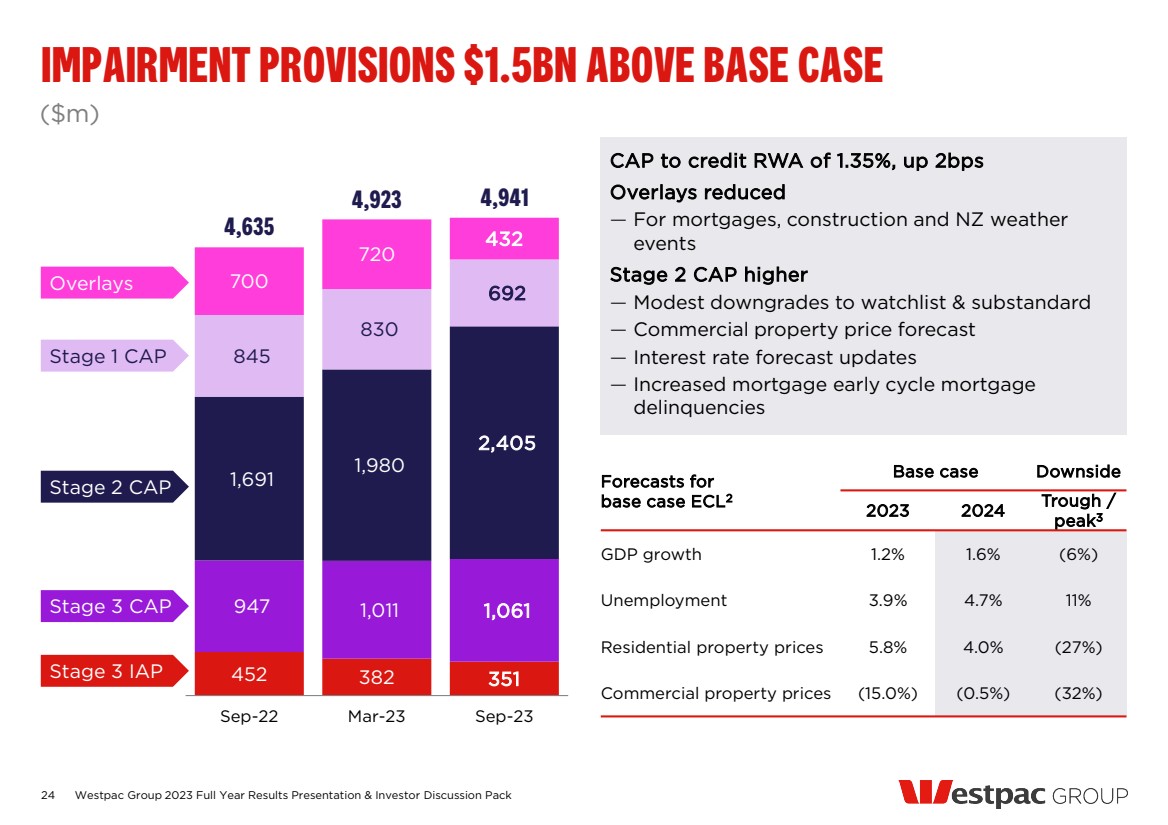
| IMPAIRMENT PROVISIONS $1.5BN ABOVE BASE CASE 24 452 382 351 947 1,011 1,061 1,691 1,980 2,405 845 830 692 700 720 432 4,635 4,923 4,941 Sep-22 Mar-23 Sep-23 ($m) Overlays Stage 3 IAP Stage 3 CAP Stage 1 CAP Stage 2 CAP CAP to credit RWA of 1.35%, up 2bps Overlays reduced — For mortgages, construction and NZ weather events Stage 2 CAP higher — Modest downgrades to watchlist & substandard — Commercial property price forecast — Interest rate forecast updates — Increased mortgage early cycle mortgage delinquencies Westpac Group 2023 Full Year Results Presentation & Investor Discussion Pack Forecasts for base case ECL2 Base case Downside 2023 2024 Trough / peak3 GDP growth 1.2% 1.6% (6%) Unemployment 3.9% 4.7% 11% Residential property prices 5.8% 4.0% (27%) Commercial property prices (15.0%) (0.5%) (32%) |
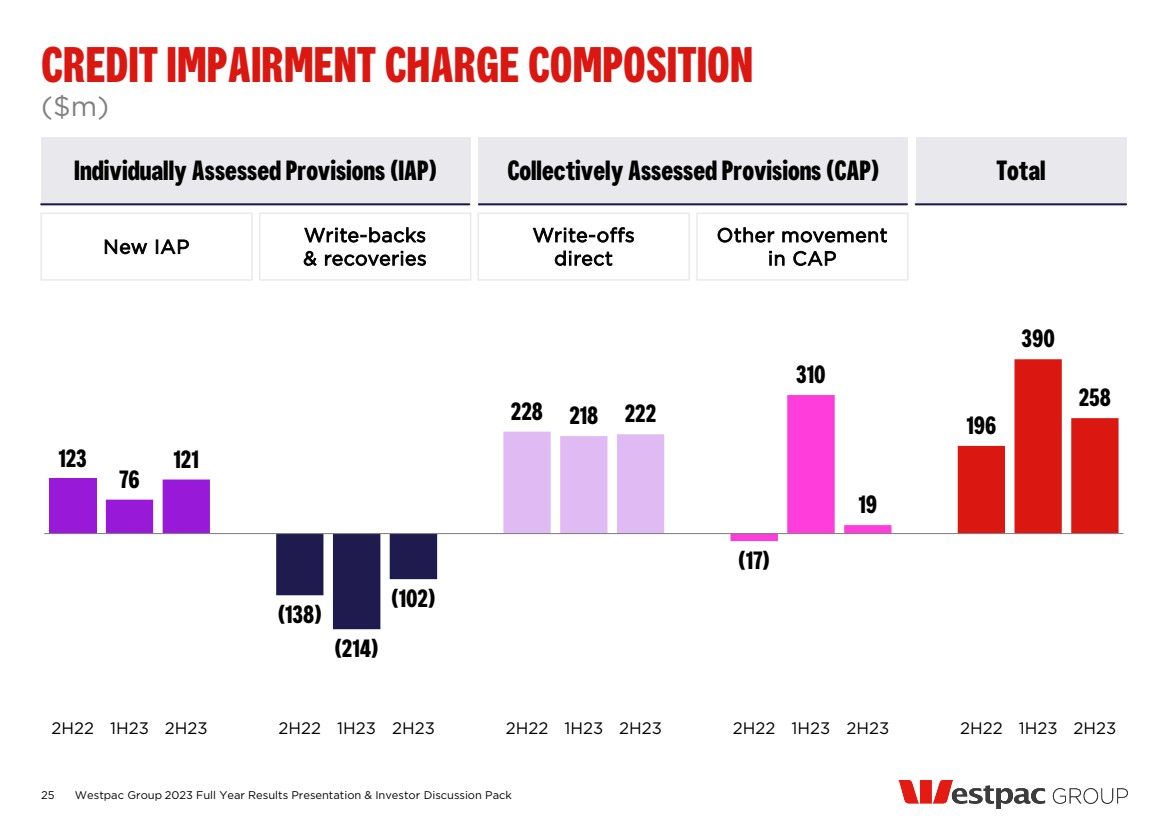
| 25 ($m) Westpac Group 2023 Full Year Results Presentation & Investor Discussion Pack CREDIT IMPAIRMENT CHARGE COMPOSITION 123 76 121 (138) (214) (102) 228 218 222 (17) 310 19 196 390 258 2H22 1H23 2H23 2H22 1H23 2H23 2H22 1H23 2H23 2H22 1H23 2H23 2H22 1H23 2H23 Individually Assessed Provisions (IAP) Collectively Assessed Provisions (CAP) Total New IAP Write-backs & recoveries Write-offs direct Other movement in CAP |
| 11.29 12.28 71bps 5bps 12.38 12.05 (54bps) (12bps) (33bps) Sep-22 Mar-23 Net profit Dividend RWA Other Sep-23 On-market share buyback Sep-23 Pro forma CET1 Capital ratio (%) CAPITAL ABOVE TOP END OF TARGET OPERATING RANGE 1 Capital deduction and other movements including FX translation impacts. 1 26 Westpac Group 2023 Full Year Results Presentation & Investor Discussion Pack Credit RWA – Data refinement, 15bps Credit RWA – Credit quality & lending growth, (12bps) Non-credit RWA, 2bps |

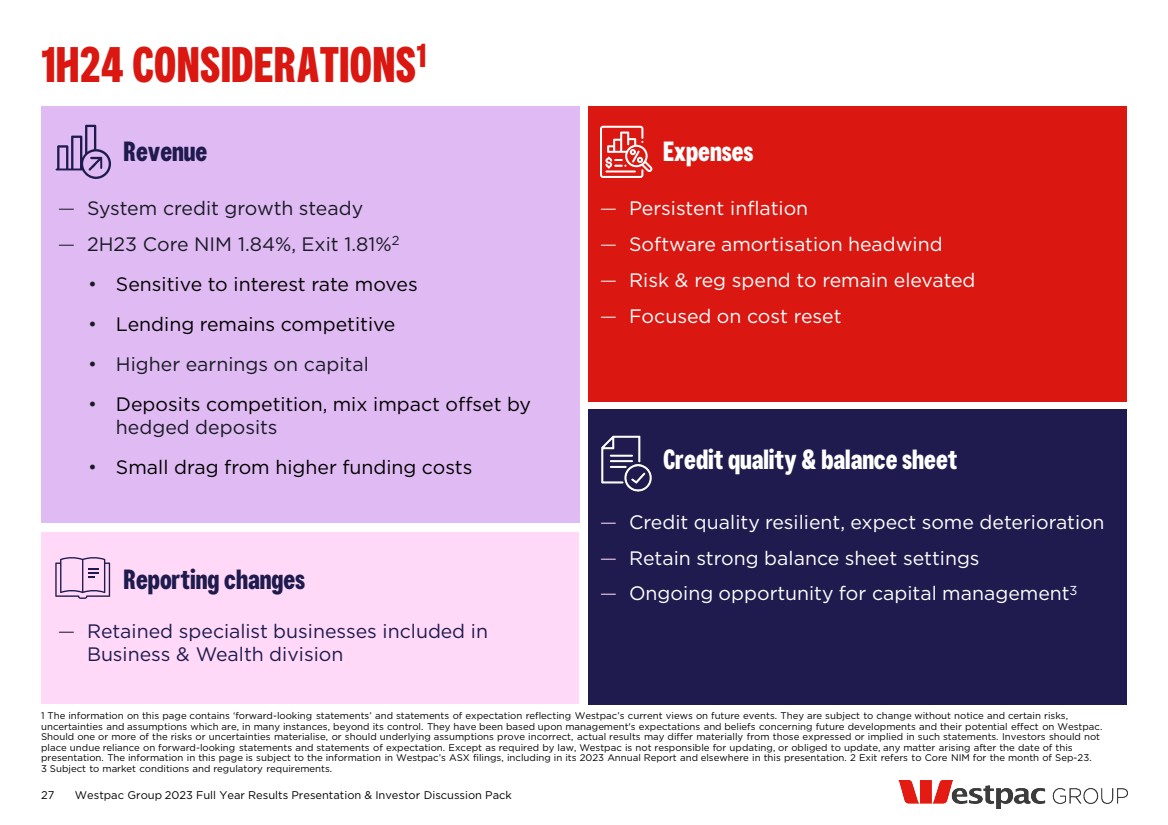
| 27 Westpac Group 2023 Full Year Results Presentation & Investor Discussion Pack 1 The information on this page contains ‘forward-looking statements’ and statements of expectation reflecting Westpac’s current views on future events. They are subject to change without notice and certain risks, uncertainties and assumptions which are, in many instances, beyond its control. They have been based upon management's expectations and beliefs concerning future developments and their potential effect on Westpac. Should one or more of the risks or uncertainties materialise, or should underlying assumptions prove incorrect, actual results may differ materially from those expressed or implied in such statements. Investors should not place undue reliance on forward-looking statements and statements of expectation. Except as required by law, Westpac is not responsible for updating, or obliged to update, any matter arising after the date of this presentation. The information in this page is subject to the information in Westpac’s ASX filings, including in its 2023 Annual Report and elsewhere in this presentation. 2 Exit refers to Core NIM for the month of Sep-23. 3 Subject to market conditions and regulatory requirements. 1H24 CONSIDERATIONS1 Revenue — System credit growth steady — 2H23 Core NIM 1.84%, Exit 1.81%2 • Sensitive to interest rate moves • Lending remains competitive • Higher earnings on capital • Deposits competition, mix impact offset by hedged deposits • Small drag from higher funding costs — Retained specialist businesses included in Business & Wealth division Reporting changes Credit quality & balance sheet — Credit quality resilient, expect some deterioration — Retain strong balance sheet settings — Ongoing opportunity for capital management3 Expenses — Persistent inflation — Software amortisation headwind — Risk & reg spend to remain elevated — Focused on cost reset |
| PETER KING Chief Executive Officer |

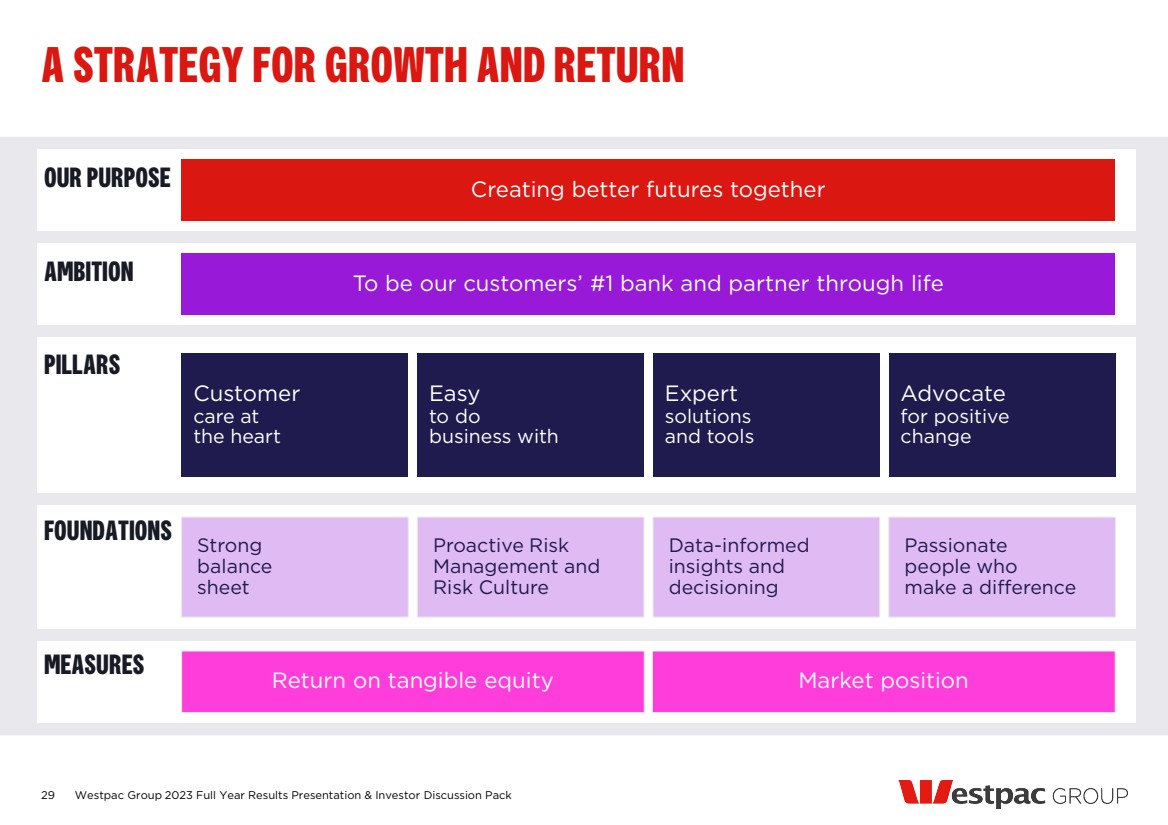
| 29 Westpac Group 2023 Full Year Results Presentation & Investor Discussion Pack A STRATEGY FOR GROWTH AND RETURN PILLARS Customer care at the heart Easy to do business with Expert solutions and tools Advocate for positive change FOUNDATIONS Strong balance sheet Proactive Risk Management and Risk Culture Data-informed insights and decisioning Passionate people who make a difference MEASURES Return on tangible equity Market position To be our customers’ #1 bank and partner through life AMBITION Creating better futures together OUR PURPOSE |
| 1 Refers to Australian banking system simplification. This page contains ‘forward looking statements’ and statements of expectation. Please refer to the disclaimer on page 134. ACCELERATING TECHNOLOGY SIMPLIFICATION1 EXPERIENCE PRODUCTS & SERVICES PLATFORMS ENTERPRISE TECHNOLOGY FOUNDATIONS Developer platforms Networks Private & Public cloud Desktop platforms Workflow systems Collections systems Data platforms Customer onboarding systems Customer masters Payment captures Product originations Product processors Staff platforms to assist customers Online customer platforms From >180 30 Westpac Group 2023 Full Year Results Presentation & Investor Discussion Pack >10 >60 >60 >20 >20 <5 <30 <20 <10 <10 To <60 |

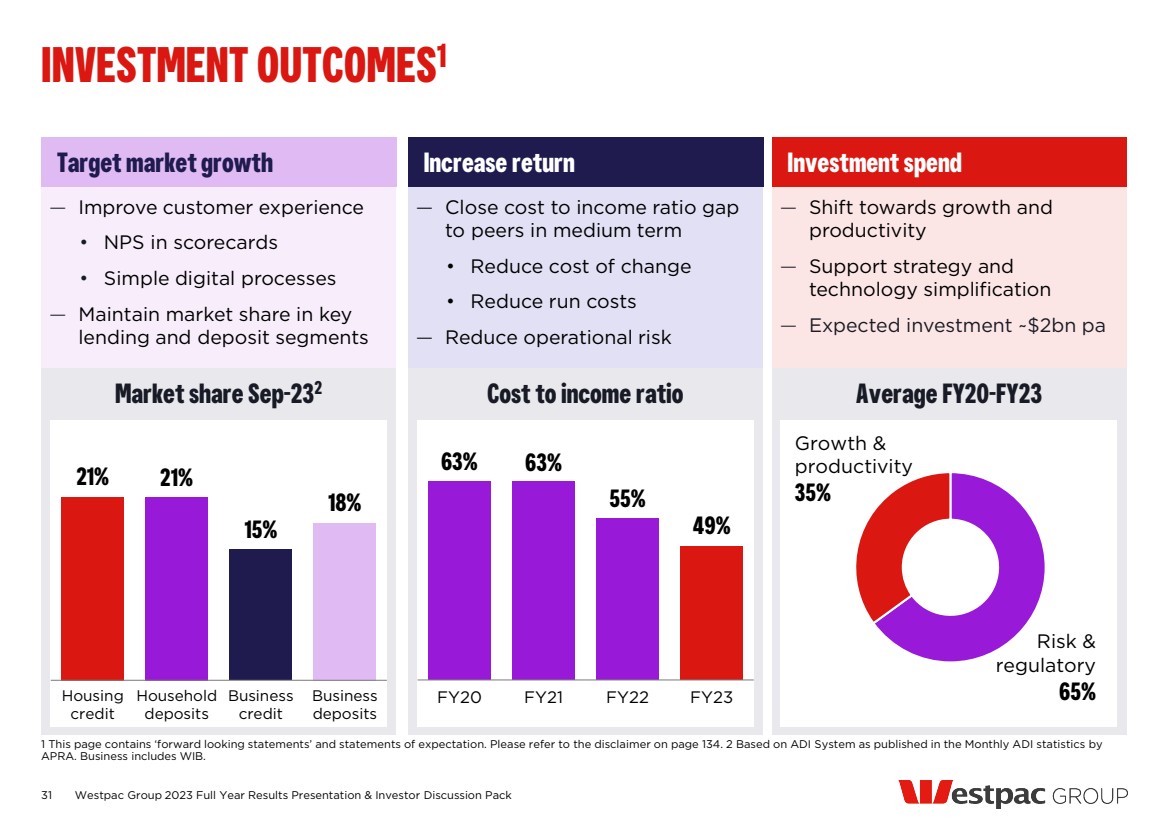
| — Improve customer experience • NPS in scorecards • Simple digital processes — Maintain market share in key lending and deposit segments — Close cost to income ratio gap to peers in medium term • Reduce cost of change • Reduce run costs — Reduce operational risk — Shift towards growth and productivity — Support strategy and technology simplification — Expected investment ~$2bn pa Market share Sep-232 31 1 This page contains ‘forward looking statements’ and statements of expectation. Please refer to the disclaimer on page 134. 2 Based on ADI System as published in the Monthly ADI statistics by APRA. Business includes WIB. INVESTMENT OUTCOMES1 Westpac Group 2023 Full Year Results Presentation & Investor Discussion Pack Cost to income ratio Average FY20-FY23 Target market growth Increase return Investment spend Growth & productivity 35% Risk & regulatory 65% 63% 63% 55% 49% FY20 FY21 FY22 FY23 21% 21% 15% 18% Housing credit Household deposits Business credit Business deposits |
| 32 Westpac Group 2023 Full Year Results Presentation & Investor Discussion Pack FY23 HIGHLIGHTS IMPROVED FINANCIAL RESULT BALANCE SHEET MOMENTUM ACCELERATING TECHNOLOGY SIMPLIFICATION STRENGTHENED CUSTOMER FRANCHISE COMPLETED PORTFOLIO SIMPLIFICATION |
| INVESTOR DISCUSSION PACK |
| OVERVIEW |

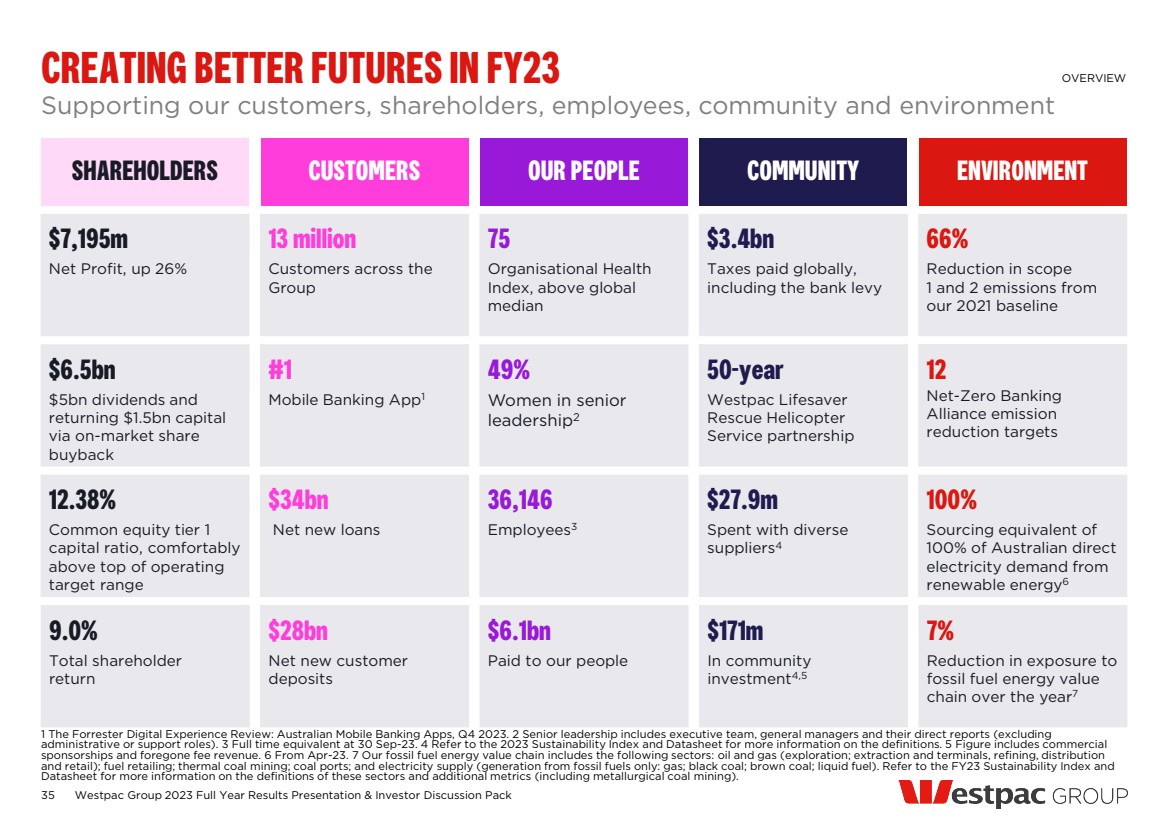
| 35 Supporting our customers, shareholders, employees, community and environment OVERVIEW 1 The Forrester Digital Experience Review: Australian Mobile Banking Apps, Q4 2023. 2 Senior leadership includes executive team, general managers and their direct reports (excluding administrative or support roles). 3 Full time equivalent at 30 Sep-23. 4 Refer to the 2023 Sustainability Index and Datasheet for more information on the definitions. 5 Figure includes commercial sponsorships and foregone fee revenue. 6 From Apr-23. 7 Our fossil fuel energy value chain includes the following sectors: oil and gas (exploration; extraction and terminals, refining, distribution and retail); fuel retailing; thermal coal mining; coal ports; and electricity supply (generation from fossil fuels only: gas; black coal; brown coal; liquid fuel). Refer to the FY23 Sustainability Index and Datasheet for more information on the definitions of these sectors and additional metrics (including metallurgical coal mining). CREATING BETTER FUTURES IN FY23 SHAREHOLDERS CUSTOMERS OUR PEOPLE COMMUNITY ENVIRONMENT $7,195m Net Profit, up 26% 13 million Customers across the Group 75 Organisational Health Index, above global median $3.4bn Taxes paid globally, including the bank levy 66% Reduction in scope 1 and 2 emissions from our 2021 baseline $6.5bn $5bn dividends and returning $1.5bn capital via on-market share buyback #1 Mobile Banking App1 49% Women in senior leadership2 50-year Westpac Lifesaver Rescue Helicopter Service partnership 12 Net-Zero Banking Alliance emission reduction targets 12.38% Common equity tier 1 capital ratio, comfortably above top of operating target range $34bn Net new loans 36,146 Employees3 $27.9m Spent with diverse suppliers4 100% Sourcing equivalent of 100% of Australian direct electricity demand from renewable energy6 9.0% Total shareholder return $28bn Net new customer deposits $6.1bn Paid to our people $171m In community investment4,5 7% Reduction in exposure to fossil fuel energy value chain over the year7 Westpac Group 2023 Full Year Results Presentation & Investor Discussion Pack |
| EARNINGS DRIVERS 2023 Full year financial results |
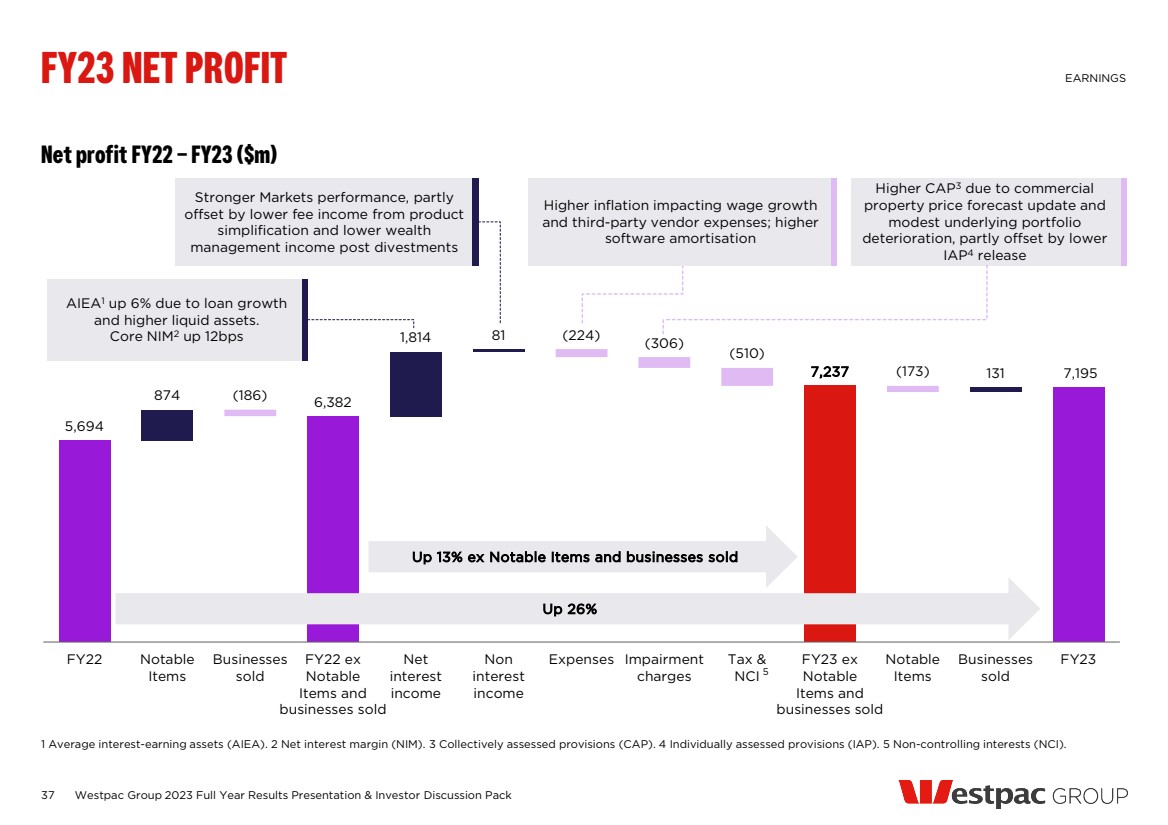
| 5,694 874 6,382 1,814 81 7,237 131 (186) (224) (306) (510) (173) 7,195 FY22 Notable Items Businesses sold FY22 ex Notable Items and businesses sold Net interest income Non interest income Expenses Impairment charges Tax & NCI FY23 ex Notable Items and businesses sold Notable Items Businesses sold FY23 37 Westpac Group 2023 Full Year Results Presentation & Investor Discussion Pack FY23 NET PROFIT EARNINGS 1 Average interest-earning assets (AIEA). 2 Net interest margin (NIM). 3 Collectively assessed provisions (CAP). 4 Individually assessed provisions (IAP). 5 Non-controlling interests (NCI). Up 26% Up 13% ex Notable Items and businesses sold 5 Net profit FY22 – FY23 ($m) AIEA1 up 6% due to loan growth and higher liquid assets. Core NIM2 up 12bps Stronger Markets performance, partly offset by lower fee income from product simplification and lower wealth management income post divestments Higher inflation impacting wage growth and third-party vendor expenses; higher software amortisation Higher CAP3 due to commercial property price forecast update and modest underlying portfolio deterioration, partly offset by lower IAP4 release |
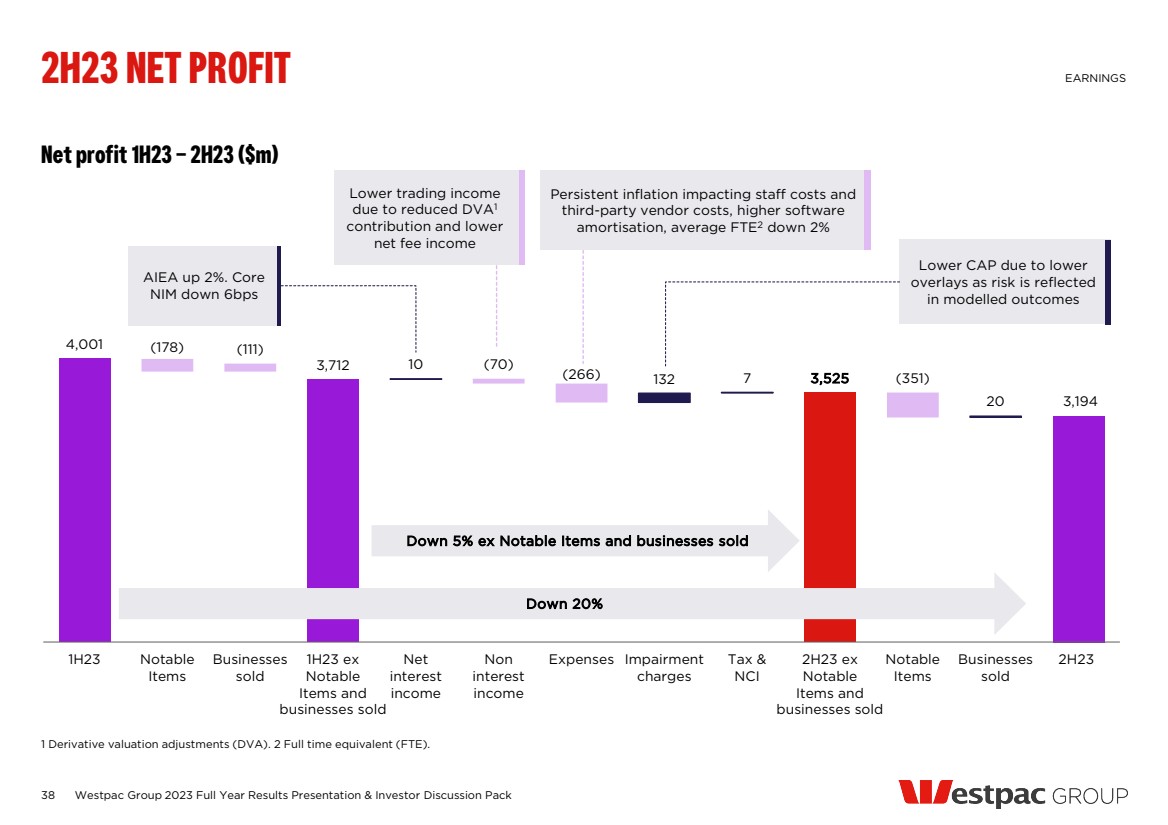
| 38 Westpac Group 2023 Full Year Results Presentation & Investor Discussion Pack Net profit 1H23 – 2H23 ($m) 2H23 NET PROFIT EARNINGS 1 Derivative valuation adjustments (DVA). 2 Full time equivalent (FTE). 4,001 3,712 10 132 7 3,525 20 (178) (111) (70) (266) (351) 3,194 1H23 Notable Items Businesses sold 1H23 ex Notable Items and businesses sold Net interest income Non interest income Expenses Impairment charges Tax & NCI 2H23 ex Notable Items and businesses sold Notable Items Businesses sold 2H23 Down 20% Down 5% ex Notable Items and businesses sold Lower trading income due to reduced DVA1 contribution and lower net fee income AIEA up 2%. Core NIM down 6bps Persistent inflation impacting staff costs and third-party vendor costs, higher software amortisation, average FTE2 down 2% Lower CAP due to lower overlays as risk is reflected in modelled outcomes |
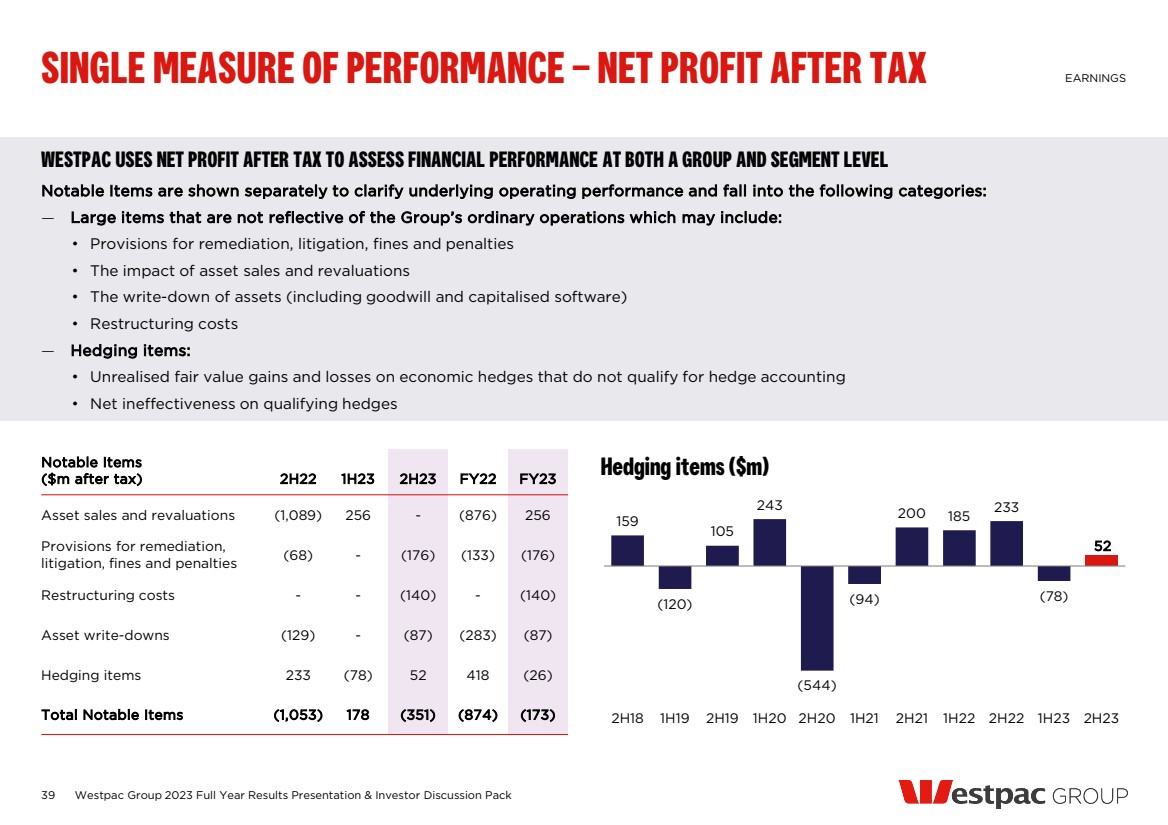
| 39 WESTPAC USES NET PROFIT AFTER TAX TO ASSESS FINANCIAL PERFORMANCE AT BOTH A GROUP AND SEGMENT LEVEL Notable Items are shown separately to clarify underlying operating performance and fall into the following categories: — Large items that are not reflective of the Group’s ordinary operations which may include: • Provisions for remediation, litigation, fines and penalties • The impact of asset sales and revaluations • The write-down of assets (including goodwill and capitalised software) • Restructuring costs — Hedging items: • Unrealised fair value gains and losses on economic hedges that do not qualify for hedge accounting • Net ineffectiveness on qualifying hedges Notable Items ($m after tax) 2H22 1H23 2H23 FY22 FY23 Asset sales and revaluations (1,089) 256 - (876) 256 Provisions for remediation, litigation, fines and penalties (68) - (176) (133) (176) Restructuring costs - - (140) - (140) Asset write-downs (129) - (87) (283) (87) Hedging items 233 (78) 52 418 (26) Total Notable Items (1,053) 178 (351) (874) (173) Hedging items ($m) Westpac Group 2023 Full Year Results Presentation & Investor Discussion Pack SINGLE MEASURE OF PERFORMANCE – NET PROFIT AFTER TAX EARNINGS 159 (120) 105 243 (544) (94) 200 185 233 (78) 52 2H18 1H19 2H19 1H20 2H20 1H21 2H21 1H22 2H22 1H23 2H23 |
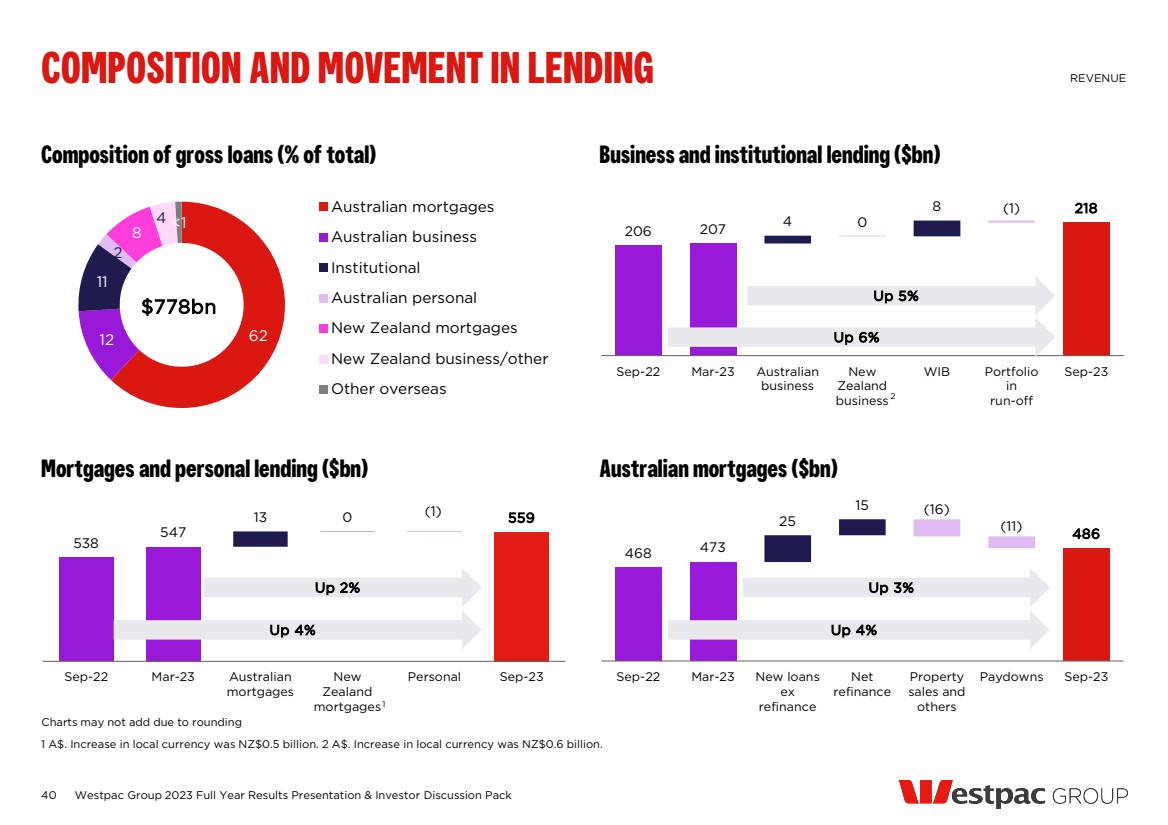
| 40 Composition of gross loans (% of total) 62 12 11 2 8 4 <1 Australian mortgages Australian business Institutional Australian personal New Zealand mortgages New Zealand business/other Other overseas Business and institutional lending ($bn) Mortgages and personal lending ($bn) Australian mortgages ($bn) Westpac Group 2023 Full Year Results Presentation & Investor Discussion Pack COMPOSITION AND MOVEMENT IN LENDING REVENUE 1 A$. Increase in local currency was NZ$0.5 billion. 2 A$. Increase in local currency was NZ$0.6 billion. $778bn 206 207 4 0 8 (1) 218 Sep-22 Mar-23 Australian business New Zealand business WIB Portfolio in run-off Sep-23 538 547 13 0 559 (1) Sep-22 Mar-23 Australian mortgages New Zealand mortgages Personal Sep-23 468 473 25 15 486 (16) (11) Sep-22 Mar-23 New loans ex refinance Net refinance Property sales and others Paydowns Sep-23 Up 6% Up 5% 2 Charts may not add due to rounding Up 4% Up 3% Up 4% Up 2% 1 |
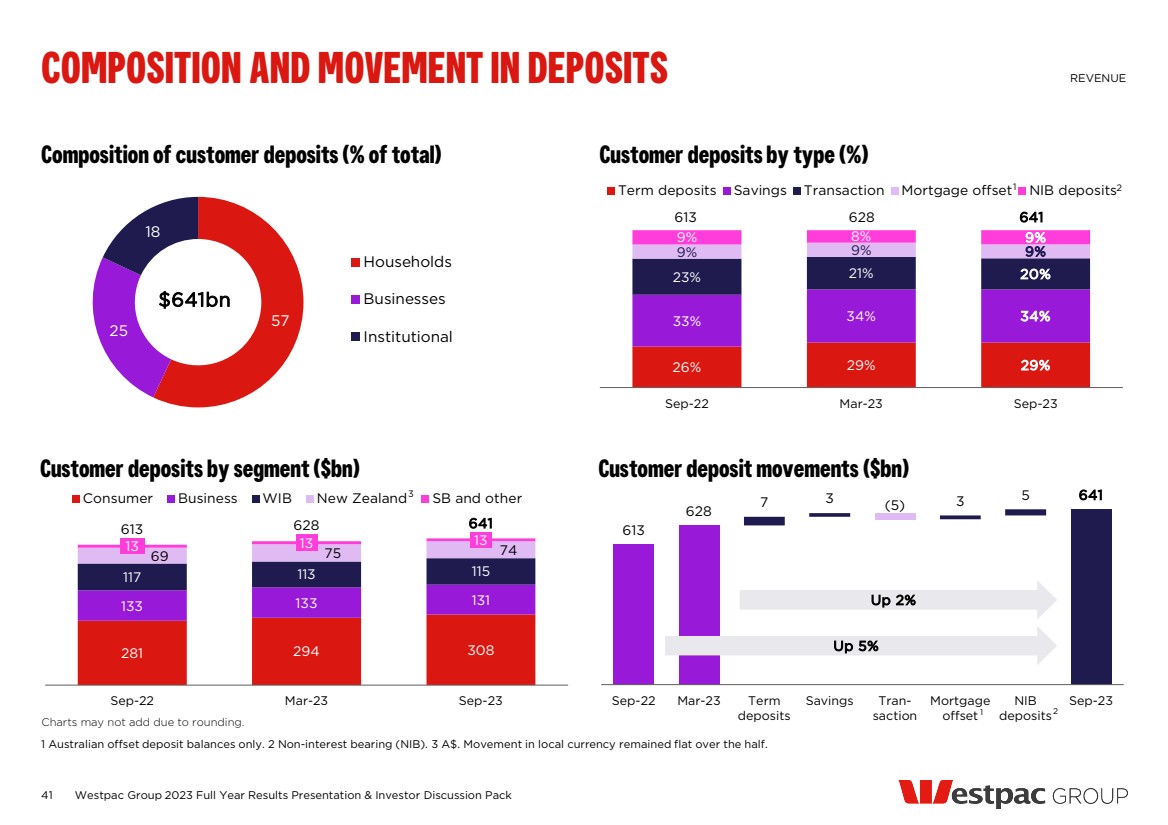
| 613 628 7 3 3 5 641 (5) Sep-22 Mar-23 Term deposits Savings Tran-saction Mortgage offset NIB deposits Sep-23 1 281 294 308 133 133 131 117 113 115 13 69 75 74 13 13 613 628 641 Sep-22 Mar-23 Sep-23 Consumer Business WIB New Zealand SB and other 41 Composition of customer deposits (% of total) 57 25 18 Households Businesses Institutional Customer deposits by type (%) 26% 29% 29% 33% 34% 34% 23% 21% 20% 9% 9% 9% 9% 8% 9% Sep-22 Mar-23 Sep-23 Term deposits Savings Transaction Mortgage offset NIB deposits Customer deposits by segment ($bn) Customer deposit movements ($bn) Westpac Group 2023 Full Year Results Presentation & Investor Discussion Pack COMPOSITION AND MOVEMENT IN DEPOSITS REVENUE 1 Australian offset deposit balances only. 2 Non-interest bearing (NIB). 3 A$. Movement in local currency remained flat over the half. $641bn Charts may not add due to rounding. 1 2 3 Up 5% Up 2% 2 613 628 641 |
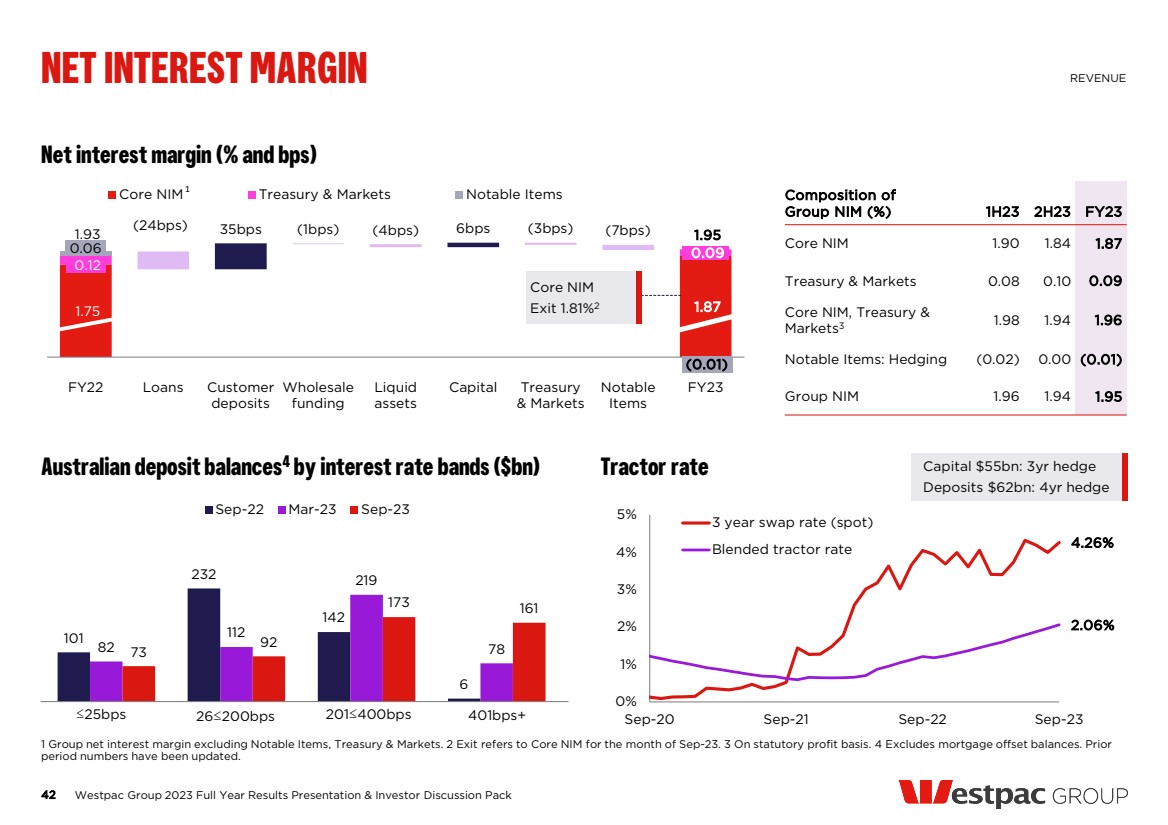
| 1.75 1.87 0.12 0.06 0.09 (0.01) 1.93 35bps 6bps 1.95 (24bps) (1bps) (4bps) (3bps) (7bps) FY22 Loans Customer deposits Wholesale funding Liquid assets Capital Treasury & Markets Notable Items FY23 Core NIM Treasury & Markets Notable Items Composition of Group NIM (%) 1H23 2H23 FY23 Core NIM 1.90 1.84 1.87 Treasury & Markets 0.08 0.10 0.09 Core NIM, Treasury & Markets3 1.98 1.94 1.96 Notable Items: Hedging (0.02) 0.00 (0.01) Group NIM 1.96 1.94 1.95 42 Net interest margin (% and bps) Australian deposit balances4 by interest rate bands ($bn) 101 232 142 6 82 112 219 73 78 92 173 161 Sep-22 Mar-23 Sep-23 Tractor rate Westpac Group 2023 Full Year Results Presentation & Investor Discussion Pack NET INTEREST MARGIN REVENUE 1 Group net interest margin excluding Notable Items, Treasury & Markets. 2 Exit refers to Core NIM for the month of Sep-23. 3 On statutory profit basis. 4 Excludes mortgage offset balances. Prior period numbers have been updated. 42 Capital $55bn: 3yr hedge Deposits $62bn: 4yr hedge 1 4.26% 2.06% 0% 1% 2% 3% 4% 5% Sep-20 Sep-21 Sep-22 Sep-23 3 year swap rate (spot) Blended tractor rate ≤25bps 26≤200bps 201≤400bps 401bps+ Core NIM Exit 1.81%2 |
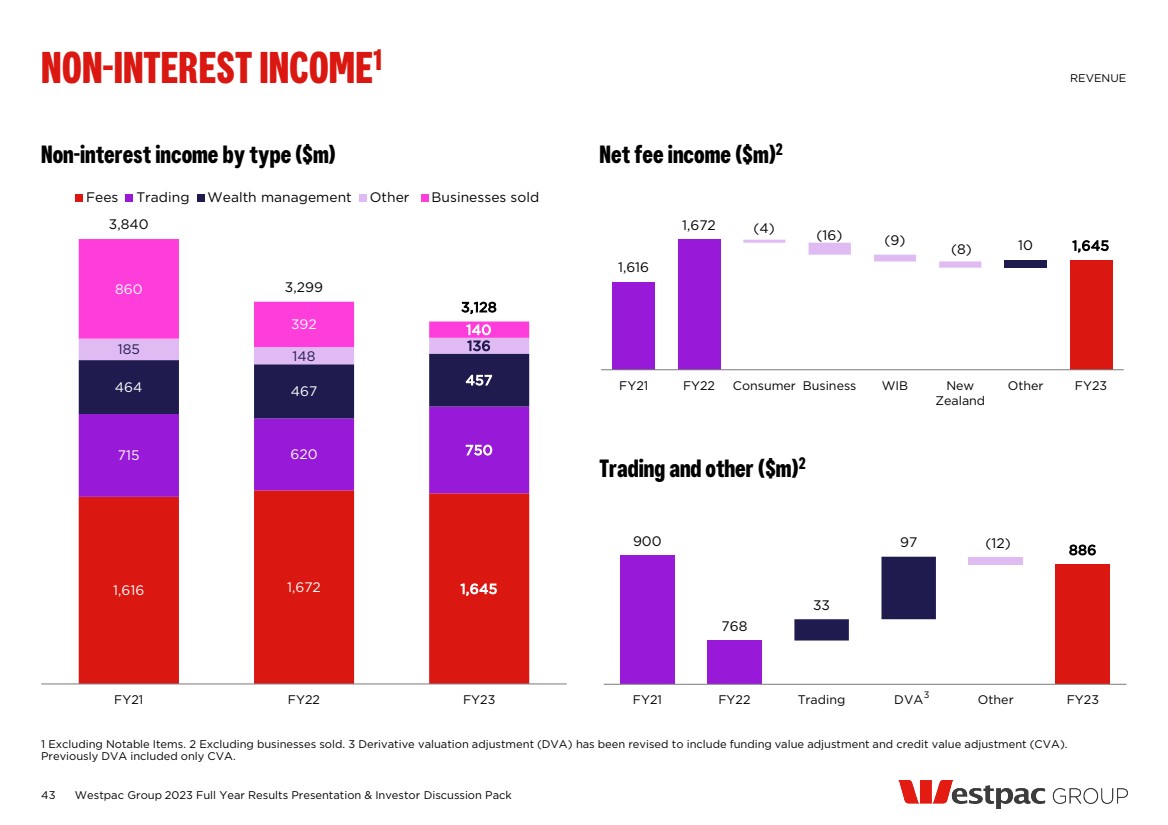
| 43 1,616 1,672 1,645 715 620 750 464 467 457 185 148 136 860 392 140 3,840 3,299 3,128 FY21 FY22 FY23 Fees Trading Wealth management Other Businesses sold Net fee income ($m)2 1,616 1,672 10 1,645 (4) (16) (9) (8) FY21 FY22 Consumer Business WIB New Zealand Other FY23 Trading and other ($m)2 900 768 33 97 886 (12) FY21 FY22 Trading DVA Other FY23 Non-interest income by type ($m) Westpac Group 2023 Full Year Results Presentation & Investor Discussion Pack NON-INTEREST INCOME1 REVENUE 1 Excluding Notable Items. 2 Excluding businesses sold. 3 Derivative valuation adjustment (DVA) has been revised to include funding value adjustment and credit value adjustment (CVA). Previously DVA included only CVA. 3 |
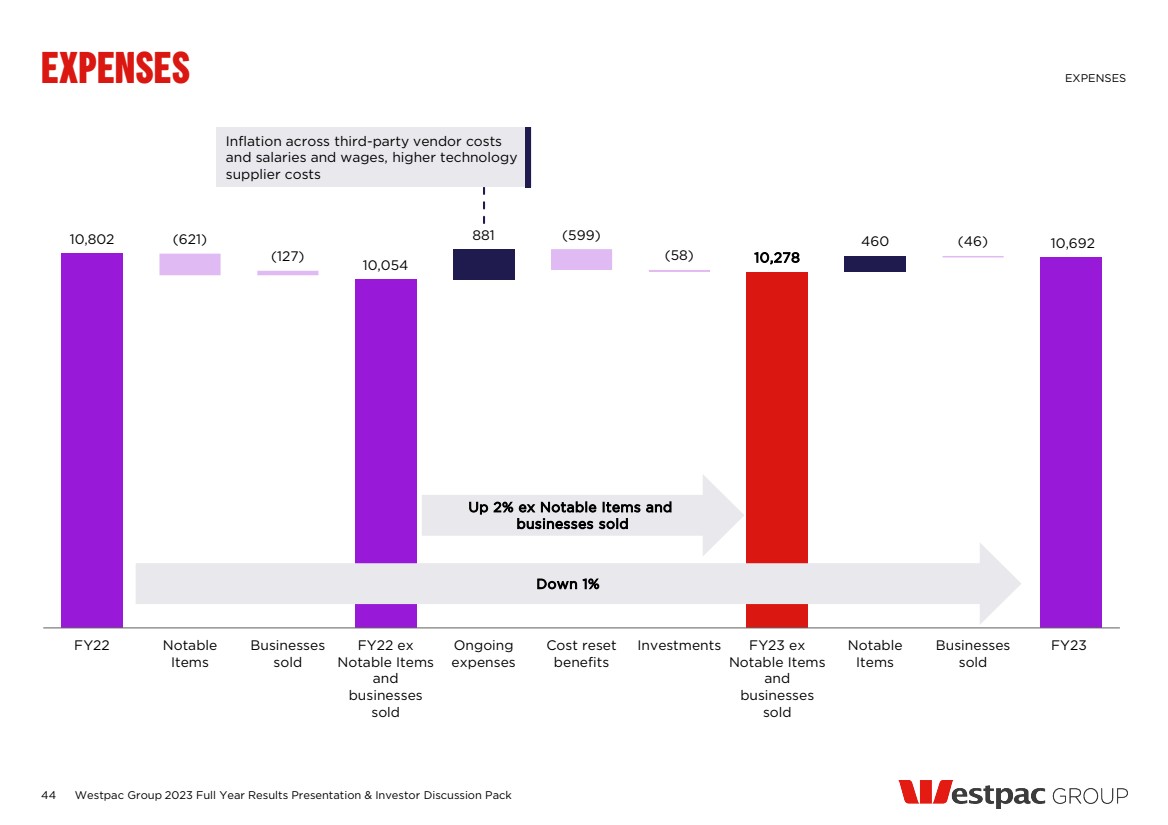
| 44 Westpac Group 2023 Full Year Results Presentation & Investor Discussion Pack EXPENSES EXPENSES 10,802 10,054 881 10,278 (621) 460 (127) (599) (58) (46) 10,692 FY22 Notable Items Businesses sold FY22 ex Notable Items and businesses sold Ongoing expenses Cost reset benefits Investments FY23 ex Notable Items and businesses sold Notable Items Businesses sold FY23 Down 1% Up 2% ex Notable Items and businesses sold Inflation across third-party vendor costs and salaries and wages, higher technology supplier costs |
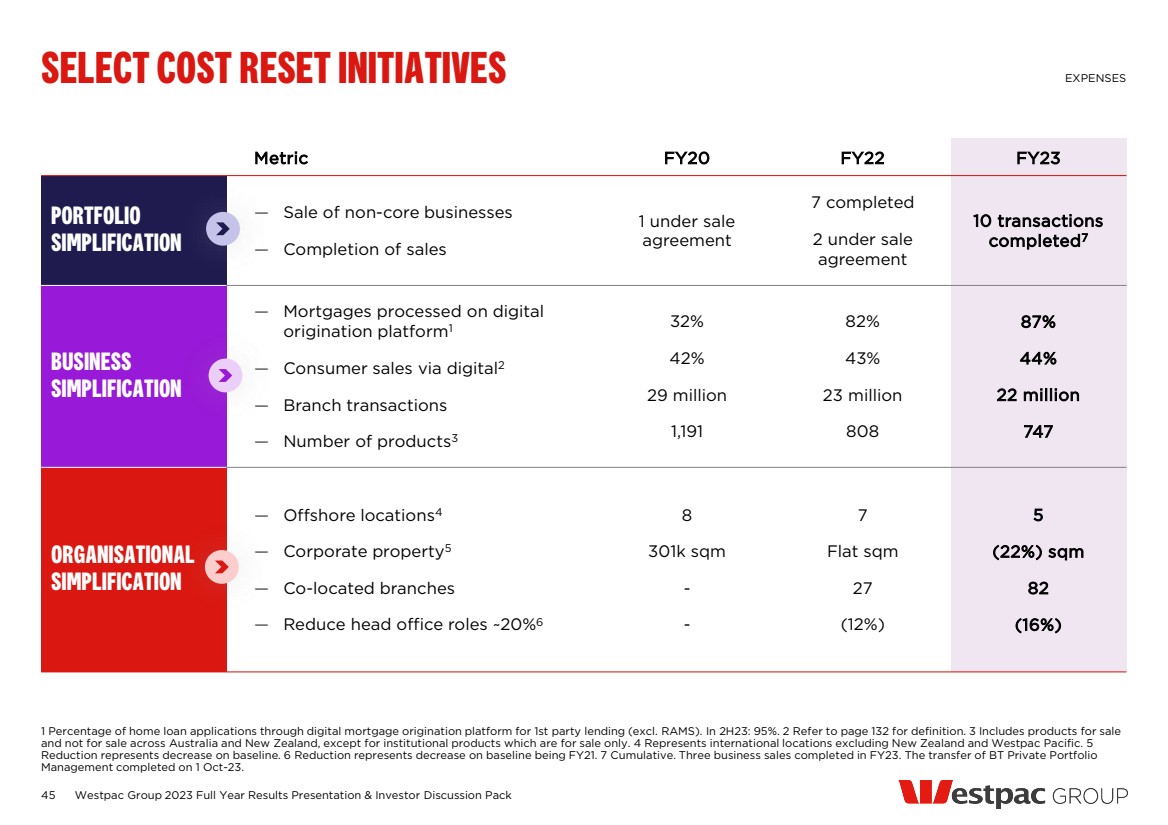
| Metric FY20 FY22 FY23 PORTFOLIO SIMPLIFICATION — Sale of non-core businesses — Completion of sales 1 under sale agreement 7 completed 2 under sale agreement 10 transactions completed7 BUSINESS SIMPLIFICATION — Mortgages processed on digital origination platform1 — Consumer sales via digital2 — Branch transactions — Number of products3 32% 42% 29 million 1,191 82% 43% 23 million 808 87% 44% 22 million 747 ORGANISATIONAL SIMPLIFICATION — Offshore locations4 — Corporate property5 — Co-located branches — Reduce head office roles ~20%6 8 301k sqm - - 7 Flat sqm 27 (12%) 5 (22%) sqm 82 (16%) 45 SELECT COST RESET INITIATIVES EXPENSES 1 Percentage of home loan applications through digital mortgage origination platform for 1st party lending (excl. RAMS). In 2H23: 95%. 2 Refer to page 132 for definition. 3 Includes products for sale and not for sale across Australia and New Zealand, except for institutional products which are for sale only. 4 Represents international locations excluding New Zealand and Westpac Pacific. 5 Reduction represents decrease on baseline. 6 Reduction represents decrease on baseline being FY21. 7 Cumulative. Three business sales completed in FY23. The transfer of BT Private Portfolio Management completed on 1 Oct-23. Westpac Group 2023 Full Year Results Presentation & Investor Discussion Pack |
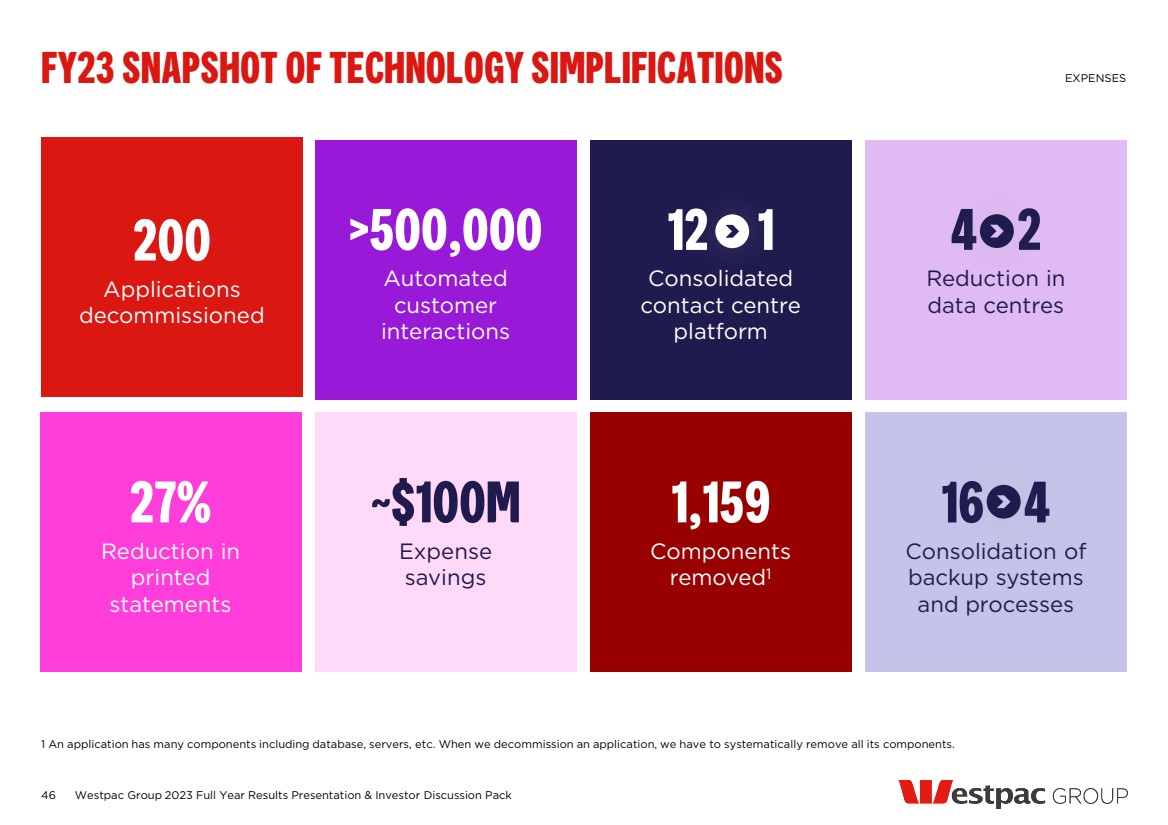
| 46 Westpac Group 2023 Full Year Results Presentation & Investor Discussion Pack FY23 SNAPSHOT OF TECHNOLOGY SIMPLIFICATIONS EXPENSES 1 An application has many components including database, servers, etc. When we decommission an application, we have to systematically remove all its components. ~$100M Expense savings >500,000 Automated customer interactions 1,159 Components removed1 12 1 Consolidated contact centre platform 200 Applications decommissioned 27% Reduction in printed statements 4 2 Reduction in data centres 16 4 Consolidation of backup systems and processes |
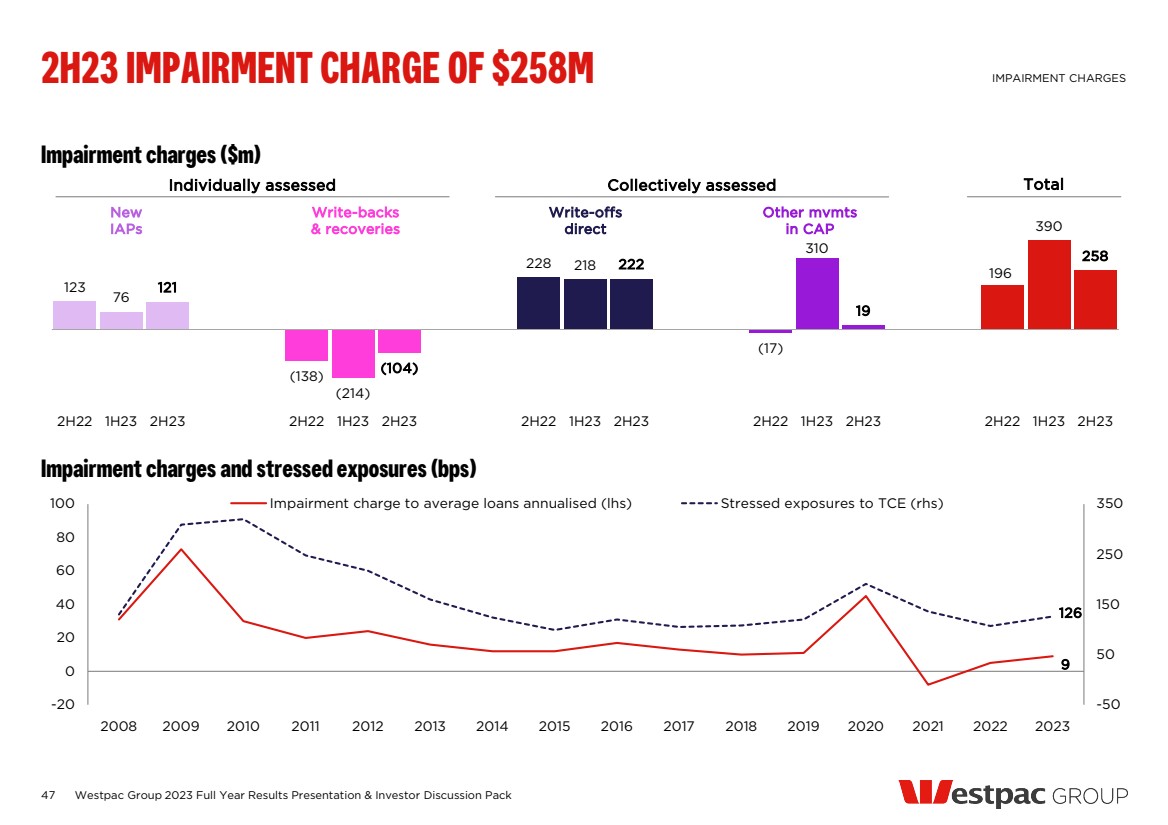
| Impairment charges ($m) 47 Impairment charges and stressed exposures (bps) 2H23 IMPAIRMENT CHARGE OF $258M IMPAIRMENT CHARGES 123 76 121 (138) (214) (104) 228 218 222 (17) 310 19 196 390 258 2H22 1H23 2H23 2H22 1H23 2H23 2H22 1H23 2H23 2H22 1H23 2H23 2H22 1H23 2H23 9 126 -50 50 150 250 350 -20 0 20 40 60 80 100 2008 2009 2010 2011 2012 2013 2014 2015 2016 2017 2018 2019 2020 2021 2022 2023 Impairment charge to average loans annualised (lhs) Stressed exposures to TCE (rhs) New IAPs Write-backs & recoveries Write-offs direct Other mvmts in CAP Individually assessed Collectively assessed Total Westpac Group 2023 Full Year Results Presentation & Investor Discussion Pack |
| CREDIT QUALITY AND PROVISIONS 2023 Full year financial results |
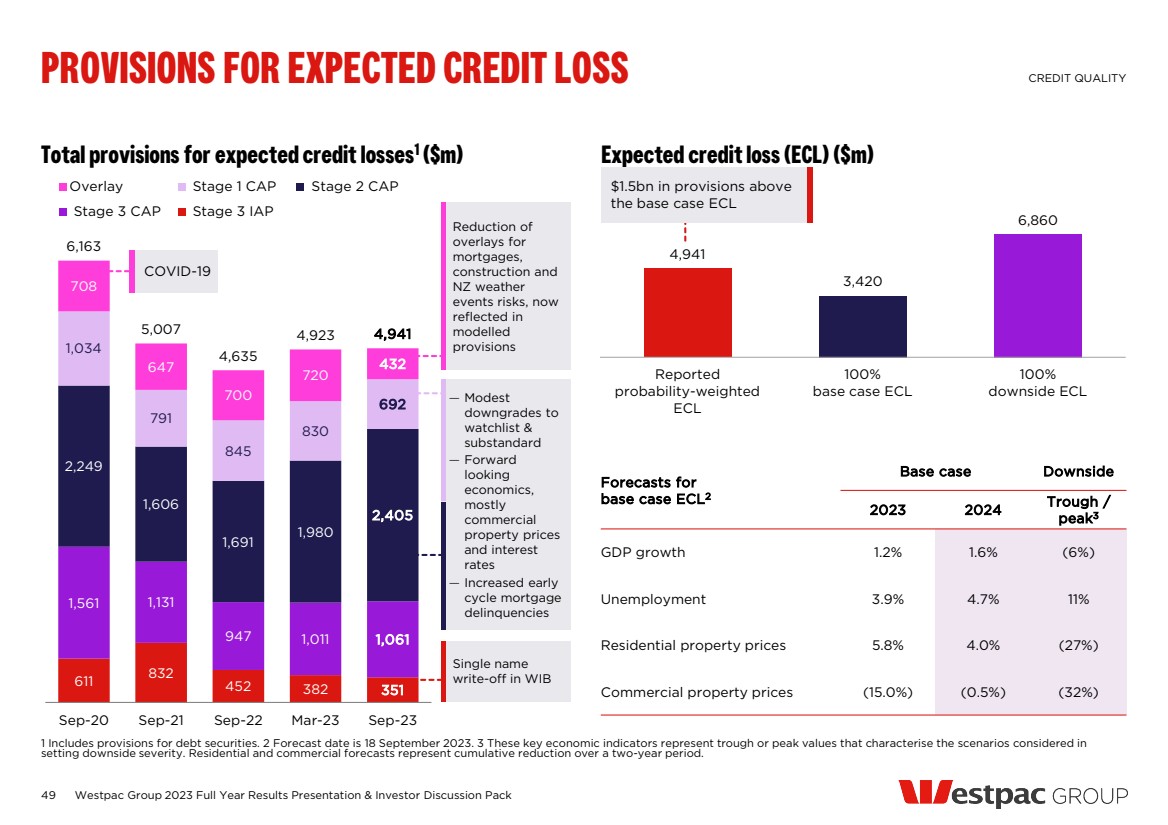
| 611 832 452 382 351 1,561 1,131 947 1,011 1,061 2,249 1,606 1,691 1,980 2,405 1,034 791 845 830 692 708 647 700 720 432 6,163 5,007 4,635 4,923 4,941 Sep-20 Sep-21 Sep-22 Mar-23 Sep-23 Overlay Stage 1 CAP Stage 2 CAP Stage 3 CAP Stage 3 IAP 4,941 3,420 6,860 Reported probability-weighted ECL 100% base case ECL 100% downside ECL PROVISIONS FOR EXPECTED CREDIT LOSS 49 Total provisions for expected credit losses1 ($m) Expected credit loss (ECL) ($m) Westpac Group 2023 Full Year Results Presentation & Investor Discussion Pack CREDIT QUALITY 1 Includes provisions for debt securities. 2 Forecast date is 18 September 2023. 3 These key economic indicators represent trough or peak values that characterise the scenarios considered in setting downside severity. Residential and commercial forecasts represent cumulative reduction over a two-year period. Forecasts for base case ECL2 Base case Downside 2023 2024 Trough / peak3 GDP growth 1.2% 1.6% (6%) Unemployment 3.9% 4.7% 11% Residential property prices 5.8% 4.0% (27%) Commercial property prices (15.0%) (0.5%) (32%) COVID-19 Reduction of overlays for mortgages, construction and NZ weather events risks, now reflected in modelled provisions Single name write-off in WIB $1.5bn in provisions above the base case ECL — Modest downgrades to watchlist & substandard — Forward looking economics, mostly commercial property prices and interest rates — Increased early cycle mortgage delinquencies |
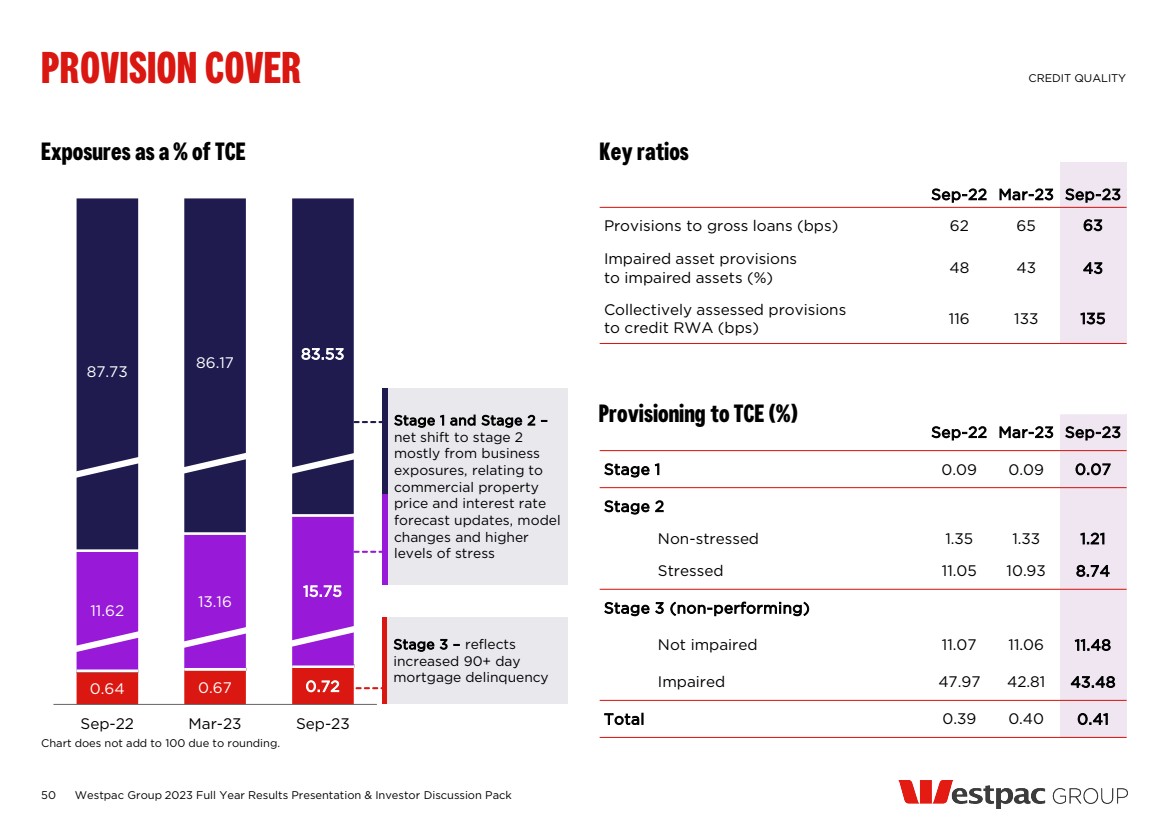
| Sep-22 Mar-23 Sep-23 Provisions to gross loans (bps) 62 65 63 Impaired asset provisions to impaired assets (%) 48 43 43 Collectively assessed provisions to credit RWA (bps) 116 133 135 0.64 0.67 0.72 11.62 13.16 15.75 87.73 86.17 83.53 Sep-22 Mar-23 Sep-23 50 Exposures as a % of TCE Key ratios Westpac Group 2023 Full Year Results Presentation & Investor Discussion Pack PROVISION COVER CREDIT QUALITY Chart does not add to 100 due to rounding. Provisioning to TCE (%) Stage 3 – reflects increased 90+ day mortgage delinquency Stage 1 and Stage 2 – net shift to stage 2 mostly from business exposures, relating to commercial property price and interest rate forecast updates, model changes and higher levels of stress Sep-22 Mar-23 Sep-23 Stage 1 0.09 0.09 0.07 Stage 2 Non-stressed 1.35 1.33 1.21 Stressed 11.05 10.93 8.74 Stage 3 (non-performing) Not impaired 11.07 11.06 11.48 Impaired 47.97 42.81 43.48 Total 0.39 0.40 0.41 |
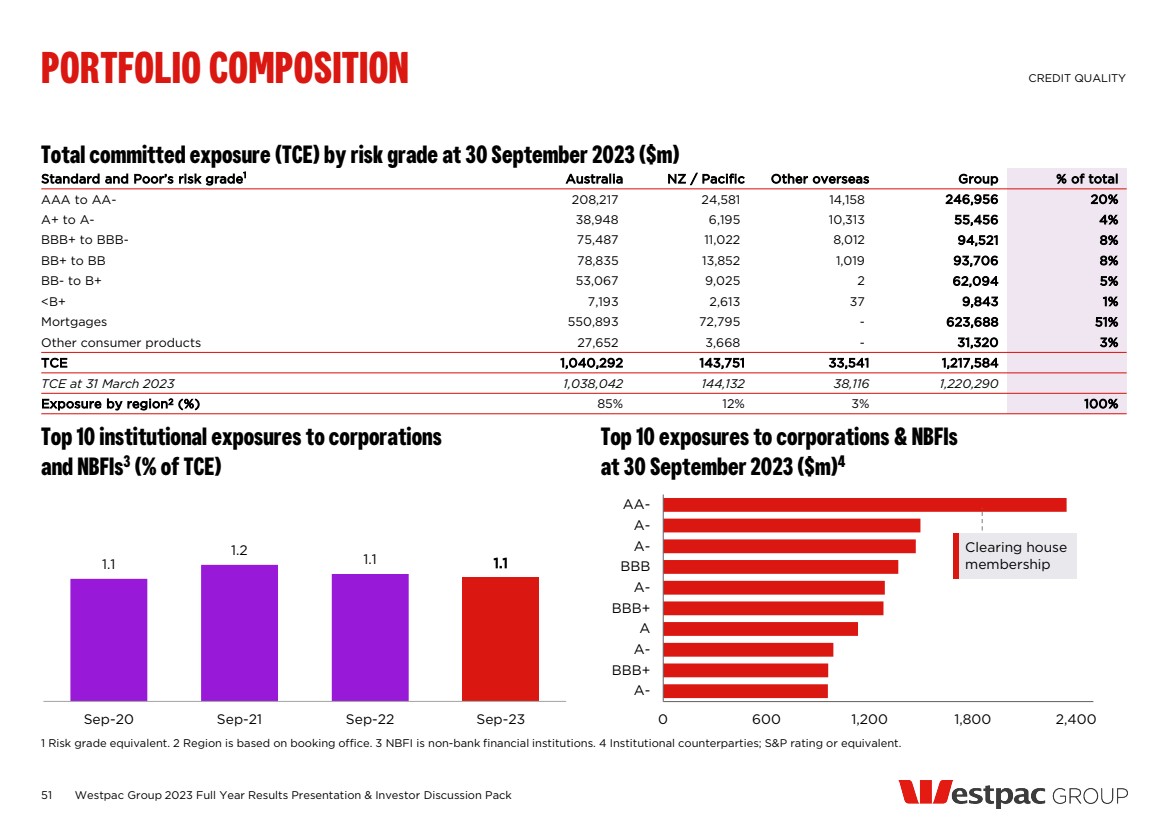
| 51 Total committed exposure (TCE) by risk grade at 30 September 2023 ($m) Top 10 institutional exposures to corporations and NBFIs3 (% of TCE) 1.1 1.2 1.1 1.1 Sep-20 Sep-21 Sep-22 Sep-23 Top 10 exposures to corporations & NBFIs at 30 September 2023 ($m)4 0 600 1,200 1,800 2,400 A-BBB+ A-A BBB+ A-BBB A-A-AA-Westpac Group 2023 Full Year Results Presentation & Investor Discussion Pack PORTFOLIO COMPOSITION CREDIT QUALITY 1 Risk grade equivalent. 2 Region is based on booking office. 3 NBFI is non-bank financial institutions. 4 Institutional counterparties; S&P rating or equivalent. Standard and Poor’s risk grade1 Australia NZ / Pacific Other overseas Group % of total AAA to AA- 208,217 24,581 14,158 246,956 20% A+ to A- 38,948 6,195 10,313 55,456 4% BBB+ to BBB- 75,487 11,022 8,012 94,521 8% BB+ to BB 78,835 13,852 1,019 93,706 8% BB- to B+ 53,067 9,025 2 62,094 5% <B+ 7,193 2,613 37 9,843 1% Mortgages 550,893 72,795 - 623,688 51% Other consumer products 27,652 3,668 - 31,320 3% TCE 1,040,292 143,751 33,541 1,217,584 TCE at 31 March 2023 1,038,042 144,132 38,116 1,220,290 Exposure by region2 (%) 85% 12% 3% 100% Clearing house membership |
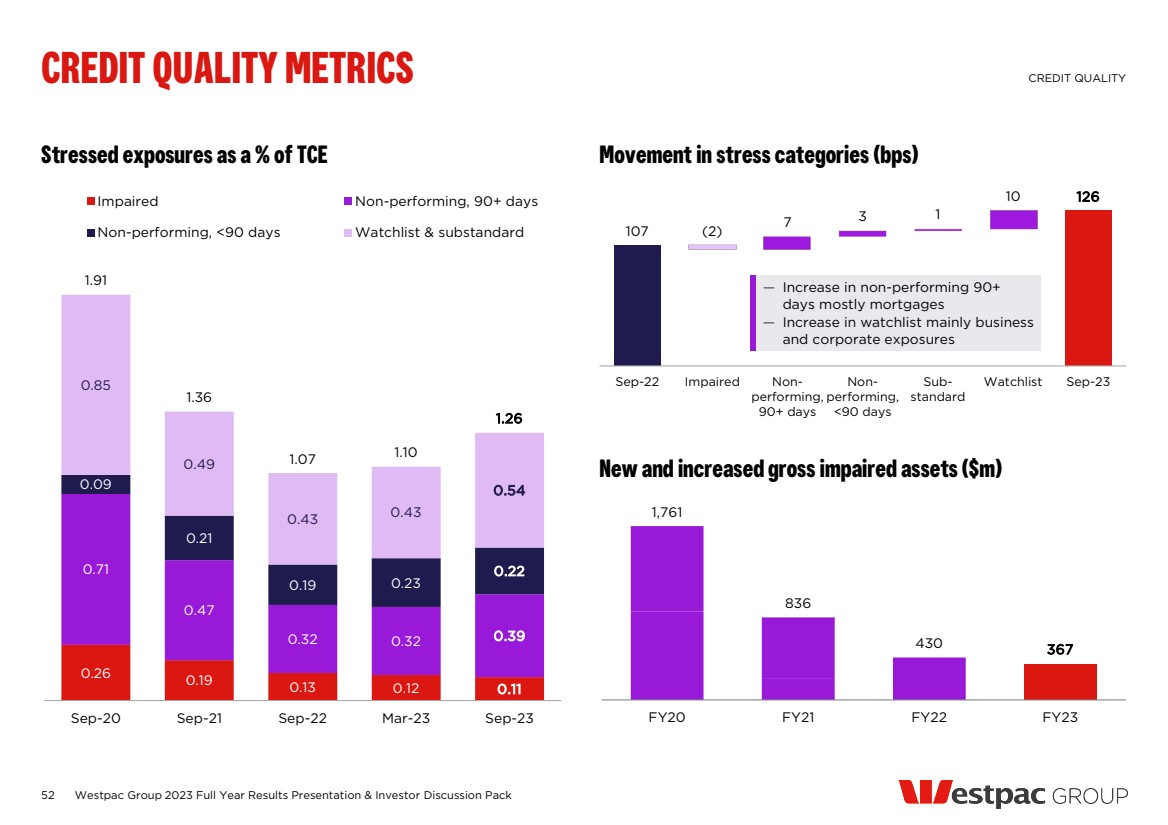
| 107 7 3 1 10 126 (2) Sep-22 Impaired Non-performing, 90+ days Non-performing, <90 days Sub-standard Watchlist Sep-23 Movement in stress categories (bps) 52 New and increased gross impaired assets ($m) 1,761 836 430 367 FY20 FY21 FY22 FY23 Stressed exposures as a % of TCE Westpac Group 2023 Full Year Results Presentation & Investor Discussion Pack CREDIT QUALITY METRICS CREDIT QUALITY — Increase in non-performing 90+ days mostly mortgages — Increase in watchlist mainly business and corporate exposures 0.26 0.19 0.13 0.12 0.11 0.71 0.47 0.32 0.32 0.39 0.09 0.21 0.19 0.23 0.22 0.85 0.49 0.43 0.43 0.54 1.91 1.36 1.07 1.10 1.26 Sep-20 Sep-21 Sep-22 Mar-23 Sep-23 Impaired Non-performing, 90+ days Non-performing, <90 days Watchlist & substandard |
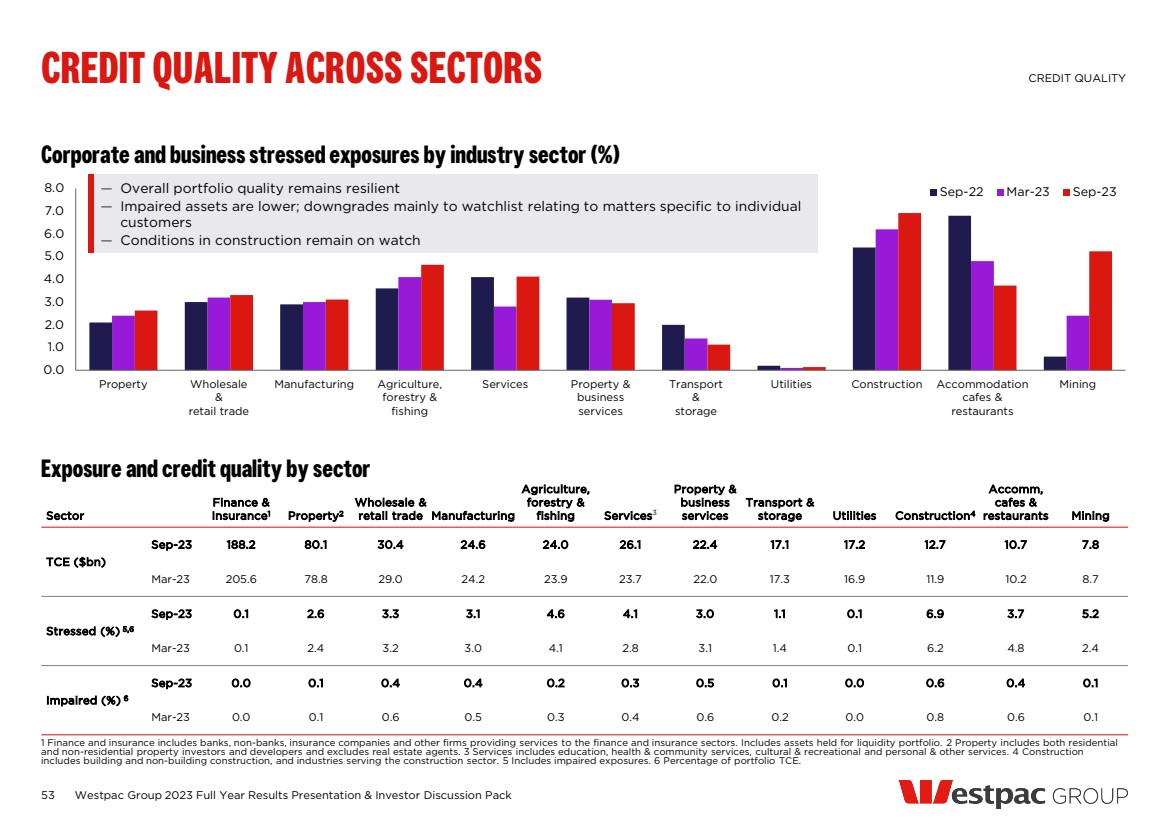
| Corporate and business stressed exposures by industry sector (%) 0.0 1.0 2.0 3.0 4.0 5.0 6.0 7.0 8.0 Property Wholesale & retail trade Manufacturing Agriculture, forestry & fishing Services Property & business services Transport & storage Utilities Construction Accommodation cafes & restaurants Mining Sep-22 Mar-23 Sep-23 53 Exposure and credit quality by sector Sector Finance & Insurance1 Property2 Wholesale & retail trade Manufacturing Agriculture, forestry & fishing Services3 Property & business services Transport & storage Utilities Construction4 Accomm, cafes & restaurants Mining TCE ($bn) Sep-23 188.2 80.1 30.4 24.6 24.0 26.1 22.4 17.1 17.2 12.7 10.7 7.8 Mar-23 205.6 78.8 29.0 24.2 23.9 23.7 22.0 17.3 16.9 11.9 10.2 8.7 Stressed (%) 5,6 Sep-23 0.1 2.6 3.3 3.1 4.6 4.1 3.0 1.1 0.1 6.9 3.7 5.2 Mar-23 0.1 2.4 3.2 3.0 4.1 2.8 3.1 1.4 0.1 6.2 4.8 2.4 Impaired (%) 6 Sep-23 0.0 0.1 0.4 0.4 0.2 0.3 0.5 0.1 0.0 0.6 0.4 0.1 Mar-23 0.0 0.1 0.6 0.5 0.3 0.4 0.6 0.2 0.0 0.8 0.6 0.1 Westpac Group 2023 Full Year Results Presentation & Investor Discussion Pack CREDIT QUALITY ACROSS SECTORS CREDIT QUALITY 1 Finance and insurance includes banks, non-banks, insurance companies and other firms providing services to the finance and insurance sectors. Includes assets held for liquidity portfolio. 2 Property includes both residential and non-residential property investors and developers and excludes real estate agents. 3 Services includes education, health & community services, cultural & recreational and personal & other services. 4 Construction includes building and non-building construction, and industries serving the construction sector. 5 Includes impaired exposures. 6 Percentage of portfolio TCE. — Overall portfolio quality remains resilient — Impaired assets are lower; downgrades mainly to watchlist relating to matters specific to individual customers — Conditions in construction remain on watch |
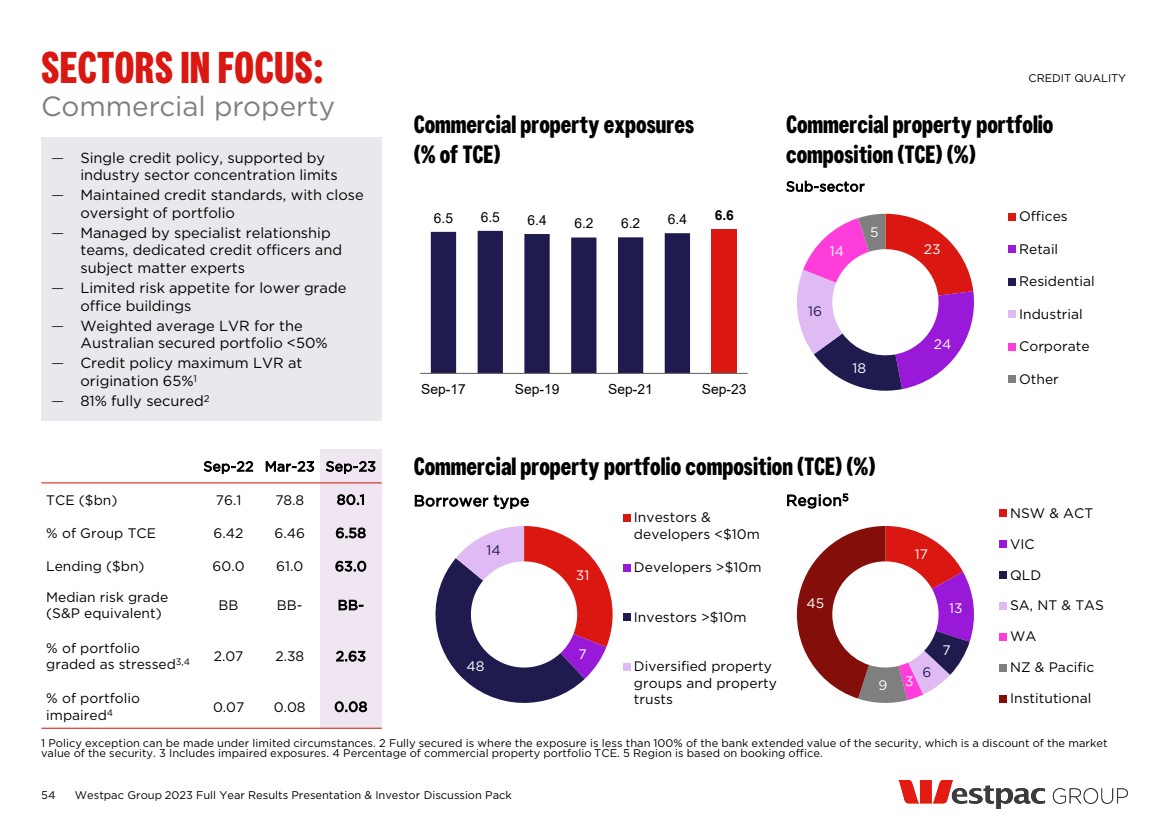
| — Single credit policy, supported by industry sector concentration limits — Maintained credit standards, with close oversight of portfolio — Managed by specialist relationship teams, dedicated credit officers and subject matter experts — Limited risk appetite for lower grade office buildings — Weighted average LVR for the Australian secured portfolio <50% — Credit policy maximum LVR at origination 65%1 — 81% fully secured2 54 Sep-22 Mar-23 Sep-23 TCE ($bn) 76.1 78.8 80.1 % of Group TCE 6.42 6.46 6.58 Lending ($bn) 60.0 61.0 63.0 Median risk grade (S&P equivalent) BB BB- BB- % of portfolio graded as stressed3,4 2.07 2.38 2.63 % of portfolio impaired4 0.07 0.08 0.08 Commercial property portfolio composition (TCE) (%) Commercial property exposures (% of TCE) Commercial property portfolio composition (TCE) (%) Westpac Group 2023 Full Year Results Presentation & Investor Discussion Pack SECTORS IN FOCUS: CREDIT QUALITY 1 Policy exception can be made under limited circumstances. 2 Fully secured is where the exposure is less than 100% of the bank extended value of the security, which is a discount of the market value of the security. 3 Includes impaired exposures. 4 Percentage of commercial property portfolio TCE. 5 Region is based on booking office. Commercial property 23 24 18 16 14 5 Offices Retail Residential Industrial Corporate Other 6.5 6.5 6.4 6.2 6.2 6.4 6.6 Sep-17 Sep-19 Sep-21 Sep-23 Sub-sector Borrower type Region5 17 13 7 6 9 3 45 NSW & ACT VIC QLD SA, NT & TAS WA NZ & Pacific Institutional 31 7 48 14 Investors & developers <$10m Developers >$10m Investors >$10m Diversified property groups and property trusts |
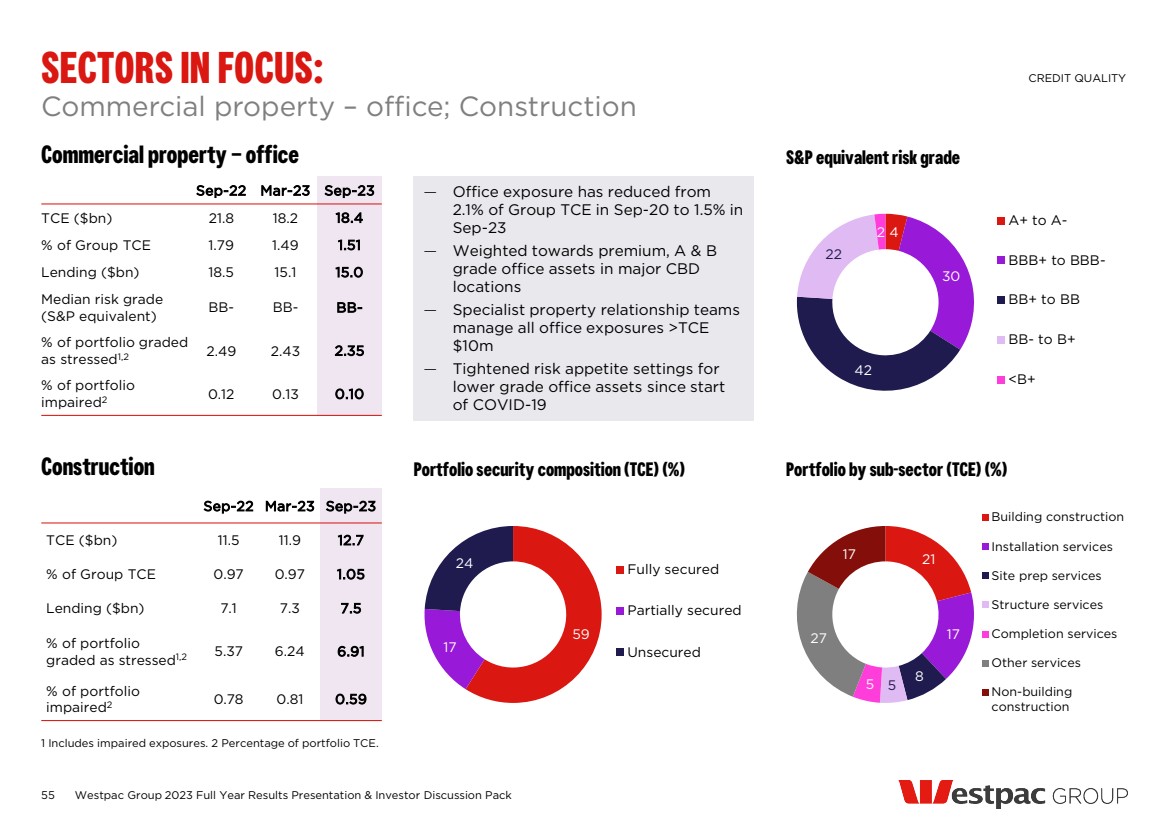
| 55 Construction Portfolio security composition (TCE) (%) Portfolio by sub-sector (TCE) (%) Commercial property – office — Office exposure has reduced from 2.1% of Group TCE in Sep-20 to 1.5% in Sep-23 — Weighted towards premium, A & B grade office assets in major CBD locations — Specialist property relationship teams manage all office exposures >TCE $10m — Tightened risk appetite settings for lower grade office assets since start of COVID-19 S&P equivalent risk grade Commercial property – office; Construction Westpac Group 2023 Full Year Results Presentation & Investor Discussion Pack SECTORS IN FOCUS: CREDIT QUALITY 1 Includes impaired exposures. 2 Percentage of portfolio TCE. Sep-22 Mar-23 Sep-23 TCE ($bn) 21.8 18.2 18.4 % of Group TCE 1.79 1.49 1.51 Lending ($bn) 18.5 15.1 15.0 Median risk grade (S&P equivalent) BB- BB- BB- % of portfolio graded as stressed1,2 2.49 2.43 2.35 % of portfolio impaired2 0.12 0.13 0.10 4 30 42 22 2 A+ to A-BBB+ to BBB-BB+ to BB BB- to B+ <B+ 59 17 24 Fully secured Partially secured Unsecured Sep-22 Mar-23 Sep-23 TCE ($bn) 11.5 11.9 12.7 % of Group TCE 0.97 0.97 1.05 Lending ($bn) 7.1 7.3 7.5 % of portfolio graded as stressed1,2 5.37 6.24 6.91 % of portfolio impaired2 0.78 0.81 0.59 21 17 8 5 5 27 17 Building construction Installation services Site prep services Structure services Completion services Other services Non-building construction |
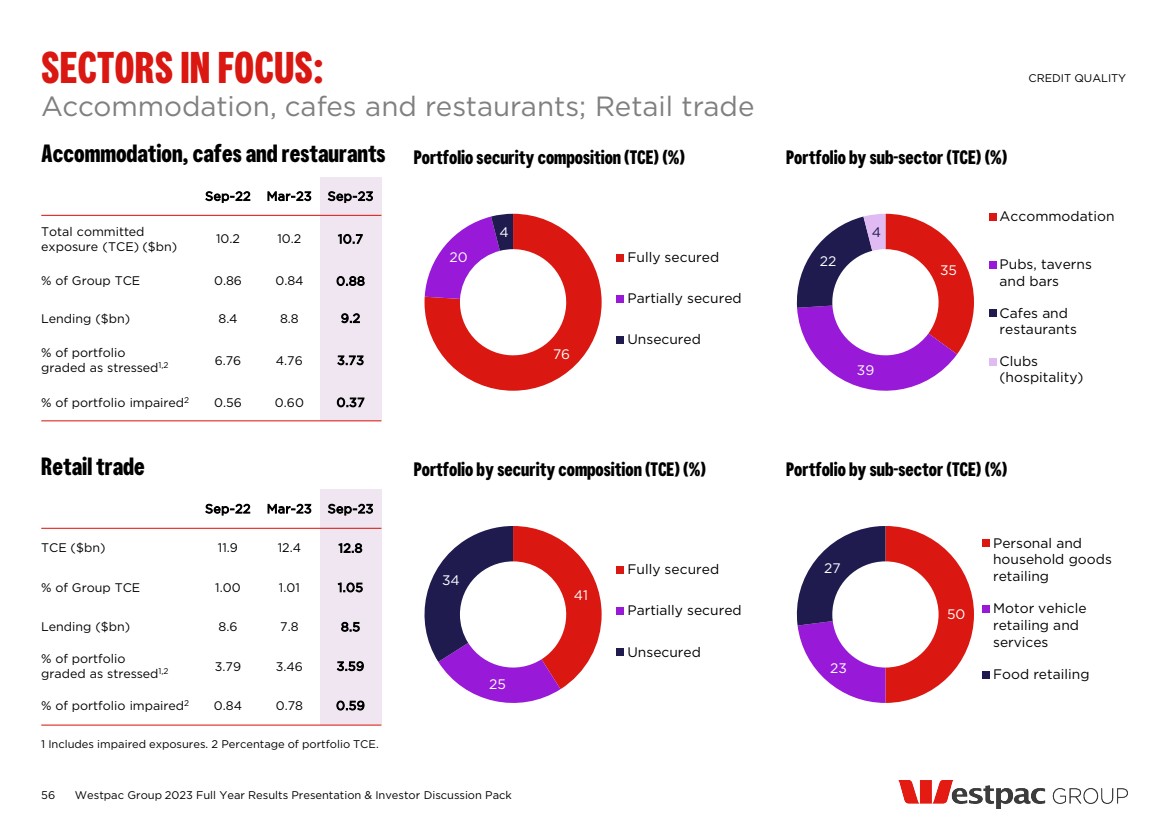
| 56 Retail trade Sep-22 Mar-23 Sep-23 TCE ($bn) 11.9 12.4 12.8 % of Group TCE 1.00 1.01 1.05 Lending ($bn) 8.6 7.8 8.5 % of portfolio graded as stressed1,2 3.79 3.46 3.59 % of portfolio impaired2 0.84 0.78 0.59 Portfolio by security composition (TCE) (%) 41 25 34 Fully secured Partially secured Unsecured Portfolio by sub-sector (TCE) (%) 50 23 27 Personal and household goods retailing Motor vehicle retailing and services Food retailing Accommodation, cafes and restaurants Sep-22 Mar-23 Sep-23 Total committed exposure (TCE) ($bn) 10.2 10.2 10.7 % of Group TCE 0.86 0.84 0.88 Lending ($bn) 8.4 8.8 9.2 % of portfolio graded as stressed1,2 6.76 4.76 3.73 % of portfolio impaired2 0.56 0.60 0.37 Portfolio security composition (TCE) (%) 76 20 4 Fully secured Partially secured Unsecured Portfolio by sub-sector (TCE) (%) 35 39 22 4 Accommodation Pubs, taverns and bars Cafes and restaurants Clubs (hospitality) Accommodation, cafes and restaurants; Retail trade Westpac Group 2023 Full Year Results Presentation & Investor Discussion Pack SECTORS IN FOCUS: CREDIT QUALITY 1 Includes impaired exposures. 2 Percentage of portfolio TCE. |
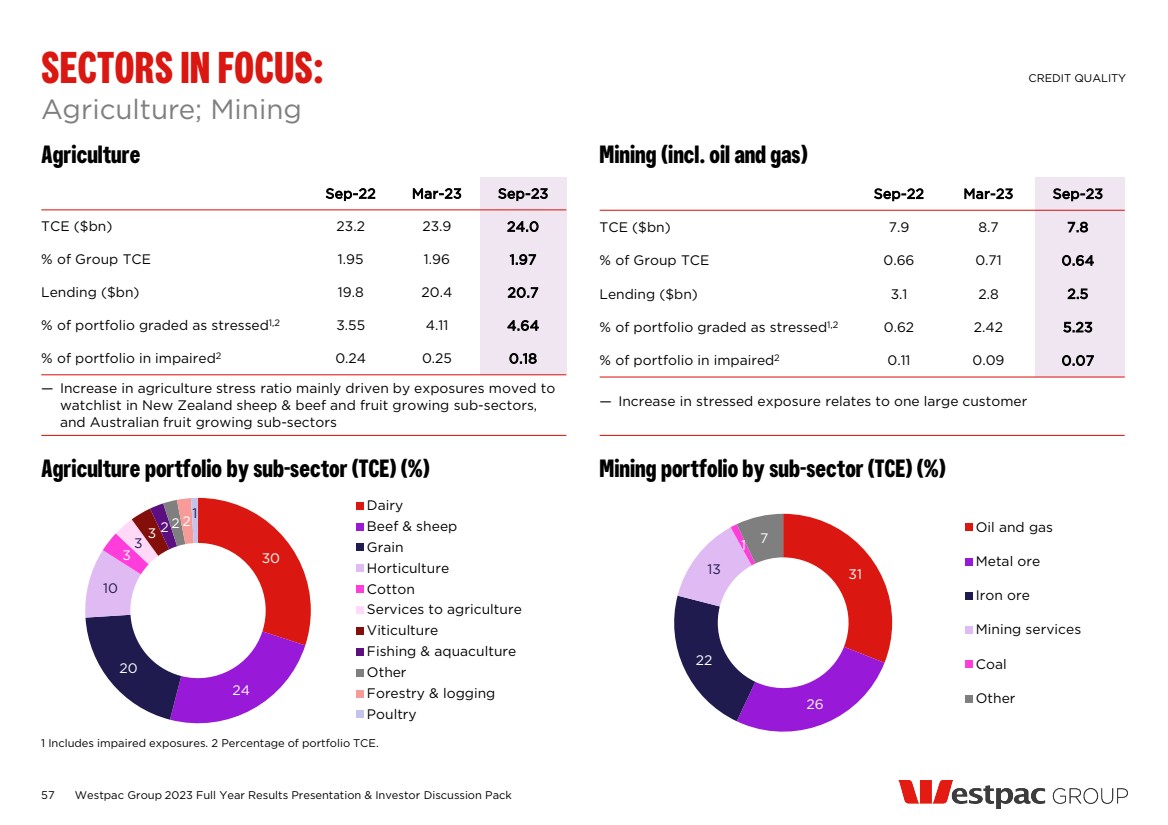
| Agriculture Mining (incl. oil and gas) Agriculture portfolio by sub-sector (TCE) (%) Mining portfolio by sub-sector (TCE) (%) Agriculture; Mining SECTORS IN FOCUS: CREDIT QUALITY 1 Includes impaired exposures. 2 Percentage of portfolio TCE. Sep-22 Mar-23 Sep-23 TCE ($bn) 23.2 23.9 24.0 % of Group TCE 1.95 1.96 1.97 Lending ($bn) 19.8 20.4 20.7 % of portfolio graded as stressed1,2 3.55 4.11 4.64 % of portfolio in impaired2 0.24 0.25 0.18 — Increase in agriculture stress ratio mainly driven by exposures moved to watchlist in New Zealand sheep & beef and fruit growing sub-sectors, and Australian fruit growing sub-sectors Sep-22 Mar-23 Sep-23 TCE ($bn) 7.9 8.7 7.8 % of Group TCE 0.66 0.71 0.64 Lending ($bn) 3.1 2.8 2.5 % of portfolio graded as stressed1,2 0.62 2.42 5.23 % of portfolio in impaired2 0.11 0.09 0.07 — Increase in stressed exposure relates to one large customer 30 24 20 10 3 3 3 2 2 21 Dairy Beef & sheep Grain Horticulture Cotton Services to agriculture Viticulture Fishing & aquaculture Other Forestry & logging Poultry 31 26 22 13 1 7 Oil and gas Metal ore Iron ore Mining services Coal Other 57 Westpac Group 2023 Full Year Results Presentation & Investor Discussion Pack |
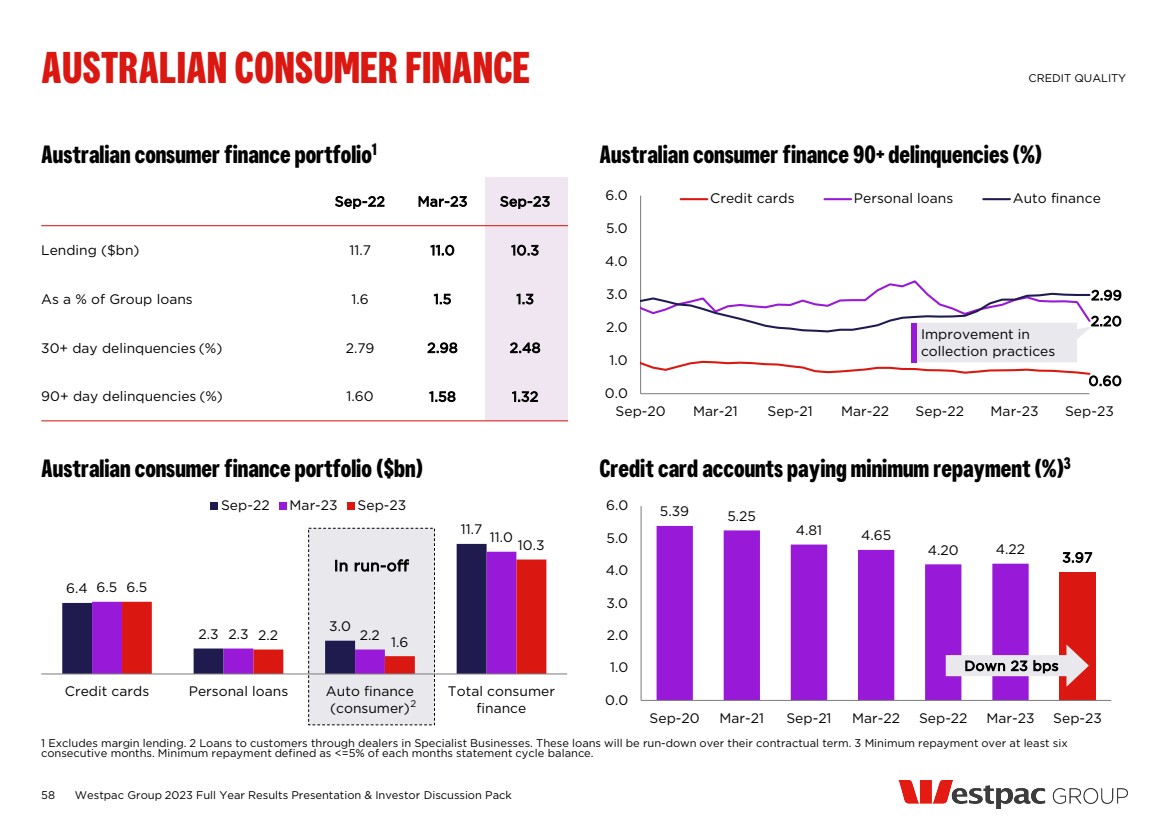
| Australian consumer finance portfolio1 Sep-22 Mar-23 Sep-23 Lending ($bn) 11.7 11.0 10.3 As a % of Group loans 1.6 1.5 1.3 30+ day delinquencies (%) 2.79 2.98 2.48 90+ day delinquencies (%) 1.60 1.58 1.32 Australian consumer finance 90+ delinquencies (%) 0.60 2.20 2.99 0.0 1.0 2.0 3.0 4.0 5.0 6.0 Sep-20 Mar-21 Sep-21 Mar-22 Sep-22 Mar-23 Sep-23 Credit cards Personal loans Auto finance Australian consumer finance portfolio ($bn) 6.4 2.3 3.0 11.7 6.5 2.3 2.2 11.0 6.5 2.2 1.6 10.3 Credit cards Personal loans Auto finance (consumer) Total consumer finance Sep-22 Mar-23 Sep-23 Credit card accounts paying minimum repayment (%)3 AUSTRALIAN CONSUMER FINANCE CREDIT QUALITY 1 Excludes margin lending. 2 Loans to customers through dealers in Specialist Businesses. These loans will be run-down over their contractual term. 3 Minimum repayment over at least six consecutive months. Minimum repayment defined as <=5% of each months statement cycle balance. Improvement in collection practices 58 Westpac Group 2023 Full Year Results Presentation & Investor Discussion Pack 2 In run-off 5.39 5.25 4.81 4.65 4.20 4.22 3.97 0.0 1.0 2.0 3.0 4.0 5.0 6.0 Sep-20 Mar-21 Sep-21 Mar-22 Sep-22 Mar-23 Sep-23 Down 23 bps |
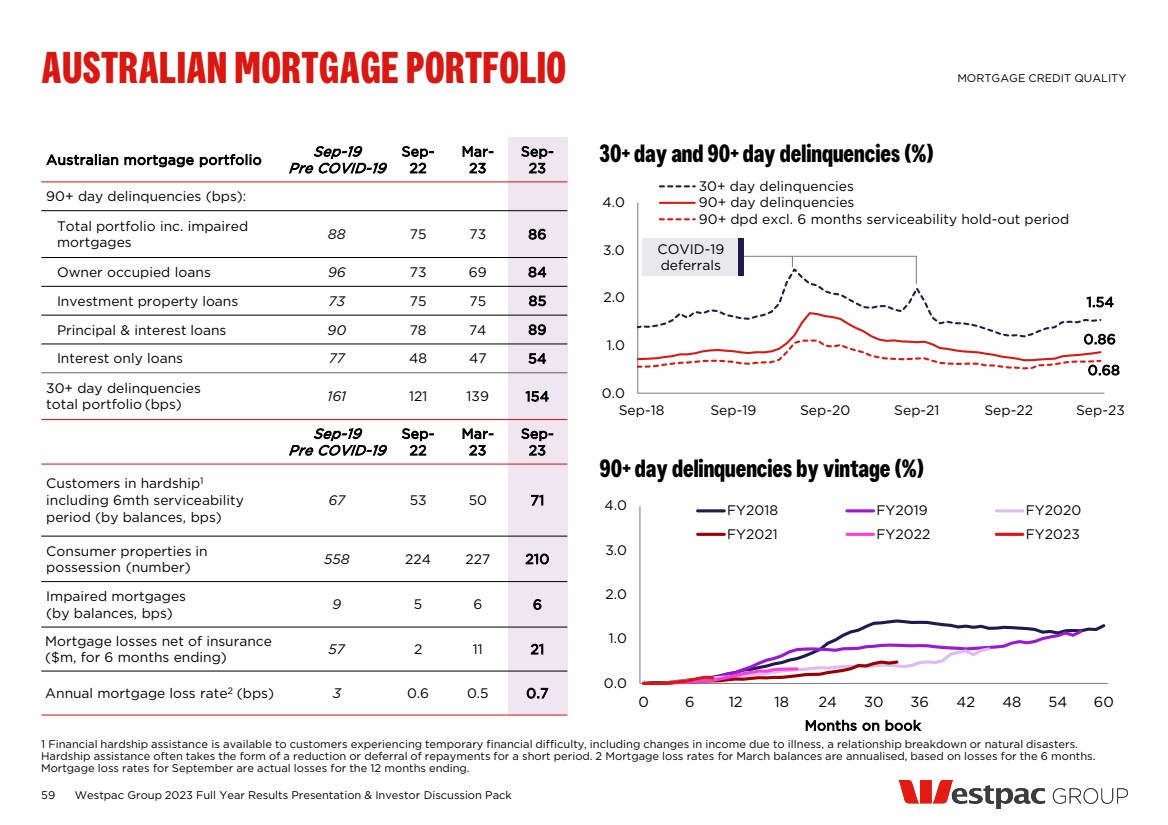
| 59 30+ day and 90+ day delinquencies (%) 1.54 0.86 0.68 0.0 1.0 2.0 3.0 4.0 Sep-18 Sep-19 Sep-20 Sep-21 Sep-22 Sep-23 30+ day delinquencies 90+ day delinquencies 90+ dpd excl. 6 months serviceability hold-out period 90+ day delinquencies by vintage (%) AUSTRALIAN MORTGAGE PORTFOLIO MORTGAGE CREDIT QUALITY 1 Financial hardship assistance is available to customers experiencing temporary financial difficulty, including changes in income due to illness, a relationship breakdown or natural disasters. Hardship assistance often takes the form of a reduction or deferral of repayments for a short period. 2 Mortgage loss rates for March balances are annualised, based on losses for the 6 months. Mortgage loss rates for September are actual losses for the 12 months ending. COVID-19 deferrals Australian mortgage portfolio Sep-19 Pre COVID-19 Sep-22 Mar-23 Sep-23 90+ day delinquencies (bps): Total portfolio inc. impaired mortgages 88 75 73 86 Owner occupied loans 96 73 69 84 Investment property loans 73 75 75 85 Principal & interest loans 90 78 74 89 Interest only loans 77 48 47 54 30+ day delinquencies total portfolio (bps) 161 121 139 154 Sep-19 Pre COVID-19 Sep-22 Mar-23 Sep-23 Customers in hardship1 including 6mth serviceability period (by balances, bps) 67 53 50 71 Consumer properties in possession (number) 558 224 227 210 Impaired mortgages (by balances, bps) 9 5 6 6 Mortgage losses net of insurance ($m, for 6 months ending) 57 2 11 21 Annual mortgage loss rate2 (bps) 3 0.6 0.5 0.7 0.0 1.0 2.0 3.0 4.0 0 6 12 18 24 30 36 42 48 54 60 FY2018 FY2019 FY2020 FY2021 FY2022 FY2023 Months on book Westpac Group 2023 Full Year Results Presentation & Investor Discussion Pack |
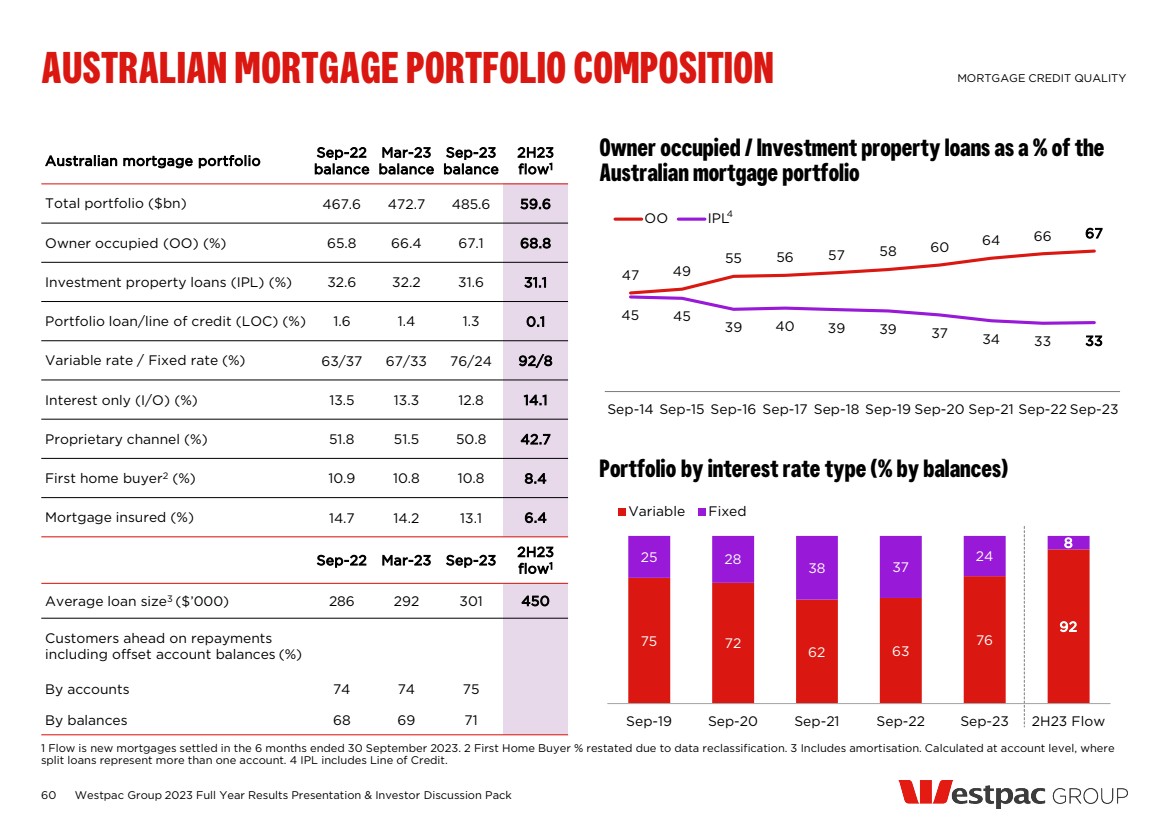
| Australian mortgage portfolio Sep-22 balance Mar-23 balance Sep-23 balance 2H23 flow1 Total portfolio ($bn) 467.6 472.7 485.6 59.6 Owner occupied (OO) (%) 65.8 66.4 67.1 68.8 Investment property loans (IPL) (%) 32.6 32.2 31.6 31.1 Portfolio loan/line of credit (LOC) (%) 1.6 1.4 1.3 0.1 Variable rate / Fixed rate (%) 63/37 67/33 76/24 92/8 Interest only (I/O) (%) 13.5 13.3 12.8 14.1 Proprietary channel (%) 51.8 51.5 50.8 42.7 First home buyer2 (%) 10.9 10.8 10.8 8.4 Mortgage insured (%) 14.7 14.2 13.1 6.4 Sep-22 Mar-23 Sep-23 2H23 flow1 Average loan size3 ($’000) 286 292 301 450 Customers ahead on repayments including offset account balances (%) By accounts 74 74 75 By balances 68 69 71 60 Owner occupied / Investment property loans as a % of the Australian mortgage portfolio Portfolio by interest rate type (% by balances) AUSTRALIAN MORTGAGE PORTFOLIO COMPOSITION MORTGAGE CREDIT QUALITY 1 Flow is new mortgages settled in the 6 months ended 30 September 2023. 2 First Home Buyer % restated due to data reclassification. 3 Includes amortisation. Calculated at account level, where split loans represent more than one account. 4 IPL includes Line of Credit. 4 47 49 55 56 57 58 60 64 66 67 45 45 39 40 39 39 37 34 33 33 Sep-14 Sep-15 Sep-16 Sep-17 Sep-18 Sep-19 Sep-20 Sep-21 Sep-22 Sep-23 OO IPL 75 72 62 63 76 92 25 28 38 37 24 8 Sep-19 Sep-20 Sep-21 Sep-22 Sep-23 2H23 Flow Variable Fixed Westpac Group 2023 Full Year Results Presentation & Investor Discussion Pack |
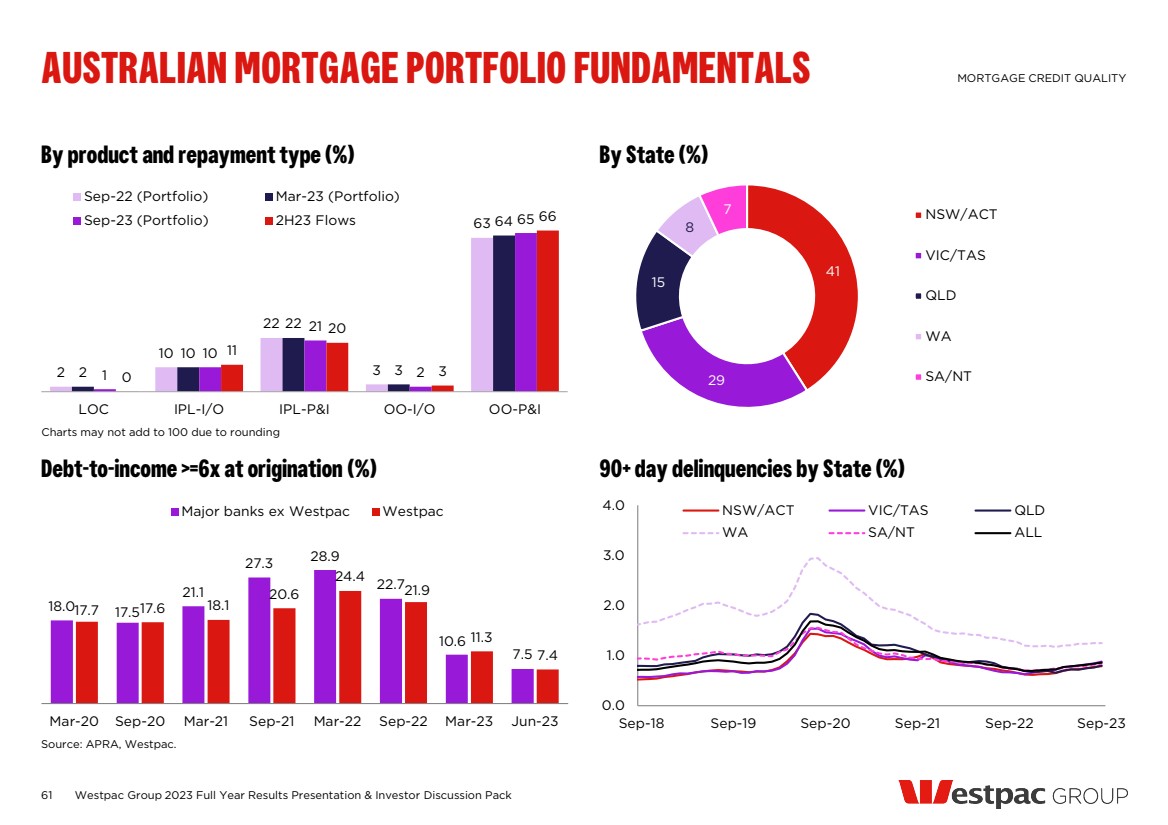
| 61 By product and repayment type (%) By State (%) Debt-to-income >=6x at origination (%) 90+ day delinquencies by State (%) Westpac Group 2023 Full Year Results Presentation & Investor Discussion Pack AUSTRALIAN MORTGAGE PORTFOLIO FUNDAMENTALS MORTGAGE CREDIT QUALITY Source: APRA, Westpac. Charts may not add to 100 due to rounding 2 10 22 3 63 2 10 22 3 64 1 10 21 2 65 0 11 20 3 66 LOC IPL-I/O IPL-P&I OO-I/O OO-P&I Sep-22 (Portfolio) Mar-23 (Portfolio) Sep-23 (Portfolio) 2H23 Flows 41 29 15 8 7 NSW/ACT VIC/TAS QLD WA SA/NT 0.0 1.0 2.0 3.0 4.0 Sep-18 Sep-19 Sep-20 Sep-21 Sep-22 Sep-23 NSW/ACT VIC/TAS QLD WA SA/NT ALL 18.0 17.5 21.1 27.3 28.9 22.7 10.6 7.5 17.7 17.6 18.1 20.6 24.4 21.9 11.3 7.4 Mar-20 Sep-20 Mar-21 Sep-21 Mar-22 Sep-22 Mar-23 Jun-23 Major banks ex Westpac Westpac |
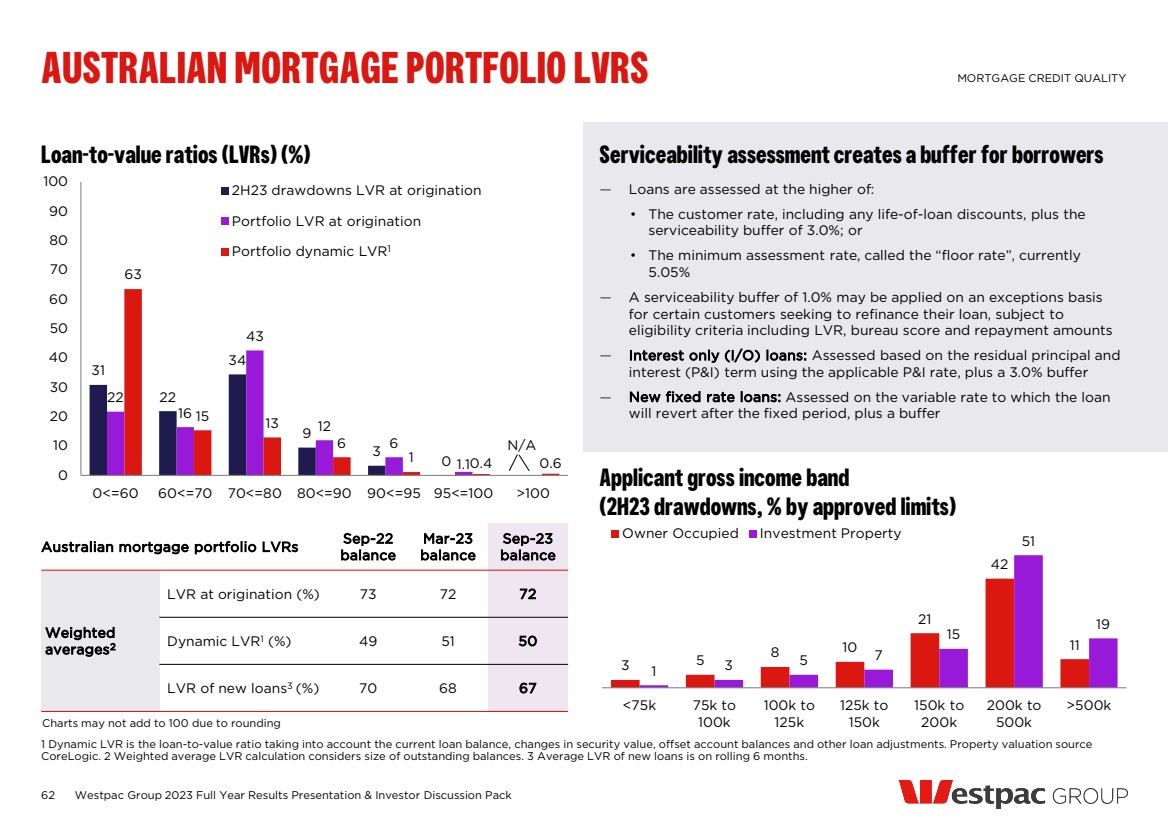
| 31 22 34 9 3 0 22 16 43 12 6 1.1 63 15 13 6 1 0.4 0.6 0 10 20 30 40 50 60 70 80 90 100 0<=60 60<=70 70<=80 80<=90 90<=95 95<=100 >100 2H23 drawdowns LVR at origination Portfolio LVR at origination Portfolio dynamic LVR 62 Loan-to-value ratios (LVRs) (%) Serviceability assessment creates a buffer for borrowers — Loans are assessed at the higher of: • The customer rate, including any life-of-loan discounts, plus the serviceability buffer of 3.0%; or • The minimum assessment rate, called the “floor rate”, currently 5.05% — A serviceability buffer of 1.0% may be applied on an exceptions basis for certain customers seeking to refinance their loan, subject to eligibility criteria including LVR, bureau score and repayment amounts — Interest only (I/O) loans: Assessed based on the residual principal and interest (P&I) term using the applicable P&I rate, plus a 3.0% buffer — New fixed rate loans: Assessed on the variable rate to which the loan will revert after the fixed period, plus a buffer Australian mortgage portfolio LVRs Sep-22 balance Mar-23 balance Sep-23 balance Weighted averages2 LVR at origination (%) 73 72 72 Dynamic LVR1 (%) 49 51 50 LVR of new loans3 (%) 70 68 67 Applicant gross income band (2H23 drawdowns, % by approved limits) Westpac Group 2023 Full Year Results Presentation & Investor Discussion Pack AUSTRALIAN MORTGAGE PORTFOLIO LVRS MORTGAGE CREDIT QUALITY 1 Dynamic LVR is the loan-to-value ratio taking into account the current loan balance, changes in security value, offset account balances and other loan adjustments. Property valuation source CoreLogic. 2 Weighted average LVR calculation considers size of outstanding balances. 3 Average LVR of new loans is on rolling 6 months. Charts may not add to 100 due to rounding N/A 1 3 5 8 10 21 42 11 1 3 5 7 15 51 19 <75k 75k to 100k 100k to 125k 125k to 150k 150k to 200k 200k to 500k >500k Owner Occupied Investment Property |
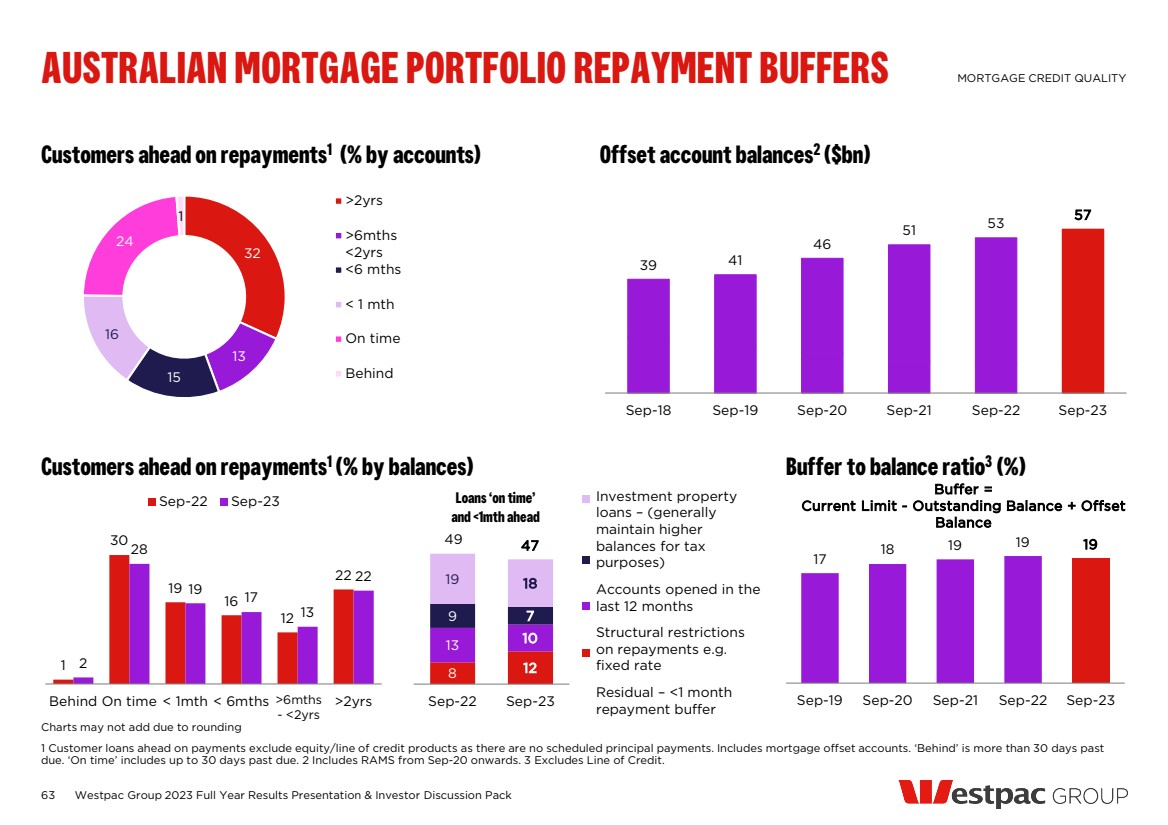
| 1 30 19 16 12 22 2 28 19 17 13 22 Behind On time < 1mth < 6mths >2yrs Sep-22 Sep-23 Loans ‘on time’ and <1mth ahead 63 Offset account balances2 Customers ahead on repayments ($bn) 1 (% by accounts) Customers ahead on repayments1 (% by balances) Buffer to balance ratio3 (%) Westpac Group 2023 Full Year Results Presentation & Investor Discussion Pack AUSTRALIAN MORTGAGE PORTFOLIO REPAYMENT BUFFERS MORTGAGE CREDIT QUALITY 1 Customer loans ahead on payments exclude equity/line of credit products as there are no scheduled principal payments. Includes mortgage offset accounts. ‘Behind’ is more than 30 days past due. ‘On time’ includes up to 30 days past due. 2 Includes RAMS from Sep-20 onwards. 3 Excludes Line of Credit. 8 12 13 10 9 7 19 18 Sep-22 Sep-23 47 49 Investment property loans – (generally maintain higher balances for tax purposes) Accounts opened in the last 12 months Structural restrictions on repayments e.g. fixed rate Residual – <1 month repayment buffer Charts may not add due to rounding Buffer = Current Limit - Outstanding Balance + Offset Balance >6mths - <2yrs 39 41 46 51 53 57 Sep-18 Sep-19 Sep-20 Sep-21 Sep-22 Sep-23 32 13 15 16 24 1 >2yrs >6mths <2yrs <6 mths < 1 mth On time Behind 17 18 19 19 19 Sep-19 Sep-20 Sep-21 Sep-22 Sep-23 |
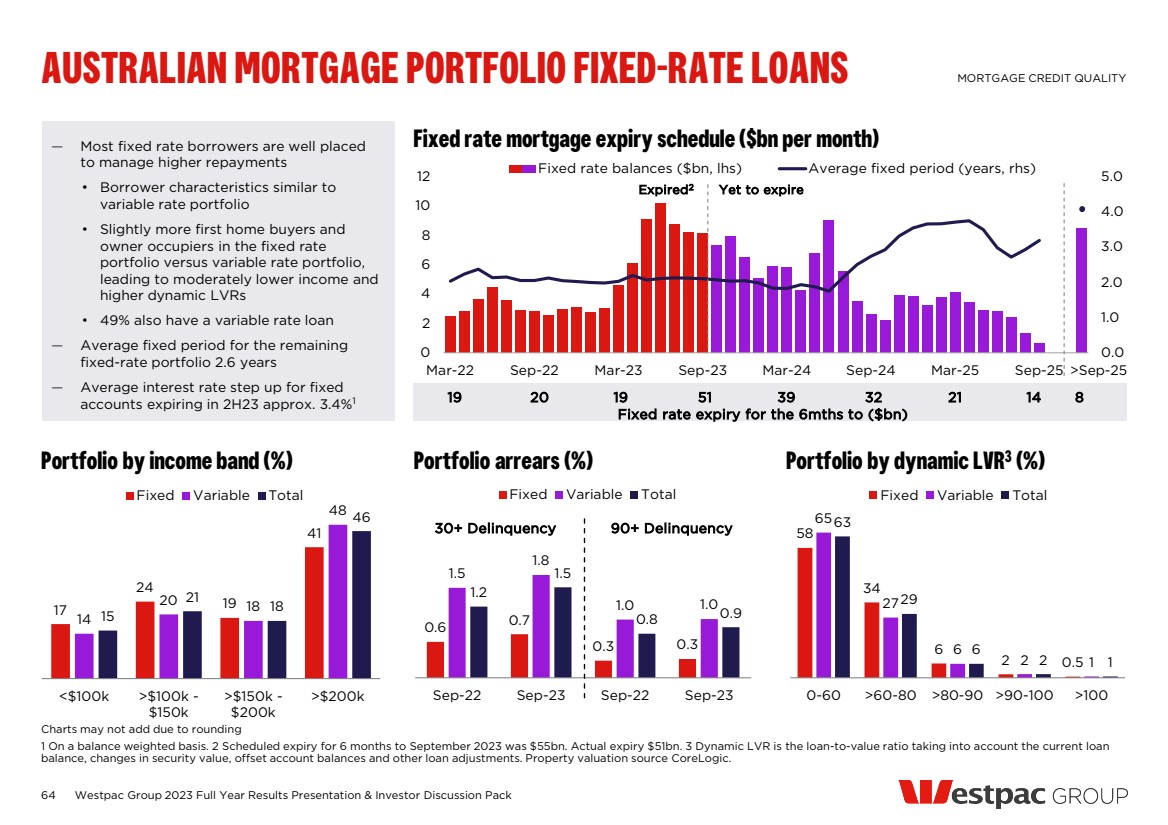
| 0.6 0.7 0.3 0.3 1.5 1.8 1.0 1.0 1.2 1.5 0.8 0.9 Sep-22 Sep-23 Sep-22 Sep-23 Fixed Variable Total 64 — Most fixed rate borrowers are well placed Fixed rate mortgage expiry schedule ($bn per month) to manage higher repayments • Borrower characteristics similar to variable rate portfolio • Slightly more first home buyers and owner occupiers in the fixed rate portfolio versus variable rate portfolio, leading to moderately lower income and higher dynamic LVRs • 49% also have a variable rate loan — Average fixed period for the remaining fixed-rate portfolio 2.6 years — Average interest rate step up for fixed accounts expiring in 2H23 approx. 3.4%1 Portfolio by income band (%) Portfolio arrears (%) Portfolio by dynamic LVR3 (%) Westpac Group 2023 Full Year Results Presentation & Investor Discussion Pack AUSTRALIAN MORTGAGE PORTFOLIO FIXED-RATE LOANS MORTGAGE CREDIT QUALITY 1 On a balance weighted basis. 2 Scheduled expiry for 6 months to September 2023 was $55bn. Actual expiry $51bn. 3 Dynamic LVR is the loan-to-value ratio taking into account the current loan balance, changes in security value, offset account balances and other loan adjustments. Property valuation source CoreLogic. 17 24 19 41 14 20 18 48 15 21 18 46 <$100k >$100k - $150k >$150k - $200k >$200k Fixed Variable Total 58 34 6 2 0.5 65 27 6 2 1 63 29 6 2 1 0-60 >60-80 >80-90 >90-100 >100 Fixed Variable Total 30+ Delinquency 90+ Delinquency 0.0 1.0 2.0 3.0 4.0 5.0 0 2 4 6 8 10 12 Mar-22 Sep-22 Mar-23 Sep-23 Mar-24 Sep-24 Mar-25 Sep-25 Fixed rate balances ($bn, lhs) Average fixed period (years, rhs) >Sep-25 19 20 19 51 39 32 21 14 8 Fixed rate expiry for the 6mths to ($bn) Expired2 Yet to expire Charts may not add due to rounding |
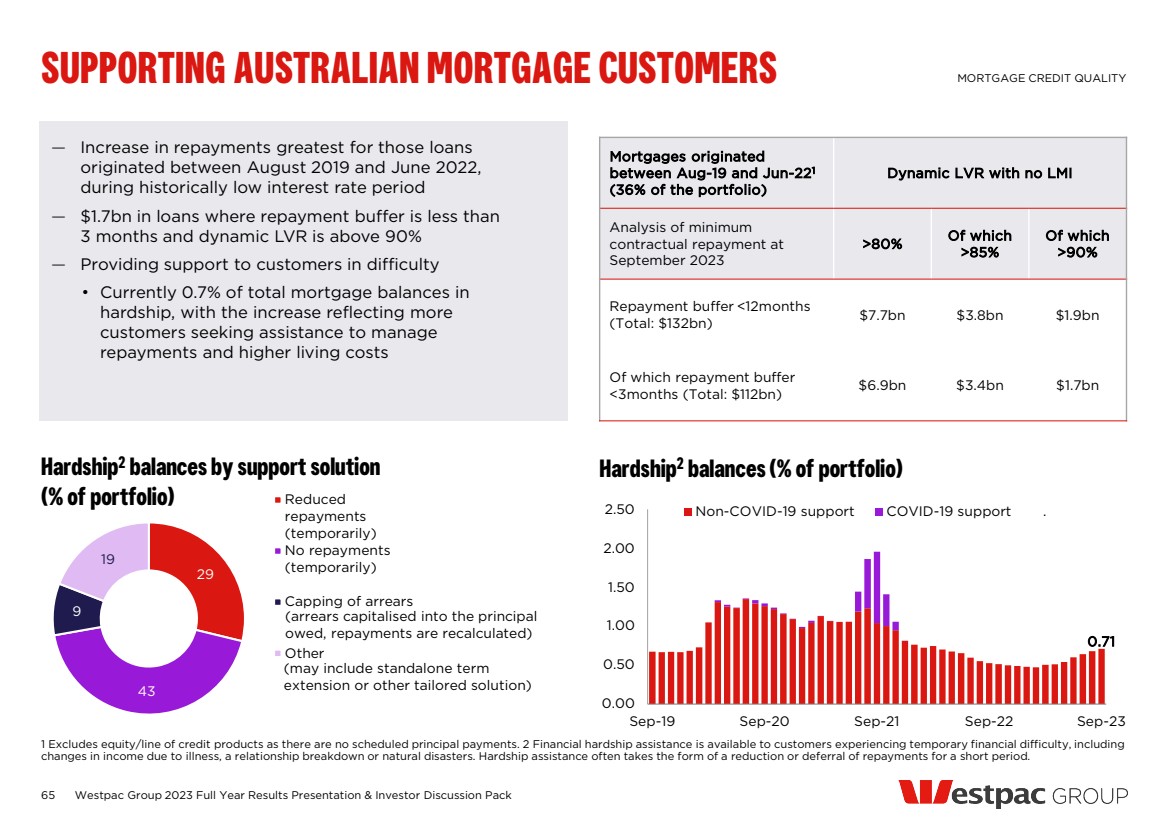
| 65 — Increase in repayments greatest for those loans originated between August 2019 and June 2022, during historically low interest rate period — $1.7bn in loans where repayment buffer is less than 3 months and dynamic LVR is above 90% — Providing support to customers in difficulty • Currently 0.7% of total mortgage balances in hardship, with the increase reflecting more customers seeking assistance to manage repayments and higher living costs Hardship2 balances by support solution (% of portfolio) Hardship2 balances (% of portfolio) Westpac Group 2023 Full Year Results Presentation & Investor Discussion Pack SUPPORTING AUSTRALIAN MORTGAGE CUSTOMERS MORTGAGE CREDIT QUALITY 1 Excludes equity/line of credit products as there are no scheduled principal payments. 2 Financial hardship assistance is available to customers experiencing temporary financial difficulty, including changes in income due to illness, a relationship breakdown or natural disasters. Hardship assistance often takes the form of a reduction or deferral of repayments for a short period. Mortgages originated between Aug-19 and Jun-221 (36% of the portfolio) Dynamic LVR with no LMI Analysis of minimum contractual repayment at September 2023 >80% Of which >85% Of which >90% Repayment buffer <12months (Total: $132bn) $7.7bn $3.8bn $1.9bn Of which repayment buffer <3months (Total: $112bn) $6.9bn $3.4bn $1.7bn 29 43 9 19 Reduced repayments (temporarily) No repayments (temporarily) Capping of arrears Other (arrears capitalised into the principal owed, repayments are recalculated) (may include standalone term extension or other tailored solution) 0.71 0.00 0.50 1.00 1.50 2.00 2.50 Sep-19 Sep-20 Sep-21 Sep-22 Sep-23 Non-COVID-19 support COVID-19 support . |
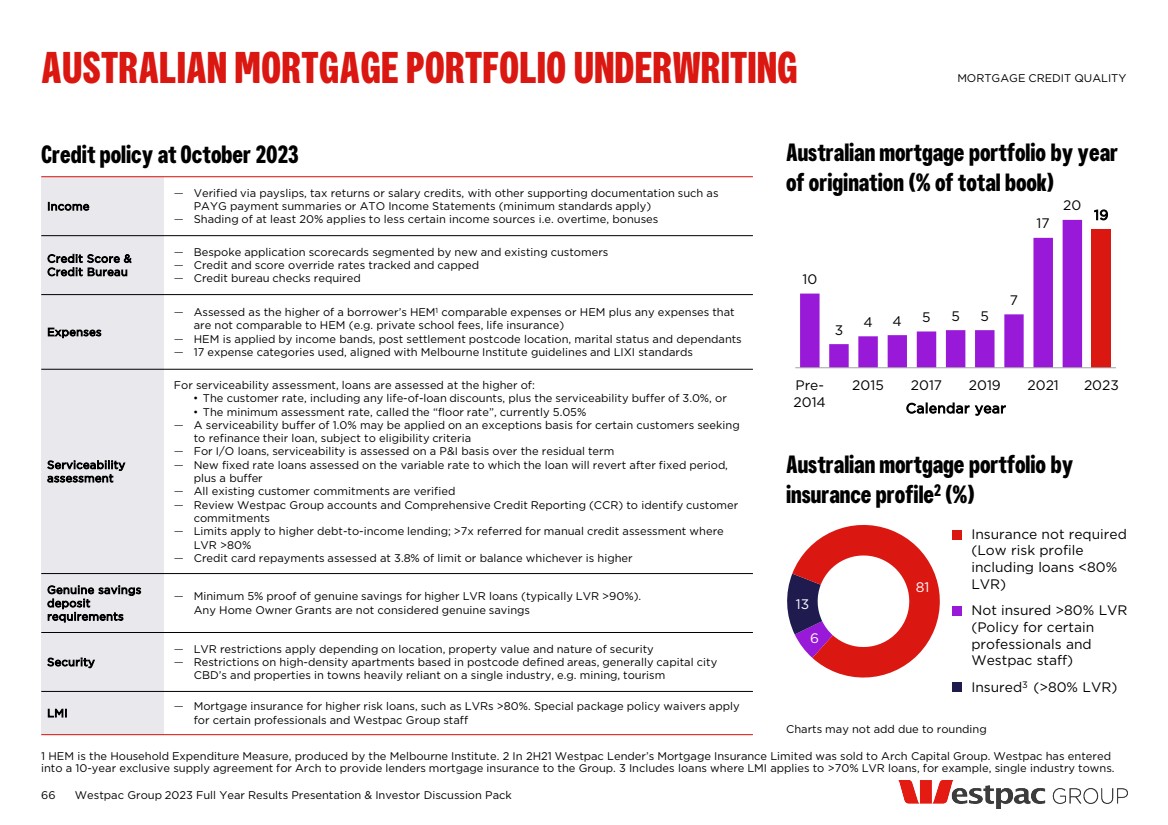
| 6 13 81 66 Australian mortgage portfolio by insurance profile2 (%) Credit policy at October 2023 Australian mortgage portfolio by year of origination (% of total book) Westpac Group 2023 Full Year Results Presentation & Investor Discussion Pack AUSTRALIAN MORTGAGE PORTFOLIO UNDERWRITING MORTGAGE CREDIT QUALITY Calendar year Charts may not add due to rounding Insurance not required (Low risk profile including loans <80% LVR) Not insured >80% LVR (Policy for certain professionals and Westpac staff) Insured3 (>80% LVR) 10 3 4 4 5 5 5 7 17 20 19 Pre-2014 2015 2017 2019 2021 2023 Income — Verified via payslips, tax returns or salary credits, with other supporting documentation such as PAYG payment summaries or ATO Income Statements (minimum standards apply) — Shading of at least 20% applies to less certain income sources i.e. overtime, bonuses Credit Score & Credit Bureau — Bespoke application scorecards segmented by new and existing customers — Credit and score override rates tracked and capped — Credit bureau checks required Expenses — Assessed as the higher of a borrower’s HEM1 comparable expenses or HEM plus any expenses that are not comparable to HEM (e.g. private school fees, life insurance) — HEM is applied by income bands, post settlement postcode location, marital status and dependants — 17 expense categories used, aligned with Melbourne Institute guidelines and LIXI standards Serviceability assessment For serviceability assessment, loans are assessed at the higher of: • The customer rate, including any life-of-loan discounts, plus the serviceability buffer of 3.0%, or • The minimum assessment rate, called the “floor rate”, currently 5.05% — A serviceability buffer of 1.0% may be applied on an exceptions basis for certain customers seeking to refinance their loan, subject to eligibility criteria — For I/O loans, serviceability is assessed on a P&I basis over the residual term — New fixed rate loans assessed on the variable rate to which the loan will revert after fixed period, plus a buffer — All existing customer commitments are verified — Review Westpac Group accounts and Comprehensive Credit Reporting (CCR) to identify customer commitments — Limits apply to higher debt-to-income lending; >7x referred for manual credit assessment where LVR >80% — Credit card repayments assessed at 3.8% of limit or balance whichever is higher Genuine savings deposit requirements — Minimum 5% proof of genuine savings for higher LVR loans (typically LVR >90%). Any Home Owner Grants are not considered genuine savings Security — LVR restrictions apply depending on location, property value and nature of security — Restrictions on high-density apartments based in postcode defined areas, generally capital city CBD’s and properties in towns heavily reliant on a single industry, e.g. mining, tourism LMI — Mortgage insurance for higher risk loans, such as LVRs >80%. Special package policy waivers apply for certain professionals and Westpac Group staff 1 HEM is the Household Expenditure Measure, produced by the Melbourne Institute. 2 In 2H21 Westpac Lender’s Mortgage Insurance Limited was sold to Arch Capital Group. Westpac has entered into a 10-year exclusive supply agreement for Arch to provide lenders mortgage insurance to the Group. 3 Includes loans where LMI applies to >70% LVR loans, for example, single industry towns. |
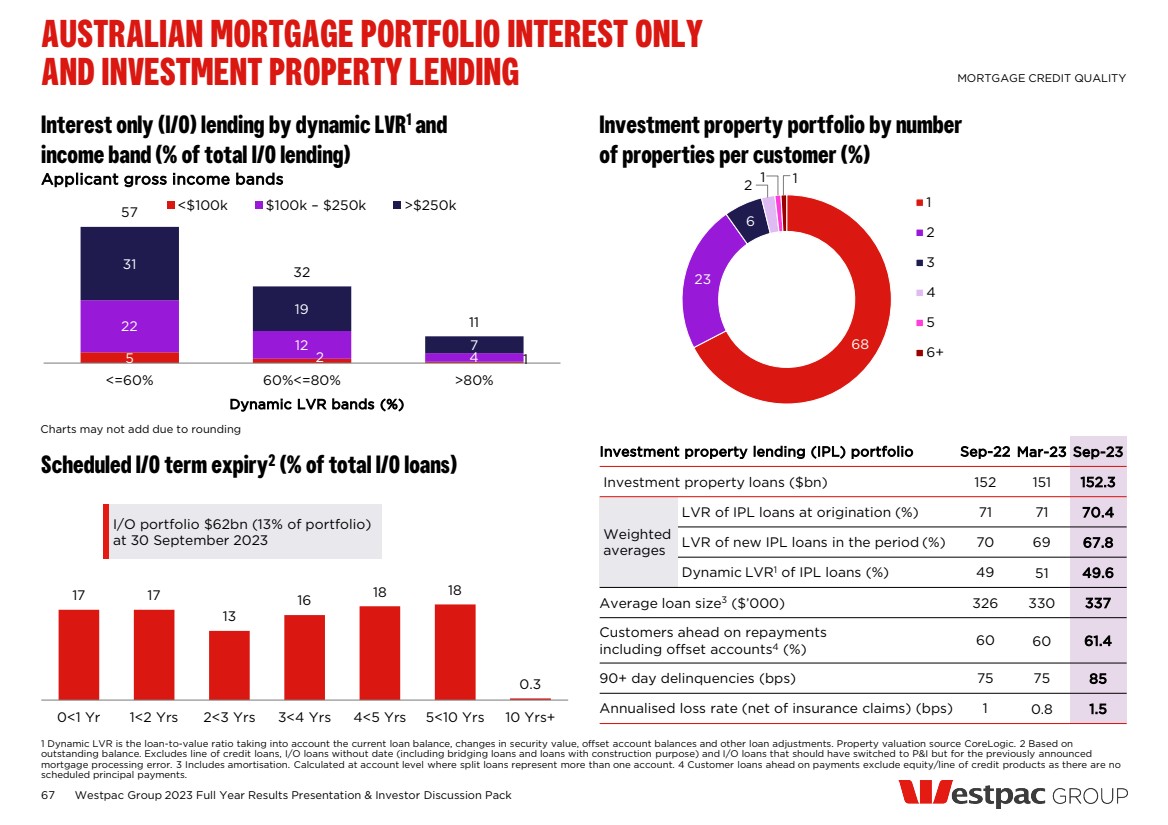
| 68 23 6 1 2 3 4 5 6+ 67 Interest only (I/O) lending by dynamic LVR1 and income band (% of total I/O lending) Investment property portfolio by number of properties per customer (%) Scheduled I/O term expiry2 (% of total I/O loans) Westpac Group 2023 Full Year Results Presentation & Investor Discussion Pack AUSTRALIAN MORTGAGE PORTFOLIO INTEREST ONLY AND INVESTMENT PROPERTY LENDING MORTGAGE CREDIT QUALITY 1 Dynamic LVR is the loan-to-value ratio taking into account the current loan balance, changes in security value, offset account balances and other loan adjustments. Property valuation source CoreLogic. 2 Based on outstanding balance. Excludes line of credit loans, I/O loans without date (including bridging loans and loans with construction purpose) and I/O loans that should have switched to P&I but for the previously announced mortgage processing error. 3 Includes amortisation. Calculated at account level where split loans represent more than one account. 4 Customer loans ahead on payments exclude equity/line of credit products as there are no scheduled principal payments. Charts may not add due to rounding 5 2 1 22 12 4 31 19 7 57 32 11 <=60% 60%<=80% >80% Dynamic LVR bands (%) <$100k $100k – $250k >$250k 17 17 13 16 18 18 0.3 0<1 Yr 1<2 Yrs 2<3 Yrs 3<4 Yrs 4<5 Yrs 5<10 Yrs 10 Yrs+ 1 Investment property lending (IPL) portfolio Sep-22 Mar-23 Sep-23 Investment property loans ($bn) 152 151 152.3 Weighted averages LVR of IPL loans at origination (%) 71 71 70.4 LVR of new IPL loans in the period (%) 70 69 67.8 Dynamic LVR1 of IPL loans (%) 49 51 49.6 Average loan size3 ($’000) 326 330 337 Customers ahead on repayments including offset accounts4 (%) 60 60 61.4 90+ day delinquencies (bps) 75 75 85 Annualised loss rate (net of insurance claims) (bps) 1 0.8 1.5 I/O portfolio $62bn (13% of portfolio) at 30 September 2023 1 Applicant gross income bands 2 |
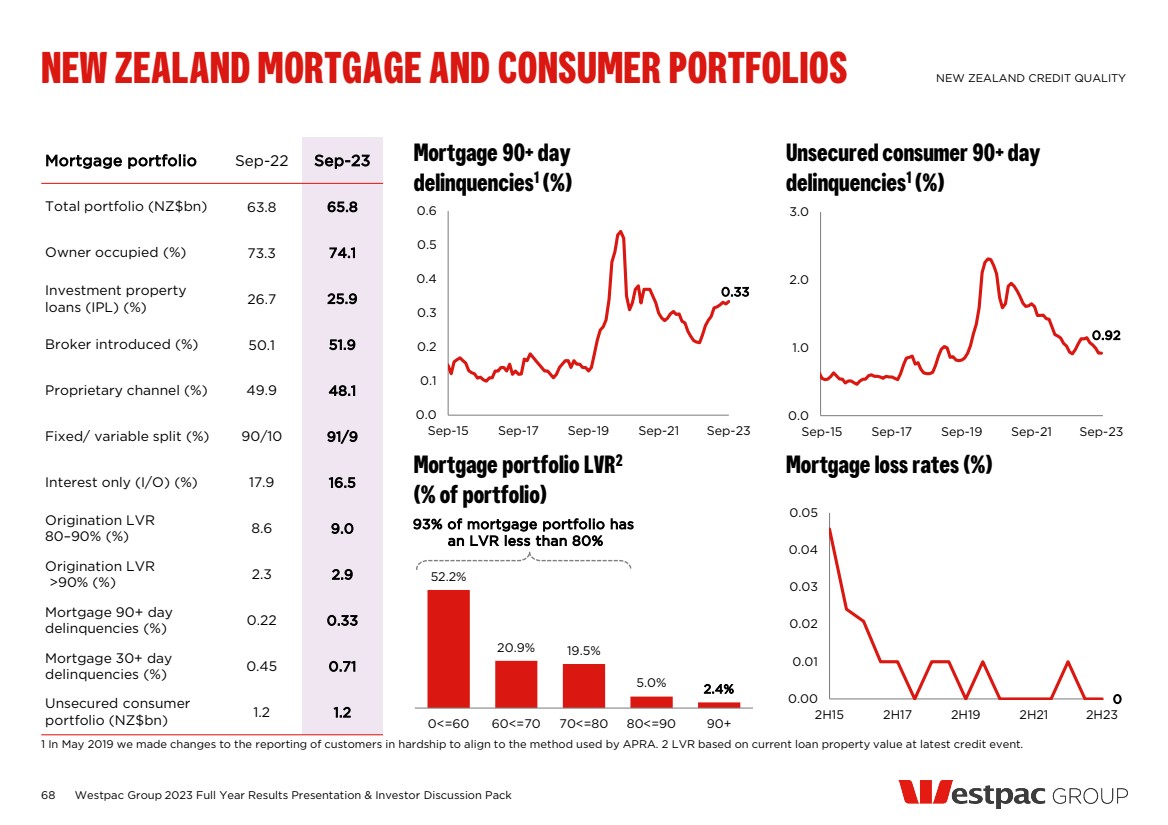
| 68 Mortgage portfolio LVR2 (% of portfolio) Mortgage loss rates (%) Mortgage 90+ day delinquencies1 (%) Unsecured consumer 90+ day delinquencies1 (%) NEW ZEALAND MORTGAGE AND CONSUMER PORTFOLIOS NEW ZEALAND CREDIT QUALITY 1 In May 2019 we made changes to the reporting of customers in hardship to align to the method used by APRA. 2 LVR based on current loan property value at latest credit event. Mortgage portfolio Sep-22 Sep-23 Total portfolio (NZ$bn) 63.8 65.8 Owner occupied (%) 73.3 74.1 Investment property loans (IPL) (%) 26.7 25.9 Broker introduced (%) 50.1 51.9 Proprietary channel (%) 49.9 48.1 Fixed/ variable split (%) 90/10 91/9 Interest only (I/O) (%) 17.9 16.5 Origination LVR 80–90% (%) 8.6 9.0 Origination LVR >90% (%) 2.3 2.9 Mortgage 90+ day delinquencies (%) 0.22 0.33 Mortgage 30+ day delinquencies (%) 0.45 0.71 Unsecured consumer portfolio (NZ$bn) 1.2 1.2 0.00 0 0.01 0.02 0.03 0.04 0.05 2H15 2H17 2H19 2H21 2H23 0.92 0.0 1.0 2.0 3.0 Sep-15 Sep-17 Sep-19 Sep-21 Sep-23 0.33 0.0 0.1 0.2 0.3 0.4 0.5 0.6 Sep-15 Sep-17 Sep-19 Sep-21 Sep-23 52.2% 20.9% 19.5% 5.0% 2.4% 0<=60 60<=70 70<=80 80<=90 90+ 93% of mortgage portfolio has an LVR less than 80% Westpac Group 2023 Full Year Results Presentation & Investor Discussion Pack |
| NON-CREDIT RISK MANAGEMENT 2023 Full year financial results |
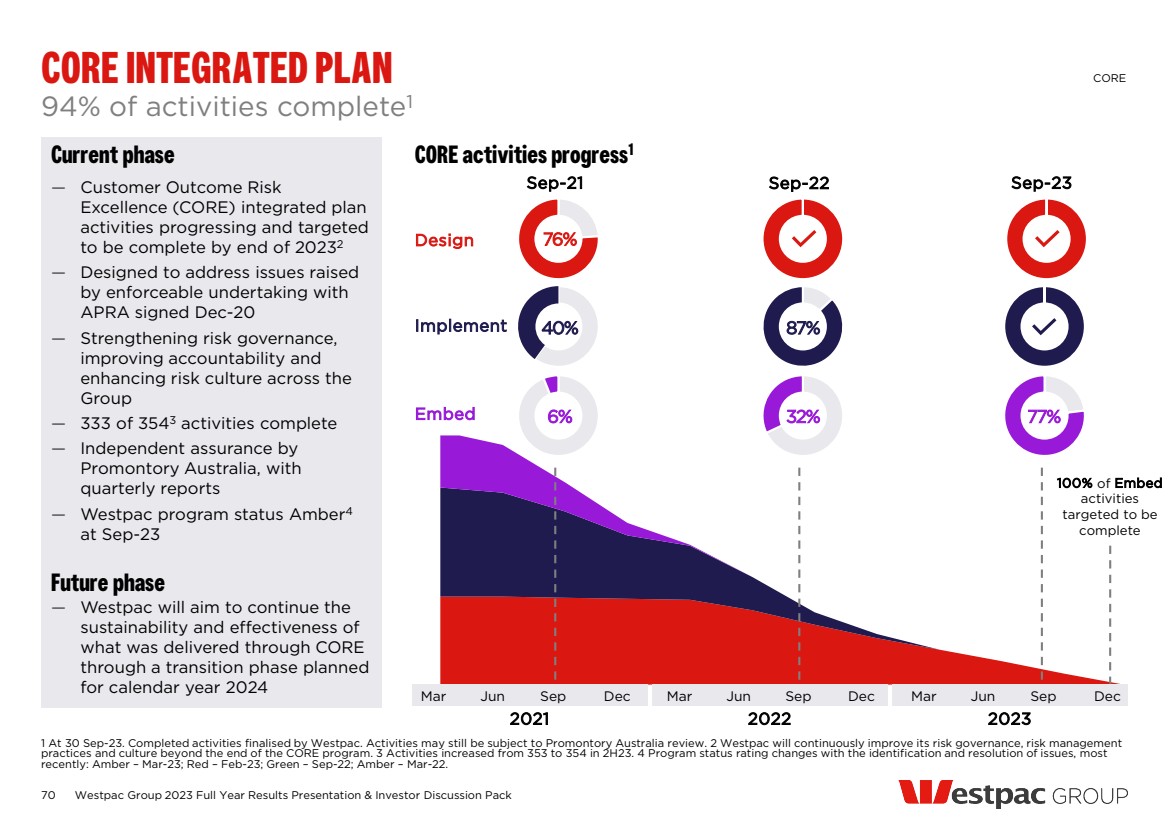
| 70 — Customer Outcome Risk Excellence (CORE) integrated plan activities progressing and targeted to be complete by end of 20232 — Designed to address issues raised by enforceable undertaking with APRA signed Dec-20 — Strengthening risk governance, improving accountability and enhancing risk culture across the Group — 333 of 3543 activities complete — Independent assurance by Promontory Australia, with quarterly reports — Westpac program status Amber4 at Sep-23 CORE activities progress1 Current phase 94% of activities complete1 Westpac Group 2023 Full Year Results Presentation & Investor Discussion Pack CORE INTEGRATED PLAN CORE 1 At 30 Sep-23. Completed activities finalised by Westpac. Activities may still be subject to Promontory Australia review. 2 Westpac will continuously improve its risk governance, risk management practices and culture beyond the end of the CORE program. 3 Activities increased from 353 to 354 in 2H23. 4 Program status rating changes with the identification and resolution of issues, most recently: Amber – Mar-23; Red – Feb-23; Green – Sep-22; Amber – Mar-22. 2021 2022 2023 Mar Jun Sep Dec Mar Jun Sep Dec Mar Jun Sep Dec Sep-23 Design Sep-21 Sep-22 Implement Embed 6% 32% 77% 40% 87% 76% 100% of Embed activities targeted to be complete Future phase — Westpac will aim to continue the sustainability and effectiveness of what was delivered through CORE through a transition phase planned for calendar year 2024 |
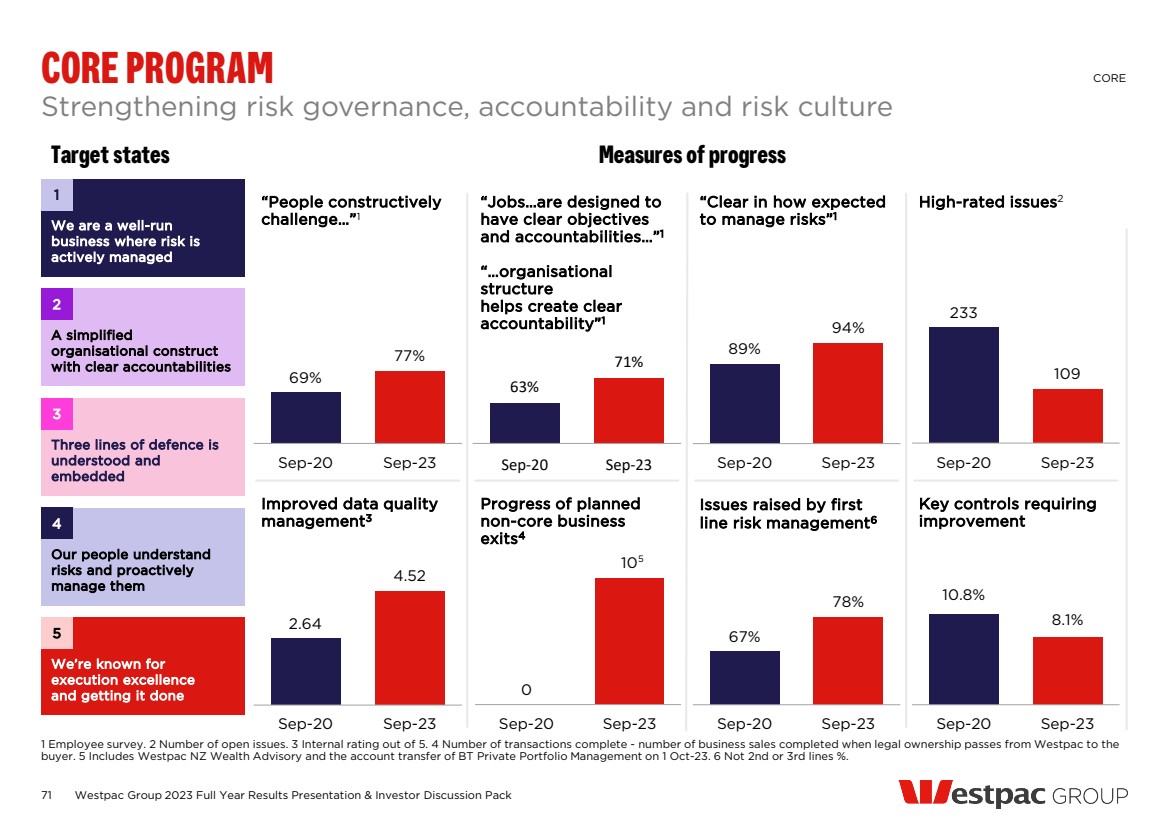
| We are a well-run business where risk is actively managed A simplified organisational construct with clear accountabilities Three lines of defence is understood and embedded Our people understand risks and proactively manage them We’re known for execution excellence and getting it done 71 Target states Measures of progress Strengthening risk governance, accountability and risk culture Westpac Group 2023 Full Year Results Presentation & Investor Discussion Pack CORE PROGRAM CORE 1 Employee survey. 2 Number of open issues. 3 Internal rating out of 5. 4 Number of transactions complete - number of business sales completed when legal ownership passes from Westpac to the buyer. 5 Includes Westpac NZ Wealth Advisory and the account transfer of BT Private Portfolio Management on 1 Oct-23. 6 Not 2nd or 3rd lines %. 67% 78% Sep-20 Sep-23 Issues raised by first line risk management6 233 109 Sep-20 Sep-23 High-rated issues2 2.64 4.52 Sep-20 Sep-23 Improved data quality management3 89% 94% Sep-20 Sep-23 “Clear in how expected to manage risks”1 69% 77% Sep-20 Sep-23 “People constructively challenge…”1 10.8% 8.1% Sep-20 Sep-23 Key controls requiring improvement 63% 71% Sep-20 Sep-23 “Jobs…are designed to have clear objectives and accountabilities…”1 “…organisational structure helps create clear accountability”1 0 10 Sep-20 Sep-23 Progress of planned non-core business exits4 1 2 3 4 5 5 |
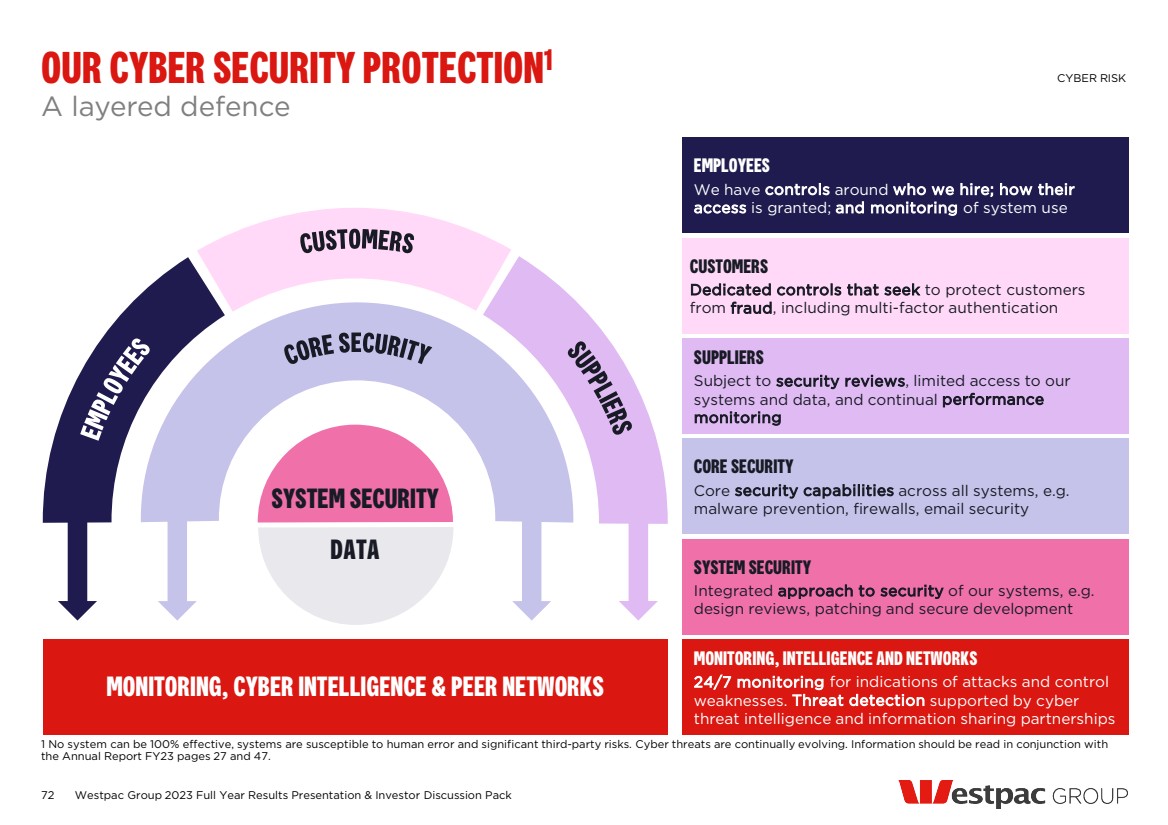
| OUR CYBER SECURITY PROTECTION1 A layered defence CYBER RISK 1 No system can be 100% effective, systems are susceptible to human error and significant third-party risks. Cyber threats are continually evolving. Information should be read in conjunction with the Annual Report FY23 pages 27 and 47. EMPLOYEES We have controls around who we hire; how their access is granted; and monitoring of system use SUPPLIERS Subject to security reviews, limited access to our systems and data, and continual performance monitoring SYSTEM SECURITY Integrated approach to security of our systems, e.g. design reviews, patching and secure development CUSTOMERS Dedicated controls that seek to protect customers from fraud, including multi-factor authentication CORE SECURITY Core security capabilities across all systems, e.g. malware prevention, firewalls, email security MONITORING, INTELLIGENCE AND NETWORKS 24/7 monitoring for indications of attacks and control weaknesses. Threat detection supported by cyber threat intelligence and information sharing partnerships MONITORING, CYBER INTELLIGENCE & PEER NETWORKS SYSTEM SECURITY DATA 72 Westpac Group 2023 Full Year Results Presentation & Investor Discussion Pack |
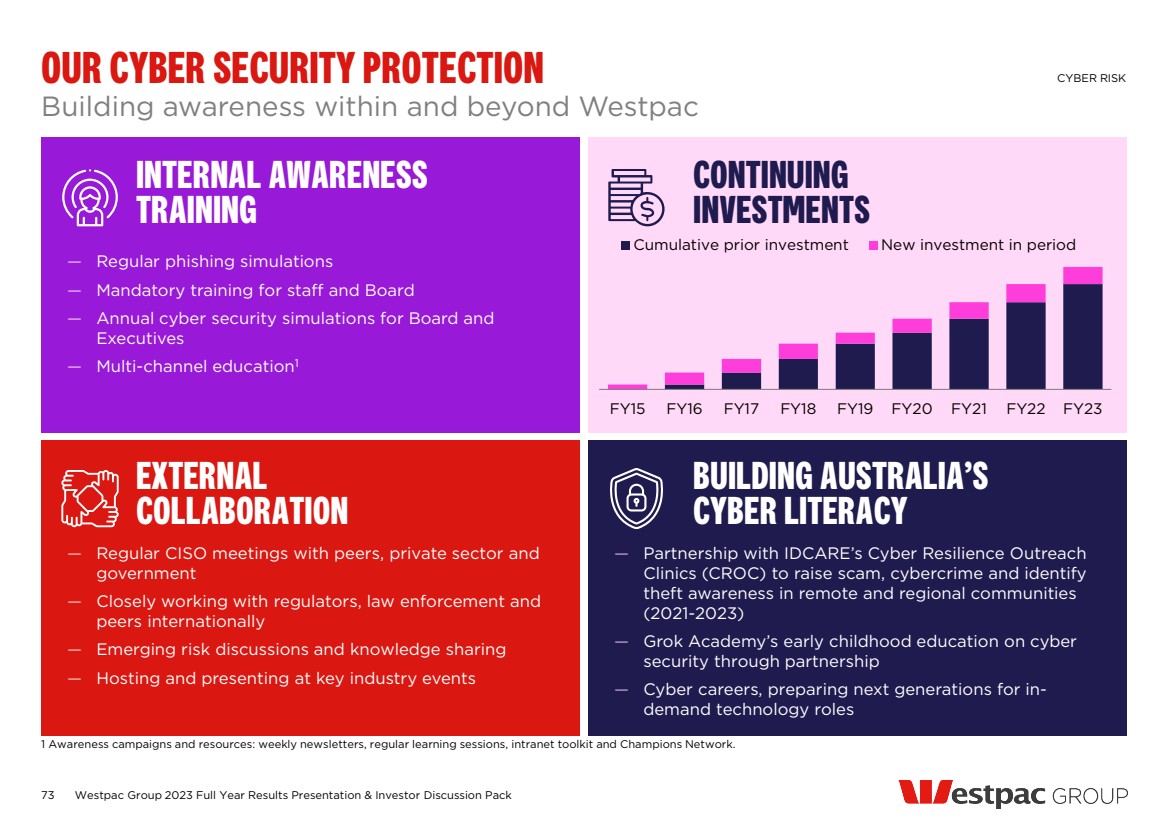
| OUR CYBER SECURITY PROTECTION Building awareness within and beyond Westpac CYBER RISK 1 Awareness campaigns and resources: weekly newsletters, regular learning sessions, intranet toolkit and Champions Network. BUILDING AUSTRALIA’S CYBER LITERACY EXTERNAL COLLABORATION — Regular CISO meetings with peers, private sector and government — Closely working with regulators, law enforcement and peers internationally — Emerging risk discussions and knowledge sharing — Hosting and presenting at key industry events — Partnership with IDCARE’s Cyber Resilience Outreach Clinics (CROC) to raise scam, cybercrime and identify theft awareness in remote and regional communities (2021-2023) — Grok Academy’s early childhood education on cyber security through partnership — Cyber careers, preparing next generations for in-demand technology roles CONTINUING INVESTMENTS INTERNAL AWARENESS TRAINING — Regular phishing simulations — Mandatory training for staff and Board — Annual cyber security simulations for Board and Executives — Multi-channel education1 FY15 FY16 FY17 FY18 FY19 FY20 FY21 FY22 FY23 Cumulative prior investment New investment in period 73 Westpac Group 2023 Full Year Results Presentation & Investor Discussion Pack |
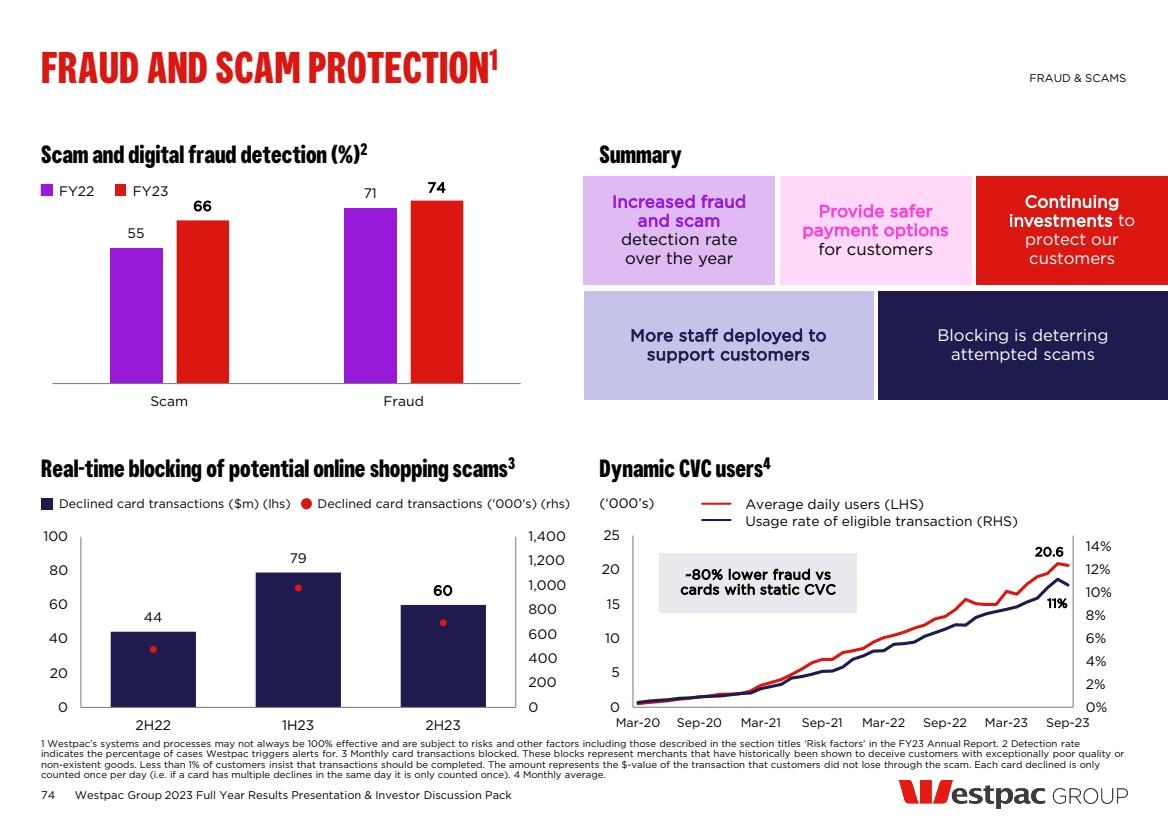
| More staff deployed to support customers Blocking is deterring attempted scams Increased fraud and scam detection rate over the year Provide safer payment options for customers Continuing investments to protect our customers 74 Scam and digital fraud detection (%)2 55 71 66 74 Scam Fraud Summary Real-time blocking of potential online shopping scams3 44 79 60 0 200 400 600 800 1,000 1,200 1,400 0 20 40 60 80 100 2H22 1H23 2H23 Dynamic CVC users4 20.6 11% 0% 2% 4% 6% 8% 10% 12% 14% 0 5 10 15 20 25 Mar-20 Sep-20 Mar-21 Sep-21 Mar-22 Sep-22 Mar-23 Sep-23 Westpac Group 2023 Full Year Results Presentation & Investor Discussion Pack FRAUD AND SCAM PROTECTION1 FRAUD & SCAMS 1 Westpac’s systems and processes may not always be 100% effective and are subject to risks and other factors including those described in the section titles ‘Risk factors’ in the FY23 Annual Report. 2 Detection rate indicates the percentage of cases Westpac triggers alerts for. 3 Monthly card transactions blocked. These blocks represent merchants that have historically been shown to deceive customers with exceptionally poor quality or non-existent goods. Less than 1% of customers insist that transactions should be completed. The amount represents the $-value of the transaction that customers did not lose through the scam. Each card declined is only counted once per day (i.e. if a card has multiple declines in the same day it is only counted once). 4 Monthly average. ~80% lower fraud vs cards with static CVC Declined card transactions ($m) (lhs) Declined card transactions ('000's) (rhs) (‘000’s) Average daily users (LHS) Usage rate of eligible transaction (RHS) FY22 FY23 |
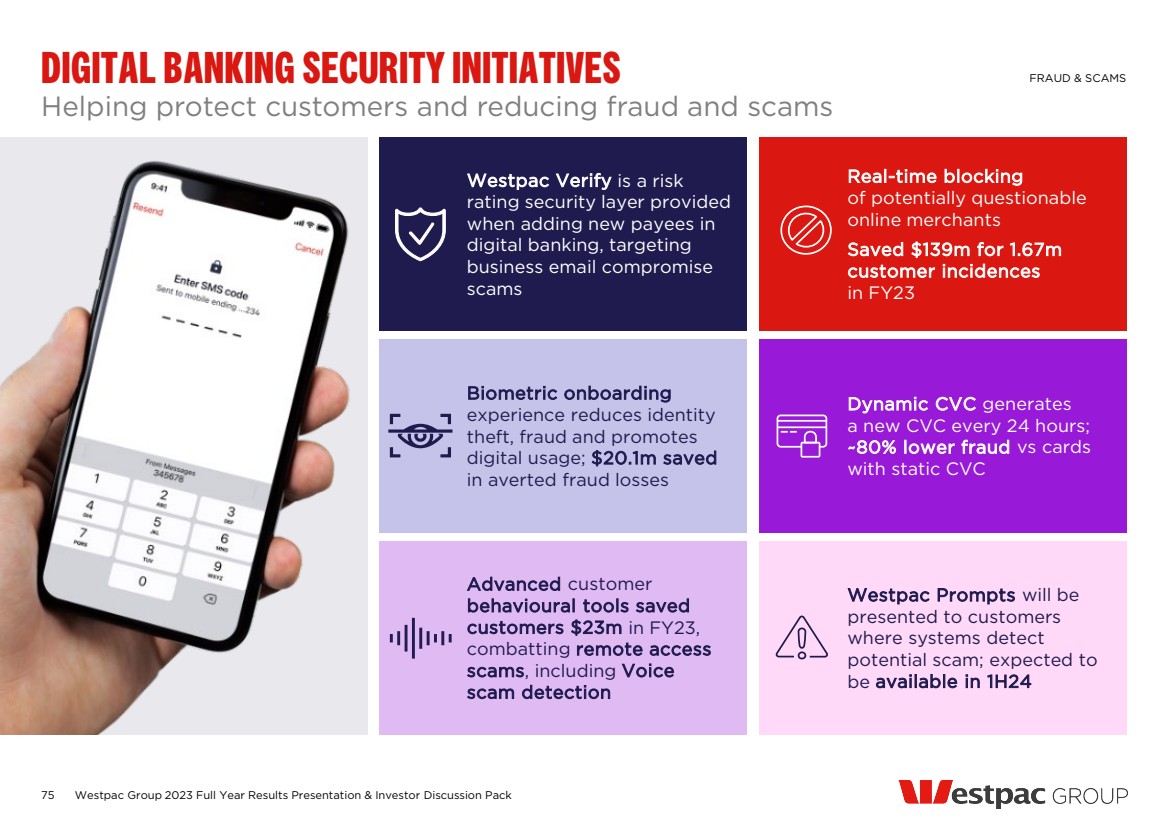
| DIGITAL BANKING SECURITY INITIATIVES 75 Helping protect customers and reducing fraud and scams Westpac Group 2023 Full Year Results Presentation & Investor Discussion Pack FRAUD & SCAMS Westpac Verify is a risk rating security layer provided when adding new payees in digital banking, targeting business email compromise scams Dynamic CVC generates a new CVC every 24 hours; ~80% lower fraud vs cards with static CVC Westpac Prompts will be presented to customers where systems detect potential scam; expected to be available in 1H24 Real-time blocking of potentially questionable online merchants Saved $139m for 1.67m customer incidences in FY23 Biometric onboarding experience reduces identity theft, fraud and promotes digital usage; $20.1m saved in averted fraud losses Advanced customer behavioural tools saved customers $23m in FY23, combatting remote access scams, including Voice scam detection |
| CAPITAL, FUNDING AND LIQUIDITY 2023 Full year financial results |
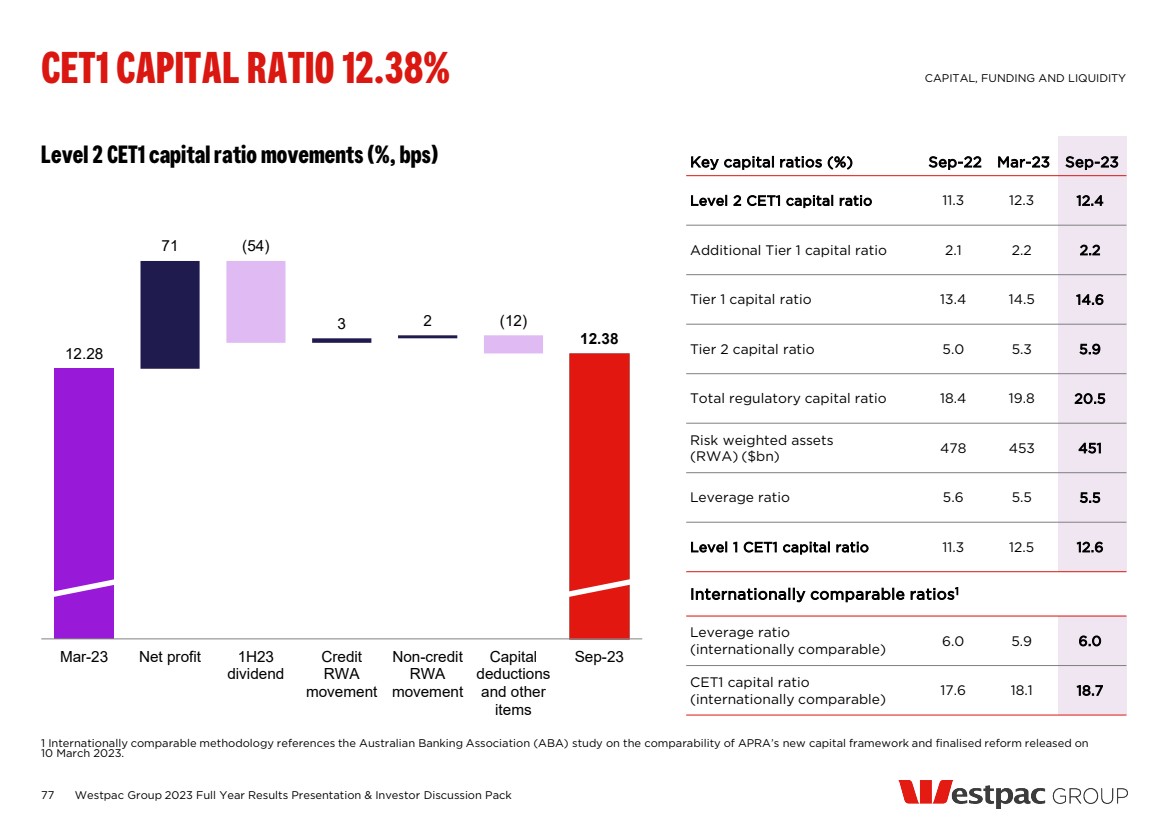
| 77 12.28 71 3 2 12.38 (54) (12) Mar-23 Net profit 1H23 dividend Credit RWA movement Non-credit RWA movement Capital deductions and other items Sep-23 Level 2 CET1 capital ratio movements (%, bps) CET1 CAPITAL RATIO 12.38% CAPITAL, FUNDING AND LIQUIDITY 1 Internationally comparable methodology references the Australian Banking Association (ABA) study on the comparability of APRA’s new capital framework and finalised reform released on 10 March 2023. Key capital ratios (%) Sep-22 Mar-23 Sep-23 Level 2 CET1 capital ratio 11.3 12.3 12.4 Additional Tier 1 capital ratio 2.1 2.2 2.2 Tier 1 capital ratio 13.4 14.5 14.6 Tier 2 capital ratio 5.0 5.3 5.9 Total regulatory capital ratio 18.4 19.8 20.5 Risk weighted assets (RWA) ($bn) 478 453 451 Leverage ratio 5.6 5.5 5.5 Level 1 CET1 capital ratio 11.3 12.5 12.6 Internationally comparable ratios1 Leverage ratio (internationally comparable) 6.0 5.9 6.0 CET1 capital ratio (internationally comparable) 17.6 18.1 18.7 Westpac Group 2023 Full Year Results Presentation & Investor Discussion Pack |
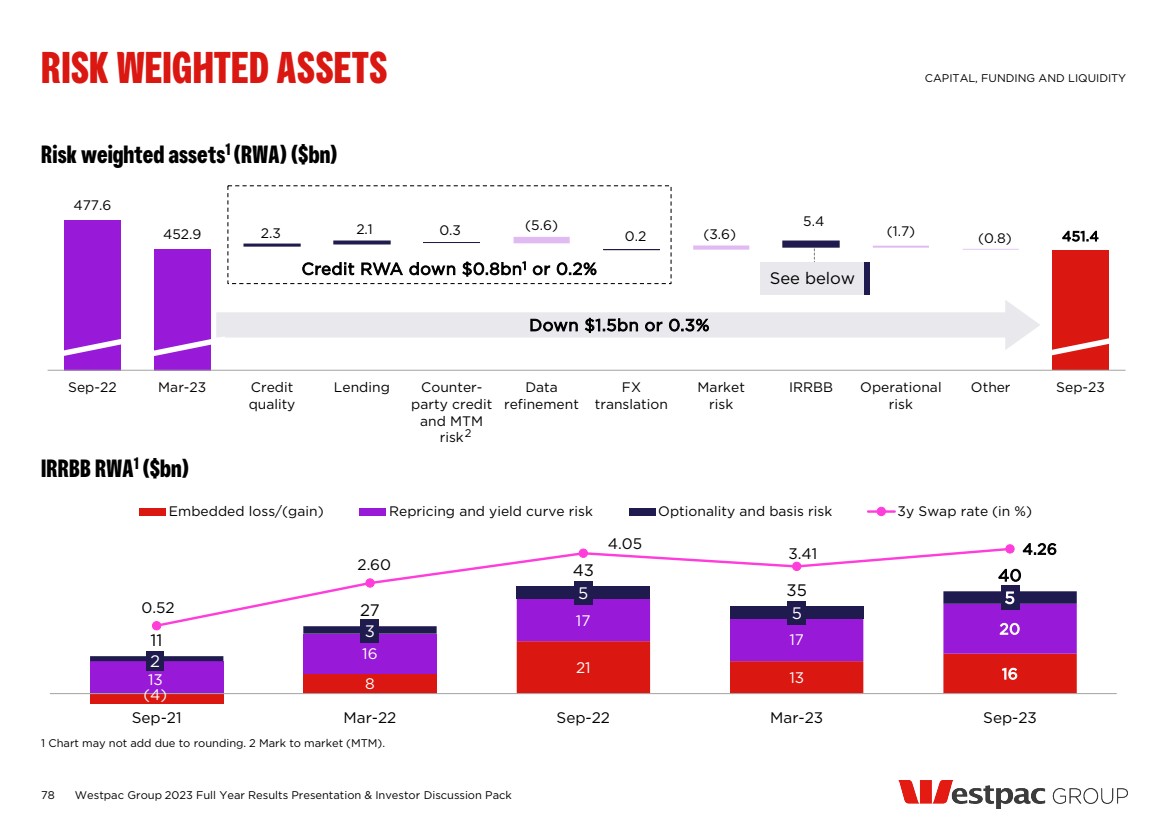
| Risk weighted assets1 (RWA) ($bn) 78 IRRBB RWA1 ($bn) RISK WEIGHTED ASSETS CAPITAL, FUNDING AND LIQUIDITY 1 Chart may not add due to rounding. 2 Mark to market (MTM). 2 2.3 2.1 0.3 0.2 (5.6) 5.4 (3.6) (1.7) (0.8) 477.6 452.9 451.4 Sep-22 Mar-23 Credit quality Lending Counter-party credit and MTM risk Data refinement FX translation Market risk IRRBB Operational risk Other Sep-23 (4) 8 21 13 16 13 16 17 17 20 2 3 5 5 5 11 27 43 35 40 0.52 2.60 4.05 3.41 4.26 -4 -3 -2 -1 0 1 2 3 4 -10 0 10 20 30 40 50 60 Sep-21 Mar-22 Sep-22 Mar-23 Sep-23 Embedded loss/(gain) Repricing and yield curve risk Optionality and basis risk 3y Swap rate (in %) Westpac Group 2023 Full Year Results Presentation & Investor Discussion Pack Down $1.5bn or 0.3% Credit RWA down $0.8bn1 or 0.2% See below |
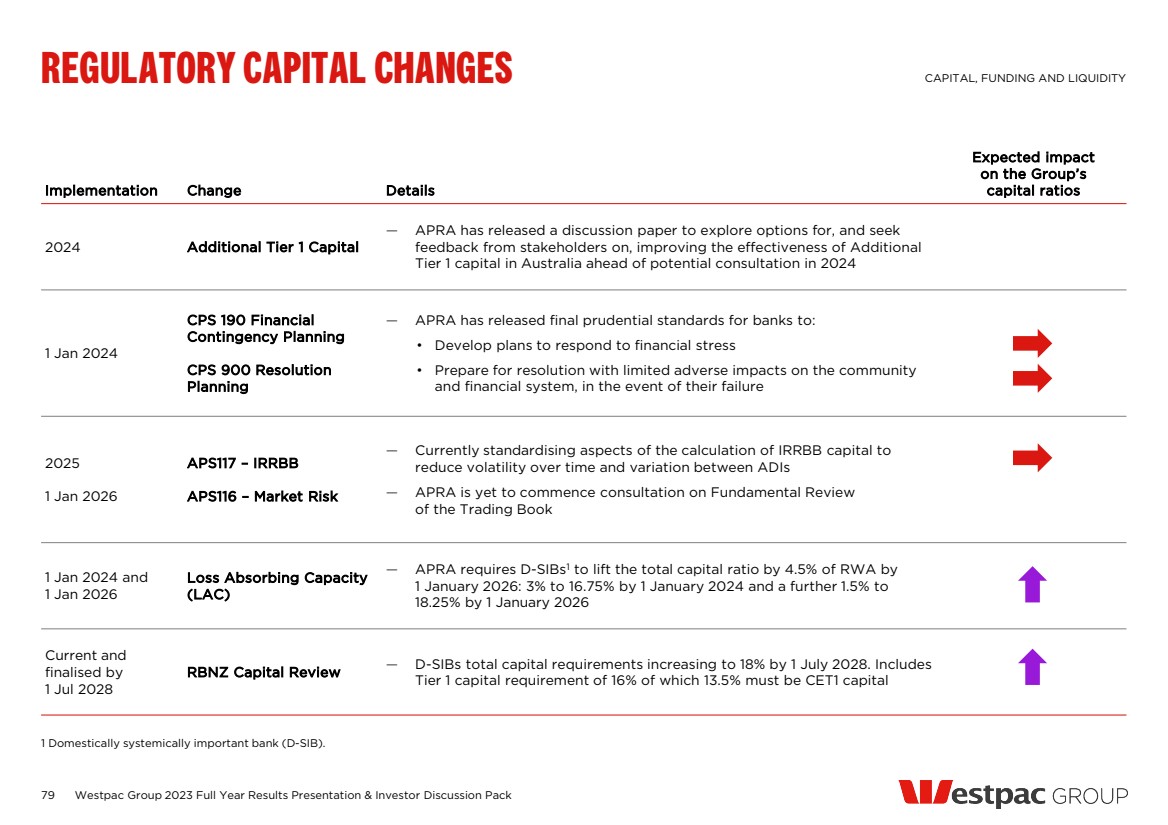
| Implementation Change Details Expected impact on the Group’s capital ratios 2024 Additional Tier 1 Capital — APRA has released a discussion paper to explore options for, and seek feedback from stakeholders on, improving the effectiveness of Additional Tier 1 capital in Australia ahead of potential consultation in 2024 1 Jan 2024 CPS 190 Financial Contingency Planning CPS 900 Resolution Planning — APRA has released final prudential standards for banks to: • Develop plans to respond to financial stress • Prepare for resolution with limited adverse impacts on the community and financial system, in the event of their failure 2025 1 Jan 2026 APS117 – IRRBB APS116 – Market Risk — Currently standardising aspects of the calculation of IRRBB capital to reduce volatility over time and variation between ADIs — APRA is yet to commence consultation on Fundamental Review of the Trading Book 1 Jan 2024 and 1 Jan 2026 Loss Absorbing Capacity (LAC) — APRA requires D-SIBs1 to lift the total capital ratio by 4.5% of RWA by 1 January 2026: 3% to 16.75% by 1 January 2024 and a further 1.5% to 18.25% by 1 January 2026 Current and finalised by 1 Jul 2028 RBNZ Capital Review — D-SIBs total capital requirements increasing to 18% by 1 July 2028. Includes Tier 1 capital requirement of 16% of which 13.5% must be CET1 capital 79 REGULATORY CAPITAL CHANGES CAPITAL, FUNDING AND LIQUIDITY 1 Domestically systemically important bank (D-SIB). Westpac Group 2023 Full Year Results Presentation & Investor Discussion Pack |
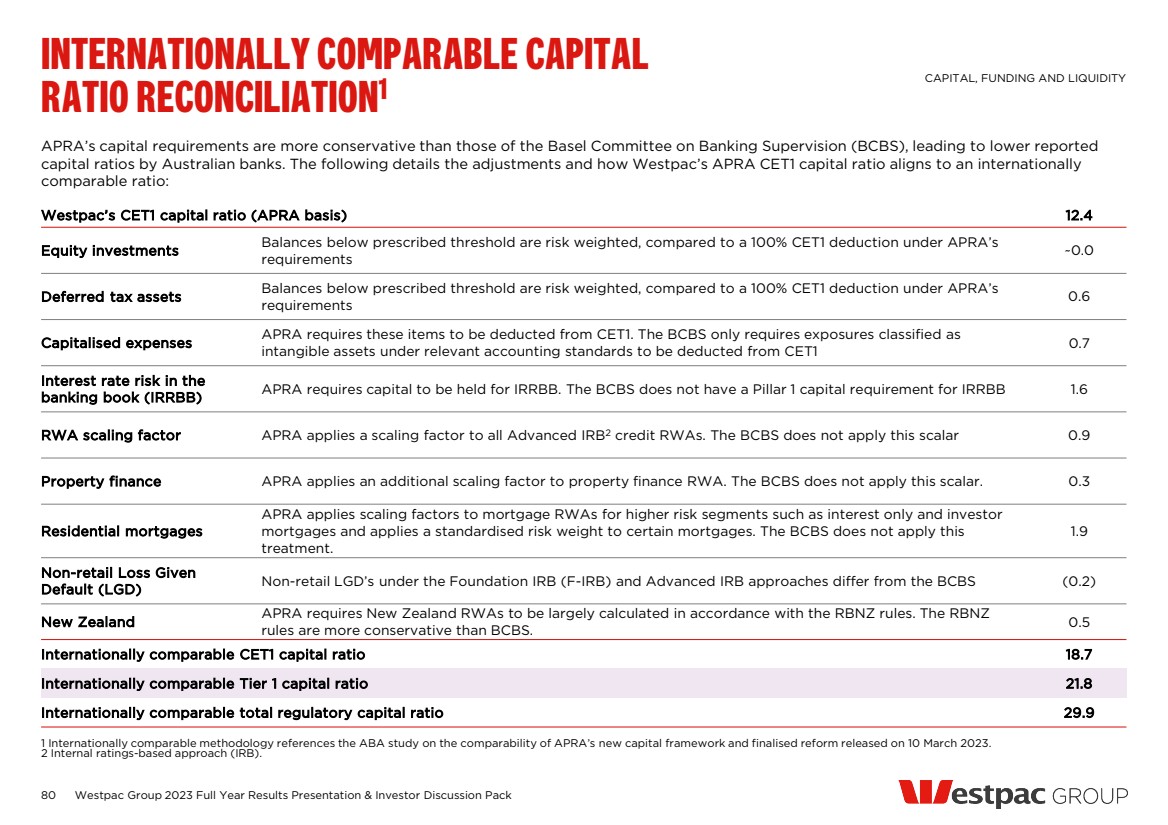
| APRA’s capital requirements are more conservative than those of the Basel Committee on Banking Supervision (BCBS), leading to lower reported capital ratios by Australian banks. The following details the adjustments and how Westpac’s APRA CET1 capital ratio aligns to an internationally comparable ratio: 80 INTERNATIONALLY COMPARABLE CAPITAL RATIO RECONCILIATION1 CAPITAL, FUNDING AND LIQUIDITY 1 Internationally comparable methodology references the ABA study on the comparability of APRA’s new capital framework and finalised reform released on 10 March 2023. 2 Internal ratings-based approach (IRB). Westpac’s CET1 capital ratio (APRA basis) 12.4 Equity investments Balances below prescribed threshold are risk weighted, compared to a 100% CET1 deduction under APRA’s requirements ~0.0 Deferred tax assets Balances below prescribed threshold are risk weighted, compared to a 100% CET1 deduction under APRA’s requirements 0.6 Capitalised expenses APRA requires these items to be deducted from CET1. The BCBS only requires exposures classified as intangible assets under relevant accounting standards to be deducted from CET1 0.7 Interest rate risk in the banking book (IRRBB) APRA requires capital to be held for IRRBB. The BCBS does not have a Pillar 1 capital requirement for IRRBB 1.6 RWA scaling factor APRA applies a scaling factor to all Advanced IRB2 credit RWAs. The BCBS does not apply this scalar 0.9 Property finance APRA applies an additional scaling factor to property finance RWA. The BCBS does not apply this scalar. 0.3 Residential mortgages APRA applies scaling factors to mortgage RWAs for higher risk segments such as interest only and investor mortgages and applies a standardised risk weight to certain mortgages. The BCBS does not apply this treatment. 1.9 Non-retail Loss Given Default (LGD) Non-retail LGD’s under the Foundation IRB (F-IRB) and Advanced IRB approaches differ from the BCBS (0.2) New Zealand APRA requires New Zealand RWAs to be largely calculated in accordance with the RBNZ rules. The RBNZ rules are more conservative than BCBS. 0.5 Internationally comparable CET1 capital ratio 18.7 Internationally comparable Tier 1 capital ratio 21.8 Internationally comparable total regulatory capital ratio 29.9 Westpac Group 2023 Full Year Results Presentation & Investor Discussion Pack |
| Common equity Tier 1 ratio1 (%) 0% 5% 10% 15% 20% 81 Leverage ratio (%) 0% 2% 4% 6% 8% Westpac Group 2023 Full Year Results Presentation & Investor Discussion Pack WELL PLACED ON INTERNATIONALLY COMPARABLE CAPITAL, FUNDING AND LIQUIDITY 1 Comparison group comprises listed commercial banks with assets in excess of A$700bn and which have disclosed fully implemented Basel III ratios or provided enough to estimate. Based on company reports/presentations. Ratios are at 30 June 2023, except for Bank of Montreal, Toronto Dominion Bank, Royal Bank of Canada, CIBC and Scotiabank which are at 31 July 2023, and Westpac which is at 30 September 2023. Where accrued expected dividends have been deducted and disclosed, these have been added back for comparability. US banks are excluded from leverage ratio analysis due to business model differences, for example from loans sold to US Government sponsored enterprises. NAB has not disclosed an internationally comparable leverage ratio since September 2017 and has therefore been excluded. CBA ANZ Danske Bank Westpac, 18.7% Unicredit NAB Nordea Rabobank Morgan Stanley ING Group BPCE Toronto Dominion Bank HSBC Lloyds UBS Commerzbank Goldman Sachs Norinchukin Bank Sumitomo Mitsui Standard Chartered Royal Bank of Canada BNP Paribas Barclays NatWest Deutsche Bank JPMorgan Chase Intesa Sanpaolo Citigroup Societe Generale ICBC China Merchants Bank BBVA China Construction Bank Scotiabank Santander Bank of Montreal CIBC Wells Fargo Mizuho FG Credit Agricola SA Bank of America Bank of China Mitsubishi UFJ Agricultural Bank of China ICBC China Merchants Bank Norinchukin Bank Bank of China China Construction Bank Rabobank Agricultural Bank of China BBVA Unicredit Westpac, 6.0% HSBC ANZ Lloyds Intesa Sanpaolo CBA UBS NatWest Danske Bank Barclays Sumitomo Mitsui Mitsubishi UFJ ING Group BPCE Nordea Commerzbank Santander Standard Chartered Deutsche Bank BNP Paribas Toronto Dominion Bank Mizuho FG Societe Generale Bank of Montreal Royal Bank of Canada CIBC Credit Agricola SA Scotiabank |
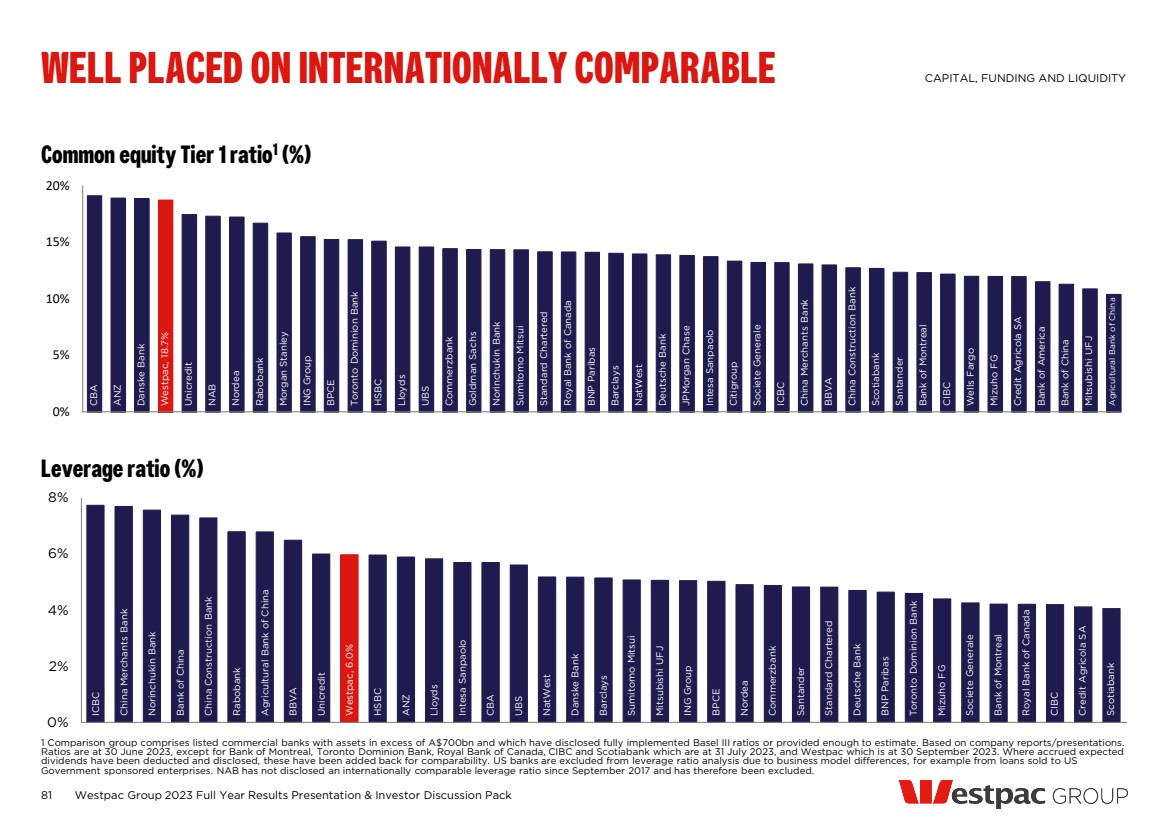
| 64 19 2 6 4 32 USD AUD Domestic AUD EMTN EUR NZD JPY SGD 79 21 Callable Bullet 82 Tier 2 profile1,3 Loss-absorbing capacity (LAC) (notional amount, A$bn) — Australian D-SIBs are required to increase Total Capital to meet APRA’s LAC requirements — This is expected to be met through Tier 2 Capital — Westpac is well placed to meet future APRA requirements for LAC Tier 2 capital (%) Westpac Group 2023 Full Year Results Presentation & Investor Discussion Pack LOSS-ABSORBING CAPACITY AND TIER 2 CAPITAL 1 Includes Westpac New Zealand Limited (WNZL). WNZL Tier 2 does not count for APRA LAC requirements. 2 Represents A$ equivalent notional amount using spot FX translation at date of issue for issuance and spot FX translation at 30-Sep-23 for maturities. Securities in callable format profiled to first call date. Securities in bullet format profiled to maturity date. 3 Any early redemption would be subject to prior written approval from APRA, which may or may not be provided. Tier 2 and LAC requirements (%) $bn @ 5.0% by 1 Jan 24 @ 6.5% by 1 Jan 26 Group RWA (at Sep-23) 451 451 Tier 2 requirement 22.6 29.3 Existing Tier 2 (Sep-23) 26.4 26.4 Current shortfall (excluding redemptions3) 0 2.9 By format 1,3 (notional amount) By currency1,3 (notional amount) 5.9 2.0 2.0 3.0 4.5 5.0 6.5 Westpac September 2023 January 2024 Requirements January 2026 Requirements Tier 2 LAC 4.2 2.2 6.2 5.2 2.9 1.4 2.3 3.3 3.1 1.8 13.9 0.5 0.6 0.6 0.6 FY19 FY20 FY21 FY22 FY23 FY24 FY25 FY26 FY27 FY28 >FY28 Westpac Banking Corporation (WBC) Westpac New Zealand Limited (WNZL) CAPITAL, FUNDING AND LIQUIDITY FY24 WBC issuance expected to be approx. $4-5 billion subject to market conditions WBC WNZL 2 2 Issuance First optional redemption date3/Maturities |
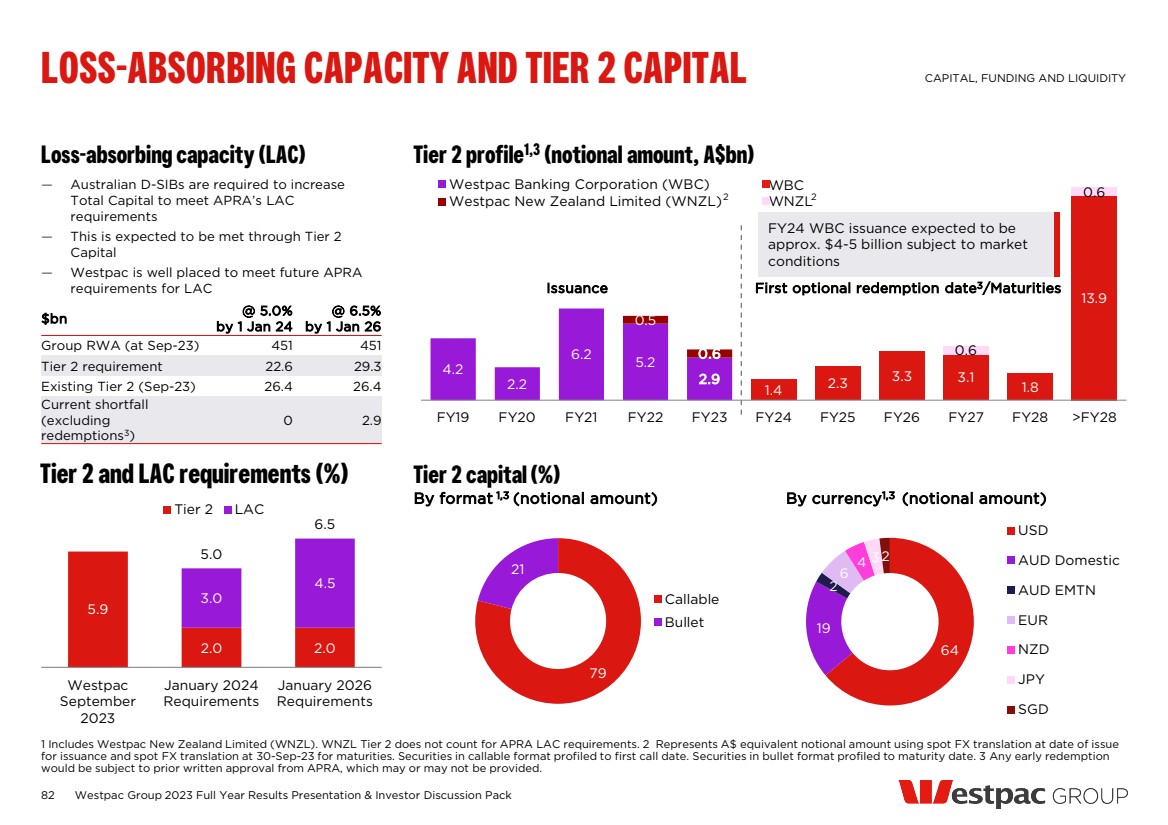
| 65 65 66 7 7 8 1 0.4 0.4 11 10 10 5 5 4 6 6 6 6 7 6 Sep-22 Mar-23 Sep-23 83 Net stable funding ratio (%) 121 115 1 4 (1) (1) (3) (5) Sep-22 Capital Retail/ SME Deposits Wholesale funding Liquids and other Loans CLF/TFF run-off and impact of APS 112 Sep-23 Customer deposits and net loans ($bn) 613 628 641 740 750 773 82.9 83.7 82.9 Sep-22 Mar-23 Sep-23 Funding composition (%) Westpac Group 2023 Full Year Results Presentation & Investor Discussion Pack FUNDING COMPOSITION CAPITAL, FUNDING AND LIQUIDITY 1 Includes long term wholesale funding with a residual maturity less than or equal to 1 year. 2 Equity excludes FX translation, available-for-sale securities and cash flow hedging reserves. 3 Other includes derivatives and other assets. Charts may not add to 100 due to rounding Wholesale offshore >1yr Wholesale onshore <1yr1 Wholesale onshore >1yr Wholesale offshore <1yr1 Securitisation Equity2 Customer deposits Customer deposits Net loans Customer deposits to net loans ratio (%) Customer deposits 71% of total funding excluding equity 3 — Focus on stable funding sources — Customer deposits provide 66% of total funding, or 71% excluding equity — Additional 22% from stable sources of long-term wholesale and equity |
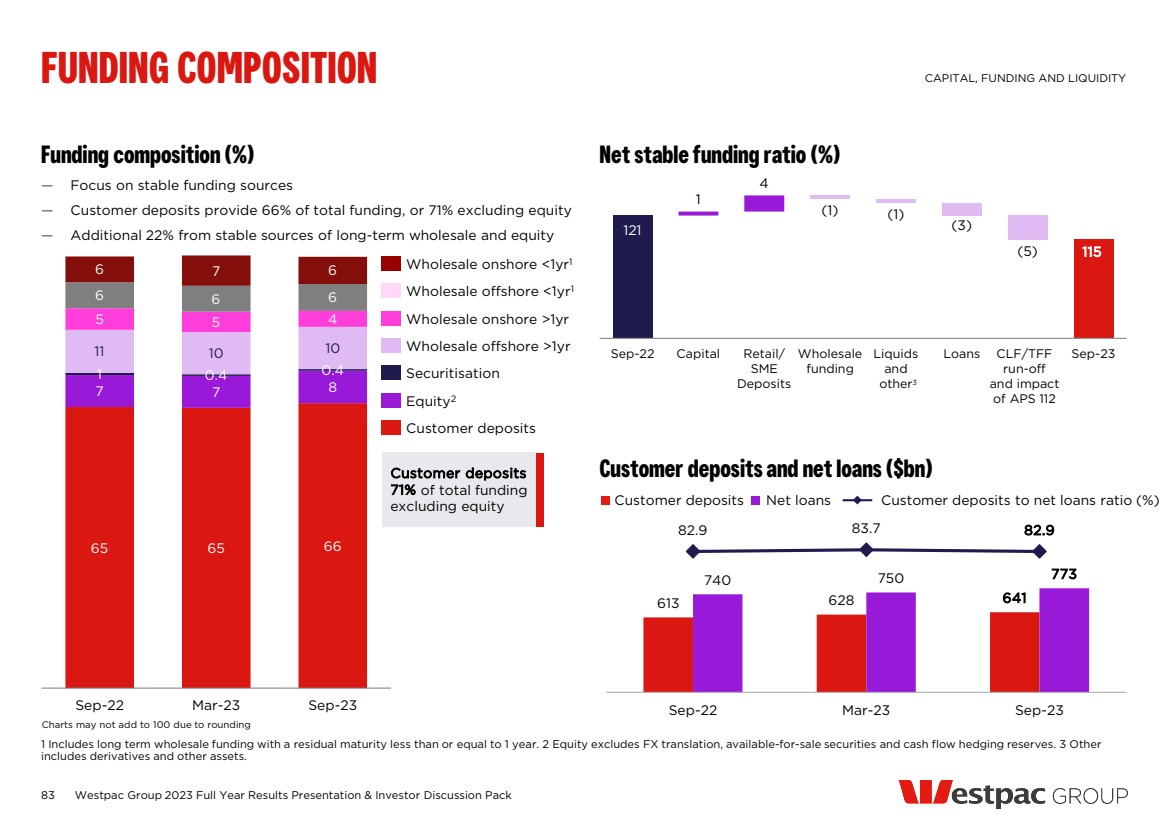
| 84 Term debt issuance and maturity profile1 ($bn) — $35.2 billion in new term issuance in FY23 • Well diversified across currencies, programs and tenors • SEC registration remains a key advantage in US$ market access • Additional diversity from the re-establishment of Westpac New Zealand Limited’s US MTN program and US$750m issuance in February 2023 — Well managed Group maturity profile • Term Funding Facility drawdowns managed to support a smooth LCR profile • Remaining Term Funding Facility drawdowns expected to be refinanced within normal funding capacity Term Funding Facility (TFF) maturities ($bn) LONG TERM WHOLESALE FUNDING PROFILE CAPITAL, FUNDING AND LIQUIDITY 1 Based on residual maturity and FX spot currency translation. Includes all debt issuance with contractual maturity greater than 13 months excluding US Commercial Paper and Yankee Certificates of Deposit. Contractual maturity date for hybrids and callable subordinated instruments is the first scheduled conversion date or call date for the purposes of this disclosure. Maturities exclude securitisation amortisation. Issuance Maturities Source: Westpac, RBA 18 12 12 31 34 31 35 43 35 41 33 30 24 56 FY18 FY19 FY20 FY21 FY22 FY23 FY24 FY25 FY26 FY27 >FY28 Funding for Lending Programme (NZ) Term Funding Facility (Aus) Subordinated debt Hybrid Covered bond Senior/Securitisation 4 2 3 3 1 1 1 1 1 6 5 21 69 Oct-23 Dec-23 Feb-24 Apr-24 Jun-24 Westpac Total eligible banks Westpac Group 2023 Full Year Results Presentation & Investor Discussion Pack |
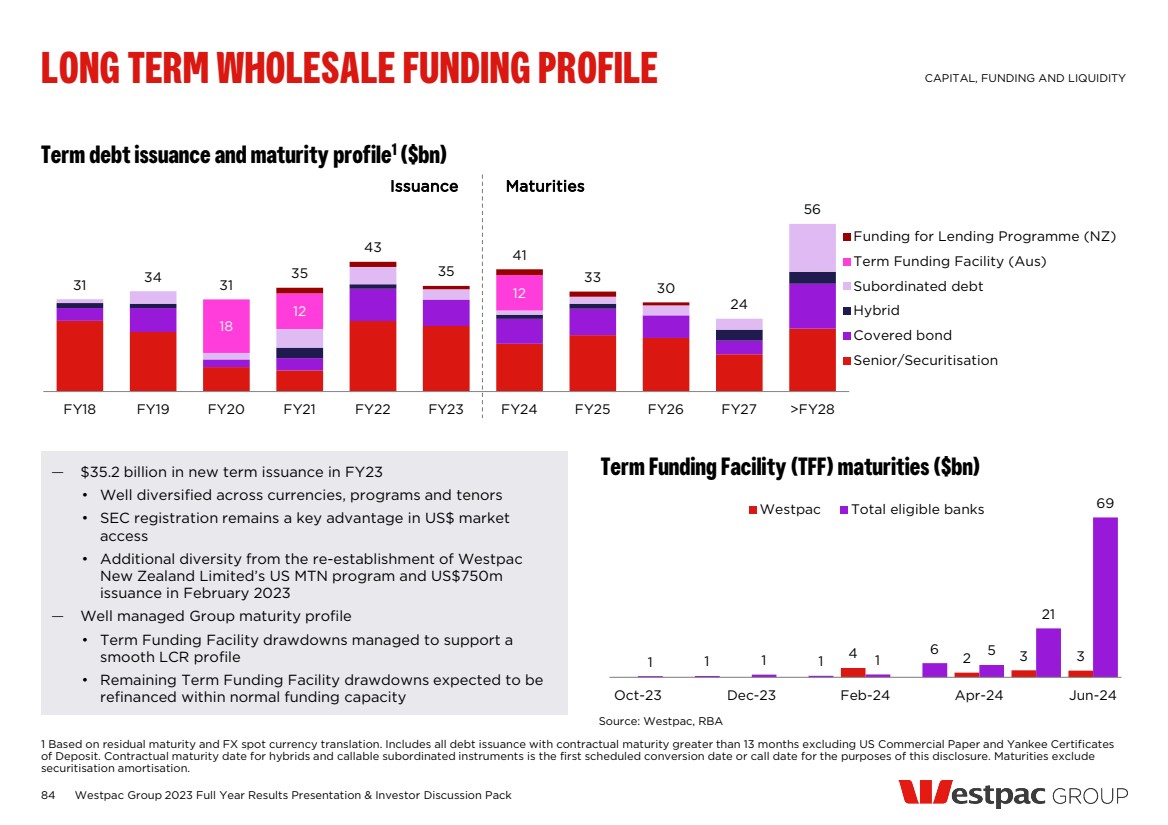
| 85 Long term wholesale funding back book1,2 (%) Indicative wholesale funding costs (spread above 3mth BBSW) FY23 term debt issuance1 (%) LONG TERM WHOLESALE FUNDING DIVERSIFICATION CAPITAL, FUNDING AND LIQUIDITY 1 Data excludes Term Funding Facility and Funding for Lending Programme. 2 Back book data excludes Securitisation. By program (%) By currency (%) By tenor (%) Charts may not add due to rounding 51 27 16 6 Senior bonds Covered bonds Tier 2 capital AT1 capital 0 20 40 60 62 26 2 10 Senior bonds Covered bonds RMBS Tier 2 capital 28 41 23 2 3 4 0 20 40 60 AUD USD EUR GBP NZD Other 60 62 77 87 96 57 65 96 116 135 0 50 100 150 200 1 year 2 year 3 year 4 year 5 year AUD 30-Sep-23 USD 30-Sep-23 AUD 30-Sep-22 USD 30-Sep-22 By program (%) By currency (%) Westpac Group 2023 Full Year Results Presentation & Investor Discussion Pack 45 24 20 4 4 2 AUD USD EUR GBP NZD Other 12 24 54 10 2 years 3 years 5 years >5 years |
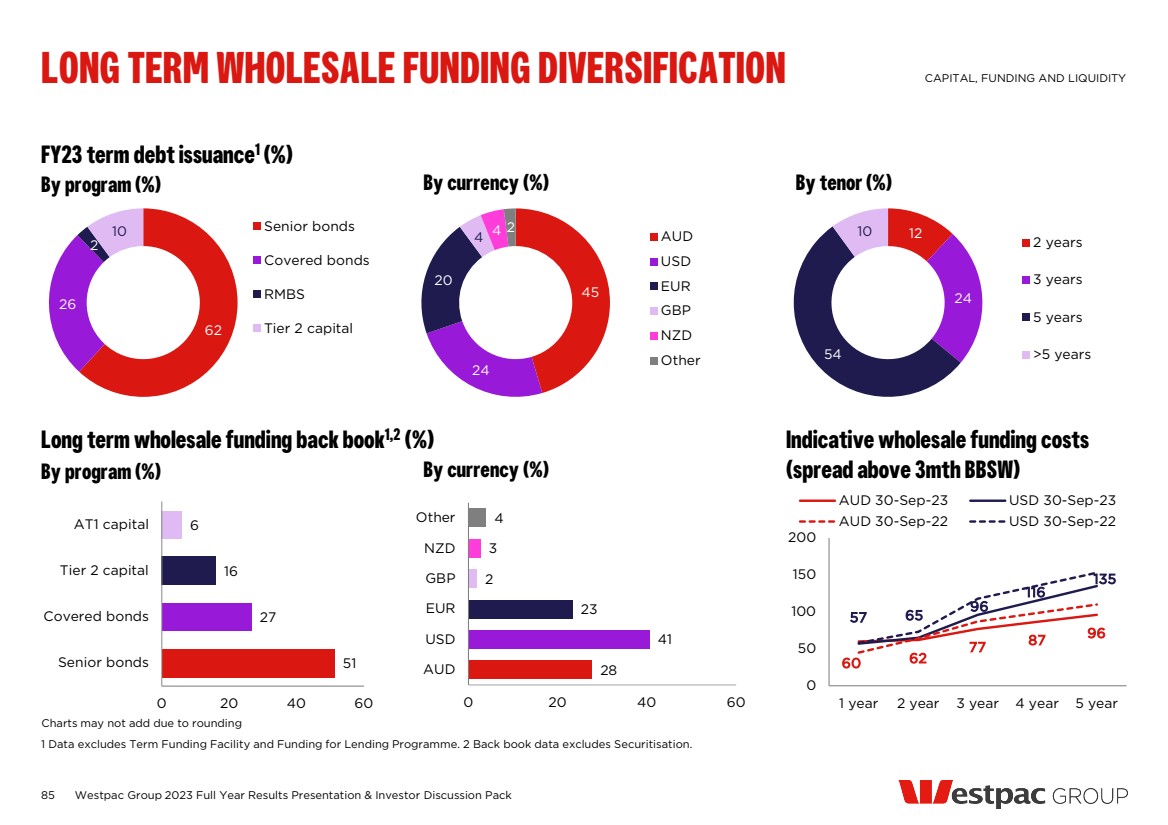
| LIQUIDITY RISK MANAGEMENT Capital, funding and liquidity 1 HQLA includes securities issued by foreign sovereigns and repo-eligible qualifying assets in foreign jurisdictions, including RBNZ eligible securities. 134% September 2023 quarterly average — LCR requires banks to hold a sufficient reserve of HQLA to allow them to survive a period of significant liquidity stress lasting 30 calendar days — Westpac is subject to LCR requirements under APS210 LIQUIDITY COVERAGE RATIO (LCR) — Westpac has a well diversified deposit portfolio DEPOSITOR DIVERSIFICATION $641bn customer deposits — NSFR requires banks to maintain a stable funding profile in relation to the composition of assets and off-balance sheet activities — Westpac is subject to NSFR requirements under APS210 NET STABLE FUNDING RATIO (NSFR) 115% — In Australia, cash, balances held with the Reserve Bank of Australia, and Australian Government and semi government securities qualify as HQLA. No Level 2 assets qualify as HQLA — HQLA included at market value in the LCR — Changes in the fair value of liquid assets are recognised either in Other Comprehensive Income through the relevant equity reserve or in the income statement HIGH QUALITY LIQUID ASSETS (HQLA) $182bn1 September 2023 quarterly average — Market interest rate risk arising in the banking book stems from the ordinary course of banking activities including loans, deposits, liquid assets and capital management — Westpac’s exposure to interest rate risk in the liquid asset portfolio is hedged using derivatives — APRA requires ADIs to calculate a capital charge for the risk of loss in earnings or a fall in the value of banking book items due to adverse movements in interest rates (APS 117) $3.2bn in IRRBB capital INTEREST RATE RISK MANAGEMENT (LIQUIDS PORTFOLIO) 86 Westpac Group 2023 Full Year Results Presentation & Investor Discussion Pack |
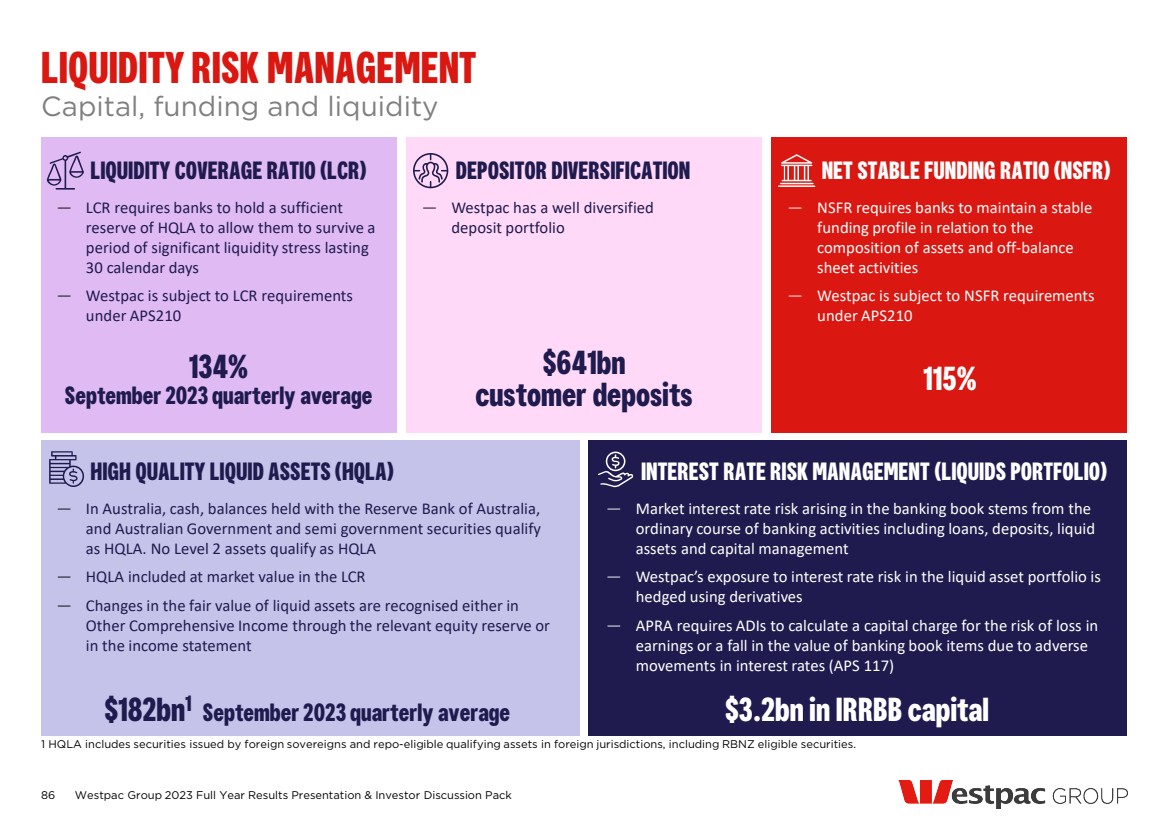
| 132 134 4 (11) (1) 8 1 Sep-22 Qtr HQLA CLF Customer Deposits Wholesale funding Other flows Sep-23 Qtr 52 12 29 7 Cash and balances with central banks Balances with foreign central banks Australian government and semi-government bonds Other HQLA LCR ($bn) Movement in LCR (%) High Quality Liquid Assets (HQLA) (%) LCR deposit mix (%) LIQUIDITY COVERAGE RATIO (LCR) CAPITAL, FUNDING AND LIQUIDITY 1 Other flows include credit and liquidity facilities, collateral outflows, inflows from customers and TFF maturities. 2 In line with APRA updated guidance, the CLF ceased to exist on 1 Jan-23. 3 Other HQLA includes securities issued by foreign sovereigns and repo-eligible qualifying assets in foreign jurisdictions, including RBNZ eligible securities. Liquid assets HQLA 2 1 Charts may not add to 100 due to rounding Net cash outflows (NCOs) Other flows1 Wholesale funding Customer deposits 95 182 11 30 136 182 Net cash outflows Liquid assets 33 35 15 17 Stable retail and SME deposits Less stable retail and SME deposits Operational deposits Non-operational deposits 3 $182bn $489bn September 2023 quarterly average 134% 87 Westpac Group 2023 Full Year Results Presentation & Investor Discussion Pack |
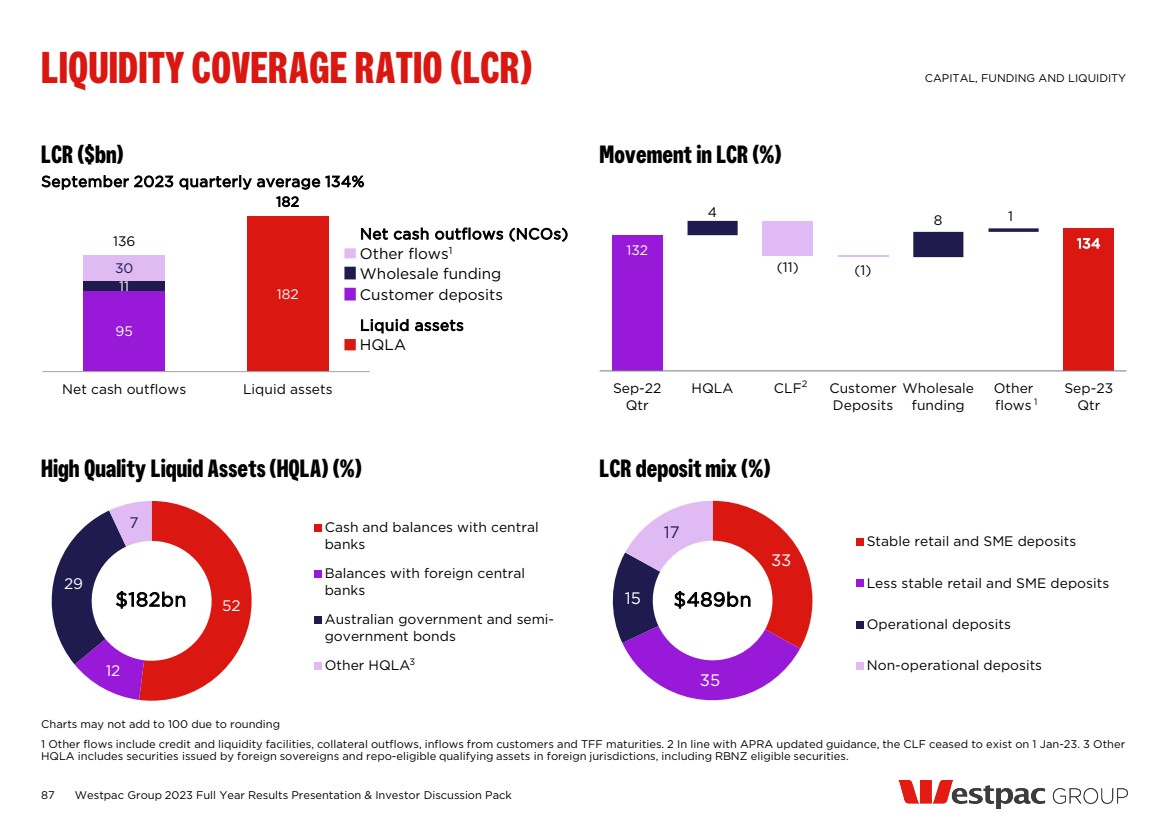
| CUSTOMER FRANCHISE 2023 Full year financial results |
| 10.4 10.5 10.7 1.5 1.5 1.5 1.0 0.9 0.8 12.9 12.8 13.0 Sep-22 Mar-23 Sep-23 Australian banking New Zealand Other 11% 12% 12% 5% 6% 6% 16% 18% 18% Sep-22 Mar-23 Sep-23 Westpac St.George brands -9 -10 -6 8 -1 -7 -25 -4 -7 -5 8 5 -10 4 0 Sep-22 Mar-23 Sep-23 Westpac St.George brands Peers -1 2 2 1 9 9 1 0 -2 5 12 12 7 6 3 Sep-22 Mar-23 Sep-23 Westpac St.George brands Peers 7.4 7.0 7.2 7.7 7.5 7.4 6.7 7.1 7.1 7.4 7.6 7.5 7.2 7.5 7.4 Sep-22 Mar-23 Sep-23 Westpac St.George brands Peers 7.5 7.6 7.6 7.5 7.8 7.8 7.4 7.4 7.4 7.5 7.8 7.7 7.6 7.6 7.6 Sep-22 Mar-23 Sep-23 Westpac St.George brands Peers 89 Customer numbers3 (#m) MFI share1,2 Customer satisfaction (CSAT)2 Net Promoter Score (NPS)2 Westpac Group 2023 Full Year Results Presentation & Investor Discussion Pack CUSTOMER FRANCHISE CUSTOMER FRANCHISE 1 Main Financial Institution for Consumer customers. 2 Due to the change of Strategic NPS provider, historic data (Sep-22) and new data (Mar-23 and Sep-23) are not comparable. For further details on metric provider see page 132. 3 Customer numbers related to businesses sold, held for sale or in run-off at Mar-23 have been excluded from all periods. 4 Other includes WIB, Westpac Pacific and Platforms customers. 5 New Zealand Consumer. Refer to page 132. Business Consumer Charts may not add due to rounding 4 New Zealand5 62 59 59 65 68 72 70 70 67 70 71 66 64 6565 Sep-22 Mar-23 Sep-23 Westpac Peers 7 8 8 31 33 34 32 30 23 22 27 21 16 15 13 Sep-22 Mar-23 Sep-23 Westpac Peers 12% 6% 12% 31% 12% 18% Peer 1 Peer 2 Peer 3 Westpac Group Westpac St.George brands Peers |
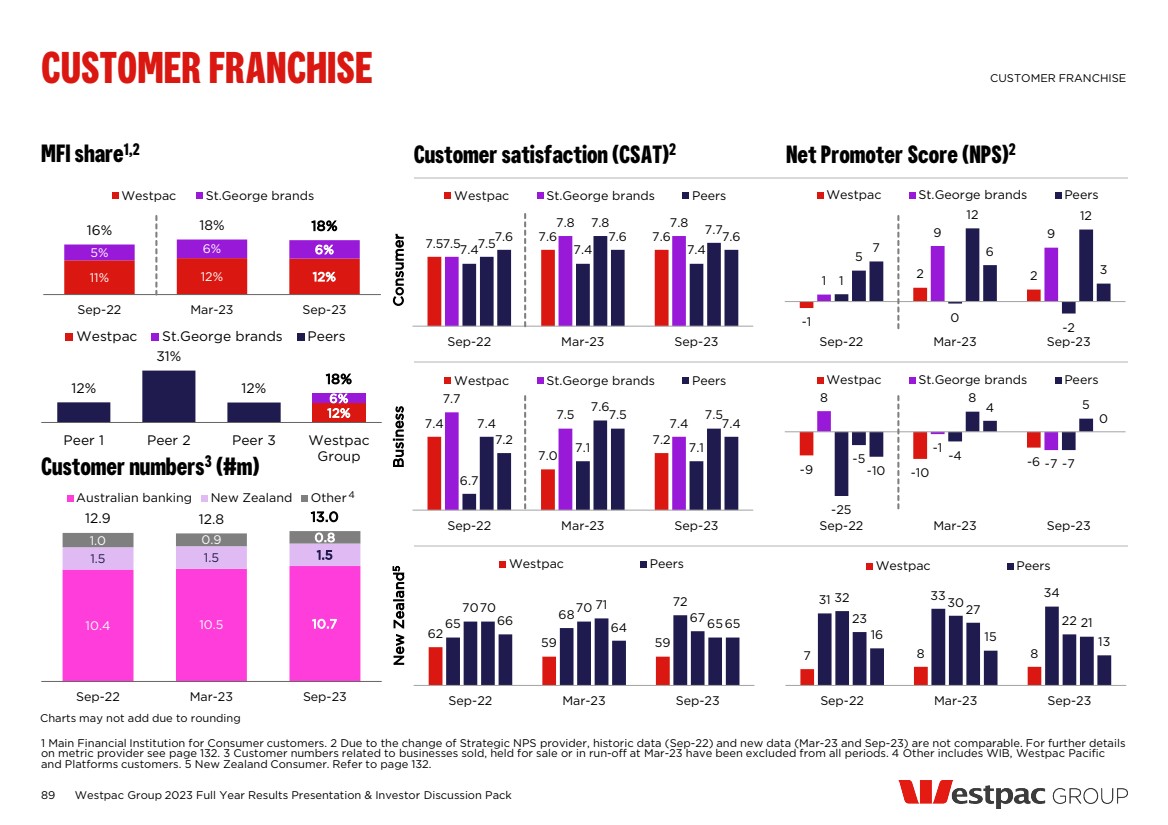
| #1 MOBILE BANKING APP 90 Continuing to support customers through our market leading app experience CUSTOMER FRANCHISE 1 The Forrester Digital Experience Review: Australian Mobile Banking Apps, Q4 2023. 2 Refer to page 132. 3 Best Major Digital Business Bank for 2023 in the DBM Australian Financial Awards. Refer to page 132. SEAMLESS USER EXPERIENCE — Intuitive search and navigation — Effortless self-service and secure chat — Helpful messaging supporting error avoidance and recovery COMPREHENSIVE FUNCTIONALITY — Best in class Money Movement: Expense Splitter, Request a Payment and Scan a Bill1 — Business to Personal profile switching — Integrated reward & offers SAFE & SECURE — Proactive fraud and scam prevention — Fraud alerts via push notifications — Safer payments with Dynamic CVC INSIGHTFUL MONEY MANAGEMENT — Predictive analysis of upcoming payments with Bills Calendar and Savings Finder — Spend analysis and cashflow — Personalised categorisation with custom sub-categories and tagging Best Major Digital Business Bank 20233 NPS #2 App2 Mobile #1 Banking App1 Westpac Group 2023 Full Year Results Presentation & Investor Discussion Pack |
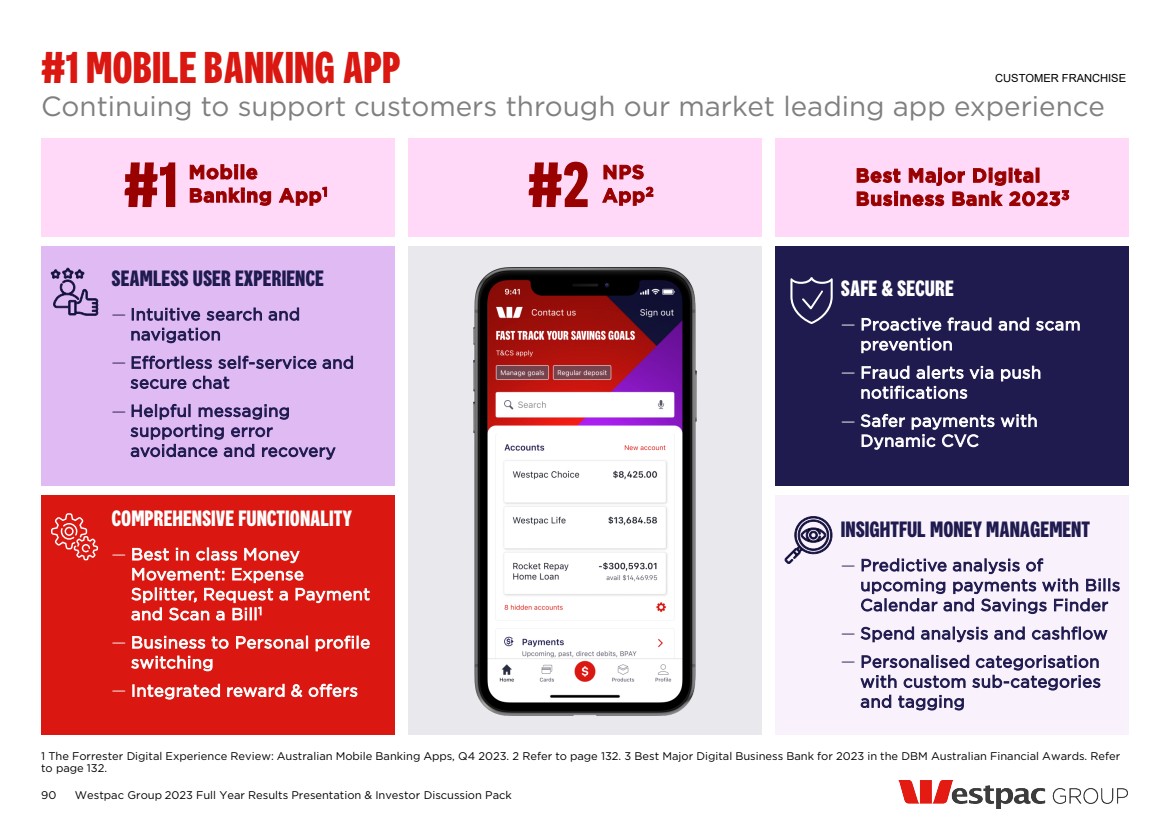
| APP ENHANCEMENTS 91 Supporting customers – bank in your pocket CUSTOMER FRANCHISE 1 The Forrester Digital Experience Review: Australian Mobile Banking Apps, Q4 2023. 2 Refer to page 132. 3 Mortgages and Consumer Finance. 4 Providing a consistent experience across devices. 2020 INNOVATION ACCELERATING NOW Real-time digital gambling block New Westpac Android App New self serve features Personal Finance Management Digital Mortgage New Business App Apple Pay New Westpac iOS App Strengthened safeguards against abusive messages Instant Digital Card and Dynamic CVC EFTPOS Air on Android and iOS Expense Splitter, Scan a Bill, Scan a PayID, PartPay Security Wellbeing Check Westpac Protect – Trusted Wi-Fi Facial Biometrics Identity Verification3 Secure One Time Password, Actionable push for fraud Voice scam detection, Biometric fraud detection ShopBack integration Money Management Enhancements Carbon footprint tracker New Westpac iPad App4 Mobile #1 Banking App1 NPS #2 App2 Westpac Group 2023 Full Year Results Presentation & Investor Discussion Pack |
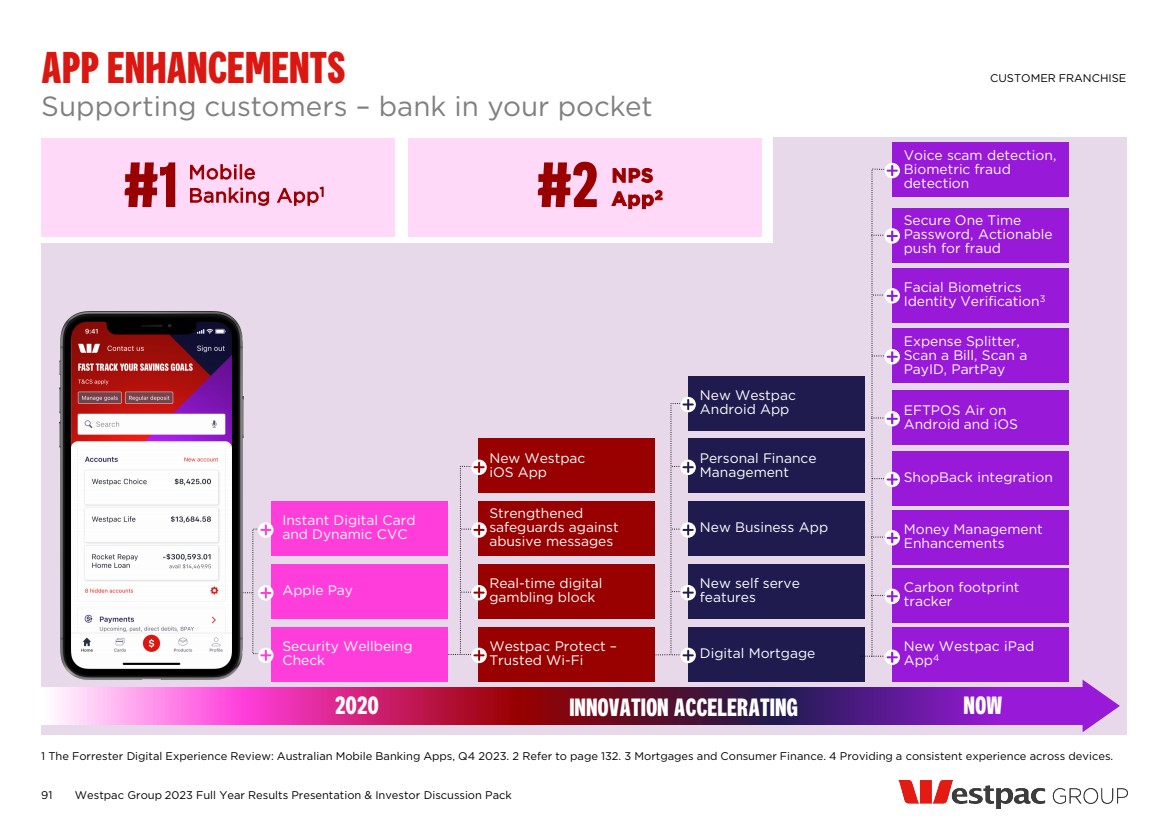
| DIGITAL INITIATIVES IN 2H23 92 Improving the digital banking experience for our customers CUSTOMER FRANCHISE 1 Westpac’s systems and processes may not always be 100% effective and are subject to risks and other factors including those described in the section titles ‘Risk factors’ in the FY23 Annual Report. 2 Since launch in Sep-22. 3 Mortgages and Consumer Finance. FRAUD & SCAMS1 Secure one-time password notifications PAYMENTS & TRANSACTIONS Scan a Bill, PartPay ECOSYSTEMS ShopBack integration in Westpac App MONEY MANAGEMENT Savings Finder, Bills Calendar, custom categories SERVICING & ONBOARDING Facial biometric identify verification BUSINESS OFFERING Eftpos Air >2m customers used money management features2 Secure push notifications providing fraud protection ID verification3 through the App, reducing branch visits Rewarded >$10m in cashbacks Easy bills payment by scanning or uploading a bill Only major bank offering capability across iOS and Android devices Westpac Group 2023 Full Year Results Presentation & Investor Discussion Pack |
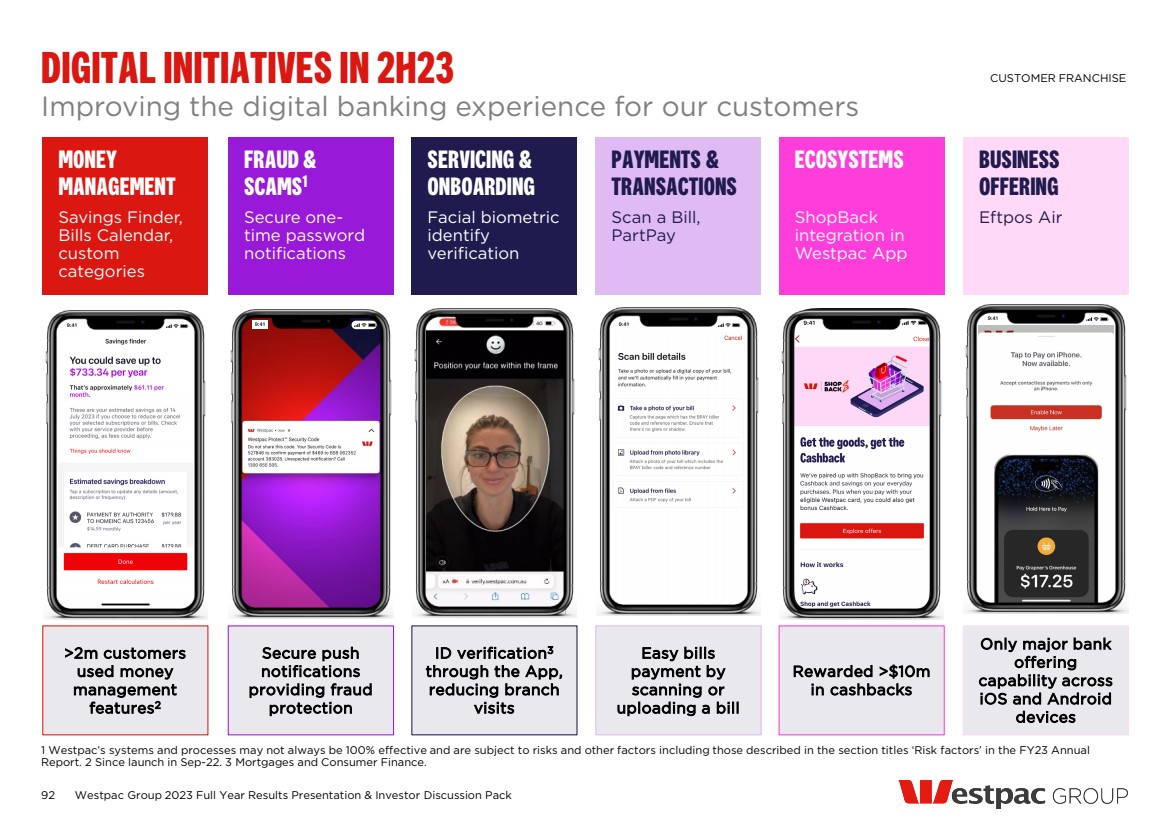
| Open Banking data for income verification Pre-populated liabilities from Consumer Credit Report Seamless digital experience between digital & lender Saving lenders 60-90 minutes per application More than 10,800 customers used the digital mortgage Volume settled $908m in FY23 DIGITAL MORTGAGE 93 Simplifying and improving the customer experience Westpac Group 2023 Full Year Results Presentation & Investor Discussion Pack CUSTOMER FRANCHISE One stop digital consent Electronic verification & verification biometrics Automated title & valuations Digitised requirements & objectives Automated income and liabilities verification Automated decision rules |
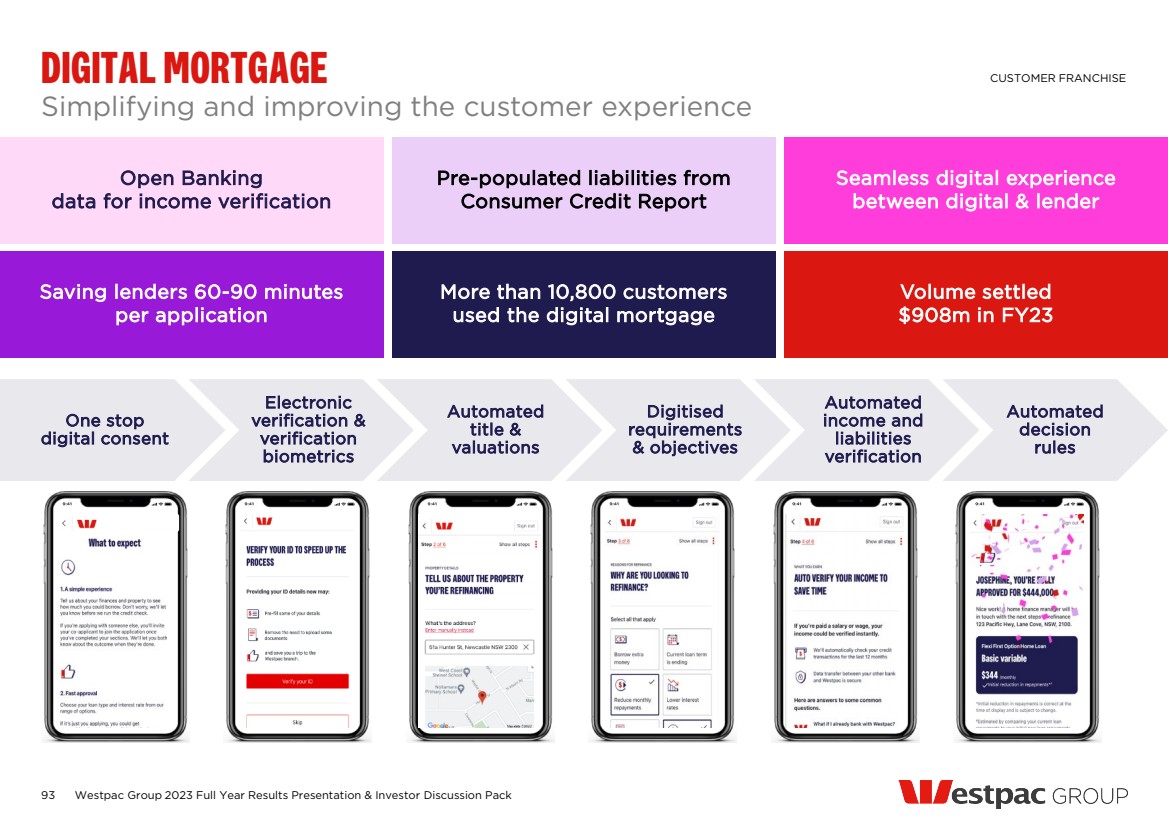
| 94 Digital sales1,3 0.32 0.32 0.37 0.44 0.47 45 45 43 43 44 2H21 1H22 2H22 1H23 2H23 Sales (#m) Sales (%) Average App sessions per day1 (#m) 4.48 4.74 4.91 5.21 5.43 2H21 1H22 2H22 1H23 2H23 Mortgages processed on digital origination platform (%) 34 50 50 79 95 2H21 1H22 2H22 1H23 2H23 Digitally active customers1 (#m) 5.24 5.31 5.48 5.64 Sep-21 Mar-22 Sep-22 Mar-23 Sep-23 Digital transactions1,2 (#m) 316 334 356 372 395 2H21 1H22 2H22 1H23 2H23 Mobile wallet payments1 (#m) 158 213 273 320 350 2H21 1H22 2H22 1H23 2H23 Customers continue to migrate to digital Westpac Group 2023 Full Year Results Presentation & Investor Discussion Pack AUSTRALIAN BANKING DIGITAL METRICS CUSTOMER FRANCHISE 1 Refer to page 132 for definition. 2 Digital transactions include all payment transactions (transfer funds, Pay Anyone and BPAY) within Westpac Live and Compass, excluding Corporate Online and Business Banking online. 3 Consumer only. Up 28% Up 6% Up 9% Up 6% Up 11% Up 3% 5.80 Up 7% Up 27% Up 4% Up 11% Up 45 ppts Up 16 ppts |
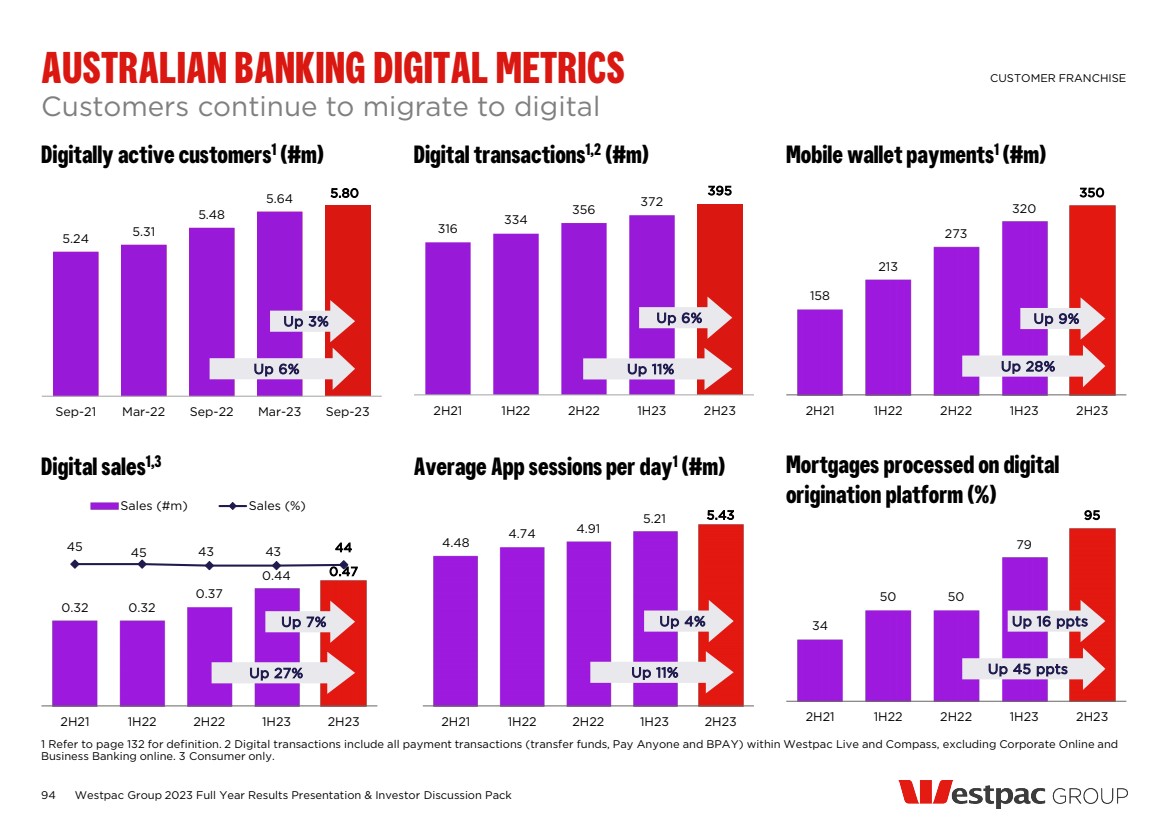
| SUSTAINABILITY 2023 Full year financial results |
| 96 Supported 32,097 Australian customers with financial hardship packages1 First Climate Report released (detail on following page) First Natural Capital Position Statement published Progress against our sustainability strategy Westpac Group 2023 Full Year Results Presentation & Investor Discussion Pack OUR COMMITMENT TO SUSTAINABILITY SUSTAINABILITY Note: See footnotes on page 126. HELPING WHEN IT MATTERS MOST BACKING A STRONGER AUSTRALIA AND NEW ZEALAND COLLABORATING FOR IMPACT Committed NZ$3m in grants to eligible business customers and NZ$1m to organisations assisting with immediate flood relief and recovery in New Zealand Human Rights Position Statement and Action Plan updated, incorporating our position on child safeguarding Specialist Vulnerability teams supported 71,182 Australian customers in FY23 Spent $27.9m with diverse suppliers in FY23, including $6.3m with Indigenous-owned businesses3 Assisted 4,551 unique customers2 in FY23, through our Indigenous Call Centre team Westpac Scholars Trust4 awarded 100 new scholarships in FY23. 737 active scholars5 supported since FY15 Modern Slavery Statement published (Mar-23) – FY20 & FY21 reports rated high by Monash University and BankTrack8 4,536 Australians participated in financial education events to build their financial confidence 1,238 jobs created via Westpac Foundation6 supported social enterprises, 6 months to Jun 23 – 7,240 jobs created since FY15 Founding member and provided seed funding to establish the Australian Child Safeguarding Business Coalition Lent NZ$810m for healthy, affordable and social housing in New Zealand (target NZ$700m by 2025)7 Provided $18.9m to Safer Children, Safer Communities program9 in FY23 – $61.4m provided since FY20 |
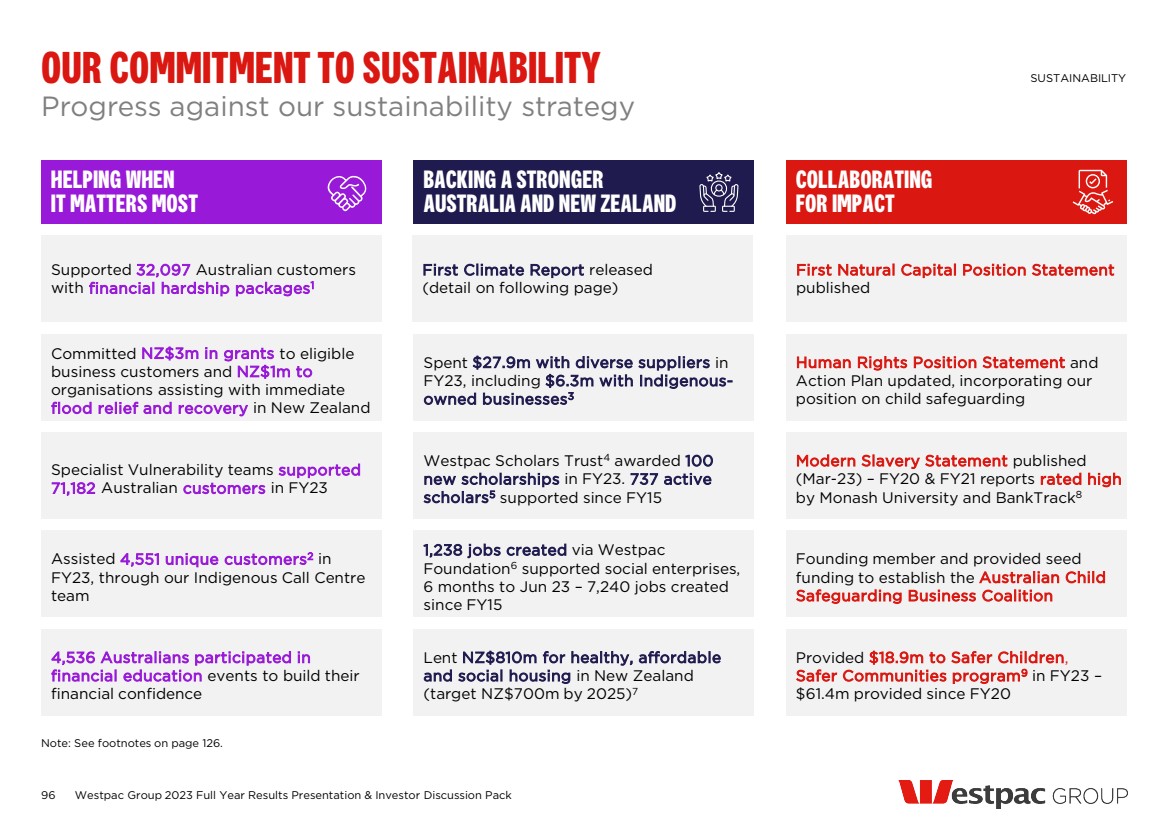
| 97 1. NET-ZERO, CLIMATE RESILIENT OPERATIONS - Reduced scope 1 and 2 emissions1 by 52% and our scope 3 upstream emissions1,2 by 4% for the year Jun-23 - From Apr-23, equivalent of 100%3 of our Australian electricity demand from renewables - Maintained certification4 for direct operations in Australia since 2012 and New Zealand since 2019 Delivering on the three elements of our Climate Action Plan Westpac Group 2023 Full Year Results Presentation & Investor Discussion Pack BECOMING A NET-ZERO, CLIMATE RESILIENT BANK SUSTAINABILITY Note: See footnotes on page 126. 2. SUPPORTING CUSTOMERS’ TRANSITION TO NET-ZERO AND TO BUILD THEIR CLIMATE RESILIENCE - 7 new NZBA targets, taking the total to 12 as a result we now have targets in 8 of 9 NZBA sectors - 58 Sustainable finance5 transactions in FY23 - total notional value of $83bn - Over $6.5bn in climate change solutions6 since 2020, exceeding our 2023 target of $3.5bn - Established pilot framework for assessing institutional customers’ transition plans - New Sustainable Finance Framework – established 2030 targets o $55bn lending o $40bn in bond facilitation - Climate-related products: Enhanced EV loan in Australia, Carbon footprint tracker in Westpac app (400,000+ users), new Sustainable Farm Loan and Sustainable Business Loan in NZ, expanded Greater Choices Home Loan for EV purchases and energy-efficient upgrades 3. COLLABORATE FOR IMPACT ON INITIATIVES TOWARDS NET-ZERO AND CLIMATE RESILIENCE - Participated in ABA7 and ASFI7 working groups on climate risk, disclosure, financed emissions, and their sustainable finance taxonomy - Contributor to Australian Industry ETI7, incl February 2023 report on pathways for heavy industry decarbonisation - Sponsored the Australian Farm Institute's ESG Goals and Target Setting Conference 2023 1 2 3 |
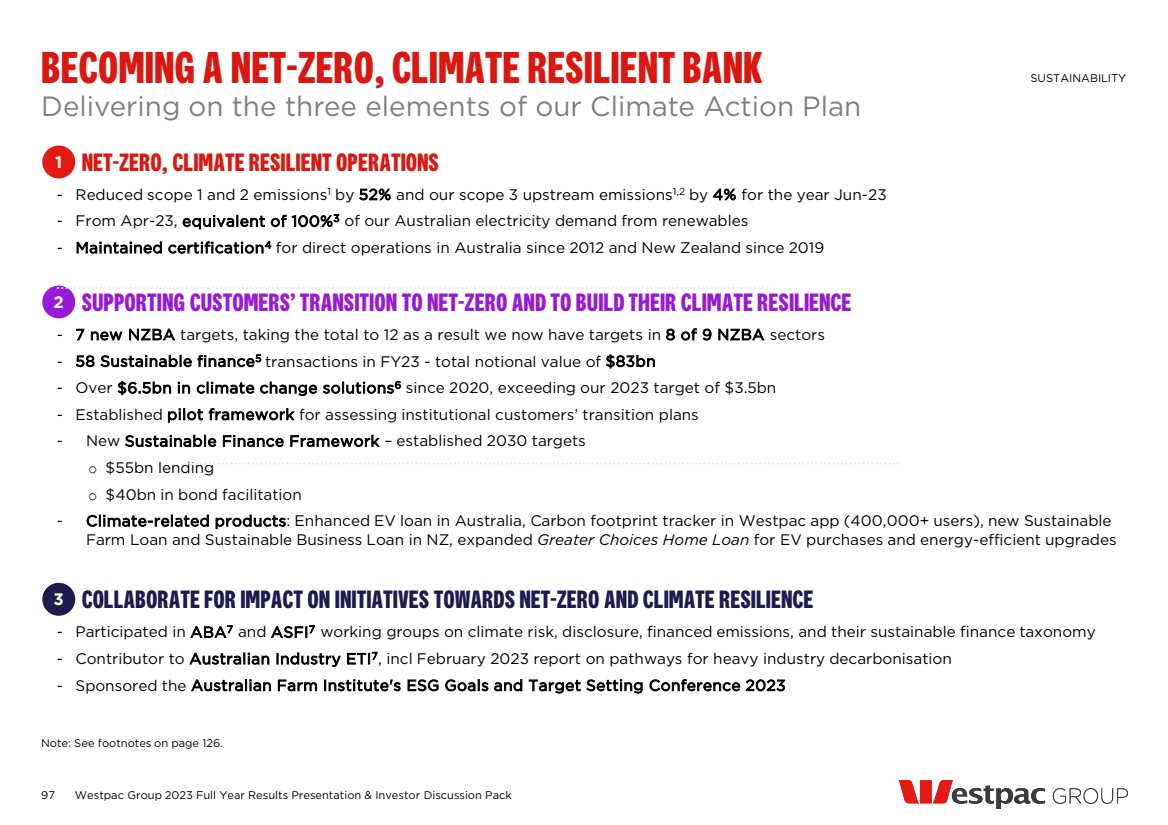
| 26% 21% 14% 12% 6% 5% 5% 4% 3% OUR FY23 CARBON FOOTPRINT 98 Estimated FY23 financed emissions1 (% of total) Understanding our carbon footprint enables us to take meaningful action and create impact Westpac Group 2023 Full Year Results Presentation & Investor Discussion Pack SUSTAINABILITY Note: See footnotes on page 126. Greenhouse gas (GHG) emissions by source % of total Scope 1: Direct impact i.e. fleet fuels, refrigerants, gas, diesel and LPG 6,559 <0.1 Scope 2: indirect impact (purchased electricity) <0.1 Scope 3 upstream emissions: Indirect impact from sources not owned or controlled <0.5 Scope 3 financed emissions: Indirect emissions related to our lending. Our share of customers’ scope 1 & 2 emissions 26.1 MtCO2-e >99 14,489 61,044 FY23 ABSOLUTE SCOPE 1 & 2 FINANCED EMISSIONS: 26.1MtCO2-e Chart does not add to 100% due to rounding Refer to our “Scope 1 and 2 direct operational emissions and scope 3 upstream emissions” and “Scope 3 financed emissions estimation” methodology Appendices in our 2023 Climate Report for more information, including methodology and data sources. 1% 1% 1% 1% Agriculture, forestry & fishing Utilities Manufacturing Residential Mortgages Trade Mining Transport & storage Services Commercial Real Estate Accommodation, cafes & restaurants Construction Finance & insurance Property services & business services tCO2-e |
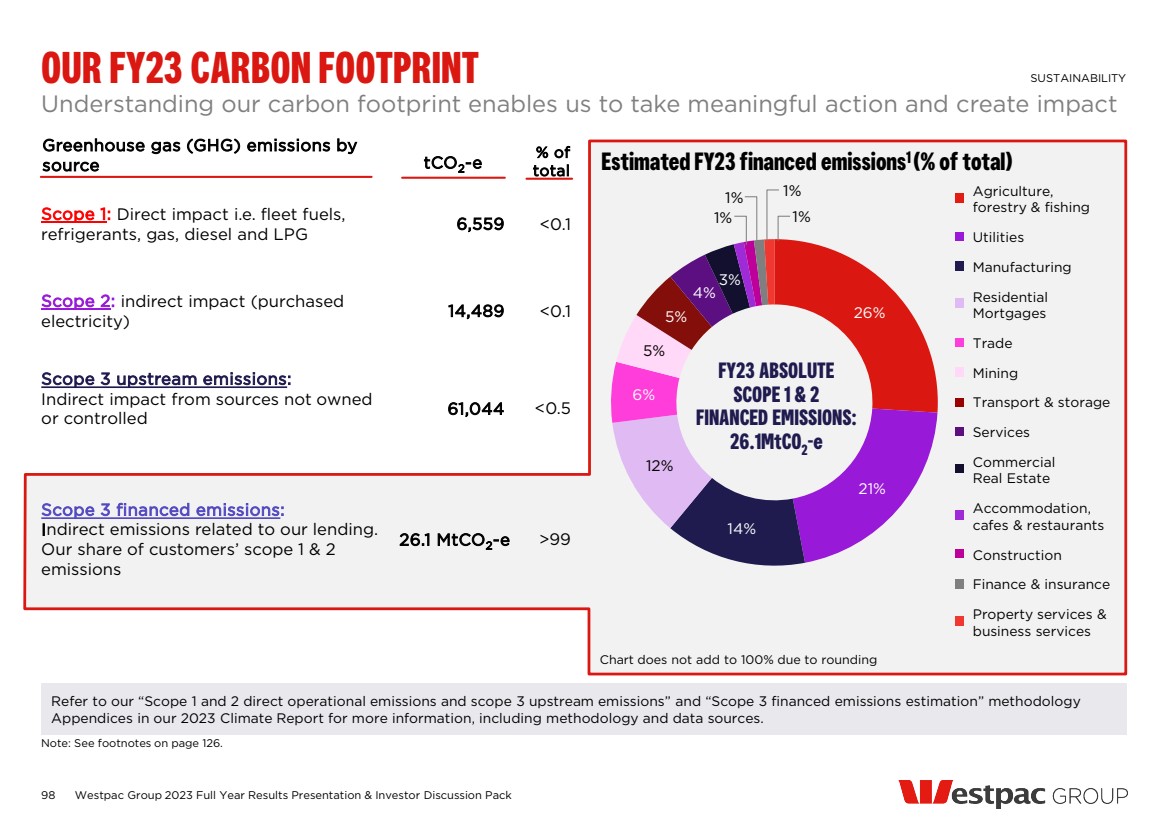
| SUMMARY OF OUR 2030 EMISSION REDUCTION TARGETS 2030 Targets set in FY22 New 2030 Targets established in FY23 For full details refer to our 2023 Climate Report SUSTAINABILITY The information on this page contains ‘forward-looking statements’ and statements of expectation reflecting Westpac’s current views on future events. They are subject to change without notice and certain risks, uncertainties and assumptions which are, in many instances, beyond its control. Please refer to the disclaimer on page 134. Note: See footnotes on pages 126 and 127. *Performance to be disclosed in FY24. 23% reduction in scope 1, 2 and 3 financed emissions FY22 Performance: 7.5MtCO2-e (18% change since FY21 baseline (9.2MtCO2-e)) 59% reduction in scope 1 and 2 emissions intensity7 for Australian and New Zealand office8 (FY22 baseline: 60kgCO2-e/m2 net lettable area9) 62% reduction in scope 1 and 2 emissions intensity5 to 0.10tCO2-e/MWh FY22 Performance: 0.23MtCO2-e (12% change since FY21 baseline (0.26MtCO2-e)) 14% reduction in scope 1 and 2 emissions intensity to 0.57tCO2-e/tonne of cement6 FY22 Performance: 0.66tCO2-e/tonne of cement (no change since FY21 baseline (0.66tCO2-e/tonne of cement)) 100% reduction of scope 1, 2 and 3 financed emissions to companies with >5% of their revenue4 directly from thermal coal mining FY22 Performance: 1.9MtCO2-e (23% change since FY21 baseline (2.46MtCO2-e)) 56% reduction in scope 1 and 2 emissions intensity20 (FY22 (year to Aug) baseline: 35kgCO2-e/m2) *STEEL PRODUCTION AVIATION (PASSENGER AIRCRAFT OPERATORS11)12 New Zealand: 9% reduction in scope 1 land management16 emissions intensity (FY21 baseline: 19.4tCO2-e/tonne of FW18) Reduction in scope 1 and 2 emissions intensity to 1.42tCO2-e/tonne of steel (FY21 baseline: Not disclosed10) 60% reduction in scope 1 emissions intensity to 76.4gCO2-e/passenger km13 FY22 Performance: 156.0gCO2-e/passenger km) (18% change since FY21 baseline (190.6gCO2-e/passenger km) Australia: 10% reduction in scope 1 land management16 emissions intensity (FY21 baseline: 1.04tCO2-e/tonne of FPCM17) New Zealand: 10% reduction in scope 1 land management16 emissions intensity (FY21 baseline: 0.83tCO2-e/tonne of FPCM17) Australia: 9% reduction in scope 1 land management16 emissions intensity (FY21 baseline: 21.73tCO2-e/tonne of FW18) UPSTREAM OIL AND GAS1,2 *COMMERCIAL REAL ESTATE (OFFICES)2 POWER GENERATION CEMENT PRODUCTION THERMAL COAL MINING2,3 *AUSTRALIAN RESIDENTIAL MORTGAGES19 *AGRICULTURE: DAIRY14,15 *AGRICULTURE: BEEF AND SHEEP14,15 99 Westpac Group 2023 Full Year Results Presentation & Investor Discussion Pack |
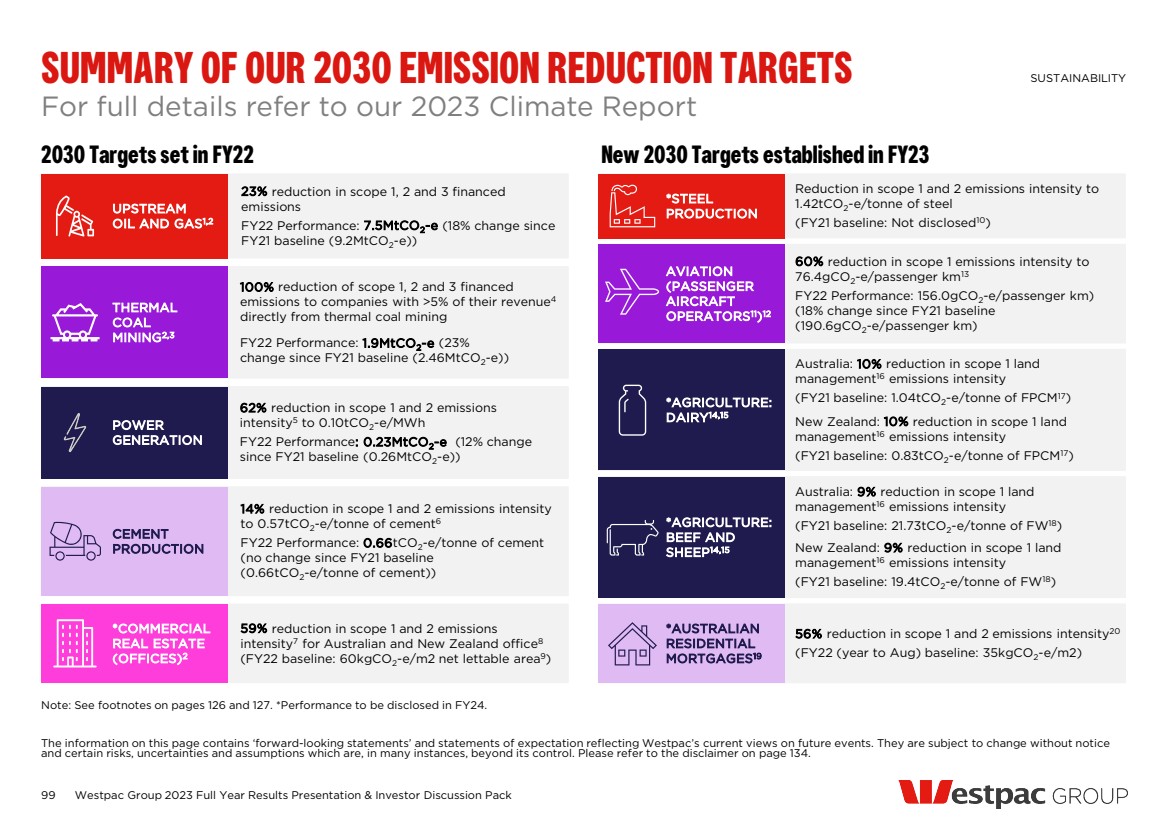
| Physical Risk in our operations — In FY23, we analysed the Group’s property footprint against a range of physical climate risks under several IPCC scenarios — In FY24, we plan to build on this to manage risks in site selection, leasing and construction Transition Risk in institutional and business lending At Sep-23, Group total committed exposure1 (TCE) was $1,218bn Of this, $127bn (10.4%) was in industries that may be exposed to higher climate change risk Mining exposure3,4 ($bn, TCE) Physical and transition impacts on our portfolio are not considered financially material ASSESSING CLIMATE-RELATED RISKS ON OUR FINANCIAL POSITION SUSTAINABILITY Note: See footnotes on page 127. 9.0 5.7 2.8 0.5 8.4 5.5 2.4 0.5 7.9 5.0 2.6 0.3 7.8 5.3 2.4 0.1 Total Other mining Oil and gas extraction and terminals Coal - thermal & metallurgical Sep-20 Sep-21 Sep-22 Sep-23 Where the $127bn is located (% of total) 81 16 3 0% 50% 100% Australia New Zealand Other Set 12 (2030) emission reduction targets in 8 NZBA sectors (full details are in our 2023 Climate Report) Movements mostly due to lower exposure to coal and oil & gas extraction Physical Risk in our lending — ~3.5% and 3.9% of our Australian mortgage portfolio is exposed to higher physical risks under RCP2.6 and RCP8.5 scenarios by 2050 respectively2 — ~2.1% (mortgages), 3.4% (commercial property lending), and 3.5% (agricultural lending) of our New Zealand portfolio is exposed to heightened risks from sea level rise under a RCP8.5 scenario by 2050 100 Westpac Group 2023 Full Year Results Presentation & Investor Discussion Pack |
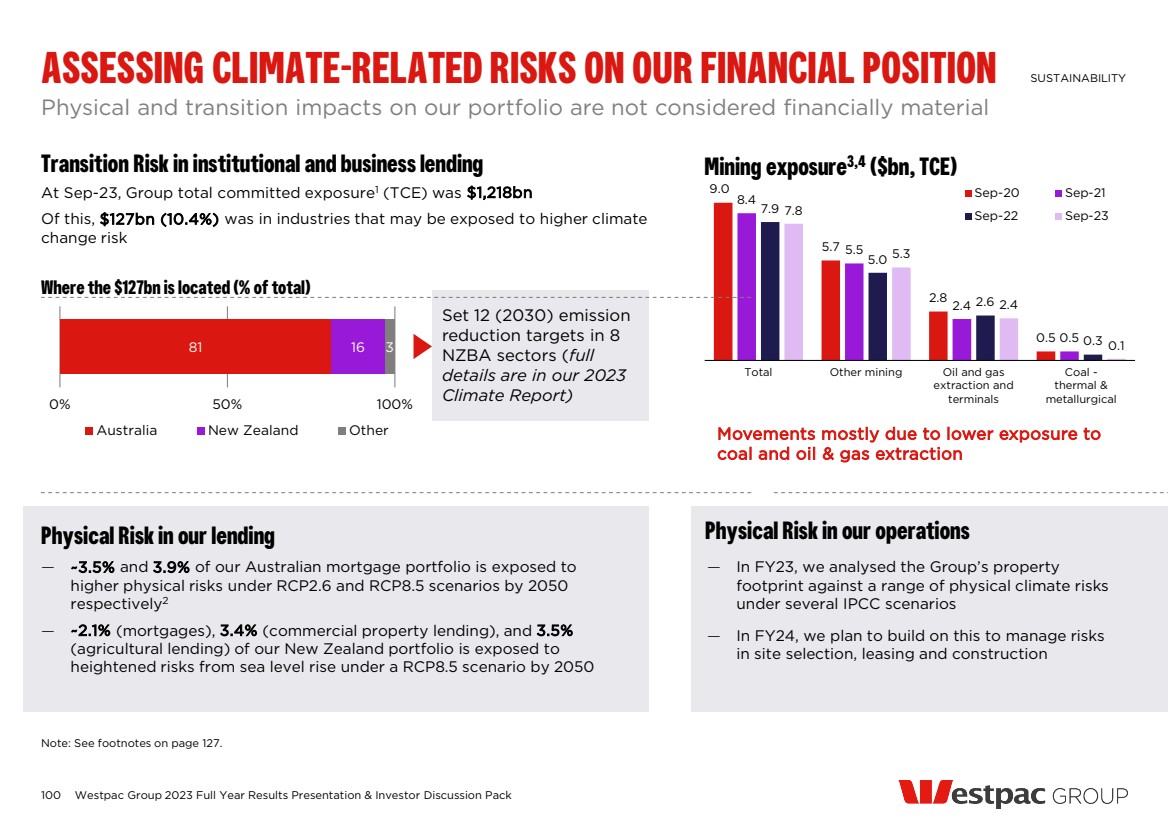
| Note: See footnotes on page 127. 101 Westpac Group 2023 Full Year Results Presentation & Investor Discussion Pack BUILDING CAPABILITY Becoming the transition partner of choice CLIMATE-RELATED OPPORTUNITIES SUSTAINABILITY GREEN TAILORED DEPOSITS SUSTAINABLE FINANCE — Supported 40 loan and 18 bond transactions1 in FY23 — $4.7bn of direct lending, joint lead manager on $14.1bn of bonds — New Sustainable Finance Framework and set 2030 targets ($55bn in lending and $40bn in bond facilitation from FY22 baseline), replacing our climate change solutions target from FY24 — Largest bank lender to greenfield renewable energy projects in Australia over the past five years2 ENGAGING CUSTOMERS — Engaged with top 100 emitting institutional customers on their emissions reduction initiatives and challenges faced — 20 institutional customers assessed under new pilot framework for transition plans — For SME customers, engagement continued with industry bodies — Balances down $0.8bn from $2.1bn at Sep-22 — Decline due to customers seeking higher returns early in the year — Deposits up since Mar-23 9.3 10.1 10.9 10.8 13.2 Sep-19 Sep-20 Sep-21 Sep-22 Sep-23 In FY22 over 3,000+ employees completed ESG fundamentals training. This year, we built on that: — >470 Aust employees completed sustainability training — >1,090 NZ employees completed ESG training — >450 WIB employees completed ESG and NZBA lunch and learn sessions — Dedicated carbon trading desks in Australia and New Zealand — Increased share in ACCU secondary market from 2.2% in 1H22 to 6.3% in 1H235 CARBON TRADING Exposure to climate change solutions3 ($bn, TCE)4 Movement mostly due to renewable energy and green buildings |
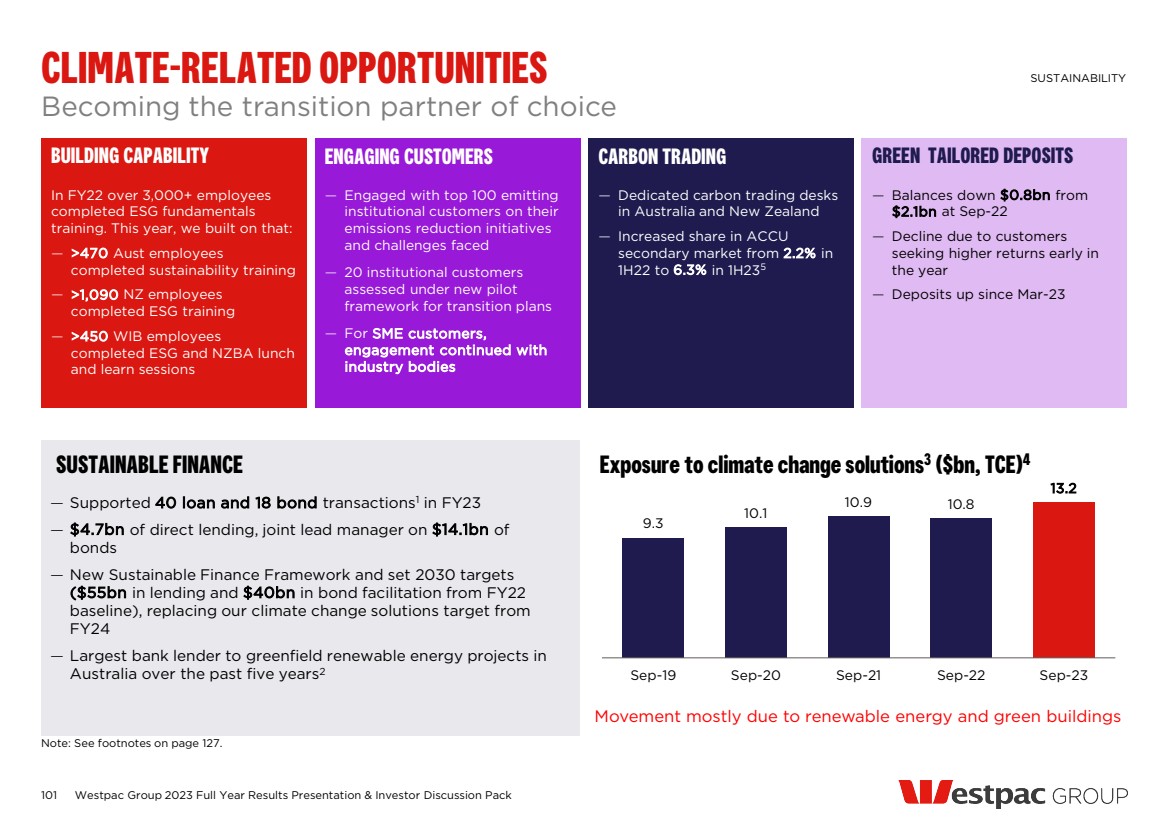
| NEW SUSTAINABLE FINANCE FRAMEWORK 102 Defines how we assess, monitor, measure and report sustainable finance Supports product development, and gives customers and our people clarity on definitions Developed after considering other international taxonomies, industry standards and science and principles-based thresholds Westpac Group 2023 Full Year Results Presentation & Investor Discussion Pack SUSTAINABILITY — Confirm that company and/or transaction does not have unacceptable ESG risks or negative ESG impacts — Apply alongside our various Position Statements — Assess labelled transactions against industry standards, principles and guidance — Assess unlabelled transactions against the Taxonomy — Determine if Green, Transition, Social or Sustainability Sustainable finance targets by 2030 Assess a Sustainable Finance transaction Determine the amount to be included in the targets Labelled lending or bond facilitation Unlabelled lending Qualifies if aligns with industry standards, principles & guidance, and/or third-party assured/verified Qualifies if eligible based on Westpac’s Sustainable Finance Taxonomy Assess ESG risks for customer/transaction, including against our Position Statements ASSESS GREEN TRANSITION SOCIAL SUSTAINABILITY $55bn $40bn Lending Bond Facilitation CLASSIFY/MEASURE MONITOR/REPORT OUR SUSTAINABLE FINANCE FRAMEWORK |
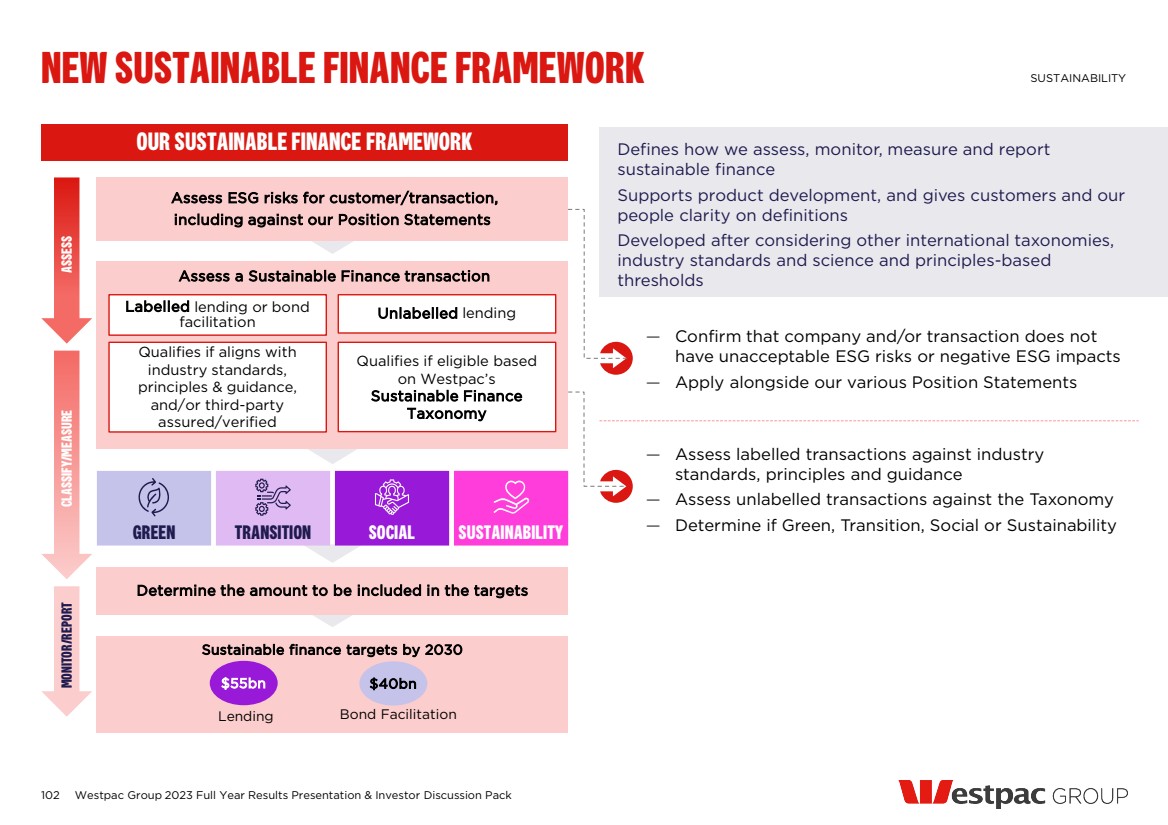
| 103 Westpac Group 2023 Full Year Results Presentation & Investor Discussion Pack SELECTED ESG CUSTOMER CASE STUDIES SUSTAINABILITY WNZL supported Queenstown Airport as Joint Sustainability Coordinator to convert $100m of existing lending into its first Sustainability-Linked Loans (SLLs), which includes ambitious targets to address some of the environmental challenges facing airports globally. Under the SLL structure, the airport’s pricing is tied to achieving its targets (including Level 4 Airport Carbon Accreditation; reducing its scope 1 and 2 GHG emissions; installing infrastructure that supports reductions in its scope 3 GHG emissions; and reducing specific waste streams sent to landfill across the terminal precinct) Westpac provided financing support for the new Rangebank Battery Energy Storage System to be built in Cranbourne, Victoria. This greenfield project is being developed by Eku Energy and Shell Energy Operations, and once fully operational will have the storage capacity to power ~80,000 homes for an hour during peak periods. The project is expected to be completed in late 2024, increasing Victoria’s renewable energy hosting capacity by 200MW / 400MWh KAMBITSIS Assisted Kambitsis to retrofit and transform two existing office buildings in South Australia, into a premium Property Council Australia A-Grade commercial space The project, due for completion in 2024, is expected to be all electric and carbon neutral certified in both construction and operation. This includes a high-performance façade, and energy efficient air conditioning to reduce emissions and operating costs. The building is targeting a number of energy and sustainability ratings AUSTRALIAN UNITY Supported Australian Unity as Sole Sustainability Coordinator for their $50m sustainability-linked loan and Sustainability-Linked Financing Framework. This market-leading deal differs from most deals in the ESG space, focusing on the ‘S’ for social. It is tied to increasing Australian Unity’s community and social value (with its FY23 social impact worth $1.76bn). Australian Unity is expected to deliver improved wellbeing outcomes for its members, customers and broader community as measured against its Community and Social Values framework. The framework prioritises three areas: lifelong wellness, economic empowerment, and strong communities Sustainability Linked Loan Business Loan MACQUARIE/SHELL BATTERY ENERGY STORAGE SYSTEM QUEENSTOWN AIRPORT Project Financing Sustainability Linked Loan |
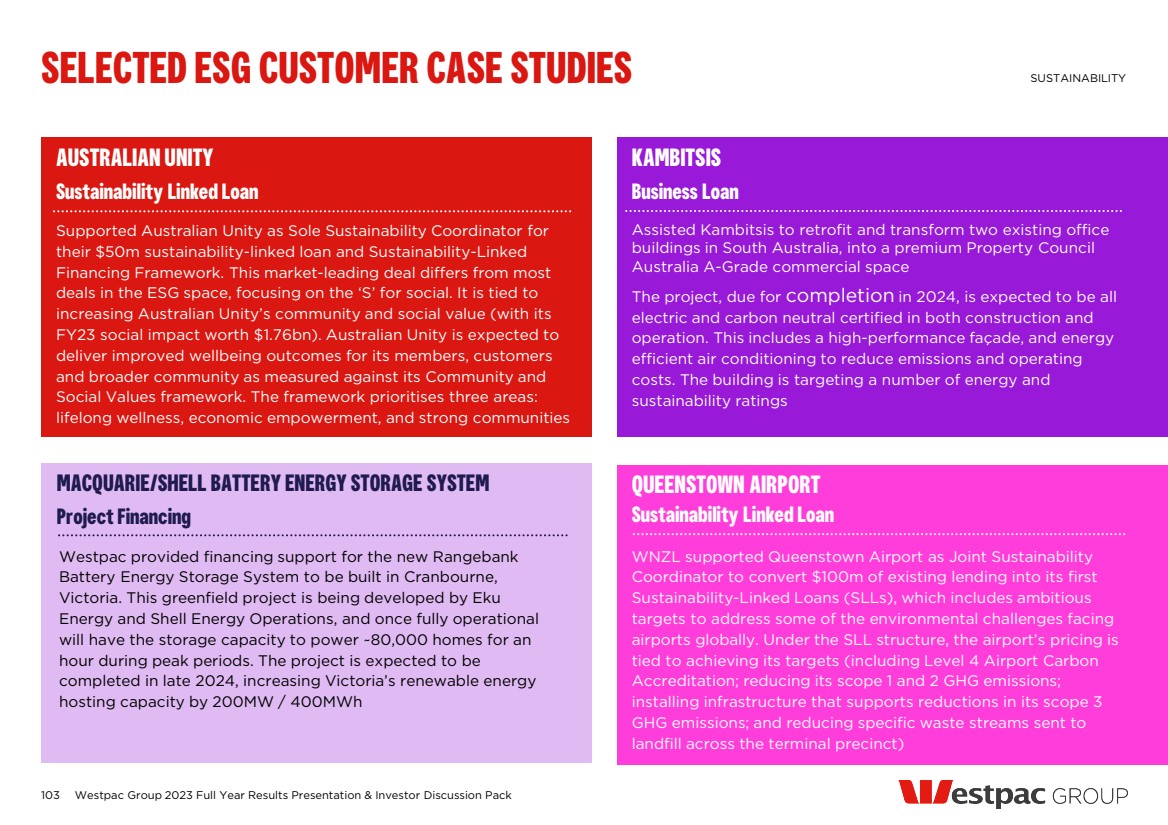
| 104 Westpac Group 2023 Full Year Results Presentation & Investor Discussion Pack COMPREHENSIVE SUSTAINABILITY REPORTING SUSTAINABILITY A suite of disclosures for more information and depth. 2021 Annual Report 2023 Annual Report Sustainable Finance Framework Modern Slavery Statement FY22 Natural Capital Position Statement Human Rights Position Statement and Action Plan Safer Children, Safer Communities 2022 Impact Report 2023 Sustainability Index and Datasheet Child Safeguarding Supplement 2023 Climate Report, includes Climate Change Position Statement and Action Plan Available at westpac.com.au/sustainability |
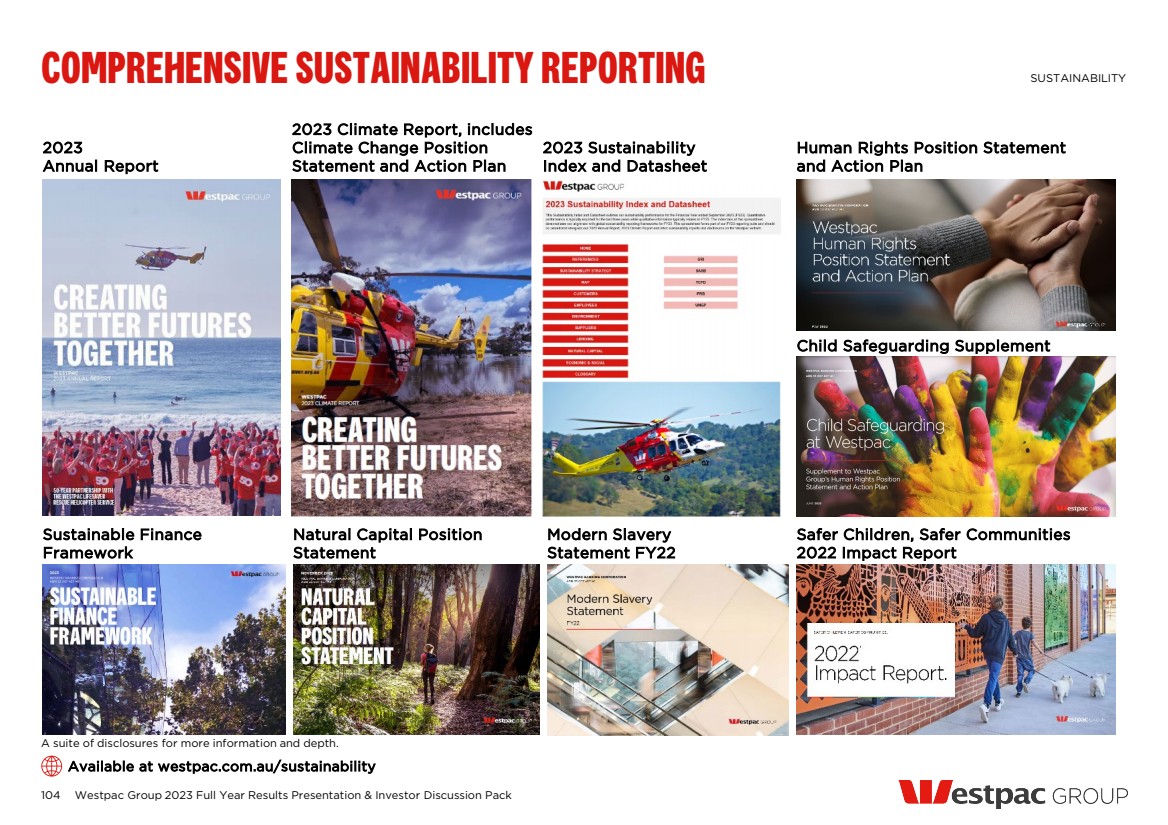
| — Chief Mental Health Officer in place since 2018 to oversee Group mental health strategy — Assistance services for employees and their families — 10 Employee Advocacy Groups in place, supporting our diverse and inclusive workplace — Introduced paid leave for: fertility treatment one week; domestic and family violence uncapped; gender affirmation up to six weeks; career break including provision for Indigenous employees to take a community break to work in community-based organisations — Expanded international remote working options — Upstander initiative launched – encouraging employees to speak up and act against racism and discrimination — Increasing representation of employees who identity as Aboriginal and/or Torres Strait Islander: • Currently 0.96% of Australian workforce (target 0.75% by Sep-23) • Target 1.5% by Sep-25 — Elder in Residence appointed — Mandatory Cultural Learning for Australian-based employees, Executive Team and Board in FY23 — Celebrated 1,000th Jawun Indigenous Community Secondment in FY23 OUR PEOPLE 105 Building capability, strengthening inclusion and diversity PEOPLE 1 6% at Level 3; measured on base salary by organisational job level. 2 40% women, 40% men and 20% of any gender. Westpac Board includes CEO. Executive team excludes CEO. 3 Senior leadership includes executive team, general managers and their direct reports (excluding administrative or support roles). 4 Our Voice+ survey includes McKinsey's Organisational Health Index – benchmarking Westpac’s organisational health relative to global standards. STRENGTHENING GENDER DIVERSITY MEASURING ORGANISATIONAL HEALTH BUILDING SKILLS AND CAPABILITIES GROWING OUR INDIGENOUS WORKFORCE UPDATE POLICIES AND INITIATIVES PROMOTING WELLBEING — Risk management – ~33,800 employees completed foundational training — Digital and data – ~5,000 employees engaged with the program — Environmental, Social, Governance – online learning delivered to ~470 employees — Leadership capabilities – development programs for 1,100 leaders in FY23 — People Leaders Culture Day setting expectations for ~4,500 leaders driving positive risk culture — Organisational Health Index score4 75 in line with FY22 — Top of second Global quartile — 3 points above Global Banking median — Female to male pay gap is 5% or less for 8 of 9 levels1 below Group Executive FEMALES % SEP-23 TARGET PROGRESS Westpac Board 40 40:40:202 ✓ Executive Team 50 40:40:202 ✓ General Managers 40 40 +/-2% ✓ Senior Leadership 49 50 +/-2%3 ✓ Westpac workforce 54 50 ✓ Westpac Group 2023 Full Year Results Presentation & Investor Discussion Pack |
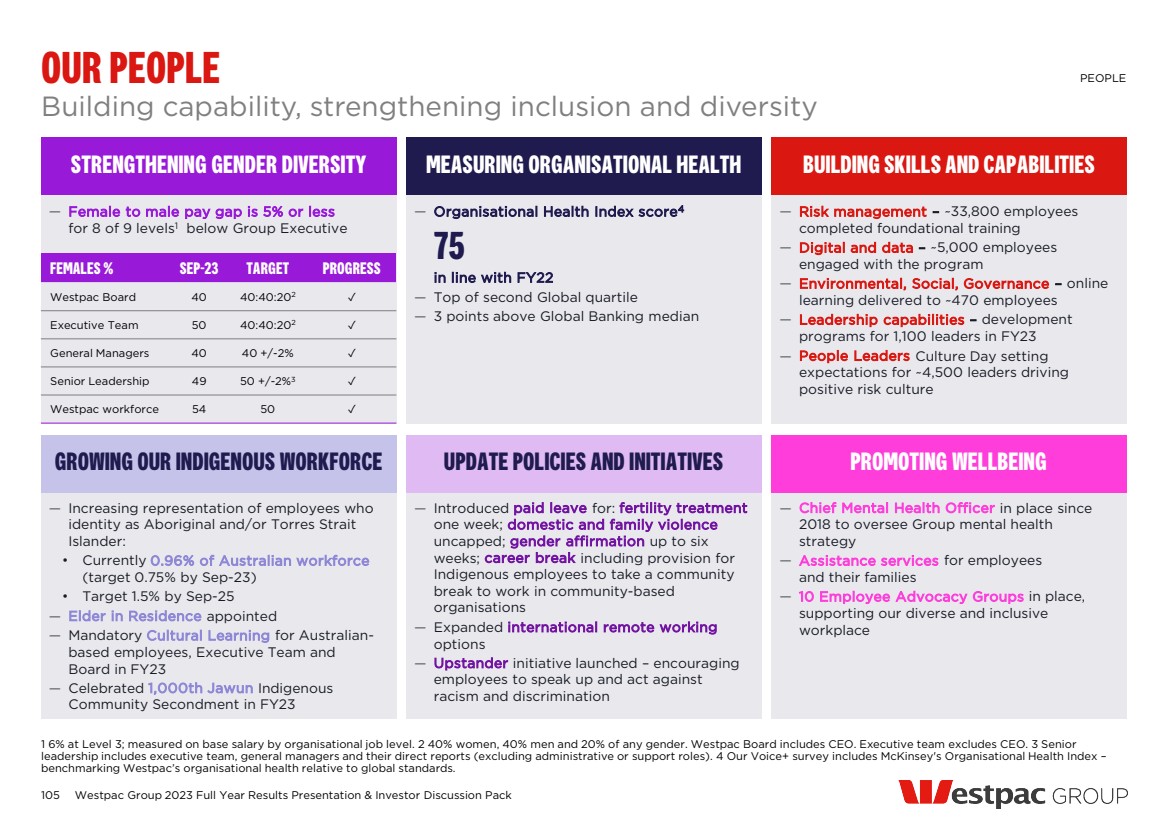
| SEGMENT RESULTS 2023 Full year financial results |
| 1,645 1,763 140 141 1,437 1,289 (420) (26) (161) (148) 2H22 1H23 Net interest income Non-interest income Operating expenses Impairment charges Tax and NCI 2H23 ex-Notable Items Notable Items 2H23 Down 18% ex Notable Items 107 Net profit ($m) Key financial metrics ex Notable Items 2H22 1H23 2H23 Change on 1H23 Pre-provision profit ($m) 2,642 2,689 2,082 (23%) Average interest-earning assets ($bn) 425 432 438 1% Net interest margin (%) 2.16 2.18 1.94 (24bps) Expense to income (%) 46.0 46.1 54.2 Large Customer deposit to loan ratio (%) 59.1 61.2 62.6 140bps Mortgage 90+ day delinquencies (%) 0.75 0.73 0.86 13bps CONSUMER 2H23 PERFORMANCE CONSUMER 1 Refer page 132 for definitions. 2 Includes all points of presence including Advisory, Community Banking Centres and Kiosks. Kiosks have been restated in comparatives. Co-located branches are considered two points of presence. 3 Only includes Westpac-owned ATMs. Down 27% Key operating metrics 2H22 1H23 2H23 Change on 1H23 Active digital banking customers1 (#m) 5.48 5.64 5.80 3% MyEDB customers (#m) 4.41 4.51 4.63 3% Branches2 (#) 732 666 644 (22) Bank@Post locations (#) 3,522 3,506 3,479 (27) Co-located branches 27 46 82 36 ATMs3 (#) 1,071 965 879 (86) Lower CAP from lower overlays due to improved economic outlook outweighing underlying portfolio deterioration Inflation and higher investment spend Mostly restructuring including accelerated branch transformation program AIEA up 1%, NIM down 24bps from competition Westpac Group 2023 Full Year Results Presentation & Investor Discussion Pack |
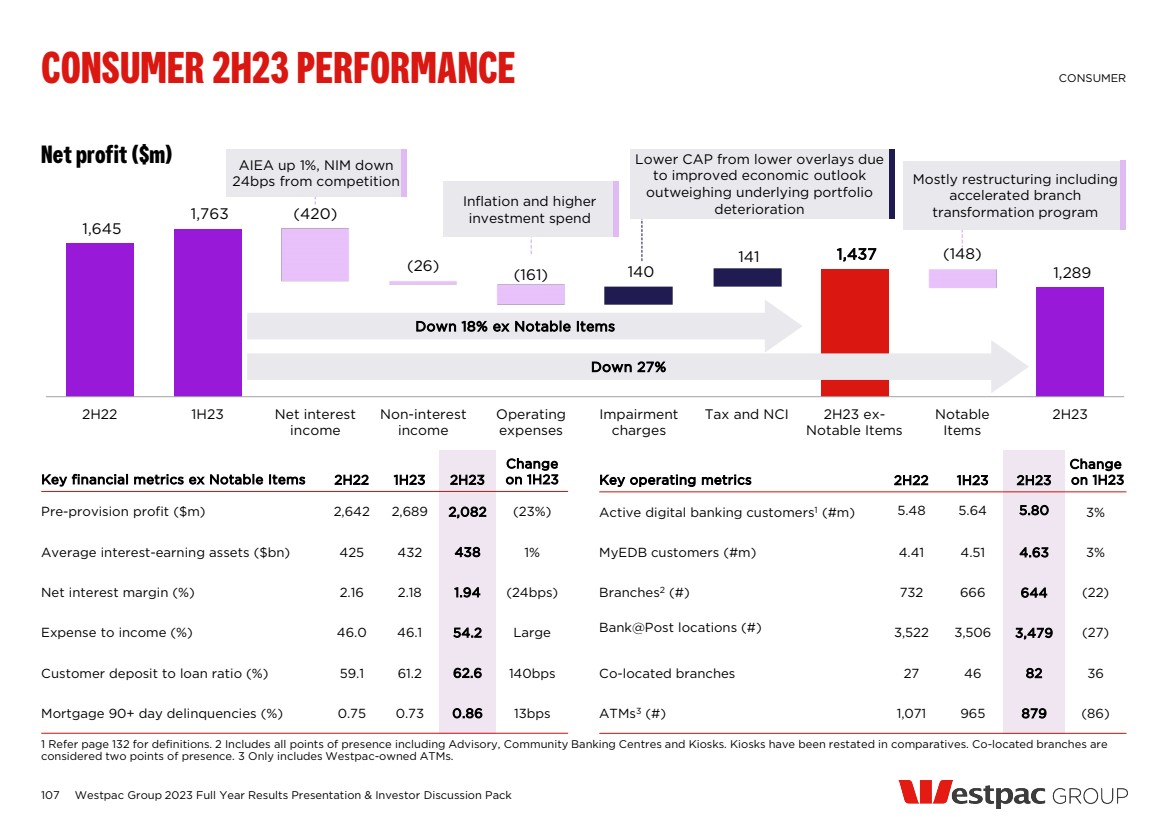
| Inflation and higher software amortisation 108 Net profit ($m) Net profit ($m) BUSINESS 2H23 PERFORMANCE BUSINESS 1 Refer page 132 for definitions. Key operating metrics 2H22 1H23 2H23 Change on 1H23 Digital sales1 (%) 29 24 35 11ppts Next Generation EFTPOS terminal uptake (‘000) 9.5 28.0 34.2 22% Business lending time to decision (days) 14.0 12.1 9.5 (21%) Net business loans ($bn) 84.9 85.6 88.9 4% Business deposits ($bn) 133.3 133.4 130.6 (2%) 679 851 152 3 777 (15) (39) (107) 845 (68) 2H22 1H23 Net interest income Non-interest income Operating expenses Impairment charges Tax and NCI 2H23 ex-Notable Items Notable Items 2H23 Down 9% Down 1% ex Notable Items Key financial metrics ex Notable Items 2H22 1H23 2H23 Change on 1H23 Pre-provision profit ($m) 956 1,294 1,392 8% Average interest-earning assets ($bn) 83.5 85.8 87.6 2% Net interest margin (%) 4.07 4.78 5.00 22bps Expense to income (%) 48.9 41.4 40.6 (75bps) Customer deposit to loan ratio (%) 157.1 156.0 147.0 (Large) Stressed exposures to TCE (%) 5.05 4.85 4.98 13bps Westpac Group 2023 Full Year Results Presentation & Investor Discussion Pack Customer remediation and restructuring Higher CAP reflecting increased stress and changed economic forecast, a large IAP and fewer writebacks AIEA up 2%, NIM increased 22bps |
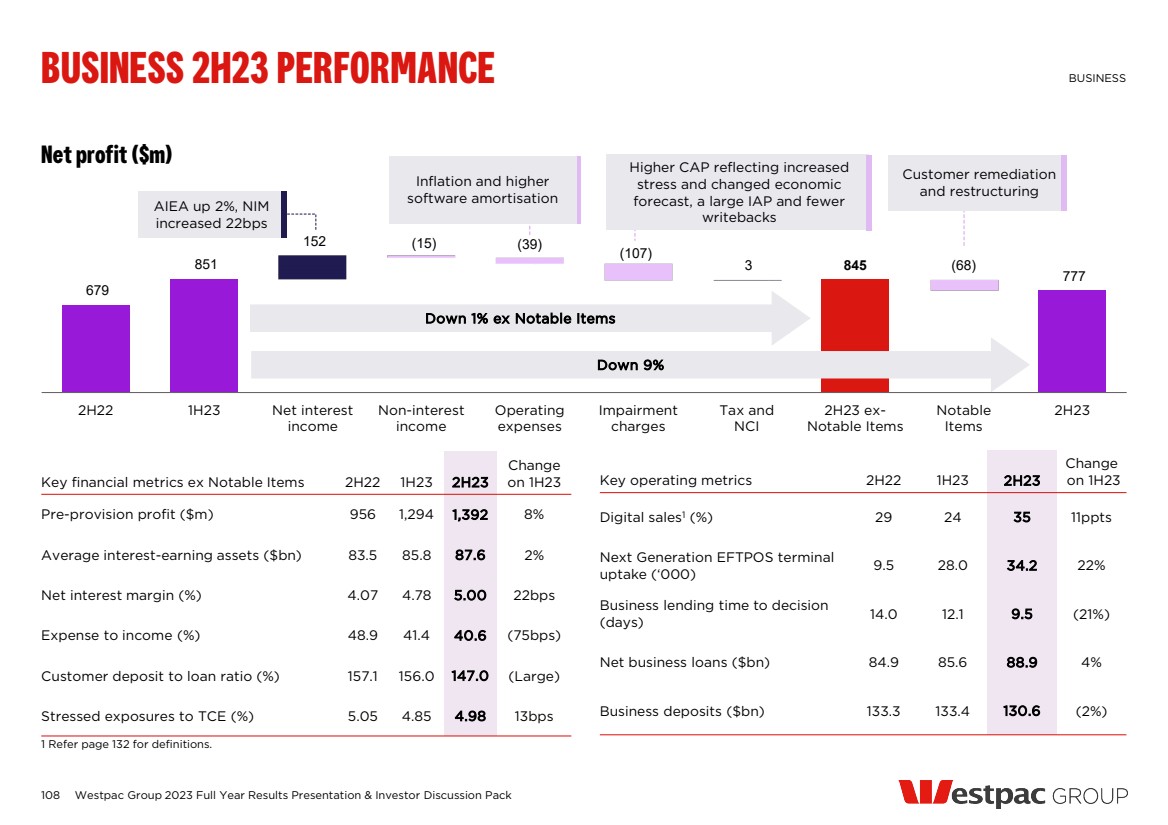
| 574 101 33 487 (42) (74) (95) (10) 381 497 2H22 1H23 Net interest income Non-interest income Operating expenses Impairment charges Tax and NCI 2H23 ex-Notable Items Notable Items 2H23 109 Net profit ($m) Key financial metrics ex Notable Items 2H22 1H23 2H23 Change on 1H23 Pre-provision profit ($m) 576 799 784 (2%) Average interest-earning assets ($bn) 93.7 98.0 105.3 7% Net interest margin (%) 1.34 1.46 1.54 8bps Expense to income ratio (%) 51.3 43.6 46.8 328bps Net loans ($bn) 85.2 84.7 92.6 9% Customer deposit to loan ratio (%) 136.8 133.0 124.4 Large Stressed exposures to TCE (%) 0.35 0.28 0.58 30bps Key operating metrics 2H22 1H23 2H23 Change on 1H23 Lending and deposit revenue ($m) 913 970 1,036 7% Sales and risk management income ($m) 348 435 452 4% Derivative valuation adjustment (DVA) ($m) (20) 52 4 (92%) Revenue per average FTE ($’000) 456 541 549 1% Westpac Group 2023 Full Year Results Presentation & Investor Discussion Pack WIB 2H23 PERFORMANCE WESTPAC INSTITUTIONAL BANK Down 13% ex Notable Items AIEA up 7%, NIM increased 8bps Reduction in DVA Higher CAP and non-repeat of 1H23 recoveries & write-backs Increased staff costs including higher FTE to support growth; inflation and higher software amortisation Down 15% |
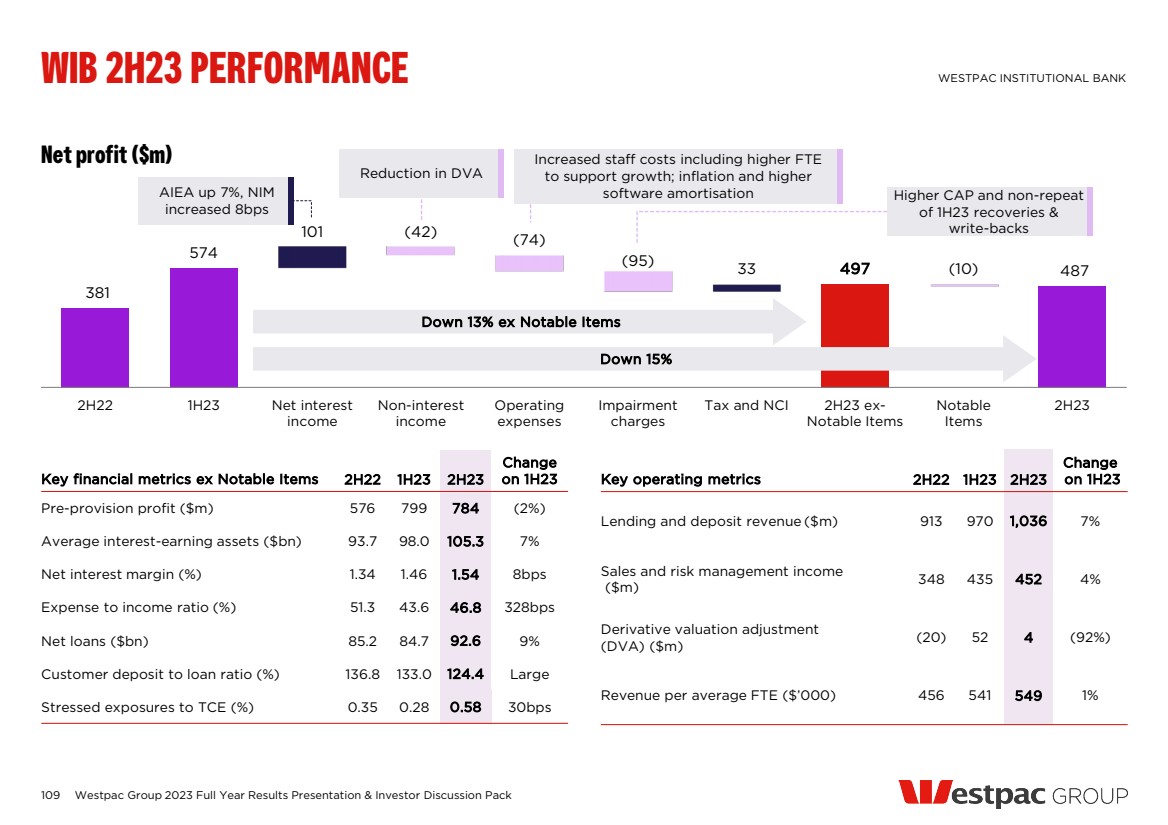
| 110 Net profit ($m) Key financial metrics ex Notable Items 2H22 1H23 2H23 Change on 1H23 Pre-provision profit (NZ$m) 736 748 741 (1%) Average interest-earning assets ($bn) 116 119 119 Flat Net interest margin (%) 2.04 2.10 2.12 2bps Expense to income (%) 44.7 45.5 47.1 167bps Customer deposit to loan ratio (%) 80.5 81.3 80.4 (90bps) Stressed exposures to TCE (%) 0.97 1.33 1.49 16bps Mortgage 90+ day delinquencies (%) 0.22 0.29 0.33 4bps Key operating metrics Sep-22 Mar-23 Sep-23 Change Mar-23 Customers (#m) 1.49 1.50 1.51 1% Digital active customers (#m) 0.96 0.98 0.99 1% Branches (#) 115 114 112 (2) ATMs (#) 439 427 413 (14) Funds (NZ$bn) (spot) 10.9 11.5 11.4 (1%) Westpac Group 2023 Full Year Results Presentation & Investor Discussion Pack NEW ZEALAND 2H23 PERFORMANCE1 NEW ZEALAND 1 In NZ$ unless otherwise noted. 528 426 22 8 173 544 537 (37) (48) (7) 2H22 1H23 Net interest income Non-interest income Operating expenses Impairment charges Tax and NCI 2H23 ex-Notable Items Notable Items 2H23 Up 26% NIM up 2bps Inflation and higher software amortisation costs Lower overlays as risk is now in modelled outcomes, lower IAP Improved card income Up 28% ex Notable Items |
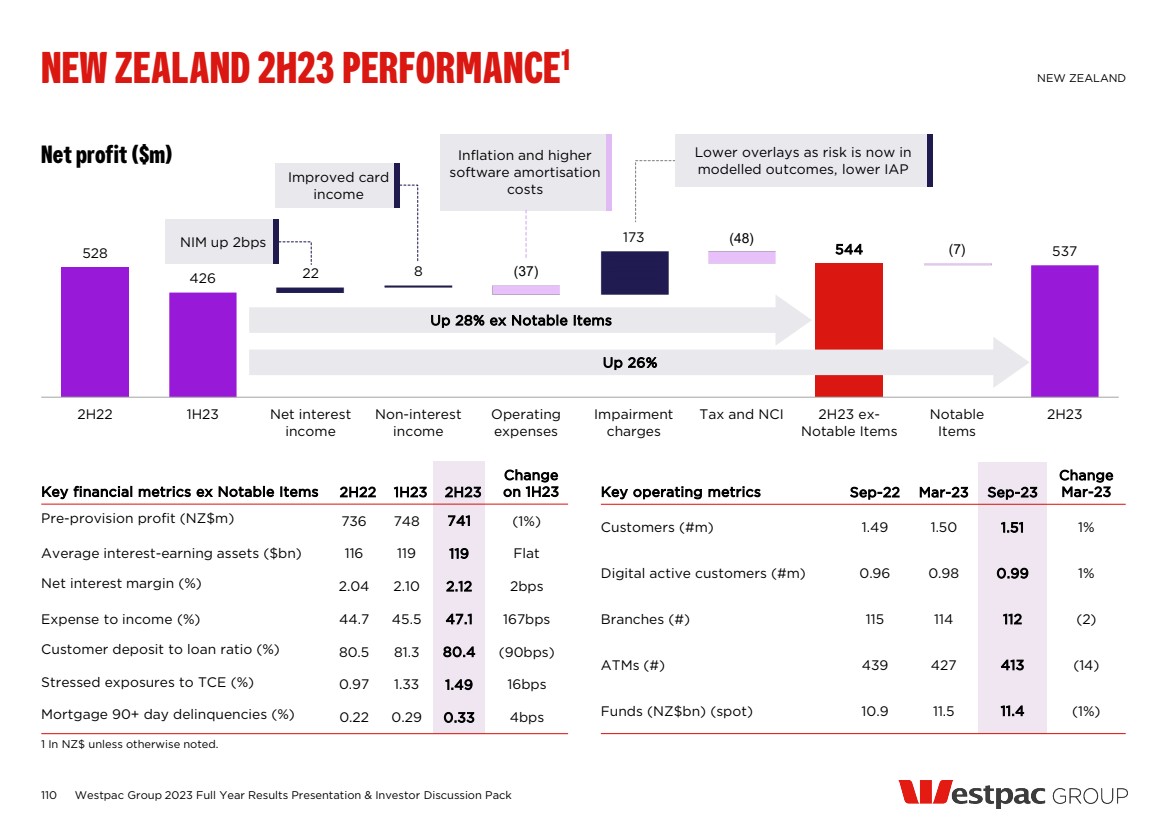
| 56% 26% 18% 111 Net loans (NZ$bn) Customer deposits (NZ$bn) Loans (NZ$bn, % of total)1 Customer deposits (NZ$bn, % of total)1 Westpac Group 2023 Full Year Results Presentation & Investor Discussion Pack NEW ZEALAND BALANCE SHEET NEW ZEALAND 1 Chart may not add due to rounding. 94 97 98 96.8 98.2 0.6 0.5 99.3 Sep-22 Mar-23 Consumer Business Sep-23 77.9 79.8 0.9 79.8 (0.9) Sep-22 Mar-23 Consumer Business Sep-23 62 64 65 66 1 1 1 1 31 32 32 33 Mar-22 Sep-22 Mar-23 Sep-23 Mortgage Personal Business 30 32 36 39 22 21 20 20 26 24 23 21 78 78 80 80 Mar-22 Sep-22 Mar-23 Sep-23 Term deposits Savings Transaction Up 1% Flat 99 1% 66% 33% Household Business Institutional |
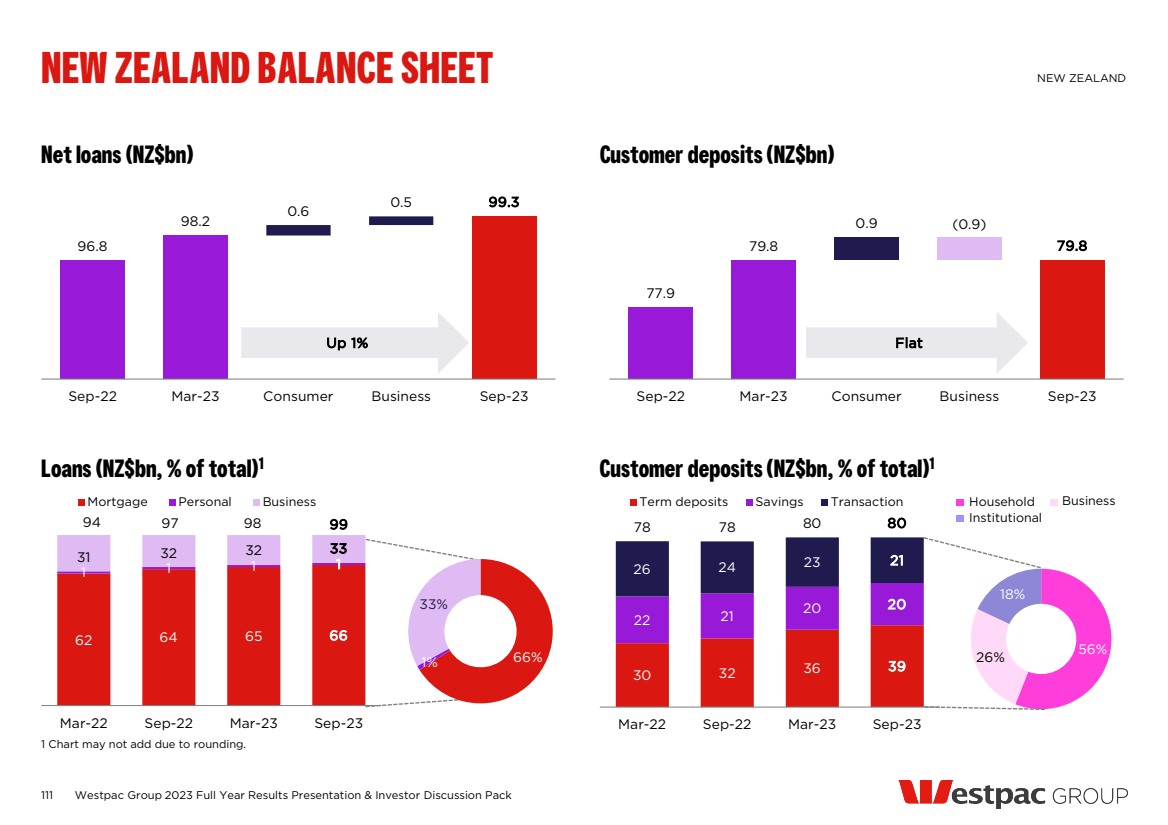
| 237 161 13 112 19 (49) 112 Net profit ($m) Contribution from businesses sold ($m) 2H22 1H23 2H23 Operating income 167 140 0 Operating expenses (49) 18 28 Pre-provision profit 118 158 28 Net profit 74 111 20 Included in businesses sold1 2H22 1H23 2H23 Westpac Life Insurance Services Advance Asset Management Limited - BT Super SFT2 - Westpac Group 2023 Full Year Results Presentation & Investor Discussion Pack SPECIALIST BUSINESSES 2H23 PERFORMANCE SPECIALIST BUSINESSES 1 Tick indicates if business is included in businesses sold for the period. Businesses sold includes one-off costs to prepare businesses for sale. 2 On 1 April 2023, the successor funds transfer (SFT) of the unitised superannuation business was completed. Net interest income 1H23 Operating 2H23 expenses Non-interest Tax and NCI income 1H23 ex-Notable Items 493 (256) (3) 31 2H23 ex-Notable Items (136) Impairment charges Notable Items Notable Items 111 141 Businesses sold Businesses remaining Net gain on sale of Advanced Asset Management Limited Lower expenses from divested businesses Lower delinquencies in auto finance 20 Customer remediation and restructuring Loss of income from divested businesses Businesses 126 remaining Businesses sold |
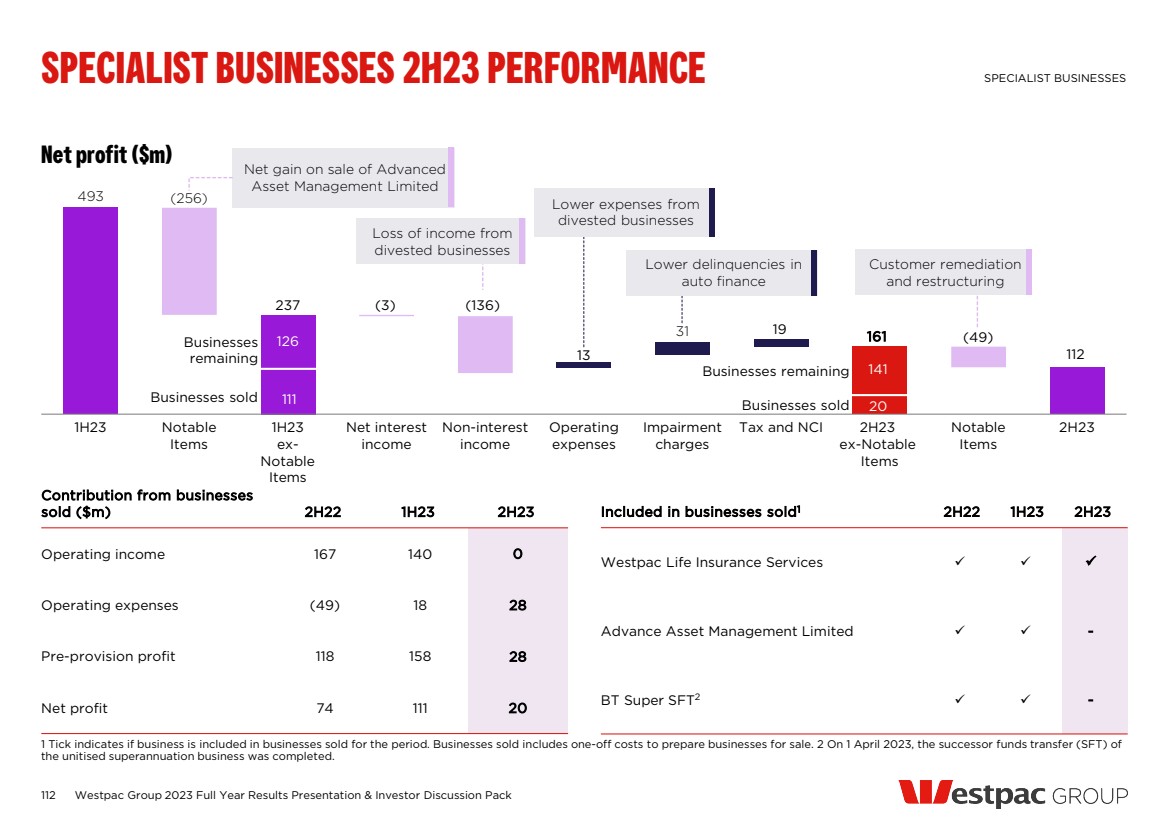
| 113 Platforms1 — Average Funds Under Administration (FUA) balance of $132.6bn increased by 1.4% over the half supported by positive market movements, partly offset by net fund outflows — Deposits of $8.1bn increased by 9.5% over the half reflecting higher interest rates Margin lending — Loan balances of $1.2bn remained stable compared to Mar-23, with customers paying down balances reflecting rising interest rates and market volatility Auto finance — Loan balances of $4.0bn decreased by 25.9% in 2H23 reflecting continued portfolio run-off Westpac Pacific — Loan balances of $1.5bn increased by 7.1% over the half achieved by growth in both Fiji and in PNG Financials excluding Notable Items and businesses sold ($m)2 2H22 1H23 2H23 Change on 1H234 Operating income 483 469 470 0.2% Operating expenses (264) (298) (295) (1.0%) Pre-provision profit 219 171 175 2.3% Net profit 183 126 141 11.9% Key financial metrics 2H22 1H23 2H23 Change on 1H234 Platforms average FUA ($bn)1 127.2 130.8 132.6 1.4% Platforms spot FUA ($bn)1 121.4 131.0 129.9 (0.8%) Platforms deposits ($bn) 6.8 7.4 8.1 9.5% Platform FUA share (excl Corp Superannuation)3 (%) 17.8 17.1 15.8 (130bps) Margin lending ($bn) 1.3 1.2 1.2 Flat Auto finance loans ($bn) 7.1 5.4 4.0 (25.9%) Westpac Pacific loans ($bn) 1.4 1.4 1.5 7.1% Remaining businesses Westpac Group 2023 Full Year Results Presentation & Investor Discussion Pack SPECIALIST BUSINESSES PORTFOLIO SPECIALIST BUSINESSES 1 Also includes residual investments businesses (packaged funds, equities). 2 Restated for the sale of AAML and the successor fund transfer (SFT) of unitised super. 3 Plan For Life, 30 Jun 2023. 4 Change on 1H23 based on rounded numbers. |
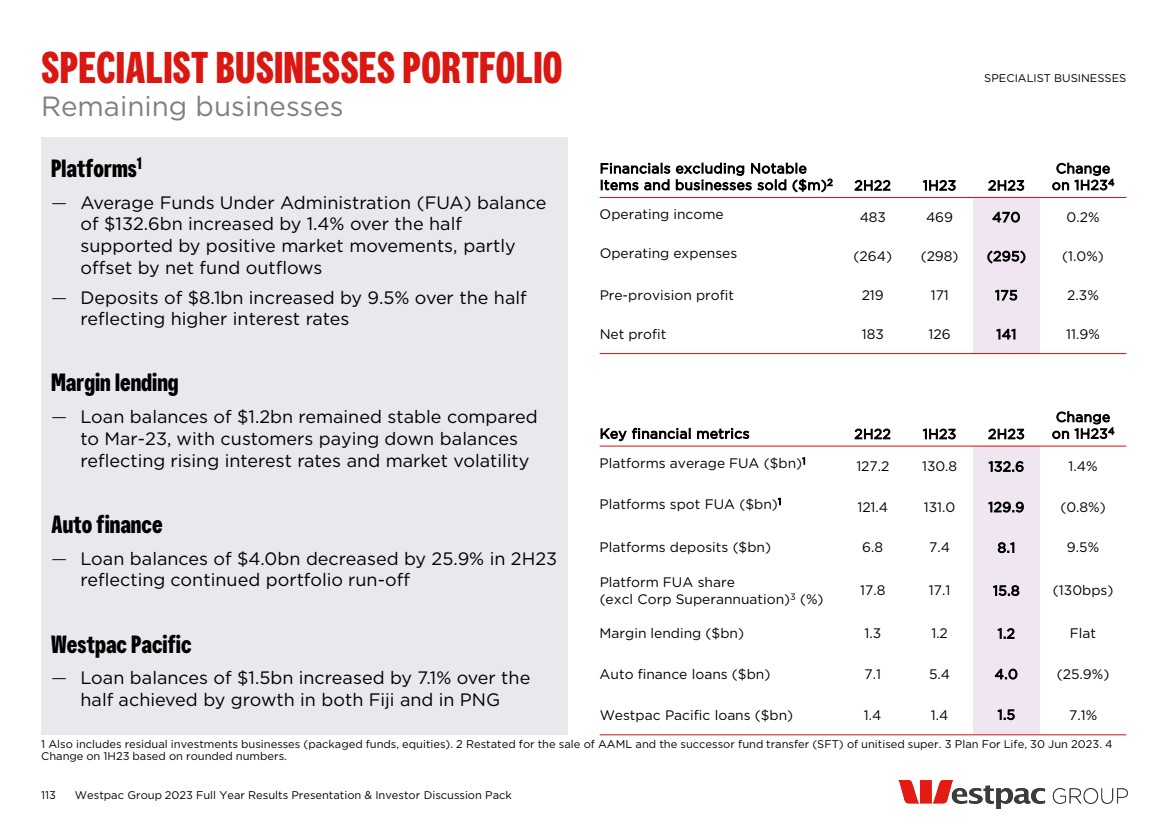
| 114 Active advisers on BT Panorama (#) 6,034 6,059 6,142 6,028 5,945 Sep-21 Mar-22 Sep-22 Mar-23 Sep-23 Managed accounts FUA on BT Panorama ($m) Panorama Platform — Awarded Highest Quality Platform rating – Chant West 20231 — Awarded Best Mobile Platform and Best Client Portal for five consecutive years2 — Continued investment in BT Panorama including the introduction of the service request tracker and bulk reporting feature which address advisers’ need to be more efficient while also improving services — BT’s managed accounts capability is a significant driver of growth on the platform3, with FUA reaching $15.5bn – a 37% increase in FY23 — Panorama FUA was $102.9bn with net flows excluding pension payments4 of $3.0bn. Market and other movements contributed to favourable $7.9bn impact on FUA FUA on BT Panorama ($m) Investors on BT Panorama (#) Westpac Group 2023 Full Year Results Presentation & Investor Discussion Pack BT PANORAMA SPECIALIST BUSINESSES 1 For details https://www.bt.com.au/about-bt/bt-financial-group/overview/awards.html. 2 Investment Trends Competitive Analysis & Benchmarking Report, December 2018 – 2022. 3 Excluding Adviser Portfolios. 4 Including pension payments BT Panorama net flows were ($0.9bn) in FY23. 9,253 10,856 11,272 13,675 15,492 Sep-21 Mar-22 Sep-22 Mar-23 Sep-23 Up 37% Up 13% Down 3% Down 1% 234,948 236,741 250,809 250,393 246,068 Sep-21 Mar-22 Sep-22 Mar-23 Sep-23 104,779 105,012 95,891 102,068 102,872 Sep-21 Mar-22 Sep-22 Mar-23 Sep-23 Down 2% Down 2% Up 7% Up 1% |
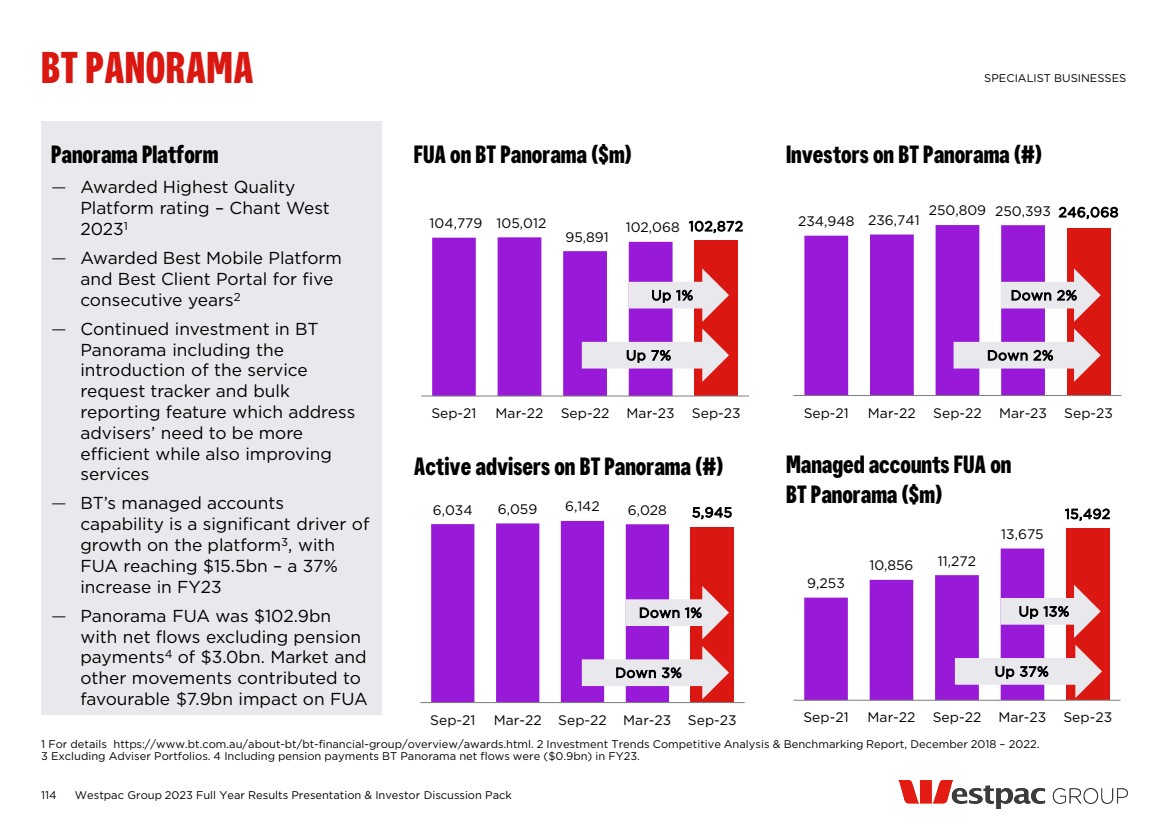
| ECONOMICS 2023 Full year financial results |
| 2021 2022 2023F 2024F Australia Credit growth Total – year end 6.8 7.8 4.4 3.5 Housing – year end 7.4 6.5 4.1 4.6 Business – year end 7.3 11.9 5.3 1.5 New Zealand Credit growth Total – year end 7.5 4.6 2.5 4.2 Housing – year end 10.5 4.4 2.9 4.5 Business – year end 3.6 5.4 1.9 3.8 2022 2023 Calendar Years Q2 Q3 Q4 Q1 Q2 Q3E Q4F 2021 2022 2023F 2024F World GDP1 - - - - - - - 6.3 3.4 3.0 3.1 Australia GDP2 3.1 6.0 2.7 2.4 2.1 1.7 1.2 4.6 2.7 1.2 1.6 Unemployment – end period 3.8 3.5 3.5 3.6 3.6 3.7 3.8 4.7 3.5 3.8 4.7 CPI headline – year end 6.1 7.3 7.8 7.0 6.0 5.4 4.6 3.5 7.8 4.6 3.4 Interest rates – cash rate 0.85 2.35 3.10 3.60 4.10 4.10 4.35 0.10 3.10 4.35 3.85 New Zealand GDP2 0.7 6.6 2.4 2.2 1.8 0.2 0.8 3.2 2.3 0.8 1.1 Unemployment – end period 3.3 3.3 3.4 3.4 3.6 3.9 4.3 3.2 3.4 4.3 5.2 Consumer prices 7.3 7.2 7.2 6.7 6.0 5.6 5.1 5.9 7.2 5.1 3.2 Interest rates – official cash rate 2.00 3.00 4.25 4.75 5.50 5.50 5.50 0.75 4.25 5.50 5.75 116 Key economic indicators Key economic indicators Private sector credit growth (% Ann) (%) At 31 Oct 2023 Westpac Group 2023 Full Year Results Presentation & Investor Discussion Pack AUSTRALIAN AND NEW ZEALAND ECONOMIC FORECASTS ECONOMICS -8 -4 0 4 8 12 16 Dec-09 Dec-11 Dec-13 Dec-15 Dec-17 Dec-19 Dec-21 Dec-23 Total credit Australia Housing Australia Business Australia Westpac f’casts % ann Sources: RBA, Statistics NZ, Westpac Economics 1 Year average growth rates. 2 Through the year growth rates. Sources: RBA, Westpac Economics Sources: IMF, RBA, Statistics NZ, Westpac Economics |
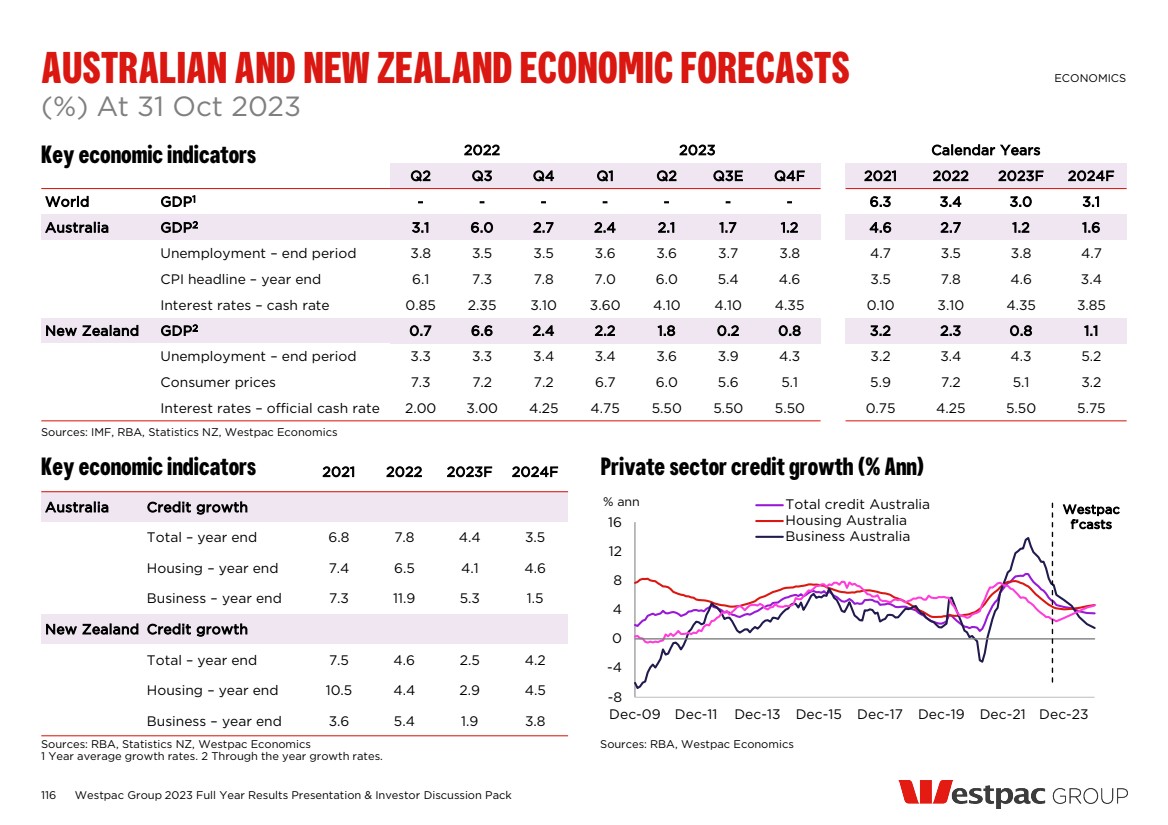
| 117 Australian dwelling prices (%, 3 month annualised) Dwelling prices (% change over period) - (to Oct-23) Westpac economics dwelling price forecasts (annual %) Prices showing broad-based lift Westpac Group 2023 Full Year Results Presentation & Investor Discussion Pack AUSTRALIAN HOUSING MARKET ECONOMICS Sources: CoreLogic, Westpac Economics * average last 10yrs. Sources: CoreLogic, Westpac Economics -20 -15 -10 -5 0 5 10 15 20 25 30 35 40 Oct-15 Oct-16 Oct-17 Oct-18 Oct-19 Oct-20 Oct-21 Oct-22 Oct-23 Oct-24 % rate cuts rate hikes Sources: CoreLogic, Westpac Economics Capital city Pop’n Last 3 mths Last 12 mths Last 5 years Sydney 5.3m Up 2.5% Up 8.9% Up 35.1% Melbourne 5.0m Up 1.5% Up 2.7% Up 19.0% Brisbane 2.6m Up 4.0% Up 7.9% Up 50.0% Perth 2.2m Up 4.3% Up 10.5% Up 51.0% Capital city Pop’n avg* 2020 2021 2022 2023F 2024F Sydney 5.3m 6.3 2.7 25.3 -12.1 10 6 Melbourne 5.0m 5.0 -1.3 15.1 -8.1 4 3 Brisbane 2.6m 4.9 3.6 27.4 –1.1 6 4 Perth 2.2m 1.1 7.3 13.1 3.6 8 8 Australia 26m 5.1 1.8 20.9 -7.1 7 4 2019 election COVID-19 ‘Delta’ Macro-prudential measures Macro-prudential measures |
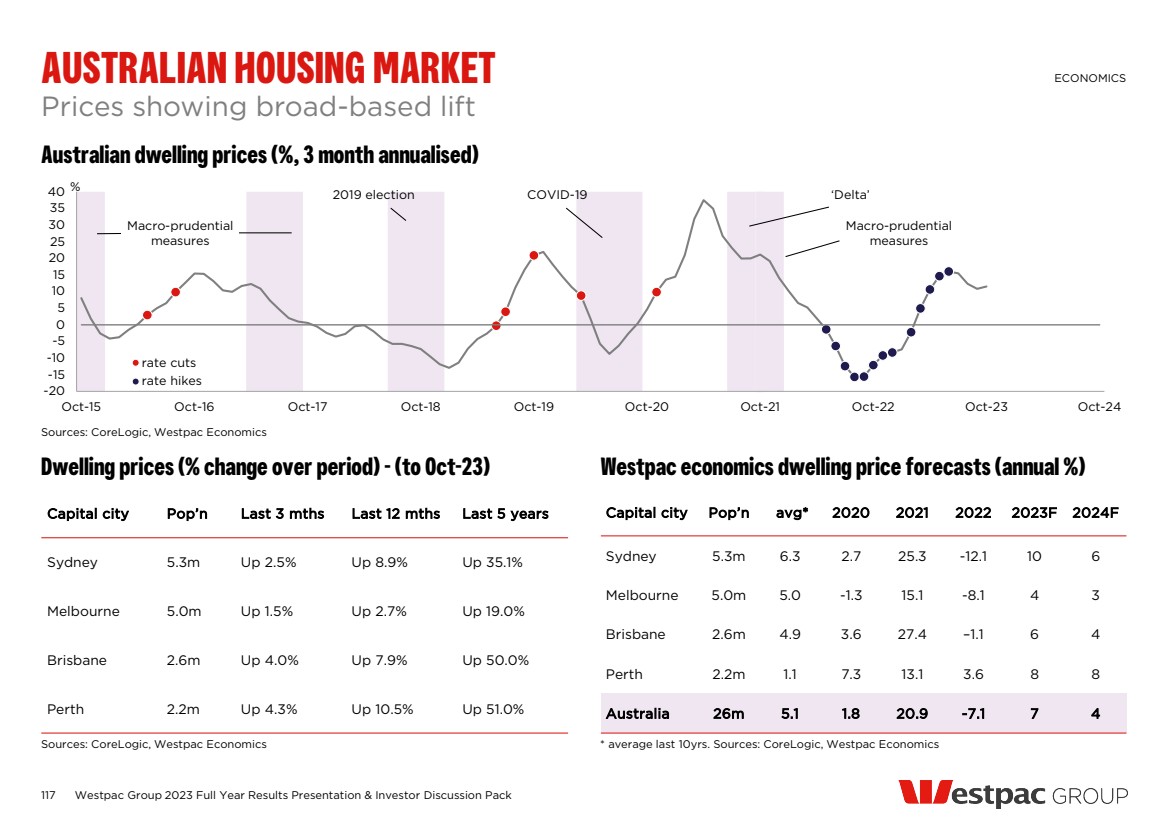
| 118 Monthly house sales and prices (% Yr) New Zealand dwelling prices (index) House price forecast Dwelling prices (% change over period) – (to Oct-23) Sharp downturn as interest rates have increased Westpac Group 2023 Full Year Results Presentation & Investor Discussion Pack NEW ZEALAND HOUSING MARKET ECONOMICS Sources: CoreLogic, Westpac Economics Sources: CoreLogic, REINZ, Westpac Economics Source: REINZ -20 -10 0 10 20 30 40 0 2,000 4,000 6,000 8,000 10,000 12,000 14,000 2004 2007 2010 2013 2016 2019 2022 Sales %YR Sales (lhs) House prices (rhs) 750 1250 1750 2250 2750 750 1250 1750 2250 2750 2007 2009 2011 2013 2015 2017 2019 2021 2023 Auckland Canterbury Wellington Other regions Index Index -20 -10 0 10 20 30 40 0 500 1000 1500 2000 2500 3000 2010 2012 2014 2016 2018 2020 2022 2024 Annual growth (right axis) Level (left axis) Index = 1000 in 2010 Sources: REINZ, Westpac Economics Forecast (Annual %) Ave. past 10 years 2020 2021 2022f 2023f 2024f Nationwide 8% +17% +27% -11% +1% +8% Capital city Pop’n Last 3 mths Last 12 mths Last 5 years Auckland 1.7m Up 2% Down 3% Up 19% Wellington 0.5m Up 3% Down 3% Up 30% Canterbury 0.7m Up 1% Down 1% Up 50% Nationwide 5.1m Up 2% Down 3% Up 32% %YR Westpac forecasts |
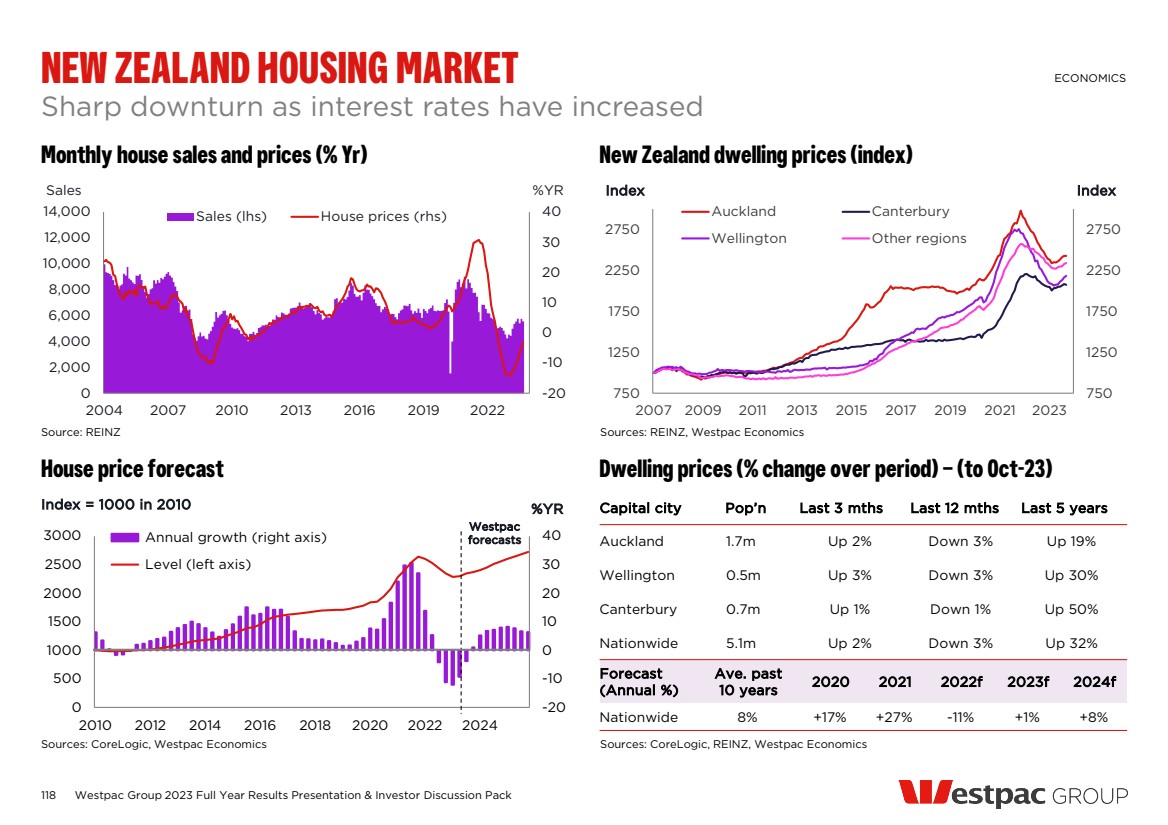
| APPENDIX 2023 Full year financial results |
| APPENDIX 1: NET PROFIT EX NOTABLE ITEMS1 120 Westpac Group 2023 Full Year Results Presentation & Investor Discussion Pack APPENDIX 1 For further information refer to Westpac’s 2023 Full Year Results Announcement. $m 1H23 2H23 FY22 FY23 Change 2H23 – 1H23 (%) Change FY23 – FY22 (%) Net interest income 9,202 9,212 16,606 18,414 Flat 11 Non-interest income 1,669 1,459 3,299 3,128 (13) (5) Net operating income 10,871 10,671 19,905 21,542 (2) 8 Expenses (4,988) (5,244) (10,181) (10,232) 5 1 Pre-provision profit 5,883 5,427 9,724 11,310 (8) 16 Impairment charges (390) (258) (335) (648) (34) 93 Tax and non-controlling interests (NCI) (1,670) (1,624) (2,821) (3,294) (3) 17 Net profit 3,823 3,545 6,568 7,368 (7) 12 |
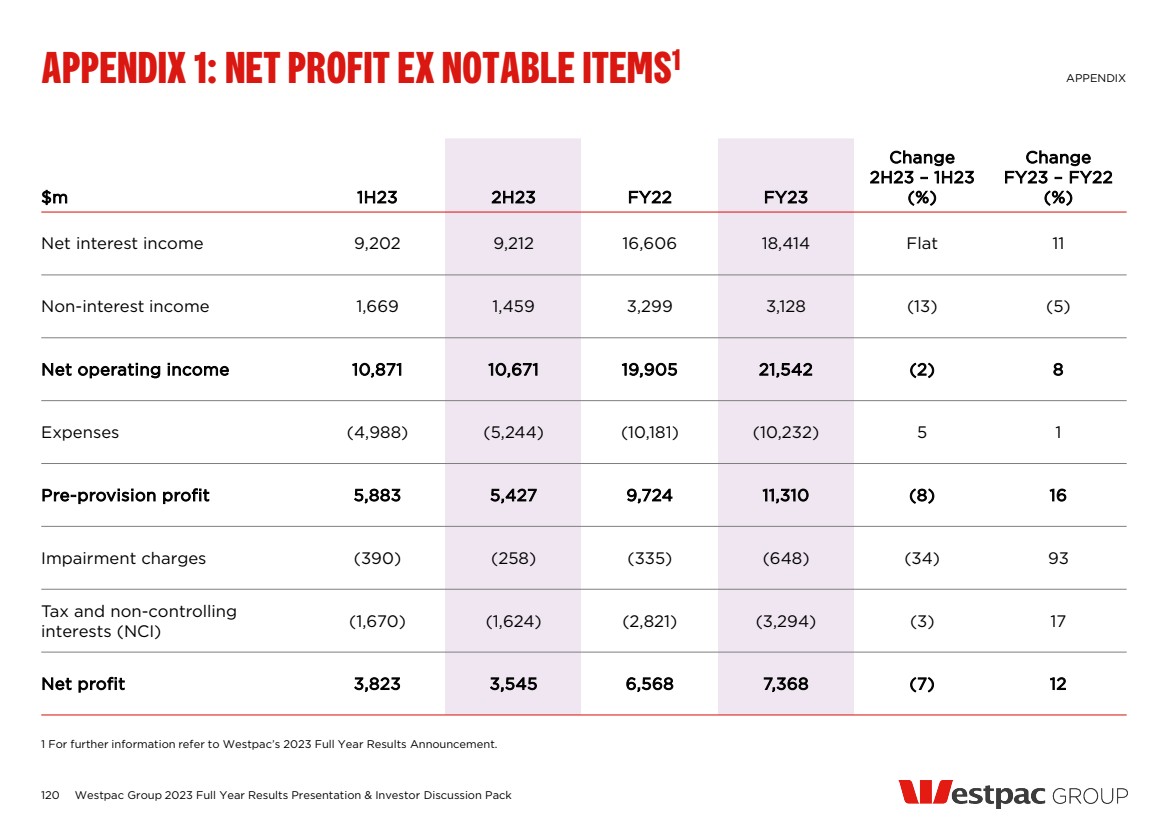
| ($m) Net profit after tax Hedging Notable Items2 Net profit excluding hedging Notable Items3 Other Notable Items4 Net profit excluding Notable Items5 Impact of businesses sold FY23 Net profit excluding Notable Items & impact of business sold FY22 Net profit excluding Notable Items & impact of business sold % change FY23-FY22 Net interest income 18,317 (19) 18,336 (78) 18,414 - 18,414 16,600 11 Non-interest income 3,328 (18) 3,346 218 3,128 140 2,988 2,907 3 Net operating income 21,645 (37) 21,682 140 21,542 140 21,402 19,507 10 Expenses (10,692) - (10,692) (460) (10,232) 46 (10,278) (10,054) 2 Pre-provision profit 10,953 (37) 10,990 (320) 11,310 186 11,124 9,453 18 Impairment charges (648) - (648) - (648) - (648) (342) 89 Tax and non-controlling interests (NCI) (3,110) 11 (3,121) 173 (3,294) (55) (3,239) (2,729) 19 Net profit 7,195 (26) 7,221 (147) 7,368 131 7,237 6,382 13 APPENDIX 2: FY23 NOTABLE ITEMS AND IMPACT OF BUSINESSES SOLD1 121 Westpac Group 2023 Full Year Results Presentation & Investor Discussion Pack APPENDIX 1 For further information refer to Westpac’s 2023 Full Year Results Announcement. 2 Economic hedges and hedge ineffectiveness, included in cash earnings adjustments in previous periods. 3 Referred to as Cash earnings in previous periods. 4 Other Notable Items include provisions for remediation, litigation, fines and penalties; impact from asset sales and revaluations; asset write-downs and restructuring costs. 5 Referred to as Cash earnings excluding Notable Items in previous periods. |
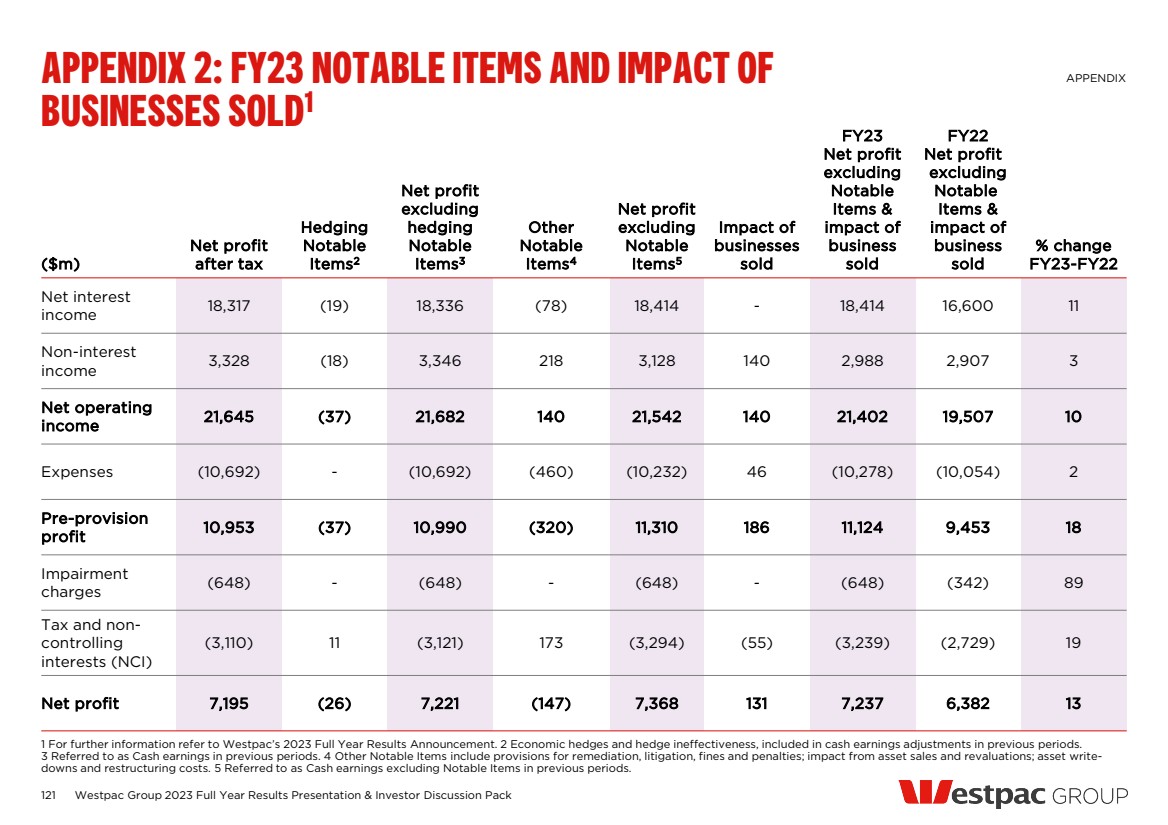
| ($m) Net profit after tax Hedging Notable Items2 Net profit excluding hedging Notable Items3 Other Notable Items4 Net profit excluding Notable Items5 Impact of businesses sold 2H23 Net profit excluding Notable Items & impact of business sold 1H23 Net profit excluding Notable Items & impact of business sold % change 2H23-1H23 Net interest income 9,204 70 9,134 (78) 9,212 - 9,212 9,202 Flat Non-interest income 1,438 4 1,434 (25) 1,459 - 1,459 1,529 (5) Net operating income 10,642 74 10,568 (103) 10,671 - 10,671 10,731 (1) Expenses (5,704) - (5,704) (460) (5,244) 28 (5,272) (5,006) 5 Pre-provision profit 4,938 74 4,864 (563) 5,427 28 5,399 5,725 (6) Impairment charges (258) - (258) - (258) - (258) (390) (34) Tax and non-controlling interests (NCI) (1,486) (22) (1,464) 160 (1,624) (8) (1,616) (1,623) Flat Net profit 3,194 52 3,142 (403) 3,545 20 3,525 3,712 (5) APPENDIX 3: 2H23 NOTABLE ITEMS AND IMPACT OF BUSINESSES SOLD1 122 Westpac Group 2023 Full Year Results Presentation & Investor Discussion Pack APPENDIX 1 For further information refer to Westpac’s 2023 Full Year Results Announcement. 2 Economic hedges and hedge ineffectiveness, included in cash earnings adjustments in previous periods. 3 Referred to as Cash earnings in previous periods. 4 Other Notable Items include provisions for remediation, litigation, fines and penalties; impact from asset sales and revaluations; asset write-downs and restructuring costs. 5 Referred to as Cash earnings excluding Notable Items in previous periods. |
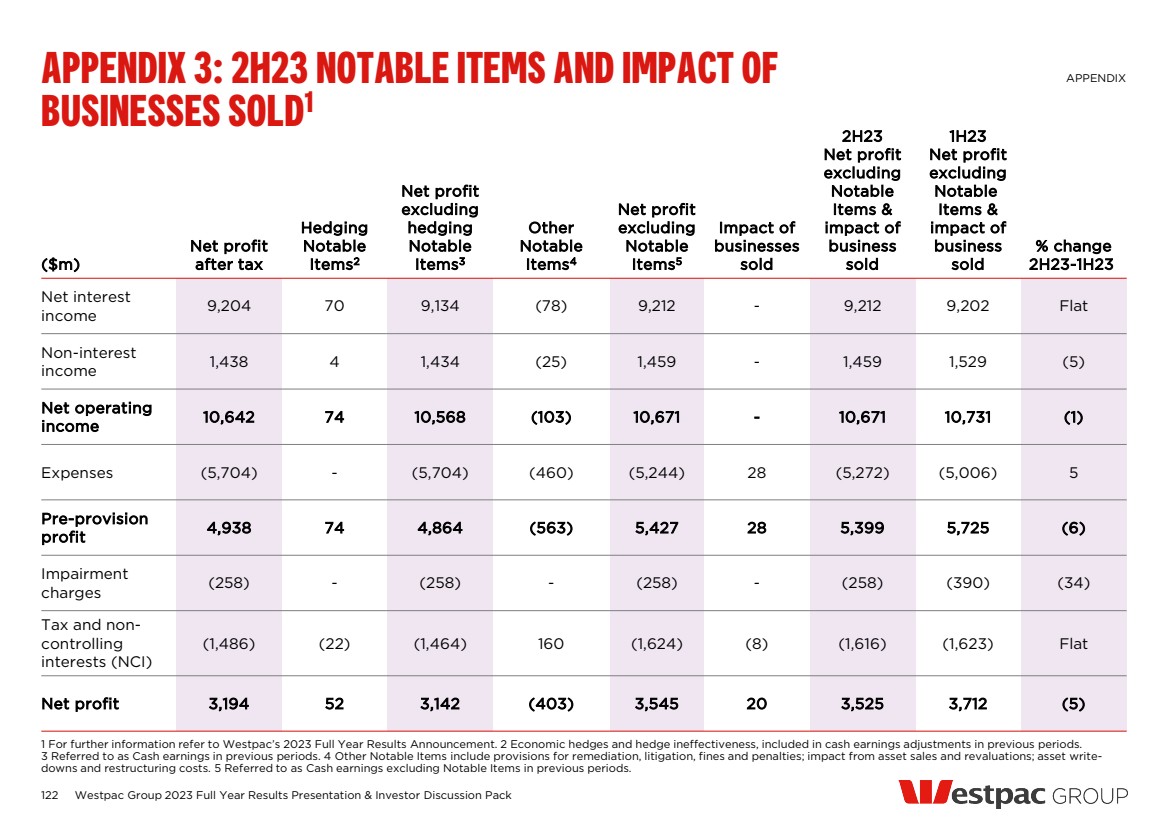
| Milestones in FY23 123 Westpac Group 2023 Full Year Results Presentation & Investor Discussion Pack APPENDIX 4: MAJOR CUSTOMER REMEDIATION APPENDIX 1 Excludes provisions and costs associated with litigation. Notable Items only. These provisions were raised in the individual years. The data is not net of utilisation. Provisions for customer refunds, payments and associated costs1 ($m) FY17 FY18 FY19 FY20 FY21 FY22 FY23 Total Banking 94 122 362 144 (135) 2 88 677 Wealth 75 146 802 208 251 51 - 1,533 Implementation costs – 62 232 196 195 32 15 732 Net profit impact of above 118 231 977 384 218 60 72 2,060 Five major remediation programs were closed in FY23 including Advice- related program Paid $194.8 million to more than 867,000 customers in FY23 One new major remediation program commenced in FY23 |
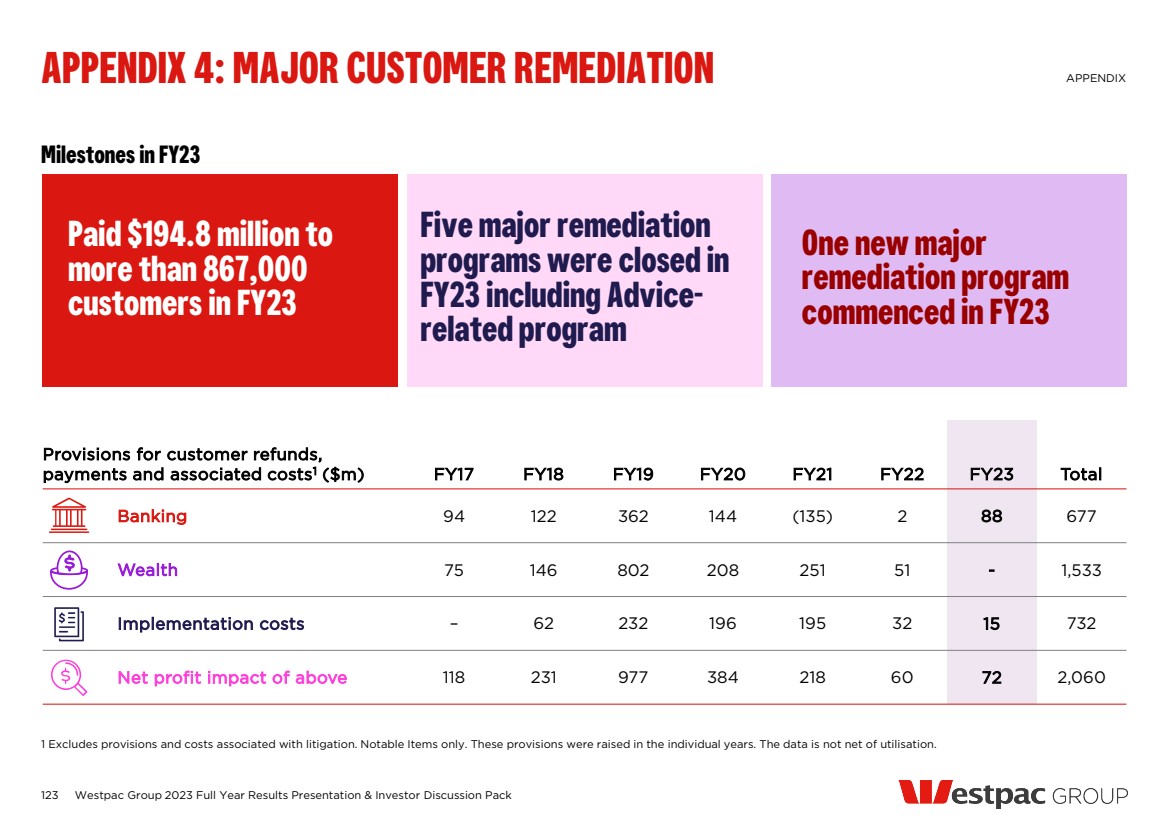
| Transactions completed Completed Divestment CET1 benefit (bps, $m1 ) Westpac NZ Wealth Advisory Dec 2020 – Westpac General Insurance Jul 2021 12bps, ~$500m Vendor Finance Aug 2021 1bp, ~40m Westpac LMI Aug 2021 7bps, ~$300m Westpac Life-NZ- Limited Feb 2022 7bps, ~$300m Motor Vehicle Finance Dec 2021 8bps, ~$350m Westpac Life Insurance Services Aug 2022 13bps, ~$500m Advance Asset Management Limited Mar 2023 Successor funds transfer (SFT) of Superannuation2 Apr 2023 10bps, ~$450m BT Private Portfolio Management 1 Oct 2023 Divestment benefits 58bps, ~$2,440m 124 APPENDIX 5: BUSINESSES EXITED APPENDIX 1 The value of capital released also includes the benefit of lower RWA. 2 BT personal and corporate superannuation funds. Westpac Group 2023 Full Year Results Presentation & Investor Discussion Pack |
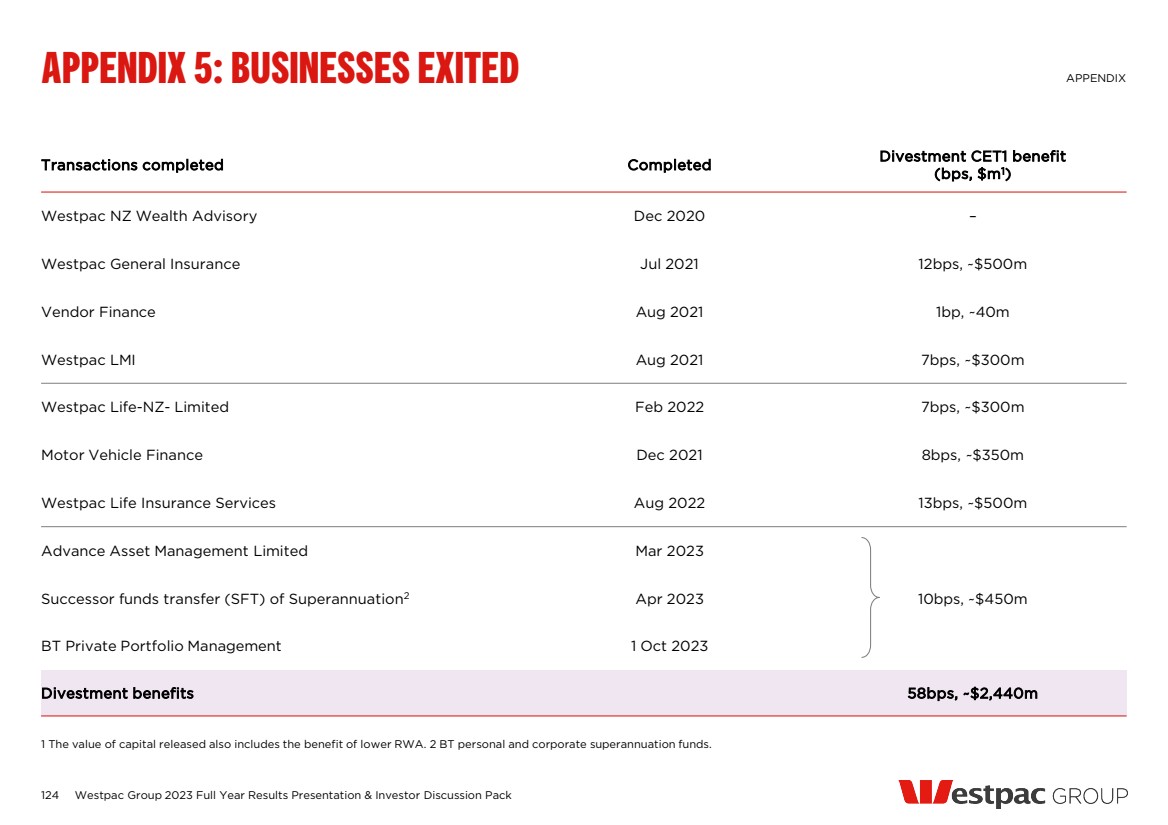
| 125 Investing in fintech businesses Westpac Group 2023 Full Year Results Presentation & Investor Discussion Pack APPENDIX 6: REINVENTURE APPENDIX Logos are of the respective companies. Westpac has committed $150m in fintech venture capital funds, managed by reinventure — Reinventure enables Westpac to access insights and adjacent business opportunities, both in Australia and offshore — The model also helps Westpac to source commercial partnerships that create value for customers NEW BUSINESS MODELS NEW TECHNOLOGY CAPABILITIES DATA, AI AND ANALYTICS Full stack payments platform Uses data to shed light on high volume crimes, improving prevention and detection Digital financial service company offering credit products to tech-savvy Australian consumers and businesses Helps home sellers make decisions about who they choose to sell their property Business loan marketplace that matches SMEs to the best lender based on their characteristics and needs Logistics and hospitality software providing ordering, delivery and payment functionality AI-powered, context-as-a-service platform, to deliver personalised experiences to customers B2B platform for physical retail stores that provides insights through their AI engine and in-store sensors A consumer digital lending platform Conversational voice-based AI for digital interviewing, powered by machine learning A leading digital credit platform in Indonesia Empowering banks to connect seamlessly with merchants and their customers Providing digital mortgage broking Enterprise cyber security company that protects businesses from malicious bot attacks Enabling software development teams to scale processes and improve code quality Digitised debt collection, leveraging modern communications, automation and machine learning A fund of funds for cryptocurrency and blockchain technology Smart receipts that automatically link purchase receipts to customers’ bank accounts Pioneering a new asset class called Tradeable Income Based Securities (TIBS) Creating real-game assets for developers, using blockchain technology Helps banks and fintechs make better decisions using a single API and dashboard to manage KYC/AML and fraud Helping Australians create their wills online A one-click checkout platform transforming online transactions Data-science-as-a-service AI-powered donor scoring software for the NFP sector AI company that integrates neuroscience into their platform creating capability that not only manages complex problems but is able to form intrinsic relationships with humans |
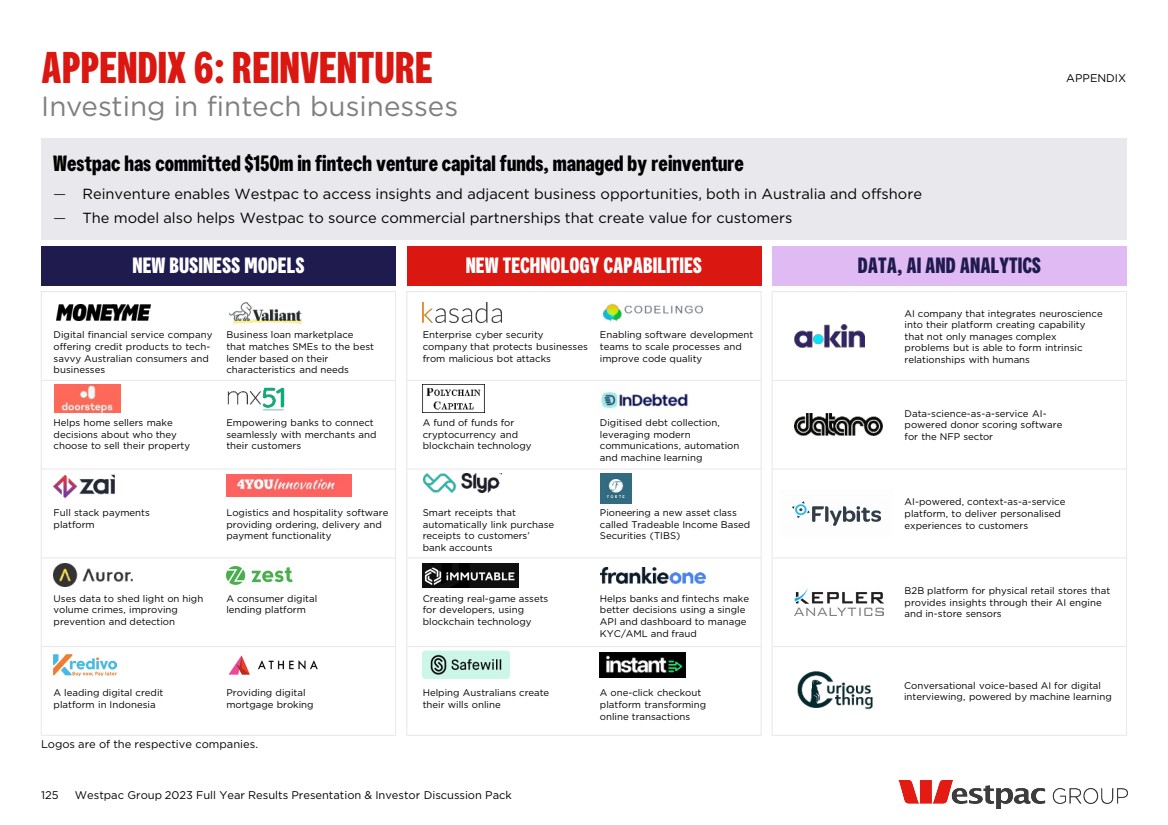
| Our commitment to sustainability 1. Customers experiencing financial hardship who accessed a financial assistance package is defined in the Glossary section in our 2023 Sustainability Index and Datasheet 2. A unique customer is a customer that has called through to the Indigenous call centre at least once during the reportable period 01/04/2022 - 30/09/2025 3. Spend with diverse and Indigenous suppliers are defined in the Glossary section in our 2023 Sustainability Index and Datasheet 4. Westpac Scholars Trust (ABN 35 600 251 071) is administered by Westpac Scholars Limited (ABN 72 168 847 041) as trustee for the Westpac Scholars Trust. Westpac Scholars Trust is a private charitable trust and neither the Trust nor the Trustee are part of the Westpac Group. Westpac provides administrative support, skilled volunteering, and funding for operational costs of Westpac Scholars Trust. 5. Active scholars refers to the total number of individuals who have been awarded a scholarship by Westpac Scholars Trust and have completed or are in the process of completing their degree or fellowship. 6. Westpac Foundation is administered by Westpac Community Limited (ABN 34 086 862 795) as trustee for Westpac Community Trust (ABN 53 265 036 982). The Westpac Community Trust is a Public Ancillary Fund, endorsed by the ATO as a Deductible Gift Recipient. None of Westpac Foundation, Westpac Community Limited nor the Westpac Community Trust are part of Westpac Group. Westpac provides administrative support, skilled volunteering, donations and funding for operational costs of Westpac Foundation. 7. This is a cumulative target which comprises (a) $5b for lending to climate change solutions, $700m for lending for healthy, affordable and social housing, and other sustainable lending, and (b) facilitation of sustainable bonds by Westpac Banking Corporation - New Zealand Branch from 1 October 2020 to 30 September 2025. The sustainable finance target includes finance for social and non-climate sustainability initiatives which may not reduce climate change risk. All sustainable finance reported is informed by global sustainable finance market standards, principles and guidance that are commonly used to label or categorise loans and bonds as sustainable. In mid-2023, the Westpac Warm up loan was renamed the Westpac Greater Choices home loan and extended to include lending that is aligned specifically to climate change solutions (e.g. EV loans), not solely healthy homes. Therefore, our cumulative reporting for 2023 does not include new lending since 2022. From 2024, Westpac intends to include Greater Choices home loan lending as part of the overall sustainable lending target. 8. Rated ‘A’ by Monash University in their Modern Slavery Disclosure Quality Ratings – ASX 100 Companies Update 2022 report for our FY20 and FY21 modern slavery disclosures; and recognised as one of three ‘front runners’ in BankTrack’s Global Human Rights Benchmark Report 2022 for our FY21 modern slavery disclosures 9. The SCSC program exists to help protect and seeks to create safer communities for children across Australia and APAC, through a series of actions, investments and collaborations with industry experts and partners Becoming a net-zero, climate resilient bank 1. 2021 baselines for scope 1, 2 and scope 3 upstream emissions targets adjusted for COVID-19 pandemic and other impacts. Refer to our 2023 Sustainability Index and Datasheet. 2. Refer to our 2023 Sustainability Index and Datasheet for details of included Scope 3 upstream emissions sources. 3. On track to achieve 100% renewables outcome for our direct operations. 95% of this supply is expected to be sourced from within the markets the electricity is consumed. We will continue to identify opportunities to lift local sourcing to 100%, to include for our Fiji and PNG businesses, as required to achieve 100% under the RE100/CDP Standard. 4. Certification is obtained for Westpac’s Australian and New Zealand operations (excludes financed emissions) under the Australian Government’s Climate Active Carbon Neutral Standard for Organisations and the New Zealand Toitū net carbonzero certification respectively. Further information can be found on the Sustainability Performance Reports page on our website. 5. These include green, social, sustainability, sustainability-linked and re-linked loans and bonds and have not been assessed under our new Sustainable Finance Framework. 6. Climate change solutions activities are defined in the Glossary section in our 2023 Sustainability Index and Datasheet. New lending represents the total of new and increases in lending commitments, excluding refinances 7. Australian Banking Association, Australian Sustainable Finance Institute, and Australian Industry Energy Transitions Initiative Our FY23 carbon footprint 1. Sectors in our financed emissions analysis are based on ANZSIC codes. These sector definitions differ from those used for our 2030 emission reduction targets and Group Exposure by Sector – includes breakdown of sectors that may be exposed to higher climate change risk reporting. Summary of our 2030 emission reduction targets 1. Includes exploration, extraction and drilling companies, all activities integrated oil and gas companies (IOCs), tolling and stand-alone refineries and LNG producers. Does not include downstream retail and distribution, pipeline infrastructure, storage and transport, nor trading entities. 2. Updated existing targets for NZBA sectors (thermal coal mining, upstream oil and gas, and commercial real estate (offices)). Refer to our 2023 Climate Report for more information. 3. Covers the production and sale of thermal coal, with adjacent sectors (including mining service providers) to be covered in other targets as appropriate. Transactional banking and rehabilitation bonds are excluded. 4. Annually, we calculate the percentage of revenue coming directly from thermal coal mining by assessing customers’ full-year audited financial reports, based on a rolling average of the prior three years of revenues. 5. Refers to scope 1 and 2 emissions of power generators, i.e. customers with >10% revenue coming from power generation or >5% revenues from thermal coal electricity generation. In Australia, this applies to customers under ANZSIC (1993) code 3610 with National Greenhouse and Energy Reporting Scheme designated generation facilities and have >10% revenue coming from power generation APPENDIX 7: SUSTAINABILITY – FOOTNOTES APPENDIX The information on this page contains ‘forward-looking statements’ and statements of expectation reflecting Westpac’s current views on future events. They are subject to change without notice and certain risks, uncertainties and assumptions which are, in many instances, beyond its control. Please refer to the disclaimer on page 134. 126 Westpac Group 2023 Full Year Results Presentation & Investor Discussion Pack |
| Summary of our 2030 emission reduction targets 6. This target covers customers that produce clinker in-house. The target has been set for customers’ scope 1 and 2 emissions in relation to the production of cement. It covers emissions generated from calcination in clinker production as well as fuel combustion and electricity consumption associated with the cement production process 7. Base building operational scope 1 and 2 emissions. Target excludes all scope 3 emissions (e.g. tenant emissions from electricity and appliance use, construction, embodied emissions and corporate activities) 8. Our target applies to facilities that are assigned office related ANZSIC codes, and with a TCE greater than or equal to $5 million A$ for Australian facilities or $5 million NZ$ for New Zealand facilities. This excludes exposures associated with site finance, construction and renovation of commercial real estate assets 9. Floor space is defined as net-lettable area (NLA). In Australia, the standard used for determining the NLA is set out in the Property Council of Australia (PCA) March 1997 Method of Measurement. In New Zealand, this is Rentable Area as set out in The Guide for the Measurement of Rentable Areas NZ 10. Steel represents a very small percentage of Westpac’s lending portfolio and a small number of customers. To protect our customers confidentiality, we have adopted a ‘traffic light’ system to disclose our performance against the target. Unlike other targets, we will not be disclosing our baseline or progress 11. Covers customers that operate scheduled air transport for passengers, including freight operations undertaken by passenger airline operators 12. The aviation sector was highly impacted by the effects of the COVID-19 pandemic resulting in emissions intensities higher than the IEA NZE 2050 pathway (less people flying). Increased activity (more people flying) will improve efficiency and result in some reduction in emissions intensity 13. Passenger kilometres (pkm) is a measure of activity for passenger airline operators 14. Applies to institutional and commercial relationship-managed agribusiness customers with total committed exposures (TCE) ≥ $1.5 million who are captured by dairy, beef, sheep and mixed farming ANZSICs 15. Applies to relationship-managed agribusiness customers with TCE equal to or greater than $NZ1.0 million who are captured by dairy and sheep and beef farming ANZSICs 16. Land management emissions refers to operational emissions resulting from how land is managed rather than emissions resulting from land-use change or on-farm carbon removals. Land management emissions arise from processes such as enteric fermentation, fertiliser use and manure management 17. Fat Protein Corrected Milk is a commonly used measure of dairy farm outputs. FPCM is milk corrected for its fat and protein content to a regional standard. In SBTi FLAG (reference scenario we used for setting Agriculture targets), dairy production is expressed in tonnes of fat and protein corrected milk 18. In SBTi FLAG animal commodities production is expressed in tonnes of fresh weight of carcass where carcass is defined as animal meat, fresh, chilled or frozen, with bone in 19. Excludes mortgages on vacant land as well as construction and renovation loans given there are no in-use operational emissions associated with these 20. Scope 1 and 2 emissions refer to in-use operational emissions from energy associated with the operation of the building, consisting of purchased electricity and natural gas consumption Assessing climate-related risks on our financial position 1. Represents the sum of the committed portion of direct lending (including funds placement overall and deposits placed), contingent and pre-settlement risk plus the committed portion of secondary market trading and underwriting risk 2. Every six months we update the physical risk analysis of our Australian residential mortgage portfolio. The analysis estimates the portion of our mortgages exposed to higher physical risks under climate scenarios developed by the Intergovernmental Panel on Climate Change (IPCC). The analysis uses a generalised model of how extreme natural disasters and climate change may impact individual properties. Australian locations that may experience higher physical risk by 2050 is defined in the Glossary section in our 2023 Sustainability Index and Datasheet 3. Other mining includes iron ore, metal ore, construction material, exploration and services. Exposure values reflect TCE for the mining sector across Westpac Group at Sep-23. The mining population is defined by relevant ANZSIC codes 4. Coal - thermal & metallurgical includes thermal and metallurgical coal mining. It excludes metallurgical coal mining in diversified miners Climate-related opportunities 1. These include green, social, sustainability, sustainability-linked and re-linked loans and bonds and have not been assessed under our new Sustainable Finance Framework 2. Based on IJGlobal and Westpac Research Data for the period 1 October 2018 to 30 September 2023 3. Climate change solutions activities are defined in the Glossary section in our 2023 Sustainability Index and Datasheet 4. TCE represents the maximum amount of credit exposure that Westpac has committed to provide to a customer, both on- and off-balance sheet, including those that arise from transactional banking 5. Due to data availability, the market share value has calculated based on Jan-Jun 2022 and Jan-Jun 2023 APPENDIX The information on this page contains ‘forward-looking statements’ and statements of expectation reflecting Westpac’s current views on future events. They are subject to change without notice and certain risks, uncertainties and assumptions which are, in many instances, beyond its control. Please refer to the disclaimer on page 134. APPENDIX 7: SUSTAINABILITY – FOOTNOTES 127 Westpac Group 2023 Full Year Results Presentation & Investor Discussion Pack |
| 128 Westpac Group 2023 Full Year Results Presentation & Investor Discussion Pack APPENDIX 7: SUSTAINABILITY APPENDIX 1 Copyright ©2023 Sustainalytics. All rights reserved. The information, data, analyses and opinions contained herein: (1) includes the proprietary information of Sustainalytics and/or its content providers; (2) may not be copied or redistributed except as specifically authorized; (3) do not constitute investment advice nor an endorsement of any product , project, investment strategy or consideration of any particular environmental, social or governance related issues as part of any investment strategy; (4) are provided solely for informational purposes; and (5) are not warranted to be complete, accurate or timely. Neither Sustainalytics nor its content providers are responsible for any trading decisions, damages or other losses related to it or its use. The use of the data is subject to conditions available at https://www.sustainalytics.com/legal-disclaimers. 2 The inclusion of Westpac in any MSCI index, and the use of MSCI logos, trademarks, service marks or index names herein, do not constitute a sponsorship, endorsement or promotion of Westpac by MSCI or any of its affiliates. The MSCI indexes are the exclusive property of MSCI. MSCI and the MSCI index names and logos are trademarks or service marks of MSCI or its affiliates. INDUSTRY RECOGNITION SUSTAINABILITY INDEXES INCLUSION AND DIVERSITY RECOGNITION Named within Top 10 Employer for gender equality through Equileap First Australian financial institution to be Disability Recruiter Accredited Bronze Accreditation for Australian Workplace Quality Index Accredited as Level 1 Activate as a Carer Friendly Employer under the CarersNSW Carers + Employers Program Recognised in the Bloomberg Gender Equality Index for the 7th consecutive year At Aug 23, Westpac has received an MSCI ESG Rating of A (score of 5.2 which is above Industry Average)2 At Dec 22, Westpac has received an S&P DJI ESG score of 68. We have been a member of the DJSI Indices since 2002 Winners for the second year running in the SEEK Star Awards for Best Employer Brand initiative for our Graduate ‘Uncommon minds’ campaign Rated Prime status of “C” by ISS ESG Achieved highest ISS QualityScore for Social dimension At Sep 23, Westpac has received an ESG Risk Rating of 21.1 from Sustainalytics and was assessed to be at Medium risk of experiencing material financial impacts from ESG factors1 Member of the FTSE4Good Index Series, of which Westpac has been a member since 2001 |
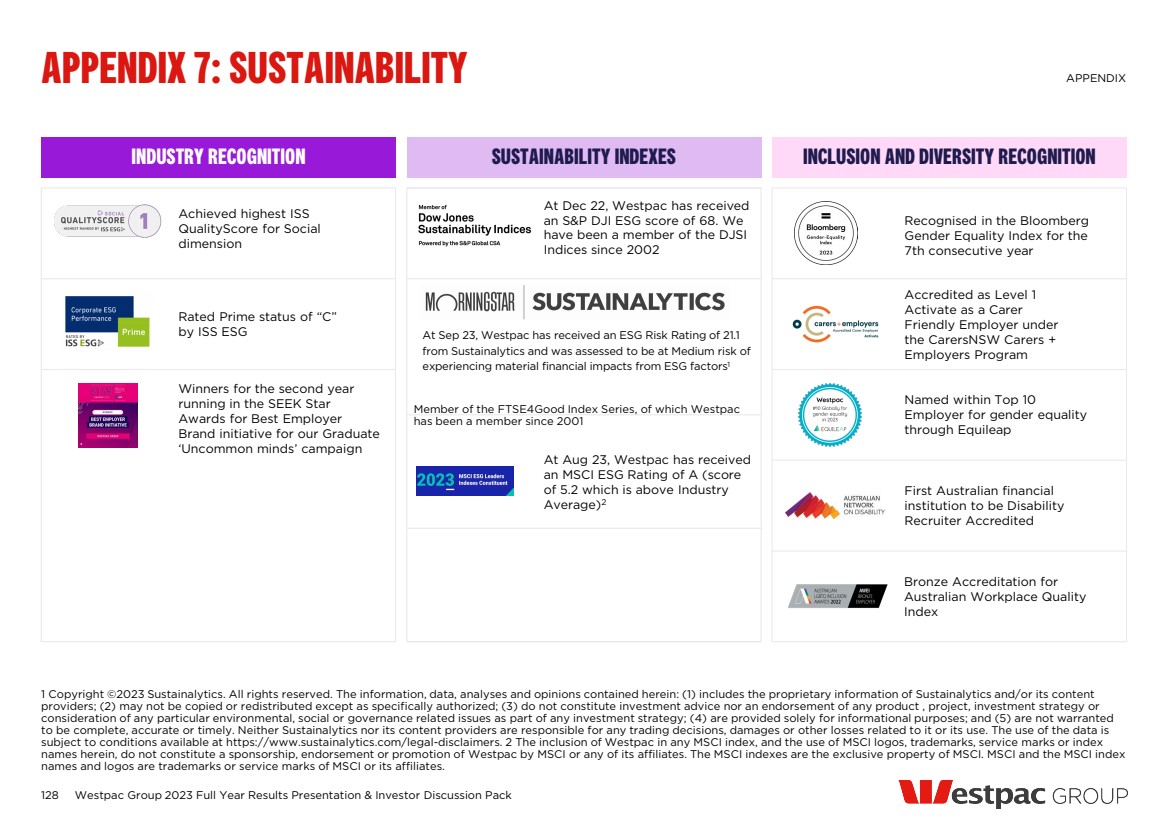
| APPENDIX 7: SUSTAINABILITY APPENDIX Commitment to United Nations Global Compact Signatory (2002), Global Compact Network Australia Founding Member (2009) RE100, an initiative of The Climate Group in partnership with CDP Member (since 2019) Industry-led UN-convened Net-Zero Banking Alliance Member, principals and steering groups (NZBA governance bodies) (from 2023) Global Reporting Initiative Align with WeConnect International (for women owned businesses) Member (2020) UN Sustainable Development Goals CEO Statement of Commitment (2016) Paris Climate Agreement Supporter (2015) Principles for Responsible Banking Signatory (2019) The Valuable 500 Signatory (2021) Toitū net carbonzero certified (New Zealand) Since 2019 UN Environment Programme Finance Initiative Founding Member (1991) Banking Board Co-Chair (since 2020) Financial Stability Board’s Task Force on Climate-related Financial Disclosures Align with and support The Equator Principles Founding Adopter, First Australian Bank (2003) UN Women Partner (2021) Taskforce on Nature-related Financial Disclosures Forum member (2021) Electric Vehicle Council of Australia Member (2022) Carbon Markets Institute Corporate Member Australian Industry Energy Transitions Initiative Partner (2022) Australian Sustainable Finance Institute Founding Member Climate Bonds Initiative Partner Sustainability Accounting Standards Board Align with Supply Nation (for Indigenous owned businesses) Founding Member (2010) Social Traders (for certified social enterprises) Member (2016) United Nations Tobacco-Free Finance pledge Founding Signatory (2018) Climate Active Certification (Australia) Since 2012 (previously NCOS) Green Building Council of Australia Member (since 2011) 129 Westpac Group 2023 Full Year Results Presentation & Investor Discussion Pack MAJOR COMMITMENTS, PARTNERSHIPS AND ASSOCIATIONS |
| APPENDIX 8: DEFINITIONS 130 Credit quality Westpac Group 2023 Full Year Results Presentation & Investor Discussion Pack APPENDIX >90 days past due Includes facilities less than 90 days past due and those credit exposures, that are in default, but where it is expected that the full value of principal and accrued interest can be collected, generally by reference to the value of security held 90+ days past due Includes facilities 90 days or more past due, and those credit exposures that are in default, but where it is expected that the full value of principal and accrued interest can be collected, generally by reference to the value of security held Provision for expected credit losses Expected credit losses (ECL) are a probability-weighted estimate of the cash shortfalls expected to result from defaults over the relevant timeframe. They are determined by evaluating a range of possible outcomes and taking into account the time value of money, past events, current conditions and forecasts of future economic conditions Collectively assessed provisions (CAP) CAP for ECL under AASB 9 represent the ECL which is collectively assessed in pools of similar assets with similar risk characteristics. This incorporates forward looking information and does not require an actual loss event to have occurred for an impairment provision to be recognised Individually assessed provisions (IAP) Provisions raised for losses on loans that are known to be impaired and are assessed on an individual basis. The estimated losses on these impaired loans is based on expected future cash flows discounted to their present value and, as this discount unwinds, interest will be recognised in the income statement Stage 1: 12 months ECL – performing For financial assets where there has been no significant increase in credit risk since origination a provision for 12 months ECL is recognised. Interest revenue is calculated on the gross carrying amount of the financial asset Stage 2: Lifetime ECL – performing For financial assets where there has been a significant increase in credit risk since origination but where the asset is still performing a provision for lifetime ECL is recognised. Interest revenue is calculated on the gross carrying amount of the financial asset Stage 3 Lifetime ECL – non-performing For financial assets that are non-performing a provision for lifetime ECL is recognised. Interest revenue is calculated on the carrying amount net of the provision for ECL rather than the gross carrying amount Impaired Includes exposures that have deteriorated to the point where full collection of interest and principal is in doubt, based on an assessment of the customer’s outlook, cash flow, and the net realisation of value of assets to which recourse is held: – Facilities 90 days or more past due, and full recovery is in doubt: exposures where contractual payments are 90 or more days in arrears and the net realisable value of assets to which recourse is held may not be sufficient to allow full collection of interest and principal, including overdrafts or other revolving facilities that remain continuously outside approved limits by material amounts for 90 or more calendar days; – Non-accrual facilities: exposures with individually assessed impairment provisions held against them, excluding restructured loans; – Restructured facilities: exposures where the original contractual terms have been formally modified to provide for concessions of interest or principal for reasons related to the financial difficulties of the customer; – Other assets acquired through security enforcement (includes other real estate owned): includes the value of any other assets acquired as full or partial settlement of outstanding obligations through the enforcement of security arrangements; and – Any other facility where the full collection of interest and principal is in doubt Stressed exposures Watchlist and substandard, non-performing not impaired, and impaired exposures Total committed exposures (TCE) Represents the sum of the committed portion of direct lending (including funds placement overall and deposits placed), contingent and pre-settlement risk plus the committed portion of secondary market trading and underwriting risk Watchlist and substandard Loan facilities where customers are experiencing operating weakness and financial difficulty but are not expected to incur loss of interest or principal |

| APPENDIX 8: DEFINITIONS 131 Segments, earnings drivers, capital and liquidity Westpac Group 2023 Full Year Results Presentation & Investor Discussion Pack APPENDIX Segments Consumer Consumer provides banking products and services, including mortgages, credit cards, personal loans, and savings and deposit products to Australian retail customers Business Business serves the banking needs of Australian small business, Agribusiness and Commercial customers WIB Westpac Institutional Bank (WIB) provides a broad range of financial products and services to corporate, institutional and government customers Westpac NZ Westpac New Zealand provides banking, wealth and insurance products and services for consumer, business and institutional customers in New Zealand Specialist Businesses Specialist Businesses was established in May 2020 by combining the operations that Westpac identified to be exited as part of its simplification agenda. Since its formation, ten business divestments have been completed. The remaining operations include Platforms, Westpac Pacific, margin lending and auto finance business which is in run-off. These businesses will be retained and transferred to the management of the Business & Wealth segment from Full Year 2024 Earnings drivers Average interest-earning assets (AIEA) The average balance of assets held by the Group that generate interest income. Where possible, daily balances are used to calculate the average balance Group net interest margin Calculated by dividing net interest income by average interest-earning assets (annualised where applicable) Core net interest margin Calculated by dividing net interest income excluding Notable Items and Treasury & Markets by average interest-earning assets (annualised where applicable) Pre-provision profit Net operating income less operating expenses Full-time equivalent employees (FTE) A calculation based on the number of hours worked by full and part-time employees as part of their normal duties. For example, the full-time equivalent of one FTE is 76 hours paid work per fortnight Capital and liquidity Capital ratios As defined by APRA (unless stated otherwise) Committed liquidity facility (CLF) The RBA makes available to Australian Authorised Deposit-taking Institutions (ADIs) a CLF that, subject to qualifying conditions, can be accessed to meet LCR requirements under APS210 Liquidity. APRA announced in September 2021 that ADIs subject to the LCR should reduce their CLF usage to zero by 1 January 2023 High quality liquid assets (HQLA) Assets which meet APRA’s criteria for inclusion as HQLA in the numerator of the LCR Internationally comparable ratios Internationally comparable regulatory capital ratios are Westpac’s estimated ratios after adjusting the capital ratios determined under APRA Basel III regulations for various items. Analysis aligns with the APRA study titled “International capital comparison study” dated 13 July 2015 Leverage ratio As defined by APRA (unless stated otherwise). Tier 1 capital divided by ‘exposure measure’ and expressed as a percentage. ‘Exposure measure’ is the sum of on-balance sheet exposures, derivative exposures, securities financing transaction exposures and other off-balance sheet exposures Liquidity coverage ratio (LCR) An APRA requirement to maintain an adequate level of unencumbered high quality liquid assets, to meet liquidity needs for a 30 calendar day period under an APRA-defined severe stress scenario. Absent a situation of financial stress, the value of the LCR must not be less than 100%. LCR is calculated as the percentage ratio of stock of HQLA and CLF over the total net cash out-flows in a modelled 30 day defined stressed scenario Net stable funding ratio (NSFR) The NSFR is defined as the ratio of the amount of available stable funding (ASF) to the amount of required stable funding (RSF) defined by APRA. The amount of ASF is the portion of an ADI’s capital and liabilities expected to be a reliable source of funds over a one year time horizon. The amount of RSF is a function of the liquidity characteristics and residual maturities of an ADI’s assets and off-balance sheet activities. ADI’s must maintain an NSFR of at least 100% Risk weighted assets or RWA Assets (both on and off-balance sheet) are risk weighted according to each asset’s inherent potential for default and what the likely losses would be in case of default. In the case of non-asset-backed risks (ie. market and operational risk), RWA is determined by multiplying the capital requirements for those risks by 12.5 |
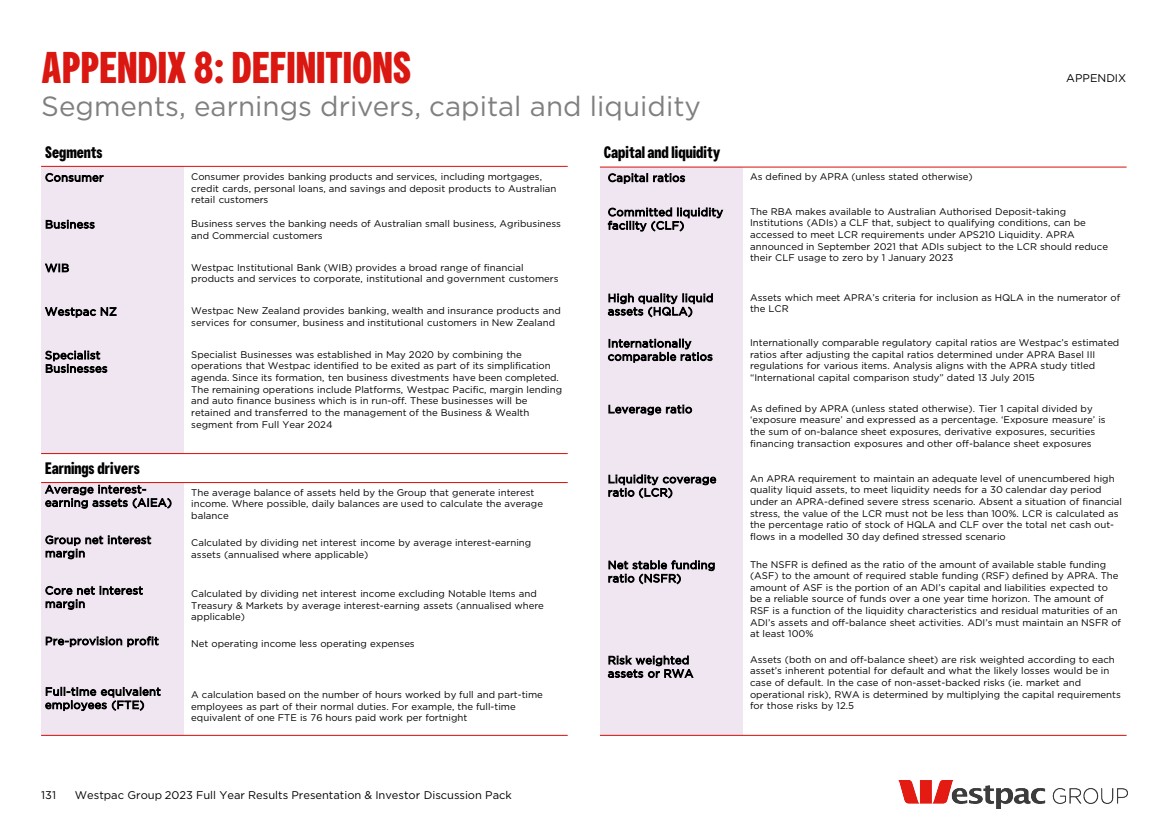
| APPENDIX 8: DEFINITIONS 132 Other Westpac Group 2023 Full Year Results Presentation & Investor Discussion Pack APPENDIX Branch transactions Branch transactions are typically withdrawals, deposits, transfers and payments Customer satisfaction or CSAT The Customer Satisfaction score is an average of customer satisfaction ratings of the customer’s main financial institution for consumer or business banking on a scale of 0 to 10 (0 means ‘extremely dissatisfied’ and 10 means ‘extremely satisfied’) CSAT (Main Bank Service Satisfaction) (Westpac NZ) Source: 3 month rolling Retail Market Monitor data (survey conducted by Camorra Research). Respondents are asked to rate the overall level of service they receive from their main bank (self-selected which ONE bank is their main provider of financial services) on a scale of 1 (Poor) to 5 (Excellent). The rating represents % of respondents who scored 4 (Very Good) or 5 (Excellent) CSAT – overall consumer Source: Fifth Dimension (5D) for March 2023 (1H23) and September 2023 (2H23); DBM Consultants Consumer Atlas for September 2022 (2H22), 6MR. MFI customers CSAT – overall business Source: Fifth Dimension (5D) for March 2023 (1H23) and September 2023 (2H23); DBM Consultants Business Atlas for September 2022 (2H22), 6MR. MFI businesses DBM Australian Financial Awards Award is based on information collected from the DBM Atlas research program – feedback from over 80,000 business owners or retail customers from January 2022 through December 2022. Award results are based on experiences and perceptions of customers surveyed in this period. For DBM Atlas and DBM Australian Financial Awards information visit www.dbmconsultants.com.au Digitally active Australian consumer and business customers who have had an authenticated session (including Quickzone) on Westpac Group digital banking platforms in the prior 90 days Digital sales The percentage of quality sales in a 12-week period that were digitally initiated (percentage against the count of all quality sales in that 12-week period) Digital transactions Digital transactions including all payment transactions (Transfer Funds, Pay Anyone and BPAY) within Westpac Live and Compass, excl. Corporate Online and Business Banking online Mobile wallet payments Count of transactions that use a digital card via apple pay, fitbit pay, garmin pay, google pay and samsung pay products Average App sessions per day Total number of sessions on Westpac Live & Compass initiated using an app over total number of days within a half year period MFI share MFI share results are based on the number of customers who have a Main Financial Institution (MFI) relationship with an institution, as a proportion of the number of customers that have a MFI relationship with any institution Consumer MFI share Source: Fifth Dimension (5D) for March 2023 (1H23) and September 2023 (2H23); DBM Consultants Consumer Atlas for September 2022 (2H22), 6MR. MFI customers Net Promoter Score or NPS Net Promoter Score measures the net likelihood of recommendation to others of the customer’s main financial institution for retail or business banking. Net Promoter ScoreSM is a trademark of Bain & Co Inc., Satmetrix Systems, Inc., and Mr Frederick Reichheld. Using a 11 point numerical scale where 10 is ‘Extremely likely’ and 0 is ‘Not at all unlikely’, Net Promoter Score is calculated by subtracting the percentage of Detractors (0-6) from the percentage of Promoters (9-10) NPS – Mobile App Source: Fifth Dimension (5D) for September 2023 (2H23), 6MR. MFI customers. Mobile App NPS measures the likelihood to recommend the customer’s MFI Mobile App used in the last 4 weeks for retail banking NPS Consumer (Westpac NZ) Source: 3 month rolling Retail Market Monitor data (survey conducted by Camorra Research). Respondents are asked about likelihood to recommend their main bank to family and friends on a scale of 1 (extremely unlikely) to 10 (extremely likely). Net Promoter Score is represents % of Promoters (recommend score of 9 or 10) minus % of Detractors (recommend score of 1 to 6) NPS – overall consumer Source: Fifth Dimension (5D) for March 2023 (1H23) and September 2023 (2H23); DBM Consultants Consumer Atlas for September 2022 (2H22), 6MR. MFI customers NPS – overall business Source: Fifth Dimension (5D) for March 2023 (1H23) and September 2023 (2H23); DBM Consultants Business Atlas for September 2022 (2H22), 6MR. MFI businesses NPS - Mortgages Source: Fifth Dimension (5D) for September 2023 (2H23), 6MR, AFI customers. Mortgage NPS measures the likelihood to recommend the Mortgage they hold with their financial institution St.George (SGB) brands SGB brands (Consumer): St.George Bank, Bank of Melbourne, BankSA; for DBM also includes RAMS, Dragondirect SGB brands (Business): St.George Bank, Bank of Melbourne and BankSA |
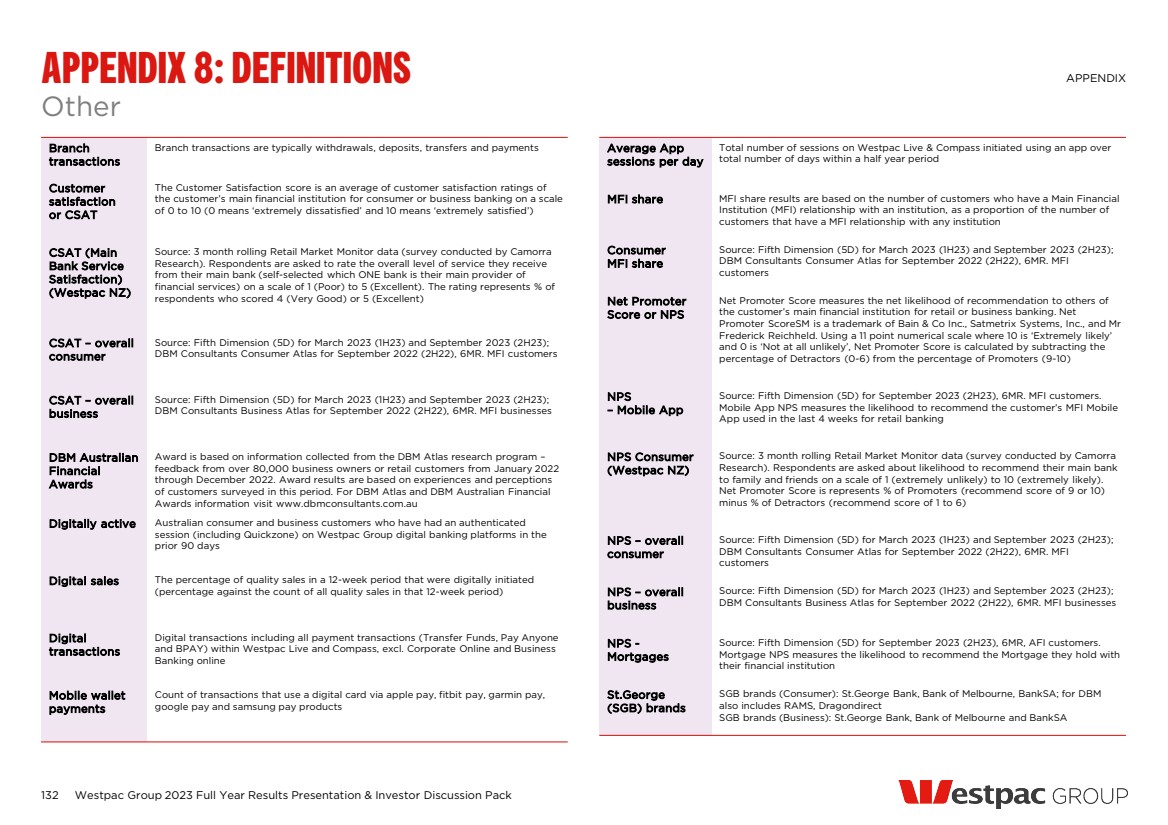
| INVESTOR RELATIONS TEAM 133 Contact us Westpac Group 2023 Full Year Results Presentation & Investor Discussion Pack CONTACT US INVESTOR RELATIONS CONTACT SHARE REGISTRY CONTACT Justin McCarthy General Manager, Investor Relations Arthur Petratos Manager, Shareholder Services Rebecca Plackett Head of Corporate Reporting and ESG Andrea Jaehne Head of Investor Relations, Ratings Agencies and Analysis Jacqueline Boddy Head of Debt Investor Relations James Wibberley Manager, Investor Relations Catherine Garcia Head of Investor Relations, Institutional Nathan Fontyne Graduate, Investor Relations For all shareholding enquiries relating to: – Address details and communication preferences – Updating bank account details, and participation in the dividend reinvestment plan For all matters relating to Westpac’s strategy, performance and results 1800 804 255 westpac@linkmarketservices.com.au investorcentre.linkmarketservices.com.au +61 2 9178 2977 investorrelations@westpac.com.au westpac.com.au/investorcentre |
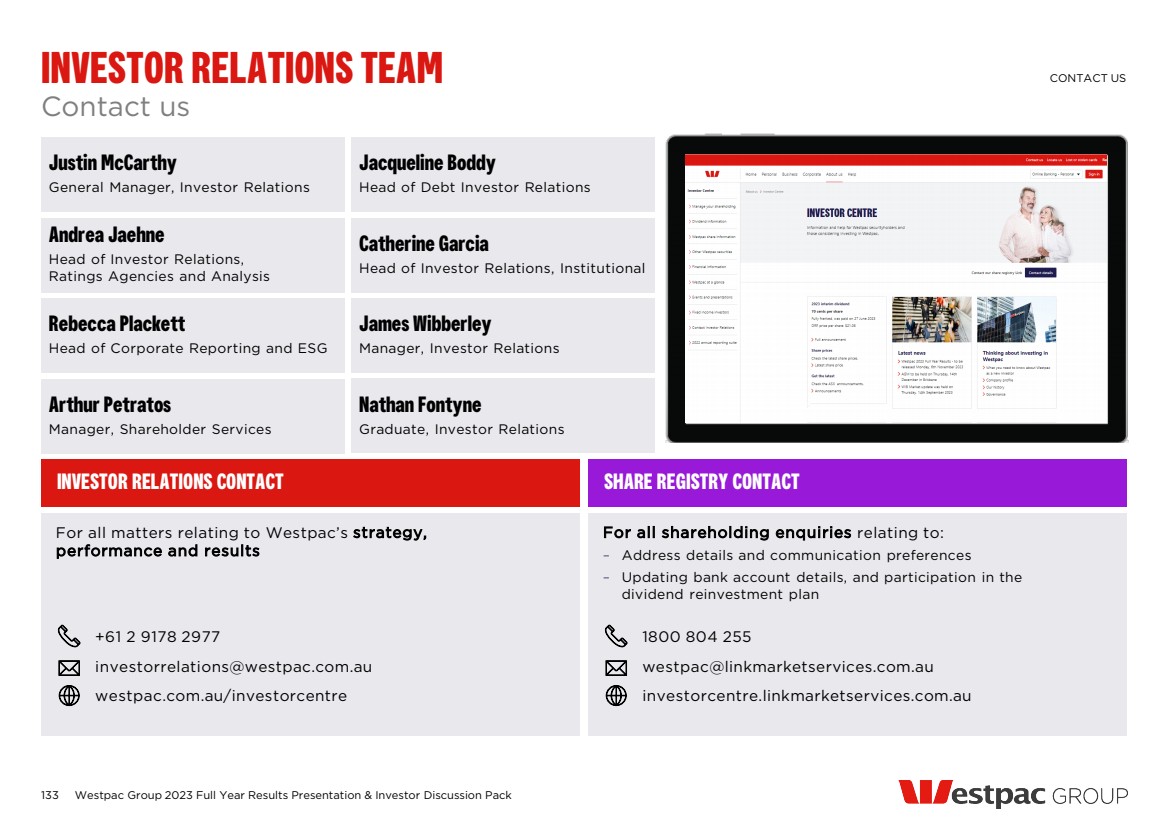
| The material contained in this presentation is intended to be general background information on Westpac Banking Corporation (Westpac) and its activities. The information is supplied in summary form and is therefore not necessarily complete. It is not intended that it be relied upon as advice to investors or potential investors, who should consider seeking independent professional advice depending upon their specific investment objectives, financial situation or particular needs. The material contained in this presentation may include information derived from publicly available sources that have not been independently verified. No representation or warranty is made as to the accuracy, completeness or reliability of the information. This presentation should be read in conjunction with our 2023 Annual Report. This includes references to our systems and processes, which may not always be 100% effective and are subject to risks and other factors, including those described in the section titled ‘Risk factors’ in our 2023 Annual Report. All amounts are in Australian dollars unless otherwise indicated. The financial information in this presentation is presented in accordance Australian Accounting Standards (AAS) and is also compliant with International Financial Reporting Standards. In 2022 and earlier reporting periods, Westpac reported a non-AAS financial measure of profit referred to as “cash earnings” as well as reporting “Notable Items” and a further non-AAS profit measure excluding these Notable Items in both external and internal reporting. In First Half 2023, Westpac ceased reporting cash earnings and cash earnings excluding Notable Items and will use net profit attributable to owners of Westpac (net profit) as Westpac’s key measure of financial performance. To assist in explaining our financial performance, Westpac will continue to report Notable Items which represent certain items that management believe are not reflective of the Group’s ongoing business performance. Refer to page 104 for details of the Notable Items impacting Westpac’s 2023 Annual Report. In assessing Westpac’s performance and that of our operating segments we use a number of financial measures, including amounts, measures and ratios that are presented on a non-AAS basis. Non-AAS financial measures and ratios do not have standardised meanings under AAS. As such they are unlikely to be directly comparable to similar measures presented by other companies and should not be viewed in isolation from, or as a substitute for, the AAS results. Refer to Westpac’s 2023 Annual Report for the twelve months ended 30 September 2023 available at www.westpac.com.au in the section “Results Announcement to the market - Introduction” for details of the presentation changes and non-AAS financial measures. This presentation contains statements that constitute “forward-looking statements” within the meaning of Section 21E of the US Securities Exchange Act of 1934. Forward looking statements are statements that are not historical facts. Forward-looking statements appear in a number of places in this presentation and include statements regarding our intent, belief or current expectations with respect to our business and operations, macro and micro economic and market conditions, results of operations and financial condition, capital adequacy and risk management, including, without limitation, future loan loss provisions and financial support to certain borrowers, forecasted economic indicators and performance metric outcomes, indicative drivers, climate- and other sustainability-related statements, commitments, targets, projections and metrics, and other estimated and proxy data. We use words such as ‘will’, ‘may’, ‘expect’, ‘intend’, ‘seek’, ‘would’, ‘should’, ‘could’, ‘continue’, ‘plan’, ‘estimate’, ‘anticipate’, ‘believe’, ‘probability’, ‘indicative’, ‘risk’, ‘aim’, ‘outlook’, ‘forecast’, ‘f’cast’, ‘f’, ‘assumption’, ‘projection’, ‘target’, ‘goal’, ‘guidance’, ‘ambition’, or other similar words to identify forward-looking statements, or otherwise identify forward-looking statements. These forward-looking statements reflect our current views on future events and are subject to change, certain known and unknown risks, uncertainties and assumptions and other factors which are, in many instances, beyond our control (and the control of our officers, employees, agents and advisors), and have been made based on management’s expectations or beliefs concerning future developments and their potential effect upon Westpac. Forward-looking statements may also be made, verbally or in writing, by members of Westpac’s management or Board in connection with this presentation. Such statements are subject to the same limitations, uncertainties, assumptions and disclaimers set out in this presentation. There can be no assurance that future developments or performance will align with our expectations or that the effect of future developments on us will be those anticipated. Actual results could differ materially from those we expect or which are expressed or implied in forward-looking statements, depending on various factors including, but not limited to, those described in the section titled ‘Risk factors' in our 2023 Annual Report for the twelve months ended 30 September 2023 available at www.westpac.com.au. When relying on forward-looking statements to make decisions with respect to Westpac, investors and others relying on information in this presentation should carefully consider such factors and other uncertainties and events. Except as required by law, we assume no obligation to revise or update any forward-looking statements contained in this presentation, whether from new information, future events, conditions or otherwise, after the date of this presentation. Further important information regarding climate change and sustainability-related statements This presentation contains forward-looking statements and other representations relating to environment, social and governance (ESG) topics, including but not limited to climate change, net-zero, climate resilience, natural capital, emissions intensity, human rights and other sustainability related statements, commitments, targets, projections, scenarios, risk and opportunity assessments, pathways, forecasts, estimated projections and other proxy data. These are subject to known and unknown risks, and there are significant uncertainties, limitations, risks and assumptions in the metrics and modelling on which these statements rely. In particular, the metrics, methodologies and data relating to climate and sustainability are rapidly evolving and maturing, including variations in approaches and common standards in estimating and calculating emissions, and uncertainty around future climate and sustainability related policy and legislation. There are inherent limits in the current scientific understanding of climate change and its impacts. Some material contained in this presentation may include information including, without limitation, methodologies, modelling, scenarios, reports, benchmarks, tools and data, derived from publicly available or government or industry sources that have not been independently verified. No representation or warranty is made as to the accuracy, completeness or reliability of such information. There is a risk that the estimates, judgements, assumptions, views, models, scenarios or projections used by Westpac may turn out to be incorrect. These risks may cause actual outcomes, including the ability to meet commitments and targets, to differ materially from those expressed or implied in this presentation. The climate and sustainability related forward-looking statements made in this presentation are not guarantees or predictions of future performance and Westpac gives no representation, warranty or assurance (including as to the quality, accuracy or completeness of these statements), nor guarantee that the occurrence of the events expressed or implied in any forward-looking statement will occur. There are usually differences between forecast and actual results because events and actual circumstances frequently do not occur as forecast and these differences may be material. Westpac will continue to review and develop its approach to ESG as this subject area matures. 134 Westpac Group 2023 Full Year Results Presentation & Investor Discussion Pack DISCLAIMER DISCLAIMER |