Exhibit 1
| ASX Release 4 November 2024 Westpac 2024 Climate Report Westpac Banking Corporation (“Westpac”) today provides the attached Westpac 2024 Climate Report. For further information: Hayden Cooper Justin McCarthy Group Head of Media Relations General Manager, Investor Relations 0402 393 619 0422 800 321 This document has been authorised for release by Tim Hartin, Company Secretary. Level 18, 275 Kent Street Sydney, NSW, 2000 |
| CLIMATE REPORT 2024 WESTPAC BANKING CORPORATION ABN 33 007 457 141 |
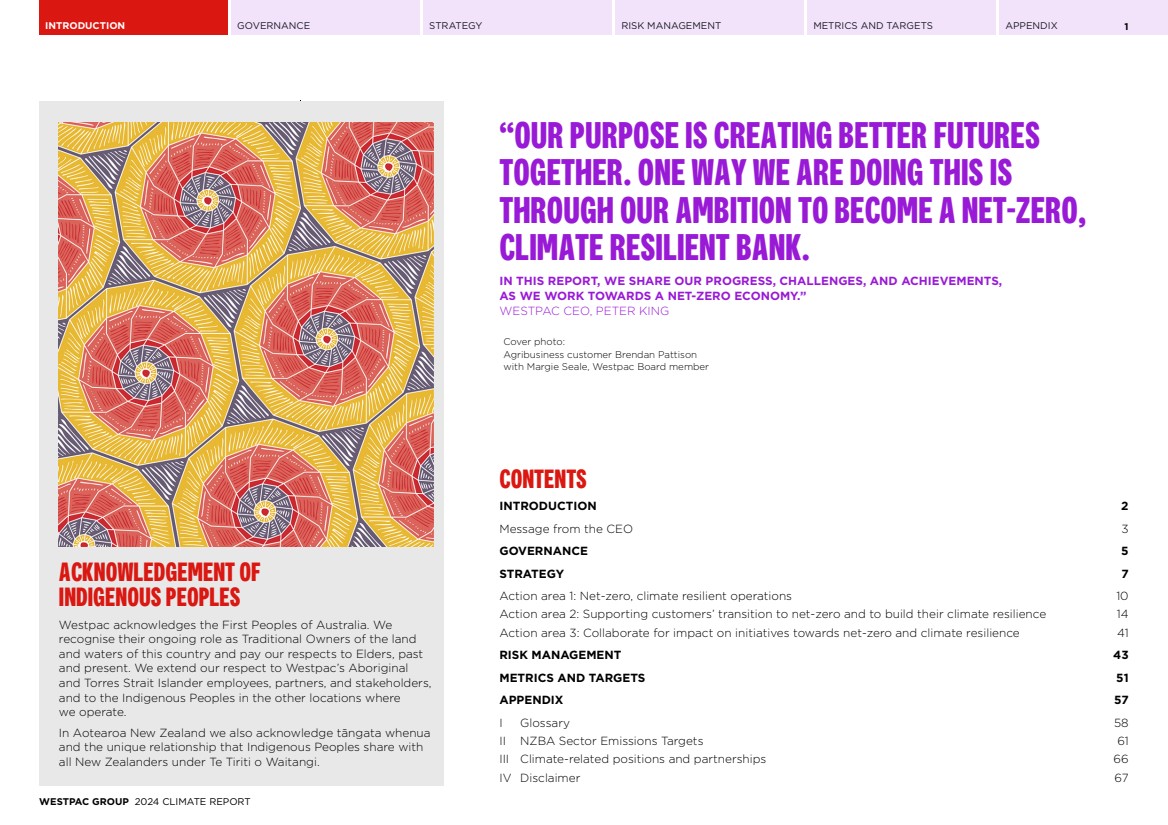
| INTRODUCTION GOVERNANCE STRATEGY RISK MANAGEMENT METRICS AND TARGETS APPENDIX 1 CONTENTS INTRODUCTION 2 Message from the CEO 3 GOVERNANCE 5 STRATEGY 7 Action area 1: Net-zero, climate resilient operations 10 Action area 2: Supporting customers’ transition to net-zero and to build their climate resilience 14 Action area 3: Collaborate for impact on initiatives towards net-zero and climate resilience 41 RISK MANAGEMENT 43 METRICS AND TARGETS 51 APPENDIX 57 I Glossary 58 II NZBA Sector Emissions Targets 61 III Climate-related positions and partnerships 66 IV Disclaimer 67 “OUR PURPOSE IS CREATING BETTER FUTURES TOGETHER. ONE WAY WE ARE DOING THIS IS THROUGH OUR AMBITION TO BECOME A NET-ZERO, CLIMATE RESILIENT BANK. IN THIS REPORT, WE SHARE OUR PROGRESS, CHALLENGES, AND ACHIEVEMENTS, AS WE WORK TOWARDS A NET-ZERO ECONOMY.” WESTPAC CEO, PETER KING Cover photo: Agribusiness customer Brendan Pattison with Margie Seale, Westpac Board member ACKNOWLEDGEMENT OF INDIGENOUS PEOPLES Westpac acknowledges the First Peoples of Australia. We recognise their ongoing role as Traditional Owners of the land and waters of this country and pay our respects to Elders, past and present. We extend our respect to Westpac’s Aboriginal and Torres Strait Islander employees, partners, and stakeholders, and to the Indigenous Peoples in the other locations where we operate. In Aotearoa New Zealand we also acknowledge tāngata whenua and the unique relationship that Indigenous Peoples share with all New Zealanders under Te Tiriti o Waitangi. WESTPAC GROUP 2024 CLIMATE REPORT |
| INTRODUCTION GOVERNANCE STRATEGY RISK MANAGEMENT METRICS AND TARGETS APPENDIX 2 INTRODUCTION Westpac Reporting Suite Our reporting suite brings together the Group’s financial, non-financial, risk and sustainability performance for the 2024 year. It includes our 2024 Annual Report, FY24 Financial Results Presentation and Investor Discussion pack, Pillar 3 report, Corporate Governance Statement, 2024 Risk Factors, 2024 Climate Report and our 2024 Sustainability Index and Datasheet. Access the full suite online at westpac.com.au/2024annualreport. About this report Our 2024 Climate Report (Report) outlines Westpac’s strategy, targets, and approach for addressing the risks and opportunities presented by climate change. It also describes our climate transition plan, outlining how we are working to reduce our carbon footprint. A Glossary (page 58) is at the end of this Report along with a list of climate-related positions and partnerships (page 66). We released our refreshed 2030 Sustainability Strategy in November 2023, outlining how we are working towards our purpose of Creating better futures together. This Climate Report focuses on our progress consistent with this strategy's climate objective. We have also published a 2024 Climate Methodologies Supplement (Supplement) on our website. This Supplement includes the details of the methodologies for estimating our operational emissions, our Net-Zero Banking Alliance sector emissions targets (NZBA sector targets), our Group financed emissions calculations, as well as details on the climate scenarios used in our climate scenario analysis. Our 2024 Sustainability Index and Datasheet provides additional detail on some metrics in this Report along with other key sustainability metrics in the 2024 Annual Report and is available on our website. This detailed spreadsheet also outlines how our reporting aligns with major reporting standards and frameworks. We recognise the intersection of climate change with other risk thematics, such as nature and human rights. These are referred to in this Report but more is also available in our Natural Capital and Human Rights Position Statements published in 2023. Westpac and its subsidiaries are covered by this Report. This includes Australia and New Zealand along with our businesses in other international locations. For certain metrics we exclude some areas of the business due to materiality and/or a lack of readily available data. In New Zealand, we are working to comply with the new External Reporting Board (XRB) climate-related standards and will publish separate climate reports for Westpac New Zealand Limited (WNZL) and our New Zealand branch (NZ Branch). For clarity, both WNZL and the NZ Branch are considered in this Report. Frameworks and standards Our reporting continues to be shaped by both global and local climate reporting standards, including the International Sustainability Standards Board (ISSB) International Financial Reporting Standards (IFRS) S1 and S2 sustainability and climate-related disclosure standards, the recently released Australian AASB S1 and S2 sustainability and climate-related disclosure standards and the New Zealand XRB climate-related disclosure standards. This Report is structured under the four major sections of Governance, Strategy, Risk Management and Metrics and Targets. This structure aligns with the ISSB IFRS S2 climate-related disclosure standards, which have absorbed the earlier recommendations of the Task Force on Climate-related Financial Disclosures (TCFD). It also aligns with the new AASB S2 Climate-related Disclosure standard. We are committed to uplift our reporting to align with the new mandatory climate-related disclosure standards and international best practice in the future. Our approach to climate reporting Outlining our approach to managing climate change risks and opportunities is challenging as measuring, reporting and the setting of targets relies on estimates, inexact data and the availability of appropriate methodologies. We strive to apply consistent principles in how we measure and report our climate metrics although these remain estimates that have inherent uncertainties. Despite the uncertainties of reported metrics and that metrics may vary over time, it is essential to estimate our impact, set targets and report on progress – so we can achieve our ambition of becoming a net-zero, climate resilient bank. We ask readers to consider these limitations and focus on our intent and our guiding principles. Over time, our climate-related data will evolve as new methodologies and technologies emerge and our stakeholders improve the measurement of their climate impacts, risks and opportunities. This Report includes forward-looking statements – such as targets, ambitions, plans, estimates, assumptions and metrics – that inherently carry uncertainty, particularly in the context of climate reporting. These risks and uncertainties need to be considered when interpreting this Report. For an explanation of forward-looking statements and the risks, uncertainties and assumptions to which they are subject, see the Disclaimer (page 67) in the Appendix. References to ‘Westpac’, ‘Group’, ‘Westpac Group’, ‘we’, ‘us’ and ‘our’ are to Westpac Banking Corporation ABN 33 007 457 141 and its subsidiaries unless stated otherwise. Operational greenhouse gas (GHG) emissions data and targets are absolute market-based greenhouse gas emissions. Unless otherwise indicated, our operational greenhouse gas emissions and energy consumption are reported for the 12-month period ended 30 June 2024. Our estimated Group portfolio financed emissions and progress of our NZBA sector targets are reported one year in arrears, for the period ended 30 September 2023, unless otherwise indicated. All other data in this Report is for the 12 months to 30 September 2024 or at 30 September 2024 and all dollar amounts are in Australian dollars, unless otherwise indicated. PricewaterhouseCoopers (PwC) provided independent reasonable assurance over our scope 1, 2 and 3 upstream emissions, and limited assurance over selected metrics and targets within this report. Their independent assurance statement is on pages 53-56 of this Report and on our website. WESTPAC GROUP 2024 CLIMATE REPORT |
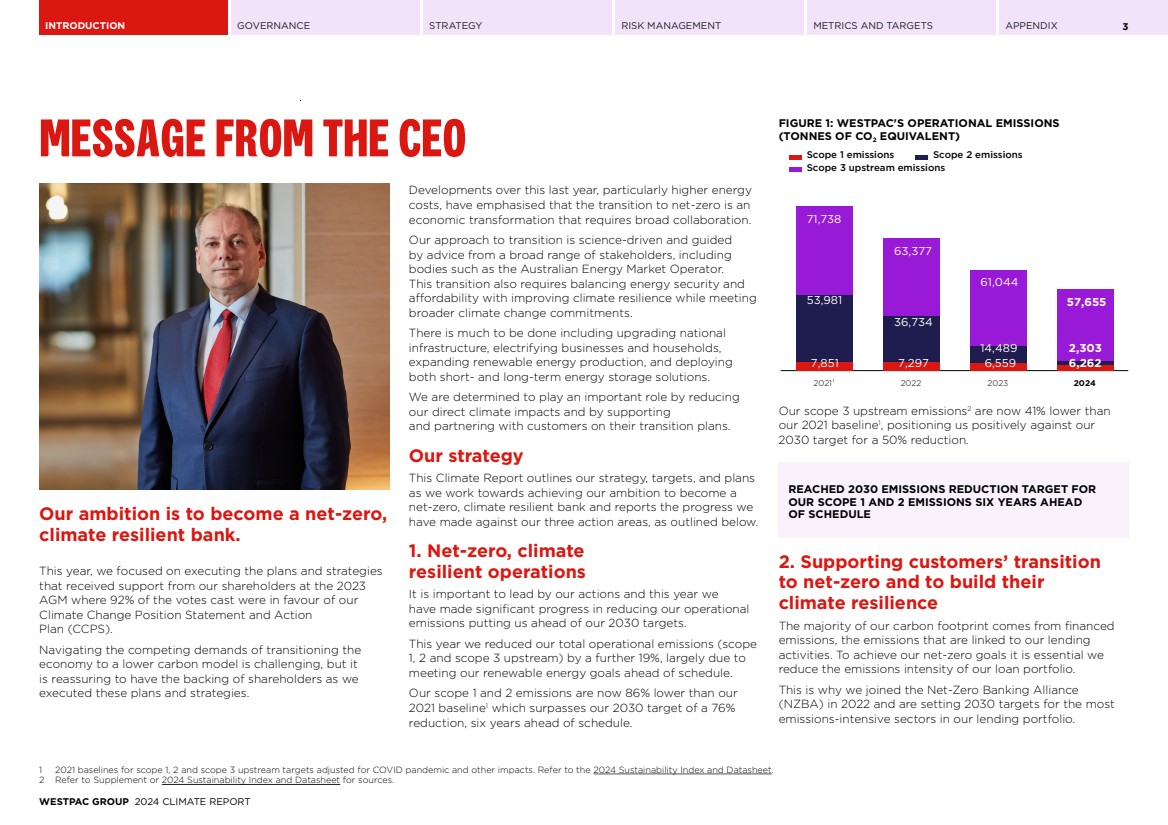
| INTRODUCTION GOVERNANCE STRATEGY RISK MANAGEMENT METRICS AND TARGETS APPENDIX 3 MESSAGE FROM THE CEO Our ambition is to become a net-zero, climate resilient bank. This year, we focused on executing the plans and strategies that received support from our shareholders at the 2023 AGM where 92% of the votes cast were in favour of our Climate Change Position Statement and Action Plan (CCPS). Navigating the competing demands of transitioning the economy to a lower carbon model is challenging, but it is reassuring to have the backing of shareholders as we executed these plans and strategies. Developments over this last year, particularly higher energy costs, have emphasised that the transition to net-zero is an economic transformation that requires broad collaboration. Our approach to transition is science-driven and guided by advice from a broad range of stakeholders, including bodies such as the Australian Energy Market Operator. This transition also requires balancing energy security and affordability with improving climate resilience while meeting broader climate change commitments. There is much to be done including upgrading national infrastructure, electrifying businesses and households, expanding renewable energy production, and deploying both short- and long-term energy storage solutions. We are determined to play an important role by reducing our direct climate impacts and by supporting and partnering with customers on their transition plans. Our strategy This Climate Report outlines our strategy, targets, and plans as we work towards achieving our ambition to become a net-zero, climate resilient bank and reports the progress we have made against our three action areas, as outlined below. 1. Net-zero, climate resilient operations It is important to lead by our actions and this year we have made significant progress in reducing our operational emissions putting us ahead of our 2030 targets. This year we reduced our total operational emissions (scope 1, 2 and scope 3 upstream) by a further 19%, largely due to meeting our renewable energy goals ahead of schedule. Our scope 1 and 2 emissions are now 86% lower than our 2021 baseline1 which surpasses our 2030 target of a 76% reduction, six years ahead of schedule. Our scope 3 upstream emissions2 are now 41% lower than our 2021 baseline1 , positioning us positively against our 2030 target for a 50% reduction. REACHED 2030 EMISSIONS REDUCTION TARGET FOR OUR SCOPE 1 AND 2 EMISSIONS SIX YEARS AHEAD OF SCHEDULE 2. Supporting customers’ transition to net-zero and to build their climate resilience The majority of our carbon footprint comes from financed emissions, the emissions that are linked to our lending activities. To achieve our net-zero goals it is essential we reduce the emissions intensity of our loan portfolio. This is why we joined the Net-Zero Banking Alliance (NZBA) in 2022 and are setting 2030 targets for the most emissions-intensive sectors in our lending portfolio. 1 2021 baselines for scope 1, 2 and scope 3 upstream targets adjusted for COVID pandemic and other impacts. Refer to the 2024 Sustainability Index and Datasheet. 2 Refer to Supplement or 2024 Sustainability Index and Datasheet for sources. FIGURE 1: WESTPAC'S OPERATIONAL EMISSIONS (TONNES OF CO2 EQUIVALENT) 7,851 7,297 6,559 6,262 53,981 36,734 14,489 2,303 71,738 63,377 61,044 57,655 Scope 1 emissions Scope 2 emissions Scope 3 upstream emissions 2021¹ 2022 2023 2024 WESTPAC GROUP 2024 CLIMATE REPORT |
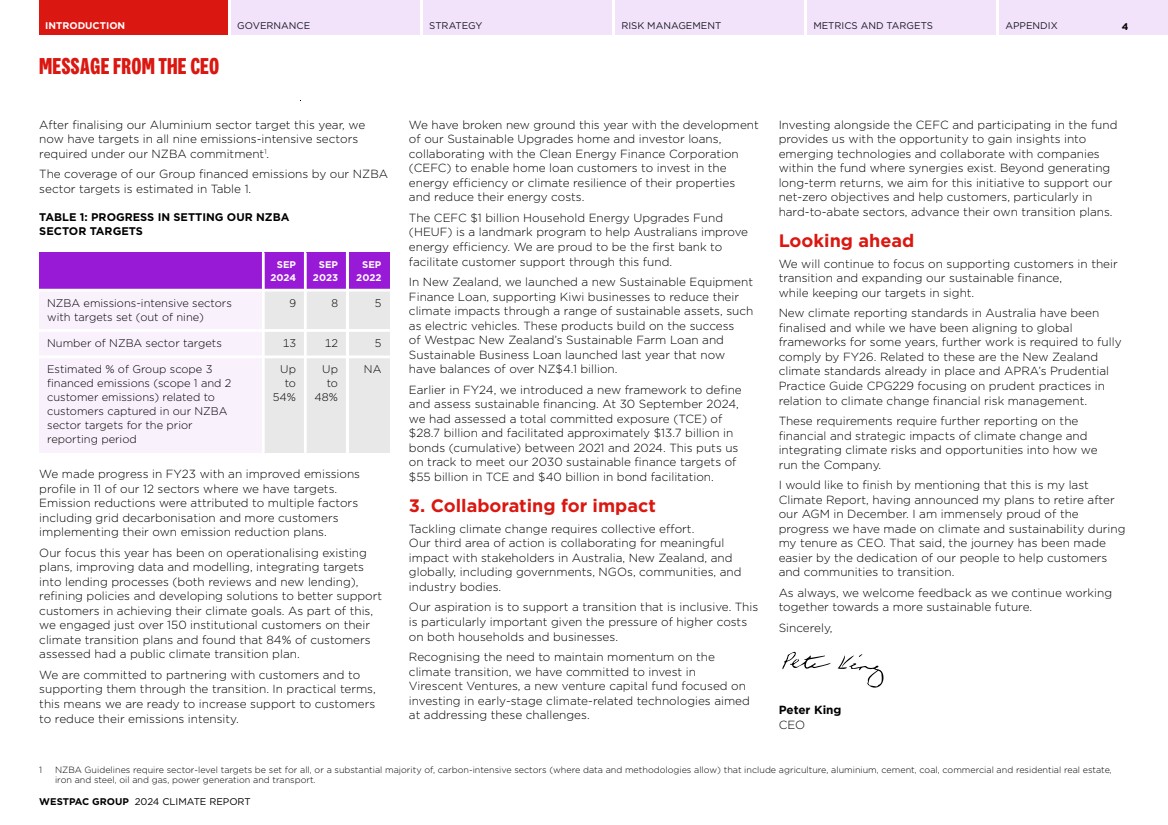
| INTRODUCTION GOVERNANCE STRATEGY RISK MANAGEMENT METRICS AND TARGETS APPENDIX MESSAGE FROM THE CEO 4 After finalising our Aluminium sector target this year, we now have targets in all nine emissions-intensive sectors required under our NZBA commitment1 .. The coverage of our Group financed emissions by our NZBA sector targets is estimated in Table 1. TABLE 1: PROGRESS IN SETTING OUR NZBA SECTOR TARGETS SEP 2024 SEP 2023 SEP 2022 NZBA emissions-intensive sectors with targets set (out of nine) 9 8 5 Number of NZBA sector targets 13 12 5 Estimated % of Group scope 3 financed emissions (scope 1 and 2 customer emissions) related to customers captured in our NZBA sector targets for the prior reporting period Up to 54% Up to 48% NA We made progress in FY23 with an improved emissions profile in 11 of our 12 sectors where we have targets. Emission reductions were attributed to multiple factors including grid decarbonisation and more customers implementing their own emission reduction plans. Our focus this year has been on operationalising existing plans, improving data and modelling, integrating targets into lending processes (both reviews and new lending), refining policies and developing solutions to better support customers in achieving their climate goals. As part of this, we engaged just over 150 institutional customers on their climate transition plans and found that 84% of customers assessed had a public climate transition plan. We are committed to partnering with customers and to supporting them through the transition. In practical terms, this means we are ready to increase support to customers to reduce their emissions intensity. We have broken new ground this year with the development of our Sustainable Upgrades home and investor loans, collaborating with the Clean Energy Finance Corporation (CEFC) to enable home loan customers to invest in the energy efficiency or climate resilience of their properties and reduce their energy costs. The CEFC $1 billion Household Energy Upgrades Fund (HEUF) is a landmark program to help Australians improve energy efficiency. We are proud to be the first bank to facilitate customer support through this fund. In New Zealand, we launched a new Sustainable Equipment Finance Loan, supporting Kiwi businesses to reduce their climate impacts through a range of sustainable assets, such as electric vehicles. These products build on the success of Westpac New Zealand’s Sustainable Farm Loan and Sustainable Business Loan launched last year that now have balances of over NZ$4.1 billion. Earlier in FY24, we introduced a new framework to define and assess sustainable financing. At 30 September 2024, we had assessed a total committed exposure (TCE) of $28.7 billion and facilitated approximately $13.7 billion in bonds (cumulative) between 2021 and 2024. This puts us on track to meet our 2030 sustainable finance targets of $55 billion in TCE and $40 billion in bond facilitation. 3. Collaborating for impact Tackling climate change requires collective effort. Our third area of action is collaborating for meaningful impact with stakeholders in Australia, New Zealand, and globally, including governments, NGOs, communities, and industry bodies. Our aspiration is to support a transition that is inclusive. This is particularly important given the pressure of higher costs on both households and businesses. Recognising the need to maintain momentum on the climate transition, we have committed to invest in Virescent Ventures, a new venture capital fund focused on investing in early-stage climate-related technologies aimed at addressing these challenges. Investing alongside the CEFC and participating in the fund provides us with the opportunity to gain insights into emerging technologies and collaborate with companies within the fund where synergies exist. Beyond generating long-term returns, we aim for this initiative to support our net-zero objectives and help customers, particularly in hard-to-abate sectors, advance their own transition plans. Looking ahead We will continue to focus on supporting customers in their transition and expanding our sustainable finance, while keeping our targets in sight. New climate reporting standards in Australia have been finalised and while we have been aligning to global frameworks for some years, further work is required to fully comply by FY26. Related to these are the New Zealand climate standards already in place and APRA’s Prudential Practice Guide CPG229 focusing on prudent practices in relation to climate change financial risk management. These requirements require further reporting on the financial and strategic impacts of climate change and integrating climate risks and opportunities into how we run the Company. I would like to finish by mentioning that this is my last Climate Report, having announced my plans to retire after our AGM in December. I am immensely proud of the progress we have made on climate and sustainability during my tenure as CEO. That said, the journey has been made easier by the dedication of our people to help customers and communities to transition. As always, we welcome feedback as we continue working together towards a more sustainable future. Sincerely, Peter King CEO 1 NZBA Guidelines require sector-level targets be set for all, or a substantial majority of, carbon-intensive sectors (where data and methodologies allow) that include agriculture, aluminium, cement, coal, commercial and residential real estate, iron and steel, oil and gas, power generation and transport. WESTPAC GROUP 2024 CLIMATE REPORT |
| INTRODUCTION GOVERNANCE STRATEGY RISK MANAGEMENT METRICS AND TARGETS APPENDIX 5 GOVERNANCE Westpac has been integrating climate change risks and opportunities into its operations – this starts with governance. Highlight CLIMATE-RELATED MEASURES MORE EXPLICITLY INCLUDED IN EXECUTIVES' SHORT-TERM VARIABLE REWARD |

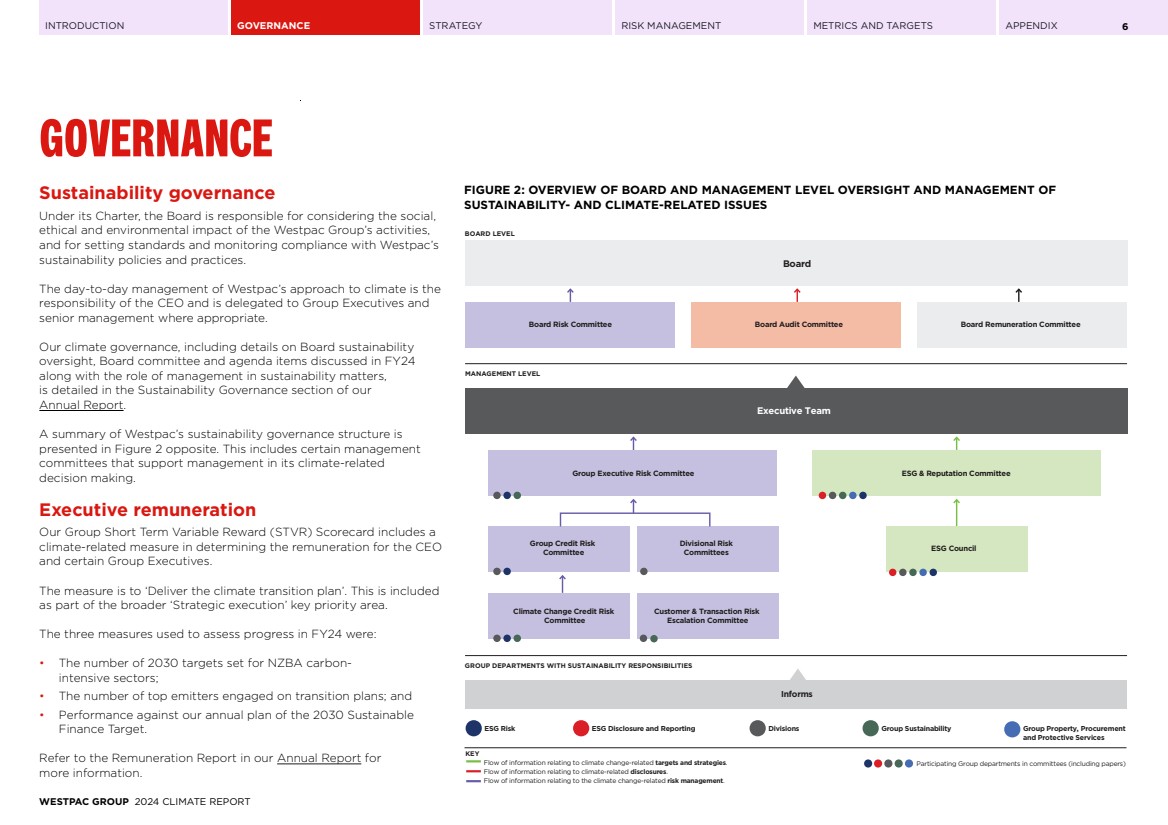
| INTRODUCTION GOVERNANCE STRATEGY RISK MANAGEMENT METRICS AND TARGETS APPENDIX 6 GOVERNANCE Sustainability governance Under its Charter, the Board is responsible for considering the social, ethical and environmental impact of the Westpac Group’s activities, and for setting standards and monitoring compliance with Westpac’s sustainability policies and practices. The day-to-day management of Westpac’s approach to climate is the responsibility of the CEO and is delegated to Group Executives and senior management where appropriate. Our climate governance, including details on Board sustainability oversight, Board committee and agenda items discussed in FY24 along with the role of management in sustainability matters, is detailed in the Sustainability Governance section of our Annual Report. A summary of Westpac’s sustainability governance structure is presented in Figure 2 opposite. This includes certain management committees that support management in its climate-related decision making. Executive remuneration Our Group Short Term Variable Reward (STVR) Scorecard includes a climate-related measure in determining the remuneration for the CEO and certain Group Executives. The measure is to ‘Deliver the climate transition plan’. This is included as part of the broader ‘Strategic execution’ key priority area. The three measures used to assess progress in FY24 were: • The number of 2030 targets set for NZBA carbon-intensive sectors; • The number of top emitters engaged on transition plans; and • Performance against our annual plan of the 2030 Sustainable Finance Target. Refer to the Remuneration Report in our Annual Report for more information. FIGURE 2: OVERVIEW OF BOARD AND MANAGEMENT LEVEL OVERSIGHT AND MANAGEMENT OF SUSTAINABILITY- AND CLIMATE-RELATED ISSUES MANAGEMENT LEVEL GROUP DEPARTMENTS WITH SUSTAINABILITY RESPONSIBILITIES ESG Risk ESG Disclosure and Reporting Divisions Group Sustainability Group Property, Procurement and Protective Services KEY Flow of information relating to climate change-related targets and strategies. Flow of information relating to climate-related disclosures. Flow of information relating to the climate change-related risk management. BOARD LEVEL Participating Group departments in committees (including papers) Informs Climate Change Credit Risk Committee Customer & Transaction Risk Escalation Committee Group Executive Risk Committee ESG & Reputation Committee ESG Council Group Credit Risk Committee Divisional Risk Committees Executive Team Board Risk Committee Board Audit Committee Board Remuneration Committee Board WESTPAC GROUP 2024 CLIMATE REPORT |
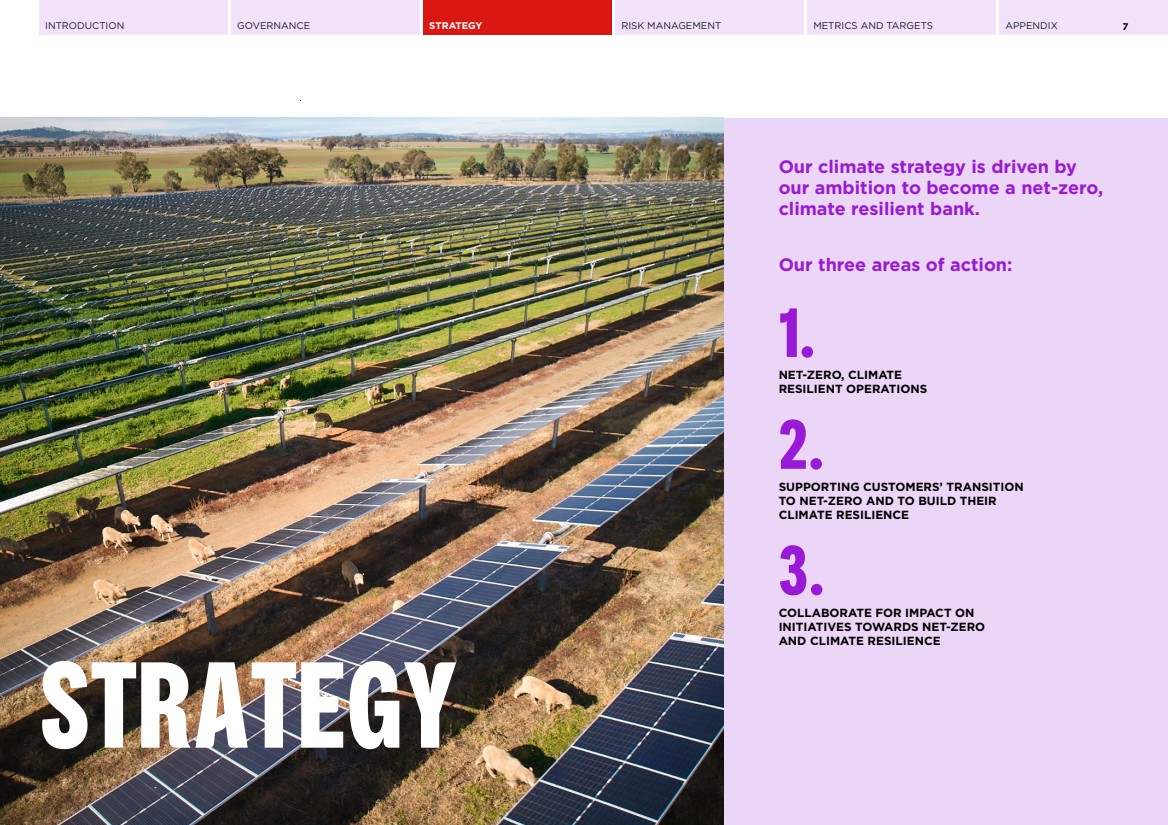
| INTRODUCTION GOVERNANCE STRATEGY RISK MANAGEMENT METRICS AND TARGETS APPENDIX 7 STRATEGY Our climate strategy is driven by our ambition to become a net-zero, climate resilient bank. Our three areas of action: 1. NET-ZERO, CLIMATE RESILIENT OPERATIONS 2. SUPPORTING CUSTOMERS’ TRANSITION TO NET-ZERO AND TO BUILD THEIR CLIMATE RESILIENCE 3. COLLABORATE FOR IMPACT ON INITIATIVES TOWARDS NET-ZERO AND CLIMATE RESILIENCE |
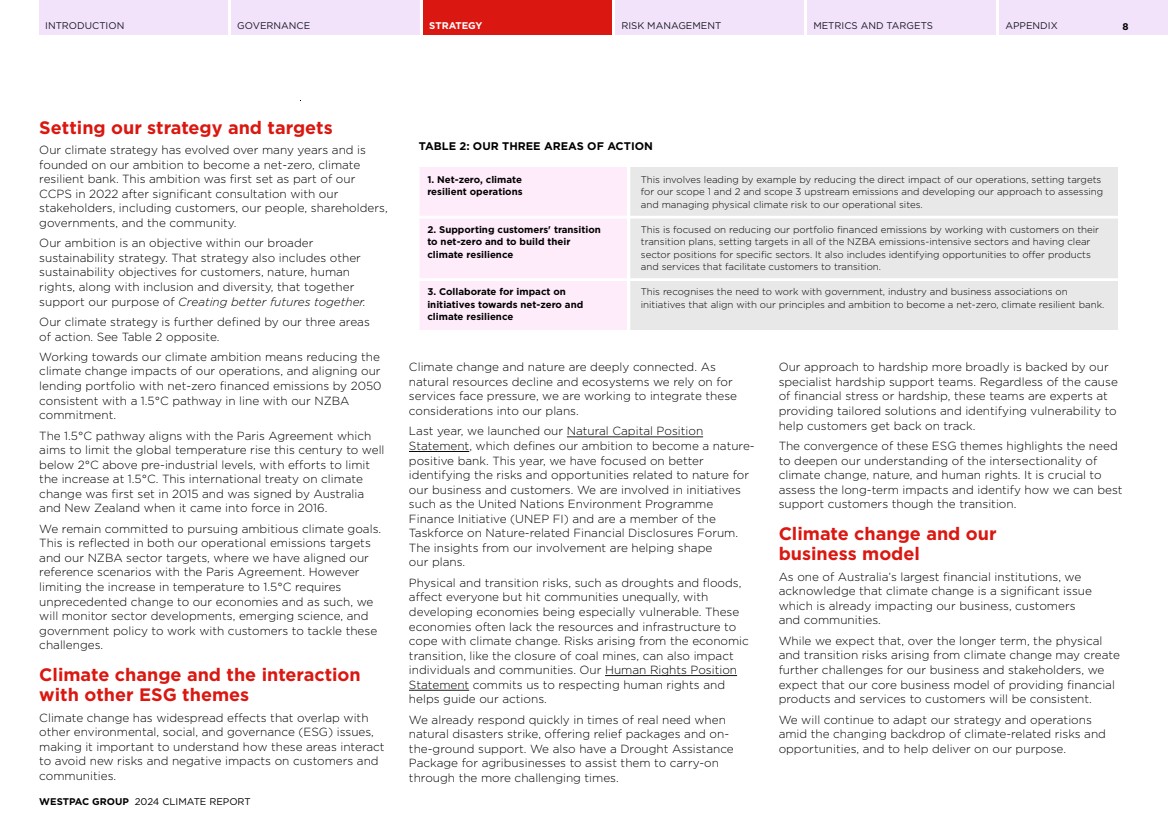
| INTRODUCTION GOVERNANCE STRATEGY RISK MANAGEMENT METRICS AND TARGETS APPENDIX 8 Setting our strategy and targets Our climate strategy has evolved over many years and is founded on our ambition to become a net-zero, climate resilient bank. This ambition was first set as part of our CCPS in 2022 after significant consultation with our stakeholders, including customers, our people, shareholders, governments, and the community. Our ambition is an objective within our broader sustainability strategy. That strategy also includes other sustainability objectives for customers, nature, human rights, along with inclusion and diversity, that together support our purpose of Creating better futures together. Our climate strategy is further defined by our three areas of action. See Table 2 opposite. Working towards our climate ambition means reducing the climate change impacts of our operations, and aligning our lending portfolio with net-zero financed emissions by 2050 consistent with a 1.5°C pathway in line with our NZBA commitment. The 1.5°C pathway aligns with the Paris Agreement which aims to limit the global temperature rise this century to well below 2°C above pre-industrial levels, with efforts to limit the increase at 1.5°C. This international treaty on climate change was first set in 2015 and was signed by Australia and New Zealand when it came into force in 2016. We remain committed to pursuing ambitious climate goals. This is reflected in both our operational emissions targets and our NZBA sector targets, where we have aligned our reference scenarios with the Paris Agreement. However limiting the increase in temperature to 1.5°C requires unprecedented change to our economies and as such, we will monitor sector developments, emerging science, and government policy to work with customers to tackle these challenges. Climate change and the interaction with other ESG themes Climate change has widespread effects that overlap with other environmental, social, and governance (ESG) issues, making it important to understand how these areas interact to avoid new risks and negative impacts on customers and communities. Climate change and nature are deeply connected. As natural resources decline and ecosystems we rely on for services face pressure, we are working to integrate these considerations into our plans. Last year, we launched our Natural Capital Position Statement, which defines our ambition to become a nature-positive bank. This year, we have focused on better identifying the risks and opportunities related to nature for our business and customers. We are involved in initiatives such as the United Nations Environment Programme Finance Initiative (UNEP FI) and are a member of the Taskforce on Nature-related Financial Disclosures Forum. The insights from our involvement are helping shape our plans. Physical and transition risks, such as droughts and floods, affect everyone but hit communities unequally, with developing economies being especially vulnerable. These economies often lack the resources and infrastructure to cope with climate change. Risks arising from the economic transition, like the closure of coal mines, can also impact individuals and communities. Our Human Rights Position Statement commits us to respecting human rights and helps guide our actions. We already respond quickly in times of real need when natural disasters strike, offering relief packages and on-the-ground support. We also have a Drought Assistance Package for agribusinesses to assist them to carry-on through the more challenging times. Our approach to hardship more broadly is backed by our specialist hardship support teams. Regardless of the cause of financial stress or hardship, these teams are experts at providing tailored solutions and identifying vulnerability to help customers get back on track. The convergence of these ESG themes highlights the need to deepen our understanding of the intersectionality of climate change, nature, and human rights. It is crucial to assess the long-term impacts and identify how we can best support customers though the transition. Climate change and our business model As one of Australia’s largest financial institutions, we acknowledge that climate change is a significant issue which is already impacting our business, customers and communities. While we expect that, over the longer term, the physical and transition risks arising from climate change may create further challenges for our business and stakeholders, we expect that our core business model of providing financial products and services to customers will be consistent. We will continue to adapt our strategy and operations amid the changing backdrop of climate-related risks and opportunities, and to help deliver on our purpose. TABLE 2: OUR THREE AREAS OF ACTION 1. Net-zero, climate resilient operations This involves leading by example by reducing the direct impact of our operations, setting targets for our scope 1 and 2 and scope 3 upstream emissions and developing our approach to assessing and managing physical climate risk to our operational sites. 2. Supporting customers' transition to net-zero and to build their climate resilience This is focused on reducing our portfolio financed emissions by working with customers on their transition plans, setting targets in all of the NZBA emissions-intensive sectors and having clear sector positions for specific sectors. It also includes identifying opportunities to offer products and services that facilitate customers to transition. 3. Collaborate for impact on initiatives towards net-zero and climate resilience This recognises the need to work with government, industry and business associations on initiatives that align with our principles and ambition to become a net-zero, climate resilient bank. WESTPAC GROUP 2024 CLIMATE REPORT |
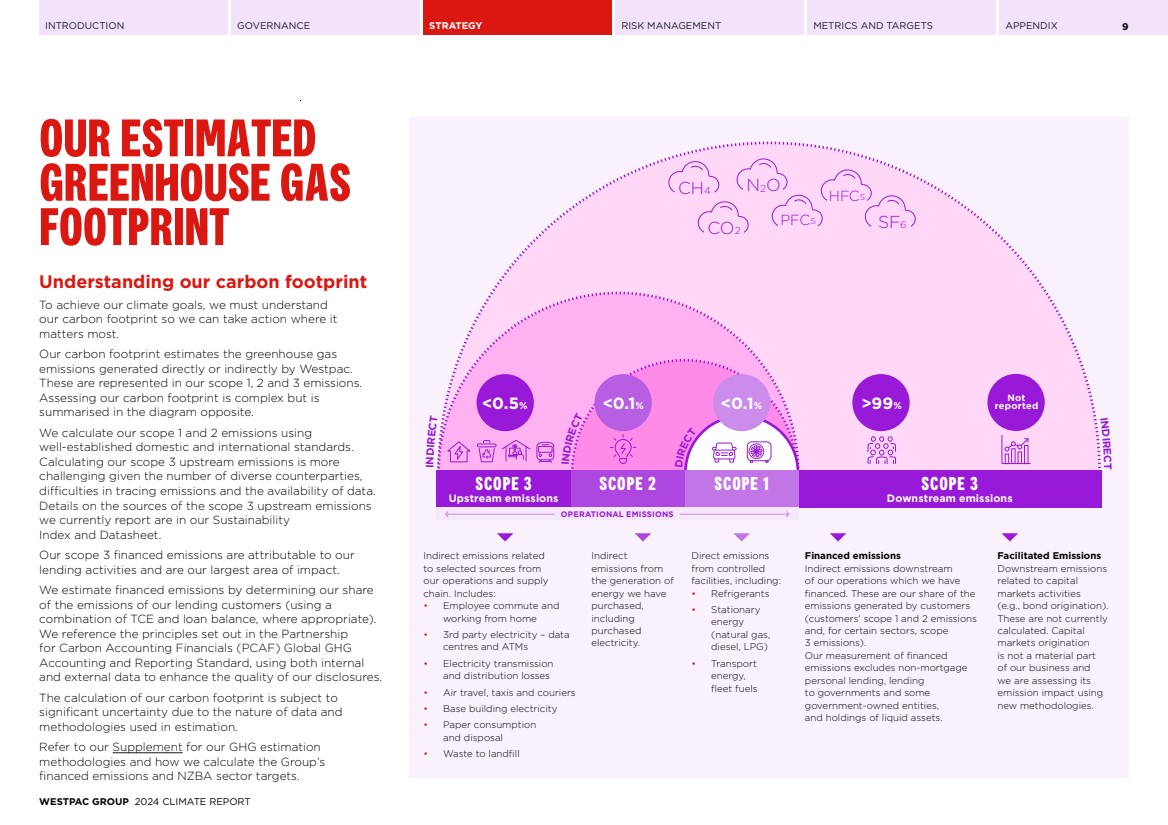
| INTRODUCTION GOVERNANCE STRATEGY RISK MANAGEMENT METRICS AND TARGETS APPENDIX 9 OUR ESTIMATED GREENHOUSE GAS FOOTPRINT Understanding our carbon footprint To achieve our climate goals, we must understand our carbon footprint so we can take action where it matters most. Our carbon footprint estimates the greenhouse gas emissions generated directly or indirectly by Westpac. These are represented in our scope 1, 2 and 3 emissions. Assessing our carbon footprint is complex but is summarised in the diagram opposite. We calculate our scope 1 and 2 emissions using well-established domestic and international standards. Calculating our scope 3 upstream emissions is more challenging given the number of diverse counterparties, difficulties in tracing emissions and the availability of data. Details on the sources of the scope 3 upstream emissions we currently report are in our Sustainability Index and Datasheet. Our scope 3 financed emissions are attributable to our lending activities and are our largest area of impact. We estimate financed emissions by determining our share of the emissions of our lending customers (using a combination of TCE and loan balance, where appropriate). We reference the principles set out in the Partnership for Carbon Accounting Financials (PCAF) Global GHG Accounting and Reporting Standard, using both internal and external data to enhance the quality of our disclosures. The calculation of our carbon footprint is subject to significant uncertainty due to the nature of data and methodologies used in estimation. Refer to our Supplement for our GHG estimation methodologies and how we calculate the Group’s financed emissions and NZBA sector targets. CH4 CO2 N2O HFCS PFCS SF6 IN DIR E C T IN DIR E CT <0.1% >99% Not <0.5% <0.1% reported SCOPE 3 SCOPE 2 SCOPE 1 SCOPE 3 Upstream emissions Downstream emissions DIRECT IN DIRECT OPERATIONAL EMISSIONS Indirect emissions related to selected sources from our operations and supply chain. Includes: • Employee commute and working from home • 3rd party electricity – data centres and ATMs • Electricity transmission and distribution losses • Air travel, taxis and couriers • Base building electricity • Paper consumption and disposal • Waste to landfill Indirect emissions from the generation of energy we have purchased, including purchased electricity. Direct emissions from controlled facilities, including: • Refrigerants • Stationary energy (natural gas, diesel, LPG) • Transport energy, fleet fuels Financed emissions Indirect emissions downstream of our operations which we have financed. These are our share of the emissions generated by customers (customers' scope 1 and 2 emissions and, for certain sectors, scope 3 emissions). Our measurement of financed emissions excludes non-mortgage personal lending, lending to governments and some government-owned entities, and holdings of liquid assets. Facilitated Emissions Downstream emissions related to capital markets activities (e.g., bond origination). These are not currently calculated. Capital markets origination is not a material part of our business and we are assessing its emission impact using new methodologies. WESTPAC GROUP 2024 CLIMATE REPORT |
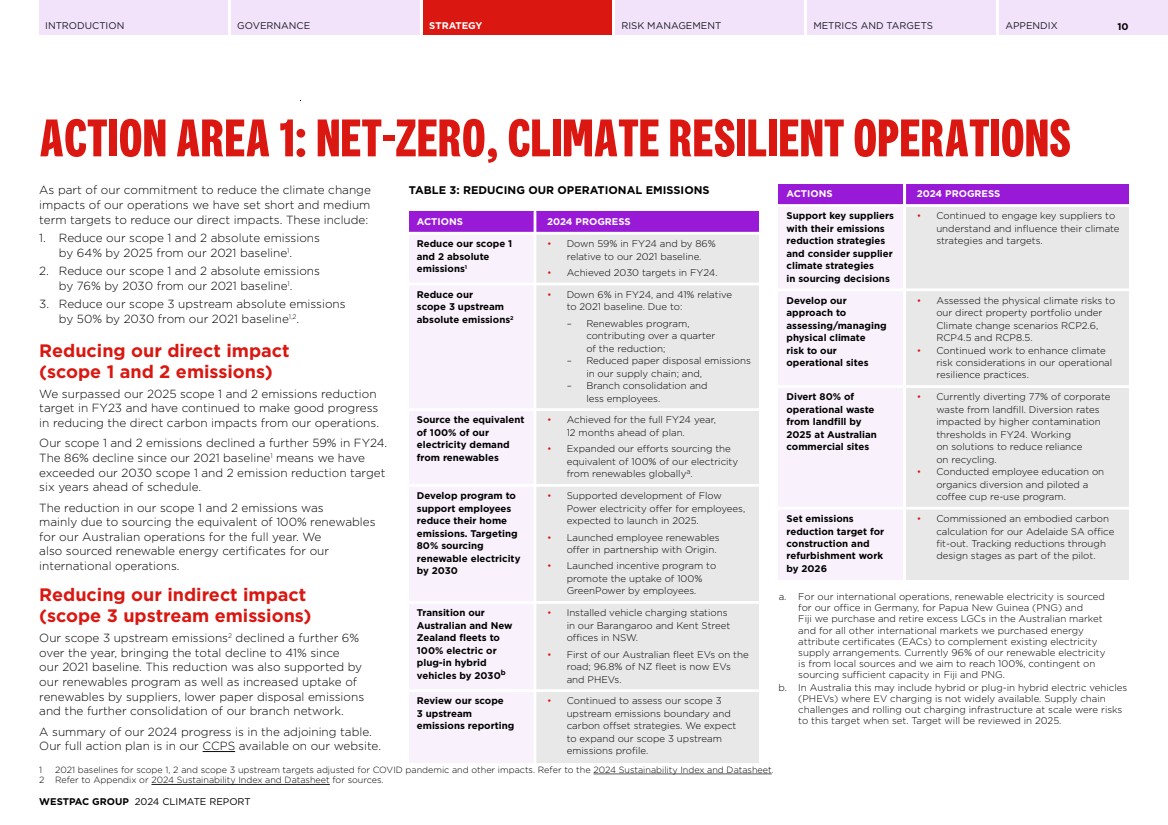
| INTRODUCTION GOVERNANCE STRATEGY RISK MANAGEMENT METRICS AND TARGETS APPENDIX 10 ACTION AREA 1: NET-ZERO, CLIMATE RESILIENT OPERATIONS As part of our commitment to reduce the climate change impacts of our operations we have set short and medium term targets to reduce our direct impacts. These include: 1. Reduce our scope 1 and 2 absolute emissions by 64% by 2025 from our 2021 baseline1 .. 2. Reduce our scope 1 and 2 absolute emissions by 76% by 2030 from our 2021 baseline1 .. 3. Reduce our scope 3 upstream absolute emissions by 50% by 2030 from our 2021 baseline1,2 .. Reducing our direct impact (scope 1 and 2 emissions) We surpassed our 2025 scope 1 and 2 emissions reduction target in FY23 and have continued to make good progress in reducing the direct carbon impacts from our operations. Our scope 1 and 2 emissions declined a further 59% in FY24. The 86% decline since our 2021 baseline1 means we have exceeded our 2030 scope 1 and 2 emission reduction target six years ahead of schedule. The reduction in our scope 1 and 2 emissions was mainly due to sourcing the equivalent of 100% renewables for our Australian operations for the full year. We also sourced renewable energy certificates for our international operations. Reducing our indirect impact (scope 3 upstream emissions) Our scope 3 upstream emissions2 declined a further 6% over the year, bringing the total decline to 41% since our 2021 baseline. This reduction was also supported by our renewables program as well as increased uptake of renewables by suppliers, lower paper disposal emissions and the further consolidation of our branch network. A summary of our 2024 progress is in the adjoining table. Our full action plan is in our CCPS available on our website. TABLE 3: REDUCING OUR OPERATIONAL EMISSIONS ACTIONS 2024 PROGRESS Reduce our scope 1 and 2 absolute emissions1 • Down 59% in FY24 and by 86% relative to our 2021 baseline. • Achieved 2030 targets in FY24. Reduce our scope 3 upstream absolute emissions2 • Down 6% in FY24, and 41% relative to 2021 baseline. Due to: – Renewables program, contributing over a quarter of the reduction; – Reduced paper disposal emissions in our supply chain; and, – Branch consolidation and less employees. Source the equivalent of 100% of our electricity demand from renewables • Achieved for the full FY24 year, 12 months ahead of plan. • Expanded our efforts sourcing the equivalent of 100% of our electricity from renewables globallya .. Develop program to support employees reduce their home emissions. Targeting 80% sourcing renewable electricity by 2030 • Supported development of Flow Power electricity offer for employees, expected to launch in 2025. • Launched employee renewables offer in partnership with Origin. • Launched incentive program to promote the uptake of 100% GreenPower by employees. Transition our Australian and New Zealand fleets to 100% electric or plug-in hybrid vehicles by 2030b • Installed vehicle charging stations in our Barangaroo and Kent Street offices in NSW. • First of our Australian fleet EVs on the road; 96.8% of NZ fleet is now EVs and PHEVs. Review our scope 3 upstream emissions reporting • Continued to assess our scope 3 upstream emissions boundary and carbon offset strategies. We expect to expand our scope 3 upstream emissions profile. ACTIONS 2024 PROGRESS Support key suppliers with their emissions reduction strategies and consider supplier climate strategies in sourcing decisions • Continued to engage key suppliers to understand and influence their climate strategies and targets. Develop our approach to assessing/managing physical climate risk to our operational sites • Assessed the physical climate risks to our direct property portfolio under Climate change scenarios RCP2.6, RCP4.5 and RCP8.5. • Continued work to enhance climate risk considerations in our operational resilience practices. Divert 80% of operational waste from landfill by 2025 at Australian commercial sites • Currently diverting 77% of corporate waste from landfill. Diversion rates impacted by higher contamination thresholds in FY24. Working on solutions to reduce reliance on recycling. • Conducted employee education on organics diversion and piloted a coffee cup re-use program. Set emissions reduction target for construction and refurbishment work by 2026 • Commissioned an embodied carbon calculation for our Adelaide SA office fit-out. Tracking reductions through design stages as part of the pilot. a. For our international operations, renewable electricity is sourced for our office in Germany, for Papua New Guinea (PNG) and Fiji we purchase and retire excess LGCs in the Australian market and for all other international markets we purchased energy attribute certificates (EACs) to complement existing electricity supply arrangements. Currently 96% of our renewable electricity is from local sources and we aim to reach 100%, contingent on sourcing sufficient capacity in Fiji and PNG. b. In Australia this may include hybrid or plug-in hybrid electric vehicles (PHEVs) where EV charging is not widely available. Supply chain challenges and rolling out charging infrastructure at scale were risks to this target when set. Target will be reviewed in 2025. 1 2021 baselines for scope 1, 2 and scope 3 upstream targets adjusted for COVID pandemic and other impacts. Refer to the 2024 Sustainability Index and Datasheet. 2 Refer to Appendix or 2024 Sustainability Index and Datasheet for sources. WESTPAC GROUP 2024 CLIMATE REPORT |
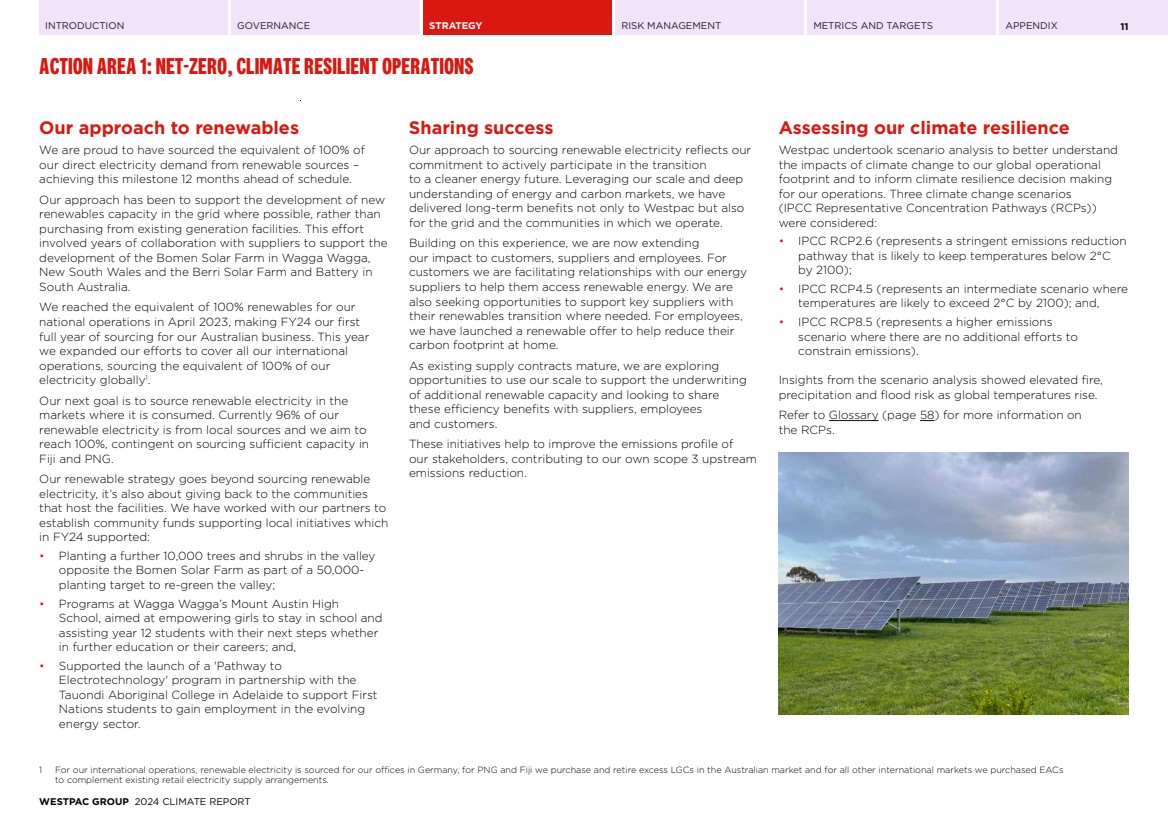
| INTRODUCTION GOVERNANCE STRATEGY RISK MANAGEMENT METRICS AND TARGETS APPENDIX ACTION AREA 1: NET-ZERO, CLIMATE RESILIENT OPERATIONS 11 Our approach to renewables We are proud to have sourced the equivalent of 100% of our direct electricity demand from renewable sources – achieving this milestone 12 months ahead of schedule. Our approach has been to support the development of new renewables capacity in the grid where possible, rather than purchasing from existing generation facilities. This effort involved years of collaboration with suppliers to support the development of the Bomen Solar Farm in Wagga Wagga, New South Wales and the Berri Solar Farm and Battery in South Australia. We reached the equivalent of 100% renewables for our national operations in April 2023, making FY24 our first full year of sourcing for our Australian business. This year we expanded our efforts to cover all our international operations, sourcing the equivalent of 100% of our electricity globally1 .. Our next goal is to source renewable electricity in the markets where it is consumed. Currently 96% of our renewable electricity is from local sources and we aim to reach 100%, contingent on sourcing sufficient capacity in Fiji and PNG. Our renewable strategy goes beyond sourcing renewable electricity, it’s also about giving back to the communities that host the facilities. We have worked with our partners to establish community funds supporting local initiatives which in FY24 supported: • Planting a further 10,000 trees and shrubs in the valley opposite the Bomen Solar Farm as part of a 50,000- planting target to re-green the valley; • Programs at Wagga Wagga’s Mount Austin High School, aimed at empowering girls to stay in school and assisting year 12 students with their next steps whether in further education or their careers; and, • Supported the launch of a 'Pathway to Electrotechnology' program in partnership with the Tauondi Aboriginal College in Adelaide to support First Nations students to gain employment in the evolving energy sector. Sharing success Our approach to sourcing renewable electricity reflects our commitment to actively participate in the transition to a cleaner energy future. Leveraging our scale and deep understanding of energy and carbon markets, we have delivered long-term benefits not only to Westpac but also for the grid and the communities in which we operate. Building on this experience, we are now extending our impact to customers, suppliers and employees. For customers we are facilitating relationships with our energy suppliers to help them access renewable energy. We are also seeking opportunities to support key suppliers with their renewables transition where needed. For employees, we have launched a renewable offer to help reduce their carbon footprint at home. As existing supply contracts mature, we are exploring opportunities to use our scale to support the underwriting of additional renewable capacity and looking to share these efficiency benefits with suppliers, employees and customers. These initiatives help to improve the emissions profile of our stakeholders, contributing to our own scope 3 upstream emissions reduction. Assessing our climate resilience Westpac undertook scenario analysis to better understand the impacts of climate change to our global operational footprint and to inform climate resilience decision making for our operations. Three climate change scenarios (IPCC Representative Concentration Pathways (RCPs)) were considered: • IPCC RCP2.6 (represents a stringent emissions reduction pathway that is likely to keep temperatures below 2°C by 2100); • IPCC RCP4.5 (represents an intermediate scenario where temperatures are likely to exceed 2°C by 2100); and, • IPCC RCP8.5 (represents a higher emissions scenario where there are no additional efforts to constrain emissions). Insights from the scenario analysis showed elevated fire, precipitation and flood risk as global temperatures rise. Refer to Glossary (page 58) for more information on the RCPs. 1 For our international operations, renewable electricity is sourced for our offices in Germany, for PNG and Fiji we purchase and retire excess LGCs in the Australian market and for all other international markets we purchased EACs to complement existing retail electricity supply arrangements. WESTPAC GROUP 2024 CLIMATE REPORT |
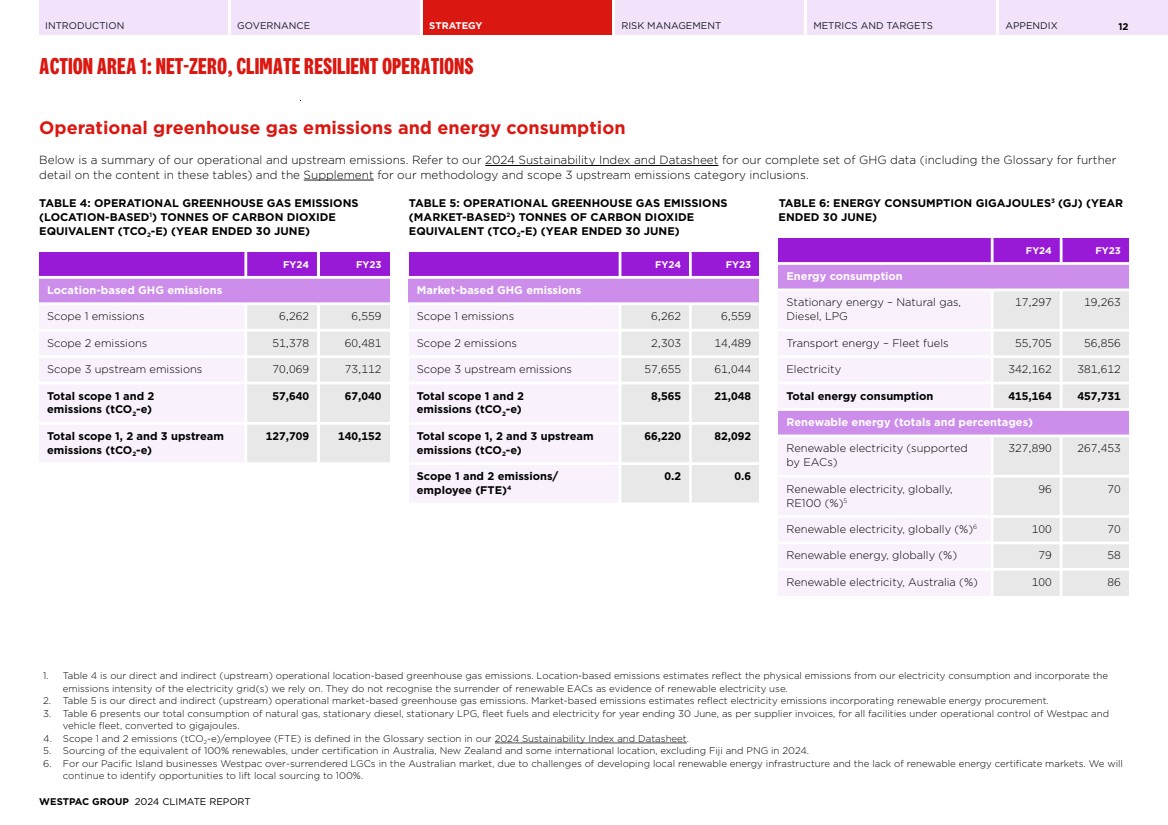
| INTRODUCTION GOVERNANCE STRATEGY RISK MANAGEMENT METRICS AND TARGETS APPENDIX ACTION AREA 1: NET-ZERO, CLIMATE RESILIENT OPERATIONS 12 Operational greenhouse gas emissions and energy consumption Below is a summary of our operational and upstream emissions. Refer to our 2024 Sustainability Index and Datasheet for our complete set of GHG data (including the Glossary for further detail on the content in these tables) and the Supplement for our methodology and scope 3 upstream emissions category inclusions. TABLE 4: OPERATIONAL GREENHOUSE GAS EMISSIONS (LOCATION-BASED1) TONNES OF CARBON DIOXIDE EQUIVALENT (TCO2-E) (YEAR ENDED 30 JUNE) FY24 FY23 Location-based GHG emissions Scope 1 emissions 6,262 6,559 Scope 2 emissions 51,378 60,481 Scope 3 upstream emissions 70,069 73,112 Total scope 1 and 2 emissions (tCO2-e) 57,640 67,040 Total scope 1, 2 and 3 upstream emissions (tCO2-e) 127,709 140,152 TABLE 5: OPERATIONAL GREENHOUSE GAS EMISSIONS (MARKET-BASED2) TONNES OF CARBON DIOXIDE EQUIVALENT (TCO2-E) (YEAR ENDED 30 JUNE) FY24 FY23 Market-based GHG emissions Scope 1 emissions 6,262 6,559 Scope 2 emissions 2,303 14,489 Scope 3 upstream emissions 57,655 61,044 Total scope 1 and 2 emissions (tCO2-e) 8,565 21,048 Total scope 1, 2 and 3 upstream emissions (tCO2-e) 66,220 82,092 Scope 1 and 2 emissions/ employee (FTE)4 0.2 0.6 TABLE 6: ENERGY CONSUMPTION GIGAJOULES3 (GJ) (YEAR ENDED 30 JUNE) FY24 FY23 Energy consumption Stationary energy – Natural gas, Diesel, LPG 17,297 19,263 Transport energy – Fleet fuels 55,705 56,856 Electricity 342,162 381,612 Total energy consumption 415,164 457,731 Renewable energy (totals and percentages) Renewable electricity (supported by EACs) 327,890 267,453 Renewable electricity, globally, RE100 (%)5 96 70 Renewable electricity, globally (%)6 100 70 Renewable energy, globally (%) 79 58 Renewable electricity, Australia (%) 100 86 1. Table 4 is our direct and indirect (upstream) operational location-based greenhouse gas emissions. Location-based emissions estimates reflect the physical emissions from our electricity consumption and incorporate the emissions intensity of the electricity grid(s) we rely on. They do not recognise the surrender of renewable EACs as evidence of renewable electricity use. 2. Table 5 is our direct and indirect (upstream) operational market-based greenhouse gas emissions. Market-based emissions estimates reflect electricity emissions incorporating renewable energy procurement. 3. Table 6 presents our total consumption of natural gas, stationary diesel, stationary LPG, fleet fuels and electricity for year ending 30 June, as per supplier invoices, for all facilities under operational control of Westpac and vehicle fleet, converted to gigajoules. 4. Scope 1 and 2 emissions (tCO2-e)/employee (FTE) is defined in the Glossary section in our 2024 Sustainability Index and Datasheet. 5. Sourcing of the equivalent of 100% renewables, under certification in Australia, New Zealand and some international location, excluding Fiji and PNG in 2024. 6. For our Pacific Island businesses Westpac over-surrendered LGCs in the Australian market, due to challenges of developing local renewable energy infrastructure and the lack of renewable energy certificate markets. We will continue to identify opportunities to lift local sourcing to 100%. WESTPAC GROUP 2024 CLIMATE REPORT |
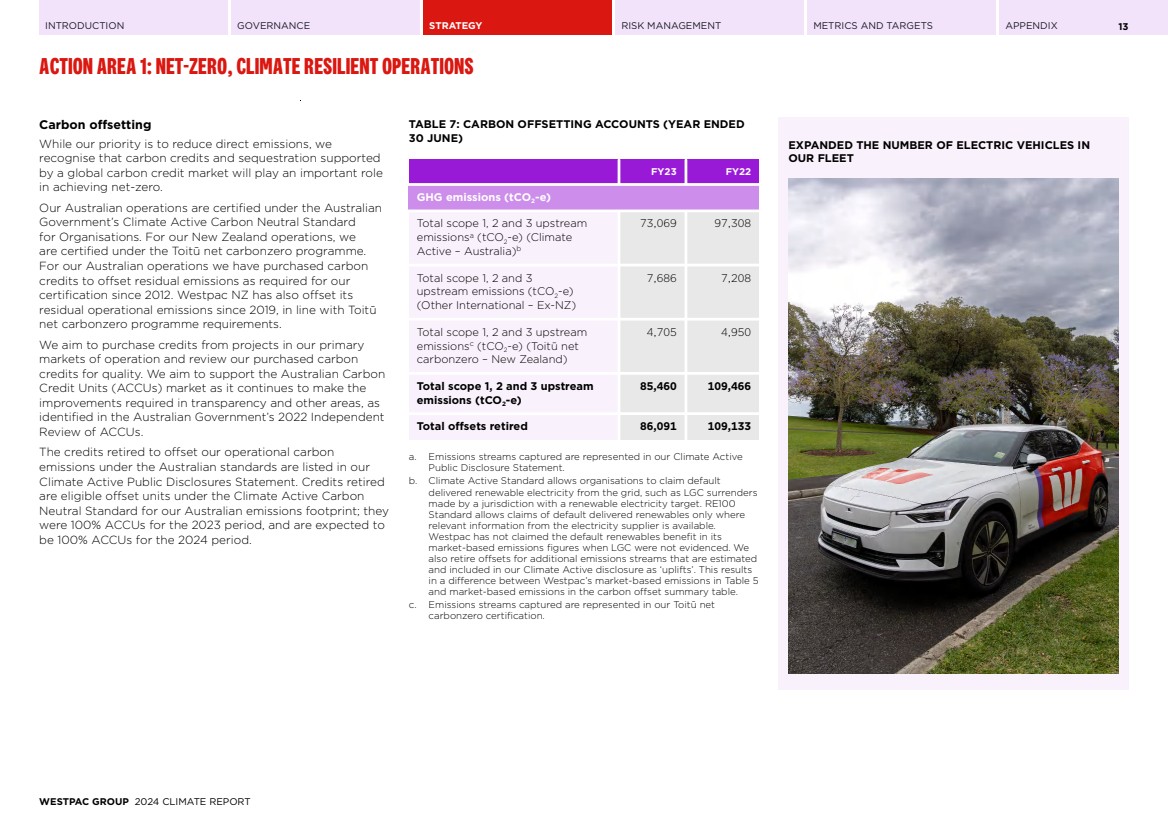
| INTRODUCTION GOVERNANCE STRATEGY RISK MANAGEMENT METRICS AND TARGETS APPENDIX ACTION AREA 1: NET-ZERO, CLIMATE RESILIENT OPERATIONS 13 Carbon offsetting While our priority is to reduce direct emissions, we recognise that carbon credits and sequestration supported by a global carbon credit market will play an important role in achieving net-zero. Our Australian operations are certified under the Australian Government’s Climate Active Carbon Neutral Standard for Organisations. For our New Zealand operations, we are certified under the Toitū net carbonzero programme. For our Australian operations we have purchased carbon credits to offset residual emissions as required for our certification since 2012. Westpac NZ has also offset its residual operational emissions since 2019, in line with Toitū net carbonzero programme requirements. We aim to purchase credits from projects in our primary markets of operation and review our purchased carbon credits for quality. We aim to support the Australian Carbon Credit Units (ACCUs) market as it continues to make the improvements required in transparency and other areas, as identified in the Australian Government’s 2022 Independent Review of ACCUs. The credits retired to offset our operational carbon emissions under the Australian standards are listed in our Climate Active Public Disclosures Statement. Credits retired are eligible offset units under the Climate Active Carbon Neutral Standard for our Australian emissions footprint; they were 100% ACCUs for the 2023 period, and are expected to be 100% ACCUs for the 2024 period. TABLE 7: CARBON OFFSETTING ACCOUNTS (YEAR ENDED 30 JUNE) FY23 FY22 GHG emissions (tCO2-e) Total scope 1, 2 and 3 upstream emissionsa (tCO2-e) (Climate Active – Australia)b 73,069 97,308 Total scope 1, 2 and 3 upstream emissions (tCO2-e) (Other International – Ex-NZ) 7,686 7,208 Total scope 1, 2 and 3 upstream emissionsc (tCO2-e) (Toitū net carbonzero – New Zealand) 4,705 4,950 Total scope 1, 2 and 3 upstream emissions (tCO2-e) 85,460 109,466 Total offsets retired 86,091 109,133 a. Emissions streams captured are represented in our Climate Active Public Disclosure Statement. b. Climate Active Standard allows organisations to claim default delivered renewable electricity from the grid, such as LGC surrenders made by a jurisdiction with a renewable electricity target. RE100 Standard allows claims of default delivered renewables only where relevant information from the electricity supplier is available. Westpac has not claimed the default renewables benefit in its market-based emissions figures when LGC were not evidenced. We also retire offsets for additional emissions streams that are estimated and included in our Climate Active disclosure as ‘uplifts’. This results in a difference between Westpac’s market-based emissions in Table 5 and market-based emissions in the carbon offset summary table. c. Emissions streams captured are represented in our Toitū net carbonzero certification. EXPANDED THE NUMBER OF ELECTRIC VEHICLES IN OUR FLEET WESTPAC GROUP 2024 CLIMATE REPORT |
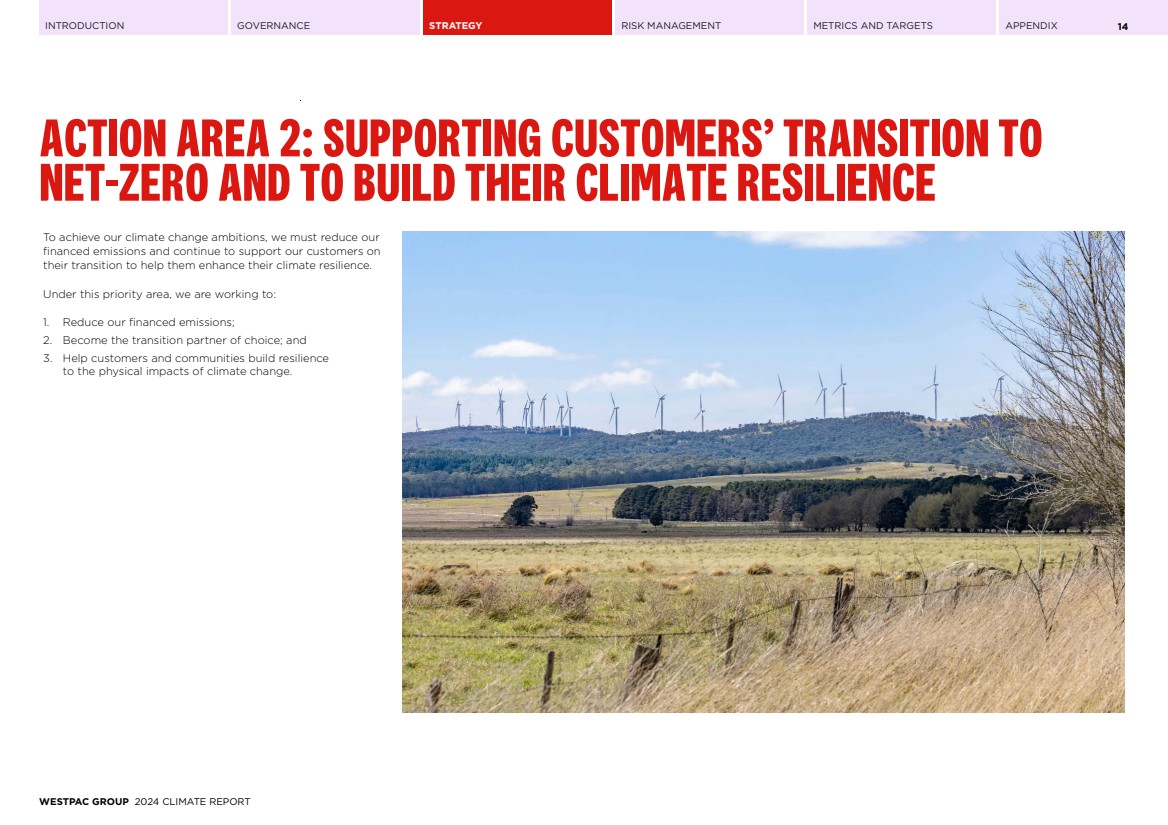
| INTRODUCTION GOVERNANCE STRATEGY RISK MANAGEMENT METRICS AND TARGETS APPENDIX 14 ACTION AREA 2: SUPPORTING CUSTOMERS’ TRANSITION TO NET-ZERO AND TO BUILD THEIR CLIMATE RESILIENCE To achieve our climate change ambitions, we must reduce our financed emissions and continue to support our customers on their transition to help them enhance their climate resilience. Under this priority area, we are working to: 1. Reduce our financed emissions; 2. Become the transition partner of choice; and 3. Help customers and communities build resilience to the physical impacts of climate change. WESTPAC GROUP 2024 CLIMATE REPORT |
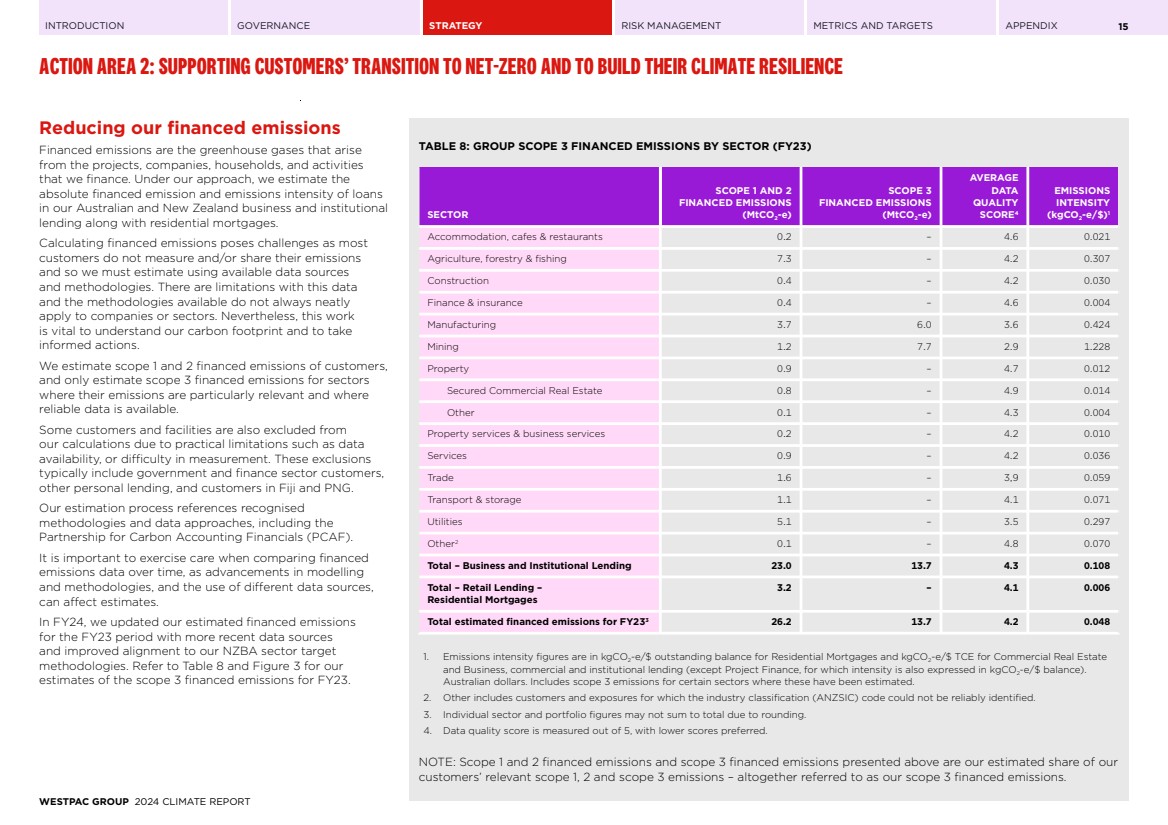
| INTRODUCTION GOVERNANCE STRATEGY RISK MANAGEMENT METRICS AND TARGETS APPENDIX ACTION AREA 2: SUPPORTING CUSTOMERS’ TRANSITION TO NET-ZERO AND TO BUILD THEIR CLIMATE RESILIENCE 15 Reducing our financed emissions Financed emissions are the greenhouse gases that arise from the projects, companies, households, and activities that we finance. Under our approach, we estimate the absolute financed emission and emissions intensity of loans in our Australian and New Zealand business and institutional lending along with residential mortgages. Calculating financed emissions poses challenges as most customers do not measure and/or share their emissions and so we must estimate using available data sources and methodologies. There are limitations with this data and the methodologies available do not always neatly apply to companies or sectors. Nevertheless, this work is vital to understand our carbon footprint and to take informed actions. We estimate scope 1 and 2 financed emissions of customers, and only estimate scope 3 financed emissions for sectors where their emissions are particularly relevant and where reliable data is available. Some customers and facilities are also excluded from our calculations due to practical limitations such as data availability, or difficulty in measurement. These exclusions typically include government and finance sector customers, other personal lending, and customers in Fiji and PNG. Our estimation process references recognised methodologies and data approaches, including the Partnership for Carbon Accounting Financials (PCAF). It is important to exercise care when comparing financed emissions data over time, as advancements in modelling and methodologies, and the use of different data sources, can affect estimates. In FY24, we updated our estimated financed emissions for the FY23 period with more recent data sources and improved alignment to our NZBA sector target methodologies. Refer to Table 8 and Figure 3 for our estimates of the scope 3 financed emissions for FY23. TABLE 8: GROUP SCOPE 3 FINANCED EMISSIONS BY SECTOR (FY23) SECTOR SCOPE 1 AND 2 FINANCED EMISSIONS (MtCO2-e) SCOPE 3 FINANCED EMISSIONS (MtCO2-e) AVERAGE DATA QUALITY SCORE4 EMISSIONS INTENSITY (kgCO2-e/$)1 Accommodation, cafes & restaurants 0.2 – 4.6 0.021 Agriculture, forestry & fishing 7.3 – 4.2 0.307 Construction 0.4 – 4.2 0.030 Finance & insurance 0.4 – 4.6 0.004 Manufacturing 3.7 6.0 3.6 0.424 Mining 1.2 7.7 2.9 1.228 Property 0.9 – 4.7 0.012 Secured Commercial Real Estate 0.8 – 4.9 0.014 Other 0.1 – 4.3 0.004 Property services & business services 0.2 – 4.2 0.010 Services 0.9 – 4.2 0.036 Trade 1.6 – 3,9 0.059 Transport & storage 1.1 – 4.1 0.071 Utilities 5.1 – 3.5 0.297 Other2 0.1 – 4.8 0.070 Total – Business and Institutional Lending 23.0 13.7 4.3 0.108 Total – Retail Lending – Residential Mortgages 3.2 – 4.1 0.006 Total estimated financed emissions for FY233 26.2 13.7 4.2 0.048 1. Emissions intensity figures are in kgCO2-e/$ outstanding balance for Residential Mortgages and kgCO2-e/$ TCE for Commercial Real Estate and Business, commercial and institutional lending (except Project Finance, for which intensity is also expressed in kgCO2-e/$ balance). Australian dollars. Includes scope 3 emissions for certain sectors where these have been estimated. 2. Other includes customers and exposures for which the industry classification (ANZSIC) code could not be reliably identified. 3. Individual sector and portfolio figures may not sum to total due to rounding. 4. Data quality score is measured out of 5, with lower scores preferred. NOTE: Scope 1 and 2 financed emissions and scope 3 financed emissions presented above are our estimated share of our customers’ relevant scope 1, 2 and scope 3 emissions – altogether referred to as our scope 3 financed emissions. WESTPAC GROUP 2024 CLIMATE REPORT |
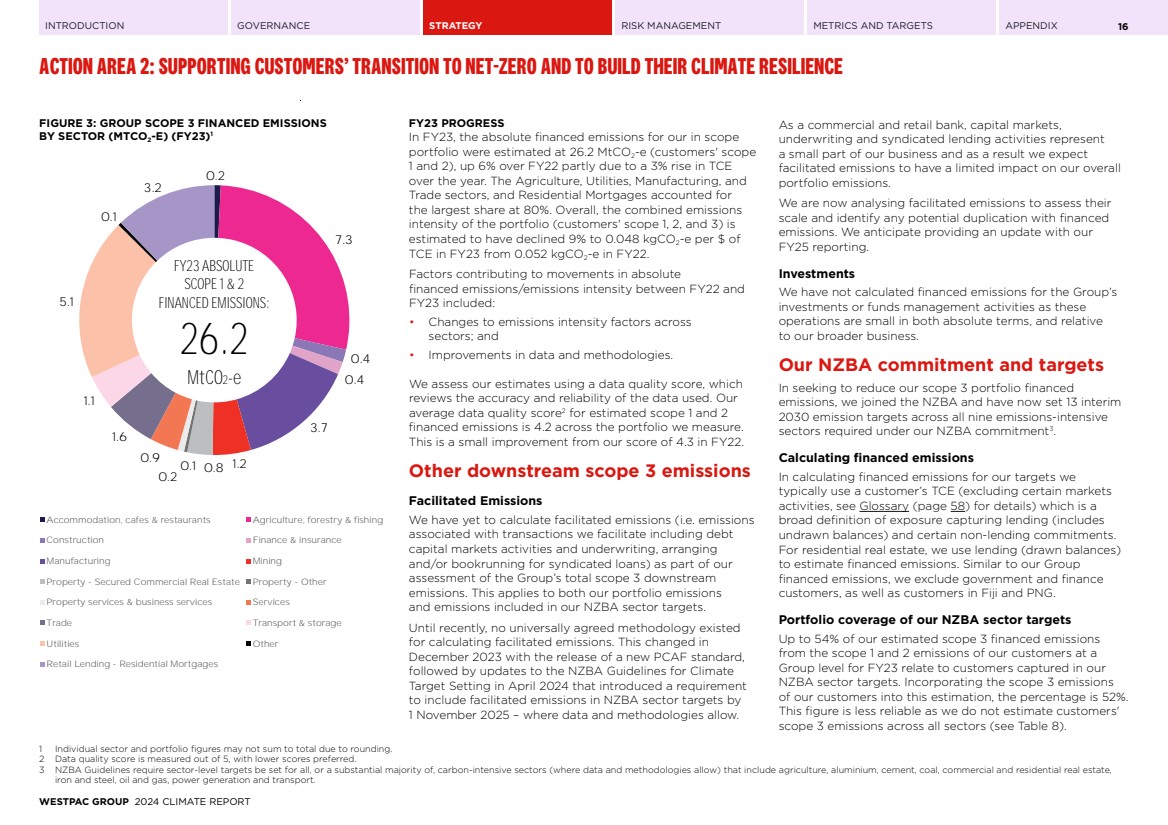
| INTRODUCTION GOVERNANCE STRATEGY RISK MANAGEMENT METRICS AND TARGETS APPENDIX ACTION AREA 2: SUPPORTING CUSTOMERS’ TRANSITION TO NET-ZERO AND TO BUILD THEIR CLIMATE RESILIENCE 16 FIGURE 3: GROUP SCOPE 3 FINANCED EMISSIONS BY SECTOR (MTCO2-E) (FY23)1 0.2 7.3 0.4 0.4 3.7 0.1 0.8 1.2 0.2 0.9 1.6 1.1 5.1 0.1 3.2 Accommodation, cafes & restaurants Agriculture, forestry & fishing Construction Finance & insurance Manufacturing Mining Property - Secured Commercial Real Estate Property - Other Property services & business services Services Trade Transport & storage Utilities Other Retail Lending - Residential Mortgages FY23 ABSOLUTE SCOPE 1 & 2 FINANCED EMISSIONS: 26.2 MtCO2-e FY23 PROGRESS In FY23, the absolute financed emissions for our in scope portfolio were estimated at 26.2 MtCO2-e (customers' scope 1 and 2), up 6% over FY22 partly due to a 3% rise in TCE over the year. The Agriculture, Utilities, Manufacturing, and Trade sectors, and Residential Mortgages accounted for the largest share at 80%. Overall, the combined emissions intensity of the portfolio (customers' scope 1, 2, and 3) is estimated to have declined 9% to 0.048 kgCO2-e per $ of TCE in FY23 from 0.052 kgCO2-e in FY22. Factors contributing to movements in absolute financed emissions/emissions intensity between FY22 and FY23 included: • Changes to emissions intensity factors across sectors; and • Improvements in data and methodologies. We assess our estimates using a data quality score, which reviews the accuracy and reliability of the data used. Our average data quality score2 for estimated scope 1 and 2 financed emissions is 4.2 across the portfolio we measure. This is a small improvement from our score of 4.3 in FY22. Other downstream scope 3 emissions Facilitated Emissions We have yet to calculate facilitated emissions (i.e. emissions associated with transactions we facilitate including debt capital markets activities and underwriting, arranging and/or bookrunning for syndicated loans) as part of our assessment of the Group’s total scope 3 downstream emissions. This applies to both our portfolio emissions and emissions included in our NZBA sector targets. Until recently, no universally agreed methodology existed for calculating facilitated emissions. This changed in December 2023 with the release of a new PCAF standard, followed by updates to the NZBA Guidelines for Climate Target Setting in April 2024 that introduced a requirement to include facilitated emissions in NZBA sector targets by 1 November 2025 – where data and methodologies allow. As a commercial and retail bank, capital markets, underwriting and syndicated lending activities represent a small part of our business and as a result we expect facilitated emissions to have a limited impact on our overall portfolio emissions. We are now analysing facilitated emissions to assess their scale and identify any potential duplication with financed emissions. We anticipate providing an update with our FY25 reporting. Investments We have not calculated financed emissions for the Group’s investments or funds management activities as these operations are small in both absolute terms, and relative to our broader business. Our NZBA commitment and targets In seeking to reduce our scope 3 portfolio financed emissions, we joined the NZBA and have now set 13 interim 2030 emission targets across all nine emissions-intensive sectors required under our NZBA commitment3 .. Calculating financed emissions In calculating financed emissions for our targets we typically use a customer’s TCE (excluding certain markets activities, see Glossary (page 58) for details) which is a broad definition of exposure capturing lending (includes undrawn balances) and certain non-lending commitments. For residential real estate, we use lending (drawn balances) to estimate financed emissions. Similar to our Group financed emissions, we exclude government and finance customers, as well as customers in Fiji and PNG. Portfolio coverage of our NZBA sector targets Up to 54% of our estimated scope 3 financed emissions from the scope 1 and 2 emissions of our customers at a Group level for FY23 relate to customers captured in our NZBA sector targets. Incorporating the scope 3 emissions of our customers into this estimation, the percentage is 52%. This figure is less reliable as we do not estimate customers' scope 3 emissions across all sectors (see Table 8). 1 Individual sector and portfolio figures may not sum to total due to rounding. 2 Data quality score is measured out of 5, with lower scores preferred. 3 NZBA Guidelines require sector-level targets be set for all, or a substantial majority of, carbon-intensive sectors (where data and methodologies allow) that include agriculture, aluminium, cement, coal, commercial and residential real estate, iron and steel, oil and gas, power generation and transport. WESTPAC GROUP 2024 CLIMATE REPORT |
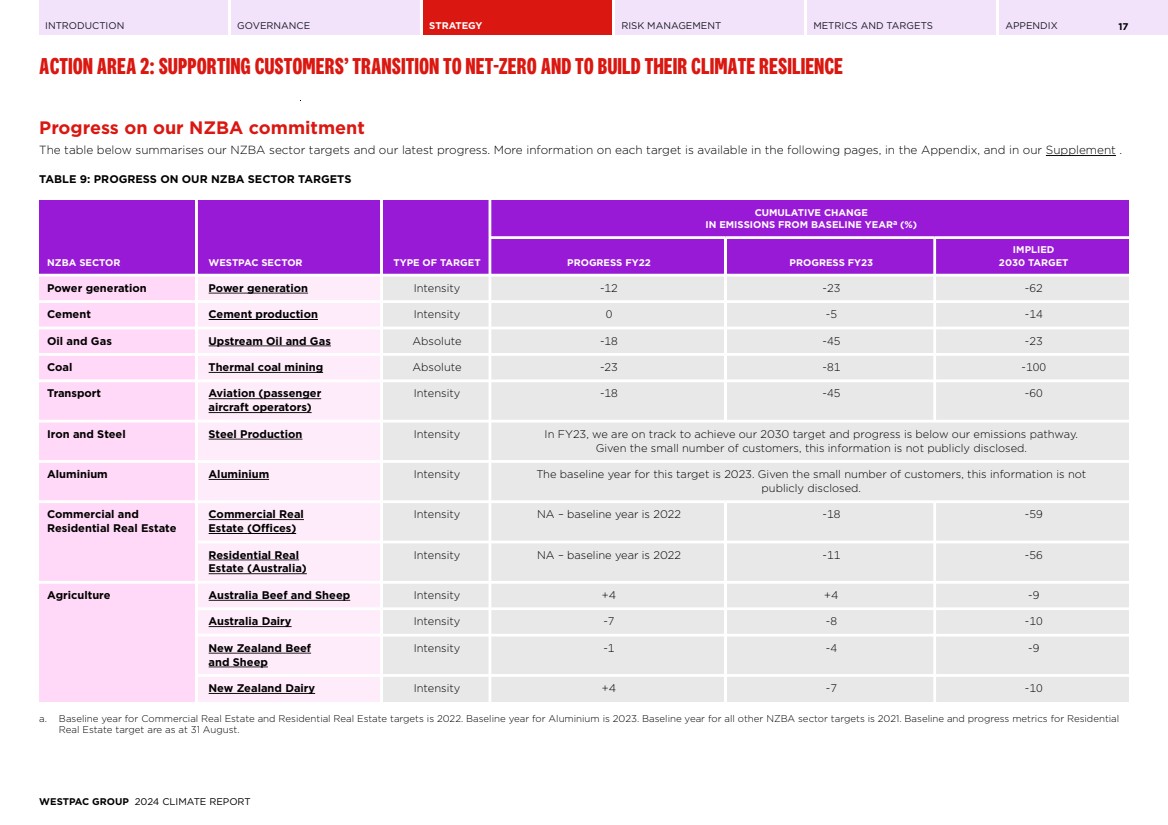
| INTRODUCTION GOVERNANCE STRATEGY RISK MANAGEMENT METRICS AND TARGETS APPENDIX ACTION AREA 2: SUPPORTING CUSTOMERS’ TRANSITION TO NET-ZERO AND TO BUILD THEIR CLIMATE RESILIENCE 17 Progress on our NZBA commitment The table below summarises our NZBA sector targets and our latest progress. More information on each target is available in the following pages, in the Appendix, and in our Supplement . TABLE 9: PROGRESS ON OUR NZBA SECTOR TARGETS NZBA SECTOR WESTPAC SECTOR TYPE OF TARGET CUMULATIVE CHANGE IN EMISSIONS FROM BASELINE YEARa (%) PROGRESS FY22 PROGRESS FY23 IMPLIED 2030 TARGET Power generation Power generation Intensity -12 -23 -62 Cement Cement production Intensity 0 -5 -14 Oil and Gas Upstream Oil and Gas Absolute -18 -45 -23 Coal Thermal coal mining Absolute -23 -81 -100 Transport Aviation (passenger aircraft operators) Intensity -18 -45 -60 Iron and Steel Steel Production Intensity In FY23, we are on track to achieve our 2030 target and progress is below our emissions pathway. Given the small number of customers, this information is not publicly disclosed. Aluminium Aluminium Intensity The baseline year for this target is 2023. Given the small number of customers, this information is not publicly disclosed. Commercial and Residential Real Estate Commercial Real Estate (Offices) Intensity NA – baseline year is 2022 -18 -59 Residential Real Estate (Australia) Intensity NA – baseline year is 2022 -11 -56 Agriculture Australia Beef and Sheep Intensity +4 +4 -9 Australia Dairy Intensity -7 -8 -10 New Zealand Beef and Sheep Intensity -1 -4 -9 New Zealand Dairy Intensity +4 -7 -10 a. Baseline year for Commercial Real Estate and Residential Real Estate targets is 2022. Baseline year for Aluminium is 2023. Baseline year for all other NZBA sector targets is 2021. Baseline and progress metrics for Residential Real Estate target are as at 31 August. WESTPAC GROUP 2024 CLIMATE REPORT |
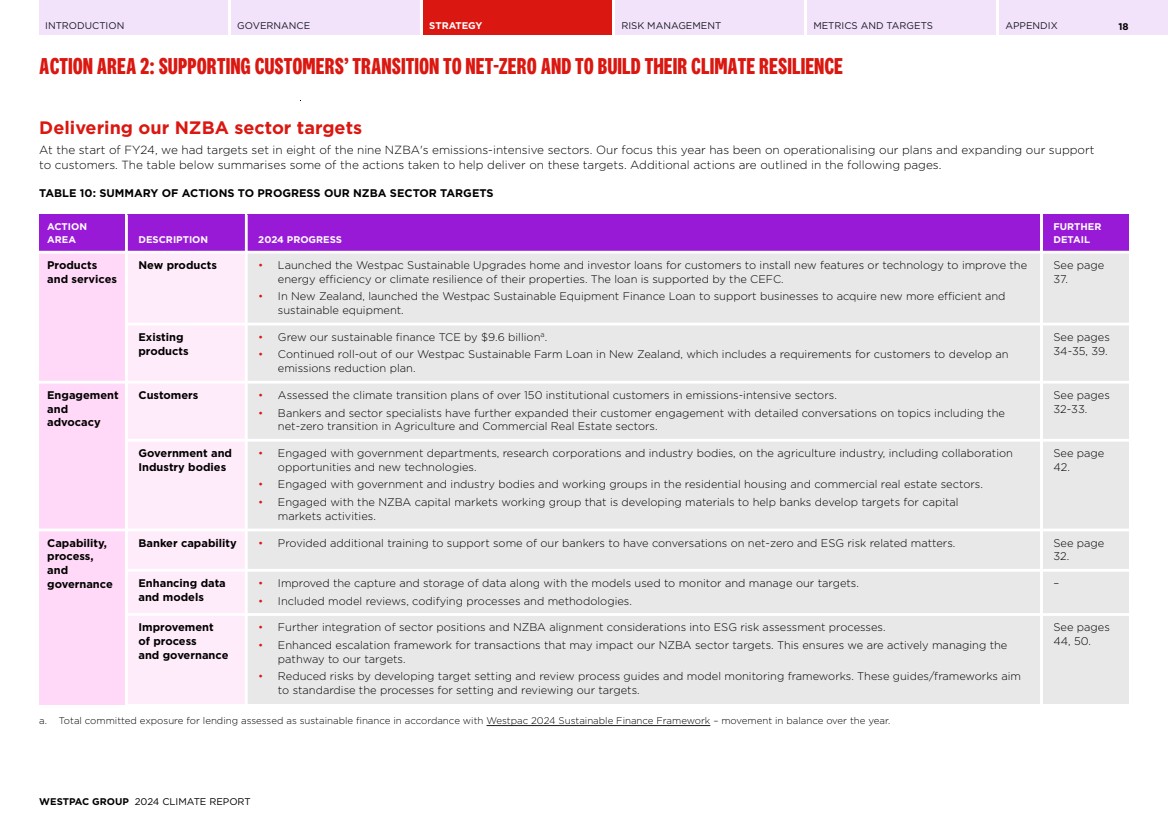
| INTRODUCTION GOVERNANCE STRATEGY RISK MANAGEMENT METRICS AND TARGETS APPENDIX ACTION AREA 2: SUPPORTING CUSTOMERS’ TRANSITION TO NET-ZERO AND TO BUILD THEIR CLIMATE RESILIENCE 18 Delivering our NZBA sector targets At the start of FY24, we had targets set in eight of the nine NZBA's emissions-intensive sectors. Our focus this year has been on operationalising our plans and expanding our support to customers. The table below summarises some of the actions taken to help deliver on these targets. Additional actions are outlined in the following pages. TABLE 10: SUMMARY OF ACTIONS TO PROGRESS OUR NZBA SECTOR TARGETS ACTION AREA DESCRIPTION 2024 PROGRESS FURTHER DETAIL Products and services New products • Launched the Westpac Sustainable Upgrades home and investor loans for customers to install new features or technology to improve the energy efficiency or climate resilience of their properties. The loan is supported by the CEFC. • In New Zealand, launched the Westpac Sustainable Equipment Finance Loan to support businesses to acquire new more efficient and sustainable equipment. See page 37. Existing products • Grew our sustainable finance TCE by $9.6 billiona .. • Continued roll-out of our Westpac Sustainable Farm Loan in New Zealand, which includes a requirements for customers to develop an emissions reduction plan. See pages 34-35, 39. Engagement and advocacy Customers • Assessed the climate transition plans of over 150 institutional customers in emissions-intensive sectors. • Bankers and sector specialists have further expanded their customer engagement with detailed conversations on topics including the net-zero transition in Agriculture and Commercial Real Estate sectors. See pages 32-33. Government and Industry bodies • Engaged with government departments, research corporations and industry bodies, on the agriculture industry, including collaboration opportunities and new technologies. • Engaged with government and industry bodies and working groups in the residential housing and commercial real estate sectors. • Engaged with the NZBA capital markets working group that is developing materials to help banks develop targets for capital markets activities. See page 42. Capability, process, and governance Banker capability • Provided additional training to support some of our bankers to have conversations on net-zero and ESG risk related matters. See page 32. Enhancing data and models • Improved the capture and storage of data along with the models used to monitor and manage our targets. • Included model reviews, codifying processes and methodologies. – Improvement of process and governance • Further integration of sector positions and NZBA alignment considerations into ESG risk assessment processes. • Enhanced escalation framework for transactions that may impact our NZBA sector targets. This ensures we are actively managing the pathway to our targets. • Reduced risks by developing target setting and review process guides and model monitoring frameworks. These guides/frameworks aim to standardise the processes for setting and reviewing our targets. See pages 44, 50. a. Total committed exposure for lending assessed as sustainable finance in accordance with Westpac 2024 Sustainable Finance Framework – movement in balance over the year. WESTPAC GROUP 2024 CLIMATE REPORT |
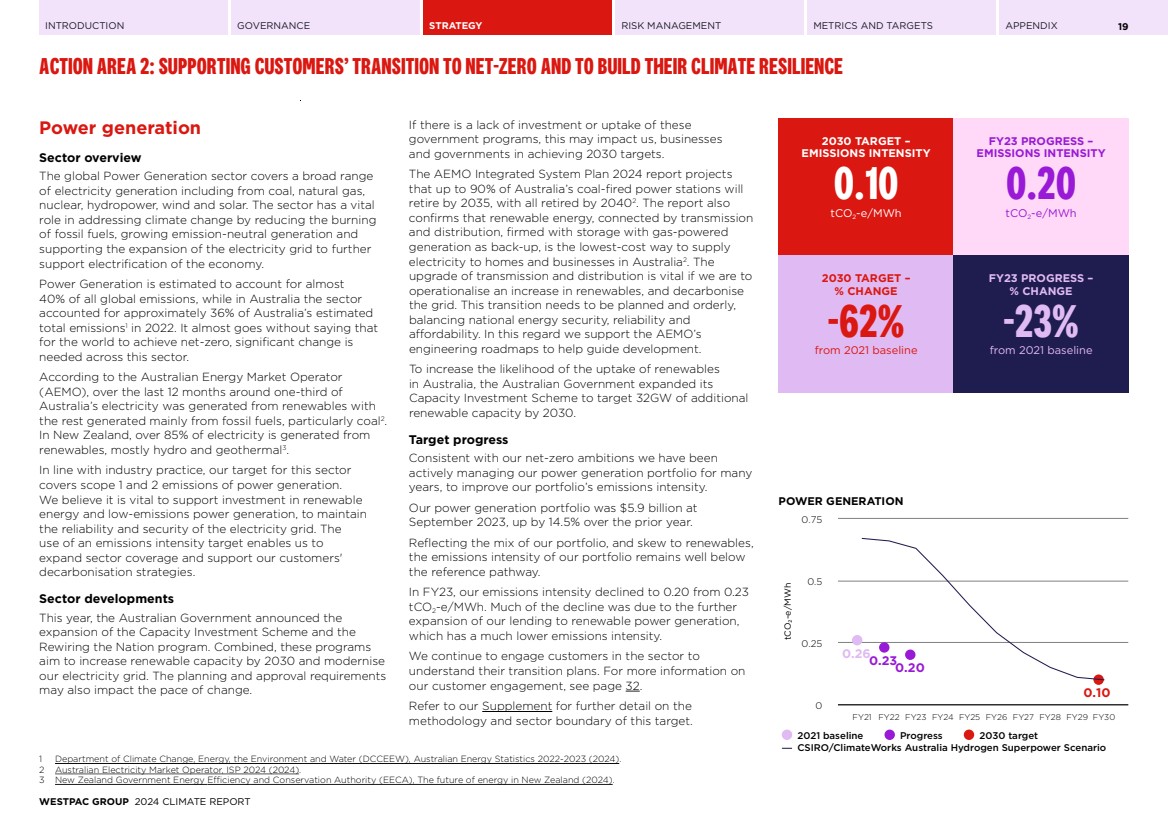
| INTRODUCTION GOVERNANCE STRATEGY RISK MANAGEMENT METRICS AND TARGETS APPENDIX ACTION AREA 2: SUPPORTING CUSTOMERS’ TRANSITION TO NET-ZERO AND TO BUILD THEIR CLIMATE RESILIENCE 19 Power generation Sector overview The global Power Generation sector covers a broad range of electricity generation including from coal, natural gas, nuclear, hydropower, wind and solar. The sector has a vital role in addressing climate change by reducing the burning of fossil fuels, growing emission-neutral generation and supporting the expansion of the electricity grid to further support electrification of the economy. Power Generation is estimated to account for almost 40% of all global emissions, while in Australia the sector accounted for approximately 36% of Australia’s estimated total emissions1 in 2022. It almost goes without saying that for the world to achieve net-zero, significant change is needed across this sector. According to the Australian Energy Market Operator (AEMO), over the last 12 months around one-third of Australia’s electricity was generated from renewables with the rest generated mainly from fossil fuels, particularly coal2 .. In New Zealand, over 85% of electricity is generated from renewables, mostly hydro and geothermal3 .. In line with industry practice, our target for this sector covers scope 1 and 2 emissions of power generation. We believe it is vital to support investment in renewable energy and low-emissions power generation, to maintain the reliability and security of the electricity grid. The use of an emissions intensity target enables us to expand sector coverage and support our customers' decarbonisation strategies. Sector developments This year, the Australian Government announced the expansion of the Capacity Investment Scheme and the Rewiring the Nation program. Combined, these programs aim to increase renewable capacity by 2030 and modernise our electricity grid. The planning and approval requirements may also impact the pace of change. If there is a lack of investment or uptake of these government programs, this may impact us, businesses and governments in achieving 2030 targets. The AEMO Integrated System Plan 2024 report projects that up to 90% of Australia’s coal-fired power stations will retire by 2035, with all retired by 20402 .. The report also confirms that renewable energy, connected by transmission and distribution, firmed with storage with gas-powered generation as back-up, is the lowest-cost way to supply electricity to homes and businesses in Australia2 .. The upgrade of transmission and distribution is vital if we are to operationalise an increase in renewables, and decarbonise the grid. This transition needs to be planned and orderly, balancing national energy security, reliability and affordability. In this regard we support the AEMO’s engineering roadmaps to help guide development. To increase the likelihood of the uptake of renewables in Australia, the Australian Government expanded its Capacity Investment Scheme to target 32GW of additional renewable capacity by 2030. Target progress Consistent with our net-zero ambitions we have been actively managing our power generation portfolio for many years, to improve our portfolio’s emissions intensity. Our power generation portfolio was $5.9 billion at September 2023, up by 14.5% over the prior year. Reflecting the mix of our portfolio, and skew to renewables, the emissions intensity of our portfolio remains well below the reference pathway. In FY23, our emissions intensity declined to 0.20 from 0.23 tCO2-e/MWh. Much of the decline was due to the further expansion of our lending to renewable power generation, which has a much lower emissions intensity. We continue to engage customers in the sector to understand their transition plans. For more information on our customer engagement, see page 32. Refer to our Supplement for further detail on the methodology and sector boundary of this target. 1 Department of Climate Change, Energy, the Environment and Water (DCCEEW), Australian Energy Statistics 2022-2023 (2024). 2 Australian Electricity Market Operator, ISP 2024 (2024). 3 New Zealand Government Energy Efficiency and Conservation Authority (EECA), The future of energy in New Zealand (2024). 2030 TARGET – EMISSIONS INTENSITY 0.10 tCO2-e/MWh FY23 PROGRESS – EMISSIONS INTENSITY 0.20 tCO2-e/MWh 2030 TARGET – % CHANGE -62% from 2021 baseline FY23 PROGRESS – % CHANGE -23% from 2021 baseline POWER GENERATION tCO₂-e/MWh 0.260.230.20 0.10 2021 baseline Progress 2030 target CSIRO/ClimateWorks Australia Hydrogen Superpower Scenario FY21 FY22 FY23 FY24 FY25 FY26 FY27 FY28 FY29 FY30 0 0.25 0.5 0.75 WESTPAC GROUP 2024 CLIMATE REPORT |
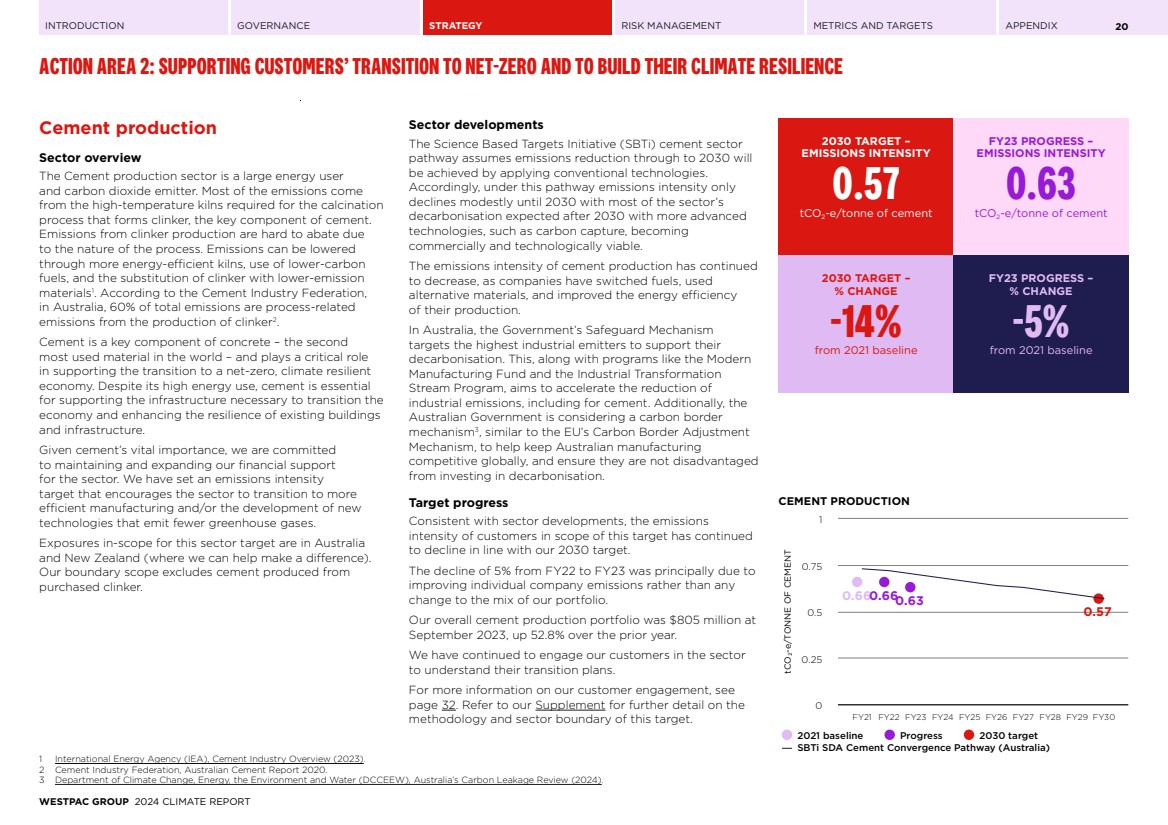
| INTRODUCTION GOVERNANCE STRATEGY RISK MANAGEMENT METRICS AND TARGETS APPENDIX ACTION AREA 2: SUPPORTING CUSTOMERS’ TRANSITION TO NET-ZERO AND TO BUILD THEIR CLIMATE RESILIENCE 20 Cement production Sector overview The Cement production sector is a large energy user and carbon dioxide emitter. Most of the emissions come from the high-temperature kilns required for the calcination process that forms clinker, the key component of cement. Emissions from clinker production are hard to abate due to the nature of the process. Emissions can be lowered through more energy-efficient kilns, use of lower-carbon fuels, and the substitution of clinker with lower-emission materials1 .. According to the Cement Industry Federation, in Australia, 60% of total emissions are process-related emissions from the production of clinker2 .. Cement is a key component of concrete – the second most used material in the world – and plays a critical role in supporting the transition to a net-zero, climate resilient economy. Despite its high energy use, cement is essential for supporting the infrastructure necessary to transition the economy and enhancing the resilience of existing buildings and infrastructure. Given cement’s vital importance, we are committed to maintaining and expanding our financial support for the sector. We have set an emissions intensity target that encourages the sector to transition to more efficient manufacturing and/or the development of new technologies that emit fewer greenhouse gases. Exposures in-scope for this sector target are in Australia and New Zealand (where we can help make a difference). Our boundary scope excludes cement produced from purchased clinker. Sector developments The Science Based Targets Initiative (SBTi) cement sector pathway assumes emissions reduction through to 2030 will be achieved by applying conventional technologies. Accordingly, under this pathway emissions intensity only declines modestly until 2030 with most of the sector’s decarbonisation expected after 2030 with more advanced technologies, such as carbon capture, becoming commercially and technologically viable. The emissions intensity of cement production has continued to decrease, as companies have switched fuels, used alternative materials, and improved the energy efficiency of their production. In Australia, the Government’s Safeguard Mechanism targets the highest industrial emitters to support their decarbonisation. This, along with programs like the Modern Manufacturing Fund and the Industrial Transformation Stream Program, aims to accelerate the reduction of industrial emissions, including for cement. Additionally, the Australian Government is considering a carbon border mechanism3 , similar to the EU’s Carbon Border Adjustment Mechanism, to help keep Australian manufacturing competitive globally, and ensure they are not disadvantaged from investing in decarbonisation. Target progress Consistent with sector developments, the emissions intensity of customers in scope of this target has continued to decline in line with our 2030 target. The decline of 5% from FY22 to FY23 was principally due to improving individual company emissions rather than any change to the mix of our portfolio. Our overall cement production portfolio was $805 million at September 2023, up 52.8% over the prior year. We have continued to engage our customers in the sector to understand their transition plans. For more information on our customer engagement, see page 32. Refer to our Supplement for further detail on the methodology and sector boundary of this target. 1 International Energy Agency (IEA), Cement Industry Overview (2023). 2 Cement Industry Federation, Australian Cement Report 2020. 3 Department of Climate Change, Energy, the Environment and Water (DCCEEW), Australia’s Carbon Leakage Review (2024). 2030 TARGET – EMISSIONS INTENSITY 0.57 tCO2-e/tonne of cement FY23 PROGRESS – EMISSIONS INTENSITY 0.63 tCO2-e/tonne of cement 2030 TARGET – % CHANGE -14% from 2021 baseline FY23 PROGRESS – % CHANGE -5% from 2021 baseline CEMENT PRODUCTION tCO₂-e/TONNE OF CEMENT 0.660.660.63 0.57 2021 baseline Progress 2030 target SBTi SDA Cement Convergence Pathway (Australia) FY21 FY22 FY23 FY24 FY25 FY26 FY27 FY28 FY29 FY30 0 0.25 0.5 0.75 1 WESTPAC GROUP 2024 CLIMATE REPORT |
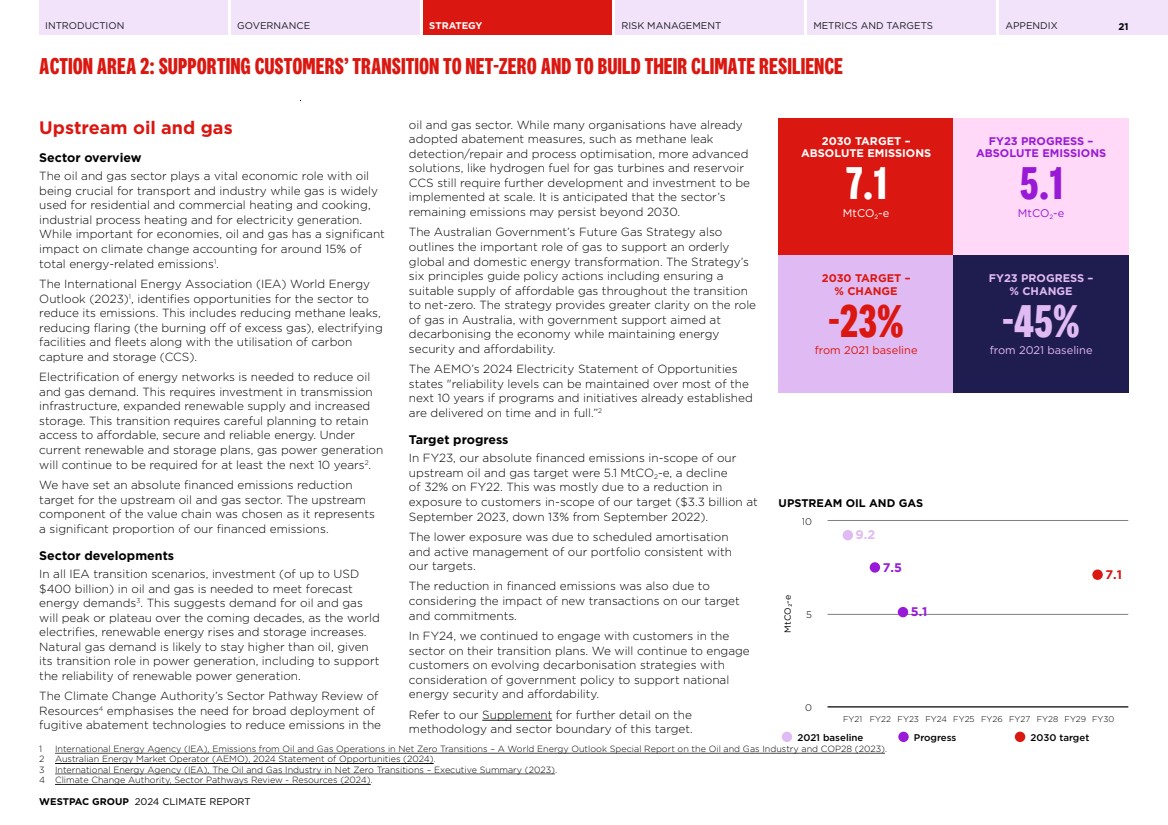
| INTRODUCTION GOVERNANCE STRATEGY RISK MANAGEMENT METRICS AND TARGETS APPENDIX ACTION AREA 2: SUPPORTING CUSTOMERS’ TRANSITION TO NET-ZERO AND TO BUILD THEIR CLIMATE RESILIENCE 21 Upstream oil and gas Sector overview The oil and gas sector plays a vital economic role with oil being crucial for transport and industry while gas is widely used for residential and commercial heating and cooking, industrial process heating and for electricity generation. While important for economies, oil and gas has a significant impact on climate change accounting for around 15% of total energy-related emissions1 .. The International Energy Association (IEA) World Energy Outlook (2023)1 , identifies opportunities for the sector to reduce its emissions. This includes reducing methane leaks, reducing flaring (the burning off of excess gas), electrifying facilities and fleets along with the utilisation of carbon capture and storage (CCS). Electrification of energy networks is needed to reduce oil and gas demand. This requires investment in transmission infrastructure, expanded renewable supply and increased storage. This transition requires careful planning to retain access to affordable, secure and reliable energy. Under current renewable and storage plans, gas power generation will continue to be required for at least the next 10 years2 .. We have set an absolute financed emissions reduction target for the upstream oil and gas sector. The upstream component of the value chain was chosen as it represents a significant proportion of our financed emissions. Sector developments In all IEA transition scenarios, investment (of up to USD $400 billion) in oil and gas is needed to meet forecast energy demands3 .. This suggests demand for oil and gas will peak or plateau over the coming decades, as the world electrifies, renewable energy rises and storage increases. Natural gas demand is likely to stay higher than oil, given its transition role in power generation, including to support the reliability of renewable power generation. The Climate Change Authority’s Sector Pathway Review of Resources4 emphasises the need for broad deployment of fugitive abatement technologies to reduce emissions in the oil and gas sector. While many organisations have already adopted abatement measures, such as methane leak detection/repair and process optimisation, more advanced solutions, like hydrogen fuel for gas turbines and reservoir CCS still require further development and investment to be implemented at scale. It is anticipated that the sector’s remaining emissions may persist beyond 2030. The Australian Government’s Future Gas Strategy also outlines the important role of gas to support an orderly global and domestic energy transformation. The Strategy’s six principles guide policy actions including ensuring a suitable supply of affordable gas throughout the transition to net-zero. The strategy provides greater clarity on the role of gas in Australia, with government support aimed at decarbonising the economy while maintaining energy security and affordability. The AEMO’s 2024 Electricity Statement of Opportunities states "reliability levels can be maintained over most of the next 10 years if programs and initiatives already established are delivered on time and in full.”2 Target progress In FY23, our absolute financed emissions in-scope of our upstream oil and gas target were 5.1 MtCO2-e, a decline of 32% on FY22. This was mostly due to a reduction in exposure to customers in-scope of our target ($3.3 billion at September 2023, down 13% from September 2022). The lower exposure was due to scheduled amortisation and active management of our portfolio consistent with our targets. The reduction in financed emissions was also due to considering the impact of new transactions on our target and commitments. In FY24, we continued to engage with customers in the sector on their transition plans. We will continue to engage customers on evolving decarbonisation strategies with consideration of government policy to support national energy security and affordability. Refer to our Supplement for further detail on the methodology and sector boundary of this target. 1 International Energy Agency (IEA), Emissions from Oil and Gas Operations in Net Zero Transitions – A World Energy Outlook Special Report on the Oil and Gas Industry and COP28 (2023). 2 Australian Energy Market Operator (AEMO), 2024 Statement of Opportunities (2024). 3 International Energy Agency (IEA), The Oil and Gas Industry in Net Zero Transitions – Executive Summary (2023). 4 Climate Change Authority, Sector Pathways Review - Resources (2024). 2030 TARGET – ABSOLUTE EMISSIONS 7.1 MtCO2-e FY23 PROGRESS – ABSOLUTE EMISSIONS 5.1 MtCO2-e 2030 TARGET – % CHANGE -23% from 2021 baseline FY23 PROGRESS – % CHANGE -45% from 2021 baseline UPSTREAM OIL AND GAS MtCO₂-e 9.2 7.5 5.1 7.1 2021 baseline Progress 2030 target FY21 FY22 FY23 FY24 FY25 FY26 FY27 FY28 FY29 FY30 0 5 10 WESTPAC GROUP 2024 CLIMATE REPORT |
| INTRODUCTION GOVERNANCE STRATEGY RISK MANAGEMENT METRICS AND TARGETS APPENDIX ACTION AREA 2: SUPPORTING CUSTOMERS’ TRANSITION TO NET-ZERO AND TO BUILD THEIR CLIMATE RESILIENCE 22 Thermal coal mining Sector overview Coal plays a major role in the energy sector and in the Australian economy. Thermal coal has long been the primary source of energy generation in Australia while metallurgical coal is central to the steel making process – also important for the Australian economy. Australia is also a major exporter of coal making a significant contribution to GDP, to government revenues and to regional development. However, the burning of coal is a significant source of greenhouse gas emissions and has been identified by scientific consensus as a major contributor to climate change. Emissions from thermal coal mining are mostly from the release of methane (a highly potent greenhouse gas) that occurs through production. Globally, thermal coal mining released around 40.5 Mt of methane in 2022, which translates to a carbon equivalent of 1.2Gt CO2-e1 .. Accordingly, we believe it is critical that the world transitions away from thermal coal combustion and does so quickly. This has been recognised globally with the latest IEA projections (2023) estimating that coal demand peaks within this decade as developed economies transition to cleaner energy sources2 .. Sector developments The Australian Energy Market Operator acknowledges the need for the energy sector to transition away from thermal coal but emphasises the need to ensure energy reliability and affordability3 .. We seek to eliminate our exposure to thermal coal mining and have set short- and medium-term positions. As a first step, we are focusing on institutional customers with a significant portion (≥15%) of their revenue coming directly from thermal coal mining. Our approach to coal is detailed in our sector positions (page 31). We have also set a thermal coal mining 2030 target and this applies a lower revenue threshold (>5%). We are working to have no exposure to thermal coal mining by 2030. We have not set a target for metallurgical coal, as it remains critical for steel production and does not have commercially viable alternatives at scale. We are looking to support affected customers with their transition plans. Target progress Over FY23 our financed emissions related to thermal coal declined 75%, with the decline predominantly due to existing facilities amortising, and no new commitments approved – consistent with our sector position, and this target. Our exposure to thermal coal mining was small at $65 million at 30 September 2023, around 0.02% of our TCE. This exposure fell further over FY24. In April 2024 the NZBA updated its guidelines to provide more clarity in how metallurgical coal mining companies and diversified companies could be classified when setting targets. We expect to update our thermal coal mining target to align with this change for the FY24 year (our FY25 reporting). This will see the boundary of our thermal coal mining NZBA sector target updated to exclude metallurgical coal mines that produce a thermal coal byproduct and diversified miners that produce a thermal coal product where their dominant activity is not thermal coal. For more information on our customer engagement, see page 32. Refer to our Supplement for further detail on the methodology and sector boundary of this target. 1 International Energy Agency (IEA), Driving Down Coal Mine Methane Emissions – A regulatory roadmap and toolkit (2023). 2 International Energy Agency (IEA), Coal 2023 - Analysis and forecast to 2026 (2023). 3 Australian Electricity Market Operator (AEMO), 2024 Integrated System Plan (ISP) (2024). 2030 TARGET – ABSOLUTE EMISSIONS 0 MtCO2-e FY23 PROGRESS – ABSOLUTE EMISSIONS 0.47 MtCO2-e 2030 TARGET – % CHANGE -100% from 2021 baseline FY23 PROGRESS – % CHANGE -81% from 2021 baseline THERMAL COAL MINING MtCO₂-e 2.46 1.9 0.47 0.0 2021 baseline Progress 2030 target FY21 FY22 FY23 FY24 FY25 FY26 FY27 FY28 FY29 FY30 0 1 2 3 WESTPAC GROUP 2024 CLIMATE REPORT |
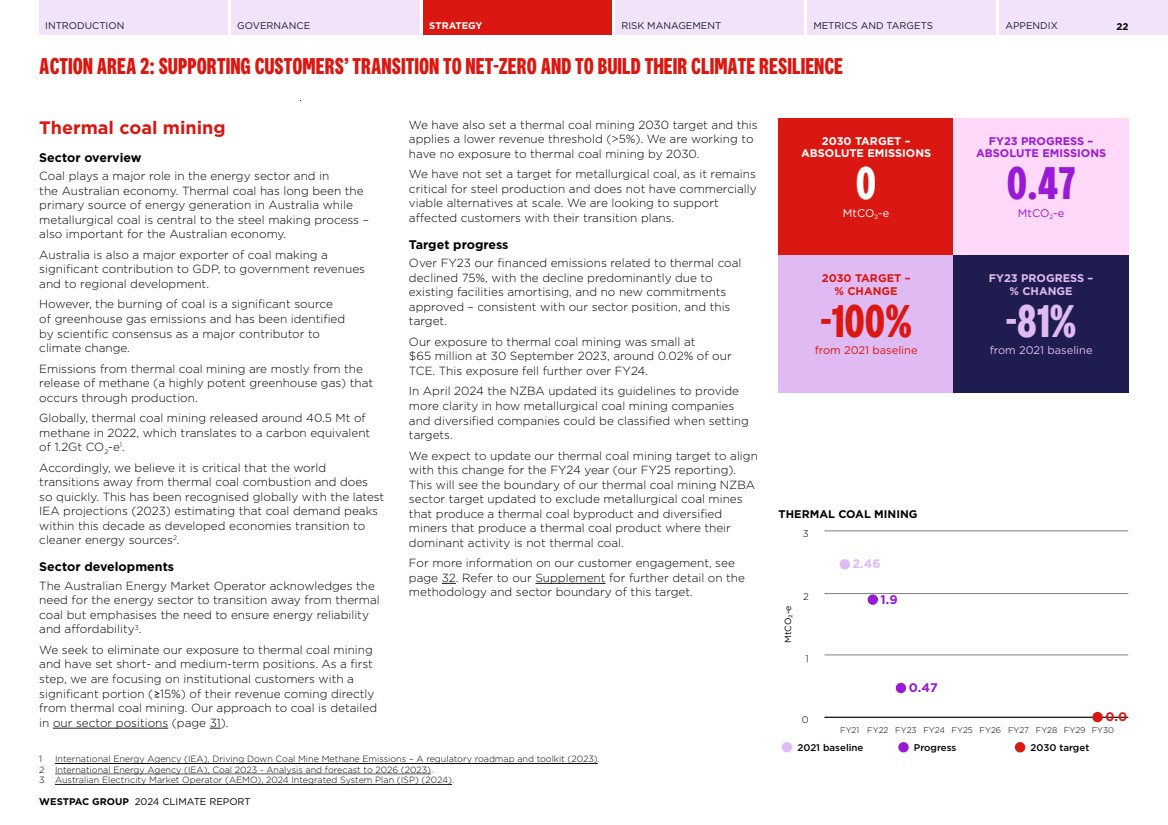
| INTRODUCTION GOVERNANCE STRATEGY RISK MANAGEMENT METRICS AND TARGETS APPENDIX ACTION AREA 2: SUPPORTING CUSTOMERS’ TRANSITION TO NET-ZERO AND TO BUILD THEIR CLIMATE RESILIENCE 23 Aviation (Passenger aircraft operators) Sector overview Falling within the NZBA’s emissions-intensive sector of transport, Aviation is considered a hard to abate sector. In 2022, aviation was responsible for around 2% of global energy-related CO2 emissions primarily from burning aviation fuel1 .. The sector is difficult to transition due to the technical barriers associated with reducing fossil fuel-based jet fuel. These include a lack of supply of lower carbon fuels, regulatory and market barriers in a truly global industry and high transition costs. Under its Net Zero Emission (NZE) by 2050 scenario, the IEA recognises these difficulties and highlights that carbon removal technologies to offset residual emissions are likely to be required to achieve net-zero by 20501 .. In setting our target, we chose to focus on passenger aviation operating scheduled air transport. This was due to data availability, maturity of customers and materiality of the sector’s share of our financed emissions. According to Westpac research, passenger aviation makes up 85–90% of global aviation emissions with freight and defence contributing the remainder. Our target is an emissions intensity metric given the importance of this sector and the need to support customers with their emissions reduction plans. Sector developments We use CO2-e emissions per passenger kilometre as our intensity metric, meaning progress depends on both fuel efficiency and the number of passenger kilometres travelled. This metric has experienced some volatility due to fluctuations in passenger kilometres travelled, which decreased during COVID restrictions and then rebounded as markets reopened. This post-COVID effect on emissions intensity has largely run its course and contributed to improved fuel efficiency for the industry. While airlines are looking to decarbonise, they have continued to face challenges including delays in acquiring more efficient aircraft and access to sustainable aviation fuel. Sustainable aviation fuel (SAF) is crucial for decarbonisation of the sector. The IEA NZE 2050 reference scenario assumes that SAF will make up around 15% of fuel consumption by 20301 .. Globally there has been a rise in policy measures to support development of a SAF industry. These policies range from incentives such as subsidies from the US Inflation Reduction Act, to regulations, such as the EU’s minimum SAF mandates, and a combination of both in the UK with a SAF mandate and revenue certainty mechanisms for producers. While Australia has yet to announce specific policies, the closure of consultation on ‘Unlocking Australia’s Low Carbon Liquid Fuel Opportunity’ as part of the Future Made in Australia initiative suggests that new policies may be in development. Target progress The reduction in emissions intensity over FY23 is mainly attributed to a rise in passenger kilometres travelled as air travel normalised after COVID. Despite this progress, customers are committed to enhancing their fuel efficiency. We have supported these efforts, notably by providing finance for fleet upgrades to more efficient aircraft. Our exposure to the sector increased over the year but this change did not have a material impact on the reported progress of our target. For more information on our customer engagement, see page 32. Refer to our Supplement for further detail on the methodology and sector boundary of this target. 1 International Energy Agency (IEA), Aviation Industry Overview (2023). 2030 TARGET – EMISSIONS INTENSITY 76.4 gCO2-e/passenger km FY23 PROGRESS – EMISSIONS INTENSITY 105.3 gCO2-e/passenger km 2030 TARGET – % CHANGE -60% from 2021 baseline FY23 PROGRESS – % CHANGE -45% from 2021 baseline AVIATION (PASSENGER AIRCRAFT OPERATORS) gCO₂-e/passenger km 190.6 156.0 105.3 76.4 2021 baseline Progress 2030 target IEA NZE Scenario FY21 FY22 FY23 FY24 FY25 FY26 FY27 FY28 FY29 FY30 0 100 200 300 WESTPAC GROUP 2024 CLIMATE REPORT |

| INTRODUCTION GOVERNANCE STRATEGY RISK MANAGEMENT METRICS AND TARGETS APPENDIX ACTION AREA 2: SUPPORTING CUSTOMERS’ TRANSITION TO NET-ZERO AND TO BUILD THEIR CLIMATE RESILIENCE 24 Steel production Sector overview Steel production is a multi-step process. The first step, and the most emissions-intensive, involves making pure iron from iron ore. Steel is then manufactured via one of two processes, with iron ore used in both: • Integrated steelmaking: this process employs a blast furnace/basic oxygen furnace (BF/BOF), where iron ore is the major source of iron; and • Electric steelmaking: this method uses an electric arc furnace (EAF), where steel scrap or direct reduced iron (DRI) serve as the major iron feedstock materials. Globally, most steel is produced using integrated steelmaking. From an emissions perspective, this process can be optimised through measures such as energy efficiency (such as more efficient equipment, heat recovery, and insulation), material efficiency (reducing waste and scrap recycling), fuel switching (to cleaner alternatives) and process change (such as using EAFs). Material decarbonisation for the sector will require significant capital, technology development and increased availability of certain raw materials. Emissions from the production of primary steel across the world are estimated to have been relatively stable since 20101 , at around 2.8 GtCO2-e per annum (8% of global emissions), largely due to steel demand1 .. Steel is crucial for the global net-zero transition and economic development, with few viable alternatives. It is essential for constructing renewable energy assets and supporting electrification and decarbonisation. As such, support for the steel sector and for customers producing metallurgical coal (a key input for large-scale steel production) is vital. Reflecting this, we have set an emissions intensity target (emissions per unit of steel produced) to accommodate the expected growth in steel demand while allowing for the deployment of low- and zero-emissions technologies. For our 2030 target, we have chosen to focus on the emissions intensity of crude steel production. Sector developments Reflecting its importance for the global transition to net-zero, the updated IEA 2023 Net Zero Emissions (NZE) report projects a 4% increase in steel demand from 2022 to 20502 .. A key challenge for the steel sector will be to reduce the emissions intensity of steel production, while continuing to meet this demand. According to the IEA's outlook, 80% of steel’s decarbonisation is expected to occur after 2030 due to the significant technological development needed to transition from coal-based blast furnaces to hydrogen-based solutions. This transition is still in its early phases. Strategies for decarbonisation include increased use of renewable energy, scrap recycling, employing green hydrogen in DRI processes, developing new technologies to increase the suitability (beneficiating) of low- to mid-grade iron ore in low carbon-intensive steel making, and combining the DRI-EAF process with electric smelting furnaces to remove impurities prior to steelmaking. In the Australian Government’s 2024-25 budget, $1.7 billion over 10 years will be allocated through the Future Made in Australia Innovation Fund to support priority sectors, including steel3 .. Additionally, the Australian Government’s Safeguard Mechanism aims to assist the highest emitting industrial scope 1 emitters. This, along with the Modern Manufacturing Fund and the Industrial Transformation Stream Program, is designed to accelerate the decarbonisation of Australia’s industrial sector. To further support Australia’s manufacturing competitiveness as it seeks to decarbonise, the Australian Government is also considering a carbon border mechanism4 , similar to the EU’s Carbon Border Adjustment Mechanism. Given the small number of customers and to ensure their confidentiality, our baseline and progress are not disclosed. Target progress Given the limited number of customers within our sector boundary and to ensure their confidentiality we are only providing a limited update on progress. Specifically, that emissions intensity for FY23: • Is on track to achieve our 2030 target; and • Remains below our emissions pathway. For more information on our customer engagement, see page 32. Refer to our Supplement for further detail on the methodology and sector boundary of this target. 1 International Energy Agency (IEA), Steel Industry Overview (2023). 2 International Energy Agency (IEA), Net Zero Roadmap A Global Pathway to Keep the 1.5°C Goal in Reach (2023). 3 Government of Australia, Department of the Treasury (Australia), A Future Made In Australia Fact Sheet (2024). 4 Department of Climate Change, Energy, the Environment and Water (DCCEEW), Australia’s Carbon Leakage Review (2024). 2030 TARGET – EMISSIONS INTENSITY 1.42 tCO2-e/tonne of crude steel 2030 TARGET – % CHANGE Not disclosed from 2021 baseline STEEL PRODUCTION tCO₂-e/tonne of crude steel 1.42 2030 target FY21 FY22 FY23 FY24 FY25 FY26 FY27 FY28 FY29 FY30 0 1 2 WESTPAC GROUP 2024 CLIMATE REPORT |
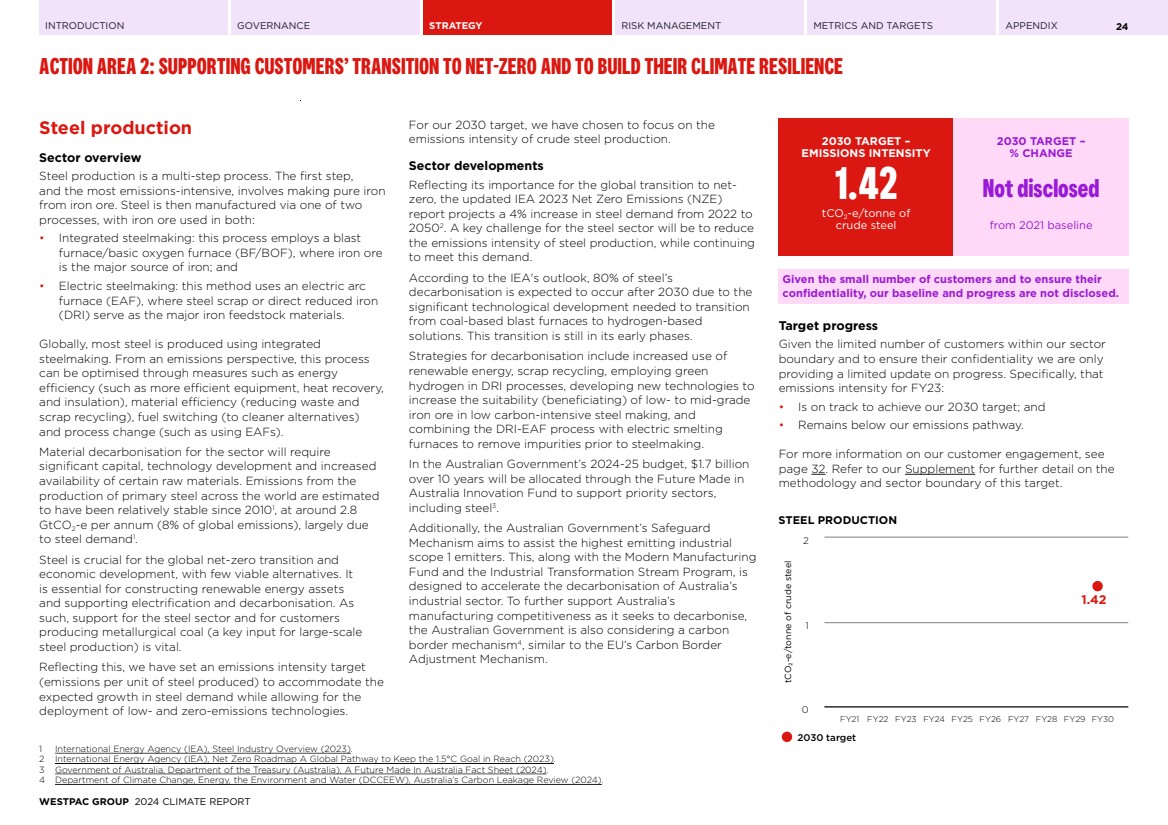
| INTRODUCTION GOVERNANCE STRATEGY RISK MANAGEMENT METRICS AND TARGETS APPENDIX ACTION AREA 2: SUPPORTING CUSTOMERS’ TRANSITION TO NET-ZERO AND TO BUILD THEIR CLIMATE RESILIENCE 25 Aluminium Sector overview Aluminium is a durable, recyclable, and lightweight material that plays a critical role in the transition to a low-carbon future. Its versatility makes it essential across a wide range of industries, including energy production, energy transmission, packaging, transportation, and telecommunications. Currently, global aluminium production accounts for approximately 3% of direct industrial CO2 emissions1 , with 95% of these emissions coming from the refining and smelting processes (scope 1 and scope 2), largely due to the electricity required for smelting. Decarbonising aluminium production depends heavily on transitioning to lower-carbon electricity, increasing grid capacity, and adopting new technologies. Reducing emissions intensity will also require greater recycling efforts, improved infrastructure, and enhancing aluminium’s efficiency in its end uses. The pace of decarbonisation across the sector will depend significantly on the timing and availability of these developments and is unlikely to follow a linear path. Sector developments Aluminium will be a key material to achieving a low carbon global economy. In recognition, aluminium was added to Australia’s Strategic Materials List in 2024. The International Aluminium Institute (IAI) 1.5°C pathway forecasts primary aluminium demand to increase to 68 Mt by 2050, up from 64 Mt in 2018. Secondary aluminium demand is forecast to increase to 81 Mt by 2050, up from 32 Mt in 2018. Sector portfolio and target We have set an emissions intensity target for 2030 that is aligned with the IAI’s 1.5°C pathway to 2050. Given the limited number of customers within our sector boundary and to ensure their confidentiality, our baseline and progress are not disclosed. Given the small number of customers and to ensure their confidentiality, our baseline and progress are not disclosed. We will continue to engage with our customers to understand their decarbonisation risks and opportunities, while also assessing the sector’s emerging risks and trends. Refer to our Supplement for further detail on the methodology and sector boundary of this target. 1 International Energy Agency (IEA), Aluminium Industry Overview (2023). 2030 TARGET – EMISSIONS INTENSITY 10.35 tCO2-e/tonne of aluminium 2030 TARGET – % CHANGE Not disclosed from 2023 baseline ALUMINIUM tCO₂-e/tonne of aluminium 10.35 2030 target FY21 FY22 FY23 FY24 FY25 FY26 FY27 FY28 FY29 FY30 0 5 10 15 WESTPAC GROUP 2024 CLIMATE REPORT |
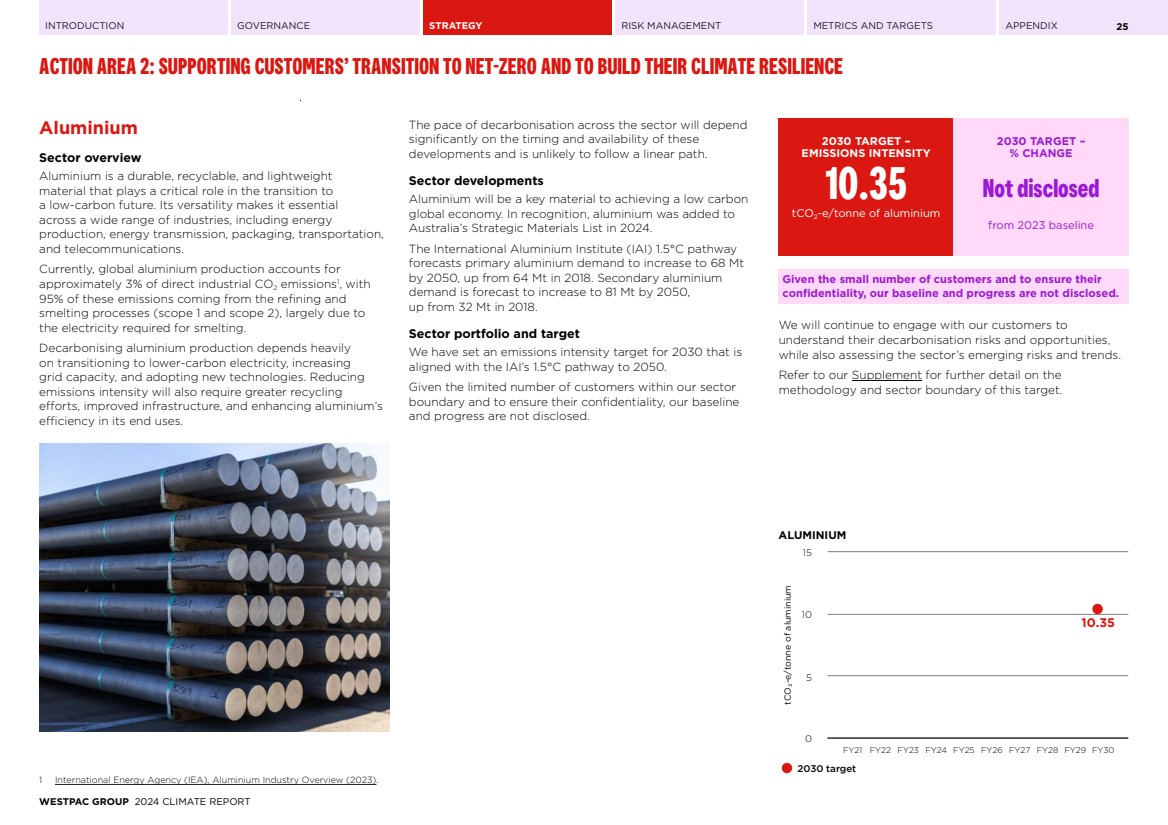
| INTRODUCTION GOVERNANCE STRATEGY RISK MANAGEMENT METRICS AND TARGETS APPENDIX ACTION AREA 2: SUPPORTING CUSTOMERS’ TRANSITION TO NET-ZERO AND TO BUILD THEIR CLIMATE RESILIENCE 26 Commercial real estate (Offices) Sector overview Commercial buildings account for approximately 10% of Australia’s emissions1 and play an important role in achieving the country’s net-zero emissions ambitions by 2050. While most large offices use electricity as their primary energy source, natural gas is also commonly used for heating, hot water and cooking. Improving energy efficiency and electrifying buildings are key steps in achieving net-zero alongside grid decarbonisation and increased use of renewable electricity. To stay on track for net-zero emissions by 2050 the sector requires stronger policy support2 .. This should include policies advancing energy efficiency, promoting low-carbon building practices, and beginning to deploy zero-carbon ready buildings (buildings designed to achieve net-zero emissions with minimal additional modifications). Our target is for Commercial Offices within the broader Commercial Real Estate sector, as this segment has more comprehensive and reliable emissions data. Consistent with industry practice, and our desire to support the sector to transition, we use an emissions intensity target (emissions relative to net lettable area). Sector developments Decarbonisation of existing buildings is expected to be driven by improved energy efficiency, electrification, and decarbonisation of the grid. Many building owners are already on this path including procuring renewable electricity and offsetting residual emissions when more ambitious goals have been set. There has also been an increased focus on reducing scope 3 embodied emissions through supply chains. For new developments, emission efficiency is frequently a key component of design. The sector depends on grid decarbonisation to achieve its interim and long-term net-zero targets. If Australia does not meet its renewable target of 82% by 2030 it will have a significant impact on the sector and may require changes in strategy to decarbonise. Demand for all electric buildings is also expected to increase as tenants aim to meet their own net-zero targets. Target progress In the last year, we engaged with many of our customers on their net-zero goals and transition plans. We have learned that some customers have achieved net-zero for their scope 1 and 2 emissions already or expect to do so before 2050. Some are also accelerating their emissions reduction targets, with some setting scope 3 emissions targets. Others are still in the process of measuring emissions and implementing energy efficiency improvements. Contributing to the 18% reduction in emissions intensity over FY23 has been: • An increased portion of customers with publicly available emissions data. This more accurate data reduces the need for proxy data, which typically assumes a higher emissions profile than direct reporting; and, • Lower customer emissions intensity. It is hard to determine the exact cause of the improvement, but the size of changes suggests it is a combination of implementing their decarbonisation strategies and grid decarbonisation. For more information on our customer engagement, see page 32. Refer to our Supplement for further detail on the methodology and sector boundary of this target. 1 Department of Climate Change, Energy, the Environment and Water (DCCEEW), Energy efficiency – Commercial Buildings (2024). 2 International Energy Agency (IEA), Buildings Energy System Overview (2023). 2030 TARGET – EMISSIONS INTENSITY 25 kgCO2-e/m2 net lettable area FY23 PROGRESS – EMISSIONS INTENSITY 49 kgCO2-e/m2 net lettable area 2030 TARGET – % CHANGE -59% from 2022 baseline FY23 PROGRESS – % CHANGE -18% from 2022 baseline COMMERCIAL REAL ESTATE (OFFICES) kgCO₂-e/m² net lettable area 60 49 25 2022 baseline Progress 2030 target IEA NZE Scenario (2021) FY21 FY22 FY23 FY24 FY25 FY26 FY27 FY28 FY29 FY30 0 25 50 75 WESTPAC GROUP 2024 CLIMATE REPORT |
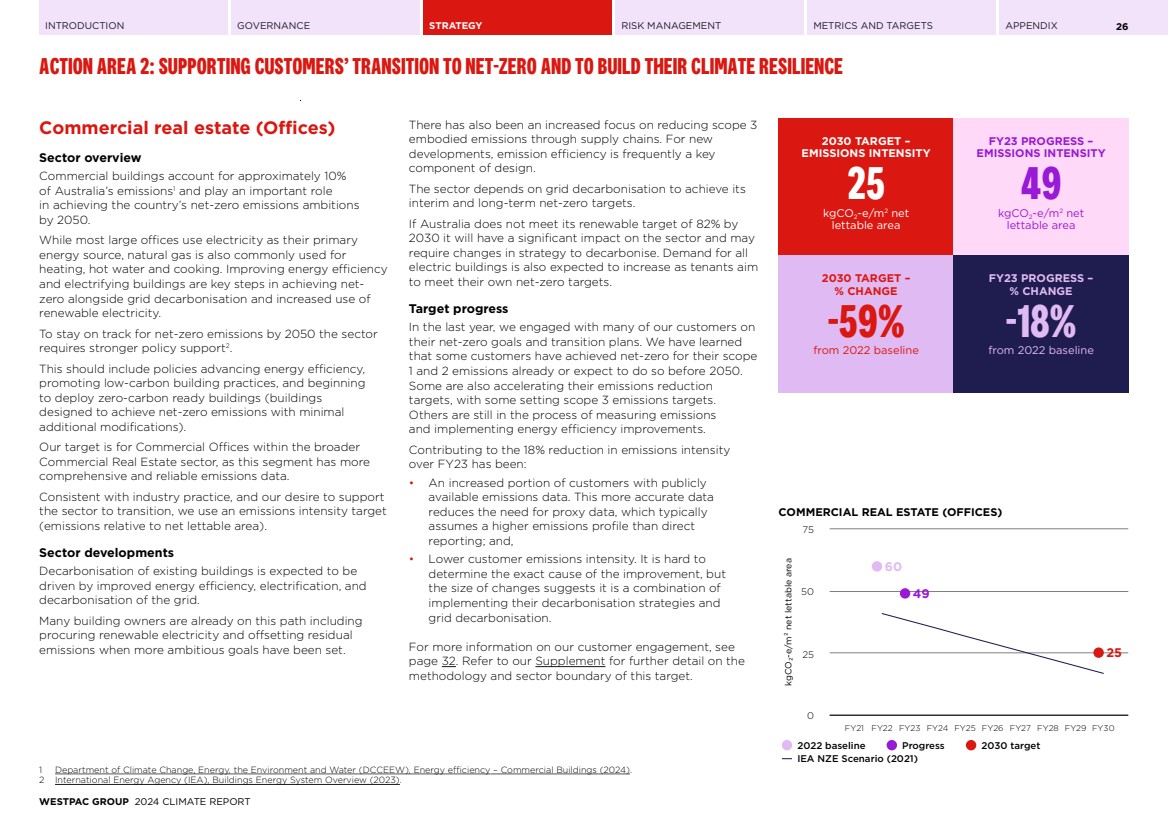
| INTRODUCTION GOVERNANCE STRATEGY RISK MANAGEMENT METRICS AND TARGETS APPENDIX ACTION AREA 2: SUPPORTING CUSTOMERS’ TRANSITION TO NET-ZERO AND TO BUILD THEIR CLIMATE RESILIENCE 27 Residential real estate (Australia) Sector overview It is estimated that Australia has around 11 million dwellings1 accounting for approximately 24% of Australia’s electricity use and more than 10% of the country’s GHG emissions2 .. At September 2023, Westpac had a 21% market share of Australian mortgages3 .. While Australian Residential Mortgages account for around half of the Group’s TCE, their share of our emissions is smaller, representing around 12% of Westpac’s scope 1 and 2 financed emissions for FY23. In measuring our financed emissions from this portfolio, we include loans to established dwellings and exclude loans for vacant land and construction. Equity access loans (a small part of our book) are also excluded as they are often used for non-housing purposes. The majority of sector emissions are from natural gas consumption and electricity use4 .. Achieving net-zero emissions relies on grid decarbonisation, improving energy efficiency (upgrading a building’s thermal properties and using more efficient appliances) and electrification (replacing gas with electric appliances). Sector developments Most Australian homes were built before national minimum energy efficiency regulations were introduced, which began in 2003 for houses and 2005 for units. Consequently, homes constructed prior to then tend to be less energy-efficient5 .. With a significant portion of Australia's housing built prior to these regulations, upgrading their energy efficiency is important to achieve the sector’s decarbonisation6 .. In 2024, the Australian Government allocated $1 billion through the Household Energy Upgrades Fund (HEUF) to support energy efficiency improvements in homes7 .. With around 5 million households on the gas network in Australia, and approximately 200 homes per day needing to switch to electric systems in Victoria alone to meet net-zero targets8 , government policies will play a pivotal role in this transition. Future measures will include implementing mandatory energy efficiency standards, incentives for home upgrades, and supportive policies with informational tools9 .. Westpac is supporting the HEUF with our Sustainable Upgrades home and investor loans. This loan allows existing home loan customers to borrow up to $50,000, secured against their property, to improve their home's climate resilience or energy efficiency. Eligibility requirements apply and the interest rate includes support from the Clean Energy Finance Corporation (CEFC) through their HEUF. Approximately 3.7 million households in Australia have rooftop solar systems and the uptake of household batteries continues to grow10. While more household solar is positive, it strains Australia’s electricity grid, especially when excess solar energy is fed back without enough demand or storage. The CEFC, and the recently established National Reconstruction Fund, are working to strengthen our energy infrastructure although further policy and direction is needed to encourage further private sector investment. Target progress In FY23, the emissions intensity of our Residential Mortgages portfolio decreased 11%. This decline was primarily due to reduced electricity grid emissions over a two-year period (from 2021 to 2023), as 2021 emissions factors were used to calculate our FY22 financed emissions. Renewable energy accounted for 39.4% of total electricity generation in 2023 (35.9% in 2022). The largest contributor has been more rooftop solar, accounting for 11.2% of generation (9.3% in 2022). Expanded use of batteries by households and utilities also contributed10 .. The financed emissions intensity of our Residential Mortgage Portfolio is dependent on the projected decarbonisation of the electricity grid if we are to meet our NZBA 2030 sector target. Refer to our Supplement for further detail on the methodology and sector boundary of this target. 1 Australian Bureau of Statistics (ABS), Estimated Dwelling Stock, June Quarter 2022 (2022). 2 Department of Climate Change, Energy, the Environment and Water (DCCEEW), Energy efficiency – Residential Buildings (2024). 3 Our market share is based on total Australian housing loans which does not align to the Australia’s total dwellings as not every property has a mortgage. 4 Thinkstep-ANZ, Embodied Carbon & Embodied Energy in Australia’s Buildings (2021). 5 COAG Energy Council, Report for Achieving Low Energy Existing Homes (2019). 6 International Energy Agency (IEA), Renovation of near 20% of existing building stock to zero-carbon-ready by 2030 is ambitious but necessary, (2022). 7 Department of Climate Change, Energy, the Environment and Water (DCCEEW), Joint media release: Helping Australians save energy, save on energy bills (2023). 8 Grattan Institute, Getting Off Gas, Why, how and who should pay? (2023). 9 International Energy Agency (IEA), There’s more to buildings than meets the eye: They hold a key to net zero emissions (2023). 10 Clean Energy Council, Clean Energy Australia report (2024). 2030 TARGET – EMISSIONS INTENSITY 15.2 kgCO2-e/m2 attributed floor area FY23 PROGRESS – EMISSIONS INTENSITY 30.7 kgCO2-e/m2 attributed floor area 2030 TARGET – % CHANGE -56% from 2022 baseline FY23 PROGRESS – % CHANGE -11% from 2022 baseline RESIDENTIAL REAL ESTATE (AUSTRALIA) kgCO₂-e/m² attributed floor area 34.6 30.7 15.2 2022 baseline Progress 2030 target CRREM Australia Multi-family homes (MFH) Scenario, 2023 FY21 FY22 FY23 FY24 FY25 FY26 FY27 FY28 FY29 FY30 0 50 25 75 WESTPAC GROUP 2024 CLIMATE REPORT |
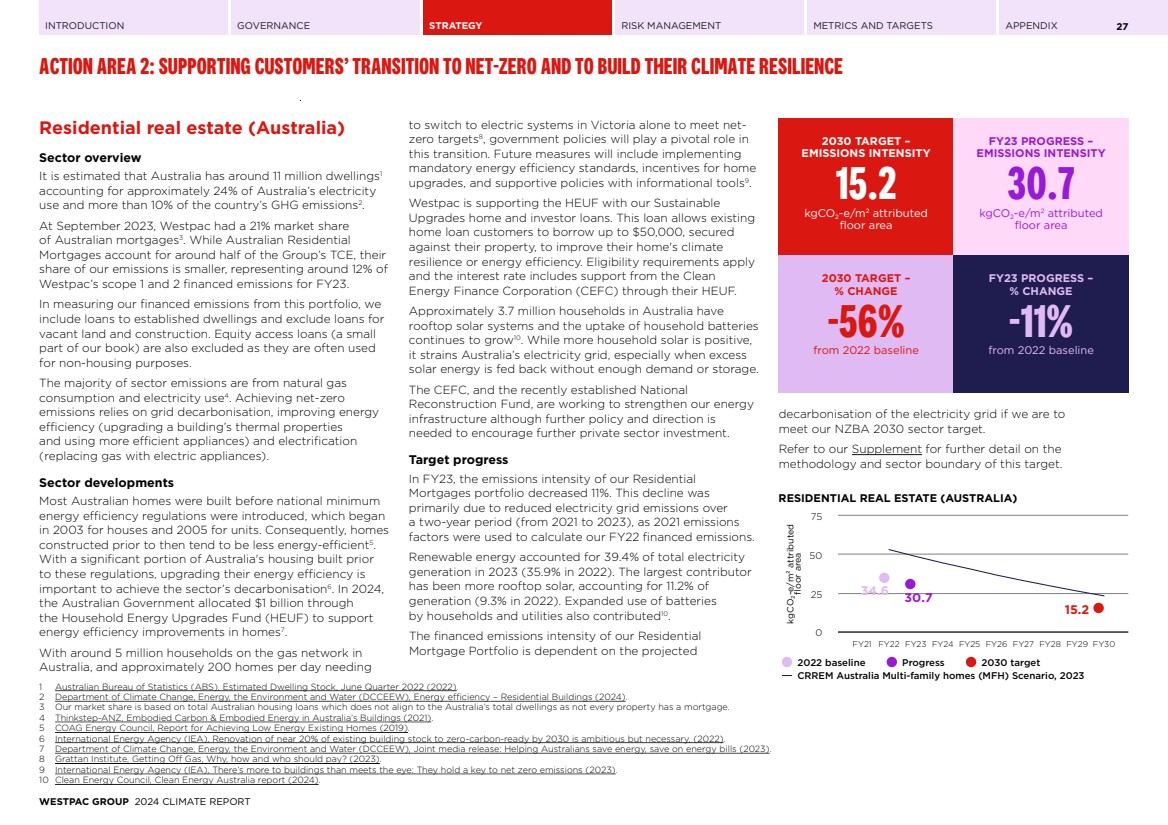
| INTRODUCTION GOVERNANCE STRATEGY RISK MANAGEMENT METRICS AND TARGETS APPENDIX ACTION AREA 2: SUPPORTING CUSTOMERS’ TRANSITION TO NET-ZERO AND TO BUILD THEIR CLIMATE RESILIENCE 28 Agriculture Sector overview Agriculture is a broad and diverse sector producing a variety of food and fibre products. Beyond its essential role in sustaining life and providing food security, Agriculture is a cornerstone of the Australian and New Zealand economies. The sector is a significant contributor to employment, GDP and export revenues. We are committed to supporting our agricultural customers and assisting them in pursuing more efficient practices, ensuring they can continue their economic and social contribution. Agriculture is vital for the economies in which we operate but is also a major source of emissions. In 2022, the sector generated around 17% of Australia’s emissions1 .. In New Zealand, due to a more energy-efficient grid and fewer high-emission industries, over 50% of the country’s emissions are from agriculture2 .. In our lending portfolio, we estimate that Agriculture accounted for around 28% of Westpac’s scope 1 and 2 financed emissions for FY23. As a major landholder, the agricultural sector has a unique opportunity to play a key role in addressing climate change through carbon sequestration and increases in biodiversity, which may provide benefits to animal and soil health and improvements to productivity. Whilst the sector’s activities and outputs are broad, its emissions are concentrated to key commodities: beef and sheep meat, as well as dairy milk production. To focus our efforts on the majority of the sector’s emissions, we have set targets on these commodities. Importantly, all targets set are based on emission intensity metrics reflecting the sector's economic contribution, our desire to further grow our portfolio and the opportunity to reduce emissions while acknowledging that agricultural production varies seasonally. Measuring sector emissions can be challenging as production systems vary across locations and output can vary from season to season and from climatic variability. At the same time, commodity prices are influenced by global conditions and can be variable; this can impact how agricultural outputs are managed. This variability may impact our progress towards our NZBA 2030 sector targets. That said, data is readily available for estimating our baseline and progress. For our targets the science-based reference pathway used is from the Science Based Targets Initiative (SBTi) Forest, Land and Agriculture (FLAG) for Oceania for Beef and Dairy (refer to Glossary (page 58) for more information). Accordingly, our data and targets are suitable for the regions we operate. As part of our NZBA 2030 sector targets for the Agriculture sector, we are committed to no deforestation, which provides for no further conversion of natural forest to agricultural land use within farm systems from 31 December 2025 for customers in scope of the targets. We are continuing to work with stakeholders on a practical approach to implementation. Areas of engagement in FY24 included discussions with Agriculture industry groups on development of harmonised definitions, data and assessment approaches, to progress our no deforestation commitment in our Sheep/Beef and Dairy portfolios. Refer to our Supplement for further detail on the methodologies and sector boundaries of our NZBA 2030 sector targets for the Agriculture sector. Sector developments In 2022 beef, sheep and dairy accounted for 80% of Australian agricultural emissions and, in the same year, enteric fermentation (methane) accounted for 70% of Australian agricultural emissions3 .. In 2022, New Zealand beef and sheep farming made up 22.9% of New Zealand’s total gross greenhouse gas emissions and 43% of New Zealand’s agriculture emissions2 .. New Zealand dairy farming made up 25.7% of New Zealand’s gross greenhouse gas emissions and 48% of New Zealand’s agricultural emissions2 .. Emissions in the sector are predominately from methane and nitrous oxide, with smaller amounts of CO2 .. Methane is from enteric fermentation (digestion) and manure management, while nitrous oxide results from excreta and application of nitrogen fertiliser4 .. Improvements in production efficiency aim to redirect methane and nitrous oxide from being emitted into the atmosphere. Options with increasing commercial potential include5 : • Feed additives. • Improved land management. • Reduced fertiliser use. • Improving feed efficiency. • Genetics/breeding to improve outputs. • Planting trees for improved shelter, environmental plantings and timber plantations. Our emission intensity targets are focused on efficiency by producing a kilogram of produce (meat or milk) with lower emissions. There are a range of strategies to improve the emissions intensity of farms although increased uptake is required to achieve the necessary improvements. Future innovation will also be necessary to help accelerate sector decarbonisation, including making some emerging technologies more commercially viable and available6 .. 1 Department of Climate Change, Energy, the Environment and Water (DCCEEW), Australia’s emissions projections 2023 (2023). 2 Ministry for the Environment (New Zealand), New Zealand's Greenhouse Gas Inventory 1990–2022: Snapshot (2024). 3 Department of Climate Change, Energy, the Environment and Water (DCCEEW), Australia's National Greenhouse Accounts (n.d.). 4 Australian Bureau of Agricultural and Resource Economics and Sciences (ABARES), Snapshot of Australian Agriculture 2024 (2024). 5 Dairy Australia, Reducing Dairy’s Greenhouse Gas Emissions (2023). 6 Climate Change Authority, Sector Pathways Review (2024). WESTPAC GROUP 2024 CLIMATE REPORT |

| INTRODUCTION GOVERNANCE STRATEGY RISK MANAGEMENT METRICS AND TARGETS APPENDIX ACTION AREA 2: SUPPORTING CUSTOMERS’ TRANSITION TO NET-ZERO AND TO BUILD THEIR CLIMATE RESILIENCE 29 Agriculture Target Progress – Australian Beef and Sheep 2030 TARGET – EMISSIONS INTENSITY 19.85 tCO2-e/tonne of Fresh Weight (FW) FY23 PROGRESS – EMISSIONS INTENSITY 22.55 tCO2-e/tonne of Fresh Weight (FW) 2030 TARGET – % CHANGE -9% from 2021 baseline FY23 PROGRESS – % CHANGE +4% from 2021 baseline In FY23 the emissions intensity for this sector portfolio of 22.55 tCO2-e/tonne of Fresh Weight (FW) was slightly higher than FY22, and 4% higher than our initial 2021 baseline. Nevertheless, our FY23 progress remains below the sector reference pathway. While our emissions intensity is higher than our 2021 baseline, our analysis of longer-term trends suggests the variances observed appear within the expected ranges of volatility. The higher emissions intensity in FY22 primarily reflects the restocking of the industry following a period of drought. Livestock levels are influenced by short-term climate changes. Higher rainfall in 2021 and 2022 improved pasture conditions and led farmers to rebuild their herds and flocks, with a related reduction in animals slaughtered. This resulted in higher stock levels and lower meat production which increased calculated emissions intensities used for the last two years1 .. This translated to higher emissions intensity in our portfolio. To help achieve our target, our actions in FY24 focused on engagement (customer, industry and government) and enablement (data, modelling, geospatial mapping, governance and capability). We have continued to engage with customers in scope of this target and industry bodies both directly as well as via Westpac-sponsored events (Beef 2024) and regional field days. This is part of our commitment to engage with customers on their opportunities for emissions reductions and efficiency. Target Progress – Australian Dairy 2030 TARGET – EMISSIONS INTENSITY 0.85 tCO2-e/tonne of Fat Protein Corrected Milk (FPCM) FY23 PROGRESS – EMISSIONS INTENSITY 0.87 tCO2-e/tonne of Fat Protein Corrected Milk (FPCM) 2030 TARGET – % CHANGE -10% from 2021 baseline FY23 PROGRESS – % CHANGE -8% from 2021 baseline In FY23 the emissions intensity for our Australian Dairy portfolio of 0.87 tCO2-e/tonne of Fat Protein Corrected Milk (FPCM) changed little from FY22 but is 8% lower than our FY21 baseline2 .. Our FY23 emissions intensity remains below the sector reference pathway1 .. The calculated improvement in emissions intensity over the last two years may reflect improvements in on-farm efficiency although given data limitations and the way intensity is calculated it is difficult to be definitive. However, at an aggregate level we have seen lower herd levels across the sector with a rise in milk produced per cow. Continuing to improve the quality of our data will be a priority and we are already assessing how we can utilise existing information including production data. We have continued to engage directly with customers in scope of this target to understand their opportunities for emissions reductions and production efficiency. AGRICULTURE – AUSTRALIA BEEF AND SHEEP tCO₂-e/tonne of Fresh Weight (FW) 21.7322.52 22.55 19.85 2021 baseline Progress 2030 target SBTi FLAG Oceania Beef Commodity Land Management Pathway FY21 FY22 FY23 FY24 FY25 FY26 FY27 FY28 FY29 FY30 0 20 10 30 AGRICULTURE – AUSTRALIA DAIRY tCO₂-e/tonne of Fat Protein Corrected Milk (FPCM) 0.950.880.87 0.85 2021 baseline Progress 2030 target SBTi FLAG Oceania Beef Commodity Land Management Pathway FY21 FY22 FY23 FY24 FY25 FY26 FY27 FY28 FY29 FY30 0 1 2 1 Due to limitations in emissions and production data, our estimates for FY22 and FY23 use the same emissions factors. 2 In FY24, we corrected minor model errors related to data inputs in the Agriculture Australia Dairy target, identified as part of our routine model risk review. This resulted in a restatement of our baseline, with no changes to the % reduction in our target. WESTPAC GROUP 2024 CLIMATE REPORT |
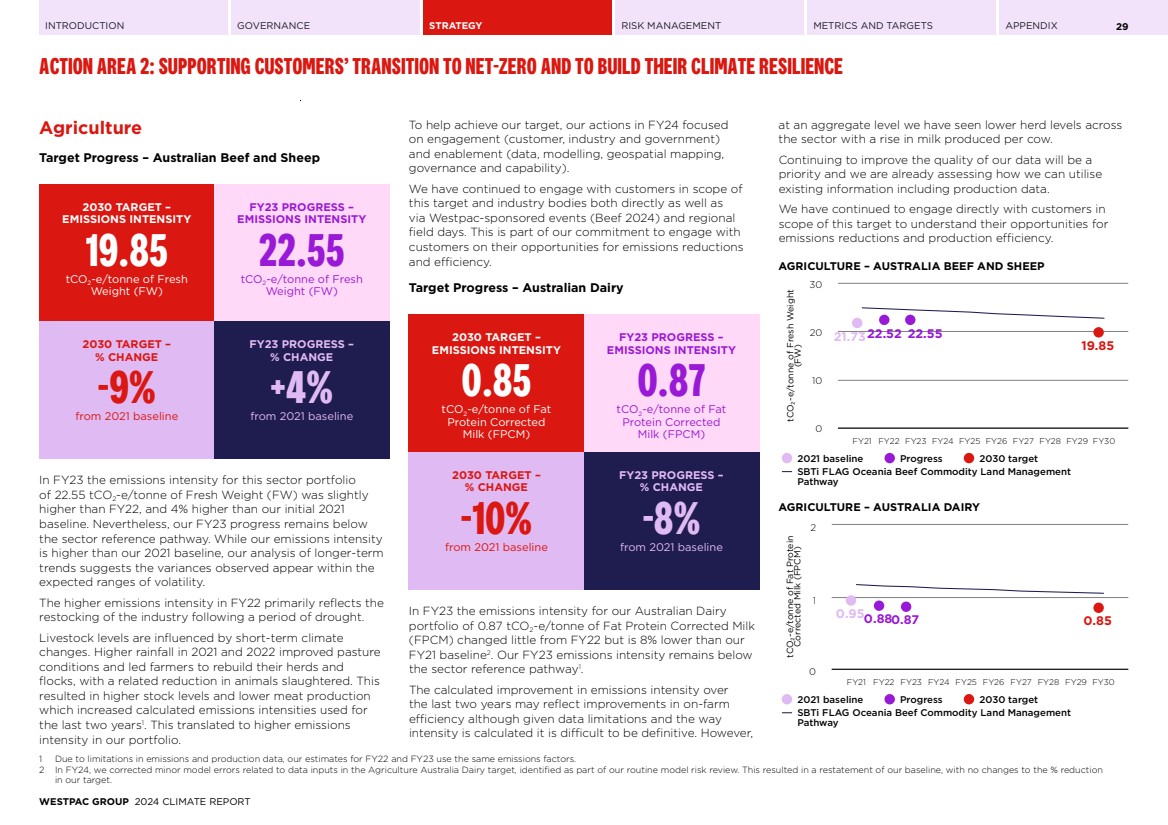
| INTRODUCTION GOVERNANCE STRATEGY RISK MANAGEMENT METRICS AND TARGETS APPENDIX ACTION AREA 2: SUPPORTING CUSTOMERS’ TRANSITION TO NET-ZERO AND TO BUILD THEIR CLIMATE RESILIENCE 30 Agriculture Target Progress – New Zealand Beef and Sheep 2030 TARGET – EMISSIONS INTENSITY 17.6 tCO2-e/tonne of Fresh Weight (FW) FY23 PROGRESS – EMISSIONS INTENSITY 18.6 tCO2-e/tonne of Fresh Weight (FW) 2030 TARGET – % CHANGE -9% from 2021 baseline FY23 PROGRESS – % CHANGE -4% from 2021 baseline In FY23 the emissions intensity for our New Zealand beef and sheep portfolio of 18.6 tCO2-e/t FW was 3% lower than the prior year (FY22) and is now 4% lower than our initial 2021 baseline. FY23 progress remains below the sector reference pathway, and currently remains on track to achieve our 2030 target. Due to the regional nature of our data used it was not possible to accurately determine the specific reasons for the improved emissions efficiency although we have witnessed a larger decline in regional emissions relative to the decline in regional production. We are engaging with customers in scope of this target while also promoting our Westpac Sustainable Farm Loan which has an emissions measurement and emissions reduction plan component to it. Target Progress – New Zealand Dairy 2030 TARGET – EMISSIONS INTENSITY 0.75 tCO2-e/tonne of Fat Protein Corrected Milk (FPCM) FY23 PROGRESS – EMISSIONS INTENSITY 0.77 tCO2-e/tonne of Fat Protein Corrected Milk (FPCM) 2030 TARGET – % CHANGE -10% from 2021 baseline FY23 PROGRESS – % CHANGE -7% from 2021 baseline In FY23 the emissions intensity for our New Zealand Dairy portfolio of 0.77 tCO2-e/t FPCM was 10% lower than the prior year (FY22) which makes it 7% lower than our FY21 baseline. Our FY23 progress remains below the sector reference pathway and currently remains on track to achieve our 2030 target. The calculated improvement in emissions intensity over the last year can be traced back to slight reductions in stocking rates and a reduction in purchased feed. As with our other agricultural targets we are treating the measurement of progress cautiously due to the quality of regional emissions data. We are engaging with customers in scope of this target while also promoting uptake of our Westpac Sustainable Farm Loan which has an emissions measurement and emissions reduction plan component to it. AGRICULTURE – NEW ZEALAND BEEF AND SHEEP tCO₂-e/tonne of Fresh Weight (FW) 19.419.2 18.6 17.6 2021 baseline Progress 2030 target SBTi FLAG Oceania Beef Commodity Land Management Pathway FY21 FY22 FY23 FY24 FY25 FY26 FY27 FY28 FY29 FY30 0 10 20 30 AGRICULTURE – NEW ZEALAND DAIRY tCO₂-e/tonne of Fat Protein Corrected Milk (FPCM) 0.830.86 0.77 0.75 2021 baseline Progress 2030 target SBTi FLAG Oceania Dairy Commodity Land Management Pathway FY21 FY22 FY23 FY24 FY25 FY26 FY27 FY28 FY29 FY30 0 1 0.5 1.5 WESTPAC GROUP 2024 CLIMATE REPORT |
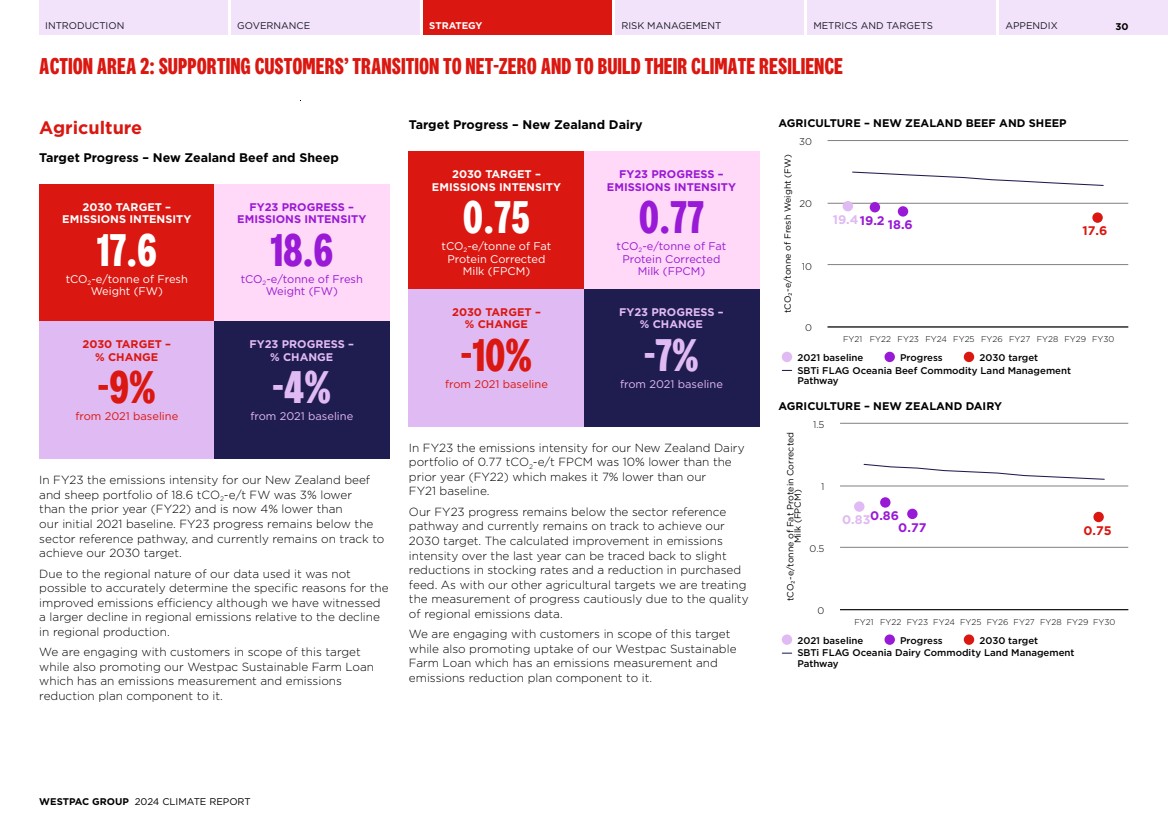
| INTRODUCTION GOVERNANCE STRATEGY RISK MANAGEMENT METRICS AND TARGETS APPENDIX ACTION AREA 2: SUPPORTING CUSTOMERS’ TRANSITION TO NET-ZERO AND TO BUILD THEIR CLIMATE RESILIENCE 31 Our sector positions To achieve our net-zero ambitions, we maintain sector positions that provide more explicit and restrictive criteria for evaluating new and renewing certain fossil fuel financing. These positions recognise the unique characteristics of each sector and their role in Australia and New Zealand’s decarbonisation journey. Our positions on oil and gas, coal mining and power generation sectors are summarised below. They operate alongside our NZBA 2030 sector lending targets. It is worth noting that the boundaries of our sector positions are not necessarily the same as our NZBA sector targets that have similar names. Upstream oil and gas1 • Subject to national energy security2 : – we will not provide project finance or bond facilitation for the development of new (greenfield) or expansionary oil and gas fields, including new associated dedicated infrastructure3 , unless in accordance with the International Energy Agency Net-Zero by 2050 scenario4 (2021). – we will continue to provide corporate lending and bond facilitation where the customer has a credible transition plan5 in place by 30 September 2025. – we will work with customers to support their development of their credible transition plans. • We will not provide project finance for oil and gas exploration in high-risk frontier basins, such as Arctic and Antarctic refuges or for oil sands development. • We will not provide project finance for exploration of shale, offshore deep water or ultra-deep-water6 oil and gas. We continue to engage with upstream oil and gas customers to gain insight into their transition plans. While the sector is making progress in developing emissions reduction plans and achieving reductions to scope 1 and 2 emissions, we recognise there are challenges in establishing scope 3 reduction plans. Through our engagement we deepened our understanding of how challenging it will be for the sector to establish 1.5°C-aligned transition plans covering scope 1, 2 and 3 by 30 September 2025. We will engage further to understand our customers’ evolving decarbonisation strategies. Alongside this, we will also continue to monitor, assess and be guided by the latest science and government policy, while considering energy security and affordability. Thermal coal mining7 Given the significant emissions generated from thermal coal, we seek to eliminate our exposure to thermal coal mining and have set short- and medium-term commitments. • We will not provide any project financing to new, expansions or extensions of thermal coal mines. • For institutional customers with ≥15%8 of their revenue coming directly from thermal coal mining, we will: – effective immediately, not onboard new customers. – effective immediately, not provide corporate lending or bond facilitation. This includes for new, expansions or extensions of life of existing thermal coal mines. – have zero lending by 30 September 2025. • For institutional customers with >5% of revenue coming directly from thermal coal, an NZBA-aligned thermal coal target will continue to apply, as outlined in our Climate Change Action Plan on page 12. Metallurgical coal mining • We will continue to support the metallurgical coal sector as it remains critical for steel production at scale, which is required to support the transition to net-zero emissions. • We will not provide project finance for new (greenfield) metallurgical coal projects. • We will continue to explore opportunities to work with customers to support the development of alternative products and processes, where appropriate. Power generation • We will not provide project finance to new (greenfield) coal-fired power generation facilities. • We will consider the intersecting requirements of emissions reduction, the feasibility of emerging technologies, as well as energy affordability, security and reliability. 1 Includes exploration, extraction and drilling companies, all activities of integrated oil and gas companies (IOCs), tolling and stand-alone refineries and LNG producers. Does not include downstream retail and distribution, pipeline infrastructure, storage and transport, nor trading entities. 2 National energy security refers to circumstances where an Australian or New Zealand Government or regulator determines (or takes a formal public position) that additional supply is necessary for national energy security and Westpac’s funding is able to support such additional supply. 3 New associated dedicated infrastructure means new gas collection, storage and processing infrastructure dedicated solely to greenfield or expansionary oil and gas extraction projects including floating production, storage and offloading (FPSO) vessels, gas processing plant and transmission pipelines. 4 The International Energy Agency Net-Zero by 2050 (2021) scenario specifies that no new (greenfield) oil and gas fields are needed beyond those projects that have already been committed (i.e. approved for development) as of 18 May 2021. 5 A credible transition plan should be developed by reference to the best available science and should include scope 1, 2 and 3 emissions and actions the company will take to achieve greenhouse gas reductions aligned with pathways to net-zero by 2050, or sooner, consistent with a maximum temperature rise of 1.5°C above pre-industrial levels by 2100. 6 Deep water refers to water depths of greater than 1,000 ft (300m) but less than 5,000 ft (1,500m). Ultra-deep-water refers to water depths of greater than 5,000 ft (1,500m). 7 Thermal coal sector is defined to encompass customers whose business involves the production and sale of thermal coal, with adjacent sectors (including mining service providers) excluded. Transactional banking and rehabilitation bonds are also excluded. From FY25 this definition will be updated to exclude metallurgical coal mines that produce a thermal coal product and diversified miners that produce a thermal coal product where their dominant activity is not thermal coal. This change has been made to align with Version 2 of the NZBA Guidelines for Climate Target Setting for Banks, updated in April 2024. 8 Annually, we calculate revenue percentage by assessing customers’ full-year audited financial reports, based on a rolling average of the prior three years of revenues. WESTPAC GROUP 2024 CLIMATE REPORT |
| INTRODUCTION GOVERNANCE STRATEGY RISK MANAGEMENT METRICS AND TARGETS APPENDIX ACTION AREA 2: SUPPORTING CUSTOMERS’ TRANSITION TO NET-ZERO AND TO BUILD THEIR CLIMATE RESILIENCE 32 Customer engagement Approach to customer engagement Our ambition is to be the transition partner of choice and engage with customers on the ESG topics that matter most to them. In our approach to customer engagement, we aim to understand customer needs and provide the support most relevant to them. Engagement spans our customer base with detailed assessments with certain institutional customers to less formal discussions with some business and agricultural customers. Areas of engagement in FY24 included: • Targeted engagement with institutional customers on their climate transition plans. • Discussing the requirements of our Westpac Sustainable Farm Loan with our New Zealand agricultural customers. • Explaining how we are considering natural capital. • Discussing transition needs with business customers. • Discussing GHG accounting and the use of carbon credits with institutional customers. • Engaging with Agriculture industry groups on development of harmonised definitions, data and assessment approaches, to progress our no deforestation commitment in our Sheep/Beef and Dairy portfolios. Building banker capability In FY24, we enhanced our bankers' ability to engage in net-zero discussions through targeted training and providing frameworks for their conversations. This was supplemented by our ESG specialists, who participated in many discussions and provided additional guidance. Initiatives across the Group in FY24 included: • In our Institutional business learning on ESG included internal newsletters, specialist knowledge sessions and use of e-learning modules; • Creation of an internal online resource with the tools and resources to support customer conversations; • Dedicated climate-related commercial property training for bankers and support staff working in this sector; • In 2023, we piloted the EY Sustainability Academy, an externally developed sustainability learning programme, which was offered to all Westpac New Zealand employees this year. Since its launch, more than 700 employees have completed the fundamentals learning module. Through this programme, our people can learn the fundamental concepts, causes, and impacts of climate change and how communities and institutions are adapting to deal with climate change and building resilience; and, • Trained >350 Corporate, Agricultural and Institutional bankers in New Zealand on current climate and ESG issues. Understanding transition plans We believe customers' future success will be influenced by how well they plan for the transition to a low-emissions, climate-resilient economy. We engage customers on their climate transition plans where appropriate, providing insights on industry best practice, climate strategy and ESG trends. This year, we updated our Climate Transition Plan Assessment Framework, as guided by the Transition Plan Taskforce (TPT) Disclosure Framework. The five elements of our Climate Transition Plan Assessment Framework are below. TABLE 11: OUR CLIMATE TRANSITION PLAN ASSESSMENT FRAMEWORK ELEMENTS AREAS OF ASSESSMENT Foundations 1. Risks and opportunities Implementation Strategy 1. Business and strategy 2. Emissions reduction initiatives 3. Capital expenditure Engagement Strategy 1. Engagement with value chain ELEMENTS AREAS OF ASSESSMENT Metrics 1. Long-term GHG targets 2. Interim scope 1 and 2 GHG targets 3. Interim scope 3 GHG targets 4. Planned use of carbon credits 5. Reporting of progress 6. External assurance Governance 1. Board oversight and capability 2. Incentives and remuneration 3. Skills, competencies and training In FY24, we engaged just over 150 institutional customers on their climate transition plans, prioritising customers that meet the Australian National Greenhouse and Energy Regulation (NGER) publication threshold for scope 1 and 2 emissions or are operating in an emissions-intensive sector. Customers engaged are broken down by sector in the figure below. FIGURE 4: CUSTOMERS ENGAGED BY SECTOR (%) WESTPAC GROUP 2024 CLIMATE REPORT |
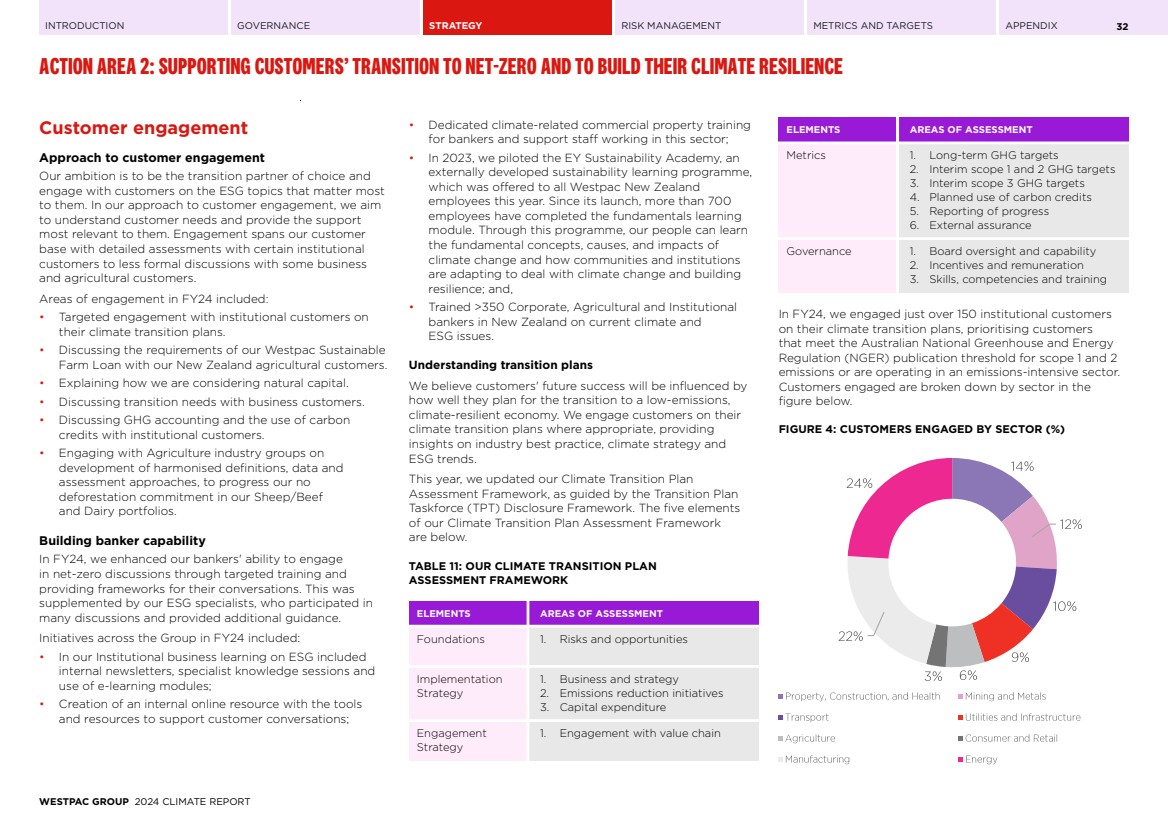
| INTRODUCTION GOVERNANCE STRATEGY RISK MANAGEMENT METRICS AND TARGETS APPENDIX ACTION AREA 2: SUPPORTING CUSTOMERS’ TRANSITION TO NET-ZERO AND TO BUILD THEIR CLIMATE RESILIENCE 33 From our engagement, we found that 84% of customers assessed had a public climate transition plan. Most of the 16% of customers without public climate transition plans were private companies. Where customers had a public climate transition plan, findings1 from our transition plan assessments included: • 92% had interim (approximately 5-10 year) scope 1 and 2 GHG targets while 66% had long-term net-zero GHG targets covering at least scope 1 and 2; • Challenges in setting longer-term targets include uncertainties around grid decarbonisation, industry policies and availability of low-carbon fuels; and, • Around 40% of customers have set an interim (approximately 5-10 year) scope 3 GHG target. FIGURE 5: % OF CUSTOMERS WITH LONG-TERM GHG TARGETS 29% 37% 22% 12% Net-zero scope 1, 2 and 3 GHG target Net-zero scope 1 and 2 GHG target Ambition, aim or support for net-zero No disclosure or commitment FIGURE 6: % OF CUSTOMERS WITH INTERIM SCOPE 1 AND 2 GHG TARGETS 38% 14% 40% 8% Scope 1 and 2, disclosed as being aligned to at least a 1.5°C Scope 1 and 2, disclosed as being aligned to a well below 2°C Scope 1 and 2, no specified temperature alignment No scope 1 and 2 targets FIGURE 7: % OF CUSTOMERS WITH INTERIM SCOPE 3 GHG TARGETS2 18% 7% 16% 60% Scope 3, disclosed as being aligned to 1.5°C Scope 3, disclosed as being to well below 2°C Scope 3, no specified temperature alignment No scope 3 target Engaging with business customers Supported by our ESG specialists, engagement with business customers has increased over the year, particularly in the Agriculture and Commercial Real Estate sectors where we have 2030 emission reduction targets. AGRICULTURE: We are supporting our Agribusiness bankers to engage with customers on emissions reduction, farm efficiency opportunities, and our commitment to no deforestation (see page 28 for further information). Customers have shared insights on land management practices aimed at improving production efficiency and reducing emissions intensity. We have also sponsored events like Beef 2024 and local field days to further increase customer and industry engagement and learn more about their transition plans. COMMERCIAL REAL ESTATE: In FY24, we engaged with over 120 customers in the scope of our Commercial Real Estate (offices) NZBA sector target to identify opportunities to support their progress. This engagement revealed that they are at various stages in their net-zero journeys. While many customers were focused on reducing emissions, the upfront cost of retrofits remains a barrier for some. Beyond providing transition financing, our discussions have highlighted the key role our bankers can play in supporting customers with insights and resources to support their net-zero journeys. 1 In FY24, we engaged over 150 institutional customers across WIB and WNZL, representing a range of sectors, on their climate transition plans. Our transition plan assessment findings are based on statements made in these customers’ public disclosures, and feedback received from customers through our engagement process. 2 Individual category figures may not sum to 100% due to rounding. WESTPAC GROUP 2024 CLIMATE REPORT |
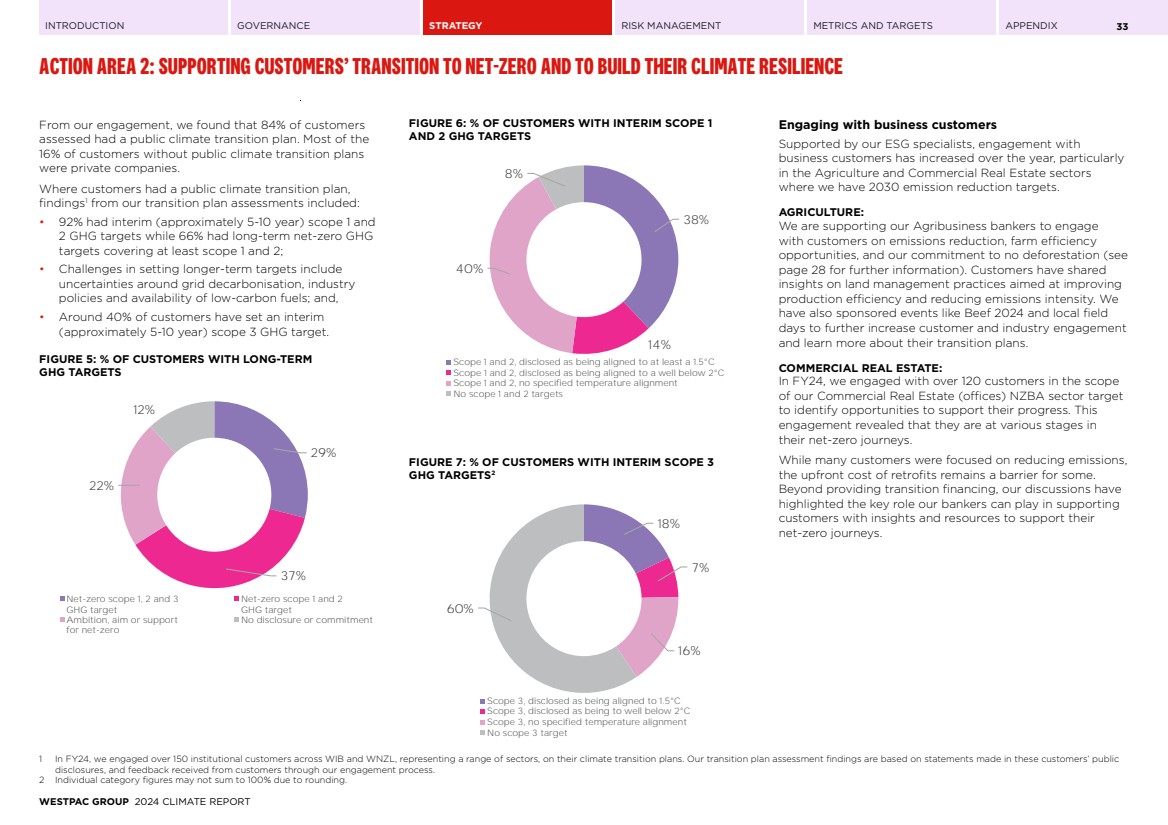
| INTRODUCTION GOVERNANCE STRATEGY RISK MANAGEMENT METRICS AND TARGETS APPENDIX ACTION AREA 2: SUPPORTING CUSTOMERS’ TRANSITION TO NET-ZERO AND TO BUILD THEIR CLIMATE RESILIENCE 34 The climate change opportunity Climate change presents significant opportunities for banks to help improve their energy efficiency and their climate resilience. This includes support via our lending and by providing sector and industry insights to assist companies on their journeys. Sustainable Finance Framework In FY23, we launched our Sustainable Finance Framework (Framework) providing clear definitions for what is green, transition, sustainability or social lending and bond facilitation. The Framework is underpinned by our Sustainable Finance Taxonomy that has the technical screening criteria for assessing lending and bond facilitation. This gives our people and customers clarity and guides our product development as we work to expand our solutions that contribute to positive climate, environmental and social outcomes. In FY24, we expanded the Framework to include criteria for energy-efficient and climate resilient upgrades to dwellings. This aligned with the launch of the Sustainable Upgrades home and investor loans. We will continue to review the Framework to accommodate new activities supporting decarbonisation, affordable and inclusive housing and other sustainable products and services. We also expect to review the Framework when the Australian Sustainable Finance Taxonomy is released and for other standards, policies and regulation where relevant. Figure 8 provides an overview of our Sustainable Finance Framework. FIGURE 8: SUSTAINABLE FINANCE FRAMEWORK Our Sustainable Finance Framework Assess ESG risks for customer/transaction, including against our Position Statements Determine the amount to be included in the targets Sustainable Finance Targets by 2030 Green Transition Social Sustainability Assess a Sustainable Finance transaction Labelled lending or bond facilitation Qualifies if aligns with industry standards, principles and guidance and/or third-party assured/verified Unlabelled lending Qualifies if eligible based on Westpac’s Sustainable Finance Taxonomy $55bn LENDING $40bn BOND FACILITATION Assess Classify/measure Monitor/report Sustainable Finance Targets With the launch of our Framework, we established two 2030 Sustainable Finance targets of: • $55 billion in lending. This target is based on TCE (or balance mortgage) at a point in time. • $40 billion in bond facilitation. This target is based on our share of the cumulative value of bonds facilitated between 2021 and 2030. Further details are available in our Sustainable Finance Framework on our website. At September 2024 we had $28.7 billion in lending and $13.7 billion in bond facilitation putting us on track to meet our 2030 targets: TABLE 12: PROGRESS IN BOND FACILITATION AND SUSTAINABLE LENDING (AT 30 SEPTEMBER) 2024 2023 Total value of bond facilitation ($bn) cumulative from 1 October 2021 13.7 8.8 Total TCE ($bn) 28.7 19.1 The $9.9 billion increase (52%) in lending1 in FY24 was due to: • Green Lending in commercial real estate, renewables and Social Lending to the healthcare sector. • Joining the Housing Australia Home Guarantee Scheme – writing $5.2 billion in loans. • Supporting Head Start Homes – a not-for-profit organisation providing social housing. • Uptake of Westpac Sustainable Farm Loan across NZ agribusiness term lending customers. Refer to Tables 13 and 14 on the next page for further details of our recent progress against our Sustainable Finance targets. 1 Total committed exposure for lending assessed as sustainable finance in accordance with our Sustainable Finance Framework – movement in balance over the year. WESTPAC GROUP 2024 CLIMATE REPORT |
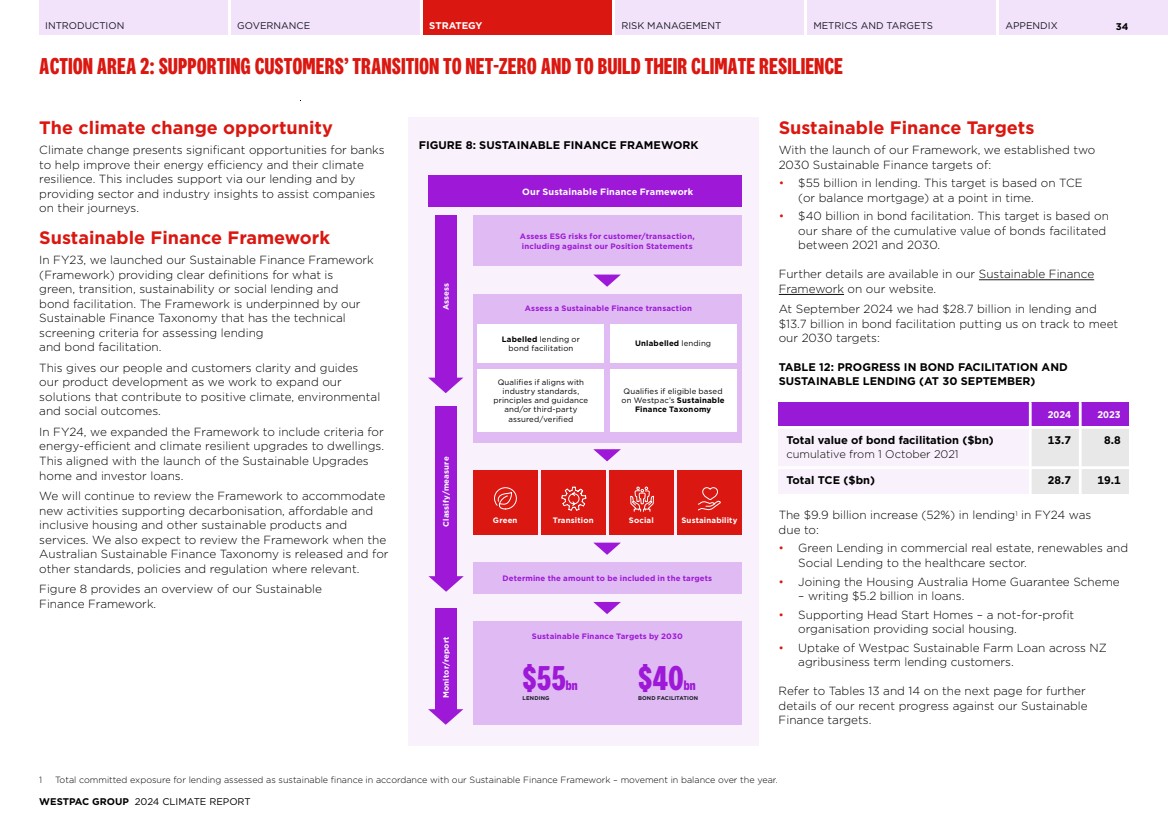
| INTRODUCTION GOVERNANCE STRATEGY RISK MANAGEMENT METRICS AND TARGETS APPENDIX ACTION AREA 2: SUPPORTING CUSTOMERS’ TRANSITION TO NET-ZERO AND TO BUILD THEIR CLIMATE RESILIENCE 35 TABLE 13: PROGRESS IN BOND FACILITATION (AT 30 SEPTEMBER) 2024 2023 CATEGORY Green 6.4 4.0 Social 0.3 0.3 Sustainabilitya 7.0 4.5 Sustainability bonds 6.8 4.3 Sustainability-linked bonds 0.2 0.2 Total value of bond facilitation ($bn) cumulative from 1 October 2021 13.7 8.8 a. Includes labelled sustainability loans and sustainability-linked loans. TABLE 14: PROGRESS IN SUSTAINABLE LENDING (AT 30 SEPTEMBER) 2024 2023 CATEGORY Green 12.2 8.9 Transition 0.0 0.0 Social 7.6 2.2 Sustainabilitya 9.0 8.0 Sustainability loans 0.2 0.2 Sustainability-linked loans 8.8 7.8 Total TCE ($bn) 28.7 19.1 SECTOR Power Generationb 3.9 3.6 Transportb 1.2 1.5 Commercial Real Estateb 4.6 4.0 Residential Mortgages – Australiac 5.2 0.2 Healthcareb 1.4 1.1 Educationb 0.7 0.9 Otherd 5.3 4.6 New Zealand – Agriculture 3.3 0.9 New Zealand – Other sectors excl. agriculture 3.2 2.3 Total TCE ($bn) 28.7 19.1 a. Includes labelled sustainability loans and sustainability-linked loans. b. WIB only excludes WNZL. c. Consumer banking only excludes WNZL. d. Includes labelled lending in other sectors (i.e. not listed already) for WIB. FIRST AOFM GREEN BOND Westpac supported the Australian Office of Financial Management (AOFM) as Joint Lead Manager, with their first 10-year A$7 billion Green Treasury Bond. AOFM manages the Australian Government’s debt portfolio. The green bond’s proceeds will be allocated to projects that drive Australia’s transition to net-zero by 2050 and aim to deliver lower greenhouse gas emissions, increases in renewable energy production, and bolstering biodiversity conservation, restoration and adaptation. The indicative list of eligible green expenditures includes projects such as: • Rewiring the nation – Providing low-cost finance to upgrade Australia’s electricity grid to integrate increasing renewable energy generation; • Renewable energy – Providing finance to drive investments that add value and develop capability in renewables and low-emission technologies; • Saving Koalas Fund – Supporting the recovery of Australia’s unique plants, animals and ecological communities; • Reef 2050 – Investing to protect the health and resilience of the Great Barrier Reef; and, • Murray-Darling Basin Plan – Recovering environmental water for the Murray-Darling Basin. WESTPAC GROUP 2024 CLIMATE REPORT |
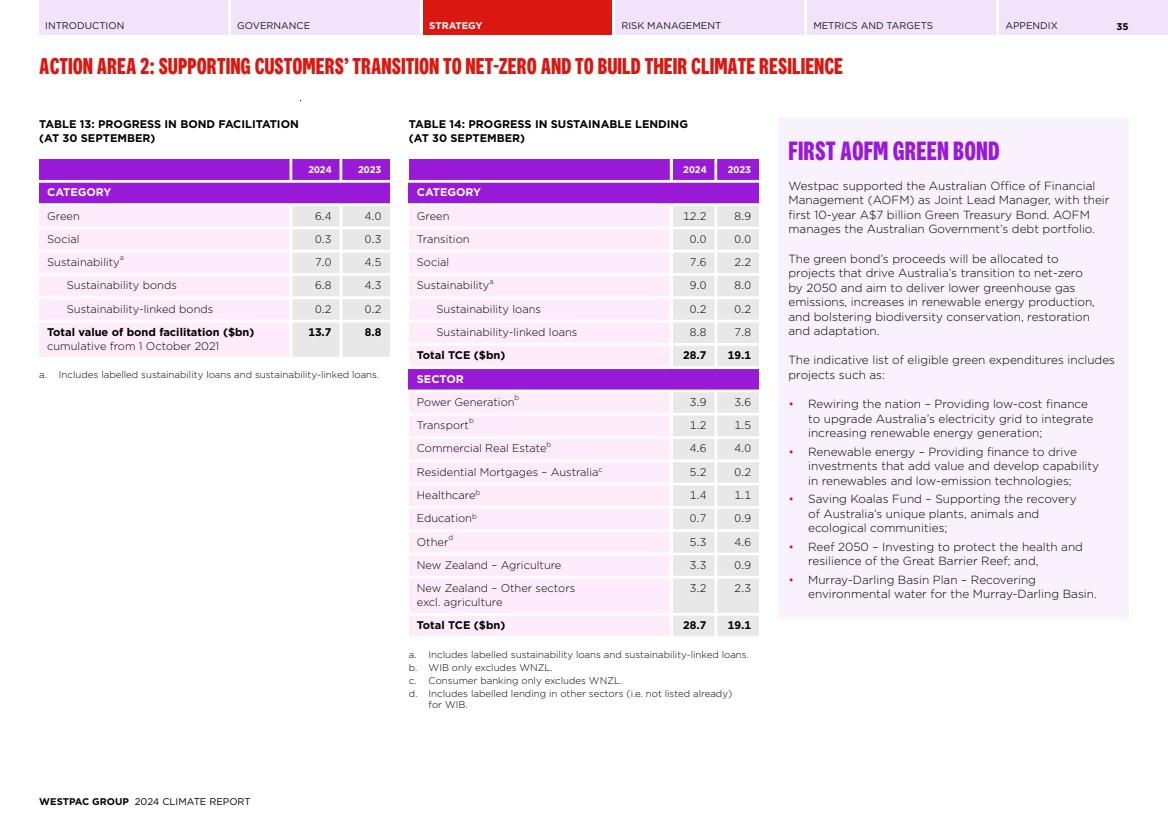
| INTRODUCTION GOVERNANCE STRATEGY RISK MANAGEMENT METRICS AND TARGETS APPENDIX ACTION AREA 2: SUPPORTING CUSTOMERS’ TRANSITION TO NET-ZERO AND TO BUILD THEIR CLIMATE RESILIENCE 36 Supporting the critical minerals sector The energy and climate transition will be heavily reliant on minerals, including copper, aluminium, nickel, lithium, salt and other rare earth elements. The Australian Government’s Critical Minerals Strategy 2023-2030 outlines a vision to expand the critical minerals sector, leveraging the country’s rich geology, expertise, and track record as a reliable producer and exporter of resources. Westpac’s long-standing support for the resources sector positions us to continue financing the mining industry and helping to secure the critical minerals needed for a lower carbon economy. TALISON LITHIUM Westpac supported Talison Lithium as Managing Lead Arranger on the refinancing of their syndicated facility. Talison Lithium is the owner of the world’s largest and lowest cost lithium mine, the Greenbushes mine in Western Australia. Lithium is critical in the climate and energy transition, used for electric vehicles, power storage and to firm up the energy grid. We are proud to support Talison Lithium as they support the transition. BCI MINERALS LTD Westpac supported BCI Minerals Ltd as Sustainability Structurer and Mandated Lead Arranger, Underwriter and Bookrunner for the construction of the Mardie salt and potash project. This transaction features the company’s first green loan aligned to the Green Loan Principles (‘GLP’). We are proud to support BCI Minerals on this landmark project. The project offers a rare, sustainable opportunity to develop a large-scale, solar evaporation salt operation on the Pilbara coast of Western Australia. The project meets GLP criteria for circular economy production process and pollution, generating almost all energy from renewables while engaging closely with traditional owner groups. Supporting the energy transition Achieving net-zero emissions requires a transformation of the electricity grid. Alongside decarbonising through renewables, the grid must expand to support the growing electrification of homes, businesses, and transport. At September 2024, 87% of our TCE to electricity generation was to renewables. Over the last year Westpac was the largest financier to renewable projects in Australia1 .. 1. Based on IJGlobal and Westpac Research Data for the period 1 October 2023 to 30 September 2024. GOLDEN PLAINS WIND FARM Westpac is proud to be the transition partner of choice for TagEnergy’s financing for Stage 2 of the Golden Plains Wind Farm located around 60km NW of Geelong in Victoria, Australia. When combined with Stage 1, which Westpac also helped finance, the $4 billion project is the largest wind farm (1,333MW) under construction in the southern hemisphere. Once complete, the total project is expected to deliver the equivalent of 9% of Victoria’s energy and provide enough clean energy to power over 765,000 homes – the equivalent of every home in regional Victoria. This structure was supported by TagEnergy’s credible power purchase agreement strategy, involving the progressive contracting of energy production during construction and operation of its facilities. WESTPAC GROUP 2024 CLIMATE REPORT |
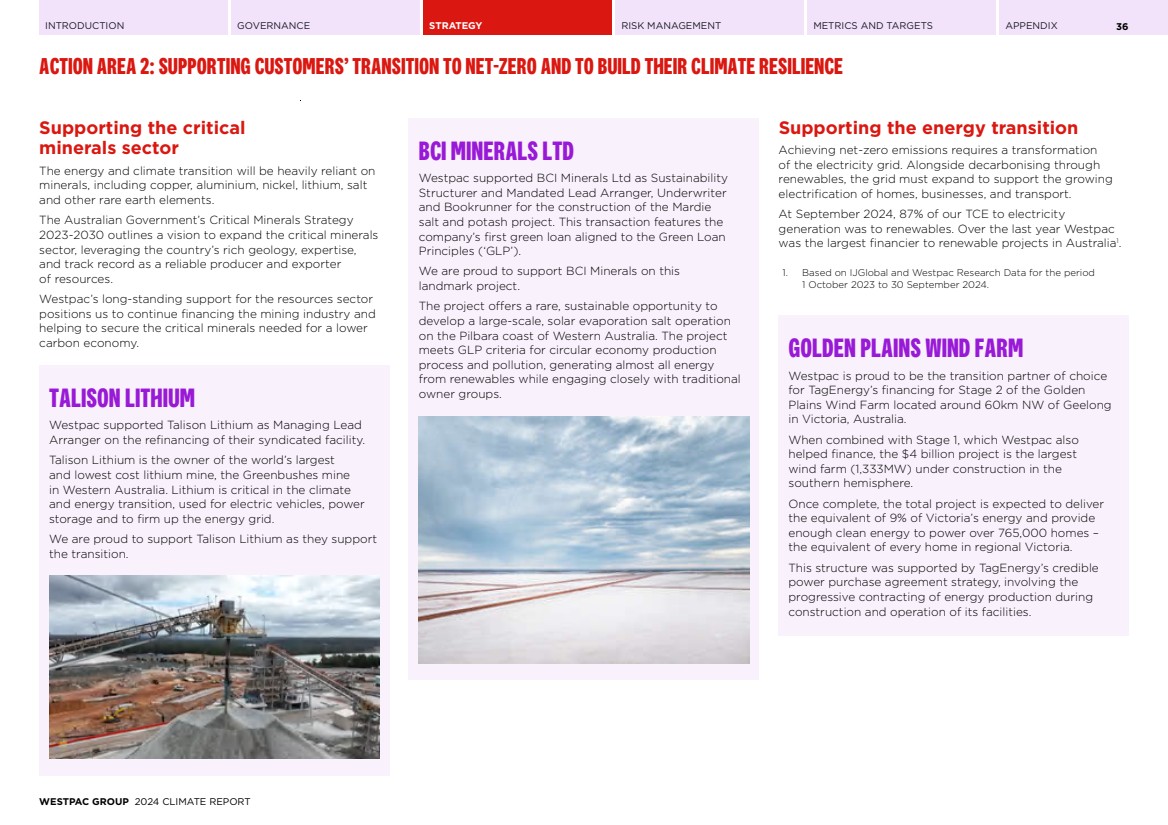
| INTRODUCTION GOVERNANCE STRATEGY RISK MANAGEMENT METRICS AND TARGETS APPENDIX ACTION AREA 2: SUPPORTING CUSTOMERS’ TRANSITION TO NET-ZERO AND TO BUILD THEIR CLIMATE RESILIENCE 37 GOYDER SOUTH WIND FARM AND BLYTH BATTERY Westpac provided finance for the Goyder South Wind Farm (203MW) and Blyth Battery (477MWh) in South Australia, which is being built by renewables developer Neoen. This landmark project is understood to be the first utility-scale renewable energy financing in Australia to be supported by a baseload power purchase agreement. It is designed to provide BHP’s Olympic Dam mining operation with a fixed amount of power generated entirely from renewable sources. Westpac is proud to partner with Neoen on this transaction further highlighting our support for Australia's energy transition. Supporting customers with products and services Customers are already using our products and services to reduce their emissions and improve resilience. This includes providing finance for consumers to upgrade their homes or purchase an electric vehicle or helping businesses to upgrade their infrastructure. While these products are often assisting customers in their transition or reduce their energy costs they are not always classified within our Sustainable Finance Framework. Supporting consumers • In FY24, we launched the Sustainable Upgrades home and investor loans for customers to install new features or technology to improve the energy efficiency or climate resilience of their properties. Launched in late 2024, the new product is aligned with our climate action plan. • Westpac is the first bank to be supported by the Clean Energy Finance Corporation’s $1 billion Household Energy Upgrades Fund (HEUF), a landmark program to help Australians access cheaper home energy solutions and affordable finance. Supporting businesses • We continue to support business customers with existing products to improve their energy efficiency or increase their climate resilience. • In New Zealand we launched the Sustainable Equipment Finance Loan, providing competitive rates for business customers to purchase a range of sustainable equipment including more efficient vehicles, machinery, and tools. Supporting institutional customers • We offer a wide range of solutions to help institutional customers with transition, including green, social, and sustainable use-of-proceeds bonds and loans, as well as sustainability-linked bonds and loans. Use of proceeds structures allow customers to efficiently fund pools of assets that support positive environmental and social outcomes, while sustainability-linked loans and bonds tie their interest rates to sustainability performance, with lower rates for meeting agreed targets. • There was strong demand for the Westpac Green Tailored Deposit last year, with the balance growing from $852 million to $1.97 billion by the end of September 2024. This was due to customers wanting to invest in a green investment and to take advantage of relatively high market interest rates. WESTPAC GROUP 2024 CLIMATE REPORT |
| INTRODUCTION GOVERNANCE STRATEGY RISK MANAGEMENT METRICS AND TARGETS APPENDIX ACTION AREA 2: SUPPORTING CUSTOMERS’ TRANSITION TO NET-ZERO AND TO BUILD THEIR CLIMATE RESILIENCE 38 MAB – NIGHTINGALE PRESTON MAB, a long-standing customer of Bank of Melbourne, is a leading property development company with a strong commitment to quality and sustainability. MAB recently collaborated with Nightingale Housing, a not-for-profit creating affordable housing solutions, to deliver Nightingale Preston. Located in Preston, Victoria, this innovative 52-apartment project prioritises social connection, housing equity, and environmental sustainability. Nightingale Preston’s communal design offers generous shared spaces such as a rooftop garden, a guesthouse for visitors and a communal bathhouse. These amenities help foster connection amongst the residents and create a thriving community. According to Mike Stasiuk, MAB Project Director Northside Communities, “The sustainability ethos of Preston Nightingale was embedded from the start. Its credentials include an impressive average NatHERS rating of 8.5 stars and a 5 Star Green Star Design & As-Built V1.2 certification, expected to be achieved later in 2024. The ESD principles of Nightingale have been embraced by MAB to further raise the standard for other buildings within Preston Crossing, and ultimately led to the creation of Melbourne's first gas-free, medium-density neighbourhood.” We are proud to finance MAB and collaborate with them as they develop their long-term sustainable development plans. WESTPAC GROUP 2024 CLIMATE REPORT |
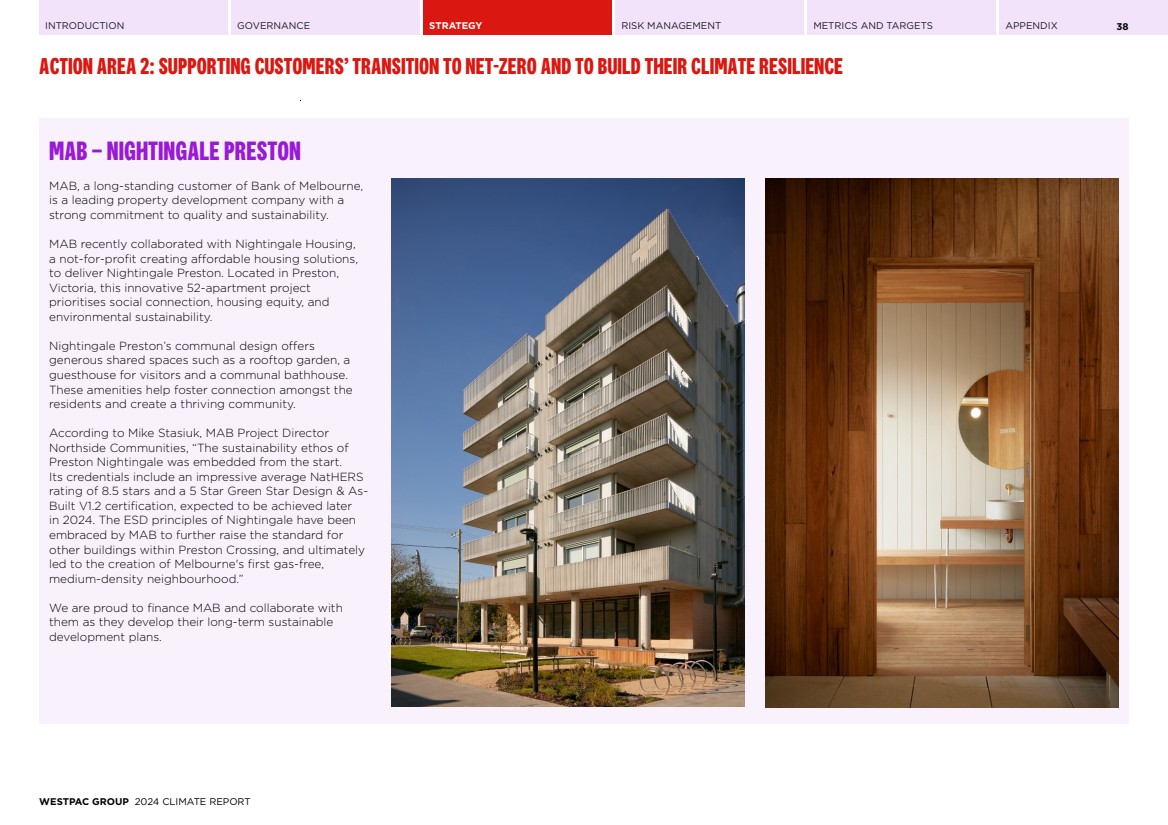
| INTRODUCTION GOVERNANCE STRATEGY RISK MANAGEMENT METRICS AND TARGETS APPENDIX ACTION AREA 2: SUPPORTING CUSTOMERS’ TRANSITION TO NET-ZERO AND TO BUILD THEIR CLIMATE RESILIENCE 39 Supporting Agribusiness customers Agriculture has long been a foundation of the Australian and New Zealand economies, and way of life. Given our nations’ vast natural resources, the sector also provides a distinct global comparative advantage and plays a critical role in our food security. The sector is also well positioned to lead the technological and operational change needed to maintain our world-class agriculture systems. However, it is important to acknowledge this sector carries a significant environmental footprint in both its emissions and its impact on the natural world. We look to balance our support to Agriculture’s Ag2030 growth plan1 whilst helping customers to understand opportunities for decarbonisation. This includes existing agricultural practices and emerging technology outlined in the Climate Change Authority's Agriculture and Land Sector Pathways Review. It is clear the agriculture sector appreciates the climate issues faced and is taking steps to reduce its impact. The sector has already established sustainability frameworks, and is improving its technology and management practices to increase farm productivity2 .. We are proud of the support we are providing the agricultural sector as it transitions and are looking to expand that support in the period ahead. A particular success over the year has been New Zealand's Sustainable Farm Loan. This facility is designed to support customers to build climate resilience, reduce GHG emissions, and deliver more sustainable farming, both economically and environmentally. At 30 September 2024 over NZ$3.6 billion in lending had been provided via this loan. 1. Department of Agriculture, Fisheries and Forestry (Australia), Delivering Ag2030 (2022). 2. Australian Bureau of Agricultural and Resource Economics and Sciences (ABARES), Snapshot of Australian Agriculture 2024 (2024). LAGUNA BAY – ENHANCING SUSTAINABILITY AT 40 SOUTH DAIRIES Long-term Westpac customer Laguna Bay is one of the largest agricultural fund managers in Australia. Their operations include 40 South Dairies, a large producer in Tasmania’s North-West. 40 South Dairies recently embarked on several initiatives to improve productivity, environmental outcomes, and animal welfare, all while contributing to the local community. One significant initiative involved the implementation of “Cow Watch” collars, which collect real-time data on individual cow movements, eating patterns, behaviour, and productivity. Analysing this data supports feed optimisation, detection of health issues, and enhances the overall wellbeing of the herd. Additionally, 40 South Dairies has diversified by rearing non-replacement dairy calves for high-quality beef production. State-of-the-art calf rearing sheds house 4,500 calves, with plans to accommodate 6,000 head per annum. This dairy beef program creates local jobs and promotes lower-emissions beef production. The farm also embraces regenerative grazing practices. Rotational grazing and shorter grazing intervals promote healthier pastures, enhance resilience to environmental stresses and increase biodiversity. 40 South Dairies is committed to reducing the carbon intensity of its products. They conduct greenhouse gas assessments, measuring emissions and removals. By reducing their environmental impact, they contribute to a more sustainable future for their operations and the broader community. In the words of Ashley Ker, General Manager of 40 South Dairies: “Our commitment to sustainable practices ensures a brighter future for our farm and community.” AT THE FOREFRONT OF INNOVATION – BREEZA STATION The Pursehouse family’s continual commitment to innovation, which they regard as part of their “DNA”, has been core to the successful growth of their multigenerational cropping business, “Breeza Station”, on the Liverpool Plains of New South Wales. Run by Andrew and Cynthia Pursehouse, along with their son James, they have been working on the health of the soil at “Breeza Station”, spanning around 5,200 hectares, for the past 40 years and the outcome is a highly productive and profitable farming enterprise, where crop yields have doubled since the early 1990s. Early adoption of minimum and no till in the late 1980s has preceded ongoing innovation, such as growing legumes to reduce reliance on synthetic fertiliser and turning over machinery regularly to utilise emerging precision technologies such as an autonomous vehicle for optical spot spraying across the farm, with James noticing efficiency by using only “2% to 3% of the chemical once used”. Other on-farm technological adoptions include an extensive network of soil moisture probes to manage irrigation scheduling, yield mapping, developing renewable energy powered bores, planting more trees, protecting the Mooki River, and returning natural habitat. James sums it up, “Being a good farmer is a particular mindset. It’s about doing everything well, being open to new ideas, and doing everything right.” Westpac Senior Relationship Manager, David Kidd, has been proud to support the Pursehouse family as their banker for 20 years. WESTPAC GROUP 2024 CLIMATE REPORT |
| INTRODUCTION GOVERNANCE STRATEGY RISK MANAGEMENT METRICS AND TARGETS APPENDIX ACTION AREA 2: SUPPORTING CUSTOMERS’ TRANSITION TO NET-ZERO AND TO BUILD THEIR CLIMATE RESILIENCE 40 Supporting customers to build climate resilience One of the most immediate and significant impacts from climate change is the physical risks from the increased severity of natural disasters. We work hard to support customers with the immediate short-term effects of these events and then help them to get back on their feet over the medium term. This includes our natural disaster relief packages in Australia and from our Adverse Events Policy in New Zealand. We are working with customers and communities to understand and respond to the impacts of climate change. This includes how it may affect their businesses, their assets and their homes. A Price for Carbon Westpac has long supported a market-based carbon price as an effective mechanism to recognise and account for the material social and environmental costs of carbon dioxide and equivalent GHG emissions. We believe that an economy-wide carbon price is justified as it monetarises the costs of GHG emissions, it improves resource allocation, and it creates incentives to reduce emissions. While we support an economy-wide carbon price, we do not believe it should be universally applied within businesses. The decision to adopt an internal carbon price should consider the nature of the business, the complexity of implementation and its effectiveness in driving change. At Westpac we do not currently use an internal carbon price (an actual transfer price or a shadow carbon price) in our operations or investment decisions. This principally reflects our business model, as a bank, which is less carbon-intensive than other sectors, and because it would be difficult to apply a unit carbon cost to transactions/ loans/deposits. As we continue to analyse and assess the risks and opportunities of climate change on our business, on customers and on our stakeholders, we may reassess how we consider the cost of carbon in the future. We can play an important role in financing the transition to a low carbon economy and improving climate resilience. This includes offering products like green bonds, sustainability linked loans, Westpac Sustainable Business Loan and Westpac Sustainable Farm Loans in New Zealand and specialist mortgage-related sustainability loans in Australia and New Zealand. While these products are not linked to an internal or external carbon price they provide incentives (usually by way of interest rate benefits) to encourage customers to improve their emissions profile and climate resilience. Supporting customers in carbon markets Westpac provides institutional customers with access to carbon and renewable energy markets in Australia and New Zealand through its Financial Markets team. While reducing gross GHG emissions should be the priority in achieving net-zero, carbon allowances, and renewable energy certificates, can play an integral role in helping customers reach their net-zero goals, particularly in sectors where emissions are harder to abate. We are an active participant in the ACCU (Australian Carbon Credit Unit) and REC (Renewable Energy Certificate) markets in Australia, as well as the New Zealand Emissions Trading Scheme (NZ ETS) market in New Zealand. Our role in carbon trading includes supporting customers with: • navigating developing carbon markets; • risk management and funding strategies; • accessing liquidity to manage exposures to carbon prices; and • meeting their voluntary and/or compliance requirements/commitments; We also actively support generators of carbon units to monetise their production. This year we expanded our capability into European, UK and US compliance carbon markets, allowing us to better support customers to offset their global emissions. Westpac is a longstanding member of the Carbon Market Institute (CMI), helping shape the sector’s compliance and regulatory frameworks. This year, we supported and contributed to the 2024 CMI-Westpac Carbon Market Report, Carbon Markets and Australia’s Net Zero Challenge. WESTPAC GROUP 2024 CLIMATE REPORT |
| INTRODUCTION GOVERNANCE STRATEGY RISK MANAGEMENT METRICS AND TARGETS APPENDIX 41 ACTION AREA 3: COLLABORATE FOR IMPACT ON INITIATIVES TOWARDS NET-ZERO AND CLIMATE RESILIENCE Addressing climate change requires collective action and a shared commitment to a common goal. This involves governments, business, communities, industry bodies, and individuals working together. As part of our commitment, our third key action is to collaborate for impact on initiatives towards net-zero and climate resilience. This year, we participated in a range of industry initiatives including: • As a member of the Australian Sustainable Finance Institute (ASFI), we participated in: – Development of the Australian Sustainable Finance Taxonomy. – Natural Capital Advisory Group workshops, including Farming for the Future workshops. • As a member of the Australian Banking Association (ABA), we participated in consultations for the AASB climate-related disclosures standards and the Climate Active program; • As the Co-Chair of the UNEP FI’s Banking Board which oversees the Principles for Responsible Banking (PRBs); • The principals and steering group governance bodies and facilitated emissions working group for the NZBA; and, • In New Zealand, we contributed advice to government on the development of a sustainable finance taxonomy, as an instrumental member of the Independent Technical Advisory Group (ITAG) organised by Toitū Tahua, Centre for Sustainable Finance. Our engagement also spanned government and industry bodies, to help us implement our commitments and plans. Agricultural industry related engagement • Engaged with Rural Research and Development Corporations (including Meat and Livestock Australia and Dairy Australia), as well as Peak Bodies (including National Farmers’ Federation and AgForce) to understand current and future decarbonisation measures and identify collaboration opportunities. • Engaged with State Departments of Primary Industry, to identify collaboration opportunities. • Met with Agriculture Victoria at their on-farm research facilities, to understand the development and application of new technologies. Residential housing related engagement • Engaged with ClimateWorks on the second phase of the Renovation Pathways project focusing on Built Environment Sectoral Plan and financing mechanisms to enable retrofits. • Participated in ASFI’s taxonomy advisory group on buildings and construction, providing advice and technical insights on the development of taxonomy technical criteria. Commercial Real Estate sector engagement • Participated in ASFI’s taxonomy advisory group on buildings and construction, providing advice and technical insights on the development of taxonomy technical criteria to inform the first phase of an Australian Sustainable Finance Taxonomy. • Continued participation in the ABA's Financed Emission Working Group to improve emissions reporting in the sector. Review of Industry associations In FY24, we reviewed our climate and energy positions as well as the positions of key industry associations of which we are members. This included assessing them against the goals of the Paris Agreement. The review found no material differences between our positions and those of the industry associations. Where potential variances were identified they were nuanced, reflecting the complexity and evolving nature of the climate landscape and debate. Westpac’s membership in industry associations does not prevent us from taking different policy positions, particularly where we believe our position better serves the interests of our customers, shareholders, employees and the broader economy. When our position significantly diverges from that of an industry association, we seek to engage directly with its leadership to gain a deeper understanding of the rationale and nature of those differences. Our approach is guided by our Principles of Engagement which are available on our website. WESTPAC GROUP 2024 CLIMATE REPORT |
| INTRODUCTION GOVERNANCE STRATEGY RISK MANAGEMENT METRICS AND TARGETS APPENDIX 42 CAPITAL ALLOCATION AND CLIMATE CHANGE We devote significant resources to managing climate change risks and opportunities. Most spending supports business-as-usual activities such as working with customers, managing targets, implementing policies/standards, stress testing, reporting and efforts to reduce our operational emissions. For banks, the allocation of capital can be viewed through three lenses: 1. Operations: Investments aimed at addressing climate-related risks and opportunities within our business. 2. Supporting customers: Capital required to underpin lending that supports customers’ transition plans. 3. Investment: Capital allocated to specific climate-related initiatives, usually outside the bank’s normal operations. Capital allocation under each lens OPERATIONS Through our strategic review process, we allocate capital to initiatives that drive change, enhance capabilities, develop new products and services, improve infrastructure, lift productivity or reduce risk. This investment is separate from business-as-usual costs. In FY24, climate-related investments included: • Improving climate-related data and systems, including for our NZBA sector targets; • Enhancing our climate scenario analysis; and • Geospatial mapping to assist with customer risk assessments. CUSTOMER SUPPORT The Group maintains sufficient levels of regulatory capital to support growth. Typically, we do not allocate capital for lending to specific sectors, or purposes. Instead, capital is applied to lending which tends to be driven by customer demand which in turn is influenced by product quality, pricing and market dynamics. Accordingly, we do not explicitly allocate capital for climate-related lending. Nevertheless, we have provided more climate-related lending over the last year, including lending under our Sustainable Finance Framework; and so more capital has been applied to this lending. We have not yet calculated the capital allocated to these facilities. Based on the Group’s current plans, we have sufficient capital to accommodate the expected increase in sustainable finance and other climate-related lending into the short and medium term. INVESTMENT In FY24 we committed to invest in Virescent Ventures’ second climate technology investment fund (Fund II). The new venture capital fund is focused on investing in early-stage climate-related technologies aimed at addressing climate-related challenges. Details of the investment committed by Westpac are confidential noting that we are investing alongside the Clean Energy Finance Corporation and other public and private institutions in Fund II’s initial $100 million raising as a minority investor. Capital Adequacy and Climate-Related Risks and Opportunities Westpac’s capital management strategy is reviewed on an ongoing basis and annually through the Internal Capital Adequacy Assessment Process (ICAAP). In assessing the appropriateness of our capital, the ICAAP considers a range of matters including regulatory minimums and buffers, stress testing under different adverse economic scenarios, our strategy business mix and operations, and external stakeholder perspectives. The impacts of climate-related risks and opportunities are considered in this assessment, including via our strategy, growth and risk considerations. Further detail on the ICAAP is in our 2024 Annual Report. WESTPAC GROUP 2024 CLIMATE REPORT |
| INTRODUCTION GOVERNANCE STRATEGY RISK MANAGEMENT METRICS AND TARGETS APPENDIX 43 RISK MANAGEMENT The assessment of climate change related risks is included in the Group’s risk management framework and reflected in the Board’s risk appetite statement. Climate change risks principally occur from: Physical risks from changing climate patterns including changes to the frequency and severity of weather events. Transition risks associated with the transition to a lower carbon economy. This includes changes in policy, technology, regulation and market pressures in relation to carbon-intensive activities. Liability risks from legal and regulatory action. These may arise from failing to adequately consider or respond to climate-related risks, changes in law or regulation, or emerging standards or societal expectations. |
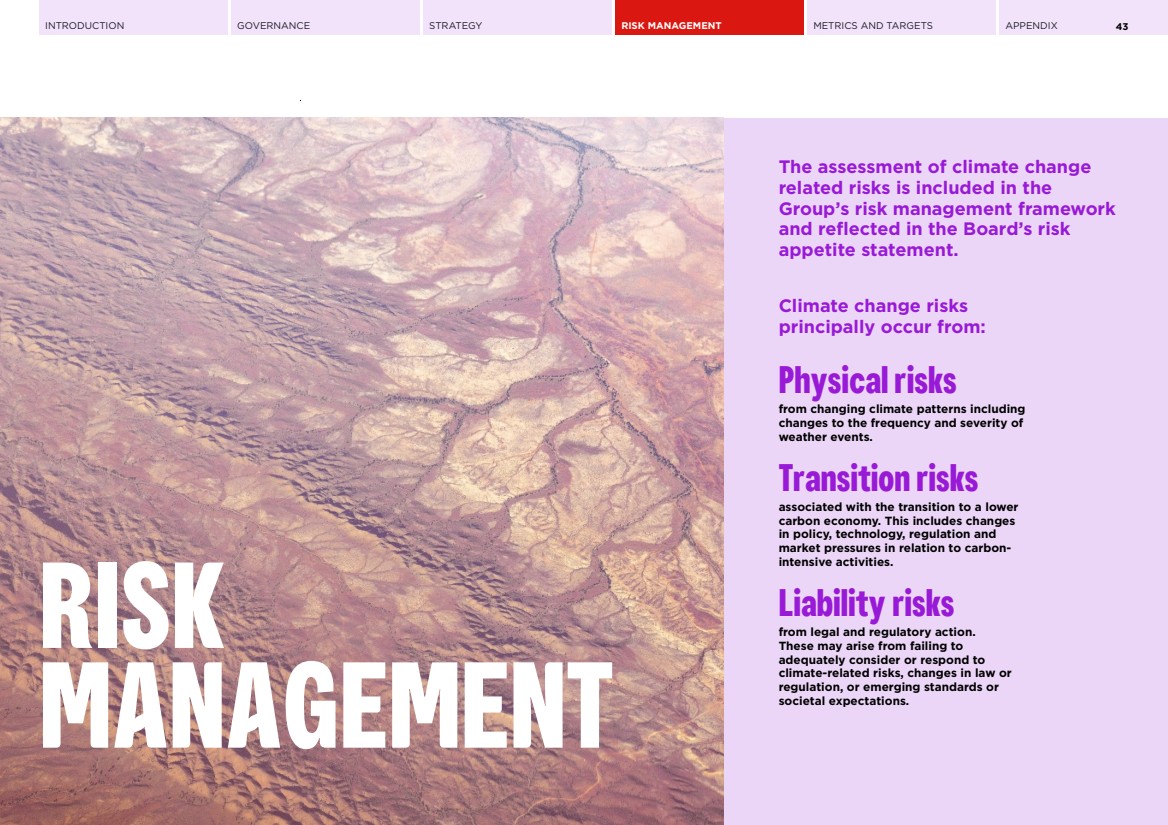
| INTRODUCTION GOVERNANCE STRATEGY RISK MANAGEMENT METRICS AND TARGETS APPENDIX 44 APPROACH TO RISK MANAGEMENT The management of climate change risk is integrated within our overall management of risks. Our Risk Management Framework (RMF) sets out our structured approach to managing the material risks we face. The framework is supported by a Board-approved Group Risk Taxonomy that defines 11 major risk categories. Climate change is classified under the major risk categories of Credit Risk (as a financial risk) and Reputation and Sustainability Risk (as a non-financial risk); however, given the way climate change risks manifest, there is potential for it to impact other material risk categories. Broadly, climate change risks manifest as physical, transition and liability risks. • Physical risks from changing climate patterns including changes to the frequency and severity of weather events. • Transition risks associated with the transition to a lower carbon economy. This includes changes in policy, technology, regulation and market pressures in relation to carbon-intensive activities. • Liability risks from legal and regulatory action. These may arise from failing to adequately consider or respond to climate-related risks, changes in law or regulation, or emerging standards or societal expectations. Further details of these major risk categories and our overall risk management approach are available in the Risk Management section of our Annual Report. We continue to improve our identification and management of climate change risk as the expectations of stakeholders evolve. Work to further embed consideration of climate change risk into existing processes and policies in FY24 included: • Assessing climate change risk across lending, our operations and supply chain is performed periodically. This process considers emerging risks, changes in the regulatory environment, issues and incidents. • Oversight and challenge by Line 2 Risk teams. This included quarterly monitoring of risk assessments to develop an aggregate Group view of climate change risk, with findings circulated to teams across the Three Lines of Defence. • Reviewing the Sustainability Risk Management Framework, approved in May 2024. • Reviewing our Group Environmental, Social, & Governance (ESG) Credit Risk Policy, approved in April 2024. • Developing a Climate Risk Policy, with implementation being embedded across the bank. • Reviewing and monitoring of climate change related risk appetite settings in the Board Risk Appetite Statement, last approved in August 2024. • Reporting to the Board Risk Committee on sustainability risk, as part of the Reputation and Sustainability Risk Class Deep Dive. • Establishing a Climate Analytics team to develop our Climate Scenario Analysis capability. • Implementation and monitoring of APRA’s Prudential Practice Guide CPG 229 – Climate Change Financial Risks (CPG 229). • Providing climate-related training to certain employees. • Enhancing processes to further embed adherence with our sector positions. Impact of climate-related risks on our material risk categories The table on the following page outlines how climate-related risks may emerge across certain major risk categories1 .. The impacts are different across each risk and will likely vary across the short, medium, and long terms. The potential impact of climate risk is being considered through a broad range of frameworks, policies and tools, including: • Sustainability Risk Management Framework. • Sustainable Finance Framework. • ESG Credit Risk Policy. • Risk Appetite Policy. • Product and Service Lifecycle Policy. • ESG risk assessment tools. • Scenario analysis tools. 1 Three major risk categories, Financial Crime, Risk Culture and Cyber Risk, have been excluded from this table on the basis the impacts of climate-related risks are deemed not material at this time. WESTPAC GROUP 2024 CLIMATE REPORT |
| INTRODUCTION GOVERNANCE STRATEGY RISK MANAGEMENT METRICS AND TARGETS APPENDIX APPROACH TO RISK MANAGEMENT 45 TABLE 15: EXAMPLES OF HOW CLIMATE-RELATED RISKS MAY EMERGE BY RISK CATEGORIES MAJOR RISK CATEGORIES CLIMATE RISK TYPES PHYSICAL RISK TRANSITION RISK LIABILITY RISK POTENTIAL IMPACT ON THE GROUP Capital Adequacy Risk Higher capital requirements due to credit risk from increasing extreme climate events. Increased capital may be required to support finance to emissions-intensive sectors. Regulatory action with potential capital overlays for climate-related risks. We fail to meet capital requirements due to unexpected credit losses or other operational costs. Funding and Liquidity Risk An increase in funding required to support customers impacted by extreme climate events or liquidity to meet the bank's prudential obligations. Reduced access to funding markets or higher borrowing costs if the bank does not meet market expectations on its reporting or its actions. Regulatory action due to weaker funding and liquidity position. We fail to obtain funding, or pay higher costs due to unexpected market shocks or credit rating downgrades. Credit Risk Higher probability of default and/or loss given default related to climate events – includes lower security and/or under/no insurance (in high risk areas). Business cashflows may be impacted (increasing credit risk) for industries impacted by the transition, including from political or regulatory change, customer demand or technology. Legal action from financing decisions that do not consider climate risks. Higher credit losses and capital requirements related to climate change. Examples include: Customers downgraded/ defaulting; lower security values in impacted areas; stranded assets; under/no insurance. Market Risk Higher volatility and/or reduction in market prices of assets due to extreme climate events. Market volatility from regulatory change or shifts in demand to more sustainable practices. Impacts asset values from changes in sentiment on climate issues. Regulatory action from failing to respond to volatility which impacts financial stability. Climate change impacts may contribute to higher market volatility and take losses from unexpected market and asset price movements. Which in turn could impact our earnings and balance sheet. Strategic Risk Not considering the physical impacts of climate change on our operations, customers and service providers. And therefore not investing in mitigation. Lost revenue by not being positioned to lend to significant climate change opportunities. Not considering sector or geographic changes related to climate change. Litigation risks from failure to consider climate risks in our strategy or failure to execute against our disclosed forward-looking statements. Failure to integrate the management of climate change into strategy exposes the Group to unmitigated risks, and lost opportunities. Operational Risk Damage to infrastructure, facilities, or IT systems, and/or disruptions in supply chains due to extreme weather events. Increased costs to comply with climate regulations or implementing sustainable practices. Litigation risks from failure to comply and address climate risks. Failure to implement climate change resilience measures results in heightened chance of business disruption, and risks to people and infrastructure. Compliance and Conduct Risk Severe climate events may cause disruption to banking operations impacting service delivery and customer outcomes. Failure to update processes and products to address climate-related risks. Could lead to reduced competitiveness, higher customer acquisition costs or poor service. Inaccurate or misleading presentation of sustainability credentials which can give rise to greenwashing claims. Failure to comply with regulations and standards related to climate change potentially leading to poor customer outcomes, fines, penalties, capital imposts, or legal action. Reputation and Sustainability Risk Increased exposure to environmental and social harm from chronic impacts on living and working conditions; damaged ecosystems and infrastructure. Heightened standards to meet customer and investor expectations on financing decisions, policies and strategies for carbon-intensive sectors. Increasing legal, market and regulatory standards and requirements for climate risk related actions, reporting and disclosures. We fail to effectively implement and convey our strategy for handling climate-related risks; fail to meet regulatory or stakeholder expectations, and misstate climate change commitments or targets. WESTPAC GROUP 2024 CLIMATE REPORT |
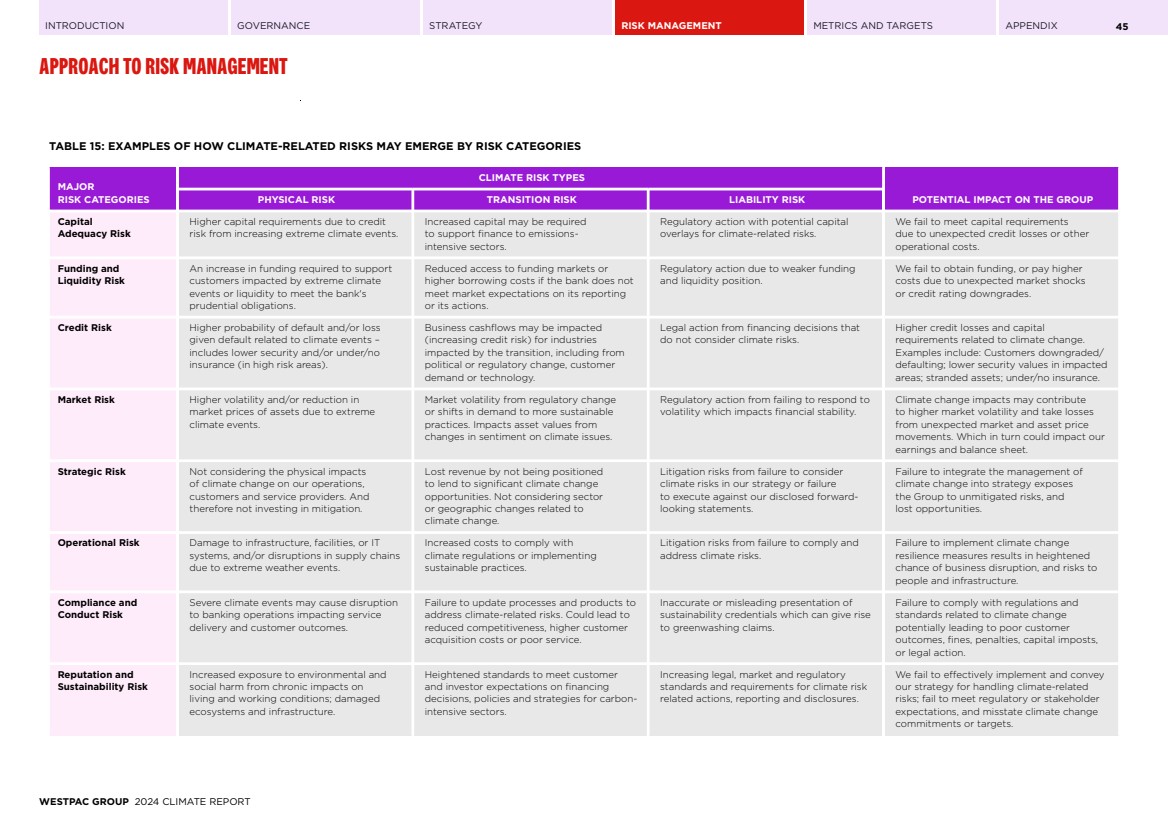
| INTRODUCTION GOVERNANCE STRATEGY RISK MANAGEMENT METRICS AND TARGETS APPENDIX 46 MANAGING CLIMATE-RELATED RISKS IN LENDING Our appetite for climate-related risk is defined in our Board Risk Appetite Statement. It includes measures of physical and transition risks and is evaluated and reviewed twice a year. We have processes for assessing and reviewing significant customers and transactions for ESG and climate-related risks. The Group ESG Credit Risk Policy forms part of our credit risk assessment process and requires the completion of an ESG-related risk assessment prior to approving finance, and at periodic reviews, for certain customers and transactions. Our Business and Institutional bankers, supported by ESG specialists, complete these assessments. Transactions may also be escalated to a Customer and Transaction Risk Escalation Committee (CTREC) comprising experienced executives including from sustainability and risk management. CTREC considers transactions for ESG, reputational risk, conflicts and financial crime risk and ensures they consider our sector positions and NZBA sector targets. The Chief Executive of the respective division (or the delegated General Manager in WNZL) has authority to approve a transaction to proceed within delegation or escalate to the ESG and Reputation Committee and/or the CEO. Climate-related scenario analysis Scenario analysis informs how we assess and manage climate-related risks over the short, medium and long-term. We use climate-related scenario analysis and stress testing to better understand the impact of climate on our lending portfolio and exposure to emissions-intensive sectors. We also use science-based reference scenarios to help understand the sectoral decarbonisation pathways and targets to transition to net-zero by 2050. Climate scenario analysis and climate stress testing is an evolving area, and we need to expand the coverage of our analysis and improve the inputs into our models. Westpac considers a broad range of scenarios when conducting scenario analysis. These scenarios are assessed to ensure an appropriate combination of data granularity, plausibility, comparability and risk severity. Effective scenario analysis should cover a wide range of plausible impacts, comply with national and international disclosure standards and support informed decision making. Westpac uses three scenarios as the basis for its analysis. These scenarios are: 1. Net-Zero: an orderly, low carbon transition where global emissions reach net-zero by 2050. This scenario is appropriate for assessing the resilience of the Group's business model as it aligns to the stated goal of the Paris agreement. 2. Disorderly Transition: a delayed, low carbon transition where global emissions reach net-zero by 2050 with limited policy action prior to 2030. This scenario is appropriate for assessing the resilience of the Group’s business model as it involves more severe transition risks. 3. Current Policies: a limited transition occurs aligned to existing policies, with emissions following a business-as-usual trajectory throughout this century. This scenario is appropriate for assessing the resilience of the Group's business model as it involves a severe physical risk scenario. Scenarios are reviewed annually, to consider changes in data or major industry updates. We currently rely on publicly available scenarios, although in the future we expect to develop bespoke scenarios that are aligned to our business and provide more relevant outputs. TABLE 16: CLIMATE-RELATED SCENARIOS AND KEY ASSUMPTIONS KEY ASSUMP-TIONS NET-ZERO DISORDERLY TRANSITION CURRENT POLICIES Temperature trajectory 1.5°C ~1.8°C >3°C Policy response Immediate, smooth and orderly transition to net-zero by 2050 Business as usual response to 2030, followed by immediate and disorderly transition to net-zero by 2050 Limited response beyond existing policies Transition risk High High Low Physical risk Low Moderate High Scenario data input - transition risk NGFS (phase 4) Net Zero 2050 NGFS (phase 4) Delayed Transition NGFS (phase 4) Current Policies Scenario data input - physical risk IPCC RCP2.6 IPCC RCP4.5 IPCC RCP8.5 WESTPAC GROUP 2024 CLIMATE REPORT |
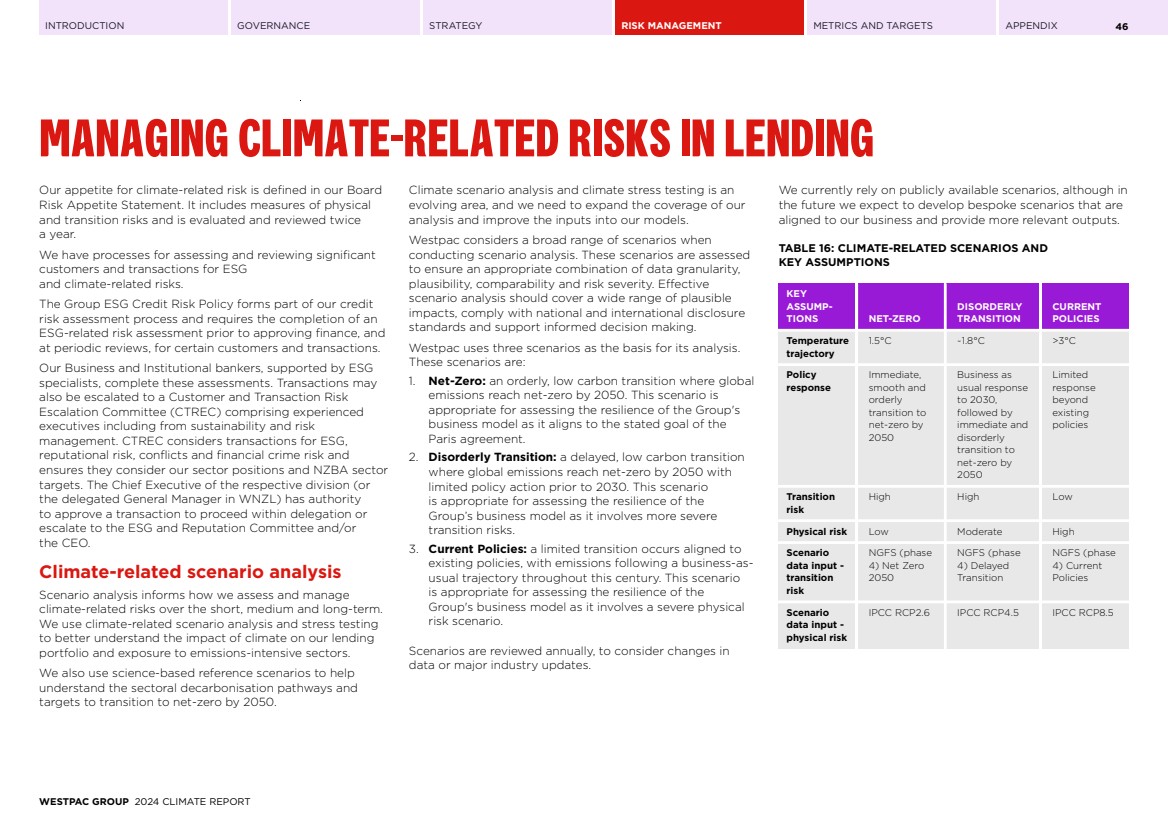
| INTRODUCTION GOVERNANCE STRATEGY RISK MANAGEMENT METRICS AND TARGETS APPENDIX MANAGING CLIMATE-RELATED RISKS IN LENDING 47 The boundary used in our scenario analyses depends on the type of analysis. For example, assessing physical risk for our Australian mortgage portfolio limits the scope to domestic mortgage lending. For information on our climate scenarios including the inputs and assumptions, refer to Section IV Climate Scenario Analysis Approach in our Supplement . In FY24, we have: • Acquired additional climate data for physical risk analysis in our residential and commercial real estate portfolios. • Expanded the data used, including geospatial information to better analyse regional climate impacts. • Established a Climate Analytics team to further develop the Bank's climate scenario analysis capability. • Implemented a new scenario selection process, which considers the latest science and suite of scenarios available and allows us to choose scenarios with the appropriate combination of data granularity, risk severity and pathway plausibility. • Reviewed our transition risk methodology to better capture how climate-related policy, technology and market changes affect the sectors we lend to. • Performed additional physical risk analysis on our mortgage portfolio, including procuring complementary physical peril data. • Commenced analysis of insurance affordability and availability across our mortgage lending portfolio. • Commenced analysis on the intersection between climate and social risk, identifying regions that are socioeconomically vulnerable to climate change risks. In FY25, we plan to further build our scenario analysis capability, broaden our data sources and improve alignment with new reporting standards. Climate Time Horizons In FY24, we established a consistent definition of short-term, medium-term, and long-term Climate Time Horizons to form the foundation of future assessments and reporting of climate-related risks and opportunities. TABLE 17: HORIZONS FOR ASSESSING CLIMATE-RELATED RISKS AND OPPORTUNITIES HORIZON YEARS Short-term Less than 1 year Medium-term 1 to <5 years Long-term 5 years and more In determining these time horizons we took into consideration the following factors: • Our short-term horizon of less than 1 year aligns with our annual business forecast cycle, is generally accepted in planning considerations and is consistent with short-term variable reward timelines. • Our medium-term horizon of 1 to less than 5 years aligns with our stress testing horizons, our Board Strategy Review (BSR) cycle (3 to 5 years) and our Internal Capital Adequacy Assessment Process (ICAAP) of 3 years. It also has the potential to align with long-term variable rewards. • Our long-term horizon of greater than 5 years is on the outer range of our BSR planning cycle and also covers the potential time periods that significant climate risks may emerge. Physical risk in the Australian mortgage portfolio Every six months we update the physical risk scenario analysis of our Australian residential mortgage portfolio. The analysis estimates the portion of our mortgages exposed to higher physical risks under climate scenarios developed by the IPCC. The analysis uses a generalised model of how extreme natural disasters and climate change may impact individual properties. Features of the analysis are detailed in the table below. TABLE 18: FEATURES OF AUSTRALIAN MORTGAGES SCENARIO ANALYSIS FEATURES OF ANALYSIS APPROACH Physical climate scenarios • IPCC RCP2.6 • IPCC RCP8.5 Portfolio approach Current and static portfolio composition into 2050. Temporal resolution 5-year periods, reported as at 2050. Spatial resolution Asset address level. Building assumptions Current building codes with no adaptation or mitigation. Perils assessed Flood, Forest Fire, Cyclone, Wind, Soil Movement. WESTPAC GROUP 2024 CLIMATE REPORT |
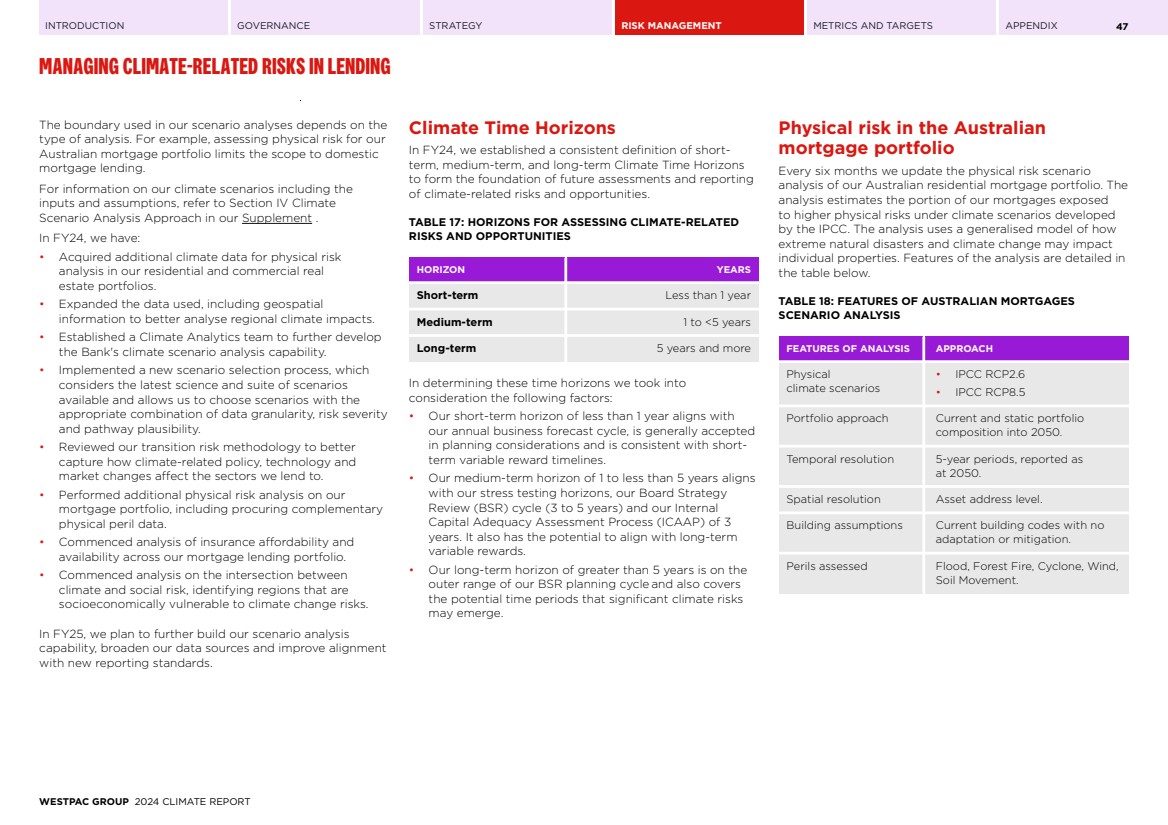
| INTRODUCTION GOVERNANCE STRATEGY RISK MANAGEMENT METRICS AND TARGETS APPENDIX MANAGING CLIMATE-RELATED RISKS IN LENDING 48 We have deepened our understanding of physical risk in our Australian mortgages portfolio with our analysis showing that around 4.1% of the portfolio is exposed to higher physical risk under RCP2.6 scenario by 20501 .. This increases to around 4.5% under the RCP8.5 scenario. This scenario would also likely have more significant impacts on our portfolio given the implied temperature changes. Table 19 outlines this outcome and shows the characteristics of these elements of our portfolio. This analysis informs our risk appetite settings and helps us to provide insights to governments and other stakeholders around physical risks. Refer to Glossary (page 58) for more information on the RCPs. TABLE 19: AUSTRALIAN MORTGAGES SCENARIO ANALYSIS1 SCENARIO % OF MORT-GAGE PORT-FOLIOa DYNAMIC LVR WEIGHTED AVERAGEb % OF PORT-FOLIO >90% DLVRc 90+ DAY DELIN-QUENCIES (%) IPCC RCP2.6 4.1% 48.29% 1.67% 1.14% IPCC RCP8.5 4.5% 48.16% 1.64% 1.11% a. Share of Australian mortgage portfolio as at 31 August 2024 in locations identified as likely to be exposed to higher physical risks under RCP2.6 and RCP8.5 scenarios by 2050. b. Dynamic LVR is the loan-to-value ratio accounting for the current loan balance, changes in security value, offset account balances and other loan adjustments. The property valuation source is CoreLogic. Weighted average LVR calculation considers the size of outstanding balances. More information on Westpac’s mortgage portfolio is provided in our Investor Discussion Pack. c. DLVR is the dynamic loan-to-value ratio. Looking ahead, we have initiated further analysis to improve our understanding of which regions are most exposed to physical perils, such as bushfires, floods and cyclones as well as the risk drivers behind each peril. Additionally we have commenced analysis to better understand areas facing the growing issue of unaffordable or unavailable insurance. The outcomes from this analysis will be reflected in future analysis. Assessing physical risks in other portfolios In FY24, we commenced an initial physical risk assessment of over 20,000 commercial real estate assets, including offices, mixed and industrial asset types. As part of this assessment we developed our geospatial capability and built our understanding of the perils that can damage an asset and impact its ability to operate. This data will improve our understanding of climate risks in the commercial real estate portfolio and potentially help our customers to better understand their peril exposure and potential mitigants. In FY24, we commenced an engagement to geolocate rural assets in our Agribusiness portfolio and develop modelling for how farm productivity could be impacted by different climate change scenarios. This process improved our understanding of how geospatial data could be used for the management of risk. We are now considering how this analysis can be extended to cover other matters including assessing nature-related risks and opportunities. Physical risk in the New Zealand portfolio In 2020, we commenced a scenario analysis process in New Zealand to build our understanding of the potential impacts that coastal hazards could have on our lending portfolio. This analysis was based on current and future risks out to 2050 under climate scenarios developed by the IPCC (IPCC RCP2.6 and IPCC RCP8.5). Data in the analysis was provided by the National Institute of Water and Atmospheric Research – Taihoro Nukurangi (NIWA). Our latest analysis discloses the approximate proportion of our lending secured by properties exposed to heightened risks2 from sea-level rise for the last three years and this is in Table 20. Reflecting the diversity of our portfolio, the exposures have not changed materially over the last three years. Refer to Glossary (page 58) for more information on the RCPs. TABLE 20: NEW ZEALAND LENDING EXPOSED TO SEA-LEVEL RISE NEW ZEALAND LENDING SEGMENT APPROXIMATE % OF TCE AT HEIGHTENED RISK OF SEA-LEVEL RISE BY 2050 UNDER THE IPCC RCP8.5 SCENARIO SEP 24 SEP 23 SEP 22 Residential mortgages 2.1% 2.1% 2.1% Commercial property 4.0% 3.4% 2.1% Agriculture 3.4% 3.5% 3.4% 1 In 2024, we made changes and updates to our methodology. Care should be exercised when comparing with previous year results as they were not restated. 2 Heightened risk is defined as annual exceedance probability of 10% or more, as well as general exposure to coastal erosion under NIWA’s Coastal Sensitivity Index. WESTPAC GROUP 2024 CLIMATE REPORT |
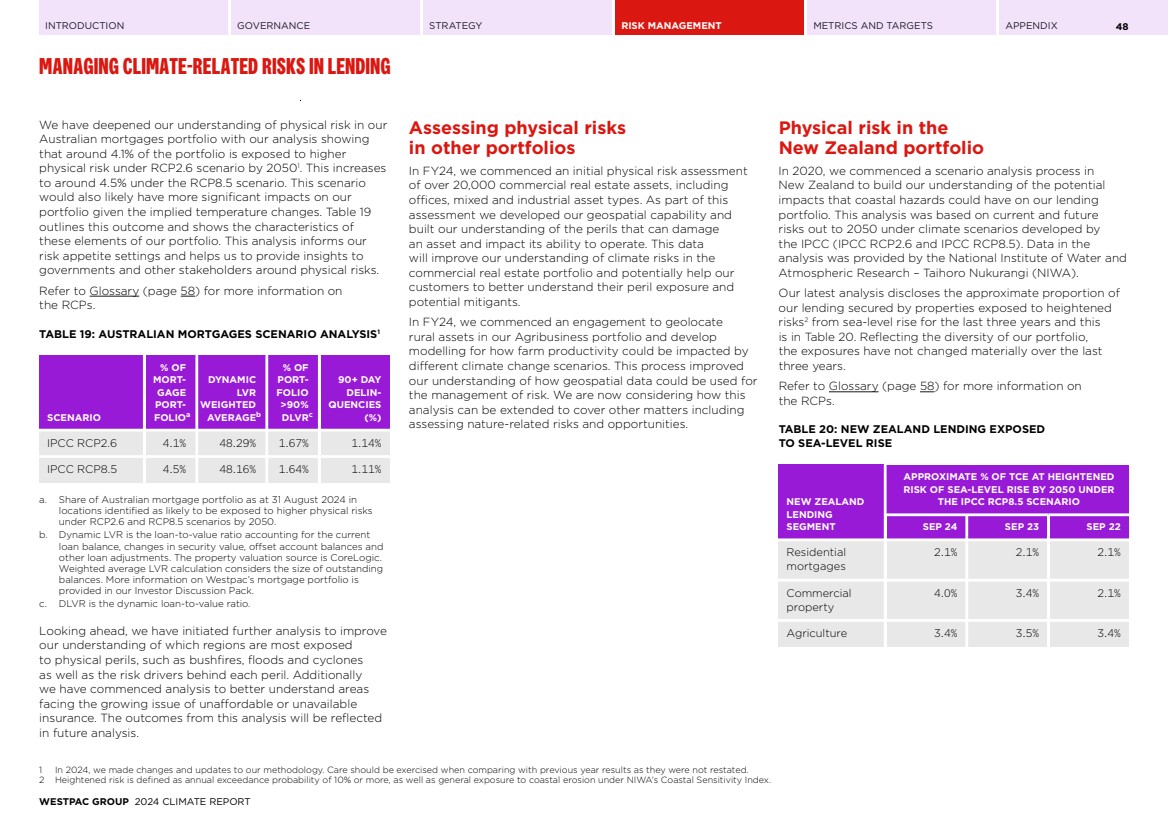
| INTRODUCTION GOVERNANCE STRATEGY RISK MANAGEMENT METRICS AND TARGETS APPENDIX MANAGING CLIMATE-RELATED RISKS IN LENDING 49 Transition risk Climate transition risks are the risks that companies face as they shift to a low-carbon economy. These risks arise from changes in polices, regulation, technologies and market conditions aimed at reducing GHG emissions and mitigating climate change. Table 21 details our total Group TCE disaggregated by industry. Within the table we highlight industries (using a lighter shade of pink) that may be exposed to higher transition risks. These sectors include the NZBA priority sectors, along with chemical manufacturing. We aggregate all our retail lending into a single line with a disaggregation for housing loans. This breakdown of potential transition risks is high level and indicative only, as transition risks may impact industries, geographies and companies in different ways and to varying degrees. There will also be some sectors, or companies, exposed to transition risks that are not in the table. At 30 September 2024, our exposure to industries that may be exposed to higher transition risk was approximately $137.4 billion, an increase of approximately 6.3% from $129.3 billion at 30 September 20231 .. We are currently expanding our analysis of transition risk within our business and institutional portfolios. This new framework will consider changes in policy, technological disruption, impacts to capital, supply chain disruption and changing patterns of consumption. This analysis should assist us to consider the strategies to manage, mitigate, and report on our risk exposure while maintaining our support for customers. 1. In 2024, comparatives have been revised to conform with current year presentation. TABLE 21: GROUP TOTAL COMMITTED EXPOSURE (TCE) BY INDUSTRY ($M)1 INDUSTRY SEP 24 SEP 23 Accommodation, cafes and restaurants 11,748 10,825 Agriculture, forestry and fishing 25,414 24,103 Dairy 7,189 7,132 Beef and sheep 9,869 9,079 Construction 13,733 12,940 Finance and insurance 162,805 202,122 Government, administration and defence 118,877 78,979 Manufacturing 25,371 24,671 Aluminium 805 644 Cement and Concrete and Iron and Steel 2,311 2,539 Oil and Gas refining 331 682 Petroleum, Coal, Chemical and Associated Product Manufacturing 2 2 Organic Industrial Chemical Manufacturing 7 6 Chemical Product Manufacturing 291 261 Mining 7,885 8,080 Coal mining 161 253 Metallurgical coal mininga 38 43 Metallurgical coal mining in diversified minersa 97 146 Thermal coal mininga 25 65 Oil and Gas Exploration 4 5 Oil and Gas Extraction and Terminals 1,764 2,434 Iron Ore 1,147 1,697 Property 85,543 80,704 Property services and business services 25,151 22,954 Servicesb 25,922 26,424 INDUSTRY SEP 24 SEP 23 Tradec 31,827 31,006 Oil and Gas distribution and retail 2,972 2,620 Fuel retailing 488 664 Transport and storage 20,672 18,262 Coal portsa 386 309 Transport – Aviation 1,513 1,377 Transport – Marine Transport 105 135 Transport – Rail Transport (incl. coal transport) 1,904 2,257 Transport – Road Transport 3,527 2,822 Utilitiesd 23,569 18,867 Electricity Supply 14,964 11,968 Gas Supply 2,094 1,826 Other 4,375 4,391 Total Retail lending 669,449 653,257 Housing 631,861 614,007 Total Group TCE 1,252,341 1,217,584 Total TCE to industries that may be exposed to higher transition risk 137,376 129,257 Of which, TCE to industries identified as having heightened transition risk based on 2019 assessment methodologye 6,162 6,842 a. Includes measures of TCE that are specific to Westpac Institutional Banking division. Refer to Glossary (page 58) for more information. b. Includes education, health and community services, cultural and recreational services, and personal and other services. c. Includes wholesale trade and retail trade. d. Includes electricity, gas and water, and communication services. e. Includes Petroleum and coke products (combination of Oil and Gas Refining, Petroleum, Coal, Chemical and Associated Product Manufacturing, Organic Industrial Chemical Manufacturing, and Chemical Product Manufacturing), Coal mining, Oil and gas mining (specifically, Oil and Gas Extraction and Terminals), Air Transport (i.e. Transport – Aviation), and Gas distribution (i.e. Gas Supply). Aligns to our Transition Risk Board Risk Appetite measure. As part of the methodology for transition risk scenario analysis, ANZSIC (1993) codes were used to map to specific industries. WESTPAC GROUP 2024 CLIMATE REPORT |
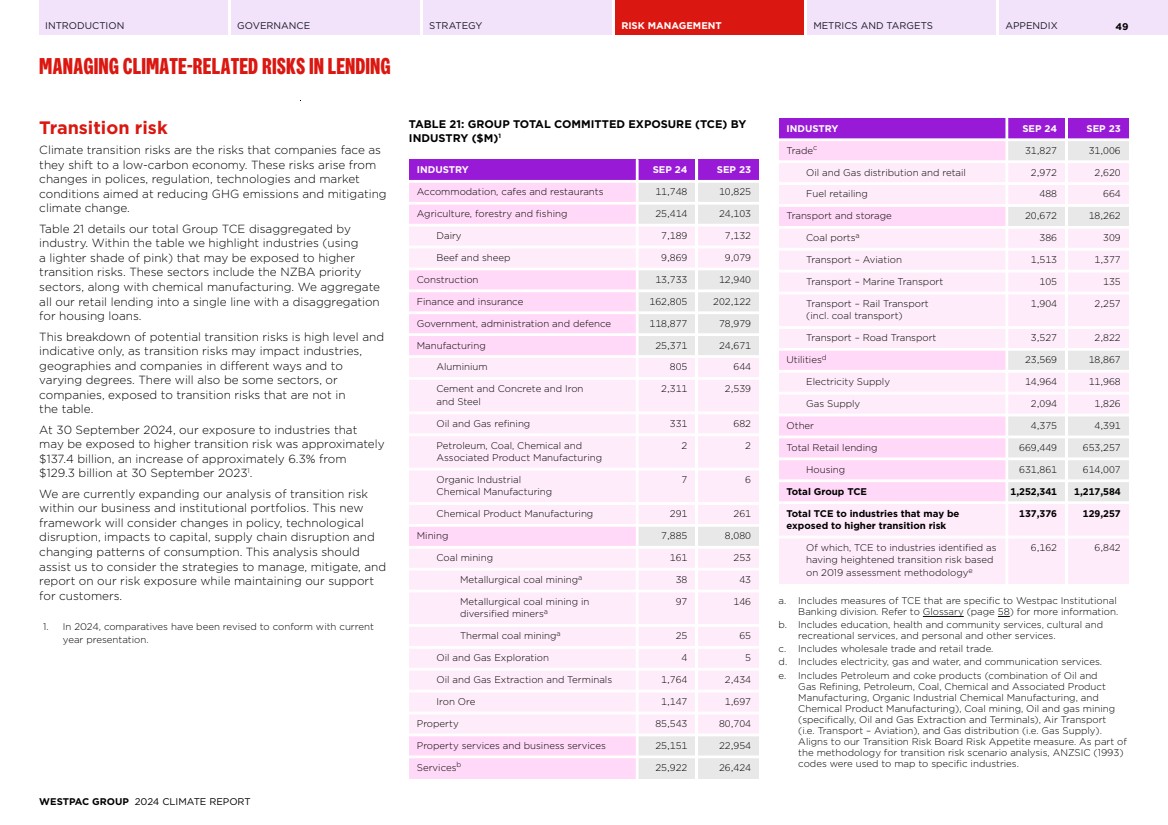
| INTRODUCTION GOVERNANCE STRATEGY RISK MANAGEMENT METRICS AND TARGETS APPENDIX MANAGING CLIMATE-RELATED RISKS IN LENDING 50 Exposure to the fossil fuel energy value chain Our TCE to industries in the fossil fuel energy value chain1 was approximately $6.8 billion at 30 September 2024, a decrease of approximately 10.6% over the prior year. TABLE 22: TCE TO INDUSTRIES IN THE FOSSIL FUEL ENERGY VALUE CHAIN ($M) INDUSTRY SEP 24 SEP 23a % CHANGE Oil and Gas Exploration 4 5 -7% Oil and Gas Extraction and Terminals 1,764 2,434 -28% Oil and Gas refining 331 682 -51% Oil and Gas distribution and retail 2,972 2,620 13% Fuel retailing 488 664 -27% Thermal coal miningb 25 65 -61% Coal portsb 386 309 25% Electricity supply (fossil fuels only: Gas; Black and Brown Coal; Liquid fuel)b 818 818 0% Total 6,788 7,597 -11% a. In 2024, comparatives have been revised to conform with current year presentation. b. Includes measures of TCE that are specific to Westpac Institutional Banking division. Refer to Glossary (page 58) for more information. Care should be taken comparing data in Table 22 with figures reported in prior years. This is because we have continued to refine the data used. In this table, ANZSIC codes were used to extract industry data which was then supplemented to create a more detailed breakdown for certain sectors (i.e. thermal and metallurgical coal mining and for coal ports). As a result, this breakdown will not align with other sector data published. Similarly, this data does not align with data used for our NZBA sector targets which typically use even more granular definitions, including to align with the NZBA guidelines. Refer to our 2024 Sustainability Index and Datasheet for more detail. ESG risk assessment tools ESG risk assessment tools are used in non-retail lending to help bankers assess ESG risks associated with customers, transactions and the activity being supported. This includes how our customers manage and mitigate these risks. If the ESG risk assessment process identifies a heightened risk, transactions may be subject to further review and due diligence and may be further escalated. The escalation process is outlined in Managing climate-related risks in lending (page 46). These tools enable our bankers to assess whether our lending is aligned to our Sustainability Risk Management Framework, Group ESG Credit Risk Policy and our sector positions. In FY24, we launched a new digital ESG risk assessment tool in our Australian business lending team that is helping to drive better engagement with our commercial customers. This new tool has been accompanied by additional training for our commercial bankers and credit managers to build their capability in understanding and managing ESG risks. Our specialist ESG teams also work closely with bankers to embed the process. Managing liability risks Liability risks stem from the potential for litigation or regulatory action that may arise if we fail to adequately consider or respond to climate-related risk, changes in law or regulation, emerging standards, or fail to meet societal expectations. These risks could arise where our actions are not perceived to align with our disclosures or commitments, or where we have potentially made an inaccurate or misleading statement. We believe transparency is important and strive to be accurate, timely and relevant in our disclosures. We apply a governance process to our disclosures which includes verification, reviews by subject matter experts, legal review, and external assurance on key metrics. Important policies and positions also require Board approval; see the Governance section for more detail. The Group Risk Management Framework includes processes to identify, assess and manage liability risks. This includes frameworks, policies, and sector positions, along with processes for monitoring changes in regulation, policy and stakeholder expectations. Any risks identified where relevant are escalated to relevant management committees. Impact of climate-related risk on our financial statements We have considered the potential risk of climate change on our financial statements including both physical risks and transition risks. We have concluded that based on the information and methodologies currently used, climate-related risks do not have a material impact on the judgements, assumptions and estimates for the year ended 30 September 2024. Key considerations in reaching this conclusion included assessing our exposure to: • High transition risk industries as a proportion of overall credit exposures; and • Physical risks that may arise from changing weather patterns and extreme weather events, with a particular focus on our housing loans. The effects of climate change represent a source of uncertainty in the medium- to long-term which may affect our financial statements in the future. Climate-related risks will continue to be monitored and assessed. Details of any provisions for expected credit losses (ECL), including overlays held in relation to physical climate-related risk, are provided in Note 10 of our Annual Report. 1 Industries include: Oil and Gas Exploration; Oil and Gas Extraction and Terminals; Oil and Gas Refining; Oil and Gas Distribution and Retail; Fuel Retailing; Thermal coal mining; Coal ports; Electricity supply (generation from fossil fuels only). WESTPAC GROUP 2024 CLIMATE REPORT |
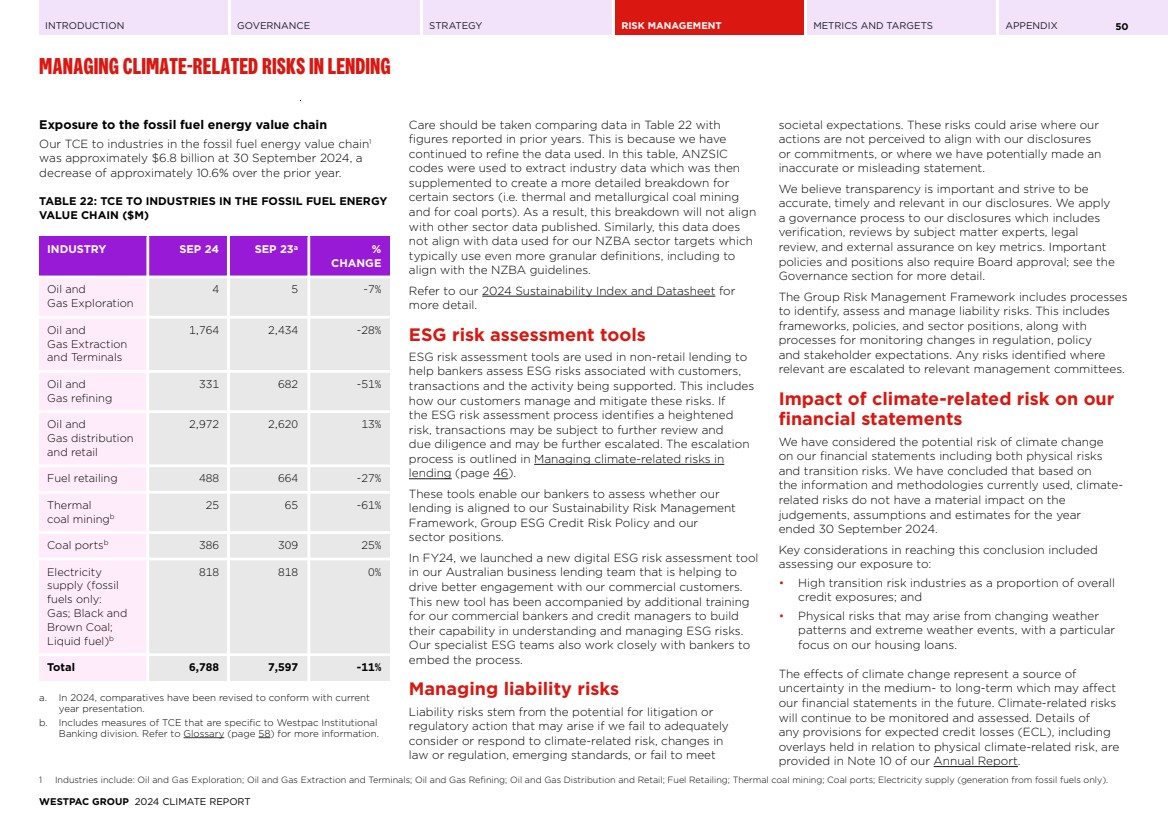
| INTRODUCTION GOVERNANCE STRATEGY RISK MANAGEMENT METRICS AND TARGETS APPENDIX 51 METRICS AND TARGETS |
| INTRODUCTION GOVERNANCE STRATEGY RISK MANAGEMENT METRICS AND TARGETS APPENDIX 52 OUR METRICS AND TARGETS This Report is structured under the four pillars of climate-related reporting: Governance, Strategy, Risk Management and Metrics and Targets. This structure also aligns with the upcoming Australian Sustainability Reporting Standard AASB S2, which applies to us from our FY26 reporting. In this Report, our various climate-related metrics and targets are integrated within other sections so are not duplicated here. This alignment supports our strategy and provides context to the commentary in those sections. We anticipate that some users of this Report will be particularly interested in the metrics commonly used across companies and industries to disclose carbon footprints as well as those related to assessed risks and opportunities. To help with this referencing we have provided the table below that lists the various cross-industry metrics and their locations within this Report. CROSS-INDUSTRY METRIC CATEGORY REFERENCE TO RELEVANT INFORMATION Scope 1 greenhouse gas emissions See page 12. Scope 2 (location-based) greenhouse gas emissions See page 12. Scope 2 (market-based) greenhouse gas emissions See page 12. Carbon offsets See page 13. Scope 3 greenhouse gas emissions – information about our scope 3 upstream emissions See page 12. Scope 3 greenhouse gas emissions – information about emissions associated with our lending (our financed emissions) See page 15. Greenhouse gas emissions measurement approach (including inputs and assumptions) Refer to Supplement available on our website. Greenhouse gas emissions measurement approach – Scope 3 categories included Refer to Supplement available on our website. Climate-related transition risks See page 49. Climate-related physical risks See pages 47-48. Capital deployment See page 42. Internal carbon prices See page 40. Remuneration See page 6. WESTPAC GROUP 2024 CLIMATE REPORT |
| INTRODUCTION GOVERNANCE STRATEGY RISK MANAGEMENT METRICS AND TARGETS APPENDIX 53 INDEPENDENT ASSURANCE STATEMENT PricewaterhouseCoopers, ABN 52 780 433 757 2 Riverside Quay, SOUTHBANK VIC 3006, GPO Box 1331 MELBOURNE VIC 3001 T: +61 3 8603 1000, F: +61 3 8603 1999, www.pwc.com.au Liability limited by a scheme approved under Professional Standards Legislation. Independent Assurance Report to the Directors of Westpac Banking Corporation The Board of Directors of Westpac Banking Corporation (‘Westpac’) engaged us to perform an independent assurance engagement in respect of the identified Subject Matter listed in Table A (the ‘Reasonable Assurance Subject Matter’) and Table B (the ‘Limited Assurance Subject Matter’) below and disclosed within the Westpac 2024 Climate Report, Westpac 2024 Sustainability Index and Datasheet and the Westpac 2024 Climate Methodologies Supplement (together the ‘Westpac 2024 Climate Reporting’). Subject Matter Table A. Reasonable Assurance Subject Matter Operational Greenhouse Gas emissions (market based) tonnes of carbon dioxide equivalent (tCO2-e) (year ended 30 June 2024) Total Scope 1 and 2 emissions 8,565 Total Scope 3 (upstream) emissions 57,655 Table B. Limited Assurance Subject Matter Energy Consumption gigajoules (GJ) (year ended 30 June 2024) Renewable electricity equivalent, globally 100 % Group Scope 3 Financed Emissions FY23 (as at 30 September 2023) Scope 1 and 2 financed emissions 26.2 MtCO2-e Scope 3 financed emissions 13.7 MtCO2-e Average data quality score 4.2 Emissions Intensity 0.048 kg CO2-e/$ Table B. Limited Assurance Subject Matter (continued) Group Scope 3 Financed Emissions by Sector FY23 (as at 30 September 2023, unless otherwise stated) Sector % of Exposure in scope of Financed Emissions % of Total Absolute Emissions (Scope 1 and 2) Accommodation, cafes & restaurants 1% 1% Agriculture, forestry & fishing 3% 28% Construction 1% 1% Finance & Insurance 10% 1% Manufacturing 3% 14% Mining 1% 4% Property (excluding secured Commercial Real Estate and Residential Mortgages) 2% 0% Property services & business services 2% 1% Services 3% 3% Trade 3% 6% Transport & storage 2% 4% Utilities 2% 19% Other 0% 0% Residential Mortgages 59% 12% Secured Commercial Real Estate 7% 3% WESTPAC GROUP 2024 CLIMATE REPORT |
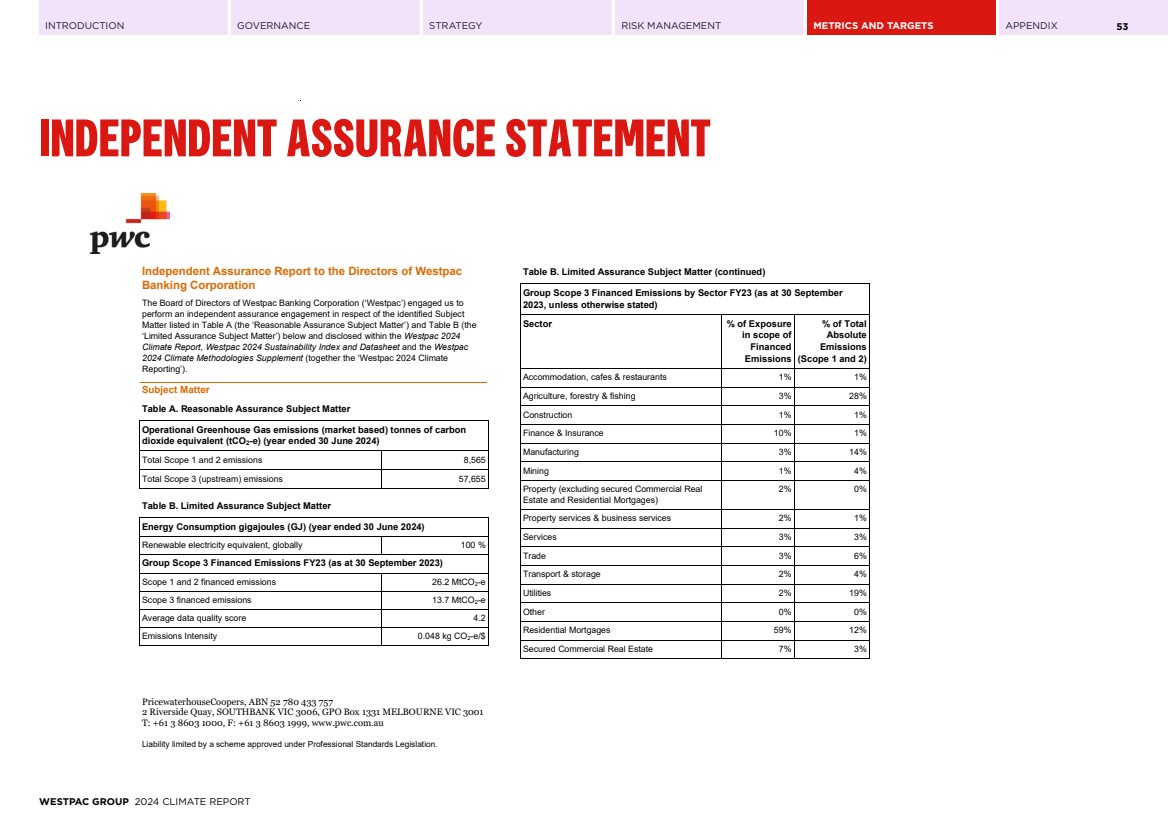
| INTRODUCTION GOVERNANCE STRATEGY RISK MANAGEMENT METRICS AND TARGETS APPENDIX INDEPENDENT ASSURANCE STATEMENT 54 2 Table B. Limited Assurance Subject Matter (continued) Industry sectors with GHG emission reduction targets (as at 30 September 2023, unless otherwise stated) Power generation – emissions intensity (tCO2-e/MWh) 0.20 Cement production – emissions intensity (tCO2-e/t of cement) 0.63 Upstream oil and gas – absolute emissions (MtCO2-e) 5.1 Thermal coal mining – absolute emissions (MtCO2-e) 0.47 Aviation (passenger aircraft operators) - emissions intensity (gCO2-e/passenger km) 105.3 Commercial real estate (Offices) – emissions intensity (kgCO2-e/m2 net lettable area) 49 Residential real estate (Australia) – emissions intensity (as at 31 August 2023) (kgCO2-e/m2 attributed floor area) 30.7 Agriculture – Australian Beef and Sheep – emissions intensity (tCO2-e/t Fresh Weight (‘FW’)) 22.55 Agriculture - Australian Dairy – emissions intensity (tCO2-e/t fat & protein corrected milk (‘FPCM’)) 0.87 Agriculture – New Zealand Beef and Sheep – emissions intensity (tCO2-e/t FW) 18.6 Agriculture – New Zealand Dairy – emissions intensity (tCO2-e/t FPCM) 0.77 Criteria We assessed the Reasonable Assurance Subject Matter and the Limited Assurance Subject Matter (together, the ‘Subject Matter’) against the Criteria. The Subject Matter needs to be read and understood together with the Criteria, being the relevant footnotes and disclosures within the Westpac 2024 Climate Report and the Westpac 2024 Climate Methodologies Supplement (together, ‘Westpac’s Climate Reporting Methodology’ or ‘the Criteria’). Responsibilities of management Westpac's management (‘management’) is responsible for the preparation of the Subject Matter in accordance with the Criteria. This responsibility includes: • determining appropriate reporting topics and selecting or establishing suitable criteria for measuring, evaluating, and preparing the underlying Subject Matter; • ensuring that those criteria are relevant and appropriate to Westpac and the intended users; and • designing, implementing, and maintaining systems, processes, and internal controls relevant to the preparation of the Subject Matter, which is free from material misstatement, whether due to fraud or error. The maintenance and integrity of Westpac’s website is also the responsibility of management; the work carried out by us does not involve consideration of these matters and, accordingly, we accept no responsibility for any changes that may have occurred to the reported Subject Matter or Criteria when presented on Westpac’s website. Our responsibilities Our responsibility is to express a reasonable assurance opinion on the Reasonable Assurance Subject Matter and a limited assurance conclusion on the Limited Assurance Subject Matter, based on the procedures we have performed and the evidence we have obtained. Our assurance opinion and conclusion are with respect to the reporting periods, or dates, relevant to each of the Subject Matter, as set out in Table A and Table B above, and do not extend to information in respect of other periods, or to any other information included in, or linked from, the Westpac 2024 Climate Report or the Westpac 2024 Climate Methodologies Supplement. Our engagement has been conducted in accordance with the Australian Standard on Assurance Engagements ASAE 3000 Assurance Engagements Other Than Audits or Reviews of Historical Financial Information and the Australian Standard on Assurance Engagements ASAE 3410 Assurance Engagements on Greenhouse Gas Statements. These standards require that we plan and perform our engagement to obtain reasonable assurance about whether the Reasonable Assurance Subject Matter above has been prepared, in all material respects, in accordance with the Criteria, and limited assurance about whether anything has come to our attention to indicate that the Limited Assurance Subject Matter has not been prepared, in all material respects, in accordance with the Criteria. WESTPAC GROUP 2024 CLIMATE REPORT |
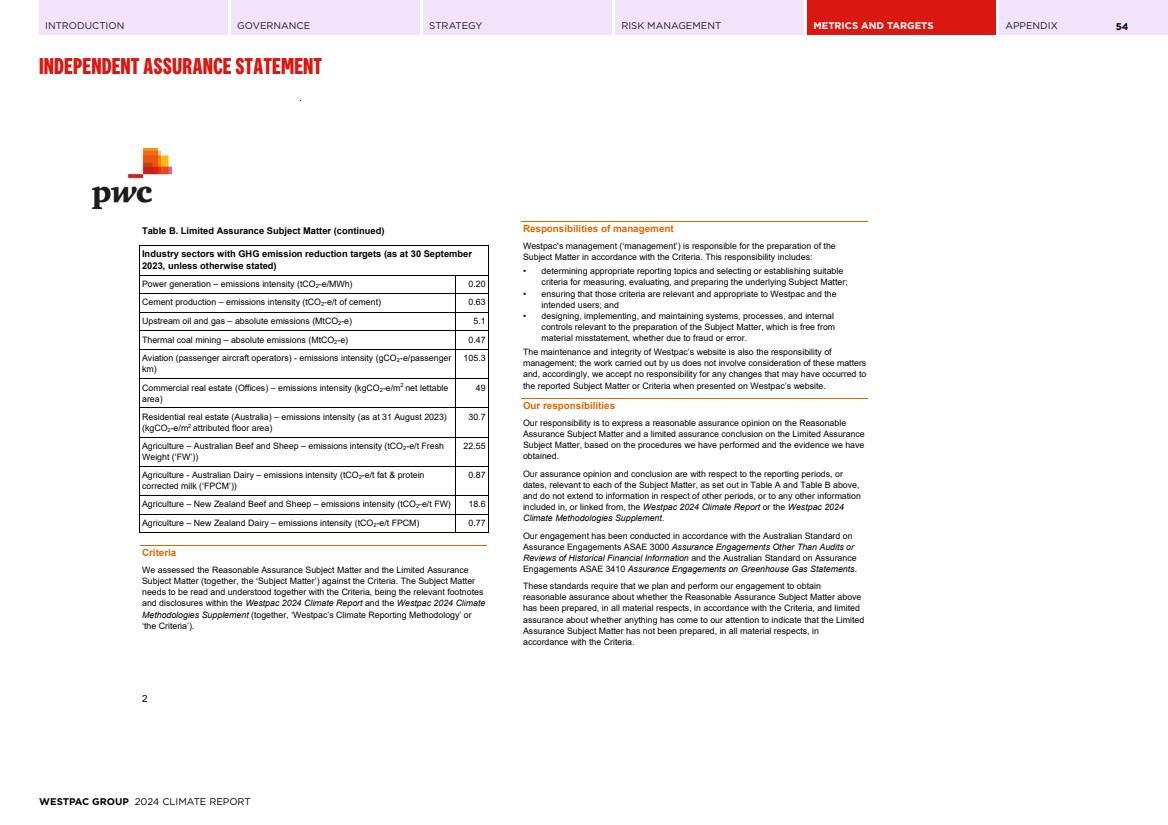
| INTRODUCTION GOVERNANCE STRATEGY RISK MANAGEMENT METRICS AND TARGETS APPENDIX INDEPENDENT ASSURANCE STATEMENT 55 3 Limited Assurance Subject Matter Aspects of the engagement were also designed to provide a limited assurance conclusion, as discussed above. The procedures performed in a limited assurance engagement vary in nature and timing from, and are less in extent than for, a reasonable assurance engagement and consequently the level of assurance obtained in a limited assurance engagement is substantially lower than the assurance that would have been obtained had a reasonable assurance engagement been performed. Accordingly, we do not express a reasonable assurance opinion on the Limited Assurance Subject Matter. In carrying out our limited assurance engagement, our procedures included: • making enquiries and assessing the design of processes and controls for capturing, collating, and reporting the performance data within the Subject Matter; • agreeing the Subject Matter to underlying data sources on a sample basis; • testing the arithmetic accuracy of a sample of calculations of the Subject Matter; • reviewing a sample of relevant management information and documentation supporting the Subject Matter; • assessing the appropriateness of a sample of estimates and assumptions applied by management; • undertaking analytical procedures over a sample of the Subject Matter; and • reviewing the Subject Matter to assess whether it has been prepared as described in the Criteria. We believe that the evidence we have obtained is sufficient and appropriate to provide a basis for our conclusion. Reasonable Assurance Subject Matter Aspects of the engagement were designed to provide a reasonable assurance conclusion, as discussed above. A reasonable assurance engagement involves performing procedures to obtain evidence about the Reasonable Assurance Subject Matter. The nature, timing and extent of procedures selected depend on professional judgement, including the assessment of risks of material misstatement, whether due to fraud or error, in the Reasonable Assurance Subject Matter. In making those risk assessments, we considered internal control relevant to Westpac’s preparation of the Reasonable Assurance Subject Matter. For the reasonable assurance engagement assurance procedures undertaken, in addition to those detailed above for the Limited Assurance Subject Matter, included: • use of larger sample sizes for substantive tests undertaken on a sample basis; and • testing the operating effectiveness of controls relied upon for assurance purposes. We believe that the evidence we have obtained is sufficient and appropriate to provide a basis for our reasonable assurance opinion. Inherent limitations Inherent limitations exist in all assurance engagements due to the selective testing of the information being examined. It is therefore possible that fraud, error, or non-compliance may occur and not be detected. Additionally, non-financial data may be subject to more inherent limitations than financial data, given both its nature and the methods used for determining, calculating, and estimating such data. The precision of different measurement techniques may also vary. The absence of a significant body of established practice on which to draw to evaluate and measure non-financial information allows for different, but acceptable, evaluation and measurement techniques that can affect comparability between entities and over time. In addition, greenhouse gas emissions quantification is subject to inherent uncertainty because of evolving knowledge and information used to determine emissions factors and the values needed to combine emissions of different gases. We specifically note that Westpac has used estimates, assumptions, or extrapolated information in the calculation of both the estimated financed emissions of its lending portfolio and the baselines and performance for its NZBA sector targets. It is acknowledged by stakeholders globally, including regulators, that there are significant limitations in the availability and quality of greenhouse gas emissions data from third parties, resulting in the extensive use of proxy data. This limitation has resulted in the Partnership for Carbon Accounting Financials (‘PCAF’) establishing a data quality score to assist in understanding the source of data which is incorporated into the Westpac’s Climate Reporting Methodology. This document details the quality of the data Westpac has used in the calculation of both its financed emissions information and the baselines and performance for its NZBA sector targets, which varies across its TCE portfolio reflecting sector or asset-specific data limitations. It is important to read this report in the context of the Westpac 2024 Climate Report and the Westpac 2024 Climate Reporting Methodologies Supplement. WESTPAC GROUP 2024 CLIMATE REPORT |
| INTRODUCTION GOVERNANCE STRATEGY RISK MANAGEMENT METRICS AND TARGETS APPENDIX INDEPENDENT ASSURANCE STATEMENT 56 4 It is anticipated that the principles and methodologies used to measure and report the Limited Assurance Subject Matter will develop over time and may be subject to change in line with market practice and regulation, impacting comparability year-on-year. The opinion and conclusion expressed in this report have been formed on the above basis. Our independence and quality control We have complied with the ethical requirements of the Accounting Professional and Ethical Standard Board's APES 110 Code of Ethics for Professional Accountants (including Independence Standards) relevant to assurance engagements, which are founded on fundamental principles of integrity, objectivity, professional competence and due care, confidentiality, and professional behaviour. Our firm applies Australian Standard on Quality Management ASQM 1, Quality Management for Firms that Perform Audits or Reviews of Financial Reports and Other Financial Information, or Other Assurance or Related Services Engagements, which requires the firm to design, implement and operate a system of quality management including policies or procedures regarding compliance with ethical requirements, professional standards and applicable legal and regulatory requirements. Other Information The Board of Directors of Westpac also engaged us to perform a limited independent assurance engagement in respect of the emissions intensity for its NZBA sector target for the Aluminium sector (baseline) and Steel production sector, as at 30 September 2023. As Westpac have elected not to disclose the baseline and/or performance for these sectors, given the small number of customers and to ensure their confidentiality, we have provided a separate report in relation to this subject matter to the Board of Directors. Use and distribution of our report We were engaged by the board of directors of Westpac on behalf of Westpac to prepare this independent assurance report having regard to the criteria specified by Westpac and set out in this report. This report was prepared solely for Westpac to assist Westpac’s members in assessing whether the directors have discharged their responsibilities, by commissioning an independent report in connection with the Subject Matter. We accept no duty, responsibility or liability to anyone other than Westpac in connection with this report or to Westpac for the consequences of using or relying on it for a purpose other than that referred to above. We make no representation concerning the appropriateness of this report for anyone other than Westpac and if anyone other than Westpac chooses to use or rely on it they do so at their own risk. This disclaimer applies to the maximum extent permitted by law and, without limitation, to liability arising in negligence or under statute and even if we consent to anyone other than Westpac receiving or using this report. Reasonable Assurance Opinion In our opinion, in all material respects, Westpac has prepared the Reasonable Assurance Subject Matter, in accordance with the Criteria for the reporting periods, or dates, as set out in Table A above. Limited Assurance Conclusion In addition, based on the procedures we have performed, as described under ‘Our responsibilities’ and the evidence we have obtained, nothing has come to our attention that causes us to believe that the Limited Assurance Subject Matter, has not been prepared, in all material respects, in accordance with the Criteria for the reporting periods, or dates, as set out in Table B above. PricewaterhouseCoopers Adam Cunningham Melbourne Partner 3 November 2024 WESTPAC GROUP 2024 CLIMATE REPORT |
| INTRODUCTION GOVERNANCE STRATEGY RISK MANAGEMENT METRICS AND TARGETS APPENDIX 57 APPENDIX CONTENTS I GLOSSARY 58 II NZBA SECTOR EMISSIONS TARGETS 61 III CLIMATE-RELATED POSITIONS AND PARTNERSHIPS 66 IV DISCLAIMER 67 |
| INTRODUCTION GOVERNANCE STRATEGY RISK MANAGEMENT METRICS AND TARGETS APPENDIX 58 APPENDIX I. GLOSSARY TERM DEFINITION ANZSIC Australia New Zealand Standard Industrial Classification Australia’s National Greenhouse Accounts (NGA) A series of reports and databases that estimate and account for Australia’s greenhouse gas emissions. The 2021 accounts cover the period 1990 to 2021. Source: Department of Climate Change, Energy, the Environment and Water (DCCEEW), National Greenhouse Accounts 2021 (2023). CO2 Carbon dioxide CO2-e Carbon dioxide equivalent. The amount of CO2 emission that would cause the same integrated radiative forcing or temperature change, over a given time horizon, as an emitted amount of a GHG or a mixture of GHGs. Source: IPCC, Special Report: Global Warming of 1.5°C, Annex I: Glossary (2018). CSIRO Commonwealth Scientific and Industrial Research Organisation Dairy Australia The national services body for the Australian dairy industry, funded by a combination of levies paid by dairy farmers and matching payments from the Commonwealth Government for eligible research and development (R&D) activities. Source: Dairy Australia (2023). Data quality score Reflects the level of uncertainty in the data inputs for financed emissions estimation using a scale of 1 to 5, with the lowest scores assigned to more accurate and specific company/property-level inputs while the highest scores are assigned to less specific inputs more reliant on assumptions and proxy data such as industry averages. Diversified company Customer with operations across multiple segments which are subject to multiple NZBA 2030 sector targets, where TCE >$100 million and when the segment reporting is available, and in scope segment revenue is >10% of total parent group revenues (except for thermal coal which is 5%). ESG Environmental, Social and Governance TERM DEFINITION EVIC Enterprise Value Including Cash is a measure of a company’s total value for the purposes of estimating Group financed emissions. Where available, EVIC is the company’s enterprise value based on total market capitalisation without deduction of cash or cash equivalents. Otherwise, and for setting NZBA 2030 sector targets, EVIC is defined as Shareholder Funds + Total Debt. Fat and protein corrected milk (FPCM) Standard used for comparing milk with different fat and protein contents, to allow better comparison between farms and regions, reducing the difference between breeds or feeding regimes. Sources: • Christie K. M., Gourley C. J. P., Rawnsley R. P., Eckard R. J., Awty I. M. (2012) Whole-farm systems analysis of Australian dairy farm greenhouse gas emissions. Animal Production Science 52, 998-1011; • Mancilla-Leyton, J.M., Morales-Jerrett, E., Delgado-Pertinez, M. & Mena, Y. (2021). “Fat- and protein corrected milk formulation to be used in the life-cycle assessment of Mediterranean dairy goat systems”. Livestock Science. 253, (1.4). IPCC Intergovernmental Panel on Climate Change Labelled Sustainable Finance (including labelled lending or bond facilitation) Finance explicitly designated as supporting environmentally and socially sustainable activities through specific sustainability labels or certifications, as defined in industry standards, principles and guidance. Examples include principles issued by the International Capital Markets Association (ICMA) and Loan Market Association (LMA)/Asia Pacific Loan Market Association (APLMA)/Loan Syndication Trading Association (LSTA). Labelled sustainable lending also includes Westpac labelled products, whereby the programsa have been assured or verified by an independent, external review provider as aligning with relevant industry standards, principles and guidance, and/or aligns with our Taxonomy Criteria, with any updates assured or verified within a reasonable timeframe. WESTPAC GROUP 2024 CLIMATE REPORT |
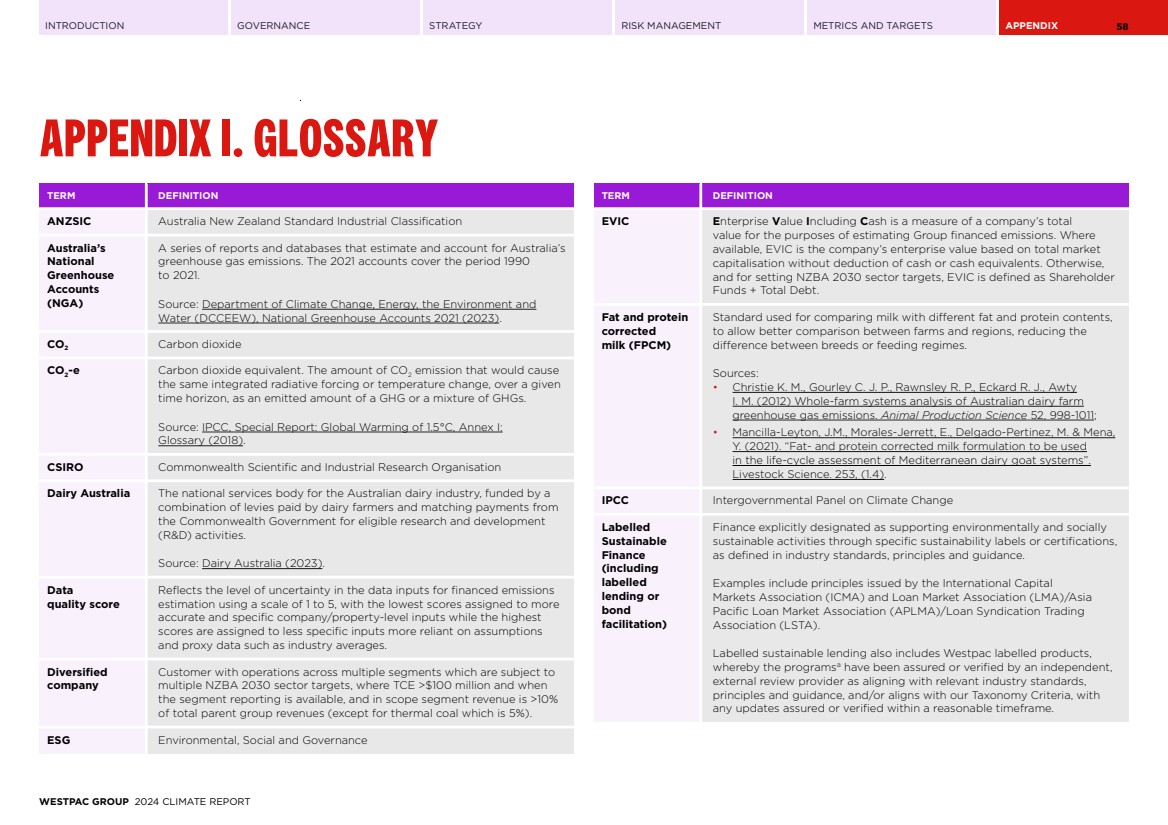
| INTRODUCTION GOVERNANCE STRATEGY RISK MANAGEMENT METRICS AND TARGETS APPENDIX APPENDIX I. GLOSSARY 59 TERM DEFINITION Natural forest A forest that is a natural ecosystem, possessing many or most of the characteristics of a forest native to the given site, including species composition, structure, and ecological function. Natural forests include: (i) Primary forest that have been subject to major human impacts in recent history. (ii) Regenerated forest that were subject to major impacts in the past (for instance by agriculture, livestock raising, tree plantations, or intensive logging) but where the main causes of impact have ceased or greatly diminished and the ecosystem has attained structure, function and composition of a natural forest. (iii) Managed natural forests where much of the ecosystem’s composition, structure, and ecological function exist in the presence of activities such as harvesting of timber or small scale cultivation. (iv) Forests that have been partially degraded by anthropogenic or natural causes (e.g. harvesting, fire, climate change, invasive species, or others) but where the land has not been converted to another use and where degradation does not result in the sustained reduction of tree cover below the thresholds that define a forest or loss in structure, function or composition. The categories “natural forest” and “tree plantation” are mutually exclusive, though in some cases the distinction may be nuanced. Source: Accountability Framework Initiative, The Accountability Framework Core Principles (2023). NGER The National Greenhouse and Energy Reporting (NGER) scheme, established by the National Greenhouse and Energy Reporting Act 2007 (NGER Act), is a single national framework for the reporting and dissemination of company information about location-based greenhouse gas emissions, energy production, and energy consumption in Australia. No deforestation commitment As part of our NZBA 2030 sector targets for the Agriculture sector, we are committed to no deforestation, which provides for no further conversion of natural forest to agricultural land use within farm systems from 31 December 2025 for customers in scope of the targets. NZBA Net-Zero Banking Alliance. NZSIOC New Zealand Standard Industrial Output Categories. Oceania Dairy/Beef Commodity Land Management pathway, 2022 Refers to the regional (Oceania) and commodity specific (Dairy or Beef) Land Management emissions intensity data that underlies the SBTi FLAG tool. The pathways are from the IMAGE model presented by Smith, et al (2016). ‘Science-Based GHG Emissions Targets for Agriculture and Forest Commodities.’ University of Aberdeen, Ecofys, and PBL. TERM DEFINITION Operational emissions GHG emissions generated from our operations including: • Our direct scope 1 emissions from controlled facilities (such as refrigerants, stationary energy (natural gas, diesel, LPG), transport energy, and fleet fuels); • Our indirect scope 2 emissions associated with the generation of energy we have purchased (such as purchased electricity); and • Our indirect scope 3 upstream emissions related to relevant sources from our operations and supply chain (such as employee commute and working from home; 3rd party electricity data centres and ATMs; electricity T&D losses; air travel, taxis and couriers; base building electricity; paper consumption and disposal; and, waste to landfill). PCAF Partnership for Carbon Accounting Financials. PCAF Standard PCAF’s Global GHG Accounting and Reporting Standard: Part A – Financed Emissions 2nd edition. Representative concentration pathways (RCPs) A set of pathways developed by the Intergovernmental Panel on Climate Change (IPCC) that reflect different levels of emissions and greenhouse gas concentrations in the atmosphere. Higher concentration levels are associated with higher estimated global surface temperatures and therefore increased effects of climate change. They are expressed as RCPy, where ‘y’ refers to the level of radiative forcing (in watts per square metre, or W/m2 ) resulting from the scenario in the year 2100. • RCP2.6 – represents a stringent emissions reduction pathway that is likely to keep temperatures below 2°C by 2100. • RCP4.5 – represents an intermediate scenario where temperatures are likely to exceed 2°C by 2100. • RCP8.5 – represents a higher emissions scenario where there are no additional efforts to constrain emissions. We use RCPs to assess the impact of physical risk under the various pathways. Our analysis is typically focused on the impact at 2050 under the relevant RCP. Analysis may include other time periods. WESTPAC GROUP 2024 CLIMATE REPORT |
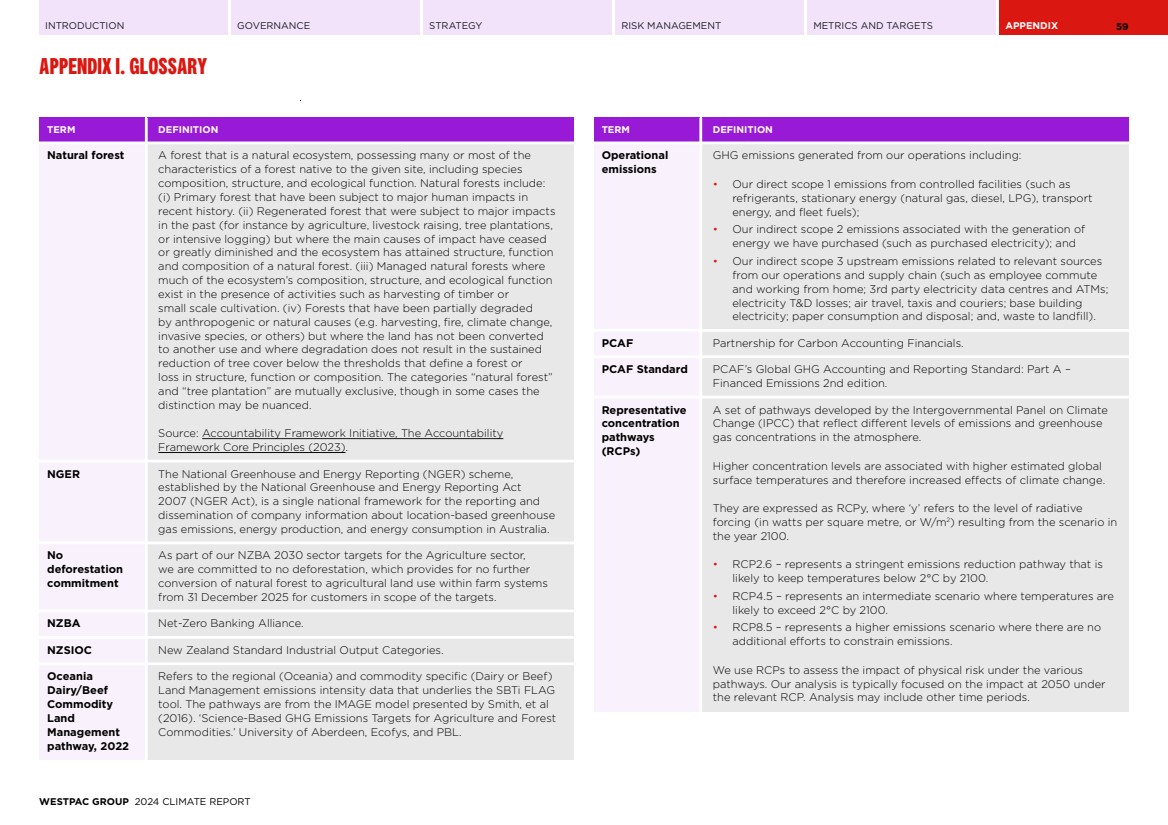
| INTRODUCTION GOVERNANCE STRATEGY RISK MANAGEMENT METRICS AND TARGETS APPENDIX APPENDIX I. GLOSSARY 60 TERM DEFINITION Removals Activities with mitigation potential in the agriculture and forestry supply chain, including soil sequestration, agroforestry and biochar. Source: Science Based Targets Initiative (SBTi), Forest, Land and Agriculture (FLAG) Science-Based Target-Setting Guidance (2022). Science Based Targets Initiative (SBTi) Forest, Land and Agriculture (FLAG) Provides a standard method to set science-based targets for FLAG sectors that include land-based emission reductions and removals. Source: Science Based Targets Initiative (SBTi), Forest, Land and Agriculture (FLAG) Science-Based Target-Setting Guidance (2022). Scope 1 and scope 2 operational emissions Scope 1 emissions are the release of greenhouse gases into the atmosphere from our direct operations. Scope 2 emissions are indirect greenhouse gas emissions from consumption of purchased electricity for our direct operations. Scope 3 financed emissions Scope 3 financed emissions are the indirect greenhouse gas emissions associated with our financing activities. For Westpac, these are our share of the greenhouse gas emissions of our lending customers. Scope 3 upstream emissions Scope 3 upstream emissions are indirect greenhouse gas emitted as a consequence of Westpac Group’s operations but occur at facilities controlled by another organisation. Sustainable Finance Transactions assessed pursuant to Westpac 2024 Sustainable Finance Framework as qualifying for inclusion in our Sustainable Finance Targets. Westpac 2024 Sustainable Finance Framework Sets out how Westpac assesses, monitors, measures and reports on financing and facilitating sustainable activities. Uses our Sustainable Finance Taxonomy or industry standards, principles and guidance to classify Green, Transition, Social and Sustainability activities. Sustainable Finance Taxonomy The Westpac Sustainable Finance Taxonomy includes the Taxonomy Criteria for classifying Green, Transition, Sustainability, and Social economic activities (refer to Westpac 2024 Sustainable Finance Framework Appendix B – Summary – Taxonomy Criteria). For the purposes of Sustainable Finance, references to industry standards, principles and guidance refers to those listed in the Westpac 2024 Sustainable Finance Framework Appendix C – Key referenced national taxonomies, industry standards, principles and guidance. TERM DEFINITION Total committed exposure (TCE) For financial reporting purposes, TCE represents the sum of the committed portion of direct lending (including funds placement overall and deposits placed), contingent and pre-settlement risk plus the committed portion of secondary market trading and underwriting risk. When calculating Group financed emissions and the NZBA sector targets we need to estimate our share of customers’ financed emissions. For certain institutional customers we use TCE to determine this share; this is detailed in our sector methodologies. For this purpose, TCE excludes secondary market trading and underwriting committed credit exposures. When calculating Sustainable Finance targets, we need to identify the principal amounts of the sustainable lending and bond facilitation that meet our Sustainable Finance Framework. For certain institutional customers we use TCE or share of bond facilitation to determine this share. For this purpose, TCE excludes PSR, secondary market trading and underwriting committed credit exposures. UNEP United Nations Environment Programme Unlabelled Sustainable Finance (including unlabelled lending) Finance that may not have a specific sustainability label or certification. In the context of Westpac 2024 Sustainable Finance Framework, such finance may still be considered as ‘sustainable’ as defined by our Framework and Taxonomy Criteria. a. For example, Westpac’s Sustainable Farm Standard. This defines the activity level criteria that a farm entity meets (or is on track to meet) in accordance with the Westpac New Zealand Limited Sustainable Farm Loan. WESTPAC GROUP 2024 CLIMATE REPORT |
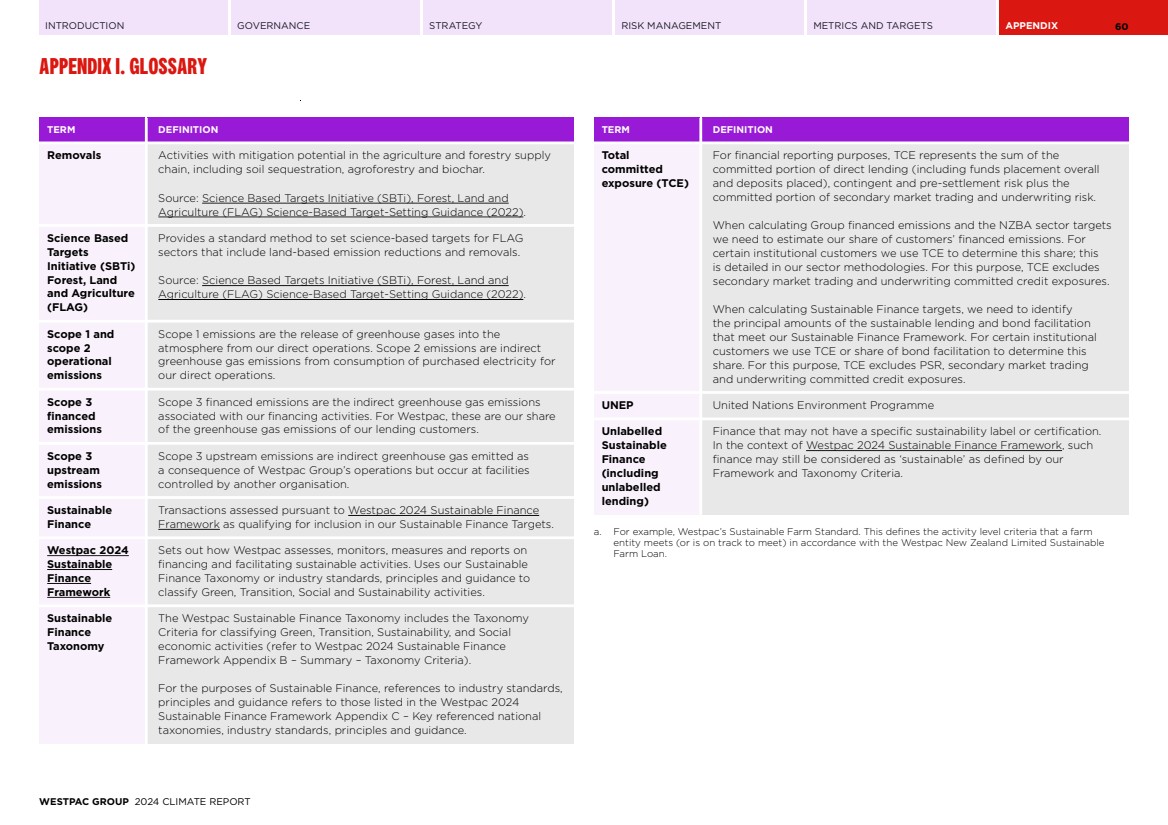
| INTRODUCTION GOVERNANCE STRATEGY RISK MANAGEMENT METRICS AND TARGETS APPENDIX 61 APPENDIX II. NZBA SECTOR EMISSIONS TARGETS This appendix details Westpac Group’s financed emissions targets that relate to the priority carbon-intensive sectors identified by the NZBA (NZBA sectors), along with how we arrived at each. This includes our targets and progress (where reported), the boundary of exposures in each sector and the science-based scenarios chosen to help determine our targets. In setting our targets, we have prioritised sectors listed in the NZBA guidelines, and focused on elements of our portfolio where we believe we can make the most difference and have the data and scenarios to set targets. As an example, in the NZBA sector of 'Transport' we have determined a sector target for Aviation and defined that to only include scheduled passenger airlines (refer to Supplement available on our website). We have now set 13 interim 2030 emission targets across all nine emissions-intensive sectors required under our NZBA commitment1 , including oil and gas, coal, cement, agriculture, commercial and residential real estate, iron and steel, power generation, transport, and aluminium. We will consider expanding the scope and coverage of our existing NZBA sector targets in accordance with our NZBA commitment. In setting our targets we have referenced the UNEP FI Guidelines for Climate Change Target Setting2 (NZBA guidelines) and credible and well-recognised science-based reference scenarios, tools, methodologies and principles tailored to each sector, as outlined in this appendix. Our approach to calculating financed emissions Westpac estimates the Group’s scope 3 financed emissions by assessing the proportion of emissions of individual customers or industry sectors attributable to financing provided by Westpac, using the committed exposure for our lending to customers. The approach applied to calculating financed emissions for the Group is necessarily different to the approach applied to estimating financed emissions for some of our sector-level targets. The Group financed emissions are developed based on portfolio level methodology. To develop sector targets that typically comprise institutional or large business customers, we often leverage more granular data to assess a company’s emissions and our portion of those emissions. This approach cannot be applied at a portfolio level due to a lack of consistent individual company information that can be aggregated to a portfolio level. For the Australian residential real estate and agriculture targets the sector-level and portfolio-level Group financed emissions approaches are broadly aligned. There are some small differences in data sources used for the different methodologies due to these approaches, but the sources are not materially different. Over time, as data improves, including from better company reporting and streamlined research processes, we expect these approaches to gradually converge. Our approach to selecting reference scenarios In determining each of our targets, we need to select an appropriate science-based reference scenario aligned with our commitment to the NZBA. We have established a set of principles to assist with scenario selection. No scenario is perfect and it is difficult to fully align some with the characteristics of the Australian and New Zealand economies or the attributes of the companies within our target boundaries. As a result, scenarios selected may differ from other industry participants, and may not align with all the principles. A summary of the principles follows. SCENARIO SELECTION PRINCIPLES DETAIL 1.5°C alignment • Scenario should meet net-zero emissions by 2050 or sooner, consistent with 1.5°C alignment. NZBA alignment • Credible, well recognised source with a science-based scenario. • Low/no overshoot (the IPCC defines as – if temperatures exceed 1.5°C by less than 0.1°C but return to less than 1.5°C in 2100). • Low reliance on offsets. • Minimise misalignment with other UN Sustainable Development Goals. Regional/sector granularity • Should have an emissions trajectory and segmentation relevant to Australia and New Zealand. • Ability to align to components of the value chain consistent with the companies in the sector boundary. Recognised use • Industry accepted/backed scenario. • Used by other industry participants. 1 NZBA Guidelines require sector-level targets be set for all, or a substantial majority of, carbon-intensive sectors (where data and methodologies allow) that include agriculture, aluminium, cement, coal, commercial and residential real estate, iron and steel, oil and gas, power generation and transport. 2 UNEP-FI Net-Zero Banking Alliance (NZBA), Guidelines for Climate Target Setting for Banks Version 2 (2024). WESTPAC GROUP 2024 CLIMATE REPORT |
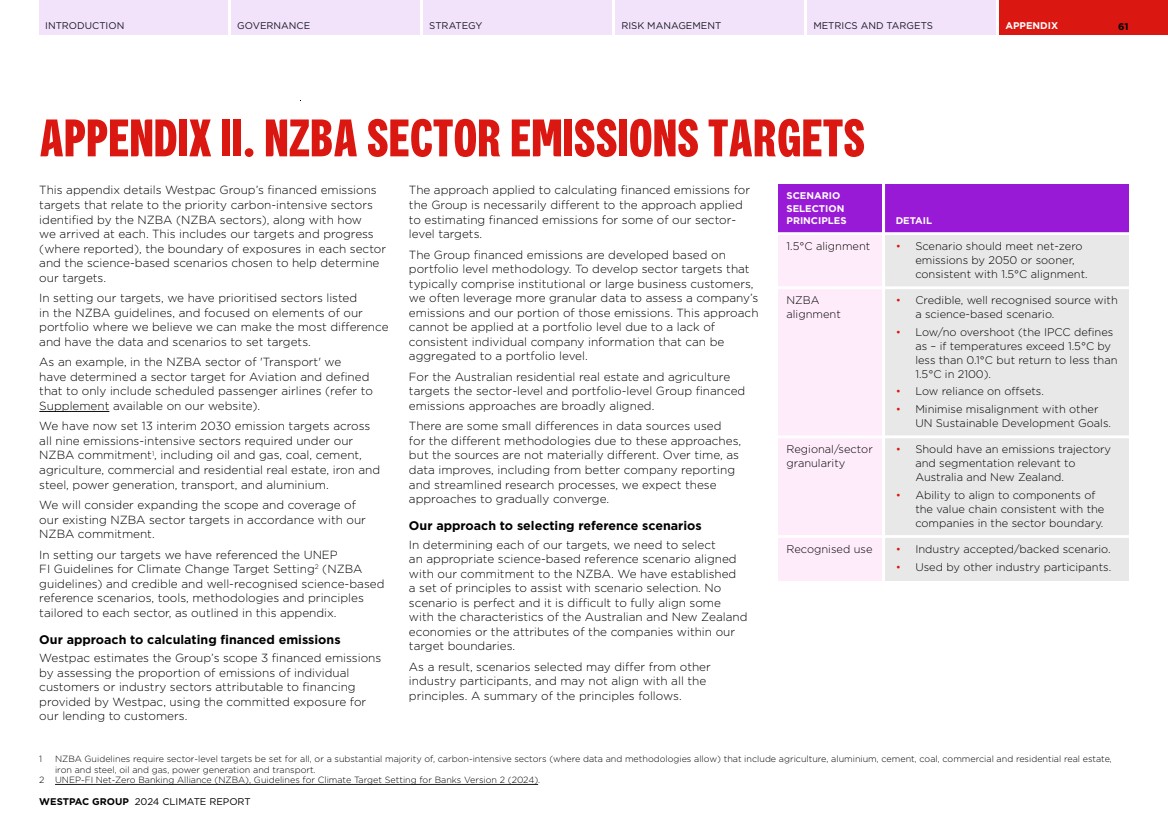
| INTRODUCTION GOVERNANCE STRATEGY RISK MANAGEMENT METRICS AND TARGETS APPENDIX APPENDIX II. NZBA SECTOR EMISSIONS TARGETS 62 Determining customers in the target boundary The boundary for each target has been determined by focusing on the value chain addressed by science-based reference scenario used for the target. To identify customers in scope, we use ANZSIC codes for initial screening and, depending on the target, we supplement with more detailed knowledge about the companies so the nature of the companies aligns with the target. The ANZSIC codes used in the initial screening are summarised in the section 'NZBA Sector Targets – Overview of sector target boundaries'. Our approach to establishing NZBA sector targets Our NZBA sector targets undergo a rigorous sequence of approvals to ensure our commitments are robust. Our target-setting process is managed by the relevant accountable division that has the relationship with the industry sector. These targets then proceed to a Group review, where various Group functions are consulted and their feedback considered. Finally the targets are presented to the ESG and Reputation (ESGR) Committee before being submitted to the Board for approval (with the exception of our NZBA sector target for the Aluminium sector which has been approved by the CEO directly). This structured approach ensures that NZBA sector targets are both ambitious and achievable. Our approach to carbon offsets for our NZBA sector targets We believe reducing emissions should be a priority action in achieving targets and the transition to net-zero. We recognise carbon offsets are likely to play a role to supplement decarbonisation in line with climate science-based scenarios. We do not intend to purchase carbon offsets to meet our NZBA sector targets. We understand that some customers are using or may use offsets to meet their decarbonisation targets and some of the data we use may also include customer offsets. Guidance around the quality and utilisation of carbon credits is a rapidly evolving area and we will review our approach to the use of carbon offsets in line with NZBA Guidance. Data limitations The calculations of our NZBA sector targets are subject to inherent uncertainties due to limitations in the availability of relevant data sources and changing methodologies, as well as the evolving scientific knowledge underpinning these estimates. Non-financial data may be subject to more inherent limitations than financial data, given both its nature and the methods used for determining, calculating, and estimating such data. In response to the data availability challenge, we are extensively using proxy data from third parties, especially for some of our NZBA sector targets such as for the Commercial Real Estate sector. Therefore, the quality of our data varies across our targets, reflecting sector- or asset-specific data limitations. It is expected that reporting quality will improve over time as mandatory reporting is introduced for businesses, although reliable household-level data may take longer to become available. Overall, there are significant uncertainties, limitations, risks, and assumptions in the metrics and modelling behind our NZBA sector targets. Other considerations Our targets are set at the sector level, and may not align with the individual targets and transition plans of customers. For this reason, and other reasons (such as evolving technologies), the pathway to achieving our targets may not be gradual or linear. The emissions reduction trajectory may occur in step-changes, or even increase in some periods. Setting targets is complex due to data quality, the availability of suitable science-based reference scenarios and because methodologies require estimation. While we have sought to use best available data and scenarios, various assumptions and estimates have been used. As a result, our targets and baselines (along with the pathways to achieve our targets) are likely to change as data quality improves and better methodologies emerge. The baselines for all NZBA sector targets have been measured using data available as at the end of the relevant baseline period. In accordance with the NZBA guidelines, we expect to review our targets at least every five years. Our NZBA sector targets have also been independently reviewed. We obtain limited assurance over our baselines and progress of our NZBA sector targets as per our independent assurance statement (pages 53-56 and on our website). Following are a summary of our NZBA sector target baselines, progress, and exposure, and an overview of our sector target boundaries. WESTPAC GROUP 2024 CLIMATE REPORT |
| INTRODUCTION GOVERNANCE STRATEGY RISK MANAGEMENT METRICS AND TARGETS APPENDIX APPENDIX II. NZBA SECTOR EMISSIONS TARGETS 63 NZBA Sector Targets – Summary of target baselines, progress, and exposure We made progress in FY23 with an improved emissions profile in 11 of our 12 sectors where we have targets. It is important to note that while we are progressing on our NZBA sector targets, our progress will likely be non-linear due to external factors out of our control. NZBA SECTOR WESTPAC SECTOR 2030 TARGET AND MEASURE BASE-LINE (YEAR) TYPE OF TARGET PROGRESS (% TO BASELINE YEAR) ABSOLUTE EMISSIONS MtCO2-e EXPOSURE IN TARGET BOUNDARYa 2021 2022 2023 2022 2023 2022 2023 Power generation Power generation Reduce scope 1 and 2 emissions intensity by 62% to 0.10 tCO2-e/MWh 0.26 (2021) Intensity 0.26 0.23 -12% 0.20 -23% NA NA $5,155m $5,905m Cement Cement production Reduce scope 1 and 2 emissions intensity by 14% to 0.57 tCO2-e/tonne of cement produced from in-house produced clinker 0.66 (2021) Intensity 0.66 0.66 0% 0.63 -5% 0.101 0.131 $527m $805m Oil and Gas Upstream Oil and Gas Reduce absolute scope 1, 2 and 3 financed emissions by 23% to 7.1 MtCO2-e 9.2 (2021) Absolute 9.2 7.5 -18% 5.1 -45% 7.5 5.1 $3,772m $3,283m Coal Thermal coal mining Zero scope 1, 2 and 3 financed emissions to companies with >5% of their revenue directly from thermal coal mining 2.46 (2021) Absolute 2.46 1.9 -23% 0.47 -81% 1.9 0.47 $198m $65m Transport Aviation (passenger aircraft operators) Reduce scope 1 emissions intensity by 60% to 76.4 gCO2-e/ passenger km 190.6 (2021) Intensity 190.6 156.0 -18% 105.3 -45% 0.361 0.605 $860m $922m Iron and Steel Steel Production Reduce scope 1 and 2 emissions intensity to 1.42 tCO2-e/tonne of crude steel produced NR (2021) Intensity NR NR NR NR NR NR NR Aluminium Aluminium Reduce scope 1 and 2 emissions intensity to 10.35 tCO2-e/tonne of primary aluminium produced NR (2023) Intensity NA NA NR NA NR NA NR Commercial and Residential Real Estate Commercial Real Estate (Offices) Reduce scope 1 and 2 emissions intensity for Australian and New Zealand offices by 59% to 25 kgCO2-e/m2 net lettable area 60 (2022) Intensity NA 60 49 -18% NA NA $17.2b $16.7b Residential Real Estate (Australia) Reduce scope 1 and 2 emissions intensity by 56% to 15.2 kgCO2-e/m2 attributed floor area 34.6b (2022) Intensity NA 34.6b 30.7 -11%b 3.20b 2.69b $436.4bb balance $438.1bb balance Agriculture Australia Beef and Sheep Reduce scope 1 land management emissions intensity by 9% to 19.85 tCO2-e/tonne of FW 21.73 (2021) Intensity 21.73 22.52 +4% 22.55 +4% NA NA $5,559m $6,139m Australia Dairy Reduce scope 1 land management emissions intensity by 10% to 0.85 tCO2-e/tonne of FPCM 0.95 (2021)c Intensity 0.95c 0.88 -7% 0.87 -8% NA NA $1,040m $1,220m New Zealand Beef and Sheep Reduce scope 1 land management emissions intensity by 9% to 17.6 tCO2-e/tonne of FW 19.4 (2021) Intensity 19.4 19.2 -1% 18.6 -4% NA NA NZ$1,647m NZ$1,575m New Zealand Dairy Reduce scope 1 land management emissions intensity by 10% to 0.75 tCO2-e/tonne of FPCM 0.83 (2021) Intensity 0.83 0.86 +4% 0.77 -7% NA NA NZ$5,993m NZ$5,983m NOTE: NA means 'Not Available' – data quality scores and/or certain emissions reporting are not available for all NZBA sector targets. We are currently uplifting our model capabilities and will endeavour to enable the disclosure of these in the future. Progress reporting is also not available for years prior to the baseline years. NR means 'Not Reported' given the small number of customers and to ensure their confidentiality. a. TCE unless otherwise stated. b. Baseline and progress metrics for Residential Real Estate target are as at 31 August. c. In FY24, we corrected minor model errors related to data inputs in the Agriculture Australia Dairy target, identified as part of our routine model risk review. This resulted in a restatement of our baseline, with no changes to the % reduction in our target. WESTPAC GROUP 2024 CLIMATE REPORT |
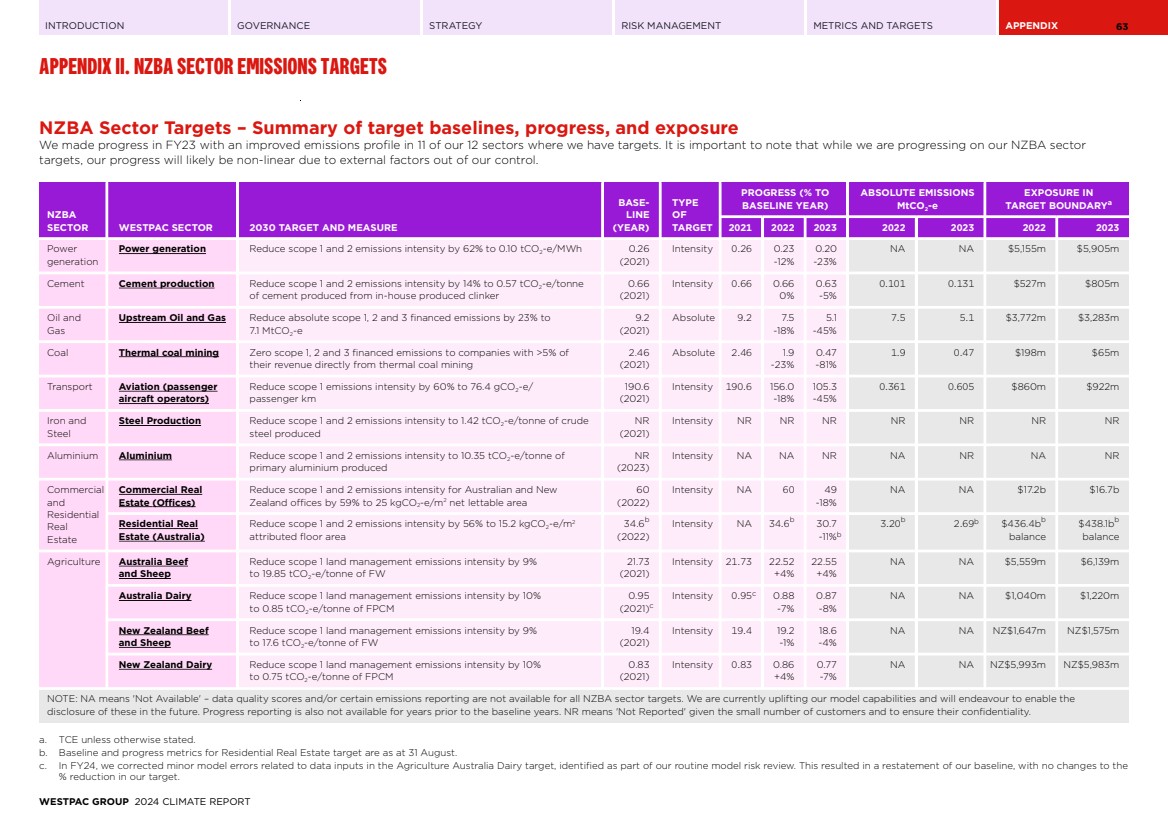
| INTRODUCTION GOVERNANCE STRATEGY RISK MANAGEMENT METRICS AND TARGETS APPENDIX APPENDIX II. NZBA SECTOR EMISSIONS TARGETS 64 NZBA Sector Targets – Overview of sector target boundaries The below table provides an overview of the boundaries of our NZBA sector targets, including the ANZSIC codes (where applicable) for identifying the initial set of customers in-scope, and the additional inclusions and exclusions to the boundary. Further detail on each NZBA sector target is available in our Supplement . SECTOR TARGET ANZSIC CODES TO IDENTIFY INITIAL CUSTOMER SET ADDITIONAL INCLUSIONS/EXCLUSIONS INTO SECTOR TARGET BOUNDARY Power generation 3610 • Inclusions: Customers with >10% revenue from power generation; or, >5% of revenue from thermal coal electricity generation and customers with NGER scheme designated generation facilities. • Exclusions: Customers deemed out of scope are electricity transmission, distribution companies and batteries. Cement production N/A • Inclusions: Identified cement manufacturing customers that produce both clinker and cement in-house. • Exclusions: Upstream emissions from the production of purchased clinker, transportation, and delivery of materials to the production facility; Downstream emissions from the distribution and use of cement in other building materials (e.g., concrete). Upstream Oil and Gas 1200; 1511; 1512; 2510 • Inclusions: Companies involved with exploration, extraction and drilling, all activities of integrated oil and gas companies (IOCs), tolling (contract manufacturing) and stand-alone refineries and LNG producers. This includes customers who are diversified, and their operations include the above. • Exclusions: Downstream retail and distribution; pipeline infrastructure; storage and transport; and trading entities. Thermal coal mining 1101; 1102; 1103 • Inclusions: Customers where >5% of their revenue comes directly from thermal coal mining, calculated on a three-year rolling average. Covers the production and sale of thermal coal only. We also conduct additional screening to identify all customers with >5% revenue from thermal coal mining, irrespective of ANZSIC code. If a diversified company has more than 5% of their revenue from thermal coal mining (including but not limited to metallurgical coal mining), we isolate the financed emissions associated with thermal coal mining. • The revenue threshold relates only to customers owning the coal reserves (via a mining lease) and generating revenue from those reserves at market prices (not contractors). • Exclusions: Rehabilitation bonds and transactional services are also excluded. Aviation (passenger aircraft operators) 6401; 6402; 6403; 7742 • Inclusions: Customers which operate scheduled passenger air transport. We include emissions from freight operations undertaken by passenger airline operators as the movement of freight and passengers are often undertaken at the same time. • Exclusions: Aircraft lessors and freight only operators; the latter due to their immateriality to Westpac. We have excluded lessors given our capacity to influence is more limited. Steel Productiona 2741 • Inclusions: Customers involved in the production of crude steel. • Exclusions: Customers out-of-scope are customers involved in downstream manufacturing, processing of end products and fabrication of products from steel (noting some such customers have ANZSIC 2741). Aluminium 2721; 2722 • Inclusions: Aluminium production is a multi-step process. Mined bauxite ore is the basic raw material. The ore is crushed and mixed with caustic soda solution to dissolve the ore’s alumina content. Further processing is applied to produce aluminium oxide (alumina). Alumina, a dry white powder, is then dissolved. A high-intensity electrical current is applied to create an electrolysis reaction that reduces the alumina into molten aluminium (smelting). The molten aluminium is cast into ingots, slabs, billets and T-bars for further processing before being manufactured into end use products. Secondary aluminium is produced by melting scrap aluminium. As there is no electrolysis, or smelting, this process consumes less than 5% of the energy needed to produce primary aluminium. • 95% of primary aluminium production emissions lie within scope 1 and scope 2 of the refining and smelting processes. We include these processes in our boundary definition. • Exclusions: Rehabilitation bonds are excluded. We exclude the extraction of bauxite ore in open-cut mining except where reported as part of vertically integrated operations. We exclude end-product manufacture. We exclude secondary production, as it does not reflect our customers’ activities, and due to current data limitations. Commercial Real Estate (Offices) ANZSIC 1993: 771-; ANZSIC 2006: 671- • Inclusions: In-scope office facilities for commercial real estate customers in Australia and New Zealand, where the TCE ≥$5 million for Australian facilities, or ≥NZ$5 million for New Zealand facilities. • Exclusions: Exposures associated with site finance and construction of offices are excluded. WESTPAC GROUP 2024 CLIMATE REPORT |
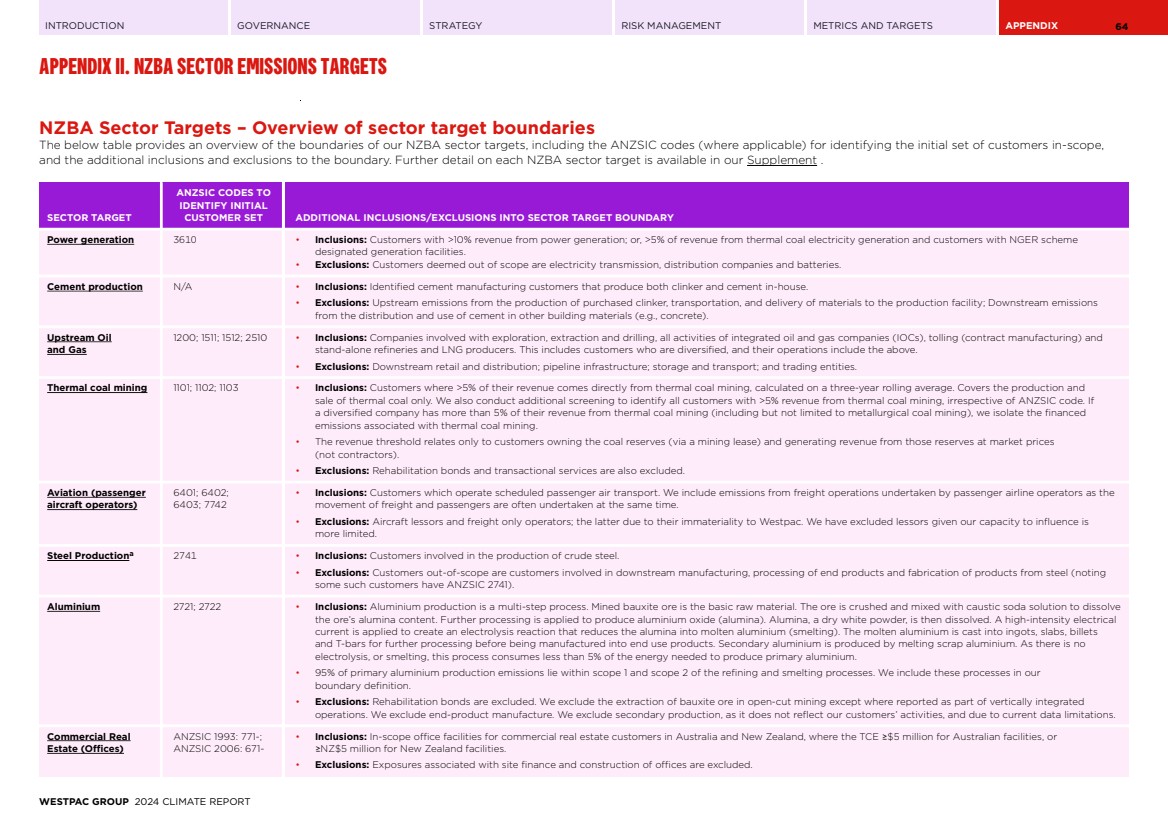
| INTRODUCTION GOVERNANCE STRATEGY RISK MANAGEMENT METRICS AND TARGETS APPENDIX APPENDIX II. NZBA SECTOR EMISSIONS TARGETS 65 SECTOR TARGET ANZSIC CODES TO IDENTIFY INITIAL CUSTOMER SET ADDITIONAL INCLUSIONS/EXCLUSIONS INTO SECTOR TARGET BOUNDARY Residential Real Estate (Australia) N/A • Inclusions: Australian Mortgages, including investment loans. Boundary includes scope 1 (excluding fugitive and LPG emissions) and scope 2 emissions. • Exclusions: Mortgages on vacant land, equity access loans, scope 3 emissions. Australia Beef and Sheep 0122; 0123; 0124; 0125; 0126 • Inclusions: Commercial relationship-managed and institutional agriculture customers with TCE ≥$1.5 million (banking needs are looked after by designated Relationship Managers); Scope 1 land management emissions which include biogenic methane from ruminant livestock and also include emissions from nutrient management, manure management, and fertiliser use. • Inclusion of sheep into Beef and Sheep Target: As sheep farming contributes materially to Australia’s overall agricultural emissions at approximately 19%, and our assessment indicates the emissions profiles between cattle and sheep are similarb .. Livestock enteric (methane) emissions reduction opportunities do not distinguish between sheep and beefc .. • Exclusions: Scope 1 emissions relating to fuel use, land-use change and removals due to data limitations; scope 2 and 3 emissions are not in the reference scenario and are therefore excluded. Australia Dairy 0130 New Zealand Beef and Sheep 0141; 0142; 0143; 0144; (ANZSIC 2006) • Inclusions: Scope 1 emissions which include enteric methane from ruminant livestock and manure management and also nitrous oxide from the application of fertilisers and livestock excreta. • Exclusions: Customers with TCE <NZ$1 million. New Zealand Dairy 0160 (ANZSIC 2006) a. Given the small number of customers, our intensity target (% reduction), baseline, and progress are not disclosed. b. Wiedemann, S & Dunn, J., V.SCS.0016 Carbon accounting technical manual, page 6 (2021). c. Black, J. et al., B.CCH.6000 National Livestock Methane Program – National Needs and Gaps Analysis, page 10 (2015). WESTPAC GROUP 2024 CLIMATE REPORT |
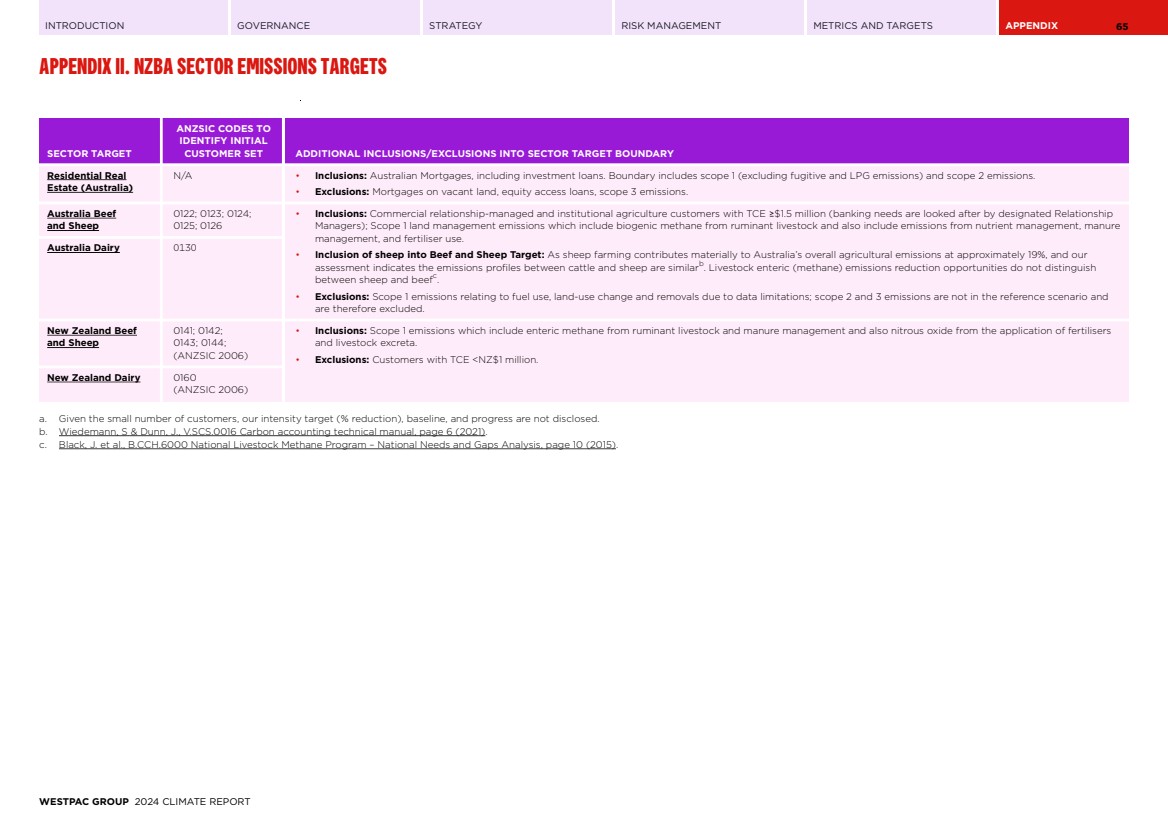
| INTRODUCTION GOVERNANCE STRATEGY RISK MANAGEMENT METRICS AND TARGETS APPENDIX 66 APPENDIX III. CLIMATE-RELATED POSITIONS AND PARTNERSHIPS Toitū net carbonzero certified (New Zealand) Since 2019 Climate Active Certification (Australia) Since 2012 (previously NCOS) Paris Climate Agreement Supporter (2015) UN Sustainable Development Goals CEO Statement of Commitment (2016) Taskforce on Nature-related Financial Disclosures Forum member (2021) RE100, an initiative of The Climate Group in partnership with CDP Member (since 2019) Principles for Responsible Banking Signatory (2019) UN Environment Programme Finance Initiative Founding Member (1991) Banking Board Co-Chair (since 2020) The Equator Principles Founding Adopter, First Australian Bank (2003) Industry-led UN-convened Net-Zero Banking Alliance Member, principals and steering groups (NZBA governance bodies) (from 2023) Australian Sustainable Finance Institute Founding Member UN Global Compact Signatory (2002), Global Compact Network Australia Founding Member (2009) Carbon Markets Institute Corporate Member Green Building Council of Australia Member (since 2011) Climate Bonds Initiative Partner IFRS S2 Sustainability Disclosure Standard (Climate-related Disclosures) Align with and support WESTPAC GROUP 2024 CLIMATE REPORT |
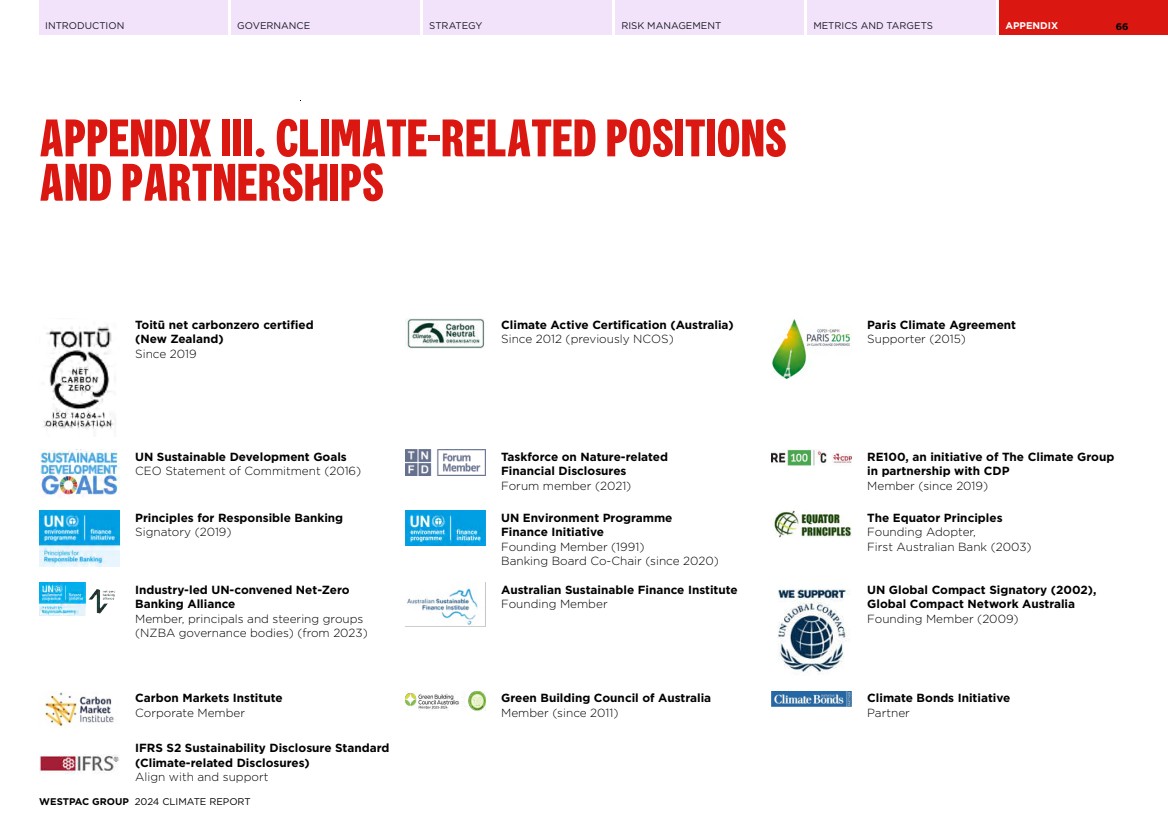
| INTRODUCTION GOVERNANCE STRATEGY RISK MANAGEMENT METRICS AND TARGETS APPENDIX 67 APPENDIX IV. DISCLAIMER The information in this document is general information about the Group and its activities as at the date of this Climate Report. It is given in summary form and is therefore not necessarily complete. It is not intended that it be relied upon as advice to investors or potential investors, who should be seeking independent professional advice depending on their specific investment objectives, financial situation or particular needs. The material contained in this document may include information, including, without limitation, methodologies, modelling, scenarios, reports, benchmarks, standards, tools, metrics and data, derived from publicly available or government or industry sources that have not been independently verified. No representation or warranty is made as to the accuracy, completeness or reliability of the information. This document contains statements that constitute “forward-looking statements” within the meaning of Section 21E of the US Securities Exchange Act of 1934. Forward-looking statements are statements about matters that are not historical facts. Forward-looking statements and metrics appear in a number of places in this document and include statements regarding our current intent, belief or expectations with respect to our business and operations, macro and micro economic and market conditions, results of operations and financial condition, capital adequacy and risk management, including without limitation, climate change, net-zero, emissions intensity and other sustainability related statements, commitments and targets, projections, scenarios, risk and opportunity assessments, pathways, forecasts and metrics, forecasted economic indicators and performance metric outcomes, financial support to certain borrowers, indicative drivers, estimated emissions and other proxy data. These are subject to known and unknown risks, and there are significant uncertainties, limitations, risks and assumptions in the metrics and modelling on which these statements rely. In particular, the metrics, methodologies and data relating to climate and sustainability are rapidly evolving and maturing, including variations in approaches and common standards in estimating and calculating emissions, and uncertainty around future climate- and sustainability-related policy and legislation. There are inherent limits in the current scientific understanding of climate change and its impacts. Forward-looking statements may also be made by members of Westpac’s management, directors, officers or employees (verbally or in writing) in connection with this document. Such statements are subject to the same limitations, uncertainties, assumptions and disclaimers in this document. We use words such as ‘will’, ‘may’, ‘expect’, ‘indicative’, ‘intend’, ‘seek’, ‘would’, ‘should’, ‘could’, ‘continue’, ‘anticipate‘, ‘believe‘, ‘probability‘, ‘risk‘, ‘aim‘, ‘target’, ‘plan’, ‘estimate‘, ‘outlook‘, ‘forecast‘, ‘goal’, ‘guidance’, ‘ambition’, ‘assumption’, ‘projection’, or other similar words that convey the prospective nature of events or outcomes and generally indicate forward-looking statements. These forward-looking statements reflect our current best estimates, judgements, assumptions and views as at the date of this document with respect to future events and are subject to change, certain known and unknown risks and uncertainties and assumptions and other factors which are, in many instances, beyond the control of Westpac, its officers, employees, agents and advisors, and have been made based upon management’s current expectations, understandings or beliefs concerning future developments and their potential effect upon us. Although management currently believes these forward-looking statements have a reasonable basis, there can be no assurance that future developments or performance will be in accordance with our expectations or that the effect of future developments on us will be those anticipated. There is a risk that the best estimates, judgements, assumptions, views, models, scenarios, projections used may subsequently turn out to be incorrect. Actual results, performance, conditions, circumstances or the ability to meet commitments and targets could differ materially from those we expect or are expressed or implied in such statements, depending on various factors, including without limitation significant uncertainties in climate change and sustainability related metrics and modelling as well as further development of methodologies, reporting or other standards which could impact metrics, data and targets (noting that climate and sustainability science, standards, methodologies and reporting are subject to rapid change and development). There are usually differences between forecast and actual results because events and actual circumstances frequently do not occur as forecast and their differences may be material. Factors that may impact on the forward- looking statements made include, but are not limited to, those described in this document and in the section titled 'Risk Management' in our 2024 Annual Report, as well as the Risk Factors document available at www.westpac.com.au. Investors should not place undue reliance on forward-looking statements and statements of expectation, including targets, particularly in light of the current economic climate and the significant global volatility. These statements are not guarantees or predictions of future performance and Westpac gives no representation, warranty or assurance (including as to the quality, accuracy or completeness of this document), nor guarantee that the occurrence of the events expressed or implied in any forward-looking statement will occur. When relying on forward-looking statements to make decisions with respect to us, investors and others should carefully consider such factors and other uncertainties and events, and the judgments and data presented in this document are not a substitute for investors and other readers’ own independent judgements and analysis. Investors and others should also exercise independent judgement, with the advice of professional advisers as necessary, regarding the risks and consequences of any matter contained in this document. To the maximum extent permitted by law, responsibility for the accuracy or completeness of any forward-looking statements, whether as a result of new information, future events or results or otherwise, is disclaimed. Except as required by law, we assume no obligation to update any forward-looking statements contained in this document, whether as a result of new information, future events or otherwise, after the date of this document. WESTPAC GROUP 2024 CLIMATE REPORT |
| CONTACT For questions and comments, please contact Westpac Group Sustainability: sustainability@westpac.com.au westpac.com.au/sustainability westpac.com.au |